Embed Size (px)
Citation preview
LETTER OF NOTIFICATION FOR THE
GROVES - BEXLEY 138 KV TRANSMISSION LINE REBUILD PROJECT
PUCO Case No. 13-1330-EL-BLN
Submitted pursuant to OAC 4906-11-01
AEP Ohio Transmission Company (AEP Ohio Transco)
JUNE 2013
Page 2 of 10
Letter of Notification
American Electric Power Groves - Bexley 138 kV Transmission Line Rebuild Project
LETTER OF NOTIFICATION
In accordance with Ohio Administrative Code Section 4906-11-01 Letter of Notification,
AEP Ohio Transmission Company submits the following information:
4906-11-01 (B) General Information
4906-11-01 (B) (1) Project Name and Reference Number
The name of this project is the Groves - Bexley 138 kV Transmission Line
Rebuild Project, and the OPSB Case number is 13-1330-EL-BLN.
4906-11-01 (B) (1) Description of the Project
An existing 138 kilovolt (kV) single circuit line will be rebuilt in an existing
right-of-way (ROW) corridor (30 feet in width) between Groves Substation and
Bexley Substation (Figure 1). The line will be built on AEP Ohio Transco
standard single circuit 138 kV structures with provisions for underbuild on four
structures. It is anticipated that self-supporting, custom, steel structures with
direct embed foundations for tangents, and pier foundations for running angle
and deadend structures will be utilized. The total length of the 138 kV line is
approximately 4.4 miles replacing 46 existing structures with 47 new structures.
4906-11-01 (B) (1) Reason the Project Meets Letter of Notification Requirements
The project is defined by Item (4)(a) of the Ohio Administrative Code Chapter
4906-01, Appendix A “Application Requirement Matrix for Electric Power
Transmission Lines,” which requires a Letter of Notification. This project
consists of replacing electric power transmission line structures within an
existing electric power transmission line right-of-way where two miles or less of
new right-of-way is required.
4906-11-01 (B) (2) Need for the Project
The purpose of the Groves - Bexley 138 kV Line Rebuild Project is to rebuild the
Groves – Bexley 138kV Line to improve and maintain the quality of electric
service and reliability to the Central Ohio area, including AEP Ohio Transco 's

Page 3 of 10
Letter of Notification
American Electric Power Groves - Bexley 138 kV Transmission Line Rebuild Project
load area. This area includes, but is not limited to the communities of Bexley,
Reynoldsburg, Gahanna, Blacklick, Columbus, Grandview Heights,
Pickerington, Pataskala, Westerville, New Albany, Upper Arlington, Groveport,
Canal Winchester, Grove City and others. This project will address an overload
identified by PJM in their 2009 RTEP study.
4906-11-01 (B) (3) Project Location Relative to Existing or Proposed Lines
The location of this project in relation to existing transmission lines is shown on
Figure 1. The proposed project, essentially a pole for pole replacement project
along the same centerline, is located entirely within the incorporated areas of the
City of Columbus and the City of Whitehall in Truro Township, Franklin County,
Ohio.
4906-11-01 (B) (4) Alternatives Considered
The line route is an existing transmission ROW and other alternatives were not
considered.
4906-11-01 (B) (5) Anticipated Construction Schedule
Construction of the 4.4-mile transmission line rebuild is expected to begin in
August of 2013 and is scheduled to be in service June of 2014.
4906-11-01 (B) (6) Maps Depicting Project Location
The Project is within the USGS Southeast Columbus quarter quadrangle. Figure
1 has been prepared to show the Project location with aerial photography. To
locate and view the Project from Columbus, Ohio, travel Interstate 670 east to
Exit 7 for Fifth Avenue, turn right onto Fifth Avenue and follow for
approximately one mile. Keep right to stay on Fifth Avenue and take a slight
right onto Stelzer Road. Bexley Substation will be on your left. The Project exits
the Bexley Substation in the northwest corner of Truro Township, south and east
of the Mifflin and Truro Township boundaries and extends south, crossing
Interstate 70 to the Groves Substation.

Page 4 of 10
Letter of Notification
American Electric Power Groves - Bexley 138 kV Transmission Line Rebuild Project
4906-11-01 (B) (7) Property Easements
The existing line is located on easements that were obtained by Columbus
Southern Power Company, now known as Ohio Power Company. All new
structures will be located within the existing transmission line ROW. Property
owners will be notified of the transmission line project prior to the
commencement of construction activities.
4906-11-01 (C) Technical Features of the Project
4906-11-01 (C) (1) Description of Technical Features
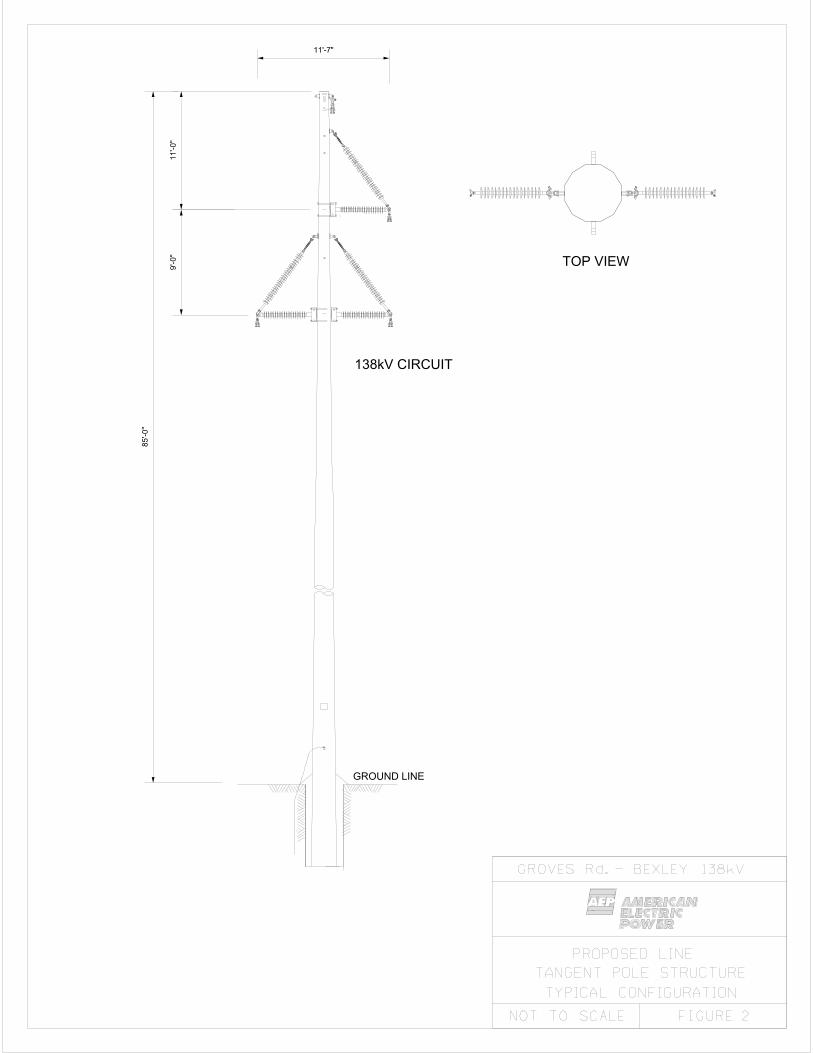
The proposed line will be designed for and operated at 138 kV. Figures 2 through
5 show the typical steel pole structures to be installed. Three (3) 1,929.6 kcmil
ACSR/TW, conductors and one (1) .646 inch diameter, fiber optic shield wire
will be installed and supported by the new structures.
4906-11-01 (C) (1) Number and Type of Structures
Figures 6 through 9 show the non-standard steel single pole structures to be used
in single locations and are comprised of one (1) large angle deadend structure
(Figure 6), two (2) tangent structures with underbuild (Figures 7 and 8), and one
(1) running angle structure (Figure 9).
4906-11-01 (C) (1) Right of Way and Land Requirements
The existing line is located on easements that were obtained by Columbus
Southern Power Company, now known as Ohio Power Company. All new
structures will be located within the existing transmission line right-of-way
(ROW).. Property owners will be notified of the transmission line project prior
to the commencement of construction activities.
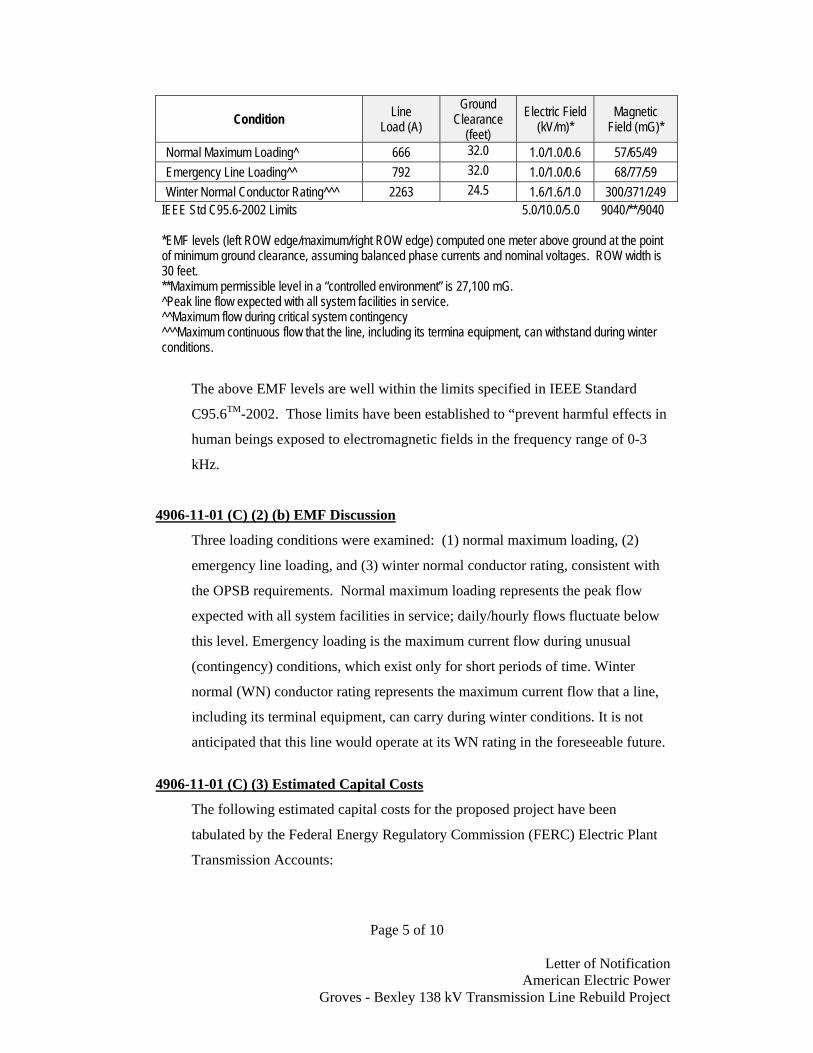
4906-11-01 (C) (2) (a) Calculated Electric and Magnetic Field Levels
EMF levels were computed one meter above the ground under the line and at the
ROW edges (12.5/17.5 feet, left/right, of the centerline). Results are summarized
below.
Page 5 of 10
Letter of Notification
American Electric Power Groves - Bexley 138 kV Transmission Line Rebuild Project
Condition Line Load (A)
Ground Clearance
(feet) Electric Field
(kV/m)* Magnetic
Field (mG)*
Normal Maximum Loading^ 666 32.0 1.0/1.0/0.6 57/65/49 Emergency Line Loading^^ 792 32.0 1.0/1.0/0.6 68/77/59 Winter Normal Conductor Rating^^^ 2263 24.5 1.6/1.6/1.0 300/371/249 IEEE Std C95.6-2002 Limits 5.0/10.0/5.0 9040/**/9040 *EMF levels (left ROW edge/maximum/right ROW edge) computed one meter above ground at the point of minimum ground clearance, assuming balanced phase currents and nominal voltages. ROW width is 30 feet. **Maximum permissible level in a “controlled environment” is 27,100 mG. ^Peak line flow expected with all system facilities in service. ^^Maximum flow during critical system contingency ^^^Maximum continuous flow that the line, including its termina equipment, can withstand during winter conditions.
The above EMF levels are well within the limits specified in IEEE Standard
C95.6TM-2002. Those limits have been established to “prevent harmful effects in
human beings exposed to electromagnetic fields in the frequency range of 0-3
kHz.
4906-11-01 (C) (2) (b) EMF Discussion
Three loading conditions were examined: (1) normal maximum loading, (2)
emergency line loading, and (3) winter normal conductor rating, consistent with
the OPSB requirements. Normal maximum loading represents the peak flow
expected with all system facilities in service; daily/hourly flows fluctuate below
this level. Emergency loading is the maximum current flow during unusual
(contingency) conditions, which exist only for short periods of time. Winter
normal (WN) conductor rating represents the maximum current flow that a line,
including its terminal equipment, can carry during winter conditions. It is not
anticipated that this line would operate at its WN rating in the foreseeable future.
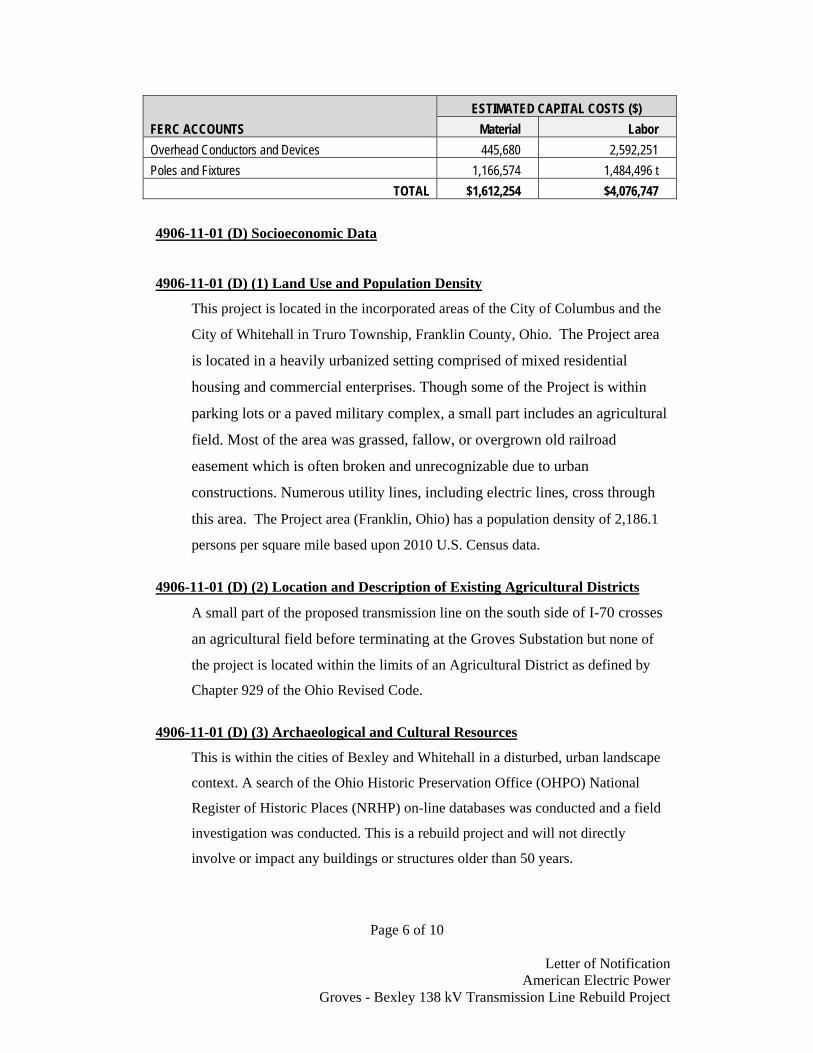
4906-11-01 (C) (3) Estimated Capital Costs
The following estimated capital costs for the proposed project have been
tabulated by the Federal Energy Regulatory Commission (FERC) Electric Plant
Transmission Accounts:
Page 6 of 10
Letter of Notification
American Electric Power Groves - Bexley 138 kV Transmission Line Rebuild Project
FERC ACCOUNTS ESTIMATED CAPITAL COSTS ($)
Material Labor Overhead Conductors and Devices 445,680 2,592,251 Poles and Fixtures 1,166,574 1,484,496 t
TOTAL $1,612,254 $4,076,747
4906-11-01 (D) Socioeconomic Data
4906-11-01 (D) (1) Land Use and Population Density
This project is located in the incorporated areas of the City of Columbus and the
City of Whitehall in Truro Township, Franklin County, Ohio. The Project area
is located in a heavily urbanized setting comprised of mixed residential
housing and commercial enterprises. Though some of the Project is within
parking lots or a paved military complex, a small part includes an agricultural
field. Most of the area was grassed, fallow, or overgrown old railroad
easement which is often broken and unrecognizable due to urban
constructions. Numerous utility lines, including electric lines, cross through
this area. The Project area (Franklin, Ohio) has a population density of 2,186.1
persons per square mile based upon 2010 U.S. Census data.
4906-11-01 (D) (2) Location and Description of Existing Agricultural Districts
A small part of the proposed transmission line on the south side of I-70 crosses
an agricultural field before terminating at the Groves Substation but none of
the project is located within the limits of an Agricultural District as defined by
Chapter 929 of the Ohio Revised Code.
4906-11-01 (D) (3) Archaeological and Cultural Resources
This is within the cities of Bexley and Whitehall in a disturbed, urban landscape
context. A search of the Ohio Historic Preservation Office (OHPO) National
Register of Historic Places (NRHP) on-line databases was conducted and a field
investigation was conducted. This is a rebuild project and will not directly
involve or impact any buildings or structures older than 50 years.

Page 7 of 10
Letter of Notification
American Electric Power Groves - Bexley 138 kV Transmission Line Rebuild Project
The project involves the construction of new, metal monopole structures that will
be replacing existing metal monopole structures. This corridor is located in a
heavily urbanized setting comprised of mixed residential housing and
commercial enterprises. Though some of the Project is within parking lots or a
paved military complex, a small part includes an agricultural field. Most of the
area was grassed, fallow, or overgrown old railroad easement. This was often
broken and unrecognizable due to urban constructions. Numerous utility lines,
including electric lines, cross through this area. A field investigation performed
for this project resulted in the identification of one site associated with the early
historic period. This site is not considered eligible for the NRHP as it does not
meet the minimum criteria. A finding of no historic properties affected as
outlined by 36 CFR Part 800.4 and 36 CFR Part 800.5 is considered appropriate.
No further work is deemed necessary for this Project.
A copy of the report produced as a result of the investigation is being submitted
concurrently with the filing of this Letter of Notification under a separate cover
to protect the sensitive information it contains.
4906-11-01 (D) (4) Local Officials to be Notified
Copies of this Letter of Notification have been sent to the Franklin County
Commissioners, the Trustees of Truro Township, the City of Columbus Mayor
and Planning Administrator, and the City of Whitehall Mayor and City Planning
Commission Chairman. Copies of these cover letters are attached.
4906-11-01 (D) (4) Public Information Program
AEP Ohio Transco’s Manager of External Affairs will advise local officials of
features and the status of the proposed transmission line Project as necessary.
4906-11-01 (D) (5) Current or Pending Litigation
There is no litigation involving this Project and none is expected.

Page 8 of 10
Letter of Notification
American Electric Power Groves - Bexley 138 kV Transmission Line Rebuild Project
4906-11-01 (D) (6) Local, State and Federal Requirements
This line will be designed, constructed and operated to meet or exceed the
requirements of the National Electric Safety Code, AEP Ohio Transco design
standards and all applicable Occupational Safety and Health Administration
(OSHA) standards. If required, a Notice of Intent will be filed with the Ohio
Environmental Protection Agency (OEPA) for authorization of construction
stormwater discharge under General Permit OHC000004 (Big Walnut Creek
watershed). If required, permits for the five structures currently existing and
proposed to be located in the floodplain for Mason Run (Structures 17 - 21) will
be acquired, and coverage under the Army Corps Nationwide Permit (Section
404) and/or an Ohio Isolated Wetland Permit will be secured. There is one
existing structure located in a wetland (Structure 21) however the new location of
Structure 21 will be located outside of the wetland boundaries. The proposed
Project is located within 20,000 feet of Port Columbus International Airport and
Nationwide Children’s Hospital Heliport such that a Federal Aviation
Administration (FAA) filing is required (FAA Form 7460-1, Notice of Proposed
Construction or Alteration). The proposed Project also crosses a railroad track
owned by Norfolk Southern Corp. for which a Wireline License and Right of
Entry Application may be required. Finally, access road construction may require
local road permits and other local permits for which the construction contractor
will be responsible. No other local, state or federal governmental agencies are
known to have requirements that must be met in connection with construction of
the project unless plans change.
4906-11-01 (E) Environmental
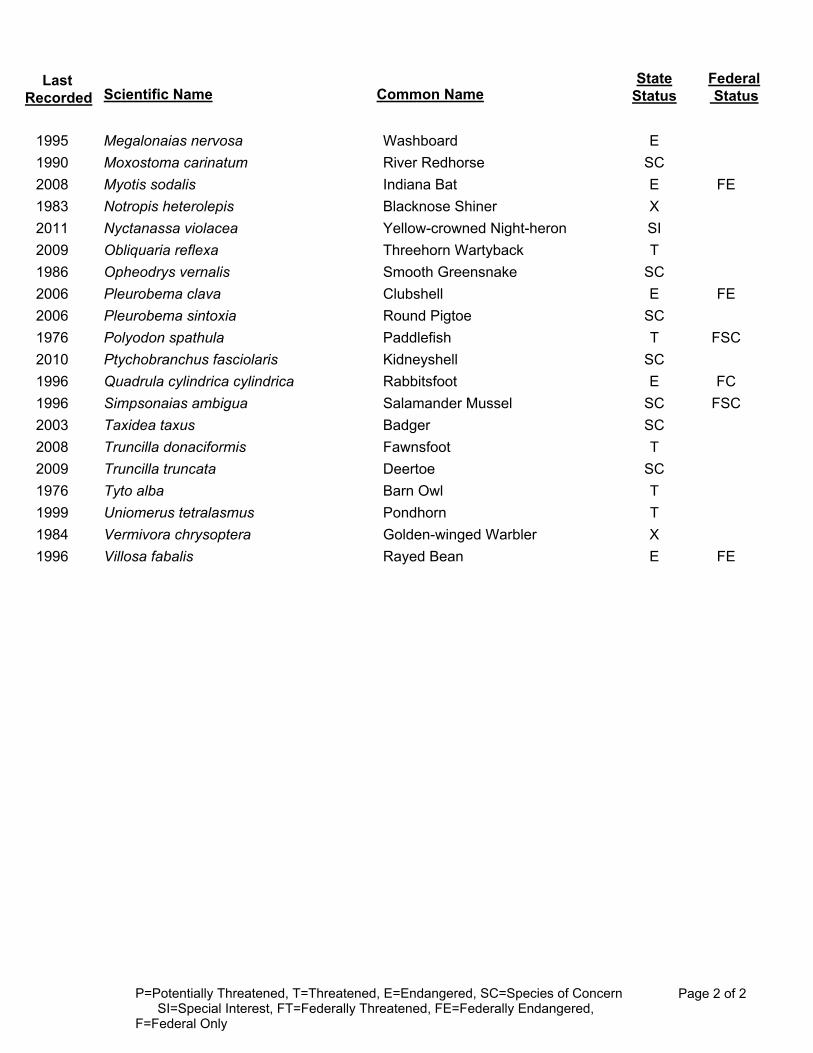
4906-11-01 (E) (1) Endangered or Threatened Species
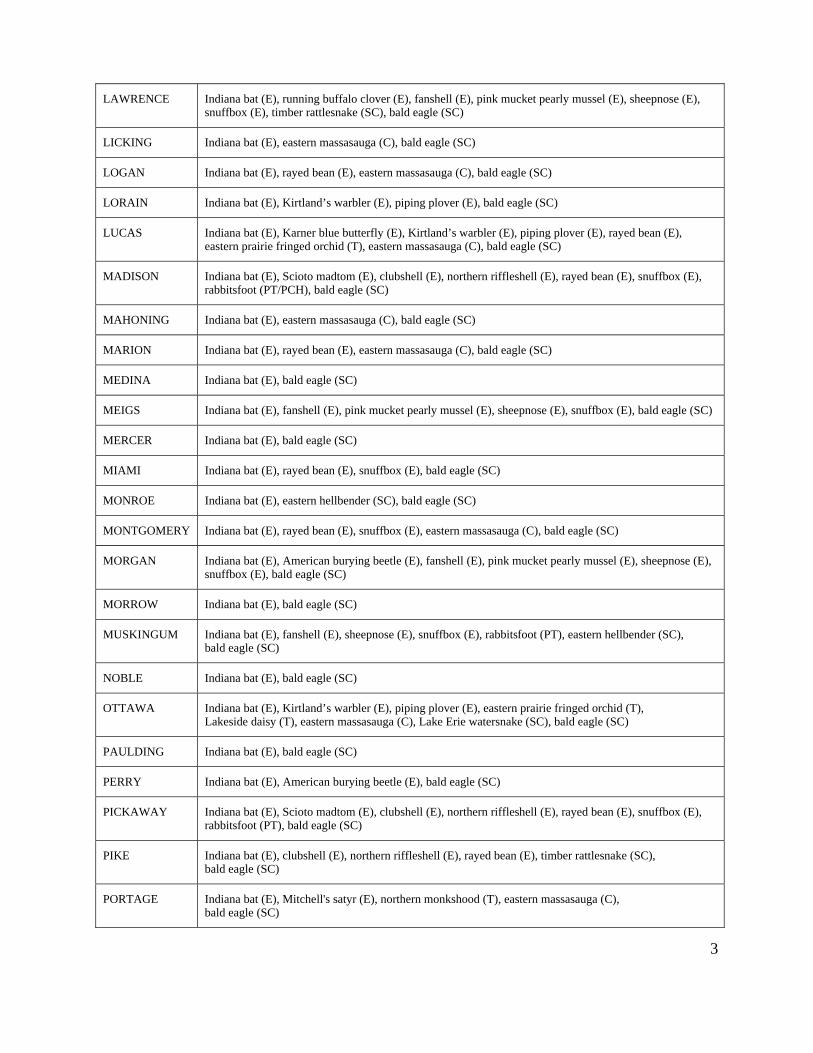
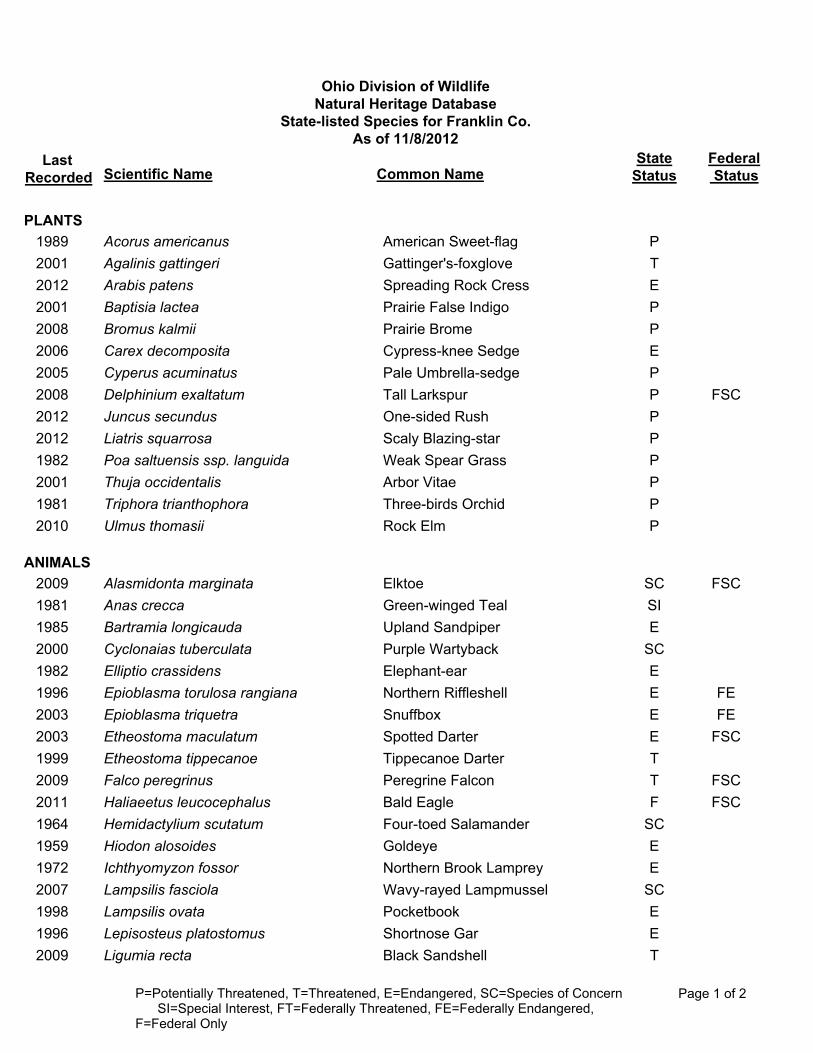
AEP Ohio Transco conducted a threatened and endangered species review. The
United States Fish and Wildlife Service’s (USFWS) species list for Franklin
County, Ohio (attached) was reviewed to determine the presence of threatened
and endangered species in the Project area. Two species were listed as potentially
occurring in Franklin County, which include the Indiana bat (endangered), and

Page 9 of 10
Letter of Notification
American Electric Power Groves - Bexley 138 kV Transmission Line Rebuild Project
the bald eagle (species of concern). AEP Ohio Transco conducted a wetland
determination for the proposed project. A copy of the report is attached.
The majority of the Project ROW will require mowing shrubs and small trees,
with additional tree trimming for access anticipated to be required in some areas.
Smaller trees less than five inches diameter at breast height exist in those areas.
Due to the habitat types in this area, no impacts to the Indiana bat are anticipated.
The Ohio Department of Natural Resources (ODNR) includes the most current
USFWS data plus has the most current, best information regarding bald eagle
nesting in the project area. The ODNR lists no recorded bald eagle nest near the
Project site therefore no impacts to the bald eagle are anticipated.
The ODNR was contacted also regarding the presence of any endangered,
threatened, or rare species that may be affected by this Project. The ODNR
responded and found no evidence or records of endangered/threatened species
within the Project area. A copy of the response is attached.
4906-11-01 (E) (2) and (3) Areas of Ecological Concern and Other Significant
Environmental, Social, Health, or Safety Impacts
The ODNR was contacted regarding areas of ecological concern in the vicinity of
the Project. The ODNR has no record of national and state forests and parks,
floodplains, wetlands, designated or proposed wilderness areas, national and state
wild and scenic rivers, wildlife areas, wildlife refuges, wildlife management
areas, and wildlife sanctuaries located within the areas likely to be disturbed by
the Project, a statement of the findings of the investigation.
There are no known unusual conditions associated with this Project that may
result in significant environmental, social, health, or safety impacts.

Page 10 of 10
Letter of Notification
American Electric Power Groves - Bexley 138 kV Transmission Line Rebuild Project
Attachments in Order of Appearance in Text
Figure 1 Project Location Map
Figures 2-5 Standard Structures
Figures 6-9 Non-Standard Structures
Copies of Notification Letters to Franklin County Commissioners, Trustees of
Truro Township, City of Columbus Mayor and Planning Administrator, and the
City of Whitehall Mayor and City Planning Commission Chairman
ODNR Information - Federal and State RTE Lists and ONDR Response Letter
Waters of the United States Delineation (Report)

!!
!
!
! ! !
!
!
!
!
!
!
!
!
!
!
!
!
!
!
!
!
!
!
!
!
!
!
!
!
!
!
!
!
!
!!!!!!
!
!
!
!
!!
((
(
(
( ( (
(
(
(
(
(
(
(
(
(
(
(
(
(
(
(
(
(
(
(
(
(
(
(
(
(
(
(
(
(
((((((
(
(
(
(
((
S Goul
d R d
Kimberly PkwyRavenswood Ct
Delmar Dr
Alum Creek Dr
E 5th Ave
S Goul
d Rd
Kimberly Pkwy N
N Cass
ady Av
e
Rarig
Ave
S Ham
ilton R
d
Rickenbacker Ave
N Ham
ilton R
dUS-33
S Goul
d Rd
Allegheny Ave
Roswell Dr
Etna St
College Ave
Outerbelt N
Mayflower Blvd
Outerbelt S
Chels
ea Ave
US-33
N Goul
d Rd
Fair Ave Fair Ave
Poth Rd
Stelze
r Rd
Ellery Dr
Eucla
ire Ave
S Cass
ady Av
e
Groves Rd
Etna Rd
Scottwood Rd
S Weya
nt Ave
Fairway Blvd
Petzinger Rd
Maryland Ave
Barne
tt Rd
Count
r y Clu
b Rd
E 5th Ave
S Year
ling Rd
S Ham
ilton R
d
E Main St
E Livingston Ave
E Broad St
I-70 E I-70 W
Stelze
r Rd
Ste lz er Rd
Noe Bix
by Rd
N ew V
i llage
RdEasthav
en Dr
Lattim
er Dr
S Roosevelt Ave
N Jam
es Rd
Coll ege Ave
S Ham
ilton R
d
N Yearling Rd
S Jam
es Rd
Penfield Rd
Maple
wood
Ave
Beech
wood
Rd
Courtr
ight R
d
S Jam
es Rd
Groves Substation1 23 4 5 6
78
910
1112
1314
1516
1718
1920
2122232425262728293031323334 35
363738394041
42 434445Bexley Substation46 JE
FFER
SON
TOWN
SHIP
MIFF
L IN TO
WNSH
IP
MARION TOWNSHIPMIFFLIN TOWNSHIP
MARI
ON TO
WNSH
IPT R
URO
TOW
NSH I
P MIFFLIN TOWNSHIPTRURO TOWNSHIP
Date
Save
d: 5/1
5/201
3
Path:
P:\Pr
ojects
\AEP
\1297
04_G
roves_
Bexle
y\PER
\Envir
onme
ntal\G
IS\Ap
ps\36
467_
1297
04_G
roves_
Bexle
y_Pro
ject_L
ocati
on_M
ap_8
andh
alfby
11.m
xd
ProjectLocation
WestVirginia
PennsylvaniaIndiana Ohio
Michigan
Kentucky Virginia ¨Figure 1 Project Location
GROVES - BEXLEY - 36467
1 inch = 0.5 miles
Date: 5/15/2013
Ohio State Plane South NAD830 2,000 4,000 6,000Feet
!( StructureCenterlineExisting Transmission lineQuarter Mile Buffer
Secondary RoadMajor Road
RailroadLocal Road
0 0.5 1 1.5Miles
NOT TO SCALE
PROPOSED LINE
GROVES Rd. - BEXLEY 138kV
TOP VIEW
TANGENT POLE STRUCTURE
TYPICAL CONFIGURATION
138kV CIRCUIT
9’-0"
11’-0"
85’-0"
11’-7"
GROUND LINE
FIGURE 2

NOT TO SCALE
PROPOSED LINE
GROVES Rd. - BEXLEY 138kV
TYPICAL CONFIGURATION
TOP VIEW
138kV CIRCUIT
11’-0"
9’-0"
9’-0"
FIGURE 3
RUNNING ANGLE POLE STRUCTURE
95’-0"
1’-0"
GROUND LINE
5’-10"
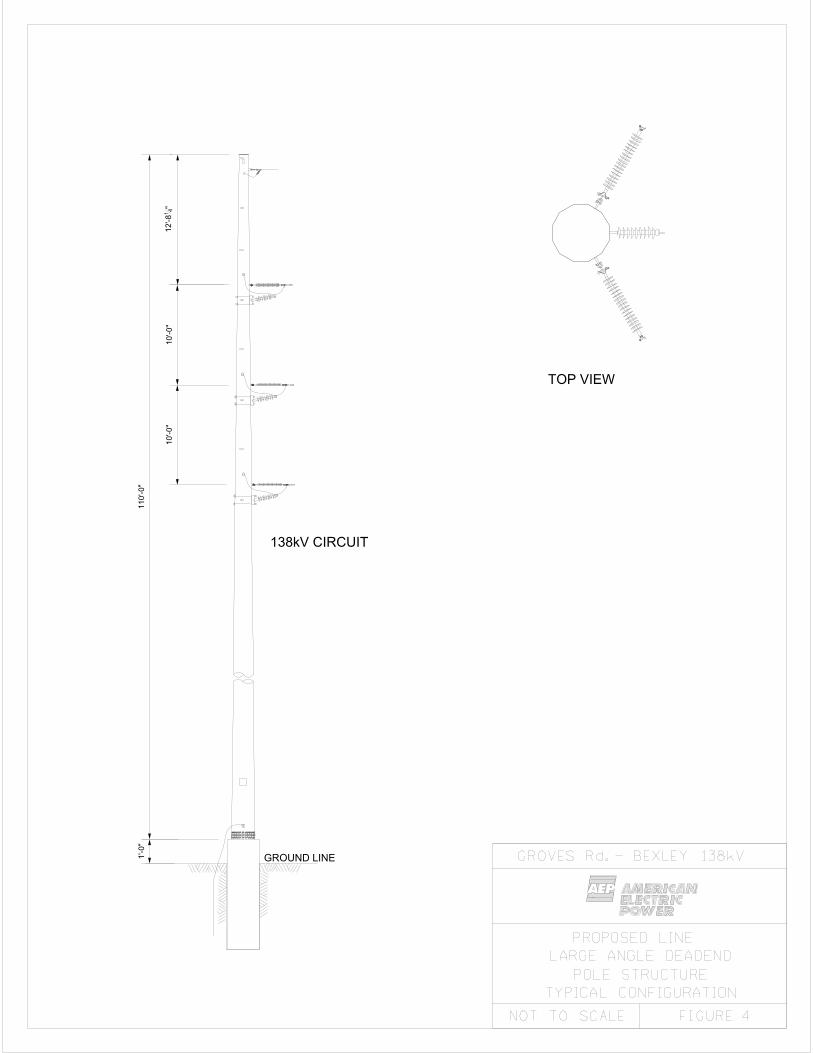
NOT TO SCALE
PROPOSED LINE
GROVES Rd. - BEXLEY 138kV
TYPICAL CONFIGURATION
TOP VIEW
138kV CIRCUIT
"4
112’-8
10’-0"
10’-0"
GROUND LINE
110’-0"
1’-0"
LARGE ANGLE DEADEND
POLE STRUCTURE
FIGURE 4

TOP VIEW
138kV CIRCUIT
"4
112’-8
10’-0"
10’-0"
NOT TO SCALE
PROPOSED LINE
GROVES Rd. - BEXLEY 138kV
TYPICAL CONFIGURATION
SMALL ANGLE DEADEND
POLE STRUCTURE
FIGURE 5
1’-0"
GROUND LINE
90’-0"
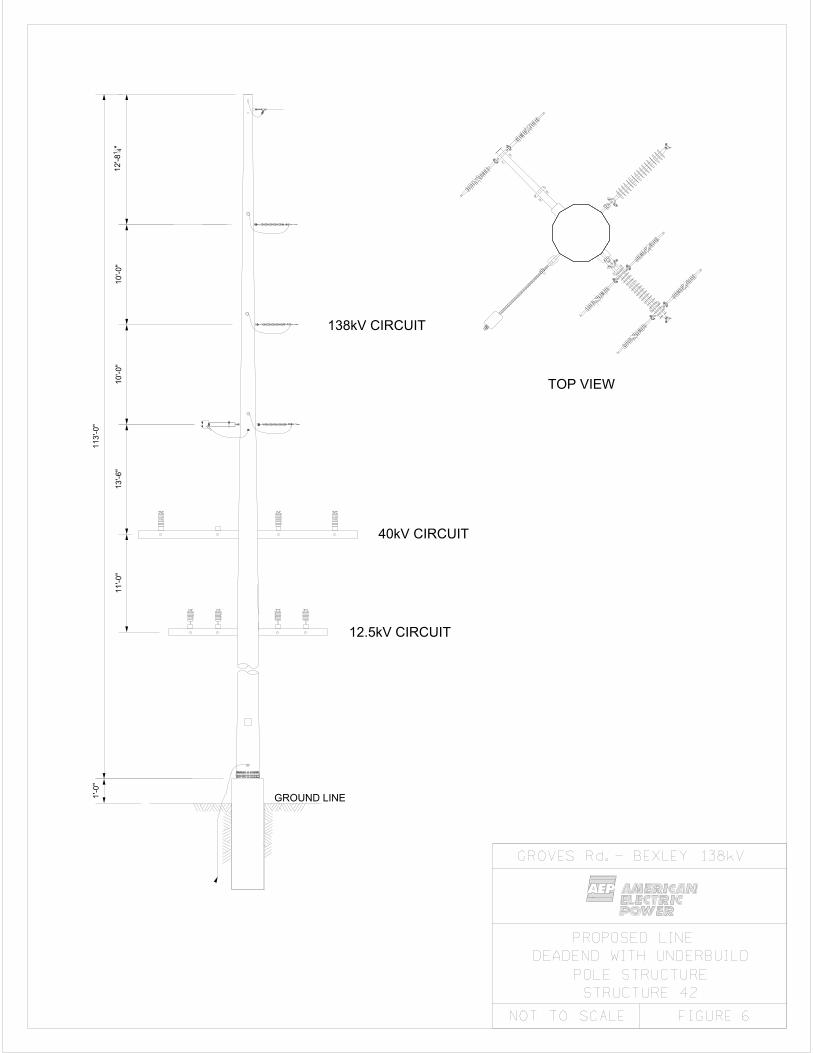
TOP VIEW
"4
112’-8
11’-0"
13’-6"
10’-0"
10’-0"
138kV CIRCUIT
12.5kV CIRCUIT
40kV CIRCUIT
113’-0"
GROUND LINE1’-0"
NOT TO SCALE
PROPOSED LINE
GROVES Rd. - BEXLEY 138kV
POLE STRUCTURE
FIGURE 6
STRUCTURE 42
DEADEND WITH UNDERBUILD

NOT TO SCALE
TOP VIEW
138kV CIRCUIT
11’-0"
9’-0"
13’-0"
15’-0"
FIGURE 7
40kV CIRCUIT
12.5kV CIRCUIT
117’-0"
11’-7"
GROUND LINE
PROPOSED LINE
GROVES Rd. - BEXLEY 138kV
POLE STRUCTURE
STRUCTURE 43
TANGENT WITH UNDERBUILD

NOT TO SCALE
TOP VIEW
9’-0"
11’-0"
22’-0"
8’-0"
11’-0"
FIGURE 8
109’-0"
138kV CIRCUIT
40kV CIRCUIT
12.5kV CIRCUIT
11’-7"
GROUND LINE
12.5kV CIRCUIT
PROPOSED LINE
GROVES Rd. - BEXLEY 138kV
POLE STRUCTURE
STRUCTURE 44
TANGENT WITH UNDERBUILD
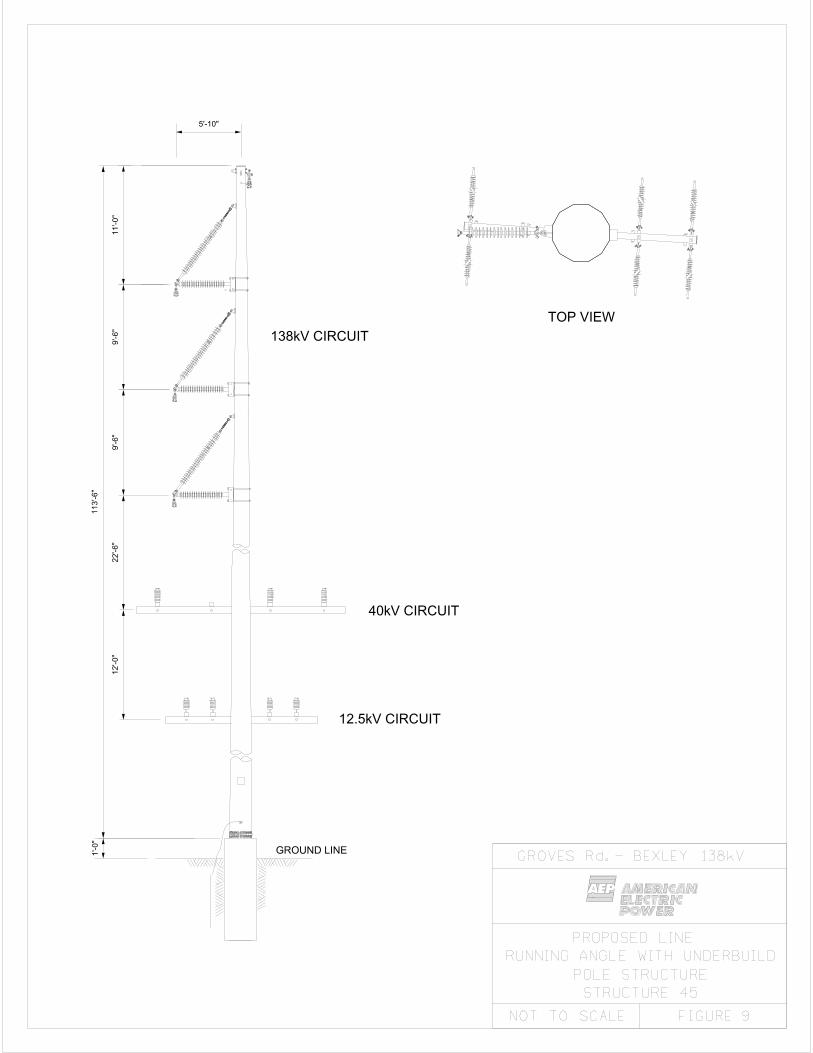
NOT TO SCALE
TOP VIEW
9’-6"
9’-6"
22’-6"
12’-0"
11’-0"
FIGURE 9
5’-10"
GROUND LINE1’-0"
138kV CIRCUIT
12.5kV CIRCUIT
40kV CIRCUIT
113’-6"
PROPOSED LINE
GROVES Rd. - BEXLEY 138kV
POLE STRUCTURE
STRUCTURE 45
RUNNING ANGLE WITH UNDERBUILD

American Electric Power 700 Morrison Road Gahanna, OH 43230
June 10, 2013 John O’Grady, Franklin County Commissioners Board President Paula Brooks, Franklin County Commissioner Marilyn Brown, Franklin County Commissioner 373 S. High Street, 26th Floor Columbus, Ohio 43215-6314
Letter of Notification Groves - Bexley 138 kV Line
Dear Commissioners: In accordance with Chapter 4906 of the Ohio Administrative Code, American Electric Power is required to submit a Letter of Notification to the State of Ohio Power Siting Board (OPSB) when certain changes are made to its transmission facilities. American Electric Power is planning to rebuild 4.4 miles of existing 138 kV transmission line located on easements it owns, on approximately the same centerline in the existing right-of-way. In compliance with Rule 4906-11-01 of the OPSB Rules and Regulations, we have prepared and filed the attached Letter of Notification. This Notification contains details on the structures, structure types and construction schedules, and is hereby submitted for your information. Cordially,
Liz Decima American Electric Power Transmission Line Engineering Enclosure c: Ohio Power Siting Board

American Electric Power 700 Morrison Road Gahanna, OH 43230
June 10, 2013 Pat Mahaffey, Truro Township Trustee Dennis Nicodemus, Truro Township Trustee Barbara Strussion, Truro Township Trustee 6900 E. Main St. Reynoldsburg, Ohio 43068-2250
Letter of Notification Groves - Bexley 138 kV Line
Dear Trustees: In accordance with Chapter 4906 of the Ohio Administrative Code, American Electric Power is required to submit a Letter of Notification to the State of Ohio Power Siting Board (OPSB) when certain changes are made to its transmission facilities. American Electric Power is planning to rebuild 4.4 miles of existing 138 kV transmission line located on easements it owns, on approximately the same centerline in the existing right-of-way. In compliance with Rule 4906-11-01 of the OPSB Rules and Regulations, we have prepared and filed the attached Letter of Notification. This Notification contains details on the structures, structure types and construction schedules, and is hereby submitted for your information. Cordially,
Liz Decima American Electric Power Transmission Line Engineering Enclosure c: Ohio Power Siting Board
American Electric Power 700 Morrison Road Gahanna, OH 43230
June 10, 2013 Michael B. Coleman, Mayor Mayor's Office City Hall 2nd Floor 90 West Broad Street Columbus, OH 43215
Letter of Notification Groves - Bexley 138 kV Line
Dear Mayor: In accordance with Chapter 4906 of the Ohio Administrative Code, American Electric Power is required to submit a Letter of Notification to the State of Ohio Power Siting Board (OPSB) when certain changes are made to its transmission facilities. American Electric Power is planning to rebuild 4.4 miles of existing 138 kV transmission line located on easements it owns, on approximately the same centerline in the existing right-of-way. In compliance with Rule 4906-11-01 of the OPSB Rules and Regulations, we have prepared and filed the attached Letter of Notification. This Notification contains details on the structures, structure types and construction schedules, and is hereby submitted for your information. Cordially,
Liz Decima American Electric Power Transmission Line Engineering Enclosure c: Ohio Power Siting Board

American Electric Power 700 Morrison Road Gahanna, OH 43230
June 10, 2013 City of Columbus Planning Division Vince Papsidero, AICP 109 N. Front Street, First Floor Columbus, OH 43215
Letter of Notification Groves - Bexley 138 kV Line
Dear Planners: In accordance with Chapter 4906 of the Ohio Administrative Code, American Electric Power is required to submit a Letter of Notification to the State of Ohio Power Siting Board (OPSB) when certain changes are made to its transmission facilities. American Electric Power is planning to rebuild 4.4 miles of existing 138 kV transmission line located on easements it owns, on approximately the same centerline in the existing right-of-way. In compliance with Rule 4906-11-01 of the OPSB Rules and Regulations, we have prepared and filed the attached Letter of Notification. This Notification contains details on the structures, structure types and construction schedules, and is hereby submitted for your information. Cordially,
Liz Decima American Electric Power Transmission Line Engineering Enclosure c: Ohio Power Siting Board
American Electric Power 700 Morrison Road Gahanna, OH 43230
June 10, 2013 Kim Maggard, Mayor Terry Anderson, City Planning Chairman Office of the Mayor 360 South Yearling Rd. Whitehall, OH 43213
Letter of Notification Groves - Bexley 138 kV Line
Dear Mayor: In accordance with Chapter 4906 of the Ohio Administrative Code, American Electric Power is required to submit a Letter of Notification to the State of Ohio Power Siting Board (OPSB) when certain changes are made to its transmission facilities. American Electric Power is planning to rebuild 4.4 miles of existing 138 kV transmission line located on easements it owns, on approximately the same centerline in the existing right-of-way. In compliance with Rule 4906-11-01 of the OPSB Rules and Regulations, we have prepared and filed the attached Letter of Notification. This Notification contains details on the structures, structure types and construction schedules, and is hereby submitted for your information. Cordially,
Liz Decima American Electric Power Transmission Line Engineering Enclosure c: Ohio Power Siting Board

United States Department of the Interior FISH AND WILDLIFE SERVICE
Ecological Services 4625 Morse Road, Suite 104
Columbus, Ohio 43230 (614) 416-8993 / FAX (614) 416-8994
Federally Listed Species by Ohio Counties
May 1, 2013
COUNTY
SPECIES
ADAMS Indiana bat (E), running buffalo clover (E), fanshell (E), pink mucket pearly mussel (E), rayed bean (E), sheepnose (E), snuffbox (E), timber rattlesnake (SC), bald eagle (SC)
ALLEN Indiana bat (E), bald eagle (SC)
ASHLAND Indiana bat (E), eastern hellbender (SC), bald eagle (SC)
ASHTABULA Indiana bat (E), Kirtland’s warbler (E), piping plover (E), clubshell (E), snuffbox (E), eastern massasauga (C), bald eagle (SC)
ATHENS Indiana bat (E), American burying beetle (E), fanshell (E), pink mucket pearly mussel (E), sheepnose (E), snuffbox (E), timber rattlesnake (SC), bald eagle (SC)
AUGLAIZE Indiana bat (E), bald eagle (SC)
BELMONT Indiana bat (E), eastern hellbender (SC), bald eagle (SC)
BROWN Indiana bat (E), running buffalo clover (E), fanshell (E), pink mucket pearly mussel (E), rayed bean (E), sheepnose (E), snuffbox (E), bald eagle (SC)
BUTLER Indiana bat (E), rayed bean (E), bald eagle (SC)
CARROLL Indiana bat (E), bald eagle (SC)
CHAMPAIGN Indiana bat (E), eastern massasauga (C), bald eagle (SC)
CLARK Indiana bat (E), rayed bean (E), eastern prairie fringed orchid (T), eastern massasauga (C), bald eagle (SC)
CLERMONT Indiana bat (E), running buffalo clover (E), fanshell (E), pink mucket pearly mussel (E), rayed bean (E), sheepnose (E), snuffbox (E), bald eagle (SC)
CLINTON Indiana bat (E), eastern massasauga (C), bald eagle (SC)
COLUMBIANA Indiana bat (E), eastern massasauga (C), eastern hellbender (SC), bald eagle (SC)
COSHOCTON Indiana bat (E), clubshell (E), fanshell (E), purple cat’s paw pearly mussel (E), rayed bean (E), sheepnose (E), snuffbox (E), rabbitsfoot (PT/PCH), eastern hellbender (SC), bald eagle (SC)
CRAWFORD Indiana bat (E), eastern massasauga (C), bald eagle (SC)
CUYAHOGA Indiana bat (E), Kirtland’s warbler (E), piping plover (E), bald eagle (SC)

2
DARKE Indiana bat (E), rayed bean (E), bald eagle (SC)
DEFIANCE Indiana bat (E), clubshell (E), northern riffleshell (E), white cat’s paw pearly mussel (E), rayed bean (E), copperbelly water snake (T), bald eagle (SC)
DELAWARE Indiana bat (E), rayed bean (E), bald eagle (SC)
ERIE Indiana bat (E), Kirtland’s warbler (E), piping plover (E/CH), Lakeside daisy (T), eastern massasauga (C), Lake Erie watersnake (SC), bald eagle (SC)
FAIRFIELD Indiana bat (E), eastern massasauga (C), bald eagle (SC)
FAYETTE Indiana bat (E), eastern massasauga (C), bald eagle (SC)
FRANKLIN Indiana bat (E), Scioto madtom (E), clubshell (E), northern riffleshell (E), rayed bean (E), snuffbox (E), rabbitsfoot (PT), bald eagle (SC)
FULTON Indiana bat (E), rayed bean (E), bald eagle (SC)
GALLIA Indiana bat (E), fanshell (E), pink mucket pearly mussel (E), sheepnose (E), snuffbox (E), timber rattlesnake (SC), bald eagle (SC)
GEAUGA Indiana bat (E), bald eagle (SC)
GREENE Indiana bat (E), clubshell (E), rayed bean (E), snuffbox (E), eastern massasauga (C), bald eagle (SC)
GUERNSEY Indiana bat (E), bald eagle (SC)
HAMILTON Indiana bat (E), running buffalo clover (E), fanshell (E), pink mucket pearly mussel (E), rayed bean (E), sheepnose (E), snuffbox (E), bald eagle (SC)
HANCOCK Indiana bat (E), clubshell (E), rayed bean (E), bald eagle (SC)
HARDIN Indiana bat (E), clubshell (E), rayed bean (E), copperbelly water snake (T), eastern massasauga (C), bald eagle (SC)
HARRISON Indiana bat (E), bald eagle (SC)
HENRY Indiana bat (E), bald eagle (SC)
HIGHLAND Indiana bat (E), timber rattlesnake (SC), bald eagle (SC)
HOCKING Indiana bat (E), American burying beetle (E), running buffalo clover (E), northern monkshood (T), small whorled pogonia (T), timber rattlesnake (SC), bald eagle (SC)
HOLMES Indiana bat (E), eastern prairie fringed orchid (T), eastern hellbender (SC), bald eagle (SC)
HURON Indiana bat (E), eastern massasauga (C), bald eagle (SC)
JACKSON Indiana bat (E), timber rattlesnake (SC), bald eagle (SC)
JEFFERSON Indiana bat (E), eastern hellbender (SC), bald eagle (SC)
KNOX Indiana bat (E), eastern hellbender (SC), bald eagle (SC)
LAKE Indiana bat (E), Kirtland’s warbler (E), piping plover (E/CH), snuffbox (E), bald eagle (SC)
3
LAWRENCE Indiana bat (E), running buffalo clover (E), fanshell (E), pink mucket pearly mussel (E), sheepnose (E), snuffbox (E), timber rattlesnake (SC), bald eagle (SC)
LICKING Indiana bat (E), eastern massasauga (C), bald eagle (SC)
LOGAN Indiana bat (E), rayed bean (E), eastern massasauga (C), bald eagle (SC)
LORAIN Indiana bat (E), Kirtland’s warbler (E), piping plover (E), bald eagle (SC)
LUCAS Indiana bat (E), Karner blue butterfly (E), Kirtland’s warbler (E), piping plover (E), rayed bean (E), eastern prairie fringed orchid (T), eastern massasauga (C), bald eagle (SC)
MADISON Indiana bat (E), Scioto madtom (E), clubshell (E), northern riffleshell (E), rayed bean (E), snuffbox (E), rabbitsfoot (PT/PCH), bald eagle (SC)
MAHONING Indiana bat (E), eastern massasauga (C), bald eagle (SC)
MARION Indiana bat (E), rayed bean (E), eastern massasauga (C), bald eagle (SC)
MEDINA Indiana bat (E), bald eagle (SC)
MEIGS Indiana bat (E), fanshell (E), pink mucket pearly mussel (E), sheepnose (E), snuffbox (E), bald eagle (SC)
MERCER Indiana bat (E), bald eagle (SC)
MIAMI Indiana bat (E), rayed bean (E), snuffbox (E), bald eagle (SC)
MONROE Indiana bat (E), eastern hellbender (SC), bald eagle (SC)
MONTGOMERY Indiana bat (E), rayed bean (E), snuffbox (E), eastern massasauga (C), bald eagle (SC)
MORGAN Indiana bat (E), American burying beetle (E), fanshell (E), pink mucket pearly mussel (E), sheepnose (E), snuffbox (E), bald eagle (SC)
MORROW Indiana bat (E), bald eagle (SC)
MUSKINGUM Indiana bat (E), fanshell (E), sheepnose (E), snuffbox (E), rabbitsfoot (PT), eastern hellbender (SC), bald eagle (SC)
NOBLE Indiana bat (E), bald eagle (SC)
OTTAWA Indiana bat (E), Kirtland’s warbler (E), piping plover (E), eastern prairie fringed orchid (T), Lakeside daisy (T), eastern massasauga (C), Lake Erie watersnake (SC), bald eagle (SC)
PAULDING Indiana bat (E), bald eagle (SC)
PERRY Indiana bat (E), American burying beetle (E), bald eagle (SC)
PICKAWAY Indiana bat (E), Scioto madtom (E), clubshell (E), northern riffleshell (E), rayed bean (E), snuffbox (E), rabbitsfoot (PT), bald eagle (SC)
PIKE Indiana bat (E), clubshell (E), northern riffleshell (E), rayed bean (E), timber rattlesnake (SC), bald eagle (SC)
PORTAGE Indiana bat (E), Mitchell's satyr (E), northern monkshood (T), eastern massasauga (C), bald eagle (SC)

4
PREBLE Indiana bat (E), eastern massasauga (C), bald eagle (SC)
PUTNAM Indiana bat (E), bald eagle (SC)
RICHLAND Indiana bat (E), eastern massasauga (C), eastern hellbender (SC), bald eagle (SC)
ROSS Indiana bat (E), clubshell (E), northern riffleshell (E), rayed bean (E), eastern hellbender (SC), timber rattlesnake (SC), bald eagle (SC)
SANDUSKY Indiana bat (E), Kirtland’s warbler (E), piping plover (E), eastern prairie fringed orchid (T), eastern massasauga (C), bald eagle (SC)
SCIOTO
Indiana bat (E), running buffalo clover (E), clubshell (E), fanshell (E), northern riffleshell (E), pink mucket pearly mussel (E), rayed bean (E), sheepnose (E), snuffbox (E), small whorled pogonia (T), Virginia spiraea (T), eastern hellbender (SC), timber rattlesnake (SC), bald eagle (SC)
SENECA Indiana bat (E), bald eagle (SC)
SHELBY Indiana bat (E), rayed bean (E), bald eagle (SC)
STARK Indiana bat (E), bald eagle (SC)
SUMMIT Indiana bat (E), northern monkshood (T), bald eagle (SC)
TRUMBULL Indiana bat (E), clubshell (E), eastern massasauga (C), bald eagle (SC)
TUSCARAWAS Indiana bat (E), eastern hellbender (SC), bald eagle (SC)
UNION Indiana bat (E), Scioto madtom (E), clubshell (E), northern riffleshell (E), rayed bean (E), snuffbox (E), rabbitsfoot (PT/PCH), bald eagle (SC)
VAN WERT Indiana bat (E), bald eagle (SC)
VINTON Indiana bat (E), American burying beetle (E), eastern hellbender (SC), timber rattlesnake (SC), bald eagle (SC)
WARREN Indiana bat (E), running buffalo clover (E), rayed bean (E), eastern massasauga (C), bald eagle (SC)
WASHINGTON Indiana bat (E), fanshell (E), pink mucket pearly mussel (E), sheepnose (E), snuffbox (E), eastern hellbender (SC), timber rattlesnake (SC), bald eagle (SC)
WAYNE Indiana bat (E), eastern prairie fringed orchid (T), eastern massasauga (C), bald eagle (SC)
WILLIAMS Indiana bat (E), clubshell (E), northern riffleshell (E), white cat’s paw pearly mussel (E), rayed bean (E), rabbitsfoot (PT/PCH), copperbelly water snake (T), bald eagle (SC)
WOOD Indiana bat (E), bald eagle (SC)
WYANDOT Indiana bat (E), rayed bean (E), eastern massasauga (C), bald eagle (SC)
IMPORTANT NOTE: This list reflects data available as of May 1, 2013, and will change as new data become available. For this reason, searches for listed species should not necessarily be limited to the counties noted above. Any decisions in that regard should be made only after calling the USFWS (614/416-8993) for guidance. E = Endangered SC = Species of Concern T = Threatened CH = Critical Habitat C = Candidate P = Proposed (T/E/CH)
Ohio Division of WildlifeNatural Heritage Database
State-listed Species for Franklin Co.As of 11/8/2012
Common NameState
StatusFederal StatusScientific Name
Last Recorded
PLANTS
Acorus americanus American Sweet-flag P1989
Agalinis gattingeri Gattinger's-foxglove T2001
Arabis patens Spreading Rock Cress E2012
Baptisia lactea Prairie False Indigo P2001
Bromus kalmii Prairie Brome P2008
Carex decomposita Cypress-knee Sedge E2006
Cyperus acuminatus Pale Umbrella-sedge P2005
Delphinium exaltatum Tall Larkspur P FSC2008
Juncus secundus One-sided Rush P2012
Liatris squarrosa Scaly Blazing-star P2012
Poa saltuensis ssp. languida Weak Spear Grass P1982
Thuja occidentalis Arbor Vitae P2001
Triphora trianthophora Three-birds Orchid P1981
Ulmus thomasii Rock Elm P2010
ANIMALS
Alasmidonta marginata Elktoe SC FSC2009
Anas crecca Green-winged Teal SI1981
Bartramia longicauda Upland Sandpiper E1985
Cyclonaias tuberculata Purple Wartyback SC2000
Elliptio crassidens Elephant-ear E1982
Epioblasma torulosa rangiana Northern Riffleshell E FE1996
Epioblasma triquetra Snuffbox E FE2003
Etheostoma maculatum Spotted Darter E FSC2003
Etheostoma tippecanoe Tippecanoe Darter T1999
Falco peregrinus Peregrine Falcon T FSC2009
Haliaeetus leucocephalus Bald Eagle F FSC2011
Hemidactylium scutatum Four-toed Salamander SC1964
Hiodon alosoides Goldeye E1959
Ichthyomyzon fossor Northern Brook Lamprey E1972
Lampsilis fasciola Wavy-rayed Lampmussel SC2007
Lampsilis ovata Pocketbook E1998
Lepisosteus platostomus Shortnose Gar E1996
Ligumia recta Black Sandshell T2009
Page 1 of 2P=Potentially Threatened, T=Threatened, E=Endangered, SC=Species of Concern SI=Special Interest, FT=Federally Threatened, FE=Federally Endangered, F=Federal Only
Common NameState
StatusFederal StatusScientific Name
Last Recorded
Megalonaias nervosa Washboard E1995
Moxostoma carinatum River Redhorse SC1990
Myotis sodalis Indiana Bat E FE2008
Notropis heterolepis Blacknose Shiner X1983
Nyctanassa violacea Yellow-crowned Night-heron SI2011
Obliquaria reflexa Threehorn Wartyback T2009
Opheodrys vernalis Smooth Greensnake SC1986
Pleurobema clava Clubshell E FE2006
Pleurobema sintoxia Round Pigtoe SC2006
Polyodon spathula Paddlefish T FSC1976
Ptychobranchus fasciolaris Kidneyshell SC2010
Quadrula cylindrica cylindrica Rabbitsfoot E FC1996
Simpsonaias ambigua Salamander Mussel SC FSC1996
Taxidea taxus Badger SC2003
Truncilla donaciformis Fawnsfoot T2008
Truncilla truncata Deertoe SC2009
Tyto alba Barn Owl T1976
Uniomerus tetralasmus Pondhorn T1999
Vermivora chrysoptera Golden-winged Warbler X1984
Villosa fabalis Rayed Bean E FE1996
Page 2 of 2P=Potentially Threatened, T=Threatened, E=Endangered, SC=Species of Concern SI=Special Interest, FT=Federally Threatened, FE=Federally Endangered, F=Federal Only

NATURAL HERITAGE DATA REQUEST FORM
OHIO DEPARTMENT OF NATURAL RESOURCES DIVISION OF WILDLIFE OHIO NATURAL HERITAGE PROGRAM 2045 MORSE RD., BLDG. G-3 COLUMBUS, OHIO 43229-6693 PHONE: 614-265-6452; EMAIL: [email protected]
INSTRUCTIONS: Please complete both pages of this form, sign and return it to the address or email address above along with: (1) a brief letter describing your project, and (2) a map detailing the boundaries of your project site. A copy of the pertinent portion of a USGS 7.5 minute topographic map is preferred but other maps are acceptable. Data requests will be competed within approximately 30 days. There is currently no charge for data requests. WHAT WE PROVIDE: The Natural Heritage Database is the most comprehensive source of information on the location of Ohio's rare species and significant natural features. Records for the following will be provided: plants and animals (state and federal listed species), high quality plant communities, geologic features, breeding animal concentrations and unprotected significant natural areas. We also provide locations for managed areas including federal, state, county, local and non-profit sites, as well as state and national scenic rivers. A minimum one mile radius around the project site will automatically be searched. Because the data is sensitive information, it is our policy to provide only the data needed to complete your project. The information is generally provided without comment on potential impacts to the species and their habitats and therefore does not constitute coordination with ODNR under NEPA, the Fish & Wildlife Coordination Act or the Federal Water Pollution Control Act. If your project requires ODNR coordination, please submit it for a more extensive environmental review by contacting John Kessler in the Office of Real Estate at 614-265-6621 or [email protected] **************************************************************************************************** Date: _____________________ Company name: __________________________________
Name of person response letter should be addressed to: Mr. ☐ Ms. ☐
____________________________________________________________________________ Address: ____________________________________________________________________ City/State/Zip: ________________________________________________________________ Phone: ________________________________ Fax: ________________________________ E-mail address: ______________________________________________________________ Project Name: ________________________________________________________________ Project Number: ______________________________________________________________

Project Site Address: __________________________________________________________ Project County: _______________________________________________________________ Project City/Township: __________________________________________________________ Project site is located on the following USGS 7.5 minute topographic quad(s): ______________ ____________________________________________________________________________ ____________________________________________________________________________ Project Latitude and Longitude if available (decimal degrees is preferred): ________________ ____________________________________________________________________________ Description of work to be performed at the project site: ________________________________ ____________________________________________________________________________ ____________________________________________________________________________ How do you want your data reported? (Both formats provide exactly the same data. The only difference is in the format of our response. The manual search is most appropriate for small scale projects or for those who do not have GIS capabilities. Please choose only one option.) Printed list and map (manual search) ______ OR GIS shapefile (computer search) __________ Additional information you require: ________________________________________________ ____________________________________________________________________________ ____________________________________________________________________________ How will the information be used? ________________________________________________ ____________________________________________________________________________ ____________________________________________________________________________ I certify that data supplied by the Ohio Natural Heritage Program will not be published without crediting the ODNR Division of Wildlife as the source of the material. In addition, I certify that electronic datasets will not be distributed to others without the consent of the Division of Wildlife, Ohio Natural Heritage Program. Signature ________________________ Date: ____________________________ DNR 5203 REV 3/2013
May 24, 2013
WATERS OF THE UNITED STATES DELINEATION
GROVES-BEXLEY 138 KV T-LINE COLUMBUS, FRANKLIN COUNTY, OHIO
Prepared for: Power Engineers, Inc
303 U.S. Route One, Suite 2A Freeport, ME 04032
Prepared by: BHE Environmental, Inc. 1 South Main Street Akron, Ohio 44308 Phone: 513.326.1500
www.bheenvironmental.com
Notice: This report has been prepared by BHE Environmental, Inc., solely for the benefit of its client in accordance with an approved scope of work. BHE assumes no liability for the unauthorized use of this report or the information contained in it by a third party. Copyright © 2013 BHE Environmental, Inc.

BHE Environmental, Inc. ii PN: 2028.003
TABLE OF CONTENTS
1.0 INTRODUCTION .................................................................................... 1
1.1 SITE DESCRIPTION ............................................................................. 1
1.2 JURISDICTIONAL AUTHORITY ................................................................ 1
1.2.1 Streams ..................................................................................... 2
1.2.2 Wetlands ................................................................................... 2
2.0 METHODS ........................................................................................... 2
2.1 ANALYSIS OF EXISTING DOCUMENTS ........................................................ 2
2.1.1 Soils ......................................................................................... 3
2.1.2 Streams ..................................................................................... 3
2.1.3 Wetlands ................................................................................... 3
2.1.4 Floodplains ................................................................................. 3
2.2 FIELD INVESTIGATIONS........................................................................ 3
2.2.1 Streams ..................................................................................... 3
2.2.2 Wetlands ................................................................................... 4
3.0 RESULTS ............................................................................................ 4
3.1 SOILS ............................................................................................ 4
3.2 STREAMS ........................................................................................ 4
3.3 WETLANDS ...................................................................................... 8
3.4 FLOODPLAINS ................................................................................. 14
4.0 SUMMARY .......................................................................................... 14
5.0 LITERATURE CITED .............................................................................. 15

BHE Environmental, Inc. iii
TABLES
Table 1. Mapped soil units within the Groves-Bexley 138 kV T-line survey corridor.
Table 2. Summary data for Stream 1 within the Groves-Bexley 138 kV T-line survey corridor.
Table 3. Summary data for wetlands identified within the Groves-Bexley 138 kV T-line survey corridor.
FIGURES
Figure 1. Overview and Key Map for the Power Engineers- Grove-Bexley 138 kV T-Line
Figure 2. Study Area for Power Engineers- Grove-Bexley 138 kV T-Line
Figure 3. Study Area for Power Engineers- Grove-Bexley 138 kV T-Line
Figure 4. Study Area for Power Engineers- Grove-Bexley 138 kV T-Line
Figure 5. Study Area for Power Engineers- Grove-Bexley 138 kV T-Line
Figure 6. Study Area for Power Engineers- Grove-Bexley 138 kV T-Line
APPENDICES
Appendix A. Photo Log
Appendix B. Stream and Wetland Datasheets
BHE Environmental, Inc. 1
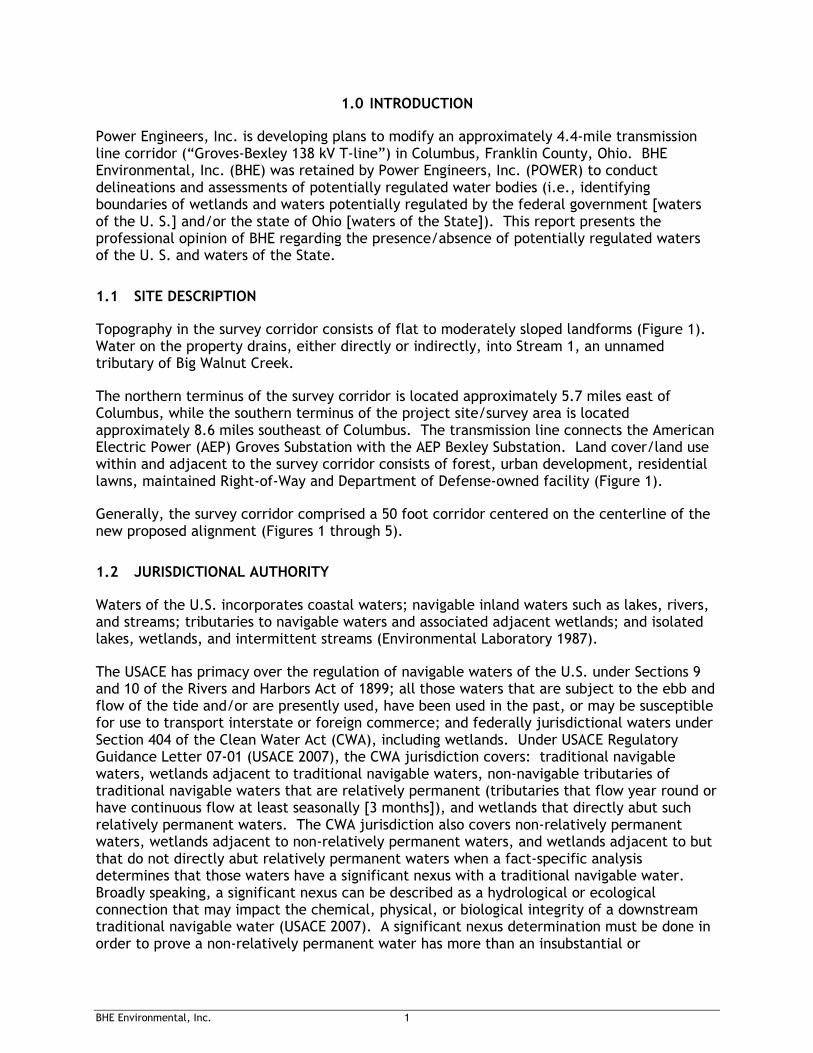
1.0 INTRODUCTION
Power Engineers, Inc. is developing plans to modify an approximately 4.4-mile transmission line corridor (“Groves-Bexley 138 kV T-line”) in Columbus, Franklin County, Ohio. BHE Environmental, Inc. (BHE) was retained by Power Engineers, Inc. (POWER) to conduct delineations and assessments of potentially regulated water bodies (i.e., identifying boundaries of wetlands and waters potentially regulated by the federal government [waters of the U. S.] and/or the state of Ohio [waters of the State]). This report presents the professional opinion of BHE regarding the presence/absence of potentially regulated waters of the U. S. and waters of the State.
1.1 SITE DESCRIPTION
Topography in the survey corridor consists of flat to moderately sloped landforms (Figure 1). Water on the property drains, either directly or indirectly, into Stream 1, an unnamed tributary of Big Walnut Creek.
The northern terminus of the survey corridor is located approximately 5.7 miles east of Columbus, while the southern terminus of the project site/survey area is located approximately 8.6 miles southeast of Columbus. The transmission line connects the American Electric Power (AEP) Groves Substation with the AEP Bexley Substation. Land cover/land use within and adjacent to the survey corridor consists of forest, urban development, residential lawns, maintained Right-of-Way and Department of Defense-owned facility (Figure 1).
Generally, the survey corridor comprised a 50 foot corridor centered on the centerline of the new proposed alignment (Figures 1 through 5).
1.2 JURISDICTIONAL AUTHORITY
Waters of the U.S. incorporates coastal waters; navigable inland waters such as lakes, rivers, and streams; tributaries to navigable waters and associated adjacent wetlands; and isolated lakes, wetlands, and intermittent streams (Environmental Laboratory 1987).
The USACE has primacy over the regulation of navigable waters of the U.S. under Sections 9 and 10 of the Rivers and Harbors Act of 1899; all those waters that are subject to the ebb and flow of the tide and/or are presently used, have been used in the past, or may be susceptible for use to transport interstate or foreign commerce; and federally jurisdictional waters under Section 404 of the Clean Water Act (CWA), including wetlands. Under USACE Regulatory Guidance Letter 07-01 (USACE 2007), the CWA jurisdiction covers: traditional navigable waters, wetlands adjacent to traditional navigable waters, non-navigable tributaries of traditional navigable waters that are relatively permanent (tributaries that flow year round or have continuous flow at least seasonally [3 months]), and wetlands that directly abut such relatively permanent waters. The CWA jurisdiction also covers non-relatively permanent waters, wetlands adjacent to non-relatively permanent waters, and wetlands adjacent to but that do not directly abut relatively permanent waters when a fact-specific analysis determines that those waters have a significant nexus with a traditional navigable water. Broadly speaking, a significant nexus can be described as a hydrological or ecological connection that may impact the chemical, physical, or biological integrity of a downstream traditional navigable water (USACE 2007). A significant nexus determination must be done in order to prove a non-relatively permanent water has more than an insubstantial or

BHE Environmental, Inc. 2
speculative effect on the chemical, physical, and/or biological integrity of a downstream traditional navigable water (USACE 2007).
Impacts to waters of the U.S. are regulated by the USACE through Section 404 of the CWA (33 U.S.C. 1344). In addition, impacts to waters or wetlands also require water quality certification from the state as defined in Section 401 of the CWA (33 U.S.C. 1341).
1.2.1 Streams
Streams and drainageways within the survey corridor were examined for the presence/absence of an Ordinary High Water Mark (OHWM) and defined bed and bank. If these characteristics were observed in a water body, it was determined to be a regulated stream; if these characteristics were absent, this area was determined to be a drainageway, swale, or ditch and not a CWA-regulated feature, i.e., not a water of the U.S.
1.2.2 Wetlands
Federal regulations define wetlands as:
Those areas that are inundated or saturated by surface or groundwater at a frequency and duration sufficient to support, and that under normal circumstances do support, a prevalence of vegetation, typically adapted for life in saturated soil conditions.
Under normal circumstances, three parameters must be present for an area to be considered a wetland: hydrophytic vegetation, wetland hydrology, and hydric soils. Applicable technical guidance that defines these parameters and provides criteria for the evaluation of associated data and field indicators is provided in the 1987 Wetland Delineation Manual (Environmental Laboratory 1987) and the Regional Supplement to the Corps of Engineers Wetland Delineation Manual, Midwest Region (USACE 2012).
2.0 METHODS
2.1 ANALYSIS OF EXISTING DOCUMENTS
Available technical documents were reviewed prior to the initiation of field investigations. These documents included:
• Soil Survey of Franklin County, Ohio (NRCS 1977) ;
• National Wetland Inventory (NWI) Map (1977 and as updated);
• Ohio Wetland Inventory (OWI) Map (1985);
• Franklin County Hydric Soils list (Soil Data Mart);
• Aerial Photography (2010);
• U.S. Geological Survey (USGS) National Hydrography Dataset (NHD) (2012); and
• Federal Emergency Management Agency (FEMA) 100-year Floodplain maps.
Most of these data were assembled in a geographic information system (GIS) project to gain a preliminary understanding of features and areas of concern. The GIS was then used for desktop analysis of site topography, soils, and drainage. Various maps were also prepared from the integrated GIS data to focus the field investigation.
BHE Environmental, Inc. 3
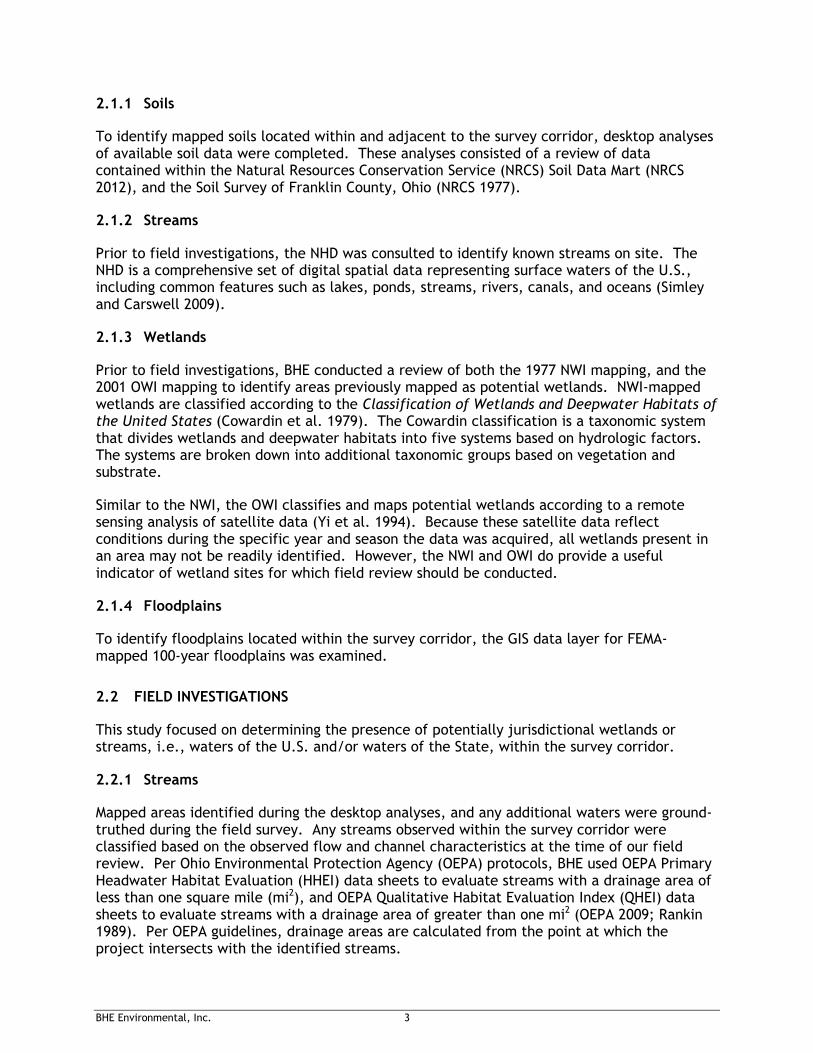
2.1.1 Soils
To identify mapped soils located within and adjacent to the survey corridor, desktop analyses of available soil data were completed. These analyses consisted of a review of data contained within the Natural Resources Conservation Service (NRCS) Soil Data Mart (NRCS 2012), and the Soil Survey of Franklin County, Ohio (NRCS 1977).
2.1.2 Streams
Prior to field investigations, the NHD was consulted to identify known streams on site. The NHD is a comprehensive set of digital spatial data representing surface waters of the U.S., including common features such as lakes, ponds, streams, rivers, canals, and oceans (Simley and Carswell 2009).
2.1.3 Wetlands
Prior to field investigations, BHE conducted a review of both the 1977 NWI mapping, and the 2001 OWI mapping to identify areas previously mapped as potential wetlands. NWI-mapped wetlands are classified according to the Classification of Wetlands and Deepwater Habitats of the United States (Cowardin et al. 1979). The Cowardin classification is a taxonomic system that divides wetlands and deepwater habitats into five systems based on hydrologic factors. The systems are broken down into additional taxonomic groups based on vegetation and substrate.
Similar to the NWI, the OWI classifies and maps potential wetlands according to a remote sensing analysis of satellite data (Yi et al. 1994). Because these satellite data reflect conditions during the specific year and season the data was acquired, all wetlands present in an area may not be readily identified. However, the NWI and OWI do provide a useful indicator of wetland sites for which field review should be conducted.
2.1.4 Floodplains
To identify floodplains located within the survey corridor, the GIS data layer for FEMA-mapped 100-year floodplains was examined.
2.2 FIELD INVESTIGATIONS
This study focused on determining the presence of potentially jurisdictional wetlands or streams, i.e., waters of the U.S. and/or waters of the State, within the survey corridor.
2.2.1 Streams
Mapped areas identified during the desktop analyses, and any additional waters were ground-truthed during the field survey. Any streams observed within the survey corridor were classified based on the observed flow and channel characteristics at the time of our field review. Per Ohio Environmental Protection Agency (OEPA) protocols, BHE used OEPA Primary Headwater Habitat Evaluation (HHEI) data sheets to evaluate streams with a drainage area of less than one square mile (mi2), and OEPA Qualitative Habitat Evaluation Index (QHEI) data sheets to evaluate streams with a drainage area of greater than one mi2 (OEPA 2009; Rankin 1989). Per OEPA guidelines, drainage areas are calculated from the point at which the project intersects with the identified streams.

BHE Environmental, Inc. 4
Features were mapped with Trimble GeoXH mapping-grade global positioning system (GPS) units.
2.2.2 Wetlands
Wetlands were identified according to the “Routine Onsite Determination Method” described in the USACE Wetlands Delineation Manual (Environmental Laboratory 1987) and the Regional Supplement to the USACE Wetland Delineation Manual, Midwest Region (USACE 2012). This procedure entails traversing the site and evaluating vegetation, soils, and hydrology at sampling plots to determine the presence of field indicators for each parameter. According to this method, wetlands are those areas that meet prescribed criteria for all three parameters. Those criteria are explained in detail in the aforementioned manuals and are modified as appropriate for regional conditions. BHE used OEPA Ohio Rapid Assessment Method (ORAM, vers. 5.0) to evaluate all wetlands.
3.0 RESULTS
Field investigations were completed May 6 - 7, 2013. A photo log illustrating the general land-use within the survey area is provided as Appendix A.
3.1 SOILS
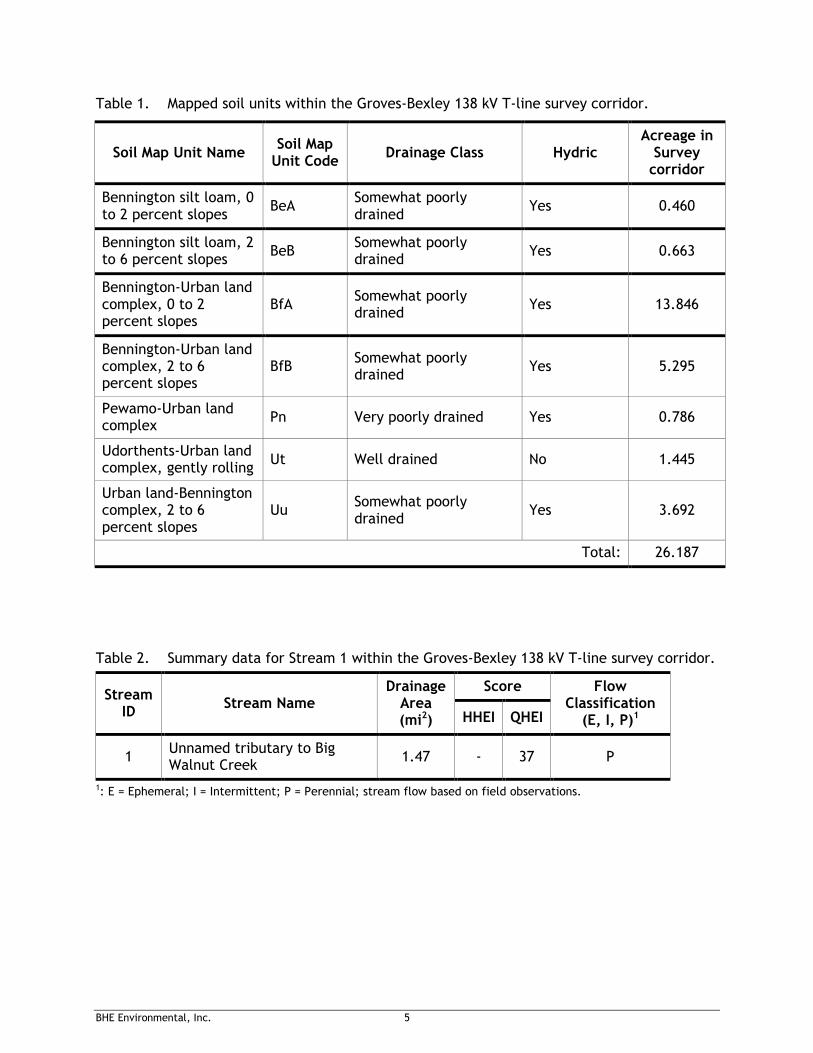
According to the NRCS (NRCS 2012), four soil series are represented within the survey area: Bennington, Pewamo, Udorthents, and Urban land-Bennington (NRCS 2012). Seven soil map units are mapped within the survey area, all of which are loamy in texture (Table 1; Figure 1). In terms of areal extent, the Bennington-Urban land complex, 0 to 2 percent slopes, is the most prevalent soil in the survey corridor (Figure 1, covering 53 percent of the survey area. Six of the seven mapping units in the survey corridor are listed as hydric (Table 1) (NRSC 2012); these hydric soils encompass 94.4 percent of the survey corridor.
3.2 STREAMS
The NHD and topographic mapping show one stream (Stream 1), a perennial Unnamed tributary to Big Walnut Creek, located within the survey corridor (Table 2). Stream 1 is apparently a man-made channel for most of its above-ground length and is broken up into two separate above-ground segments (Figures 4 and 5) and apparently flows into a buried culvert between the two locations. The mapped streams, Turkey Run and Mason Run (Figures 1 through 6) have apparently been placed in underground culverts as a result of development over the years and it is assumed here that Mason Run empties into the same culvert system that now carries Stream 1. Field observations of the substrates, flow, and other characteristics of Stream 1 were recorded on standard data sheets (Appendix B). This stream was determined to be of low quality due to adjacent land use and historic and continuing modifications/impacts. Such modifications include multiple culverts, channelization, diversions, and the presence of large quantities of refuse deposited in the channel. In addition, water quality is likely being negatively impacted due to discharge from roads, commercial properties, and residential land. The surface water had an unnatural color and odor in some regions and no evidence of a healthy macroinvertebrate community was noted. Additional information on Stream 1 is provided following Table 2.
BHE’s professional opinion is that this stream is a Water of the U.S. and is therefore regulated by the USACE under the CWA.
BHE Environmental, Inc. 5
Table 1. Mapped soil units within the Groves-Bexley 138 kV T-line survey corridor.
Soil Map Unit Name Soil Map Unit Code
Drainage Class Hydric Acreage in Survey corridor
Bennington silt loam, 0 to 2 percent slopes
BeA Somewhat poorly drained
Yes 0.460
Bennington silt loam, 2 to 6 percent slopes
BeB Somewhat poorly drained
Yes 0.663
Bennington-Urban land complex, 0 to 2 percent slopes
BfA Somewhat poorly drained
Yes 13.846
Bennington-Urban land complex, 2 to 6 percent slopes
BfB Somewhat poorly drained
Yes 5.295
Pewamo-Urban land complex
Pn Very poorly drained Yes 0.786
Udorthents-Urban land complex, gently rolling
Ut Well drained No 1.445
Urban land-Bennington complex, 2 to 6 percent slopes
Uu Somewhat poorly drained
Yes 3.692
Total: 26.187
Table 2. Summary data for Stream 1 within the Groves-Bexley 138 kV T-line survey corridor.
Stream ID
Stream Name Drainage Area (mi2)
Score Flow Classification (E, I, P)1 HHEI QHEI
1 Unnamed tributary to Big Walnut Creek
1.47 - 37 P
1: E = Ephemeral; I = Intermittent; P = Perennial; stream flow based on field observations.

BHE Environmental, Inc. 6
Stream 1
Stream Name Unnamed tributary to Big Walnut Creek (Modified Warm Water Habitat)
Evaluation Score/System 37/OEPA QHEI
Watershed HUC (14-Digit) Big Walnut Creek (05060001160030).
Flow Regime/Water Level Perennial
Dominant Substrate(s) Silt, gravel
Other Substrates Silt, bedrock, leaf pack/woody debris, fine detritus, muck
Natural/Channelized Modified and Channelized
Stream Order 2
Date Surveyed May 6, 2013 and May 7, 2013
BHE Environmental, Inc. 7
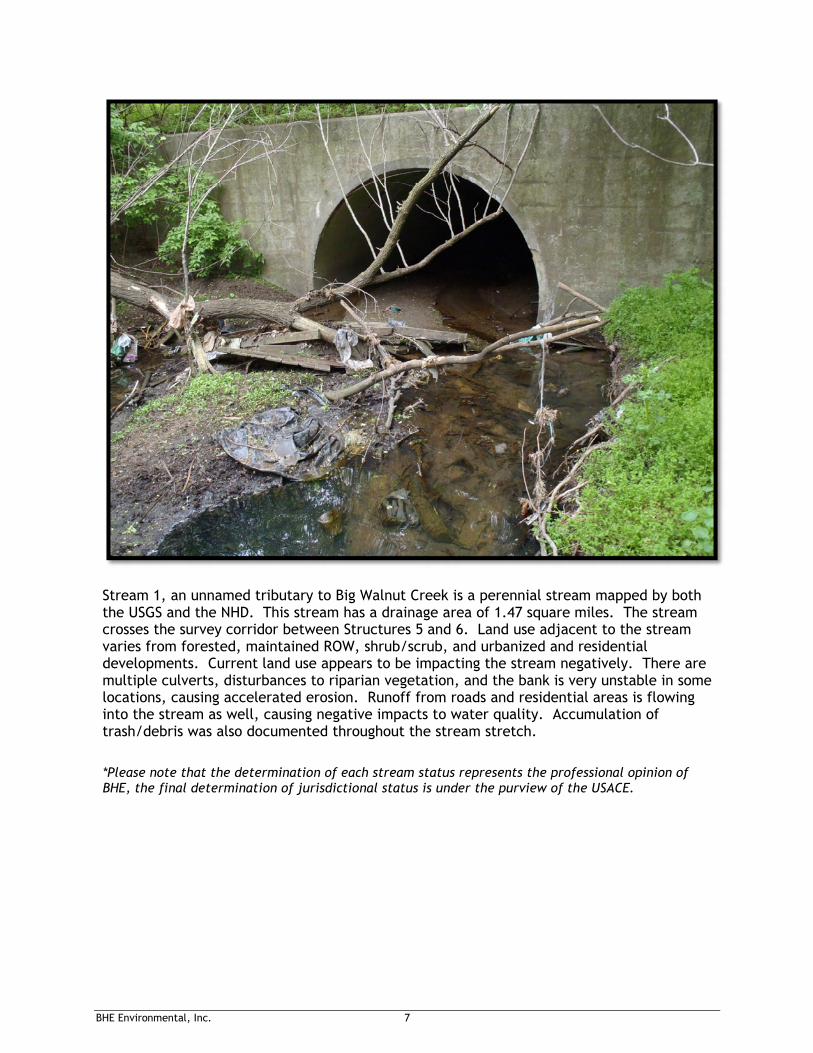
Stream 1, an unnamed tributary to Big Walnut Creek is a perennial stream mapped by both the USGS and the NHD. This stream has a drainage area of 1.47 square miles. The stream crosses the survey corridor between Structures 5 and 6. Land use adjacent to the stream varies from forested, maintained ROW, shrub/scrub, and urbanized and residential developments. Current land use appears to be impacting the stream negatively. There are multiple culverts, disturbances to riparian vegetation, and the bank is very unstable in some locations, causing accelerated erosion. Runoff from roads and residential areas is flowing into the stream as well, causing negative impacts to water quality. Accumulation of trash/debris was also documented throughout the stream stretch.
*Please note that the determination of each stream status represents the professional opinion of BHE, the final determination of jurisdictional status is under the purview of the USACE.

BHE Environmental, Inc. 8
3.3 WETLANDS
Desktop analysis identified that no NWI wetlands were found within the Groves-Bexley 138 kV T-line survey corridor. OWI wetland mapping did identify small wetlands on the eastern side of Stream 1. These were not investigated as they were outside of the proposed area of impact (Figure 1).
Field investigations identified five wetlands within the survey area. Table 3 provides a summary of wetland characteristics. The five identified wetlands cover an area of 0.24 acres within the 50-foot study area (some wetlands extend outside of the study area). Field observations of the vegetation, hydrology, and soils of each wetland were recorded on standard USACE data sheets (Appendix B), and qualitative assessments were conducted using ORAM datasheets (Appendix B). The extent of the wetland boundaries that were identified in the field are shown on Figures 2 - 6. Following Table 3 are summary descriptions and representative photographs of each wetland delineated in the survey corridor.
Table 3. Summary data for wetlands identified within the Groves-Bexley 138 kV T-line survey corridor.
Wetland ID
Wetland Type ORAM Score
ORAM Category Jurisdictional
Status1 Acreage
1 PEM 9.0 Category 1 Connected 0.050
2 PSS 20.0 Category 1 Isolated 0.009
3 PSS/PFO 16.0 Category 1 Isolated 0.055
4 PEM 9.0 Category 1 Isolated 0.005
5 PSS/PFO 25.0 Category 1 Isolated 0.120
Total: 0.239
1: Please note that the determination of each wetland’s isolated or connected status represents the professional opinion of BHE, the final determination of jurisdictional status is under the purview of the USACE.
BHE Environmental, Inc. 9
Wetland 1
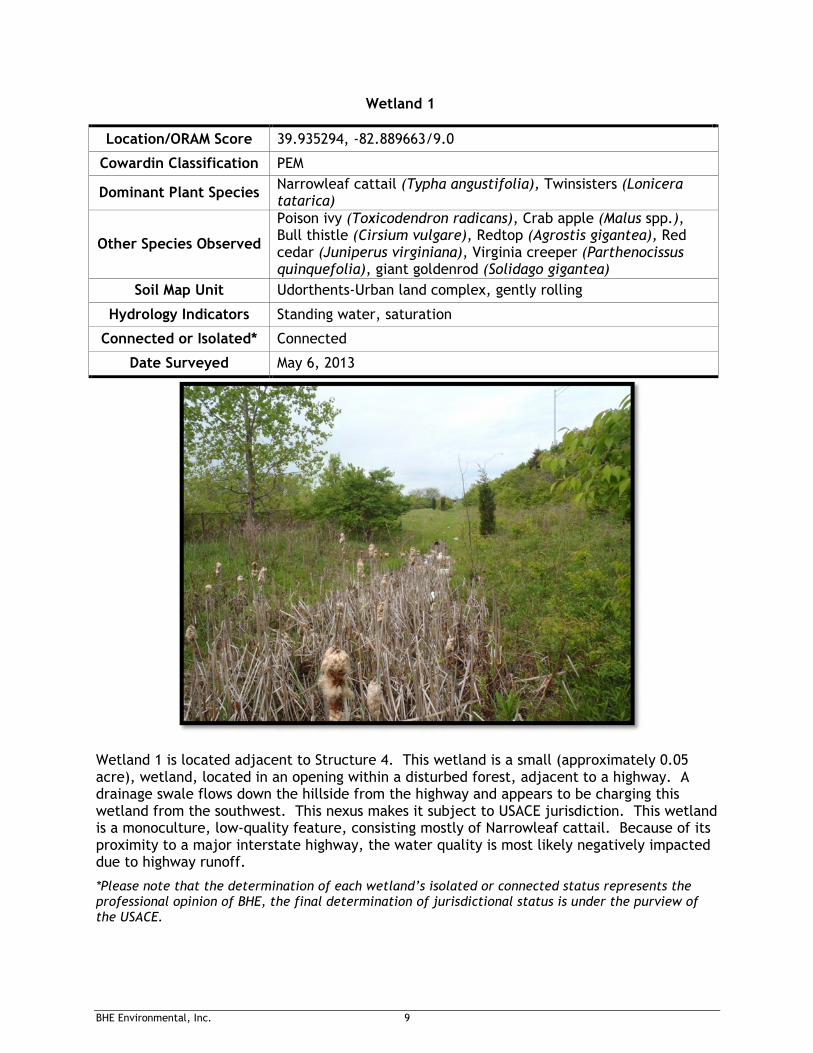
Location/ORAM Score 39.935294, -82.889663/9.0
Cowardin Classification PEM
Dominant Plant Species Narrowleaf cattail (Typha angustifolia), Twinsisters (Lonicera tatarica)
Other Species Observed
Poison ivy (Toxicodendron radicans), Crab apple (Malus spp.), Bull thistle (Cirsium vulgare), Redtop (Agrostis gigantea), Red cedar (Juniperus virginiana), Virginia creeper (Parthenocissus quinquefolia), giant goldenrod (Solidago gigantea)
Soil Map Unit Udorthents-Urban land complex, gently rolling
Hydrology Indicators Standing water, saturation
Connected or Isolated* Connected
Date Surveyed May 6, 2013
Wetland 1 is located adjacent to Structure 4. This wetland is a small (approximately 0.05 acre), wetland, located in an opening within a disturbed forest, adjacent to a highway. A drainage swale flows down the hillside from the highway and appears to be charging this wetland from the southwest. This nexus makes it subject to USACE jurisdiction. This wetland is a monoculture, low-quality feature, consisting mostly of Narrowleaf cattail. Because of its proximity to a major interstate highway, the water quality is most likely negatively impacted due to highway runoff.
*Please note that the determination of each wetland’s isolated or connected status represents the professional opinion of BHE, the final determination of jurisdictional status is under the purview of the USACE.

BHE Environmental, Inc. 10
Wetland 2
Location/ORAM Score 40.428993, -81.64927/20.0
Cowardin Classification PSS
Dominant Plant Species Water speedwell (Veronica anagallis-aquatica), Yellow avens (Geum aleppicum), Silver maple (Acer saccharinum),
Other Species Observed
American Elm (Ulmus americana), River grape (Vitis riparia), Twinsisters, giant goldenrod, Allegheny blackberry (Rubus allegheniensis), Box elder (Acer negundo), Sallow sedge (Carex lurida), Black willow (Salix nigra), Cottonwood (Populus deltoides)
Soil Map Unit Bennington-Urban land complex, 0 to 2 percent slopes
Hydrology Indicators Water-stained leaves,
Connected or Isolated* isolated
Date Surveyed May 6, 2013
Wetland 2 is a small (approximately 0.009 acre) wetland, located partially within a ROW area. This wetland appears to be spring fed. It is located between Structures 19 and 20. Adjacent land use is commercial and urban development along with disturbed forest. This wetland is significantly disturbed. This wetland is located in a manmade swale that was lined with a gravel base layer that impedes current hydrologic flow and that does not effectively drain surface waters to nearby water features due to adjacent land use and microtopography. The wetland is bordered by an industrial facility which can be a source of pollutants via runoff and leaching, as well.
*Please note that the determination of each wetland’s isolated or connected status represents the professional opinion of BHE, the final determination of jurisdictional status is under the purview of the USACE.

BHE Environmental, Inc. 11
Wetland 3
Location/ORAM Score 39.954690, -82.903487/16.0
Cowardin Classification PSS/PFO
Dominant Plant Species Jewelweed (Impatiens capensis), Silver maple, Poison ivy, American elm, Twinsisters
Other Species Observed River grape, Dogwood (Cornus spp.), Glossy buckthorn (Rhamnus frangula), Sallow sedge
Soil Map Unit Bennington-Urban land complex, 0 to 2 percent slopes
Hydrology Indicators Water-stained leaves, saturation, high water table
Connected or Isolated* isolated
Date Surveyed May 7, 2013
Wetland 3 is a small (approximately 0.055 acre) depressional wetland containing woody vegetation. This wetland is within an excavated swale that does not drain, therefore retaining hydrology for long periods of time. It is located adjacent to Structure 21. This wetland is not connected to Stream 1. Adjacent land use is commercial and urban development along with disturbed forest. This wetland is located in a manmade swale that was lined with a gravel base layer that impedes current hydrologic flow and that does not effectively drain surface waters to nearby water features due to adjacent land use and microtopography. The wetland is bordered by an auto scrap yard which can be a source of pollutants via runoff and leaching, as well. *Please note that the determination of each wetland’s isolated or connected status represents the professional opinion of BHE, the final determination of jurisdictional status is under the purview of the USACE.
BHE Environmental, Inc. 12
Wetland 4
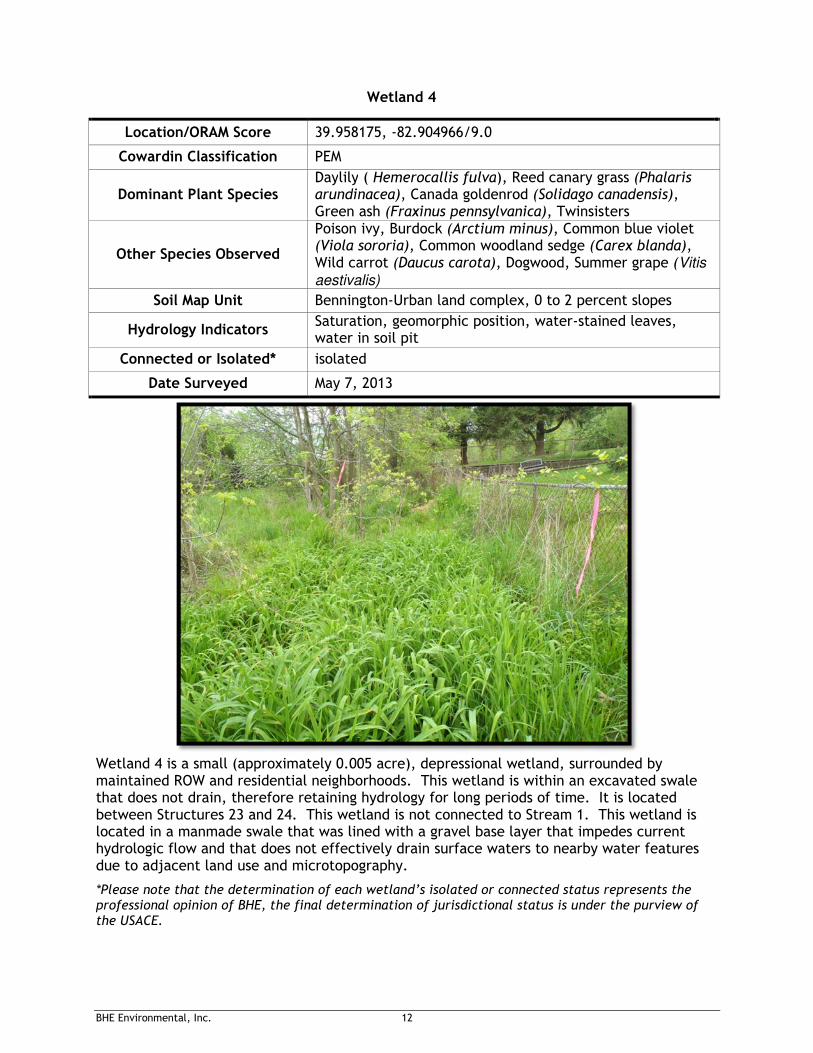
Location/ORAM Score 39.958175, -82.904966/9.0
Cowardin Classification PEM
Dominant Plant Species Daylily ( Hemerocallis fulva), Reed canary grass (Phalaris arundinacea), Canada goldenrod (Solidago canadensis), Green ash (Fraxinus pennsylvanica), Twinsisters
Other Species Observed
Poison ivy, Burdock (Arctium minus), Common blue violet (Viola sororia), Common woodland sedge (Carex blanda), Wild carrot (Daucus carota), Dogwood, Summer grape (Vitis
aestivalis)
Soil Map Unit Bennington-Urban land complex, 0 to 2 percent slopes
Hydrology Indicators Saturation, geomorphic position, water-stained leaves, water in soil pit
Connected or Isolated* isolated
Date Surveyed May 7, 2013
Wetland 4 is a small (approximately 0.005 acre), depressional wetland, surrounded by maintained ROW and residential neighborhoods. This wetland is within an excavated swale that does not drain, therefore retaining hydrology for long periods of time. It is located between Structures 23 and 24. This wetland is not connected to Stream 1. This wetland is located in a manmade swale that was lined with a gravel base layer that impedes current hydrologic flow and that does not effectively drain surface waters to nearby water features due to adjacent land use and microtopography.
*Please note that the determination of each wetland’s isolated or connected status represents the professional opinion of BHE, the final determination of jurisdictional status is under the purview of the USACE.

BHE Environmental, Inc. 13
Wetland 5
Location/ORAM Score 39.96962, -82.90409/25.0
Cowardin Classification PSS/PFO
Dominant Plant Species Sallow sedge, Green Ash, Poison ivy, Red maple (Acer rubrum), Box elder (Acer negundo)
Other Species Observed Mulitflora rose (Rosa multifora), Yellow avens, Giant goldenrod
Soil Map Unit Bennington-Urban land complex, 0 to 2 percent slopes
Hydrology Indicators Standing water, saturation, high water table, water marks on trees, drift deposits
Connected or Isolated* isolated
Date Surveyed May 7, 2013
Wetland 5 is a larger (approximately 0.12 acre), forested/shrub-scrub wetland, located within the maintained ROW and adjacent residential properties. This wetland is primarily fed through precipitation. Due to its location within a depression there is no outlet, this wetland retains hydrology for long periods of time. It is located adjacent to Structure 31. This wetland appears somewhat disturbed, but provides some suitable habitat as sightings of waterfowl were reported. In addition, there was some evidence of soil disturbance based on the finding of a man-made hardpan at 14 inches.
*Please note that the determination of each wetland’s isolated or connected status represents the professional opinion of BHE, the final determination of jurisdictional status is under the purview of the USACE.

BHE Environmental, Inc. 14
3.4 FLOODPLAINS
According to the digital FEMA data, no floodplains are within the boundaries of the survey corridor.
4.0 SUMMARY
A routine wetland and stream survey was completed on the approximately 4.4-mile long proposed transmission line in Columbus, Franklin County, Ohio. Five wetlands were identified on site. One jurisdictional (i.e., waters of the U.S.) stream, Stream 1, an unnamed tributary to Big Walnut Creek, is located within the survey corridor.
The preliminary jurisdictional boundaries identified within the survey area and their assessments are based on BHE’s professional opinion. Any impacts to jurisdictional waters identified within the survey corridor may require authorization under Sections 404 and 401 of the CWA, from the USACE and/or the OEPA, respectively.
Please note that the final determination of the limits and jurisdictional status of onsite streams and wetlands is under the purview of the U.S. Army Corps of Engineers (USACE) and may require an onsite inspection with USACE representatives in order to finalize the jurisdictional determination. The jurisdictional determination can be rolled into the permit application process which is what BHE would recommend as requesting a separate jurisdictional determination by the USACE could delay the permitting process. The USACE does not have a time limit imposed on them for completing a jurisdictional determination. BHE would also recommend the implementation of appropriate BMP’s that would help to reduce associated direct and indirect impacts.
BHE Environmental, Inc. 15
5.0 LITERATURE CITED
Cowardin, L.M., F.C. Golet, and E.T. LaRoe. 1979. Classification of Wetlands and Deepwater Habitats of the United States. Office of Biological Services, Fish and Wildlife Service, U.S. Department of the Interior, Washington, DC. 103 p.
Environmental Laboratory. 1987. Corps of Engineers Wetlands Delineation Manual, Technical Report Y-87-1. U.S. Army Engineer Waterways Experiment Station, Vicksburg, Mississippi. 100 p., plus appendices.
Mack, John J. 2001. Ohio Rapid Assessment Method for Wetlands, Manual for Using Version 5.0. Ohio EPA Technical Bulletin Wetland/2001-1-1. Ohio Environmental Protection Agency, Division of Surface Water, 401 Wetland Ecology Unit, Columbus, Ohio.
Natural Resources Conservation Service (NRCS). 1977. Soil Survey of Franklin County, Ohio. 186p.
NRCS. 2012. Soil Data Mart. Available at: http://soildatamart.nrcs.usda.gov/. Accessed May 9, 2013.
Ohio Environmental Protection Agency (OEPA). 2009. Field Evaluation Manual for Ohio’s Primary Headwater Streams, Version 2.3. OEPA, Division of Surface Water, Northeast District Office, Twinsburg, Ohio. 86 p.
Rankin, E.T. 1989. The Qualitative Habitat Evaluation index (QHEI): Rationale, Methods, and Application. Div. Water Qual. Plan. & Assess., Ecol. Assess. Sect., Columbus, Ohio.
Simley, J.D. and W.J. Carswell, Jr. 2009. The National Map - Hydrography: U.S. Geological Survey Fact Sheet 2009-3054, 4 p.
U.S. Army Corps of Engineers (USACE). 2007. Regulatory Guidance Letter 07-01: Practices for Documenting Jurisdictional Determinations under Section 404 of the Clean Water Act (CWA) and Sections 9 and 10 of the Rivers and Harbors Act (RHA) of 1899. 17p.
USACE. 2012. Regional Supplement to the Corps of Engineers Wetland Delineation Manual: Eastern Mountains and Piedmont Region, Version 2.0. Eds: J. F. Berkowitz, J. S. Wakeley, R. W. Lichvar, C. V. Noble. ERDC/EL TR-12-9. Vicksburg, MS: U.S. Army Engineer Research and Development Center. 147 p., plus appendices.
Yi, G.D., M. Risley, M. Koneff, and C. Davis. 1994. Development of Ohio’s GIS-based wetlands inventory. Journal of Soil and Water Conservation 49:23-28.

BHE Environmental, Inc.
FIGURES
Figure 1. Overview and Key Map for the Power Engineers- Grove-Bexley 138 kV T-Line.
Figure 2. Study Area for Power Engineers- Grove-Bexley 138 kV T-Line.
Figure 3. Study Area for Power Engineers- Grove-Bexley 138 kV T-Line.
Figure 4. Study Area for Power Engineers- Grove-Bexley 138 kV T-Line.
Figure 5. Study Area for Power Engineers- Grove-Bexley 138 kV T-Line.
Figure 6. Study Area for Power Engineers- Grove-Bexley 138 kV T-Line

Data Sources:
April 2013
2032.003
Microsoft Corporation - ESRI World Imagery 2012USGS National Hydrology DatasetUSFWS Wetlands InventoryODNR Ohio Wetlands InventoryFEMA Flood Data
²
")")")")
") ") ")
")
")
")
")
")
")
")
")
")
")
")
")
")
")
")
")
")
")
")
")
")
")
")
")
")
")
")
")
")
")")")")")")
")
")")
")
")")Bexley Substation
Groves Substation
98
7
65
432
1
4645444342
4140
39 38 37 36353433
3231
302928
2726
25242322
2120
1918
171615
1412
1110
13
Figure 4
Figure 3
Figure 5
Figure 2
Figure 6
Mason RunAlum Cr
eek
Big Walnut Creek
Turkey RunBlis
s Run
BexleyBexley
WhitehallWhitehall
Alum Cree
k
Maso
n Ru
n
Mason Run
Figure 1. Overview and Key Map for the Power Engineers-Grove-Bexley 138 kV T-Line,
Franklin County, Ohio
") Structures - T-LineCenterlineTransmission LineFigure ExtentsStreams100-Year FloodzoneNational Wetlands InventoryLakePalustrine EmergentPalustrine ForestedPalustrine Scrub/ShrubPalustrine Unconsolidated BottomRiverine
ODNR Ohio Wetlands InventoryFarmed WetlandsShallow MarshShrub Scrub WetlandsWet MeadowWoods On Hydric Soils
0 2,400 4,8001,200
Feet
_̂
OhioProject Area
Franklin Co.Legend
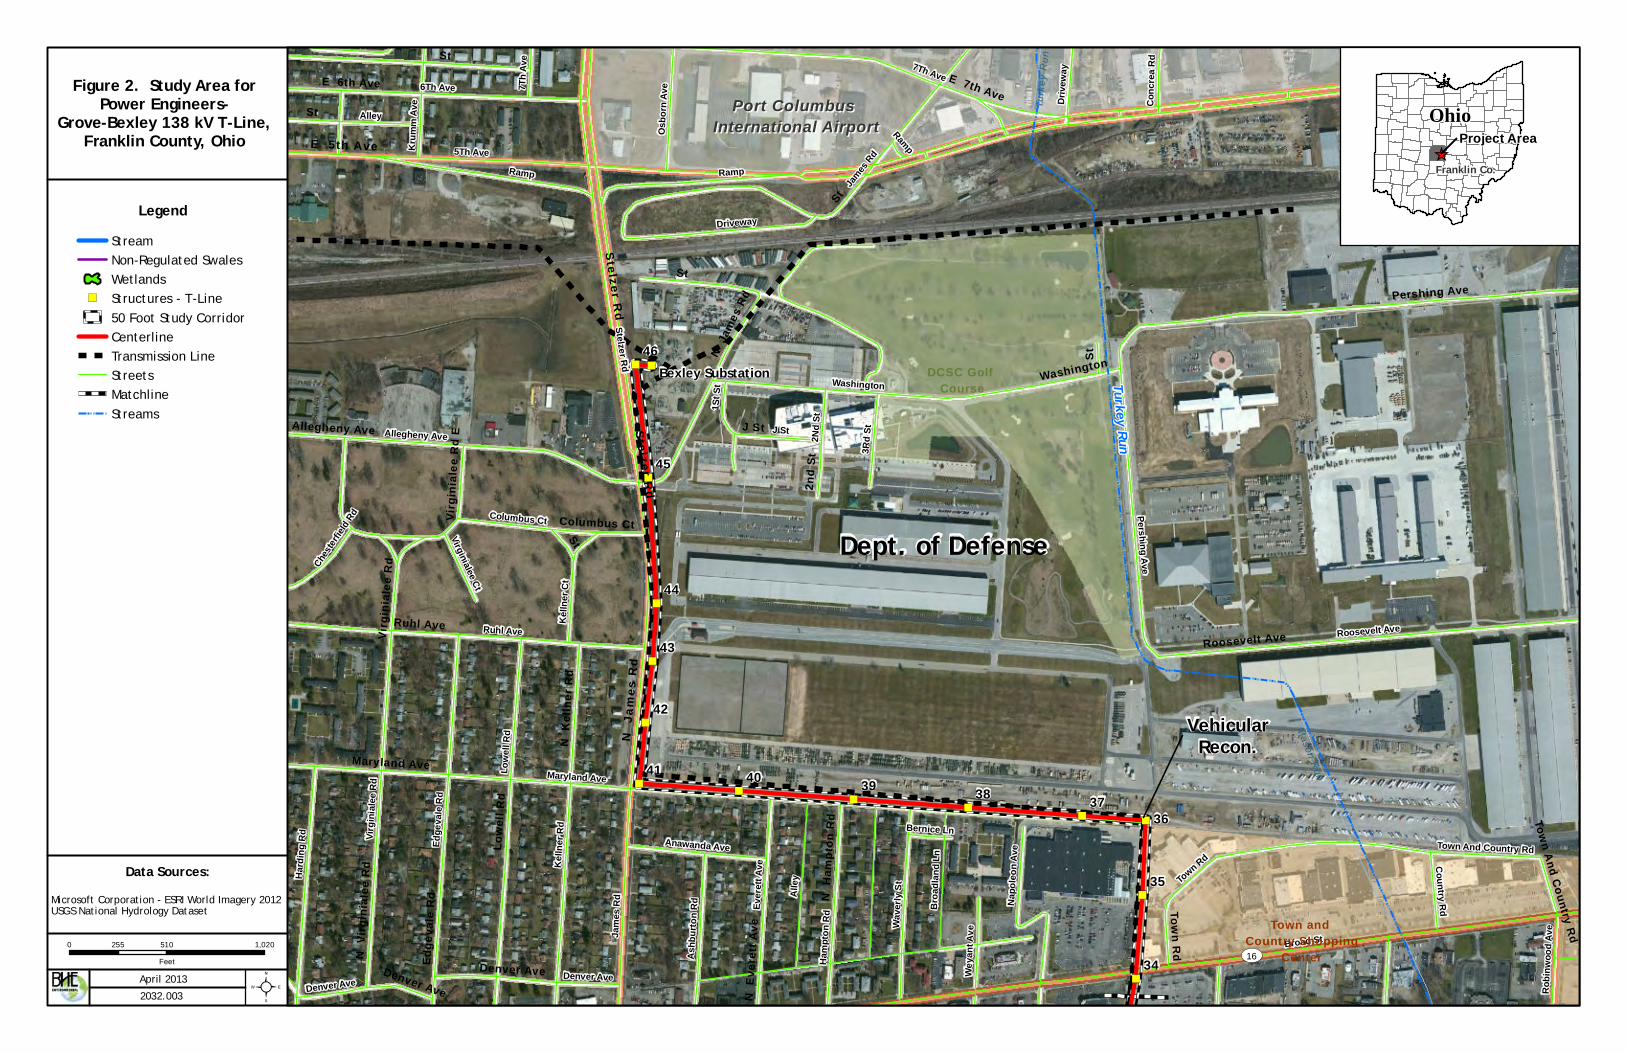
Data Sources:
April 2013
2032.003
Microsoft Corporation - ESRI World Imagery 2012USGS National Hydrology Dataset
²
")
")
")
")
")")
")
")
")
")
")
")
")
")
")
")
")
")
")
")
")
")
")
")
")
")
")
")
")
")
")
")
")
")
")
")
")")")
")")
")
")
")
")
")
")")
Dept. of Defense
VehicularRecon.
46
45
44
43
42
41 40 39 38 3736
35
34
Bexley Substation Turkey Run
Broad StJame
s Rd
Maryland Ave
5Th Ave
Pershing Ave
Stelzer Rd
Ruhl Ave
6Th Ave
Lowe
ll Rd
7Th Ave
Kelln
er RdVir
ginial
ee R
dWashington
Roosevelt Ave
Edge
vale
Rd
Ramp
Alley
Allegheny Ave
Hard
ing R
d
J St
Driveway
Ever
ett Av
e
Wave
rly S
t
Hamp
ton R
d2N
d St
Town RdTown And Country Rd
Columbus Ct
1St S
t
3Rd S
t
Napo
leon A
ve
Denver Ave
Kelln
er Ct
Ashb
urto
n Rd
Osbo
rn Av
e
Broa
dland
Ln
Anawanda Ave
Krum
m Av
e
Weya
nt Av
e
Country Rd
Robin
wood
Ave
Chest
erfield
Rd
Conc
rea R
dVirginialee Ct
Bernice Ln
Ramp
James
Rd
Alley
Drive
way
7Th A
ve
Ramp
Denver AveST16
E 5th Ave
N J
ames
Rd
Stelzer Rd Stelzer Rd
E 5th Ave
St
Maryland Ave
Pershing Ave
Ruhl Ave
E 7th Ave
Lowe
ll Rd
Washington
Roosevelt Ave
E 6th Ave
Edge
vale
Rd
N K
ellne
r Rd
Allegheny Ave
N V
irgin
ialee
Rd
J St
N Ja
mes R
d
Denver Ave
2nd
St
Town Rd
Town And Country Rd
N E
vere
tt Av
e
Columbus Ct
N H
ampt
on R
d
Virg
inial
ee R
d E
Virg
inial
ee R
d
Denver Ave
St
St
St
St
St
Mason Run
Turk
ey R
un
Port ColumbusPort Columbus International Airport International Airport
Town and Country Shopping
Center
DCSC Golf Course
StreamNon-Regulated SwalesWetlands
") Structures - T-Line50 Foot Study CorridorCenterlineTransmission LineStreetsMatchlineStreams
0 510 1,020255
Feet
_̂
OhioProject Area
Franklin Co.
Legend
Figure 2. Study Area forPower Engineers-
Grove-Bexley 138 kV T-Line,Franklin County, Ohio
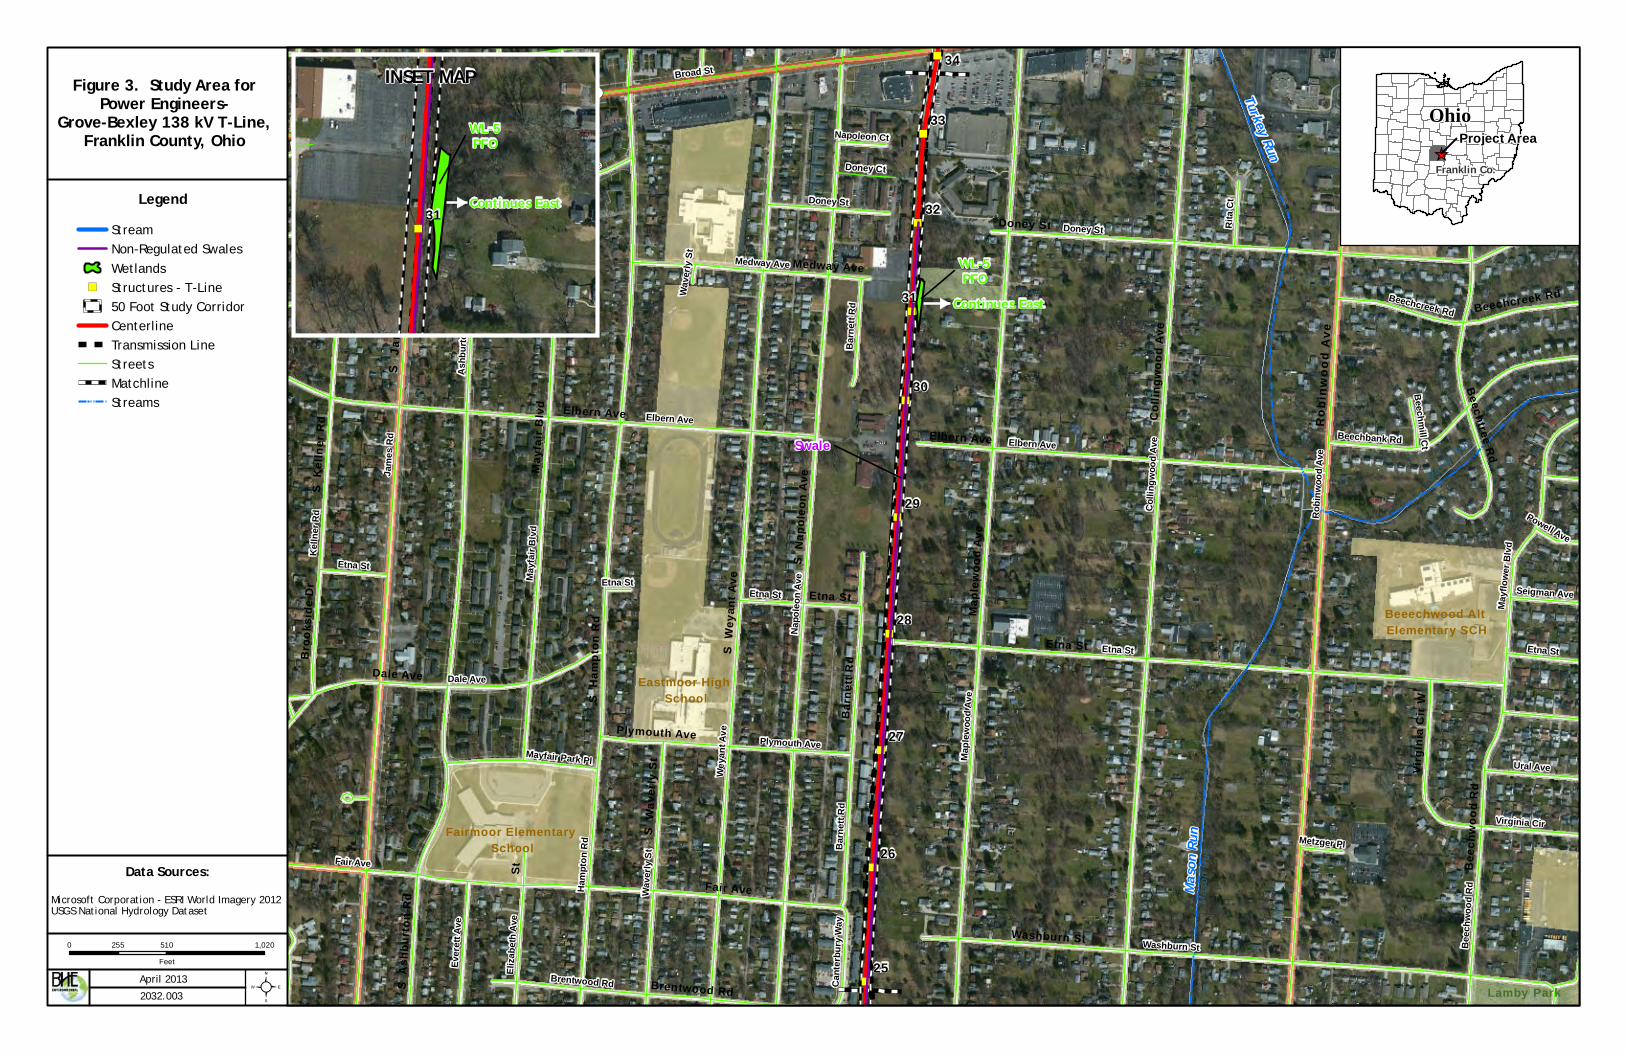
Data Sources:
April 2013
2032.003
Microsoft Corporation - ESRI World Imagery 2012USGS National Hydrology Dataset
²
")
")
")
")
")")
")
")
")
")
")
")
")
")
")
")
")
")
")
")
")
")
")
")
")
")
")
")
")
")
")
")
")
")
")
")
")")")
")")
")
")
")
")
")
")")
Swale
Continues East
WL-4
WL-5PFO
34
33
32
31
30
29
28
27
26
25
Maso
n Run
Turkey RunJa
mes R
d
Etna St
Weya
nt Av
e
Hamp
ton R
d
Broad St
Napo
leon A
ve
Fair Ave
Doney St
Robin
wood
Ave
Maple
wood
Ave
Kelln
er Rd
Collin
gwoo
d Ave
Ashb
urto
n Rd
Washburn St
Mayfa
ir Blvd
Elbern Ave
Dale Ave
Beec
htree
Rd
Barn
ett R
d
Wave
rly S
t
Brentwood Rd
Virginia Cir
Medway Ave
Beechbank Rd
Plymouth Ave
Beechcreek Rd
Beec
hwoo
d Rd
Mayfl
ower
Blvd
Ural Ave
Ever
ett Av
e
Mayfair Park Pl
Broadmoor Ave
Rita
Ct
Eliza
beth
Ave
Doney Ct
Cante
rbur
y Way
Seigman Ave
Frontage Rd
Plankton Dr
Powell Ave
Metzger Pl
Napoleon Ct
Beechmill Ct
Barn
ett R
d
Beec
hwoo
d Rd
Etna St
Etna St
Elbern Ave
Doney St
Wave
rly St
Etna StEtna St
ST16
S J
ames
Rd
Robi
nwoo
d Av
e
Etna St S W
eyan
t Ave
Doney St
Mapl
ewoo
d Ave
S H
ampt
on R
d
S N
apol
eon A
ve
Colli
ngwo
od A
ve
Fair Ave
Washburn St
Elbern Ave S
Ash
burto
n Rd
Mayf
air B
lvd
Dale Ave
Beechtree Rd
S K
ellne
r Rd
Barn
ett R
d
Beec
hwoo
d Rd
S W
aver
ly St
Brentwood Rd
Medway Ave
Plymouth Ave
Beechcreek Rd
St
Broo
ksid
e Dr
Virg
inia
Cir W
Etna St
Beec
hwoo
d Rd
Elbern Ave
Maso
n Ru
n
Mason Run
Eastmoor High School
Beeechwood Alt Elementary SCH
Fairmoor Elementary School
Lamby Park
StreamNon-Regulated SwalesWetlands
") Structures - T-Line50 Foot Study CorridorCenterlineTransmission LineStreetsMatchlineStreams
0 510 1,020255
Feet
_̂
OhioProject Area
Franklin Co.
Legend
Figure 3. Study Area forPower Engineers-
Grove-Bexley 138 kV T-Line,Franklin County, Ohio
")
")
")
")
")
")
")
")
")
")
")
")
")
")
")
")
")
")
")
")
")
")
")
")
")
")
")
")
")
")
")
")
")
")
")
")
")")
")
")
")
")
")
")
")
")
")")
Continues East
WL-5PFO
31
INSET MAP

Data Sources:
April 2013
2032.003
Microsoft Corporation - ESRI World Imagery 2012USGS National Hydrology Dataset
²
")
")
")
")
")")
")
")
")
")
")
")
")
")
")
")
")
")
")
")
")
")
")
")
")
")
")
")
")
")
")
")
")
")
")
")
")")")
")")
")
")
")
")
")
")")
Swale
STR-1
Swale
STR-1
WL-3PSS
WL-4PSS
WL-2PEM
25
24
23
22
21
20
19
18
17
16
15
Maso
n Run
Main St
Barn
ett R
d
Beec
hwoo
d Rd
Hamp
ton R
d
Eliza
beth
Ave
Livingston Ave
Fulton St
Mound St
Bolton Ave
Astor Ave
Lamb
y Ln
Cente
r St
Elm StBexley Park Rd
Robin
wood
Ave
Elderw
ood A
ve
Brentwood Rd
Ruby
Ave
Ever
ett Av
e
Byro
n Ave
Towers Ct
Olne
y Dr
Napo
leon A
ve
Wave
rly S
t
Arkw
ood A
ve
Maple
wood
Ave
Weya
nt Av
e
Rand Sq
Collin
gwoo
d Ave
Dellw
ood A
ve
Troy S
t
Dillon Dr
Palm St Andrus Ave
Rand
Ave
Allendale Dr
Bonaire St
Colby Ave
Caro
lwoo
d Ave
Baywood St
Kent
Cir
Dort Pl
Andr
us C
t
Ashton Rd
Broo
kway
Rd
Rand Ct
Anthony Ct
Shad
yside
St
Kenard Ct
Rand Cir
Brentwood Ct
Saint Mary Ct
Berw
ick A
rms P
l
Brownlee Ave
Driveway
Strie
bel R
d
Ashton Ct
Mcallister Ave
Arkwood Ct
Troy Dr
Driveway
Hamp
ton R
d
Andr
us C
t
Ruby
Ave
Wave
rly S
t
Byro
n Ave
Wave
rly S
t
Weya
nt Av
e
Fulton St
Astor Ave
Fulton St Weya
nt Av
eDriveway
Astor Ave
Bolton Ave
Weya
nt Av
eBy
ron A
ve
Wave
rly S
t
Eliza
beth
Ave
Mound St
Driveway
£¤40
Barn
ett R
d
E Liv ingston Ave
Robinwood Ave
Beec
hwoo
d Rd
S H
ampt
on R
d
Eliza
beth
Ave
Astor Ave
E Mound St
St
E Fulton St
Bolton Ave
Lamb
y Ln
Cent
er S
t
Rand
Ave
Elm St
Elde
rwoo
d Ave
Brentwood Rd
Byro
n Ave
Olney Dr
S W
aver
ly St
Arkwood Ave
S E
vere
tt Av
e
Towers Ct S
Towers Ct N
Colli
ngwo
od A
ve
S N
apol
eon A
ve
Troy
St
Dillo
n Dr
Allendale Dr
Carolwood Ave
Towers Ct
Anthony Ct S
Rand Sq E
St
S W
aver
ly St
St
Astor Ave
E Fulton St
E Mound St
St
St
St
St
Eliza
beth
Ave
Maso
n Ru
n
Lamby Park
Barnett Park
Johnson Memorial Park
StreamsNon-Regulated SwalesWetlands
") Structures - T-Line50 Foot Study CorridorCenterlineTransmission LineStreetsMatchlineStreams
0 510 1,020255
Feet
_̂
OhioProject Area
Franklin Co.
Legend
Figure 4. Study Area forPower Engineers-
Grove-Bexley 138 kV T-Line,Franklin County, Ohio
")
")
")
")
")
")
")
")
")
")
")
")
")
")
")
")
")
")
")
")
")
")
")
")
")
")
")
")
")
")
")
")
")
")
")
")
")")
")
")
")
")
")
")
")
")
")")
WL-4PSS
24
INSET MAP
")
")
")
")
")
")
")
")
")
")
")
")
")
")
")
")
")
")
")
")
")
")
")
")
")
")
")
")
")
")
")
")
")
")
")
")
")")
")
")
")
")
")
")
")
")
")")
STR-1
WL-3PSS
Swale
Kent
Cir
21
INSET MAP
")
")
")
")
")
")
")
")
")
")
")
")
")
")
")
")
")
")
")
")
")
")
")
")
")
")
")
")
")
")
")
")
")
")
")
")
")")
")
")
")
")
")
")
")
")
")")
WL-2PEM
STR-1
SwaleFulton St
19
INSET MAP

Data Sources:
April 2013
2032.003
Microsoft Corporation - ESRI World Imagery 2012USGS National Hydrology Dataset
²
")
")
")
")
")")
")
")
")
")
")
")
")
")
")
")
")
")
")
")
")
")
")
")
")
")
")
")
")
")
")
")
")
")
")
")
")")")
")")
")
")
")
")
")
")")
Swale
STR-1
Swale
Swale
WL-1PEM
9
8
7
6
54
3
2
14
13
12
11
10
Mason Run
70
Cour
trigh
t Rd
Roswell Dr
Elaine
Rd
Cuna
rd R
d
Vilardo Ln
Wilto
n Dr
Kirkwood Rd
Livingston Ave
Bostwick Rd
April Ln
Burli
ngto
n Ave
Penfield Rd
Selki
rk R
d
Conway Dr
Vineshire Dr
Dundee Ave
Liv Moor DrGilroy Rd
Deshler Ave
Seabrook Ave
Ellery Dr
Exit 107A
Colby Ave
Alco
y Dr
Argus Rd
Carlton Ave
Cushing DrSibley Ave
Clyd
e Pl
Picard Rd
Shamrock Dr
Basil Dr
Binbrook Rd
Adair
Rd
Dehner Dr
Strie
bel R
d
Carst
are D
rLiv
ingsto
n Ct
Dund
ee P
l
Conover PlBay Ct
Vineshire Ln
Wilton Pl
Scottwood Rd
Truro Station Service Rd
Courtright Ct
Larry Pl
Walka
th Dr
Elaine Ct
Wyton
Ct
Elaine Pl
Westp
hal A
ve
Year
ling R
d
Elaine Park Dr
Chrisview Dr
Wellington Ct
Cunard Sq
Penfield Ct
Drive
way
Brookshire Ct
Dellw
ood A
ve
Geormar Dr
Marle
y Ct
Park
ing Lo
t
Carstare Ct
70
Parki
ng Lo
t
Livingston Ave
Colby Ave
Strie
bel R
d
Livingston Ave
Deshler Ave Elaine Pl
Penfield Ct
107A
§̈¦70§̈¦70
E Liv ingston Ave
Cour
trigh
t Rd Roswell Dr
Elain
e Rd
Cuna
rd R
d Vilar
do L
n
Kirkwood Rd
Wilt
on D
r
E Livingston Ave
St
Bostwick Rd
April Ln
Burli
ngto
n Ave
Selki
rk R
d
Conway Dr
Vineshire Dr
Dundee Ave
Liv Moor Dr
Gilroy Rd
Seabrook Ave
Ellery Dr
Colby Ave
Alcoy Dr
Argus Rd
Carlton Ave
E Deshler Ave
Strie
bel R
d
Cushing Dr Sibley Ave
Clyd
e Pl
Pica
rd R
d
Shamrock Dr
Basil Dr Penfield Rd
Adair Rd
Dehn
er D
r Binbrook Rd N
Livin
gsto
n Ct
Penf
ield R
d E
Vineshire Ln
Scottwood Rd
Larry Pl
St St
St
Maso
n Run
StreamsNon-Regulated SwalesWetlands
") Structures - T-Line50 Foot Study CorridorCenterlineTransmission LineStreetsMatchlineStreams
0 510 1,020255
Feet
_̂
OhioProject Area
Franklin Co.
Critical Environmental
Issues AssessmentLegend
Figure 5. Study Area forPower Engineers-
Grove-Bexley 138 kV T-Line,Franklin County, Ohio
")
")
")
")
")
")
")
")
")
")
")
")
")
")
")
")
")
")
")
")
")
")
")
")
")
")
")
")
")
")
")
")
")
")
")
")
")")
")
")
")
")
")
")
")
")
")")
WL-1PEM
Swale
STR-1
70
70
4
INSET MAP
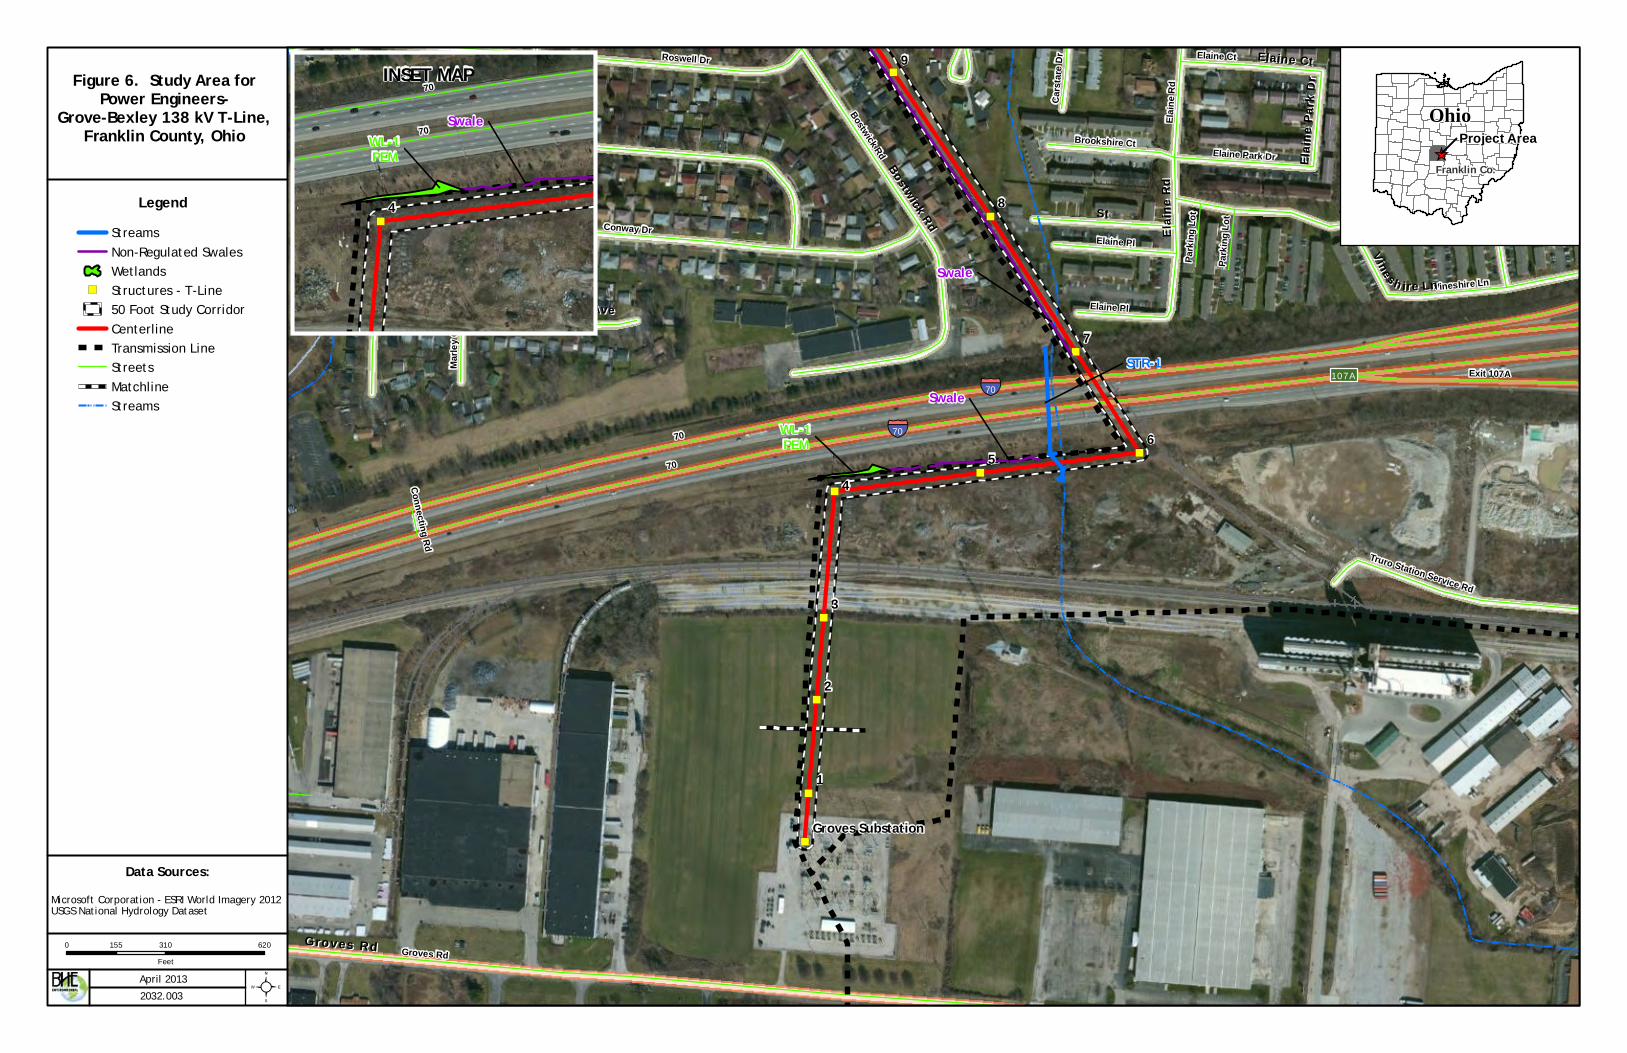
Data Sources:
April 2013
2032.003
Microsoft Corporation - ESRI World Imagery 2012USGS National Hydrology Dataset
²
")
")
")
")
")
")
")
")
")
")
")
")
")
")
")
")
")
")
")
")
")
")
")
")
")
")
")
")
")
")
")
")
")
")
")
")
")")
")
")
")")
")
")
")
")
")")
Swale
STR-1
Swale
WL-1PEM
9
8
7
65
4
3
2
1
Groves Substation
Mason Run
70
Groves Rd
Conway Dr
Gilroy Rd
Alco
y Dr
Vineshire Dr
Roswell Dr
Elaine
Rd
Bostwick Rd
Exit 107A
Deshler Ave
Ellery Dr
Elaine Ct
Elaine Pl
Vineshire Ln
Elaine Park Dr
Adair
Rd
Truro Station Service Rd
Brookshire Ct
Marle
y Ct
Carst
are D
r
Park
ing Lo
t Connecting Rd
Elaine Pl
70
Parki
ng Lo
t
107A
§̈¦70
§̈¦70
Groves Rd Groves Rd
St St Conway Dr Conway Dr
Gilroy Rd Gilroy Rd
Alco
y Dr
Alco
y Dr VV ii nn ee ss hh ii rr ee DD rr
Elain
e Rd
Elain
e Rd
Bostwick Rd
Bostwick Rd
Ellery Dr Ellery Dr
E Deshler Ave E Deshler Ave
Elaine Ct Elaine Ct
VViinnee ss hh ii rr ee LL nn
Elain
e Par
k Dr
Elain
e Par
k Dr
Mason Run
StreamsNon-Regulated SwalesWetlands
") Structures - T-Line50 Foot Study CorridorCenterlineTransmission LineStreetsMatchlineStreams
0 310 620155
Feet
_̂
OhioProject Area
Franklin Co.
Legend
Figure 6. Study Area forPower Engineers-
Grove-Bexley 138 kV T-Line,Franklin County, Ohio
")
")
")
")
")
")
")
")
")
")
")
")
")
")
")
")
")
")
")
")
")
")
")
")
")
")
")
")
")
")
")
")
")
")
")
")
")")
")
")
")
")
")
")
")
")
")")
WL-1PEM
Swale
STR-1
70
70
4
INSET MAP

BHE Environmental, Inc.
APPENDIX A
Photo Log

Photo 1. Swale connecting Wetland 1 and Stream 1 (unnamed tributary to Big Walnut Creek). This portion of the line is bordered on the east by interstate 70. Image taken looking west on
May 6, 2013.
Photo 2. Stream 1 on a section where it has been channelized within the transmission line corridor near Structure 7. Image taken looking north on May 6, 2013.
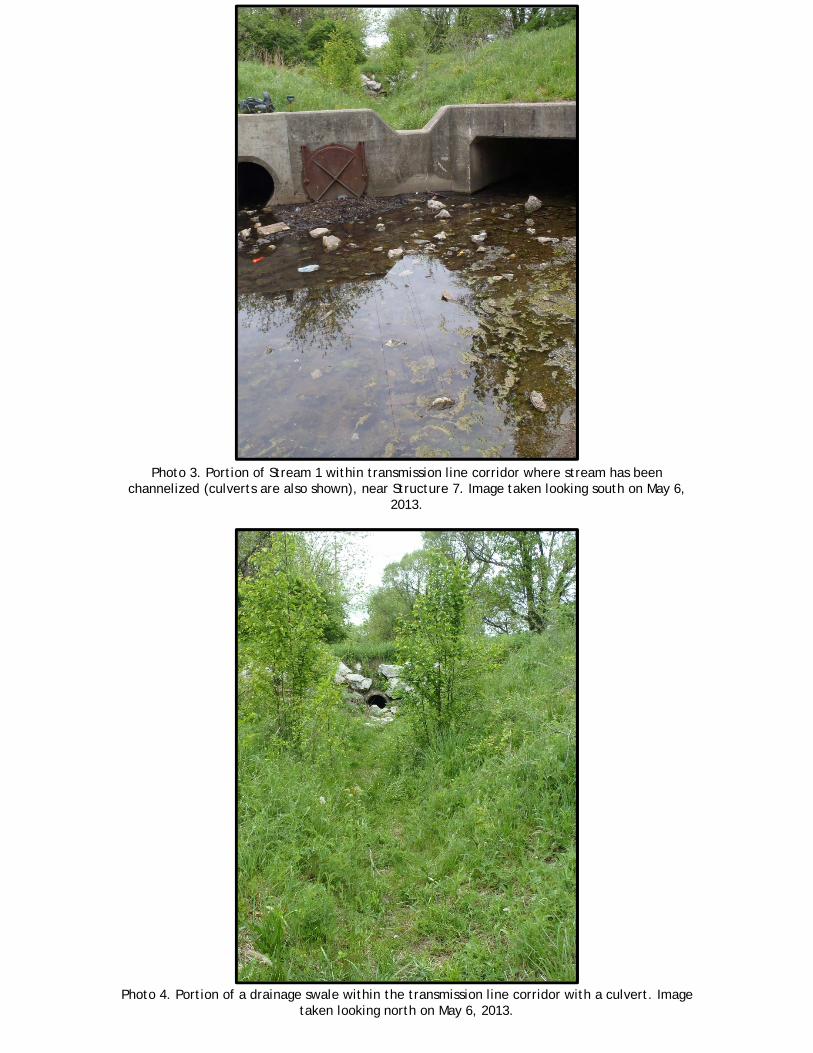
Photo 3. Portion of Stream 1 within transmission line corridor where stream has been channelized (culverts are also shown), near Structure 7. Image taken looking south on May 6,
2013.
Photo 4. Portion of a drainage swale within the transmission line corridor with a culvert. Image taken looking north on May 6, 2013.

Photo 5. Drainage swale flowing to Stream 1 near Structure 7. Image taken looking north on May 6, 2013.
Photo 6. Drainage swale within the transmission line corridor with a culvert and drain near Structure 9. Image taken looking south on May 6, 2013.
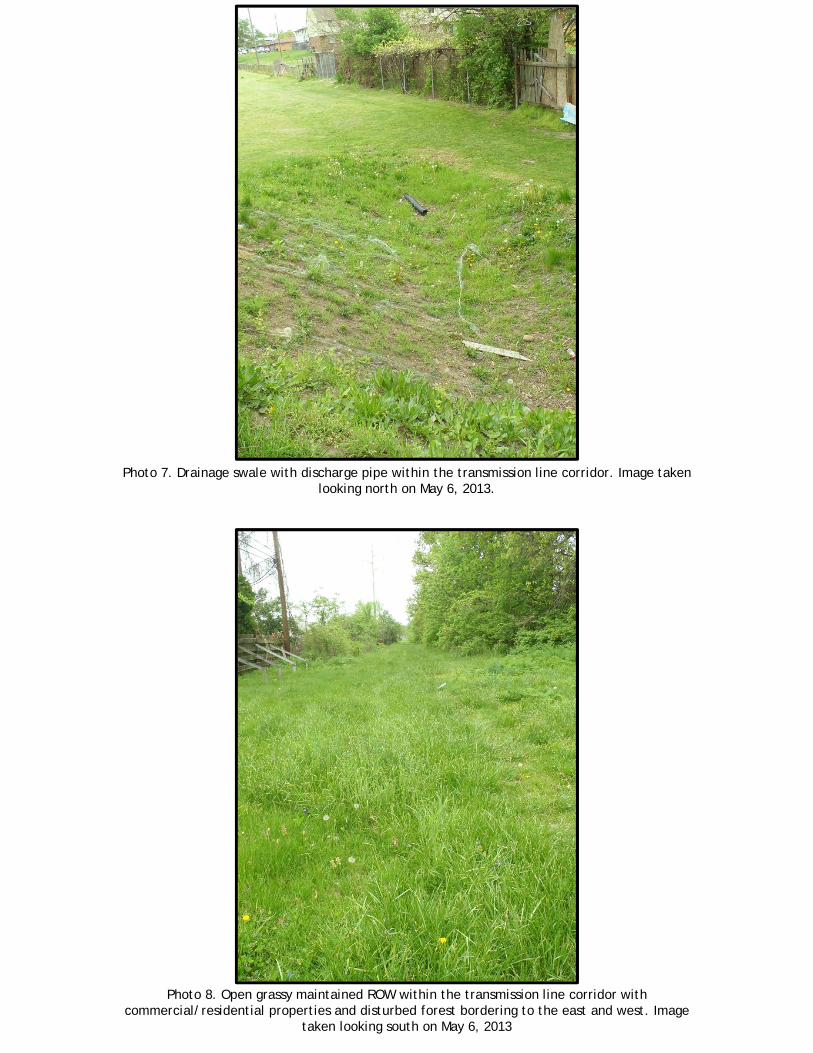
Photo 7. Drainage swale with discharge pipe within the transmission line corridor. Image taken looking north on May 6, 2013.
Photo 8. Open grassy maintained ROW within the transmission line corridor with commercial/residential properties and disturbed forest bordering to the east and west. Image
taken looking south on May 6, 2013

Photo 10. Open grassy field within the transmission line corridor with disturbed forest on the east and residential/commercial property on the west near Structure 14. Image taken looking
northwest on May 7, 2013.
Photo 9. Open grassy field within the transmission line corridor bordered on the east and west by disturbed forest and residential properties. Image taken looking south on May 7, 2013.

Photo 12. Stream 1 culvert inlet near Structure 16. This stream has been culverted and buried along the line until Structure 6. Image taken looking east on May 7, 2013.
Photo 11. Stream 1 culvert inlet near Structure 16. This stream has been culverted and buried along the line until Structure 6. Image taken looking northwest on May 7, 2013.

Photo 14. Ending of surface water flow of Stream 1 within the transmission line corridor. Stream is diverted through a culvert and flows underground via pipe system. Image is taken looking
south. Taken May 7, 2013.
Photo 13. Vegetated area bordered by disturbed forest with the transmission line corridor near Structure 20. Image taken looking southeast on May 7, 2013.
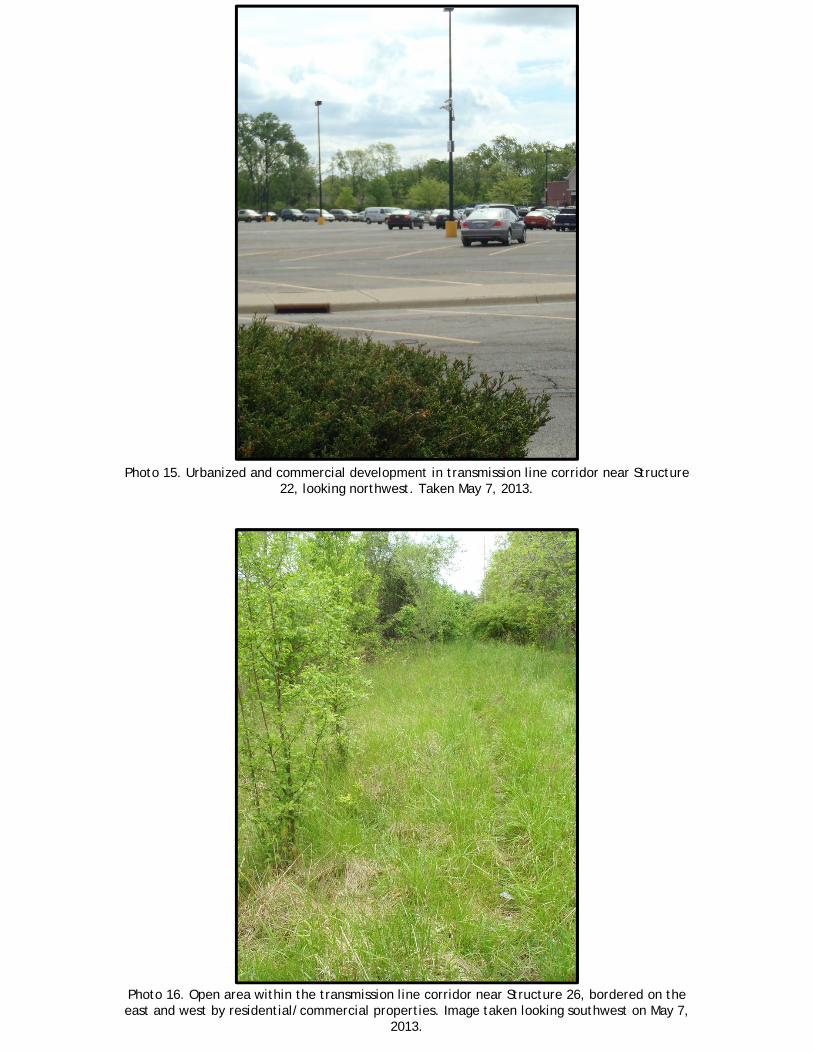
Photo 16. Open area within the transmission line corridor near Structure 26, bordered on the east and west by residential/commercial properties. Image taken looking southwest on May 7,
2013.
Photo 15. Urbanized and commercial development in transmission line corridor near Structure 22, looking northwest. Taken May 7, 2013.

Photo 18. Transmission line corridor in existing ROW, near Structure 27, (pedestrian walking trail shown) looking north. Taken May 7, 2013.
Photo 17. Transmission line corridor (structure in background) in an open grassy field, near Structure 29 with residential/commercial properties to the left and right looking north. Taken
May 7, 2013.

Photo 19. Transmission line corridor on Department of Defense property looking south. Taken May 7, 2013.

BHE Environmental, Inc.
APPENDIX B
Stream and Wetland Datasheets

Qualitative Habitat Evaluation Indexand Use Assessment Field Sheet
_ _/ _ _/ _ _RM: Date:
QHEI Score:
_ _ _._Stream & Location:
Scorers Full Name & Affiliation:_ _ _- _ _ _- _ _ _ _ _ _ _ _ _ Lat./ Long.:River Code: STORET #:
Comments
Comments
Substrate
Maximum20
CoverMaximum
20
ChannelMaximum
20Comments
RiparianMaximum
10
Pool /Current
Maximum12
EPA 4520 06/16/06
Riffle /Run
Maximum8
Maximum10
Gradient
Comments
Comments
Comments
_ _ . _ _ _ _ /8_ . _ _ _ _(NAD 83 - decimal o)Office verified
location
Recreation PotentialPrimary Contact
Secondary Contact(circle one and comment on back)
1] SUBSTRATE
BEST TYPES POOL RIFFLE OTHER TYPES POOL RIFFLELIMESTONE [1]TILLS [1]WETLANDS [0]HARDPAN [0]SANDSTONE [0]RIP/RAP [0]LACUSTURINE [0]SHALE [-1]COAL FINES [-2]
ORIGIN QUALITYCheck ONE (Or 2 & average)
Check ONLY Two substrate TYPE BOXES;estimate % or note every type present
HEAVY [-2]MODERATE [-1]NORMAL [0]FREE [1]EXTENSIVE [-2]MODERATE [-1]NORMAL [0]NONE [1]
SILT
EMBE
DDEDNESS(Score natural substrates; ignore
sludge from point-sources)4 or more [2]3 or less [0]
NUMBER OF BEST TYPES:
HARDPAN [4]DETRITUS [3]MUCK [2]SILT [2]ARTIFICIAL [0]
BLDR /SLABS [10]BOULDER [9]COBBLE [8]GRAVEL [7]SAND [6]BEDROCK [5]
2] INSTREAM COVER Indicate presence 0 to 3: 0-Absent; 1-Very small amounts or if more common of marginalquality; 2-Moderate amounts, but not of highest quality or in small amounts of highest
quality; 3-Highest quality in moderate or greater amounts (e.g., very large boulders in deep or fast water, largediameter log that is stable, well developed rootwad in deep / fast water, or deep, well-defined, functional pools.
UNDERCUT BANKS [1]OVERHANGING VEGETATION [1]SHALLOWS (IN SLOW WATER) [1]ROOTMATS [1]
POOLS > 70cm [2]ROOTWADS [1]BOULDERS [1]
OXBOWS, BACKWATERS [1]AQUATIC MACROPHYTES [1]LOGS OR WOODY DEBRIS [1]
EXTENSIVE >75% [11]MODERATE 25-75% [7]SPARSE 5-<25% [3]NEARLY ABSENT <5% [1]
AMOUNTCheck ONE (Or 2 & average)
3] CHANNEL MORPHOLOGY Check ONE in each category (Or 2 & average)SINUOSITYHIGH [4]MODERATE [3]LOW [2]NONE [1]
DEVELOPMENTEXCELLENT [7]GOOD [5]FAIR [3]POOR [1]
CHANNELIZATIONNONE [6]RECOVERED [4]RECOVERING [3]RECENT OR NO RECOVERY [1]
STABILITYHIGH [3]MODERATE [2]LOW [1]
Check ONE in each category for EACH BANK (Or 2 per bank & average)4] BANK EROSION AND RIPARIAN ZONERiver right looking downstream
EROSIONNONE / LITTLE [3]MODERATE [2]HEAVY / SEVERE [1]
L R
POOL WIDTH > RIFFLE WIDTH [2]POOL WIDTH = RIFFLE WIDTH [1]POOL WIDTH < RIFFLE WIDTH [0]
Check ONE (ONLY!)
Indicate for reach - pools and riffles.
RIPARIAN WIDTH FLOOD PLAIN QUALITYL R
FOREST, SWAMP [3]SHRUB OR OLD FIELD [2]RESIDENTIAL, PARK, NEW FIELD [1]FENCED PASTURE [1]OPEN PASTURE, ROWCROP [0]
L RCONSERVATION TILLAGE [1]URBAN OR INDUSTRIAL [0]MINING / CONSTRUCTION [0]
L R
Indicate predominant land use(s)past 100m riparian.
WIDE > 50m [4]MODERATE 10-50m [3]NARROW 5-10m [2]VERY NARROW < 5m [1]NONE [0]
5] POOL / GLIDE AND RIFFLE / RUN QUALITYMAXIMUM DEPTH
> 1m [6]0.7-<1m [4]0.4-<0.7m [2]0.2-<0.4m [1]< 0.2m [0]
CHANNEL WIDTH CURRENT VELOCITY
SLOW [1]INTERSTITIAL [-1]INTERMITTENT [-2]EDDIES [1]
Check ONE (Or 2 & average) Check ALL that applyTORRENTIAL [-1]VERY FAST [1]FAST [1]MODERATE [1]
Indicate for functional riffles; Best areas must be large enough to support a populationof riffle-obligate species: Check ONE (Or 2 & average).
RIFFLE DEPTHBEST AREAS > 10cm [2]BEST AREAS 5-10cm [1]BEST AREAS < 5cm
RUN DEPTHMAXIMUM > 50cm [2]MAXIMUM < 50cm [1]
RIFFLE / RUN SUBSTRATE RIFFLE / RUN EMBEDDEDNESSSTABLE (e.g., Cobble, Boulder) [2]MOD. STABLE (e.g., Large Gravel) [1]UNSTABLE (e.g., Fine Gravel, Sand) [0]
NONE [2]LOW [1]MODERATE [0]EXTENSIVE [-1][metric=0]
NO RIFFLE [metric=0]
6] GRADIENT ( ft/mi)DRAINAGE AREA
( mi2)
%POOL:
%RUN:
%GLIDE:
%RIFFLE:
VERY LOW - LOW [2-4]MODERATE [6-10]HIGH - VERY HIGH [10-6]
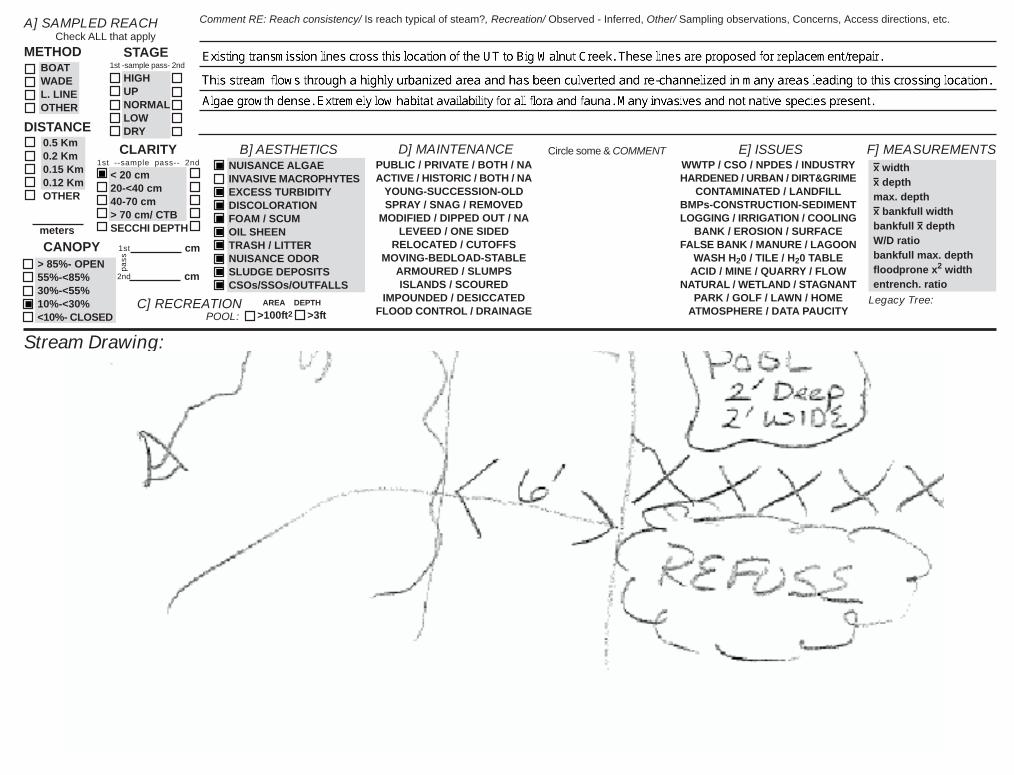
Comment RE: Reach consistency/ Is reach typical of steam?, Recreation/ Observed - Inferred, Other/ Sampling observations, Concerns, Access directions, etc.
Stream Drawing:
Legacy Tree:AREA DEPTH
>100ft2 >3ftC] RECREATION
POOL:
A] SAMPLED REACH
METHODBOATWADEL. LINEOTHER
DISTANCE0.5 Km0.2 Km0.15 Km0.12 KmOTHER
meters
CANOPY> 85%- OPEN55%-<85%30%-<55%10%-<30%<10%- CLOSED
Check ALL that apply
CLARITY
< 20 cm20-<40 cm40-70 cm> 70 cm/ CTBSECCHI DEPTH
cm
1st --sample pass-- 2nd
STAGE
HIGHUPNORMALLOWDRY
1st -sample pass- 2nd
cm
1st
pass
2nd
B] AESTHETICSNUISANCE ALGAEINVASIVE MACROPHYTESEXCESS TURBIDITYDISCOLORATIONFOAM / SCUMOIL SHEENTRASH / LITTERNUISANCE ODORSLUDGE DEPOSITSCSOs/SSOs/OUTFALLS
PUBLIC / PRIVATE / BOTH / NAACTIVE / HISTORIC / BOTH / NA
YOUNG-SUCCESSION-OLDSPRAY / SNAG / REMOVED
MODIFIED / DIPPED OUT / NALEVEED / ONE SIDED
RELOCATED / CUTOFFSMOVING-BEDLOAD-STABLE
ARMOURED / SLUMPSISLANDS / SCOURED
IMPOUNDED / DESICCATEDFLOOD CONTROL / DRAINAGE
D] MAINTENANCE Circle some & COMMENT E] ISSUESWWTP / CSO / NPDES / INDUSTRYHARDENED / URBAN / DIRT&GRIME
CONTAMINATED / LANDFILLBMPs-CONSTRUCTION-SEDIMENTLOGGING / IRRIGATION / COOLING
BANK / EROSION / SURFACEFALSE BANK / MANURE / LAGOON
WASH H20 / TILE / H20 TABLEACID / MINE / QUARRY / FLOW
NATURAL / WETLAND / STAGNANTPARK / GOLF / LAWN / HOME
ATMOSPHERE / DATA PAUCITY
F] MEASUREMENTSx widthx depthmax. depthx bankfull widthbankfull x depthW/D ratiobankfull max. depthfloodprone x2 widthentrench. ratio

ORAM v. 5.0 Field Form Quantitative Rating
Site: May 7, 2013
CMS
0 0 Metric 1. Wetland Area (size). (max 6 pts)Subtotal Points Select one size class and assign score.
0 >50 acres (>20.2ha) (6 pts)25 to <50 acres (10.1 to <20.2ha) (5 pts)10 to <25 acres (4 to <10.1ha) (4 pts) 3 to <10 acres (1.2 to <4ha) (3 pts) 0.3 to <3 acres (0.12 to <1.2ha) (2pts)
0.1 to <0.3 acres (0.04 to <0.12ha) (1 pt) 0 X <0.1 acres (0.04ha) (0 pts)
3 3 Metric 2. Upland buffers and surrounding land use. (max 14 pts)Subtotal Points 2a. Calculate average buffer width (select one, do not double check)
3 WIDE. Buffers average 50m (164ft) or more around wetland perimeter (7)
MEDIUM. Buffers average 25m to <50m (82 to <164ft) around wetland perimeter (4)3 2b NARROW. Buffers average 10m to <25m (32ft to <82ft) around wetland perimeter (1)
0 X VERY NARROW. Buffers average <10m (<32ft) around wetland perimeter (0)
2b. Intensity of surrounding land use (select one or double check & average) VERY LOW. 2nd growth or older forest, prairie, savannah, wildlife area, etc. (7)LOW. Old field (>10 years), shrubland, young second growth forest. (5)
3 X MODERATELY HIGH. Residential, fenced pasture, park, conservation tillage, new fallow field. (3)HIGH. Urban, industrial, open pasture, row cropping, mining, construction. (1)
9 6 Metric 3. Hydrology. (max 30 pts)Subtotal Points 3a. Sources of Water. Score all that apply. 3b. Connectivity. Score all that apply.
6 High pH groundwater (5) 100 year floodplain (1)
Other groundwater (3) Between stream/lake and other human use (1)2 3d 1 X Precipitation (1) Part of wetland/upland (e.g. forest), complex (1)1 3e Seasonal/Intermittent surface water (3) 1 X Part of riparian or upland corridor (1)
Perennial surface water (lake or stream) (5)
3d. Duration inundation/saturation. 3c. Maximum water depth. Select only 1. (select one or double check & average)
>0.7 (27.6in) (3) Semi- to permanently inundated/saturated (4)
0.4 to 0.7m (15.7 to 27.6in) (2) Regularly inundated/saturated (3)1 X <0.4m (<15.7in) (1) 2 X Seasonally inundated (2)
Seasonally saturated in upper 30cm (12in) (1)3e. Modifications to natural hydrologic regime.
(select one or double check & average) None or none apparent (12)Recovered (7)Recovering (3)
1 X Recent or no recovery (1)
12 3 Metric 4. Habitat Alteration and Development. (max 20 pts.)
Subtotal Points 4a. Substrate disturbance. Score one or double check and average.3 None or none apparent (4)
Recovered (3) 4c. Habitat alteration. Score one or double check and average. 1 4a Recovering (2) None or none apparent (9)
1 4c 1 X Recent or no recovery (1) Recovered (6)
Recovering (3)
4b. Habitat development. Select one. 1 X Recent or no recovery (1)
Excellent (7)
Very good (6)
Good (5)
Moderately good (4)
Fair (3)
Poor to fair (2)
1 X Poor (1)
12 subtotal this page
Groves-Bexley 138kV T-Line Date:Wetland 1Wetland: Rater:
Check all disturbances observed
Check all disturbances observedditch
tile
stormwater input other- list
road bed/RR track
dikepoint source (nonstormwater)
dredgingweir
filling/grading
selective cutting
mowing
clearcuttinggrazing
farming
nutrient emrichment
sedimentationherbaceous/aquatic bed removal
dredging
shrub/sapling removal
toxic pollutantswoody debris removal

ORAM v. 5.0 Field Form Quantitative Rating
Site: Date: May 7, 2013
CMS
12 subtotal first page
12 0 Metric 5. Special Wetlands. (max 10 pts.)Subtotal Points Check all that apply and score as indicated
0 Bog (10 pts)
Fen (10 pts)
Old Growth Forest (10 pts)
Mature forested wetland (5 pts)
Lake Erie coastal/tributary wetland-unrestricted hydrology (10 pts)
Lake Erie coastal/tributary wetland-restricted hydrology (5 pts)
Lake Plain Sand Prairies (Oak Openings) (10 pts)
Relict Wet Prairies (10 pts)
Known occurrence state/federal threatened or endangered species (10)
Significant migatory songbird/waterfowl habitat or usage (10 pts)
Category 1 Wetland. See Question 1 of Qualitative Rating. (-10 pts)
9 -3 Metric 6. Plant Communities, interspersion, microtopography. (max 20 pts.)Subtotal Points 6a. Wetland Vegetation Communities
-3 Score all present using 0 to 3 scale
Aquatic bed 0
1 Emergent
Shrub
Forest
Mudflats
Open water
6b. Horizontal (plan view) interspersionSelect only one
High (5)
Moderately high (4)
Moderate (3)
Moderately low (2)
1 X Low (1)
None (0)
6c. Coverage of invasive plants.
-5 X Extensive >75 % cover (-5)
Moderate 25-75% cover (-3)
Sparse 5-25% cover (-1)
Nearly Absent <5% cover (0) 0
Absent (1) 1
2
6d. Microtopography 3
Score all present using 0 to 3 scale
Vegetated hummocks/tussocks
Coarse woody debris >15 cm (6") 0
Standing dead > 25 cm (10") dbh
Amphibian breeding pools
9 GRAND TOTAL (max 100 pts) Category 1Provisional Wetland Category:
Refer to Table 1 ORAM long form for list.
Add or deduct points for coverage
High 4 ha (9.88 acres) or more
Microtopography Cover Scale
Mudflat and Open Water Class Quality
Moderate 1 ha to <4 ha (2.47 acres 9.88 acres)
3 Present in moderate or greater amounts and of highest quality
Absent
Present very small amounts or if more common of marginal quality
1
Present in moderate amounts, but not of highest quality or in small amounts of highest quality
2
lowLow spp diversity and/or predominance of nonnative or disturbance tolerant native species
Absent <0.1 ha (0.2471 acres)
Low 0.1 ha to <1 ha (0.2471 acres to 2.47 acres)
moderate
A predominance of native species, with nonnative spp and/or disturbance tolerant native spp absent or virtually absent, and high spp diversity and often, but not always, the presence of rare, threatened, or endangered spp
high
Native spp are dominant component of the vegetation, although nonnative and/or disturbance tolerant native spp can also be present, and species diversity moderate to moderately high, but generally w/o presence of rare threatened or endangered spp
Groves-Bexley 138kV T-Line
Present and comprises significant part, or more, of wetland's vegetation and is of high quality
1
2
3
Wetland: Wetland 1 Rater:
Narrative Description of Vegetation Quality
Other (list)
Vegetation Community Cover ScaleAbsent or comprises <0.1 ha (0.2471 acres) contiguous area
Present and either comprises small part of wetland's vegetation and is of moderate quality, or comprises a significant part but is of low quality
Present and either comprises significant part of wetland's vegetation and is of moderate quality or comprises a small part and is of high quality

Name: Date: May 7, 2013
Photograph
final score: Provisional Wetland Category:
Hydrologic Unit CodeUSGS Quad
Category 19
How was size estimated?
ODNR - DNAP
Delineation Report/Map
Wetlands Delineation
0.051
Soil Survey
NWI MapOWI Map
5060001USGS Topo
Sources of information used(check all that apply)
Aerial PhotoWetland Size (acres)
Phone:
e-mail address
Wetlands Name
Location of Wetlands including address if available
39.935294°, -82.889663°
234-678-8889
Site VisitUTM
Wetland 1
Background Information Form – ORAM v.5.0
Background Information FormCMS
User Address:
Affiliation:
1 South Main Street, Akron, Ohio 44308
BHE Environmental, Inc.

ORAM v.5.0 Field Form – Narrative Rating
Name: Date: May 7, 2013
11: Relict Wet Prairies
10: Oak Openings
9e: Non-native Species Predominate
9a: Lake Erie Coastal and Tributary Wetlands
9b: Hydrology result of Erosion Control Measures (Lake Erie)
9c: Hydrology unrestricted
9d: Native Species Predominate
8a: “Old Growth Forest”
8b: Mature Forested Wetlands
3: Documented High Quality Wetland
4: Significant Breeding or Concentration Area (waterfowl)
1: Critical Habitat2: Threatened or Endangered Species
CMS
5: Category 1 Wetlands (hydrologically isolated)
6: Bogs
7: Fens
Narrative Rating Questions
Wetlands Name Wetland 1
NO YES
YES
YES
YES
YES
YES
YES
YES
YES
YES
YES
YES
YES
YES
YES
YES
NO
NO
NO
NO
NO
NO
NO
NO
NO
NO
NO
NO
NO
NO
NO

ORAM v. 5.0 Field Form Quantitative Rating
Site: May 7, 2013
CMS
0 0 Metric 1. Wetland Area (size). (max 6 pts)Subtotal Points Select one size class and assign score.
0 >50 acres (>20.2ha) (6 pts)25 to <50 acres (10.1 to <20.2ha) (5 pts)10 to <25 acres (4 to <10.1ha) (4 pts) 3 to <10 acres (1.2 to <4ha) (3 pts) 0.3 to <3 acres (0.12 to <1.2ha) (2pts)
0.1 to <0.3 acres (0.04 to <0.12ha) (1 pt) 0 X <0.1 acres (0.04ha) (0 pts)
1 1 Metric 2. Upland buffers and surrounding land use. (max 14 pts)Subtotal Points 2a. Calculate average buffer width (select one, do not double check)
1 WIDE. Buffers average 50m (164ft) or more around wetland perimeter (7)
MEDIUM. Buffers average 25m to <50m (82 to <164ft) around wetland perimeter (4)1 2b NARROW. Buffers average 10m to <25m (32ft to <82ft) around wetland perimeter (1)
0 X VERY NARROW. Buffers average <10m (<32ft) around wetland perimeter (0)
2b. Intensity of surrounding land use (select one or double check & average) VERY LOW. 2nd growth or older forest, prairie, savannah, wildlife area, etc. (7)LOW. Old field (>10 years), shrubland, young second growth forest. (5)MODERATELY HIGH. Residential, fenced pasture, park, conservation tillage, new fallow field. (3)
1 X HIGH. Urban, industrial, open pasture, row cropping, mining, construction. (1)
7 6 Metric 3. Hydrology. (max 30 pts)Subtotal Points 3a. Sources of Water. Score all that apply. 3b. Connectivity. Score all that apply.
6 High pH groundwater (5) 100 year floodplain (1)
Other groundwater (3) Between stream/lake and other human use (1)2 3d 1 X Precipitation (1) Part of wetland/upland (e.g. forest), complex (1)1 3e Seasonal/Intermittent surface water (3) 1 X Part of riparian or upland corridor (1)
Perennial surface water (lake or stream) (5)
3d. Duration inundation/saturation. 3c. Maximum water depth. Select only 1. (select one or double check & average)
>0.7 (27.6in) (3) Semi- to permanently inundated/saturated (4)
0.4 to 0.7m (15.7 to 27.6in) (2) Regularly inundated/saturated (3)1 X <0.4m (<15.7in) (1) 2 X Seasonally inundated (2)
Seasonally saturated in upper 30cm (12in) (1)3e. Modifications to natural hydrologic regime.
(select one or double check & average) None or none apparent (12)Recovered (7)Recovering (3)
1 X Recent or no recovery (1)
14 7 Metric 4. Habitat Alteration and Development. (max 20 pts.)
Subtotal Points 4a. Substrate disturbance. Score one or double check and average.7 None or none apparent (4)
Recovered (3) 4c. Habitat alteration. Score one or double check and average. 2 4a 2 X Recovering (2) None or none apparent (9)
3 4c Recent or no recovery (1) Recovered (6)
3 X Recovering (3)
4b. Habitat development. Select one. Recent or no recovery (1)
Excellent (7)
Very good (6)
Good (5)
Moderately good (4)
Fair (3)
2 X Poor to fair (2)
Poor (1)
14 subtotal this page
Groves-Bexley 138kV T-Line Date:Wetland 2Wetland: Rater:
Check all disturbances observed
Check all disturbances observedditch
tile
stormwater input other- list
road bed/RR track
dikepoint source (nonstormwater)
dredgingweir
filling/grading
selective cutting
mowing
clearcuttinggrazing
farming
nutrient emrichment
sedimentationherbaceous/aquatic bed removal
dredging
shrub/sapling removal
toxic pollutantswoody debris removal
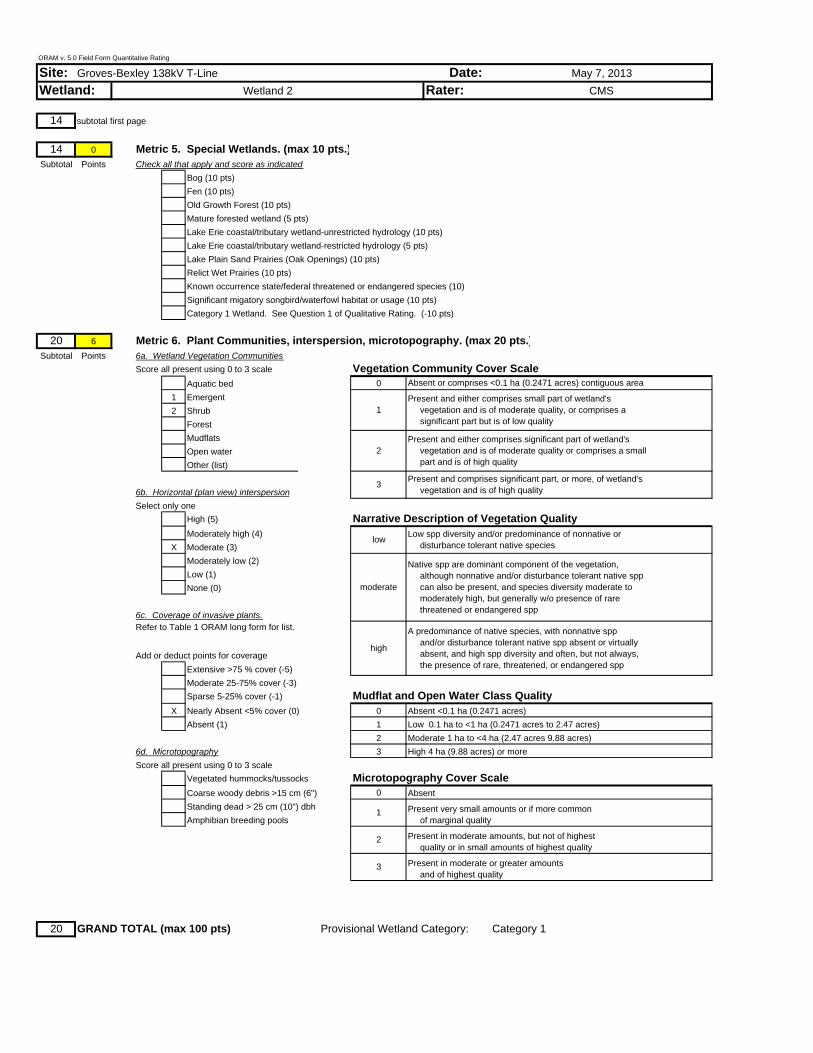
ORAM v. 5.0 Field Form Quantitative Rating
Site: Date: May 7, 2013
CMS
14 subtotal first page
14 0 Metric 5. Special Wetlands. (max 10 pts.)Subtotal Points Check all that apply and score as indicated
0 Bog (10 pts)
Fen (10 pts)
Old Growth Forest (10 pts)
Mature forested wetland (5 pts)
Lake Erie coastal/tributary wetland-unrestricted hydrology (10 pts)
Lake Erie coastal/tributary wetland-restricted hydrology (5 pts)
Lake Plain Sand Prairies (Oak Openings) (10 pts)
Relict Wet Prairies (10 pts)
Known occurrence state/federal threatened or endangered species (10)
Significant migatory songbird/waterfowl habitat or usage (10 pts)
Category 1 Wetland. See Question 1 of Qualitative Rating. (-10 pts)
20 6 Metric 6. Plant Communities, interspersion, microtopography. (max 20 pts.)Subtotal Points 6a. Wetland Vegetation Communities
6 Score all present using 0 to 3 scale
Aquatic bed 0
1 Emergent
2 Shrub
Forest
Mudflats
Open water
6b. Horizontal (plan view) interspersionSelect only one
High (5)
Moderately high (4)
3 X Moderate (3)
Moderately low (2)
Low (1)
None (0)
6c. Coverage of invasive plants.
Extensive >75 % cover (-5)
Moderate 25-75% cover (-3)
Sparse 5-25% cover (-1)
0 X Nearly Absent <5% cover (0) 0
Absent (1) 1
2
6d. Microtopography 3
Score all present using 0 to 3 scale
Vegetated hummocks/tussocks
Coarse woody debris >15 cm (6") 0
Standing dead > 25 cm (10") dbh
Amphibian breeding pools
20 GRAND TOTAL (max 100 pts) Category 1
Narrative Description of Vegetation Quality
Other (list)
Vegetation Community Cover ScaleAbsent or comprises <0.1 ha (0.2471 acres) contiguous area
Present and either comprises small part of wetland's vegetation and is of moderate quality, or comprises a significant part but is of low quality
Present and either comprises significant part of wetland's vegetation and is of moderate quality or comprises a small part and is of high quality
Groves-Bexley 138kV T-Line
Present and comprises significant part, or more, of wetland's vegetation and is of high quality
1
2
3
Wetland: Wetland 2 Rater:
2
lowLow spp diversity and/or predominance of nonnative or disturbance tolerant native species
Absent <0.1 ha (0.2471 acres)
Low 0.1 ha to <1 ha (0.2471 acres to 2.47 acres)
moderate
A predominance of native species, with nonnative spp and/or disturbance tolerant native spp absent or virtually absent, and high spp diversity and often, but not always, the presence of rare, threatened, or endangered spp
high
Native spp are dominant component of the vegetation, although nonnative and/or disturbance tolerant native spp can also be present, and species diversity moderate to moderately high, but generally w/o presence of rare threatened or endangered spp
Provisional Wetland Category:
Refer to Table 1 ORAM long form for list.
Add or deduct points for coverage
High 4 ha (9.88 acres) or more
Microtopography Cover Scale
Mudflat and Open Water Class Quality
Moderate 1 ha to <4 ha (2.47 acres 9.88 acres)
3 Present in moderate or greater amounts and of highest quality
Absent
Present very small amounts or if more common of marginal quality
1
Present in moderate amounts, but not of highest quality or in small amounts of highest quality

Name: Date: May 7, 2013
UTM
Wetland 2
Background Information Form – ORAM v.5.0
Background Information FormCMS
User Address:
Affiliation:
1 South Main Street, Akron, Ohio 44308
BHE Environmental, Inc.
Wetland Size (acres)
Phone:
e-mail address
Wetlands Name
Location of Wetlands including address if available
39.952603°, -82.901627°
234-678-8889
Site Visit
Sources of information used(check all that apply)
Aerial Photo
Hydrologic Unit CodeUSGS Quad
Category 120
How was size estimated?
ODNR - DNAP
Delineation Report/Map
Wetlands Delineation
0.009
Soil Survey
NWI MapOWI Map
5060001USGS Topo
Photograph
final score: Provisional Wetland Category:

ORAM v.5.0 Field Form – Narrative Rating
Name: Date: May 7, 2013
Narrative Rating Questions
Wetlands Name Wetland 2
8a: “Old Growth Forest”
8b: Mature Forested Wetlands
3: Documented High Quality Wetland
4: Significant Breeding or Concentration Area (waterfowl)
1: Critical Habitat2: Threatened or Endangered Species
CMS
5: Category 1 Wetlands (hydrologically isolated)
6: Bogs
7: Fens
11: Relict Wet Prairies
10: Oak Openings
9e: Non-native Species Predominate
9a: Lake Erie Coastal and Tributary Wetlands
9b: Hydrology result of Erosion Control Measures (Lake Erie)
9c: Hydrology unrestricted
9d: Native Species Predominate
NO YES
YES
YES
YES
YES
YES
YES
YES
YES
YES
YES
YES
YES
YES
YES
YES
NO
NO
NO
NO
NO
NO
NO
NO
NO
NO
NO
NO
NO
NO
NO
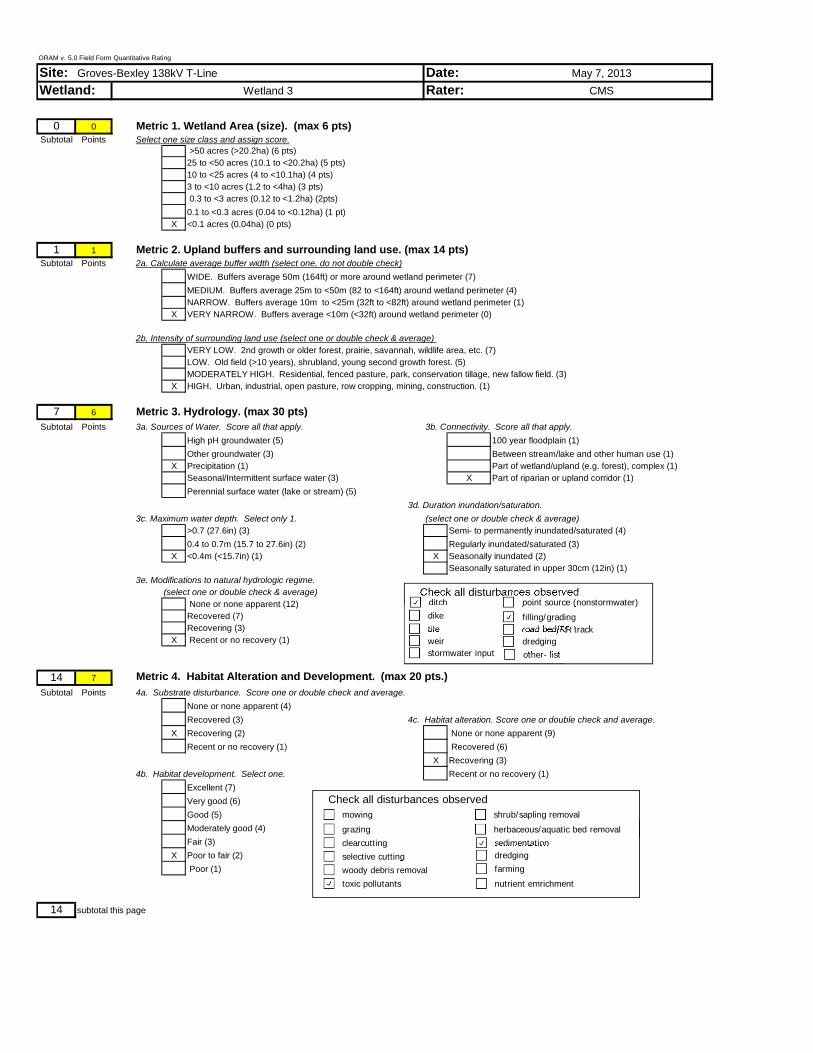
ORAM v. 5.0 Field Form Quantitative Rating
Site: May 7, 2013
CMS
0 0 Metric 1. Wetland Area (size). (max 6 pts)Subtotal Points Select one size class and assign score.
0 >50 acres (>20.2ha) (6 pts)25 to <50 acres (10.1 to <20.2ha) (5 pts)10 to <25 acres (4 to <10.1ha) (4 pts) 3 to <10 acres (1.2 to <4ha) (3 pts) 0.3 to <3 acres (0.12 to <1.2ha) (2pts)
0.1 to <0.3 acres (0.04 to <0.12ha) (1 pt) 0 X <0.1 acres (0.04ha) (0 pts)
1 1 Metric 2. Upland buffers and surrounding land use. (max 14 pts)Subtotal Points 2a. Calculate average buffer width (select one, do not double check)
1 WIDE. Buffers average 50m (164ft) or more around wetland perimeter (7)
MEDIUM. Buffers average 25m to <50m (82 to <164ft) around wetland perimeter (4)1 2b NARROW. Buffers average 10m to <25m (32ft to <82ft) around wetland perimeter (1)
0 X VERY NARROW. Buffers average <10m (<32ft) around wetland perimeter (0)
2b. Intensity of surrounding land use (select one or double check & average) VERY LOW. 2nd growth or older forest, prairie, savannah, wildlife area, etc. (7)LOW. Old field (>10 years), shrubland, young second growth forest. (5)MODERATELY HIGH. Residential, fenced pasture, park, conservation tillage, new fallow field. (3)
1 X HIGH. Urban, industrial, open pasture, row cropping, mining, construction. (1)
7 6 Metric 3. Hydrology. (max 30 pts)Subtotal Points 3a. Sources of Water. Score all that apply. 3b. Connectivity. Score all that apply.
6 High pH groundwater (5) 100 year floodplain (1)
Other groundwater (3) Between stream/lake and other human use (1)2 3d 1 X Precipitation (1) Part of wetland/upland (e.g. forest), complex (1)1 3e Seasonal/Intermittent surface water (3) 1 X Part of riparian or upland corridor (1)
Perennial surface water (lake or stream) (5)
3d. Duration inundation/saturation. 3c. Maximum water depth. Select only 1. (select one or double check & average)
>0.7 (27.6in) (3) Semi- to permanently inundated/saturated (4)
0.4 to 0.7m (15.7 to 27.6in) (2) Regularly inundated/saturated (3)1 X <0.4m (<15.7in) (1) 2 X Seasonally inundated (2)
Seasonally saturated in upper 30cm (12in) (1)3e. Modifications to natural hydrologic regime.
(select one or double check & average) None or none apparent (12)Recovered (7)Recovering (3)
1 X Recent or no recovery (1)
14 7 Metric 4. Habitat Alteration and Development. (max 20 pts.)
Subtotal Points 4a. Substrate disturbance. Score one or double check and average.7 None or none apparent (4)
Recovered (3) 4c. Habitat alteration. Score one or double check and average. 2 4a 2 X Recovering (2) None or none apparent (9)
3 4c Recent or no recovery (1) Recovered (6)
3 X Recovering (3)
4b. Habitat development. Select one. Recent or no recovery (1)
Excellent (7)
Very good (6)
Good (5)
Moderately good (4)
Fair (3)
2 X Poor to fair (2)
Poor (1)
14 subtotal this page
Groves-Bexley 138kV T-Line Date:Wetland 3Wetland: Rater:
Check all disturbances observed
Check all disturbances observedditch
tile
stormwater input other- list
road bed/RR track
dikepoint source (nonstormwater)
dredgingweir
filling/grading
selective cutting
mowing
clearcuttinggrazing
farming
nutrient emrichment
sedimentationherbaceous/aquatic bed removal
dredging
shrub/sapling removal
toxic pollutantswoody debris removal

ORAM v. 5.0 Field Form Quantitative Rating
Site: Date: May 7, 2013
CMS
14 subtotal first page
14 0 Metric 5. Special Wetlands. (max 10 pts.)Subtotal Points Check all that apply and score as indicated
0 Bog (10 pts)
Fen (10 pts)
Old Growth Forest (10 pts)
Mature forested wetland (5 pts)
Lake Erie coastal/tributary wetland-unrestricted hydrology (10 pts)
Lake Erie coastal/tributary wetland-restricted hydrology (5 pts)
Lake Plain Sand Prairies (Oak Openings) (10 pts)
Relict Wet Prairies (10 pts)
Known occurrence state/federal threatened or endangered species (10)
Significant migatory songbird/waterfowl habitat or usage (10 pts)
Category 1 Wetland. See Question 1 of Qualitative Rating. (-10 pts)
16 2 Metric 6. Plant Communities, interspersion, microtopography. (max 20 pts.)Subtotal Points 6a. Wetland Vegetation Communities
2 Score all present using 0 to 3 scale
Aquatic bed 0
Emergent
2 Shrub
1 Forest
Mudflats
Open water
6b. Horizontal (plan view) interspersionSelect only one
High (5)
Moderately high (4)
Moderate (3)
2 X Moderately low (2)
Low (1)
None (0)
6c. Coverage of invasive plants.
Extensive >75 % cover (-5)
-3 X Moderate 25-75% cover (-3)
Sparse 5-25% cover (-1)
Nearly Absent <5% cover (0) 0
Absent (1) 1
2
6d. Microtopography 3
Score all present using 0 to 3 scale
Vegetated hummocks/tussocks
Coarse woody debris >15 cm (6") 0
Standing dead > 25 cm (10") dbh
Amphibian breeding pools
16 GRAND TOTAL (max 100 pts) Category 1Provisional Wetland Category:
Refer to Table 1 ORAM long form for list.
Add or deduct points for coverage
High 4 ha (9.88 acres) or more
Microtopography Cover Scale
Mudflat and Open Water Class Quality
Moderate 1 ha to <4 ha (2.47 acres 9.88 acres)
3 Present in moderate or greater amounts and of highest quality
Absent
Present very small amounts or if more common of marginal quality
1
Present in moderate amounts, but not of highest quality or in small amounts of highest quality
2
lowLow spp diversity and/or predominance of nonnative or disturbance tolerant native species
Absent <0.1 ha (0.2471 acres)
Low 0.1 ha to <1 ha (0.2471 acres to 2.47 acres)
moderate
A predominance of native species, with nonnative spp and/or disturbance tolerant native spp absent or virtually absent, and high spp diversity and often, but not always, the presence of rare, threatened, or endangered spp
high
Native spp are dominant component of the vegetation, although nonnative and/or disturbance tolerant native spp can also be present, and species diversity moderate to moderately high, but generally w/o presence of rare threatened or endangered spp
Groves-Bexley 138kV T-Line
Present and comprises significant part, or more, of wetland's vegetation and is of high quality
1
2
3
Wetland: Wetland 3 Rater:
Narrative Description of Vegetation Quality
Other (list)
Vegetation Community Cover ScaleAbsent or comprises <0.1 ha (0.2471 acres) contiguous area
Present and either comprises small part of wetland's vegetation and is of moderate quality, or comprises a significant part but is of low quality
Present and either comprises significant part of wetland's vegetation and is of moderate quality or comprises a small part and is of high quality

Name: Date: May 7, 2013
Photograph
final score: Provisional Wetland Category:
Hydrologic Unit CodeUSGS Quad
Category 116
How was size estimated?
ODNR - DNAP
Delineation Report/Map
Wetlands Delineation
0.055
Soil Survey
NWI MapOWI Map
5060001USGS Topo
Sources of information used(check all that apply)
Aerial PhotoWetland Size (acres)
Phone:
e-mail address
Wetlands Name
Location of Wetlands including address if available
39.952603°, -82.901627°
234-678-8889
Site VisitUTM
Wetland 3
Background Information Form – ORAM v.5.0
Background Information FormCMS
User Address:
Affiliation:
1 South Main Street, Akron, Ohio 44308
BHE Environmental, Inc.

ORAM v.5.0 Field Form – Narrative Rating
Name: Date: May 7, 2013
11: Relict Wet Prairies
10: Oak Openings
9e: Non-native Species Predominate
9a: Lake Erie Coastal and Tributary Wetlands
9b: Hydrology result of Erosion Control Measures (Lake Erie)
9c: Hydrology unrestricted
9d: Native Species Predominate
8a: “Old Growth Forest”
8b: Mature Forested Wetlands
3: Documented High Quality Wetland
4: Significant Breeding or Concentration Area (waterfowl)
1: Critical Habitat2: Threatened or Endangered Species
CMS
5: Category 1 Wetlands (hydrologically isolated)
6: Bogs
7: Fens
Narrative Rating Questions
Wetlands Name Wetland 3
NO YES
YES
YES
YES
YES
YES
YES
YES
YES
YES
YES
YES
YES
YES
YES
YES
NO
NO
NO
NO
NO
NO
NO
NO
NO
NO
NO
NO
NO
NO
NO

ORAM v. 5.0 Field Form Quantitative Rating
Site: May 7, 2013
CMS
0 0 Metric 1. Wetland Area (size). (max 6 pts)Subtotal Points Select one size class and assign score.
0 >50 acres (>20.2ha) (6 pts)25 to <50 acres (10.1 to <20.2ha) (5 pts)10 to <25 acres (4 to <10.1ha) (4 pts) 3 to <10 acres (1.2 to <4ha) (3 pts) 0.3 to <3 acres (0.12 to <1.2ha) (2pts)
0.1 to <0.3 acres (0.04 to <0.12ha) (1 pt) 0 X <0.1 acres (0.04ha) (0 pts)
3 3 Metric 2. Upland buffers and surrounding land use. (max 14 pts)Subtotal Points 2a. Calculate average buffer width (select one, do not double check)
3 WIDE. Buffers average 50m (164ft) or more around wetland perimeter (7)
MEDIUM. Buffers average 25m to <50m (82 to <164ft) around wetland perimeter (4)3 2b NARROW. Buffers average 10m to <25m (32ft to <82ft) around wetland perimeter (1)
0 X VERY NARROW. Buffers average <10m (<32ft) around wetland perimeter (0)
2b. Intensity of surrounding land use (select one or double check & average) VERY LOW. 2nd growth or older forest, prairie, savannah, wildlife area, etc. (7)LOW. Old field (>10 years), shrubland, young second growth forest. (5)
3 X MODERATELY HIGH. Residential, fenced pasture, park, conservation tillage, new fallow field. (3)HIGH. Urban, industrial, open pasture, row cropping, mining, construction. (1)
9 6 Metric 3. Hydrology. (max 30 pts)Subtotal Points 3a. Sources of Water. Score all that apply. 3b. Connectivity. Score all that apply.
6 High pH groundwater (5) 100 year floodplain (1)
Other groundwater (3) Between stream/lake and other human use (1)2 3d 1 X Precipitation (1) Part of wetland/upland (e.g. forest), complex (1)1 3e Seasonal/Intermittent surface water (3) 1 X Part of riparian or upland corridor (1)
Perennial surface water (lake or stream) (5)
3d. Duration inundation/saturation. 3c. Maximum water depth. Select only 1. (select one or double check & average)
>0.7 (27.6in) (3) Semi- to permanently inundated/saturated (4)
0.4 to 0.7m (15.7 to 27.6in) (2) Regularly inundated/saturated (3)1 X <0.4m (<15.7in) (1) 2 X Seasonally inundated (2)
Seasonally saturated in upper 30cm (12in) (1)3e. Modifications to natural hydrologic regime.
(select one or double check & average) None or none apparent (12)Recovered (7)Recovering (3)
1 X Recent or no recovery (1)
12 3 Metric 4. Habitat Alteration and Development. (max 20 pts.)
Subtotal Points 4a. Substrate disturbance. Score one or double check and average.3 None or none apparent (4)
Recovered (3) 4c. Habitat alteration. Score one or double check and average. 1 4a Recovering (2) None or none apparent (9)
1 4c 1 X Recent or no recovery (1) Recovered (6)
Recovering (3)
4b. Habitat development. Select one. 1 X Recent or no recovery (1)
Excellent (7)
Very good (6)
Good (5)
Moderately good (4)
Fair (3)
Poor to fair (2)
1 X Poor (1)
12 subtotal this page
Groves-Bexley 138kV T-Line Date:Wetland 4Wetland: Rater:
Check all disturbances observed
Check all disturbances observedditch
tile
stormwater input other- list
road bed/RR track
dikepoint source (nonstormwater)
dredgingweir
filling/grading
selective cutting
mowing
clearcuttinggrazing
farming
nutrient emrichment
sedimentationherbaceous/aquatic bed removal
dredging
shrub/sapling removal
toxic pollutantswoody debris removal

ORAM v. 5.0 Field Form Quantitative Rating
Site: Date: May 7, 2013
CMS
12 subtotal first page
12 0 Metric 5. Special Wetlands. (max 10 pts.)Subtotal Points Check all that apply and score as indicated
0 Bog (10 pts)
Fen (10 pts)
Old Growth Forest (10 pts)
Mature forested wetland (5 pts)
Lake Erie coastal/tributary wetland-unrestricted hydrology (10 pts)
Lake Erie coastal/tributary wetland-restricted hydrology (5 pts)
Lake Plain Sand Prairies (Oak Openings) (10 pts)
Relict Wet Prairies (10 pts)
Known occurrence state/federal threatened or endangered species (10)
Significant migatory songbird/waterfowl habitat or usage (10 pts)
Category 1 Wetland. See Question 1 of Qualitative Rating. (-10 pts)
9 -3 Metric 6. Plant Communities, interspersion, microtopography. (max 20 pts.)Subtotal Points 6a. Wetland Vegetation Communities
-3 Score all present using 0 to 3 scale
Aquatic bed 0
1 Emergent
Shrub
Forest
Mudflats
Open water
6b. Horizontal (plan view) interspersionSelect only one
High (5)
Moderately high (4)
Moderate (3)
Moderately low (2)
1 X Low (1)
None (0)
6c. Coverage of invasive plants.
-5 X Extensive >75 % cover (-5)
Moderate 25-75% cover (-3)
Sparse 5-25% cover (-1)
Nearly Absent <5% cover (0) 0
Absent (1) 1
2
6d. Microtopography 3
Score all present using 0 to 3 scale
Vegetated hummocks/tussocks
Coarse woody debris >15 cm (6") 0
Standing dead > 25 cm (10") dbh
Amphibian breeding pools
9 GRAND TOTAL (max 100 pts) Category 1
Narrative Description of Vegetation Quality
Other (list)
Vegetation Community Cover ScaleAbsent or comprises <0.1 ha (0.2471 acres) contiguous area
Present and either comprises small part of wetland's vegetation and is of moderate quality, or comprises a significant part but is of low quality
Present and either comprises significant part of wetland's vegetation and is of moderate quality or comprises a small part and is of high quality
Groves-Bexley 138kV T-Line
Present and comprises significant part, or more, of wetland's vegetation and is of high quality
1
2
3
Wetland: Wetland 4 Rater:
2
lowLow spp diversity and/or predominance of nonnative or disturbance tolerant native species
Absent <0.1 ha (0.2471 acres)
Low 0.1 ha to <1 ha (0.2471 acres to 2.47 acres)
moderate
A predominance of native species, with nonnative spp and/or disturbance tolerant native spp absent or virtually absent, and high spp diversity and often, but not always, the presence of rare, threatened, or endangered spp
high
Native spp are dominant component of the vegetation, although nonnative and/or disturbance tolerant native spp can also be present, and species diversity moderate to moderately high, but generally w/o presence of rare threatened or endangered spp
Provisional Wetland Category:
Refer to Table 1 ORAM long form for list.
Add or deduct points for coverage
High 4 ha (9.88 acres) or more
Microtopography Cover Scale
Mudflat and Open Water Class Quality
Moderate 1 ha to <4 ha (2.47 acres 9.88 acres)
3 Present in moderate or greater amounts and of highest quality
Absent
Present very small amounts or if more common of marginal quality
1
Present in moderate amounts, but not of highest quality or in small amounts of highest quality

Name: Date: May 7, 2013
UTM
Wetland 4
Background Information Form – ORAM v.5.0
Background Information FormCMS
User Address:
Affiliation:
1 South Main Street, Akron, Ohio 44308
BHE Environmental, Inc.
Wetland Size (acres)
Phone:
e-mail address
Wetlands Name
Location of Wetlands including address if available
39.958129°, -82.905052°
234-678-8889
Site Visit
Sources of information used(check all that apply)
Aerial Photo
Hydrologic Unit CodeUSGS Quad
Category 19
How was size estimated?
ODNR - DNAP
Delineation Report/Map
Wetlands Delineation
0.005
Soil Survey
NWI MapOWI Map
5060001USGS Topo
Photograph
final score: Provisional Wetland Category:
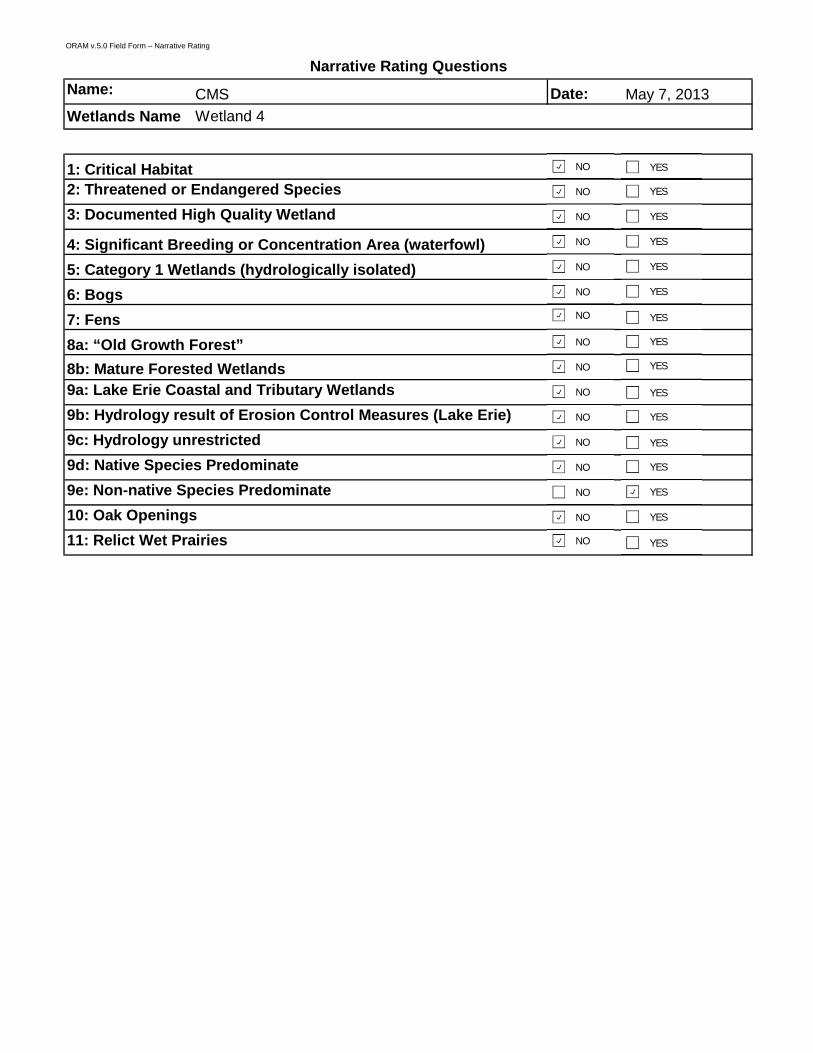
ORAM v.5.0 Field Form – Narrative Rating
Name: Date: May 7, 2013
Narrative Rating Questions
Wetlands Name Wetland 4
8a: “Old Growth Forest”
8b: Mature Forested Wetlands
3: Documented High Quality Wetland
4: Significant Breeding or Concentration Area (waterfowl)
1: Critical Habitat2: Threatened or Endangered Species
CMS
5: Category 1 Wetlands (hydrologically isolated)
6: Bogs
7: Fens
11: Relict Wet Prairies
10: Oak Openings
9e: Non-native Species Predominate
9a: Lake Erie Coastal and Tributary Wetlands
9b: Hydrology result of Erosion Control Measures (Lake Erie)
9c: Hydrology unrestricted
9d: Native Species Predominate
NO YES
YES
YES
YES
YES
YES
YES
YES
YES
YES
YES
YES
YES
YES
YES
YES
NO
NO
NO
NO
NO
NO
NO
NO
NO
NO
NO
NO
NO
NO
NO

ORAM v. 5.0 Field Form Quantitative Rating
Site: May 8, 2013
CMS
1 1 Metric 1. Wetland Area (size). (max 6 pts)Subtotal Points Select one size class and assign score.
1 >50 acres (>20.2ha) (6 pts)25 to <50 acres (10.1 to <20.2ha) (5 pts)10 to <25 acres (4 to <10.1ha) (4 pts) 3 to <10 acres (1.2 to <4ha) (3 pts) 0.3 to <3 acres (0.12 to <1.2ha) (2pts)
1 X 0.1 to <0.3 acres (0.04 to <0.12ha) (1 pt) <0.1 acres (0.04ha) (0 pts)
4 3 Metric 2. Upland buffers and surrounding land use. (max 14 pts)Subtotal Points 2a. Calculate average buffer width (select one, do not double check)
3 WIDE. Buffers average 50m (164ft) or more around wetland perimeter (7)
MEDIUM. Buffers average 25m to <50m (82 to <164ft) around wetland perimeter (4)3 2b NARROW. Buffers average 10m to <25m (32ft to <82ft) around wetland perimeter (1)
0 X VERY NARROW. Buffers average <10m (<32ft) around wetland perimeter (0)
2b. Intensity of surrounding land use (select one or double check & average) VERY LOW. 2nd growth or older forest, prairie, savannah, wildlife area, etc. (7)LOW. Old field (>10 years), shrubland, young second growth forest. (5)
3 X MODERATELY HIGH. Residential, fenced pasture, park, conservation tillage, new fallow field. (3)HIGH. Urban, industrial, open pasture, row cropping, mining, construction. (1)
14 10 Metric 3. Hydrology. (max 30 pts)Subtotal Points 3a. Sources of Water. Score all that apply. 3b. Connectivity. Score all that apply.
10 High pH groundwater (5) 100 year floodplain (1)
Other groundwater (3) Between stream/lake and other human use (1)3 3d 1 X Precipitation (1) Part of wetland/upland (e.g. forest), complex (1)3 3e Seasonal/Intermittent surface water (3) 1 X Part of riparian or upland corridor (1)
Perennial surface water (lake or stream) (5)
3d. Duration inundation/saturation. 3c. Maximum water depth. Select only 1. (select one or double check & average)
>0.7 (27.6in) (3) Semi- to permanently inundated/saturated (4)
2 X 0.4 to 0.7m (15.7 to 27.6in) (2) 3 X Regularly inundated/saturated (3)<0.4m (<15.7in) (1) Seasonally inundated (2)
Seasonally saturated in upper 30cm (12in) (1)3e. Modifications to natural hydrologic regime.
(select one or double check & average) None or none apparent (12)Recovered (7)
3 X Recovering (3) Recent or no recovery (1)
22 8 Metric 4. Habitat Alteration and Development. (max 20 pts.)
Subtotal Points 4a. Substrate disturbance. Score one or double check and average.8 None or none apparent (4)
Recovered (3) 4c. Habitat alteration. Score one or double check and average. 2 4a 2 X Recovering (2) None or none apparent (9)
3 4c Recent or no recovery (1) Recovered (6)
3 X Recovering (3)
4b. Habitat development. Select one. Recent or no recovery (1)
Excellent (7)
Very good (6)
Good (5)
Moderately good (4)
3 X Fair (3)
Poor to fair (2)
Poor (1)
22 subtotal this page
Groves-Bexley 138kV T-Line Date:Wetland 5Wetland: Rater:
Check all disturbances observed
Check all disturbances observedditch
tile
stormwater input other- list
road bed/RR track
dikepoint source (nonstormwater)
dredgingweir
filling/grading
selective cutting
mowing
clearcuttinggrazing
farming
nutrient emrichment
sedimentationherbaceous/aquatic bed removal
dredging
shrub/sapling removal
toxic pollutantswoody debris removal

ORAM v. 5.0 Field Form Quantitative Rating
Site: Date: May 8, 2013
CMS
22 subtotal first page
22 0 Metric 5. Special Wetlands. (max 10 pts.)Subtotal Points Check all that apply and score as indicated
0 Bog (10 pts)
Fen (10 pts)
Old Growth Forest (10 pts)
Mature forested wetland (5 pts)
Lake Erie coastal/tributary wetland-unrestricted hydrology (10 pts)
Lake Erie coastal/tributary wetland-restricted hydrology (5 pts)
Lake Plain Sand Prairies (Oak Openings) (10 pts)
Relict Wet Prairies (10 pts)
Known occurrence state/federal threatened or endangered species (10)
Significant migatory songbird/waterfowl habitat or usage (10 pts)
Category 1 Wetland. See Question 1 of Qualitative Rating. (-10 pts)
25 3 Metric 6. Plant Communities, interspersion, microtopography. (max 20 pts.)Subtotal Points 6a. Wetland Vegetation Communities
3 Score all present using 0 to 3 scale
Aquatic bed 0
Emergent
Shrub
2 Forest
Mudflats
Open water
6b. Horizontal (plan view) interspersionSelect only one
High (5)
Moderately high (4)
Moderate (3)
2 X Moderately low (2)
Low (1)
None (0)
6c. Coverage of invasive plants.
Extensive >75 % cover (-5)
Moderate 25-75% cover (-3)
-1 X Sparse 5-25% cover (-1)
Nearly Absent <5% cover (0) 0
Absent (1) 1
2
6d. Microtopography 3
Score all present using 0 to 3 scale
Vegetated hummocks/tussocks
Coarse woody debris >15 cm (6") 0
Standing dead > 25 cm (10") dbh
Amphibian breeding pools
25 GRAND TOTAL (max 100 pts) Category 1
Narrative Description of Vegetation Quality
Other (list)
Vegetation Community Cover ScaleAbsent or comprises <0.1 ha (0.2471 acres) contiguous area
Present and either comprises small part of wetland's vegetation and is of moderate quality, or comprises a significant part but is of low quality
Present and either comprises significant part of wetland's vegetation and is of moderate quality or comprises a small part and is of high quality
Groves-Bexley 138kV T-Line
Present and comprises significant part, or more, of wetland's vegetation and is of high quality
1
2
3
Wetland: Wetland 5 Rater:
2
lowLow spp diversity and/or predominance of nonnative or disturbance tolerant native species
Absent <0.1 ha (0.2471 acres)
Low 0.1 ha to <1 ha (0.2471 acres to 2.47 acres)
moderate
A predominance of native species, with nonnative spp and/or disturbance tolerant native spp absent or virtually absent, and high spp diversity and often, but not always, the presence of rare, threatened, or endangered spp
high
Native spp are dominant component of the vegetation, although nonnative and/or disturbance tolerant native spp can also be present, and species diversity moderate to moderately high, but generally w/o presence of rare threatened or endangered spp
Provisional Wetland Category:
Refer to Table 1 ORAM long form for list.
Add or deduct points for coverage
High 4 ha (9.88 acres) or more
Microtopography Cover Scale
Mudflat and Open Water Class Quality
Moderate 1 ha to <4 ha (2.47 acres 9.88 acres)
3 Present in moderate or greater amounts and of highest quality
Absent
Present very small amounts or if more common of marginal quality
1
Present in moderate amounts, but not of highest quality or in small amounts of highest quality

Name: Date: May 7, 2013
UTM
Wetland 5
Background Information Form – ORAM v.5.0
Background Information FormCMS
User Address:
Affiliation:
1 South Main Street, Akron, Ohio 44308
BHE Environmental, Inc.
Wetland Size (acres)
Phone:
e-mail address
Wetlands Name
Location of Wetlands including address if available
39.969702°, -82.904150°
234-678-8889
Site Visit
Sources of information used(check all that apply)
Aerial Photo
Hydrologic Unit CodeUSGS Quad
Category 125
How was size estimated?
ODNR - DNAP
Delineation Report/Map
Wetlands Delineation
0.117727
Soil Survey
NWI MapOWI Map
5060001USGS Topo
Photograph
final score: Provisional Wetland Category:

ORAM v.5.0 Field Form – Narrative Rating
Name: Date: May 8, 2013
Narrative Rating Questions
Wetlands Name Wetland 5
8a: “Old Growth Forest”
8b: Mature Forested Wetlands
3: Documented High Quality Wetland
4: Significant Breeding or Concentration Area (waterfowl)
1: Critical Habitat2: Threatened or Endangered Species
CMS
5: Category 1 Wetlands (hydrologically isolated)
6: Bogs
7: Fens
11: Relict Wet Prairies
10: Oak Openings
9e: Non-native Species Predominate
9a: Lake Erie Coastal and Tributary Wetlands
9b: Hydrology result of Erosion Control Measures (Lake Erie)
9c: Hydrology unrestricted
9d: Native Species Predominate
NO YES
YES
YES
YES
YES
YES
YES
YES
YES
YES
YES
YES
YES
YES
YES
YES
NO
NO
NO
NO
NO
NO
NO
NO
NO
NO
NO
NO
NO
NO
NO
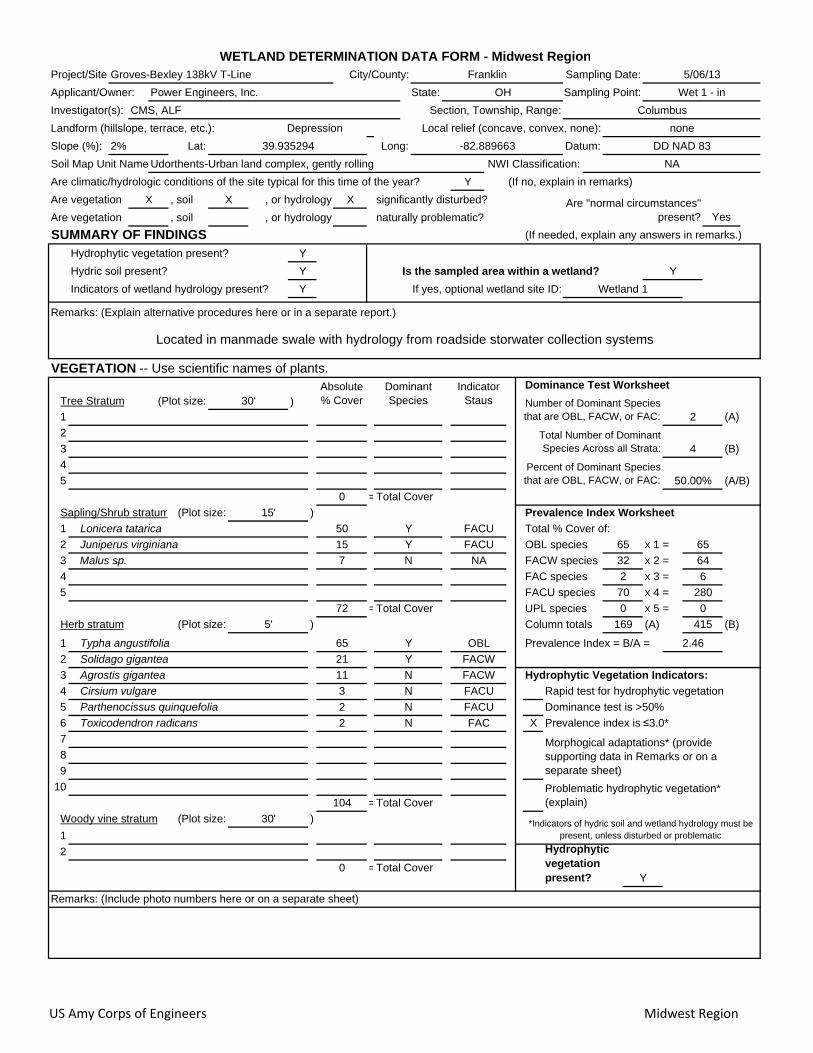
Project/Site
Slope (%):
Are climatic/hydrologic conditions of the site typical for this time of the year? (If no, explain in remarks)
Are vegetation , soil significantly disturbed?
Are vegetation , soil naturally problematic?
SUMMARY OF FINDINGSHydrophytic vegetation present?
Hydric soil present? Is the sampled area within a wetland?
Indicators of wetland hydrology present?
Remarks: (Explain alternative procedures here or in a separate report.)
Dominance Test Worksheet
)1 (A)
2
3 (B)
4
5 (A/B)
=Total Cover
Sapling/Shrub stratum ) Prevalence Index Worksheet
1 Total % Cover of:
2 OBL species x 1 =
3 FACW species x 2 =
4 FAC species x 3 =
5 FACU species x 4 =
=Total Cover UPL species x 5 =
Herb stratum ) Column totals (A) (B)
1 Prevalence Index = B/A =
2
3 Hydrophytic Vegetation Indicators:
4 Rapid test for hydrophytic vegetation
5 Dominance test is >50%
6 X Prevalence index is ≤3.0*
7
8
9
10
=Total Cover
Woody vine stratum )
1
2
=Total Cover
Remarks: (Include photo numbers here or on a separate sheet)
Number of Dominant Species that are OBL, FACW, or FAC:
Total Number of Dominant Species Across all Strata:
Percent of Dominant Species that are OBL, FACW, or FAC:
0
WETLAND DETERMINATION DATA FORM - Midwest RegionCity/County: Franklin Sampling Date:
*Indicators of hydric soil and wetland hydrology must be present, unless disturbed or problematic
5/06/13
Sampling Point: Wet 1 - inOH
Local relief (concave, convex, none): none
Columbus
(If needed, explain any answers in remarks.)
NA
, or hydrology
, or hydrology
X
Groves-Bexley 138kV T-Line
Hydrophytic vegetation present?
(Plot size: 30'
104
(Plot size: 15'
Tree Stratum (Plot size:
DD NAD 83
FACW
32 64
Morphogical adaptations* (provide supporting data in Remarks or on a separate sheet)
Y
4
2
70 280
50.00%
Y
0
Toxicodendron radicans 2 N FAC
Cirsium vulgare 3 N FACU
Parthenocissus quinquefolia
FACU
Typha angustifolia 65 Y OBL
(Plot size: 5'
Solidago gigantea 21 Y FACW
Agrostis gigantea 11 N
7 N
65 65
2 6
72
2.46
169 415
Problematic hydrophytic vegetation* (explain)
0 0
2 N
Lonicera tatarica 50 Y FACU
15 Y
Absolute % Cover30'
Wetland 1If yes, optional wetland site ID:
Located in manmade swale with hydrology from roadside storwater collection systems
Y
Dominant Species
Indicator Staus
Y
Y
VEGETATION -- Use scientific names of plants.
Are "normal circumstances" present? Yes
Malus sp.FACUJuniperus virginiana
NA
Investigator(s): CMS, ALF
Landform (hillslope, terrace, etc.):
Applicant/Owner: Power Engineers, Inc. State:
Depression
Section, Township, Range:
Soil Map Unit Name
Y
Udorthents-Urban land complex, gently rolling NWI Classification:
2% Lat: Long:39.935294 Datum:-82.889663
X X
US Amy Corps of Engineers Midwest Region

Iron-Manganese Masses (F12) (LRR K, L, R)
Very Shallow Dark Surface (TF12)
X
Aquatic Fauna (B13)X True Aquatic Plants (B14) XX Hydrogen Sulfide Odor (C1)
XX Presence of Reduced Iron (C4)
X
X
10-20 10 YR 5/2 95 10 YR 5/6 5 C M clay silt loam gravel & channers
*Type: C = Concentration, D = Depletion, RM = Reduced Matrix, MS = Masked Sand Grains. **Location: PL = Pore Lining, M = Matrix
Indicators of wetland hydrology present?
Coast Prairie Redox (A16) (LRR K, L, R)Dark Surface (S7) (LRR K, L)
Sandy Gleyed Matrix (S4)Sandy Redox (S5)
Indicators for Problematic Hydric Soils:
Other (explain in remarks)
Stunted or Stressed Plants (D1)Geomorphic Position (D2)
Secondary Indicators (minimum of two required)
Yes
FAC-Neutral Test (D5) Iron Deposits (B5)
Drift Deposits (B3)
YWater table present? Yes X No Depth (inches): 12"
(includes capillary fringe)
Surface water present?
Yes X NoSaturation present? 0"
Depleted Dark Surface (F7)Redox Depressions (F8)
No X
Recent Iron Reduction in Tilled Soils (C6)
Depth (inches):
Thin Muck Surface (C7) Inundation Visible on Aerial Imagery (B7)Sparsely Vegetated Concave Surface (B8)
Field Observations:Depth (inches):
Crayfish Burrows (C8)Saturation Visible on Aerial Imagery (C9)
Depth (inches):
SOIL
Wetland Hydrology Indicators:
Saturation (A3)
HYDROLOGY
Surface Water (A1) Surface Soil Cracks (B6)High Water Table (A2)
2 cm Muck (A10)
5 cm Mucky Peat or Peat (S3)
Restrictive Layer (if observed):
Sediment Deposits (B2)
Histisol (A1)Histic Epipedon (A2)Black Histic (A3)Hydrogen Sulfide (A4)Stratified Layers (A5)
Primary Indicators (minimum of one is required; check all that apply)
Redox Dark Surface (F6)
Loamy Gleyed Matrix (F2)
Gauge or Well Data (D9)Other (Explain in Remarks)
Hydric Soil Indicators:
Describe recorded data (stream gauge, monitoring well, aerial photos, previous inspections), if available:
Remarks:
Water-Stained Leaves (B9)
Oxidized Rhizospheres on Living Roots (C3)
Drainage Patterns (B10)
Algal Mat or Crust (B4)
Stripped Matrix (S6)Loamy Mucky Mineral (F1)
*Indicators of hydrophytic vegetation and weltand hydrology must be present, unless disturbed or
problematic
Remarks:
Type:
Sandy Mucky Mineral (S1)
YHydric soil present?
Depleted Matrix (F3)Depleted Below Dark Surface (A11)Thick Dark Surface (A12)
Dry-Season Water Table (C2)Water Marks (B1)
5-10 10 YR 4/2 95 10YR 5/6 5 C M clay silt loam
0-5 10 YR 3/1 100 clay silt loam many fine roots
Sampling Point: Wet 1 - in
Depth (Inches)
Matrix Redox FeaturesTexture RemarksColor (moist) % Color (moist) % Type* Loc**
Profile Description: (Describe to the depth needed to document the indicator or confirm the absence of indicators.)
US Army Corps of Engineers Midwest Region

Project/Site
Slope (%):
Are climatic/hydrologic conditions of the site typical for this time of the year? (If no, explain in remarks)
Are vegetation , soil significantly disturbed?
Are vegetation , soil naturally problematic?
SUMMARY OF FINDINGSHydrophytic vegetation present?
Hydric soil present? Is the sampled area within a wetland?
Indicators of wetland hydrology present?
Remarks: (Explain alternative procedures here or in a separate report.)
Dominance Test Worksheet
)1 (A)
2
3 (B)
4
5 (A/B)
=Total Cover
Sapling/Shrub stratum ) Prevalence Index Worksheet
1 Total % Cover of:
2 OBL species x 1 =
3 FACW species x 2 =
4 FAC species x 3 =
5 FACU species x 4 =
=Total Cover UPL species x 5 =
Herb stratum ) Column totals (A) (B)
1 Prevalence Index = B/A =
2
3 Hydrophytic Vegetation Indicators:
4 Rapid test for hydrophytic vegetation
5 Dominance test is >50%
6 Prevalence index is ≤3.0*
7
8
9
10
=Total Cover
Woody vine stratum )
1
2
=Total Cover
Remarks: (Include photo numbers here or on a separate sheet)
Applicant/Owner: Power Engineers, Inc. State:
Depression
Section, Township, Range:
Soil Map Unit Name
Y
Udorthents-Urban land complex, gently rolling NWI Classification:
1% Lat: Long:39.935346 Datum:-82.889536
Investigator(s): CMS, ALF
Landform (hillslope, terrace, etc.):
Are "normal circumstances" present? Yes
Absolute % Cover30'
If yes, optional wetland site ID:N
Dominant Species
Indicator Staus Number of Dominant Species
that are OBL, FACW, or FAC:
N
N
VEGETATION -- Use scientific names of plants.
Lonicera tatarica 21 Y FACU
15 Y
36
Agrostis gigantea
(Plot size: 5'
Solidago canadensisPoa annua
FACUJuniperus virginiana
Solidago nemoralis NA
15 N
11 N
0 0
0 0
Achillea millefolium 14 N FACU
Trifolium hybridum
Cerastium fontanum 5 N FACU
Cirsium vulgare 3 N FACU
Problematic hydrophytic vegetation* (explain)
11
114
Morphogical adaptations* (provide supporting data in Remarks or on a separate sheet)
N
4
1
111 444
25.00%
3.32
168 558
0 0
N FACU
Y FACW
Y FACU
Hydrophytic vegetation present?
(Plot size: 30'
143
(Plot size: 15'
Tree Stratum (Plot size:
FACU
57
N
0
57
27
Total Number of Dominant Species Across all Strata:
Percent of Dominant Species that are OBL, FACW, or FAC:
0
WETLAND DETERMINATION DATA FORM - Midwest RegionCity/County: Franklin Sampling Date:
*Indicators of hydric soil and wetland hydrology must be present, unless disturbed or problematic
5/06/13
Sampling Point: SP-2 Wet 1 - outOH
Local relief (concave, convex, none): none
Columbus
(If needed, explain any answers in remarks.)
NA
, or hydrology
, or hydrology
Groves-Bexley 138kV T-Line
DD NAD 83
US Amy Corps of Engineers Midwest Region

Iron-Manganese Masses (F12) (LRR K, L, R)
Very Shallow Dark Surface (TF12)
Aquatic Fauna (B13)True Aquatic Plants (B14)Hydrogen Sulfide Odor (C1)
Presence of Reduced Iron (C4)
Sampling Point: SP-2 Wet 1 - out
Depth (Inches)
Matrix Redox FeaturesTexture RemarksColor (moist) % Color (moist) % Type* Loc**
Profile Description: (Describe to the depth needed to document the indicator or confirm the absence of indicators.)
0-6 10 YR 4/2 100 silt loam many fine roots
6-12 10 YR 4/3 100 silt loam
10 YR 6/8 20 C M
Loamy Gleyed Matrix (F2)
Gauge or Well Data (D9)Other (Explain in Remarks)
Hydric Soil Indicators:
Describe recorded data (stream gauge, monitoring well, aerial photos, previous inspections), if available:
Remarks:
Water-Stained Leaves (B9)
Oxidized Rhizospheres on Living Roots (C3)
Drainage Patterns (B10)
Algal Mat or Crust (B4)
Stripped Matrix (S6)Loamy Mucky Mineral (F1)
*Indicators of hydrophytic vegetation and weltand hydrology must be present, unless disturbed or
problematic
Remarks:
Type:
Sandy Mucky Mineral (S1)
NHydric soil present?
Depleted Matrix (F3)Depleted Below Dark Surface (A11)Thick Dark Surface (A12)
Dry-Season Water Table (C2)Water Marks (B1) Crayfish Burrows (C8)
Saturation Visible on Aerial Imagery (C9)
Depth (inches):
SOIL
Wetland Hydrology Indicators:
Saturation (A3)
HYDROLOGY
Surface Water (A1) Surface Soil Cracks (B6)High Water Table (A2)
2 cm Muck (A10)
5 cm Mucky Peat or Peat (S3)
Restrictive Layer (if observed):
Sediment Deposits (B2)
Histisol (A1)Histic Epipedon (A2)Black Histic (A3)Hydrogen Sulfide (A4)Stratified Layers (A5)
Primary Indicators (minimum of one is required; check all that apply)
Redox Dark Surface (F6)
(includes capillary fringe)
Surface water present?
Yes NoSaturation present? 0"X
Depleted Dark Surface (F7)Redox Depressions (F8)
No X
Recent Iron Reduction in Tilled Soils (C6)
Depth (inches):
Thin Muck Surface (C7) Inundation Visible on Aerial Imagery (B7)Sparsely Vegetated Concave Surface (B8)
Field Observations:Depth (inches):
FAC-Neutral Test (D5) Iron Deposits (B5)
Drift Deposits (B3)
NWater table present? Yes No X Depth (inches): 12"
*Type: C = Concentration, D = Depletion, RM = Reduced Matrix, MS = Masked Sand Grains. **Location: PL = Pore Lining, M = Matrix
Indicators of wetland hydrology present?
Coast Prairie Redox (A16) (LRR K, L, R)Dark Surface (S7) (LRR K, L)
Sandy Gleyed Matrix (S4)Sandy Redox (S5)
Indicators for Problematic Hydric Soils:
Other (explain in remarks)
Stunted or Stressed Plants (D1)Geomorphic Position (D2)
Secondary Indicators (minimum of two required)
Yes
12-20 10 YR 3/1 60 10 YR 7/3 20 D M clay silt loam gravel & channers
US Army Corps of Engineers Midwest Region

Project/Site
Slope (%):
Are climatic/hydrologic conditions of the site typical for this time of the year? (If no, explain in remarks)
Are vegetation , soil significantly disturbed?
Are vegetation , soil naturally problematic?
SUMMARY OF FINDINGSHydrophytic vegetation present?
Hydric soil present? Is the sampled area within a wetland?
Indicators of wetland hydrology present?
Remarks: (Explain alternative procedures here or in a separate report.)
Dominance Test Worksheet
)1 (A)
2
3 (B)
4
5 (A/B)
=Total Cover
Sapling/Shrub stratum ) Prevalence Index Worksheet
1 Total % Cover of:
2 OBL species x 1 =
3 FACW species x 2 =
4 FAC species x 3 =
5 FACU species x 4 =
=Total Cover UPL species x 5 =
Herb stratum ) Column totals (A) (B)
1 Prevalence Index = B/A =
2
3 Hydrophytic Vegetation Indicators:
4 Rapid test for hydrophytic vegetation
5 X Dominance test is >50%
6 X Prevalence index is ≤3.0*
7
8
9
10
=Total Cover
Woody vine stratum )
1
2
=Total Cover
Remarks: (Include photo numbers here or on a separate sheet)
Investigator(s): CMS, ALF
Landform (hillslope, terrace, etc.):
Applicant/Owner: Power Engineers, Inc. State:
Depression
Section, Township, Range:
Soil Map Unit Name
Y
Bennington-Urban land complex, 0 to 2 percent slopes NWI Classification:
3% Lat: Long:N 39.952603° Datum:W 82.901627°
X X
Y
Y
VEGETATION -- Use scientific names of plants.
Are "normal circumstances" present? Yes
Absolute % Cover30'
Wetland 2If yes, optional wetland site ID:
The sampled are contains disturbed vegetation and soils due to associate land use. The sampled area has been determined to be a wetland.
Y
Populus deltoides 11 Y FAC
Dominant Species
Indicator Staus
Ulmus americana 5 Y FACW
Acer saccharinum 7 Y FACW
Acer negundo 11 Y FAC
Salix nigra 7 Y OBL
Lonicera japonica 5 Y FACU
71 71
31 93
23
1.84
164 302
Problematic hydrophytic vegetation* (explain)
0 0
9 N FAC
Veronica anagallis-aquatica 53 Y OBL
(Plot size: 5'
Geum aleppicum 21 Y FACW
Dichanthelium clandestinum 13 N
Solidago gigantea 7 N FACW
Carex lurida 11 N OBL
Toxicodendron radicans
Y
Rubus allegheniensis 2 Y FACU
Vitis riparia 2 Y FACW
4
Groves-Bexley 138kV T-Line
Hydrophytic vegetation present?
(Plot size: 30'
114
(Plot size: 15'
Tree Stratum (Plot size:
DD NAD 83
FACW
55 110
Morphogical adaptations* (provide supporting data in Remarks or on a separate sheet)
Y
10
9
7 28
90.00%
Hydrophytic vegetation is present.
Number of Dominant Species that are OBL, FACW, or FAC:
Total Number of Dominant Species Across all Strata:
Percent of Dominant Species that are OBL, FACW, or FAC:
23
WETLAND DETERMINATION DATA FORM - Midwest RegionCity/County: Franklin Sampling Date:
*Indicators of hydric soil and wetland hydrology must be present, unless disturbed or problematic
5/06/13
Sampling Point: SP-3 Wet 2 - inOH
Local relief (concave, convex, none): concave
Columbus
(If needed, explain any answers in remarks.)
NA
, or hydrology
, or hydrology
X
US Amy Corps of Engineers Midwest Region

Iron-Manganese Masses (F12) (LRR K, L, R)
Very Shallow Dark Surface (TF12)
X
Aquatic Fauna (B13)True Aquatic Plants (B14)Hydrogen Sulfide Odor (C1)
Presence of Reduced Iron (C4) X
X
Sampling Point: SP-3 Wet 2 - in
Depth (Inches)
Matrix Redox FeaturesTexture RemarksColor (moist) % Color (moist) % Type* Loc**
Profile Description: (Describe to the depth needed to document the indicator or confirm the absence of indicators.)
0-2 10YR 5/2 20 D M clay10YR 4/1 40
10YR 7/3 20 C M clay
6-12 10YR 4/1 80 10YR 5/8 10 C M clay gravel and channers
Loamy Gleyed Matrix (F2)
Gauge or Well Data (D9)Other (Explain in Remarks)
Hydric Soil Indicators:
Describe recorded data (stream gauge, monitoring well, aerial photos, previous inspections), if available:
Remarks:
Water-Stained Leaves (B9)
Oxidized Rhizospheres on Living Roots (C3)
Drainage Patterns (B10)
Algal Mat or Crust (B4)
Stripped Matrix (S6)Loamy Mucky Mineral (F1)
*Indicators of hydrophytic vegetation and weltand hydrology must be present, unless disturbed or
problematic
Remarks:
Type:
Sandy Mucky Mineral (S1)
YHydric soil present?
Depleted Matrix (F3)Depleted Below Dark Surface (A11)Thick Dark Surface (A12)
Dry-Season Water Table (C2)Water Marks (B1) Crayfish Burrows (C8)
Saturation Visible on Aerial Imagery (C9)
Depth (inches): 12
SOIL
Wetland Hydrology Indicators:
Saturation (A3)
HYDROLOGY
Surface Water (A1) Surface Soil Cracks (B6)High Water Table (A2)
2 cm Muck (A10)
5 cm Mucky Peat or Peat (S3)
Restrictive Layer (if observed):
Sediment Deposits (B2)
Histisol (A1)Histic Epipedon (A2)Black Histic (A3)Hydrogen Sulfide (A4)Stratified Layers (A5)
Manmade harpan
Primary Indicators (minimum of one is required; check all that apply)
Redox Dark Surface (F6)
(includes capillary fringe)
Surface water present?
Yes NoSaturation present? X
Depleted Dark Surface (F7)Redox Depressions (F8)
No X
Recent Iron Reduction in Tilled Soils (C6)
Depth (inches):
Thin Muck Surface (C7) Inundation Visible on Aerial Imagery (B7)Sparsely Vegetated Concave Surface (B8)
Field Observations:Depth (inches):
FAC-Neutral Test (D5) Iron Deposits (B5)
Drift Deposits (B3)
YWater table present? Yes No X Depth (inches):
Wetland hydrology is present.
10YR 6/3 10 C M clay
*Type: C = Concentration, D = Depletion, RM = Reduced Matrix, MS = Masked Sand Grains. **Location: PL = Pore Lining, M = Matrix
Indicators of wetland hydrology present?
Coast Prairie Redox (A16) (LRR K, L, R)Dark Surface (S7) (LRR K, L)
Sandy Gleyed Matrix (S4)Sandy Redox (S5)
Indicators for Problematic Hydric Soils:
Other (explain in remarks)
Stunted or Stressed Plants (D1)Geomorphic Position (D2)
Secondary Indicators (minimum of two required)
Yes
2-6 10YR 5/2 90 10YR 5/6 10 C M clay abundant gravel
US Army Corps of Engineers Midwest Region
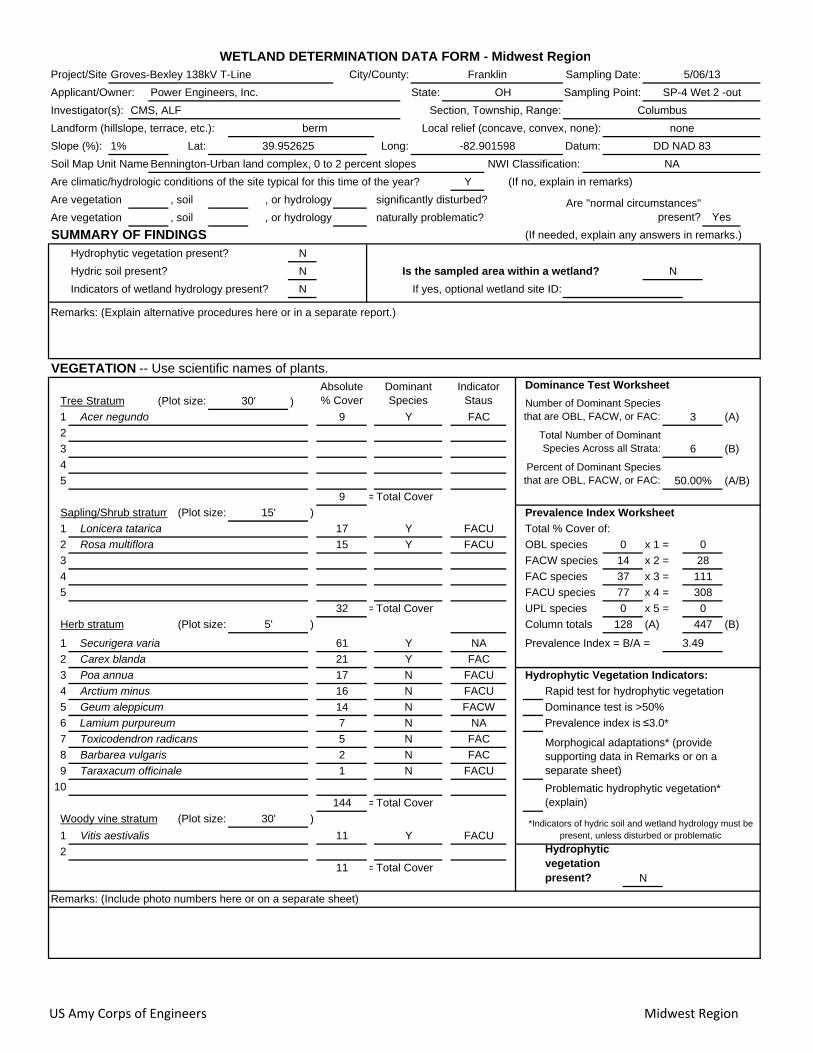
Project/Site
Slope (%):
Are climatic/hydrologic conditions of the site typical for this time of the year? (If no, explain in remarks)
Are vegetation , soil significantly disturbed?
Are vegetation , soil naturally problematic?
SUMMARY OF FINDINGSHydrophytic vegetation present?
Hydric soil present? Is the sampled area within a wetland?
Indicators of wetland hydrology present?
Remarks: (Explain alternative procedures here or in a separate report.)
Dominance Test Worksheet
)1 (A)
2
3 (B)
4
5 (A/B)
=Total Cover
Sapling/Shrub stratum ) Prevalence Index Worksheet
1 Total % Cover of:
2 OBL species x 1 =
3 FACW species x 2 =
4 FAC species x 3 =
5 FACU species x 4 =
=Total Cover UPL species x 5 =
Herb stratum ) Column totals (A) (B)
1 Prevalence Index = B/A =
2
3 Hydrophytic Vegetation Indicators:
4 Rapid test for hydrophytic vegetation
5 Dominance test is >50%
6 Prevalence index is ≤3.0*
7
8
9
10
=Total Cover
Woody vine stratum )
1
2
=Total Cover
Remarks: (Include photo numbers here or on a separate sheet)
N
N
VEGETATION -- Use scientific names of plants.
Acer negundo 9 Y FAC
Applicant/Owner: Power Engineers, Inc. State:
berm
Section, Township, Range:
Soil Map Unit Name
Y
Bennington-Urban land complex, 0 to 2 percent slopes NWI Classification:
1% Lat: Long:39.952625 Datum:-82.901598
Investigator(s): CMS, ALF
Landform (hillslope, terrace, etc.):
Absolute % Cover30'
If yes, optional wetland site ID:N
Dominant Species
Indicator Staus Number of Dominant Species
that are OBL, FACW, or FAC:
Lonicera tatarica 17 Y FACU
15 Y
32
(Plot size: 5'
Carex blandaPoa annua
FACURosa multiflora
Lamium purpureum NA
37 111
3.49
128 447
Problematic hydrophytic vegetation* (explain)
0 0
14 N FACW
61 Y NA
21 Y FAC
17 N
7 N
N
Vitis aestivalis 11 Y FACU
11
DD NAD 83
FACU
14 28
Morphogical adaptations* (provide supporting data in Remarks or on a separate sheet)
N
6
3
77 308
50.00%
FACU
FAC
FAC
FACU
0 0
Are "normal circumstances" present? Yes
Hydrophytic vegetation present?
(Plot size: 30'
144
Taraxacum officinale
(Plot size: 15'
Tree Stratum (Plot size:
Arctium minus 16 N
Geum aleppicum
Toxicodendron radicans 5 N
Barbarea vulgaris 2 N
1 N
Total Number of Dominant Species Across all Strata:
Percent of Dominant Species that are OBL, FACW, or FAC:
9
WETLAND DETERMINATION DATA FORM - Midwest RegionCity/County: Franklin Sampling Date:
*Indicators of hydric soil and wetland hydrology must be present, unless disturbed or problematic
5/06/13
Sampling Point: SP-4 Wet 2 -outOH
Local relief (concave, convex, none): none
Columbus
(If needed, explain any answers in remarks.)
NA
, or hydrology
, or hydrology
Securigera varia
Groves-Bexley 138kV T-Line
US Amy Corps of Engineers Midwest Region

Iron-Manganese Masses (F12) (LRR K, L, R)
Very Shallow Dark Surface (TF12)
Aquatic Fauna (B13)True Aquatic Plants (B14)Hydrogen Sulfide Odor (C1)
Presence of Reduced Iron (C4)
Sampling Point: SP-4 Wet 2 -out
Depth (Inches)
Matrix Redox FeaturesTexture RemarksColor (moist) % Color (moist) % Type* Loc**
Profile Description: (Describe to the depth needed to document the indicator or confirm the absence of indicators.)
0-2.5 10 YR 2/1 100 silt loam many fine roots
2.5-9 10 YR 3/1 80 silt loam
9-16 10 YR 2/1 70
10 YR 3/2 5 silt loam abundant gravel and channers
Loamy Gleyed Matrix (F2)
Gauge or Well Data (D9)Other (Explain in Remarks)
Hydric Soil Indicators:
Describe recorded data (stream gauge, monitoring well, aerial photos, previous inspections), if available:
Remarks:
Water-Stained Leaves (B9)
Oxidized Rhizospheres on Living Roots (C3)
Drainage Patterns (B10)
Algal Mat or Crust (B4)
Stripped Matrix (S6)Loamy Mucky Mineral (F1)
*Indicators of hydrophytic vegetation and weltand hydrology must be present, unless disturbed or
problematic
Remarks:
Type:
Sandy Mucky Mineral (S1)
NHydric soil present?
Depleted Matrix (F3)Depleted Below Dark Surface (A11)Thick Dark Surface (A12)
Dry-Season Water Table (C2)Water Marks (B1) Crayfish Burrows (C8)
Saturation Visible on Aerial Imagery (C9)
Depth (inches): 16"
SOIL
Wetland Hydrology Indicators:
Saturation (A3)
HYDROLOGY
Surface Water (A1) Surface Soil Cracks (B6)High Water Table (A2)
2 cm Muck (A10)
5 cm Mucky Peat or Peat (S3)
Restrictive Layer (if observed):
Sediment Deposits (B2)
Histisol (A1)Histic Epipedon (A2)Black Histic (A3)Hydrogen Sulfide (A4)Stratified Layers (A5)
Manmad hardpan
Primary Indicators (minimum of one is required; check all that apply)
Redox Dark Surface (F6)
(includes capillary fringe)
Surface water present?
Yes NoSaturation present? X
Depleted Dark Surface (F7)Redox Depressions (F8)
No X
Recent Iron Reduction in Tilled Soils (C6)
Depth (inches):
Thin Muck Surface (C7) Inundation Visible on Aerial Imagery (B7)Sparsely Vegetated Concave Surface (B8)
Field Observations:Depth (inches):
FAC-Neutral Test (D5) Iron Deposits (B5)
Drift Deposits (B3)
NWater table present? Yes No X Depth (inches):
10 YR 3/3 15
*Type: C = Concentration, D = Depletion, RM = Reduced Matrix, MS = Masked Sand Grains. **Location: PL = Pore Lining, M = Matrix
Indicators of wetland hydrology present?
Coast Prairie Redox (A16) (LRR K, L, R)Dark Surface (S7) (LRR K, L)
Sandy Gleyed Matrix (S4)Sandy Redox (S5)
Indicators for Problematic Hydric Soils:
Other (explain in remarks)
Stunted or Stressed Plants (D1)Geomorphic Position (D2)
Secondary Indicators (minimum of two required)
Yes
10 YR 3/3 20
US Army Corps of Engineers Midwest Region
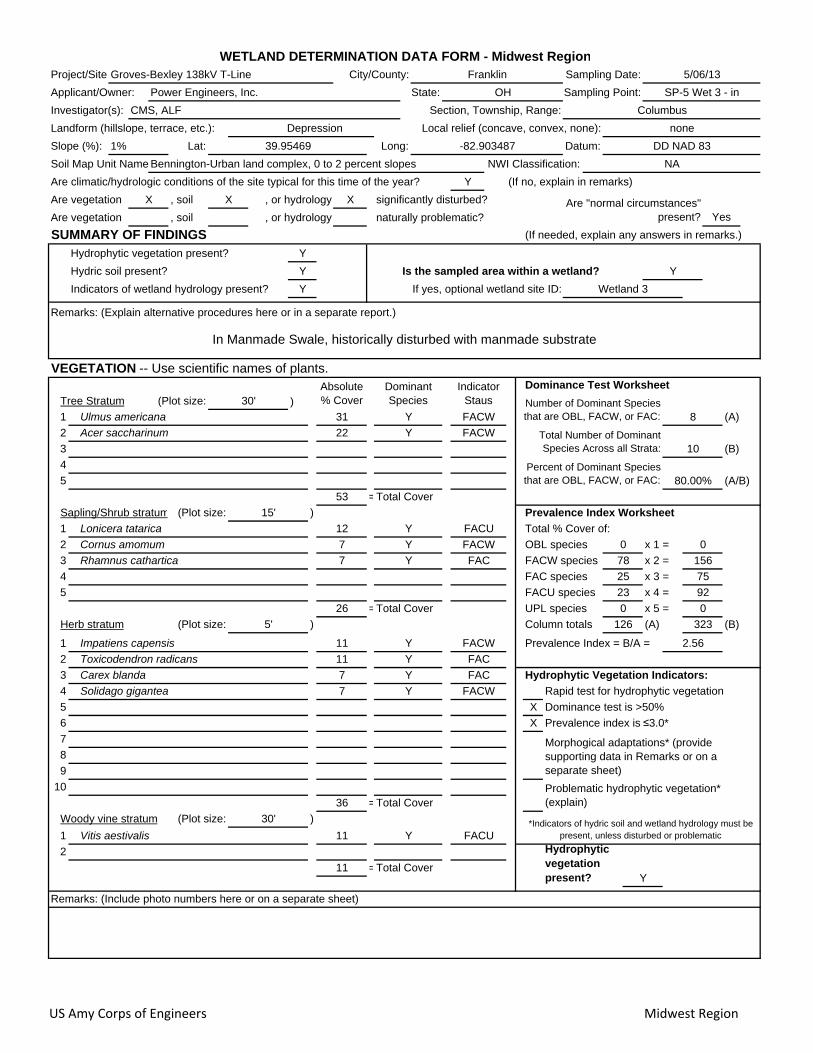
Project/Site
Slope (%):
Are climatic/hydrologic conditions of the site typical for this time of the year? (If no, explain in remarks)
Are vegetation , soil significantly disturbed?
Are vegetation , soil naturally problematic?
SUMMARY OF FINDINGSHydrophytic vegetation present?
Hydric soil present? Is the sampled area within a wetland?
Indicators of wetland hydrology present?
Remarks: (Explain alternative procedures here or in a separate report.)
Dominance Test Worksheet
)1 (A)
2
3 (B)
4
5 (A/B)
=Total Cover
Sapling/Shrub stratum ) Prevalence Index Worksheet
1 Total % Cover of:
2 OBL species x 1 =
3 FACW species x 2 =
4 FAC species x 3 =
5 FACU species x 4 =
=Total Cover UPL species x 5 =
Herb stratum ) Column totals (A) (B)
1 Prevalence Index = B/A =
2
3 Hydrophytic Vegetation Indicators:
4 Rapid test for hydrophytic vegetation
5 X Dominance test is >50%
6 X Prevalence index is ≤3.0*
7
8
9
10
=Total Cover
Woody vine stratum )
1
2
=Total Cover
Remarks: (Include photo numbers here or on a separate sheet)
Total Number of Dominant Species Across all Strata:
Percent of Dominant Species that are OBL, FACW, or FAC:
53
WETLAND DETERMINATION DATA FORM - Midwest RegionCity/County: Franklin Sampling Date:
*Indicators of hydric soil and wetland hydrology must be present, unless disturbed or problematic
5/06/13
Sampling Point: SP-5 Wet 3 - inOH
Local relief (concave, convex, none): none
Columbus
(If needed, explain any answers in remarks.)
NA
, or hydrology
, or hydrology
X
Groves-Bexley 138kV T-Line
Hydrophytic vegetation present?
(Plot size: 30'
36
(Plot size: 15'
Tree Stratum (Plot size:
DD NAD 83
FAC
78 156
Morphogical adaptations* (provide supporting data in Remarks or on a separate sheet)
Y
10
8
23 92
80.00%
Y
Vitis aestivalis 11 Y FACU
11
Solidago gigantea 7 Y FACW
2.56
126 323
Problematic hydrophytic vegetation* (explain)
0 0
11 Y FACW
11 Y FAC
7 Y
0 0
25 75
Lonicera tatarica 12 Y FACU
7 Y
7 Y
26
Impatiens capensis
(Plot size: 5'
Toxicodendron radicansCarex blanda
Acer saccharinum 22 Y FACW
Are "normal circumstances" present? Yes
Absolute % Cover30'
Wetland 3If yes, optional wetland site ID:
In Manmade Swale, historically disturbed with manmade substrate
Y
Dominant Species
Indicator Staus Number of Dominant Species
that are OBL, FACW, or FAC:
Applicant/Owner: Power Engineers, Inc. State:
Depression
Section, Township, Range:
Soil Map Unit Name
Y
Bennington-Urban land complex, 0 to 2 percent slopes NWI Classification:
1% Lat: Long:39.95469 Datum:-82.903487
Rhamnus catharticaFACWCornus amomumFAC
Investigator(s): CMS, ALF
Landform (hillslope, terrace, etc.):
X X
Y
Y
VEGETATION -- Use scientific names of plants.
Ulmus americana 31 Y FACW
US Amy Corps of Engineers Midwest Region

Iron-Manganese Masses (F12) (LRR K, L, R)
Very Shallow Dark Surface (TF12)
X
Aquatic Fauna (B13)X True Aquatic Plants (B14) XX Hydrogen Sulfide Odor (C1) XX
Presence of Reduced Iron (C4) X X
XX
*Type: C = Concentration, D = Depletion, RM = Reduced Matrix, MS = Masked Sand Grains. **Location: PL = Pore Lining, M = Matrix
Indicators of wetland hydrology present?
Coast Prairie Redox (A16) (LRR K, L, R)Dark Surface (S7) (LRR K, L)
Sandy Gleyed Matrix (S4)Sandy Redox (S5)
Indicators for Problematic Hydric Soils:
Other (explain in remarks)
Stunted or Stressed Plants (D1)Geomorphic Position (D2)
Secondary Indicators (minimum of two required)
Yes
FAC-Neutral Test (D5) Iron Deposits (B5)
Drift Deposits (B3)
YWater table present? Yes X No Depth (inches): 10"
(includes capillary fringe)
Surface water present?
Yes X NoSaturation present? 8"
Depleted Dark Surface (F7)Redox Depressions (F8)
No X
Recent Iron Reduction in Tilled Soils (C6)
Depth (inches):
Thin Muck Surface (C7) Inundation Visible on Aerial Imagery (B7)Sparsely Vegetated Concave Surface (B8)
Field Observations:Depth (inches):
Crayfish Burrows (C8)Saturation Visible on Aerial Imagery (C9)
Depth (inches): 12"
SOIL
Wetland Hydrology Indicators:
Saturation (A3)
HYDROLOGY
Surface Water (A1) Surface Soil Cracks (B6)High Water Table (A2)
2 cm Muck (A10)
5 cm Mucky Peat or Peat (S3)
Restrictive Layer (if observed):
Sediment Deposits (B2)
Histisol (A1)Histic Epipedon (A2)Black Histic (A3)Hydrogen Sulfide (A4)Stratified Layers (A5)
Manmade hardpan
Primary Indicators (minimum of one is required; check all that apply)
Redox Dark Surface (F6)
Loamy Gleyed Matrix (F2)
Gauge or Well Data (D9)Other (Explain in Remarks)
Hydric Soil Indicators:
Describe recorded data (stream gauge, monitoring well, aerial photos, previous inspections), if available:
Remarks:
Water-Stained Leaves (B9)
Oxidized Rhizospheres on Living Roots (C3)
Drainage Patterns (B10)
Algal Mat or Crust (B4)
Stripped Matrix (S6)Loamy Mucky Mineral (F1)
*Indicators of hydrophytic vegetation and weltand hydrology must be present, unless disturbed or
problematic
Remarks:
Type:
Sandy Mucky Mineral (S1)
YHydric soil present?
Depleted Matrix (F3)Depleted Below Dark Surface (A11)Thick Dark Surface (A12)
Dry-Season Water Table (C2)Water Marks (B1)
6-12 10 YR 5/1 100 clay loam gravel & channers
0-6 10 YR 2/1 90 10 YR 5/1 10 D M clay loam many fine roots
Sampling Point: SP-5 Wet 3 - in
Depth (Inches)
Matrix Redox FeaturesTexture RemarksColor (moist) % Color (moist) % Type* Loc**
Profile Description: (Describe to the depth needed to document the indicator or confirm the absence of indicators.)
US Army Corps of Engineers Midwest Region

Project/Site
Slope (%):
Are climatic/hydrologic conditions of the site typical for this time of the year? (If no, explain in remarks)
Are vegetation , soil significantly disturbed?
Are vegetation , soil naturally problematic?
SUMMARY OF FINDINGSHydrophytic vegetation present?
Hydric soil present? Is the sampled area within a wetland?
Indicators of wetland hydrology present?
Remarks: (Explain alternative procedures here or in a separate report.)
Dominance Test Worksheet
)1 (A)
2
3 (B)
4
5 (A/B)
=Total Cover
Sapling/Shrub stratum ) Prevalence Index Worksheet
1 Total % Cover of:
2 OBL species x 1 =
3 FACW species x 2 =
4 FAC species x 3 =
5 FACU species x 4 =
=Total Cover UPL species x 5 =
Herb stratum ) Column totals (A) (B)
1 Prevalence Index = B/A =
2
3 Hydrophytic Vegetation Indicators:
4 Rapid test for hydrophytic vegetation
5 X Dominance test is >50%
6 Prevalence index is ≤3.0*
7
8
9
10
=Total Cover
Woody vine stratum )
1
2
=Total Cover
Remarks: (Include photo numbers here or on a separate sheet)
Applicant/Owner: Power Engineers, Inc. State:
Depression
Section, Township, Range:
Soil Map Unit Name
Y
Bennington-Urban land complex, 0 to 2 percent slopes NWI Classification:
1% Lat: Long:39.958175 Datum:-82.904966
Investigator(s): CMS, ALF
Landform (hillslope, terrace, etc.):
Are "normal circumstances" present? Yes
Absolute % Cover30'
Wetland 4If yes, optional wetland site ID:
In manmade swale, with manmade hardpan, historically disturbed.
Y
Dominant Species
Indicator Staus Number of Dominant Species
that are OBL, FACW, or FAC:
X X
Y
Y
VEGETATION -- Use scientific names of plants.
Juglans nigra 11 Y FACU
Fraxinus pennsylvanica 7 Y FACW
Lonicera tatarica 15 Y FACU
5 Y
3 N
23
Hemerocallis fulva
(Plot size: 5'
Phalaris arundinaceaSolidago gigantea
Cornus amomumFACUJuglans nigraFACW
Viola sororia FAC
20 Y
3 N
0 0
15 45
Carex blanda 7 Y FAC
Toxicodendron radicans
Problematic hydrophytic vegetation* (explain)
5
100
Morphogical adaptations* (provide supporting data in Remarks or on a separate sheet)
Y
9
5
31 124
55.56%
3.45
136 469
40 200
Y FAC
Y UPL
Y FACW
Hydrophytic vegetation present?
(Plot size: 30'
95
(Plot size: 15'
Tree Stratum (Plot size:
FACW
50
Y
0
40
20
Total Number of Dominant Species Across all Strata:
Percent of Dominant Species that are OBL, FACW, or FAC:
18
WETLAND DETERMINATION DATA FORM - Midwest RegionCity/County: Franklin Sampling Date:
*Indicators of hydric soil and wetland hydrology must be present, unless disturbed or problematic
5/06/13
Sampling Point: SP-6 Wet 4 - inOH
Local relief (concave, convex, none): none
Columbus
(If needed, explain any answers in remarks.)
NA
, or hydrology
, or hydrology
X
Groves-Bexley 138kV T-Line
DD NAD 83
US Amy Corps of Engineers Midwest Region
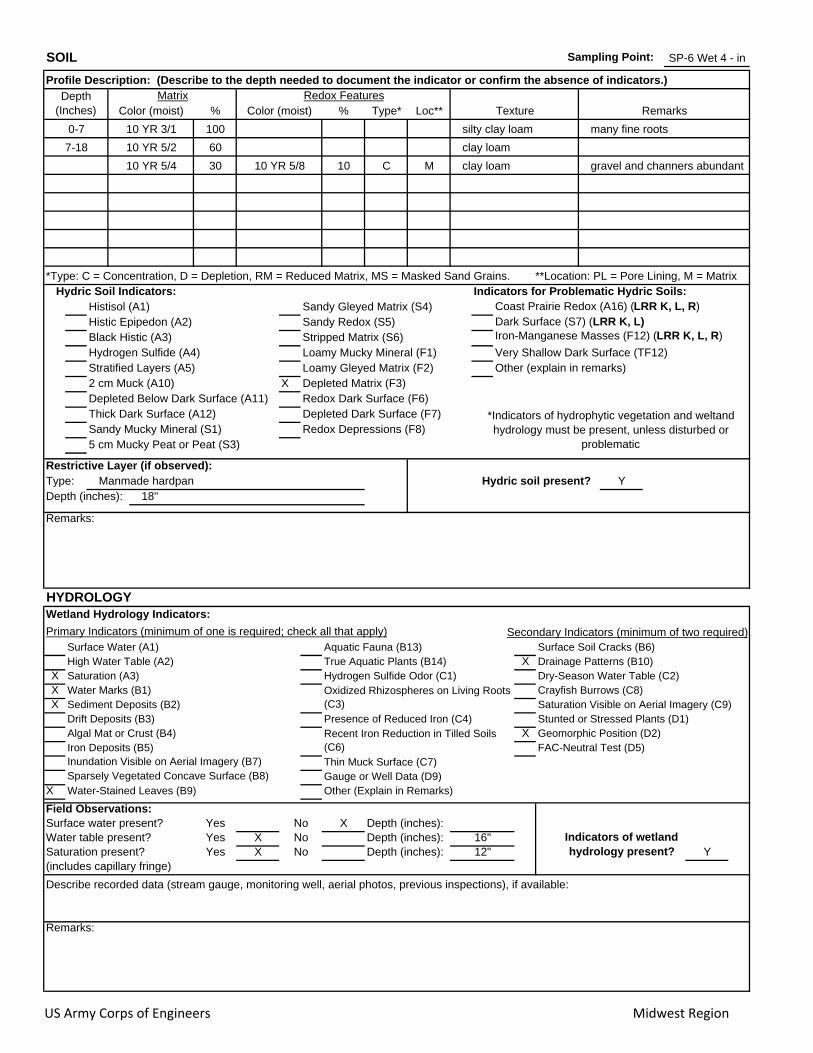
Iron-Manganese Masses (F12) (LRR K, L, R)
Very Shallow Dark Surface (TF12)
X
Aquatic Fauna (B13)True Aquatic Plants (B14) X
X Hydrogen Sulfide Odor (C1) XX
Presence of Reduced Iron (C4) X
X
Sampling Point: SP-6 Wet 4 - in
Depth (Inches)
Matrix Redox FeaturesTexture RemarksColor (moist) % Color (moist) % Type* Loc**
Profile Description: (Describe to the depth needed to document the indicator or confirm the absence of indicators.)
0-7 10 YR 3/1 100 silty clay loam many fine roots
7-18 10 YR 5/2 60 clay loam
Loamy Gleyed Matrix (F2)
Gauge or Well Data (D9)Other (Explain in Remarks)
Hydric Soil Indicators:
Describe recorded data (stream gauge, monitoring well, aerial photos, previous inspections), if available:
Remarks:
Water-Stained Leaves (B9)
Oxidized Rhizospheres on Living Roots (C3)
Drainage Patterns (B10)
Algal Mat or Crust (B4)
Stripped Matrix (S6)Loamy Mucky Mineral (F1)
*Indicators of hydrophytic vegetation and weltand hydrology must be present, unless disturbed or
problematic
Remarks:
Type:
Sandy Mucky Mineral (S1)
YHydric soil present?
Depleted Matrix (F3)Depleted Below Dark Surface (A11)Thick Dark Surface (A12)
Dry-Season Water Table (C2)Water Marks (B1) Crayfish Burrows (C8)
Saturation Visible on Aerial Imagery (C9)
Depth (inches): 18"
SOIL
Wetland Hydrology Indicators:
Saturation (A3)
HYDROLOGY
Surface Water (A1) Surface Soil Cracks (B6)High Water Table (A2)
2 cm Muck (A10)
5 cm Mucky Peat or Peat (S3)
Restrictive Layer (if observed):
Sediment Deposits (B2)
Histisol (A1)Histic Epipedon (A2)Black Histic (A3)Hydrogen Sulfide (A4)Stratified Layers (A5)
Manmade hardpan
Primary Indicators (minimum of one is required; check all that apply)
Redox Dark Surface (F6)
(includes capillary fringe)
Surface water present?
Yes X NoSaturation present? 12"
Depleted Dark Surface (F7)Redox Depressions (F8)
No X
Recent Iron Reduction in Tilled Soils (C6)
Depth (inches):
Thin Muck Surface (C7) Inundation Visible on Aerial Imagery (B7)Sparsely Vegetated Concave Surface (B8)
Field Observations:Depth (inches):
FAC-Neutral Test (D5) Iron Deposits (B5)
Drift Deposits (B3)
YWater table present? Yes X No Depth (inches): 16"
*Type: C = Concentration, D = Depletion, RM = Reduced Matrix, MS = Masked Sand Grains. **Location: PL = Pore Lining, M = Matrix
Indicators of wetland hydrology present?
Coast Prairie Redox (A16) (LRR K, L, R)Dark Surface (S7) (LRR K, L)
Sandy Gleyed Matrix (S4)Sandy Redox (S5)
Indicators for Problematic Hydric Soils:
Other (explain in remarks)
Stunted or Stressed Plants (D1)Geomorphic Position (D2)
Secondary Indicators (minimum of two required)
Yes
10 YR 5/4 30 10 YR 5/8 10 C M clay loam gravel and channers abundant
US Army Corps of Engineers Midwest Region
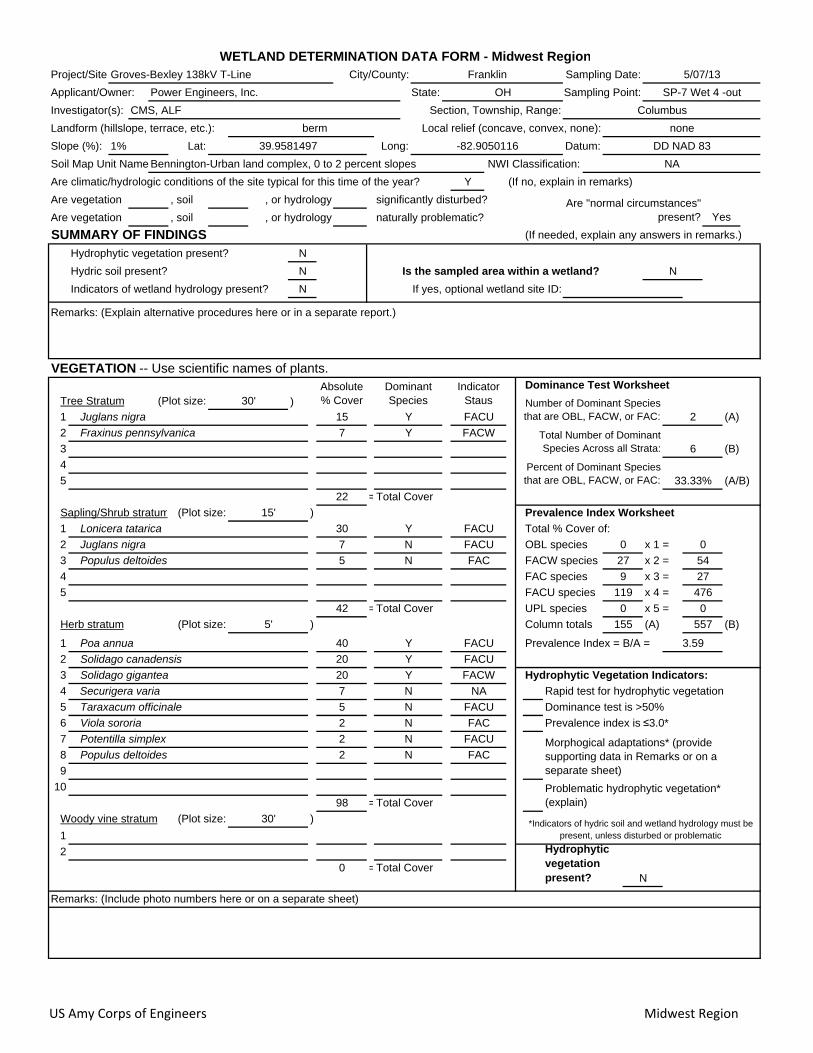
Project/Site
Slope (%):
Are climatic/hydrologic conditions of the site typical for this time of the year? (If no, explain in remarks)
Are vegetation , soil significantly disturbed?
Are vegetation , soil naturally problematic?
SUMMARY OF FINDINGSHydrophytic vegetation present?
Hydric soil present? Is the sampled area within a wetland?
Indicators of wetland hydrology present?
Remarks: (Explain alternative procedures here or in a separate report.)
Dominance Test Worksheet
)1 (A)
2
3 (B)
4
5 (A/B)
=Total Cover
Sapling/Shrub stratum ) Prevalence Index Worksheet
1 Total % Cover of:
2 OBL species x 1 =
3 FACW species x 2 =
4 FAC species x 3 =
5 FACU species x 4 =
=Total Cover UPL species x 5 =
Herb stratum ) Column totals (A) (B)
1 Prevalence Index = B/A =
2
3 Hydrophytic Vegetation Indicators:
4 Rapid test for hydrophytic vegetation
5 Dominance test is >50%
6 Prevalence index is ≤3.0*
7
8
9
10
=Total Cover
Woody vine stratum )
1
2
=Total Cover
Remarks: (Include photo numbers here or on a separate sheet)
Securigera varia NA
*Indicators of hydric soil and wetland hydrology must be present, unless disturbed or problematic
5/07/13
Sampling Point: SP-7 Wet 4 -outOH
Local relief (concave, convex, none): none
Columbus
(If needed, explain any answers in remarks.)
NA
33.33%
Total Number of Dominant Species Across all Strata:
Percent of Dominant Species that are OBL, FACW, or FAC:
22
WETLAND DETERMINATION DATA FORM - Midwest RegionCity/County: Franklin Sampling Date:
, or hydrology
, or hydrology
0
Groves-Bexley 138kV T-Line
Hydrophytic vegetation present?
(Plot size: 30'
98
(Plot size: 15'
Tree Stratum (Plot size:
DD NAD 83
FACW
27 54
Morphogical adaptations* (provide supporting data in Remarks or on a separate sheet)
N
6
2
119 476
Taraxacum officinale
Potentilla simplex 2 N FACU
Populus deltoides 2 N FAC
N
3.59
155 557
Problematic hydrophytic vegetation* (explain)
0 0
5 N FACU
40 Y FACU
20 Y FACU
20 Y
2 N
7 N
0 0
9 27
Lonicera tatarica 30 Y FACU
7 N
5 N
42
Poa annua
(Plot size: 5'
Solidago canadensisSolidago gigantea
Populus deltoidesFACUJuglans nigraFAC
Viola sororia FAC
Fraxinus pennsylvanica 7 Y FACW
Are "normal circumstances" present? Yes
Absolute % Cover30'
If yes, optional wetland site ID:N
Dominant Species
Indicator Staus Number of Dominant Species
that are OBL, FACW, or FAC:
N
N
VEGETATION -- Use scientific names of plants.
Juglans nigra 15 Y FACU
Applicant/Owner: Power Engineers, Inc. State:
berm
Section, Township, Range:
Soil Map Unit Name
Y
Bennington-Urban land complex, 0 to 2 percent slopes NWI Classification:
1% Lat: Long:39.9581497 Datum:-82.9050116
Investigator(s): CMS, ALF
Landform (hillslope, terrace, etc.):
US Amy Corps of Engineers Midwest Region
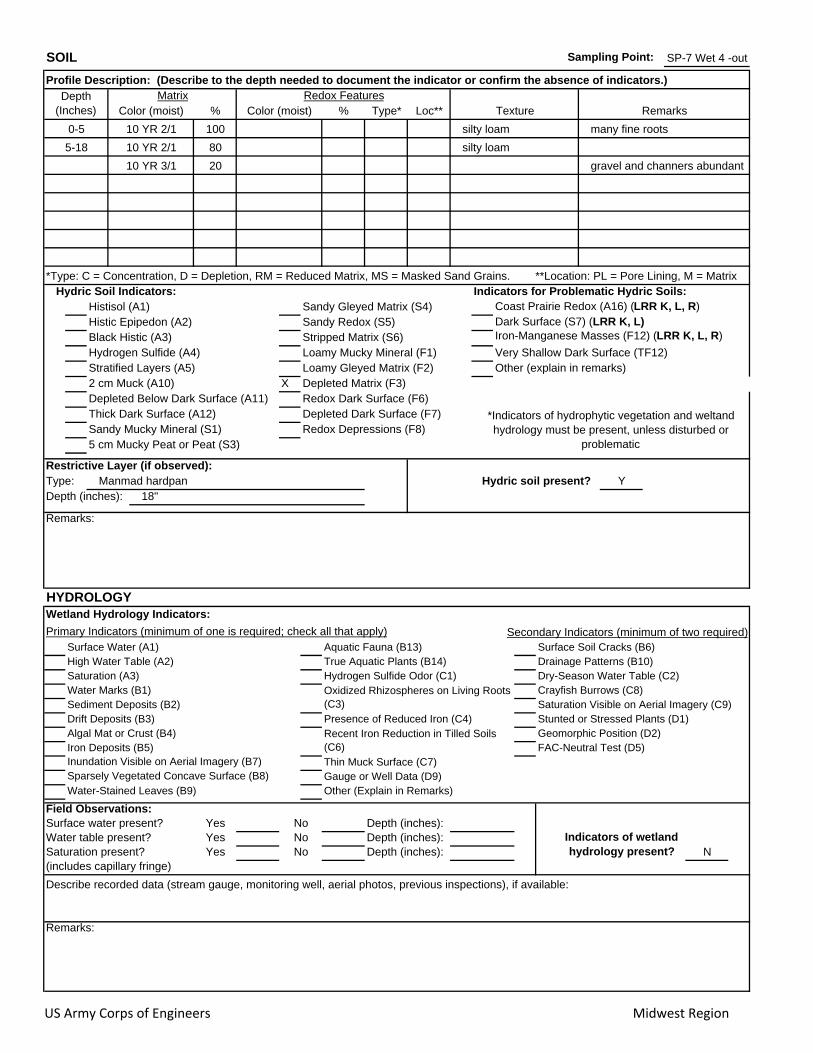
Iron-Manganese Masses (F12) (LRR K, L, R)
Very Shallow Dark Surface (TF12)
X
Aquatic Fauna (B13)True Aquatic Plants (B14)Hydrogen Sulfide Odor (C1)
Presence of Reduced Iron (C4)
10 YR 3/1 20 gravel and channers abundant
*Type: C = Concentration, D = Depletion, RM = Reduced Matrix, MS = Masked Sand Grains. **Location: PL = Pore Lining, M = Matrix
Indicators of wetland hydrology present?
Coast Prairie Redox (A16) (LRR K, L, R)Dark Surface (S7) (LRR K, L)
Sandy Gleyed Matrix (S4)Sandy Redox (S5)
Indicators for Problematic Hydric Soils:
Other (explain in remarks)
Stunted or Stressed Plants (D1)Geomorphic Position (D2)
Secondary Indicators (minimum of two required)
Yes
FAC-Neutral Test (D5) Iron Deposits (B5)
Drift Deposits (B3)
NWater table present? Yes No Depth (inches):
(includes capillary fringe)
Surface water present?
Yes NoSaturation present?
Depleted Dark Surface (F7)Redox Depressions (F8)
No
Recent Iron Reduction in Tilled Soils (C6)
Depth (inches):
Thin Muck Surface (C7) Inundation Visible on Aerial Imagery (B7)Sparsely Vegetated Concave Surface (B8)
Field Observations:Depth (inches):
Crayfish Burrows (C8)Saturation Visible on Aerial Imagery (C9)
Depth (inches): 18"
SOIL
Wetland Hydrology Indicators:
Saturation (A3)
HYDROLOGY
Surface Water (A1) Surface Soil Cracks (B6)High Water Table (A2)
2 cm Muck (A10)
5 cm Mucky Peat or Peat (S3)
Restrictive Layer (if observed):
Sediment Deposits (B2)
Histisol (A1)Histic Epipedon (A2)Black Histic (A3)Hydrogen Sulfide (A4)Stratified Layers (A5)
Manmad hardpan
Primary Indicators (minimum of one is required; check all that apply)
Redox Dark Surface (F6)
Loamy Gleyed Matrix (F2)
Gauge or Well Data (D9)Other (Explain in Remarks)
Hydric Soil Indicators:
Describe recorded data (stream gauge, monitoring well, aerial photos, previous inspections), if available:
Remarks:
Water-Stained Leaves (B9)
Oxidized Rhizospheres on Living Roots (C3)
Drainage Patterns (B10)
Algal Mat or Crust (B4)
Stripped Matrix (S6)Loamy Mucky Mineral (F1)
*Indicators of hydrophytic vegetation and weltand hydrology must be present, unless disturbed or
problematic
Remarks:
Type:
Sandy Mucky Mineral (S1)
YHydric soil present?
Depleted Matrix (F3)Depleted Below Dark Surface (A11)Thick Dark Surface (A12)
Dry-Season Water Table (C2)Water Marks (B1)
5-18 10 YR 2/1 80 silty loam
0-5 10 YR 2/1 100 silty loam many fine roots
Sampling Point: SP-7 Wet 4 -out
Depth (Inches)
Matrix Redox FeaturesTexture RemarksColor (moist) % Color (moist) % Type* Loc**
Profile Description: (Describe to the depth needed to document the indicator or confirm the absence of indicators.)
US Army Corps of Engineers Midwest Region
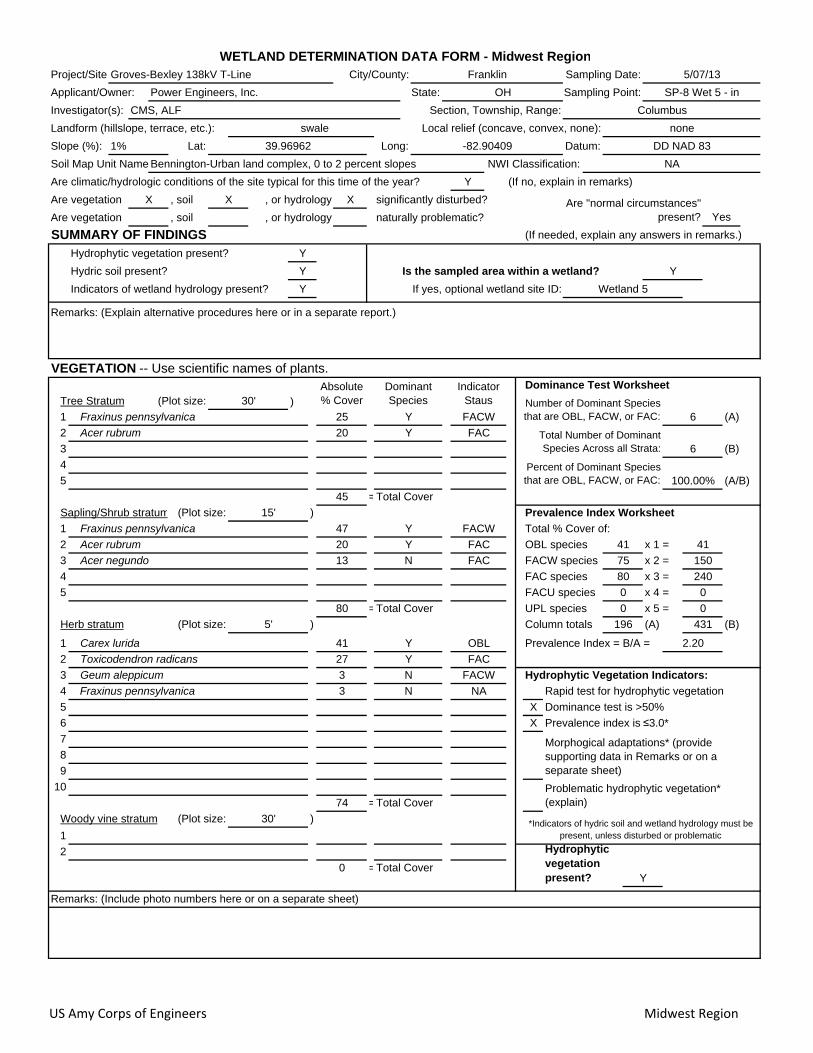
Project/Site
Slope (%):
Are climatic/hydrologic conditions of the site typical for this time of the year? (If no, explain in remarks)
Are vegetation , soil significantly disturbed?
Are vegetation , soil naturally problematic?
SUMMARY OF FINDINGSHydrophytic vegetation present?
Hydric soil present? Is the sampled area within a wetland?
Indicators of wetland hydrology present?
Remarks: (Explain alternative procedures here or in a separate report.)
Dominance Test Worksheet
)1 (A)
2
3 (B)
4
5 (A/B)
=Total Cover
Sapling/Shrub stratum ) Prevalence Index Worksheet
1 Total % Cover of:
2 OBL species x 1 =
3 FACW species x 2 =
4 FAC species x 3 =
5 FACU species x 4 =
=Total Cover UPL species x 5 =
Herb stratum ) Column totals (A) (B)
1 Prevalence Index = B/A =
2
3 Hydrophytic Vegetation Indicators:
4 Rapid test for hydrophytic vegetation
5 X Dominance test is >50%
6 X Prevalence index is ≤3.0*
7
8
9
10
=Total Cover
Woody vine stratum )
1
2
=Total Cover
Remarks: (Include photo numbers here or on a separate sheet)
Fraxinus pennsylvanica NA
*Indicators of hydric soil and wetland hydrology must be present, unless disturbed or problematic
5/07/13
Sampling Point: SP-8 Wet 5 - inOH
Local relief (concave, convex, none): none
Columbus
(If needed, explain any answers in remarks.)
NA
100.00%
Total Number of Dominant Species Across all Strata:
Percent of Dominant Species that are OBL, FACW, or FAC:
45
WETLAND DETERMINATION DATA FORM - Midwest RegionCity/County: Franklin Sampling Date:
, or hydrology
, or hydrology
X
0
Groves-Bexley 138kV T-Line
Hydrophytic vegetation present?
(Plot size: 30'
74
(Plot size: 15'
Tree Stratum (Plot size:
DD NAD 83
FACW
75 150
Morphogical adaptations* (provide supporting data in Remarks or on a separate sheet)
Y
6
6
0 0
Y
2.20
196 431
Problematic hydrophytic vegetation* (explain)
0 0
41 Y OBL
27 Y FAC
3 N
3 N
41 41
80 240
Fraxinus pennsylvanica 47 Y FACW
20 Y
13 N
80
Carex lurida
(Plot size: 5'
Toxicodendron radicansGeum aleppicum
Acer negundoFACAcer rubrumFAC
Acer rubrum 20 Y FAC
Are "normal circumstances" present? Yes
Absolute % Cover30'
Wetland 5If yes, optional wetland site ID:Y
Dominant Species
Indicator Staus Number of Dominant Species
that are OBL, FACW, or FAC:
X X
Y
Y
VEGETATION -- Use scientific names of plants.
Fraxinus pennsylvanica 25 Y FACW
Applicant/Owner: Power Engineers, Inc. State:
swale
Section, Township, Range:
Soil Map Unit Name
Y
Bennington-Urban land complex, 0 to 2 percent slopes NWI Classification:
1% Lat: Long:39.96962 Datum:-82.90409
Investigator(s): CMS, ALF
Landform (hillslope, terrace, etc.):
US Amy Corps of Engineers Midwest Region
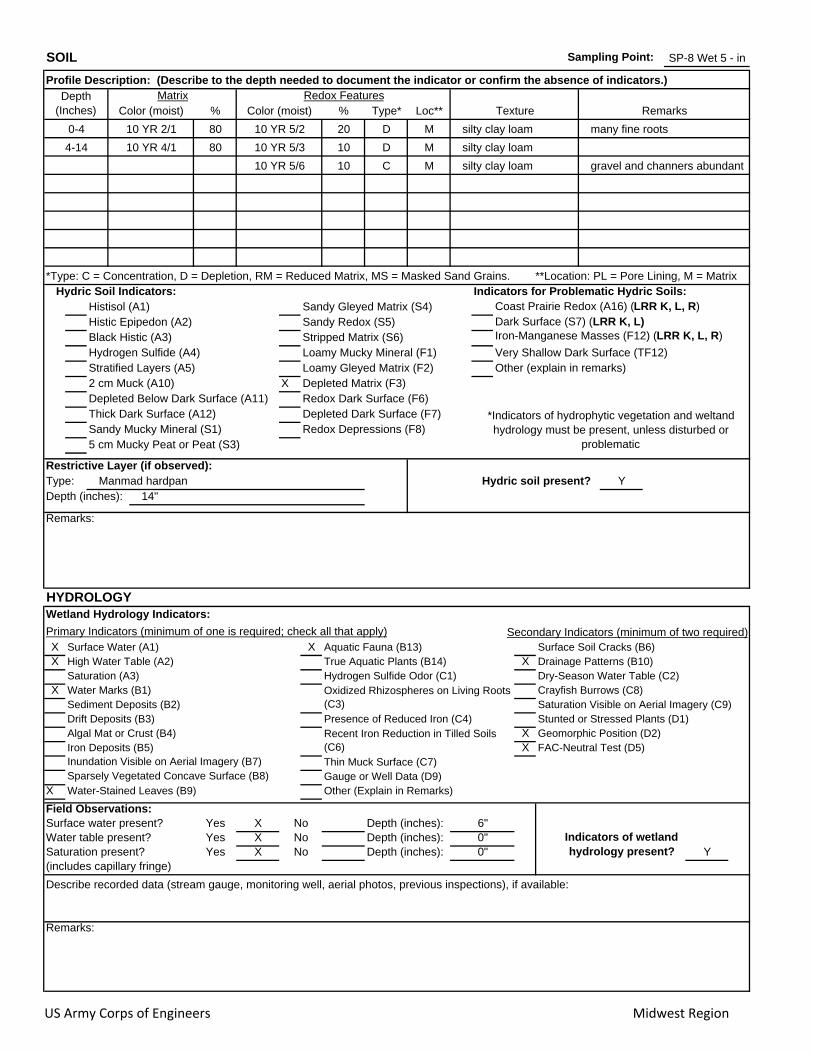
Iron-Manganese Masses (F12) (LRR K, L, R)
Very Shallow Dark Surface (TF12)
X
X X Aquatic Fauna (B13)X True Aquatic Plants (B14) X
Hydrogen Sulfide Odor (C1) X
Presence of Reduced Iron (C4) XX
X
10 YR 5/6 10 C M silty clay loam gravel and channers abundant
*Type: C = Concentration, D = Depletion, RM = Reduced Matrix, MS = Masked Sand Grains. **Location: PL = Pore Lining, M = Matrix
Indicators of wetland hydrology present?
Coast Prairie Redox (A16) (LRR K, L, R)Dark Surface (S7) (LRR K, L)
Sandy Gleyed Matrix (S4)Sandy Redox (S5)
Indicators for Problematic Hydric Soils:
Other (explain in remarks)
Stunted or Stressed Plants (D1)Geomorphic Position (D2)
Secondary Indicators (minimum of two required)
6"Yes
FAC-Neutral Test (D5) Iron Deposits (B5)
Drift Deposits (B3)
YWater table present? Yes X No Depth (inches): 0"
(includes capillary fringe)
Surface water present?
Yes X NoSaturation present? 0"
Depleted Dark Surface (F7)Redox Depressions (F8)
No
Recent Iron Reduction in Tilled Soils (C6)
Depth (inches):
Thin Muck Surface (C7) Inundation Visible on Aerial Imagery (B7)Sparsely Vegetated Concave Surface (B8)
Field Observations:X Depth (inches):
Crayfish Burrows (C8)Saturation Visible on Aerial Imagery (C9)
Depth (inches): 14"
SOIL
Wetland Hydrology Indicators:
Saturation (A3)
HYDROLOGY
Surface Water (A1) Surface Soil Cracks (B6)High Water Table (A2)
2 cm Muck (A10)
5 cm Mucky Peat or Peat (S3)
Restrictive Layer (if observed):
Sediment Deposits (B2)
Histisol (A1)Histic Epipedon (A2)Black Histic (A3)Hydrogen Sulfide (A4)Stratified Layers (A5)
Manmad hardpan
Primary Indicators (minimum of one is required; check all that apply)
Redox Dark Surface (F6)
Loamy Gleyed Matrix (F2)
Gauge or Well Data (D9)Other (Explain in Remarks)
Hydric Soil Indicators:
Describe recorded data (stream gauge, monitoring well, aerial photos, previous inspections), if available:
Remarks:
Water-Stained Leaves (B9)
Oxidized Rhizospheres on Living Roots (C3)
Drainage Patterns (B10)
Algal Mat or Crust (B4)
Stripped Matrix (S6)Loamy Mucky Mineral (F1)
*Indicators of hydrophytic vegetation and weltand hydrology must be present, unless disturbed or
problematic
Remarks:
Type:
Sandy Mucky Mineral (S1)
YHydric soil present?
Depleted Matrix (F3)Depleted Below Dark Surface (A11)Thick Dark Surface (A12)
Dry-Season Water Table (C2)Water Marks (B1)
4-14 10 YR 4/1 80 10 YR 5/3 10 D M silty clay loam
0-4 10 YR 2/1 80 10 YR 5/2 20 D M silty clay loam many fine roots
Sampling Point: SP-8 Wet 5 - in
Depth (Inches)
Matrix Redox FeaturesTexture RemarksColor (moist) % Color (moist) % Type* Loc**
Profile Description: (Describe to the depth needed to document the indicator or confirm the absence of indicators.)
US Army Corps of Engineers Midwest Region