Embed Size (px)
Citation preview

Stephan Engels | CFO | Frankfurt | 07 August 2014
Growing business volumes in Core Bank –original 2016 NCA target of €93bn already achievedAnalyst conference – Q2 2014 results

2Stephan Engels | CFO | Frankfurt | 07 August 2014
Key Financial Facts Q2 2014
CET1 Basel III fully phased-in increased from 9.0% to 9.4%1).
Capital accretive portfolio sales in CRE lead to substantial derisking in NCA – original 2016 EaDtarget of €93bn already achieved.
Low LLPs of €257m supported by €112m release as a result of the CRE portfolio sales. Costs almost stable at €1.7bn for the 6th consecutive quarter.
Group net result of €100m for Q2 2014 leads to €300m in H1 2014 compared to €-58m in H1 2013.
Group operating result of €257m in Q2 2014 leads to €581m for H1 2014 exceeding H1 2013 by 8%. Core bank with 3% revenue increase q-o-q. Growing business volumes in PC and MSB underpin strategic progress.
1) Includes net profit of H1 2014

3Stephan Engels | CFO | Frankfurt | 07 August 2014
Key financial figures at a glance
H1 2014 vs. H1 2013Q2 2014 vs. Q1 2014
Fin
anci
alR
esul
tE
aDin
NC
AB
3 C
ET
1
fully
pha
sed-
in
Q2 2014
100257
440
Q1 2014
200324
496
Net Result1)
Op. resultGroup
Op. resultCore Bank
300581
936
-58
538
1,011
Q2 20142)
9.4
Q1 2014
9.0
H1 20142)
9.4
H1 2013
8.4
Q2 2014
92
Q1 2014
102
H1 2014
92
H1 2013
136
H1 2013 H1 2014
1) Consolidated result attributable to Commerzbank shareholders 2) Includes net profit of H1 2014
€m
€bn
%

4Stephan Engels | CFO | Frankfurt | 07 August 2014
Quarterly transitionOperating result, €m
Group operating result affected by CRE portfolio sa les
1)Net resultQ1 2014
200
Net resultQ2 2014
100
Tax, Minorities
157
Operating result
Q2 2014
328
Costs
19
LLP
131
Revenues
154
Operating result
Q1 2014
324
Operating result
Q2 2013
74
CRE portfolio sales
257
Operating result /
pre-tax profitQ2 2014
71
1) Consolidated result attributable to Commerzbank shareholders 2) Excluding effect from sale of Spain, Portugal and Japan CRE portfolios
1)
Effect from sales of CRE portfolios in Spain, Portugal and Japan
2) 2)
2)
Q2 2014 vs. Q1 2014
▲Group revenues excluding the CRE portfolio sales increased by 7%
▲ €-71m effect from CRE portfolio sales include €112m LLP releases in NPL portfolio which proves conservative valuation standards while impact of €-183m reflects small discount on performing loans and transaction costs
▼ Q2 2014 net result includes taxes of prior periods
2)

5Stephan Engels | CFO | Frankfurt | 07 August 2014
Costs€m
Q2 2014 vs. Q1 2014
► Total expenses almost at level Q1 2014
▲Decreasing personnel expenses due to reduced FTE
► As expected, operating costs increased due to several regulatory requirements (e.g. for AQR, Fatca, CRD IV-implementation), ongoing strategic investments and transaction costs from CRE portfolio sales
2014
Q2
1,727
777
950
Q1
1,698
722
976
Q4
1,688
762
926
Q3
1,686
714
972
Q2
1,699
730
969
Q1
1,724
702
1,022
∑ 6,797
Operating expensesPersonnel expenses
∑ 3,425
2013
Almost stable total expenses for the 6th consecutive quarter

6Stephan Engels | CFO | Frankfurt | 07 August 2014
Provisions for loan losses€m
Q2 2014 vs. Q1 2014
▲ LLP in CRE supported by asset run down as well as by releases from CRE portfolio sales
► Ship Finance LLPs as expected
▲Good portfolio quality in Core Bank
20142013
NCACore Bank
347
Q1
267
92
175
Q2
257
192
65
Q1
238
104
134
Q4
451
134
317
Q3
492
249
243
Q2
537
190
Low LLPs supported by €112m release from CRE portfol io sales
∑ 1,747 ∑ 495

7Stephan Engels | CFO | Frankfurt | 07 August 2014
Quarterly transitionOperating result, €m
Q1 2014
496
Q4 2013
418
Q3 2013
375
Q2 2013
461
Q1 2013
550-11%
LLPRevenues
61
Q2 2014Costs
29 44088
Ø equity (€ bn) 16.8Op. RoE (%) 11.0CIR (%) 71.1
Ø equity (€ bn) 19.2Op. RoE (%) 10.3CIR (%) 72.9
Ø equity (€ bn) 19.2Op. RoE (%) 9.2CIR (%) 72.2
Core Bank: Revenue increase of 3% q-o-q
Q2 2014 vs. Q1 2014
▲Revenue increase of 3%, with improvements in MSB, CEE and Treasury – slight reductions in PC (after seasonally higher Q1 2014) and C&M (after disposal gains in Q1 2014)
► LLPs at the same level as in Q2 2013
►Others & Consolidation of €-212m with improved Treasury result

8Stephan Engels | CFO | Frankfurt | 07 August 2014
Private Customers: Growing business volumes evidenc e the strategic progress
Quarterly transitionOperating result, €m
+3%
Q2 2014
115
Costs
12
LLP
20
Revenues
29
Q1 2014
112
Q4 2013
60
Q3 2013
41
Q2 2013
54
Q1 2013
69
Ø equity (€ bn) 3.9
Op. RoE (%) 5.5
CIR (%) 90.3
Ø equity (€ bn) 4.0
Op. RoE (%) 11.3CIR (%) 83.1
Ø equity (€ bn) 4.0Op. RoE (%) 11.4
CIR (%) 84.5
Q2 2014 vs. Q1 2014
▲ Increased net interest income from rising volume of interest bearing assets and active margin management
►Shift to volume-based securities business not yet fully compensate declining transaction based revenues
▲ 95k net new clients mark a two-year record high in Q2 2014 thanks to successful marketing campaigns

9Stephan Engels | CFO | Frankfurt | 07 August 2014
Direct Banking – Revenues before LLP €m
Filialbank – Revenues before LLP €m
Commerz Real – Revenues before LLP €m
PC divisional split
Q2 2014
85
Q1 2014
88
Q2 2013
82
Q2 2014
39
Q1 2014
51
Q2 2013
32
Q2 2014
722
Q1 2014
734
Q2 2013
725 ▲Growth of new mortgage loan volume to €2.7bn exceeds strong Q1 2014 (+18% q-o-q)
▲Assets in premium and managed accounts increased to 31% of total securities business (+3%p q-o-q; +10%p y-o-y)
▲Assets under control increased to €57bn (+3.2% q-o-q)
▲ +16k net new clients vs. Q1 2014
▲Stable revenues from ongoing business
►Q1 2014 revenues supported by portfolio sale in asset structuring unit

10Stephan Engels | CFO | Frankfurt | 07 August 2014
Mittelstandsbank: Growth in loan volume and revenue s
Quarterly transitionOperating result, €m
Ø equity (€ bn) 5.9Op. RoE (%) 14.6
CIR (%) 47.9
Ø equity (€ bn) 6.6Op. RoE (%) 20.4CIR (%) 45.0
Ø equity (€ bn) 6.9Op. RoE (%) 15.6CIR (%) 44.7
-21%
Q2 2014
267
Costs
8
LLP
85
Revenues
23
Q1 2014
337
Q4 2013
221
Q3 2013
349
Q2 2013
215
Q1 2013
325
Q2 2014 vs. Q1 2014▲Revenue increase due to positive development in loans and positive valuation effects of counterparty risks in derivative
business ►Decreasing net commission income especially from capital market products such as interest- and FX-hedges
▲Growth of loan volume in all business lines +5% q-o-q and +9% y-o-y with corporates in Germany above market development

11Stephan Engels | CFO | Frankfurt | 07 August 2014
Großkunden & International – Revenues before LLP €m
Mittelstand Germany – Revenues before LLP €m
Financial Institutions – Revenues before LLP €m
MSB divisional split
Q2 2013
103
Q2 2014
134
Q1 2014
104
Q2 2014
251
Q1 2014
241
Q2 2013
205
Q1 2014
Q2 2013
Q2 2014
389 371 353
▲Higher revenues from loans as well as from international business (e.g. letters of credit)
► Improvement in valuation effects of counterparty risks in derivatives business
▲Further growth of loan volume at stable margins
►Declining revenues from capital market related products
▲ Increase in loan volume at stable margins
▲Higher client activities from Corporate Finance business compensating for declining revenues from derivatives

12Stephan Engels | CFO | Frankfurt | 07 August 2014
Central & Eastern Europe: Continued growth in mBank leads to record revenues
Quarterly transitionOperating result, €m
Ø equity (€ bn) 1.7
Op. RoE (%) 13.0
CIR (%) 53.8
Ø equity (€ bn) 1.6Op. RoE (%) 25.1CIR (%) 46.9
Ø equity (€ bn) 1.6Op. RoE (%) 21.3CIR (%) 47.9
-14%
Q2 2014
84
Costs
7
LLP
17
Revenues
10
Q1 2014
98
Q4 2013
66
Q3 2013
65
Q2 2013
54
Q1 2013
75
Q2 2014 vs. Q1 2014
▲ Positive development of all material revenue line items mainly driven by lower interest costs and increased incomefrom loan business
▲ Volumes with continued upward trend in loans and retail deposits
► Higher costs reflecting intensified promotional activity and project expenses related to the “One Bank Strategy”

13Stephan Engels | CFO | Frankfurt | 07 August 2014
254
Corporates & Markets: Profiting from a diversified business model across asset classes
Quarterly transitionOperating result excl. OCS and net CVA/DVA1), €m
-5%
Q2 2014
194
Costs
12
LLP
4
Revenues
18
Q1 2014
204
Q4 2013
98
Q3 2013
110
Q2 2013
274
Q1 2013
231
Q2 2014 vs. Q1 2014
▲Strong performance in Equities compensates for continued weakness in Fixed Income and Currencies
▲Corporate Finance with strong operating revenues as client activity improved
►Adjusted for the €42m gains from asset disposal in Structured Credit Legacy in Q1 2014, overall revenues with slight increase q-o-q
OCS effect (€m) 20
Net CVA/DVA (€m)1) -40
Ø equity (€ bn) 3.3
Op. RoE (%)2) 33.4
CIR (%)2) 56.7
OCS effect (€m) -27
Net CVA/DVA (€m)1) 19
Ø equity (€ bn) 4.4
Op. RoE (%)2) 17.8
CIR (%)2) 63.1
Result excl. OCSand net CVA/DVA1)
1) Net of hedges. Since Q2 2013 spread-based calculation of CVA/DVA impact, before calculation was rating-based. 2) Excl. OCS effect and net CVA/DVA (net of hedges)
2)
Reported result
OCS effect (€m) -5
Net CVA/DVA (€m)1) 17
Ø equity (€ bn) 4.4
Op. RoE (%)2) 18.6
CIR (%)2) 63.3
216166272 85 186

14Stephan Engels | CFO | Frankfurt | 07 August 2014
Corporates & Markets divisional split
Corporate Finance – Revenues before LLPs€m
FIC – Revenues before LLPs (excl. OCS effect, CVA/DVA1))€m
CPM – Revenues before LLPs (excl. CVA/DVA 1))€m
EMC – Revenues before LLPs€m
Q2 2014
220
Q1 2014
175
Q2 2013
186
Q2 2014
95
Q1 2014
105
Q2 2013
116
Q2 2014
90
Q1 2014
136
Q2 2013
143
1) Net of hedges. Since Q2 2013 spread based calculation of CVA/DVA impact, before calculation was rating based.
Q2 2014
131
Q1 2014
133
Q2 2013
154
▲Good performance in Bonds and Loans business driven by increased client activity
▲ECM with best quarter since Q2 2011
► Y-o-y revenue decline due to lost revenue stream after loan restructuring in Q3 2013
▲Strong demand for off-the-shelf and tailor-made equity derivatives products
▼Challenging environment for commodities product range, especially structured products
►Credit Trading with solid performance
▼Revenues and client demand remain under pressure due to historical lows in volatility both in interest rates and FX
► Lower contribution from Structured Credit Legacy after previous disposal gains

15Stephan Engels | CFO | Frankfurt | 07 August 2014
Risk Density 1) of EaDbps
LLP split€m
Default volume and coverage€m
▲Risk density in Core Bank stable below 30bp – very good portfolio quality in PC
▲Default portfolio unchanged despite growing business volumes – improved coverage and lower NPL ratio
► LLPs at the level of Q2 2013 as expected
1) Risk Density = EL/EAD (on each segment) 2) As % of EaD
Add
ition
to p
rovi
sion
sR
elea
ses
Q2 2014Q1 2014Q2 2013
1.6
86
1.7
84
1.8
82
NPL ratio (%)2)
Cov. ratio (%)
4,937
540
1,427
2,970
5,7434,863
5331,344
2,986
5,7904,960
4631,276
3,221
6,073
GLLP
Collaterals
LLP
Default volume
+1%
+85%
Q2 2014
192
1-538
142
16
Q1 2014
104
-1-9 21
57
36
Q2 2013
190
-1 -1936
147
27
O&C
C&M
CEE
MSB
PC
Core Bank
C&M
CEE
MSB
PC
Q2 2014
2727
59
31
23
Q1 2014
2931
61
31
25
Q2 2013
27
21
53
30
27
Core Bank: Higher LLPs in line with expectations –NPL ratio at good level of 1.6%

16Stephan Engels | CFO | Frankfurt | 07 August 2014
NCA: Operating result Q2 2014 includes burden from CRE portfoliosales
Quarterly transitionOperating result, €m
Ø equity (€ bn) 9.7EaD incl. NPL (€ bn) 136
Ø equity (€ bn) 7.9EaD incl. NPL (€ bn) 102
Ø equity (€ bn) 8.1EaD incl. NPL (€ bn) 92
-6%
Q2 2014
-183
Costs
10
LLP
43
Revenues
123
CRE portfolio
sales
101
Q1 2014
-172
Q4 2013
-328
Q3 2013
-272
Q2 2013
-387
Q1 2013
-86
1) Excluding effect from sales of Spain, Portugal and Japan CRE portfolios
Effect from sales of CRE portfolios in Spain, Portugal and Japan
Q2 2014 vs. Q1 2014▲Sales of CRE portfolios in Spain, Portugal and Japan have been capital accretive by €204m due to the corresponding RWA-
reduction of €3.4bn though NCA had to digest €-101m P&L hit in Q2 2014►Difference to effect at Group level stems from Group internal close-out charges▲ LLP release of €112m in sold NPL book proves conservative valuation while revenue impact of €-203m reflects small
discount on the performing loans sold
1) 1) 1)

17Stephan Engels | CFO | Frankfurt | 07 August 2014
Default volume and coverage€m
▲CRE: Net LLP releases due to portfolio sales in Spain and Portugal
►Ship Finance1): LLPs as expected
▲Default portfolio reduction driven by CRE portfolio sales: Spain (€1.1bn), Portugal (€0.3bn)
EaD incl. default volume€bn
LLP€m
Q2 2014Q1 2014Q2 2013
7.8
103
8.6
102
8.6
99
NPL ratio (%)2)
Cov. ratio (%)
Q2 2014
110
134
Q1 2014
74
0-72
Q2 2013
-81%
65
-51%
347
240
-2
137
-362
Public Finance
CRE
Ship Finance1)
-10%
-32%
Q2 2014
92
55
24
13
Q1 2014
102
56
32
14
Q2 2013
136
71
48
17
Public Finance
CRE
ShipFinance1)
7,406
302
4,849
2,255
7,174
8,955
347
5,647
2,961
8,776
11,572
394
7,332
3,846
11,708
GLLP
Collaterals
LLP
Default volume
Note: Numbers may not add up due to rounding 1) Deutsche Schiffsbank 2) As % of EaD
NCA: Q2 Portfolio reduction of €10bn equally reflec ts current run-down and CRE sales – EaD of € 92bn already below original t arget for 2016

18Stephan Engels | CFO | Frankfurt | 07 August 2014
Natural maturities lead to €47bn EaD in 2016 –options for opportunistic sales and transfers of
mainly liquid assets under regular review
New EaD target of €~20bn for CRE and Ship Finance 1) –Public Finance with held-to-maturity strategy
EaD volume of Public Finance portfolio€bn as of Q2 2014
EaD volume of CRE and Ship Finance 1) portfolios €bn as of Q2 2014
Note: Numbers may not add up due to rounding 1) Deutsche Schiffsbank
Acceleration of value preserving run-down of CRE and Ship Finance1)
New target 2016: €~20bn
CRE (lower risk)
15.5
Ship Finance (lower risk)
3.2
CRE (medium risk)
4.7
Ship Finance (medium risk)3.2
Ship Finance (higher risk)2.9
CRE (higher risk)
CRE (NPL)
3.7Ship Finance (NPL)
3.5
0.6
€37bn
20.0
PF (mainly liquid assets) 2)
34.9 PF (less liquid assets) 3)
€55bn
2) Mainly liquid assets with low discounts in market value (e.g. German "Bundesländer“, Swiss and Belgian sovereigns)
3) Less liquid assets with higher discounts in market value (e.g. Euro exit risk, U.S. sub-sovereigns)

19Stephan Engels | CFO | Frankfurt | 07 August 2014
EaD-Development over time€bn as of Q2 2014
Higher risk cluster CRE reduced to less than €1bn a fter portfolio transactions
Q3 2012 Q2 2013 Q1 2014
Run-downsince Q3 2012
CREhigher risk
Ship Finance 1)
higher risk
CREmed. risk
Ship Finance 1)
med. risk
11.7
4.2
5.7
8.6 4.1
3.4 3.1 2.9
0.6
9.2 7.5 5.3 4.7
4.3 3.5 3.2
7.0 7.1 5.1 3.7CRENPL
4.1 4.6 3.7 3.5Ship Finance 1)
NPL
-95%
-31%
-49%
-44%
-47%
-15%
Q2 2014
1) Deutsche Schiffsbank

20Stephan Engels | CFO | Frankfurt | 07 August 2014
Capital (€bn) 25.324.7
Capital (€bn) 20.419.7
Common Equity Tier 1 ratio fully phased-in increase d to 9.4%
Q2 2014
217
Q1 2014
218
Q2 20141)
9.4
Q1 2014
9.0
Q2 20141)
11.7
Q1 2014
11.3
RWA€bn
B3 phase-in%
B3 fully phased-in%
1) Includes net profit of H1 2014
› Business growth in Core Bank leads to higher credit RWA
› RWA decrease of €3.4bn due to portfolio sales in CRE
› Inclusion of H1 2014 earnings
› Improvements in capital reserves and regulatory deduction items
› Increase analogue to B3 ratio fully phased-in

21Stephan Engels | CFO | Frankfurt | 07 August 2014
Leverage ratio well above regulatory threshold
Total assets€bn
CRD4 Leverage ratio%
+1%
Q2 2014
583
Q1 2014
574
Q2 2013
637
Q2 20141)
4.1
Q1 2014
4.1
Q2 2013
4.0
Q2 20141)
3.3
Q1 2014
3.3
Q2 2013
3.2
LR under phase-in
LR under fully phased-in
1) Includes net profit of H1 2014

22Stephan Engels | CFO | Frankfurt | 07 August 2014
Outlook 2014
We focus our value preserving asset run-down in NCA on CRE and Ship Finance1) with a new 2016 EaD target for CRE and Ship Finance1) of €~20bn
We update our forecasted LLP to stay well below 2013
We confirm our cost guidance for 2014 of max €7.0bn
We keep on growing business volumes in the Core Bank with special focus on loan volumes in PC and MSB
We confirm our 2016 target for CET1 Basel III fully phased-in beyond 10% however we do not expect a linear development
1) Deutsche Schiffsbank

23Stephan Engels | CFO | Frankfurt | 07 August 2014
Appendix

24Stephan Engels | CFO | Frankfurt | 07 August 2014
German economy 2014/2015 – Economy defies politics ( as yet)
GDP (Change vs previous year in %)
Reasons for outperformance
› No bubble in the housing market.
› Low level of private sector debt translating to low refinancing cost.
› Less need for fiscal consolidation.
› Improved competitiveness since start of EMU; however, the advantage is about to decline due to cyclical and political reasons.
› Strong position in Asian markets and Emerging Markets in general.
Current development
› German economy has taken a breather. Real GDP probably stagnated or even fell slightly in Q2.
› This is mainly due to a special effect (mild winter pumping up construction in Q1, correction in Q2), but manufacturing has lost steam, too.
› Labour market has improved further.
› Government is about to reregulate the economy which will push up labour costs significantly.
Our expectation for 2014/2015
› Despite the set-back in Q2 we expect the upswing to continue.
› The expansionary monetary policy will continue to mask the dampening im-petus from politics. We are looking for a growth rate of 2% in 2014 and 2015, which will still be above EMU average.
› Underlying inflation will rise slowly. We expect inflation to average 1.2% in 2014 and at 2.2% in 2015.
DAX (average p.a.)
Euriborin % (average p.a.)
Source: Commerzbank Economic Research
0.91.6
1.2
2014e
2.0
2015e
0.91.7
2013
-0.4
0.4
2012
-0.6
2011
3.4
Germany Eurozone
20132011 2015e2012
9,600
2014e
6,843
10,600
8,297
6,586
2014e2012 2013
0.260.22
1.39
0.25
2015e2011
0.57

25Stephan Engels | CFO | Frankfurt | 07 August 2014
Hedging & Valuation Adjustments
€m Q1 13 Q2 13 Q3 13 Q4 13 FY 13 Q1 14 Q2 14
PCOCS &Net CVA/DVA
0 -0 0 -0 -0 -0 0
MSBOCS &Net CVA/DVA
-0 -34 13 21 -1 2 14
CEEOCS &Net CVA/DVA
- -7 6 -1 -2 -0 -1
C&MOCS &Net CVA/DVA
41 -20 -25 68 64 12 -8
O&COCS &Net CVA/DVA
41 -25 -29 -29 -42 -11 -4
CoreBank
OCS &Net CVA/DVA
82 -86 -36 60 20 3 1
NCAOCS &Net CVA/DVA
8 46 -8 -34 12 48 -0
GroupOCS &Net CVA/DVA
90 -40 -44 26 32 51 0
Note: Numbers may not add up due to rounding

26Stephan Engels | CFO | Frankfurt | 07 August 2014
Note: Numbers may not add up due to rounding 1) Utility and infrastructure transactions (mostly UK) – taken over from PRU in mid-2012; without value-impairing securities 2) Deutsche Schiffsbank 3) Claims in the category LaR 4) Incl. regions
NCA: Diversified portfolio EaD (incl. NPL) per 30 June 2014, in €bn
Commercial Real Estate
Public Finance
(incl. PFI1))
Ship Finance 2)
(incl. CR Warehouse)
1.2
0.0
0.1
0.8
0.2
POR
19.1
0.0
4.9
9.6
4.6
Rest
11.60.60.13.72.2Rest
54.95.28.97.712.8Sum
0.00.00.00.00.0NPL3)
32.52.18.53.77.7Sovereign4)
10.82.50.20.42.8FI
SumESITUSAGER
1.1
0.0
1.1
POR
6.5
0.7
5.8
Rest
24.51.90.414.6Sum
3.70.50.32.2NPL3)
20.81.40.112.4Performing
SumITUSAGER
1.7
0.4
1.2
Rest
12.92.53.35.4Sum
3.50.50.71.9NPL3)
9.42.02.63.5Performing
SumBulkerTankerContainer
Others
EaD RWA
24.5 14.9
EaD RWA
54.9 23.8
EaD RWA
12.9 13.5

27Stephan Engels | CFO | Frankfurt | 07 August 2014
Cluster
• Bulk Carrier (Handysize/-max)
• Bulk Carrier – Panamax
• Container 4,000 – 8,000 TEU• Crude Oil Tanker
NCA: Higher risk cluster CRE reduced to less than € 1bn after sale of portfolios in Spain and Japan
• Container > 8,000 TEU
• Gas Tanker• Yards
• Other (Cruise, Car Carrier, Offshore, Other)
Ship Finance 2)
EaD in €bn
2.9(31%)
• Bulk Carrier (Capesize/VLOC)
• Container < 2,000 TEU• Container 2,000 – 4,000 TEU
• Product-/Chemical Tanker
• Italy• Portugal
• USA• Others
• Germany• France
• Poland• Others
Commercial Real Estate 1)
EaD in €bn
1.1
1.4
0.1
2.1
0.6(3%)
12.4
0.6
0.8
4.7 (23%)
15.5(74%)
• Hungary
• Others 0.4
1.7
higherrisk
lowerrisk
mediumrisk
1.0
0.7
0.8
0.4
1.0
1.0
0.3
0.9
<0.1
1.4
0.6
4.3(14%)
6.3 (21%)
19.4(65%)
Q2/14 Q4/13 Q2/14 Q4/13
3.1(29%)
3.7(36%)
3.7(35%)
Note: Numbers may not add up due to rounding 1) Incl. HF Retail portfolio of NCA 2) Deutsche Schiffsbank
3.2(34%)
3.2(35%)
1.2
0.3

28Stephan Engels | CFO | Frankfurt | 07 August 2014
Default portfolios CRE and Ship Finance 1) as of 30 June 2014
37(21)21(29)29(35)28Coverage ratio incl. GLLP excl. collaterals (%)
31 Dec 201230 June 2014 (31 Dec 2013)
(15.9)
(103)
(3,847)
(119)
(1,882)
(5,662)
(23.5)
(112)
(257)
(5)
(55)
(283)
(13.5)
(101)
(1,692)
(30)
(662)
(2,371)
14.071.415.015.0NPL ratio (%)
103102104104Coverage ratio incl. GLLP and collaterals (%)
5,0562061,6552,752Collaterals
13022775GLLP
2,67253604967Loan loss provisions
7,6432572,2013,663Default volume
TotalUSGermanyTotalDefault portfolio CRE by country | €m
33(31)35(40)41(43)44(41)43Coverage ratio incl. GLLP excl. collaterals (%)
31 Dec 201230 June 2014 (31 Dec 2013)
(27.0)
(99)
(2,252)
(281)
(1,291)
(3,871)
(21.3)
(96)
(374)
(32)
(150)
(581)
(23.0)
(102)
(486)
(58)
(256)
(788)
(34.6)
(100)
(1,106)
(178)
(668)
(1,956)
23.719.622.535.627.2NPL ratio (%)
9511110599103Coverage ratio incl. GLLP and collaterals (%)
2,7893644451,0502,097Collaterals
2724252110219GLLP
1,2111252337251,286Loan loss provisions
4,4824766931,8973,505Default volume
TotalBulkerTankerContainerTotalDefault portfolio SF 1) by ship type | €m
1) Deutsche Schiffsbank

29Stephan Engels | CFO | Frankfurt | 07 August 2014
Default Portfolio (30 June 2014)
1) Incl. Others & Consolidation
722
Default portfolio and coverage ratios by segment€m – excluding/ including GLLP
Default volume Loan loss provisions Collaterals GLLP
6,276 8415,225
Group 1
89% / 96%
Private Customers82% / 97%
Mittelstandsbank72% / 82%
Central & Eastern Europe96% / 102%
Corporates& Markets65% / 72%
Non-Core Assets99% / 103%
12,91712,342
268/404/124
822795
3022,255
7,1747,405
1,462/437/280
2,6462,179
644/16/62
1,010
567/570/73
1,1871,211
4,849

30Stephan Engels | CFO | Frankfurt | 07 August 2014
Group Q2 2013 H1 2013 Q1 2014 Q2 2014 H1 2014
Operating result (€m) 74 538 324 257 581
Net result (€m) 40 -58 200 100 300
Core tier 1 ratio B 2.5 (2013) / CET 1 B 3 (2014) in (%) 12.1 12.1 11.3 11.7 11.7
CET 1 ratio B 3 fully phased in (%) n/a n/a 9.0 9.4 9.4
Total assets (€bn) 637 637 574 583 583
RWA B 2.5 (2013) / CET 1 B 3 (2014) (€bn) 206 206 218 217 217
Leverage ratio (phase-in, %) n/a n/a 4.1 4.1 4.1
Core Bank (incl. O&C) Q2 2013 H1 2013 Q1 2014 Q2 2014 H1 2014
Operating result (€m) 461 1,011 496 440 936
Op. RoE (%) 11.0 12.2 10.3 9.2 9.8
CIR (%) 71.1 71.5 72.9 72.2 72.6
Risk density of EaD (bps) 27 27 29 27 27
LTD ratio (%) 74 74 76 77 77
NCA Q2 2013 H1 2013 Q1 2014 Q2 2014 H1 2014
Operating result (€m) -387 -473 -172 -183 -355
EaD incl. NPL volume (€bn) 136 136 102 92 92
Risk density of EaD (bps) 70 70 86 68 68
Commerzbank financials at a glance
1) Attributable to Commerzbank shareholders 2) Includes net profit of H1 2014
1)
2) 2)
2) 2)
2) 2)

31Stephan Engels | CFO | Frankfurt | 07 August 2014
in € mQ1
2013Q2
2013Q3
2013Q4
2013Q1
2014Q2
2014% yoy % qoq
Total Revenues 2,455 2,310 2,281 2,229 2,260 2,241 -3.0 -0.8
o/w Total net interest and net trading income 1,671 1,618 1,409 1,381 1,538 1,426 -11.9 -7.3
o/w Net commission income 844 805 784 773 815 782 -2.9 -4.0
o/w Other income -60 -113 88 75 -93 33 >100 >100
Provision for possible loan losses -267 -537 -492 -451 -238 -257 52.1 -8.0
Operating expenses 1,724 1,699 1,686 1,688 1,698 1,727 1.6 1.7
Operating profit 464 74 103 90 324 257 >100 -20.7
Impairments on goodw ill - - - - - - - -
Restructuring expenses 493 - - - - - - -
Net gain or loss from sale of disposal groups - - - - - - - -
Pre-tax profit -29 74 103 90 324 257 >100 -20.7
- -
Average capital employed 26,445 26,459 26,758 26,842 27,077 27,285 3.1 0.8
RWA (End of Period) 209,796 206,288 197,287 190,588 218,259 217,013 5.2 -0.6
Cost/income ratio (%) 70.2% 73.5% 73.9% 75.7% 75.1% 77.1%
Operating return on equity (%) 7.0% 1.1% 1.5% 1.3% 4.8% 3.8%
Return on equity of pre-tax result (%) -0.4% 1.1% 1.5% 1.3% 4.8% 3.8%
Commerzbank Group

32Stephan Engels | CFO | Frankfurt | 07 August 2014
Core Bank
in € mQ1
2013Q2
2013Q3
2013Q4
2013Q1
2014Q2
2014% yoy % qoq
Total Revenues 2,284 2,254 2,227 2,151 2,216 2,277 1.0 2.8
o/w Total net interest and net trading income 1,544 1,413 1,385 1,268 1,417 1,497 5.9 5.6
o/w Net commission income 825 787 778 757 810 777 -1.3 -4.1
o/w Other income -85 54 64 126 -11 3 -94.4 >100
Provision for possible loan losses -92 -190 -249 -134 -104 -192 -1.1 -84.6
Operating expenses 1,642 1,603 1,603 1,599 1,616 1,645 2.6 1.8
Operating profit 550 461 375 418 496 440 -4.6 -11.3
Impairments on goodw ill - - - - - - - -
Restructuring expenses 493 0 0 0 -0 0 >100 >100
Net gain or loss from sale of disposal groups - - - - - - - -
Pre-tax profit 57 461 375 418 496 440 -4.6 -11.3
- - - - - - - -
Average capital employed 16,387 16,808 17,426 17,931 19,193 19,163 14.0 -0.2
RWA (End of Period) 144,660 144,533 140,874 137,004 162,021 164,337 13.7 1.4
Cost/income ratio (%) 71.9% 71.1% 72.0% 74.3% 72.9% 72.2% - -
Operating return on equity (%) 13.4% 11.0% 8.6% 9.3% 10.3% 9.2% - -
Return on equity of pre-tax result (%) 1.4% 11.0% 8.6% 9.3% 10.3% 9.2% - -

33Stephan Engels | CFO | Frankfurt | 07 August 2014
Private Customers
in € mQ1
2013Q2
2013Q3
2013Q4
2013Q1
2014Q2
2014% yoy % qoq
Total Revenues 858 839 825 827 874 845 0.7 -3.3
o/w Total net interest and net trading income 431 444 452 446 450 480 8.1 6.7
o/w Net commission income 427 390 379 365 407 362 -7.2 -11.1
o/w Other income - 5 -6 16 17 3 -40.0 -82.4
Provision for possible loan losses -35 -27 -31 -15 -36 -16 40.7 55.6
Operating expenses 754 758 753 752 726 714 -5.8 -1.7
Operating profit 69 54 41 60 112 115 >100 2.7
Impairments on goodw ill - - - - - - - -
Restructuring expenses - - - - - - - -
Net gain or loss from sale of disposal groups - - - - - - - -
Pre-tax profit 69 54 41 60 112 115 >100 2.7
Average capital employed 4,001 3,920 3,979 3,986 3,982 4,036 3.0 1.4
RWA (End of Period) 28,803 28,971 29,205 27,213 28,485 29,023 0.2 1.9
Cost/income ratio (%) 87.9% 90.3% 91.3% 90.9% 83.1% 84.5% - -
Operating return on equity (%) 6.9% 5.5% 4.1% 6.0% 11.3% 11.4% - -
Return on equity of pre-tax result (%) 6.9% 5.5% 4.1% 6.0% 11.3% 11.4% - -

34Stephan Engels | CFO | Frankfurt | 07 August 2014
Mittelstandsbank
in € mQ1
2013Q2
2013Q3
2013Q4
2013Q1
2014Q2
2014% yoy % qoq
Total Revenues 727 695 790 705 716 739 6.3 3.2
o/w Total net interest and net trading income 457 405 458 441 440 463 14.3 5.2
o/w Net commission income 280 272 264 250 274 264 -2.9 -3.6
o/w Other income -10 18 68 14 2 12 -33.3 >100
Provision for possible loan losses -78 -147 -106 -139 -57 -142 3.4 >-100
Operating expenses 324 333 335 345 322 330 -0.9 2.5
Operating profit 325 215 349 221 337 267 24.2 -20.8
Impairments on goodw ill - - - - - - - -
Restructuring expenses - - - - - - - -
Net gain or loss from sale of disposal groups - - - - - - - -
Pre-tax profit 325 215 349 221 337 267 24.2 -20.8
- -
Average capital employed 5,829 5,903 6,065 6,165 6,624 6,858 16.2 3.5
RWA (End of Period) 55,364 56,802 57,354 57,746 61,951 66,214 16.6 6.9
Cost/income ratio (%) 44.6% 47.9% 42.4% 48.9% 45.0% 44.7% - -
Operating return on equity (%) 22.3% 14.6% 23.0% 14.3% 20.4% 15.6% - -
Return on equity of pre-tax result (%) 22.3% 14.6% 23.0% 14.3% 20.4% 15.6% - -
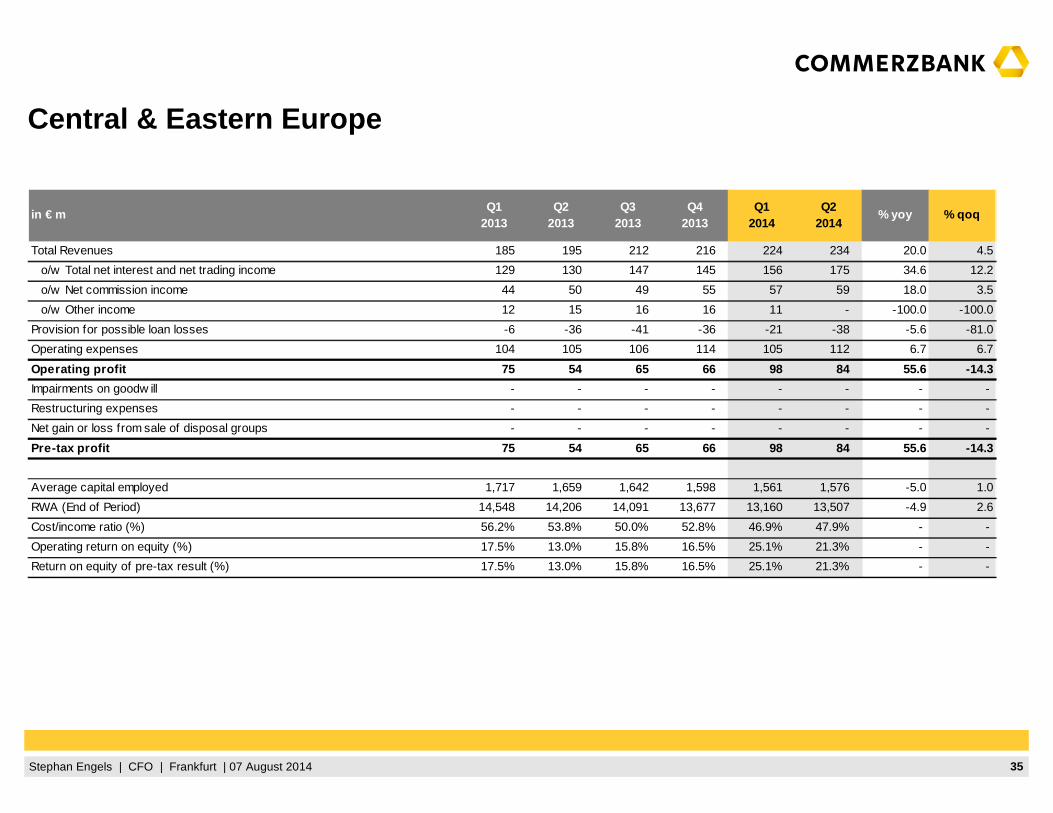
35Stephan Engels | CFO | Frankfurt | 07 August 2014
Central & Eastern Europe
in € mQ1
2013Q2
2013Q3
2013Q4
2013Q1
2014Q2
2014% yoy % qoq
Total Revenues 185 195 212 216 224 234 20.0 4.5
o/w Total net interest and net trading income 129 130 147 145 156 175 34.6 12.2
o/w Net commission income 44 50 49 55 57 59 18.0 3.5
o/w Other income 12 15 16 16 11 - -100.0 -100.0
Provision for possible loan losses -6 -36 -41 -36 -21 -38 -5.6 -81.0
Operating expenses 104 105 106 114 105 112 6.7 6.7
Operating profit 75 54 65 66 98 84 55.6 -14.3
Impairments on goodw ill - - - - - - - -
Restructuring expenses - - - - - - - -
Net gain or loss from sale of disposal groups - - - - - - - -
Pre-tax profit 75 54 65 66 98 84 55.6 -14.3
Average capital employed 1,717 1,659 1,642 1,598 1,561 1,576 -5.0 1.0
RWA (End of Period) 14,548 14,206 14,091 13,677 13,160 13,507 -4.9 2.6
Cost/income ratio (%) 56.2% 53.8% 50.0% 52.8% 46.9% 47.9% - -
Operating return on equity (%) 17.5% 13.0% 15.8% 16.5% 25.1% 21.3% - -
Return on equity of pre-tax result (%) 17.5% 13.0% 15.8% 16.5% 25.1% 21.3% - -

36Stephan Engels | CFO | Frankfurt | 07 August 2014
Corporates & Markets
in € mQ1
2013Q2
2013Q3
2013Q4
2013Q1
2014Q2
2014% yoy % qoq
Total Revenues 584 569 460 466 543 505 -11.2 -7.0
o/w Total net interest and net trading income 504 415 299 345 466 405 -2.4 -13.1
o/w Net commission income 83 93 91 100 76 101 8.6 32.9
o/w Other income -3 61 70 21 1 -1 >-100 >-100
Provision for possible loan losses 26 19 -43 55 9 5 -73.7 -44.4
Operating expenses 338 334 332 355 336 324 -3.0 -3.6
Operating profit 272 254 85 166 216 186 -26.8 -13.9
Impairments on goodw ill - - - - - - - -
Restructuring expenses - - - - - - - -
Net gain or loss from sale of disposal groups - - - - - - - -
Pre-tax profit 272 254 85 166 216 186 -26.8 -13.9
Average capital employed 3,254 3,286 2,823 2,887 4,376 4,373 33.1 -0.1
RWA (End of Period) 33,908 31,667 28,091 27,676 37,519 39,001 23.2 3.9
Cost/income ratio (%) 57.9% 58.7% 72.2% 76.2% 61.9% 64.2% - -
Operating return on equity (%) 33.4% 30.9% 12.0% 23.0% 19.7% 17.0% - -
Return on equity of pre-tax result (%) 33.4% 30.9% 12.0% 23.0% 19.7% 17.0% - -

37Stephan Engels | CFO | Frankfurt | 07 August 2014
Non-Core Assets
in € mQ1
2013Q2
2013Q3
2013Q4
2013Q1
2014Q2
2014% yoy % qoq
Total Revenues 171 56 54 78 44 -36 >-100 >-100
o/w Total net interest and net trading income 127 205 24 113 121 -71 >-100 >-100
o/w Net commission income 19 18 6 16 5 5 -72.2 -
o/w Other income 25 -167 24 -51 -82 30 >100 >100
Provision for possible loan losses -175 -347 -243 -317 -134 -65 81.3 51.5
Operating expenses 82 96 83 89 82 82 -14.6 -
Operating profit -86 -387 -272 -328 -172 -183 52.7 -6.4
Impairments on goodw ill - - - - - - - -
Restructuring expenses - - - - - - - -
Net gain or loss from sale of disposal groups - - - - - - - -
Pre-tax profit -86 -387 -272 -328 -172 -183 52.7 -6.4
Average capital employed 10,058 9,651 9,332 8,911 7,884 8,122 -15.8 3.0
RWA (End of Period) 65,135 61,755 56,413 53,584 56,239 52,676 -14.7 -6.3
Cost/income ratio (%) 48.0% 171.4% 153.7% 114.1% 186.4% n/a - -
Operating return on equity (%) -3.4% -16.0% -11.7% -14.7% -8.7% -9.0% - -
Return on equity of pre-tax result (%) -3.4% -16.0% -11.7% -14.7% -8.7% -9.0% - -

38Stephan Engels | CFO | Frankfurt | 07 August 2014
Others & Consolidation
in € mQ1
2013Q2
2013Q3
2013Q4
2013Q1
2014Q2
2014% yoy % qoq
Total Revenues -70 -44 -60 -63 -141 -46 -4.5 67.4
o/w Total net interest and net trading income 23 19 29 -109 -95 -26 >-100 72.6
o/w Net commission income -9 -18 -5 -13 -4 -9 50.0 >-100
o/w Other income -84 -45 -84 59 -42 -11 75.6 73.8
Provision for possible loan losses 1 1 -28 1 1 -1 >-100 >-100
Operating expenses 122 73 77 33 127 165 >100 29.9
Operating profit -191 -116 -165 -95 -267 -212 -82.8 20.6
Impairments on goodw ill - - - - - - - -
Restructuring expenses 493 - - - - - - -
Net gain or loss from sale of disposal groups - - - - - - - -
Pre-tax profit -684 -116 -165 -95 -267 -212 -82.8 20.6
Average capital employed 1,586 2,040 2,917 3,296 2,650 2,319 13.7 -12.5
RWA (End of Period) 12,037 12,887 12,134 10,693 20,906 16,591 28.7 -20.6
Cost/income ratio (%) n/a n/a n/a n/a n/a n/a - -
Operating return on equity (%) -48.2% -22.7% -22.6% -11.5% -40.3% -36.6% - -
Return on equity of pre-tax result (%) -172.5% -22.7% -22.6% -11.5% -40.3% -36.6% - -

39Stephan Engels | CFO | Frankfurt | 07 August 2014
Capital Capital CapitalQ1 2014 Q2 2014 YTD Jun 2014
€bn
End ofPeriod
End ofPeriod
Average
Subscribed capital 1.1 1.1 Capital reserve 15.9 15.9 Retained earnings 10.5 10.4 Currency translation reserve -0.2 -0.1 Revaluation reserve -1.1 -1.0 Cash flow hedges -0.3 -0.3 Consolidated P&L 0.2 0.3 IFRS capital without non-controlling interests 26.2 26.4 26.3 Basis for RoE on net result
Non-controlling interests (IFRS) 0.9 0.9 0.9 IFRS capital 27.1 27.3 27.2 Basis for operating RoE and pre-tax RoE
Goodwill and intangibles -3.0 -3.0 DTA losses carried forward -1.5 -1.5 Deductions on securitizations -0.4 -0.3 Deductions related to non-controlling interests -0.5 -0.5 Investments in financial entities and own shares -0.2 -0.1 Other regulatory adjustments -1.9 -1.4
Common equity tier 1 B3 capital (fully phased-in) 19 .7 20.4 Basis for CET1 B3 fully phased-in ratio
Transition adjustments 5.1 4.9 Common equity tier 1 capital (phase in) 24.7 25.3 Basis for CET1 B3 phase-in ratio
Group equity definitions
1)
Note: Numbers may not add up due to rounding 1) Includes net profit of H1 2014 2) Include mainly capital deductions for shortfall, prudent valuation and defined benefit pension funds
2)

40Stephan Engels | CFO | Frankfurt | 07 August 2014
Glossary - Capital Allocation / RoE Calculation
Capital Allocation
› Amount of average capital allocated to business segments is calculated by multiplying the segments currentYTD average Basel 3 RWA (PC € 28.8bn, MSB € 63.3bn, CEE € 13.3bn, C&M € 38.0bn, O&C € 19.2bn, NCA€ 57.0bn) by a ratio of 9%
› In addition average regulatory capital deductions are allocated attributable to business segments which results in increased average capital per segment (PC €1.4bn, MSB €1.0bn, CEE € 0.4bn, C&M € 1.0bn, O&C € 0.1bn,NCA € 0.4bn)
› Excess capital is allocated to Others & Consolidation
› Reallocation of €1.5bn EBA Capital Buffer to core bank (O&C) - previously total amount of €4bn was assigned to NCA
› Capital allocation is disclosed in the business segment reporting of Commerzbank Group
RoE Calculation
› As of Q2 2014 the RoE is calculated on an average level of IFRS capital
› Difference between Investors Capital and IFRS Capital is based on revaluation reserve and cash flow hedges (€1.4bn) – reverse effect in core bank driven by reallocation of EBA Capital Buffer (€1.5bn)
› Calculation represents the current market standard of local and international financial institutes

41Stephan Engels | CFO | Frankfurt | 07 August 2014
For more information, please contact Commerzbank’s I R team:
Institutional Investors and Financial Analysts
Michael H. KleinP: +49 69 136 24522M: [email protected]
Maximilian BickerP: +49 69 136 28696M: [email protected]
Tanja Birkholz (Head of Investor Relations / Executi ve Management Board Member)P: +49 69 136 23854M: [email protected]
Retail Investors
Florian NeumanP: +49 69 136 41367M: [email protected]
Ute Heiserer-JäckelP: +49 69 136 41874M: [email protected]
Simone NuxollP: +49 69 136 45660M: [email protected]
Dirk Bartsch (Head of Strategic IR / Rating Agency R elations)P: +49 69 136 22799 M: [email protected]
Christoph Wortig (Head of IR Communications)P: +49 69 136 52668M: [email protected]

42Stephan Engels | CFO | Frankfurt | 07 August 2014
Disclaimer
Investor Relations
This presentation contains forward-looking statements. Forward-looking statements are statements that are not historical facts; they include, inter alia, statements about Commerzbank’s beliefs and expectations and the assumptions underlying them. These statements are based on plans, estimates, projections and targets as they are currently available to the management of Commerzbank. Forward-looking statements therefore speak only as of the date they are made, and Commerzbank undertakes no obligation to update publicly any of them in light of new information or future events. By their very nature, forward-looking statements involve risks and uncertainties. A number of important factors could therefore cause actual results to differ materially from those contained in any forward-looking statement. Such factors include, among others, the conditions in the financial markets in Germany, in Europe, in the United States and elsewhere from which Commerzbank derives a substantial portion of its revenues and in which it hold a substantial portion of its assets, the development of asset prices and market volatility, potential defaults of borrowers or trading counterparties, the implementation of its strategic initiatives and the reliability of its risk management policies.
In addition, this presentation contains financial and other information which has been derived from publicly available information disclosed by persons other than Commerzbank (“external data”). In particular, external data has been derived from industry and customer-related data and other calculations taken or derived from industry reports published by third parties, market research reports and commercial publications. Commercial publications generally state that the information they contain has originated from sources assumed to be reliable, but that the accuracy and completeness of such information is not guaranteed and that the calculations contained therein are based on a series of assumptions. The external data has not been independently verified by Commerzbank. Therefore, Commerzbank cannot assume any responsibility for the accuracy of the external data taken or derived from public sources.
Copies of this document are available upon request or can be downloaded from www.commerzbank.com/aktionaere/index.htm