Embed Size (px)
Citation preview
33DIGGERMAGAZINE.COM SEPTEMBER 2016
An ongoing series provided by Oregon State University
in collaboration with the United States Department of Agriculture
and in partnership with the Oregon Association of Nurseries
Comparing natural and artificial turfBy Brian Daviscourt, Alec Kowalewski, John Lambrinos, Bart Eleveld and Micah Gould
GROWING KNOWLEDGESeries content is coordinated by Dr. Jay Pscheidt, professor of botany and plant pathology at Oregon State University in Corvallis, Oregon.
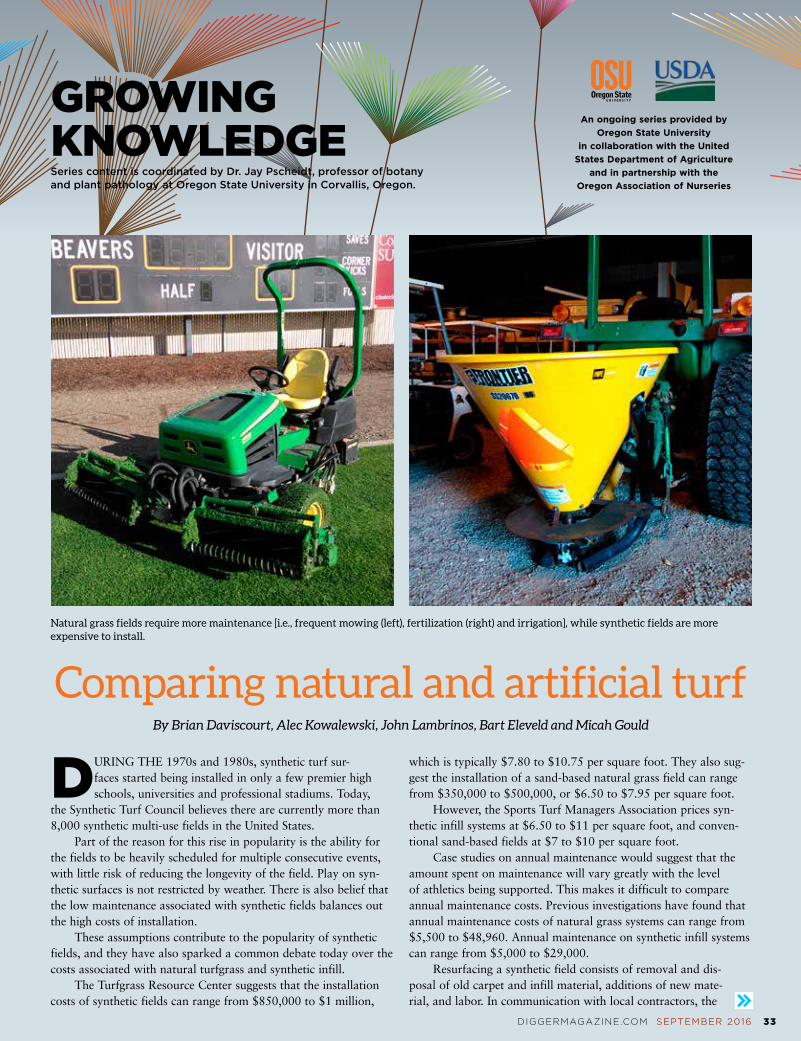
Natural grass fields require more maintenance [i.e., frequent mowing (left), fertilization (right) and irrigation], while synthetic fields are more expensive to install.
DURING THE 1970s and 1980s, synthetic turf sur-faces started being installed in only a few premier high schools, universities and professional stadiums. Today,
the Synthetic Turf Council believes there are currently more than 8,000 synthetic multi-use fields in the United States.
Part of the reason for this rise in popularity is the ability for the fields to be heavily scheduled for multiple consecutive events, with little risk of reducing the longevity of the field. Play on syn-thetic surfaces is not restricted by weather. There is also belief that the low maintenance associated with synthetic fields balances out the high costs of installation.
These assumptions contribute to the popularity of synthetic fields, and they have also sparked a common debate today over the costs associated with natural turfgrass and synthetic infill.
The Turfgrass Resource Center suggests that the installation costs of synthetic fields can range from $850,000 to $1 million,
which is typically $7.80 to $10.75 per square foot. They also sug-gest the installation of a sand-based natural grass field can range from $350,000 to $500,000, or $6.50 to $7.95 per square foot.
However, the Sports Turf Managers Association prices syn-thetic infill systems at $6.50 to $11 per square foot, and conven-tional sand-based fields at $7 to $10 per square foot.
Case studies on annual maintenance would suggest that the amount spent on maintenance will vary greatly with the level of athletics being supported. This makes it difficult to compare annual maintenance costs. Previous investigations have found that annual maintenance costs of natural grass systems can range from $5,500 to $48,960. Annual maintenance on synthetic infill systems can range from $5,000 to $29,000.
Resurfacing a synthetic field consists of removal and dis-posal of old carpet and infill material, additions of new mate-rial, and labor. In communication with local contractors, the

bu
ild
ers
of
qu
ali
ty
gr
een
ho
use
s a
nd
str
uct
ur
es
503-678-2700800-347-2701 (outside OR)
Fax 503-678-2789www.ovg.com * [email protected]
20357 Hwy 99E * Aurora, OR 97002
GROUND COVER 3.2 OZ.6x300 $109.0010x300 $183.0012x300 $218.0015x300 $271.50
Corrugated Poly Carbonate
4.25’ Wide Sheets 8’ ... $32.64 14’ ... $57.1210’ ... $40.80 16’ ... $65.2812’ ... $48.96 24’ ... $97.92
Twinwall Poly Carbonate
4’ Wide Sheets 8’ ... $52.80 14’ ... $ 92.4010’ ... $66.00 16’ ... $105.6012’ ... $79.20 24’ ... $158.40
Wire LockComplete
$12.54 - 12’
call for current greenhouse
prices and a catalog
prices good thru 9/30/16
34 SEPTEMBER 2016 DIGGERMAGAZINE.COM
Comparing natural and artificial turf
cost of resurfacing a synthetic infill system has been estimated at $4 per square foot for material and labor. The Synthetic Turf Council estimates the cost of transporting and landfilling the product at $30,000 to $60,000 for an 80,000-square-foot field ($0.38 to $0.75 per square foot). For this study, $0.56/square foot ($45,000/80,000 square feet) was used to calculate disposal of syn-thetic infill material.
These installation and maintenance costs for synthetic infill and natural turfgrass systems have primarily been provided by industry sources and commodity groups. They were also not expansive enough to include the practice of resurfacing for either natural turfgrass or synthetic infill fields, or for facilities of differ-ent athletic levels in the same analysis.
Another unexplored aspect in the literature is hours of player use. The question here is, “How many maintenance dollars are being used to provide an hour of use for an individual?”
Therefore, the objectives of this study were to: 1) Compare the cost of installation and maintenance across a
20-year period; and 2) Establish and compare a cost-per-hour of player use value
for natural turfgrass and synthetic infill athletic fields.
Materials and methodsThis case study assembles and compares the 20-year life cycle
costs of five natural turfgrass fields and five synthetic infill fields in the Willamette Valley, Oregon. Annual player use data was collected on these fields to create a comparison of the cost efficiency of the 10 fields over their life cycles.
This was accomplished by calculating the cost of providing one hour of use for a single individual [20-year life cycle cost divided by (annual hours of individual use multiplied by 20 years)]. Surface temperature and hardness data were also collected monthly in 2014–15 utilizing the testing procedures found in ASTM F1963 (10 standard procedures for field hardness testing, using a FieldScout TruFirm and Raytek non-contact thermometer).
In order to represent a broader range of maintenance capabili-ties, fields were selected for this study to cover maintenance levels from K–12 schools to the NCAA level.
Cost of installation: The overall average of natural grass athletic field installation, which included three sand-based fields and two native soil fields, was $325,000 with a cost per square foot range of $1.50–$6.50. The average cost of installing the five synthetic infill fields was $1,212,000, with a cost per square foot

Premier Supplier of Nursery Products
503-434-55251726 SW Highway 18, McMinnville, OR 97218 • www.dstakemill.com 6152
• Shipping Materials - Stickers, shelves and pallets made to your specs, pallet repair boards, shipping gates, tilt sticks, used pallets
• Packing Supplies - Shrink wrap, banding
• Planting Stakes - Multiple sizes available
• Treated Lumber - Multiple sizes available
35DIGGERMAGAZINE.COM SEPTEMBER 2016
ranging from $12.50–$20.40. By comparison, the average cost to
install a natural grass field was $887,000 less than the average cost to install a syn-thetic field. A possible reason for the larger values when compared to the literature is the cost of soil stabilization required for clay soils present at the sites.
Cost of maintenance: The average cost of a single year of maintenance for five natural grass fields was $35,000, while the average cost of a single year of mainte-nance for the 10 synthetic infill fields was $7,000. The average annual maintenance budget for natural grass fields was almost five times as much than the average annual maintenance for synthetic infill fields with a difference of $28,000.
Cost of resurfacing: Of the five natural grass fields, only field 1, the university field, is on a schedule to be resurfaced. The cost includes removal of old surface, rolling, topdressing and seeding. This is scheduled to happen every five years at a cost of $21,000.
Re-carpeting of the five synthetic fields was planned for all fields after 8–10 years. The average cost of re-carpeting synthetic fields was $376,000.
Twenty-year budget: The average 20-year maintenance cycle for the five natu-ral grass fields was $903,000. The average cost of a 20-year maintenance cycle for the 10 synthetic infill fields was $1,952,000. The average on synthetic infill fields was two times as much the average for natural grass fields.
Cost of providing an hour of use: The calculated individual annual hours for the natural grass fields averaged 22,000 hours. Expanded to the 20-year period, the usage hours were an average of 438,130 hours. Similarly, the synthetic fields averaged 22,000 hours.
The average annual hours of use on the synthetic fields was caused by low use on the high-school level field. Expanded to the 20-year period, the usage hours were an average of 1,402,000 hours. Comparatively, the average usage hours on the synthetic fields for the 20-year period were three times greater than the natural grass fields.
The average cost to provide an

36 SEPTEMBER 2016 DIGGERMAGAZINE.COM
individual with an hour of use for the five natural grass fields was $2.18. The average cost per individual player hour for the synthetic infill fields was $2.15. This figure emphasizes the importance of how necessary it is for synthetic fields to be adequately utilized. To be effectively utilized, synthetic fields, with their life cycle costs, need to be used for enough hours to be competitive with natural grass fields.
Firmness and temperature: The relationship between month, surface temperature and hardness can be seen in Figures 1 and 2. June and July were the hottest months during the data collection with the surface temperature on synthetic fields measuring at over 140 degrees on the test points located in full sun (Figure 1).
The hottest points on the surface of natural grass fields were up to 100 degrees, but these areas had been worn by traffic and recently sanded and seeded; the unworn full sun areas were measur-ing in the 80-degree range.
Surface hardness on natural grass fields showed great variation during the rainy season from November through March, with firm-ness levels reaching up to 1.5 inches of depression in poorly drained areas that could be judged unplayable (Figure 2). The synthetic fields in this study showed little variation in firmness even during the rainy season, maintaining a depression range between 0.2–1.0 inch.
ConclusionThe synthetic infill fields in this study were as cost effective as
natural grass with the player-hour use cost of $2.15 to the natu-ral grass cost of $2.18, despite being twice as expensive over the 20-year period of analysis. This can likely be credited to the syn-
thetic fields’ ability to maintain surface quality with high levels of use and little impact from weather.
The synthetic surfaces maintained consistent surface hardness through the rainy season while the natural grass fields varied in hardness with the rainy season, losing stability.
These results support the idea that synthetic fields are just as cost effective as natural grass fields, despite their larger costs, by providing greater amounts of player-use hours.
It also suggests that if sufficient hours are utilized on the field, it could potentially be a poor investment depending on the situation of the facility. For example, a high school football coach who wants to protect the field by not letting other groups use it would have to increase the cost per player-use hour.
Brian Daviscourt is a graduate assistant in the Horticulture and Athletics departments at Oregon State University. He can be reached at [email protected].
Bartelt Eleved is an economist specializing in farm management at Oregon State University. He can be reached at 541-737-1409.
Micah Gould is a graduate research assistant in the Turf Management Program in Horticulture at Oregon State University. He can be reached at [email protected].
Dr. Alec Kowalewski is a turfgrass specialist at Oregon State University. He can be reached at [email protected].
Dr. John Lambrinos is a landscape ecologist and associate professor at Oregon State University. He can be reached at [email protected].
Comparing natural and artificial turf
Figure 1. Surface temperatures on natural grass and synthetic infill athletic fields across Oregon in 2015.
Figure 2. Firmness of natural grass and synthetic infill athletic fields across Oregon in 2015.
Natural grass monthly average surface temperature
Month
Month
Month
Inch
es o
f d
epre
ssio
n
Surf
ace
tem
per
atur
e (F
)
Inch
es o
f d
epre
ssio
n
Surf
ace
tem
per
atur
e (F
)
Month0 2 4 6 8 10 120 2 4 6 8 10 12
0 2 4 6 8 10 120 2 4 6 8 10 12
160
140
120
100
80
60
40
20
0
21.81.61.41.21.00.80.60.40.2
0
21.81.61.41.21.00.80.60.40.2
0
160
140
120
100
80
60
40
20
0
Natural grass monthly average surface hardness
Synthetic infill monthly average surface temperature Synthetic infill monthly average surface hardness