Embed Size (px)
Citation preview
GROWING PRESENCE, EMERGING VOICES: PACIFIC ISLANDERS AND ACADEMIC ACHIEVEMENT IN
WASHINGTON
Prepared by:
David T. Takeuchi, Ph.D. School of Social Work and Department of Sociology
University of Washington Seattle
and
Shirley Hune, Ph.D. Educational Leadership and Policy Studies
College of Education University of Washington Seattle
Research Team
Third Andresen Seunghye Hong
Julie Kang, Ph.D. Mavae ‘Aho Redmond
Jeom Ja Yeo
Submitted to The Washington State Commission on Asian Pacific American Affairs
December 2008
GROWING PRESENCE, EMERGING VOICES: PACIFIC ISLANDERS AND ACADEMIC ACHIEVEMENT IN
WASHINGTON
Suggested citation: Takeuchi, D. and S. Hune. (2008). Growing Presence, Emerging Voices: Pacific Islanders and Academic Achievement in Washington. A report submitted to The Washington State Commission on Asian Pacific American Affairs. Seattle, WA: University of Washington.
ii
ACKNOWLEDGEMENTS This report, produced over a relatively short period of time, was made possible with the support, insights, and commitment of a number of people representing different agencies, communities, and constituencies. The Commission on Asian Pacific Americans Affairs (CAPAA), especially Executive Director Ellen Abellera, provided clear guidance about the project and helped to overcome some of the bureaucratic hurdles we encountered. The Multi-Ethnic Think Tank (METT) provided us with useful frameworks for and historical perspective of education and diversity issues in Washington State. Two subgroups of the METT, the Pacific Islander Advisory Committee and the Asian American Advisory Committee, were formed to provide us with us advice and consultation about their respective communities. We were impressed with their commitment, passion, and knowledge about educational issues in Washington State and the nation. The Washington Educational Association and the Seattle Educational Association provided us with meeting space for our community meetings. We thank the teachers who participated in our survey and who offered their perspectives on future directions for educating students who come from different cultural traditions. The Southwest Youth and Family Services helped us with some key informant interviews and discussions with Pacific Islanders who had attended Washington State public schools. The Office of Superintendent and Public Instruction (OSPI) provided our research team with access to some of the data on student enrollment and academic performance. Frances Contreras, an assistant professor at the University of Washington and the principal investigator for the Hispanic Study, shared materials and resources with our studies and we are appreciative of her collaborative efforts. We were fortunate to have tables and graphs using data from the Beyond High School project, which provided critical information about the perspectives of students and parents in Washington State. Charles Hirschman, Patty J. Glynn, and Nikolas Pharris-Ciurej were incredibly supportive and gracious in helping us with our requests for tables in a short amount of time. Michael Spencer, an alumnus of Kamehameha Schools and currently an associate professor at the University of Michigan, provided extensive consultation on the project and assisted in writing key parts of this report. The College of Education at the University of Washington provided important institutional support that enabled us to conduct this study in an efficient manner over the past few months. Lynne Lampe helped us tremendously in editing the final report. We thank the research team for their talent, resourcefulness, and commitment. Jeom Ja Yeo played a key role in educational data analysis, Seunghye Hong provided the demographic data, Julie Kang developed the teacher survey, and Third Andresen and Mavae ‘Aho Redmond contributed key
iii
documents and interviews. Each researcher provided valuable input and resources at our meetings. We are most appreciative of their gracious responses to our many requests for data, information, and revisions, often during late evenings, weekends, and holidays. The project has been a valuable teaching and learning opportunity. Finally, we sincerely appreciate the support and input from residents living in diverse communities we met along the way. They provided us with their time, energy, and ideas to help shape the final product. To them, we are ever grateful. David T. Takeuchi Shirley Hune December 2008
iv
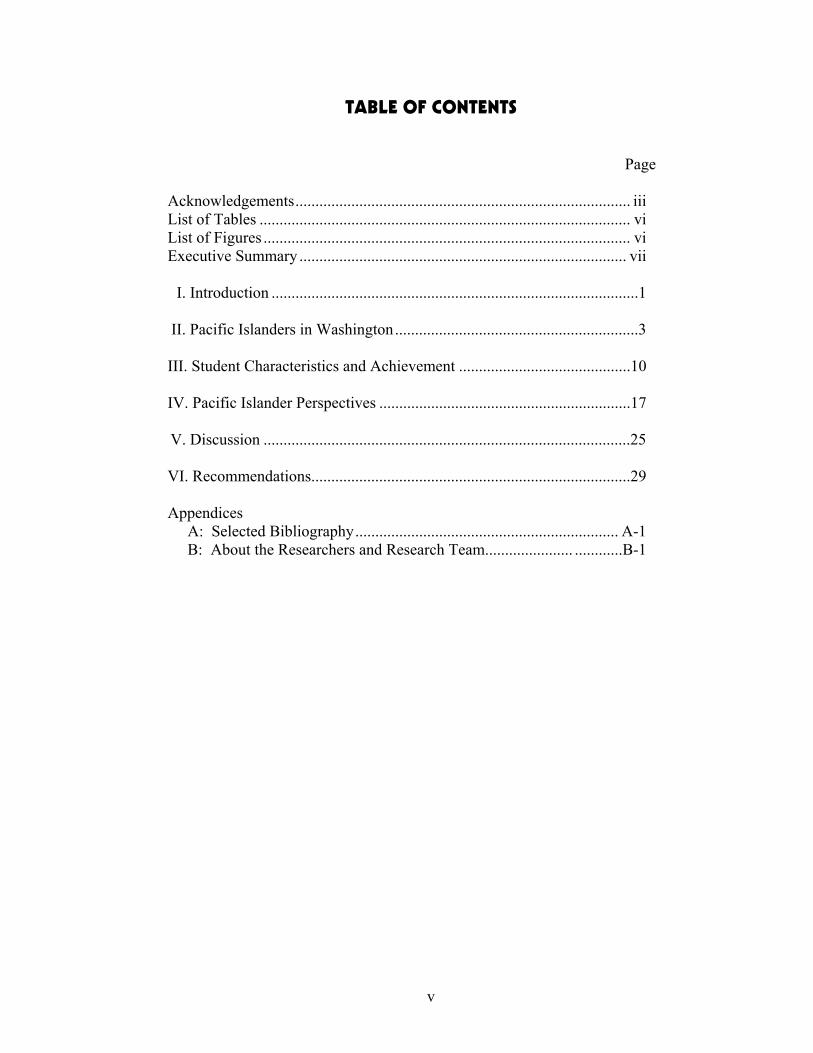
TABLE OF CONTENTS Page Acknowledgements.................................................................................... iii List of Tables ............................................................................................. vi List of Figures ............................................................................................ vi Executive Summary .................................................................................. vii I. Introduction ............................................................................................1 II. Pacific Islanders in Washington.............................................................3 III. Student Characteristics and Achievement ...........................................10 IV. Pacific Islander Perspectives ...............................................................17 V. Discussion ............................................................................................25 VI. Recommendations................................................................................29 Appendices A: Selected Bibliography.................................................................. A-1 B: About the Researchers and Research Team...................... ............B-1
v
LIST OF TABLES
Table Page II-A. Washington State Racial and Ethnic Population, 2007........................................ 3 II-B. Washington’s Ranking in 2007 by Percentage and Numbers of the Total Population Who Are Pacific Islanders........................................................ 4 II-C. Top 10 Counties With Largest Pacific Islander Populations, 2003..................... 4 II-D. Median Household Income and Per Capita Income by Races and
Pacific Islander Ethnic Groups in the United States and Washington State, 1999 ....................................................................................... 7 III-A. Pacific Islander Student Profile in Washington State Public Schools, 2007-2008 ....................................................................... 10 III-B. Geographic Concentration of Pacific Island Students and Characteristics
of School Districts With Pacific Islander Students, 2007–2008 ........................ 11 III-C. WASL Performance by Race, 2007–2008 ......................................................... 14 IV-A. Educational Aspirations, Expectations, and Preparations .................................. 18 IV-B. Student Perceptions of Obstacles to Obtaining a Desired Job ........................... 20 IV-C. Parents’ Involvement in Their Child’s Education.............................................. 21
vi

LIST OF FIGURES
Figure Page II-A. Ethnic Composition of Pacific Islanders Category in the United States
and Washington State, 2007 ................................................................................ 5 II-B. Pacific Islander Population Changes in the United States and Washington State, 2002–2007 ............................................................................. 6 II-C. Percentages of Individuals Below Poverty Level by Pacific Islander
Ethnic Groups in the United States and Washington State, 2000 ........................ 8 II-D. Percentages of Foreign Born by PI Ethnic Groups in the United States and Washington State, 2000 ................................................................................ 8 II-E. Percentages of Bachelor’s Degree or Higher by PI Ethnic Groups
in the United States and Washington State, 2000 ................................................ 9 III-A. Samoan Demographic Profile in Seattle Public Schools, 2007–2008................ 12 III-B. Samoan Educational Status by Attendance, Suspension, and Dropout, Seattle Public Schools, 2007–2008.............................................. 13 III-C. WASL 10th-Grade Performance by Race and Ethnicity, 2007–2008................. 15 IV-A. Comparison of Plans to Attend College with Accomplishment of Attending College.......................................................................................... 18 IV-B. Comparison of Plans to Attend a 4-Year College With Accomplishment of Attending a 4-Year College............................................... 19 IV-C. Parent Aspirations and Expectations for a College Degree
(BA/BS) for Student .......................................................................................... 21
vii

GROWING PRESENCE, EMERGING VOICES: PACIFIC ISLANDERS AND ACADEMIC ACHIEVEMENT IN WASHINGTON
EXECUTIVE SUMMARY
Prepared by:
David T. Takeuchi, Ph.D. Shirley Hune, Ph.D.
University of Washington Seattle
PURPOSE The State Legislature requested a study on academic achievement focusing exclusively on Pacific Islanders. This report fulfills the requirement of Section 119 of Engrossed Substitute House Bill (Chapter 329, Laws of 2008) to conduct a study of the achievement gap among Pacific Islanders. Similar, but not identical, studies on academic achievement have been conducted for African Americans, Asian Americans, Latinos, and Native Americans. This study began on August 1, 2008, and consists of a review of the available empirical literature, analysis of the U.S. Census data, analyses of enrollment and achievement data from the Office of the Superintendent and Public Instruction (OSPI), review of pertinent academic performance data from other sources, and a few original data collection activities such as a teacher survey and key informant interviews with Pacific Islander students who graduated from Washington public schools. We also held monthly meetings with an advisory committee comprising representatives from the Pacific Islander community. OVERVIEW OF PACIFIC ISLANDERS Pacific Islanders have made lasting contributions in the United States and the State of Washington for a long period of time, and they continue to leave their mark. Although Pacific Islanders have a relatively small population size, their numbers have increased at a faster pace when compared with the overall population in the State. They are diverse in their origins and in their demographic characteristics. A substantial number live in poverty and a sizable proportion are from different countries. Despite their growing presence, unique characteristics, and pressing challenges, their voices about their quality of life have not been heard. One reason Pacific Islanders have been missing from discussions is that they are often categorized with Asian Americans. Pacific Islanders and Academic Achievement Pacific Islanders are frequently at a disadvantage in Washington state: They are more likely, on average, to come from poor families and are often enrolled in schools in low income neighborhoods. Second, they are often less
viii
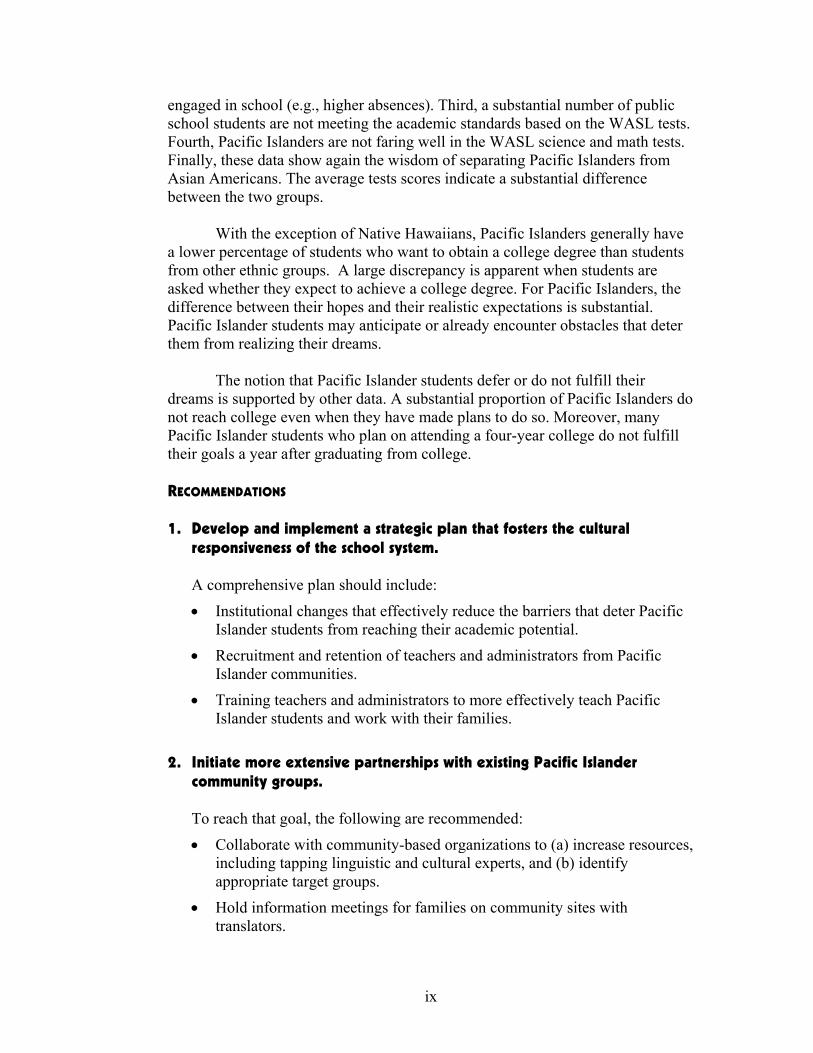
engaged in school (e.g., higher absences). Third, a substantial number of public school students are not meeting the academic standards based on the WASL tests. Fourth, Pacific Islanders are not faring well in the WASL science and math tests. Finally, these data show again the wisdom of separating Pacific Islanders from Asian Americans. The average tests scores indicate a substantial difference between the two groups. With the exception of Native Hawaiians, Pacific Islanders generally have a lower percentage of students who want to obtain a college degree than students from other ethnic groups. A large discrepancy is apparent when students are asked whether they expect to achieve a college degree. For Pacific Islanders, the difference between their hopes and their realistic expectations is substantial. Pacific Islander students may anticipate or already encounter obstacles that deter them from realizing their dreams. The notion that Pacific Islander students defer or do not fulfill their dreams is supported by other data. A substantial proportion of Pacific Islanders do not reach college even when they have made plans to do so. Moreover, many Pacific Islander students who plan on attending a four-year college do not fulfill their goals a year after graduating from college. RECOMMENDATIONS 1. Develop and implement a strategic plan that fosters the cultural
responsiveness of the school system. A comprehensive plan should include:
• Institutional changes that effectively reduce the barriers that deter Pacific Islander students from reaching their academic potential.
• Recruitment and retention of teachers and administrators from Pacific Islander communities.
• Training teachers and administrators to more effectively teach Pacific Islander students and work with their families.
2. Initiate more extensive partnerships with existing Pacific Islander
community groups. To reach that goal, the following are recommended:
• Collaborate with community-based organizations to (a) increase resources, including tapping linguistic and cultural experts, and (b) identify appropriate target groups.
• Hold information meetings for families on community sites with translators.
ix
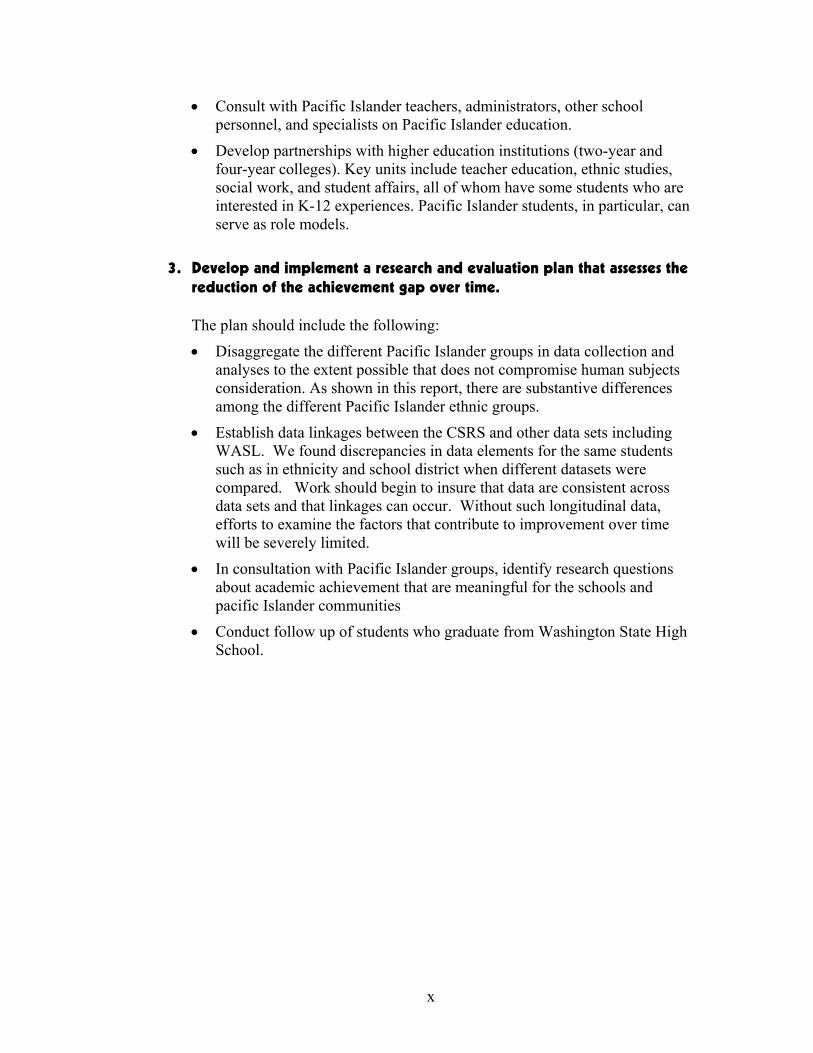
• Consult with Pacific Islander teachers, administrators, other school personnel, and specialists on Pacific Islander education.
• Develop partnerships with higher education institutions (two-year and four-year colleges). Key units include teacher education, ethnic studies, social work, and student affairs, all of whom have some students who are interested in K-12 experiences. Pacific Islander students, in particular, can serve as role models.
3. Develop and implement a research and evaluation plan that assesses the
reduction of the achievement gap over time. The plan should include the following:
• Disaggregate the different Pacific Islander groups in data collection and analyses to the extent possible that does not compromise human subjects consideration. As shown in this report, there are substantive differences among the different Pacific Islander ethnic groups.
• Establish data linkages between the CSRS and other data sets including WASL. We found discrepancies in data elements for the same students such as in ethnicity and school district when different datasets were compared. Work should begin to insure that data are consistent across data sets and that linkages can occur. Without such longitudinal data, efforts to examine the factors that contribute to improvement over time will be severely limited.
• In consultation with Pacific Islander groups, identify research questions about academic achievement that are meaningful for the schools and pacific Islander communities
• Conduct follow up of students who graduate from Washington State High School.
x
1
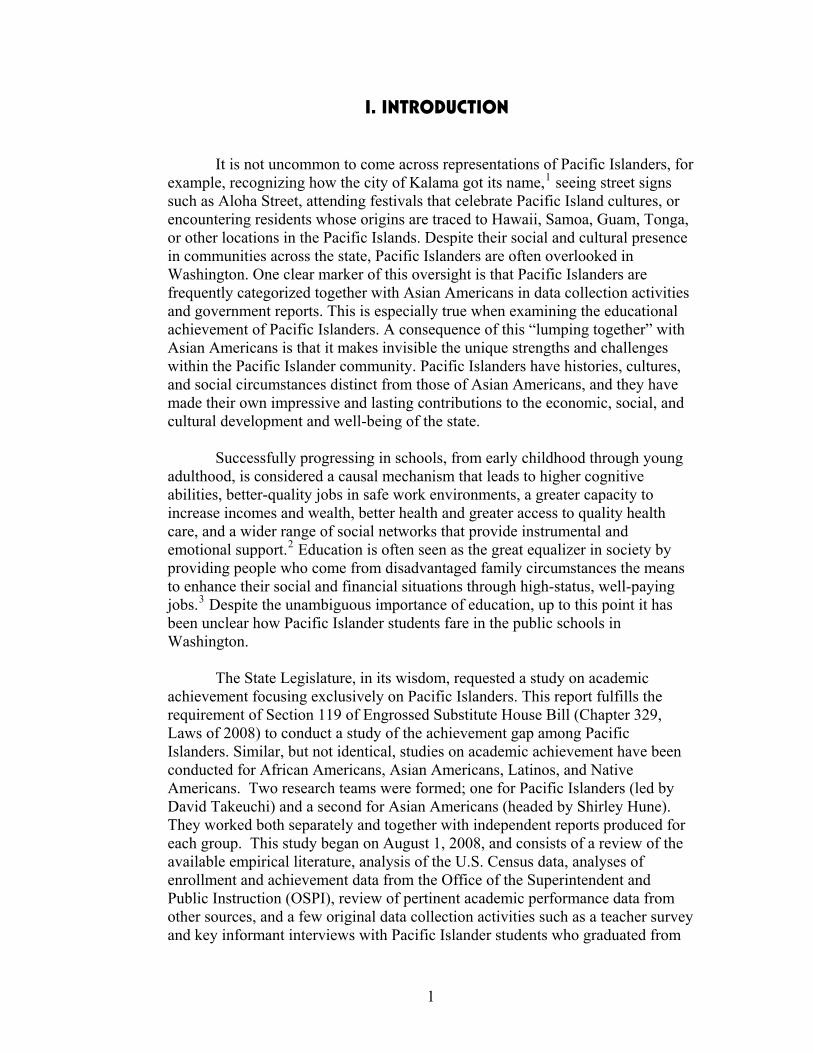
I. INTRODUCTION It is not uncommon to come across representations of Pacific Islanders, for example, recognizing how the city of Kalama got its name,1 seeing street signs such as Aloha Street, attending festivals that celebrate Pacific Island cultures, or encountering residents whose origins are traced to Hawaii, Samoa, Guam, Tonga, or other locations in the Pacific Islands. Despite their social and cultural presence in communities across the state, Pacific Islanders are often overlooked in Washington. One clear marker of this oversight is that Pacific Islanders are frequently categorized together with Asian Americans in data collection activities and government reports. This is especially true when examining the educational achievement of Pacific Islanders. A consequence of this “lumping together” with Asian Americans is that it makes invisible the unique strengths and challenges within the Pacific Islander community. Pacific Islanders have histories, cultures, and social circumstances distinct from those of Asian Americans, and they have made their own impressive and lasting contributions to the economic, social, and cultural development and well-being of the state. Successfully progressing in schools, from early childhood through young adulthood, is considered a causal mechanism that leads to higher cognitive abilities, better-quality jobs in safe work environments, a greater capacity to increase incomes and wealth, better health and greater access to quality health care, and a wider range of social networks that provide instrumental and emotional support.2 Education is often seen as the great equalizer in society by providing people who come from disadvantaged family circumstances the means to enhance their social and financial situations through high-status, well-paying jobs.3 Despite the unambiguous importance of education, up to this point it has been unclear how Pacific Islander students fare in the public schools in Washington. The State Legislature, in its wisdom, requested a study on academic achievement focusing exclusively on Pacific Islanders. This report fulfills the requirement of Section 119 of Engrossed Substitute House Bill (Chapter 329, Laws of 2008) to conduct a study of the achievement gap among Pacific Islanders. Similar, but not identical, studies on academic achievement have been conducted for African Americans, Asian Americans, Latinos, and Native Americans. Two research teams were formed; one for Pacific Islanders (led by David Takeuchi) and a second for Asian Americans (headed by Shirley Hune). They worked both separately and together with independent reports produced for each group. This study began on August 1, 2008, and consists of a review of the available empirical literature, analysis of the U.S. Census data, analyses of enrollment and achievement data from the Office of the Superintendent and Public Instruction (OSPI), review of pertinent academic performance data from other sources, and a few original data collection activities such as a teacher survey and key informant interviews with Pacific Islander students who graduated from
Washington public schools. We also held monthly meetings with an advisory committee comprising representatives from the Pacific Islander community. With this report, we provide the results of our investigation of the educational performance of and related factors among Pacific Islander students. We build on past studies and reports, most notably the Multi-Ethnic Think Tank (METT) Position Statement published in 2002, to document how Pacific Islanders are faring in the public schools in Washington State.4 The METT provides a core theme for this report: the recognition that educational performance is a multifaceted process not caused by a single set of factors. Although socioeconomic factors, especially poverty, are important in understanding academic achievement, so are school and other institutional factors that constrain students and parents from fully engaging in school. We present our findings with this core theme in mind.
2
II. PACIFIC ISLANDERS IN WASHINGTON
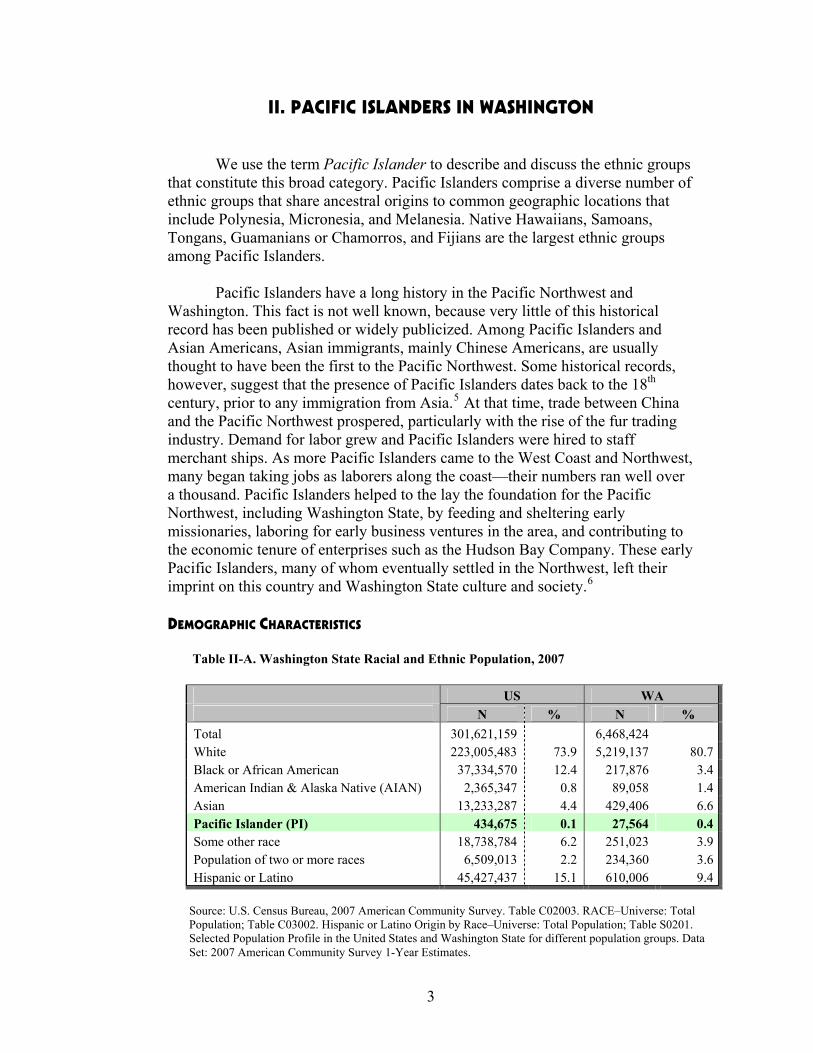
We use the term Pacific Islander to describe and discuss the ethnic groups that constitute this broad category. Pacific Islanders comprise a diverse number of ethnic groups that share ancestral origins to common geographic locations that include Polynesia, Micronesia, and Melanesia. Native Hawaiians, Samoans, Tongans, Guamanians or Chamorros, and Fijians are the largest ethnic groups among Pacific Islanders. Pacific Islanders have a long history in the Pacific Northwest and Washington. This fact is not well known, because very little of this historical record has been published or widely publicized. Among Pacific Islanders and Asian Americans, Asian immigrants, mainly Chinese Americans, are usually thought to have been the first to the Pacific Northwest. Some historical records, however, suggest that the presence of Pacific Islanders dates back to the 18th century, prior to any immigration from Asia.5 At that time, trade between China and the Pacific Northwest prospered, particularly with the rise of the fur trading industry. Demand for labor grew and Pacific Islanders were hired to staff merchant ships. As more Pacific Islanders came to the West Coast and Northwest, many began taking jobs as laborers along the coast—their numbers ran well over a thousand. Pacific Islanders helped to the lay the foundation for the Pacific Northwest, including Washington State, by feeding and sheltering early missionaries, laboring for early business ventures in the area, and contributing to the economic tenure of enterprises such as the Hudson Bay Company. These early Pacific Islanders, many of whom eventually settled in the Northwest, left their imprint on this country and Washington State culture and society.6
DEMOGRAPHIC CHARACTERISTICS
Table II-A. Washington State Racial and Ethnic Population, 2007
US WA N % N %
Total 301,621,159 6,468,424 White 223,005,483 73.9 5,219,137 80.7Black or African American 37,334,570 12.4 217,876 3.4American Indian & Alaska Native (AIAN) 2,365,347 0.8 89,058 1.4Asian 13,233,287 4.4 429,406 6.6Pacific Islander (PI) 434,675 27,564 0.40.1 Some other race 18,738,784 6.2 251,023 3.9Population of two or more races 6,509,013 2.2 234,360 3.6Hispanic or Latino 45,427,437 15.1 610,006 9.4
Source: U.S. Census Bureau, 2007 American Community Survey. Table C02003. RACE–Universe: Total Population; Table C03002. Hispanic or Latino Origin by Race–Universe: Total Population; Table S0201. Selected Population Profile in the United States and Washington State for different population groups. Data Set: 2007 American Community Survey 1-Year Estimates.
3
Pacific Islanders currently constitute a larger proportion of Washington State’s population than of the United States as a whole. Recent estimates show that Pacific Islanders totaled 434,675 or 0.1% of the U.S. population. In Washington, the estimated number of Pacific Islanders totaled 27,564 or 0.4% of the State’s population.7
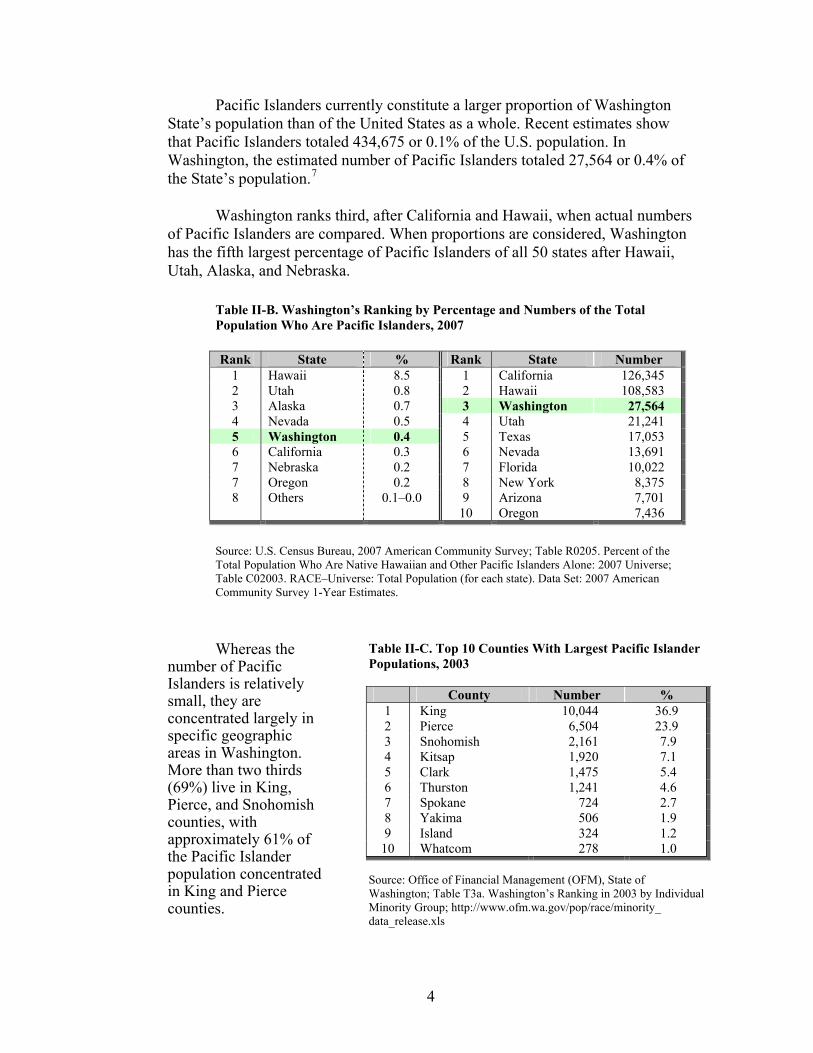
Washington ranks third, after California and Hawaii, when actual numbers of Pacific Islanders are compared. When proportions are considered, Washington has the fifth largest percentage of Pacific Islanders of all 50 states after Hawaii, Utah, Alaska, and Nebraska.
Table II-B. Washington’s Ranking by Percentage and Numbers of the Total Population Who Are Pacific Islanders, 2007
Rank State % Rank State Number
1 Hawaii 8.5 1 California 126,345 2 Utah 0.8 2 Hawaii 108,583 3 Alaska 0.7 3 Washington 27,564 4 Nevada 0.5 4 Utah 21,241 5 Washington 0.4 5 Texas 17,053 6 California 0.3 6 Nevada 13,691 7 Nebraska 0.2 7 Florida 10,022 7 Oregon 0.2 8 New York 8,375 8 Others 0.1–0.0 9 Arizona 7,701 10 Oregon 7,436
Source: U.S. Census Bureau, 2007 American Community Survey; Table R0205. Percent of the Total Population Who Are Native Hawaiian and Other Pacific Islanders Alone: 2007 Universe; Table C02003. RACE–Universe: Total Population (for each state). Data Set: 2007 American Community Survey 1-Year Estimates.
Whereas the number of Pacific Islanders is relatively small, they are concentrated largely in specific geographic areas in Washington. More than two thirds (69%) live in King, Pierce, and Snohomish counties, with approximately 61% of the Pacific Islander population concentrated in King and Pierce counties.
Table II-C. Top 10 Counties With Largest Pacific Islander Populations, 2003
County Number %
1 King 10,044 36.9 2 Pierce 6,504 23.9 3 Snohomish 2,161 7.9 4 Kitsap 1,920 7.1 5 Clark 1,475 5.4 6 Thurston 1,241 4.6 7 Spokane 724 2.7 8 Yakima 506 1.9 9 Island 324 1.2
10 Whatcom 278 1.0
Source: Office of Financial Management (OFM), State of Washington; Table T3a. Washington’s Ranking in 2003 by Individual Minority Group; http://www.ofm.wa.gov/pop/race/minority_ data_release.xls
4
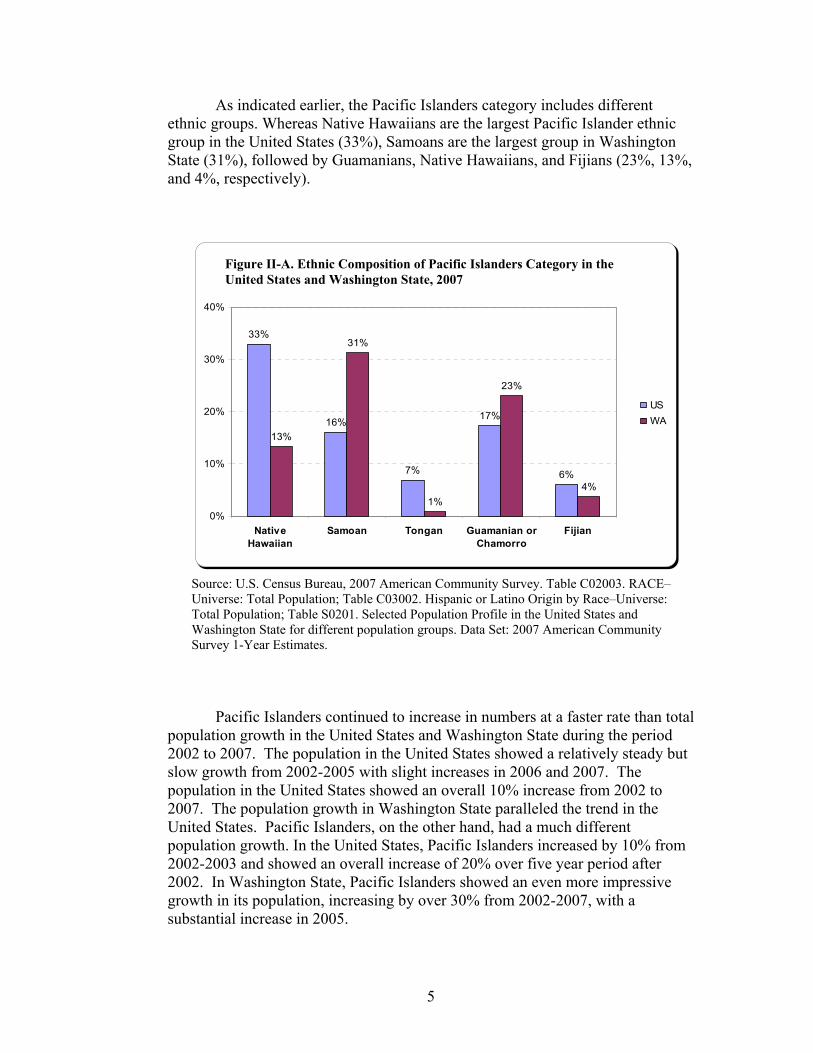
As indicated earlier, the Pacific Islanders category includes different ethnic groups. Whereas Native Hawaiians are the largest Pacific Islander ethnic group in the United States (33%), Samoans are the largest group in Washington State (31%), followed by Guamanians, Native Hawaiians, and Fijians (23%, 13%, and 4%, respectively).
Figure 1. Ethnic composition of Pacific Islanders in the U.S. and Washington State, 2007
33%
16%
7%
17%
6%
13%
31%
1%
23%
4%
0%
10%
20%
30%
NativeHawaiian
Samoan Tongan Guamanian orChamorro
Fijian
40%
USWA
Figure II-A. Ethnic Composition of Pacific Islanders Category in the United States and Washington State, 2007
Source: U.S. Census Bureau, 2007 American Community Survey. Table C02003. RACE–Universe: Total Population; Table C03002. Hispanic or Latino Origin by Race–Universe: Total Population; Table S0201. Selected Population Profile in the United States and Washington State for different population groups. Data Set: 2007 American Community Survey 1-Year Estimates.
Pacific Islanders continued to increase in numbers at a faster rate than total population growth in the United States and Washington State during the period 2002 to 2007. The population in the United States showed a relatively steady but slow growth from 2002-2005 with slight increases in 2006 and 2007. The population in the United States showed an overall 10% increase from 2002 to 2007. The population growth in Washington State paralleled the trend in the United States. Pacific Islanders, on the other hand, had a much different population growth. In the United States, Pacific Islanders increased by 10% from 2002-2003 and showed an overall increase of 20% over five year period after 2002. In Washington State, Pacific Islanders showed an even more impressive growth in its population, increasing by over 30% from 2002-2007, with a substantial increase in 2005.
5
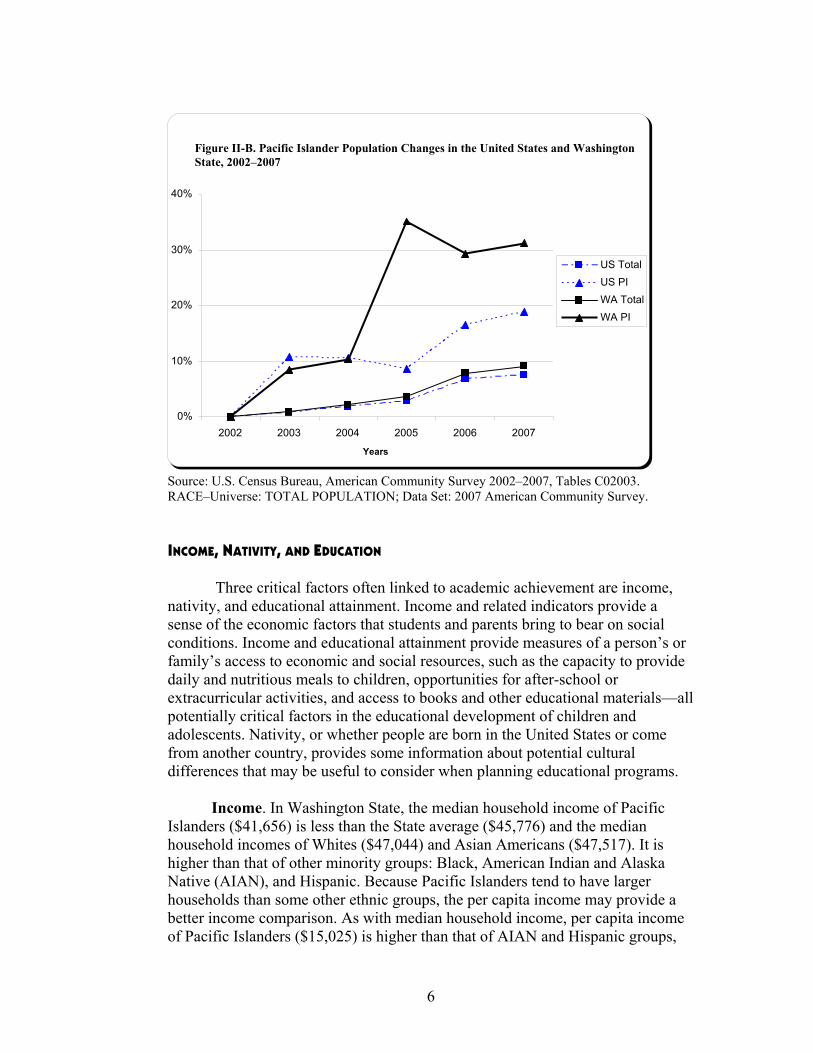
Figure II-B. Pacific Islander Population Changes in the United States and Washington State, 2002–2007
0%
10%
20%
30%
40%
US Total US PI WA Total WA PI
2002 2003 2004 2005 2006 2007
Years
Source: U.S. Census Bureau, American Community Survey 2002–2007, Tables C02003. RACE–Universe: TOTAL POPULATION; Data Set: 2007 American Community Survey.
INCOME, NATIVITY, AND EDUCATION
Three critical factors often linked to academic achievement are income, nativity, and educational attainment. Income and related indicators provide a sense of the economic factors that students and parents bring to bear on social conditions. Income and educational attainment provide measures of a person’s or family’s access to economic and social resources, such as the capacity to provide daily and nutritious meals to children, opportunities for after-school or extracurricular activities, and access to books and other educational materials—all potentially critical factors in the educational development of children and adolescents. Nativity, or whether people are born in the United States or come from another country, provides some information about potential cultural differences that may be useful to consider when planning educational programs.
Income. In Washington State, the median household income of Pacific Islanders ($41,656) is less than the State average ($45,776) and the median household incomes of Whites ($47,044) and Asian Americans ($47,517). It is higher than that of other minority groups: Black, American Indian and Alaska Native (AIAN), and Hispanic. Because Pacific Islanders tend to have larger households than some other ethnic groups, the per capita income may provide a better income comparison. As with median household income, per capita income of Pacific Islanders ($15,025) is higher than that of AIAN and Hispanic groups,
6
but it is lower than that of Blacks ($17,748). Pacific Islanders still have lower per capita income than the State average and than Whites and Asian Americans.
We also find income variations among Pacific Islanders. Samoans have the lowest median household income and per capita income when compared with other Pacific Islander ethnic groups. Tongans have the second lowest per capita income; although they show the highest median household income, it tends to support a larger household.
These income comparisons provide stark documentation about the problems in lumping Pacific Islanders with Asian Americans. The median household income and per capita income levels of Pacific Islanders differ dramatically from those of Asian Americans. These data highlight how dissimilar Pacific Islanders and Asian Americans are in their economic status. Conclusions about the economic status of Pacific Islanders are far different when the two groups are considered together rather than separately.
Table II-D. Median Household Income and Per Capita Income by Races and Pacific Islanders Ethnic Groups in the United States and Washington State, 1999
Median Household Income
in 1999 Per Capita Income in 1999
US WA US WA “Race Total $50,046 $45,776 $21,587 $22,973 White $44,687 $47,044 $23,918 $24,674 Black $29,423 $35,919 $14,437 $17,748 AIAN $30,599 $32,670 $12,893 $13,622 Asian $51,908 $47,517 $21,823 $20,141 Pacific Islander $42,717 $41,656 $15,054 $15,025 Hispanic $33,676 $32,757 $12,111 $11,293 Ethnic group Native Hawaiian $44,554 $40,870 $17,697 $19,765 Samoan $40,620 $39,614 $12,160 $11,337 Tongan $45,700 $65,388 $10,680 $13,177 Guamanian $46,306 $47,287 $17,583 $16,809 Fijian $45,420 $40,625 $14,745 $22,380
Source: U.S. Census Bureau. Tables DP-3. Profile of Selected Economic Characteristics: 2000. Data Set: Census 2000 Summary File 4 (SF 4) Sample data (1-in-6 households).
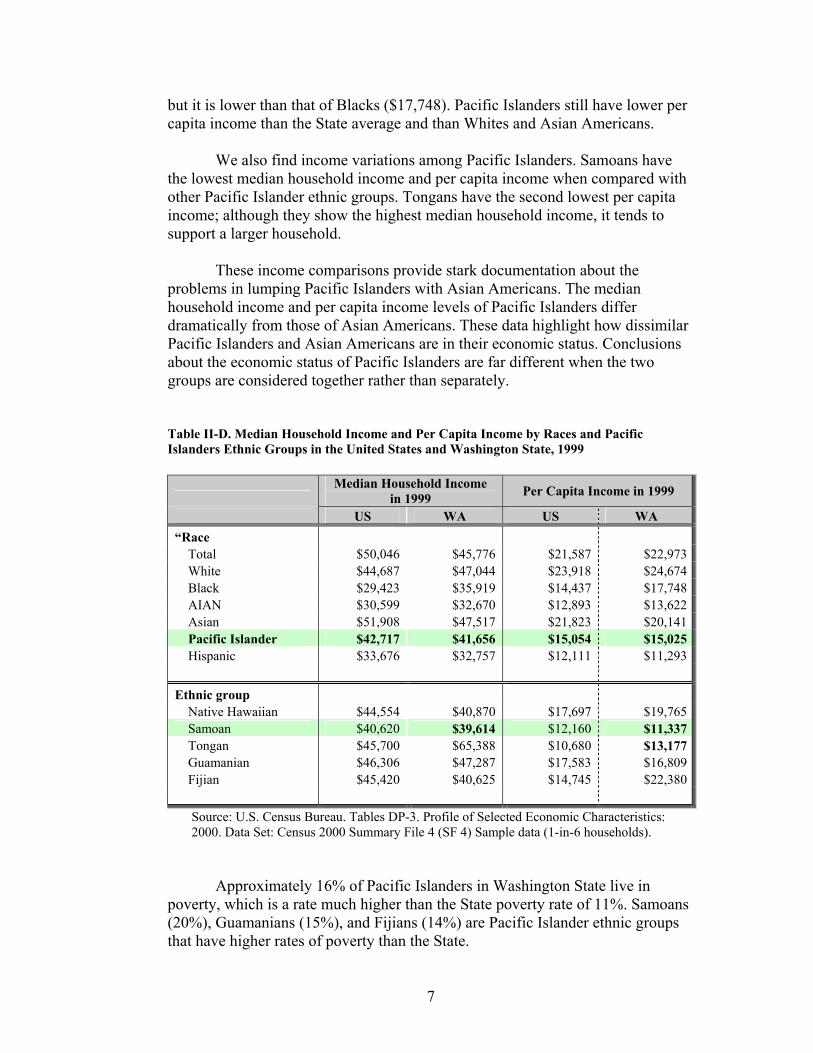
Approximately 16% of Pacific Islanders in Washington State live in poverty, which is a rate much higher than the State poverty rate of 11%. Samoans (20%), Guamanians (15%), and Fijians (14%) are Pacific Islander ethnic groups that have higher rates of poverty than the State.
7
Source: U.S. Census Bureau. Census 2000 Summary File 4 (SF 4) Sample data (1-in-6 households).
Figure II-D. Percentages of Foreign Born by PI Ethnic Groups
11%
20%
2%
21%
12%
78%
10%
17%
2%
20%
3%
76%
51% 55%
0%
20%
40%
60%
80%
Total PI NativeHawaiian
Samoan Tongan Guamanian Fijian
US
WA
Figure II-C. Percentages of Individuals Below Poverty Level by PI Ethnic Groups in the United States and Washington State, 2000
12%
18%
16%
20%
20%
14%
11%
11%
16%
10%
20%
5%
15%
14%
0%
5%
10%
15%
20%
25%
Total PI NativeHawaiian
Samoan Tongan Guamanian Fijian
USWA
Source: U.S. Census Bureau. Tables DP-3. Profile of Selected Economic Characteristics: 2000. Data Set: Census 2000 Summary File 4 (SF 4) Sample data (1-in-6 households).
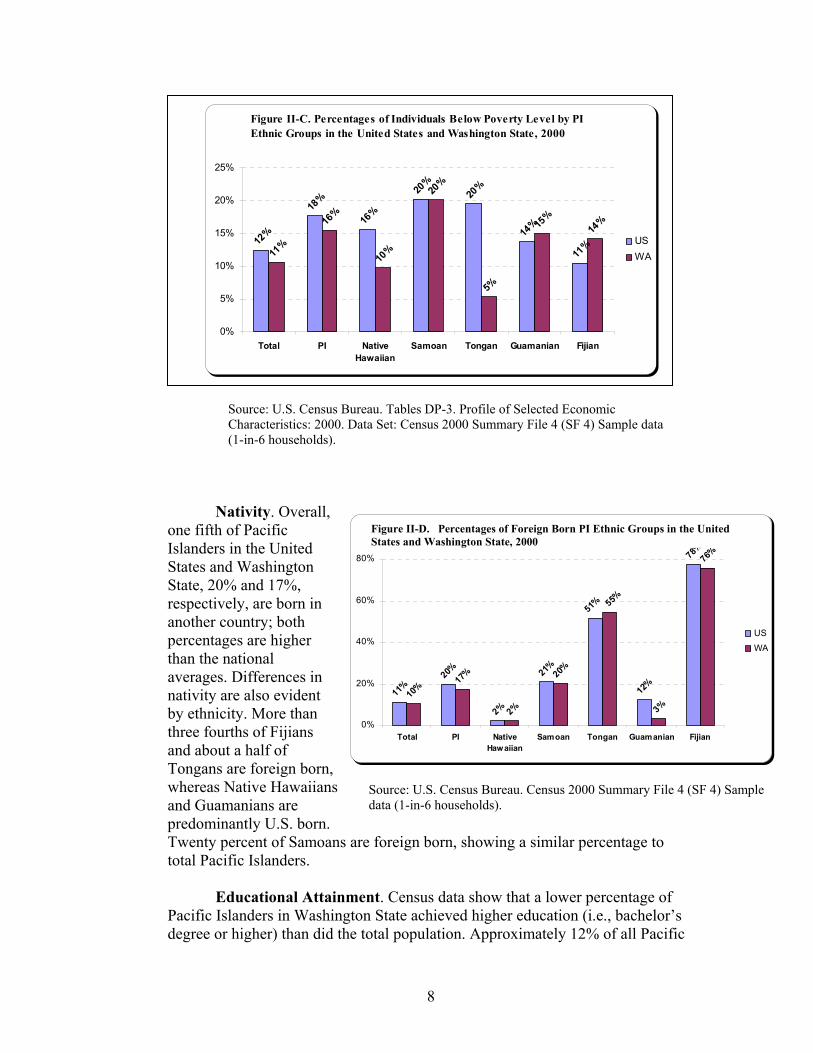
Nativity. Overall, one fifth of Pacific Islanders in the United States and Washington State, 20% and 17%, respectively, are born in another country; both percentages are higher
Figure II-D. Percentages of Foreign Born PI Ethnic Groups in the United States and Washington State, 2000
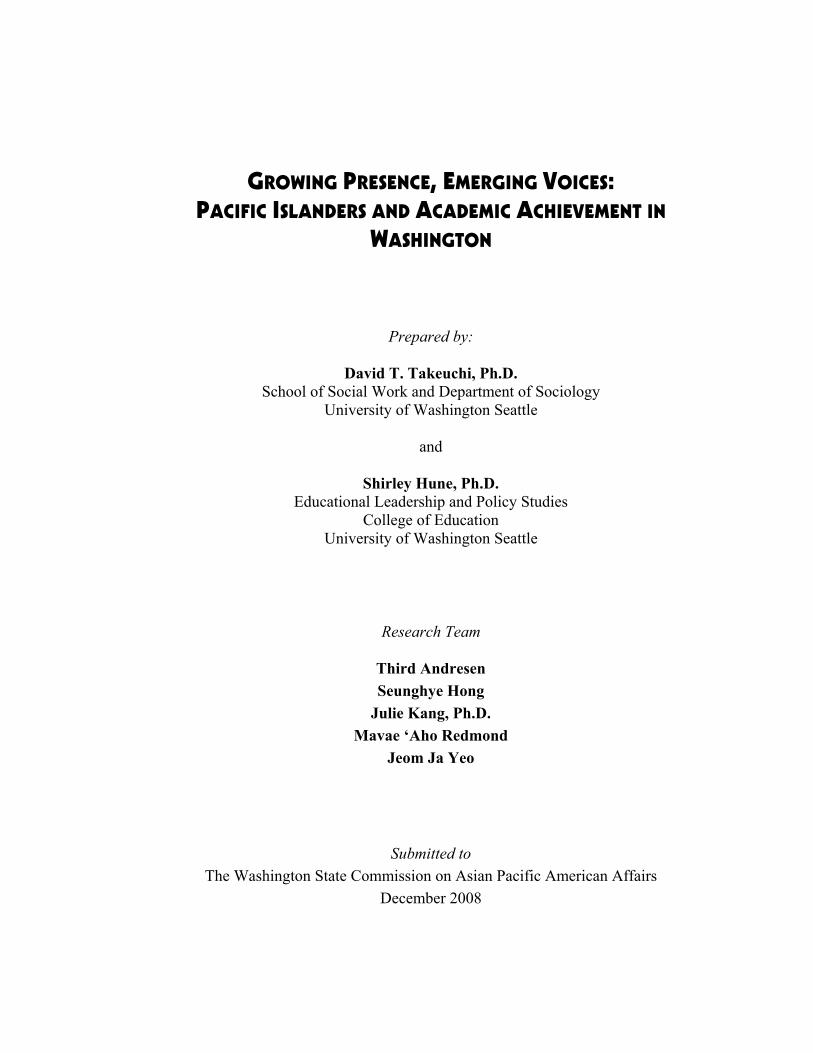
than the national averages. Differences in nativity are also evident by ethnicity. More than three fourths of Fijians and about a half of Tongans are foreign born, whereas Native Hawaiians and Guamanians are predominantly U.S. born. Twenty percent of Samoans are foreign born, showing a similar percentage to total Pacific Islanders. Educational Attainment. Census data show that a lower percentage of Pacific Islanders in Washington State achieved higher education (i.e., bachelor’s degree or higher) than did the total population. Approximately 12% of all Pacific
8
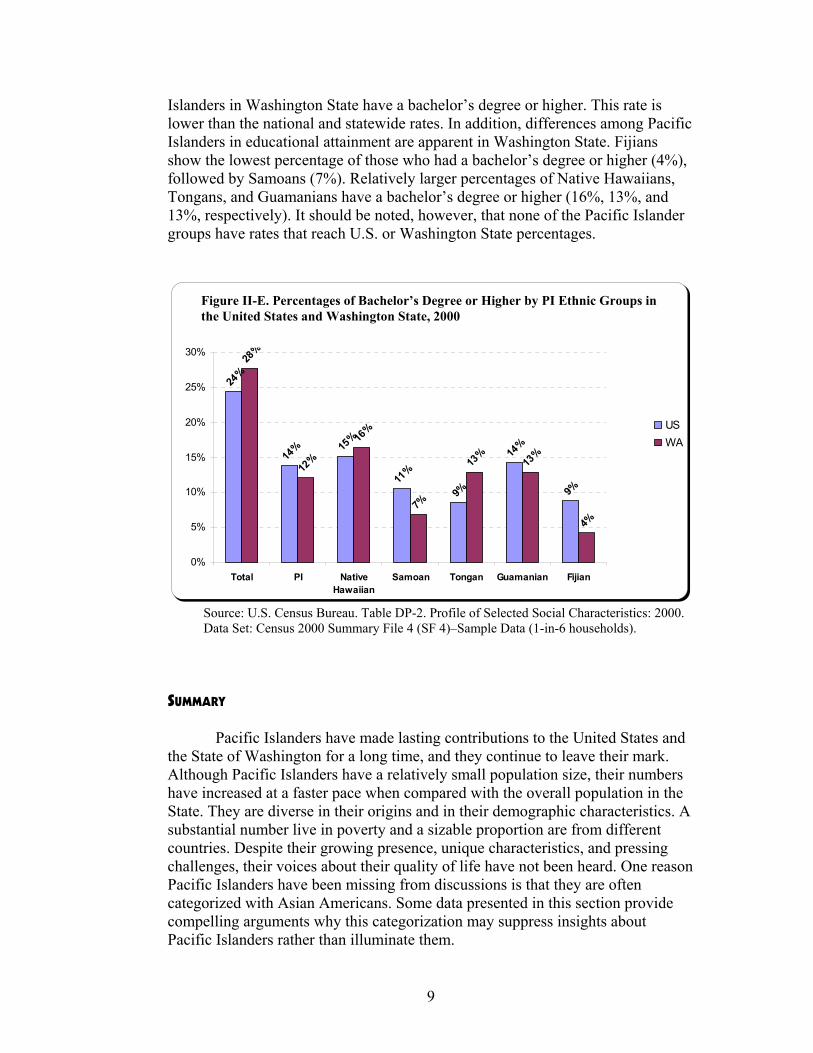
Islanders in Washington State have a bachelor’s degree or higher. This rate is lower than the national and statewide rates. In addition, differences among Pacific Islanders in educational attainment are apparent in Washington State. Fijians show the lowest percentage of those who had a bachelor’s degree or higher (4%), followed by Samoans (7%). Relatively larger percentages of Native Hawaiians, Tongans, and Guamanians have a bachelor’s degree or higher (16%, 13%, and 13%, respectively). It should be noted, however, that none of the Pacific Islander groups have rates that reach U.S. or Washington State percentages.
Figure II-E. Percentages of Bachelor's Degree or Higherby PI ethnic groups in the U.S. and Washington State, 2000
24%
14% 15
%
11%
9%
14%
9%
28%
12%
16%
7%
13%
13%
4%
0%
5%
10%
15%
20%
25%
30%
Total PI NativeHawaiian
Samoan Tongan Guamanian Fijian
USWA
Figure II-E. Percentages of Bachelor’s Degree or Higher by PI Ethnic Groups in the United States and Washington State, 2000
Source: U.S. Census Bureau. Table DP-2. Profile of Selected Social Characteristics: 2000. Data Set: Census 2000 Summary File 4 (SF 4)–Sample Data (1-in-6 households).
SUMMARY Pacific Islanders have made lasting contributions to the United States and the State of Washington for a long time, and they continue to leave their mark. Although Pacific Islanders have a relatively small population size, their numbers have increased at a faster pace when compared with the overall population in the State. They are diverse in their origins and in their demographic characteristics. A substantial number live in poverty and a sizable proportion are from different countries. Despite their growing presence, unique characteristics, and pressing challenges, their voices about their quality of life have not been heard. One reason Pacific Islanders have been missing from discussions is that they are often categorized with Asian Americans. Some data presented in this section provide compelling arguments why this categorization may suppress insights about Pacific Islanders rather than illuminate them.
9
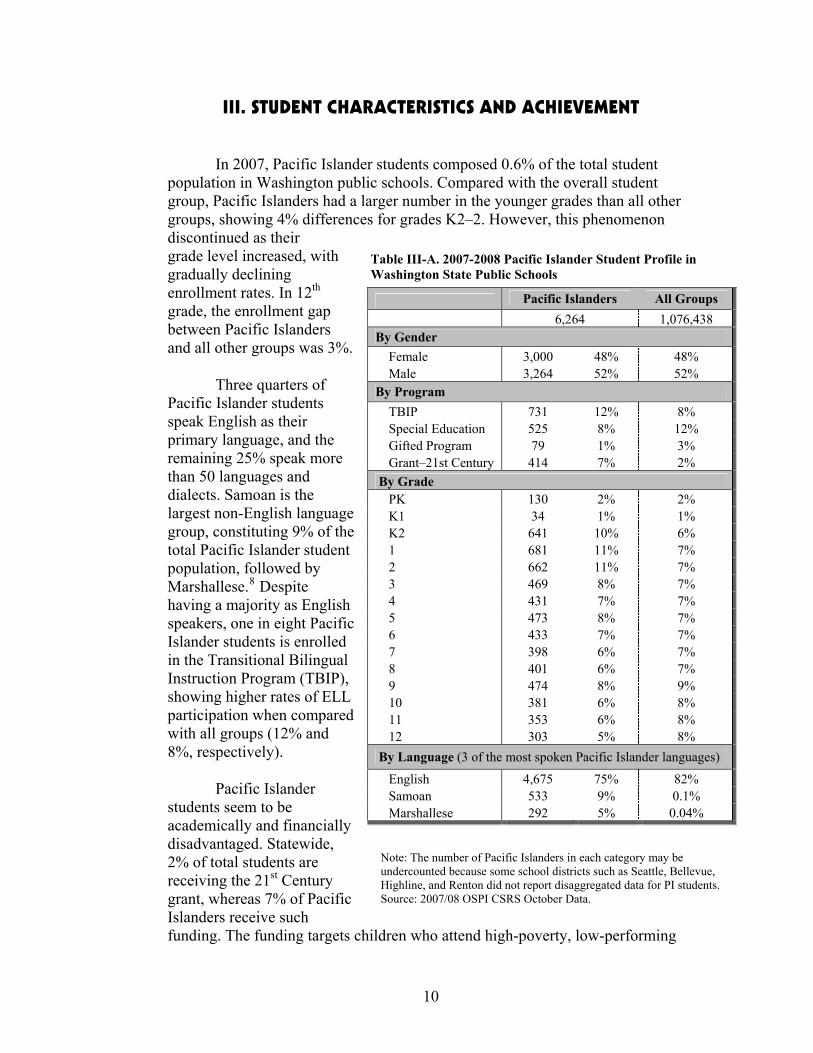
III. STUDENT CHARACTERISTICS AND ACHIEVEMENT In 2007, Pacific Islander students composed 0.6% of the total student population in Washington public schools. Compared with the overall student group, Pacific Islanders had a larger number in the younger grades than all other groups, showing 4% differences for grades K2–2. However, this phenomenon discontinued as their grade level increased, with gradually declining enrollment rates. In 12th grade, the enrollment gap between Pacific Islanders and all other groups was 3%.
Table III-A. 2007-2008 Pacific Islander Student Profile in Washington State Public Schools
Note: The number of Pacific Islanders in each category may be undercounted because some school districts such as Seattle, Bellevue, Highline, and Renton did not report disaggregated data for PI students. Source: 2007/08 OSPI CSRS October Data.
Three quarters of Pacific Islander students speak English as their primary language, and the remaining 25% speak more than 50 languages and dialects. Samoan is the largest non-English language group, constituting 9% of the total Pacific Islander student population, followed by Marshallese.8 Despite having a majority as Espeakers, one in eight Pacific Islander students is enrolled in the Transitional Bilingual Instruction Program (TBIP), showing higher rates of ELL participation when compared with all groups (12% and 8%, respectively).
nglish
Pacific Islander students seem to be academically and financially disadvantaged. Statewide, 2% of total students are receiving the 21st Century grant, whereas 7% of Pacific Islanders receive such funding. The funding targets children who attend high-poverty, low-performing
Pacific Islanders All Groups 6,264 1,076,438 By Gender
Female 3,000 48% 48% Male 3,264 52% 52%
By Program TBIP 731 12% 8% Special Education 525 8% 12% Gifted Program 79 1% 3% Grant–21st Century 414 7% 2%
By Grade PK 130 2% 2% K1 34 1% 1% K2 641 10% 6% 1 681 11% 7% 2 662 11% 7% 3 469 8% 7% 4 431 7% 7% 5 473 8% 7% 6 433 7% 7% 7 398 6% 7% 8 401 6% 7% 9 474 8% 9% 10 381 6% 8% 11 353 6% 8% 12 303 5% 8%
By Language (3 of the most spoken Pacific Islander languages)
English 4,675 75% 82% Samoan 533 9% 0.1% Marshallese 292 5% 0.04%
10
schools and allows them to participate in academic enrichment opportunities that various agencies provide during nonschool hours.
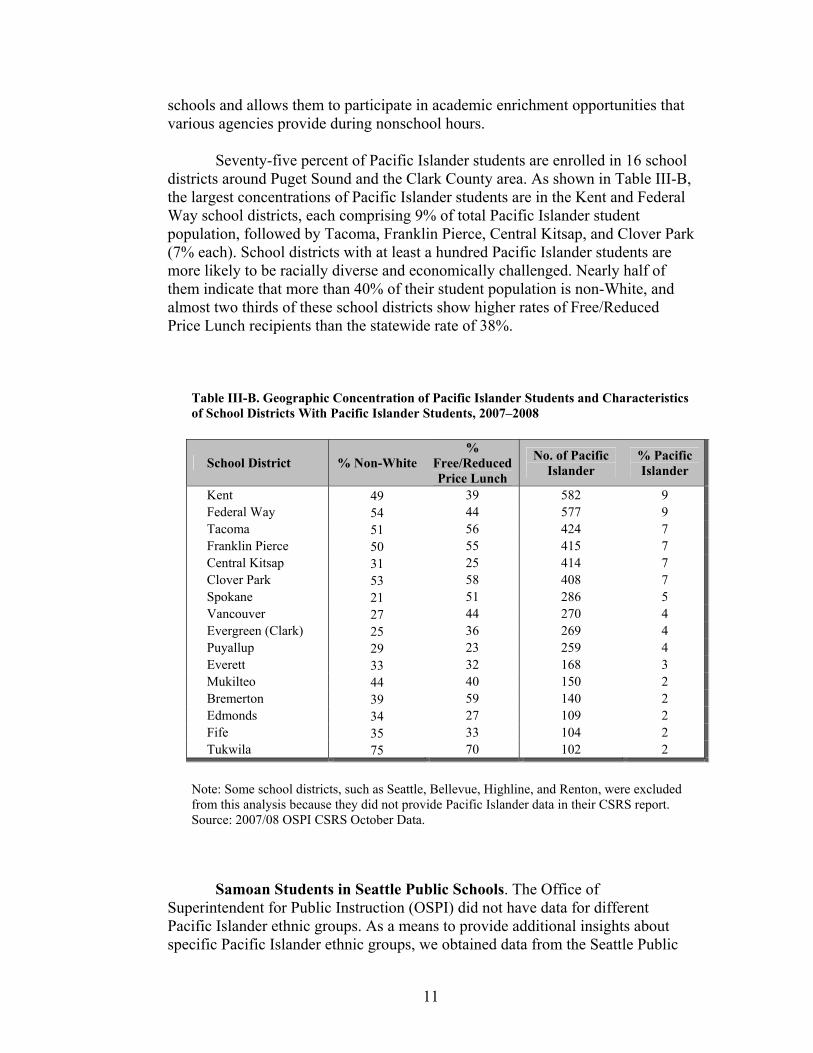
Seventy-five percent of Pacific Islander students are enrolled in 16 school districts around Puget Sound and the Clark County area. As shown in Table III-B, the largest concentrations of Pacific Islander students are in the Kent and Federal Way school districts, each comprising 9% of total Pacific Islander student population, followed by Tacoma, Franklin Pierce, Central Kitsap, and Clover Park (7% each). School districts with at least a hundred Pacific Islander students are more likely to be racially diverse and economically challenged. Nearly half of them indicate that more than 40% of their student population is non-White, and almost two thirds of these school districts show higher rates of Free/Reduced Price Lunch recipients than the statewide rate of 38%.
Table III-B. Geographic Concentration of Pacific Islander Students and Characteristics of School Districts With Pacific Islander Students, 2007–2008
School District % Non-White %
Free/Reduced Price Lunch
No. of Pacific Islander
% Pacific Islander
Kent 49 39 582 9 Federal Way 54 44 577 9 Tacoma 51 56 424 7 Franklin Pierce 50 55 415 7 Central Kitsap 31 25 414 7 Clover Park 53 58 408 7 Spokane 21 51 286 5 Vancouver 27 44 270 4 Evergreen (Clark) 25 36 269 4 Puyallup 29 23 259 4 Everett 33 32 168 3 Mukilteo 44 40 150 2 Bremerton 39 59 140 2 Edmonds 34 27 109 2 Fife 35 33 104 2 Tukwila 75 70 102 2
Note: Some school districts, such as Seattle, Bellevue, Highline, and Renton, were excluded from this analysis because they did not provide Pacific Islander data in their CSRS report. Source: 2007/08 OSPI CSRS October Data.
Samoan Students in Seattle Public Schools. The Office of Superintendent for Public Instruction (OSPI) did not have data for different Pacific Islander ethnic groups. As a means to provide additional insights about specific Pacific Islander ethnic groups, we obtained data from the Seattle Public
11
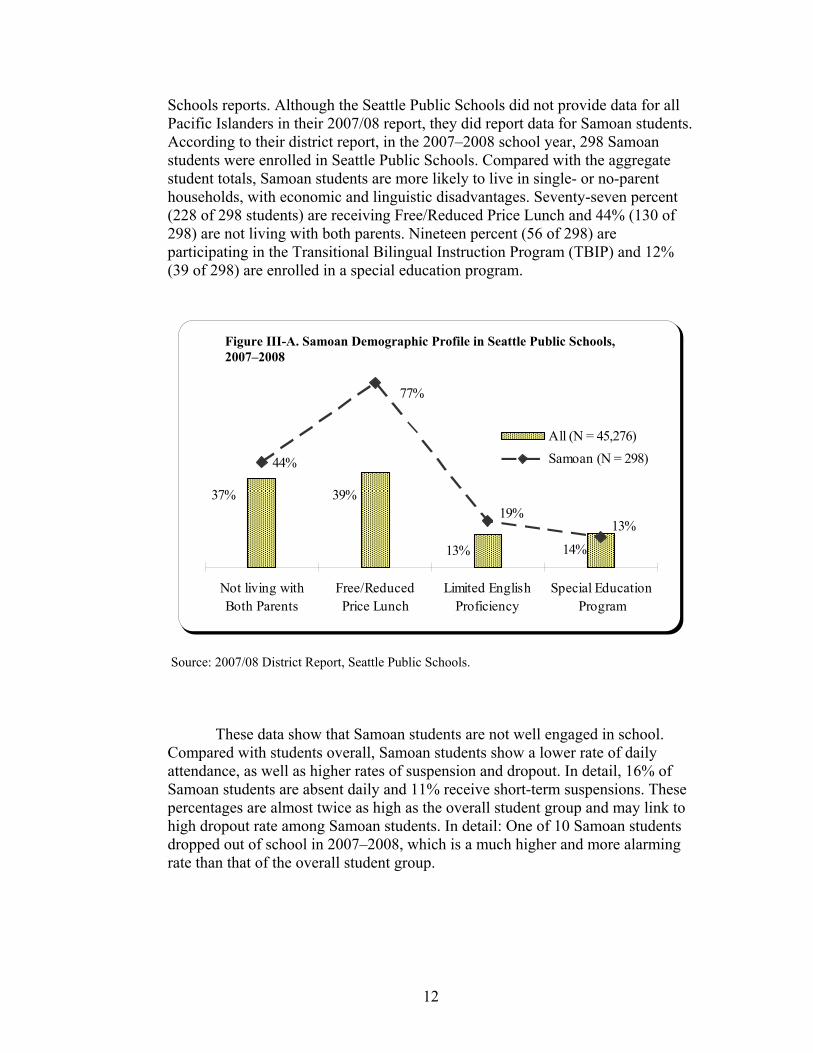
Schools reports. Although the Seattle Public Schools did not provide data for all Pacific Islanders in their 2007/08 report, they did report data for Samoan students. According to their district report, in the 2007–2008 school year, 298 Samoan students were enrolled in Seattle Public Schools. Compared with the aggregate student totals, Samoan students are more likely to live in single- or no-parent households, with economic and linguistic disadvantages. Seventy-seven percent (228 of 298 students) are receiving Free/Reduced Price Lunch and 44% (130 of 298) are not living with both parents. Nineteen percent (56 of 298) are participating in the Transitional Bilingual Instruction Program (TBIP) and 12% (39 of 298) are enrolled in a special education program.
Figure 1. Samoan Demographic Profile in Seattle Public Schools, 2007/08
14%13%
39%37%
44%
77%
13%19%
Not living withBoth Parents
Free/ReducedPrice Lunch
Limited EnglishProficiency
Special EducationProgram
All (N = 45,276)Samoan (N = 298)
Figure III-A. Samoan Demographic Profile in Seattle Public Schools, 2007–2008
Source: 2007/08 District Report, Seattle Public Schools. These data show that Samoan students are not well engaged in school. Compared with students overall, Samoan students show a lower rate of daily attendance, as well as higher rates of suspension and dropout. In detail, 16% of Samoan students are absent daily and 11% receive short-term suspensions. These percentages are almost twice as high as the overall student group and may link to high dropout rate among Samoan students. In detail: One of 10 Samoan students dropped out of school in 2007–2008, which is a much higher and more alarming rate than that of the overall student group.
12
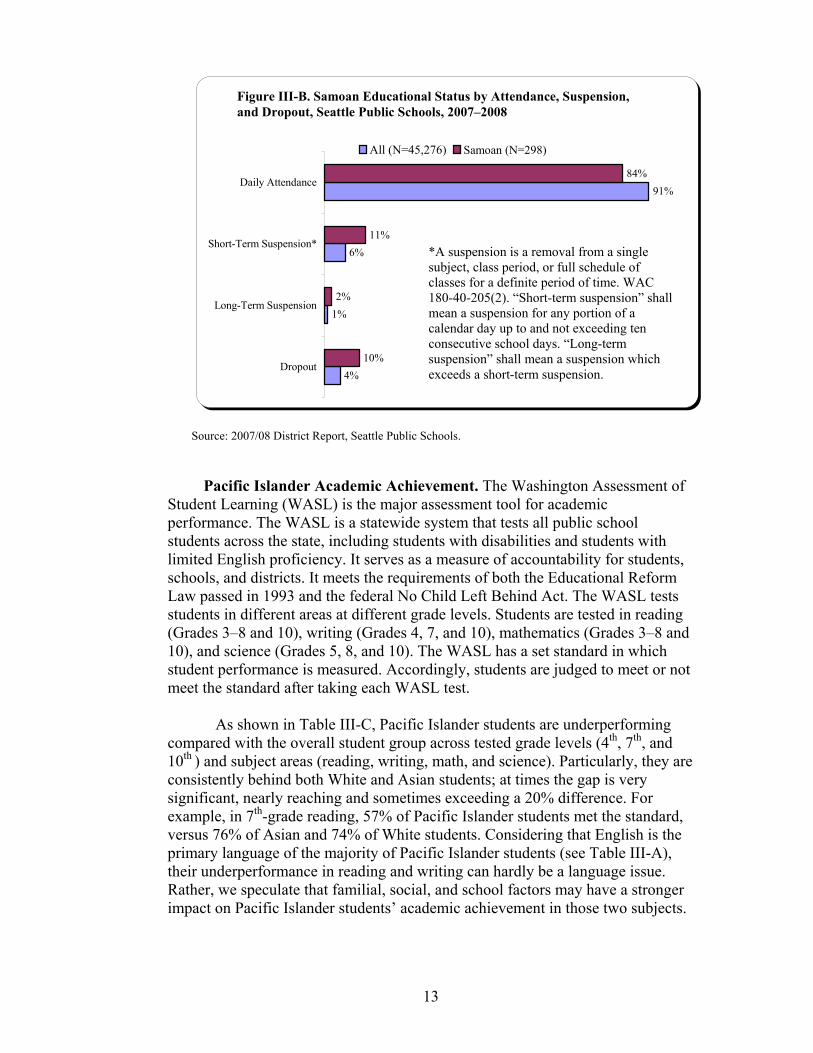
Figure 2. Samoan Educational Status by Attendance, Suspension, and Dropout, Seattle Public Schools, 2007/08
4%
1%
6%
91%
10%
2%
11%
84%
Dropout
Long-Term Suspension
Short-Term Suspension*
Daily Attendance
All (N=45,276) Samoan (N=298)
Figure III-B. Samoan Educational Status by Attendance, Suspension, and Dropout, Seattle Public Schools, 2007–2008
*A suspension is a removal from a single
subject, class period, or full schedule of classes for a definite period of time. WAC 180-40-205(2). “Short-term suspension” shall mean a suspension for any portion of a calendar day up to and not exceeding ten consecutive school days. “Long-term suspension” shall mean a suspension which exceeds a short-term suspension.
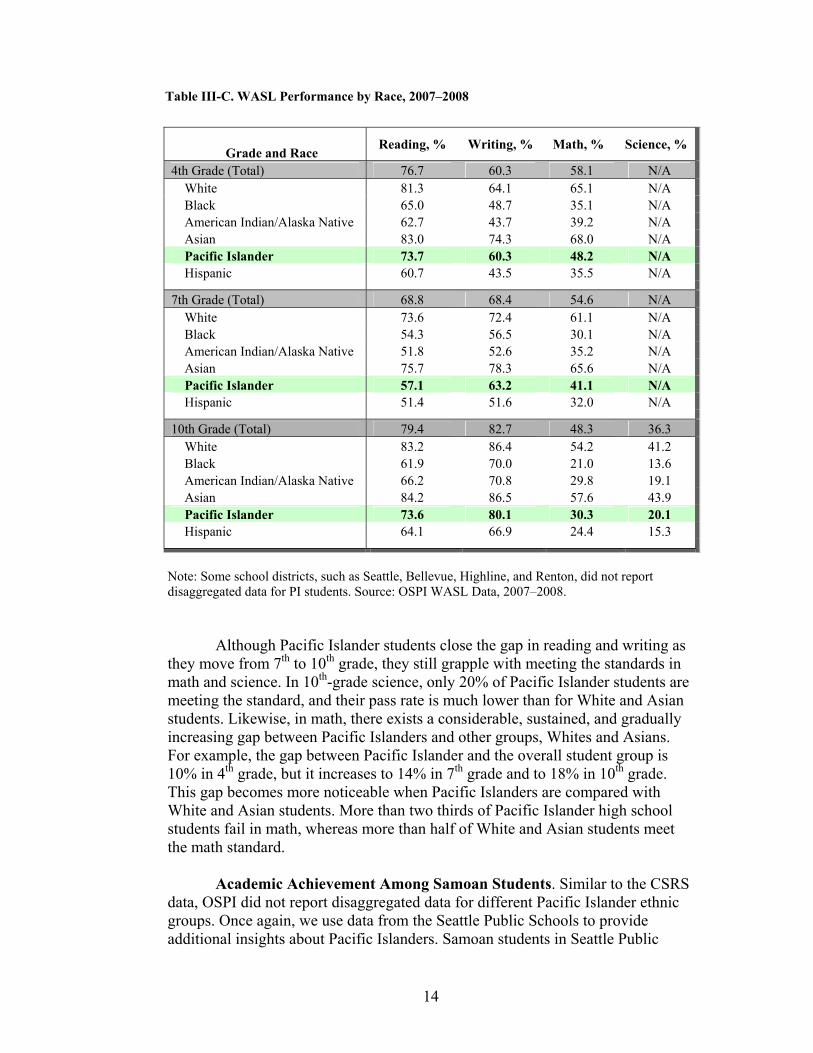
Source: 2007/08 District Report, Seattle Public Schools. Pacific Islander Academic Achievement. The Washington Assessment of Student Learning (WASL) is the major assessment tool for academic performance. The WASL is a statewide system that tests all public school students across the state, including students with disabilities and students with limited English proficiency. It serves as a measure of accountability for students, schools, and districts. It meets the requirements of both the Educational Reform Law passed in 1993 and the federal No Child Left Behind Act. The WASL tests students in different areas at different grade levels. Students are tested in reading (Grades 3–8 and 10), writing (Grades 4, 7, and 10), mathematics (Grades 3–8 and 10), and science (Grades 5, 8, and 10). The WASL has a set standard in which student performance is measured. Accordingly, students are judged to meet or not meet the standard after taking each WASL test. As shown in Table III-C, Pacific Islander students are underperforming compared with the overall student group across tested grade levels (4th, 7th, and 10th ) and subject areas (reading, writing, math, and science). Particularly, they are consistently behind both White and Asian students; at times the gap is very significant, nearly reaching and sometimes exceeding a 20% difference. For example, in 7th-grade reading, 57% of Pacific Islander students met the standard, versus 76% of Asian and 74% of White students. Considering that English is the primary language of the majority of Pacific Islander students (see Table III-A), their underperformance in reading and writing can hardly be a language issue. Rather, we speculate that familial, social, and school factors may have a stronger impact on Pacific Islander students’ academic achievement in those two subjects.
13
Grade and Race Reading, % Writing, % Math, % Science, %
4th Grade (Total) 76.7 60.3 58.1 N/A White 81.3 64.1 65.1 N/A Black 65.0 48.7 35.1 N/A American Indian/Alaska Native 62.7 43.7 39.2 N/A Asian 83.0 74.3 68.0 N/A Pacific Islander 73.7 60.3 48.2 N/A Hispanic 60.7 43.5 35.5 N/A
7th Grade (Total) 68.8 68.4 54.6 N/A White 73.6 72.4 61.1 N/A Black 54.3 56.5 30.1 N/A American Indian/Alaska Native 51.8 52.6 35.2 N/A Asian 75.7 78.3 65.6 N/A Pacific Islander 57.1 63.2 41.1 N/A Hispanic 51.4 51.6 32.0 N/A
10th Grade (Total) 79.4 82.7 48.3 36.3 White 83.2 86.4 54.2 41.2 Black 61.9 70.0 21.0 13.6 American Indian/Alaska Native 66.2 70.8 29.8 19.1 Asian 84.2 86.5 57.6 43.9 Pacific Islander 73.6 80.1 30.3 20.1 Hispanic 64.1 66.9 24.4 15.3
Table III-C. WASL Performance by Race, 2007–2008
Note: Some school districts, such as Seattle, Bellevue, Highline, and Renton, did not report disaggregated data for PI students. Source: OSPI WASL Data, 2007–2008. Although Pacific Islander students close the gap in reading and writing as they move from 7th to 10th grade, they still grapple with meeting the standards in math and science. In 10th-grade science, only 20% of Pacific Islander students are meeting the standard, and their pass rate is much lower than for White and Asian students. Likewise, in math, there exists a considerable, sustained, and gradually increasing gap between Pacific Islanders and other groups, Whites and Asians. For example, the gap between Pacific Islander and the overall student group is 10% in 4th grade, but it increases to 14% in 7th grade and to 18% in 10th grade. This gap becomes more noticeable when Pacific Islanders are compared with White and Asian students. More than two thirds of Pacific Islander high school students fail in math, whereas more than half of White and Asian students meet the math standard. Academic Achievement Among Samoan Students. Similar to the CSRS data, OSPI did not report disaggregated data for different Pacific Islander ethnic groups. Once again, we use data from the Seattle Public Schools to provide additional insights about Pacific Islanders. Samoan students in Seattle Public
14
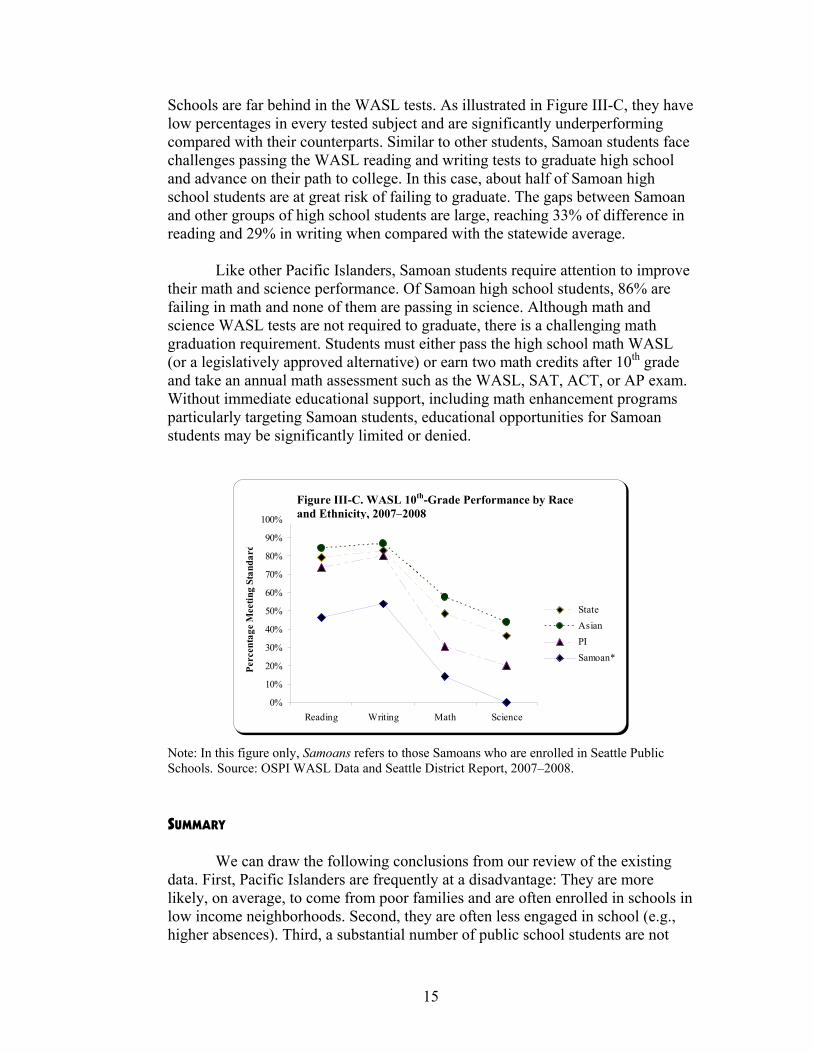
Schools are far behind in the WASL tests. As illustrated in Figure III-C, they have low percentages in every tested subject and are significantly underperforming compared with their counterparts. Similar to other students, Samoan students face challenges passing the WASL reading and writing tests to graduate high school and advance on their path to college. In this case, about half of Samoan high school students are at great risk of failing to graduate. The gaps between Samoan and other groups of high school students are large, reaching 33% of difference in reading and 29% in writing when compared with the statewide average. Like other Pacific Islanders, Samoan students require attention to improve their math and science performance. Of Samoan high school students, 86% are failing in math and none of them are passing in science. Although math and science WASL tests are not required to graduate, there is a challenging math graduation requirement. Students must either pass the high school math WASL (or a legislatively approved alternative) or earn two math credits after 10th grade and take an annual math assessment such as the WASL, SAT, ACT, or AP exam. Without immediate educational support, including math enhancement programs particularly targeting Samoan students, educational opportunities for Samoan students may be significantly limited or denied.
Figure 3. WASL 10th Grade Performance by race and ethnicity, 2007/08
0%
10%
20%
30%
40%
50%
60%
70%
80%
90%
100%
Reading Writing Math Science
Perc
enta
ge M
eetin
g St
anda
rd
StateAsianPISamoan*
Figure III-C. WASL 10th-Grade Performance by Race and Ethnicity, 2 070 –2008
Note: In this figure only, Samoans refers to those Samoans who are enrolled in Seattle Public Schools. Source: OSPI WASL Data and Seattle District Report, 2007–2008. SUMMARY We can draw the following conclusions from our review of the existing data. First, Pacific Islanders are frequently at a disadvantage: They are more likely, on average, to come from poor families and are often enrolled in schools in low income neighborhoods. Second, they are often less engaged in school (e.g., higher absences). Third, a substantial number of public school students are not
15
meeting the academic standards based on the WASL tests. Fourth, Pacific Islanders are not faring well in the WASL science and math tests. Finally, these data show again the wisdom of separating Pacific Islanders from Asian Americans. The average tests scores indicate a substantial difference between the two groups. We have one observation as a result of working with the OSPI data. In this section, we relied on two data sets: the 2007–2008 CSRS and WASL data from OSPI. The WASL data focus on individual scores, levels, and pass or fail in meeting standards in every subject tested in each grade. The CSRS is designed to provide comprehensive information regarding student demographics and academic tracks in order to respond to federal and state reporting requirements. Although these two data sets function as highly qualified sources for our analysis on Pacific Islander students, they pose some difficulties. First, neither data set disaggregates Pacific Islander subgroups other than language codes, which hindered us from doing a substantive analysis on disparities across ethnicities. Second, we had difficulties in merging the two data sets. Even when we could link individual students from the two sets by their ID numbers, we found discrepancies when the information should have been identical, such as grade and language. Accordingly, we did not have confidence that a merged data set would be useful for this report.
16
IV. PACIFIC ISLANDER PERSPECTIVES
Pacific Islander students are seldom included in sufficient samples in research studies, which makes it difficult to capture some of their educational experiences beyond test scores. Given this limitation, it is difficult to say much about how students from different Pacific Islander ethnic groups may be similar or unique in their experiences in school. As a means to begin to remedy this void, we take advantage of the opportunity to use data drawn from the Beyond High School project, a study conducted by researchers from the University of Washington.9 The Beyond High School project includes a reasonable-size sample to say a few things about some of the perceptions of Pacific Islander ethnic groups. The study includes a total of 268 participants who report some Pacific Islander ethnicity (42 Guamanian or Chamorro, 118 Samoan, 81 Native Hawaiian, and 27 Other Pacific Islanders). We supplement these data with responses from 20 key informant interviews with Pacific Islander young adults who attended public schools in Washington State and with data collected from Pacific Islander teachers. EDUCATIONAL ASPIRATIONS, PREPARATION, AND ATTENDANCE College aspirations and expectations capture what students hope to achieve and whether they realistically think they will accomplish their educational goals. Although more than half of the different Pacific Islander students had aspirations to earn a college degree, this percentage was lower than the percentage for the non–Pacific Islander groups included in the study (76%). Native Hawaiians were the only Pacific Islander group that had a similarly high percentage of students who had aspirations for a college degree. College expectations provide a measure to assess whether students foresee obstacles that might prevent them from getting a degree. When comparing the percentages for college aspirations and expectations, we noticed that Pacific Islander students appear to anticipate significant obstacles to reaching their goal. Among students from non–Pacific Islander groups, the difference between aspirations and expectations is 7.5% (75.8% versus 68.3%). For Guamanian, Samoan, and Native Hawaiian students, the difference is more than 10%. Students from the other Pacific Islander groups showed no difference between aspirations and expectations, but their percentages were low for both. Note, however, that Guamanian, Samoan, and Native Hawaiian students reported taking the SAT/ACT at a level similar to that of non–Pacific Islander groups.
17
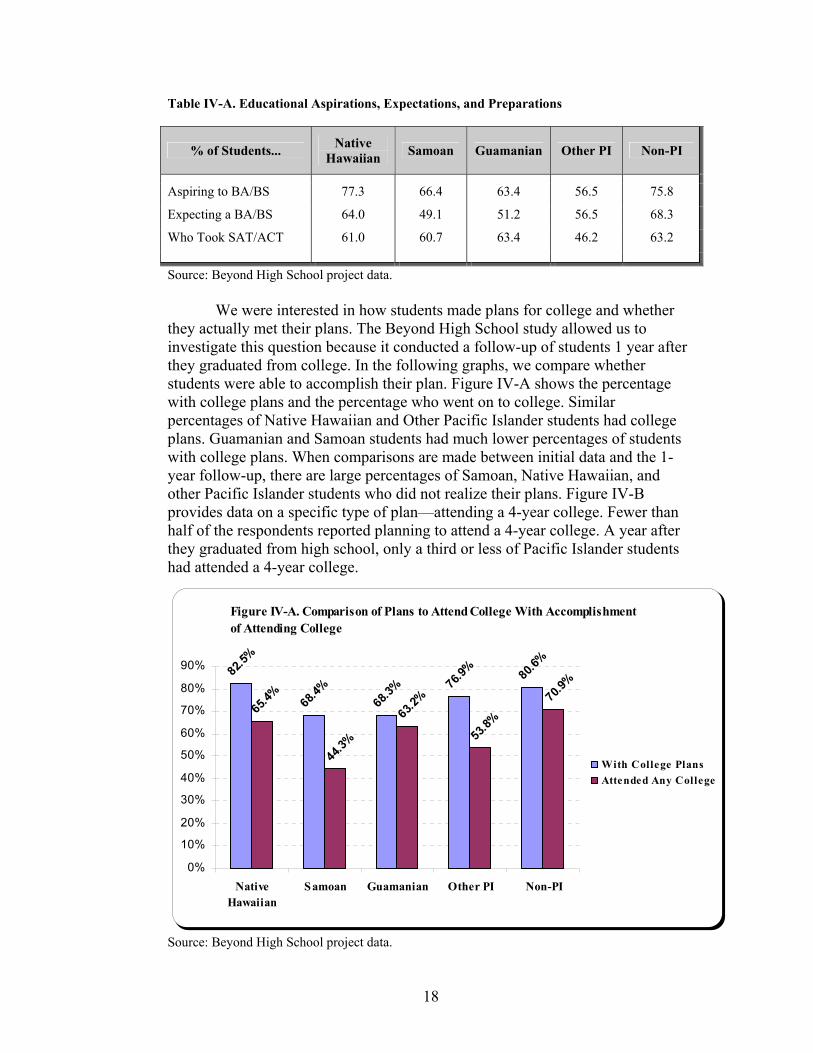
Table IV-A. Educational Aspirations, Expectations, and Preparations
% of Students... Native Hawaiian Samoan Guamanian Other PI Non-PI
Aspiring to BA/BS 77.3 66.4 63.4 56.5 75.8
Expecting a BA/BS 64.0 49.1 51.2 56.5 68.3
Who Took SAT/ACT 61.0 60.7 63.4 46.2 63.2
Source: Beyond High School project data. We were interested in how students made plans for college and whether they actually met their plans. The Beyond High School study allowed us to investigate this question because it conducted a follow-up of students 1 year after they graduated from college. In the following graphs, we compare whether students were able to accomplish their plan. Figure IV-A shows the percentage with college plans and the percentage who went on to college. Similar percentages of Native Hawaiian and Other Pacific Islander students had college plans. Guamanian and Samoan students had much lower percentages of students with college plans. When comparisons are made between initial data and the 1-year follow-up, there are large percentages of Samoan, Native Hawaiian, and other Pacific Islander students who did not realize their plans. Figure IV-B provides data on a specific type of plan—attending a 4-year college. Fewer than half of the respondents reported planning to attend a 4-year college. A year after they graduated from high school, only a third or less of Pacific Islander students had attended a 4-year college.
Figure IV-A. Comparison of Plans to Attend College With Accomplishment of Attending College
82.5%
68.4%
68.3%
76.9% 80
.6%
65.4%
44.3%
63.2%
53.8%
70.9%
0%
10%
20%
30%
40%
50%
60%
70%
80%
90%
NativeHawaiian
Samoan Guamanian Other PI Non-PI
With College PlansAttended Any College
Source: Beyond High School project data.
18
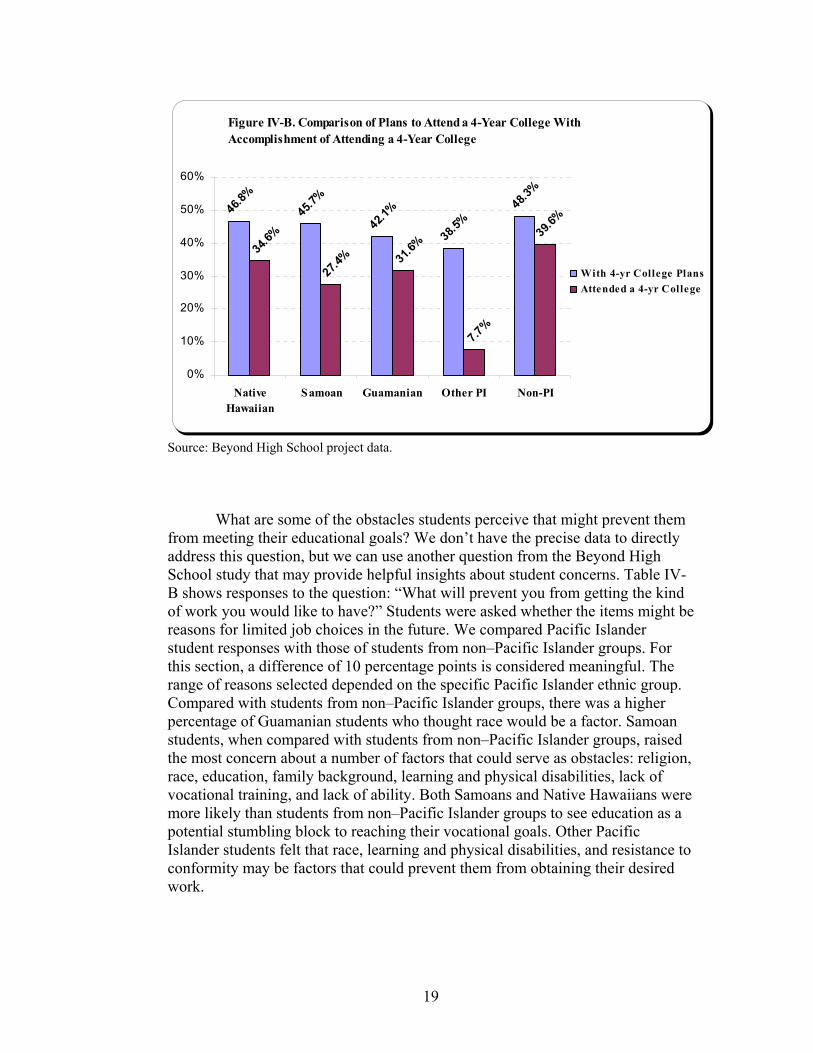
Figure IV-B. Comparison of Plans to Attend a 4-Year College With Accomplishment of Attending a 4-Year College
46.8%
45.7%
42.1%
38.5%
48.3%
39.6%
7.7%
31.6%34
.6%
27.4%
0%
10%
20%
30%
40%
50%
60%
NativeHawaiian
Samoan Guamanian Other PI Non-PI
With 4-yr College PlansAttended a 4-yr College
Source: Beyond High School project data. What are some of the obstacles students perceive that might prevent them from meeting their educational goals? We don’t have the precise data to directly address this question, but we can use another question from the Beyond High School study that may provide helpful insights about student concerns. Table IV-B shows responses to the question: “What will prevent you from getting the kind of work you would like to have?” Students were asked whether the items might be reasons for limited job choices in the future. We compared Pacific Islander student responses with those of students from non–Pacific Islander groups. For this section, a difference of 10 percentage points is considered meaningful. The range of reasons selected depended on the specific Pacific Islander ethnic group. Compared with students from non–Pacific Islander groups, there was a higher percentage of Guamanian students who thought race would be a factor. Samoan students, when compared with students from non–Pacific Islander groups, raised the most concern about a number of factors that could serve as obstacles: religion, race, education, family background, learning and physical disabilities, lack of vocational training, and lack of ability. Both Samoans and Native Hawaiians were more likely than students from non–Pacific Islander groups to see education as a potential stumbling block to reaching their vocational goals. Other Pacific Islander students felt that race, learning and physical disabilities, and resistance to conformity may be factors that could prevent them from obtaining their desired work.
19
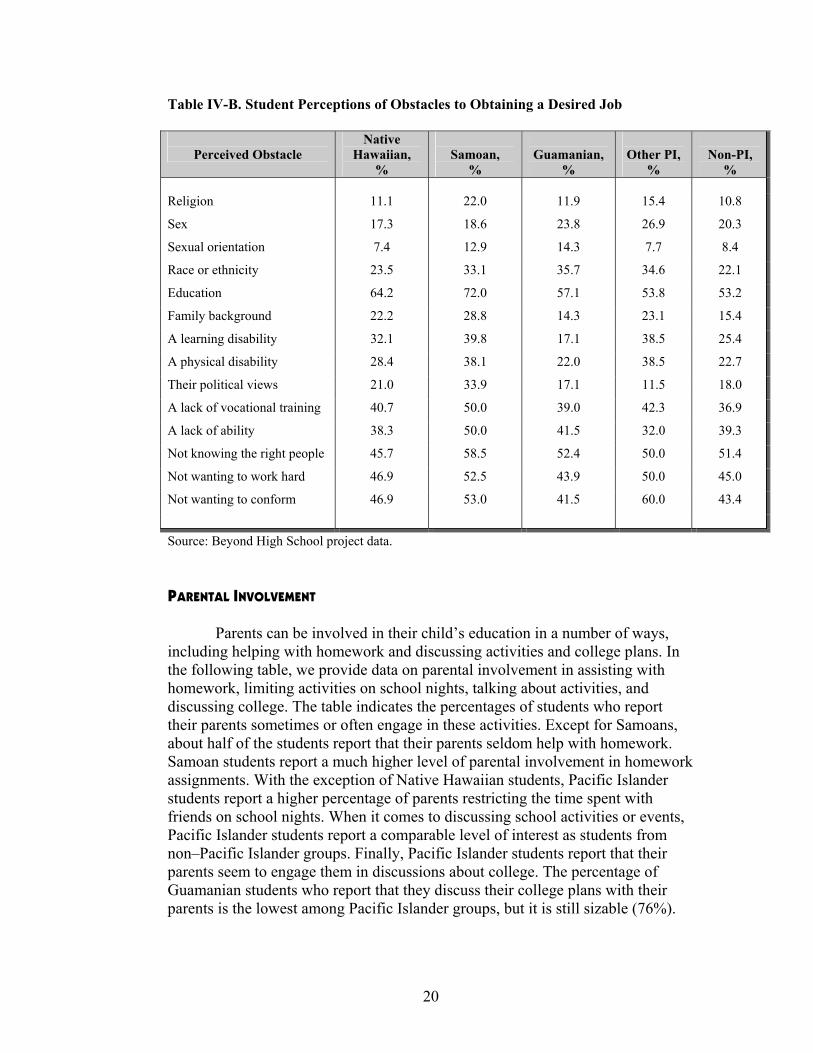
Table IV-B. Student Perceptions of Obstacles to Obtaining a Desired Job
Perceived Obstacle Native
Hawaiian, %
Samoan,
%
Guamanian,
%
Other PI,
%
Non-PI,
% Religion 11.1 22.0 11.9 15.4 10.8
Sex 17.3 18.6 23.8 26.9 20.3
Sexual orientation 7.4 12.9 14.3 7.7 8.4
Race or ethnicity 23.5 33.1 35.7 34.6 22.1
Education 64.2 72.0 57.1 53.8 53.2
Family background 22.2 28.8 14.3 23.1 15.4
A learning disability 32.1 39.8 17.1 38.5 25.4
A physical disability 28.4 38.1 22.0 38.5 22.7
Their political views 21.0 33.9 17.1 11.5 18.0
A lack of vocational training 40.7 50.0 39.0 42.3 36.9
A lack of ability 38.3 50.0 41.5 32.0 39.3
Not knowing the right people 45.7 58.5 52.4 50.0 51.4
Not wanting to work hard 46.9 52.5 43.9 50.0 45.0
Not wanting to conform 46.9 53.0 41.5 60.0 43.4
Source: Beyond High School project data. PARENTAL INVOLVEMENT Parents can be involved in their child’s education in a number of ways, including helping with homework and discussing activities and college plans. In the following table, we provide data on parental involvement in assisting with homework, limiting activities on school nights, talking about activities, and discussing college. The table indicates the percentages of students who report their parents sometimes or often engage in these activities. Except for Samoans, about half of the students report that their parents seldom help with homework. Samoan students report a much higher level of parental involvement in homework assignments. With the exception of Native Hawaiian students, Pacific Islander students report a higher percentage of parents restricting the time spent with friends on school nights. When it comes to discussing school activities or events, Pacific Islander students report a comparable level of interest as students from non–Pacific Islander groups. Finally, Pacific Islander students report that their parents seem to engage them in discussions about college. The percentage of Guamanian students who report that they discuss their college plans with their parents is the lowest among Pacific Islander groups, but it is still sizable (76%).
20
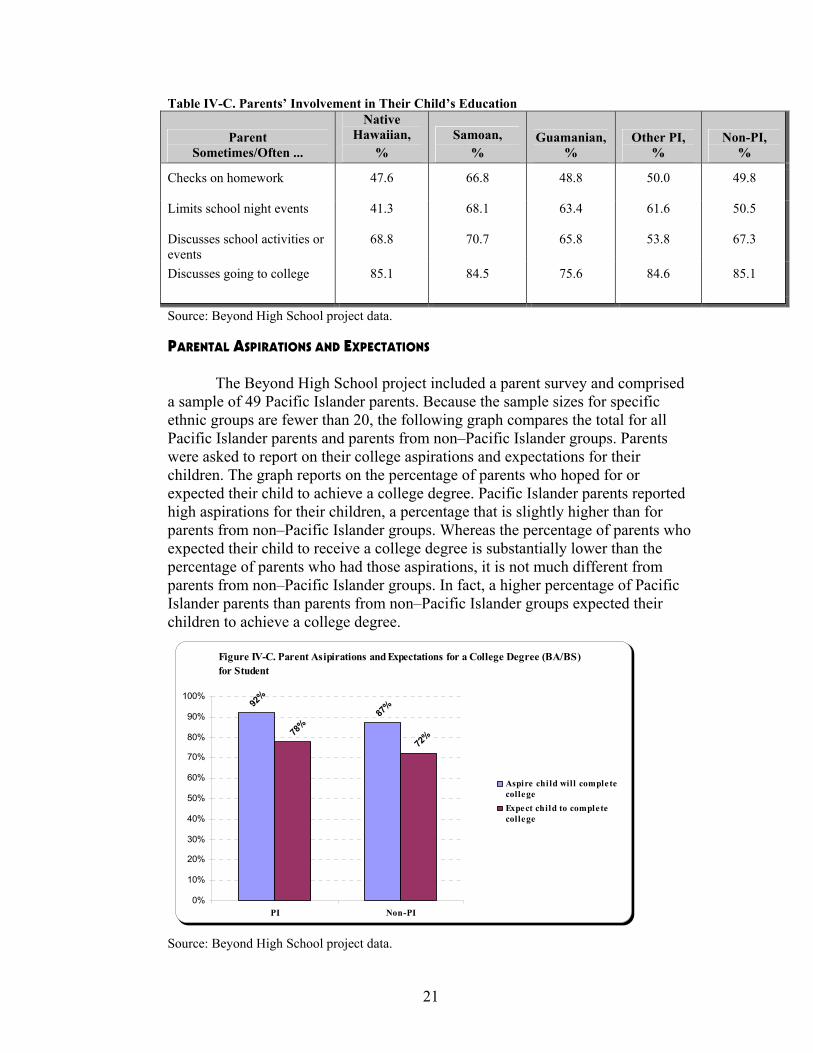
Table IV-C. Parents’ Involvement in Their Child’s Education
Parent Sometimes/Often ...
Native Hawaiian,
% Samoan,
% Guamanian,
% Other PI,
% Non-PI,
% Checks on homework 47.6 66.8 48.8 50.0 49.8
Limits school night events 41.3 68.1 63.4 61.6 50.5
Discusses school activities or events
68.8 70.7 65.8 53.8 67.3
Discusses going to college 85.1 84.5 75.6 84.6 85.1
Source: Beyond High School project data.
PARENTAL ASPIRATIONS AND EXPECTATIONS The Beyond High School project included a parent survey and comprised a sample of 49 Pacific Islander parents. Because the sample sizes for specific ethnic groups are fewer than 20, the following graph compares the total for all Pacific Islander parents and parents from non–Pacific Islander groups. Parents were asked to report on their college aspirations and expectations for their children. The graph reports on the percentage of parents who hoped for or expected their child to achieve a college degree. Pacific Islander parents reported high aspirations for their children, a percentage that is slightly higher than for parents from non–Pacific Islander groups. Whereas the percentage of parents who expected their child to receive a college degree is substantially lower than the percentage of parents who had those aspirations, it is not much different from parents from non–Pacific Islander groups. In fact, a higher percentage of Pacific Islander parents than parents from non–Pacific Islander groups expected their children to achieve a college degree.
Figure IV-C. Parent Asipirations and Expectations for a College Degree (BA/BS) for Student
92%
87%
72%78
%
0%
10%
20%
30%
40%
50%
60%
70%
80%
90%
100%
PI Non-PI
Aspire child will completecollegeExpect child to completecollege
Source: Beyond High School project data.
21
TEACHER PERSPECTIVES
Teacher perspectives are not often represented in research studies on Pacific Islander students. We take advantage of a survey of teachers conducted by the Washington Education Association in November 2008. A total of 20 Pacific Islander teachers were included in the sample, and we provide a summary of their responses to the survey questions.
Pacific Islander educators provided insights about the reasons they chose
teaching as a career. There responses were varied, as one might expect. Many of the Pacific Islander teachers stated that they wanted to teach because they like children and “wanted to help kids feel successful in school.” One teacher commented that her family members “highly value education and [the] importance of being a lifelong learner.” One male teacher wrote, “I was influenced by my coach in high school.” A music teacher in the study chose to teach due to his limited career choices with a degree in music.
Although their motivations for teaching may vary, once they entered
teaching careers, their interactions with Pacific Islander students tended to be positive and meaningful. Most of the Pacific Islander teachers stated that they have a better understanding of their students and their families due to their own personal heritage and/or language abilities. One teacher wrote that she “understands what they are saying and [it is] easier [for the parents] to communicate with [her].” Many Pacific Islander teachers reported that they could better relate to their students and their families. “I feel that I can relate to their parents on a higher level. I can also relate to their experiences in growing up in another culture,” commented a Pacific Islander teacher. Another teacher shared, “Students asked about how my family was when I was young and make comparisons with their own family.” One teacher stated, “Some call me affectionately ‘Auntie.’ I try to be a subtle, strong role model for Pacific Islander females.” Most of the teachers recognize that their heritage, background, and/or experiences in dual cultures are important in teaching. They believe that they can “connect with [Pacific Islander] kids and advocate for and encourage them to succeed.”
Pacific Islander teachers also shared facets of their classroom instruction
and provided recommendations for teaching Pacific Islander students. Most teachers refer to their district and Washington State teaching standards as their guide in developing curriculum. The teachers demonstrate knowledge of students in multiple ways, including “listening to them and showing them respect,” “checking with them on an individual basis,” and “getting to know their backgrounds and families.” Most teachers advocate for “differential instructional strategies to address multiple learning styles,” such as using cooperative learning groups, direct instruction, and think-pair-share strategies. However, they also report lack of time and language as challenges in interacting with Pacific Islander students. One teacher wrote, “Not being able to speak their language,” whereas
22
another noted, “Not knowing some general things about the culture.” Another high school teacher recognized “very restrictive family and their lifestyles” as challenges in interacting with Pacific Islander students.
When asked to share best teaching practices for Pacific Islander students,
some teachers believed that best teaching practices for Pacific Islanders are “the same for all students” and others recommended a variety of strategies:
• Providing students with culturally relevant, authentic tasks. • Developing and implementing curriculum connected to life. • Modeling success, encouraging them, looking for opportunities for them,
letting them know that you are in their corner. • Listening to [their] stories, using hands-on projects, oral language, and
visual materials. • Giving students accountability for their success. • Connecting with their community by visiting their homes and treating
them with respect. • Engaging students with high-interest topics, using strategies proven to be
effective with ELL students. SUMMARY Generally, with the exception of Native Hawaiians, a lower percentage of Pacific Islander students want to obtain a college degree than do students from other ethnic groups. About three quarters of students from Native Hawaiian hoped to earn a college degree. A large discrepancy is apparent when students are asked whether they expect to achieve a college degree. For Pacific Islanders, the difference between their hopes and their realistic expectations is substantial. Pacific Islander students may anticipate or already encounter obstacles that deter them from realizing their dreams. The notion that Pacific Islander students defer or do not fulfill their dreams is supported by other data. A substantial proportion of Pacific Islanders do not reach college even when they have made plans to do so. Moreover, many Pacific Islander students who plan on attending a 4-year college do not fulfill their goals a year after graduating from college. The Beyond High School data provide some sense about the potential obstacles that confront Pacific Islander students. In key informant interviews, former students shared many of the observations found in the Beyond High School survey but also provided a qualitatively different set of responses. The following are identified as problems by these former students:
• Principal, teachers, staff, and students judge us before they get to know us. We are looked upon as bullies.
• Negative influence from friends.
23
• Parents do not understand how hard it is to balance our traditional culture with American influence.
• Parents are too traditional. • We cannot talk to our parents like other kids can. • Parents expect us to go to school (do well) and come home and clean,
watch our siblings, and they wonder why we are doing poor in school. • Parent put us down verbally and discipline us physically.
It is noteworthy that Pacific Islander parents have high aspirations and expectations for their children. A sizeable proportion of parents fully expect their children to receive a college degree. In addition, parents are involved to some extent in the educational experiences of their children. Pacific Islander teachers provide some critical insights about some of the effective strategies in working with Pacific Islander students. Some of these strategies are supported by Pacific Islander students, particularly ones who are sensitive to their culture. In key informant interviews with Pacific Islander students, they were queried about factors that led to their success in high school. The former students stated that the following were especially important: (1) hands-on training for Pacific Islander youth who want to learn more about their own culture (i.e., language, dance, history, etc.) and (2) activities that come from the Pacific Islander culture so that other students are able to learn about it as well.
24
V. DISCUSSION The value of high levels of education in society cannot be overemphasized. For example, if all American adults enjoyed the health status and health care of college graduates, it would result in an annual cost savings to the U.S. economy of more than $1 trillion.10 And these are estimates just for health and health care. If we factor in how education benefits other facets of life, such as reducing crime or preventing violence, the dollar savings to society is mind boggling. Accordingly, the more Washington State can ensure that its students receive a quality education that leads to college, the more it will see the long-term benefits of its investment. Our analyses show that Pacific Islanders represent a target group of people who do not receive the maximum benefit from their schooling in Washington State. While a substantial number of Washington State students are not performing adequately on the WASL, there is an exceedingly high percentage of Pacific Islanders who do not pass different content test areas. A large percentage of Pacific Islanders do not expect to receive a college degree and different Pacific Islander groups anticipate some problems in meeting their occupational plans. The good news is that Pacific Islander parents and students seem to have high aspirations; that is, a majority of parents hope their children receive a college degree, and students similarly have high aspirations after college. Something happens while they are in school and in their adolescent years that is distracting them from realizing their educational goals. Survey data and our key informant interviews suggest that some of these factors include discrimination in school and neighborhoods, poor relationships with teachers and parents, a negative school climate for minority students, curricula that may not be sensitive to the learning styles of different cultural groups, and limited after-school activities. What factors contribute to the achievement gap, especially in the WASL test scores, the major test in Washington State that affects high school graduation? It is commendable that the state has a long-standing interest in standardizing the measurement of student progress and proficiencies in different subject matters. Standardization allows for performance indicators to be defined and a common metric used to assess whether students reach them. However, it is clear that the WASL is a controversial measure of student progress and outcome. It is equally clear that the WASL has not been validated extensively among different cultural groups, including Pacific Islanders. The extent to which the WASL sufficiently and appropriately measures academic achievement at requisite grade levels for different cultural groups is not evident. Beyond the actual test itself, past studies and recent public reports, including the METT document, suggest that reducing the academic achievement gap is a multifaceted challenge and requires collaborative efforts among different parties in the state. The empirical literature on Pacific Islander educational achievement is quite limited, making it difficult to more precisely address this
25
issue. However, it is possible to outline some general themes derived from past work on this topic. First, economic considerations must be factored into educational reform. Data on the socioeconomic status of Pacific Islander families reinforce how closely economic disparities are tied to educational outcomes. Economic factors are to be considered with regard to accomplishing postsecondary goals. Financial assistance and scholarship programs that target disadvantaged minorities have played a critical role in increasing postsecondary opportunities for other ethnic groups, including Native Hawaiians in Hawaii. Closely related to economic factors is access to strong early childhood education, because it often helps to reduce the consequences of early child development problems. Experiences in childhood often have consequences into adulthood, which is referred to as “the long arm of childhood.”11 Programs and policies that can support family child care arrangements among Pacific Islander families may be potentially useful practices. Culture-based education (CBE) has shown great promise among Native Americans, Alaska Natives, and Native Hawaiians and has been shown to be compatible with conventional research-based “best practices.”12 CBE is defined as “the grounding of instruction and student learning in the values, normknowledge, beliefs, practices, experiences, and language that are the foundation of a culture.”
s,
13 The value of CBE is that it helps students to become engaged and connected to the content of their learning, which contributes positively to both socioemotional and education outcomes. Family and community involvement in student learning are well-known, successful educational practices that should be considered for Pacific Islander students. Although many attempts at including family and community into schools have fallen short, models of CBE have demonstrated success in incorporating family and community into educational content. In addition to its careful consideration of cultural inclusion, CBE has the potential to increase the flow of information among school, family, and community in a meaningful way. Central to the CBE approach in Hawaii is the integration of family and community, which involves active participation of family members in educational activities and the use of community as a setting for student learning. Indeed, the data show that parental involvement and expectations for children among Pacific Islanders are not lagging behind other ethnic groups to the extent that achievement is. Rather, schools must look at the ways in which Pacific Islander parents and communities are integrated into the school and its curriculum and how much they could offer to all students in terms of knowledge, experience, and skills. Through CBE, the value of family and community embraces the notion that teachers can harness the knowledge, skills, and experience of family and community members for the benefit of their classes, not only for Pacific Islander students, but all students.
26
For example, in the home, whereas teachers may advocate for family members to help with homework or to read with their child, a CBE approach might ask students to collaborate with family members on projects that are beneficial to their family and community. Accessing parents’ tacit knowledge through information such as family genealogy, family stories, or cultural values are other ways of encouraging family involvement. One example of family involvement in a science/environmental studies curriculum is the “Mālama I ka ‘Aina/Protect the Land” project, where students are asked to work with their families to develop a sustainability plan, describing how they can protect natural resources. Projects like these could tap into Pacific Islanders’ historical knowledge of land and water conservation, agriculture, and aquaculture. These kinds of assignments build upon parental involvement, family knowledge, and the interconnection of school, family, and community; such projects have the potential to make the material more meaningful and relevant to students’ own lives and experiences. Culture-based education also incorporates active and experiential learning, where lessons are framed within authentic experiences, projects, and places. Thus, schools can make the education experience more relevant to Pacific Islander students by moving beyond the classroom and accessing the knowledge and strengths that lie within the community, through partnerships with local organizations, businesses, and practitioners. In this way, students can both learn and apply knowledge, and at the same time, possibly engage in community service and/or service learning. This not only builds upon the interconnectedness between schools and communities, but also has the potential to increase students’ bonds and attachments to the community as well. Some examples include projects where students can learn about biology, natural resource management, history, science, and math that involve field studies at such locations as marshes and taro patches.14 In a study of Alaska Natives, the designing of a fish rack was used to engage students in the study of geometry.15 The researchers found that students in the study outperformed the control group by a wide margin in mathematical achievement. Other aspects of CBE as it currently is conceptualized for Native Hawaiians are the themes of (1) haku, or original compositions imbued with a person’s experience or spirit, (2) hō’ike, performances requiring multilevel demonstrations of knowledge and skills, (3) mālama ‘āina, land stewardship focusing on sustainability and familial connection, (4) kōkua kaiāulu, community giveback embodying the value of unity, and (5) ola pono, or values and life skills that synthesize Hawaiian and global perspectives. As with family and community integration, these themes also mirror conventional, mainstream best practices, such as rigorous assessment accounting for a range of competency and skills, place-based and service learning projects promoting community well-being, and career planning and preparation for global citizenship.16
27
The Pacific Northwest region is rich with opportunities to provide culture-based educational approaches, in its ability to draw upon not only Pacific Islanders but also American Indians, Alaska Natives, and other racial/ethnic groups who reside in Washington State. One advantage to the CBE model is that teachers do not need to be experts or the sole source of providing culturally relevant experiences. However, the reliance on conventional methods of teaching and approaches to parental and community involvement do not take full advantage of these opportunities. Rather, they can potentially alienate students from their educational experience and render its contents less meaningful and less relevant to their lived experience. A common practice in schools is to highlight the contributions of historical figures for their accomplishments in designated months of the year. Though important, these events are not sufficient because they often ignore the contemporary contributions of people, including Pacific Islanders, in their own homes and in their communities. The value of such an approach benefits all students, not only Pacific Islanders.
28

VI. RECOMMENDATIONS We have carefully worked to write separate and distinct reports for Pacific Islanders and Asian Americans, but we combined efforts to develop some guiding principles and strategies shape reforms that will affect students and their families. We hope that this joint effort will provide clarity in priorities and directions. DEVELOP AND IMPLEMENT A STRATEGIC PLAN THAT FOSTERS THE CULTURAL
RESPONSIVENESS OF THE SCHOOL SYSTEM. No single intervention will effectively enhance the academic achievement of all students in Washington State and simultaneously eliminate the gap of academic performance between some ethnic groups and others. What is needed at this time is a comprehensive and coordinated plan that encompasses:
• Institutional changes that effectively reduce the barriers that deter Pacific Islander students from reaching their academic potential. Institutional barriers are factors (i.e., discrimination, bullying, stereotyping, and inappropriate testing) that create a hostile school climate that disengages students and their parents from learning in the classroom or participating in school activities. Culture-based education (CBE), shown to be effective among some groups, should be considered as one possible intervention in overcoming some of these institutional barriers.
• Recruitment and retention of teachers and administrators from Pacific
Islander communities.
• Training teachers and administrators to more effectively teach Pacific Islander students and work with their families.
INITIATE MORE EXTENSIVE PARTNERSHIPS WITH EXISTING PACIFIC ISLANDER COMMUNITY
GROUPS. In the course of this short study, we have been invariably impressed with the talents, insights, motivation, and initiative of the different groups that we have had the opportunity to meet. Such groups, including the Multi-Ethnic Think Tank, Pacific Islander Community Advisory Group, and the Asian American Community Advisory Group, have extensive community networks that make them potentially strategic partners in helping schools meet the educational needs of Pacific Islander students. The operative word in this recommendation is the term partnership. Partnerships involve a collaborative relationship that reduces power imbalances and shares responsibility in identifying the problem or issue,
29
discussing ideas, developing solutions, and evaluating results of policy or programmatic interventions. ENSURE THAT PACIFIC ISLANDERS, WITH PARTICULAR ATTENTION TO GROUPS AT-RISK, ARE
INCLUDED IN ALL ACADEMIC AND CO-CURRICULAR PROGRAMS, FROM EARLY EDUCATION
(SUCH AS THRIVE BY FIVE) THROUGH K–12 AND ON TO COLLEGE ACCESS, INFORMATION, AND RECRUITMENT OPPORTUNITIES. To reach that goal, the following are recommended:
• Collaborate with community-based organizations to (1) increase resources, including tapping linguistic and cultural experts, and (2) identify families and ethnic groups who can most benefit.
• Hold information meetings for families on community sites with
translators.
• Consult with Pacific Islander teachers, administrators, other school personnel, and specialists on Pacific Islander education.
• Develop partnerships with higher education institutions (2-year and 4-year
colleges). Key units include: teacher education, ethnic studies, social work, and student affairs, all of whom have some students who are interested in K–12 experiences. Pacific Islander students, in particular, can serve as role models.
DEVELOP AND IMPLEMENT A RESEARCH AND EVALUATION PLAN THAT ASSESSES THE
REDUCTION OF THE ACHIEVEMENT GAP OVER TIME. The plan should include the following:
• Disaggregate the different Pacific Islander groups in data collection and analyses to the extent that does not compromise concerns about confidentiality. As shown in this report, there are substantive differences among the different Pacific Islander ethnic groups. Without this disaggregation, it will be difficult to know whether any changes in academic indicators are for all ethnic groups or for only a few.
• Establish data linkages between the CSRS and other data sets including
the WASL. We found discrepancies in data elements, such as in ethnicity and school district, for the same students when different data sets were compared. Work should begin to ensure that data are consistent across data sets and that linkages can occur. Without such longitudinal data,
30
31
efforts to examine the factors that contribute to improvement over time will be severely limited.
• In consultation with Pacific Islander groups, identify research questions
about academic achievement that are meaningful for the schools and Pacific Islander communities
• Conduct follow-up of students who graduate from Washington State high
schools. The Beyond High School project provides some interesting findings about what happens to seniors once they graduate from high school. These types of studies are critical to understand the short- and long-term consequences of schooling in Washington State.
Endnotes 1 This information is taken from the city of Kalama Web site (http://www.cityofkalama.com/ history.htm): “Kalama received its name from the river two miles to the north. The Kalama River was named after John Kalama, a full-blooded Hawaiian, who was born on the Hawaiian islands in 1814.” 2 See for example: J. P. Leigh, “Direct and Indirect Effects of Education on Health,” Social Science & Medicine 17 (1983): 227–234; S. M. Lynch, “Cohort and Life-Course Patterns in the Relationship Between Education and Health: A Hierarchical Approach,” Demography 40 (2003): 309–331; H. Mann, “Report no. 12 of the Massachusetts School Board,” in The Republic and the School: Horace Mann on the Education of Free Men, ed. L. A. Cremin (New York: Teachers College Press, 1957); J. Mirowsky and C. E. Ross, “Education, Personal Control, Lifestyle and Health: A Human Capital Hypothesis,” Research on Aging 20 (1998): 415–449; J. Mirowsky and C. E. Ross, Education, Social Status, and Health (New York: Walter de Gruyter, 2003). 3 College Board, Education Pays, 2005: The Benefits of Higher Education for Individuals and Society (Washington, DC: College Board, 2005). 4 Multi-Ethnic Think Tank, Call to Action: Mandating an Equitable and Culturally Competent Education for All Students in Washington State (Seattle: METT, 2002). 5 T. Kopple, Kanakas: The Untold Story of Hawaiian Pioneers in British Columbia and the Pacific Northwest (Vancouver, BC: Whitecap Books, 1995). 6 D. Takumi, Shared Dreams: A History of Asians and Pacific Islanders in Washington State (Seattle: Washington Centennial Commission, 1989). 7 The 2000 U.S. Census allowed respondents for the first time to select multiple racial groups. Individuals could be classified as belonging to a single group or multiple groups depending on their preferences. The Census provides data on different racial categories. Accordingly, the numbers for different racial groups can be divergent depending on which definition of race is used. In this report, we use the individuals who classify themselves only as Pacific Islanders.
8 In the OSPI data sets, a number of students were identified as Pacific Islanders who spoke Asian languages. Although it is possible this could be the case, we are unable to determine whether these
32
were misclassifications or accurate representations of the languages spoken. We chose to not describe these data to prevent any confusion and to avoid detracting from the main themes of this report. 9 The UW-BHS (University of Washington-Beyond High School, Charles Hirschman, principal investigator) project is a study of educational attainment and the transition to adulthood among more than 9,600 students who were first interviewed in the spring of their senior year in high school and followed up 1 year later. The primary goals of the study are to: (1) describe and explain differences in the transition from high school to college by race and ethnicity, socioeconomic origins, and other characteristics, (2) evaluate of the impact of the Washington State Achievers Program, and (3) explore the implications of multiple race and ethnic identities. The first baseline UW-BHS senior survey was conducted in the spring of 2000 in five comprehensive high schools in one district. Students who were absent on the day of the survey as well as students enrolled in alternative educational programs were contacted by mail. The second baseline survey was conducted for the same set of high schools in 2002. The next two waves of the survey occurred in 2002 and 2003, the years in which the scholarship program was introduced, and the final 2 years of data collection in 2004 and 2005 witnessed the beginning of the program of school reform. Data are pooled over the years for the tables reported in this report. For the Pacific Islander sample, the tables include data on Guamanians (N = 42), Samoans (N = 118), Native Hawaiians (N = 81), Other Pacific Islanders (N = 26), and non–Pacific Islanders (N = 9,159). 10 P. Bravemen, and S. Egerter, Overcoming Obstacles to Health: Report from the Robert Wood Johnson Foundation to the Commission to Build a Healthier America (Princeton, NJ: Robert Wood Johnson Foundation, 2008). 11 M. D. Hayward and B. K. Gorman, “The Long Arm of Childhood: The Influence of Early-Life Social Conditions on Men’s Mortality,” Demography 41, no. 1 (2004): 87–107. 12 Ledward, B., and B. Takayama, Ho'opilina Kumu: Culture-Based Education Among Hawai'i Teachers (Honolulu: Kamehameha Schools, Research and Evaluation Division, 2008). 13 Ledward, B., B. Takayama, and W. Kahumoku III. Kiki Na Wai: Swiftly Flowing Streams. Examples of 'Ohana and Community Integration in Culture-Based Education (Honolulu: Kamehameha Schools, Research & Evaluation Division, 2008), 1. 14 Ledward and Takayama, Ho'opilina Kumu; Ledward, Takayama, and Kahumoku, Kiki Na Wai,
1. 15 Rickard, A., “Constant Perimeter, Varying Area: A Case Study of Teaching and Learning Mathematics to Design a Fish Rack,” Journal of American Indian Research, 44, no. 3 (2005): 80–100. 16 Rickard, “Constant Perimeter, Varying Area,” 80–100.
APPENDIX A
Selected Readings on Pacific Islanders and Their Education
Alliance for Excellent Education. (2007). Asian Pacific Islander American Students and U.S. High Schools. Washington DC: Alliance for Excellent Education.
Asian American Justice Center. (2006). A Community of Contrasts: Asian Americans and Pacific Islanders in the United States. Washington DC: Asian American Justice Center.
Barcelo, N. (2004). The State of Hawaiian/Pacific Islanders at the University of Washington. Seattle, WA: University of Washington.
Kitano, M. K. and M. DiJiosia. (2000). Are Asian and Pacific Americans over represented in programs for the gifted? Roeper Review: A Journal on Gifted Education, 24:76-80.
Kopple, T. (1995). Kanakas: The Untold Story of Hawaiian Pioneers in British Columbia and the Pacific Northwest. British Columbia: White Cap Books.
Lai, E. and D. Arguelles. (1998). The New Face of Asian Pacific America: Numbers, Diversity, and Change in the 21st Century. Los Angeles, CA: Asian Week with UCLA Asian American Studies Center Press. Ledward, B. and B. Takayama. (2008). Ho'opilina kumu: Culture-based education among Hawai'i teachers. Honolulu, HI: Kamehameha Schools, Research and Evaluation Division. Ledward, B., B. Takayama, and W. Kahumoku III. (2008). Kiki na wai: Swiftly flowing streams. Examples of 'ohana and community integration in culture-based education. Honolulu, HI: Kamehameha Schools, Research & Evaluation Division. Lee, Stacey J. with K. Kumashiro. (2005). A Report on the Status of Asian Americans and Pacific Islanders in Education: Beyond the ‘Model Minority’ Stereotype. Washington, DC: National Education Association. Liang, Christopher T. H., Marie P. Ting, and Daniel Hiroyuki Teraguchi. (2001). Access denied: The complexity of Asian Pacific Americans. Diversity Web.
Mayeda, David Tokiharu, Lisa Pasko, and Meda Chesney-Lind. (2006). You got to do so much to actually make it: Gender, Ethnicity, and Samoan Youth in Hawaií. aapi nexus 4:69-93.
National Commission on Asian American and Pacific Islander Research in Education. (CARE). (2008). Asian Americans and Pacific Islanders: Facts, Not Fiction: Setting the Record Straight. New York, NY: The Asian / Pacific / American Institute and the Steinhardt Institute for Higher Education Policy at New York University.
A-1
National Pacific Islander Educator Network (NPIEN). (2007). Uniting the resources of the village to strengthen families, the community, and to promote educational excellence. Lakewood, CA: NIPEN.
Pacific Islander Women’s Association. (2006). Voices of Pacific Island women: Residing in the Pacific Northwest: Reflections of health, economics, education, and more. Seattle, WA: Pacific Island Women’s Association.
Pang, V. O. and L. L. Cheng. (1998). Struggling to be heard: The unmet needs of Asian Pacific American children. Albany, NY: State University of New York Press.
Pang, V. O., Peter N. Kiang, and Yoon K. Pak. (2004). Asian Pacific American Students: Challenging A Biased Educational System. Pp. 542-563 in Handbook of Research on Multicultural Education, edited by J. A. Banks and C. M. Banks. San Francisco, CA: Jossey-Bass.
President's Advisory Commission on Asian Americans and Pacific Islanders. (2001). Asian Americans and Pacific Islanders: A People Looking Forward Action for Access and Partnerships in the 21st Century. Rockville, MD: White House Initiative on Asian Americans and Pacific Islanders.
Rickard, A. (2005). Constant perimeter, varying area: A case study of teaching and learning mathematics to design a fish rack. Journal of American Indian Research, 44(3), 80–100. Small, Cathy A. (2007). Pacific: Fiji, Tonga, Samoa. Pp. 534-542 in The New Americans: A guide to immigration since 1965, edited by M. C. Waters and R. Ueda. Cambridge, MA: Harvard University Press.
Takumi, D. (1989). Shared Dreams: A History of Asians and Pacific Islanders in Washington State. Seattle, WA: Washington Centennial Commission.
The Washington State Multi-Ethnic Think Tank. (2002). Call to action: Mandating an equitable and culturally competent education for all students in Washington State. Seattle, WA: Community Outreach of the Office of Superintendent of Public Instruction (OSPI).
UCLA Asian American Studies Center et al. (2006). Pacific Islanders Lagging Behind in Higher Educational Attainment: Analytical Brief of New Cenus Data. Los Angeles, CA: UCLA Asian American Studies Center - Census Information Center, UC AAPI Policy Intiative, Asian Pacific American Legal Center.
U.S. Census Bureau. (2005). We the People: Pacific Islanders in the United States (Census 2000 Special Reports). Washington, DC: U.S. Department of Commerce, Economics and Statistics Administration.
U.S. Census Bureau. (2007). The American Community – Pacific Islanders: 2004 (American Community Survey Reports). Washington, DC: Ù.S. Department of Commerce, Economics and Statistics Administration.
A-2
A-3
U.S. Government Accountability Office (GAO). (2007). Higher Education: Information Sharing Could Help Institutions Identify and Address Challenges Some Asian Americans and Pacific Islander Students Face. Washington, DC: GAO.
Waters, Mary C. and Reed Ueda. (2007). The New Americans: A guide to immigration since 1965. Cambridge, MA: Harvard University Press.
APPENDIX B
About the Researchers and Research Team David T. Takeuchi, Ph.D., is a sociologist and Professor in the School of Social Work and the Department of Sociology at the University of Washington. His research focuses on educational and health topics related to race, ethnicity, immigration, and social class. He recently received the Family Research Consortium Legacy Award for research and mentoring and the National Center on Health and Health Disparities Innovations Award for his research to improve the quality of life for people in diverse communities. Shirley Hune, Ph.D., is a Professor of Educational Leadership and Policy Studies at the University of Washington Seattle. From 1992-2007, she was Associate Dean of the Graduate Division at UCLA and a Professor of Urban Planning. Her research focuses on immigration, race, and gender, Asian American history and access and equity in higher education. She is a member of the Research Advisory Councils of the Gates Millennium Scholars and the Washington State Achievers Programs. Third Andresen is a Ph.D. student at the College of Education, University of Washington in curriculum and instruction focusing on multicultural education. He has been in the field of education and a community organizer for 12 years. He is a well regarded spoken word artist, fundraiser, and producer in the Filipino American community of Seattle. Seunghye Hong is currently a Ph.D. candidate in the School of Social Work at the University of Washington. Her primary research interests are neighborhood contexts, mental health, and immigration among racial/ethnic minority groups, focusing on Asian Americans and Latinos. Julie Kang completed her PhD in curriculum and instruction at the University of Washington in 2008. She is a faculty member at the University of Washington Seattle and Bothell, working with teachers seeking National Board Certification and Professional Teaching Certificates. Her research interests include oral histories of Asian American teachers, families, and communities of Title I/Learning Assistance Program (LAP) and English Language Learner (ELL) students. Mavae ‘Aho Redmond is a graduate student in counseling psychology at Argosy University in Seattle. Her research interests consist of working within the Pacific Islander community, where she is known as an advocate. She served honorably in the United States Navy, active duty realm and currently is stationed at Naval Station Everett, Washington as a Reservist. Jeom Ja Yeo is a Ph.D. candidate in curriculum and instruction at the University of Washington Seattle. Her research interests are immigration, race, ethnicity, and urban and suburban school policies and practices. She has been involved in various studies administrated by the Center for the Study of Teaching and Policy (CSTP) during the course of her doctoral study.
B-1