Embed Size (px)
Citation preview
Growing the Productive Base of Māori Freehold Land Prepared for Ministry for Primary Industries by PricewaterhouseCoopers
February 2013
DisclaimerEvery effort has been made to ensure the information in this information paper is accurate.
The Ministry for Primary Industries does not accept any responsibility or liability for any error of fact, omission, interpretation or opinion that may be present, however it may have occurred.
Requests for further copies of this information paper should be directed to:
Publications Logistics OfficerMinistry for Primary IndustriesPO Box 2526WELLINGTON 6140
Email: [email protected]: 0800 00 83 33
This publication is available on the Ministry for Primary Industries website at http://www.mpi.govt.nz/news-resources/publications.aspx
AcknowledgementsThe Ministry for Primary Industries acknowledges and thanks PwC, the authors, for the research and compilation of this report.
The Ministry for Primary Industries thanks the Ministry of Justice, Office of the Chief Registrar – Māori Land Court for the provision of data on Māori Freehold Land.
ISBN No: 978-0-478-40528-6 (print)ISBN No: 978-0-478-40529-3 (online)
© Crown Copyright, February 2013 - Ministry for Primary Industries
Growing the Productive Base of Māori Freehold Land Prepared for Ministry for Primary Industries by PricewaterhouseCoopers
February 2013
2 GROWING THE PRODUCTIVE BASE OF MĀORI FREEHOLD LAND PRICEWATERHOUSECOOPERS
CONTENTS
Ministry for Primary industries Foreword 3
PwC Introduction 4
Executive Summary 5
Introduction 9
Model Development 15
National Industry Analysis 21
Regionalising the Model 24
Case Study 29
Conclusions 32
References 35
Appendices 36

3PRICEWATERHOUSECOOPERS GROWING THE PRODUCTIVE BASE OF MĀORI FREEHOLD LAND
MINISTRY FOR PRIMARY INDUSTRIES FOREWORDTuatahi, me mihi atu ki a rātou mā ngā tini aitua.
E ngā mate huhua puta noa i te motu, haere atu rā, haere atu rā.
Nō reira, waihō ake ko te aka o te rangi ki a rātou kua whetūrangitia. Ko te aka o te whenua ki a tātou nei te hunga ora.
Tihei mauri ora.
E aku nui, e aku rahi, e aku whakatamarahi ki te rangi, tēnā koutou katoa.
First we pay our respects to the many deceased.
To the multitudes who have passed on, all around the country, we bid farewell.
Therefore, we leave the realm of the deceased and return to the world of light.
Behold the sneeze of life.
To the esteemed masses, greetings and salutations to all.
New Zealand’s primary sectors are the engine room of our economy. The success of these sectors is integral to providing economic, social and environmental well-being for all New Zealanders, and Māori have a big role to play in this area.
Significant opportunities for further economic development are available for Māori participants in the primary sector, in particular through maximising the potential of Māori-owned land.
This report – Growing the Productive Base of Māori Freehold Land – explores the economic benefits that Māori and all New Zealanders stand to gain from lifting production on Māori freehold land to achieve average industry benchmarks.
In order to realise the potential identified in this report, MPI will need to work collaboratively with Māori, and other primary sector participants, to enable increased productivity from the sustainable use of Māori primary sector assets. Partnering with Māori to enable the growth of New Zealand’s primary sectors is a central part of MPI’s Strategy 2030 – Growing and Protecting New Zealand.
I am excited about the future of Māori Agribusiness. Economic development in this area will continue to enhance the already growing Māori economy, which – in turn – will contribute to the New Zealand economy.
Wayne McNee Director-General
4 GROWING THE PRODUCTIVE BASE OF MĀORI FREEHOLD LAND PRICEWATERHOUSECOOPERS
PwC INTRODUCTIONPwC is pleased to have had the opportunity to work with the Ministry for Primary Industries (MPI) to develop a measure of the potential economic value from bringing under-utilised and unproductive freehold Māori land into the productive agriculture sector. Current Government policy has set a path to grow the primary export base, so ensuring that as much of the available productive land resource is meaningfully in production is a must-do. The potential in the Māori freehold land resource provides such an opportunity.
The analysis developed and described in this report was the result of a short assignment to test whether it was possible to measure in economic terms, the impact of policies to facilitate the introduction of freehold Māori land into the agriculture sector. In this sense the findings presented within are a proof of concept that a difference can be made and is, to some extent, measurable.
To this end the analysis utilised a standard economic framework in the form of Statistics New Zealand’s System of National Accounts. Forward-looking projections for the agriculture sector output were capped to remain within the forecasts and projections produced by MPI. The choice of framework and use of existing forecasts was done deliberately to keep the focus on the question of whether the development and deployment of particular agriculture sector policies can (and should) be measured. The answer is an unequivocal “yes”.
Because it is highly unlikely that all land could be brought into production successfully during the future period used here, the study illustrates the possible upper bound of foregone opportunities from not having the freehold Māori land resource turned towards successful productive activity. To keep in line with this we also chose to focus on the pastoral sector and exclude forestry from the analysis due in part to the long lead times associated with this activity. In reality, some of the land assigned in the analysis to sheep and beef farming would probably be more suited for forestry and therefore this represents an opportunity to further extend the insights gained from this analytical approach.
Likewise, further opportunities exist to extend this approach, including more comprehensive analysis of land that constitutes the freehold Māori land
resource base and developing further understanding around the regional variations in agriculture production. Accessing the potential locked up in the freehold Māori land resource not currently in production will take a sustained and significant coordinated effort. The size of the prize at stake suggests that the effort is worth it.
While the size of the prize is significant for both Māori and NZ Inc., nothing comes for free. Bringing the land into production demands a sizable investment. An undertaking of this size and scale will require coordination across different areas of government in the process of working with Iwi and local Māori land owners to bring about successful investment. Perhaps in this sense the absolute size of the opportunity presented is less important than having a common framework and therefore language to engage and build through.
Involvement of the land-based science sector and the tertiary education sector will also be required, as will involvement of the private sector, if the introduced land is to be brought up to current productive standards. An examination of the role of Māori Trusts and Māori Incorporations in agribusiness and the optimal regulatory and ownership settings underpinning Māori land ownership will also be crucial to success – one area requiring significant innovation is surmounting the challenge of small block holdings to increasing land utilisation and productivity.
Finally, this report is based upon economic analysis which should only be used as a means for assessing the benefits of a course of (policy) action and as a tool for engaging with communities and/or groups as to local development possibilities. It cannot be used for financial analysis and does not constitute financial advice – it is recommended that individual opportunities and or projects undergo proper and thorough financial appraisal before any commitment to proceed.
We hope that in some small way this report and the analytical approaches developed within provide a useful contribution towards the implementation of workable polices that can push towards the attainment of the Government’s ambitious but critically important economic growth agenda.

5PRICEWATERHOUSECOOPERS GROWING THE PRODUCTIVE BASE OF MĀORI FREEHOLD LAND
EXECUTIVE SUMMARY
There are positive economic consequences associated with facilitating Māori freehold land into the productive sector:
1. This study explored the potential “size of the prize” in economic terms around MPI applying new governance and management models to facilitate the introduction of currently under-utilised and unproductive freehold Māori land into production.
2. The tangible benefits from introducing more Māori freehold land into production include realising an additional nominal $8 billion in gross output and $3.7 billion in value added above MPI baseline pastoral sector forecasts between 2013 and 2022.
3. The potential barriers to introducing the land include requirements for additional investment in the land of just under $3 billion and time required to bring the land into production – the benefits are tangible but likely to be incremental.
Evaluating the performance of governance and management models in improving Māori agribusiness returns…
1. This report outlines the development and deployment of an economic framework to explore the assessment of initiatives to improve the governance and management models currently in use for the stewardship of Māori freehold land.
2. The model developed offers an indication of the consequences for components of the agriculture sector of introducing under-performing and under-utilised Māori land into use, and is then extended to a regional and local level.
3. The Māori Primary Sector Partnerships Branch (MPSP) at the Ministry for Primary Industries (MPI) has an initiative to bring under-performing Māori freehold land up to agriculture sector performance standards and to also bring under-utilised freehold land into the productive sector.
4. A previous Ministry of Agriculture and Forestry report identified 1.5 million hectares of Māori freehold land with only 20 percent of this considered to be operating productively at or above relevant industry benchmarks. The balance was considered to be either under-performing (40 percent) or under-utilised (40 percent).
5. The initiative MPSP has developed involves facilitating the introduction of improved
governance and management frameworks over the stewardship of the low productivity land to open up a path towards bringing it into full (or improved) production by industry standards. MPSP requires a means to assess the likely economic effects associated with the potential uptake of the enhanced governance and management models.
6. The two main questions evaluated in this report are how to potentially evaluate and measure the effectiveness of the MPSP governance and management model deployment in economic terms and secondly, what is the potential economic worth from bringing in more Māori freehold land:
a. The answer to the first question was affirmative. Yes, the deployment of the new governance and management model could be evaluated from an economic perspective.
b. The answer to the second question was also positive – there are tangible benefits to bringing in the additional land, as the rest of this report demonstrates.
The relationship between governance and management models, economic returns and developing an economic assessment framework…
7. The economic assessment model developed in this report has direct linkages to the governance and management model framework proposed by MPSP and is capable
6 GROWING THE PRODUCTIVE BASE OF MĀORI FREEHOLD LAND PRICEWATERHOUSECOOPERS
of providing output that would be consistent with the Government’s strategies, such as the Business Growth Agenda.
8. The logic underlying the economic model has been developed from existing Statistics New Zealand frameworks for reporting national accounts (GDP).
9. The data used in the model originates from official statistics compiled by Statistics New Zealand, and also from MPI through its publications. In this regard, the results produced by the model are developed from MPI estimates, forecasts, and long range projections for output from the agriculture sector. We have also incorporated industry data where this is available.
10. The assessments undertaken with the model were threefold:a. The model was used to assess the overall
impact at a national industry level of bringing the available under-performing and under-utilised Māori freehold land into the productive sector.
b. A regional assessment was conducted on Northland, to provide an example and to link with the case study.
c. A case study of a generic land block (land block X).
The amount of Māori land available to bring into production is a critical assumption…
11. A critical component influencing the model’s output was the assumed size and quality of the available Māori freehold land. Land to be introduced was allocated following a MAF report on Māori freehold land, with just under 1 million hectares of land identified as either unproductive or under-utilised.
12. This land was assumed to go into either dairy production or sheep and beef farming, which was assumed to be the highest value uses available. The model did not consider other forms of agriculture (e.g. horticulture or other farming) or forestry. The breakdown of land between the two pastoral industries was:
a. Dairy was assumed to have just under
61,000 hectares available.
b. Sheep and beef farming was assumed to have around 910,000 hectares available.
13. It is unlikely that such a large amount of land could be brought in simultaneously, so we assume that land was introduced over a three year cycle.
Other important assumptions and perspectives used in the analytical process…
14. The evaluation was carried out using a standard economic accounting framework used by Statistics New Zealand – the System of National Accounts (SNA).
15. The model used MPI estimates, forecasts and projections between 2010 and 2022 for agriculture sector gross output. These figures provide the baseline expectations for sector performance over the next ten years. These figures were combined with the SNA framework to create the model.
16. The model used aggregated sector performance data from MPI to populate the parts of the model that calculated the potential benefits from the freehold Māori land brought into production. This data was at a national level, but for brevity and proof of concept reasons was also used for the regional and case study analyses. The model could be made more realistic at regional and case study levels by utilising industry data collected down to finer levels of detail.
17. A core assumption centred on the successful uptake of the governance and management model so that the total amount of land could be brought in within three years. This allowed the MPI forecast and projection range to be used as the comparator baseline without having to generate additional (and possibly contentious) longer range sector projections. The drawback is this is not a likely realistic time frame for bringing the land in – it will take longer to achieve.
18. The analysis concentrated on the pastoral sector including dairy farming and sheep and beef farming, with the assumption that the
7PRICEWATERHOUSECOOPERS GROWING THE PRODUCTIVE BASE OF MĀORI FREEHOLD LAND
land potentially fit for dairying went into that use while the balance went into sheep and beef. Realistically, some of the land assigned to sheep and beef farming is probably better suited to forestry purposes, but forestry was left out of the analysis in this report for reasons stated herein.
19. The analysis was kept in nominal terms to align with MPI gross output forecasts and projections for the sector. Further work could be done to render the analysis in real (inflation adjusted) terms which may be useful for undertaking more detailed evaluation around interventions using the governance and management model, such as cost-benefit analysis.
This report is about the proof of concept around an evaluation framework for analysing a potential intervention in the form of a new governance and management model for facilitating improved performance from Māori freehold land. It is also about estimating the size of the economic prize associated with bringing currently unproductive and under-utilised freehold Māori land into more productive use.
The size of the impact at a national industry level…
20. From a national perspective, looking at the impacts on the dairy and sheep and beef industries, the potential impact created from the injection of Māori freehold land consists of changes in output, employment, investment and contribution to GDP over and above MPI forecasts for the pastoral sector:
a. just under $8 billion in nominal total output;
b. 3600 jobs over ten years;
c. just under $3 billion investment required (in nominal terms);
d. a $3.7 billion nominal contribution to GDP.
Adapting the model to assess economics at a regional level…
21. The model was decomposed to a regional level to allow a more localised analysis. Northland was chosen as the example region and estimates were developed for the potential size of available under-performing and under-utilised land. These estimates were based off the size of freehold estate in the region and our assumptions around the quality and availability of land derived from the MAF report. In this regard, Northland was estimated to have available:
a. 5,600 hectares for dairying;
b. just under than 49,000 hectares potentially available for sheep and beef.
22. When this land was introduced into the Northland model, the following impacts were generated:
a. An additional $700m increase in nominal gross output
b. A $300m nominal contribution to GDP
c. 331 full time equivalent positions over the 10 years
d. A $250m increase in investment (in nominal terms) in the region.
23. Northland was chosen because it is a relatively low income area, with parts that have very high unemployment and high levels of deprivation. Introducing the Māori land provides both an economic and social development initiative based around additional spending in the region associated with farming activities, additional profits accruing to owners of the land, and more salaries and wages.
Investigating a case study within a regional context…
24. Land block X was identified as a potential case study, with 573 hectares of high quality land, but considered under-utilised.
25. Following the assumption that the whole block was developed, this would render an effective area of 516 hectares, which at current stocking rates would support around 2,000 dairy cattle, equating to approximately 1,500 cows in milk producing over half a
8 GROWING THE PRODUCTIVE BASE OF MĀORI FREEHOLD LAND PRICEWATERHOUSECOOPERS
million kilograms of milk solids per annum.
26. The injection of Land block X into dairy production would generate, according to our model, the following economic benefits for the land owners and community over a ten year period:
a. $41m increase in nominal gross output;
b. $21m contribution to nominal GDP;
c. between 15 and 20 full time equivalent positions;
d. a $6m initial investment and ongoing investment of $4m over ten years (in nominal terms).
27. These benefits are based on MPI data at a national level. Adding regional data to the model would make the assessment much more realistic.
28. Land block X therefore has the potential to be a very large farm, by MPI model dairy farm standards, but not unrealistic compared to other farms here and overseas. The size requires a well developed governance and management structure, employing a division of labour for the various farm management and operational tasks. It also creates the opportunity to introduce education and experiential initiatives through farm cadet and farm trainee schemes
The assumptions for the model include being able to bring the land into the sector within a 3-year time frame; this was used as a device to help quantify the size of potential benefits within the period for which MPI sector forecasts and projections were available. Realistically, this will not be possible as there are real reasons why the land is not currently in production and it will take time for the facilitation of improved governance and management models to influence this. Therefore, the potential benefits are more likely to be spread over time – the benefits are tangible, just incremental.
The Ministry for Primary Industries wishes to find a means of quantifying the potential economic consequences of bringing more Māori freehold land into production, following implementation of improved governance and management models:
1. There is a quantifiable relationship between better governance and management models and improved economic outcomes.
2. There is a significant resource of Māori freehold land that could be further developed which is currently either unproductive or under-utilised.
3. This report describes the development of an economic framework to measure how effective governance practise can increase efficiency and overall economic performance.
9PRICEWATERHOUSECOOPERS GROWING THE PRODUCTIVE BASE OF MĀORI FREEHOLD LAND
The assumptions for the model include being able to bring the land into the sector within a 3-year time frame; this was used as a device to help quantify the size of potential benefits within the period for which MPI sector forecasts and projections were available. Realistically, this will not be possible as there are real reasons why the land is not currently in production and it will take time for the facilitation of improved governance and management models to influence this. Therefore, the potential benefits are more likely to be spread over time – the benefits are tangible, just incremental.
The Ministry for Primary Industries wishes to find a means of quantifying the potential economic consequences of bringing more Māori freehold land into production, following implementation of improved governance and management models:
1. There is a quantifiable relationship between better governance and management models and improved economic outcomes.
2. There is a significant resource of Māori freehold land that could be further developed which is currently either unproductive or under-utilised.
3. This report describes the development of an economic framework to measure how effective governance practise can increase efficiency and overall economic performance.
INTRODUCTION
PURPOSEPwC was engaged by the Ministry for Primary Industries (MPI) to assist its Māori Primary Sector Partnerships Branch to develop measures of economic performance for the agriculture sector that would enable the potential impact of increasing the performance of Māori agribusinesses to be assessed. This work is designed to complement the development of a governance framework that will help bring under-utilised land into the productive sector, as well as help improve under-performing land. It answers two questions:
1. Is there an economic framework that can be developed and used to analyse the potential benefits associated with deploying a new governance and management model to under-performing and under-utilised Māori freehold land?
2. What is the potential size of this economic benefit if the land could be brought into production at national benchmark levels?
Economic assessment is required as a tool to determine the potential to generate local and national returns from the better use of this land. Governance is the critical issue associated with this process because of the complex nature of the ownership structures covering many Māori land blocks and the laws covering the administration of such lands.
BACKGROUNDMPI has a project designed to deliver a framework that will improve governance, strategy
and business implementation processes for Māori landowners with a view that this will lift the productivity, efficiency and/or profitability of their agribusiness ventures. This will have particular application to currently under-utilised and/or low productive land.
The framework is currently at a conceptual stage of development. To support the continued progress of the framework, robust estimates are required to gauge the impact the model might have on the New Zealand agriculture sector via bringing further Māori land into production. These estimates need to form the basis of Ministerial advice and ongoing management and monitoring of the eventual introduction of the facilitation programme.
Facilitating better governance and management processes amongst Māori agribusinesses aligns neatly with the Government’s Business Growth Agenda (BGA) in terms of assisting with the development of viable primary sector businesses through:• Better access to international supply chains,
e.g. through supplying Fonterra.• Improved access to national innovation
networks deployed in the pastoral sector that help drive dairying and sheep and beef performance.
• The opportunity to build skills and experience in a sector of the economy that produces the majority of the country’s export receipts, yet badly needs a young and well trained work force.
• Increased interaction with both national and international capital markets.
10 GROWING THE PRODUCTIVE BASE OF MĀORI FREEHOLD LAND PRICEWATERHOUSECOOPERS
• Utilising more of the country’s natural resources in a sustainable manner and making better use of existing regional and national infrastructure.
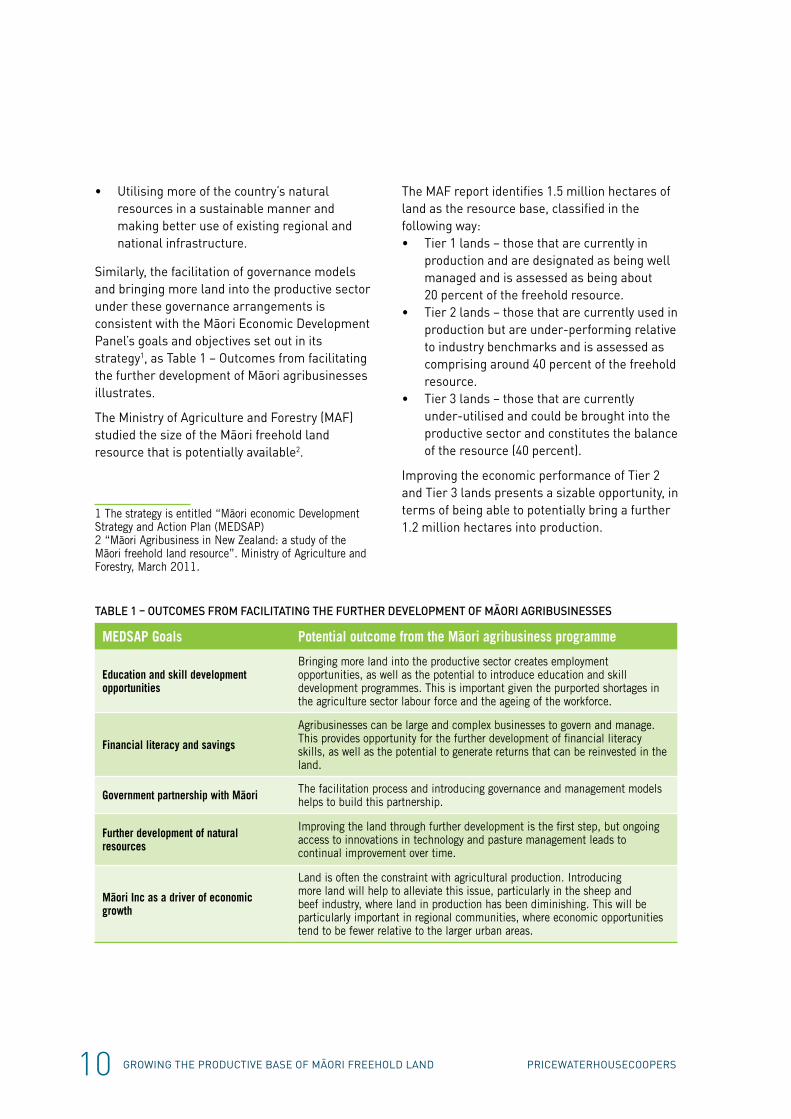
Similarly, the facilitation of governance models and bringing more land into the productive sector under these governance arrangements is consistent with the Māori Economic Development Panel’s goals and objectives set out in its strategy1, as Table 1 – Outcomes from facilitating the further development of Māori agribusinesses illustrates.
The Ministry of Agriculture and Forestry (MAF) studied the size of the Māori freehold land resource that is potentially available2.
1 The strategy is entitled “Māori economic Development Strategy and Action Plan (MEDSAP)2 “Māori Agribusiness in New Zealand: a study of the Māori freehold land resource”. Ministry of Agriculture and Forestry, March 2011.
The MAF report identifies 1.5 million hectares of land as the resource base, classified in the following way:• Tier 1 lands – those that are currently in
production and are designated as being well managed and is assessed as being about 20 percent of the freehold resource.
• Tier 2 lands – those that are currently used in production but are under-performing relative to industry benchmarks and is assessed as comprising around 40 percent of the freehold resource.
• Tier 3 lands – those that are currently under-utilised and could be brought into the productive sector and constitutes the balance of the resource (40 percent).
Improving the economic performance of Tier 2 and Tier 3 lands presents a sizable opportunity, in terms of being able to potentially bring a further 1.2 million hectares into production.
TABLE 1 – OUTCOMES FROM FACILITATING THE FURTHER DEVELOPMENT OF MĀORI AGRIBUSINESSES
MEDSAP Goals Potential outcome from the Māori agribusiness programme
Education and skill development opportunities
Bringing more land into the productive sector creates employment opportunities, as well as the potential to introduce education and skill development programmes. This is important given the purported shortages in the agriculture sector labour force and the ageing of the workforce.
Financial literacy and savings
Agribusinesses can be large and complex businesses to govern and manage. This provides opportunity for the further development of financial literacy skills, as well as the potential to generate returns that can be reinvested in the land.
Government partnership with Māori The facilitation process and introducing governance and management models helps to build this partnership.
Further development of natural resources
Improving the land through further development is the first step, but ongoing access to innovations in technology and pasture management leads to continual improvement over time.
Māori Inc as a driver of economic growth
Land is often the constraint with agricultural production. Introducing more land will help to alleviate this issue, particularly in the sheep and beef industry, where land in production has been diminishing. This will be particularly important in regional communities, where economic opportunities tend to be fewer relative to the larger urban areas.
11PRICEWATERHOUSECOOPERS GROWING THE PRODUCTIVE BASE OF MĀORI FREEHOLD LAND
SCOPEThe key task of this project is to provide advice and support to assist MPI with the further development of robust estimates through a high-level economic model. Specifically, this entails:• In the first instance, the provision of a
top-down economic model that can broadly estimate the effects on the agriculture sector of bringing further Māori land into production.
• Secondly, use this model to evaluate the potential wider development impacts on local and regional communities (e.g. employment and education opportunities).
• Thirdly, ensure that the top-down model can accommodate bottom-up approaches such as individual projects and/or regional initiatives. Application of the framework and model to an exploratory case study to assess the effectiveness of the model process at guiding intervention and investment may be required.
WHAT IS IN SCOPEThe primary function of this initial piece of work is the development of an economic model that can cover the agriculture sector and its major constituent industries. Given the timing of this project and the size and nature of the freehold land resource, it was decided to restrict the scope to better understanding the impacts of introducing the resource into the pastoral sector with emphasis on:• the dairy industry;• the sheep and beef farming industry.
In this regard, both of these industries constituted the best use of land in terms of potential utilisation and returns relative to the likely quality of the land in question (as illustrated by Table 3 in the model development section).
WHAT IS NOT IN SCOPEThere are three aspects linked to the Māori agribusiness governance project that are not within the scope of this work:
• Financial models (see the explanation below).• The further development of the governance
framework itself.• Some primary industry production groups,
such as horticulture and forestry.
There are important differences between economic models and financial models, but most importantly they measure different things and treat aspects of commercial undertakings differently. One of the most significant factors that will impact on the development of the model is that economic analysis does not count financial transfers.
This is important because a significant cost of doing business in the dairy industry is the requirement to purchase shares from Fonterra before milk supply will be accepted by the company. Since Fonterra accounts for around 90 percent of the milk market, this is a critical factor when assessing dairy projects because of the additional capital requirements. While the share purchase is a significant component of the capital required to establish a dairy farming agribusiness, they are classed as a transfer under economic analysis and do not figure in the estimates for investment used in this report.
The model we have developed only considers output at the farm gate, which includes the payments made to farmers for milk, meat and wool etc. The model does not consider export receipts, and it is assumed that all additional output produced from introducing further land can be absorbed by domestic and international markets for minimal price changes.
Additionally, the land injected in the model is only the Māori Freehold land identified in a 2008 MAF Report; general Māori owned land is not included in the scenario analysis.
One other component excluded in the model is the consideration of environmental costs; it is assumed that any new farming venture will be managed in an efficient and sustainable way.
12 GROWING THE PRODUCTIVE BASE OF MĀORI FREEHOLD LAND PRICEWATERHOUSECOOPERS
We decided not to explore forestry at this stage of the analysis, even though a good proportion of Māori land is suitable for plantation production forests. The reasoning behind this included:• The development cycle of planted production
forests ranges between 25 and 32 years, which is a long-term commitment – there are potentially other uses for land over shorter term cycles that offer employment and economic benefits which we think deserve consideration first.
• Planting in the forestry sector constitutes intermediate consumption in the first instance meaning that planting a forest reduces GDP short term. There is no gain in GDP until the harvesting phase has begun, but the returns are further in the future and therefore more difficult to assess.
• Short-term employment is generated through planting, but once this is finished other work is required (e.g. thinning and harvesting on other blocks) to sustain the labour force and more importantly any investment in industry oriented education and training – without a critical mass of forest resource across different age classes this will make it difficult to justify sustainability.
At the outset we felt we did not have sufficient information about the age spread of forest land across the freehold resource to be able to assess the ongoing impact of bringing land into forestry. The long time horizons between planting and harvesting (even with some intervening production thinning) meant the gains were difficult to assess within our time frames for this project.
REAL VERSUS NOMINAL ANALYSISEconomic analysis usually distinguishes between real and nominal variables. Real variables are those that have been adjusted for the effects of inflation, whereas nominal variables are expressed in current prices that retain the inflation component. Much of the data used in this analysis has been provided in nominal terms, including the Statistics New Zealand data on national accounts down to a more detailed
industry level, as well as MPI forecasts. Because the MPI data is expressed in nominal terms, sourced from the “Situation and Outlook for Primary Industries”, we have maintained our analysis and model development in nominal terms.
THE ROLE OF GOVERNANCE AND MANAGEMENT – SOME OBSERVATIONSThe model of the pastoral sector will allow the overall impact of the introduction of Māori land to be quantified. This section discusses several governance and management techniques to maximise efficiency should any land be brought into production. This review of literature draws on our own independent research to provide some insight as to how to get the most out of new land, if it is introduced.
• Correct scale governance structures that ensure the success of business operations. Sound governance must be in place before any policy or planning can be implemented to ensure the long-term success of the organisation. Smaller entities must be flexible in the implementation of governance to ensure they do not overburden the board with costly and inappropriate structures. The right structures can create clear accountabilities and appropriate benchmarks for performance.
• Remuneration of Trustees/Directors and Management to ensure the right calibre of applicant for these positions. The success of any entity will start with the selection of Trustees/Directors. These people will recruit the management team, who in turn will engage the right staff to ensure the successful operation of the entity. Trustee/directors must continually monitor and review performance. Top farm managers have a strong affinity with the land and would generally seek to provide long term sustainable farming systems. Many farm managers have been in place for 10 to 20 years and treat the land as their own. This area could however come under some pressure if Māori Authorities (e.g. Iwi) and other entities have provided remuneration
13PRICEWATERHOUSECOOPERS GROWING THE PRODUCTIVE BASE OF MĀORI FREEHOLD LAND
based on factors that are derived from short term profit policies.
• Planning is critical to the success of any business. Strategic Planning articulates the leadership role required of the board and gives a clear indication to management of what should be addressed during the preparation of Operation Plans. Strategic Plans would generally cover a three to ten year period, and provide a vision of where the board wants to head. Operational Plans typically cover a 12-month period and cover how the entity will make progress towards the set strategic objectives. If opportunities arise outside of the strategic plan, they should not be pursued without serious consideration.
• Skilled resource and flexibility to manage the farmland without interference from other interests (i.e. Trustees/Directors or Land Owners). Successful management requires key skills. If these skills are not available within the current resources, it is important that the right people are brought on board to ensure success. It is not essential to have a management team that is skilled in every area of management, but it is essential that the management team does know when they require outside assistance to provide the resources they need.
• Clear distinction between management and governance roles. Maintaining a clear distinction between governance and management and their responsibilities, as well as the ability to identify resource weakness and recruitment of skills required is key in the success of an organisation. There needs to be a clear understanding of the need for an effective structure and a monitoring system that separates operational matters from governance issues.
• Appropriate framework in place to assess organisation performance. Individual indicators will vary for organisations, depending of the goals and objectives of the organisation. Typically, there is a lack of guidelines on how to use performance
measures as indicators, and the process of identifying these factors is not always particularly well known in the farming sector.
• Resource Audit. The audit should include all resources which the organisation can access to support its strategies, some of which may be outside the organisation’s ownership, such as its network of contacts or customers. Although the audit must be comprehensive, it is important to identify the resources which are critical in underpinning its strategies – in contrast to those which are necessary, but which are not the means through which the organisation’s advantage is built.
• Stakeholder mapping. Useful for both identifying stakeholders and for establishing political priorities in terms of managing these stakeholders. Any company must understand how political and cultural issues of the organisation impact on strategic decision making.
• Diversification to spread risk of investment. This includes investing in different regions to minimise the risk of climatic disaster or investing in different stock groups to limit exposure to commodity volatility in any one particular income stream. A second category of diversification for Māori Authorities or entities is to look at different land uses which actually provide a return from their land holdings, enabling them to derive a better return from that asset than under their own management. This is diversification away from the standard land uses, but may be the only income stream for the authority and would generally be associated with smaller, marginally economic blocks. There are a wide range of diversification options open to Māori authorities, but any investment must have had suitable due diligence undertaken on its viability, and acceptable fallback options in place, prior to any commitment to proceed.
• Utilisation of networks. Effective business networks, especially between authorities representing owners and the farming entities themselves exist in many regions but are by no means being fully utilised. Future
14 GROWING THE PRODUCTIVE BASE OF MĀORI FREEHOLD LAND PRICEWATERHOUSECOOPERS
business growth will be enhanced, by better utilisation of existing networks and the development of new ones.
• Merger of smaller scale operations. Smaller scale operations that are not being well managed or moving forward, should seek out opportunities to amalgamate with other blocks and create a viable operation. Smaller blocks could look to amalgamate with larger authorities, who could develop the land to a level that makes the block economic to be run on its own. Good results have been gained by leasing out land. Initial payment can be the development of land from scrub, and then on to a set rental. These blocks have then accumulated rentals to finance the purchase of their own stock, or development of more intensive horticultural operations.
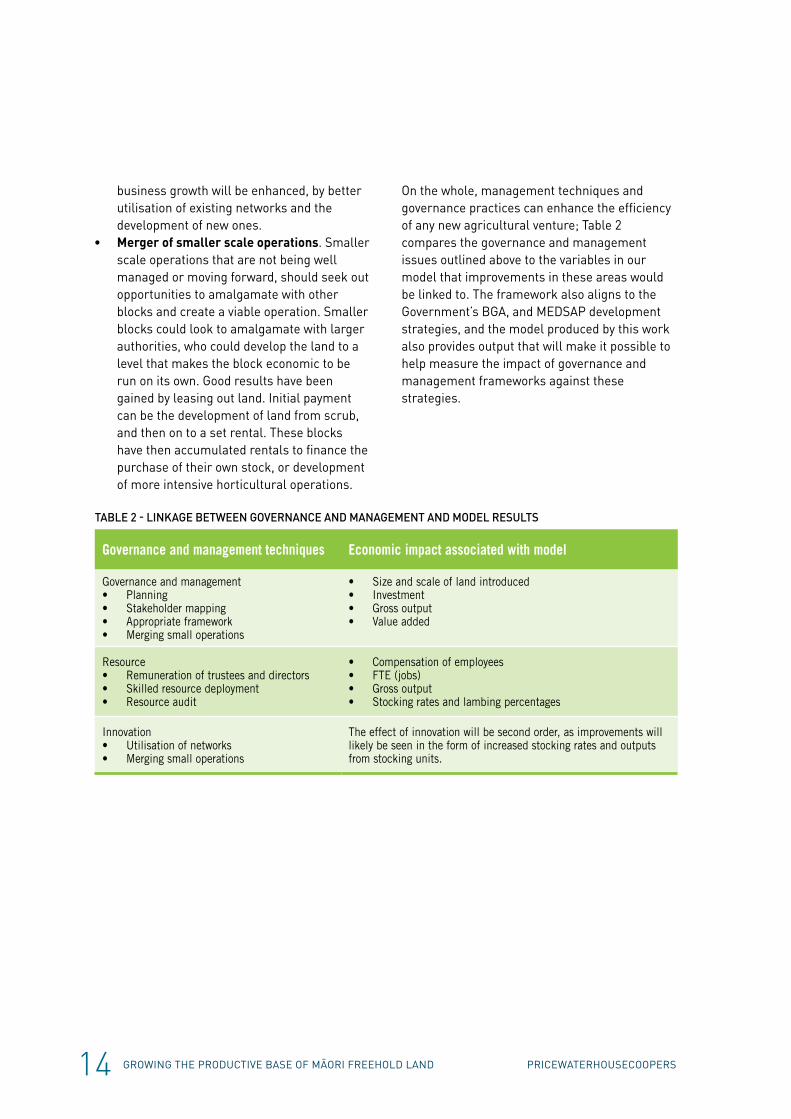
On the whole, management techniques and governance practices can enhance the efficiency of any new agricultural venture; Table 2 compares the governance and management issues outlined above to the variables in our model that improvements in these areas would be linked to. The framework also aligns to the Government’s BGA, and MEDSAP development strategies, and the model produced by this work also provides output that will make it possible to help measure the impact of governance and management frameworks against these strategies.
TABLE 2 - LINKAGE BETWEEN GOVERNANCE AND MANAGEMENT AND MODEL RESULTS
Governance and management techniques Economic impact associated with model
Governance and management• Planning• Stakeholder mapping• Appropriate framework• Merging small operations
• Size and scale of land introduced• Investment• Gross output• Value added
Resource• Remuneration of trustees and directors• Skilled resource deployment• Resource audit
• Compensation of employees• FTE (jobs)• Gross output• Stocking rates and lambing percentages
Innovation• Utilisation of networks• Merging small operations
The effect of innovation will be second order, as improvements will likely be seen in the form of increased stocking rates and outputs from stocking units.
15PRICEWATERHOUSECOOPERS GROWING THE PRODUCTIVE BASE OF MĀORI FREEHOLD LAND
SOURCES OF DATAThe model we have built relies on several data sources, both internal and external to PwC. This section outlines the data sources used, the variables taken from each source, and a description of the source.
STATISTICS NEW ZEALANDThe bulk of the macroeconomic data used to build industry models was drawn from the Statistics New Zealand national accounts database. These variables form the foundation of the industry models used to create a baseline model. The variables collected for both the sheep and beef, and dairy sectors from the national accounts database are:• gross output;• intermediate consumption;• value added;• compensation of employees;• operating surplus;• indirect taxes and subsidies;
MINISTRY FOR PRIMARY INDUSTRIES (MPI).When possible, MPI statistics were used in the model. The 2012 Statement of Primary Industries (SOPI) document was used to obtain estimates and forecasts for output across the various primary industries from 2010 to 2016.
The Statistics New Zealand national accounts data stops at 2009, and MPI data was used from 2010 to 2016.There was an overlap in the Statistics New Zealand and MPI data sets which aided continuity. The estimates for output in SOPI
were integrated with the Statistics New Zealand data to create a forward-looking model with a historical component.
Additional MPI estimates and projections for the pastoral sector were used to build the farm level models which allowed the impact of new inputs of land to be measured in terms of total sector output. Data from farm monitoring reports was used to create an estimate of the incremental revenue from additional land used for sheep and beef farming.
PwC REGIONAL INDUSTRY DATABASE (RID)The PwC RID is a database developed and managed by the Finance and Economics team at PwC; it contains employment information based on ANZSIC classifications for every industry in New Zealand. The number of full time employees in the agriculture sector and subcategories was drawn from the RID, and used to create an estimate for the compensation of employees in the industry models.
SELECTION OF INDUSTRIESFor this model we have only included a pastoral sector, with a sheep and beef and a diary industry. The agriculture industry also includes horticulture and other farming. Forestry is a separate industry.
For horticulture and other farming, the overall size of these industries was relatively small when compared to agriculture as a whole and the contribution made by the pastoral industries
MODEL DEVELOPMENT
This section describes how an economic framework was developed to undertake the analysis around improving Māori freehold land and what this would mean against a benchmark of current MPI forecasts and projections for the agriculture sector:
1. The model developed has a conservative approach through being based around existing economic accounting frameworks and using current published forward looking MPI data.
2. The model is also optimistic in terms of reflecting that the total freehold land base can be brought into production within three years. This is an assumption to capitalise on the MPI forecasts and projections.
3. The model uses a combination of top down and bottom up approaches within the standard economic accounting framework to provide estimates of the impact that introducing land makes.
16 GROWING THE PRODUCTIVE BASE OF MĀORI FREEHOLD LAND PRICEWATERHOUSECOOPERS
including dairy farming and sheep and beef farming. These industries contain many components and trying to accurately model the output would be a complex process within the project timeline. For example, there are over five different outputs in the horticulture sector, and each would need separate models and projections going forward. As a result, these industries have not been included in the model.
The complicating factor with forestry related to the timeframe. Our research indicated that a typical forestry development took place over a 25-30 year cycle, with ongoing investment needed in that time. This production window makes it difficult to model output from the industry in the timeframe of our model.
Given the constraints of the forestry, horticulture and other farming industries, our model focuses on the pastoral sector only, as this sector provides the most reliable projections going forward and allows an accurate idea of the impact to be measured.
ASSUMPTIONSIn building the economic model, a number of assumptions have been made. These assumptions are either conceptual or model assumptions. Conceptual assumptions are related to the way that the model is structured, while model assumptions relate to calculations within the model and how results have been generated. This section discusses conceptual assumptions, while the model assumptions are outlined in an appendix.
ECONOMIC MODELLINGThe model that has been developed is an economic model, not a financial model. According to the World Bank3 economic models aim to identify and compare economic and social benefits accruing to the economy as a whole, while financial models consider the revenues and costs in an attempt to estimate a financial rate of return. Economic and financial models are not independent, and both should be considered
3 http://rru.worldbank.org/documents/toolkits/highways/3_public/33/3333.htm
when estimating the economic and financial viability of individual projects. In this regard:• Financial models answer the question “is the
project viable with an acceptable rate of return?”
• Economic models answer the question “is it worth the effort and resources to intervene?”
IMPLEMENTATION CYCLESBoth the sheep and beef, and dairy models have an implementation cycle included. This means that when the decision to introduce the land is made, the land is introduced on a three year cycle. For example, the 60,305 hectares of dairy land is introduced at a rate of 20,100 hectares per year, in the three year cycle. Additionally, output from that investment is not seen until the following year, as a time lag is necessary to allow the development of the farm; land introduced in 2013 will not contribute to output until the following year.
EFFECTIVE FARM AREAFarm monitoring reports produced by MPI reference an effective farm area, which is the total area of farm land that is available for use. Our research has found that this effective area is typically around 90 percent of the total farm size, so any land introduced is scaled down to find the total effective area available for farming.
INDUSTRY STANDARDS AND BENCHMARKSThe model implicitly assumes that both the new land brought into the productive sector and the lifting of the under-performing land’s performance meet industry benchmarks around factors such as stocking rates, milk solids production and kill weights.
EMPLOYMENTPrior to 2011, employment was taken from Statistics New Zealand industry level statistics. From the years 2012-2022, employment data has been driven by both the volume of output, and the level of productivity. For example, increases in volume would lead to higher employment, while increases in productivity would lead to lower employment for a given level of production.

17PRICEWATERHOUSECOOPERS GROWING THE PRODUCTIVE BASE OF MĀORI FREEHOLD LAND
INVESTMENTWhen introducing new land into the model, several assumptions are made. There is a set up cost involved with establishing the farm, which would typically include land improvements, purchases of new machinery and other associated capital costs. Our estimates were based on a wide variety of sources456 to get a measure of the level of investment required for each new hectare of land. For dairy this was around $10,600 per hectare (excluding supplier share purchases), while sheep and beef farms had significantly lower per hectare investment levels relative to dairying. As well as the establishment investment, there will be ongoing maintenance investment to maintain the ongoing effectiveness of the production assets created. The effect of new land injection will be highest initially when the farm is being developed, with a small increase in ongoing maintenance investment.
DISPOSITION OF OUTPUTThe additional output generated by the land development process (milk solids, lamb and beef) can be absorbed into national and international markets at current and projected prices.
UNDER-UTILISED VS. UNDER-PERFORMING LANDOur model distinguishes land introduced from under-utilised and under-performing sources. From the MAF report it was documented that under-performing land operates at around 70 percent of full capacity. In our model, under-performing land only realises a 30 percent increase in output as it reaches full efficiency. Given that this land is already developed, the level of additional investment required per hectare will also be slightly lower.
4 http://business-success-strategy-center.simnz.com/business-investment/farming-business/dairy-farming/how-much-does-a-dairy-conversion-cost-in-nz/5 http://pasturetoprofit.blogspot.co.nz/2011/01/crash-burn-dairy-farmers-bankers-go-mad.html6 http://www.side.org.nz/IM_Custom/ContentStore/Assets/9/6/28c799363388e2b07d70c7be770fe87d/Converting%20your%20farm%20to%20dairying.pdf
BARRIERS TO MAORI FREEHOLD LANDThe model makes the assumption that all land is available has been introduced into the model. The modelling does not account for any local caveats or restrictions on land use. Much more detailed description of the available land is needed in order to account for these caveats on a case by case basis.
ALLOCATION OF MĀORI LANDThe number of hectares of Māori land available to be introduced into production is an important parameter for the model, as the total impact on output hinges on the amount of land that can be introduced. We have followed a 2011 MAF7 report, and applied several assumptions to generate an estimate of the amount of Māori land available for production.
A paper by Levente Timár8 in 2011 discussed rural land use in New Zealand, and the amount of Māori land that is potentially available. While this research would have been ideal for allocating the Māori land based on best use, all data was from 2002 only; the results were based on older data and therefore not used when determining the allocation of Māori land.
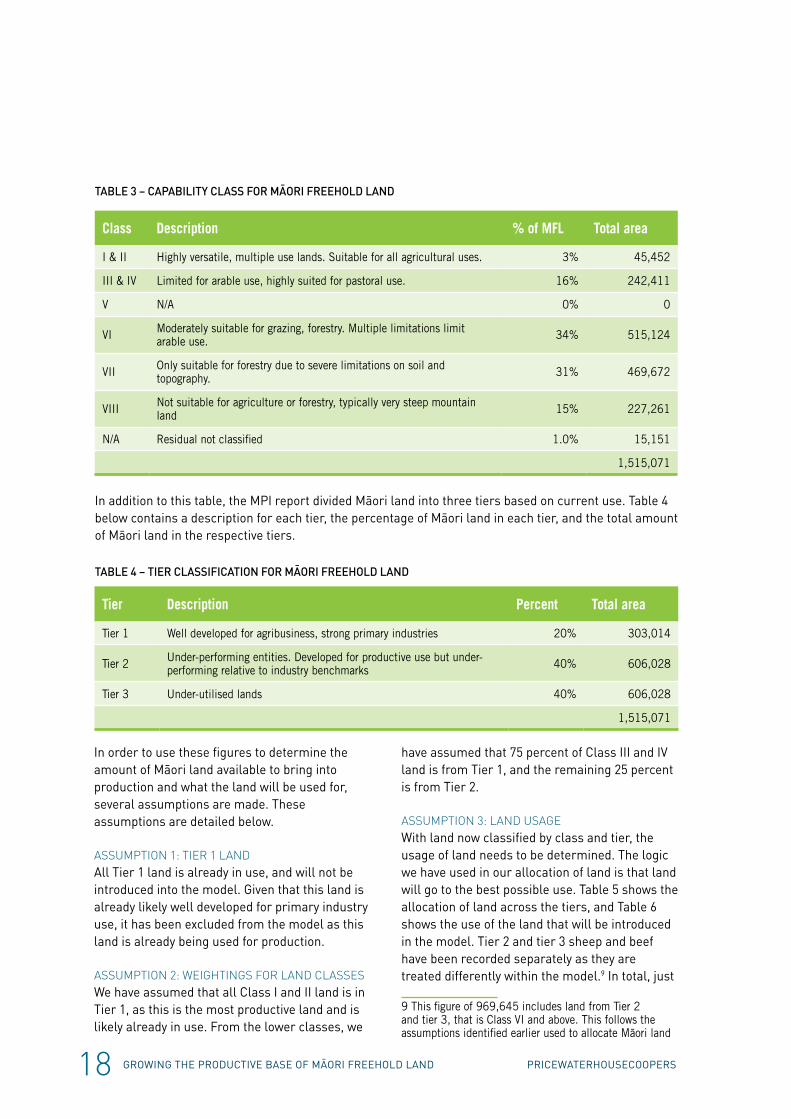
MPI divides land into eight land use capability classes, which are based on the quality and suitability of the land. Table 3 shows a breakdown of the eight classes; with a description of the class and the amount of Māori land in each class (a table from MPI with a detailed description of each class is in the appendix).
7 Māori Agribusiness in New Zealand: A Study of the Māori Freehold Land Resource, MPI, (2011)8 Rural Land Use and Land Tenure in New Zealand, Levente Timar (2011), Motu Economic and Public Policy Research
18 GROWING THE PRODUCTIVE BASE OF MĀORI FREEHOLD LAND PRICEWATERHOUSECOOPERS
In order to use these figures to determine the amount of Māori land available to bring into production and what the land will be used for, several assumptions are made. These assumptions are detailed below.
ASSUMPTION 1: TIER 1 LANDAll Tier 1 land is already in use, and will not be introduced into the model. Given that this land is already likely well developed for primary industry use, it has been excluded from the model as this land is already being used for production.
ASSUMPTION 2: WEIGHTINGS FOR LAND CLASSESWe have assumed that all Class I and II land is in Tier 1, as this is the most productive land and is likely already in use. From the lower classes, we
have assumed that 75 percent of Class III and IV land is from Tier 1, and the remaining 25 percent is from Tier 2.
ASSUMPTION 3: LAND USAGEWith land now classified by class and tier, the usage of land needs to be determined. The logic we have used in our allocation of land is that land will go to the best possible use. Table 5 shows the allocation of land across the tiers, and Table 6 shows the use of the land that will be introduced in the model. Tier 2 and tier 3 sheep and beef have been recorded separately as they are treated differently within the model.9 In total, just
9 This figure of 969,645 includes land from Tier 2 and tier 3, that is Class VI and above. This follows the assumptions identified earlier used to allocate Māori land
TABLE 3 – CAPABILITY CLASS FOR MĀORI FREEHOLD LAND
Class Description % of MFL Total area
I & II Highly versatile, multiple use lands. Suitable for all agricultural uses. 3% 45,452
III & IV Limited for arable use, highly suited for pastoral use. 16% 242,411
V N/A 0% 0
VI Moderately suitable for grazing, forestry. Multiple limitations limit arable use. 34% 515,124
VII Only suitable for forestry due to severe limitations on soil and topography. 31% 469,672
VIII Not suitable for agriculture or forestry, typically very steep mountain land 15% 227,261
N/A Residual not classified 1.0% 15,151
1,515,071
In addition to this table, the MPI report divided Māori land into three tiers based on current use. Table 4 below contains a description for each tier, the percentage of Māori land in each tier, and the total amount of Māori land in the respective tiers.
TABLE 4 – TIER CLASSIFICATION FOR MĀORI FREEHOLD LAND
Tier Description Percent Total area
Tier 1 Well developed for agribusiness, strong primary industries 20% 303,014
Tier 2 Under-performing entities. Developed for productive use but under-performing relative to industry benchmarks 40% 606,028
Tier 3 Under-utilised lands 40% 606,028
1,515,071
19PRICEWATERHOUSECOOPERS GROWING THE PRODUCTIVE BASE OF MĀORI FREEHOLD LAND
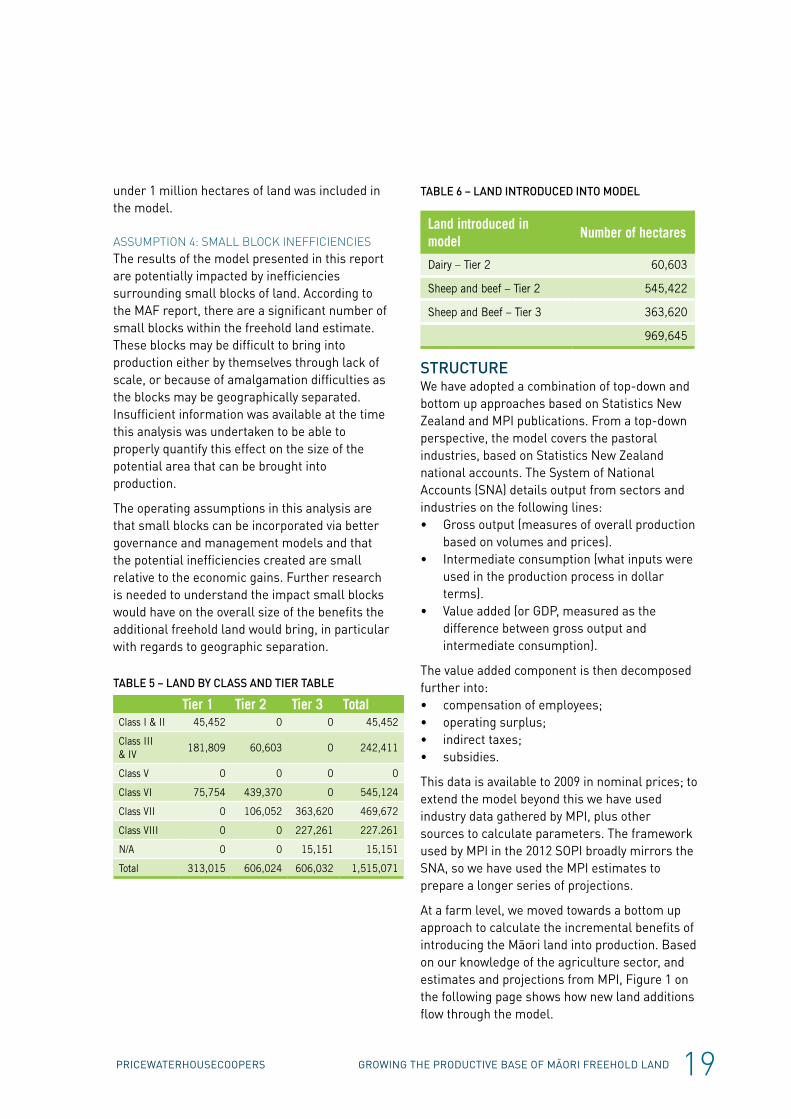
under 1 million hectares of land was included in the model.
ASSUMPTION 4: SMALL BLOCK INEFFICIENCIESThe results of the model presented in this report are potentially impacted by inefficiencies surrounding small blocks of land. According to the MAF report, there are a significant number of small blocks within the freehold land estimate. These blocks may be difficult to bring into production either by themselves through lack of scale, or because of amalgamation difficulties as the blocks may be geographically separated. Insufficient information was available at the time this analysis was undertaken to be able to properly quantify this effect on the size of the potential area that can be brought into production.
The operating assumptions in this analysis are that small blocks can be incorporated via better governance and management models and that the potential inefficiencies created are small relative to the economic gains. Further research is needed to understand the impact small blocks would have on the overall size of the benefits the additional freehold land would bring, in particular with regards to geographic separation.
TABLE 5 – LAND BY CLASS AND TIER TABLE
Tier 1 Tier 2 Tier 3 TotalClass I & II 45,452 0 0 45,452
Class III & IV
181,809 60,603 0 242,411
Class V 0 0 0 0
Class VI 75,754 439,370 0 545,124
Class VII 0 106,052 363,620 469,672
Class VIII 0 0 227,261 227.261
N/A 0 0 15,151 15,151
Total 313,015 606,024 606,032 1,515,071
TABLE 6 – LAND INTRODUCED INTO MODEL
Land introduced in model
Number of hectares
Dairy – Tier 2 60,603
Sheep and beef – Tier 2 545,422
Sheep and Beef – Tier 3 363,620
969,645
STRUCTUREWe have adopted a combination of top-down and bottom up approaches based on Statistics New Zealand and MPI publications. From a top-down perspective, the model covers the pastoral industries, based on Statistics New Zealand national accounts. The System of National Accounts (SNA) details output from sectors and industries on the following lines:• Gross output (measures of overall production
based on volumes and prices).• Intermediate consumption (what inputs were
used in the production process in dollar terms).
• Value added (or GDP, measured as the difference between gross output and intermediate consumption).
The value added component is then decomposed further into:• compensation of employees;• operating surplus;• indirect taxes;• subsidies.
This data is available to 2009 in nominal prices; to extend the model beyond this we have used industry data gathered by MPI, plus other sources to calculate parameters. The framework used by MPI in the 2012 SOPI broadly mirrors the SNA, so we have used the MPI estimates to prepare a longer series of projections.
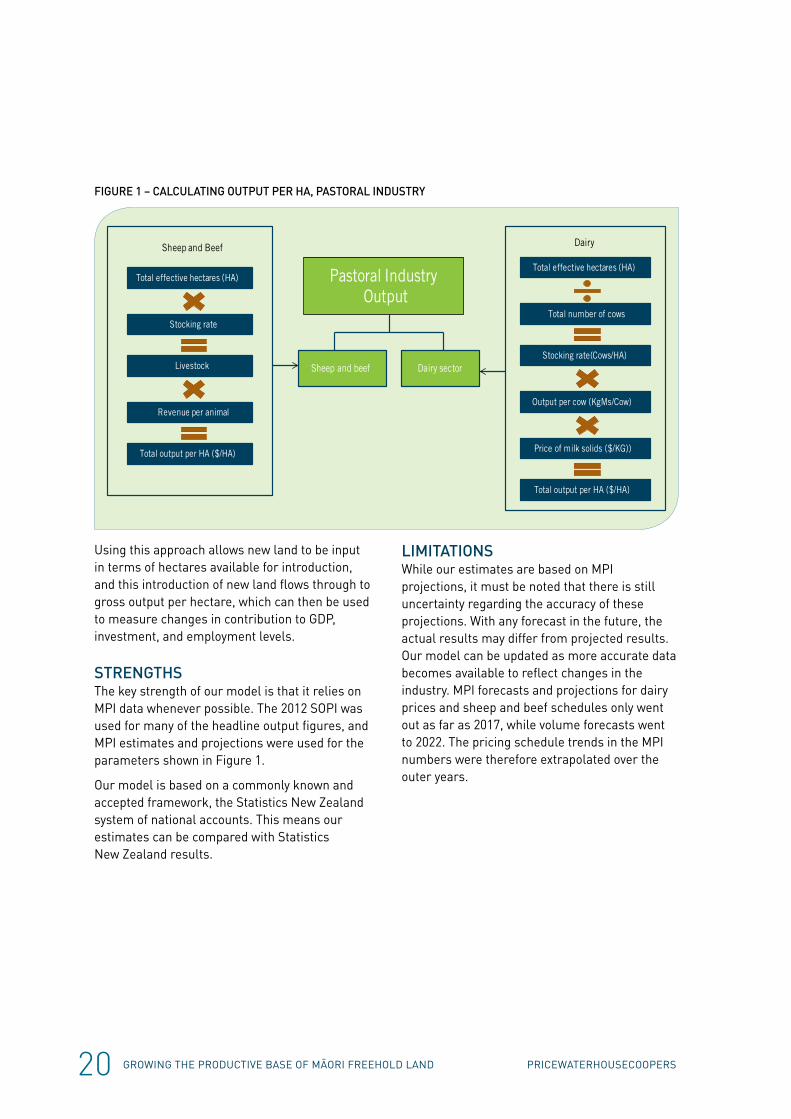
At a farm level, we moved towards a bottom up approach to calculate the incremental benefits of introducing the Māori land into production. Based on our knowledge of the agriculture sector, and estimates and projections from MPI, Figure 1 on the following page shows how new land additions flow through the model.
20 GROWING THE PRODUCTIVE BASE OF MĀORI FREEHOLD LAND PRICEWATERHOUSECOOPERS
FIGURE 1 – CALCULATING OUTPUT PER HA, PASTORAL INDUSTRY
Using this approach allows new land to be input in terms of hectares available for introduction, and this introduction of new land flows through to gross output per hectare, which can then be used to measure changes in contribution to GDP, investment, and employment levels.
STRENGTHSThe key strength of our model is that it relies on MPI data whenever possible. The 2012 SOPI was used for many of the headline output figures, and MPI estimates and projections were used for the parameters shown in Figure 1.
Our model is based on a commonly known and accepted framework, the Statistics New Zealand system of national accounts. This means our estimates can be compared with Statistics New Zealand results.
LIMITATIONSWhile our estimates are based on MPI projections, it must be noted that there is still uncertainty regarding the accuracy of these projections. With any forecast in the future, the actual results may differ from projected results. Our model can be updated as more accurate data becomes available to reflect changes in the industry. MPI forecasts and projections for dairy prices and sheep and beef schedules only went out as far as 2017, while volume forecasts went to 2022. The pricing schedule trends in the MPI numbers were therefore extrapolated over the outer years.
Total effective hectares (HA)
Livestock
Stocking rate
Revenue per animal
Total output per HA ($/HA)
Dairy sector
Pastoral Industry Output
Sheep and beef
Total effective hectares (HA)
Stocking rate(Cows/HA)
Total number of cows
Output per cow (KgMs/Cow)
Total output per HA ($/HA)
Price of milk solids ($/KG))
Sheep and Beef Dairy

21PRICEWATERHOUSECOOPERS GROWING THE PRODUCTIVE BASE OF MĀORI FREEHOLD LAND
NATIONAL INDUSTRY ANALYSIS
TABLE 8 - CHANGES AFTER IMPLEMENTING NEW MĀORI LAND (IN NOMINAL TERMS)
Variable Average Per Year Total benefit
Gross output ($billions) 0.79 7.90
Value added ($billions) 0.37 3.65
Investment ($billions) 0.29 2.91
Employment (jobs) 3580 jobs over ten years
TABLE 7 - INPUT OF NEW LAND, AND INVESTMENT (IN NOMINAL TERMS)
2013 2014 2015 Total
Dairy Land (HA) 20,201 20,201 20,201 60,603
Sheep and Beef Land (HA) 303,013 303,013 303,013 909,039
Dairy Investment ($millions) 217 217 217 652
Sheep and Beef Investment ($millions) 324 324 324 973
INTRODUCTIONAfter building the baseline model of the pastoral industries, a scenario was run to measure the impact of introducing the under-utilised and under-performing land to the respective industries. The scenarios involved introducing the Māori land over a three year cycle, and measuring the impact on total output, GDP, employment and investment over a ten year projection period relative to the baseline numbers provided for the sector by MPI. The scenario allows the estimation of total benefits that can be realised, according to our model, of introducing the Māori land into production.
BRINGING LAND IN ON THE 3-YEAR CYCLEBased upon the size of the Māori freehold land resource developed in the previous section, this land was introduced over a 3-year period based upon the assumption of a successful introduction and fast uptake of the new governance and
management framework. Table 7 – Input of new land, and investment (in nominal terms) below details the total amount of Māori land introduced per year, along with the level of set up investment required.
Our model allowed us to see the effect of this new land on the dairy and sheep and beef industries, through the mechanisms described in the structure section. The following two pages display the results of the simulations on the pastoral industry. The orange line represents the baseline model developed, and the darker line is the new level after the injection of the Māori land. Table 8 – Changes after implementing new Māori land (in nominal terms) below quantifies the benefits on a yearly and total basis
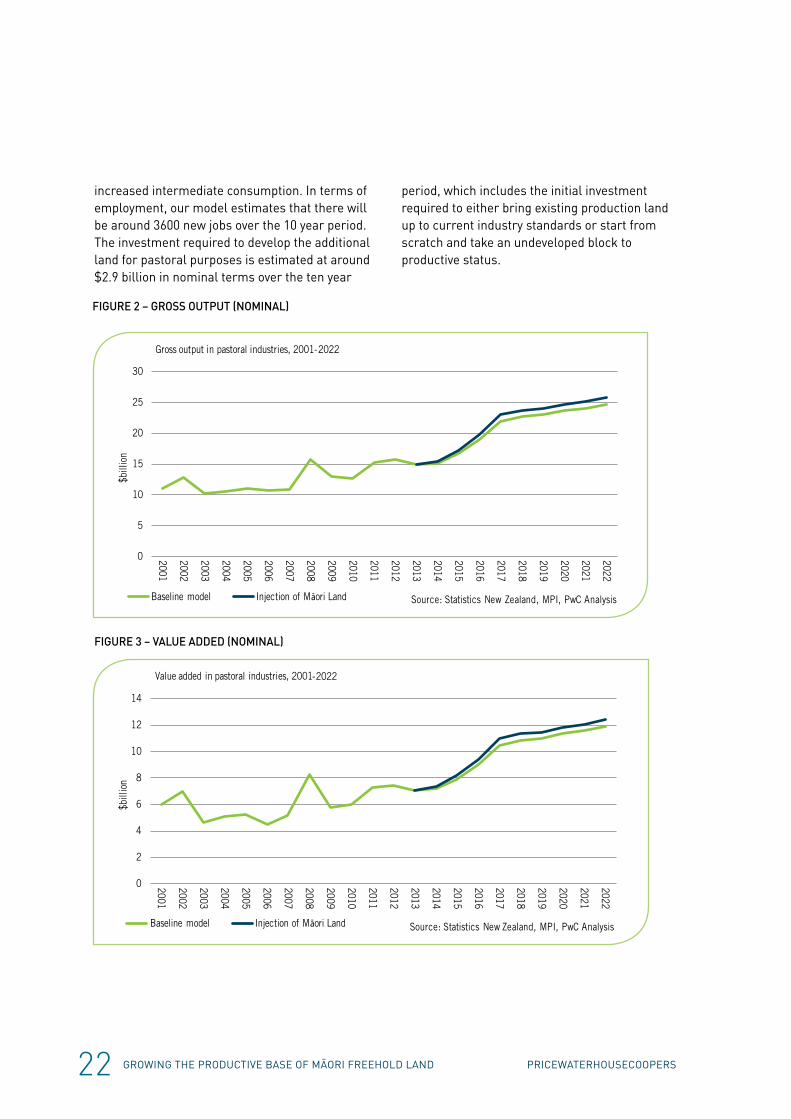
The total increase in output in the pastoral sector relative to MPI’s baseline expectations over the ten year period between 2013 and 2022 is just under $8 billion in nominal terms. There are gains in contribution to GDP and additional activity is generated in other sectors through
Running the model at a national level provides an estimate of the size of the prize for bringing more Māori freehold land into production:
1. Over 900,000 hectares introduced into pastoral use over the assumed 3-year period.
2. Total nominal (price and volume) effect on output almost $8 billion over 10 years.
3. 3600 jobs over a ten year period.
22 GROWING THE PRODUCTIVE BASE OF MĀORI FREEHOLD LAND PRICEWATERHOUSECOOPERS
increased intermediate consumption. In terms of employment, our model estimates that there will be around 3600 new jobs over the 10 year period. The investment required to develop the additional land for pastoral purposes is estimated at around $2.9 billion in nominal terms over the ten year
period, which includes the initial investment required to either bring existing production land up to current industry standards or start from scratch and take an undeveloped block to productive status.
FIGURE 3 – VALUE ADDED (NOMINAL)
FIGURE 2 – GROSS OUTPUT (NOMINAL)
0
5
10
15
20
25
30
2001
2002
2003
2004
2005
2006
2007
2008
2009
2010
2011
2012
2013
2014
2015
2016
2017
2018
2019
2020
2021
2022
$bill
ion
Gross output in pastoral industries, 2001-2022
Baseline model Injection of Māori Land Source: Statistics New Zealand, MPI, PwC Analysis
Baseline model Injection of Māori Land
0
2
4
6
8
10
12
14
2001
2002
2003
2004
2005
2006
2007
2008
2009
2010
2011
2012
2013
2014
2015
2016
2017
2018
2019
2020
2021
2022
$bill
ion
Value added in pastoral industries, 2001-2022
Source: Statistics New Zealand, MPI, PwC Analysis

23PRICEWATERHOUSECOOPERS GROWING THE PRODUCTIVE BASE OF MĀORI FREEHOLD LAND
FIGURE 4 – EMPLOYMENT
FIGURE 5 – INVESTMENT (NOMINAL)
Baseline model Injection of Māori Land Source: Statistics New Zealand, MPI, PwC Analysis
70
75
80
85
90
95
100
105
110
2001
2002
2003
2004
2005
2006
2007
2008
2009
2010
2011
2012
2013
2014
2015
2016
2017
2018
2019
2020
2021
2022
FTE
(000
s)
Employment in pastoral industries, 2001-2022
Baseline model Injection of Māori Land Source: Statistics New Zealand, MPI, PwC Analysis
0
0.5
1
1.5
2
2.5
3
3.5
4
2001
2002
2003
2004
2005
2006
2007
2008
2009
2010
2011
2012
2013
2014
2015
2016
2017
2018
2019
2020
2021
2022
$bill
ion
Investment in pastoral industries, 2001-2022

24 GROWING THE PRODUCTIVE BASE OF MĀORI FREEHOLD LAND PRICEWATERHOUSECOOPERS
INTRODUCTIONBreaking the model down into regional areas provides for a more localised impact from undertaking economic development initiatives to bring under-performing and under-utilised Māori freehold land into the productive sector. Many of these initiatives will be targeted at individual blocks of land (e.g. land block X, discussed in a later section) or clusters of smaller blocks into production. While the contribution of these individual blocks or clusters may be small relative to a national industry level and the wider agriculture sector, their local contribution may be more significant. This is likely to be enhanced in regional areas of New Zealand with fewer economic and employment opportunities.
REGION DEFINITIONThe model utilises Statistics New Zealand regional council boundaries to provide a greater degree of granularity. Regional level data provides more consistent time series for both stock numbers and employment in the agriculture industries. The regional definitions also tie into Māori freehold land data obtained from the Māori Land Court through MPI.
The distribution of Māori freehold land across the regions identifies the potential size of the resource and both the scope and opportunity for deploying the governance programme to where it could potentially be the most effective. Breaking the national level model for the pastoral industries down to a regional level requires a set of additional assumptions, which are discussed next.
At this stage of model development, we employed two key additional assumptions to break the model down to a regional level.
• Overall trends from the wider sector flow through to the regions so that production methods and technologies show little regional variation, implying output growth is driven by stock availability.
• The distribution of Māori freehold land that is under-utilised in each region roughly mimics the national trends used in the previous industry analysis.
These assumptions reflect the absence of information at the time the model was built around how the under-performing and under-utilised land is currently distributed between regions, which was not covered in detail in the MAF report into Māori freehold land (referenced and discussed earlier).
STRENGTHSThe strengths of this approach are its consistency in model structure and output with the national models that were developed for the dairy and pastoral sectors. Given gross output in the pastoral sector relies on both land and livestock to generate the volumes, the quantity of livestock in a particular area (e.g. dairy cattle) provides a reasonable indication of the overall output likely to be generated by that region. Similarly, the model structure has enough flexibility built in to accommodate potential regional variations should sufficient data become available to make such issues meaningful.
LIMITATIONSGiven the additional assumptions discussed above, the regional models follow their respective national industry models in terms of overall output growth. In developing the model to date we have used national dairy and sheep and beef data from MPI as the basis for key pieces of
REGIONALISING THE MODEL
Carrying some assumptions over from the national level analysis, a regionalised version of the model was developed:
1. Focus on Northland sector, with 116,000 hectares of Māori freehold land.
2. Total effect on output just over $700 million over 10 years.
3. 331 jobs over a ten year period.
25PRICEWATERHOUSECOOPERS GROWING THE PRODUCTIVE BASE OF MĀORI FREEHOLD LAND
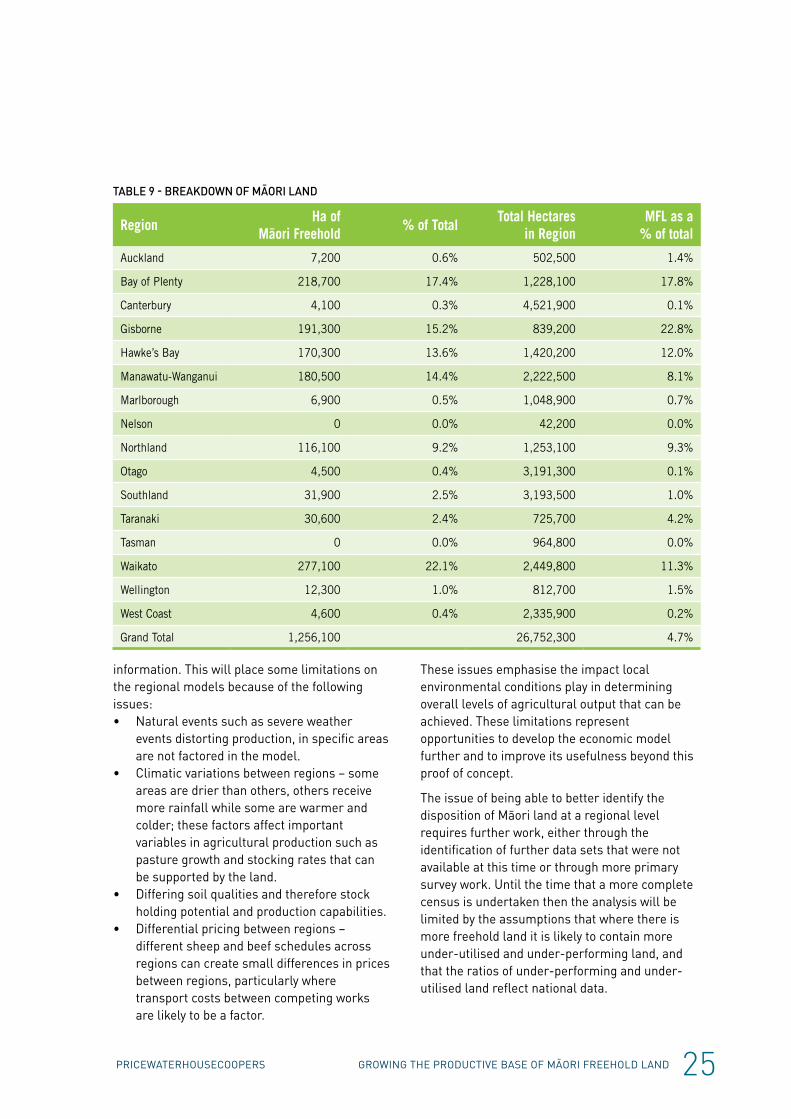
TABLE 9 - BREAKDOWN OF MĀORI LAND
RegionHa of
Māori Freehold % of Total
Total Hectares in Region
MFL as a % of total
Auckland 7,200 0.6% 502,500 1.4%
Bay of Plenty 218,700 17.4% 1,228,100 17.8%
Canterbury 4,100 0.3% 4,521,900 0.1%
Gisborne 191,300 15.2% 839,200 22.8%
Hawke’s Bay 170,300 13.6% 1,420,200 12.0%
Manawatu-Wanganui 180,500 14.4% 2,222,500 8.1%
Marlborough 6,900 0.5% 1,048,900 0.7%
Nelson 0 0.0% 42,200 0.0%
Northland 116,100 9.2% 1,253,100 9.3%
Otago 4,500 0.4% 3,191,300 0.1%
Southland 31,900 2.5% 3,193,500 1.0%
Taranaki 30,600 2.4% 725,700 4.2%
Tasman 0 0.0% 964,800 0.0%
Waikato 277,100 22.1% 2,449,800 11.3%
Wellington 12,300 1.0% 812,700 1.5%
West Coast 4,600 0.4% 2,335,900 0.2%
Grand Total 1,256,100 26,752,300 4.7%
information. This will place some limitations on the regional models because of the following issues:• Natural events such as severe weather
events distorting production, in specific areas are not factored in the model.
• Climatic variations between regions – some areas are drier than others, others receive more rainfall while some are warmer and colder; these factors affect important variables in agricultural production such as pasture growth and stocking rates that can be supported by the land.
• Differing soil qualities and therefore stock holding potential and production capabilities.
• Differential pricing between regions – different sheep and beef schedules across regions can create small differences in prices between regions, particularly where transport costs between competing works are likely to be a factor.
These issues emphasise the impact local environmental conditions play in determining overall levels of agricultural output that can be achieved. These limitations represent opportunities to develop the economic model further and to improve its usefulness beyond this proof of concept.
The issue of being able to better identify the disposition of Māori land at a regional level requires further work, either through the identification of further data sets that were not available at this time or through more primary survey work. Until the time that a more complete census is undertaken then the analysis will be limited by the assumptions that where there is more freehold land it is likely to contain more under-utilised and under-performing land, and that the ratios of under-performing and under-utilised land reflect national data.

26 GROWING THE PRODUCTIVE BASE OF MĀORI FREEHOLD LAND PRICEWATERHOUSECOOPERS
TABLE 10 - IMPACT OF NORTHLAND LAND INJECTION ABOVE BASELINE PROJECTIONS (NOMINAL)
2013 2014 2015 2016 2017 2018 2019 2020 2021 2022 Total
Gross output 0 21.9 47.4 82.0 93.3 95.2 95.5 97.4 98.0 100.0 730.6
Intermediate consumption 0 11.8 25.5 43.9 50.0 50.9 51.1 52.1 52.5 53.5 391.3
Value added 0 10.1 22.0 38.1 43.3 44.2 44.3 45.3 45.5 46.5 339.3
Compensation to employees 0 1.3 2.9 4.9 5.6 5.7 5.7 5.8 5.8 6.0 43.7
Operating surplus 0 7.7 16.8 29.0 32.9 33.5 33.4 34.0 34.0 34.6 256.0
Indirect taxes 0 1.1 2.3 4.1 4.8 5.1 5.2 5.5 5.7 6.0 39.9
Subsidies 0 0.01 0.02 0.03 0.03 0.04 0.04 0.04 0.04 0.04 0.28
FTE 0 120 246 401 426 425 422 424 424 426 3314
Gross fixed capital formation
0 50.1 53.7 57.9 13.3 15.2 15.4 15.5 15.7 15.9 252.6
REGIONAL EXAMPLE – NORTHLANDWe selected the Northland region to provide an example of model output because this will tie in with the case study of land block X considered in the next section. As shown in Table 9 – Breakdown of Māori land, the region contains 9.2 percent (or 116,000 hectares ) of the total Māori freehold land resource identified by the Māori Land Court. Further data from the Court indicates that currently there are approximately:• 4,600 hectares of land in dairying; and• 47,600 hectares of land in pastoral use
(predominantly sheep and beef).
The problem with the data relating to regional dairy and pastoral uses is that records can overlap to reflect multiple uses; hence an area may be counted more than once, limiting the reliability of any new land introduction.10.
Northland is recognised as a region that contains areas with high unemployment, low incomes and reasonably high levels of deprivation, with educational attainment below national averages. A relatively small industry base also limits opportunities, but bringing more Māori land into
10 This suggests a potentially useful project to map Māori Land Court data around uses to Statistics New Zealand Standard Industrial Classifications (ANZSIC06) for agricultural industries.
the productive sector could provide a catalyst to creating further economic and social development opportunities.
Based upon the data about the size of the Māori freehold land resource in the region, combined with our assumptions at the national level around the amounts of land potentially suitable for dairying and sheep and beef farming, we estimate that there are:• 5,601 hectares potentially available for
dairying; and• 48,732 hectares potentially available for
sheep and beef.
Over the ten year period between 2013 and 2022, the model suggests that bringing the above land either into production or improving current productivity will create:• A gross output increase of $731 million in
current (nominal) prices over the baseline expectations as shown in Table 10 – Impact of Northland land injection above baseline projections (nominal).
• An increase in value added (GDP) of $339 million in current (nominal) prices over the baseline expectations as shown in Table 10 – Impact of Northland land injection above baseline projections (nominal)
• An average additional 331 full-time.

27PRICEWATERHOUSECOOPERS GROWING THE PRODUCTIVE BASE OF MĀORI FREEHOLD LAND
equivalent (FTE) employment opportunities per annum over the baseline employment in the pastoral industries.
• Increased investment in the region of $253 million in current (nominal) prices which includes the initial investment required to establish the farming enterprises and improve existing farms, as well as annual investment to maintain the productive capacity of the assets.
Further impacts over the 10-year include an increase of $391 million (in nominal terms) in intermediate consumption, which are the purchases made in the course of producing output. These include items such as fuel, fertiliser, veterinary expenses, stock feed etc. Further injections come from wages and salaries earned by the new farm labour and the profits attributable to the farming operations. Summaries of these items can be seen in Table 10 – Impact of Northland land injection above baseline projections (nominal).
FIGURE 6 – GROSS OUTPUT IN NORTHLAND (NOMINAL)
FIGURE 7 – VALUE ADDED IN NORTHLAND (NOMINAL)
Baseline model Injection of Māori Land Source: Statistics New Zealand, MPI, PwC Analysis
0.0
0.5
1.0
1.5
2.0
2.5
2002
2003
2004
2005
2006
2007
2008
2009
2010
2011
2012
2013
2014
2015
2016
2017
2018
2019
2020
2021
2022
$bill
ion
Gross output in pastoral industries, Northland, 2002-2022
Baseline model Injection of Māori Land Source: Statistics New Zealand, MPI, PwC Analysis
0.0
0.1
0.2
0.3
0.4
0.5
0.6
0.7
0.8
0.9
1.0
2002
2003
2004
2005
2006
2007
2008
2009
2010
2011
2012
2013
2014
2015
2016
2017
2018
2019
2020
2021
2022
$bill
ion
Value added in pastoral industries, Northland, 2002 -2022
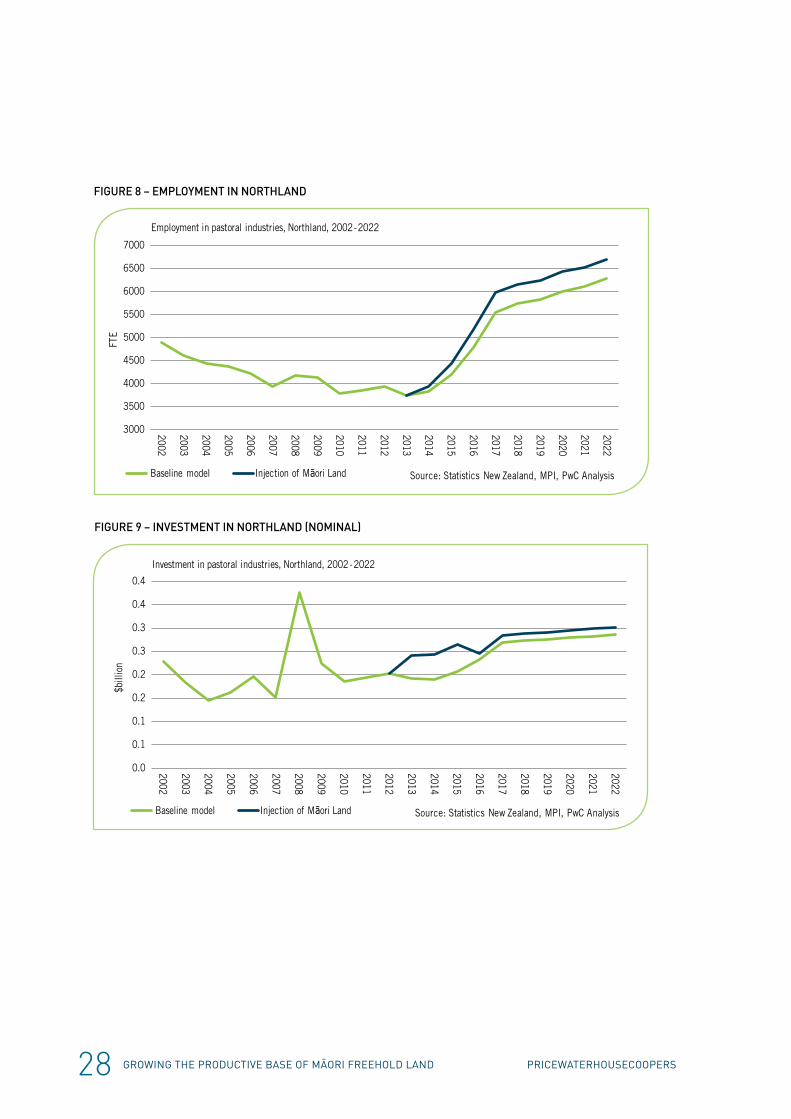
28 GROWING THE PRODUCTIVE BASE OF MĀORI FREEHOLD LAND PRICEWATERHOUSECOOPERS
FIGURE 8 – EMPLOYMENT IN NORTHLAND
FIGURE 9 – INVESTMENT IN NORTHLAND (NOMINAL)
Baseline model Injection of Māori Land Source: Statistics New Zealand, MPI, PwC Analysis
3000
3500
4000
4500
5000
5500
6000
6500
7000
2002
2003
2004
2005
2006
2007
2008
2009
2010
2011
2012
2013
2014
2015
2016
2017
2018
2019
2020
2021
2022
FTE
Employment in pastoral industries, Northland, 2002-2022
Baseline model Injection of Māori Land Source: Statistics New Zealand, MPI, PwC Analysis
0.0
0.1
0.1
0.2
0.2
0.3
0.3
0.4
0.4
2002
2003
2004
2005
2006
2007
2008
2009
2010
2011
2012
2013
2014
2015
2016
2017
2018
2019
2020
2021
2022
$bill
ion
Investment in pastoral industries, Northland, 2002-2022
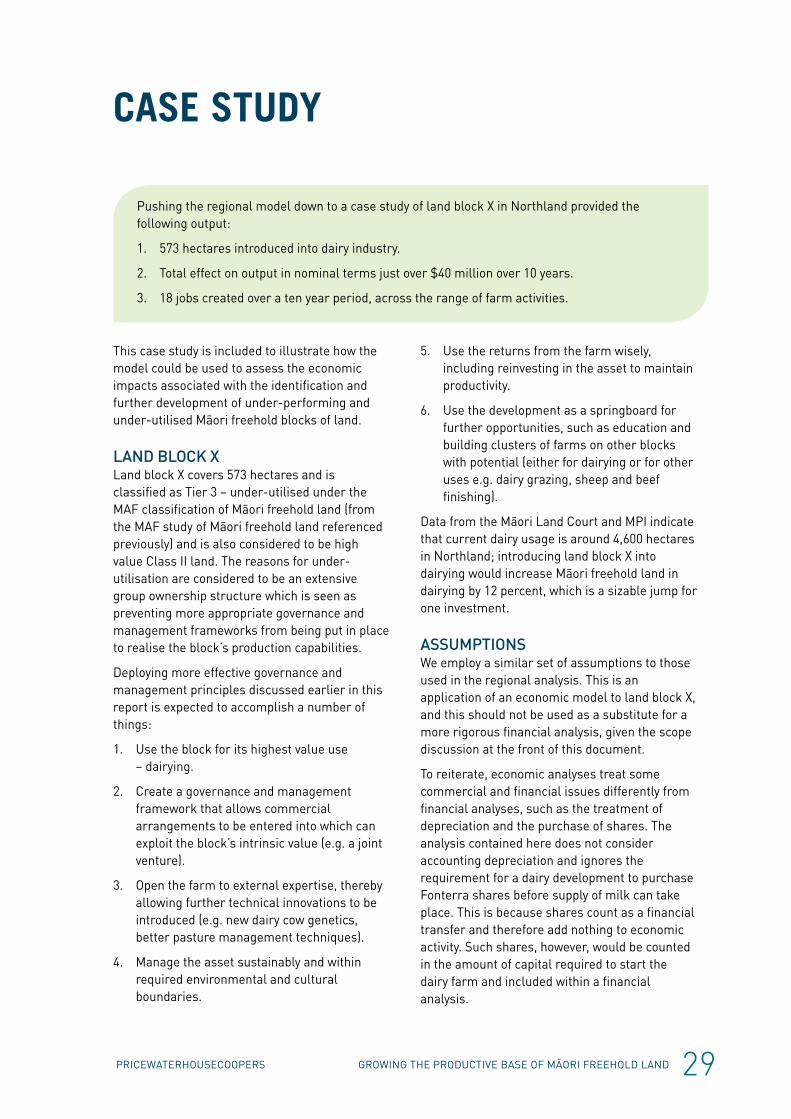
29PRICEWATERHOUSECOOPERS GROWING THE PRODUCTIVE BASE OF MĀORI FREEHOLD LAND
This case study is included to illustrate how the model could be used to assess the economic impacts associated with the identification and further development of under-performing and under-utilised Māori freehold blocks of land.
LAND BLOCK XLand block X covers 573 hectares and is classified as Tier 3 – under-utilised under the MAF classification of Māori freehold land (from the MAF study of Māori freehold land referenced previously) and is also considered to be high value Class II land. The reasons for under-utilisation are considered to be an extensive group ownership structure which is seen as preventing more appropriate governance and management frameworks from being put in place to realise the block’s production capabilities.
Deploying more effective governance and management principles discussed earlier in this report is expected to accomplish a number of things:
1. Use the block for its highest value use – dairying.
2. Create a governance and management framework that allows commercial arrangements to be entered into which can exploit the block’s intrinsic value (e.g. a joint venture).
3. Open the farm to external expertise, thereby allowing further technical innovations to be introduced (e.g. new dairy cow genetics, better pasture management techniques).
4. Manage the asset sustainably and within required environmental and cultural boundaries.
5. Use the returns from the farm wisely, including reinvesting in the asset to maintain productivity.
6. Use the development as a springboard for further opportunities, such as education and building clusters of farms on other blocks with potential (either for dairying or for other uses e.g. dairy grazing, sheep and beef finishing).
Data from the Māori Land Court and MPI indicate that current dairy usage is around 4,600 hectares in Northland; introducing land block X into dairying would increase Māori freehold land in dairying by 12 percent, which is a sizable jump for one investment.
ASSUMPTIONSWe employ a similar set of assumptions to those used in the regional analysis. This is an application of an economic model to land block X, and this should not be used as a substitute for a more rigorous financial analysis, given the scope discussion at the front of this document.
To reiterate, economic analyses treat some commercial and financial issues differently from financial analyses, such as the treatment of depreciation and the purchase of shares. The analysis contained here does not consider accounting depreciation and ignores the requirement for a dairy development to purchase Fonterra shares before supply of milk can take place. This is because shares count as a financial transfer and therefore add nothing to economic activity. Such shares, however, would be counted in the amount of capital required to start the dairy farm and included within a financial analysis.
CASE STUDY
Pushing the regional model down to a case study of land block X in Northland provided the following output:
1. 573 hectares introduced into dairy industry.
2. Total effect on output in nominal terms just over $40 million over 10 years.
3. 18 jobs created over a ten year period, across the range of farm activities.
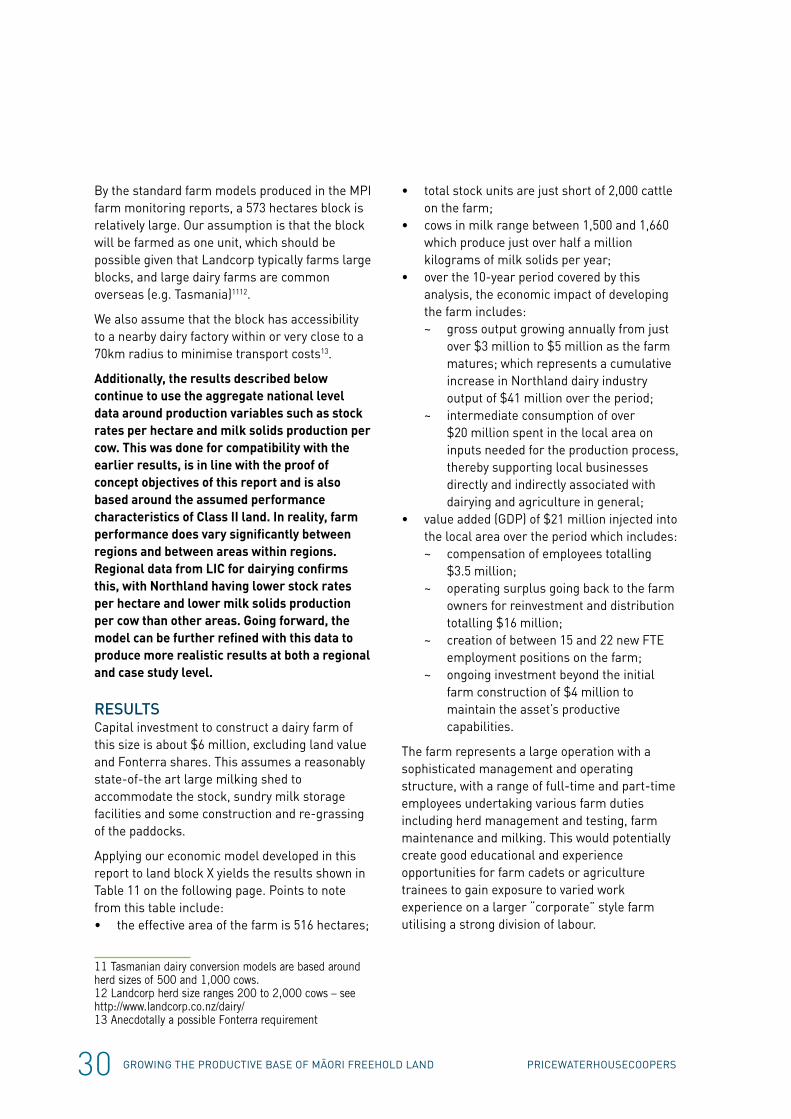
30 GROWING THE PRODUCTIVE BASE OF MĀORI FREEHOLD LAND PRICEWATERHOUSECOOPERS
By the standard farm models produced in the MPI farm monitoring reports, a 573 hectares block is relatively large. Our assumption is that the block will be farmed as one unit, which should be possible given that Landcorp typically farms large blocks, and large dairy farms are common overseas (e.g. Tasmania)1112.
We also assume that the block has accessibility to a nearby dairy factory within or very close to a 70km radius to minimise transport costs13.
Additionally, the results described below continue to use the aggregate national level data around production variables such as stock rates per hectare and milk solids production per cow. This was done for compatibility with the earlier results, is in line with the proof of concept objectives of this report and is also based around the assumed performance characteristics of Class II land. In reality, farm performance does vary significantly between regions and between areas within regions. Regional data from LIC for dairying confirms this, with Northland having lower stock rates per hectare and lower milk solids production per cow than other areas. Going forward, the model can be further refined with this data to produce more realistic results at both a regional and case study level.
RESULTSCapital investment to construct a dairy farm of this size is about $6 million, excluding land value and Fonterra shares. This assumes a reasonably state-of-the art large milking shed to accommodate the stock, sundry milk storage facilities and some construction and re-grassing of the paddocks.
Applying our economic model developed in this report to land block X yields the results shown in Table 11 on the following page. Points to note from this table include:• the effective area of the farm is 516 hectares;
11 Tasmanian dairy conversion models are based around herd sizes of 500 and 1,000 cows.12 Landcorp herd size ranges 200 to 2,000 cows – see http://www.landcorp.co.nz/dairy/13 Anecdotally a possible Fonterra requirement
• total stock units are just short of 2,000 cattle on the farm;
• cows in milk range between 1,500 and 1,660 which produce just over half a million kilograms of milk solids per year;
• over the 10-year period covered by this analysis, the economic impact of developing the farm includes:
~ gross output growing annually from just over $3 million to $5 million as the farm matures; which represents a cumulative increase in Northland dairy industry output of $41 million over the period;
~ intermediate consumption of over $20 million spent in the local area on inputs needed for the production process, thereby supporting local businesses directly and indirectly associated with dairying and agriculture in general;
• value added (GDP) of $21 million injected into the local area over the period which includes:
~ compensation of employees totalling $3.5 million;
~ operating surplus going back to the farm owners for reinvestment and distribution totalling $16 million;
~ creation of between 15 and 22 new FTE employment positions on the farm;
~ ongoing investment beyond the initial farm construction of $4 million to maintain the asset’s productive capabilities.
The farm represents a large operation with a sophisticated management and operating structure, with a range of full-time and part-time employees undertaking various farm duties including herd management and testing, farm maintenance and milking. This would potentially create good educational and experience opportunities for farm cadets or agriculture trainees to gain exposure to varied work experience on a larger “corporate” style farm utilising a strong division of labour.

31PRICEWATERHOUSECOOPERS GROWING THE PRODUCTIVE BASE OF MĀORI FREEHOLD LAND
TAB
LE 1
1 –
CASE
STU
DY (N
OMIN
AL D
OLLA
R VA
LUES
)
Dairy
Mod
elUn
it20
1320
1420
1520
1620
1720
1820
1920
2020
2120
22To
tal
Per
Year
New
land
to b
e in
trod
uced
ha57
3
Set u
p in
vest
men
t ($m
ill)
$mill
60
00
00
00
00
Area
bro
ught
into
pro
duct
ion
(ha)
ha0
573
00
00
00
00
Effe
ctiv
e ar
ea (h
a)ha
051
60
00
00
00
0
Ong
oing
eff
ectiv
e ar
ea (h
a)ha
051
651
651
651
651
651
651
651
651
6
Stoc
king
rate
cow
s/ha
3.7
3.8
3.8
3.9
3.9
3.9
4.0
4.0
4.0
4.0
Tota
l Cat
tle o
n fa
rmco
ws
01,
957
1,96
71,
993
2,00
52,
034
2,04
02,
057
2,06
42,
081
Rat
io –
Cow
s in
milk
to to
tal c
attle
0.78
0.79
0.78
0.79
0.77
0.77
0.77
0.78
0.77
0.78
Tota
l cow
s in
milk
cow
s0
1540
1533
1566
1551
1573
1570
1596
1594
1618
Milk
sol
ids
per c
owkg
336
343
341
348
346
353
353
359
358
363
Tota
l milk
sol
ids
prod
uced
kg0
528,
916
522,
118
544,
585
536,
229
555,
700
553,
851
572,
032
570,
604
588,
274
Farm
gat
e pr
ice
c/kg
595
644
712
807
927
805
835
867
900
934
Tota
l Rev
enue
$mill
0.0
3.4
3.7
4.4
5.0
4.5
4.6
5.0
5.1
5.5
Gro
ss O
utpu
t0
3.4
3.7
4.4
5.0
4.5
4.6
5.0
5.1
5.5
41.2
4.1
Inte
rmed
iate
con
sum
ptio
n$m
ill0
1.67
1.83
2.16
2.44
2.20
2.27
2.44
2.52
2.70
20.2
2.0
Valu
e ad
ded
$mill
01.
731.
892.
242.
532.
282.
352.
522.
612.
7920
.92.
1
Com
pens
atio
n of
em
ploy
ees
$mill
00.
290.
320.
400.
430.
360.
370.
400.
420.
463.
50.
3
Ope
ratin
g Su
rplu
s$m
ill0
1.33
1.43
1.68
1.92
1.75
1.80
1.93
1.99
2.11
15.9
1.6
Indi
rect
Tax
es$m
ill0
0.12
0.13
0.16
0.18
0.17
0.18
0.19
0.21
0.22
1.6
0.2
Subs
idie
s$m
ill0
0.00
10.
001
0.00
10.
001
0.00
10.
001
0.00
10.
001
0.00
10.
011
0.00
1
FTEs
FTE
014
.59
15.9
318
.84
21.3
119
.17
19.8
321
.25
22.0
023
.54
176.
517
.6
GFC
F$m
ill0
0.34
0.37
0.43
0.49
0.44
0.46
0.49
0.51
0.54
4.1
0.4

32 GROWING THE PRODUCTIVE BASE OF MĀORI FREEHOLD LAND PRICEWATERHOUSECOOPERS
This report set out to address two questions:
1. Is there an economic framework that can be developed and used to analyse the potential benefits associated with deploying a new governance and management model to under-performing and under-utilised Māori freehold land?
2. What is the potential size of this economic benefit if the land could be brought into production at national benchmark levels?
The framework developed in this report was designed to answer these questions associated with bringing more Māori freehold land into production. This report looked at the MAF estimates for the availability of Māori land that is either currently in production and under-performing or currently under-utilised and not fulfilling a productive role. These estimates were used to develop a picture of the amount of land that could be brought into production and/or brought up to national productive benchmarks.
The model developed uses Statistics New Zealand’s System of National Accounts (SNA) framework to develop broad industry models for the dairy and sheep and beef industries. Statistics New Zealand provides national accounts data by components at both a broad industry and sector level, which includes measures of gross output, intermediate consumption, value added (GDP) as well as a decomposition of GDP into its various measures (e.g. compensation of employees, operating surplus etc). SNA data is available up to 2009 in current prices, so nominal output data contained within MPI’s “Situation and Outlook for Primary Industries” (SOPI) publication was used to provide estimates on output up to the current year (2012) as well as forecasts and projections for the forward years (out to 2022).
In addition to developing the model, we conducted a review of existing literature to identify governance and management practises that can improve the efficiency and effectiveness of an agricultural operation. We identified the potential economic outputs that the improved management practises may be linked to. One of the key issues to be addressed was how
introducing better governance and management models could assist with bringing more Māori freehold land into production. Once in production this land will generate economic value that can be measured.
This idea of measurement involves assessing the economic potential of under-performing and under-utilised Māori land by analysing the potential output and employment changes through facilitating this land into the productive economy against the baseline of current MPI output estimates. The model uses a combination of a top down and bottom up methodology to develop a framework that allows the effect of the introduction of new land to be measured in terms of output, investment, employment and contribution to GDP.
This was done so as to retain comparability with the commonly published current MPI forecasts and projections (from SOPI and provided by MPI). These numbers were expressed in nominal terms and retain an inflation component (as opposed to real). We used this model to make an assessment of the benefits of Māori land injections at three different scales:• At a national industry level for dairying and
sheep and beef farming.• At a regional industry level for dairying and
sheep and beef.• At an individual project level, whereby the
economics for a potential case study were analysed.
At a national level, our model estimates that bringing in just under 1 million hectares of under-utilised and under-performing land will have significant economic benefits; around $8 billion in total output and around $3.7 billion in contribution to GDP in nominal terms. In addition, facilitating the improvement of the land is projected to generate around 3,600 jobs over a ten year period.
Our model was extended to a regional scenario analysis, and then a case study focussing on land block X, a block of land in Northland. Our model was adjusted to reflect the individual characteristics of the Northland region and land block X. Similar to the national model, we were
CONCLUSIONS
33PRICEWATERHOUSECOOPERS GROWING THE PRODUCTIVE BASE OF MĀORI FREEHOLD LAND
able to obtain an estimate of the impact of introducing the under-utilised and under-performing land into agriculture in these areas. Results from deploying the model included:• For Northland, over 50,000 hectares
introduced, with a $731m contribution to gross output, $253m total investment over the 10 year period, which includes both setup costs and ongoing maintenance.
• Land block X: The block is 573 hectares, all used for dairy farming. A $41m contribution to GDP, with around 18 jobs created per year. This represents a large scale operation, with significant educational and experience opportunities for the community.
The framework indicates that the potential to realise economic gains from bringing Māori freehold land into production exist and provide benefits to land owners, the industry and New Zealand in general. The issues are however around the size of the Māori freehold land resource that can be brought into play and how quickly it can be absorbed into the productive sector.
The assumptions for the model include being able to bring the land into the sector within a 3-year time frame, something which was used as a device to help quantify the size of potential benefits within the period for which MPI sector forecasts and projections were available. Realistically, this will not be possible as there are real reasons why the land is not currently in production and it will take time for the facilitation of good governance and management models to have an influence on this. Therefore the potential benefits are more likely to be spread out over time – the benefits are tangible, just incremental.
To make an economic assessment of Māori land potential even more realistic, more information is needed on the size, quality and geographic location of the land parcels in question. Our analysis assumed that the blocks could be brought in and rendered productive, however their location and size may mean that the land operates with less efficiency than that assumed here. We also assumed that the land was placed into either dairy or sheep and beef uses, yet for land proposed for sheep and beef, forestry may
remain a viable option. We excluded forestry from the analysis because of its long development cycle and what we believe is a requirement for scale, however when making individual block assessments, particularly on steeper hill country, forestry as an option should also be considered.
In this regard, the economic model developed here represents a stepping stone to better understanding the economic potential of Māori freehold land and can be built upon through the development of better and more detailed information.
RECOMMENDATIONSThe economic model described in this report was built in less than two weeks as a proof of concept tool to assist with answering MPI’s two main questions. The results in this report suggest that the economic model has potential for further development as an analytical device capable of directing and assessing the results of MPSP’s efforts towards implementing the new governance and management model. Extending the model to enable both broader and more relevant analyses to be undertaken includes the following:• Broaden the 10-year analytical window to
30 years – this would necessitate the building of internal stock models within the economic model, rather than relying on MPI 10-year projection data.
• Bring the forestry sector into the model (given the extension to the 30-year time frame).
• Provide a means of measuring contributions towards MPI’s “Export Double” objective, which would be achieved by either adding downstream production sectors to the model, or by finding a simple conversion algorithm that transforms farm gate output (e.g. milk solids) into end product for export (e.g. milk powder).
• Add real (inflation adjusted) variables (e.g. growth rates) to the existing nominal variables in the model, adding dimensions to both economic and policy analysis (e.g. through cost-benefit analysis).
• Deepen the regional and project models to
34 GROWING THE PRODUCTIVE BASE OF MĀORI FREEHOLD LAND PRICEWATERHOUSECOOPERS
allow for regional variations in production to make them more realistic.
• Allowing land use comparisons between pastoral and forestry.
• Providing measures for valuing erosion.• Include a sheep and beef farm case study.• Incorporate better measures for productivity.
The model format is flexible enough in structure to accommodate the above changes, however the core input required does not change – the need for more accurate information on the composition of Māori freehold land.
35PRICEWATERHOUSECOOPERS GROWING THE PRODUCTIVE BASE OF MĀORI FREEHOLD LAND
REFERENCES
This document references a number of different documents when detailing how data is collected and presented in the model.
Report of Maori Agribusiness in New Zealand, Ministry of Agriculture and Forestry, 2011. Accessed from http://www.mpi.govt.nz/news-resources/publications?title=Maori Agribusiness in New Zealand: A Study of the Maori Freehold Land Resource
Situation and Outlook for Primary Industries, Ministry for Primary Industries, 2012. Accessed from http://www.mpi.govt.nz/news-resources/publications.aspx?title=Situation and Outlook for Primary Industries SOPI 2012
Rural Land Use and Land Tenure in New Zealand, Levente Timar, Motu Economic and Public Policy Research, December 2011
Farm monitoring overview 2011, Ministry of Agriculture and Forestry, 2011. Accessed from http://www.mpi.govt.nz/news-resources/publications/Default.aspx?TabId=126&id=1192
New Zealand Dairy Statistics 2010-11, Livestock Improvement Corporation (LIC), 2011. Accessed from http://www.lic.co.nz/pdf/DAIRY STATISTICS 2010-11-WEB.pdf
Land-Use Intensity Module: Land Use in Rural New Zealand Version 1, Joanna Hendy and Suzi Kerr, Motu Economic and Public Policy Research, June 2006
Beef and lamb stock number survey, Beef and Lamb New Zealand, 2012. Accessed http://www.beeflambnz.com/Documents/Information/Stock number survey 2030 June 2012.pdf
36 GROWING THE PRODUCTIVE BASE OF MĀORI FREEHOLD LAND PRICEWATERHOUSECOOPERS
RESTRICTIONS1. This report into the development and
application of an economic framework for assessing the impact of bringing Māori land into production was prepared for the Ministry for Primary Industries. This report has been prepared solely for this purpose and should not be relied upon for any other purpose.
2. To the fullest extent permitted by law, PwC accepts no duty of care to any third party in connection with the provision of this report and/or any related information or explanation (together, the “Information”). Accordingly, regardless of the form of action, whether in contract, tort (including without limitation, negligence) or otherwise, and to the extent permitted by applicable law, PwC accepts no liability of any kind to any third party and disclaims all responsibility for the consequences of any third party acting or refraining to act in reliance on the Information.
3. Our report has been prepared with care and diligence and the statements and opinions in the report are given in good faith and in the belief on reasonable grounds that such statements and opinions are not false or misleading. In preparing our report, we have
relied on the data and information provided by MPI as being complete and accurate at the time it was given. The views expressed in this report represent our independent consideration and assessment of the information provided.
4. No responsibility arising in any way for errors or omissions (including responsibility to any person for negligence) is assumed by us or any of our partners or employees for the preparation of the report to the extent that such errors or omissions result from our reasonable reliance on information provided by others or assumptions disclosed in the report or assumptions reasonably taken as implicit.
5. We reserve the right, but are under no obligation, to revise or amend our report if any additional information (particularly as regards the assumptions we have relied upon) which exists at the date of our report, but was not drawn to our attention during its preparation, subsequently comes to light.
6. This report is issued pursuant to the terms and conditions set out in the Contract for Services agreed on 17 October 2012.
APPENDICES
37PRICEWATERHOUSECOOPERS GROWING THE PRODUCTIVE BASE OF MĀORI FREEHOLD LAND
ADDITIONAL ASSUMPTIONSAlong with the conceptual assumptions discussed earlier, there are a number of assumptions specifically related to the way the model has been generated.
NON-FARM INCOMEThe 2012 Situation and Outlook for Primary Industries document included a measure of non-farm income. This non farm income was allocated to industries based on farm level data for each industry. Farms in the horticulture industry typically have a relatively high proportion of non farm income, so the share of non farm income allocated to horticulture is higher than for other industries which rely more on farm income.
STOCKING RATESThe stocking rate is a measure of the number of stocking units per hectare. Farm monitoring reports and MPI estimates provided most of these estimates, but for the sheep and beef sector there was no data beyond 2011. A 2006
paper by Motu provided a mathematical function to model stocking rate as a function of time, and this was used to project the stocking rate out to 2022.
RATIOS IN NATIONAL ACCOUNTSThe National accounts series from Statistics New Zealand runs to 2009. From 2010 onwards, several variables have been calculated based on past ratios. In most of these cases, the ratio has stayed constant over time. Intermediate consumption, subsidies, intermediate taxes and gross fixed capital formation have been computed in this manner.
OPERATING SURPLUSOperating surplus is a measure of total profits in National accounts, and is often used as a balancing item in the national accounts system. We have used a similar approach with operating surplus included as a residual to ensure that national accounts measure of value added balances with top level contribution to GDP.
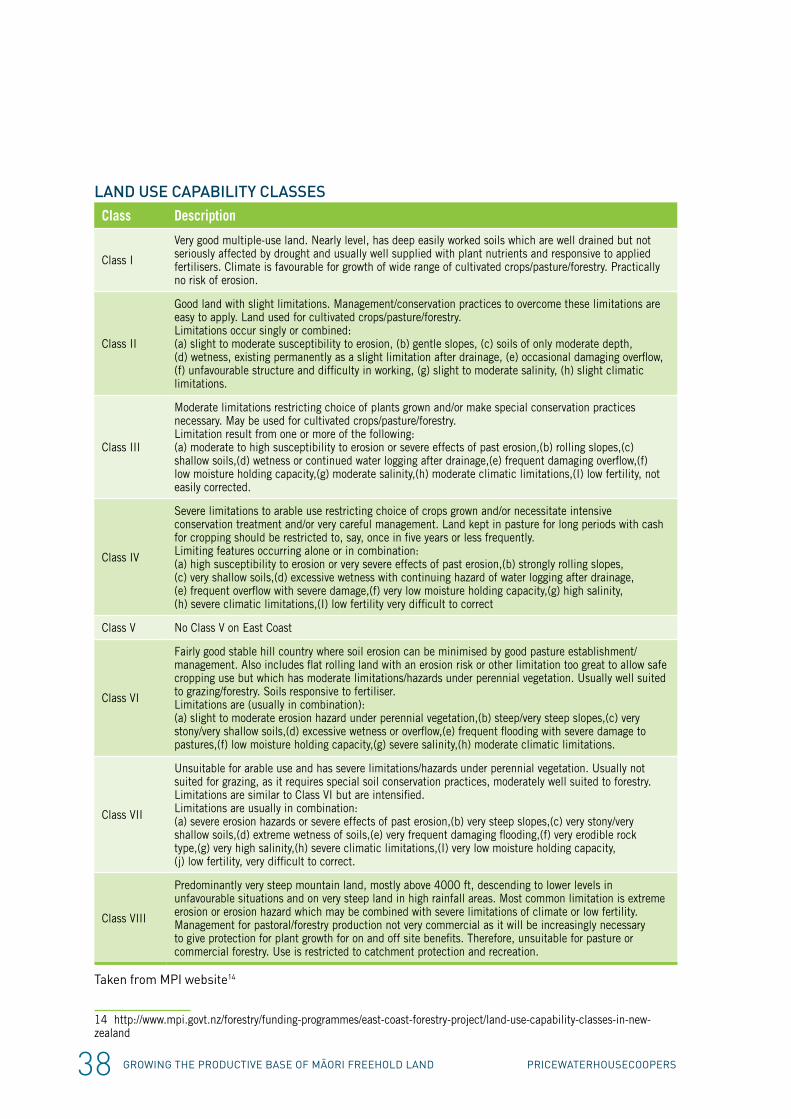
38 GROWING THE PRODUCTIVE BASE OF MĀORI FREEHOLD LAND PRICEWATERHOUSECOOPERS
LAND USE CAPABILITY CLASSESClass Description
Class I
Very good multiple-use land. Nearly level, has deep easily worked soils which are well drained but not seriously affected by drought and usually well supplied with plant nutrients and responsive to applied fertilisers. Climate is favourable for growth of wide range of cultivated crops/pasture/forestry. Practically no risk of erosion.
Class II
Good land with slight limitations. Management/conservation practices to overcome these limitations are easy to apply. Land used for cultivated crops/pasture/forestry. Limitations occur singly or combined: (a) slight to moderate susceptibility to erosion, (b) gentle slopes, (c) soils of only moderate depth, (d) wetness, existing permanently as a slight limitation after drainage, (e) occasional damaging overflow, (f) unfavourable structure and difficulty in working, (g) slight to moderate salinity, (h) slight climatic limitations.
Class III
Moderate limitations restricting choice of plants grown and/or make special conservation practices necessary. May be used for cultivated crops/pasture/forestry. Limitation result from one or more of the following: (a) moderate to high susceptibility to erosion or severe effects of past erosion,(b) rolling slopes,(c) shallow soils,(d) wetness or continued water logging after drainage,(e) frequent damaging overflow,(f) low moisture holding capacity,(g) moderate salinity,(h) moderate climatic limitations,(I) low fertility, not easily corrected.
Class IV
Severe limitations to arable use restricting choice of crops grown and/or necessitate intensive conservation treatment and/or very careful management. Land kept in pasture for long periods with cash for cropping should be restricted to, say, once in five years or less frequently. Limiting features occurring alone or in combination: (a) high susceptibility to erosion or very severe effects of past erosion,(b) strongly rolling slopes, (c) very shallow soils,(d) excessive wetness with continuing hazard of water logging after drainage, (e) frequent overflow with severe damage,(f) very low moisture holding capacity,(g) high salinity, (h) severe climatic limitations,(I) low fertility very difficult to correct
Class V No Class V on East Coast
Class VI
Fairly good stable hill country where soil erosion can be minimised by good pasture establishment/management. Also includes flat rolling land with an erosion risk or other limitation too great to allow safe cropping use but which has moderate limitations/hazards under perennial vegetation. Usually well suited to grazing/forestry. Soils responsive to fertiliser. Limitations are (usually in combination): (a) slight to moderate erosion hazard under perennial vegetation,(b) steep/very steep slopes,(c) very stony/very shallow soils,(d) excessive wetness or overflow,(e) frequent flooding with severe damage to pastures,(f) low moisture holding capacity,(g) severe salinity,(h) moderate climatic limitations.
Class VII
Unsuitable for arable use and has severe limitations/hazards under perennial vegetation. Usually not suited for grazing, as it requires special soil conservation practices, moderately well suited to forestry. Limitations are similar to Class VI but are intensified. Limitations are usually in combination: (a) severe erosion hazards or severe effects of past erosion,(b) very steep slopes,(c) very stony/very shallow soils,(d) extreme wetness of soils,(e) very frequent damaging flooding,(f) very erodible rock type,(g) very high salinity,(h) severe climatic limitations,(I) very low moisture holding capacity, (j) low fertility, very difficult to correct.
Class VIII
Predominantly very steep mountain land, mostly above 4000 ft, descending to lower levels in unfavourable situations and on very steep land in high rainfall areas. Most common limitation is extreme erosion or erosion hazard which may be combined with severe limitations of climate or low fertility. Management for pastoral/forestry production not very commercial as it will be increasingly necessary to give protection for plant growth for on and off site benefits. Therefore, unsuitable for pasture or commercial forestry. Use is restricted to catchment protection and recreation.
Taken from MPI website14
14 http://www.mpi.govt.nz/forestry/funding-programmes/east-coast-forestry-project/land-use-capability-classes-in-new-zealand

39PRICEWATERHOUSECOOPERS GROWING THE PRODUCTIVE BASE OF MĀORI FREEHOLD LAND

40 GROWING THE PRODUCTIVE BASE OF MĀORI FREEHOLD LAND PRICEWATERHOUSECOOPERS


![IN THE MAORI LAND COURT OF NEW ZEALAND TAITOKERAU …€¦ · [2] The land is Maori freehold land and comprises 7.3855 hectares. It is registered under CFR62480. Mercia is the sole](https://img.pdfslide.net/doc/110x75/5f06c4337e708231d419a09f/in-the-maori-land-court-of-new-zealand-taitokerau-2-the-land-is-maori-freehold.jpg)