Embed Size (px)
Citation preview

November 11, 2016Rebekah G. Shirley
Research Fellow, Energy and Resources GroupUniversity of California, Berkeley
Growing the Renewable Energy and Transportation Nexus in SIDS: The Role of Data and Analysis

http://www.rael.berkeley.edu
RENEWABLE AND APPROPRIATE ENERGY LABORATORYAn Independent Energy Research Facility at the Energy and Resource Group, University of California, Berkeley
http://erg.berkeley.edu/http://erg.berkeley.edu/people/shirley-rebekah/http://rael.berkeley.edu/project/sustainable-energy-for-sarawak-sabah/
Focus: Design and dissemination of low-carbon energy systems in industrialized and developing countries based on use-inspired basic research and interdisciplinary approaches to analysis.

Spatial models that integrate utility, resource, LULC data,
demographic data for MCDA and identifying investment opps
e.g. MapRE
Power system simulation and optimization tools
(large and small scale) to inform project planning
and grid expansione.g. SWITCH
RAEL
Policy Analysis Tools
Integrate robust and credible Cost/Benefit analysiswith policy analysis, and finance and energy system
models to inform policye.g. Cool Climate Network
Track Record
› SWITCH: Long range simulation tool (WECC, China, S. America
› Cool Climate: Carbon footprinting + evaluates system costs of differentGHG reduction targets for CA
› MapRE: Spatial modeling tool developed with LBNL to indentifyhigh priority investment for RE
› Built green job and carbon tools forEDIN Program
RENEWABLE AND APPROPRIATE ENERGY LABORATORYA blend of capabilities to support energy decision making by government and planning agencies in low carbon energy planning

WECC
ChileEast
Africa
India
China
EastMalaysia
Current Low-Carbon Modeling Efforts
Kosovo
Cntl Am/Caribbean
*New profiles can be built to analyze region-specific challenges
RENEWABLE AND APPROPRIATE ENERGY LABORATORYBroad geographic focus on developing countries in South and Southeast Asia, East Africa, Central America and the Caribbean

Carbon FootprintAnalysis / Green Job Estimation
Cost Benefit Analysis
Power SystemSimulation/Modeling
THE SUSTAINABLE ISLANDS WORKING GROUPResearch and Modeling Tools applied to Island Contexts and SIDS
SIMULATION OF THE BORNEO GRID (PLEXOS), SOUTH EAST ASIAUsing local data to identify alternative least cost capacity expansion options and supporting government decision making processes
Rebekah Shirley, Daniel Kammen, Energy planning and development in Malaysian Borneo: Assessing the benefits of distributed technologies versus large scale energy mega-projects, Energy Strategy Reviews, Volume 8, July 2015, Pages 15-29

SPATIAL MODELING FOR DATA LIMITED CONTEXTS, BORNEOCombining top-down and bottom-up spatial methods to estimate biodiversity impacts of energy project land use footprints
Table 1. Showing Number of Species Affected and Estimated Number of Individuals Lost for SCORE Dams
Hydroelectric Dam StatusReservoir Area (km2)
Number of Species Affected
Total Number Individuals Lost (Millions)
Number of Species Affected
Total Number Individuals Lost (Millions)
Bakun Operational since 2011 701 302 1.75 142 55.09 Murum Being inundated 242 312 0.61 147 19.55 Baram Under Construction 414 318 1.04 162 35.52
Birds Mammals
Justin Kitzes, Rebekah Shirley, “Estimating biodiversity impacts without field surveys: A case study in northern Borneo,” Ambio, pp. 1–10, 2015
Caribbean Center for Green Technology – UVI Drs. Hall, McKayle, Archibald, Kammen, Kao (Confidential / Progress for DOE / NREL reference) 12 July, 2010
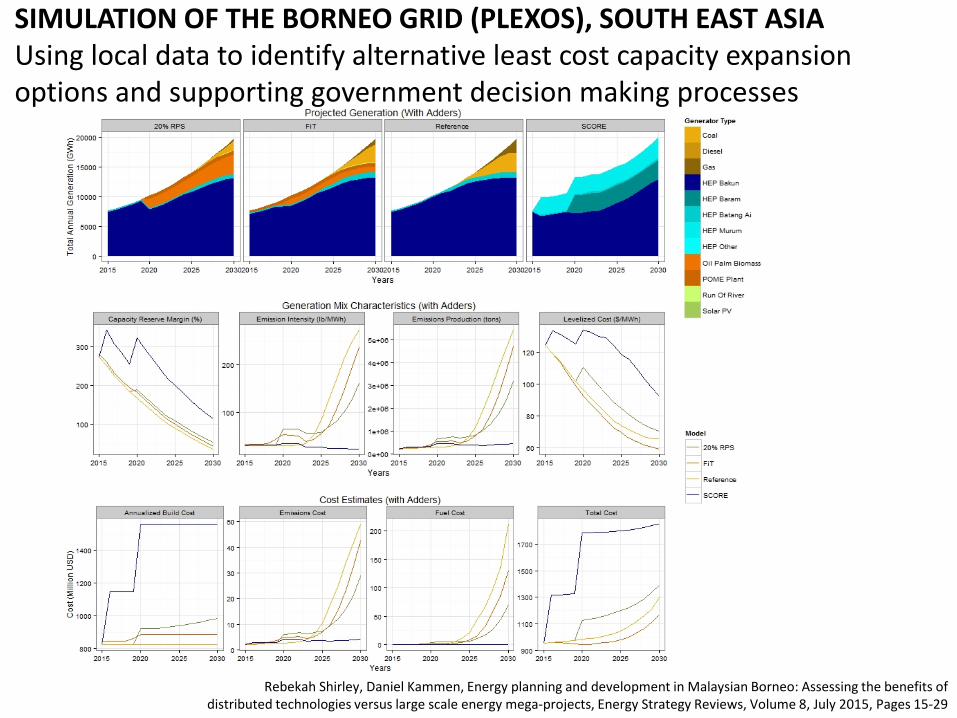
USVI HOUSEHOLD CARBON CALCULATORPersonalizing education and awareness on sustainability and climate change and simple monitoring tools for government agencies
http://coolclimate.berkeley.edu/
In collaboration with NREL, USVI Ministry of Energy, University of the Virgin Islands
Based on the Cool Climate Carbon Footprint Calculator developed at RAEL
Expenditure Data from the 2005 USVI and 2008 US Consumer Expenditure Survey and Consumer Price Index Data
Emissions Factors• Utilities: Electricity, Water, Gas, and Waste
based on local Utility data
• Food/Goods and Services: based on EIO-LCA data and local distribution data
• Transportation: based on EIO-LCA data for vehicle manufacture, local data on taxi, ferry, aircraft and private vehicle use and standard vehicle characteristicshttp://www.eiolca.net/

Work-hrs per year 2000
Cap
acity
Fac
tor
Equi
pmen
t life
time
(yea
rs)
Employment Components
Average Employment Over Life of FacilityTotal jobs/MWp Total
jobs/MWa Total person-yrs/GWh
Energy Technology
Source of Numbers
CIM (person-years/MWp)
O&M (jobs/MWp)
Fuel extract’n
& process(person-yrs/GWh)
CIM
O&M and fuel process-ing
CIM
O&M and fuel
process-ing
CIM
O&M and fuel process-ing
Total Avg
Biomass 1 EPRI 2001 85% 40 4.29 1.53 0.00 0.11 1.53 0.13 1.80 0.01 0.21 0.22 0.21Biomass 2 REPP2001 85% 40 8.50 0.24 0.13 0.21 1.21 0.25 1.42 0.03 0.16 0.19Geothermal 1 WGA 2005 90% 40 6.43 1.79 0.00 0.16 1.79 0.18 1.98 0.02 0.23 0.25
0.25Geothermal 2 CALPIRG 2002 90% 40 17.50 1.70 0.00 0.44 1.70 0.49 1.89 0.06 0.22 0.27Geothermal 3 EPRI 2001 90% 40 4.00 1.67 0.00 0.10 1.67 0.11 1.86 0.01 0.21 0.22Landfill Gas 1 CALPIRG 2002 85% 40 21.30 7.80 0.00 0.53 7.80 0.63 9.18 0.07 1.05 1.12 0.72Landfill Gas 2 EPRI 2001 85% 40 3.71 2.28 0.00 0.09 2.28 0.11 2.68 0.01 0.31 0.32Small Hydro EPRI 2001 55% 40 5.71 1.14 0.00 0.14 1.14 0.26 2.07 0.03 0.24 0.27 0.27Solar PV 1 EPIA 2006 20% 25 37.00 1.00 0.00 1.48 1.00 7.40 5.00 0.84 0.57 1.42
0.87Solar PV 2 REPP 2006 20% 25 32.34 0.37 0.00 1.29 0.37 6.47 1.85 0.74 0.21 0.95Solar PV 3 EPRI 2001 20% 25 7.14 0.12 0.00 0.29 0.12 1.43 0.60 0.16 0.07 0.23
Solar Thermal 1 NREL 2008 40% 25 10.31 1.00 0.00 0.41 1.00 1.03 2.50 0.12 0.29 0.400.23Solar Thermal 2 NREL 2006 40% 25 4.50 0.38 0.00 0.18 0.38 0.45 0.95 0.05 0.11 0.16
Solar Thermal 3 EPRI 2001 40% 25 5.71 0.22 0.00 0.23 0.22 0.57 0.55 0.07 0.06 0.13Wind 1 EWEA 2008 35% 25 10.10 0.40 0.00 0.40 0.40 1.15 1.14 0.13 0.13 0.26
0.17Wind 2 REPP 2006 35% 25 3.80 0.14 0.00 0.15 0.14 0.43 0.41 0.05 0.05 0.10Wind 3 McKinsey 2006 35% 25 10.96 0.18 0.00 0.44 0.18 1.25 0.50 0.14 0.06 0.20Wind 4 CALPIRG 2002 35% 25 7.40 0.20 0.00 0.30 0.20 0.85 0.57 0.10 0.07 0.16Wind 5 EPRI 2001 35% 25 2.57 0.29 0.00 0.10 0.29 0.29 0.83 0.03 0.09 0.13
Energy Efficiency 1 ACEEE 2008 100% 20 0.17
0.38Energy Efficiency 2
J. Goldemberg 2009 100% 20 0.59
USVI AND GRENADA: GREEN JOBS CALCULATORUsing local project data to determine short-term, long-term job potential, translate to person-years/unit production, extrapolate trends

The Intercontinental on Bora Bora, one of the earliest SWAC systems ever deployed
SWAC AND ELECTRIC VEHICLES IN THE PACIFICSystem Design and Science communication for appropriate technologies
• SWAC at the Brando (Tetiaroa) and the Interconntinental (Bora Bora)
• System deploys a 7,874 foot pipe to a depth of more than 3,000 feet
• Saves 90% of electricity consumed by conventional cooling systems
• Tetiaroa SWAC saves 660,000 liters of fuel oil imports and 1,500 tons of CO2 annually
• Modeled SWAC system integration + Low income housing study
Electric Jeepney (eJeepney) plying on the streets of metro Manila
• eJeepney conceived in 2005 by the Institute for Climate and Sustainable Cities, launched in 2008
• Over 50 eJeepneys in Manila, also in Leyte to assist with typhoon recovery
• Motor rated power: 7kW; 8-10 hour charge time; 40km/hr max speed; 84V 225 Ah battery on board
• Averages US$0.04 (Php1.86.00) per km while diesel-fed jeepneys are US$0.18 per km
• National Geographic: The Great Energy Challenge

BARBADOS ROAD MAP: RENEWABLE ENERGY IN TRANSPORTATION• RE penetration as much as 65% or more + contribute to Least Cost pathways in
scenarios that assume ambitious deployment of EE or Electric Vehicles• The transportation sector has the second largest energy demand in Barbados,
met 100% through imported oil products (30% of a $393 mill fuel import bill). • Given the small/limited land area (431 km2), dense road network, relatively
large size of fleet (94,100 registered vehicles 80% private passenger cars) - EVs are a real option to meet transportation demand with renewable energy.
• 2013 Megapower EV charging infrastructure pilot + sale of ex-demo Nissan Leafs: Today 40 charging points deployed, 17 publicly accessible, over 40 EVs
Fuel l Consumption 2006-2015 (diesel for electricity in 2012 was 32 million litres, IRENA 2015
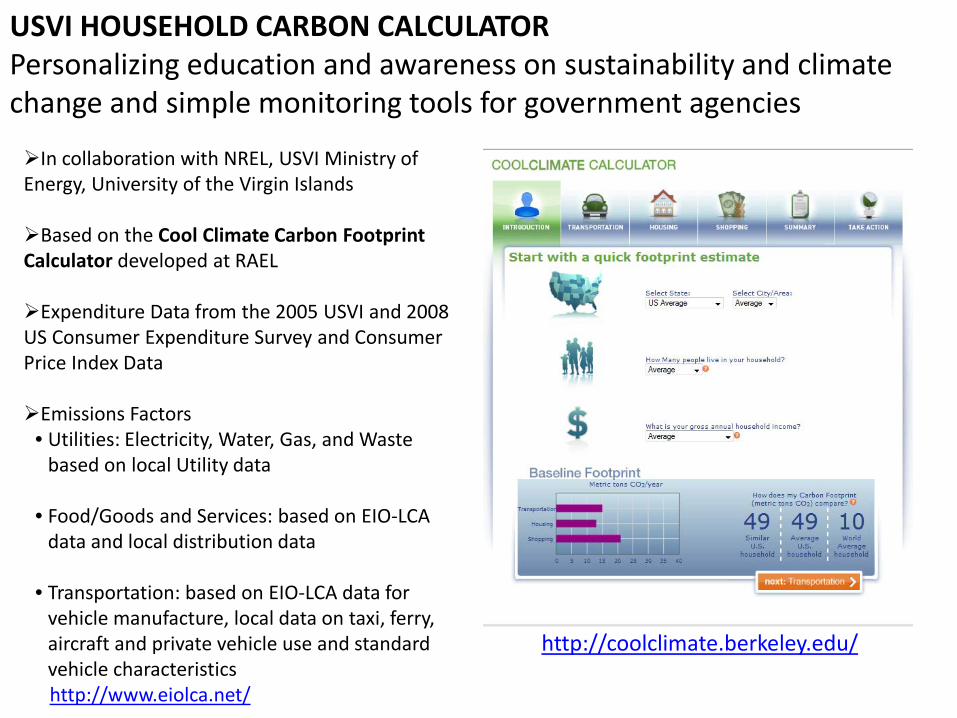
BENEFITS OF ELECTRIFYING BARBADOS’ TRANSPORTATION SECTOR• Greater energy efficiency: Std ICE passenger car in Bbdos drives 40 km @ 0.1L/km.
EV offsets overall fuel consumption by 1460 L/year• Lower Costs: One third cost per km – $0.2/km ICE vs $0.07/km Leaf (assumes
300,000 km over lifetime, PV charging, includes import costs, battery replacement)• Sharply reduced greenhouse gas emissions and improved air quality• Better integration of variable renewable energy sources: EV particularly valuable if
charging profile can be aligned with PV generation (represent storage, lower curtailment of PV, lower total system cost, more PV capacity deployed)
• Potential re-purposing of batteries after the life of vehicles (prevent RE curtailment)
EV charging demand and equivalent gasoline demand reduction: EV Ambitious Scenario (EV 50% new car sales by 2030), IRENA 2015
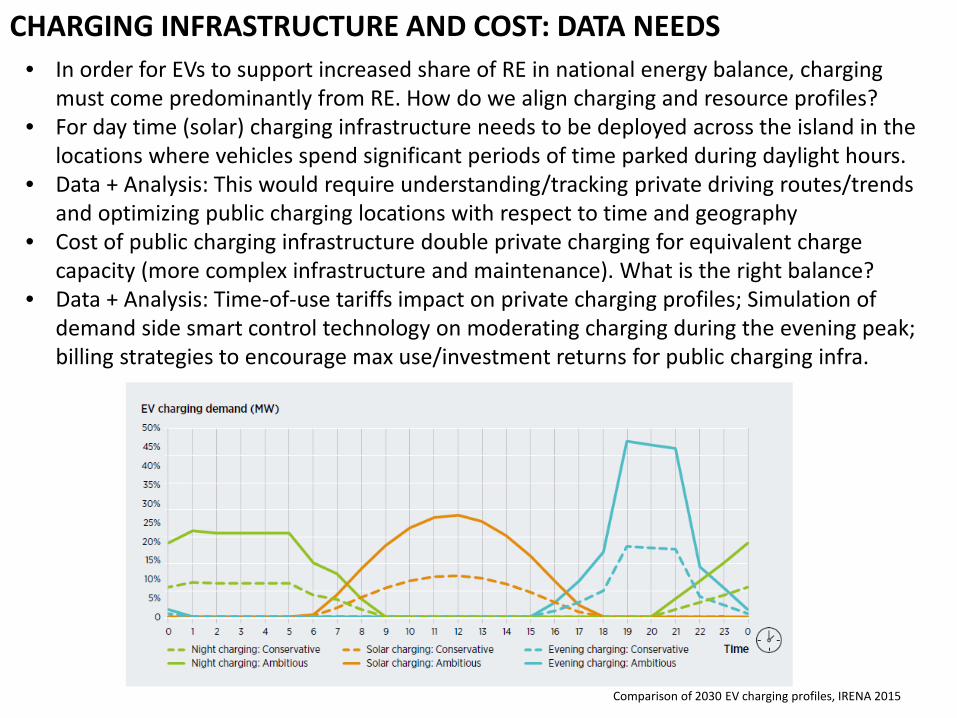
CHARGING INFRASTRUCTURE AND COST: DATA NEEDS
Comparison of 2030 EV charging profiles, IRENA 2015
• In order for EVs to support increased share of RE in national energy balance, charging must come predominantly from RE. How do we align charging and resource profiles?
• For day time (solar) charging infrastructure needs to be deployed across the island in the locations where vehicles spend significant periods of time parked during daylight hours.
• Data + Analysis: This would require understanding/tracking private driving routes/trends and optimizing public charging locations with respect to time and geography
• Cost of public charging infrastructure double private charging for equivalent charge capacity (more complex infrastructure and maintenance). What is the right balance?
• Data + Analysis: Time-of-use tariffs impact on private charging profiles; Simulation of demand side smart control technology on moderating charging during the evening peak; billing strategies to encourage max use/investment returns for public charging infra.
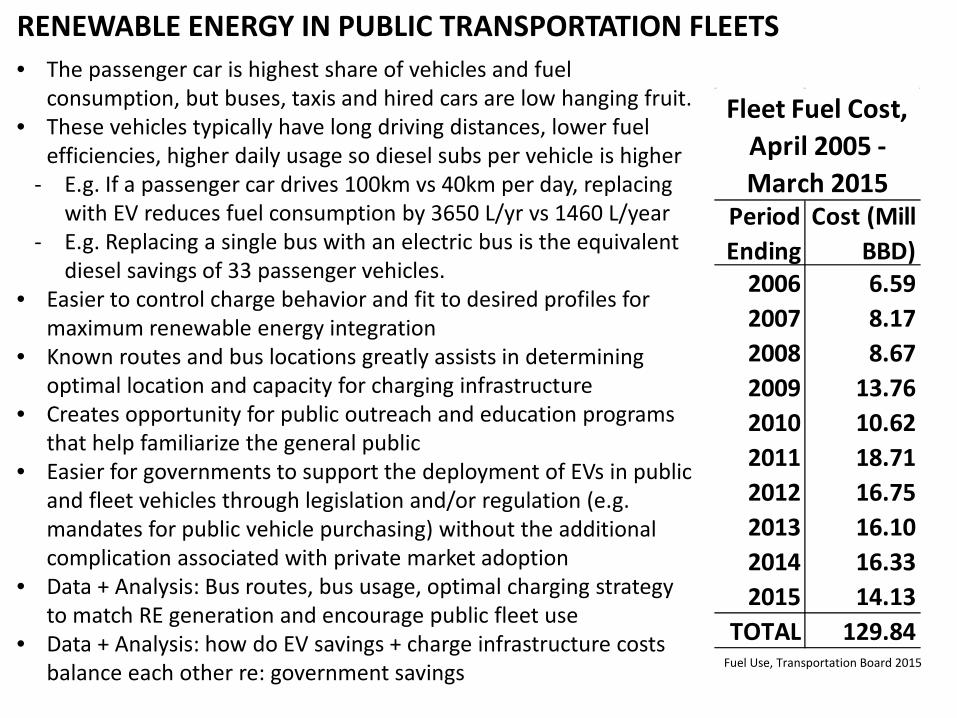
RENEWABLE ENERGY IN PUBLIC TRANSPORTATION FLEETS• The passenger car is highest share of vehicles and fuel
consumption, but buses, taxis and hired cars are low hanging fruit.• These vehicles typically have long driving distances, lower fuel
efficiencies, higher daily usage so diesel subs per vehicle is higher- E.g. If a passenger car drives 100km vs 40km per day, replacing
with EV reduces fuel consumption by 3650 L/yr vs 1460 L/year- E.g. Replacing a single bus with an electric bus is the equivalent
diesel savings of 33 passenger vehicles. • Easier to control charge behavior and fit to desired profiles for
maximum renewable energy integration• Known routes and bus locations greatly assists in determining
optimal location and capacity for charging infrastructure• Creates opportunity for public outreach and education programs
that help familiarize the general public• Easier for governments to support the deployment of EVs in public
and fleet vehicles through legislation and/or regulation (e.g. mandates for public vehicle purchasing) without the additional complication associated with private market adoption
• Data + Analysis: Bus routes, bus usage, optimal charging strategy to match RE generation and encourage public fleet use
• Data + Analysis: how do EV savings + charge infrastructure costs balance each other re: government savings
Period Ending
Cost (Mill BBD)
2006 6.592007 8.172008 8.672009 13.762010 10.622011 18.712012 16.752013 16.102014 16.332015 14.13
TOTAL 129.84
Fleet Fuel Cost, April 2005 - March 2015
Fuel Use, Transportation Board 2015

CONCLUSION: RESEARCH AND ANALYSIS CAN SUPPORT ELECTRIFICATION OF LOCAL FLEETS AND INCREASED RE PENETRATION
Useful future analyses:- Data collection on driving routes (public and private) to project future
needs and optimize public charging point numbers and locations: maximize use and minimize cost/charge (pilot programs + spatial/system optimization tools)
- Time of Use tariff and Control technology simulation studies to optimize charging profiles relative to RE generation profiles
- Simulation of grid integration of repurposed batteries as storage, impacts on intermittency, cost savings
- Sectoral Interactions: Economic equilibrium studies to understand how EV import tax reductions/exemptions savings + public charge infrastructure costs flow through local economy
Barbados is an ideal proving ground for the rest of the Caribbean and other small island states for improving electricity supply sustainability, efficiency, stability and cost effectiveness through renewable energy sources, electric vehicles and intelligent grid technology.

THANK YOU!Thank you to our SIDS partners:
The Barbados Renewable Energy AssociationThe Organization of American States
The National Renewable Energy LaboratoryThe United Nations Department for Economic and Social Affairs
Direct further questions to:[email protected]
Find more on this work at:https://rael.berkeley.edu/project/low-carbon-solutions-for-sustainable-islands/
or https://rael.berkeley.edu/people/shirley-rebekah/