Embed Size (px)
Citation preview

Growing the seeds: recovery, strength and capability in Gippsland communitiesCeleste Young, Roger Jones and Craig CormickInstitute for Sustainable Industries and Liveable CitiesVictoria University
ISILCINSTITUTE FOR SUSTAINABLE INDUSTRIES AND LIVEABLE CITIES
Growing the seeds: recovery, strength and capability in Gippsland communities Page 2 of 145
All material in this document, except as identified below, is licensed under the Creative Commons Attribution-Non-Commercial 4.0 International Licence.
Material not licensed under the Creative Commons licence: • Victoria University logo• Any other logos• All photographs, graphics and figures.
All content not licenced under the Creative Commons licence is all rights reserved. Permission must be sought from the copyright owner to use this material.
Disclaimer: Victoria University advises that the information contained in this publication comprises general statements based on scientific research. The reader is advised and needs to be aware that such information may be incomplete or unable to be used in specific situation. No reliance or actions must therefore be made on that information without seeking prior expert professional, scientific and technical advice. To the extent permitted by law, Victoria University (including its employees and consultants) exclude all liability to any person for any consequences, including but not limited to all losses, damages, costs, expenses and any other compensation, arising directly or indirectly from using this publication (in part or in whole) and any information or material contained in it. This report represents the opinions (findings, and conclusions or recommendations) of the authors, and is the product of professional research.
Published by Victoria University, April 2021
ISBN: 978-1-86272-829-5
Citation: Young, C., Jones, R N., and Cormick, C. (2021). Growing the seeds: recovery, strength and capability in Gippsland communities, Victoria University, Melbourne.
Images: Shutterstock
Acknowledgements We would like to thank the participants of this study for their time, honesty and generosity. We would also like to thank the Victorian Council of Social Services (VCOSS) for their support of the project, and the Health Issues Centre (HIC) for facilitating the online community forum. Thank you to Bridget Tehan, Steve Cameron; to Kathleen Mitakakis, Mary Walsh, Luisa Taafua, Danny Vadasz and members of HIC’s Information Technology team who supported the online community workshop, and to Siobhan McCuskey from the Victoria Institute of Strategic Economic Studies (VISES), Victoria University (VU), who provided administrative support throughout the project. We would also like to acknowledge Emergency Management Victoria (EMV) and Bushfire Recovery Victoria (BRV) for their advice, and the Bushfire and Natural Hazards Cooperative Research Centre (BNHCRC) for their co-funding of this study.

Growing the seeds: recovery, strength and capability in Gippsland communities Page 3 of 145
Table of ContentsAbout this report 4Executive summary 5About this project 9Terminology 11Community recovery 12What the community is recovering from 16
Community experiences of strengths and challenges 20Community capabilities 41The structure of the capability system 41Capability system categories 42Community strength theme areas 43Status of capabilities 44Needs and opportunities for recovery capability 48Conclusion 52References 54
A comparative analysis of bushfire recovery experiences amongst diverse communities in Victoria 56 and New South WalesKey findings across the study 57Methodology 57Overall findings 58Comparisons of those directly and indirectly impacted by the bushfires 62Victorian and NSW comparisons 67Analysis by respondents who identify with a disability and those from CALD backgrounds 72Conclusion 80
Measuring the economic impacts 81Methods and tools 82The baseline economy 84Major direct impacts 88Estimating economic responses to fire and COVID-19 88Industry responses 91Recovery 94Black Saturday Case Study 94Community contributions to recovery 96Bairnsdale Neighbourhood House value assessment 98Conclusions 99References 102
Appendices 103Appendix A1: Perspectives represented in community survey 104Appendix A2: Questions for interviews 106Appendix B: Community self-assessment of capabilities and their status 107Appendix C: Key activities 110Appendix D: Survey and interview questions 111Appendix E: Companion process for measuring capability 115Appendix F: Strategies influencing recovery 116Appendix G: Scientific and technical descriptions of past events 120Appendix H: Exposure data 136

Growing the seeds: recovery, strength and capability in Gippsland communities Page 4 of 145
About this report‘Adversity is a cloak that shrouds great gifts. It is up to us to cast away the cloak and reveal all that lies within. This is the journey.’ — Milena Cifali, Mallacoota Time: The Lost Summer 2020
The 2019–20 East Gippsland fires occurred during the most severe fire season ever recorded on the east coast of Australia. They burned from November 2019 to February 2020, damaging over half of the East Gippsland Shire, an area of over 1.16 million hectares. Over 400 dwellings and businesses were lost and four people lost their lives. Recovery had just begun when the COVID-19 pandemic hit. In the same way that the Black Saturday Bushfires have fundamentally changed how bushfires are seen, these events have changed how recovery will be thought about. Writing this report has been a confronting and humbling experience.
In initial conversations, it became clear that the community members who participated wanted a different conversation to the one they had been having. They were seeking to be heard and understood – not as victims of the bushfires, but as people who needed support because of the bushfires. To accommodate this, the research has been shaped around the conversation they wanted to have, which is focused on community strengths and capabilities.
This study was undertaken when COVID-19 restrictions were in place, extending for two weeks after Melbourne’s lockdown ended. As a result, this report represents a snapshot of the recovery process at that time, and contains material that may distress individuals who have been affected the bushfires and the COVID-19 pandemic.
This report does not aim to represent all community issues or speak for the whole community, but rather to identify overarching themes around capabilities raised by those who wished to participate in the study. Participants have spoken about their experiences; those observed in their home communities and other communities they are working with. We also acknowledge that since the end of Melbourne’s lockdown and the easing of COVID-19-related restrictions, circumstances may have changed, affecting communities’ contexts; and government and non-government agencies may be acting on issues contained in this report.
The purpose of this reportThe purpose of this report is to provide a starting point for assessing and understanding community capability practically, and to provide an indicative status of these in East Gippsland and Wellington Shires following the bushfires. It uses a systemic assessment of social, economic and risk contexts to examine community strengths and capabilities, and identify potential future pathways.
The first section of this report has a specific focus on the capabilities involved in community recovery and how they have been experienced by diverse groups within the East Gippsland and Wellington community. This is viewed through a strengths-focused lens. It also provides an initial assessment of the status of the capabilities identified, and the challenges, needs and opportunities that have arisen as part of the recovery experience.
The second section provides a broader picture of the comparative strengths, capabilities and needs identified in an online survey of those impacted by the bushfires in New South Wales and Gippsland through established community panels. The results show which aspects are shared more broadly, those partitioned by direct and indirect experience, and those specific to the East Gippsland community.
The third section provides an economic assessment of two local government areas – East Gippsland and Wellington Shires – to provide a high-level assessment of the economic influences and impacts on the intersection of the COVID-19 pandemic and bushfire recovery.

Growing the seeds: recovery, strength and capability in Gippsland communities Page 5 of 145
Executive summary‘The role of recovery is not to become normal. Its goal is to embrace the human vocation of becoming more deeply more fully human.’ — Pat Deegan, 1996.
Growing the seeds: recovery, strength and capability in Gippsland communities, explores how the communities in East Gippsland and Wellington Shires experienced their strength and capabilities following a bushfire event that burned for 106 days before being contained, followed by a global pandemic that led to a statewide lockdown. The intersection of these two events is unprecedented and there were not the arrangements in place to effectively manage an occurrence of this nature. Recovery from disasters, where adapting to a new state is part of the process, is best approached by building on a community’s strongest attributes and capabilities. This project has engaged with people who live in and who work with those communities to explore what those strengths and capabilities are. It also examines the influences and implications of the changing risk landscape and economic context surrounding communities in relation to these capabilities. This research was undertaken during COVID-19 and the two weeks after Melbourne’s lockdown had been lifted.
In seeking pathways forward, these communities cannot be considered in isolation to other communities and circumstances. People’s experiences need to be viewed in the broader context of the systems in and around communities to make sense of them, and to help identify why and where change is needed. Communities are the human face that tells us how well this system is working. The novel nature of this recovery means that there is much to be learned (and will continue to be learned) from these communities and their experiences that can help inform future recovery. In the same way that Black Saturday bushfires changed our understanding of bushfires, these events will reshape future recovery processes.
The contextThese communities are situated primarily in rural and remote areas, and have community-oriented economies with strong health and community services, primary production and tourism sectors, dominated by small businesses (98%). Before the fires, the region had experienced strong growth in employment, and the local economy was positioned to recover well with the support of well-targeted recovery programs.
The study found the overarching context of recovery at the community scale was complex and fragmented. The place- based, context-specific nature of recovery, and the lack of clarity around the role of the community in the recovery process, complicated this issue.
On the surface, the communities of East Gippsland and Wellington may appear homogeneous. However, these communities are diverse in themselves. Each has its own social ecosystem and subcultures, and connectivity between and within them varied; some were relatively autonomous whereas others were highly interconnected. Typical members also spanned the spectrum from wealthy to extremely disadvantaged. Common characteristics these communities shared were resilience, resourcefulness and proactivity. Some have the experience of coping with, and recovering from, previous bushfires, and show capabilities that reflect this.
Strengths and capabilitiesCapabilities enable communities to achieve outcomes, and were articulated by study participants as strengths. A richness of strengths were described by study participants. Overall capabilities of specific communities were felt to be not well understood by those outside their community, and were often only known to those within communities or those working closely with them. This was felt to have led to capabilities such as local know-how being discounted and often overlooked. Some diverse cohorts, such as the elderly, Aboriginal communities, those who identify as having a disability, and culturally and linguistically diverse (CALD) communities, have unique capabilities that were also not often recognised.
The most important strengths and capabilities for the community were attribute-based, such as hopeful, supportive and compassion. These were seen to underpin how these communities function, and were also strongly associated with resilience. This was also reflected in the survey, with generosity (50%) and resilience (45%) nominated as the most-needed strengths. Attribute capabilities were also seen as the most variable and sensitive to context.
The study found that ‘enabling capabilities’ play an important role, and that there were ‘linchpin capabilities’ that support the effective functioning of others. For example, face-to-face communication was nominated as a critical aspect of providing effective care. Social structures and infrastructure had been the most negatively impacted.
Volunteering and the organisations that support this are key community strengths, and play a critical role in recovery. For rural Victoria, surveys estimate that about half of the people aged over 15 are involved in formal volunteering. The informal and volunteer economies do not currently appear in formal accounts, although the informal economy was estimated as being equal to 13.8% of the national economy between 1999–2010. The economic and community-based assessments both found that targeted support for the locally-based informal and volunteer economies is essential for effective longer-term recovery.

Growing the seeds: recovery, strength and capability in Gippsland communities Page 6 of 145
Currently, community capabilities are not a formally recognised component of emergency management and planning processes. There is a critical need to build data and knowledge of these to support resilient community recovery, and ensure targeted policy making and programs are in place to support capability, prior to events occurring. This will require developing approaches that work from the ‘bottom-up’, which are undertaken in collaboration with communities over the longer term. It is also important to establish a better understanding of risk ownership at the community level (who is responsible, who is accountable and who pays?), to clarify the role of the community and where they have agency to act. This will help to determine what capabilities are most important, and identify capability gaps and limitations, so these become more strategically managed across the prevention, preparedness, response and recovery (PPRR) spectrum.
Challenges and needsCommunity strengths and capabilities had been affected by multiple challenges. This is to be expected due to the novel nature of this recovery. The length and severity of the fires meant that some communities were exhausted before recovery started, and in some cases, there was no defined starting point for recovery. COVID-19 was a dominant theme, and the resulting restrictions have had a profound impact on those directly and indirectly affected by the bushfires. This is also due, in part, to the fact that the recovery process was disrupted by the pandemic in the critical post-event stage, where communities come together, make sense of what has happened, and provide comfort and support.
The COVID-19 restrictions were felt to have exacerbated pre-existing issues and vulnerabilities within communities, amplified the impacts of the bushfires in directly and indirectly-affected communities, and increased and compounded trauma. They also resulted in communities becoming more isolated and invisible, and adversely impacted their ability to provide care and community connectivity. Conversely, where people had the resources and ability to adapt, it had built strengths in areas such as the growth of online networks, communication and resilience. The impact of these restrictions was also reflected in the online survey, with 59% of responses from Victoria giving a higher rating to the challenge of COVID-19 in their recovery compared to New South Wales (44%). The long-term impacts on community capability, particularly in areas of emotional stamina, are unknown and will need to be monitored.
Findings also strongly indicate the need to build awareness and capability in support providers, so they are better equipped to negotiate the complexity and levels of trauma being experienced, and manage themselves effectively. Relevant training was reported as being rolled out across community groups and support agencies at the time of this study. Education in relation to this will also be important for others interacting with these communities in the future, such as businesses and researchers.
The lockdown during the first wave of COVID-19 had an immediate impact on employment, which fell by 7–8 % in March 2020 before recovering to -3% to -5% in May–September. Employment numbers over this period showed little difference between the fire-affected areas and other regions. East Gippsland Shire closely followed the Victorian average for small business employment and performed better than Wellington Shire. This indicates that JobKeeper and associated programs were the major influences on employment during this period of recovery. The financial responses to COVID-19 were found to have masked the economic impacts of the fires. However, bushfire-related impacts may emerge over time, and will need to be monitored.
There were also challenges experienced by communities associated with program delivery, which had a negative impact on their capabilities. These issues primarily stemmed from the lack of knowledge of, and limited inclusion of communities by government, areas of emergency management and support agencies. There was a general lack of awareness as to the specific nature of these communities, and how to engage with the diversity of cohorts within them. Poor digital infrastructure in some areas also compounded these issues. This has also resulted in some community members feeling ‘managed at’ rather than being supported to manage themselves.
There have also been accessibility issues for some community members, which impacted their ability to engage with support programs. Challenges included the complexity of the processes, timelines in relation to grants, the move to online communication due to COVID-19, and difficulty obtaining information. There is a need to take into account the specific contextual needs of communities impacted by the bushfires – in particular different cultural contexts, language and literacy challenges, people who identify with a disability, those with limited digital skills or poor access to the internet. It was also felt that there needed to be a greater understanding of the social structures within these communities, and who within communities was best placed to work with agencies to enable delivery at the community level.
Communication was a key factor, and who was communicating and levels of trust often determined how information was received and heard. Communication preferences varied, with the forum and interviews indicating that smaller groups and face-to-face communication were preferred, whereas in the broader survey the preference was for emails. It was important for participants to feel their concerns and needs were acknowledged and heard, and would be acted upon. Those facilitating conversations and in leadership positions also required support to develop skills and build the trust needed for
Growing the seeds: recovery, strength and capability in Gippsland communities Page 7 of 145
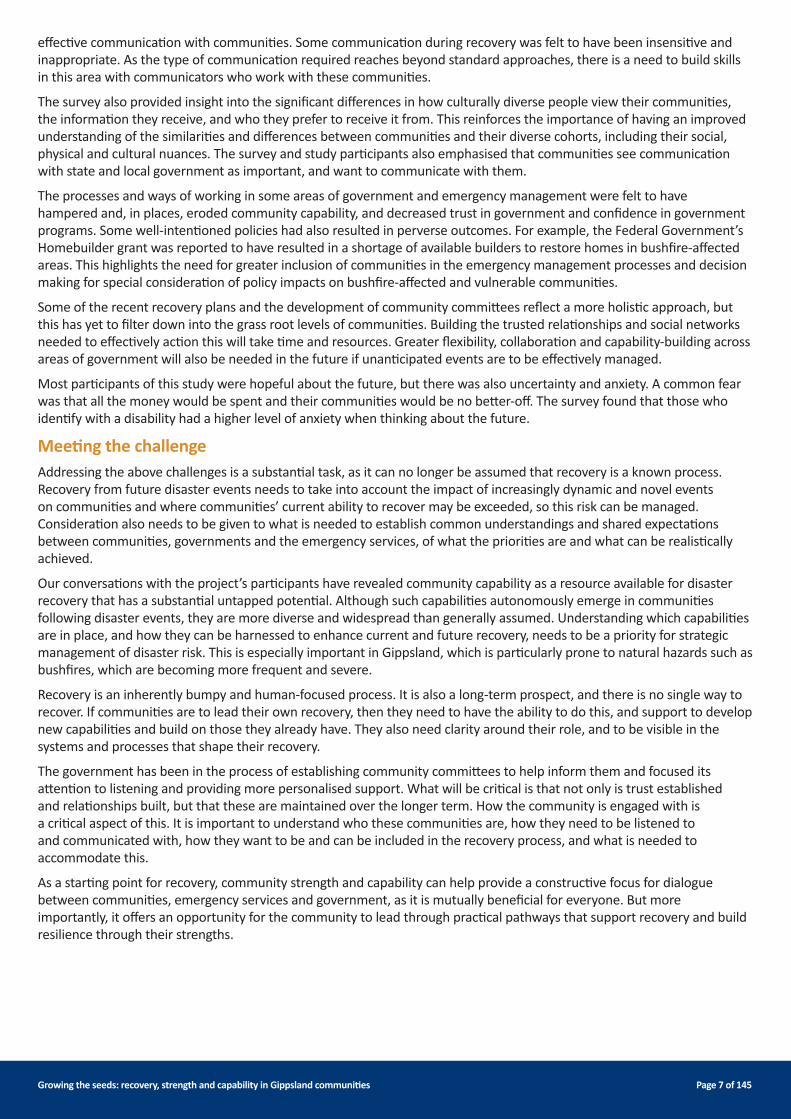
effective communication with communities. Some communication during recovery was felt to have been insensitive and inappropriate. As the type of communication required reaches beyond standard approaches, there is a need to build skills in this area with communicators who work with these communities.
The survey also provided insight into the significant differences in how culturally diverse people view their communities, the information they receive, and who they prefer to receive it from. This reinforces the importance of having an improved understanding of the similarities and differences between communities and their diverse cohorts, including their social, physical and cultural nuances. The survey and study participants also emphasised that communities see communication with state and local government as important, and want to communicate with them.
The processes and ways of working in some areas of government and emergency management were felt to have hampered and, in places, eroded community capability, and decreased trust in government and confidence in government programs. Some well-intentioned policies had also resulted in perverse outcomes. For example, the Federal Government’s Homebuilder grant was reported to have resulted in a shortage of available builders to restore homes in bushfire-affected areas. This highlights the need for greater inclusion of communities in the emergency management processes and decision making for special consideration of policy impacts on bushfire-affected and vulnerable communities.
Some of the recent recovery plans and the development of community committees reflect a more holistic approach, but this has yet to filter down into the grass root levels of communities. Building the trusted relationships and social networks needed to effectively action this will take time and resources. Greater flexibility, collaboration and capability-building across areas of government will also be needed in the future if unanticipated events are to be effectively managed.
Most participants of this study were hopeful about the future, but there was also uncertainty and anxiety. A common fear was that all the money would be spent and their communities would be no better-off. The survey found that those who identify with a disability had a higher level of anxiety when thinking about the future.
Meeting the challengeAddressing the above challenges is a substantial task, as it can no longer be assumed that recovery is a known process. Recovery from future disaster events needs to take into account the impact of increasingly dynamic and novel events on communities and where communities’ current ability to recover may be exceeded, so this risk can be managed. Consideration also needs to be given to what is needed to establish common understandings and shared expectations between communities, governments and the emergency services, of what the priorities are and what can be realistically achieved.
Our conversations with the project’s participants have revealed community capability as a resource available for disaster recovery that has a substantial untapped potential. Although such capabilities autonomously emerge in communities following disaster events, they are more diverse and widespread than generally assumed. Understanding which capabilities are in place, and how they can be harnessed to enhance current and future recovery, needs to be a priority for strategic management of disaster risk. This is especially important in Gippsland, which is particularly prone to natural hazards such as bushfires, which are becoming more frequent and severe.
Recovery is an inherently bumpy and human-focused process. It is also a long-term prospect, and there is no single way to recover. If communities are to lead their own recovery, then they need to have the ability to do this, and support to develop new capabilities and build on those they already have. They also need clarity around their role, and to be visible in the systems and processes that shape their recovery.
The government has been in the process of establishing community committees to help inform them and focused its attention to listening and providing more personalised support. What will be critical is that not only is trust established and relationships built, but that these are maintained over the longer term. How the community is engaged with is a critical aspect of this. It is important to understand who these communities are, how they need to be listened to and communicated with, how they want to be and can be included in the recovery process, and what is needed to accommodate this.
As a starting point for recovery, community strength and capability can help provide a constructive focus for dialogue between communities, emergency services and government, as it is mutually beneficial for everyone. But more importantly, it offers an opportunity for the community to lead through practical pathways that support recovery and build resilience through their strengths.

Growing the seeds: recovery, strength and capability in Gippsland communities Page 8 of 145
Key actions in response to findingsn Mapping of community capability that is led by communities and supported by government to support strategic
planning and knowledge of these.n Consideration and inclusion of community capabilities and local knowledge in regional planning, emergency
management processes and program development. n Consideration of potential future events that may cascade or disrupt different aspects across the PPRR process. This will
need to take into account the capabilities of community, emergency management and government, and their strengths, limitations and gaps.
n Clarification of risk ownership at the community level to support improved understanding of the role communities play across the PPRR spectrum. A key aspect of this is the need to understand what risks they own, explicitly and implicitly, and what capability there is to be able to manage and mitigate risks.
n The development of a five-to-ten-year capability sub-plan to support the development and growth of community capabilities in areas prone to natural hazards, taking into account the changing nature of these hazards impacting communities.
n The development of protocols and guidance for engagement and communication for those working and interacting with bushfire-affected communities, which is informed by the communities who have been affected.
n Development of multi-tiered communication and engagement approaches (small and large conversations, as well as public and social media), that are tailored to, and accommodate the needs and constraints of, communities and the diverse cohorts within them.
n Development of statements of inclusion (formal and informal) by communities that outline how they want to be, and can be, included in the recovery process.
n Education and awareness-raising in relation to the different cultural, social and contextual aspects of these communities to support inclusive interactions. Also, community-led education of cultural, physical and contextual aspects of diverse cohorts within communities.
n Warnings to be placed on public communication that depict real stories or graphic images of the bushfires in public media and materials to reduce distress or triggering responses in those who have experienced, or been affected by, bushfires in the wider community.
n Greater consideration of the impact of future restrictions relating to COVID-19 and public policies on bushfire-affected communities.

Growing the seeds: recovery, strength and capability in Gippsland communities Page 9 of 145
About this projectThis project was undertaken as part of the Planetary Health initiative at VU, which is designed to increase the capacity of researchers to make a difference in contributing to the United Nations Sustainable Development Goals contributing to planetary health. Funded by VU and the BNHCRC, the project has been delivered in partnership with VCOSS and Gippsland community members who chose to participate in the study, with assistance from HIC and ThinkOutsideThe. The project commenced in August 2020, and the research component was completed in December 2020. It builds on our previous work undertaken for the BNHCRC in relation to risk ownership of natural hazards, systemic risk, and diversity and inclusion in the emergency management sector (EMS).
The key questions for the study were:n What capabilities currently exist compared to those needed by the local community?n What are the key influences that shape these capabilities and how are they being shaped (e.g., COVID-19, economic
and social issues)?n What is needed to support and grow these capabilities?
This issue has been examined from three perspectives:n The Gippsland community perspective through an online forum, interviews, focus groups and publicly available
materials (articles, reports, newsletters, etc.).n The broader community perspective through an online survey of community members in New South Wales and
Gippsland who experienced the bushfires.n Historical and changing risks, economic and demographic perspectives derived from data analysis and reports.
MethodologyThe methodology used to inform the project is from ‘Working from the Inside Out’ (Young, 2018). This has been developed to inform decision making in groups, organisations and communities. It aims to develop workable solutions to seemingly intractable problems through transdisciplinary research and systemic assessment of the system surrounding the issue being examined. It starts by understanding end user needs and contexts, before surveying available knowledge from a wide range of sources to develop research that can be used by end users. Due to the limited timeframe and scope of this project, we have only used the ‘understanding the context’ aspect of the overall methodology. We have also used a mixed methods approach analysis across the different research areas.
The community stream of this work was undertaken using community conversations through a tiered approach to knowledge collation (Figure 1, see page 10 for details). This approach enabled us to collaborate with current community-focused activities and support active conversations within communities, rather than impose an agenda.
Community capability was explored using the lens of strengths and experiences of participants of their recovery process through an online community conversation (held on 20 September 2020), which was attended by fifteen participants. Twenty semi-structured interviews and three focus groups of between two–four participants were also undertaken. (The questions can be found in Appendix A2.) Australian Bureau of Statistics (ABS) data and materials provided by interviewees, information from publicly available reports and information collected in a desktop review of documents and social media. The group representing different aspects of the community included: interest groups, faith, physical ability, race, age (with the exclusion of young people and children), gender, cultural identity and vocation. Those impacted by the fires were from rural and remote communities. (Refer to Appendix A1 and C for details.)
Participants for the forum were sourced through online VCOSS networks and social media. Participants for the interviews were sourced through pre-existing contacts and networks in Gippsland.
The data collected was analysed using thematic analysis to categorise them (Sandelowski, 1995). Capabilities were then extracted from these themes and assessed by adapting an asset-based community development approach (McKnight and Kretzman, 1990). We applied a functional lens to these catergories, and then cross-referenced them with thematic areas.

Growing the seeds: recovery, strength and capability in Gippsland communities Page 10 of 145
An online survey was also conducted in October 2020 involving 614 inhabitants of fire-affected regions of Victoria and NSW. The two states were chosen to allow for a comparative analysis of findings, with 31% of respondents coming from Victoria and 69% from NSW. The survey contained 11 questions relating to communications, personal and community resilience, and their attitudes towards the future (Appendix D). Participants in the survey were selected from postcodes that had been affected by the bushfires, and were filtered by whether they had been affected directly, indirectly, or not at all. Those not affected at all were not involved in the study. (For further details, see Appendix E.)
The economic analysis consisted of a wide range of data sets collected from the ABS, covering employment and economic output including data especially collected to track the impact of the COVID-19 pandemic. A privately-generated model (REMPLAN), that releases its data publicly, was also analysed because it was being used locally for planning. We were particularly interested to understand the impacts of COVID-19 and the fires on the local economy, and to see how the different industries and segments of the community were affected. Exposure data was sourced from Geoscience Australia, and demographic data from the ABS.
Event timelines were constructed from a range of online sources, the Victorian Parliamentary Inquiry into the 2019–20 bushfires, MODIS satellite data and the literature. Sources are detailed in Appendices G and I.
This research was undertaken under the ethical protocols of VU, and consent was obtained from all participants. All references to place have been removed to ensure the anonymity of participants.
Figure 1: Research process structure
Big picture conversationLiterature review, online survey,desktop review of materials,community forums
Around the tableConversations, focus groups
Individual conversationsInterviews
Community conversation

Growing the seeds: recovery, strength and capability in Gippsland communities Page 11 of 145
TerminologyAttributes: qualities or features that are defined as inherent parts of someone or something.
Cascading risks: when multiple risks interact and cross from one domain into another, escalating the responsibility to manage those risks. Sometimes the compound effect can create new risks (e.g., large-scale damage leading to economic collapse; see compound risks).
Community knowledge stewardship: The process of collecting knowledge and experience of people and place to serve as collective experience for managing change. It can also be knowledge that has been collected by community members through experience or intergenerational learning, passed on to other community members. This knowledge is often shared through tacit learning and storytelling. Indigenous knowledge, where knowledge holders or keepers are entrusted to pass knowledge on to others, is often defined by specific cultural protocols or processes.
Community knowledge steward: a person who is trusted and respected for their expertise and depth of knowledge relating to their community, and the passing down and sharing of this knowledge. Community knowledge stewards are often, but not always, community elders who practice their stewardship as a vocation.
Compound risks are caused by one or more events occurring closely together and can result in the development of a new risk.
Gross value-added: total output by industry consisting of wages, operating surplus and taxes less subsidies on production, less its supply chain inputs.
Inclusion: the active development of an environment in which all individuals are valued and respected, have equal access to opportunities and resources, and are able to contribute in a meaningful way to a community or an organisation.
Input-output tables measure the inputs into each sector and then calculate the added value of goods and services produced by that sector. Both the input and output sides have to balance, the end result being Gross Domestic Product.
Output: total value of an end product, consisting of wages, operating surplus and taxes less subsidies on production, including its supply chain inputs.
PPRR is a crisis management model used by Australian emergency management agencies that provides a comprehensive approach to risk management. It refers to the key planning and activity phases of prevention, preparedness, response and recovery.
Risk ownership: the allocation of ownership determined by what is at risk, the actions that are needed to mitigate and manage risk, who is responsible, how they are responsible, and their obligations in relation to risk (Young et al., 2015). Allocation can be both implicit and explicit. Implicit ownership that goes unrecognised becomes unowned risk, explicit ownership that is unmanaged becomes avoidable risk.
Rural and remote areas encompass all areas outside Australia’s major cities. Using the Australian Standard Geographical Classification System, these areas are classified as inner regional, outer regional, and remote or very remote.
Social infrastructure is comprised of the facilities, spaces, services and networks that support the quality of life and wellbeing of our communities. It helps us to be happy, safe and healthy, to learn, and to enjoy life. The network of social infrastructure contributes to social identity, inclusion and cohesion.
Social structure applies to the particular arrangement of the interrelated institutions, agencies and social patterns, as well as the status and role that each person assumes in the group.
Supply chain: the use of goods and services by industry in the production cycle to produce an end product.
Growing the seeds: recovery, strength and capability in Gippsland communities Page 12 of 145
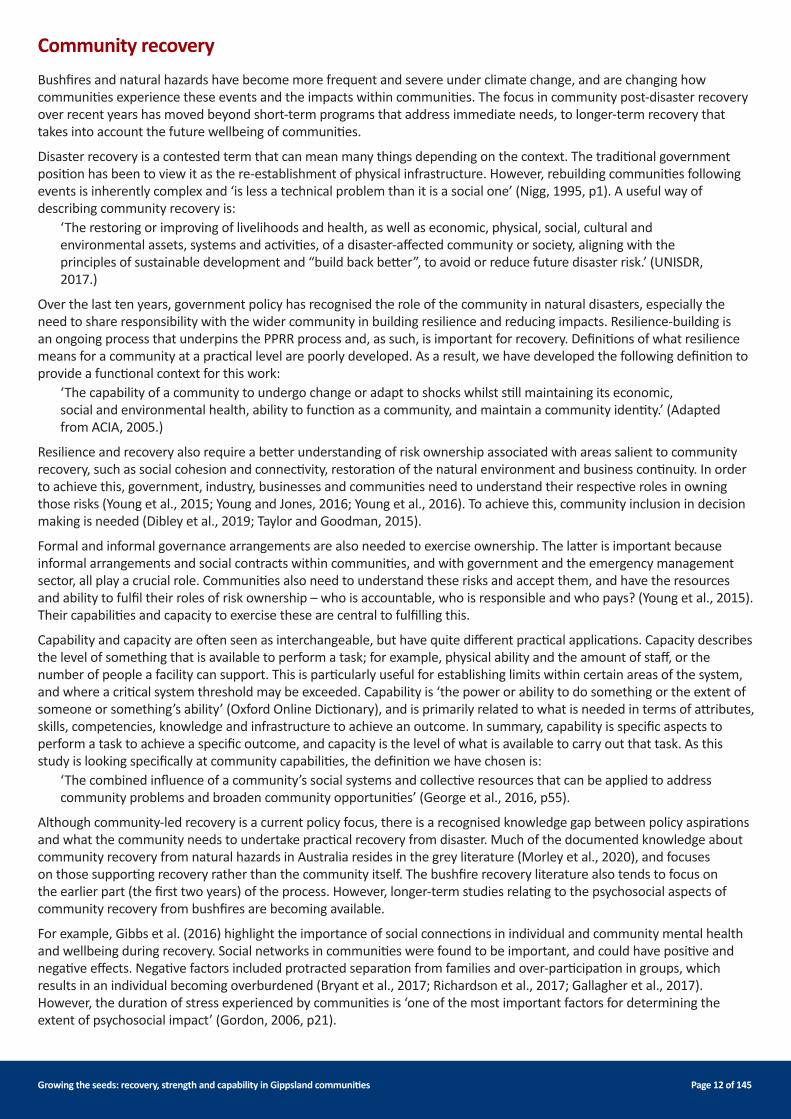
Community recovery Bushfires and natural hazards have become more frequent and severe under climate change, and are changing how communities experience these events and the impacts within communities. The focus in community post-disaster recovery over recent years has moved beyond short-term programs that address immediate needs, to longer-term recovery that takes into account the future wellbeing of communities.
Disaster recovery is a contested term that can mean many things depending on the context. The traditional government position has been to view it as the re-establishment of physical infrastructure. However, rebuilding communities following events is inherently complex and ‘is less a technical problem than it is a social one’ (Nigg, 1995, p1). A useful way of describing community recovery is:
‘The restoring or improving of livelihoods and health, as well as economic, physical, social, cultural and environmental assets, systems and activities, of a disaster-affected community or society, aligning with the principles of sustainable development and “build back better”, to avoid or reduce future disaster risk.’ (UNISDR, 2017.)
Over the last ten years, government policy has recognised the role of the community in natural disasters, especially the need to share responsibility with the wider community in building resilience and reducing impacts. Resilience-building is an ongoing process that underpins the PPRR process and, as such, is important for recovery. Definitions of what resilience means for a community at a practical level are poorly developed. As a result, we have developed the following definition to provide a functional context for this work:
‘The capability of a community to undergo change or adapt to shocks whilst still maintaining its economic, social and environmental health, ability to function as a community, and maintain a community identity.’ (Adapted from ACIA, 2005.)
Resilience and recovery also require a better understanding of risk ownership associated with areas salient to community recovery, such as social cohesion and connectivity, restoration of the natural environment and business continuity. In order to achieve this, government, industry, businesses and communities need to understand their respective roles in owning those risks (Young et al., 2015; Young and Jones, 2016; Young et al., 2016). To achieve this, community inclusion in decision making is needed (Dibley et al., 2019; Taylor and Goodman, 2015).
Formal and informal governance arrangements are also needed to exercise ownership. The latter is important because informal arrangements and social contracts within communities, and with government and the emergency management sector, all play a crucial role. Communities also need to understand these risks and accept them, and have the resources and ability to fulfil their roles of risk ownership – who is accountable, who is responsible and who pays? (Young et al., 2015). Their capabilities and capacity to exercise these are central to fulfilling this.
Capability and capacity are often seen as interchangeable, but have quite different practical applications. Capacity describes the level of something that is available to perform a task; for example, physical ability and the amount of staff, or the number of people a facility can support. This is particularly useful for establishing limits within certain areas of the system, and where a critical system threshold may be exceeded. Capability is ‘the power or ability to do something or the extent of someone or something’s ability’ (Oxford Online Dictionary), and is primarily related to what is needed in terms of attributes, skills, competencies, knowledge and infrastructure to achieve an outcome. In summary, capability is specific aspects to perform a task to achieve a specific outcome, and capacity is the level of what is available to carry out that task. As this study is looking specifically at community capabilities, the definition we have chosen is:
‘The combined influence of a community’s social systems and collective resources that can be applied to address community problems and broaden community opportunities’ (George et al., 2016, p55).
Although community-led recovery is a current policy focus, there is a recognised knowledge gap between policy aspirations and what the community needs to undertake practical recovery from disaster. Much of the documented knowledge about community recovery from natural hazards in Australia resides in the grey literature (Morley et al., 2020), and focuses on those supporting recovery rather than the community itself. The bushfire recovery literature also tends to focus on the earlier part (the first two years) of the process. However, longer-term studies relating to the psychosocial aspects of community recovery from bushfires are becoming available.
For example, Gibbs et al. (2016) highlight the importance of social connections in individual and community mental health and wellbeing during recovery. Social networks in communities were found to be important, and could have positive and negative effects. Negative factors included protracted separation from families and over-participation in groups, which results in an individual becoming overburdened (Bryant et al., 2017; Richardson et al., 2017; Gallagher et al., 2017). However, the duration of stress experienced by communities is ‘one of the most important factors for determining the extent of psychosocial impact’ (Gordon, 2006, p21).

Growing the seeds: recovery, strength and capability in Gippsland communities Page 13 of 145
Key needs for effective community recovery relevant for community capability include the consideration and respectful inclusion of the community in the recovery process and decision making, and appropriate community engagement, along with collaboration, leadership and understanding of complexity (Dibley et al., 2019). Taylor and Goodman (2015) raise the importance of community dialogue and conversations as part of sense-making following fires. The provision of services through community-based services that are trusted and connected in the local community is also central to effective outcomes (North and Westerhaus, 2003). Also required are partnerships where there is mutual respect and that make use of local knowledge; for example, ‘respect for cultural aspects and an understanding of local politics’ (Wagner et al., 2008 p39).
Establishing comprehensive plans for response and recovery prior to events occurring as part of longer-term strategic risk management is particularly important (IPCC, 2012; Jones et al., 2013; UNSIDR, 2015; Young et al., 2017).
A particular challenge is that there is no criteria for what ‘being recovered’ constitutes, so measuring recovery as a process over time is difficult. This is, in part, because recovery happens at all levels of the community and is context-specific, so each experience is different, making it hard to generalise. Short to intermediate funding of recovery programs is also an issue (Young et al., 2015), and there is a need to improve mental health planning (Gibbs et al., 2016).
Current recovery models that guide decision-making generally have a linear structure, which is at odds with the uncertain and context-specific nature of recovery. For recovery to be effectively managed, complexity needs to incorporated (IPCC, 2012; UNSIDR, 2015). There is an implicit assumption in these models that the environment surrounding recovery stabilises during this process. As a result, there is no provision for the potential impact of further large external economic, social or environmental shocks. This leaves little to guide how those giving the support or the community, as to how disruption of this process should, or can, be responded to.
The process of recoveryThe process of recovery happens at a community and individual level, and is deeply tied in with the individual and community wellbeing. A common process used to explain this is illustrated in Figure 2.
Figure 2: The Zunin and Myers stages of recovery, as cited in DeWolfe (2000).
Warning Threat
Impact
One to three days Time One to three years
Inventory Trigger eventsand anniversary reactions
(Coming to terms)
Working through grief
(Community cohesion)
A new beginning
Pre-disaster
“Heroic”
Disillusionment
Honeymoon
Reconstruction

Growing the seeds: recovery, strength and capability in Gippsland communities Page 14 of 145
This process has many stages, summarised from Dewolf (2000), p10–12, as follows: Warning or threat phase: a time of anxiety where communities receive warning as to an impending event.Impact: the period when the event is being experienced, the degree of impact depending on the magnitude and length of the event.Heroic: a time when survival and safety are prominent, which can lead to an increase in risky decision making and a lessened ability to problem solve. It is also the phase where some community members may experience post-traumatic experiences. Honeymoon: some will experience a short-lived sense of optimism that they will receive the help they need. It is also a time when communities bond and share experiences.Inventory: upon taking stock, people may start to recognise the limitations of recovery support and fatigue may set in.Disillusionment: the reality of short-comings in relief efforts becomes recognised, which can increase community tensions, particularly where other members of the community are starting to establish some sort of normality. Increases in community tensions are common.Reconstruction: reconstruction and acceptance of what has happened begins, and people start to reconstruct their lives, look to the future and adjust to the changed surroundings. This is intermingled with grieving and loss, which may continue for years.
This process shares similarities with grief and change models such as the Satir model of change (Satir and Banmen, 1991) and the Kübler-Ross five stages of grief (Kübler-Ross, 2006). Although these models appear to be linear in the way they are presented, they make up a series of observed phases and are dynamic in how they manifest. How or whether an individual or community moves through these phases depends on many factors, such the type of person or community, their pre-existing status, the context in which they exist, and the nature of the event.
Diverse communities Diversity has many meanings. Its traditional application to communities tends to focus on the visible physical and social differences in people, such as physical ability, gender, age, ethnicity and race. However, more recent definitions have expanded to what is not immediately visible, such as diversity of thought, common interest, culture and activity. For this study, we wanted to examine Gippsland communities with a specific focus on how their diversity produces characteristics that potentially contribute to recovery, and to understand these as capabilities. We also aimed to determine those capabilities that were common across all communities, and those unique to specific cohorts. To enable this, we adapted an organisational definition from Davidson and Fielden (2004), p60:
‘Diversity is the way we all differ and how those differences enable, enhance or inhibit the ability of individuals, groups and communities to achieve individual, collective and/or community goals and objectives.’
While traditionally the focus in emergency management has been on larger more easily identifiable capabilities at the organisational and agency level, many of the community capabilities, which they often see as their strengths, are in the less visible categories. Emergencies management organisations have limited understanding of the capabilities within communities, particularly those of diverse cohorts (Young et al., 2018b; Pyke, 2018). Barriers to the use of capabilities in diverse cohorts also exist – for example, different understandings of meanings in language (MacDonald, 2020).
One way to increase the involvement those from diverse backgrounds and minority cohorts is to develop formal and informal statements of inclusion (Young et al., 2020). These articulate how groups want to be included in processes, allowing them to negotiate from a position of empowerment.
Support for recoveryA number of programs have been put in place to provide assistance to the community for recovery at the State and Federal Government levels through two key agencies: National Bushfire Recovery Agency (NBRA) and Bushfire Recovery Victoria (BRV). A $2 billion program to be disbursed by the NBRA was established on 6 January 2020. The program is primarily delivered through state governments, with oversight, coordination and leadership from the NBRA. The key purpose of the NBRA is to lead and coordinate the Commonwealth-supported recovery and rebuild for the 2019‒20 bushfires through collaboration across all sectors, working with all levels of government and connection to and communication with communities (NBRA, n.d.).
BRV was established in January 2020. Their key task is to provide a permanent and dedicated Victorian Government agency that works directly with local communities to ‘listen, help and deliver what they need’ (BRV, 22 February 2021). BRV provide programs and support through Community Recovery Hubs that are embedded in the community for the long term. These hubs provide practical support to the community through planning and rebuilding advice, case support and support for not-for-profit (NFP) organisations, and businesses. They have also established eleven community councils to guide their activities in eleven local communities in bushfire-affected areas (BRV, 28 January 2021). Emergency management committees who oversee emergency management planning also exist at the regional and municipal level.

Growing the seeds: recovery, strength and capability in Gippsland communities Page 15 of 145
Summary of recovery strategies and plans for GippslandThe State Government has developed the Eastern Victorian Fires 2019–20 State Recovery Plan, which is supported by the Statewide Recovery Framework. The following plans have been developed under the auspices of the East Gippsland Recovery Committee, which was established with the assistance of BRV in January 2020, and began formal operations on 2 April 2020.
East Gippsland Recovery Plan Version 1 contains the following five pillars, which underpin forward action:n Culture and Healing Sub-plan – Aboriginal Bushfire Reference Groupn Economic Recovery Sub-plann Built Recovery Sub-plann Natural Recovery Sub-plann Social Recovery Sub-plan.
The Culture and Healing Sub-plan has been developed specifically to support Indigenous communities recover within East Gippsland.
At the community level, the Mallacoota and District Recovery Association (MADRA) has developed the MADRA Draft Recovery Plan, which maps out social, environmental and economic pathways for recovery. This is a community-led plan that has been developed using the best practice model developed by the Strathewen Community Renewal Association following the Black Saturday Bushfires in 2009. Its strategy is aligned to the five pillars outlined in The East Gippsland Recovery Plan Version 1, as outlined above. (For further details of recovery strategies and plans, see Appendix F.)
A Strategic Business Plan, East Gippsland 2021–2024 by East Gippsland Marketing Inc., has also been developed. This plan is focused on building business capability. These plans also need to be seen in the context of the Gippsland Regional Plan 2020–2025, which provides a future vision for the region and its transformation through a social, environmental and economic lens. It is, however, notable that although there is acknowledgement of the need to build emergency management capability in these plans, they lack specific measures to progress this.

Growing the seeds: recovery, strength and capability in Gippsland communities Page 16 of 145
What the community is recovering from
m2
m2
m2
Global COVID-19 pandemic, uncontrolled spread in Melbourne during July, peaking 5 August.
Total cases 20,345 with 819 deaths.
Central to East Gippsland (possibly linked to the big dry), 36-month lowest rainfall on record (to
Dec 2019), slightly smaller area, 48-month lowest on record (to Oct 2020). Drought declared.
Southern and eastern Australia’s ‘the big dry’.Gabo Island’s annual average rainfall decreased
from 948mm (1871–1993) to 821mm (1997–2019).
Drought (extended rainfall deficiency) declared.
Climate shift. Max temperature increases by almost 1°C, May–Oct rain decreases, fire danger
increases in Victoria by over one-third.
Region: Wellington and East Gippsland (unless otherwise indicated)
In June, major flooding of the Tambo, Mitchell and Cann Rivers. Est cost to council of $77 million.
From Jan–March throughout the upper part of East Gippsland Shire causing severe damage to natural systems, agriculture and property.
From Dec 2006–March 2007, north of Bruthen and to the west, causing damage to public land and the region’s catchments.
Central and Eastern Gippsland (Avon, Mitchell and The Lakes), storm damage and flash flooding causing property damage and loss, one fatality, $15 million (2007), $60 million recovery.
South, east and west Gippsland, causing the Morwell mine to flood, and widespread road closures across region.
Throughout February, 166,000 ha burned, nine homes were destroyed, and farm and stock losses in Goongerah-Deddick.
From Feb–March, Wellington Shire, Licola and Dargo, burned over 113,000 ha of forest and parkland.
Over 1,160 million ha burnt in East Gippsland, four deaths, over 400 residential and commercial properties, infrastructure destroyed or damaged.
1997
2017
2020
1998
2002
2009
2003
2006
2007
2012
2014
2019
Figure 3: Timeline of natural hazard events from 1997

Growing the seeds: recovery, strength and capability in Gippsland communities Page 17 of 145
To better understand the relationship between community capabilities and experiences related to the recovery process, it is important to understand what the community is recovering from, the broader risk context the community is recovering in, and the desired state communities are trying to recover to. It is also important to understand the ramifications of how recovery is evolving, and what it means for how community capabilities need to be supported and developed, so capability is enabled rather than eroded.
Recovery is also part of longer-term processes, so cannot be seen as a single moment in time, but something that is continuous and influenced by the environment it occurs in and its historical context. Figure 3 shows a timeline of natural hazard events from 1997. This date was chosen because it has been identified as a regime shift in climate throughout southeast Australia (Jones, 2012). This shift has increased the risk of extreme heat, fire and drought in Gippsland, changing the nature of the events being experienced.
Since 1997, notable natural hazard events include:n Fires: large fires occurred in 2003, 2006–07 and 2014, and 2019–2020 in the Wellington Shire.n Drought: May–October rainfall decreased from 1997, but widespread drought was not declared until 2002 and dry
conditions continued to 2009, becoming known as The Millennium Drought. Wet years 2010–12 relieved conditions, but from 2016 a record drought began in East Gippsland, returning to average conditions in 2020.
n Floods: three major flood events recorded are all associated with La Niña years 1998, 2007 and 2012.n Storm events associated with east coast lows can also cause extensive damage, especially along the coast where winds
are strongest.n The 2019–20 fires in East Gippsland occurred during the worst fire season ever to affect eastern Australia during
the historical record. Extended drought conditions in eastern Australia (including Gippsland) meant that an above normal fire season had been predicted by August (BNHCRC, 2019). Severe fires began along the east coast of NSW in September 2020, and new bushfires continued to start throughout the spring of 2020.
The 2019–20 Australian bushfire seasonThe fire season in East Gippsland was declared on 23 September 2019, the second earliest ever. The record drought (noted above), meant that an above average fire season was expected. The fires began with a heatwave on 21 November 2019. The pattern of fires followed hot and dry weather, forming a series of peaks in spread and intensity through to February 2020. The fires accelerated around Christmas/New Year. Australia had a record Forest Fire Danger Index (FFDI) for December and south-eastern Australia had a record December FFDI on the 30th and 31st. A state of disaster was declared on 2 January 2020, the first time such a declaration had been made in Victoria. Up to 100,000 people were estimated to be at risk. Around 2,000 people were evacuated by sea and air from Mallacoota on 3 January 2020 as fires burned down the Genoa River Valley towards the coast, with evacuations continuing over the following days.
The fires merged into the Snowy and Tambo complexes until mid-January 2020 when some relief occurred with cooler weather. Fires continued to be ignited through to 8 February 2020 until the Tambo Complex was contained on 19 February 2020, and the Snowy Complex on 6 March 2020. (A detailed timeline is presented in Appendix H.)
During the fires, thousands of people were evacuated by air, sea and road. Four lives were lost, and air quality exceeded safe limits for an extended period of time. Buildings in East Gippsland Shire damaged or destroyed included 392 residential and 27 commercial properties, with an estimated 577 non-residential buildings (such as sheds and other farm buildings). While these numbers vary slightly according to different sources, they represent loss rates of 1.5% and 2.2% for the whole shire, and are much higher for the localities directly affected. The total area of the East Gippsland Shire burnt during the fires was 55% (1,163,248 ha). Seventeen percent of agricultural land was burnt (55,724 ha), mainly grazing (39,983 ha), mixed farming (14,926 ha), and dairy (734 ha) (EGRC, 2020).
The COVID-19 pandemicOn 25 January 2020, Australia had its first case of COVID-19, a traveller from China. On 11 March 2020, the World Health Organisation declared it a pandemic. By the second week of March 2020, progressively strict lockdown rules were being implemented, with full lockdown in Melbourne by the end of the month. The first wave began declining towards the end of April 2020, and by 12 May 2020 restrictions were began to be eased. Tourism operators were hoping that trade would resume.
In June 2020, the second wave of infections began, and restrictions were reintroduced by 20 June 2020. On 7 July 2020, metropolitan Melbourne and the Mitchell Shire went into full lockdown. Other states closed their borders restricting interstate travel. The only freedom to travel was within the rest of regional Victoria. Except for key occupations with permits and health needs that could not be met regionally, access to Melbourne was also restricted. Travel conditions were eased slightly in late September 2020, but the 5km limit was not lifted until 6 October 2020.

Growing the seeds: recovery, strength and capability in Gippsland communities Page 18 of 145
Figure 4 shows the timeline for fire and COVID-19 intensity, and the project’s community surveys. The red bars are satellite ‘hotspots’ detected where the fires are brightest, so are a measure of the area burning intensely. The orange columns are new cases of COVID-19 detected in Victoria, and clearly show the two peaks of the pandemic in March–April 2020 and July–September 2020.
Figure 4: Timeline of area under intense fire (MODIS satellite data hotspots), and number of new COVID-19 cases recorded in Victoria, November 2019–November 2020.
0 600 1200 1800 2400Nov2019
Dec2019
Jan2020
Feb2020
Mar2020
Apr2020
May2020
Jun2020
Jul2020
Aug2020
Sep2020
Oct2020
Nov2020
Fire hotspots / number of new cases
Area on fire
COVID-19 first wave
COVID-19 second wave
Community surveys
0 600 1,200 1,800 2,400November
December
January
February
March
Area on fire
COVID-19 first wave
COVID-19 second wave
Community surveys
April
May
June
July
August
September
October
November
2020
2019
Growing the seeds: recovery, strength and capability in Gippsland communities Page 19 of 145
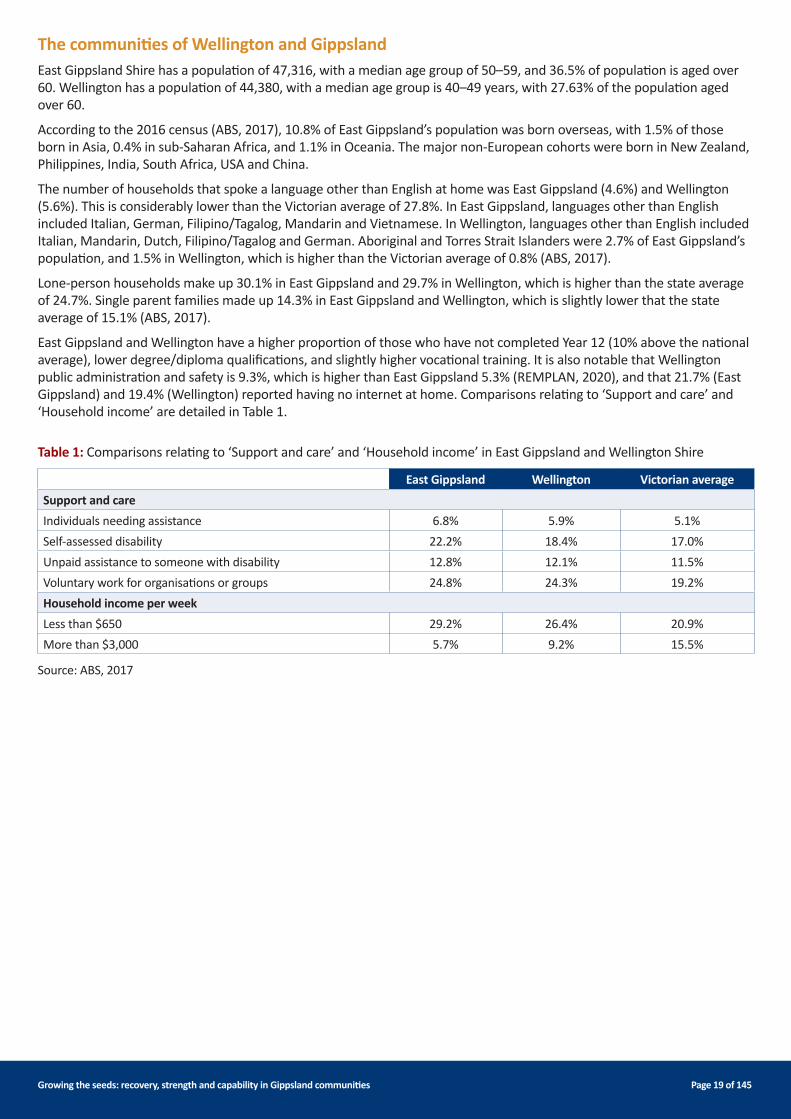
The communities of Wellington and GippslandEast Gippsland Shire has a population of 47,316, with a median age group of 50–59, and 36.5% of population is aged over 60. Wellington has a population of 44,380, with a median age group is 40–49 years, with 27.63% of the population aged over 60.
According to the 2016 census (ABS, 2017), 10.8% of East Gippsland’s population was born overseas, with 1.5% of those born in Asia, 0.4% in sub-Saharan Africa, and 1.1% in Oceania. The major non-European cohorts were born in New Zealand, Philippines, India, South Africa, USA and China.
The number of households that spoke a language other than English at home was East Gippsland (4.6%) and Wellington (5.6%). This is considerably lower than the Victorian average of 27.8%. In East Gippsland, languages other than English included Italian, German, Filipino/Tagalog, Mandarin and Vietnamese. In Wellington, languages other than English included Italian, Mandarin, Dutch, Filipino/Tagalog and German. Aboriginal and Torres Strait Islanders were 2.7% of East Gippsland’s population, and 1.5% in Wellington, which is higher than the Victorian average of 0.8% (ABS, 2017).
Lone-person households make up 30.1% in East Gippsland and 29.7% in Wellington, which is higher than the state average of 24.7%. Single parent families made up 14.3% in East Gippsland and Wellington, which is slightly lower that the state average of 15.1% (ABS, 2017).
East Gippsland and Wellington have a higher proportion of those who have not completed Year 12 (10% above the national average), lower degree/diploma qualifications, and slightly higher vocational training. It is also notable that Wellington public administration and safety is 9.3%, which is higher than East Gippsland 5.3% (REMPLAN, 2020), and that 21.7% (East Gippsland) and 19.4% (Wellington) reported having no internet at home. Comparisons relating to ‘Support and care’ and ‘Household income’ are detailed in Table 1.
East Gippsland Wellington Victorian average Support and careIndividuals needing assistance 6.8% 5.9% 5.1%Self-assessed disability 22.2% 18.4% 17.0%Unpaid assistance to someone with disability 12.8% 12.1% 11.5%Voluntary work for organisations or groups 24.8% 24.3% 19.2%Household income per weekLess than $650 29.2% 26.4% 20.9%More than $3,000 5.7% 9.2% 15.5%
Table 1: Comparisons relating to ‘Support and care’ and ‘Household income’ in East Gippsland and Wellington Shire
Source: ABS, 2017

Growing the seeds: recovery, strength and capability in Gippsland communities Page 20 of 145
Community experiences of strengths and challenges

Growing the seeds: recovery, strength and capability in Gippsland communities Page 21 of 145
This section of the report focuses on the key themes and sub-themes that arose during the community forums and interviews from a community perspective – how the participants saw strength in relation to themselves and their community, and the challenges they experienced during recovery.
Strengths and community characteristics that were elicited from the community forum and the interviews included:n Local knowledge of the history of the region, their communities and the people within them, land management and
natural hazardsn Expertise in managing risks in their local environmentn Lived experience of recovering from natural hazardsn Compassionate and empatheticn Caring and supportiven Resilientn Resourcefuln Proactiven Hopefuln Independentn Established trusted relationships and ways of workingn Established communication networksn Connectedn Volunteering and service to the communityn Trusted relationshipsn Adaptiven Meeting places.
The analysis in relation to these is contained in the ‘Community capabilities’ section on page 40.
Community characteristics There were multiple perceptions of what a community is, including: n Geographical place and size of community (large regional, remote and rural)n Shared interest groups (e.g., faith, vocation, volunteering)n Diverse communities (e.g., Aboriginal, CALD, those who identified with a disability)n Family-based communitiesn Socioeconomical characteristics (education and wealth)n Time of residence in the region (the old and the new community).
The communities in East Gippsland were characterised by many participants as historically having a predominantly older ‘Anglo-saxon retirement’ demographic, but beneath the surface of this was a diversity of communities. It was a region of nuances and dichotomies, which was fragmented and connected, collaborative yet conflicted, and transforming but ‘resistant to change’. It was seen as ‘a community of communities’, where there was considerable wealth and capacity in some areas, but also a high level of social and economic vulnerability, with some living very much ‘hand-to-mouth’.
Individual communities were described as diverse in nature, with each community existing within its own social ecosystem. They were often described as being connected to each other but autonomous, with each having its own unique culture. Within communities, they were ‘well connected’ but not living in each other’s pockets, and respectful of other people’s privacy. They were also independent and resourceful problem solvers who did not like to be characterised as victims.
They were often described as a community where ‘old fashioned values’ (such as service to the community, care, respect for elders and resilience) were woven into the overall social fabric. Communities were also characterised as families where people ‘didn’t always get on’ but cared about each other, and ‘if you are in trouble, people will assist you’. Self-reliance was important for many participants – ‘If you don’t ask they leave you alone, because it is a point of pride’.
Residents of the community were also described in terms of long-term (those who were born there or had lived there for generations), ‘newer’ (those who had not been born there), short-term (those who stayed a couple of years and moved on), and ‘blow ins’ (those who came during the tourist and harvesting seasons). Smaller communities were described as connected and knowledgeable about each other, while larger communities were seen as connected at a local (street/group) level but more fragmented across the wider community.
Growing the seeds: recovery, strength and capability in Gippsland communities Page 22 of 145
Many participants spoke of the region as changing, with increasing gentrification, and declining and changing industries. It was also seen as resistant to change, particularly by people who had returned to the community or were catalysts for change. Some participants felt things were happening too fast, and there was concern in relation to the loss of what were seen as important aspects of community, such as local knowledge and community traditions. There were also concerns about a further widening of the gap between the ‘haves and have nots’, as those with less money were being priced out due to the increasing cost of real estate.
Communities were also characterised as having a number of historical tensions between different communities and the cohorts within them. These were seen as being underpinned by differing and polarised views on what was of value, and what priority should be given to local agendas. Contentious agendas included the decline of some historically-based industries, climate change, land use management, and marginalised communities. Some of these tensions were described as ‘going back generations’, shaped by how the region was settled and colonised, and were seen as deeply entwined with community identities and current social structures. They were described as easily inflamed, particularly when ‘well-intentioned’ interventions were undertaken by people who did not understand the history or local politics.
There were variations in perception as to whether the 2019–2020 bushfires were different to previous fires, with some seeing them as no different, and others stating they had never experienced a fire like this before. There was agreement, however, that the recovery process had been substantially different to any previous experience. The key reasons raised were the COVID-19 pandemic and the protracted nature of the fires in some areas, where communities were on high alert for weeks which resulted in people responding and recovering at the same time.
‘We lost a lot of sleep and were exhausted from the smoke, and there wasn’t really one day to say the fire’s finished, we have got to start recovering. It was a continual process.’
Key themes, strengths and challengesThe key themes identified during the community forums and interviews were:n COVID-19 n Trauma n Community relationships with external organisations and government n Support for recovery n Policies n Inclusion and community-led recovery and resilience n Local knowledge n Communication and engagement with communitiesn Challenges from within the community n Specific experiences from different communitiesn The future.
COVID-19
‘The timing of COVID with our recovery – psychologically and on a community level and individual level – was brutal. Just when people were starting to get out of the house and tell their story with other people and receive that mutual support and re-engage with the community, and feel okay it is safe now, and then we all got locked away again and that was brutal. It was really hard, really hard on organisations, on families and on individuals.’
The impact of COVID-19 presented as one of the strongest themes in relation to recovery. It had a profound effect on the recovery process, resulting in new needs arising and unprecedented outcomes in relation to recovery capability. It was felt to have overwhelmed the public agendas and conversations, leaving many of those affected by bushfires with greater uncertainty, and feeling isolated and forgotten.
‘There is this sort of state created by COVID where everyone is hanging about with uncertainty, not knowing whether or how things will shape up.’

Growing the seeds: recovery, strength and capability in Gippsland communities Page 23 of 145
Disruption to community get-togethers associated with recovery processes was particularly challenging. In the past, community get-togethers – where community members debriefed and made sense of their experiences – had been a central part of the established pattern of the recovery processes.
‘When the fires happened, you had a couple of amazing people who stepped up, opened the hall, and everyone was coming in, and they started doing Friday night dinners and everyone was there. There were 200-odd people
every Friday night and then COVID ended it.’
Not being able to share stories with each other face-to-face. The inability of community members to share their stories directly with each other due to the COVID-19 restrictions has been extremely challenging, as this has been a key part of how they make sense of what has happened in previous recoveries.
‘You sort of feel that every time you talk, you tell a different part of the story.’
The move to digital technology as the primary source of communication was also challenging. Having to learn new technologies and systems and navigate multiple agencies was seen to place further demands those who ‘had barely got back on their feet’ and were already exhausted. Additional barriers were also created for those in particularly remote and rural areas where there is poor digital infrastructure (see ‘Digital divide’ p32 for further details).
Not being able to be active in the early stages of recovery and help others left some interviewees feeling disempowered and distressed. This was described as a key part of the previous pattern of recovery for people in directly and indirectly impacted communities.
‘You can’t have a community meeting. You can’t give someone a hug if they remember it six months down the track. If someone came in and burst into tears you can’t … what can you do? Say hey, we weren’t even open to support the community. I can’t imagine what they’re going through just to have that loss of contact with other
people. You’re told to stay at home and … you need someone, you need a shoulder to cry on, but they were denied that for COVID.’
The closure of meeting places and community gathering impacted sense-making and connectivity. The closure of community spaces such as community gardens and Opportunity Shops that provide purpose and connection in the community, was felt to have intensified isolation. This was seen as especially hard for those who identified with a disability and the elderly. It also disrupted other rituals such as funerals. There was concern raised about this disruption to the ‘process of grief’ and the compounding effect this may have on those impacted by bushfires in the longer term. For others it had constrained their ability to be able to assist or offer comfort or support to those affected by bushfires or suffering grief.
‘The first funeral l did you were only allowed to have ten people. It was just so hard. The message l was giving, or people may have received, was l didn’t care, because l wasn’t allowed to give them a hug or touch them, I imagine.’
Complexities People were confined to their environment, which impacted their wellbeing. This was particularly problematic for those people who had lost their homes or lived in directly impacted areas. An example was one family who had lost two homes, so there were thirteen people in a two-bedroom house. People who were unable to leave their geographical location described feeling ‘trapped’ seeing the devastation with ‘no greenery’. This was described as intensifying the experience of trauma and grief, and retraumatising others.
Many people in remote areas became completely isolated, which resulted in instances of families having little or no interaction with others during these restrictions due to the distances between dwellings. It reduced the ability of support workers in local organisations to provide care for vulnerable members of the community. Places such as schools and community centres were described as providing safe spaces where vulnerable members of the community could be supported in a non-intrusive way. Their closure was felt to have compounded social issues, such as family violence, mental health issues, substance abuse, homelessness and financial duress, which had already been exacerbated by the bushfires.

Growing the seeds: recovery, strength and capability in Gippsland communities Page 24 of 145
‘When the school closed, that was the last safe space where we knew we would have contact with those families everyday … and then we just locked them all away and l was really worried for some of those women and kids.
I still am.’
Constrained ability to provide support to community members also impacted those providing support and intensified isolation for vulnerable members of the community who are dependent on others for connectivity. (For further details, see ‘People who identify with a disability’, p34.)
‘Many disability self-advocates are feeling “lost”, as the usual volunteering work undertaken is not occurring at the same levels, which is further increasing isolation and negatively impacting self-worth and a sense of belonging.
Many of the NDIS providers are not undertaking group events, and this is causing serious isolation and linkage issues. There were also additional pressures placed on locally-based community organisations due to a reduction
in outside services.’
‘All the agencies that were here, when COVID came, they all left. So, people haven’t had what they would have had normally.’
It had also impacted many smaller community organisations. One organisation was reported to have lost 90% of its paid staff and 60% of its volunteers. It was suggested that there needed to be targeted support to assist with this, particularly in relation to day-to-day costs and bills, such as insurances and water, and the emotional resilience of volunteers.
‘They’ve all been virtually annihilated because of COVID-19, and what I heard from a couple of volunteers here that run the various events, is they are exhausted and they’re feeling like they don’t want to do anything again.’
It was also felt to have reduced emotional stamina and financial resources particularly in small businesses, many of which are run by families.
The closure of borders hampered the ability of those to recover. The border closures impacted those away visiting relatives at Christmas, who had large, connected families, and the Aboriginal community.
‘There was a lot of like not knowing where people were and worrying about people – and not being able to get back because they couldn’t get back for quite a long time. And then not being able to see their support systems
because of COVID.’
It also had impacts on those who lived on one side of the border and had businesses on the other, disrupting businesses, and reducing their ability to manage their financial recovery.
Trauma
‘People are suffering collective trauma, which creates anxiety and irritability. So, it is going to be difficult to move forward and l believe [name removed] will be a really changed place, this is something that will echo
up and down along all fire-ravaged communities.’
The trauma experienced during the fires was still present in directly and indirectly-affected participants. Some were still trying to make sense of their experiences and working through the process of grieving. Others described themselves, or people in their communities, as exhausted and being re-traumatised by COVID.
Factors described as contributing to trauma during and following the fires, included:n Not being listened to or feeling heard by others prior to, and during the response and recovery process.n The memory of the fires being retriggered by sensorial experiences such as warmer days, the smell of eucalypt burning,
or seeing a devastated area of forest.

Growing the seeds: recovery, strength and capability in Gippsland communities Page 25 of 145
n Exacerbation and amplification of pre-existing situations, such as financial duress, previous displacement, conflicts within communities and domestic violence.
n Confusion and trauma during evacuation, particularly where they were evacuated repeatedly.n Increased anxiety about next bushfire season for communities who had not been directly impacted by the bushfires.n Being displaced and homeless, and not knowing for long periods of time if people were okay, if they had survived the
fires, or where they were.n Knowing or supporting others, or reading about the event and what had happened to others.n Over-consultation from multiple agencies and having to ‘repeat the same story over and over’ for numerous different
support agencies resulted in traumatised residents having to relive the experience.n Decision-regret and a sense of failing others as a result of decisions made during the fire response, even if they had a
positive outcome.n Inappropriate or insensitive communication or interactions.n Feeling isolated in their grief and loss, and not being able to seek comfort from others in ways they usually would.n The level of destruction of the natural environment, and the animals within it, and being reminded of this when they
encountered it. For those who lived in impacted areas, this was on a daily basis.
In some cases, community members described experiencing a combination of the above. Other participants expressed concern about the level of trauma they were seeing around them. In terms of the Aboriginal community, there were specific lived experiences that further compounded and complicated this that had not been considered (see ‘Aboriginal community’, p35). One participant who worked with supporting socially-vulnerable community members, raised the likelihood of a ‘mental health tsunami’ following the easing of COVID-19 lockdown restrictions, and the need to build capacity and skills of local services, frontline service providers and local health professionals to deal with this. There were also suggestions that due to the lockdown, some of the support people they were dealing with seemed ‘pretty upset and might need some help as well’.
There was a lack of capability and awareness as to how to effectively respond to communities and individuals who were experiencing trauma by many of those interacting with them. Many actions were described as well-intentioned but not always helpful. One person received a number of phone calls from someone in an outside agency to check that a family member wasn’t going to commit suicide after it had been mentioned they were finding recovery difficult. It was raised that a group of organisations were going to receive training in mental health support, and some areas of government had started rolling out similar training in late 2020.
There was little clarity in relation to how the level of trauma experienced by these communities will influence and impact longer-term recovery processes and capabilities.
Relationships with external organisations and governmentRelationships with external parties were complex, and were often felt to constrain the capability of the community to act, and some interactions resulted in people feeling disrespected. However, many participants expressed a strong desire to be able to have a constructive and honest dialogue with state and local government that resulted in action.
Perceived attitudes towards communities and assumptions about their capability. Participants felt that often there were assumptions made about communities and their capability to manage their own affairs.
‘You’ve got bureaucracy coming in from Melbourne who think that we’re just a bunch of country bumkins who don’t quite know what we’re doing, yet we know our community better than they do.’
There were also assumptions made in relation to how people should behave during the fires when they were filling multiple roles in their own communities.
‘This assumption, or this expectation that all the people that had roles to play normally should be defending them. Whereas a lot of those people [name removed] and some police officers, and ambulance
[name removed] had their own properties to look after.’
There was also distrust in relation to government by some participants, and a perception that they were ‘managing at the community’, rather than supporting the communities to manage themselves.

Growing the seeds: recovery, strength and capability in Gippsland communities Page 26 of 145
Relationships with volunteering organisations were seen as a particular strength. A number of organisations were mentioned including Blazeaid, Rotary, The Lions Club, the Country Women’s Association and the RSL.
‘They just rolled up and took over, but it forced us to come to grips with what was going on, and to actually do something rather than sit like stunned mullets.’
The relationships with external agencies that enhanced capability were ones where individuals had built trust and established connections in the community, or were embedded in the community prior to the fires.
Support for recovery
‘The first thing l would have liked to be asked is, “How are you? How are you doing?”, and “Is there anything you need?”.’
Many of the challenges related to support for recovery were interlinked with communication and engagement, and the lack of detailed knowledge about the communities they were being delivered into. The manner in which this communication and engagement was undertaken negatively impacted some community members’ ability to be self-reliant and make decisions.
Support programs were not always accessible for the community. It was felt that services had often been delivered in a way that was not accessible to some of the most vulnerable members of the communities. This included those who did not have internet, had literacy or language challenges, were time-poor, people who identified with a disability, or were suffering trauma. Specific challenges included:n The application forms were overly complex, lengthy and considered difficult to complete. It was perceived to favour
those with internet access, know-how and time, rather than some of those most at need.n Not being able to get the information needed to access the grants available, or not learning or hearing about grants
until after applications had closed.n The processes for obtaining approvals for grants and approvals was time-consuming, slow, and required a lot of energy
and specific skills to achieve outcomes.n Difficulties being able to access the grants, and not being able to speak to a person.n Some support providers had expected people to come to them rather than reaching out to the community, and had not
taken into account that many of those most in need may not be able to seek out services. n Being inundated with questions and feeling forced to make decisions when they could ‘barely make sense’ of
themselves.
There was also confusion, particularly for vulnerable members of the community, as to what financial support they were entitled to. In some cases, there was an assumption that because they were already receiving support from the government, that they were not eligible for the additional bushfire funding.
The complexity of bureaucratic processes and criteria that needed to be navigated to obtain support. This was described as a source of frustration and additional stress. In smaller, less well-resourced communities particularly, they found it confusing and time consuming, which had resulted in some community members disengaging and ‘just doing without’. Fatigue and the level of trauma in communities had also not been taken into account.
There were multiple government departments providing services, resulting in confusion and frustration. It was also felt that there were siloed approaches and a lack of coordination across government departments, which resulted in demarcation and people being ‘bounced around departments’, creating additional duress. It also meant that people had to repeat their story multiple times, which compounded their trauma.
‘What we’ve noticed is that people are already stretched in normal times, let alone in bushfire times, let alone in COVID times. And we can’t forget drought as well. So what we’ve noticed is that the number of people haven’t
had the same reserves of energy and bandwidth to be able to do the sort of things they’d like to do.’

Growing the seeds: recovery, strength and capability in Gippsland communities Page 27 of 145
There could also be different challenges in obtaining support for those who had left their communities following the fires. This was attributed to available funding being geographically-based, and a lack of coordination between states in relation to this. Communities who had local leaders or capable individuals who could navigate the bureaucracy saw the processes in a more positive light, but still described it as ‘difficult’. In other cases, individuals and community groups had taken independent action in response because they ‘didn’t want to wait for government’.
Lack of knowledge of those providing support in relation to current local services. In some cases, government departments and agencies were seen as duplicating or overriding what already existed in the community. This was felt to have presented additional challenges, particularly in rural and remote areas. It was raised that many local organisations were well placed to assist and were an underutilised resource.
‘I think the main thing is that we have the skills and the knowledge to be on the ground to help the people to start with.’
Flexibility and providing options in programs were important. There were differing responses to support being provided from participants who stressed that programs with greater flexibility and agility in program delivery had better served community needs. An example of this was the responses to those who had received specific counselling or attended seminars in relation to mental health support. These varied from frustration of being talked at by health professionals and told ‘what to think’, to finding it very useful in helping them understand what they were experiencing and how to deal with it. Another participant described going to a therapist who ‘didn’t seem to listen or be interested’, and then being offered a massage which was ‘far more helpful’.
Funding and financial support
‘Sometimes it just feels like we are just a means for other people to make money. We are not a “business opportunity”, we are a community who needs support. It feels like people are somehow trading in our tragedy.’
The substantial increase in government and philanthropic funding was welcomed, however it was also seen to have focused on external programs to deal with the plight of the community, but not necessarily the community itself.
‘They put a lot of money out there but it goes to the wrong things.’
It was suggested that some of these resources might have been better channeled into community organisations to enhance local capability and capacity. Also raised was that the term ‘grant’ suggested a handout that was short-term, and that it might be useful to reframe this as an ‘investment’.
The way financial support provided did not always consider the impact of hidden costs. Hidden costs to those directly and indirectly impacted were not always taken into account. One example given was those who had farms not considered ‘working farms’ were ineligible for the support provided to farmers, even though they had lost farm infrastructure such as fences and equipment. Household items such as curtains, sheets and bedding that had been smoke damaged, were also raised.
There were also concerns that community members who needed support may miss out. This primarily related to the way funding was structured and that some community members had not been quick enough or had the support needed to access the available funding. A lack of responsiveness in relation to information needed to access funding or make financial decisions had created additional barriers. Two interviewees reported that they had contacted agencies multiple times and had not been able to achieve an outcome.
‘We are not even asking for a handout. We were just trying to get one of the loans so we could do some things around the place. We couldn’t even get someone to call us back. We don’t have time to fill out a form, the grant
forms are really difficult and long.’

Growing the seeds: recovery, strength and capability in Gippsland communities Page 28 of 145
The short-term allocation of resources and funding. This pertained particularly for those who worked in community organisations, local government and locally-based agencies. This was felt to have created an environment of uncertainty. Some participants raised concerns that vulnerable community members may be placed more at risk when their contracts ended, as the service they offered would either cease or someone new would replace them. As new employees would have to go through the same process of establishing trust and learning about these communities, this was felt to reduce the recovery progress.
‘You can’t just bring someone in now and go, “Here you go, you take over all my people”, because the relationships and the trust that you build over this time, it’s not something you can hand over to someone else.’
It was suggested that it would be useful to develop a register of vulnerable community members that could be linked to the particular service(s) being provided to ensure improved continuity and service to community members, particularly in Aboriginal and remote communities that were isolated.
‘Because we were from outside, it’s taken us a long while to find who these community members are, and where they are.’
Development of strengthsSome participants felt that the pandemic had brought out the best in others, and that it had contributed to strength-building.
‘I feel it is part of building our resilience and capacity to cope.’
‘The bushfires kind of were there, and l think we were responding to that … but I think the pandemic really brought everyone together.’
The broadening out of their community (due to technology such as Zoom), was also described by some participants. One example was an online meditation run by a local faith-based group attended by people ‘from New South Wales, Canberra, Tamworth, Sydney, Alice Springs, Canberra, Western Victoria and Melbourne’. There has also been an increase in online networks such as Facebook groups, where members of the public and the wider community could offer support. A participant who identified with a disability had found the increase in online services had made her life much easier.
Some community members had developed new ways of engaging with their communities in response to the restrictions. One example is a community member who organised two local art competitions for their community. Others had adapted to the restrictions and found new ways of interacting.
‘I will go out and have a cuppa over the fence or whatever. It’s like, no, we can’t come inside, but how about we meet out the front.’
Sharing and telling stories. A number of community members had chosen to tell their stories publicly, either through participation in documentaries, books of individual or community experiences, and news and social media through ABC news articles and Facebook groups. Two participants also reported that they were in the process of collating stories for their specific communities, so they could be documented. The telling of these stories by others, and those who had chosen to do this, felt that it had helped them process their experiences.
‘That is the first time since the fires that anyone has heard my story without interrupting me.’
The level of public stories following this bushfire is something that one participant said, ‘would not have happened in the past’. This may be attributable to the COVID-19 restrictions, and the need for individuals to find new avenues to make sense of their experiences as part of the recovery process. It was also raised that it was felt that the absence of coming together for some community members had also contributed to this.

Growing the seeds: recovery, strength and capability in Gippsland communities Page 29 of 145
PoliciesWell-intentioned but poorly considered policies were felt to have resulted in perverse outcomes and additional challenges for recovering communities. Two of the policies raised were:n The Federal Government’s HomeBuilder grant (developed as an economic stimulus during the pandemic), had created a
shortage of builders to build homes in bushfire-affected areas. This had delayed the rebuilding of some homes.n The placement of recent CALD arrivals from overseas in some regional locations had not been implemented with
additional resources for the community to support them. This was felt to have increased the vulnerability of these communities, and added additional barriers to their inclusion.
Communication and engagement with communities
‘You don’t go into a community and say “You need to do this, this, this and this”. You plant the seed and let them think of their ideas, and they take ownership.’
Communication and engagement challenges with the communities stemmed from the limited knowledge of those offering outside assistance with specific communities. There was also a lack of understanding of the cultural and social structures of communication within specific communities. Trust was also a key factor in how the information was received and heard. The role of listening was emphasised, but more importantly, how different people needed to be listened to.
Local sensitivities and cultural traits of how different communities communicate were not always understood. This was a challenge that created additional barriers to communication with these communities.
‘It’s the old-fashioned respect your elders. It’s the elders, the older you are, the more everyone shuts up when you talk.’
It was also felt to be problematic that some people from outside of the community had made the presumption that people in these communities had the same values. One example of this is the divergent views relating to climate change.
‘People coming in make a presumption that everyone believes in global warming. If you start the conversation off with the presumption that they will believe what you believe, then they are going to shut down
in two seconds and walk away for real … or just shout at you. I’ve seen it happen.’
Local social structures and ways of communicating and different communities such as CALD, those who identify as having a disability and Aboriginal communities were not seen as well understood by other community members and some external support agencies. It was also raised that some people didn’t want to communicate and that this needed to be respected.
There were sensitivities related to asking for specific information following the fires. Some community members didn’t mind giving their names or contact details. However, they didn’t like giving out email addresses because they ‘Didn’t want to have to do a survey in six months’, as this was seen to be a breach of their privacy. There were also inappropriate questions following the event from some of those offering support to communities. One example was a person who was continuously asked if they had insurance directly after their house had been burnt down, which they described as offensive.
‘A lot of them on the ground down there didn’t have the skills. At first, I hate to say, but ... some of the questioning they gave to some of these people was wrong … that was a learning curve. Actually, very upsetting
because a lot of questions they asked were, “Where do you live? What’s your address?” Well, there is no address. They have nowhere to live. The questioning was all wrong.’
Communication had not been tailored to suit the individuals in their communities or circumstances. Interviewees emphasised that wholesale communication worked in some circumstances, but what was most effective in recovery was local networks and face-to-face communication. The key form of communication during the fires for many of those interviewed was ABC radio. The basis and nuances of community communication also needed to be better understood. The key basis for communication described by participants was personal connections and relationships, and things in common.
Over-communication was also an issue. One example of this was an interviewee reporting that one person they knew had received 14 calls in two weeks from different government departments, researchers and agencies.

Growing the seeds: recovery, strength and capability in Gippsland communities Page 30 of 145
Many materials were also provided in written form, or on social media or online applications, due to COVID-19 restrictions. It was felt that these needed to be tailored to suit different communities and required different approaches and consideration of their constraints, particularly those in more isolated communities and/or diverse cohorts.
‘It is talking to locals but on their level. I’ve got emails to say “Comment on this”. Look, I would love to, and my information’s probably great, but I really don’t have the time to do it. It’s got to be in a special format and all this. “Sorry, I’ll write you a quick letter but I’m not doing any formats.” The majority of communities, those grassroots
people, will not comment on things like that. They won’t provide that information because it’s too daunting for them.’
There were also accessibility issues related to communication, particularly for those in remote communities that were isolated, lower socio-economic communities, those with specific disabilities, and little accommodation of specific needs. One example of this was the challenges visually-impaired people faced using apps on their phones.
There was lack of knowledge as to what approaches were needed to engage with communities. It was felt that the current approaches were not suited to the community, and created barriers to conversations and the sharing of information.
‘If people want to find out, it’s really coming in and having the little conversations – at the school, at the kindergartens, at the footy club – where there’s 10 or 20 people, or eight people in a small community, maybe four people. Don’t expect those people to put pen to paper, email, etc. It’s only the people who have the time
to do that, and they’re normally not giving you the right information.’
Some public communication with communities was seen as counterproductive. It was felt that the media was focusing on the trauma of what had happened when people were trying to move on.
‘What we need now is more good news stories.’
The graphic nature of the recent fire preparation advertisements was also raised by some participants who had concerns about how these might affect children, vulnerable community members, or those suffering post-traumatic stress disorder (PTSD) from previous bushfire experiences in the broader community. One participant, who was not directly impacted, felt the advertisements were a ‘turn off’ and demotivated them, while another said they felt ‘angry’ when they saw them. It was suggested that these advertisements should have a warning attached to them.
Community members played a key role in communication with vulnerable community members. This was often through a direct relationship with a particular community or an interest group and motivated by the need to help these individuals. An example of this was given by a volunteer of an interest group who provided support to CALD community members during recovery.
‘Communication is about keeping those vulnerable informed through their own language. For those whose first language is not English, it can be difficult for some to comprehend the message. We do work with a young lady
within this vulnerable group who does have good English and is able to ensure that her other compatriots are all aware of what is happening.’
Inclusion and community-led recovery and resilience
‘When an emergency happens, you need representation from the community. There are certain structures in the way the community works, and that needs to be followed to have a better outcome from the start to the end.’
The lack of clarity of what community-led recovery and resilience meant and the role the community should and can play in this process. The lack of clear risk ownership of who was responsible, who was accountable and who pays, and role definition was a constraint to recovery and resilience action. The articulation of the agenda could also be seen to imply there was a deficit in the community by some interviewees.

Growing the seeds: recovery, strength and capability in Gippsland communities Page 31 of 145
‘What my frustration has always been is we have a strategy, that everyone has a role to play. No-one will actually identify what those roles are, so we’re reliant on the government of the day deciding what their role is, and what message they want to share with us. What they want is community-led recovery and community-led resilience,
but then they won’t actually facilitate supporting that. And they don’t actually define what that means.’
There had been a lack of inclusion of community members in many of the emergency management processes. It was felt that areas of emergency management and government processes and ways of working could be exclusionary. It was also raised that their local knowledge of risks and concerns around their lack of preparedness had been dismissed in the past.
The lack of accommodation for those who were constrained in their ability to participate in emergency management decision making. In some cases, exhaustion or their specific context constrained community members’ ability to participate in emergency management processes and required additional support for them to do so, and this was not accommodated. This had reduced some community members’ ability to contribute and participate in the process. This particularly pertained to those who identified as having a disability, those with literacy or language challenges, CALD, Aboriginal communities, and heavily impacted areas of the community.
The organisational culture and ways of working of some agencies and areas of government. The institutional structures and processes through which government and areas of emergency management currently worked were felt to be at odds with community ways of working.
‘They’re not doing it on purpose, but because of who’s running those processes and the world they are coming from, and their lack of understanding of the world they’re working with, they are telling you not to participate.’
Lack of resources, coordination or clarity of the role in of local government regionally in relation to longer-term recovery. Longer-term recovery was primarily seen as the responsibility of the local government in the area affected. A few interviewees suggested it would help capability and capacity if they could coordinate and pool resources for long-term activities across the PPRR spectrum on a regional basis. Capability in local government was seen to have increased in relation to recovery due to councils outside the region seconding staff in to support recovery and additional support for COVID-19 responses. However, the short-term nature of some of these resources was felt to give uncertainty to the longer-term capability of local government.
Local knowledge
‘Nothing happens that everyone in our community doesn’t know about, but that is 100% off the radar of the official recovery process. They haven’t noticed it, they haven’t engaged with it.’
Local knowledge was seen as a key strength. This included knowledge of their communities, the people within their communities, their cultures and of their environment and history. Much of this sits with many of the longer-term residents and the elders within the communities. This was primarily anecdotal and oral, and was often shared in informal settings such as social events, pubs, community activities and get-togethers. In relation to the Aboriginal community, there were culturally specific formal and informal arrangements in relation to the sharing of this knowledge.
‘They will sit there and drink their beers and tell you about every fire for the last hundred years or so. They will tell you because their fathers were there. Their grandfathers were there.’
Some areas also had particular know-how in relation to land and emergency management, risk management and recovery. There were cases such as the Aboriginal and farming communities where local knowledge and know-how is intergenerational. One of the key challenges related to this was that it was felt that it was often not respected because it was not formally learnt.
‘They always talk about local knowledge, but you feed information back to them and they have already decided how it’s going to work.’

Growing the seeds: recovery, strength and capability in Gippsland communities Page 32 of 145
This was felt to have reduced some communities’ ability to obtain the support they needed to prepare their communities prior to the fires, particularly in some rural and remote areas. It also made them feel that little value was attributed to their capability and knowledge. Inflexibility and decisions that ‘just didn’t add up’ during the fires were also seen to have hampered some people’s ability to make decisions or proactively manage their local situation.
Members of the local community also felt their local knowledge and understanding of ‘what was actually needed’ locally for recovery was a strength. They could also be more agile as they had the trusted relationships and knowledge of the region and where available local resources were. An example given was of a person who was able to mobilise key resources to deliver food during the fires, and neighbourhood house volunteers who were able to individually tailor relief packages for specific community members because they knew them. Another participant gave an example of knowing of local accommodation with wheelchair access that was able to be used during evacuations.
The potential loss of local knowledge due to the ageing population and community members leaving. This was particularly concerning where they supported locally-based planning and emergency management capability. One example of this was someone who had worked in the logging industry who knew how to put in firebreaks with a skidder (a type of bulldozer) who helped volunteers putting in a firebreak.
‘When people have spent their working life in logging, these skills will just be gone, there won’t be anyone who can operate machines like that if they haven’t had experience in the logging industry.’
It was particularly important in Aboriginal and CALD communities, as it related to their social structures and how they lived.
The digital divide
‘I don’t think people realise just how the digital divide impacts. It’s dangerous during the bushfire, and it was expensive during COVID, and it’s going to hamper recovery.’
Lack of digital access and digital skills were raised as a significant and ongoing capability challenge for some community members, particularly in remote communities that were isolated and rural areas. Not everyone in the community was connected to the internet or seen as confident in using digital technology. The poor quality of mobile coverage and internet availability was raised as being one of the major challenges for those recovering, and was also felt to place those who lived in those areas at higher levels of risk. This particularly related to those in isolated communities.
‘A lot of them live off the grid, and a lot of them are obviously in quite remote parts of the areas where the fires were. So they’re not connected to mains power. They’re not connected to mains water. They don’t necessarily
have internet, or phone coverage is a bit dodgy. And so that’s made it even harder.’
The digital divide added additional challenges for vulnerable community members. This included families who had children, or vulnerable community members such as the elderly, people who identify with a disability, those who are at risk during an event or when an emergency occurs.
‘We have a lot of elderly people in our community, and if anything happens l have to run up the hill if l need to ring someone and sometimes it just doesn’t work. What happens if one them has a heart attack or something? It also
affects our business, as people expect good internet if they are staying at a place and we simply don’t have it.’
Data obtained from Wellington Shire Council from a phone survey of residents during COVID in relation to bushfire recovery services, found that 36% of the people surveyed did not have a mobile smartphone or internet access.
Equity issues for remote and vulnerable communities. Additional costs at the household level were reported by interviewees in remote and rural areas and vulnerable communities. Isolated communities had additional costs due to lack of infrastructure and the need to invest in equipment such as satellite dishes, additional phones and radios to ensure communication particularly during bushfires. It was also felt that it could limit employment opportunities in the post-COVID economy for those in areas with poor coverage, potentially widening the gap between the ‘haves and the have nots’, and compounding areas of pre-existing disadvantage.

Growing the seeds: recovery, strength and capability in Gippsland communities Page 33 of 145
Challenges from within the communityDiffering community expectations in relation to recovery could be problematic, particularly in relation to what could be achieved. Some participants felt that the complexity of the task, combined with COVID restrictions, had been underestimated. Some felt things weren’t happening fast enough, and others felt that it was happening before communities had ‘sorted themselves out’, and this was creating additional pressures.
‘Everyone is looking at different directions of moving forward, and some people are saying “This is the way we should do it”, and others are saying “No, no, this is the way we should do it”.’
They also highlighted that recovery processes had been enabled when the community had the social structures in place in place before the events.
‘They had a community representation committee prior and all that sort of stuff. That makes a big difference. So, talking to them, they’re all quite positive, and they’re planning and they’re all advocating,
and they’re all on the same page.’
Expectations of who should lead the community. It was felt that expectations of who should be a community leader had created tensions in some communities during recovery. In some cases, leaders had been selected by people ‘further up the chain’, and it was felt the community were not given a choice about who they wanted to lead or speak for them. Others raised that there had been an emergence of new community leaders since the bushfires, which was viewed as building strength. It was also raised that women leaders were also seen as a strength and they often led from behind.
Lack of experience of recovery. Community members who had previous experience with recovery processes had different expectations of the time it took to achieve an outcome during recovery and were more aware of how slow things could be. Concerns were raised about the lack of education in relation to this for people at the community level who did not have this experience or were new to the region.
‘Especially because of social media, we have these very nasty comments about how no-one’s helping anybody, but that’s not true. It’s even about charities like the Red Cross and CWA and all that. Look, they have been
working extremely hard here. They have been providing money. It’s not as easy as giving a person a hundred thousand dollars. But the general public see it as that easy, but we need for people to have an education,
the whole community, about if a crisis happens, there is a lot of processes and it takes a long time, because we’ve learned from past experiences. Hence, we have complicated processes in place. We mightn’t like it,
but unfortunately we have to deal with it.’
There was also a lack of connection and knowledge of each other in some communities prior to the fires. This was attributed to the changing demographic, distance between dwellings in more remote areas, and some people liking to ‘keep to themselves’.
‘It’s about building it before the fire comes. I look at [name removed] community and a lot of them didn’t know each other prior to the fires.’

Growing the seeds: recovery, strength and capability in Gippsland communities Page 34 of 145
Different communitiesCommunity members who identify with a disabilityThe key strengths of this community were their connection to each other, and that some individuals were very experienced in dealing with government systems and their knowledge of what was needed for those who identify with a disability. Some people in communities also had considerable skills in dealing with bureaucracy.
The recovery experiences of this community highlighted a long-standing lack of resources and planning in relation to accessible built infrastructure to accommodate members of this community. An example was given of a woman who was unable to enter the evacuation centre because it did not cater for electric wheelchairs. It also was felt the wider community often made assumptions in relation to their capabilities which could lead to their ability to contribute to the community being discounted.
‘We deal with that daily, the stereotype and the belief that someone with a disability just wouldn’t be able to achieve or couldn’t undertake basic tasks.’
Organisations offering support were often under-resourced. The advent of COVID had added additional challenges for this community, as it had disrupted support agencies’ ability to be able to provide the face-to-face contact with people who needed support and further stretched these resources. This resulted in decreased cohesion, connectivity and day-to-day purpose with some of those in the community.
‘Volunteering is my everything. It gives me something to strive for and happiness. It gives me food for my soul. The bushfires and this pandemic have made me feel pretty useless.’ — Gippsland Disability Group Inc. video
It also highlighted the need for greater inclusion of this community in bushfire preparation, to ensure that facilities were appropriately equipped to deal with the different needs.
‘We’re starting to get there, but we’re a long, long, long way off in making sure that in preparedness and whatever that means, that people with a disability are considered, and not an afterthought.’
Farming communityOne of the key strengths of this community was their local knowledge (which in some cases was intergenerational), risk management skills and resilience.
The changing nature of the farming community in the region was seen to have directly impacted recovery capability – in particular, the demise of smaller farms, the consolidation of farming properties, and off-farm ownership and management. This was described as resulting in a heavier burden on farmers who lived in these areas due to the decreased number of people to support recovery.
‘When l was a kid, the farms were tightly held in family names, and the sons go from the fathers, and then there were families who had been here for years. Now, not a lot of those family links … that is all finished, and there’s
very few of the original family members that remain … so they now have some big landholders, big farmers from bigger, robust properties.’
This was also compounded in areas where properties were under threat for extended periods of time, where there were road closures, and where there were issues with water shortages during the fires. The bushfires, on top of the drought, had increased financial duress for some farmers in this community and disrupted areas of the supply chains. Some interviewees reported an increase in operating costs for essential items (such as stock feed), which was quoted at being $360.00 per coil at the time of the interviews. Their economic contribution to the local economy and role in the community was seen as a strength by some participants.
Growing the seeds: recovery, strength and capability in Gippsland communities Page 35 of 145
‘For a yearly analysis, the agricultural community holds the whole of East Gippsland up. They’re the bread and butter. The little bit of icing is our tourist industry on top. So we need to really, really look after our farming
community, because we’ve been through four years of drought.’
This community’s ability to assess and manage their own risks at a local level were, at times, overridden by external authorities in what they felt to be arbitrary decisions made by those in centralised control positions. This resulted in some members of the community having to work around decisions to protect their assets and livelihoods.
Aboriginal communityAboriginal communities were described as socially complex. Key strengths of this community are cultural knowledge, connection to Country, and over ‘60,000 years’ of land-management knowledge and skills, including cultural burning practices. This knowledge is intergenerational and passed down through storytelling, and some areas of this knowledge have strict cultural protocols in relation to who shares this knowledge, how it is shared, and who it can be shared with.
Participants described how the history of colonisation has resulted in the Aboriginal people being marginalised from the wider community.
‘The reason why there is so much transience within the Aboriginal community dates back to the days the missions were introduced – they brought people from all over the place to those missions – and later tried to
force them to assimilate into the wider community. So now those people travel between areas to maintain their family connections.’
During the evacuations, the lack of cultural knowledge from outside the community resulted in confusion and additional trauma. One of the reasons for this was the Aboriginal community were not included in the discussions or consulted regarding coordinating evacuations. Some members of this community also carry additional layers of trauma due to their lived experience of being marginalised and previous government policies, which further complicated this.
‘We’ve got ladies that can tell us stories about camping out in the beanfield areas because they weren’t allowed in town. They tell stories of even further back when they had to hide their children for fear of them being removed.’
Examples were also given of how members of the Aboriginal community experienced discrimination and racist comments during the evacuation and recovery processes.
The Aboriginal community experience of the fires and the ability to recover is deeply entwined with a unique cultural and spiritual connection to the land. As a result, recovery requires different considerations and support to enable healing, and capability and capacity-building.
It was also raised that members of community had found the creation of more employment opportunities positive and were interested in revegetation work and protecting heritage sites as part of their healing process. It was also felt that their capabilities were not well understood in the wider community, and there was a need for education. While the community were grateful for opportunities to share their knowledge on some of the available platforms, there was concern that their local community members were not being engaged to participate in revegetation work. Many have had to leave the area to seek employment and housing elsewhere, and would like to be included as part of the program. A challenge that has been identified to this happening included the lack of suitable housing in the areas where work is being completed.
The community group, Reconciliation East Gippsland, was also active in seeking better understanding across areas of the community between Aboriginal and non-Aboriginal community members.
Arts communityOne of the key strengths was the ability to collaborate, creativity and the safe space that this community provides for difficult emotions to be made sense of and accepted.
Community-based arts, although prevalent throughout the region, were found to be poorly resourced and heavily reliant on a volunteer workforce. There is limited local infrastructure to support the development of younger professional artists in particular. Some artists reported struggling to work their way through the bureaucratic processes needed to obtain small amounts of project funding prior to the fires and COVID-19. It was raised that the arts were recognised as a substantial strength in the region, but were often under-resourced and under-utilised in terms of the community’s economic and

Growing the seeds: recovery, strength and capability in Gippsland communities Page 36 of 145
transformational potential. They play an important role in recovery and making sense of their experiences following the bushfires and supporting connectivity in the community.
‘Everyone up here does something, they play guitar, they sing, they paint, they make things.’
Since the fires, artists have written books, held exhibitions, and made music from their experiences. Some also saw an opportunity for being an active part of the rejuvenation and the transformation of the region. There were also areas where artist collaboration with businesses had added value and enabled local business and economic growth. One example of this was a group of artists who worked with tourism-based businesses to provide unique experiences for those visiting the region, and collaborations across the community to develop festivals and special events.
Faith-based communityOne of the key strengths in the faith community was their knowledge about how to support people who were experiencing threshold aspects in people’s lives, such as birth and death and their ethic of compassion.
‘It is someone saying “How is it for you?” … someone listening to them. But for others, it might be saying “Can you write down for me how this is?”.’
The key challenge for the interconnected faith-based community has been COVID-19 and the need to move to online platforms and restrict numbers of people who are allowed to participate in rituals such as funerals where it is about healing people through collective as well as personal grief. Rituals also provide a spiritual structure that supports aspects of how some people live their day-to-day lives and gives them meaning.
The restrictions also created challenges in the delivery of pastoral care in the community and schools, with those responsible for these areas of care finding it more difficult to provide support due to the lack of day-to-day contact. For those within bushfire-affected areas, support during recovery by connecting with others and providing care, guidance and healing where there were local connections. Groups associated with faith communities and church halls also provided an important focus for social connection and activities in some communities.
CALD communityThe key strengths in the CALD community is their cultural knowledge of their communities. Local interest groups within the region, who have built connections with some CALD community connections, as well as local resources (such as interpreters, helicopters, skilled people) needed to assist these communities.
Members of this community were described by some participants as preferring to communicate within their individual cultural groups. It was raised that there was no specific body that represented this cohort as a whole in East Gippsland, although there were smaller networks for specific cohorts (such the Filipino community or asylum seekers). It was also raised that there was an element of transient CALD workers, who were part of the seasonal workforce. A lack of understanding of the landscape and local risk meant that they had less capability to manage themselves in fires due to their lack of experience and knowledge.
‘I know they don’t have fires like that. This would have been a new experience for them.’
It was also raised that in towns where newly arrived refugees were placed, there was often a lack of local resources to support them in regional areas, which could lead to them being marginalised.
Conversely, others who participated in the study from this group were longer-term residents who felt they were part of their community. Members of different CALD communities such as the Sikh community had been active in supporting others during the fires. Community members who were connected into the community also knew where local resources were that could assist particularly vulnerable members of the community. (See ‘Communication’, p29.)

Growing the seeds: recovery, strength and capability in Gippsland communities Page 37 of 145
The elderly communityThe key strengths in this community were community knowledge stewardship for the region, as Elders in Aboriginal communities, and in their participation in volunteering, faith-based activities and community service areas.
Elderly participants rarely spoke about the challenges that they personally were facing, tending to focus more on the communities around them. The only direct comment from one elderly participant was in relation to tiredness. The elderly participants interviewed were independent and proud of this. However, it was raised that this could sometimes lead to this demographic seeing seeking support as a failure or taking away from others most in need.
One support worker noted:
‘They are just still resistant to support because they’re just trying to do it themselves, but they are exhausted … even just filling in that form was too much for them. And even the concept of having to plant a plant on top of all
the other work that they have to do is too much for them.’
They felt they had a key role to play in volunteering, but felt that sometimes assumptions about age and their ability had affected this.
‘It is about accepting some of us being over 60, fit and healthy, and [are] able to achieve as much and often more than other volunteers.’
Some of them have also had extensive experience of living through and recovering from bushfires, and have knowledge of the history of the region and their communities.
Remote communities that were isolatedThe key strengths in these communities were their independence and self-reliance.
Poor digital infrastructure, limited resources and people to undertake recovery, and financial duress due to additional costs resulting from the fires and COVID-19 were key capability challenges for these communities. It was also raised that the independent nature of these communities could sometimes make it harder for these people to seek or ask for help. They often felt they were too small to matter to government, and do not have the capacity to deal with multiple bodies without effective support.
‘Because we are a small community organising ourselves and dealing with public land managers that were enormous and had lots of departments, it was beyond us to get traction.’
Another challenge raised was that some communities and people who lived off the grid were often invisible to those who didn’t know they were there. This was problematic during the fires for emergency management. They felt this was in part because these communities like to keep to themselves. There were also concerns raised that they would not receive the telecommunication infrastructure they needed due to the small number of residents in their communities.
Small business community One of the strengths was the support that small businesses provide to the local community, and the agility and innovation of some business who had flourished and continued to grow during recovery. (It is important to note that these businesses were able to leverage the opportunities due to their technological skills.) Local shops often acted as meeting places in smaller more isolated communities, and their owners acted as connectors in their communities. Many have been active during the recovery process in supporting others and sharing knowledge.
The key challenges for local businesses were a lack of inclusion and understanding as to the role they play in the community by those outside. The loss of income due to the fires and COVID-19 impacted many small businesses, particularly those that rely upon tourism. There was also considerable financial duress reported, with substantial increases in costs. One example provided was insurances for boats where their bill had, with no specific justification, increased to $16,000 per annum. One participant raised that the small business community had not been included in the recovery process.

Growing the seeds: recovery, strength and capability in Gippsland communities Page 38 of 145
‘The business sector just seem to be completely out of the loop, and they seem to be either the end recipients of the things that fall through the cracks, or they’re the actual ones in need. If they fall over or they can’t open,
that has impacts on people’s access to petrol, to fresh food, to a place of connecting, whatever the things are that they’re doing. So I think that’s a huge area for opportunity. If we can strengthen that in a way that’s relevant – I don’t mean a 20-page document that no-one reads and they go “Tick it off, I’ve got it”. It has to be also
the activities that help people do that effectively.’
Poor digital and business infrastructure, and limited business skills (particularly in relation to managing business risk and digital literacy in some smaller businesses), were seen as a major challenge in relation to recovery.
‘I don’t know of any of the businesses that we worked with previously, or now, who have a business continuity plan.’
The loss of infrastructure and the damage to the environment was also a concern to those who worked as environment and nature-based tourism operators. Local businesses had also supported each other during recovery with one participant describing how they had been providing both emotional and capability-building support during this period.
The futureWhile some participants were anxious about the immediate future, the majority of participants were optimistic following the easing of the COVID-19 restrictions, and were hopeful in relation to the coming months.
‘I think the majority of people are very hopeful. People are moving on, definitely. There’s obviously a few that haven’t that will carry it, but that’s where we’ve got to pick up the mental health services. It is a vibrant
community up here, and we’ve got some of the best country in the world: the beaches, the bush, the mountains, the snow. It’s looking like, apparently, a ripper hospitality season up here, from what I gather from people with
establishments, because obviously with COVID-19 you can’t go overseas, so a lot of the hospitality is going like “We’ve got bookings, we can’t take any – booked out already”. Also, we think maybe the drought might
have broken.’
A number of participants found it difficult to think beyond the immediate future due to their circumstances or fatigue. There were also those who were anxious that they would continue not to be heard, and when all the money was spent, their situation would not improve in the longer term. One participant raised that there was a need to really think about what bushfires like this might mean in the future for businesses, as a healthy environment was critical to the region’s sustainability.
There was a desire to build capability and capacity in the region, and to use the experience of the bushfires to rebuild the communities into a position of greater strength and autonomy. Participants saw a number of opportunities to bring positive change into their communities, and to build on community capabilities to use the opportunities on offer through the recovery process to build strength and resilience.
‘I think there’s some huge opportunities to explore the role small business plays in supporting each other, but also what role do businesses and philanthropy play in helping people get things done that need to be done
in a really time effective way because they’ve got the infrastructure, they’ve got the knowledge, they’ve got the logistics and they just know how to fix it.’
‘There’s a lot of farmers that will take advantage of this – the old fence got burnt down, it’s a chance to build a bigger, better fence. So, in the long-term, the clear fence lines will see us out for the future.’

Growing the seeds: recovery, strength and capability in Gippsland communities Page 39 of 145
Participants within and surrounding fire-affected communities were focused on rebuilding themselves and their communities.
‘I need to rebuild myself more importantly because l have lost everything, a sense of history, a sense of place. You have to start from scratch and build up memories again. Write a new piece of music, file it in a folder,
buy yourself a new piece of jewellery. There are a lot of things you need to rebuild. And it’s not just about going back to your land and slapping down bricks and mortar. There is so much more to it than that.’
It was also about rebuilding the parts of their communities that supported their connectivity, purpose in the community and supporting others.
‘Support those very small groups that are in those communities that were operating prior to all this, but that are probably struggling now to continue. And that brings that resilience, because once you’re going to your footy once a week, or whatever, or your netball or whatever, you do build-up with your community better
resilience because you’ve got people to help you in times of trouble. It’s those small little things.’
There were also participants who saw the possibility of rejuvenating the community in different ways, through collaborating and leveraging the talent of locals and reaching out beyond their region to strengthen them.
Summary The experiences shared by participants of community strength and challenges illustrate the complexities of the communities, and the unprecedented nature of the fires and the recovery process.
The greatest diversity was between the different communities and their cultures. The cultural aspects of certain cohorts and their capabilities were not seen as well understood or included in the wider community. Communities were also in a process of transformation across the Gippsland region, and there is a need to ensure that building emergency management capabilities is a visible aspect of this agenda.
The strengths that were important to communities and enabled their functioning were the less visible aspects, which existed at individual and community levels. These included: n Attributes (e.g., caring, resilience).n Know-how and local expertise (e.g., expertise, bio-hazard knowhow in farming communities, environment management
in the Aboriginal community, and recovery expertise in those who have previous experience of bushfires).n Community structures (e.g., social structures, built structures). n Enabling strengths such as local knowledge, community organisations and networks, and community activities.
Attributes and volunteering and locally-based community organisations were seen as particularly important. It was felt that these were not valued and often dismissed by government and some agencies who were providing support. The lack of digital infrastructure and digital skills, particularly in rural and remote areas, was a key capability gap. This was seen to increase risk and inequities in communities and constrain growth of capabilities and recovery.
The growth of new strengths during recovery was also described. This included increased resilience and the broadening out of networks, new leaders and enterprise. Support and development of leadership capability at the community level was felt to be important. These were very much based on the context people were in, their ability to capitalise on the emerging opportunities provided by the additional funding, and the advances in online communication platforms and services.
Multiple challenges to strengths and capabilities across a range of themes were identified. The strongest theme was the advent of COVID-19 restrictions. These had amplified the impact of the bushfires in directly and indirectly-affected communities, and there are indications that they had increased and compounded trauma. The advent of COVID-19 occurred at the critical sense-making point in their recovery process, where communities come together and start to reorganise and heal. The restriction of face-to-face interactions and confinement was described as amplifying pre-existing issues such as domestic violence, drug abuse and tensions within the communities, as well as psychosocial and economic impacts from the bushfires. It also meant that people were unable to provide physical comfort at a critical time.
There was also a lack of skills and awareness in government and those who interact and support communities with complex trauma which had exacerbated this. It is not clear whether or how this will reduce the capabilities of communities in the longer term. There are, however, agencies that work with these communities (such as non-government organisations who work globally in disaster recovery), and others who work in community development who have these skills, which can be leveraged.

Growing the seeds: recovery, strength and capability in Gippsland communities Page 40 of 145
The overarching challenge was that the community did not feel that been heard when they spoke, or that their communities and the strengths and capabilities within them were seen, respected or understood. There was also a general lack of understanding of risk ownership, which had resulted in a lack of clarity of the role and the responsibilities and accountabilities of the community in the emergency management process. This was felt to have constrained their ability to be empowered to act decisively. The lack of inclusion of the community in decision making and emergency management by government and emergency management organisations, prior to, during and following the fires, was also felt to have increased risks and hampered recovery.
Other themes related to relationships with government and support agencies and how they had been engaged and communicated with, and how support had been provided to them.
Key common challenges identified included:n A lack of understanding of differences between communities, community organisations, and the social and cultural
aspects within them, by those providing assistance. n The emergency management process and government decision making had not been inclusive of the community.n Distrust of government by the community and different priorities, values and understanding of risk between
government and the community.n Recovery programs had not accommodated the needs of different communities and cohorts within them. This
pertained particularly to those with language and literacy challenges, people who identified with a disability, the Aboriginal and CALD communities, and communities in rural and remote areas. This was reported as a barrier to some of those most in need to accessing programs and funding.
n The focus on online delivery and lack of consideration of the poor digital infrastructure and digital literacy in some communities, particularly in rural and remote areas.
n The communication and engagement processes were not suited to how the communities communicate, and there was little consideration of the specific cultural, contextual of physical needs of community members so they could participate.
n Tensions and fragmentation within and between communities, and a lack of knowledge as to the capabilities of some of the more diverse cohorts within these communities.
n The lack of experience and knowledge in relation to recovery, and the risks of natural hazards of those new to the region.

Growing the seeds: recovery, strength and capability in Gippsland communities Page 41 of 145
Community-based assets
Community-based assets
Community capabilitiesSixty-five specific community capabilities were identified by participants, and these fell into seven thematic areas: local knowledge, communication, networks, community leadership, business provision of support, and care and resilience. Community capabilities were elicited from the forum and interviews, coded and linked to the associated community-based assets participants had selected. These were then cross-referenced across capability system categories and themes. The categorisation focused on the function of capabilities within system (see ‘Capabilities systems’, below). Many of these capabilities are currently not formally included in emergency management processes, and a simple process has been provided that can be used as an addition to this in the future (see Appendix E).
Constraints of this assessmentThe responses have been elicited from a small sample group, so this not a comprehensive assessment. Its aim is to provide a starting point for understanding what type of community capabilities exist, their function in the capability system, and participants’ perceived status of these following the fires, which are summarised below. Community-based assets associated with these capabilities have been collated into the various capability categories, and are generalised. Some examples are contained in this summary, and detailed capabilities and community-based assets can be found in the ‘Mapping table’ in Appendix B.
The structure of the capability systemCapabilities exist in a structure and are interconnected, and they relate to and are dependent on each other (Figure 5). They have been assessed using the following criteria: n The recovery theme to which the capability pertained.n Capability category (Figure 6, p41).n Perceived status (Figure 8, p43).n Community-based assets associated with the capability (e.g., community hall, community groups, farmers).
Figure 5: Functionally-based community capability system
Communitystrengths(themes)
Know-how Structure
Attribute
Enabling

Growing the seeds: recovery, strength and capability in Gippsland communities Page 42 of 145
Capability system categories
Figure 6: Capability system categories
The category with the largest group of capabilities was enabling (32%) and structure (28%), with know-how (22%) and attribute (18%) the smaller ones. These were analysed as a system and included the function of the capability in the system and community-based assets associated with that capability. These were found to fall into the following four categories:
Structures: social and physical structures in place that support a specific community’s capabilities. This included social structures (e.g., organisations, committees, community leaders). It also included infrastructure (e.g., green infrastructure – trees, lakes, water), built infrastructure (e.g., radio networks and meeting places), economic infrastructure (e.g., social enterprises, small businesses and established industries), and social infrastructure (e.g., health providers, community organisations and networks). The largest distribution fell across provision of support and care (33%) and community leaders (28%). Communication, networks and business were all 11%, and resilience 6%.
Know-how: knowledge and expertise and the ability to use it practically. This category included capabilities such as communication (e.g., bureaucracy broking, storytelling); local knowledge (e.g., experience of bushfire recovery, day-to-day risk management, historical knowledge of the region); and resilience (e.g., business acumen and enterprise). The largest theme area was communication at 43%, with local knowledge 29%, and resilience and business both 14%.
Enabling: people or components that sit within the ‘system’, and are key to supporting and facilitating capabilities and strengths in communities. This category included different individuals and groups within the community (e.g., neighbours, artists, advocates, bureaucracy brokers, businesses, personal and business relationships), and informal networks (e.g., groups of interest and communication networks). It also included those who keep knowledge (e.g., community knowledge stewards). The largest theme area was local knowledge at 33%. Communication and business were both 19%, and networks 14%. Provision of support and care, community leadership, and networks were all 5%.
Attributes: qualities or traits that people, communities or organisations possess or contain. This category included capabilities such as being proactive, generosity, care, and being innovative/creative. These manifested at an individual and a community level. The same attribute could also apply to the community or a person. There were only two theme areas related to attributes, and their distribution was attributes (92%), and business (8%). The high level of attributes in the resilience theme is notable. There was a high level of attribute-based capabilities that are also the seen by the community as being the most important in terms of what makes them resilient and able to function.
Enabling
Structure
Know-how
Attribute
18%
32%
28%
22%

Growing the seeds: recovery, strength and capability in Gippsland communities Page 43 of 145
Community strength theme areasThe seven theme areas identified were business, communication, community leadership, local knowledge, networks, resilience, and provision of support and care (Figure 7). Not all themes contained all of the capabilities, and some of them had particularly high percentages of some capabilities.
Figure 7: Distribution of theme areas
The largest group of themes was related to resilience (28%), communication (18%), and know-how (17%). The remaining groups of networks, community leadership, business and provision of care had relatively even distribution, ranging from 8% to 11%.
ResilienceThe largest capability categories in this theme are attributes (61%) and enabling (22%). The high percentage of attributes was applied to communities and individuals. The structure capability was the natural environment. Know-how included capabilities such as organising and planning, and experience of previous recovery that related primarily to individuals rather than the whole community. Enabling capabilities were online and community connectivity, and financial resources.
Local knowledge Local knowledge capabilities only contained two of capability categories – enabling (64%) and know-how (36%). Know-how capabilities included biohazard management, land management skills, responding to events in the local area, experience of recovery, and day-to-day risk management. In terms of enabling capabilities, these included knowledge sharing networks, different types of local knowledge (e.g., knowledge of the community and local resources), and community knowledge stewardship.
CommunicationThe largest capability categories were know-how (55%) and enabling (27%). Know-how capabilities included communication skills such as listening, negotiation and storytelling. Enabling capabilities included those such as face-to-face communication, bureaucracy broking and trusted sources of information. There was also built infrastructure that supported radio networks.
Networks The two capability categories that pertained to this theme were enabling (60%) and structure (40%). Structure capabilities include built structures (e.g., cattle sale yards, offices, cafés, places of worship), and socioeconomic structures. Enabling capabilities included collaborative alliances and trusted relationships.
Resilience
Communication
Local knowledge
Provision of care and support
Business
Community leadership
Networks
9%
8%
28%
18%
17%
11%
9%
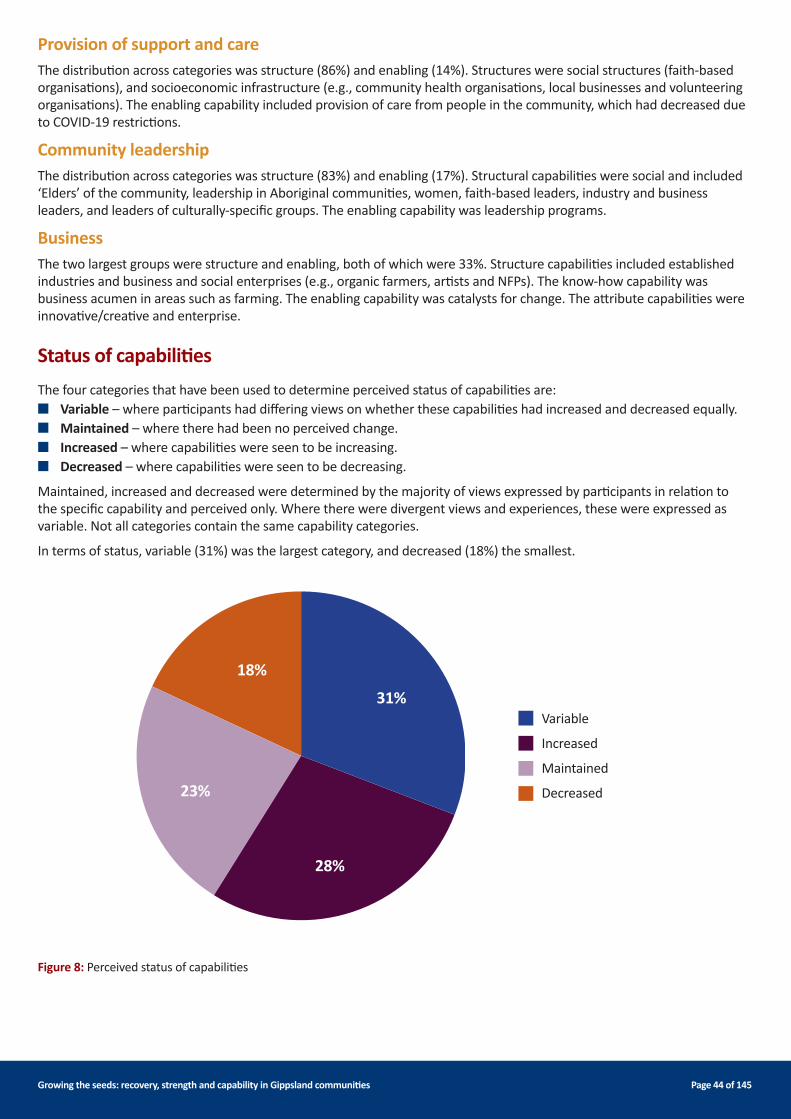
Growing the seeds: recovery, strength and capability in Gippsland communities Page 44 of 145
Provision of support and careThe distribution across categories was structure (86%) and enabling (14%). Structures were social structures (faith-based organisations), and socioeconomic infrastructure (e.g., community health organisations, local businesses and volunteering organisations). The enabling capability included provision of care from people in the community, which had decreased due to COVID-19 restrictions.
Community leadershipThe distribution across categories was structure (83%) and enabling (17%). Structural capabilities were social and included ‘Elders’ of the community, leadership in Aboriginal communities, women, faith-based leaders, industry and business leaders, and leaders of culturally-specific groups. The enabling capability was leadership programs.
Business The two largest groups were structure and enabling, both of which were 33%. Structure capabilities included established industries and business and social enterprises (e.g., organic farmers, artists and NFPs). The know-how capability was business acumen in areas such as farming. The enabling capability was catalysts for change. The attribute capabilities were innovative/creative and enterprise.
Status of capabilitiesThe four categories that have been used to determine perceived status of capabilities are:n Variable – where participants had differing views on whether these capabilities had increased and decreased equally.n Maintained – where there had been no perceived change.n Increased – where capabilities were seen to be increasing. n Decreased – where capabilities were seen to be decreasing.
Maintained, increased and decreased were determined by the majority of views expressed by participants in relation to the specific capability and perceived only. Where there were divergent views and experiences, these were expressed as variable. Not all categories contain the same capability categories.
In terms of status, variable (31%) was the largest category, and decreased (18%) the smallest.
Figure 8: Perceived status of capabilities
Variable
Increased
Maintained
Decreased
18%
31%
28%
23%

Growing the seeds: recovery, strength and capability in Gippsland communities Page 45 of 145
VariableThe distribution across the categories was attribute (30%), know-how (25%), enabling (25%), and structure (20%). The largest theme group was resilience (40%), with communication (19%) the other theme area of note.
Attribute capabilitiesCapabilities: caring, proactive, innovation, resourceful, independent, resourceful and adaptive.Attribute capabilities were highly variable and whether they increased or decreased was primarily attributed to the context and person, and often related to their ability to manifest this attribute. In some areas, these attributes (such as innovation and creativity) had been seen to increase in response to rethinking how things could be done and being able to capitalise on the current funding available. In others, it had decreased due to lack of ability to be proactive or adaptive due to COVID-19 restrictions. It is notable that examples favoured those who had the resources, skills and telecommunications infrastructure structure to do so.
Know-how capabilitiesCapabilities: knowledge of local relationships and knowledge-sharing networks of local knowledge, online community connectivity and local community relationships.Knowledge of local relationships were seen by some to have increased as people had made new connections following the fires. Some participants, however, reported a decrease in areas where there had been changes in the communities and lack of face-to-face contact. Knowledge-sharing networks had increased online but decreased in face-to-face interactions. In terms of local relationships, these were also variable, with some reporting local relationships had been maintained, and others reporting them to have decreased due to personal tensions between individuals, people moving away from the community, and COVID-19 restrictions. Online community connectivity was variable due to the patchy internet connections in the region and limited digital skills in some areas of the community.
Structure capabilitiesCapabilities: volunteering organisations and groups, established industries, small businesses, local networks (face-to-face contact), local health (provision of care) and social enterprises.Community-based organisations were seen to have declined. In terms of established industries in local regions, there was variability with some established industries (such as healthcare). This was seen as increasing due to demand, but decreasing in capacity to enact this at a community level due to a decrease in available access to clients and resources due to social distancing restrictions. Industries and businesses related to tourism and hospitality were seen to be decreasing due to COVID-19 restrictions, and a loss of infrastructure (such as the pathway to the lighthouse at Cann River). Some small businesses and social enterprises were seen to be increasing by those who had been able to either innovate or capitalise on the online opportunities. Provision of care in individual communities at the local level was seen as being maintained by some with telehealth, decreased by others, and increasing in relation to some individuals in communities.
Enabling capabilitiesCapabilities: local level planning, organising and coordination, listening skills, negotiation in the local community, storytelling, local knowledge of experience of bushfires.In terms of local level planning, organising and coordination in relation to emergency management in local areas, there was a perceived increase for longer-term planning and the formation of local planning committees. However, others perceived a decrease in capability due to impacts of the fires and COVID-19 restrictions, and exclusion from the process to be able to prepare for the next fire season. Local knowledge of bushfires was seen to have been maintained by some, but seen to have decreased by others due to people leaving and new people arriving in communities. It was also attributed to the emotional toll of the bushfires in some communities, and a loss of confidence in their experience due to the different nature of these fires.
Storytelling and sharing of stories was felt to have decreased in relation to face-to-face telling due to COVID-19 restrictions, and increased in the public telling of stories through mediums such as documentaries, newspaper articles, books and exhibitions. Listening skills and their capacity to listen had increased in some working in support roles. However, their ability to do this effectively had decreased due to lack of face-to-face contact during the COVID-19 restrictions, trauma in the local community, a reduction in capacity in community-based organisations due to resource constraints, and a reduction in volunteering.

Growing the seeds: recovery, strength and capability in Gippsland communities Page 46 of 145
Maintained The distribution across this group in relation to the capability categories was enabling (46%), structure (27%), and know-how (20%). There were no attribute capabilities in this category. The largest theme in this category was local knowledge (40%), with other themes being relatively evenly distributed.
Know-how capabilities Capabilities: technical knowledge, local knowledge of land management and experience of previous bushfires.As these were associated with specific individuals, they were seen as being maintained since the bushfires, but there was concern about their potential future decline due to people leaving the area and the ageing population.
Structure capabilities Capabilities: radio (built infrastructure), elders of the community, faith leaders and meeting places (built infrastructure).Faith leaders and leadership by elders of the community were felt to have been maintained. Built structure, such as meeting places and radio networks, had for the most part been maintained. However, this does not cover their ability to act effectively within these roles, simply that they had not changed in status.
Enabling capabilities Capabilities: trusted sources of information, leadership programs, local knowledge of individuals within communities, knowledge holders, knowledge of local environment and history of the region.Capabilities such as community knowledge stewardship, local knowledge of the environment, and history of the region were, for the most part, in the domain of long-term residents, and were felt to have been maintained by those who raised this. Trusted sources of information included local Facebook groups and ABC Radio. Leadership programs were also seen to have been maintained through online delivery.
Decreased The distribution across this group in relation to the capability categories was structure (50%), enabling (25%), and attribute (25%). There were no know-how capabilities that were considered to have decreased in terms of the knowledge that people had prior to the fires. The two prominent theme groups in this area were provision of care and support (50%) and resilience (46%).
Attribute capabilities Capabilities: supportive, physical stamina and emotional stamina.The declines in these attributes were primarily associated with the trauma and overall fatigue within communities who had been directly and indirectly affected. It was also notable that the desire to be supportive was present in all respondents, but the capability to enact this had been severely impacted by COVID-19 restrictions.
Structure capabilities Capabilities: provision of support and care from volunteering organisations, local community organisations, local industry and small businesses, and agencies supporting diverse communities (e.g., Aboriginal, CALD, and those who identify with a disability). The decrease in all these areas was related to COVID-19 restrictions, the impact of the bushfires, and inaccessibility issues with recovery programs. The natural environment pertains to those areas directly affected by the bushfires.
Enabling capabilities Capabilities: face-to-face (physical) communication and community connectivity, provision of care from community organisations and local businesses, and community gatherings.Community gatherings and face-to face communication had decreased due to COVID-19 restrictions. Provision of care by people in communities was seen to have decreased, primarily due to physical and emotional impacts from the bushfires, COVID-19 restrictions, and a reduction in external support services. The decrease in financial resources was attributed to accessibility issues with support programs, emotional and physical impacts of the bushfires, pre-existing vulnerability prior to the bushfires, and the COVID-19 lockdown that disrupted businesses and supply chains.

Growing the seeds: recovery, strength and capability in Gippsland communities Page 47 of 145
IncreasedThe distribution across this group in relation to the capability categories was know-how (34%), enabling (33%), structure (22%), and attribute (11%). In terms of thematic groups, communication (27%) was the largest group.
Attribute capabilities: compassion/empathy and generosity and kindness These were perceived to have increased from within communities and from those outside of them.
Structure capabilitiesCapabilities: women leaders, leadership in the Aboriginal community, business and industry leaders, and collaborative alliances.The increase in leaders and leadership was perceived at formal and informal levels, with new leaders ‘stepping up’ and others showing less visible leadership within their communities. The increase in leaders and leadership from diverse cohorts is notable.
Know-how capabilities Capabilities: business acumen, enterprise, advocacy, bureaucracy broking and risk management.The increase of skills with business acumen, advocacy, risk management of day-to-day risks were seen to be increasing in response to the novel risks and new situations that have emerged since the fires. Business acumen, in particular, was seen to be increasing due to an increase in relation to programs, and also people engaging with these programs. Enterprise was seen to be increasing in response to the COVID-19 restrictions and the ability to capitalise on the opportunities offered by online services. It was notable that where this had increased in business areas, people had the knowledge, skills and resources to do so. Advocacy was seen to be increasing due to the substantial impact of COVID-19 on these communities.
Enabling capabilities Capabilities: catalysts for change, newsletters and local news, online communication, local knowledge of health of the local community, external networks and online connectivity.The increase in networks external to the community was due to COVID-19 restrictions, and the change to online communication in communities (such as those in faith-based organisations and interest groups), led to a broadening out of external networks. It also led to increased online connectivity and communication in communities who had internet access, particularly in relation to Facebook groups. Regional collaborative alliances and people who were catalysts for change were seen to be increasing in line with the opportunity to be able to enact change as part of the recovery process. There was also a perceived increase in local knowledge of the health of those within their communities due to a heightened awareness following the bushfires.
SummaryThis analysis has illustrated the complexity of community capabilities, and that the devil is indeed in the detail. Applying a functional community development approach has shown that there is a need to look beyond categories of what things are and understand more fully what they do if they are to be actionable. It has also highlighted the independencies of the different capability groups, and a need for greater understanding as to what are pivotal community capabilities so that programs can be prioritised. Currently, there is not the data nor the mechanisms in place to support this.
The largest theme groups were resilience, communication and local knowledge. In relation to the distribution across themes, some themes had high concentrations of certain capabilities such as provision of support (86%), and structure capabilities and resilience, which had 61% of attribute capabilities. Local knowledge also contained 64% of enabling capabilities and communication 55% of know-how capabilities.
The largest group of capabilities related to enabling, and these were also the most critical to ensuring that the community had agency to enact and use the capabilities they had. These are not always obvious, but they are often the most critical. Having a high level of capabilities in one category did not always indicate their importance. This also illustrates the importance of mapping functional dependencies to identify where specific capabilities act as linchpins within the system. An example of this is face-to-face and physical capabilities associated with communication and provision of care, which underpinned the effectiveness of actions at the community level.
It is also interesting to note that strength-derived capabilities that were considered the most needed and important by the community were predominantly attribute capabilities that were strongly associated with resilience. What the interviews in the previous section highlight is that knowledge of these lies within communities, and that attribute and enabling capabilities particularly are largely invisible to those outside these communities.

Growing the seeds: recovery, strength and capability in Gippsland communities Page 48 of 145
The wealth of the capabilities and associated community-based assets that were elicited during this study show the potential that exists within these communities. It also shows the vulnerability of these communities, and the need to understand more fully where these exist in communities, ownership of these, where there are gaps, and those which are currently underutilised.
This assessment illustrates the importance of understanding the whole capability system. Also, the importance of consideration of these as part of the broader planning across the PPRR spectrum and the usefulness of community capability as an indicator. A basic process has been developed, which can be added into planning processes (Appendix F). The first step needed is to build data and knowledge of this area to support the process. This will need to be undertaken in close collaboration with these communities, and representation from different areas of the community will be needed if this is to be of value.
Needs and opportunities for recovery capabilityDuring the forum and interviews, the participants were asked what needs they believed would be key needs for their communities over the next five years in terms of recovery, and for building strength and capabilities in their communities. Sixty-two needs and 21 opportunities were identified. These have been collated and summarised under the seven themes below. The opportunities are listed below the identified needs to provide context and assist decision making. The ‘specific needs for different communities’ theme was the largest group (Figure 9), reinforcing the need for greater consideration and accommodation of these diverse needs in program delivery.
Figure 9: Distribution of opportunities needs for recovery and community capability
Specific needs for different communities
Emergency management
General community needs
Government and support agencies and organisations
Communication and engagement
Current recovery support
Inclusion
0 2 4 6 8 10 12 14 16 18
Emergency management1. Mechanisms that support ongoing learning between different communities, areas of government and emergency
management. 2. To determine the recovery strengths and capabilities of each community and emergency management capability
strengths and gaps across the Gippsland region. 3. To build and leverage existing skills, knowledge and capabilities in the communities to support better planning to
strengthen their ability to prepare, respond and recover from future complex and cascading events.4. Collaboration between local governments in the region to support recovery to build long-term regional strength and
capability and resources to support this.

Growing the seeds: recovery, strength and capability in Gippsland communities Page 49 of 145
5. Consideration of the potential future impacts and capability needs. To run scenarios to understand more fully the potential impacts on capabilities in relation of the following:> Long-term events such as the 2019–2020 fires, and the intersection with other potential shocks (COVID-19,
economic).> The implications of the ageing population in the East Gippsland region. > The changing environment within which these communities live, and who is living in them.
6. To understand the capability capacity in communities, particularly in relation to volunteering and service to the community, which underpins much of the response and recovery capability.
The following were raised as needed prior to events to support more effective recovery and capability-building:7. Authentic and inclusive collaboration where there is respectful community-led dialogue that supports constructive
interactions with communities.8. To establish working and trusted partnerships with the community to support better communication, coordination and
understandings of community needs and capacities across the PPRR spectrum.9. To develop shared understandings and expectations with communities, support agencies and government in relation
to what community needs can be realistically met, and what is possible in terms of capability, capacity, resourcing and funding.
10. Understanding of risk ownership, which includes recovery at the community level, and clearer delineation of responsibilities, accountabilities and the role of communities across the PPRR spectrum.
11. The building of trust between communities, government and emergency management agencies to enable the building of the long-term working partnerships.
12. Respecting, valuing and leveraging existing local knowledge and knowhow in these communities, particularly in relation to place-based activities across the PPRR spectrum.
13. To build local facilities and resources that will increase the capability of the community to be able to function with more autonomy to reduce local emergency management risk and manage long-term recovery.
14. Longer-term funding to provide certainty of support to the building of capability at the community level across the PPRR spectrum.
Opportunity 1: The development of a long-term plan (five years minimum) for building emergency management capability, which incorporates the above needs to provide a cohesive approach across the region, and more consistent and focused funding to support resourcing of this.
Opportunity 2: To develop, with communities, community-specific capability profiles through bottom-up mapping of capabilities and community-based assets.
Inclusion 15. For the community to be able to determine how they want to be included in the emergency management process, and
for this to be heard, respected and supported. 16. For there to be accommodation of the needs of diverse communities within the region in relation to accessibility and
the provision of additional support so they can participate and inform recovery.17. For the whole community to be included in decision making in a meaningful way that enables them to manage their
local environments. 18. For better inclusion and knowledge of the more diverse members of communities, and resources to support their
inclusion, particularly in relation to recent arrivals.
Opportunity 3: The further development of mechanisms, tools and governance to support the development of ways of working that include communities in decision making (e.g., deliberative democracy, engagement protocols and policy, statements of inclusion).
Opportunity 4: Development of support programs to enable better inclusion of diverse cohorts in the communities and engagement with emergency management agencies.
Current recovery support 19. Additional face-to-face support in communities that ensures that all members of the community have appropriate
support to enable them to access the programs and resources available through of the recovery programs.20. Accessible and practical information and responsive provision of this information so people are able to access funding,
financial support and the information they need.21. Consideration of the diversity of communities and the change in culture from one town to the next in program design
and roll out of programs and emergency management activities.
Growing the seeds: recovery, strength and capability in Gippsland communities Page 50 of 145
22. Further development of flexible structures and programs that can be adapted to suit specific community needs and contexts, which are informed by the community and include community capabilities.
23. For more resources to support the delivery of support by locally-based community organisations as the closest point of contact for local community members.
Opportunity 5: To ensure that these needs are captured and used to inform current and future programs.
Communication and engagement24. Inclusive, trauma and risk communication training for those working in public communication and support programs.25. For greater understanding from those outside the region in relation to who the community they are communicating is,
and how they need to be engaged and communicated with. 26. Safe spaces where community members can speak honestly and openly about their needs, and where they feel
respected, heard and understood. 27. Understanding of and respect for current informal communication systems and networks that exist within the
community, and how outside communication can be used to enhance this.28. The development of carefully facilitated conversations to build bridges between different cohorts through constructive
dialogue. These conversations need to happen at different levels (see Figure 1, p10), and be tailored to specific community contexts and capabilities.
29. For a deeper understanding of language and cultural nuances at the community level, and what information needs to be communicated, how this needs to be communicated, and who needs to be communicating it.
Opportunity 7: For government to develop communication and engagement capability through multi-layered forms of ongoing communication to create trust and understanding between communities and government of the communities’ needs for recovery and the actions they need support with.
Opportunity 8: To work with communities to identify where they have communication capabilities, and how they can be leveraged to enhance emergency management across the PPRR spectrum.
Opportunity 9: Skills development of frontline support employees in relation to the needs detailed above.
General community needs 30. Broader local community conversations about how risks are changing and what it means for communities.31. Improved continuity in provision of services to vulnerable community members.32. To build, value and leverage existing skills, knowledge and capabilities in the community to support better planning in
individual communities to strengthen their ability to plan, prepare, respond and recover from future events.33. To build skills in the local community so they are able to navigate and negotiate difficult conversations within, and
between, their own communities.34. Education for newer residents in the community about the environment and local risks to improve their ability to
effectively manage their situations.35. Diversification of the industries and support for social enterprises to improve resilience, and the development of new
economies and long-term community rejuvenation.36. Reliable and cost-effective digital infrastructure, particularly in remote and rural areas.37. To build community connectivity and collaborations that support rejuvenation and resilience-building to support longer-
term sustainable recovery.
Opportunity 10: To provide support so that communities are more effectively able to leverage current funding, external organisations, support agencies and expertise to the community in addressing the above needs. (It will be important to ensure that support offered is accessible and useable for communities and the various cohorts within them.)
Opportunity 11: To nominate a spokesperson or body for digital equity for the region to ensure that those in more isolated and under-resourced communities are not bypassed in relation to digital and telecommunications infrastructure.
Opportunity 12: Development of mechanisms in local organisations that support improved continuity of services to, and maintaining of trust in, communities.

Growing the seeds: recovery, strength and capability in Gippsland communities Page 51 of 145
Government, support agencies and organisations38. Authentic collaboration with the community and improved coordination and cohesion between government and
support agencies working with the community in recovery.39. To trust the community to manage themselves and to follow the community’s lead.40. Development of skills of those working with communities, particularly in relation to appropriate risk communication,
inclusive community engagement, and managing people who have experienced trauma.41. To reduce red tape and develop more flexible and agile processes that work with communities’ existing social structure,
community organisations and groups to support individuals.42. Understanding and respect for local knowledge and the role it has in decision making and risk management at the local
level.43. Consideration of the impact of policy on already vulnerable communities prior to implementation.44. For dialogue with government where the community feel they can discuss what their needs are and they are actively
listened to, which enables action.45. More context-specific engagement and ways of working to enable the development of the long-term working
partnerships that ‘work beside’ the communities.
Opportunity 13: The development of improved understanding of the community and ways of working between the community, government and recovery agencies.
Specific needs and opportunities for different communitiesPeople who identify with a disability community46. Accessible built infrastructure that accommodates the needs of this community in evacuation and recovery support
centres and decision making.47. Accommodation of specific communication needs that are not always considered (e.g., vision-impaired people cannot
use apps).
Opportunity 14: To provide ways of working that ensure the members of these communities are able to inform and influence planning and decision making in relation to recovery and the needs of their communities.
Small business community48. To build business acumen and capability in small businesses, particularly in relation to strategic and business continuity
planning and digital literacy.49. Reliable digital access and telecommunication infrastructure, particularly for small and more isolated communities.50. Inclusion in the emergency management decision making process.51. To identify further capability gaps beyond digital skills and continuity planning in local businesses to inform
development and leveraging of existing programs and external agencies, organisations and businesses to build capability in this area.
Opportunity 15: The development of partnerships, alliances and targeted training that support capability-building and resilience of local businesses.
Remote communities who are isolated 52. Reliable and cost-effective telecommunications infrastructure. 53. Inclusion in the development of specific plans that are tailored to their community needs.54. To understand where isolated communities in remote areas are, who lives in them, and key points of contact for those
communities.
Opportunity 16: Mapping of isolated communities in remote and rural areas and inhabitants to ensure when events happen, agencies know where these communities are located, and who is the primary contact for these communities.
Opportunity 17: The development of a process with communities to manage any future border closures more effectively and minimise the disruption to those living in close proximity.

Growing the seeds: recovery, strength and capability in Gippsland communities Page 52 of 145
Aboriginal community55. Safe, culturally-specific spaces where community members feel welcomed and understood.56. Community education in relation to cultural aspects of Aboriginal communities, and how existing knowledge of
bushfire management and cultural richness can contribute to building understanding and improved inclusion of these communities.
57. Dialogue between this community and emergency services to improve understanding of how to interact with this community in a more culturally appropriate way during and following emergencies.
Opportunity 18: To develop a culturally appropriate response plan that is informed by the Aboriginal community to ensure there is a shared understanding between the community, government and support agencies as to how emergency management of future events can be more effectively undertaken.
Arts community58. Infrastructure that supports the development of young artists to build future resilience.59. Development of business cases to support growth of the arts in this region.
Opportunity 19: The development of arts education infrastructure and programs to support rejuvenation of the economy and sustainability, and build the arts sector in the region.
CALD community60. Culturally appropriate and accessible information for specific cultural groups, particularly if they are new to the region
and lack understanding of local processes, and may have different understandings of natural hazard risk. 61. For local resources to support improved inclusion of recent arrivals, and mapping of local support capabilities in relation
to this.
Opportunity 20: Development of a body in East Gippsland that speaks for this community to advocate for the above.
Elderly members of the community62. To capture the local know-how and knowledge and wisdom of those who have lived in the region in relation to
resilience and management, response and recovery of natural hazards in the region.
Opportunity 21: Documenting of local knowledge and know-how in collaboration with the communities of East Gippsland.
SummaryThe needs identified in relation to capabilities are complex and reinforce the need for concurrent big and small actions. They reflect the previous lack of investment and understanding of communities’ capabilities, and the narrow focus that is often applied to capabilities within emergency management and government processes and assessments. It is important to understand the detail of different community contexts and the people within them for these to be salient and result in sustainable outcomes.
Implementing these is a sizeable task, and how these are prioritised will need to be negotiated collaboratively with communities, government, emergency management agencies and others who provide assistance. This will require a long-term approach and resourcing. It will also require the development of shared understandings and expectations as to what is possible and what can realistically be achieved within the constraints of all the parties involved across the PPRR spectrum.
Conclusion‘It’s very easy to despair. So we try not to use words like “lost”. We try to use words like “found” and “recovered”. And that’s what I’m looking at. I’m looking at recovery.’ — Bruce Pascoe, The Guardian, 2020
The East Gippsland communities are diverse and contain a richness of strengths and capabilities, which differ from community to community. Their experience of natural hazards and recovery, knowledge of their communities and the context in which they live, makes some people in these communities experts in recovery. Currently, capabilities within communities are an underutilised resource for government and the emergency services.
The added dimensions of the nature and longevity of these fires and advent of the COVID-19 pandemic were unanticipated, and the systems, approaches, capability or skills were not in place to guide the provision of support to these communities. It will be important to continue to learn from what has and has not worked, and to continue to learn from these communities’ experiences.

Growing the seeds: recovery, strength and capability in Gippsland communities Page 53 of 145
There are many strengths and challenges within these communities, and most of them stem from a lack of knowledge of these communities and a lack of structures and mechanisms to enable the collaboration needed between government, support agencies and the community to build this.
The less visible structures, enablers and attributes that underpin their communities are the strength that makes them resilient. They are also what is most important to the community and underpin community functioning. There is a need for greater consideration and inclusion of these in emergency management processes and recovery programs. The current lack of relevant data means that this will take time, and that new systems and understandings will need to be established to support the development of these. There is the potential to look to organisations that already have these capabilities, particularly those who have worked in humanitarian disasters overseas or have community development backgrounds.
Although this is an indicative study, it illustrates the value of focusing on community strengths and capabilities for recovery, and the need to better understand how they manifest in different communities, and how they are influenced and change through the recovery process. It also highlights the importance of focusing on function as opposed to just categorisation of types, and the potential usefulness of community capability and strengths as an indicator.
Recovery is a long-term prospect, and there is no single pathway to recovery. If communities are to lead their own recovery, it is critical to build the mechanisms and ways of working in with those who provide support to them for the longer term. It will also be important to negotiate with communities as to how they need to be listened to and communicated with, and how they want to, and can be, included in this process. A key aspect needed for this process is that communities need to be able to trust government to act, and the government need to trust communities to lead.
Community capabilities and strength are the foundation from which communities lead, and one that empowers them to do so. It also offers a constructive focus and practical collaborative pathway for government and support agencies to work with communities in the important and sometimes contentious issue of recovery and building resilience. These communities are at the coalface of recovery and new learnings will continue to emerge. The communities are context experts in their own recovery, and in sharing their experiences, they are showing us what they have learned and what is needed to support them.
n Community capabilities are currently an untapped potential, are poorly understood by emergency management, and government, and are not well represented in emergency management processes across the PPRR spectrum.
n The capabilities that are most important for communities and underpin community functioning are attribute and enabling capabilities. These are often not visible and often only known by the communities.
n The longevity of the fires and the advent of COVID-19 during the recovery process is unprecedented, and there are new community needs arising in relation to recovery. It is not known how this will impact community capability or agency in the longer term.
n There are strong indications that COVID-19 restrictions have amplified the impacts from the fire in those directly and indirectly affected. There is a need to build awareness of, and capability to, manage and negotiate with communities suffering trauma in those working and interacting with these communities.
n The was a lack of knowledge of the different local communities and the specific needs and cultural nuances, particularly in relation to diverse cohorts, and those in remote and rural areas. This has resulted in poor, and sometimes, inappropriate communication and programs that were not accessible to some of those most in need.
n Greater cohesion, collaboration and consistency is needed between, and within, government and agencies who provide support and communities following disasters.
n There is a need to establish risk ownership at the community level to clarify who is responsible and accountable during recovery, so they can build the capabilities needed to fulfil this in their local communities.
n It is important to listen and include the community. However, how they want to be listened to, and how they can and want to be included, and what is needed to enable this, is more important.
n Mapping of community capabilities and development of a five to ten-year plan that supports growth of capabilities in regional and rural areas in collaboration with communities is needed.

Growing the seeds: recovery, strength and capability in Gippsland communities Page 54 of 145
ReferencesAustralian Bureau of Statistics (ABS). (2017). Census of population and housing 2016. ABS, Canberra.
Allam, L., and Moore, I. (2020, 13 May). Wednesday its-time-to-embrace-the-history-of-the-country-first-harvest-of- dancing-grass-in-200-years? The Guardian. https://www.theguardian.com/artanddesign/2020/may/13/its-time-to- embrace-the-history-of-the-country-first-harvest-of-dancing-grass-in-200-years?CMP=share_btn_fb&fbclid=IwAR0lcesFm9p WzpdUc2leWsjwuTaT4LmbA3SqQRxin1--Tn8Um_wmj72rPhg Accessed 14 February 2021.
Arctic Climate Impact Assessment (ACIA). (2005). Arctic climate impact assessment, Cambridge University Press, London.
Bryant, R A., Gallagher, H C., Gibbs, L., Pattison, P., MacDougall, C., Harms, L., Block, K., Baker, E., Sinnott, V., Ireton, G. and Richardson, J., et al. (2017). Mental health and social networks after disaster, American Journal of Psychiatry, 174(3), 277– 285. doi:10.1176/appi.ajp.2016.15111403
Bushfire and Natrual Hazards Cooperative Research Centre (BNHCRC). (2019). Australian seasonal bushfire outlook: August 2019. Hazard Note Issue 63. BNHCRC, Melbourne.
Bushfire Recovery Victoria (BRV). (2021, 22 February). Homepage. Victoria State Government. https://www.vic.gov.au/ bushfire-recovery-victoria Accessed 3 March 2021.
Cilali, M. (2020). Mallacoota time. Echo Books.
Davidson, M J., and Fielden, S L. (2004). Individual diversity and psychology in organizations. John Wiley DeWolfe, D J. (2000). Training manual for mental health and human service workers in major disasters (2nd edn). Centre for Mental Health Services, US Department of Health and Human Services, Washington D.C. https://www.hsdl.org/?view&did=4017 Accessed 12 April 2021.
Dibley, G., Mitchell, L., Ireton, G., Gordon, R., and Gordon, M. (2019). Government’s role in supporting community-led approaches to recovery, Department of Health and Human Services, Victoria.
East Gippsland Bushfire Recovery Committee (EGRC). (2020). East Gippsland Bushfire Recovery Committee Chair’s Report, p43. East Gippsland Shire Council, Victoria.
Gallagher, H C., Gibbs, L., Pattison, P., Forbes, D., Block, K., Harms, L., MacDougall, C., Kellett, C., Ireton, G., and Bryant, R. (2017). Dyadic effects of attachment on mental health: couples in a post-disaster context. Journal of Family Psychology.
George, A S., Scott, K., Mehra, V. and Sriram, V. (2016). Synergies, strengths and challenges: findings on community capability from a systematic health systems research literature review. BMC Health Services Research, 16(7), 47–59.
Gibbs, L., Bryant, R., Harms, L., Forbes, D., Block, K., Gallagher, H C., Ireton, G., Richardson, J., Pattison, P., MacDougall, C., Lusher, D., Baker, E., Kellett, C., Pirrone, A., Molyneaux, R., Kosta, L., Brady, K., Lok, M., Van Kessell, G., Waters, E. (2016).Beyond Bushfires: Community Resilience and Recovery Final Report. University of Melbourne, Victoria, Australia.
Gordon, R. (2006). Acute responses to emergencies: findings and observations of 20 years in the field, Australian Journal of -Emergency Management, 21(1), 17–23.
Intergovernmental Panel on Climate Change (IPCC). (2012). Managing the risks of extreme events and disasters to advance climate change adaptation. A special report of Working Groups I and II of the Intergovernmental Panel on Climate Change, Special Reports, Cambridge, UK and New York, USA, Cambridge University Press, Cambridge.
Jones, R N. (2012). Detecting and attributing nonlinear anthropogenic regional warming in southeastern Australia. Journal of Geophysical Research, 117(D4), D04105.
Jones, R N., Young, C K., Handmer, J., Keating, A., Mekala, G D., and Sheehan, P. (2013). Valuing adaptation under rapid change, National Climate Change Adaptation Research Facility, Queensland.
Kübler-Ross, E. (1969). On death and dying. Macmillan, New York.
MacDonald, F. (2020). Building resilience: understanding the capabilities of diverse communities, BNHCRC, Melbourne.
McKnight, J., and Kretzmann, J. (1990). Mapping community capacity. Evanston, IL: Asset-Based Community Development Institute, Northwestern University.
Morley, P., Barclay, E., and Parsons, M. (2020). Barriers and enablers in the long-term recovery of communities affected by natural hazards: a review of the literature, Institute for Rural Futures, University of New England Armidale, New South Wales.
National Bushfire Recovery Agency. (n.d.) About us, Commonwealth Government of Australia. Accessed 27 January 2021 from: https://www.bushfirerecovery.gov.au/agency
Growing the seeds: recovery, strength and capability in Gippsland communities Page 55 of 145
Nigg, J M. (1995). Disaster recovery as a social process, Disaster Research Center, University of Delaware Newark, DE 19716 USA
North, C S., and Westerhaus, E T. (2003). ‘Applications from previous disaster reseach to guide mental health interventions after the September 11 attacks’. In Ursano, R. S., Fullerton, C. S. and Norwood, A. E. (Eds). (2003). Terrorism and disaster: individual and community mental health interventions, 93–106. Cambridge University Press, Cambridge.
Pyke, J. (2018). Building capability in emergency services: diversity and inclusion in communities, BNHCRC, Melbourne.
REMPLAN. (2020). REMPLAN economy. Compelling Economics, Bendigo. https://app.remplan.com.au/
Richardson, J F., Baker, E., Gallagher, H C., Gibbs, L., Block, K., Lusher, D., Kellett, C., MacDougall, C., Harms, L., and Smith, M. (2017). ‘Separation and reunification in disasters The importance of understanding the psychosocial consequences,’ in Awotona, A (Ed.). Planning for community-based disaster resilience worldwide: learning from case studies in six continents, 357–372. Routledge. doi:10.4324/9781315600734
Sandelowski, M. (1995). Qualitative analysis: what it is and how to begin. Research in Nursing and Health, 18, 371–375. doi:10.1002/nur.4770180411
Satir, V., and Banmen, J. (1991). The Satir model: family therapy and beyond. Science and Behavior Books
Taylor, D., and Goodman, H. (2015). Towards place-based and community-led disaster preparedness responsiveness recovery and renewal, Melbourne Catholic Care.
United Nations Office for Disaster Risk Reduction (UNISDR). (2015). Sendai framework for disaster risk reduction 2015– 2030, UNISDR, Geneva.
Wagner, J., Frisch, M., and Fields, B. (2008). Building local capacity: planning for local culture and neighborhood recovery in New Orleans. Cityscape, 10(3), 39–56. Retrieved 13 March 2021 from: http://www.jstor.org/stable/20868669
Young, C., Symons, J., and Jones, R N. (2015). Whose risk is it anyway? Desktop review of institutional ownership of risk associated with natural hazards and disasters, BNHCRC, Melbourne.
Young, C., Jones, R N., and Symons, J. (2016). Understanding values at risk and risk ownership workshop synthesis report, Victoria Institute of Strategic Economic Studies, Victoria University and BNHCRC, Melbourne.
Young, C., Jones, R N., Kumnick, M., Christopher, G., and Casey, N. (2017). Risk ownership framework for emergency management policy and practice. BNHCRC, Melbourne, and VISES, Victoria University
Young, C. (2018a). Working from the inside out to improve research utilisation in decision making, AFAC Conference proceedings 2018. BNHCRC, Melbourne.
Young, C., Jones, R N., and Kumnick, M. (2018b). The long road: building effective diversity and inclusion in emergency management organisations. Case study synthesis and draft framework. BNHCRC, Melbourne.
Young, C., Cormick, C. and Jones, R N. (2020). Learning as we go: developing effective inclusive management – case studies and guidance. BNHCRC, Melbourne.

Growing the seeds: recovery, strength and capability in Gippsland communities Page 56 of 145
A comparative analysis of bushfire recovery experiences amongst diverse communities in Victoria and New South Wales

Growing the seeds: recovery, strength and capability in Gippsland communities Page 57 of 145
This section presents the results of an online survey conducted in New South Wales and Victoria (Gippsland), through established community panels, of those impacted by the bushfires. The questions were derived from the key themes that were elicited from the online community workshop undertaken on 20 September 2020.
The survey was analysed across the following categories:n The geographical location (NSW and Victoria)n Those directly and indirectly impactedn The CALD community and people who identify with a disability.
The aim was to understand if community members experiences and perceptions were shared or differed in the above categories in relation to:n Who they considered to be ‘their community’ and the eventn Their communities, strengths and challenges during and following the firesn What community strengths were considered important for the future communication needs.
MethodologyThe survey was conducted in October 2020 across 614 inhabitants of fire-affected regions of Victoria and NSW. The two states were chosen to allow for a comparative analysis of findings, with 31% of respondents coming from Victoria and 69% from NSW.
Participants in the survey were selected from postcodes that had been affected by the bushfires of 2019–2020, who were then filtered by whether they had been affected directly, indirectly or not at all – with those not affected at all not being included in the study. Participants were then asked 11 questions relating to communications, personal and community resilience and their attitudes towards the future.
There were some significant differences between those who stated they had been directly impacted by the bushfires to those who said they were indirectly impacted, which is discussed in the analysis. While the total survey responses were 34% directly impacted and 66% indirectly impacted, for NSW this was 64% directly impacted and 36% indirectly impacted, and for Victoria it was 28% directly impacted and 72% indirectly impacted (Figure 10).
The gender breakdown was male (47%) and female (53%), while 18% identified as having a disability, and 23% identified with a cultural background. Seven individuals identified as having an Indigenous background, which was deemed too low for statistical significance in a survey, but more qualitative work with this cohort might provide important insights.
There was relatively even distribution of groups (17%–21%) related to age of respondents distributed across the 31–40, 41–50, 51–60, and 61–70 age bracket. The smallest groups of respondents were in 18–24 year age bracket (3%), 25–30 (7%) and over 70 (13%). The length of time people had lived in their community was also broad, with the largest percentage (29%) having lived in their current location for over 20 years, and the smallest (6%) having lived in their current location for one year or less.
Figure 10: Impacted by the fires
Total
66%
34%
64%
36%
72%
28%
NSW VIC
Indirectly impacted (e.g., business and life disrupted, friends or relatives directly impacted)
Directly impacted (e.g., evacuated or lost property)

Growing the seeds: recovery, strength and capability in Gippsland communities Page 58 of 145
Overall findingsAmongst the key findings, almost two thirds of respondents consider the recent bushfires were a lot different compared to previous ones (Figure 11). When asked in an open-ended question ‘In what way were the fires different’, the majority of responses related to the fires’ severity and impact, citing them being more devastating, more widespread, with more people affected and the fires lasting longer.
Figure 11: Do you feel that the recent bushfires were different to previous bushfires?
Figure 12: What strengths do you think your community showed following the bushfires?
A lot (65%)
A little (26%)
Not at all (9%)
When asked questions relating to their community and community resilience (Figure 12), respondents said that the strengths their community showed following the bushfires included generosity and kindness (69%), resilience (61%) and active volunteering (59%) – all rating above 50%.
69%61% 59%
44% 39% 36% 34% 32% 31%
13% 11%
Generosity a
nd kindness
Resilience
Active
volunteerin
g
Socia
l connecti
ons
Fundrai
sing
Shari
ng knowledge
Organisa
tion skills
Strong l
eadersh
ip
Collaborati
ng
Creativit
y
Enterpris
ing

Growing the seeds: recovery, strength and capability in Gippsland communities Page 59 of 145
When asked what were the main challenges they had faced since the bushfire (Figure 13), COVID-19 was the main challenge (49%), followed by damage to the environment (39%), anxiety (31%) and overall fatigue (26%).
Figure 13: What are the main challenges you have faced since the bushfires?
Figure 14: How well were you communicated with after the bushfires?
49%
39%
31%
26%
20%18%
14% 13%10% 9% 8% 6% 5% 5%3% 3%
COVID-19 impact
s
Damag
e to th
e environment
Anxiety
Overal
l fatigu
e
Being iso
lated
Not being a
ble to co
nnect to others
Lack o
f money
Not enough
people offering t
he right h
elpIlln
ess
Not being a
ble to ge
t basi
c nece
ssities
Not being a
ble to co
nnect to other d
ue to la
ck of in
ternet
Conflict
Too m
any p
eople offering h
elp
Discrim
ination
OtherNone
Considering the information they had received after the bushfires (Figure 14), almost 45% of the respondents considered they got the right information at the right time, while 20% felt they got confusing information from too many different sides, and 17% felt they got the right information but not at the right time. Only 9% felt they did not get enough information, and 5% considered they received too much information.
The right information
at the right time
Confusing information
from too many different organisations
The right information
but not at the right time
Not enough information
Too much information
Other None/ not needed
45%
20% 17%9%
5%1% 2%

Growing the seeds: recovery, strength and capability in Gippsland communities Page 60 of 145
Participants were then asked what was most important to them right now (Figure 15). The largest responses were for family (80%) and health (63%), with a consensus across all groups. Next, mentioned by more than a third, were myself (41%), having a home (39%) and mental health (37%). Rated slightly lower, but significant to around a third of respondents were putting food on the table (32%), employment (29%) and money (29%).
Figure 15: What is most important to you at the moment?
80%
63%
41% 39% 37% 32% 29% 29%20% 18% 16%
My fam
ilyHealt
hMyse
lf
Having a
home
Mental healt
h
Putting food on th
e table
Employm
ent
Money
Access
to inform
ation
Internet acce
ss
Access
to support
Government agencies were nominated as the authority respondents would most like to communicate with them about their needs, with state government agencies being the most cited (55%), followed by local government (48%) and federal government (47%). The next two highest cited were community groups (29%) and emergency services groups (25%).
Preferred communication methods cited email (49%) and traditional mass media (TV and radio, 42%) as the preferred means by which people would like to be informed. This was followed by family (27%), community meetings (23%) and local community members (21%). Apps on a phone were only cited by 19%, which was the same response level for friends, face-to-face at community centres and through the post.
When asked about their attitudes towards the future, 45% of the respondents felt positive or very positive about the future. However, a little over 25% stated they were anxious, and 6% stated they were very worried. 28% stated they were neither positive nor anxious (Figure 16).
Figure 16: When you think of the next five years do you feel … ?
Positive
Neither positive nor anxious
Anxious
Very positive
Very worried
10%
6%
35%
28%
20%

Growing the seeds: recovery, strength and capability in Gippsland communities Page 61 of 145
Respondents were next asked what words best described their community towards the end of 2020 (Figure 17), with hopeful (37%) and resilient (29%) the top two words selected from a list of 13 prompted responses, followed by recovering (29%) and fatigued (24%). Positive and negative responses tended to alternate down the rest of the list, with other words such as stronger (22%), anxious (19%), financially troubled (17%), worried (16%) and more collaborative (10%).
Figure 17: What words best describes your community towards the end of 2020?
Figure 18: What strengths do you think are most needed by your community now?
37%
50%
29%
46%
29%
45%
24%
37%
22%
37%
19%
31%
17%
28%
16%
27%
10%
26%
7%
17%
5%
11%
7%
15%
2%
Hopeful
Generosity a
nd kindness
Resilient
Compassion
Recove
ring
Resilience
Fatigu
ed
Socia
l connecti
ons
Stronge
r
Strong l
eadersh
ip
Anxious
Shari
ng knowledge
Finan
ically
troubled
Collaborati
ng
Worried
Active
volunteerin
g
More colla
borative
Organisa
tional ski
lls
Fearf
ul
Creativit
y
Far fro
m reco
verin
g
Enterpris
ing
Less
strong t
han previo
usly
Fundrai
sing
In conflict
The final question was what strengths did respondents feel their community needed right now (Figure 18), and the most often cited words were generosity and kindness (50%), compassion (46%) and resilience (45%). Other responses included social connections (37%), strong leadership (37%), sharing knowledge (31%) and collaborating (28%). The lowest responses were for creativity (17%), enterprising (15%) and fundraising (11%).

Growing the seeds: recovery, strength and capability in Gippsland communities Page 62 of 145
Comparisons of those directly and indirectly impacted by the bushfiresPeople directly impacted by the fires are more likely to consider them a lot different to the previous ones (71%), compared to those impacted indirectly (63%).
While family and people who live in the same location both rated the highest for people’s definition of community, both were lower for those who were indirectly impacted by the fires. Those who were indirectly affected by the fires rated people who share common interests as their community (17%), much higher than those directly impacted by the fires (9%) (Figure 19).
Figure 19: Who do you consider your community?
My fam
ily
People who liv
e in th
e
same lo
cation as
me
People I share
common
interests an
d activiti
es with
Online fri
ends
People who do sim
ilar w
ork
to me, o
r those I w
ork with
Directly impacted Indirectly impacted
44% 42%
9%4% 2% 1% 3%
17%
36%41%

Growing the seeds: recovery, strength and capability in Gippsland communities Page 63 of 145
Respondents who were indirectly impacted found their communities to be more generous and kind (72% compared to 63%) and involved in fundraising (45% to 26%), while those directly impacted rated creativity higher (17% to 11%) and enterprising also higher (16% to 9%) as words used to describe their communities (Figure 20).
Figure 20: What strengths do you think your community showed following the bushfires?
63%
63%60%
60%
43%
45%
35%
35%
31%
32%
11%
9%
57%
46%
26%
37%
34%
35%
29%
17%
16%
72%Generosity and kindness
Resilience
Active volunteering
Social connections
Fundraising
Sharing knowledge
Organisational skills
Strong leadership
Collaborating
Creativity
Enterprising
Directly impacted Indirectly impacted

Growing the seeds: recovery, strength and capability in Gippsland communities Page 64 of 145
People who were directly impacted by the fires tended to cite more challenges than those indirectly impacted, and they also cited damage to the environment as a bigger challenge (42%) than COVID-19 (41%) in importance, with anxiety (40%) and overall fatigue (33%) also being more significant challenges for those directly impacted. For those indirectly impacted, COVID-19 was the single biggest impact (53%), which was followed by damage to the environment (38%), anxiety (27%) and overall fatigue (18%), all at lowers levels than those directly impacted (Figure 21).
Figure 21: What are the main challenges you have faced since the bushfires?
41%
42%38%
27%
22%
18%
18%
20%
21%
18%
11%
9%
9%
14%
12%
10%
9%
5%
10%
6%
6%
4%
2%
1%
40%
33%
24%
53%COVID-19 impacts
Damage to the environment
Anxiety
Overall fatigue
Being isolated
Not being able to connect to others
Lack of money
Not enough people offering the right help
Illness
Not being able to get basic necessities
Not being able to connect to others
Conflict
Too many people offering help
Discrimination
Directly impacted Indirectly impacted

Growing the seeds: recovery, strength and capability in Gippsland communities Page 65 of 145
Those who were directly impacted by bushfires were much less likely to say that they got the right information at the right time (35%) compared to those only indirectly impacted by the fires (50%), and were more likely to state that they received confusing information from too many organisations (25% to 17%). There were very few differences in who those directly or indirectly impacted felt should communicate with them about their issues, with both groups citing state government (55%), local government (47%) and federal government (47%. There was also the same response for community groups (29%), but slight preference for those indirectly impacted to cite emergency services groups (27% to 23%). Looking at how people would prefer to be communicated with, people who were directly impacted by the fires preferred to receive their information more from their family (33% to 24%), in community meetings (29% to 20%) and newspaper (21% to 14%) compared to those indirectly impacted.
When asked how they felt about the next five years, those directly impacted by the bushfires were more likely to be very positive (15% very positive compared to 8%) and less anxious (16% compared to 22%). There were similar responses to how directly impacted and indirectly impacted communities chose to describe their communities towards the end of 2020, however people impacted directly by the fires are more likely to state fearful (13% to 4%) to describe their communities than those indirectly impacted – though at relatively low levels, while financially troubled (20% to 13%), was more highly rated by communities indirectly impacted than those directly impacted (Figure 22).
39%
30%
28%
24%
25%
22%
24%
20%
20%
17%15%
10%10%
13%
5%
3%
4%
4%
7%
6%
2%
13%
18%
37%
29%
29%
Hopeful
Resilient
Recovering
Fatigued
Stronger
Anxious
Financially troubled
Worried
More collaborative
Fearful
Far from recovering
Less strong than previously
In conflict
Figure 22: What words best describes your community towards the end of 2020?
Directly impacted Indirectly impacted

Growing the seeds: recovery, strength and capability in Gippsland communities Page 66 of 145
When asked what strengths they thought were most needed by their community now, people impacted directly by the fires felt their communities needed more active volunteering (34%) compared to those indirectly affected (24%), who said their communities need more generosity and kindness (54% to 43%). There were also differences in responses to compassion (42% directly impacted and 47% indirectly impacted) (Figure 23).
Figure 23: What strengths do you think are most needed by your community now?
43%
42%
43%
35%
36%
28%
29%
34%
54%
47%
45%
38%
37%
32%
28%
24%
26%
19%
15%
10%
15%
11%
26%
16%
Generosity and kindness
Compassion
Resilience
Social connections
Strong leadership
Sharing knowledge
Collaborating
Active volunteering
Organisation skills
Creativity
Enterprising
Fundraising
Directly impacted Indirectly impacted

Growing the seeds: recovery, strength and capability in Gippsland communities Page 67 of 145
Victorian and NSW comparisonsWhen examining the comparisons in the responses between Victoria and New South Wales, several findings stood out, including that NSW respondents were more likely to state that the recent bushfires were different to previous bushfires (70% stated a lot in NSW, compared to 56% in Victoria, and 65% for the survey average). This acknowledges that different locations can have different experiences – driven by factors such as differing demographic, cultural or geographic factors, as well as the lengths, size, scale and timelines of the bushfires in those areas. It also accords with the general assessment that NSW was more heavily impacted by the bushfires of 2019–20 than Victoria (Research Papers: Bushfires 2019–20, Parliament of Victoria).
There were also significant differences in relation to what strengths respondents felt their community showed following the bushfires, with Victorians rating higher across all question options. This indicates that the Victorian experience was different in some ways to that of NSW, which needs to be fully understood through more qualitative interviews and analysis. For instance, for generosity and kindness, NSW responses were 67% while Victorian were 74%. For resilience, NSW rated 58% and Victoria 68%, for social connections NSW rated 43% and Victoria 47%, for fundraising NSW rated 34% to Victoria’s 49%, and for sharing knowledge NSW rated 34% and Victoria rated 40%.
Victorian respondents also rated high on organisational skills (32% NSW to 39% Victoria), strong leadership (31% NSW to 34% Victoria), collaborating (30% NSW to 34% Victoria), creativity (11% NSW to 17% Victoria) and enterprising (11% NSW to 13% Victoria) (Figure 24).
Figure 24: What strengths did your community show following the bushfires?
67%
58%
55%
43%
34%
34%
32%
31%
30%
11%
11%
74%
68%
68%
47%
49%
40%
39%
34%
34%
17%
13%
Generosity and kindness
Resilience
Active volunteering
Social connections
Fundraising
Sharing knowledge
Organisation skills
Strong leadership
Collaborating
Creativity
Enterprising
New South Wales Victoria

Growing the seeds: recovery, strength and capability in Gippsland communities Page 68 of 145
When examining the main challenges since the bushfires, ratings were fairly close between NSW and Victoria, with the notable exception of COVID-19 impacts (44% NSW to 59% in Victoria), and damage to the environment (42% NSW and only 33% in Victoria) (Figure 25). This dichotomy of results is likely to be explained by the COVID-19 lockdown in Victoria and its impact on respondents, but that would need to be confirmed by independent research.
Figure 25: What are the main challenges you have faced since the bushfires?
44%
42%
32%
27%
20%
17%
15%
14%
10%
9%
9%
6%
5%
59%
33%
30%
24%
21%
19%
14%
11%
8%
7%
5%
5%
3%
3%3%
COVID-19 impacts
Damage to the environment
Anxiety
Overall fatigue
Being isolated
Not being able to connect to others
Lack of money
Not enough people offering the right help
Illness
Not being able to get basic necessities
Not being able to connect to others
Conflict
Too many people offering help
Discrimination
New South Wales Victoria
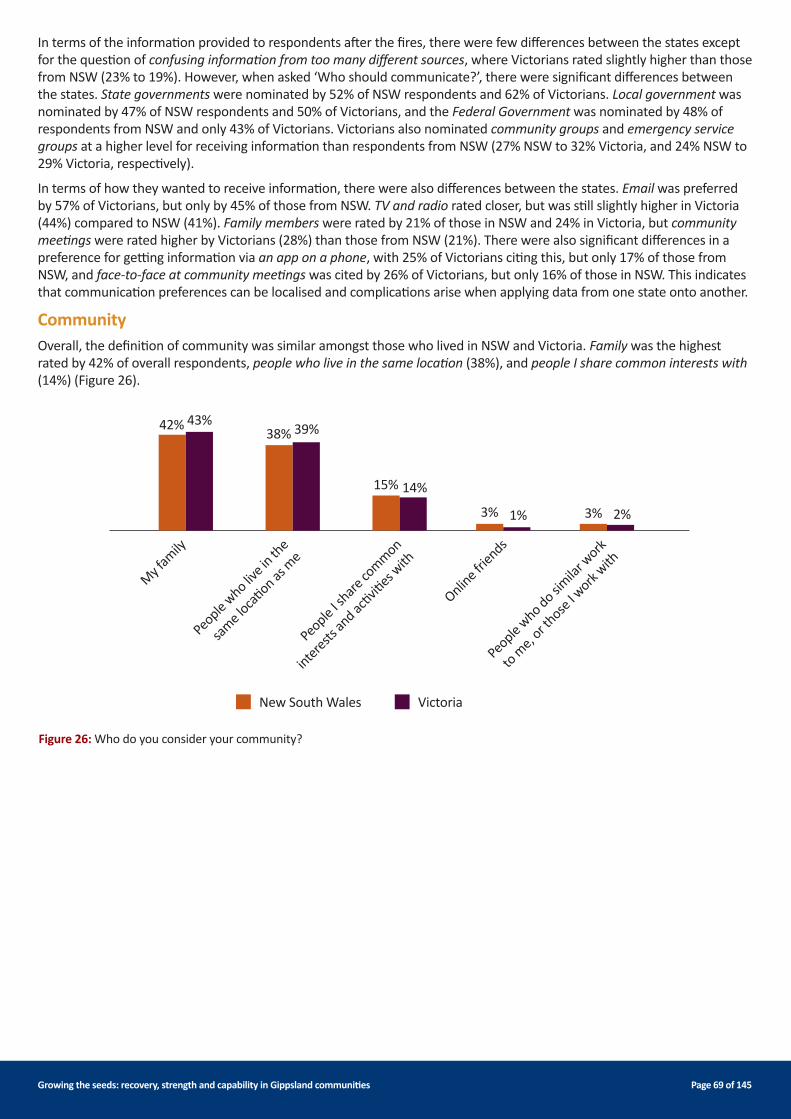
Growing the seeds: recovery, strength and capability in Gippsland communities Page 69 of 145
In terms of the information provided to respondents after the fires, there were few differences between the states except for the question of confusing information from too many different sources, where Victorians rated slightly higher than those from NSW (23% to 19%). However, when asked ‘Who should communicate?’, there were significant differences between the states. State governments were nominated by 52% of NSW respondents and 62% of Victorians. Local government was nominated by 47% of NSW respondents and 50% of Victorians, and the Federal Government was nominated by 48% of respondents from NSW and only 43% of Victorians. Victorians also nominated community groups and emergency service groups at a higher level for receiving information than respondents from NSW (27% NSW to 32% Victoria, and 24% NSW to 29% Victoria, respectively).
In terms of how they wanted to receive information, there were also differences between the states. Email was preferred by 57% of Victorians, but only by 45% of those from NSW. TV and radio rated closer, but was still slightly higher in Victoria (44%) compared to NSW (41%). Family members were rated by 21% of those in NSW and 24% in Victoria, but community meetings were rated higher by Victorians (28%) than those from NSW (21%). There were also significant differences in a preference for getting information via an app on a phone, with 25% of Victorians citing this, but only 17% of those from NSW, and face-to-face at community meetings was cited by 26% of Victorians, but only 16% of those in NSW. This indicates that communication preferences can be localised and complications arise when applying data from one state onto another.
CommunityOverall, the definition of community was similar amongst those who lived in NSW and Victoria. Family was the highest rated by 42% of overall respondents, people who live in the same location (38%), and people I share common interests with (14%) (Figure 26).
Figure 26: Who do you consider your community?
My fam
ily
People who liv
e in th
e
same lo
cation as
me
People I share
common
interests an
d activiti
es with
Online fri
ends
People who do sim
ilar w
ork
to me, o
r those I w
ork with
New South Wales Victoria
42% 38%
15%
3% 3%
43% 39%
14%
1% 2%

Growing the seeds: recovery, strength and capability in Gippsland communities Page 70 of 145
While definitions of community were similar, the experiences of them differed in several respects. When asked ‘What strengths they felt were most needed by their community now?’, there were generally higher responses from Victoria compared to NSW across almost all answers. Generosity and kindness (56% to 48%), compassion (54% to 42%), resilience (46% to 44%), social connections (39% to 36%), strong leadership (44% to 34%), sharing knowledge (34% to 29%), active volunteering (30% to 26%), organisational skills (32% to 23%) and creativity (25% to 14%) (Figure 27).
Figure 27: What strengths did your community show following the bushfires?
69%
58%
55%
43%
34%
34%
32%
31%
30%
11%
11%
74%
68%
68%
47%
49%
40%
39%
34%
34%
17%
13%
Generosity and kindness
Resilience
Active volunteering
Social connections
Fundraising
Sharing knowledge
Organisation skills
Strong leadership
Collaborating
Creativity
Enterprising
New South Wales Victoria

Growing the seeds: recovery, strength and capability in Gippsland communities Page 71 of 145
When asked what words best described their community towards the end of 2020, Victorians were less hopeful (35% to 38%), but more resilient (38% to 26%) and recovering (32% to 28%). They were, however, also more fatigued (27% to 23%) and financially troubled (16% to 21%) (Figure 28).
38%
26%
28%
23%
21%
20%
16%
16%
10%
8%
7%
5%
3%
10%
6%
5%
7%
2%
35%
38%
32%
27%
23%
19%
21%
14%
Hopeful
Resilient
Recovering
Fatigued
Stronger
Anxious
Financially troubled
Worried
More collaborative
Fearful
Far from recovering
Less strong than previously
In conflict
Figure 28: What words best describes your community towards the end of 2020?
New South Wales Victoria
Looking toward the next five years, Victorians felt a little more anxious and worried than those in NSW (32% to 24%) and were less positive (38% to 49%), and also cited mental health as a bigger issue than those in NSW did (44% to 34%).
Growing the seeds: recovery, strength and capability in Gippsland communities Page 72 of 145
Analysis by respondents who identify with a disability and those from CALD backgrounds
Concerns and anxietiesThe survey found that people from CALD backgrounds tended to have different needs and expectations than respondents from non-CALD backgrounds. When asked what were the main challenges they had faced since the bushfires (Figure 29, overleaf), people living with a disability (18% of total survey respondents, which is the same percentage of the population as reported by the Australian Institute of Health and Welfare) responded much more with anxiety (41% compared the survey average of 31%), being isolated (29% compared to the survey average of 20%) and not being connected to others physically (27% compared to the survey average of 18%).
When asked how they felt about the next five years, people who identify with a disability were much more likely to state they were very worried or anxious (40% combined, compared to the survey average of 26%), and were much less likely to state they felt positive or very positive (32% combined, compared to the survey average of 45%).
These were similar to the results from respondents who stated they had shared a CALD background (23% of respondents from the total survey). For instance, when asked what were the main challenges they had faced since the bushfires, 39% stated anxiety (compared to 41% for respondents who identify with a disability and 31% for the survey average). The heightened levels of anxiety amongst members of CALD communities represent a need for further investigation to determine ways in which these levels of anxiety might be addressed.
When asked what they felt about the next five years, people who identify with a disability were markedly different in their response to those from CALD backgrounds, who tended to be closer to the total survey responses. For instance, 40% of respondents who identify with a disability felt worried or anxious compared to the survey average of 26% (29% of people from CALD backgrounds), and only 32% felt positive, compared to the survey average of 45% (43% for respondents who identify with a disability).
When asked what was the most important thing for them at the moment, people who identify with a disability and people from CALD backgrounds were more likely to cite their health (70% and 66% respectively, compared to the survey average of 53%), their mental health (44% and 45% compared to the survey average of 37%) and having a home (45% and 44% compared to the survey average of 39%). Respondents from CALD backgrounds cited employment as a significantly higher issue than the respondents who identify with a disability (39% and 13%, compared to the survey average of 29%).
Respondents from CALD backgrounds and those who identified with a disability were also slightly more likely to cite lack of money as a key issue for them (19% and 15% respectively, compared to 14% for the survey average), overall fatigue (31% and 29%, compared to 26%), and not being able to get basic necessities (12% both, compared to 9%) (Figure 29, overleaf).
These findings reveal increased anxiety, increased concerns for the future, and increased health and financial concerns amongst these groups, that are not easily seen from a survey of just the general public.

Growing the seeds: recovery, strength and capability in Gippsland communities Page 73 of 145
Figure 29: What are the main challenges you have faced since the bushfires?
49%
39%39%
39%41%
31%
31%30%
30%24%
20%
18%24%
27%
14%19%
15%
15%15%
13%
13%18%
9%12%12%
8%11%
7%
6%
6%
5%5%
3%
3%
3%4%
9%
10%
26%
41%
46%53%
COVID-19 impacts
Damage to the environment
Anxiety
Overall fatigue
Being isolated
Not being able to connect to others
Lack of money
Not enough people offering the right help
Illness
Not being able to get basic necessities
Not being able to connect to others
Conflict
Too many people offering help
Discrimination
Total CALD community respondents People who identify with a disability

Growing the seeds: recovery, strength and capability in Gippsland communities Page 74 of 145
CommunityPeople who identify with a disability and those from CALD backgrounds had similar responses to the survey average when asked who they most considered their community: 46% and 44% stated family, compared to the survey average of 42%, and 40% and 37% stated people who live in the same locations as them, compared to the survey average of 38% (Figure 30). The third most common response was people who you share common interests and activities with, which was cited by 12% of respondents who identify with a disability, 15% of CALD respondents, and 14% of the total respondents. The other two options were online friends (2% of survey respondents) and people you work with (2% of survey respondents).
Figure 30: Who do you consider to be your community?
My fam
ily
People who liv
e in th
e
same lo
cation as
me
People I share
common
interests an
d activiti
es with
Online fri
ends
People who do sim
ilar w
ork
to me, o
r those I w
ork with
42% 44% 46%
38% 37%40%
14%15%12%
2% 1% 2% 2% 2% 1%
Total CALD community respondents People who identify with a disability
When asked what strengths your community showed during the bushfires, there were some stark differences between people who identify with a disability and people from CALD backgrounds (Figure 31, overleaf). For instance, 75% of respondents who identified with a disability cited generosity and kindness compared to the survey average of 69%, but only 67% of people from a CALD background cited it. Likewise, 41% of respondents who identify with a disability cited strong leadership (compared to the survey average of 32%), which was only cited by 33% of people from CALD backgrounds. This suggests that people who identify with a disability may be more closely connected to the wider community, and receive more community support than those from CALD backgrounds.
When asked what strengths were most needed by their communities, people who identify with a disability cited generosity and kindness, compassion, strong leadership and active volunteering more often than the survey average, while those from CALD backgrounds were much closer to the survey averages, with the exception of social connections and organisational skills. Only the CALD respondents rated resilience higher than the survey average (Table 2).
Strength neededGenerosity
and kindness ResilienceStrong
leadershipActive
volunteeringSocial
connectionsOrganisational
skillsSurvey average 50% 45% 37% 27% 37% 26%Identify with a disability 58% 43% 41% 37% 38% 31%Culturally diverse 54% 48% 32% 31% 41% 16%
Table 2: What strengths are most needed by your community?

Growing the seeds: recovery, strength and capability in Gippsland communities Page 75 of 145
Figure 31: What strengths did your community show following the bushfires?
69%
61%
59%
44%
39%
36%
34%
32%
31%
13%
11%
67%
57%
58%
44%
41%
34%
34%
33%
36%
17%
13%
75%
63%
65%
41%
41%
38%
39%
41%
33%
15%
12%
Generosity and kindness
Resilience
Active volunteering
Social connections
Fundraising
Sharing knowledge
Organisation skills
Strong leadership
Collaborating
Creativity
Enterprising
Total CALD community respondents People who identify with a disability
Growing the seeds: recovery, strength and capability in Gippsland communities Page 76 of 145
When asked what words best describe their community towards the end of 2020 (Figure 32, overleaf), respondents who identify with a disability and CALD communities gave similar answers to the survey averages. For instance, hopeful was cited as the highest response by 37% across all three groups. Resilient was cited by 38% of respondents who identify with a disability, 26% of CALD respondents, and 29% of total survey respondents. The third highest response was recovering, cited by 29% of respondents who identify with a disability, CALD community members (33%), and 29% of the total respondents. Other responses were all within three percentage points of the total survey responses: fatigued (24%), stronger (22%), anxious (19%) and financially troubled (17%). Response rates to some extreme community impacts were present, but at relatively low rates and at similar levels for all groups – fearful (7%), far from recovering (7%), less strong than previously (5%) and in conflict (2%).

Growing the seeds: recovery, strength and capability in Gippsland communities Page 77 of 145
37%
29%
29%
24%
22%
19%
17%
16%
10%
7%
7%
5%
2%
29%
21%
21%
17%
19%
19%
13%
6%
11%
5%
4%
37%
26%
37%
38%
33%
26%
19%
21%
18%
17%
10%
10%
6%
8%
4%
Hopeful
Resilient
Recovering
Fatigued
Stronger
Anxious
Financially troubled
Worried
More collaborative
Fearful
Far from recovering
Less strong than previously
In conflict
Figure 32: What words best describes your community towards the end of 2020?
Total CALD community respondents People who identify with a disability

Growing the seeds: recovery, strength and capability in Gippsland communities Page 78 of 145
CommunicationRespondents were asked three questions in relation to communication: how well they were communicated with after the bushfires, who they would like to communicate with them, and how they would like to be communicated with (Figure 33, overleaf).
There was often a difference in responses between respondents who identify with a disability and those from CALD backgrounds compared to the survey average, indicating that respondents who identify with a disability felt more effectively served with information, or were more able to access the appropriate and necessary information than those from CALD backgrounds. For instance, the survey average for people having received the right information at the right time was 45%, with respondents who identify with a disability giving a higher response of 49%, but respondents from CALD backgrounds giving a lower response at 43%.
Across the other responses, those from CALD backgrounds had very little differences to the total response rate, but there were differences from those who identified with a disability. For instance, when asked if they had received confusing information from too many different organisations, the total response rate was 20%, with CALD respondents (21%), and respondents who identify with a disability (16%).
When asked if they had received the right information, but not at the right time, the survey average was 17%, with CALD respondents (16%) and respondents who identify with a disability significantly lower (10%). A similar significant difference was recorded for the response to not enough information, with 16% of respondents who identify with a disability agreeing, compared to 9% for both the survey average and those from CALD backgrounds. This indicates that people who identify with a disability have a strong appetite for information.
For the option of having received too much information, the ratings were uniformly low at 5% for the survey average and respondents who identify with a disability, and 7% for those from a CALD background.
When asked who they would like to communicate with them in relation to their information needs, state government agencies were rated the highest by all three groups, with those from a CALD background rating them much higher (63%), compared to the survey average (55%) and respondents who identify with a disability (56%).
Across state, federal and local governments (the three highest nominated source for information), respondents who identify with a disability rated the Federal Government over Local Government (50% to 44%), while those from CALD backgrounds rated Local Government over Federal Government (51% to 44%). This may relate to where different groups obtain most of the current support from, with the National Disability Insurance Scheme (NDIS) for example, being seen as a federal government initiative. The total survey responses were 55% for state government agencies, 48% for local government, and 47% for federal government agencies.
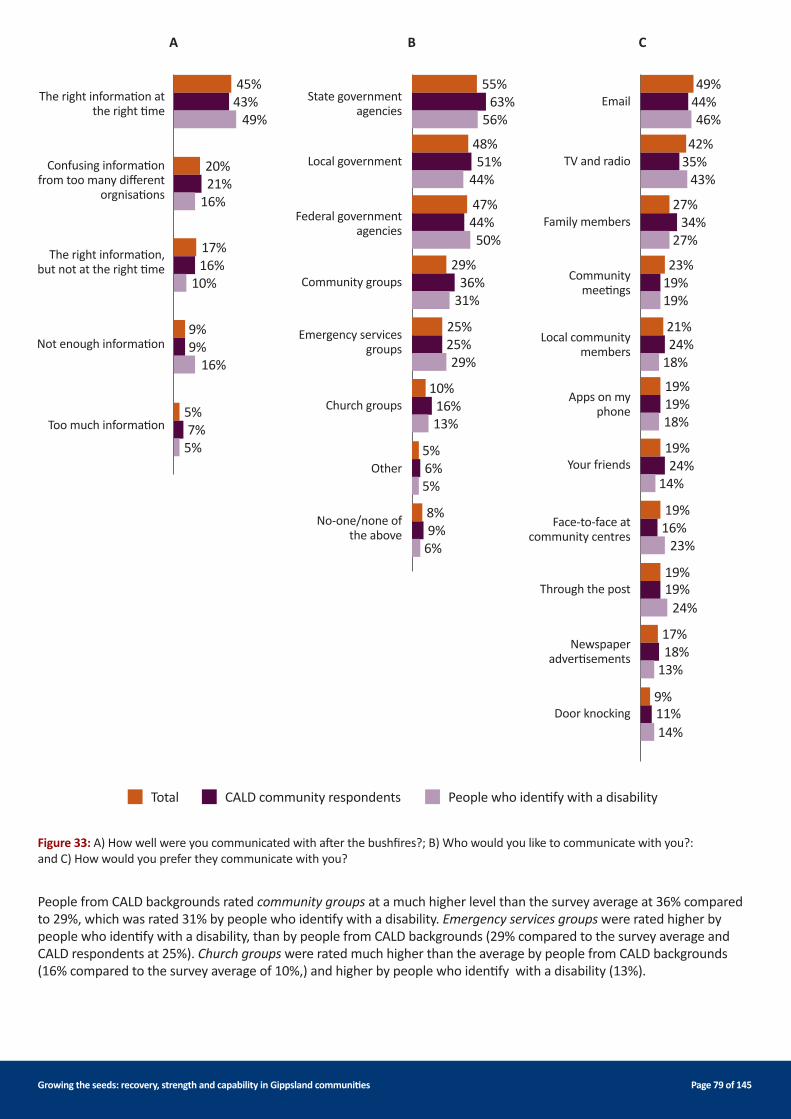
Growing the seeds: recovery, strength and capability in Gippsland communities Page 79 of 145
Figure 33: A) How well were you communicated with after the bushfires?; B) Who would you like to communicate with you?: and C) How would you prefer they communicate with you?
45% 55% 49%
42%
27%
23%
21%
19%
19%
19%
19%
9%
17%
19%
11%
18%
20%48%
47%
17%29%
9% 25%
5%
10%
5%
8%
43% 63% 44%
35%
34%
19%
24%
19%
24%
16%
21%51%
44%
16%36%
9% 25%
7%
16%
6%
9%
49% 56% 46%
43%
27%
19%
18%
18%
14%
23%
24%
14%
13%
16%44%
50%
10%31%
16% 29%
5%
13%
5%
6%
The right information at the right time
State governmentagencies
TV and radio
Family members
Community meetings
Local community members
Apps on my phone
Your friends
Face-to-face at community centres
Through the post
Door knocking
Newspaper advertisements
Federal governmentagencies
Community groups
Emergency services groups
Church groups
Other
No-one/none of the above
Local governmentConfusing information from too many different
orgnisations
The right information, but not at the right time
Not enough information
Too much information
Total CALD community respondents
A B C
People who identify with a disability
People from CALD backgrounds rated community groups at a much higher level than the survey average at 36% compared to 29%, which was rated 31% by people who identify with a disability. Emergency services groups were rated higher by people who identify with a disability, than by people from CALD backgrounds (29% compared to the survey average and CALD respondents at 25%). Church groups were rated much higher than the average by people from CALD backgrounds (16% compared to the survey average of 10%,) and higher by people who identify with a disability (13%).

Growing the seeds: recovery, strength and capability in Gippsland communities Page 80 of 145
When asked how they would like to be communicated with, there was a general accord across all respondents, with email being the highest response, followed by TV and radio, then family members and community meetings. However, while there was very little difference between the survey average and those respondents who identify with a disability, there were some significant differences in responses from those from CALD backgrounds. For instance, while email was cited as the most preferred source of information by 49% across the survey, this fell to 46% among respondents who identify with a disability, and 44% amongst those from CALD backgrounds.
Responses to TV and radio and family members were within one percentage point to the average from respondents who identify with a disability (42% to 43%, and 27% for both), but those from CALD backgrounds rated TV and radio much lower (35% compared to 42%), and rated family members much higher (34% compared to 27%).
Respondents from CALD backgrounds also rated friends and families and their local community at a higher level than the survey average, while respondents who identify with a disability rated them lower than the survey average but rated face-to-face at community meetings, through the post and by door knocking higher, as shown in the previous figure.
These findings show that people who identify with a disability and those from CALD backgrounds can have different information preferences to the broader community, which can inform more effective communication with them during bushfires and other emergencies.
ConclusionThe survey provided useful insight into the resilience of communities in fire-impacted areas of Victoria and New South Wales. The findings revealed a considerable level of optimism, but also identified where people felt concerns and anxieties. Comparative data between those who were directly impacted by recent bushfires and those who were indirectly impacted showed there was some differences in perception of community strengths and how well they had been communicated with. It was also notable that there were higher allocations of strengths in Victorian respondents related to volunteering, and that resilience was seen as greater in these communities following the fires.
Comparing NSW and Victorian responses showed there were some significant differences between the experiences in each state, particularly in terms of how severe they felt the bushfires had been compared to previous fires. The data also showed that there can be significant differences in how CALD community members view their communities, the information they receive, and who they prefer to receive it from, which can be considered when working to engage with people from CALD backgrounds.
Key findings across the studyn Almost two thirds of respondents consider the recent bushfires were a lot different compared to previous ones, with
people from New South Wales (NSW) more likely to consider the fires a lot different to the previous ones, compared to people from Victoria.
n People directly impacted by the fires are more likely to consider the fires a lot different to the previous ones, compared to those impacted indirectly.
n 45% of the respondents feel positive or very positive about the future, however, a little over 25% are anxious. n The definition of community is similar among different groups, with family (42%), and people who live in the same
location (38%) being considered their community.n Hopeful (37%), resilient (29%) and recovering (29%) are the top three words chosen to describe one’s own community,
and generosity and kindness (50%), compassion (46%) and resilience (45%) are the strengths respondents said communities now most need.
n Email (49%) and traditional mass media (TV and radio, 42%) are the preferred means by which people would like to be informed.
n The government, be it state (55%), local (48%) or federal (47%) are the authorities that people find most appropriate to communicate with them about their important needs.
n Almost 45% of the respondents consider they received the right information at the right time, while 20% felt they received confusing information from too many different sides, and 17% felt they received the right information but not at the right time.
n People who were directly impacted by the fires have mentioned more challenges in general, with the damage to the environment surpassing COVID-19 in importance, while anxiety and fatigue were also significant challenges for over 30% of respondents.
n While there were some differences of note between the states, those people from diverse cultural backgrounds tended to have significantly different needs and expectations from members of the general public.

Growing the seeds: recovery, strength and capability in Gippsland communities Page 81 of 145
Measuring the economic impacts

Growing the seeds: recovery, strength and capability in Gippsland communities Page 82 of 145
The aim of this section is to more fully understand the economic impacts of the double shock of the fires and the COVID-19 pandemic on the economies of East Gippsland and Wellington Shires in order to complement the investigation into the strength-based recovery of the affected communities.
Economic recovery from catastrophic fires, such as those in East Gippsland, is complex. Some sectors will be directly hit and need immediate support. Other sectors may benefit indirectly from recovery programs, such as those involved in repairing and rebuilding damaged infrastructure. The impacts and recovery themselves are not evenly distributed, with some businesses being devastated and others barely affected.
Indirect effects are widespread and often diffuse. Time spent putting things back together, community stress and morale can affect productivity. There may be compounding effects, where previous events have placed some sectors under stress, or been favourable for others. The economy also extends beyond dollars and cents, with human health and welfare of a community being an important social asset. The total non-monetary assets of a region – its natural, social and cultural capital – rival the monetary economy in value.
There is also significant value in unpaid work undertaken by the community, such as household work, caring for others, emergency management, health support, public sport, and contributions to art and culture. A project addressing a strengths-based approach to community recovery, needs to survey both the conventional and the broader economy and how they are tracking.
The COVID-19 pandemic and lockdown has complicated the fire recovery process immensely. The aim of this part of the study has therefore been to understand the impact of the fires and COVID-19 on the Gippsland economy where possible, and to follow the recovery path during 2020. One important question is whether the effects of the fires in East Gippsland can be distinguished from the economic effects of the pandemic. A second question is whether the programs supporting people and businesses to cope with the pandemic are also playing a role in fire recovery. Lastly, because some impacts may not be apparent in the data, we also aim to identify areas of socioeconomic vulnerability, in addition to areas of strength.
Methods and toolsThis section describes the methods and tools used in the economic study, and contains a brief primer on how regional economic data can be used to inform recovery strategies.
In economic terms, hazards such as fires and disease pandemics are referred to as shocks, so-called because they shock the economy from its prevailing path. Parts of the economy may recover that path or something close to it, whereas others may reset dramatically. A strengths-based approach will aim to do this as positively as possible, where parts of the economy can be improved upon.
Figure 34 (overleaf) shows an idealised model of disaster shocks and recovery. Damage and loss are greater when there is no prior planning, and damages can be minimised by better preparation, prevention and response. Recovery will be accelerated by pre-planning, potentially leaving the economy in a better position than originally. The shape of the recovery is important. A rapid recovery is v-shaped, whereas a prolonged recovery may be u-shaped and fail to recover fully, leaving permanent loss.
The East Gippsland economy has suffered two shocks and the broader economy a large, single shock. To understand the effect of both we looked at the economy of East Gippsland Shire, neighbouring Wellington Shire, the Gippsland region and the State. This was dictated by the availability of data – some data can be obtained at the Local Government Area (LGA) scale and some is only available at state and national scale.

Growing the seeds: recovery, strength and capability in Gippsland communities Page 83 of 145
Figure 34: Idealised hazard economic shock and recovery profile, showing the potential benefits of strategic planning on long-term economic loss.
The Australian Bureau of Statistics (ABS) warns that the large impact of the COVID-19 pandemic has reset the economy, leading to a break in the record (ABS, 2020h). To manage this, they have stopped producing trends for some results and are monitoring the economy in greater detail to gauge the impact of COVID and relief measures (ABS, 2020e, 2020h).
We collected two main data sets for analysis. The first describes the baseline economy before the fires. This includes comprehensive baseline exposure data sourced from Geoscience Australia for the East Gippsland and Wellington Shires. This contains a list of assets and community characteristics for each LGA and is presented in Appendix I. The second data set follows the evolution of the economy throughout the COVID-19 first and second waves.
The main sources of economic data used were the ABS and two consulting groups who conduct ongoing surveys and modelling used in regional planning: Compelling Economics via REMPLAN and SGS Economics (profile.id.com.au). REMPLAN is a regional economic model based on ABS survey data, input-output tables and additional surveys (REMPLAN, 2020). The ABS produces national input-output tables, the latest version being for 2017–18, released in May 2020 (ABS, 2020b). Other groups take these and use models to downscale them to the area of interest, such as state and LGA level, by estimating input-output relationships for each area of interest. Because the production of national input-output tables takes about two years, such models are kept up-to-date by using quarterly and state accounts. Projections of COVID-19 impacts were also generated by this group at the LGA scale to nationally, and these projections were used by the East Gippsland Recovery Group in their recovery planning.
Nationally, there are nineteen industry sectors, with tourism often being added as a twentieth based on the ABS Tourism Accounting methodology (ABS, 2020a). Input-output tables measure the inputs into each sector and then calculate the added value of goods and services produced by that sector. Both the input and output sides have to balance, the end result being Gross Domestic Product. The value-added component calculated for each sector prevents double counting, because inputs from other sectors have been subtracted. These inputs into a sector make up the value chain (e.g., the value chain from the farm to the tourist’s plate). Gross value added, as it is called, is roughly equivalent to labour cost plus return to industry (earnings before tax).
This is an important measure for local economies, because most employees live close to work, much of their household expenditure is spent locally. If businesses are locally-owned, a proportion of their profits and business investment will also be spent locally. These measures inform regional strategies, such as that developed for Food and Fibre Gippsland and GROW Gippsland (see Appendix G). Part of an economic recovery strategy is making sure the entire value chain is up and running as quickly and efficiently as possible.
This survey looks at four economic measures: employment numbers, wages and salaries, sector output and gross value-added. Output is overall return from goods and services produced including inputs. Each industry sector pays direct wages and salaries. Its inputs of goods and services contribute indirect wages and salaries. Household expenditure provided by these wages employs people in sectors such as wholesale and retail providing induced employment. These three layers of household income also help to support unpaid work and the volunteer economy. All four areas of economic contribution from labour via wages and salaries are therefore direct, indirect, induced and in-kind.
Benefit
Business as usual
Loss
Preparation and prevention
Hazard event
Planned recovery
Unplanned recovery
HazardLoss
Short-term recovery Long-term recovery
Reduced loss and planned recovery

Growing the seeds: recovery, strength and capability in Gippsland communities Page 84 of 145
Some sectors, such as education, health and the public service, support the regional economy through external payments of wages and salaries. Social support and investment funding also contribute to local economies. This income is counterbalanced by outgoing taxes. Large corporations may take profit out of a region, but can also bring investment in, so regional economic strategies generally aim to balance internally and externally generated investment to get the best of both.
The REMPLAN model output for East Gippsland and Wellington Shires for the 2018–2019 financial year provided estimates of the baseline economy. Separate tourism employment was also provided and from that we estimated wages and salaries, output and gross value-added. Tourism was added to make up a twentieth sector by subtracting its contributions from the other sectors. Sectors that contribute the most to Tourism, such as Accommodation and Food Services and Retail Services are demoted in importance, especially in East Gippsland. These are presented in the next section.
In the REMPLAN projections for COVID-19 impacts on the economy, the employment baseline was March 2020. As part of their COVID monitoring program, the ABS were also compiling weekly employment and wages and salaries data from all businesses that have touch electronic payrolls down to the LGA level (ABS, 2020i). In this data, employment peaked in the week of 14 March 2020. Comparing projected employment with measured employment allows us to see what has been planned for and what has been realised.
Estimating economic losses and potential recovery pathways is complicated. The usual method is to ‘shock’ an economic model and let it adjust to the changed conditions. However, the unprecedented combination of widespread fire damage plus the COVID-19 pandemic, means the shock is large and compound, with knock-on effects. The response is nonlinear and dynamic, and therefore difficult to model.
Passive models of damage and loss provide worst-case estimates. If recovery plans are being implemented, the emphasis for information shifts to identifying priorities and gaps in recovery planning as the situation evolves. The unprecedented nature of COVID-19 has made this task a priority.
The baseline economyThe economies of the East Gippsland and Wellington Shires are strongly determined by geographical factors, especially topography, land-use and distance from large urban centres. Once dominated by primary production, they have evolved into mixed economies where health and community services, retail trade and tourism have become much more important. The Agriculture sector (Agriculture, Forestry and Fishing) remains strong.
Estimated gross regional product is $2,360 million for East Gippsland and $3,222 million for Wellington (REMPLAN, 2020). Gross value added 2018–19 for Victoria from REMPLAN is $423.6 billion compared to the ABS $426.4 billion, so we consider the local estimates to be fairly reliable. The relative contributions from each sector are shown in Table 3 for East Gippsland, Wellington, Gippsland and Victoria covering employment, wages and salaries, output and gross value-added. They are in percent and ranked from their largest to smallest contribution. Also included are the contributions of different sectors to the Tourism sector, with over two-thirds being in the Food and Accommodation sector (Table 4).
The order of importance changes for the different economic measures. The top three sectors for employment are Health, Retail and Tourism; for wages and salaries are Health, Education and Construction; for output are Manufacturing, Agriculture and Construction; for value-added are Rental, Hiring and Real Estate, Agriculture and Health. Note that the Rental, Hiring and Real Estate sector contains the dwellings category, which contains rental properties and imputed rent for owned residences. This latter component is often listed separately in the National Accounts because it does not involve a monetary transfer.
East Gippsland had 4,403 businesses in June 2019 active and registered for GST according to the ABS. However, the total number of registered businesses in September 2020 in East Gippsland was 10,550 (See Appendix I). Some of these may be active and trading below the GST threshold of $75,000 so will not be measured as a formal part of the business economy. Similar figures for Wellington are 4,029 and 9,146. Both economies are dominated by small businesses, with over 98% having under 20 employees, and the majority being sole traders.
The East Gippsland economy is very much a community-oriented economy with a strong primary production component, dominated by small businesses. This does not include employers registered elsewhere, which includes the public services. If all four economic measures are considered together, the most important sectors in East Gippsland are, in order: Health Care and Social Assistance; Agriculture, Forestry and Fishing; Construction; Manufacturing; Education and Training; and Tourism. In contrast, the most important sectors in Wellington are: Construction; Agriculture, Forestry and Fishing; Public Administration and Safety; Mining; Health Care and Social Assistance; and Manufacturing.

Growing the seeds: recovery, strength and capability in Gippsland communities Page 85 of 145
Before the fires, from 2018 and 2019 the Gippsland economy improved markedly. Unemployment in East Gippsland fell from 8.2% in the June 2018 quarter to 4.4% September 2019, and Wellington from 6.4% to 3.7% over the same period. Adjusted employment figures pre-COVID-19 are estimated as 16,539 for East Gippsland and 18,111 for Wellington (REMPLAN, 2020).
The main employers in East Gippsland pre-COVID-19 are the Health (2,641), Retail (2,002), Agriculture (1,612) and Accommodation and Food Services sectors (1,532) (REMPLAN, 2020). If Tourism (compiled as part of REMPLAN from other sectors), is included, it becomes third largest with 1,614 employees, with Agriculture coming fourth. In Wellington, the Agriculture (2,570), Health (2,252) and Construction sectors (2,143) are the largest employers, and Tourism is less important, ranking eighth.
The major built, human, public, business and natural assets are listed in Appendix I. Total building exposure includes 26,300 houses and 25,132 other buildings in East Gippsland valued at $10.6 billion, with contents valued at $1.7 billion (2018 estimates). Building exposure in Wellington is slightly lower with a similar pattern. Roughly one-third are estimated to contain asbestos, posing a health risk to response and recovery that needs to be managed.
Table 3: Estimated contributions (%) for employment, wages and salaries, output and value-added for the main industry sectors plus tourism for East Gippsland, Wellington, the Gippsland Region and Victoria. Baseline 2018–19. Data source: REMPLAN, 2020.
Employment
Industry sector East Gippsland Wellington Gippsland Victoria
Health Care and Social Assistance 15.9% 12.4% 14.4% 13.1%
Retail Trade 10.9% 9.0% 10.0% 9.7%
Tourism 9.8% 5.4% 6.8% 6.0%
Agriculture, Forestry and Fishing 9.7% 14.1% 9.4% 2.3%
Education and Training 8.9% 8.1% 8.4% 8.4%
Construction 8.2% 11.8% 9.7% 8.7%
Manufacturing 7.4% 5.6% 6.5% 8.1%
Public Administration and Safety 5.3% 9.3% 6.6% 5.5%
Other Services 4.1% 3.5% 4.0% 3.7%
Professional, Scientific and Technical Services 3.4% 3.1% 3.6% 8.3%
Transport, Postal and Warehousing 3.3% 2.3% 2.8% 4.3%
Accommodation and Food Services 2.8% 3.4% 3.8% 4.4%
Administrative and Support Services 2.6% 2.4% 2.6% 3.3%
Wholesale Trade 2.0% 1.3% 1.9% 3.3%
Electricity, Gas, Water and Waste Services 1.4% 1.7% 3.3% 1.2%
Financial and Insurance Services 1.2% 1.2% 1.5% 4.1%
Rental, Hiring and Real Estate Services 1.2% 1.0% 1.2% 1.6%
Arts and Recreation Services 1.0% 0.9% 1.2% 1.7%
Information Media and Telecommunications 0.8% 0.4% 0.8% 2.0%
Mining 0.3% 3.1% 1.3% 0.3%
Total ($millions) 16,539 18,111 105,677 2,730,332

Growing the seeds: recovery, strength and capability in Gippsland communities Page 86 of 145
Wages and Salaries
Industry sector East Gippsland Wellington Gippsland Victoria
Health Care and Social Assistance 18.0% 11.7% 15.1% 12.4%
Education and Training 11.3% 8.9% 10.5% 10.3%
Construction 8.8% 12.5% 9.9% 7.8%
Public Administration and Safety 7.8% 17.2% 10.3% 7.6%
Retail Trade 7.3% 5.4% 7.0% 6.2%
Manufacturing 7.1% 7.8% 8.2% 8.3%
Tourism 6.8% 3.5% 0.4% 0.4%
Agriculture, Forestry and Fishing 5.2% 5.8% 4.1% 0.9%
Professional, Scientific and Technical Services 4.6% 3.8% 4.8% 10.3%
Wholesale Trade 3.8% 2.2% 3.5% 5.5%
Administrative and Support Services 3.7% 3.4% 4.0% 6.3%
Transport, Postal and Warehousing 3.1% 1.9% 2.8% 4.5%
Other Services 2.9% 2.0% 2.6% 2.5%
Electricity, Gas, Water and Waste Services 2.2% 2.1% 4.6% 1.6%
Financial and Insurance Services 2.0% 1.8% 2.4% 6.1%
Accommodation and Food Services 1.7% 1.7% 4.1% 3.3%
Rental, Hiring and Real Estate Services 1.6% 1.1% 1.5% 2.0%
Information Media and Telecommunications 1.1% 0.5% 1.1% 2.5%
Mining 0.5% 6.2% 2.2% 0.4%
Arts and Recreation Services 0.5% 0.5% 0.8% 1.1%
Total ($millions) $1,154 $1,418 $7,768 $220,354
Output
Industry sector East Gippsland Wellington Gippsland Victoria
Manufacturing 14.5% 11.7% 14.3% 18.0%
Agriculture, Forestry and Fishing 13.0% 13.5% 10.2% 2.4%
Construction 12.8% 15.8% 13.5% 12.4%
Rental, Hiring and Real Estate Services 10.2% 6.9% 8.0% 8.8%
Health Care and Social Assistance 6.9% 4.4% 5.6% 5.1%
Tourism 6.8% 3.2% 4.6% 3.9%
Retail Trade 4.3% 2.8% 3.5% 3.4%
Education and Training 4.1% 2.9% 3.5% 3.7%
Electricity, Gas, Water and Waste Services 3.7% 3.3% 9.6% 3.2%
Public Administration and Safety 3.4% 8.0% 4.5% 3.6%
Transport, Postal and Warehousing 3.3% 1.7% 2.3% 4.5%
Professional, Scientific and Technical Services 3.1% 2.3% 2.9% 6.9%
Wholesale Trade 2.7% 1.4% 2.3% 4.0%
Financial and Insurance Services 2.7% 2.2% 3.0% 8.3%
Other Services 2.0% 1.3% 1.7% 1.6%
Administrative and Support Services 1.9% 1.5% 1.7% 2.8%
Information Media and Telecommunications 1.6% 0.6% 1.4% 3.8%
Accommodation and Food Services 1.5% 1.3% 1.7% 1.8%
Mining 0.9% 14.7% 4.9% 0.9%
Arts and Recreation Services 0.6% 0.5% 0.6% 1.1%
Total ($millions) $4,948 $6,801 $35,631 $924,391

Growing the seeds: recovery, strength and capability in Gippsland communities Page 87 of 145
Value-addedIndustry sector East Gippsland Wellington Gippsland VictoriaRental, Hiring and Real Estate Services 15.1% 10.2% 12.3% 13.0%Agriculture, Forestry and Fishing 13.0% 13.0% 10.3% 2.5%Health Care and Social Assistance 10.2% 6.2% 8.4% 7.6%Construction 8.4% 10.8% 9.2% 8.0%Education and Training 6.2% 4.4% 5.4% 5.7%Tourism 6.0% 3.4% 5.1% 4.2%Manufacturing 5.6% 5.2% 6.0% 6.9%Retail Trade 5.5% 3.6% 4.7% 4.5%Public Administration and Safety 4.6% 10.2% 6.1% 4.9%Financial and Insurance Services 3.9% 3.1% 4.4% 11.4%Electricity, Gas, Water and Waste Services 3.9% 3.4% 7.2% 3.1%Transport, Postal and Warehousing 3.2% 1.4% 2.2% 4.3%Professional, Scientific and Technical Services 3.2% 2.3% 3.2% 7.4%Wholesale Trade 3.0% 1.6% 2.6% 4.5%Administrative and Support Services 2.2% 1.8% 2.2% 3.6%Other Services 2.0% 1.3% 1.7% 1.8%Accommodation and Food Services 1.3% 1.2% 1.5% 1.7%Information Media and Telecommunications 1.3% 0.5% 1.3% 3.3%Mining 1.0% 16.1% 5.8% 0.9%Arts and Recreation Services 0.4% 0.4% 0.5% 0.9%Total ($millions) $2,360 $3,222 $16,350 $423,628
Table 4: Estimated contribution (%) of different industry sectors to employment numbers in the Tourism sector for East Gippsland, Wellington, the Gippsland Region and Victoria. Data source: REMPLAN, 2020.
Tourism Industry sector East Gippsland Wellington Gippsland VictoriaHealth Care and Social Assistance 0.2% 0.6% 0.4% 0.5%Retail Trade 10.1% 10.1% 10.1% 10.1%Agriculture, Forestry and Fishing 0.6% 0.3% 0.4% 0.7%Accommodation and Food Services 69.7% 47.5% 51.0% 35.7%Education and Training 3.0% 2.8% 3.7% 7.6%Construction 0.0% 0.0% 0.0% 0.0%Manufacturing 7.2% 1.9% 2.6% 1.7%Public Administration and Safety 0.0% 0.0% 0.0% 0.0%Other Services 1.8% 1.7% 1.7% 1.6%Transport, Postal and Warehousing 11.5% 16.9% 14.0% 13.1%Professional, Scientific and Technical Services 0.0% 0.0% 0.0% 0.0%Administrative and Support Services 8.1% 4.4% 7.6% 8.1%Wholesale Trade 2.3% 2.4% 2.4% 2.4%Electricity, Gas, Water and Waste Services 0.0% 0.0% 0.0% 0.0%Arts and Recreation Services 23.8% 19.8% 22.6% 17.6%Rental, Hiring and Real Estate Services 5.0% 11.1% 12.3% 5.7%Financial and Insurance Services 0.0% 0.0% 0.0% 0.0%Information Media and Telecommunications 1.5% 1.3% 1.4% 1.3%Mining 0.0% 0.0% 0.0% 0.0%Total ($millions) 1,614 999 7,214 162,938
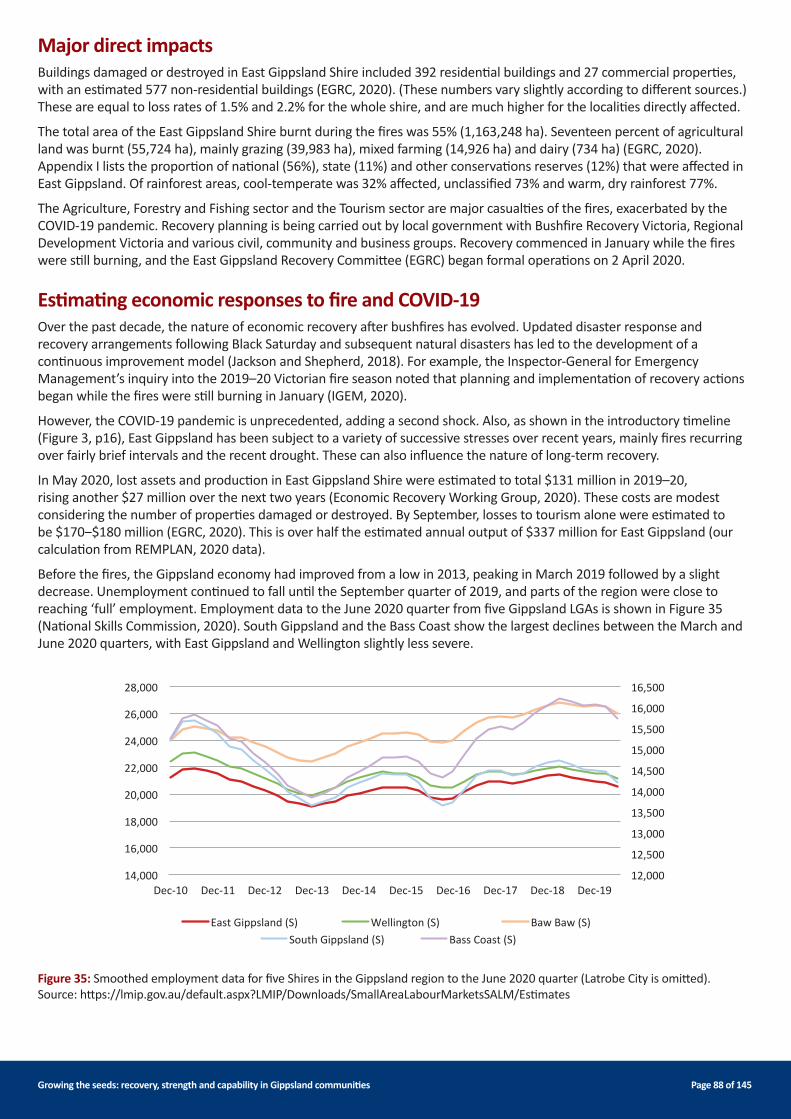
Growing the seeds: recovery, strength and capability in Gippsland communities Page 88 of 145
Major direct impactsBuildings damaged or destroyed in East Gippsland Shire included 392 residential buildings and 27 commercial properties, with an estimated 577 non-residential buildings (EGRC, 2020). (These numbers vary slightly according to different sources.) These are equal to loss rates of 1.5% and 2.2% for the whole shire, and are much higher for the localities directly affected.
The total area of the East Gippsland Shire burnt during the fires was 55% (1,163,248 ha). Seventeen percent of agricultural land was burnt (55,724 ha), mainly grazing (39,983 ha), mixed farming (14,926 ha) and dairy (734 ha) (EGRC, 2020). Appendix I lists the proportion of national (56%), state (11%) and other conservations reserves (12%) that were affected in East Gippsland. Of rainforest areas, cool-temperate was 32% affected, unclassified 73% and warm, dry rainforest 77%.
The Agriculture, Forestry and Fishing sector and the Tourism sector are major casualties of the fires, exacerbated by the COVID-19 pandemic. Recovery planning is being carried out by local government with Bushfire Recovery Victoria, Regional Development Victoria and various civil, community and business groups. Recovery commenced in January while the fires were still burning, and the East Gippsland Recovery Committee (EGRC) began formal operations on 2 April 2020.
Estimating economic responses to fire and COVID-19Over the past decade, the nature of economic recovery after bushfires has evolved. Updated disaster response and recovery arrangements following Black Saturday and subsequent natural disasters has led to the development of a continuous improvement model (Jackson and Shepherd, 2018). For example, the Inspector-General for Emergency Management’s inquiry into the 2019–20 Victorian fire season noted that planning and implementation of recovery actions began while the fires were still burning in January (IGEM, 2020).
However, the COVID-19 pandemic is unprecedented, adding a second shock. Also, as shown in the introductory timeline (Figure 3, p16), East Gippsland has been subject to a variety of successive stresses over recent years, mainly fires recurring over fairly brief intervals and the recent drought. These can also influence the nature of long-term recovery.
In May 2020, lost assets and production in East Gippsland Shire were estimated to total $131 million in 2019–20, rising another $27 million over the next two years (Economic Recovery Working Group, 2020). These costs are modest considering the number of properties damaged or destroyed. By September, losses to tourism alone were estimated to be $170‒$180 million (EGRC, 2020). This is over half the estimated annual output of $337 million for East Gippsland (our calculation from REMPLAN, 2020 data).
Before the fires, the Gippsland economy had improved from a low in 2013, peaking in March 2019 followed by a slight decrease. Unemployment continued to fall until the September quarter of 2019, and parts of the region were close to reaching ‘full’ employment. Employment data to the June 2020 quarter from five Gippsland LGAs is shown in Figure 35 (National Skills Commission, 2020). South Gippsland and the Bass Coast show the largest declines between the March and June 2020 quarters, with East Gippsland and Wellington slightly less severe.
Figure 35: Smoothed employment data for five Shires in the Gippsland region to the June 2020 quarter (Latrobe City is omitted). Source: https://lmip.gov.au/default.aspx?LMIP/Downloads/SmallAreaLabourMarketsSALM/Estimates
12,000
12,500
13,000
13,500
14,000
14,500
15,000
15,500
16,000
16,500
14,000
16,000
18,000
20,000
22,000
24,000
26,000
28,000
Dec-10 Dec-11 Dec-12 Dec-13 Dec-14 Dec-15 Dec-16 Dec-17 Dec-18 Dec-19
East Gippsland (S) Wellington (S) Baw Baw (S)South Gippsland (S) Bass Coast (S)

Growing the seeds: recovery, strength and capability in Gippsland communities Page 89 of 145
We compared East Gippsland, Wellington and the whole Gippsland region and could not detect any noticeable effects of the fires on the East Gippsland employment numbers. When all three are compared with the Victorian results (not shown), the reductions in employment are less severe than for the greater Melbourne region, which shows the effect of the stricter lockdown.
The REMPLAN model was used to estimate the impacts of COVID-19 for LGAs across Australia, beginning in March 2020 and providing monthly estimates to September 2020. All results project a decline in average employment, some reaching their lowest point in July and recovering slightly. Figure 36 shows the projected decline in East Gippsland to be slightly greater than the Gippsland average, and much less than for Victoria as a whole. The rest of Australia recovers faster than Victoria in their model because of the lockdown.
Figure 36: Percent changes in employment from a March 2020 baseline estimated by the REMPLAN model for selected regions.
Figure 37: Ranges of change from the baseline (nominally March 2020) for employment, wages and salaries, output and value-added production for East Gippsland (coloured wedges) and Wellington (black dotted lines).
The projected employment impacts were converted into ranges of change for all 20 industry sectors for East Gippsland and Wellington, for employment, wages and salaries, output and gross value-added (Figure 37). Changes in East Gippsland are shown as coloured areas and Wellington as dotted lines. The percent changes are very similar for employment and wages and salaries but the projected decline in output is roughly double, and value-added triple. This shows that although employment was expected to be maintained, productivity was going to decline faster.
-8
-7
-6
-5
-4
-3
-2
-1
0
Mar Apr May Jun Jul Aug Sep
Chan
ge in
tota
l em
ploy
men
t (%
)
East Gippsland Wellington Gippsland region
Victoria Australia
-50%
-40%
-30%
-20%
-10%
0%
Baseline Apr May Jun Jul Aug Sep
Employment
-50%
-40%
-30%
-20%
-10%
0%
Baseline Apr May Jun Jul Aug Sep
Wages and salaries
-45%
-30%
-15%
0%
Baseline Apr May Jun Jul Aug Sep
Output
-50%
-40%
-30%
-20%
-10%
0%
Baseline Apr May Jun Jul Aug Sep
Value-added
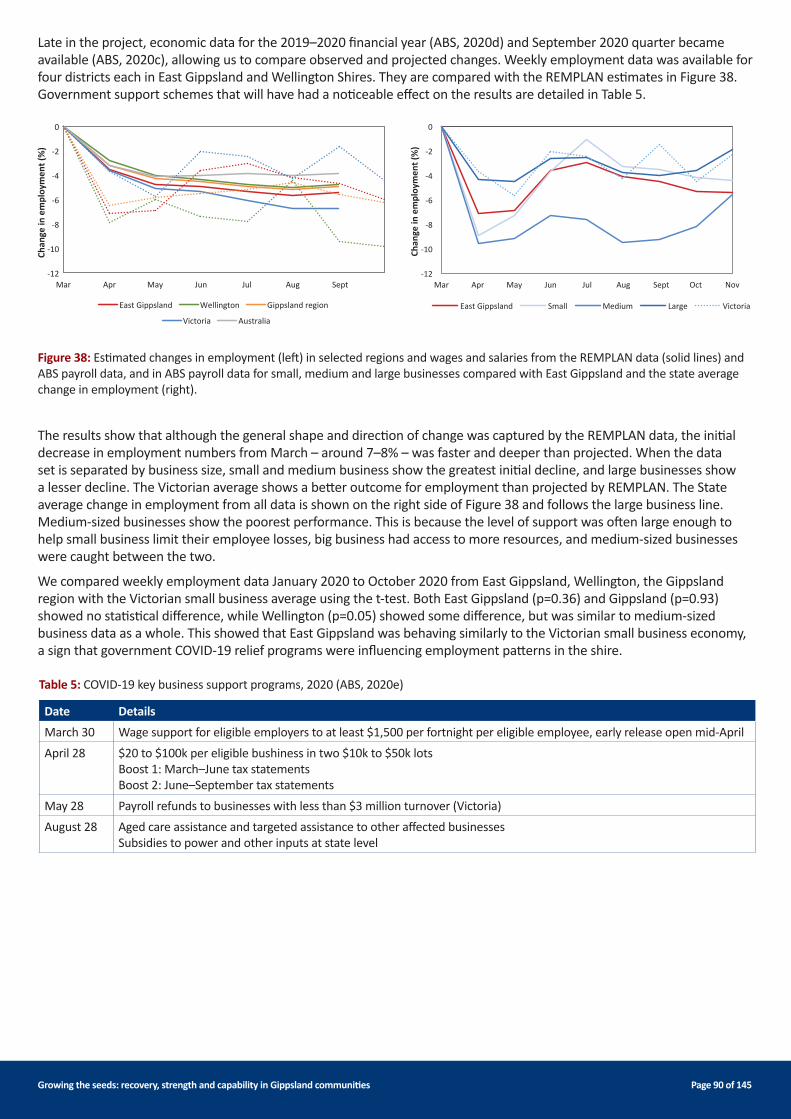
Growing the seeds: recovery, strength and capability in Gippsland communities Page 90 of 145
Late in the project, economic data for the 2019–2020 financial year (ABS, 2020d) and September 2020 quarter became available (ABS, 2020c), allowing us to compare observed and projected changes. Weekly employment data was available for four districts each in East Gippsland and Wellington Shires. They are compared with the REMPLAN estimates in Figure 38. Government support schemes that will have had a noticeable effect on the results are detailed in Table 5.
Figure 38: Estimated changes in employment (left) in selected regions and wages and salaries from the REMPLAN data (solid lines) and ABS payroll data, and in ABS payroll data for small, medium and large businesses compared with East Gippsland and the state average change in employment (right).
Table 5: COVID-19 key business support programs, 2020 (ABS, 2020e)
Date DetailsMarch 30 Wage support for eligible employers to at least $1,500 per fortnight per eligible employee, early release open mid-AprilApril 28 $20 to $100k per eligible bushiness in two $10k to $50k lots
Boost 1: March–June tax statementsBoost 2: June–September tax statements
May 28 Payroll refunds to businesses with less than $3 million turnover (Victoria)August 28 Aged care assistance and targeted assistance to other affected businesses
Subsidies to power and other inputs at state level
The results show that although the general shape and direction of change was captured by the REMPLAN data, the initial decrease in employment numbers from March – around 7–8% – was faster and deeper than projected. When the data set is separated by business size, small and medium business show the greatest initial decline, and large businesses show a lesser decline. The Victorian average shows a better outcome for employment than projected by REMPLAN. The State average change in employment from all data is shown on the right side of Figure 38 and follows the large business line. Medium-sized businesses show the poorest performance. This is because the level of support was often large enough to help small business limit their employee losses, big business had access to more resources, and medium-sized businesses were caught between the two.
We compared weekly employment data January 2020 to October 2020 from East Gippsland, Wellington, the Gippsland region with the Victorian small business average using the t-test. Both East Gippsland (p=0.36) and Gippsland (p=0.93) showed no statistical difference, while Wellington (p=0.05) showed some difference, but was similar to medium-sized business data as a whole. This showed that East Gippsland was behaving similarly to the Victorian small business economy, a sign that government COVID-19 relief programs were influencing employment patterns in the shire.
-12
-10
-8
-6
-4
-2
0
Mar Apr May Jun Jul Aug Sept
Chan
ge in
em
ploy
men
t (%
)
East Gippsland Wellington Gippsland region
Victoria Australia
Chan
ge in
em
ploy
men
t (%
)
-12
-10
-8
-6
-4
-2
0
Mar Apr May Jun Jul Aug Sept Oct Nov
East Gippsland Small Medium Large Victoria
Growing the seeds: recovery, strength and capability in Gippsland communities Page 91 of 145
Employment age and gender statistics at the regional (Gippsland) and state scale, and sectoral performance at the State and Federal scale, also show consistent patterns of change. Because of the similarities shown in Figure 38, these can also be inferred as being valid for East Gippsland. Declines in employment are generally faster and deeper for females and part-time workers in general, and recovery slower. The Single Touch Payroll (STP) data for Victoria shows different patterns for various age groups. Those aged 40–59 declined by the least, 30–39 and 60–69 next, over 70, 20–29 and under 20 the most, and females faster and deeper than males.
In November 2020 when the economy was recovering from lockdown, all age classes under 60 improved, those under 20 by the most, slightly higher than mid-March. There has been little recovery for those over 60, and those over 70 seem to have left the workforce. Given the greatest risk of COVID-19 to older people, many may have left employment because of the risk they faced. More women than men also withdrew from paid work because they were more likely to be the main caregiver for family, friends and community.
Underutilisation data picks up demand for work not recorded in employment numbers, and less well recorded in unemployment. The latest detailed labour force data for the August 2020 quarter records shows underemployment moving from 2.9% in the February quarter to 6.9% and 7.2% in May and August (2.4% to 6.5% and 7.1% for males and 3.7% to 7.5% and 7.3% for females) (ABS, 2020g). The number of potential hours where people are available for extra work increased from 7.1% to 12.3% and 13.0% of time worked, the highest rates since this measure began in 2014, with a similar gender bias as above. Other data also shows the increase in the numbers of unemployed is lower than the reduction in those employed, suggesting that people are withdrawing from the labour market. All these figures point to reduced productivity.
According to the seasonally-adjusted monthly data, employment in the Gippsland region was highest in December 2019, then showed the rapid decline from March to a small minimum in May and another in August, before recovering in October 2020 to levels approaching those of the last summer peak. The May and August dips and recoveries in Figure 38 and other data can be tied to the timing of COVID-19 support programs (see Table 5). In both cases, their timing seemed to signal the beginning of recovery, but especially in September, the projected end of lockdown was encouraging businesses to return to post-COVID open markets.
Industry responsesBased on the available data, the general patterns of employment post-fire appear to be largely dictated by the COVID-19 pandemic and the government and industry responses to it. We could not detect any post-fire signal in employment and Figure 35 suggests the fires themselves had little effect. This section looks at various industry responses to the COVID-19 lockdown, economic support programs and recovery.
As the projected employment March–September in REMPLAN was different to the ABS data shown in Figure 38, we did not pursue the sectoral breakdown from REMPLAN, but instead relied on ABS data collated at the State and National scale. Figure 39 (overleaf), shows changes in employment and salaries and wages for Victoria for 19 industry sectors, arranged in the order of importance for East Gippsland employment. The upper chart shows the average change from April to October from March, and the lower chart shows the change in November from March.
Statewide, Health Care and Social Assistance along with Electricity, Gas, Waste and Water Services increased during April–October, the former due to the COVID-19 response and latter due to more people staying at home. Financial and Insurance Services showed an increase in employment, but a slight decrease in wages and salaries, reflecting the need for businesses to manage COVID-19 relief payments and disaster insurance needs. Most sectors declined, with the number of jobs in most declining more than wages. This reflects the loss of employment by those in less secure work as outlined in the previous section. In the more salaried sectors, wages declined by more than positions, possibly due to people moving to part-time, or to reductions in overtime where relevant. The two sectors that declined the most – Accommodation and Food Services, and Arts and Recreation Services – are the mainstay of tourism employment in East Gippsland (Table 4). Wellington would have been similarly affected, although the Tourism sector is a smaller part of its economy.
The November figures see a partial and mixed recovery. Health Care, Retail Trade, Public Administration, and Finance and Insurance have greater employment than in March (the latter in employment only). Some sectors are showing the signs of the long lockdown, still being in decline. Information Media and Telecommunications showing the largest reduction. Relevant to East Gippsland, employment in Arts and Recreation Services had begun to recover, but wages and salaries had declined. This sector has attracted limited government support. Given that these are state averages, how they may apply to East Gippsland is difficult to project. For the sectors dominated by small businesses, such as Tourism and Agriculture, they are likely to be a reliable guide.

Growing the seeds: recovery, strength and capability in Gippsland communities Page 92 of 145
Figure 39: Average change to employment and wages and salaries from the STP dataset for Victoria. Average change from April to November with March as a zero baseline (upper chart), and change in November compared to the March baseline (lower chart).
-25%
-25%
-20%
-20%
-15%
-15%
-10%
-10%
-5%
-5%
0%
0%
5%
5%
10%
10%
Health care and social assistanceRetail trade
Agriculture, forestry and fishingAccommodation and food services
Education and trainingConstruction
ManufacturingPublic administration and safety
Other servicesTransport, postal and warehousing
Professional, scientific and technical servicesAdministrative and support services
Wholesale tradeElectricity, gas, water and waste services
Arts and recreation servicesRental, hiring and real estate services
Financial and insurance servicesInformation media and telecommunications
MiningAll
Average change April–October from March
Change in November compared to March
Jobs Wages and salaries

Growing the seeds: recovery, strength and capability in Gippsland communities Page 93 of 145
How these estimates flow through to productivity in terms of output and gross value-added is also hard to estimate. Output and value-added measures may have declined faster in percentage terms for sectors where employment has declined. Some may take longer to recover, but it is possible that with international travel being restricted, tourism may recover rapidly.
Figure 40 shows the change in gross value-added for each sector for 2019–20 for Victoria and nationally. This was a period of growth for the first part and contraction for the second, but the State and National figures are fairly similar. The ABS national accounts released quarterly, provide data on changes in household, public and private demand for industry sectors for the state (ABS, 2020c). For example, to the September 2020 quarter, household demand for Arts and Recreation (except that which can be consumed at home) had declined significantly. This was also the case for Accommodation and Food, and Transport services. Victorian household spending declined by 16% over the twelve months to September, and by 1% in the September quarter.
Figure 40: Gross value-added by industry sector for the 2019–20 financial year for Victoria and Australia. Source: ABS, Australian National Accounts: State Accounts 2019–20 financial year.
Agriculture, Forestry and Fishing
Mining
Manufacturing
Electricity, Gas, Water and Waste Services
Construction
Wholesale Trade
Retail Trade
Accommodation and Food Services
Transport, Postal and Warehousing
Information Media and Telecommunications
Financial and Insurance Services
Rental, Hiring and Real Estate Services
Professional, Scientific and Technical Services
Administrative and Support Services
Public Administration and Safety
Education and Training
Health Care and Social Assistance
Arts and Recreation Services
Other Services
-0.4 -0.3 -0.2 -0.1 0 0.1
ppt
0.2 0.3 0.4 0.5 0.6
Victoria Australia

Growing the seeds: recovery, strength and capability in Gippsland communities Page 94 of 145
COVID-safe workplace regulations also affected productivity in most sectors. For Agriculture, the drought had already reduced productivity in Gippsland, and for activities such as grazing, productivity will remain limited until farm infrastructure can be repaired, pastures made more productive, and herd numbers increased. The most recent national accounts showed that agricultural output was high while farmers were offloading stock, but with rainfall they are in recovery and restocking. This will also be the case in Gippsland, as although the long-term drought conditions persist, 2020 has been a normal year for rainfall.
A lack of local, fine-grained data makes it difficult to assess the impact of the fires on top the impacts of COVID-19. Analysis following the Black Saturday fires shows that Agriculture, Forestry and Fishing, and Food and Accommodation (related to Tourism) were the most affected sectors (Ulubasoglu and Onder, 2020). To explore these issues further, we need to address the topic of economic recovery.
RecoveryThe best guide to long-term economic recovery from bushfire in Victoria is contained within an analysis of the Black Saturday bushfires, summarised in the following case study.
Black Saturday Case Study
Ulubasoglu and Onder (2020) surveyed long-term economic recovery following the Black Saturday bushfires by following personal income by sector for burnt and unburnt areas over the following ten years. This was divided into two five-year periods marked by the 2011 and 2016 census, using 2006 as a baseline. They analysed Statistical Areas 2 (SA2), roughly two to four for every LGA, with burnt coverage ranging between 3.4% to 72.2%. The upper limit is slightly less than the area burnt in the eastern half of the East Gippsland Shire (approximately 80%).
Average annual income decreased by 5.1% across all affected areas and for every 10% burnt, average annual income decreased by 5.5%. Low-income earners declined by -8.6% and women by -9.7%, the latter partly due to lower-paying and less-secure occupations. These changes persisted to the 2016 census, with a stronger effect for women, whereas high earner incomes recovered. Agriculture (-23.4% in personal income) and Tourism (-16%) were the two main affected sectors (latter measured by the Accommodation and Food Services Sector). Because there was a 2.5-year gap between the fires in 2009 and the 2011 census, missing the early stages of recovery, these are interpreted as severe impacts. Shorter-term impacts could not be detected within this time interval.
Disasters can also benefit some sectors, especially construction during the rebuilding phase. Ulubasoglu and Onder (2020) matched different types of recovery funding with their specific sector to see which experienced net benefits or loss. Arts and Recreational Services received a short-term benefit and Administrative and Support Services, and Public Administration and Safety benefitted over the full period. The former was supported by recovery programs. They concluded that the recovery policies had a beneficial effect in most areas, but were insufficient to fully compensate for losses to Agriculture and Tourism, along with lower-paid workers in less secure occupations. The persistent disadvantage to women and the lower paid suggests that the more vulnerable members of the population are less likely to recover fully from fires.

Growing the seeds: recovery, strength and capability in Gippsland communities Page 95 of 145
The effects of the COVID-19 pandemic appear to have over-ridden any effect on the fires of the economy of East Gippsland. East Gippsland has experienced similar variations in employment as in neighbouring areas, and also follows the State average small business pattern. This was also the case for employment across four regions within the East Gippsland Shire – the two regions with the most severe fire impacts resembled those that were less affected. The widespread nature of pandemic support – being open to many businesses (though not all), and the additional income support provided by the JobKeeper and JobSeeker payments has provided financial resources that would not otherwise have been available.
Aspects of the economic shock from the pandemic are similar to those from bushfire, but more widespread. For example, the National Tourism accounts for 2019–2020 show that tourism declined nationally by over 17% (ABS, 2020a). More females than males are employed in the tourism sector. Part-time employment for males declined by 8.2% and females by 8.8%, and full-time for males by 4.5% and females by 5.3%. This suggests a similar pattern to the shock following the Black Saturday bushfires. Some groups are more vulnerable to disaster. For example, youth employment in Australia has been hit harder by COVID-19 than overall employment, particularly for females, even though recovery may be to higher levels than before. The employment vulnerabilities and needs of rural youth are different to urban youth, so recovery programs need to account for such differences (Haman, 2021). Older workers also seem to have been more affected.
An important caveat is that the Ulubasoglu and Onder (2020) data was analysed at a much finer spatial scale than the ABS 2020 surveys, requiring the analysis was carried out so as not to identify individuals. The high level of detail currently being collected by the ABS will hopefully become available for sectoral analysis at some future date. As the Ulubasoglu and Onder (2020) assessment looked at an event in 2009 using the 2011 and 2016 censuses, the hope would be that continuous monitoring currently underway can shed more light on the impacts and recovery of both shocks on the economy.
The difference between sector employment and sector productivity during the lockdown remains unclear. The initiatives in Table 5 were mostly designed to maintain employment, but productivity depends on access to inputs and demand for the good and services being produced. Sectoral recovery profiles may vary from sector to sector, and whether a sector is recovering from fire, COVID-19 or both.
To remain profitable over the longer term, industry output and gross value added need to return to sustainable levels. The post-COVID-19 economy may become much more localised due to travel restrictions and limitations on the movement of goods and services, so strengthening local supply chains is a pragmatic strategy. However, in doing so, it is important that they do not become more vulnerable as a result (e.g., by having too little flexibility).
The preceding discussion has been about the economy that can be measured, but the economy that is not so easily measured, the informal economy, is also important, especially because it supports some of the most vulnerable in the community. Its real size is uncertain, and depends partly on how it is defined. It is often associated with the black or illegal economy, but there are other reasons as to why people depend on informal arrangements. For example, businesses that employ family members, additional incomes to sustain households, odd jobs and the barter economy.
Using data from 1999–2010, Australia’s informal economy was estimated to average 13.8%, with unemployment and self-employment its largest determinant compared to taxes and business freedom (Williams and Schneider, 2016). Year-to-year variations are not because people are avoiding tax or due hostile business environments, but are more closely linked to employment opportunities. Higher rates and more secure employment lead to a smaller informal economy, and the employment data shows that those with less secure employment have been more affected by the impacts of COVID-19. The overall health and wellbeing of the under- and unemployed is lower than for the general population in full employment (ABS, 2012), so strict rules for who gets recovery assistance can lead to them missing out after a disaster (Hallegatte et al., 2020). The informal economy also depends heavily on the volunteer economy for in-kind contributions.
Growing the seeds: recovery, strength and capability in Gippsland communities Page 96 of 145
Community contributions to recoveryHere, we briefly survey of the economic value of voluntary contributions through the emergency services and the wider community relevant for recovery. Direct contributions to recovery by the community are provided by volunteers’ time and efforts, cash from fund raising and contributions from NFP enterprises. Social interactions also contribute indirectly to human and social welfare and the environment.
Most data on volunteering is collected by the ABS, either during employment or community surveys and by the census, and by volunteering NFPs. The ABS is in the process of building voluntary labour into the national accounts to get a more complete picture of the overall economy.
The value of CFA volunteers across Victoria in 2001 was estimated as $470 million, equaling a contribution of $8,000 per volunteer (Hourigan, 2001) using a gross-value added method that linked the value of volunteers’ time to paid wages of fire fighters (McLennan et al., 2004). Updated to 2019 dollars, this is about $12,300 per volunteer, totaling $674 million for the 54,621 CFA volunteers in Victoria (CFA, 2019). A similar exercise for the SES in 2002, estimated a value of about $9,450 per volunteer (Percovich et al., 2004) updated to $14,170 in 2019. This would be a $47 million contribution for the State-based estimates of 5,217 volunteers (VICSES, 2019). These studies measured input, so did not consider the benefits provided by emergency services themselves.
A comprehensive analysis of volunteering in Victoria was undertaken by Ironmonger (2012), based on the 2006 Voluntary Work Survey and assessed both formal and informal volunteering. Contributions were calculated using opportunity cost – the amount it would cost if the work was to be done and paid for professionally, rather than replacement cost, which is a straightforward forgone wage of the volunteers. Travel costs were also included. Roughly 50% of volunteers pay their own way in some form (ABS, 2015, 2020f). The result was a contribution $4.9 billion in 2006, about 14% of Victoria’s product. Volunteering to 2006 had been increasing since 1992 (Ironmonger, 2012), but recent data suggest that it has decreased nationally, especially in cities.
The 2019 General Social Survey results reflect a change in how the ABS aggregate data. Regional volunteering activities will not be estimated until four years’ data have been collected due to restricted sample sizes (ABS, 2020f). The most recent data is therefore at the National scale, and we relied on the 2014 and 2010 surveys for greater detail. For the 2019 national survey, 29.5% of people over 15 had undertaken organised volunteering in the previous year, informal volunteering in the past four weeks was 33.5% (the first time this data had been collected), and unpaid work for non-household member over four weeks was 51.5% (ABS, 2020f). For the previous measure of those over 18, organised volunteering had fallen nationally from 34.4% in 2010 to 28.8% in 2019. In 2014, it was 31.3% (ABS, 2015). The unpaid contribution of those over 18 to non-household people had increased from 48.9% to 52.5% over the same period.
Volunteerism in regional areas is higher than in cities, especially the large cities of Sydney, Melbourne and Brisbane. For Victoria in 2010, the rate for Melbourne was 32.6% and elsewhere 45.1% (ABS, 2011). In 2014, it was 29.6% in Melbourne and 39.9% elsewhere, but in outer rural regions, it was 52.6±10.7% (ABS, 2015). This last estimate would have applied to Wellington and East Gippsland. The slightly lower national estimate for 2019 suggests this may have decreased slightly. Therefore, the approximate level of formal volunteering in the region will be close to 50%, informal volunteering nationally is at about one-third, and non-household assistance is provided by about half the population over 15 (many undertaking two or three of these).
Table 6 presents national, state and local estimates for the type of activity people volunteer for. These estimates are based on taking the 2010 data for Victoria and scaling it using the national capital city-regional pattern to provide separate city and country estimates. It was not possible to do this for the 2014 data and the 2019 data does not have that detail. The 2010 results for Victoria regional – relevant for East Gippsland and Wellington – are scaled to a level of 45.1% volunteerism for people aged over 18. It is difficult to extend these to more recent surveys because some of the categories have been changed.
All these activities are relevant to recovery, some more so than others. Welfare/community, sport and physical recreation and emergency services are stronger at the regional scale. In the national figures, welfare has been moved with health in the latest figures, separate from other community groups. The welfare category has declined, but given the level of informal volunteering and non-household assistance reported in the most recent survey, it is possible some of this activity continues, but informally.
Table 7 provides an estimate of the national average number of hours volunteers spend on each type of activity each year. Emergency services and environment/animal welfare have strong commitment and religious and welfare/community activities a lesser amount. We would expect that regional commitments of time would be greater than this, but do not have the data to confirm that.
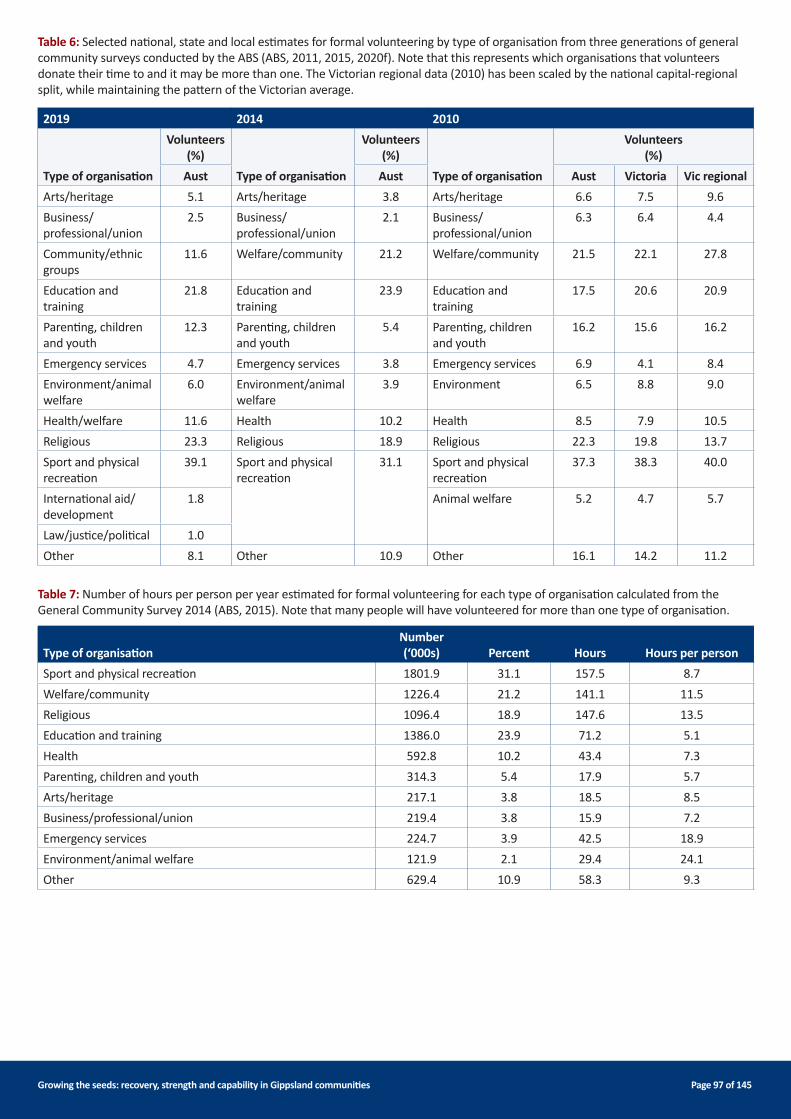
Growing the seeds: recovery, strength and capability in Gippsland communities Page 97 of 145
2019 2014 2010
Type of organisation
Volunteers (%)
Type of organisation
Volunteers (%)
Type of organisation
Volunteers (%)
Aust Aust Aust Victoria Vic regionalArts/heritage 5.1 Arts/heritage 3.8 Arts/heritage 6.6 7.5 9.6Business/professional/union
2.5 Business/professional/union
2.1 Business/professional/union
6.3 6.4 4.4
Community/ethnic groups
11.6 Welfare/community 21.2 Welfare/community 21.5 22.1 27.8
Education and training
21.8 Education and training
23.9 Education and training
17.5 20.6 20.9
Parenting, children and youth
12.3 Parenting, children and youth
5.4 Parenting, children and youth
16.2 15.6 16.2
Emergency services 4.7 Emergency services 3.8 Emergency services 6.9 4.1 8.4Environment/animal welfare
6.0 Environment/animal welfare
3.9 Environment 6.5 8.8 9.0
Health/welfare 11.6 Health 10.2 Health 8.5 7.9 10.5Religious 23.3 Religious 18.9 Religious 22.3 19.8 13.7Sport and physical recreation
39.1 Sport and physical recreation
31.1 Sport and physical recreation
37.3 38.3 40.0
International aid/development
1.8 Animal welfare 5.2 4.7 5.7
Law/justice/political 1.0Other 8.1 Other 10.9 Other 16.1 14.2 11.2
Type of organisationNumber (‘000s) Percent Hours Hours per person
Sport and physical recreation 1801.9 31.1 157.5 8.7Welfare/community 1226.4 21.2 141.1 11.5Religious 1096.4 18.9 147.6 13.5Education and training 1386.0 23.9 71.2 5.1Health 592.8 10.2 43.4 7.3Parenting, children and youth 314.3 5.4 17.9 5.7Arts/heritage 217.1 3.8 18.5 8.5Business/professional/union 219.4 3.8 15.9 7.2Emergency services 224.7 3.9 42.5 18.9Environment/animal welfare 121.9 2.1 29.4 24.1Other 629.4 10.9 58.3 9.3
Table 6: Selected national, state and local estimates for formal volunteering by type of organisation from three generations of general community surveys conducted by the ABS (ABS, 2011, 2015, 2020f). Note that this represents which organisations that volunteers donate their time to and it may be more than one. The Victorian regional data (2010) has been scaled by the national capital-regional split, while maintaining the pattern of the Victorian average.
Table 7: Number of hours per person per year estimated for formal volunteering for each type of organisation calculated from the General Community Survey 2014 (ABS, 2015). Note that many people will have volunteered for more than one type of organisation.

Growing the seeds: recovery, strength and capability in Gippsland communities Page 98 of 145
These estimates show the likely extent of the volunteer or in-kind economy in regions like East Gippsland. It is consistent with the community’s experience with recovery documented earlier in this report. We lack access to data, but it is likely that the COVID-19 lockdowns had a similar impact on the in-kind economy compared to the monetary economy. Support programs included the JobKeeper and JobSeeker payments, expanded eligibility and qualifications to sole traders and carers for those infected or isolated by Coronavirus, and limited economic support and crisis payments (DSS, 2021). The Coronavirus Supplement was $550 per fortnight 27 April to 24 September, $250 per fortnight from 25 September to 31 December, and then $150 per fortnight to 31 March 2021. However, distancing rules meant that the ability of people to carry out volunteer work was limited significantly.
The value of community NFPs and volunteer work during recovery is widely acknowledged, but has not been formally quantified. Box 2 features an economic assessment of the Bairnsdale Neighbourhood House before the fires. This is a non-profit charity that combines three paid positions and has 150 volunteers. The volunteer contributions were assessed at $1.3 million per year for an 8:1 return. With a population of over 47,000, and roughly 37,000 over 18, volunteering rates in the vicinity of 45–50% would generate considerable returns. However, there would be a great deal of effort required to carry that out for all the different activities contained in Tables 6 and 7.
Since the fires, there have been calls to update the Bairnsdale Neighbourhood House and similar community infrastructure because of its long-term presence, effectiveness and knowledge of local communities. The data suggests that the impact of non-paid work may be greater than many people assume, and an investment opportunity as part of recovery.
Bairnsdale Neighbourhood House value assessment
The Bairnsdale Neighbourhood House has been a charity since 1984, has one full-time and two part-time employees and in 2019, had 150 volunteers. This was a big increase from previous years as it provided drought relief using funding provided through Rotary. Its regular program runs food relief for up to 250 people per week, a community café, emergency grocery relief, and group and educational programs. This stretches its capacity to store, prepare and serve food relief.
When the fires occurred, it provided relief from day one. Sikh volunteers used the kitchen to prepare over 15,000 meals over 17 days. They also coordinated and distributed donated goods, many of them perishable relying on the voluntary effort of a range of organisations. This included setting up a mobile coolroom with a generator and distributing meals to remote areas.
A value assessment was conducted in 2019 by Neighbourhood Houses Victoria using established and independent methods. Income was $222,364, sustaining 1.94 full-time equivalent positions, purchasing emergency relief of $24,060 of food and groceries and providing resumé assistance ($720), tax help ($12,000) and community means ($130,560). This was assessed as providing $1,758,696 value including improved quality of life through social connection ($250,068), volunteer contributions ($1,341,288), emergency relief ($24,060) and services of $143,280. This is a return of roughly 8:1 for all funding, and almost 14:1 for Neighbourhood House funding.

Growing the seeds: recovery, strength and capability in Gippsland communities Page 99 of 145
ConclusionsThe aim of the economic analysis was to more fully understand the economic impacts of the double shock of the fires and the COVID-19 on the economies of East Gippsland and Wellington Shires, in particular whether the effects of the fires in East Gippsland can be distinguished from the economic effects of the pandemic, and whether the programs supporting people and businesses during COVID-19 are also playing a role in fire recovery.
The East Gippsland economy can be described as a community-oriented economy, with strong primary production and tourism components dominated by small businesses. Before the fires, the region had experienced strong growth in employment and was well situated for the coming tourist season. The fires interrupted that, but the economy was arguably in a position to recover strongly, especially if well-targeted recovery programs were put in place. Just when recovery would have ramped up after the fires, the COVID-19 pandemic entered its first wave in Victoria. The resulting lockdown had an immediate impact on employment. The employment numbers over the subsequent months showed little difference between the fire-affected areas and more generally, even within the East Gippsland Shire. This indicates that for employment, the driving factors were the JobKeeper and associated programs rather than the fires. We do not have access to how much has been spent on fire-recovery programs within the region, but this has had little impact on published employment numbers.
Employment numbers through to the relaxation of lockdown rules in spring 2020 are consistent with the COVID-19 response. Increases at the end of this period suggest preparation for a domestic tourism surge. COVID-19 and its responses have masked the impacts of the fires in the economic data that has become available to date, but such impacts may emerge over time. For example, after drought and fire, livestock agriculture will be rebuilding herds and this is already evident in higher meat prices. Offloading stock during drought leads to lower meat prices and rebuilding raises meat prices. The long-term outcome will be evident when production and the market are reconciled. Those who were burnt out will take longer to catch up. This issue of impacts being masked, rather than non-existent, probably applies in a range of sectors.
Table 8 describes the major impacts and issues affecting recovery for both bushfire and pandemics for the 20 industry sectors assessed in the project, along with the volunteer economy. It is a snapshot view only, and much more needs to be learned before such a table can be filled out in detail.
Table 8: Major impacts and issues affecting recovery for bushfire and pandemics, with reference to their exposure in the East Gippsland Shire.
Sector Bushfire Pandemic Presence in regionAgriculture, Forestry and Fishing
Agriculture: direct damage takes years to recover pasture, tree and vine crops, build up livestockForestry: 59% of planned logging next five years burnt. Salvage logging short-term
Workplaces generally COVID-safe
Disrupted supply chains for agriculture. Second income for agriculture also at risk (e.g., tourism, farm gate sales, casual work)
High
Mining Direct damage (can be severe) Disrupted supply chains LowManufacturing Limited to direct damage,
access to supply chainReduced production due to COVID-safe workplaces, food production higher risk, may need surge capacity for some goods
High
Electricity, Gas, Water and Waste services
Direct damage, may require adaptation to better standards
Change in consumption patterns due to reduced commercial and increased household use. Some changes may be permanent
Low for employment, moderate for output
Construction Direct benefit from rebuilds in damaged areas
Reduced productivity due to COVID-safe workplaces. HomeBuilder grants also take up limited industry capacity
High
Wholesale trade Direct damage, short-term transport disruptions
Change in consumption patterns, COVID-safe workplace effect on productivity, online-sourced wholesale trade increased
Low
Retail trade Direct damage, stock loss, short-term fire relief but risk if underinsured
Reduced trade for non-essential goods, those without online presence disadvantaged, casuals laid off. Highly reliant on tourism for recovery
High
Accommodation and Food services
Direct impacts, possible loss of income for a season
Lockdowns can halt accommodation, severely interrupt food services, post-lockdown likely to surge
High

Growing the seeds: recovery, strength and capability in Gippsland communities Page 100 of 145
Transport, Postal and Warehousing
Direct damage, short-term transport disruptions
Some areas benefit, but workplaces need to COVID-safe and delivery contactless, buying patterns may change
Moderate
Information Media and Telecommunications
Essential during events and afterwards, but limited economic effect
Unclear, the sector has been affected severely, demand for freelance work drops
Low
Financial and Insurance services
Some boost post-fire due to insurance, refinancing, etc.
Considerable boost for those explaining complex financial arrangements to business, refinancing needed due to business interruptions
Low
Rental, Hiring and Real Estate services
Direct damage, some boost during rebuild, especially plant hires
Complex, renters undergo hardship, property sales slow, plant hiring slows – post-lockdown seeing boost in regional real estate
Low for employment, moderate for output
Professional, Scientific and Technical services
Technical services required for recovery in some areas
Biomedical services at a premium, other areas may slow as private sector slows and government concentrates on pandemic management
Moderate
Administrative and Support services
Benefits during the recovery phase
Some areas decline, but others increase including cleaning, security, contact tracing
Moderate
Public Administration and Safety
Benefits during the recovery phase
Government focus on pandemic increases substantially, moving resources from other areas
Moderate
Education and Training
Direct damage may require recovery, pastoral care may be needed for students
Lockdowns affect casual staff; tertiary education suffers from loss of international students
High
Health Care and Social Assistance
Needed for short-term recovery both physical and mental
Pressure is on the whole sector, displacing normal medical treatment and needing a high level of management to cope with heightened risk. Prolonged effects inevitable even if cases kept low
High
Arts and Recreation services
Can benefit from short-term programs, but can be disadvantaged long-term
Devastated by restrictions on performance and supervised activities, lockdown, limited government support
Low, highly exposed to tourism
Other services Direct damage and disruption As most are personal services, this sector suffers from lockdown and recovery can be slow
Moderate
Tourism Direct damage and loss of up to a season, direct damage takes longer to recover from
Devastated by lockdowns. Lack of international travel will mean a concentration on domestic tourism for some time, positive outcomes possible
High
Volunteer economy Essential during the recovery process, burnout a risk
Severely affected by lockdowns and social distancing rules, some allowance has been made for care for others, but income support being tapered off, burnout and exhaustion a risk
High
The analysis has provided some insights into some of the strengths of recovery programs, particularly those aiming to sustain employment during the COVID-19 pandemic. In other areas, there are gaps in the data, or little data at all and the community survey plays a complementary role. It is important to identify where different recovery strategies are complementary, competing or neutral. For example, on page 7, the HomeBuilder scheme is reported as competing with post-fire reconstruction. The construction industry in Figures 39 and 40 has declined slightly during the COVID-19 period, indicating competing demands for a reduced capacity.
In the transition between lockdown and inoculation being the primary management strategy for COVID-19, significant parts of the economy have been reset, some temporarily, but others may be permanent. East Gippsland Shire faces two types of recovery and Wellington Shire one, although they were indirectly affected by the fires and some areas are recovering from fires in early 2019. The economic aspects of recovery, particularly those that take in the informal and volunteer economy, remain important because the current situation is unprecedented.

Growing the seeds: recovery, strength and capability in Gippsland communities Page 101 of 145
In accounting for possible economic impacts of the fires, COVID-19 and the nature of recovery, the following factors stand out:n The two sectors showing the most long-term vulnerability after past recovery efforts – Agriculture and Tourism
(Ulubasoglu and Onder, 2020) – are the first and third largest sources of employees in East Gippsland Shire.n The two sectors that are understood to contribute the most to the Tourism sector, Accommodation and Food, and Arts
and Recreation services have experienced the largest declines in employment across Victoria during 2020. This will include Tourism in East Gippsland and Wellington Shires, and is consistent with anecdotal evidence.
n The available data for agricultural output is too coarse to show changes in East Gippsland. With 17% of agricultural land in East Gippsland damaged, and accompanying stock and infrastructure losses, any effect may not be picked up by the available data. This may also be the case for some other sectors.
n Despite the initial shock in March 2020, COVID-related support has contributed to similar levels of employment in fire-affected areas compared to adjacent non-affected areas.
n Those with less secure employment – the young, the elderly, and females – have been more affected by employment downturns, and those in the age bracket 25–55 have been least affected. This reflects similar patterns to those seen after other disaster events.
n Despite employment losses being minimised for many sectors, productivity has declined, which will affect ongoing business profit and loss. This will require sufficient improvement in productivity to support expenses once employment subsidies are removed. This also does not include productivity losses and recovery needs due to the impacts of fire. Therefore, recovery over the next two to three years will be critical to long-term recovery.
n The return to normal activity in Victoria with international travel almost completely stopped is resulting in additional demand for domestic tourism. This provides an opportunity to return to peak levels and beyond. When tourism accounts are mapped according to employment patterns, it ranks as the sixth largest sector for output and the eighth largest for value-added in East Gippsland. Value-added production from Tourism is about 40% of output. Ensuring that inputs are locally sourced will benefit the supplying industries, increasing the contribution tourism makes to the local economy. For example, increasing the content of locally grown food will benefit agriculture and manufacturing (via food processing).
n Targeted support for the informal and volunteer economies is essential for effective long-term recovery.

Growing the seeds: recovery, strength and capability in Gippsland communities Page 102 of 145
ReferencesAustralian Bureau of Statistics (ABS). (2011). Voluntary work Australia 2010. 4441.0, Canberra.
ABS. (2012). Australian health survey: nutrition – state and territory results, 2011–12. 4364.0.55.009 Data Cube, Canberra.
ABS. (2015). General social survey summary results Australia. 4159.0, Canberra.
ABS. (2020a). Australian national accounts. Tourism satellite accounts 2019–2020, Canberra.
ABS. (2020b). Australian national accounts: input-output tables, 2017–18 5209.0.55.001, Canberra.
ABS. (2020c). Australian national accounts: national income, expenditure and product. 5206.0, Canberra.
ABS. (2020d). Australian national accounts: state accounts. 5222.0, Canberra.
ABS. (2020e). Economic measurement during COVID-19: selected issues in the economic accounts. 5261.0, Canberra.
ABS. (2020f). General social survey summary results Australia. 4159.0, Canberra.
ABS. (2020g). Labour force, Australia. 6202, Canberra.
ABS. (2020h). Methods changes during the COVID-19 period. 1359.0, Canberra.
ABS. (2020i). Weekly payroll jobs and wages in Australia. 6160.0.55.001, Canberra.
Country Fire Authority. (2019). Annual report 2018–19, Victoria.
Department of Social Security. (2021). Social security guide. Guides to social policy law, Australian Government, Canberra. Retrieved from: https://guides.dss.gov.au/guide-social-security-law/coronavirus
Economic Recovery Working Group. (2020). East Gippsland fires 2019–20. Economic recovery sub-plan (p57), East Gippsland Shire Council, Victoria.
EGRC. (2020). East Gippsland Bushfire Recovery Committee Chair’s Report (p43), East Gippsland Shire Council, Victoria.
Hallegatte, S., Vogt-Schilb, A., Rozenberg, J., Bangalore, M., and Beaudet, C. (2020). From poverty to disaster and back: a review of the literature. Economics of disasters and climate change, 4(1), 223–247.
Haman, O. B. (2021). ‘Australian young people and COVID-19: unemployment, government interventions and exclusion’. In Köleoğlu, N., and Agolli, L. (Eds), Socio-economic impacts and challenges of COVID-19 (pp143–162), Rating Academy Publishing, Turkey.
Hourigan, M. (2001). ‘The value of the volunteer contribution consultants report to the Victorian Country Fire Authority’, cited in CFA submission to the Economic Development Committee of the Parliament of Victoria, Country Fire Authority, Victoria.
Inspector-General for Emergency Management. (2020). Inquiry into the 2019–20 Victorian fire season. Phase 1 community and sector preparedness for and response to the 2019–20 fire season, No. 978-1-922262-32-5, Victoria.
Ironmonger, D. (2012). The economic value of volunteering in Victoria.
Jackson, L. M., and Shepherd, A. F. (2018). We learn as one: Victoria’s journey to collaborative lessons management. Australian Journal of Emergency Management, 33(2), 23–26. doi:10.3316/informit.588943713564648
McLennan, J., Acker, F., Beatson, R., Birch, A. and Jamieson, R. (2004). Volunteer recruitment and retention issues: A review of the literature (p92), La Trobe University and Bushfire and Natural Hazards Cooperative Research Centre (BNHCRC), Melbourne.
National Skills Commission. (2020). Small Area Labour Markets (SALM), June Quarter 2020, Canberra.
Percovich, O., Bennet, J., and Handmer, J. (2004). Valuing the SES: the social value of volunteering in the state emergency services, Emergency Services Australia Project No. 07/01, Centre for Risk and Community Safety, RMIT University, Melbourne.
REMPLAN. (2020). REMPLAN Economy. Retrieved from https://www.remplan.com.au/economy/
Ulubasoglu, M. and Onder, Y. (2020). Disasters and economic resilience: the effects of Black Saturday bushfires on individual income (p76), BNHCRC, Melbourne.
Victoria State Emergency Service. (2019). Victoria State Emergency Services Annual Report 2018–2019, Victoria.
Williams, C., and Schneider, F. (2016). Measuring the global shadow economy: the prevalence of informal work and labour, Edward Elgar Publishing, UK.

Growing the seeds: recovery, strength and capability in Gippsland communities Page 103 of 145
Appendices

Growing the seeds: recovery, strength and capability in Gippsland communities Page 104 of 145
Appendix A1: Perspectives represented in community survey
Different perspectives from which community members viewed strengthsTeacher Not-for-profit organisationSocial enterprise entrepreneur EntrepreneurParent EnvironmentalistCommunity development MusicianCommunity volunteer Business support consultant Community program leader Business ownerLandCare Peak body consultantFarmer TourismSingle parent Community church memberResident who identifies with a disability Manager of community organisationVolunteer Retired doctorEmergency management agency volunteer Health care workerAmbulance Local government employeeAboriginal organisation AcademicTheatre maker Small community residentLocal government Remote community residentMentor Regional town residentRelief worker Regional city residentBushfire recovery officer Rural residentFinancial counsellor Retired economist Writer Asylum seeker support network memberBartender CALD community memberManager of neighbourhood houseFarmerRecovery committee memberCarer AdvocatePriestPastoral carer
Demographics of interviewees Twenty-five people participated in the interview process. In terms of those who participated in the focus groups and interviews, the largest group of participants was the 25–40 year age range and the smallest the 80+ age range (Figure A1, overleaf). Eighty-four percent lived within the East Gippsland or Wellington Shires, with over two thirds of participants being from remote communities. Sixty-eight percent were female and thirty-two percent were male. In terms of directly impacted and indirectly impacted communities, forty percent of interviewees were directly impacted.

Growing the seeds: recovery, strength and capability in Gippsland communities Page 105 of 145
Figure A1: Age of participants participating in interviews and focus groups.
25–40
50–70
60–80
80+
8%
51%
38%
23%

Growing the seeds: recovery, strength and capability in Gippsland communities Page 106 of 145
Appendix A2: Questions for interviews1. Interviewee gender/age/employment status
2. Cultural origin (voluntary)
3. Cultural identity (voluntary)
4. Gender (voluntary)
5. Age category
6. Who would you consider to be your community?
7. How would you describe this community? (What is their strength, what aspects might they need to strengthen?)
8. Since the bushfires has anything changed for your community? If so, what?
9. Do you have concerns about your community since the bushfires?
10. What does recovery mean to you?
11. What strengths within the community since the bushfires have helped you?
12. What has had the most positive impact?
13. What has been the most challenging for your community since this event?
14. What is most important for you at this point in time?
15. What do you think will be important over the next five years to support community strengths?
16. What would be the most useful to you now?
17. Who would be best person for you to receive this from?
18. How would you like to receive it?
19. To what extent is your community involved with support agencies?
20. What has been useful?
21. What would you like to see more of?
22. Is there anything that would you like to see less of?

Growing the seeds: recovery, strength and capability in Gippsland communities Page 107 of 145
Appendix B: Community self-assessment of capabilities and their status
Theme Type Category Community-based assets Status1. Local knowledge Technical knowledge Know-how Residents with experience of specific equipment
such as graders, experience of working with government, farmers, builders, loggers
Maintained
2. Local knowledge Knowledge of individuals in communities and local relationships
Enabling Community groups, neighbourhood houses, local community at a micro-level, remote communities, locally-based community organisations, small communities, community-based groups, farmers, families, residents
Maintained
3. Local knowledge Cultural knowledge Enabling Aboriginal communities and cooperatives, CALD communities, community interest groups, faith organisations, local community members, knowledge holders
Variable
4. Local knowledge Knowledge of local environment
Enabling Loggers, farmers, Aboriginal community, aquaculture, environmental workers, residents
Maintained
5. Local knowledge History of the region Enabling Older members of the community, knowledge, Aboriginal communities, intergenerational family knowledge, researchers
Maintained
6. Local knowledge Land management knowledge and skills
Know-how Farmers, Aboriginal communities, aqua culturists, forestry, long-term residents, locally-based environment managers
Maintained
7. Local knowledge Experience of bushfire response and recovery
Know-how Volunteers, forestry, industry, farmer, community groups
Variable
8. Local knowledge Health of the local communities and individuals
Enabling Community groups, neighbours, small communities, health providers, local government, GPs, health care networks, carers
Increased
9. Local knowledge Risk management of day-to-day risks
Know-how Local residents, businesses and organisations in communities, farmers, biohazard/disease management
Increased
10. Local knowledge Knowledge sharing networks for local knowledge (formal)
Enabling Volunteering organisations and committees, locally-based NGOs, interest groups, research-led networks, business-based networks
Variable
11. Local knowledge Community knowledge stewardship
Enabling Elders of the community, Aboriginal people, intergenerational residents, knowledge stewards
Maintained
12. Communication Local knowledge sharing(informal)
Structure Social
Business networks, volunteering networks, neighbourhood house network, pubs, day-to-day conversations
Variable
13. Communication Newsletters and local news
Enabling Community groups of interest, faith groups, local newspapers and newsletters
Increased
14. Communication Online communication Enabling Facebook, online networks, email, Zoom Increased15. Communication Radio networks Structure
BuiltTelecommunication structure Maintained
16. Communication Face-to-face (physical communication/touch)
Enabling Individuals having ‘cups of tea’, networks, local community organisations, businesses
Decreased
17. Communication Listening skills Know-how Community organisations, volunteers, individuals, support agencies, faith groups, support personnel, artists.
Variable
18. Communication Advocacy Know-how Community organisations and committees, volunteers, individuals, support agencies, carers, business owners
Increased
19. Communication Communication with government support agencies
Know-how Individuals, committees, local organisations committees, disabled community, advocates, businesses, farmers, skilled retirees
Increased

Growing the seeds: recovery, strength and capability in Gippsland communities Page 108 of 145
Theme Type Category Community-based assets Status20. Communication Negotiation Know-how Local leaders, elders of the communities.
committees, skilled retireesVariable
21. Communication Bureaucracy broking Know-how Skilled volunteers, community organisations, advocacy groups, committees and skilled retirees
Increased
22. Communication Storytelling Know-how Community organisations, local authors and artists, individuals within the community
Variable
23. Communication Trusted sources of information
Enabling Family, local community,, community organisations in local areas, local Facebook groups, local networks, ABC radio
Maintained
24. Networks Networks external to an individual community
Enabling Arts, business, farmers, faith-based organisations, tourism, interest groups
Increased
25. Networks Local community relationships
Enabling Family, neighbours, small communities, local businesses, neighbourhood houses
Variable
26. Networks Collaborative alliances and networks
Structure Socioeconomic
Community and volunteer groups, neighbourhood houses, business alliances
Increased
27. Networks Meeting places Structure Built
Sale yards, business offices, sporting clubs, local government buildings, pubs, men’s sheds, schools, places of worship, opshops, cafés
Maintained
28. Networks Trusted relationships Enabling Volunteering organisations, neighbourhood houses, schools, sporting clubs, family, local support, people in the community
Maintained
29. Community leadership
‘Elders’ of the community Structure Social
Long-term and intergenerational residents, Aboriginal elders
Maintained
30. Community leadership
Faith leaders Structure Social
Different religious organisations and networks Maintained
31. Community leadership
Women leaders Structure Social
Older women, leaders of women’s groups, networks and committees, Gippsland Environmental Agency Women’s Leadership Team
Increased
32. Community leadership
Programs Enabling Gippsland Community leadership program, Victorian Rural Women’s Leadership and Mentoring Program
Maintained
33. Community leadership
Business and industry leaders
Structure Economic
Farmers, small business owners, social enterprise business owners, tourism operators
Increased
34. Community leadership
Leadership in Aboriginal communities
Structure Social
Aboriginal elders, representatives on committees Increased
35. Business Enterprise Know-how Farming, tourism, health, forestry, small businesses
Increased
36. Business Business acumen Know-how Farmers, business networks, artists, retirees, local consultants
Increased
37. Business Established industries Structure Economic
Farming, tourism, health, forestry, logging aquaculture
Variable
38. Business Innovation/creativity Attribute Locally-based, business owners, farmers, artists, NFPs, artists, catalysts for change
Variable
39. Business Social enterprises Structure Economic
Artists, community organisations, locally-based industry, nature-based tourism and NGOs
Variable
40. Business Catalysts for change Enabling Businesses, artists (e.g., The Slipway initiative), environmentalists, Aboriginal communities
Increased
41. Resilience Experience of previous bushfires and recovery
Know-how Individuals (e.g., farmers, EM volunteers, EM committees), local government, support agencies such as the Red Cross and external volunteering agencies (e.g., Blazeaid and CWA)
Maintained
42. Resilience Resourceful Attribute Community organisations, artists, farmers, small business
Variable
43. Resilience Adaptive Attribute Some small business owners, residents, organisations, farmers
Variable

Growing the seeds: recovery, strength and capability in Gippsland communities Page 109 of 145
Theme Type Category Community-based assets Status44. Resilience Community connectivity –
(face-to-face/physical)Enabling Small communities, local community, micro-
communities street level, familiesVariable
45. Resilience Natural environment Structure Environmental
Green spaces, healthy lakes, animals Decreased
46. Resilience Local level organising,planning and coordination
Know-how Farmers, forestry, local EM agencies committee, local government, individuals, community organisations, community led groups (e.g., MADRA, households, individual communities)
Variable
47. Resilience Caring Attribute Communities and individuals, local organisations and businesses, families
Variable
48. Resilience Compassionate/empathic
Attribute Individuals within the community and those that support them
Increased
49. Resilience Online connectivity Enabling Facebook, emails, Zoom Increased50. Resilience Emotional stamina Attribute Communities and individuals, local organisations
and businessesDecreased
51. Resilience Proactive Attribute Local residents, community organisations, businesses and individuals
Variable
52. Resilience Hopeful Attribute People within communities Maintained53. Resilience Supportive Attribute Local communities and residents, local
organisations, businesses, farmersDecreased
54. Resilience Independent Attribute Communities and local residents, particularly those in remote communities, local organisations
Variable
55. Resilience Community gatherings Enabling Local festivals, community events, sporting events, competitions
Decreased
56. Resilience Generosity and kindness Attribute People, communities and organisations Increased57. Resilience Physical stamina Attribute People within communities Decreased58. Resilience Financial resources Enabling Business, industry, family, donations, loans Decreased59. Provision of support/care
Volunteering organisations
Structure Social infrastructure
Blazeaid (travellers), CWA, CFA, SES, Rotary, Probus, RSL
Decreased
60. Provision of support/care
Local health providers Structure Social infrastructure
Primary Care Partnerships, Healthcare centres, bush nurses, private health care providers, GPs
Variable
61. Provision of support/care
People in the community Enabling Local community, families, neighbours, carers Decreased
62. Provision of support/care
Local community organisations
StructureSocial/social infrastructure
Advocacy groups, sports clubs, cooperatives, neighbourhood houses, volunteers
Decreased.
63. Provision of support/care
Small businesses and established industries
StructureEconomic
Tourism and hospitality, local shops and pubs, family-run businesses, farmers
Decreased
64. Provision of support/care
Aboriginal, CALD and disability support agencies
Structure Social infrastructure and social
Health providers, bush nurses, aboriginal organisations, asylum seeker networks, disability support agencies and advocates
Decreased
65. Provision of support/care
Faith-based organisations and groups
Structure Social
Local church communities, local physically-based faith networks, faith-based groups (e.g., Sikh community and church-based groups), volunteers
Decreased
Reference: MacQueen, K M., McLellan, E., Metzger, D S., Kegeles, S., Strauss, R P., Scotti, R., Blanchard, L., and Trotter, R T. (2001, December). What is community? An evidence-based definition for participatory public health. Am J Public Health, 91(12), 1929–38. doi: 10.2105/ajph.91.12.1929. PMID: 11726368; PMCID: PMC1446907.

Growing the seeds: recovery, strength and capability in Gippsland communities Page 110 of 145
Appendix C: Key activitiesThe following activities were undertaken as part of our research:1) Initial informal conversations with our stakeholders and established contacts within the Gippsland region.2) A literature review that included a desktop review of current local strategies.3) A 90-minute online forum was undertaken on Sunday 20 September 2020 to facilitate a community conversation. The
forum was co-developed by the research team with VCOSS, HIC and Emergency Management Victoria (EMV). It was facilitated by Steve Cameron from EMV. Twenty people participated. Key exercises for the day included the following:• An introduction to the study and the activities for the day• Three breakout groups discussions of where each group was asked one or more of the following questions, and
whilst each room had a different focus many spoke of issues that cut across all three domains. The prompting questions asked were: > Thinking a few years ahead (say, 5–10 years) to where you want to be – personally and as a community > What are the strengths you need to build on and what strengths might you need to develop? > What do you need to get there (e.g., skills, connections, people)? > What challenges are you likely to face?
• Large group discussion to feedback4) A 10-minute online survey of 614 residents of bushfire affected regions in New South Wales and Victoria that was
undertaken using established community panels. Questions were derived from key themes elicited during the community forum and initial interviews. (For questions see Appendix D.)
5) Twenty semi-structured interviews were undertaken with individuals and small focus groups of between 2–5 participants. (For questions see Appendix D.)
6) Follow-up conversations to clarify aspects of the interviews with some participants were also undertaken.7) An economic assessment using ABS data and a review of publicly available documents, data and materials provided by
members of the Gippsland community.8) Review by research participants.

Growing the seeds: recovery, strength and capability in Gippsland communities Page 111 of 145
Appendix D: Survey and interview questions
Online survey questions1. Were you directly impacted by last summer’s bushfires (e.g., if you were evacuated or lost property)?
Yes No (if ‘No’, they go to Q2)
2. Were you indirectly impacted by last summer’s bushfires (e.g., business and life disrupted, friends or relatives directly impacted)?Yes No (If ‘No’ to both Q1 and Q2 – drop from the questionnaire.)
Demographics1. What is your age?
Under 1818–2425–3031–4041–5051–6061–70Over 70
2. What is your gender?FemaleMaleOtherRather not say
3. Do you identify with any cultural background? (Voluntary question)NoYes, ________________________
4. Do you identify as having a disability?NoYesRather not say
5. What is your postcode? Programming: terminate if the respondent does not belong in postcode list____________
6. How long have you lived in your current location?1 year or less (If so, have you recently moved your location as a result of the 2019–20 bushfires?) 2–3 years4–5 years6–9 years10–14 years15–20 yearsOver 20 years

Growing the seeds: recovery, strength and capability in Gippsland communities Page 112 of 145
Main questions1. Who do you most consider your community?
Online friendsPeople who live in the same location as meMy familyPeople who do similar work to me, or those I work withPeople I share common interests and activities with
2. Do you feel that the recent bushfires were different to previous bushfires?A lot A little Not at all If a lot or a little how? ____________________________
3. What strengths do you think your community showed following the bushfires? (multiple answers allowed)Social connectionsResilienceGenerosity and kindnessCreativityActive volunteeringEnterprisingCollaboratingSharing knowledge Strong leadership Organisation skillsFundraisingOther ______________________
4. What are the main challenges you have faced since the bushfires? (multiple answers allowed)Not being able to connect to others physically Not being able to connect to others due to lack of internet Too many people offering help. Not enough people offering the right help Overall fatigue Being isolatedDamage to the environmentNot being able to get basic necessitiesLack of moneyAnxietyDiscriminationConflictIllnessCOVID-19 impactsOther ________________
5. How well were you communicated with after the bushfires? Too much information Confusing information from too many different organisationsThe right information, but not at the right timeThe right information at the wrong timeNot enough informationOther ___________________

Growing the seeds: recovery, strength and capability in Gippsland communities Page 113 of 145
6. What is most important to you at the moment? (tick all that apply)MyselfMy familyHealthMental healthHaving a home Employment Food on the tableAccess to knowledgeAccess to support servicesMoney Internet accessOther ____________________
7. Who would you like to communicate with you in relation to these needs? (tick all that apply)Federal government agenciesState government agenciesLocal governmentCommunity groupsChurch groupsEmergency services groupsOther _____________________
8. And how would you prefer they communicate with you? (tick all that apply)Local community membersFamily membersYour friendsCommunity meetingsThrough the postTV and radioNewspaper advertisementsDoor knockingEmailApps on my phoneFace-to-face at community centresOther ________________________
9. When you think of the next five years do you feel? Very positivePositiveNeither positive nor anxiousAnxiousVery anxious(If very anxious, what are your key worries?__________________________)

Growing the seeds: recovery, strength and capability in Gippsland communities Page 114 of 145
10. What words best describes your community towards the end of 2020 (choose up to three answers)StrongerHopefulMore collaborativeRecoveringResilientFatiguedFearfulWorriedAnxiousIn conflictFinancially troubledFar from recoveringLess strong than previouslyOther _______________
11. What strengths do you think are most needed by your community now? (multiple answers allowed)Social connectionsResilienceGenerosity and kindnessCreativityCompassionActive volunteeringEnterprisingCollaboratingSharing knowledge Strong leadership Organisation skillsFundraising Other ______________________
Thank you for your time.

Growing the seeds: recovery, strength and capability in Gippsland communities Page 115 of 145
Appendix E: Companion process for measuring capability
This companion process that focuses on capabilities and community-based assets can be integrated alongside those currently in place, and can be an ongoing or discrete activity that is triggered by a natural hazard event or economic, social or environmental shock.
Figure E1: Capabilities companion process for recovery
This process has four tasks:1. Assess context, capabilities and assets to identify where they exist, who owns them, the role they play and the current
context and needs. 2. Evaluate where capability strengths exist, and identify opportunities and barriers related to these capabilities and
capability gaps.3. Develop programs and activities that leverage current capabiilty/strengths, and address capability gaps and needs in
collaboration with the community.4. Implement programs and activities led by community with support from agencies and government.
The frequency of cycles would be determined by the end user and is dependent upon need. For example, if it is activated when a shock occurs such as the pandemic, there may be value in assessing these capabilities more regularly to provide insight into their status and the impact on the recovery process. These tasks could also be integrated into the recovery process and used as one of the measures of community progress towards recovery.
Assess context, capabilities and assets
Develop programs and activities
EvaluateImplement programs and activities
Growing the seeds: recovery, strength and capability in Gippsland communities Page 116 of 145
Appendix F: Strategies influencing recovery
StrategiesThe overarching plan for the Gippsland region is the Gippsland Regional Plan 2020–2025. It is a collaborative effort from local government, state bodies and local groups. The target is a vision of Gippsland in 2040, and the strategy covers the years above. It is organised into the following themes: collaborators and partners; carers of our country, environment and natural assets; creators of a new economy; a connected Gippsland; highly educated people, lifelong learners; and a healthy, happy inclusive community. It is notable that emergency management of natural hazards does not feature in this plan.
A number of other strategies and plans contribute to this:n Developing and implementing an approach to regional innovation and development in Gippsland, Victoria (2018–2020).
(Gippsland Smart Specialisation Strategy, modelled on the EU’s Smart Specialisation program, 2020)n Accelerating growth for Gippsland food and fibre industry – Food and Fibre Gippsland. Auspiced and run by Food and
Fibre Gippsland, (KPMG, 2019)n Gippsland regional digital plan. (Gippsland Regional Partnership, 2019)n Towards 2030 Gippsland destination management plan: a blueprint for growth. (TRC Tourism Pty Ltd, 2019)n Regional action plan: embedding GROW principles across the Gippsland region. (ArcBlue Asia Pacific and Latrobe Valley
Authority, 2018)
State government State government-related recovery plans are the Eastern Victorian fires 2019–20 state recovery plan (BRV, 2020) and Recovery framework (BRV, 2020):n Represent the NBRA at community forums and events, either individually or as a member of a small team.n Support local councils in bushfire recovery efforts.n Work in close consultation with local council Community Recovery Officers.
Local Economic Recovery Program (NBRA and BRV): n Local Community Project Grants ($38 million).n Regional Economic Stimulus and Resilience Grants ($34 million).n Regional Economic Programs Fund ($8 million).
Eligible topics: enabling infrastructure, industry and business development, social development, natural environment and resource development, built environment adaptation, Aboriginal culture and healing.
The East Gippsland Recovery 2030 Plan (Chester, 2020) has been developed to support the overarching recovery strategies and focuses on a holistic recovery process which is community led. The five pillars (Table F1, overleaf) of the plan are supported by stakeholders from across the three levels of government, non-government organisations, and community committees. Five working groups have been established to support this (Table F1).
The formal governance developed aims to ‘work alongside existing local networks with and between communities, and between individuals and community groups’.
Community recovery committees have, or are being, established for the following regions to support the delivery of programs and recovery activities within the region in the following locations:n Bruthenn Buchan, Gelantipy and Districtsn Cann Valleyn Clifton Creekn Mallacoota and Districtn Omeo, Cobungra, Swifts Creek and Ensayn Orbost and Districtn Sarsfieldn Errinundra to Snowy; Wairewa.

Growing the seeds: recovery, strength and capability in Gippsland communities Page 117 of 145
Table F1: Fire recovery working groups (East Gippsland Shire, 2020, p26)
Social Economic Culture and healing Built NaturalTo support the emotional, social, spiritual and physical wellbeing and financial recovery of individuals, families and communities
To build a business community and local economy that is stronger and more resilient than before the fires
To ensure that Aboriginal culture and participation is prioritised in recovery, that healing is supported and that support service are culturally safe
Ensure assessment, and implementation of recovery and rebuild of residential housing, commercial, industrial buildings, key infrastructure assets such as roads, bridges and public spaces, telecommunications, energy services, drinking water and sewerage and transport
To manage the environment allowing ecosystems to recover and risks to the natural values and communities to be reduced through targeted intervention
East Gippsland Shire Council,Bushfire Recovery Victoria, Department of Health and Human Services, Department of Education and Training, Australian Red Cross, Victorian Council of Churches, Salvation Army,Lifeline,Rural Financial Counselling Service, Anglicare,Windermere, Child and Family Services, Gippsland Lakes Complete Health, Gippsland and East Gippsland Aboriginal Co-Operative (GEGAC),Regional Arts Victoria, Bairnsdale Regional Health Service,East GippslandPrimary Care Partnership,Gippsland Primary Health Network, Relationships Australia, St Vincent de Paul
Department of Jobs, Precincts and Regions, Regional Development Victoria, Agriculture Victoria Forestry and Game,Small Business Victoria,Bushfire Recovery Victoria, East Gippsland Shire Council, Destination Gippsland, Committee for Gippsland, Food and Fibre Gippsland, Federation University, Gunaikurnai Land and Waters Aboriginal Council (GLaWAC), Victorian Chamber of Commerce and Industry, Bonaccord Freightlines
Gippsland Alliance G5 (Unofficially called G6), Gunaikurnai Landand Waters Aboriginal Corporation GLaWAC), Taungurung Land and Waters Council, Far East Gippsland Representative, Gippsland and East Gippsland Aboriginal Cooperative (GEGAC), Yoowinna Wurnalung Aboriginal Healing Service, Moogji Aboriginal Council East Gippsland IncLakes Entrance, Aboriginal Health Association Lake Tyers Health and Children’s Service, Lake Tyers Aboriginal Trust, Ramahyuck District Aboriginal Corporation First Peoples Assembly, Mungabareena Aboriginal Corporation Albury Wodonga, Aboriginal Health Service,Traditional Owners representatives from unformalised RAP Country
East Gippsland Shire Council, Bushfire Recovery Victoria, AusNet Services Development of Transport,Department of Environment Land Water and Planning, East Gippsland Water, Environment Protection Authority Victoria, Parks Victoria, NBN Co,Regional Roads Victoria
Landcare Network,Parks Victoria, Environment Protection Authority, East Gippsland CMA, East Gippsland Shire Council,Bushfire Recovery Victoria, East Gippsland Water, Federation University Australia,Gunaikurnai Landand Water Aboriginal Corporation, Department of Environment Land Water and Planning, Department of Jobs Precincts and Resources (Agriculture Victoria)

Growing the seeds: recovery, strength and capability in Gippsland communities Page 118 of 145
Current financial supportPrograms that provide financial support include the following:n Grants for local government and community service organisations This program offer grants for Local Government Authorities and Community Service Organisations to help councils,
charities and community organisations support recovery, redevelopment and resilience after the 2019/20 Victorian Bushfires, and to build capacity and preparedness for the future.
n Victorian Bushfire Appeal – BRV The Victorian Government has partnered with Bendigo Bank and The Salvation Army to establish the Victorian Bushfire
Appeal. 100% of donated funds will go directly to communities in need. The Victoria Bushfire Appeal will support those most affected by the bushfire with over $5 million available by providing the following:> Payments to families – immediate payments of $50,000 will be made to each of the families of people who have
tragically died during Victoria’s recent bushfires.> Helping farmers – $1 million, provided through BlazeAid will help farmers replace boundary fences destroyed by the
bushfires on their private property.> Immediate support – funding of up to $4 million will support residents in bushfire-affected areas who have
experienced loss of, or damage to, their primary residence.n Bushfire Relief Assistance – VicRoads VicRoads will provide assistance to help with those who have been affected by bushfires with their registration and
licensing services. Available until 1 April 2022.n Tax relief measures The Victorian government is offering a range of tax relief measures for people affected by the 2019/20 bushfires.
Tax relief measures, include:> Relief on 2020 land tax if your property was destroyed or substantially damaged> Relief of up to $55,000 in land transfer (stamp) duty on a replacement home for a home destroyed by bushfire> Relief of up to $2100 on motor vehicle duty when purchasing a replacement vehicle for one that was destroyed by
bushfire> Other tax relief measures are available and will be considered on a case-by case situation.
n Bushfire Recovery Victoria (BRV) bushfire recovery grants for community facilities Bushfire recovery grants for community facilities have been established to support local organisations to repair and
improve damaged or destroyed community facilities in fire affected communities. Community groups and social enterprises will be able to apply for grants up to $50,000.
Community support programs include:n Rainwater and septic tank replacement program – The Funding Centre The Rainwater and septic tank replacement program will support households that have lost or significantly damaged
rainwater and/or septic tanks on their primary place of residence as a result of the eastern Victorian fires that have occurred since 21 November 2019.
n Bushfire clean-up program – BRV The Bushfire clean-up program provides free of charge clean-up assistance for Victorian residences and businesses
impacted by the 2019/20 bushfires. The program provides removal and clean-up of all dangerous debris, including asbestos, hazardous trees and concrete slab foundations.
SourcesBRV. (2021). Homepage. The Victorian Government. Accessed 10 February 2021 at: https://www.vic.gov.au/bushfire-recovery-victoria
East Gippsland Shire Council. (n.d.). Community recovery webpage. Accessed 10th February 2021 at: https://www.eastgippsland.vic.gov.au/community/bushfire-community-recovery
East Gippsland Shire Council and BRV. East Gippsland Fires Recovery Plan 2019–2020.
Mallacoota and District Recovery Association (MADRA). https://madrecovery.com/
The Funding Centre. Accessed 10 February 2021 at: https://www.fundingcentre.com.au/bushfire-relief-grants#:~:text=Emergency%20Bushfire%20Response%3A%20Small%20Business,bushfires%20commencing%2021%20November%202019.
Growing the seeds: recovery, strength and capability in Gippsland communities Page 119 of 145
Economic sourceshttps://app.remplan.com.au/eastgippsland/economy/covid-19/impact-on-employment
https://www.remplan.com.au/blog/2020/06/local-economies-during-covid-19-month-by-month-insights/ (REMPLAN COVID model)
Additionally, all ABS data used has been cited through the relevant reports.

Growing the seeds: recovery, strength and capability in Gippsland communities Page 120 of 145
Appendix G: Scientific and technical descriptions of past events
This appendix outlines some of the scientific and technical aspects influencing the recent climate-related events influencing disaster recovery in Gippsland, especially climate and climate change. It is not only important to understand what we are recovering from, but to consider what we are recovering to. It is also important to understand which risks may be more severe and/or more frequent than those in the past.
Climate change is normally measured using trend analysis. If the statistics are considered to represent the underlying process, this implies a gradual underlying change. Attribution of a change – whether it is likely to be random or due to an external cause – is carried out by assessing whether a trend has exceeded background variability (Hegerl et al., 2010). This can be problematic for extreme events. Australia’s high year-to-year variations require large changes before an external cause can be attributed in this way. This is especially difficult for the less common and more extreme events, because it may take a long time to identify changed conditions with high confidence. It is also difficult for complex events such as fire, which have many influences (Abram et al., 2021; Bradstock, 2010; Williams et al., 2013). The causes of large fires are always controversial because of this.
Based on the understanding of climate as a complex system (Jones and Ricketts, 2019), we take a non-standard approach to the science of climate change, assessing changing climate as a series of steady-state regimes. A climate regime of a specific region (e.g., SE Australia, SW Australia) is defined by the mean climate and variability around that mean. Under the influence of increasing greenhouse gas emissions, regimes can shift from one stable state to another, affecting extreme events and associated climate-related risks.
Regime shifts are detected using a statistical test that identifies a step change in the mean of a time series and its probability of occurrence if the sequence was random. Usually, a shift cannot be detected for a number of years after it occurs, but some recent large shifts have been detected within three years. A system will remain fairly stable following a shift, but if the external forcing continues, it will change again. Regime shifts are the result of interactions between climate change and variability, so has both a deterministic and a random element, making it easier to predict that it will occur than it is to predict when it will occur. If a regime shift can be attributed to external forcing, attribution of cause actually makes it easier to attribute change or variability to associated climate-related risks such as fire.
Regime changes have affected a wide range of climate variables in Australia, including Victoria and Gippsland (Jones, 2012; Jones et al., 2013). In Victoria, days above severe forest fire danger have increased from two to almost four days. The number of days over 35°C have also increased in the following way: Orbost has increased from 5.2 (1972–1996) to 8.2 days (1997–2019), and days above 40°C increased by 0.6 to 1.5 days. For Sale, days above 35°C have increased from 3.8 to 7.3 days and above 40°C from 0.3 to 1.0 days over the same period.
May to October rainfall from Orbost and Labertouche has decreased by about 10% from 1890–1996 and 1997–2019. Higher temperatures also increase the water-holding capacity of the atmosphere, increasing the likelihood of extreme rainfall, even if the overall average decreases.
The following summarises what is known about recent changes affecting the major risks within Gippsland, especially fire.
FireA comprehensive review of the 2019–20 fires in Australia has been conducted by Abram et al., (2021), assessing their impact with respect to the past present and future. Those interested in greater detail than provided here are directed there. The following refers specifically to the Gippsland fires, although it places them in a global context with respect to changing fire regimes.
The 2019–20 fire season in Victoria was the worst over the past twenty years in terms of number of fires, area burnt and second in the number of dwellings lost (Filkov et al., 2020). The two main areas affected were the upper north-east and the East Gippsland Shire. About 1.1 million hectares were burnt covering 56% of the shire. The eastern half of the shire was more seriously affected, especially Cann River (92%), Mallacoota (83%) and Orbost (76%), and nine of all twelve districts were directly affected.
The East Gippsland fires began following a heatwave that travelled east through Victoria, peaking in East Gippsland on 21 November 2019. Daily maximum temperatures ranged from 34.7°C at Omeo to 41.4°C at Bairnsdale and 41.6°C at Lakes Entrance. The day was a total fire ban and fire danger rated as Very High by the CFA. Fires were ignited by lightning strikes, MODIS satellite data registering 50 hot spots on 22 November 2019. The pattern of fires followed hot and dry weather, forming a series of peaks in spread and intensity through to February 2020.

Growing the seeds: recovery, strength and capability in Gippsland communities Page 121 of 145
The largest acceleration of the fires was catalysed by maximum temperatures on 30 December 2019 that were about 2°C warmer than 21 November 2019, reaching 43.6°C in Bairnsdale. Australia had a record Forest Fire Danger Index (FFDI) for December, and south-eastern Australia had a record December FFDI on the 30th and 31st. A state of disaster was declared on 2 January 2020, the first time such a declaration had been made in Victoria. Up to 100,000 people were estimated to be at risk. Around 2,000 people were evacuated by sea and air from Mallacoota on 3 January 2020 as fires burned down the Genoa River Valley towards the coast.
Around 4 January 2020, the fires merged into the Snowy and Tambo complexes. Mid-January saw some relief with cooler weather. Fires continued to be ignited through to 8 February 2020, the Tambo Complex was contained on 19 February 2020 and the Snowy Complex on 6 March 2020. A comprehensive timeline is provided in Table G1 on page 130.
Figure G1 shows the number of 1 km hotspots detectable by satellite. MODIS remotely-sensed satellite data detects ignition and burning on a 1 km grid, measuring fire initiation and spread (Giglio et al., 2016). Its measured detection accuracy for Victorian forests 2000–2013 is 62.5%, but increases to 87.1% when matched to high resolution images (Soto-Berelov et al., 2018). It is most reliable in detecting crown fire, but performs less well in modified landscapes and with ground-based fire. We matched the area of hotspots with progressive estimates of area burnt over the period of the fire, finding that it had roughly a 78% detection rate. Figure G1 therefore shows a fairly reliable estimate of the area of land on fire from November to February.
Figure G1: Fire hotspots detected by MODIS remote sensing in the East Gippsland and Wellington Shires, November 2019 to February 2020.
0
600
1200
1800
2400
15 Nov 2019 29 Nov 2019 13 Dec 2019 27 Dec 2019 10 Jan 2020 24 Jan 2020 07 Feb 2020
Fire
hot
spot
s (1
km g
rid)
East Gippsland
Wellington
Preceding conditionsFire risk is a function of many factors that include fire weather such as temperature, humidity and wind speed and direction, fuel type, fuel load, fuel condition – where the condition of large and fine fuel presents different risks, topography and ignition risk (Bradstock et al., 2010; Deb et al., 2020; Nolan et al., 2020). The dryness of large fuel is subject to previous conditions and is related to soil moisture content, which is affected by drought. Fine fuel influences the explosivity and speed of fires, and its moisture content can change very quickly in hot and dry conditions with very low humidity (Deb et al., 2020; Nolan et al., 2016). These can be grouped into four categories: (a) spatially continuous fuel (i.e., plant biomass); (b) that is dry enough to burn; (c) an ignition source (e.g., lightning or human causes); and (d) weather conditions favourable to fire spread (Bradstock, 2010). Our intention here is not to discriminate between different causal factors (e.g., fuel load versus climate [Adams et al., 2020]), but to point out the role that climate change has played in elevating the risk and severity of recent fires.
The Bureau of Meteorology (BoM) has produced a climatology of Forest Fire Danger Index (FFDI) from 1950 based on gridded station data (Dowdy, 2018). FFDI deciles for Australia Spring 2019 are shown in Figure G2 (overleaf), and East Gippsland is either in the top 10% or highest on record (BoM, 2019). The BoM has also produced charts of spring FFDI history nationally and for the states. NSW set a record for spring 2019 and Victoria was above average. However, Figure G2 indicates spring FFDI in East Gippsland was probably also at record levels. The BoM (2019) statement was published in mid-December before most of the fires occurred.
15 Nov 2019
2400
1800
1200
600
029 Nov 2019 13 Dec 2019 27 Dec 2019 10 Jan 2020 24 Jan 2020 07 Feb 2020
Fire
hot
spot
s (1
km g
rid)
East Gippsland
Wellington

Growing the seeds: recovery, strength and capability in Gippsland communities Page 122 of 145
Figure G2: Accumulated-FFDI deciles for spring 2019 (based on all years since 1950). Source: Bureau of Meteorology, 2019.
Drought also played a role in setting the high fire danger, and this was exacerbated by extreme conditions during the fire period (Ehsani et al., 2020). Boer et al., (2020) show that estimated fine dead fuel moisture content in eastern Australian forests was at its highest level since the beginning of the record in 1990 and 2018 and even higher in 2019, the product of the drought that began in 2016 (see ‘Drought’, p129). Heatwaves, which contributed to the timing of the fires in East Gippsland (Figure G1), tend to dry out fine fuels in particular (Jyoteeshkumar Reddy et al., 2021). Very hot and dry conditions can cure fine fuel almost instantly, making it quite explosive.
The severity of the firesThe fires burnt large areas of forest and farmland, destroyed the most buildings of any fires in Victoria since Black Saturday (Filkov et al., 2020), led to the deaths of four people in East Gippsland, caused widespread mortality of fauna during and after the fires (Dickman and McDonald, 2020), produced poor to very poor air quality across the region for weeks (Arriagada et al., 2020), and disrupted communities and industry throughout the region.
Air quality was affected over a wide area. Arriagada et al., (2020) estimated excess deaths and hospitalisat ions from population-weighted air quality data from the affected states through to 10 February 2020. Although the EPA had mobile air quality stations in East Gippsland (Sale, Bairnsdale, Orbost) during the fires, it is not known whether this data was included – the closest standard site being Rosedale. For the whole of Victoria, estimated excess deaths were 120 (44–195), cardiovascular hospital admissions 331 (62–602), respiratory admissions 585 (0–1227) and emergency department attendances for asthma 401 (217–586) (Arriagada et al., 2020).
The 2019–20 fires affecting Victoria, NSW and Queensland are considered to be a global-scale event when the area burnt, ecosystems damaged, the nature of the fires (pyrocumulonimbus events) and the emissions produced are accounted for (Abram et al., 2021; Boer et al., 2020; Filkov et al., 2020; Nolan et al., 2020). One estimate for CO2 emissions from the fires is 0.67 Gt in a range of 0.31 to 1.03 (Bowman et al., 2020), compared to total emissions for Australia of 0.41 Gt in 2019 excluding land use change (Ritchie and Roser, 2017).

Growing the seeds: recovery, strength and capability in Gippsland communities Page 123 of 145
By 24 February 2020, fires in NSW and eastern Victoria had burnt 5.8 million hectares including 21% of the ‘temperate broadleaf and mixed’ (TBLM) forest biome nationally (Boer et al., 2020). The final estimate was 23% (Abram et al., 2021). Roughly one-fifth of that was in East Gippsland. This biome mainly consists of eucalypt forests, containing a range of ecological vegetation communities from dry sclerophyll forests through to temperate rainforest. The other forest biome in the region is Mediterranean forests, woodlands and scrub – generally restricted to dry and coastal areas.
Appendix H lists the proportion of national (56%), state (11%) and other conservations reserves (12%) affected. Of rainforest areas, cool-temperate was 32% affected, unclassified 73% and warm, dry rainforest 77%. There is growing concern that the temperate forest ecosystems of the region are critically endangered. This is because fires are occurring at a frequency that prevents the forests from recovering to sustainable levels of maturity.
Figure G3 (overleaf) shows areas burnt in the past 20 years (Bennett et al., 2020). Large fires have occurred in 2002–03, 2006–07, 2014, 2019 and 2019–20. A smaller area was burnt near Dargo in 2009. The areas burnt twice and three times are substantial, and some areas have even been burnt four times.
Fires and logging are changing the age structure of East Gippsland forests. Old growth forests or regrowth with old-growth elements are important for arboreal mammals and large hollow-nesting birds (Lindenmayer, 2020). Regrowth forests are most at risk of burning again at around 30 years (Taylor et al., 2014). Victoria has lost 77% of its old-growth in the past 25 years from a range of causes (Lindenmayer and Taylor, 2020). Forest structure is a vital component for the survival and recovery of fauna from fire (Lindenmayer, 2020). The amount of rainforest affected is concerning, especially warm, dry rainforest. A number of other rare ecological vegetation classes have also been affected by the fires to a similar or greater degree (A Trumble Ward, pers. comm.).
Forest Fire Management Victoria’s own data shows that 79% of public land in the whole Gippsland Region is currently below the tolerable fire interval, up from 64% in 2018–19 (FFMV, 2020). Over the same interval, the proportion of land above the bushfire risk threshold fell from 71% to 41% (this is a fuel measure, independent of climate). Forestry has also been severely impacted. Of the area proposed for logging in the East Gippsland Region (East Gippsland and Wellington Shires) in the next five years, 59% was recently burnt, 28% of total state logging (Lindenmayer and Taylor, 2020).
This places the forest estate, and the people who rely on it in a similar state to the Great Barrier Reef. Fire and bleaching events are recurring at rates that exceed tolerable recovery intervals, and large proportions of the forest and reef area at risk of fire or bleaching, and the livelihoods of those who depend on those resources, are also at risk (Hughes et al., 2019).
Although the areas burnt in the 1939 and 2003 fires were larger over all (about 2 million and 1.9 million ha, respectively) these fires were more destructive. One of the reasons for this was the increased frequency of pyrocumulonimbus cloud formations over the 70 or so days the fires burnt (Mullins, 2020). These formations look like severe thunderstorms and are formed by extreme convection caused by heat from the fires, which forms a positive feedback, amplifying the impact of the fires (Dowdy et al., 2019; McRae et al., 2015). These conditions increased the danger for those directly impacted communities and emergency service personnel (Sharples et al., 2019).

Growing the seeds: recovery, strength and capability in Gippsland communities Page 124 of 145
Figure G3: Regions burnt in East Gippsland over the past 20 years, showing areas and frequency of burning. Source: https://scx2.b-cdn.net/gfx/news/2020/1-whyaustralia.jpg
Fire climate regimesThe characteristics combining climate, type of fuel, its spatial connectivity and its readiness to burn, ignition sources and topography all contribute to the generally accepted definition of a fire regime (Krebs et al., 2010). We define a fire climate regime as the mean and distribution of a fire weather index that is maintained in steady state by climate processes. If a fire climate regime changes due to external climate forcing, additional feedbacks will result in a nonlinear change to fire risk, decreasing with cooler, wetter conditions and increasing with drier warmer conditions. Abrupt changes to fire regimes have been considered in the past (Zinck et al., 2011) but not fire climate regimes.
The fire index most used in Australia is the Forest Fire Danger Index (FFDI). It is calculated using a formula of the original forest-based observations of Luke and McArthur (1978, derived by Noble et al., 1980), which uses maximum temperature, a drought index, relative humidity and wind speed. Obtaining long and homogenous records for relative humidity and wind speed is difficult, so has delayed the construction of homogenous records of FFDI. Records of station-based and gridded FFDI have been constructed for Australia (Clarke et al., 2013; Harris and Lucas, 2019; Dowdy, 2018, #7039; Lucas, 2010), but despite being cleaned substantially, these records still contain some inhomogeneities. The gridded data set is being updated on an ongoing basis.
The closest station to East Gippsland in the most recent station-based dataset is East Sale 1971–2017 (Harris and Lucas, 2019; Lucas and Harris, 2019). Orbost has been used in the past (Lucas, 2010), but suffers from data quality and continuity issues. Annual FFDI for Sale 1971–72 to 2016–17 fire years (July to June) contains an upward shift of 26% at p<0.05 in 1996–97. When the different factors contributing to fire danger from the Lucas and Harris (2019) data are tested for shifts, two drought indices increase, and rainfall and relative humidity decrease at p<0.05, and windspeed increases at p<0.01 in the same year. Maximum temperature increases by 0.6°C in 1997–98 at p<0.01.

Growing the seeds: recovery, strength and capability in Gippsland communities Page 125 of 145
We reconstructed FFDI for Australian states, territories and regions using high-quality climate data from the BoM. This treatment uses fire season maximum temperature, average climate amount, annual rainfall anomaly and area under the warmest 10% of maximum temperature for each region. This complements the gridded and station-based records, can be applied as soon as records are updated, and provides a reliable estimate of annual average FFDI and the number of days of specific fire risk per year (e.g., days above severe fire danger).
The full blended data set for Victoria is constructed from the model for 1957–58 to 1971–72 and 2010–2011 to 2019–20 and the original station-based data from 1972–73 to 2009–10. The shift date for total FFDI is 1996–97, an increase of 30% at p<0.01, slightly higher than for Sale. Due to its proximity to the coast and wetlands, Sale registers fewer severe and catastrophic fire danger days than would be experienced further inland. For Victoria, days of severe to catastrophic fire danger shifted in 2002–03 from 2.1 days each fire season to 4.2 (Figure G4). If not for the wet years of 2010–12, this shift would have been greater. For NSW, SA and SE Australia, total FFDI shifts in 2002–03.
After eliminating other variables from the high-quality data used in the model and the data used to calculate FFDI, the two variables most closely associated with the timing of fire regime shifts are upward shifts in fire season maximum temperature and downward shifts in relative humidity. This suggests that fire regime changes are most influenced by a combination of increased heat and drier air during the fire season. These shifts also occur over larger areas. The decrease in average relative humidity over Australia coincides with that for the southern hemisphere land average in 2002–03 (Figure G5a). Average annual median daily FFDI for Australia from the Lucas and Harris (2019) dataset and annual global fire season length also shift at the same time (Figure G5b).
0.0
1.0
2.0
3.0
4.0
5.0
6.0
7.0
8.0
1957 1967 1977 1987 1997 2007 2017
Days
Sev
+ fir
e da
nger
Figure G4: Reconstructed Forest Fire Danger Index climatology from climate averages for Victoria showing estimated days in each fire season (July–June) of fire risk at severe, extreme and catastrophic levels.
Figure G5: (a) Mean daily average anomalies for RH from the Southern Hemisphere (HadISH) (Willett et al., 2014) and Australia (Lucas and Harris, 2019), the latter as standard anomalies; (b) Global fire season length, the number of days when fire danger was above its median value (Jolly et al., 2015) compared with the Australian median daily average FFDI (Lucas and Harris, 2019).
(a) (b)
Days
Sev
+ fir
e da
nger
8
7
6
5
4
3
2
1
01957 1967 1977 1987 1997 2007 2017
RH a
nom
aly
Anom
aly
1973-3
-2
-1
0
1
2
3 2.5
2.0
1.5
1.0
0.5
0
-0.5
-1.0
-1.5-2.0
1978 1983 1988 1993 1998 2003 1979 1984 1989 1994 1999 2004 2009 20142008 2013
AustraliaS Hemisphere Global Fire Season Length Aust Median Daily FFDI

Growing the seeds: recovery, strength and capability in Gippsland communities Page 126 of 145
The shift in the fire climate regime seen in Gippsland and Victoria in fire year 1996–1997 coincides with a major global shift in climate that occurred in 1997 (Jones and Ricketts, 2017). This also coincides with a shift in sea surface temperatures over southern Australia. The reason for most of the shifts in fire regimes being 2002–03 is because the climate shift in 1997 was immediately followed by an extended La Niña event to 2001 that led to three cool summers in four. The next El Niño occurred in 2002–03 and this is associated with large-scale changes in relative humidity and fire season maximum temperature.
Global origin for fire climate regime shiftsThe coincidence of fire regime shifts in Australia with a global shift in fire season length suggests a global origin for changes in fire climate regimes. Moisture over land (atmospheric water vapour and rainfall) has two sources: ocean evaporation or recycling over land (Gimeno et al., 2012). Regions where moisture is dominated by oceanic sources include zones of Mediterranean climate, tropical wet and dry season climates, and some alpine and boreal climates. These are all regions that have seen recent increases in fire.
Simple models of moisture transport from the ocean scale up to warmer conditions over land (Byrne and O’Gorman, 2018; Chadwick et al., 2016). If moisture from the ocean fails to keep up with warming over land, relative humidity will decrease. This simple model explains most of the rainfall change in a more complex model (Chadwick et al., 2016). Byrne and O’Gorman (2018) show that for temperature and specific and relative humidity 40°S to 40°N their model predicts the observed trend for each over land, capturing the variations with a clear shift around the year 2000 for temperature and specific humidity, but not fully for relative humidity.
Globally, increases in atmospheric vapour pressure in 1930, 1979, 1987, 1998 and 2015 from the CRU_ts4.03 dataset are consistent with shifts in sea surface and atmospheric temperatures (Jones and Ricketts, 2017). Warmer temperatures evaporate more seawater leading to a higher moisture content in the atmosphere. For most of these shifts, the associated warming over land has been maintained with respect to relative humidity. A large decrease in the land and blended land marine data sets for both the global and southern hemisphere (Willett et al., 2014; Willett et al., 2020) in 2002 is consistent with this. The northern hemisphere blended land and marine data also show large decreases since around 2000.
The major continuing issues for fire under climate change is how to distinguish between change and variability, and to be able to provide reliable projections of changing fire risk. Some have noted the recent the nonlinear changes in FFDI and that they are rivalling or exceeding future projections (Abram et al., 2021; Clarke et al., 2013; Lucas, 2010). One strategy is to nest fire models in regional and global climate models (Li et al., 2019). Others analyse data from models to estimate future fire risk using variables such as FFDI (Clarke and Evans, 2019; Clarke et al., 2016; Clarke et al., 2011; Fox-Hughes et al., 2014).
Some climate model-based studies for Australia show both decreases and increases in FFDI (Clarke et al., 2016), whereas observations all show large positive increases, identified globally in moisture-limited environments (Andela et al., 2017). Using data not shown here, we compared regime shifts in each state with projections for 2030 from the CSIRO and Bureau of Meteorology projections from 2015 (CSIRO and Bureau of Meteorology, 2015). For both total FFDI and days above severe fire danger, the regime shifts occurring between 1996–97 and 2002–03 (except Queensland at 2012–13), NSW and SWWA were almost at their 2030 upper ranges; Queensland was equal, and Tasmania and SE Australia were just over the upper limit. Victoria is in the middle of the range. This is consistent with an emerging literature showing that models may be systematically underestimating future fire risk (Sanderson and Fisher, 2020; van Oldenborgh et al., 2020).
This is because fire is a hydroclimatic process that occupies the dry end of the water resources spectrum. Climate models do not reproduce changes in the water cycle as well as they do for temperature. We have traced this back to their capacity to produce regime shifts, which they do but in a rather rudimentary way (Jones and Ricketts, 2019). These shortcomings, which relate to capacity of models to represent heat engine behaviour in the tropics, suggest that changes in observed FFDI illustrate the sensitivity of fire climates to greenhouse gas forcing better than models.
This is an important conclusion for interpreting current and future fire risk for heavily-forested regions such as East Gippsland. There is an active debate as to the roles of factors such as fuel loads, forest cover fragmentation and climate in contributing to megafires such as those that occurred in Gippsland in 2002–03, 2006–07 and 2019–20 (Adams et al., 2020; Bradstock et al., 2020). We have shown that these fires are due to a shift in fire climate regime initiated in 1996–97 that was fully in place by 2002–03. While fuel loads and landscape fragmentation can increase fire risk, changes to the underlying climate drivers show the shift in fire climates is a global phenomenon. Climate is therefore driving overall fire risk, and other factors such as fuel load and short-term moisture content, vegetation structure influenced by previous fires and activities such as logging, and landscape fragmentation can all amplify fire risk at the local and regional scale.
This does not preclude other types of change in fire regimes, which take all these factors into account including fire climate. For example, repeated fires may result in ecosystem-wide shifts in forest type and cover (Zinck et al., 2011) or changes in forest cover may lead to a rapid shift in fire behaviour (Pausas and Fernández-Muñoz, 2012).

Growing the seeds: recovery, strength and capability in Gippsland communities Page 127 of 145
On that basis, we can attribute the recent shift of fire climate in Gippsland and more broadly to human-induced climate change. The contribution of climate variability is mainly being felt through the impact of very wet (2010–12) and very dry (2016–19) periods, the intensity of which may also be influenced by climate change. Given the close relationship between regimes of onshore moisture supply and fire regimes, patterns of future change are unpredictable. Continuing warmer and dry conditions could lead to one or more future regime shifts in fire climates.
An important outcome of understanding change in fire risk though regime shifts is that where historically, serious fires have been considered as intergenerational events, people can now potentially experience several such fires within their lifetime.
FloodGippsland has historically been subject to severe flooding based on its high relief and potential for heavy rainfall, especially from east coast lows. The Gippsland Lakes and estuaries are also vulnerable to combinations of riverine and coastal flooding. As low-lying areas connected to coastal waters, they are also vulnerable to sea level rise. Although flooding affects smaller areas than storm or fire, its direct impacts in flood-prone areas can result in large loss and damage to infrastructure, property and high-value agriculture.
Recent events mentioned in the event timeline occurred in 1998, 2007, 2011 and 2012. These are all associated with La Niña events, which often lead to wetter than normal conditions in many parts of Australia. The 1998 flood in East Gippsland was the record flood on the Bemm, Brodribb, Tambo Wentworth Rivers and Gippsland Lakes (EGCMA, 2017) and cost to the East Gippsland Shire was an estimated $77.5 million (Monson, 2004). The 2007 floods affected rivers from the Tambo west, including those in the Wellington Shire, and the Gippsland Lakes, flooding parts of Lakes Entrance. This flood exceeded the capacity of emergency services personnel (Tubnor, 2017), and required five relief centres. It resulted in $60 million infrastructure repair and insurance costs of $15 million (AIDR, n.d.).
The floods in 2011 and 2012 occurred over twelve months as part of a double La Niña event. The June 2011 event was major on the Cann, Bemm and Timbarra Rivers, March 2012 was on the Snowy, and the June 2012 event occurred on many of the rivers between the Benn River in the East through to West Gippsland. This was associated with high winds leading to widespread storm damage.
Victoria has recently remapped its 1% annual exceedance and maximum probable flood areas, the latter based on the largest potential rainfall given physical limits (DELWP, 2016) (Figure G6, overleaf). The key regional planning documents are the East and West Gippsland Floodplain Management Strategies (EGCMA, 2017; Tubnor, 2017). Both documents outline preparation and recovery strategies for future flood events. Although decreased rainfall is overall projected for the Gippsland region, warmer sea surface temperatures and a greater capacity of the air to hold moisture suggests that extreme rainfall may increase (Timbal et al., 2016).

Growing the seeds: recovery, strength and capability in Gippsland communities Page 128 of 145
Figure G6: Map of floodways (blue) and 1% annual exceedance probability flood extent (green) for the East Gippsland Management region. Source: http://vro.agriculture.vic.gov.au/dpi/vro/egregn.nsf/pages/eg_lwm_catchment_fp_data
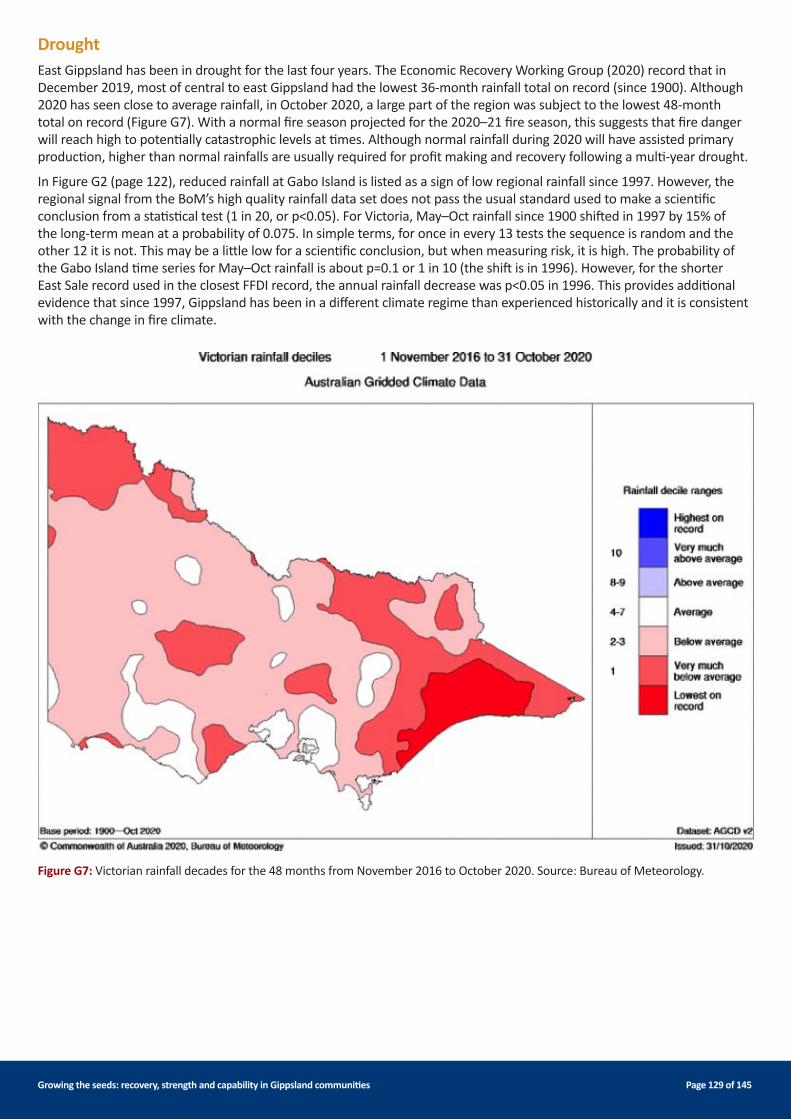
Growing the seeds: recovery, strength and capability in Gippsland communities Page 129 of 145
Figure G7: Victorian rainfall decades for the 48 months from November 2016 to October 2020. Source: Bureau of Meteorology.
DroughtEast Gippsland has been in drought for the last four years. The Economic Recovery Working Group (2020) record that in December 2019, most of central to east Gippsland had the lowest 36-month rainfall total on record (since 1900). Although 2020 has seen close to average rainfall, in October 2020, a large part of the region was subject to the lowest 48-month total on record (Figure G7). With a normal fire season projected for the 2020–21 fire season, this suggests that fire danger will reach high to potentially catastrophic levels at times. Although normal rainfall during 2020 will have assisted primary production, higher than normal rainfalls are usually required for profit making and recovery following a multi-year drought.
In Figure G2 (page 122), reduced rainfall at Gabo Island is listed as a sign of low regional rainfall since 1997. However, the regional signal from the BoM’s high quality rainfall data set does not pass the usual standard used to make a scientific conclusion from a statistical test (1 in 20, or p<0.05). For Victoria, May–Oct rainfall since 1900 shifted in 1997 by 15% of the long-term mean at a probability of 0.075. In simple terms, for once in every 13 tests the sequence is random and the other 12 it is not. This may be a little low for a scientific conclusion, but when measuring risk, it is high. The probability of the Gabo Island time series for May–Oct rainfall is about p=0.1 or 1 in 10 (the shift is in 1996). However, for the shorter East Sale record used in the closest FFDI record, the annual rainfall decrease was p<0.05 in 1996. This provides additional evidence that since 1997, Gippsland has been in a different climate regime than experienced historically and it is consistent with the change in fire climate.

Growing the seeds: recovery, strength and capability in Gippsland communities Page 130 of 145
Extreme weather eventsDamaging storm events along the Gippsland coast are usually associated with east coast lows (Norman et al., 2013). Three types of east coast low have been identified. Cold core lows occur when the centre of the cyclonic weather system is colder than the surroundings, warm cores are when they are warmer and hybrids are warmer below and cooler above. Their pattern of occurrence along the coast has moderate to low links with other climate indices. Over the historical period they have decreased in occurrence slightly, mainly during the cooler months (Ji et al., 2018).
Cavicchia et al., (2020) assess possible future changes to each type on the east coast of Australia. In the Gippsland region, cold core lows may increase slightly, warm cores lows decrease and hybrid lows decrease in the cool season but are projected to have the largest increase. Hybrid lows are associated with the strongest winds historically and greatest project rainfall increases, potentially having an impact on future flooding (Cavicchia et al., 2020). Therefore, the risk of coastal and riverine flooding will persist and may increase in severity.
Detailed timelineTable G1 contains a detailed timeline of the fires in East Gippsland combined with a timeline of the COVID-19 pandemic in Victoria. Its main purpose is to show how extreme the fires were at their peak and to aid in interpreting the social and economic impacts of the pandemic on recovery.
Event Region Major effectsSep 23 East Gippsland Fire danger period commences Second earliest start due to drought conditions (2018
earliest)Oct 28 Wellington Fire danger period commencesNov 21 Tambo Fire District Very hot conditions and dry lightning strikes start fires, some spread rapidlyNov 25–29 Tambo and Snowy fire
districtsBruthen–Six Mile Track fire threatens settlements, seven named fires in EGS, complex fires develop, peaks on 25th and 29th, approx. 30,000 ha 1 Dec
December 1–20
East Gippsland Shire 32,930 ha 8 Dec, 40,953 10 Dec, backburning operations keep fires in check, peak on 9 Dec
Dec 20 East Gippsland Shire, State Control Centre
Warmer conditions and school holidays change emphasis from serious but remote fires to escalating public threat
Dec 20–21 East Gippsland Shire (north) Great Alpine Road closed, power and mobile phones out in northern areasDec 20–28 East Gippsland Shire Fires double in size to 28 Dec and begin to mergeDec 24–25 Gippsland region Hazardous air quality throughout regionDec 27 East Gippsland region Travel warnings broadcast, pyrocumulonimbus (PyC) forms above two fires Dec 28 Goongerah and Martins
CreekEvacuation warnings broadcast
Dec 29 East Gippsland Shire General evacuation for residents and visitors, fire spread to further eastDec 30–31 East Gippsland Shire Record temperatures in East Gippsland, fire quadruples in size to 1 Jan, emergency
warning Lakes Entrance (30,000 pop.)Dec 31 East Gippsland Shire Three significant fires, 21 in total, >500,000 ha now burnt, fires merging, multiple
PyC columns. Buchan, Bruthen, Orbost, Cann River, Genoa, and Mallacoota isolated. Eighty communities covered by emergency warnings.
Jan 1 East Gippsland Shire Property losses reported for Mallacoota, Genoa, Reedy Flat, Buchan, Bruthen, Sarsfield, Gelantipy, between Nicholson and Swan Reach, Clifton Creek.
Jan 2 Six LGAs including East Gippsland and Wellington
State of Disaster declared covering 35,000 km2 and 100,000 people for seven days.
Jan 3 Mallacoota and East Gippsland Shire
Evacuation of Mallacoota by sea and air begins. Buchan loses water supply. Telecomms lost Combienbar, Gelantipy, Genoa, W Tree, Goongerah, and Bonang.
Jan 4–5 East Gippsland Shire Next extreme heat day 4 Jan. Almost 300,000 ha burnt in one day, on 5 Jan the fires merging into the Tambo and Snowy complexes.
Jan 5 East Gippsland Shire Evacuations continue in Mallacoota and Omeo; airlift offered from Tonghi Ck, Waterholes, Cabbage Tree Ck, Club Terrace, W Tree, Wingan R, Gelantipy, Murrindal, Sardine Ck, Combienbar, Goongerah, Bellbird Ck and Wairewa
Table G1: A detailed timeline of the fires in East Gippsland combined with a timeline of the COVID-19 pandemic in Victoria, 2019–2020

Growing the seeds: recovery, strength and capability in Gippsland communities Page 131 of 145
Jan 6–9 East Gippsland region Some relief with light rain allows crews to move in, evacuate people, target settlements for protection. Air quality remains hazardous.
Jan 9–10 East Gippsland region 9 Jan State of Disaster extended 48 hours, 10 Jan exceeds 40°C in the region, last day of free-running wildfire
Jan 11–16 East Gippsland region Wind change sees some fires burning from the SW, backburns to protect settlements show up on hotspots data. Focus shifts to recovery. Public telecoms available from 14 Jan
Jan 19 East Gippsland region Returns to community now being managed, emergency supplies for people and livestock, wildlife rapid assessment
Jan 19 – 21 East Gippsland region Severe weather with some rainfallJan 22 – Feb 8 East Gippsland region Efforts to contain the Tambo and Snowy Fire Complexes, tourist retrieve vehicles and
property, major roads opened and power restoredJanuary 25 Melbourne Australia’s first case of COVID-19, traveller from GuangdongFeb 19 Tambo Fire Complex Declared contained at 324,739 ha and safe 6 MayMar 6 Snowy Fire Complex Declared contained at 663,035 ha and safe 30 JuneMar 11 Global WHO declares COVID-19 as a pandemicMar 13 Melbourne Australian Grand Prix in Melbourne cancelledMar 16 Victoria Victoria declares state of emergencyMar 18 Victoria Mass gatherings limited to 500 outdoors and 100 indoorsMar 21 Victoria First aged-care restrictionsMar 21 Victoria Payroll refunds for businesses with <$3 million turnover financial year 2019–20 Mar 23 Victoria Non-essential hospital visits and businesses restricted until 13 AprilMar 25 Victoria Attendance at weddings, funerals and sport restricted. Self-isolation for those with
COVID-19 introducedMar 30 Victoria Stay-at-home directions introduced state-wide, with few exceptionsMar 30 National JobKeeper payments of at least $1,500 per fortnight to eligible employers for eligible
employeesApr 28 National Boosting cashflow as tax relief to eligible businessesMay 31 Victoria Stay-at-Home replaced by Stay Safe. Gatherings of up to 20 people permittedJune 21 Victoria Stay Safe (2) tightened to five and ten persons at home and outJul 1 Wellington Shire 12 COVID-19 cases to 1 Jul, another five during Jul and AugJul 1 Melbourne Stay-at-Home imposed on 40 suburbs, everywhere else Stay SafeJul 4 Melbourne Housing Commission tower lockdowns (home detention) for five daysJul 8 Stay-at-Home reimposed on metropolitan Melbourne and Mitchell Shire. Planned
minimum of six weeksJul 22 Victoria Masks mandatory for Stay-at-Home (metro) and Stay Safe (rest of Victoria)Aug 2 Victoria State of Disaster with Stage 4 restrictionsAug 3 Victoria Updated business restrictions, lower staff numbers, many businesses to close, limiting
the movement of people around the state for workSep 12 Regional Victoria Moves from Stage 3 (Stay Safe) to Stage 2Sep 13 Victoria $3 billion in grants, tax relief and cash flow relief announced, ecommerce and supply
chain assistanceSep 25 East Gippsland Shire Records its 7th and last COVID-19 case, most occurring in AugustSep 28 Victoria Second step easing of restrictions, more businesses can open with COVID-safe plans,
abattoir production increased Oct 28 Metropolitan Melbourne Move from Stay-at-Home to Stay SafeNov 8 Victoria Third step allowing for travel between city and country, more businesses to openNov 22 Victoria Last step restrictions for individuals, businesses. Industry by industry guidance, all
need COVID-safe plans

Growing the seeds: recovery, strength and capability in Gippsland communities Page 132 of 145
ReferencesAbram, N J., Henley, B J., Sen Gupta, A., Lippmann, T J R., Clarke, H., Dowdy, A J., and Boer, M M. (2021). Connections of climate change and variability to large and extreme forest fires in southeast Australia. Communications Earth and Environment, 2(1), 8. doi:10.1038/s43247-020-00065-8
Adams, M A., Shadmanroodposhti, M., and Neumann, M. (2020). Causes and consequences of Eastern Australia’s 2019–20 season of mega-fires: A broader perspective. Global Change Biology, 26(7), 3756–3758. doi:https://doi.org/10.1111/gcb.15125
AIDR. (n.d.). Flood – Gippsland, Gippsland, Victoria, June 2007. Retrieved January 31, 2021, from Australian Institute for Disaster Resilience, https://knowledge.aidr.org.au/resources/flood-gippsland-victoria-2007/
Andela, N., Morton, D C., Giglio, L., Chen, Y., Van Der Werf, G., Kasibhatla, P S., and Kloster, S. (2017). A human-driven decline in global burned area. Science, 356(6345), 1356–1362.
Arriagada, N B., Palmer, A J., Bowman, D., Morgan, G G., Jalaludin, B B., and Johnston, F H. (2020). Unprecedented smoke-related health burden associated with the 2019–20 bushfires in eastern Australia. Medical Journal of Australia, 213(6), 282–283.
Bennett, L., Kasel, S., Fairman, T., and Jiang, R. (2020). Why Australia’s severe bushfires may be bad news for tree regeneration. Australasian Plant Conservation: Journal of the Australian Network for Plant Conservation, 28(4), 10.
Boer, M M., de Dios, V R., and Bradstock, R A. (2020). Unprecedented burn area of Australian mega forest fires. Nature Climate Change, 10(3), 171–172.
Bowman, D M., Williamson, G J., Price, O F., Ndalila, M N., and Bradstock, R A. (2020). Australian forests, megafires and the risk of dwindling carbon stocks. Plant, Cell and Environment, 44(2), 347–355.
Bradstock, R., Hammill, K., Collins, L., and Price, O. (2010). Effects of weather, fuel and terrain on fire severity in topographically diverse landscapes of south-eastern Australia. Landscape Ecology, 25(4), 607–619. doi:10.1007/s10980-009-9443-8
Bradstock, R A. (2010). A biogeographic model of fire regimes in Australia: current and future implications. Global Ecology and Biogeography, 19(2), 145–158. doi:10.1111/j.1466-8238.2009.00512.x
Bradstock, R A., Nolan, R H., Collins, L., Resco de Dios, V., Clarke, H., Jenkins, M., and Boer, M M. (2020). A broader perspective on the causes and consequences of eastern Australia’s 2019–20 season of mega-fires: A response to Adams et al. Global Change Biology, 26(7), e8–e9. doi:https://doi.org/10.1111/gcb.15111
Bureau of Meteorology. (2019). Special Climate Statement 72: dangerous bushfire weather in spring 2019. Special Climate Statement, Bureau of Meteorology, Melbourne.
Byrne, M P., and O’Gorman, P A. (2018). Trends in continental temperature and humidity directly linked to ocean warming. Proceedings of the National Academy of Sciences, 115(19), 4863–4868. doi:10.1073/pnas.1722312115
Cavicchia, L., Pepler, A., Dowdy, A., Evans, J., Di Luca, A., and Walsh, K. (2020). Future changes in the occurrence of hybrid cyclones: the added value of cyclone classification for the east Australian low-pressure systems. Geophysical Research Letters, 47(6), e2019GL085751. doi:https://doi.org/10.1029/2019GL085751
Chadwick, R., Good, P., and Willett, K. (2016). A simple moisture advection model of specific humidity change over land in response to SST warming. Journal of Climate, 29(21), 7613–7632.
Clarke, H., and Evans, J P. (2019). Exploring the future change space for fire weather in southeast Australia. Theoretical and Applied Climatology, 136(1–2), 513–527.
Clarke, H., Lucas, C., and Smith, P. (2013). Changes in Australian fire weather between 1973 and 2010. International Journal of Climatology, 33(4), 931–944.
Clarke, H., Pitman, A. J., Kala, J., Carouge, C., Haverd, V. and Evans, J P. (2016). An investigation of future fuel load and fire weather in Australia. Climatic Change, 139(3-4), 591-605.
Clarke, H G., Smith, P L. and Pitman, A J. (2011). Regional signatures of future fire weather over eastern Australia from global climate models. International Journal of Wildland Fire, 20(4), 550–562. doi:https://doi.org/10.1071/WF10070
CSIRO and Bureau of Meteorology. (2015). Climate change in Australia. Information for Australia’s natural resource management regions: technical report. CSIRO and Bureau of Meteorology, Australia.

Growing the seeds: recovery, strength and capability in Gippsland communities Page 133 of 145
Deb, P., Moradkhani, H., Abbaszadeh, P., Kiem, A S., Engström, J., Keellings, D., and Sharma, A. (2020). Causes of the widespread 2019–2020 Australian bushfire season. Earth’s Future, 8(11), e2020EF001671. doi:https://doi.org/10.1029/2020EF001671
Department of Environment, Land, Water and Planning. (2016). Victorian flood data and mapping guidelines. Retrieved from https://www.water.vic.gov.au/__data/assets/pdf_file/0027/53757/Victorian-Flood-Data-and-Mapping-FOR-WEB.pdf
Dickman, C., and McDonald, T. (2020). Some personal reflections on the present and future of Australia’s fauna in an increasingly fire-prone continent. Ecological Management and Restoration, 21(2), 86–96. doi:https://doi.org/10.1111/emr.12403
Dowdy, A J. (2018). Climatological variability of fire weather in Australia. Journal of Applied Meteorology and Climatology, 57(2), 221–234. doi:10.1175/jamc-d-17-0167.1
Dowdy, A J., Ye, H., Pepler, A., Thatcher, M., Osbrough, S L., Evans, J P., and McCarthy, N. (2019). Future changes in extreme weather and pyroconvection risk factors for Australian wildfires. Scientific Reports, 9(1), 1–11.
EGCMA. (2017). East Gippsland floodplain management strategy, (p59). East Gippsland Catchment Management Authority, Bairnsdale.
Ehsani, M R., Arevalo, J., Risanto, C B., Javadian, M., Devine, C J., Arabzadeh, A., and Behrangi, A. (2020). 2019–2020 Australia fire and its relationship to hydroclimatological and vegetation variabilities. Water, 12(11), 3067.
Filkov, A I., Ngo, T., Matthews, S., Telfer, S., and Penman, T D. (2020). Impact of Australia’s catastrophic 2019/20 bushfire season on communities and environment. Retrospective analysis and current trends. Journal of Safety Science and Resilience, 1(1), 44–56.
Forest Fire Management Victoria. (2020). Fuel management report 2018–19. Forest Fire Management Victoria, East Melbourne.
Fox-Hughes, P., Harris, R., Lee, G., Grose, M., and Bindoff, N. (2014). Future fire danger climatology for Tasmania, Australia, using a dynamically downscaled regional climate model. International Journal of Wildland Fire, 23(3), 309–321.
Giglio, L., Schroeder, W., and Justice, C. (2016). The collection 6 MODIS active fire detection algorithm and fire products. Remote Sensing of Environment, 178, 31–41.
Gimeno, L., Stohl, A., Trigo, R M., Dominguez, F., Yoshimura, K., Yu, L., and Nieto, R. (2012). Oceanic and terrestrial sources of continental precipitation. Reviews of Geophysics, 50(4). https://doi.org/10.1029/2012RG000389
Harris, S., and Lucas, C. (2019). Understanding the variability of Australian fire weather between 1973 and 2017. PLoS One, 14(9), e0222328.
Hegerl, G C., Hoegh-Guldberg, O., Casassa, G., Hoerling, M P., Kovats, R S., Parmesan, C., and Stott, P A. (2010). Good practice guidance paper on detection and attribution related to anthropogenic climate change. In Stocker, T F., Field, C.B., Qin, D., Barros, V., Plattner, G-K., Tignor, M., Midgley, P M., and Ebi, K L. (Eds.), Meeting report of the Intergovernmental Panel on Climate Change expert meeting on detection and attribution of anthropogenic climate change (p8). IPCC Working Group I Technical Support Unit, University of Bern, Switzerland.
Hughes, T P., Kerry, J T., Connolly, S R., Baird, A H., Eakin, C M., Heron, S F., and Liu, G. (2019). Ecological memory modifies the cumulative impact of recurrent climate extremes. Nature Climate Change, 9(1), 40–43.
Ji, F., Pepler, A S., Browning, S., Evans, J P., and Di Luca, A. (2018). Trends and low frequency variability of East Coast Lows in the twentieth century. Journal of Southern Hemisphere Earth Systems Science, 68(1), 1–15.
Jolly, W M., Cochrane, M A., Freeborn, P H., Holden, Z A., Brown, T J., Williamson, G J. and Bowman, D M J S. (2015). Climate-induced variations in global wildfire danger from 1979 to 2013. Nature Communications, 6(1), 7537. doi:10.1038/ncomms8537
Jones, R N. (2012). Detecting and attributing nonlinear anthropogenic regional warming in southeastern Australia. Journal of Geophysical Research, 117(D4), D04105. doi:https://doi.org/10.1029/2011jd016328
Jones, R N., and Ricketts, J H. (2017). Reconciling the signal and noise of atmospheric warming on decadal timescales. Earth System Dynamics, 8(1), 177–210. doi:https://doi.org/10.5194/esd-8-177-2017
Jones, R N., and Ricketts, J H. (2019). The Pacific Ocean heat engine: global climate’s regulator. Earth System Dynamics Discussions, in review. doi:https://doi.org/10.5194/esd-2019-72
Jones, R N., Young, C K., Handmer, J., Keating, A., Mekala, G D., and Sheehan, P. (2013). Valuing adaptation under rapid change. National Climate Change Adaptation Research Facility, Australia.
Growing the seeds: recovery, strength and capability in Gippsland communities Page 134 of 145
Jyoteeshkumar Reddy, P., Sharples, J J., Lewis, S C., and Perkins-Kirkpatrick, S E. (2021). Modulating influence of drought on the synergy between heatwaves and dead fine fuel moisture content of bushfire fuels in the southeast Australian region. Weather and Climate Extremes, 31, 100300. doi:https://doi.org/10.1016/j.wace.2020.100300
Krebs, P., Pezzatti, G B., Mazzoleni, S., Talbot, L M., and Conedera, M. (2010). Fire regime: history and definition of a key concept in disturbance ecology. Theory in Biosciences, 129(1), 53–69.
Li, F., Val Martin, M., Andreae, M O., Arneth, A., Hantson, S., Kaiser, J W., and Forrest, M. (2019). Historical (1700–2012) global multi-model estimates of the fire emissions from the Fire Modeling Intercomparison Project (FireMIP). Atmospheric Chemistry and Physics, 19(19), 12545–12567.
Lindenmayer, D. (2020). Fire, forests and fauna (The 2020 Krebs Lecture). Pacific Conservation Biology.
Lindenmayer, D B., and Taylor, C. (2020). New spatial analyses of Australian wildfires highlight the need for new fire, resource, and conservation policies. Proceedings of the National Academy of Sciences, 117(22), 12481–12485.
Lucas, C. (2010). On developing a historical fire weather data-set for Australia. Australian Meteorological and Oceanographic Journal, 60(1), 1.
Lucas, C., and Harris, S. (2019). Seasonal McArthur Forest Fire Danger Index (FFDI) data for Australia: 1973–2017. Retrieved from: https://data.mendeley.com/datasets/xf5bv3hcvw/2
Luke, R H., and McArthur, A G. (1978). Bushfires in Australia. Australian Government Publishing Service, Canberra.
McRae, R H D., Sharples, J J., and Fromm, M. (2015). Linking local wildfire dynamics to pyroCb development. Natural Hazards and Earth System Sciences, 15(3), 417–428. doi:10.5194/nhess-15-417-2015
Monson, R. (2004). The 1998 floods in the Tambo valley. International Journal of Mass Emergencies and Disasters, 22(3), 61–86.
Mullins, G. (2020). Submission to: Royal Commission into National Natural Disaster Arrangements (p90). Emergency Leaders for Climate Action, Sydney.
Noble, I., Gill, A., and Bary, G. (1980). McArthur’s fire-danger meters expressed as equations. Australian Journal of Ecology, 5(2), 201–203.
Nolan, R H., Boer, M M., Collins, L., Resco de Dios, V., Clarke, H., Jenkins, M., and Bradstock, R A. (2020). Causes and consequences of eastern Australia’s 2019–20 season of mega-fires. Global Change Biology, 26(3), 1039–1041. doi:https://doi.org/10.1111/gcb.14987
Nolan, R H., Boer, M M., Resco de Dios, V., Caccamo, G., and Bradstock, R A. (2016). Large-scale, dynamic transformations in fuel moisture drive wildfire activity across southeastern Australia. Geophysical Research Letters, 43(9), 4229–4238.
Norman, B., Steffen, W., Webb, B., Capon, T., Maher, B., Woodroffe, C., and Lavis, J. (2013). South East Coastal Adaptation (SECA): Coastal urban climate futures in SE Australia from Wollongong to Lakes Entrance. National Climate Change Adaptation Research Facility, Gold Coast.
Pausas, J G., and Fernández-Muñoz, S. (2012). Fire regime changes in the Western Mediterranean Basin: from fuel-limited to drought-driven fire regime. Climatic Change, 110(1), 215–226. doi:10.1007/s10584-011-0060-6
Ritchie, H., and Roser, M. (2017). CO₂ and greenhouse gas emissions. Retrieved from https://ourworldindata.org/co2-and-other-greenhouse-gas-emissions
Sanderson, B M., and Fisher, R A. (2020). A fiery wake-up call for climate science. Nature Climate Change, 10(3), 175–177. doi:10.1038/s41558-020-0707-2
Sharples, A., Hilton, J., and Sullivan, A. (2019). Pyroconvective interactions and spot fire dynamics. Hazard Note 61, BNHCRC, Melbourne.
Soto-Berelov, M., Jones, S D., Clarke, E., Reddy, S., Gupta, V., and Cardoso Felipe, M L. (2018). Assessing two large area burnt area products across Australian Southern Forests. International Journal of Remote Sensing, 39(3), 879–905. doi:10.1080/01431161.2017.1392638
Taylor, C., McCarthy, M A., and Lindenmayer, D B. (2014). Nonlinear effects of stand age on fire severity. Conservation Letters, 7(4), 355–370.
Timbal, B., Ekström, M., Fiddes, S., Grose, M., Kirono, D G., Lim, E-P., and Wilson, L. (2016). Climate change science and Victoria, Bureau of Meteorology.

Growing the seeds: recovery, strength and capability in Gippsland communities Page 135 of 145
Tubnor, L. (2017). West Gippsland Floodplain Management Strategy 2018–2027 (p59). West Gippsland Catchment Management Authority, Bairnsdale.
van Oldenborgh, G J., Krikken, F., Lewis, S., Leach, N J., Lehner, F., Saunders, K R., and Wallom, D. (2020). Attribution of the Australian bushfire risk to anthropogenic climate change. Natural Hazards and Earth System Sciences Discussions, 1–46.
Willett, K., Dunn, R., Thorne, P., Bell, S., De Podesta, M., Parker, D., and Williams Jr, C. (2014). HadISDH land surface multi-variable humidity and temperature record for climate monitoring. Climate of the Past, 10(6).
Willett, K M., Dunn, R J., Kennedy, J J., and Berry, D I. (2020). Development of the HadISDH. Marine humidity climate monitoring dataset. Earth System Science Data, 12(4), 2853–2880.
Williams, R J., Bradstock, R A., Cary, G J., Dovey, L., Enright, N J., Gill, A M., and Lucas, C. (2013). Current Fire Regimes, Impacts and the Likely Changes–VII: Australian Fire Regimes under Climate Change: Impacts, Risks and Mitigation. In Goldammer, J G., (Ed.), Vegetation Fires and Global Change, 133–142, Kessel Publishing House, Germany.
Zinck, R D., Pascual, M., and Grimm, V. (2011). Understanding shifts in wildfire regimes as emergent threshold phenomena. The American Naturalist, 178(6), E149–E161.

Growing the seeds: recovery, strength and capability in Gippsland communities Page 136 of 145
Appendix H: Exposure dataExposure Report for the East Gippsland Shire (Geoscience Australia)Localities: Bairnsdale, Bruthen (L), Eagle Point (L), Lake Tyers Beach (L), Lakes Entrance, Lindenow (L), Loch Sport (L), Mallacoota (L), Marlo (L), Metung (L), Newlands Arm (L), Omeo (L), Orbost, Paynesville, Raymond Island (L)
Dwelling estimates where residents:Demographic* Event Nat (Av)All aged 65 or over 28.3% 16.9%Includes persons aged 14 years and under 17.5% 25.4%Includes an Indigenous person 3.1% 3%Single parent family 4.9% 5.5%In need of assistance for self-care activities 12.4% 10%Include persons not proficient in English 0.1% 0.9%Do not have access to a motor vehicle 5.3% 7.5%No one has completed Year 12 or higher 24.4% 15.6%Moved to the region in the last 1 year 8.9% 12%Moved to the region in the last 5 years 22.3% 32.1%Top 5 employing industry*Health Care Social Assistance, Retail Trade, Accommodation Food Services, Education Training, Agriculture Forestry FishingEconomic*Low income ($1–$499/week) 36.7% 23.5%Medium income ($500–$1,499/week) 53.0% 53%High income ($1,500+/week) 8.9% 22.2%In public housing 3.4% 4.2%All unemployed 1.5% 1.1%
Building Exposure, V11 September 2020Residential EventPopulation 47,954Dwellings* 26,300Buildings 25,132Pre-1980 construction 8,989Pre-1990 probable asbestos** 16,142Reconstruction value $10,623,210,000Contents value $1,796,990,000CommercialBuilding count 865Reconstruction value $8,466,900,000IndustrialBuilding count 455Reconstruction value $1,233,580,0002016 SEIFA IRSAD*Dwellings SEIFA decile 10 score (most advantaged)
—
SEIFA decile 9 score —SEIFA decile 8 score —SEIFA decile 7 score 189SEIFA decile 6 score 2,212SEIFA decile 5 score 3,454SEIFA decile 4 score 6,076SEIFA decile 3 score 5,262SEIFA decile 2 score 4,647SEIFA decile 1 score (most disadvantaged) 4,414No SEIFA score 46
* Demographic information based on 2016 ABS Census. Residential demographic and economic information is not provided for dwelling counts less than 20 or when the population count is zero.
**Buildings may contain asbestos cement materials, especially in the eaves, internal and external wall cladding, ceilings (particularly in wet areas such as bathrooms and laundries), corrugated products (roofing and cladding) and fences.

Growing the seeds: recovery, strength and capability in Gippsland communities Page 137 of 145
Institution ExposureEducation Event Government Facilities EventSchool – Pre/Primary 30 Medicare Office 1School – Secondary 7 Centrelink Office 7School – Tertiary — Local Government Offices 1School – Other (Combined, Special) 10Health and Welfare Emergency ServicesHospital – Public 3 Police Station 10Hospital – Private — Fire Station 42Nursing Home 7 Ambulance Station 8Retirement Home 4 SES Facility 8
Infrastructure ExposureUtility/Energy Event Transport EventPower Station – Major Renewable — Airport – Major Areas 3Power Station – Major Fossil Fuel 1 Airport – Major Terminals 1Transmission – Substation — Airport – Landing Grounds 5Transmission – Electricity Lines (km) 40 Road – Major (km) 510Liquid Fuel – Refineries — Road – Arterial and Sub-arterial (km) 953Liquid Fuel – Terminals — Railway – Station 10Liquid Fuel – Depots — Railway – Tracks (km) 131Liquid Fuel – Petrol Stations 23 Maritime – Major Port —Gas Pipeline (km) 246 Maritime – Ferry Terminal 2Oil Pipeline (km) —Off-shore Extraction Platform —Waste Management Site 20Waste Water Treatment Plant 9Major Dam Walls 1Telephone Exchange 35Broadcasting Studios (Radio and TV) —

Growing the seeds: recovery, strength and capability in Gippsland communities Page 138 of 145
Business Exposure, ABR September 2020Number of businesses 10,550 Number of Registered Charity Organisations 102Accommodation and Food Services 538 Number of Primary Producers* 1,365Administrative and Support Services 721 Agriculture and Fishing Support Services 182Agriculture, Forestry and Fishing 1,369 Aquaculture —Arts and Recreation Services 311 Dairy Cattle Farming 88Construction 1,941 Deer Farming —Education and Training 231 Fishing 93Electricity, Gas, Water and Waste Services 25 Forestry and Logging 45Financial and Insurance Services 404 Forestry Support Services 23Health Care and Social Services 588 Fruit and Tree Nut Growing 26Information Media and Telecoms 44 Hunting and Trapping 6Manufacturing 419 Mushroom and Vegetable Growing 60Mining 21 Nursery and Floriculture Production 20Other Services 823 Other Crop Growing 15Professional, Scientific and Tech Serv 862 Other Livestock Farming 45Public Administration and Safety 28 Poultry Farming 10Rental, Hiring and Real Estate Services 811 Sheep, Beef Cattle and Grain Farming 752Retail Trade 674Transport, Postal and Warehousing 452Wholesale Trade 183Unclassified businesses 105
*Primary producer for counts greater than five
Agricultural Exposure, 2019Event Nat (Prop)
Agriculture Commodity Estimated Value 2019: $263,779,000 0.5%Estimated Agricultural Area (Ha): 389,100 0.1%Commodities include: Apples, Apricots, Avocados, Barley, Beans french runner, Beehives, Blueberries, Broccoli, Brussel sprouts, Canola, Carrots, Cauliflowers, Cereals livestock feed, Cherries, Cultivated turf, Cut flowers, Dairy cattle, Egg production, Goats, Grapes, Green peas, Hens for eggs, Lemons, Lettuces, Limes, Lupins, Maize, Meat cattle, Nectarines, Nurseries, Oats, Olives, Onions, Other berries, broadacre crops, cereals, livestock, nuts, pulses, vegetables, Pastures for hay, Pastures for silage, Peaches, Pears Nashi, Pigs, Plums, Pullets for eggs, Pumpkins, Sheep lambs, Sorghum, Sweet corn, Triticale, Wheat

Growing the seeds: recovery, strength and capability in Gippsland communities Page 139 of 145
Environmental Exposure, September 2020World Heritage List, 2018Declared property: Total Area: 0 haNo features within the nominated boundaryBuffer zone: Total Area: 0 haNo features within the nominated boundaryNational Heritage List, 2020: (Status = Listed places and within listed place only)Historic: Total Area: 0 haNo features within the nominated boundaryIndigenous: Total Area: 0 haNo features within the nominated boundaryNatural: Total Area: 327,130 haAustralian Alps National Parks and Reserves: NSW (141.2ha, 0.0%), Australian Alps National Parks and Reserves, VIC (326,988.8ha, 39.0%)Commonwealth Heritage List, 2020: (Status = Listed places and within listed place only)Historic: Total Area: 0 haNo features within the nominated boundaryIndigenous: Total Area: 0 haNo features within the nominated boundaryNatural: Total Area: 0 haNo features within the nominated boundaryCollab Aust Protected Areas Database (CAPAD), 2018. IUCN Protected Area Man Categories:Ia – Strict Nature Reserve: Total Area: 54,964 haIb – Wilderness Area: Total Area: 113,137 haII – National Park: Total Area: 722,444 haIII – Natural Monument or Feature: Total Area: 24,054 haIV – Habitat/Species Management Area: Total Area: 5,767 haV – Protected Landscape/Seascape: Total Area: 60,927 haVI – Protected area with sustainable use of natural resources: Total Area: 18,809 haWetlands of International Importance (Ramsar Sites), 2016:Gippsland Lakes – VIC (31,791.2ha, 52.0%) Total Area: 31,791 haInterim Biogeographic Regions for Australia (IBRA), Version 7: Total Area: 2,094,968 haNatural Resource Managements (NRM), 2017 Regions: Total Area: 2,093,189 ha
Exposure information sourced from:Agricultural Exposure: Agricultural commodities and estimated value is based on ABS value of Agricultural Commodities Produced (VACP) 2018-19, and Agricultural Commodity Estimates by Region 2016. www.ga.gov.au/metadata-gateway/metadata/record/gcat_82222Building Exposure: Residential, Commercial and Industrial exposure information collated from a variety of best and publicly available data. Building reconstruction and contents values adjusted to June 2018 costings. www.ga.gov.au/metadata-gateway/metadata/record/gcat_82220Business Exposure: The Australian Business Register. The data is based on the main business location of the registration. https://abr.gov.au/About-us/Our-work/The-ABR-explained/Demographic Exposure: ABS 2016 Census statistics and ABS 2016 Social-economic Indexes For Areas-Index of Relative Socio-economic Advantage and Disadvantage (SEIFA IRSAD) to a NEXIS building location. Institution Exposure: Institution asset data collected through a variety of best available data. This data is either not available publicly because they are government departmental data and or commercially available data products.Infrastructure Exposure: Infrastructure asset data is collected through a variety of best and publicly available data. www.ga.gov.au/scientific-topics/national-location-information/built-environment-and-exposureEnvironmental Exposure: Environmental data is sourced from the Department of Environment and Energy, and represents the most recently released publicly available data. www.environment.gov.auFor more information: www.ga.gov.au/scientific-topics/hazards/risk-impact/nexis

Growing the seeds: recovery, strength and capability in Gippsland communities Page 140 of 145
Summary of impacts in East Gippsland Shire
Built EnvironmentProperty NumberResidences destroyed (homes, flats, caravans, holiday homes and rentals) 380Residences damaged (homes, flats, caravans, holiday homes and rentals) 68Commercial properties destroyed or damaged 27Sheds destroyed 532Sheds damaged 45Roads ImpactsRegional roads 420 kmCouncil roads 650 kmDELWP roads 7,500 kmCouncil bridges 15Princes Highway Closed 37 daysGreat Alpine, Monaro, and Bonang Roads Closed temporarilyEssential services ImpactsPowerpoles replaced 165Transformers affected 2Drinking water $420,000Water supply upgrades $500,000Sewerage operations $150,000Social ImpactsFatalities 3Residents affected 46,000Communities affected 118Relief centres 11 for 2,380Referrals made through recovery centres >15,000Funding applications 2,283Hardship payments (9,485) $9,269,000Re-establishment funding (74) $1,669,000Aboriginal community infrastructure Significant damageAboriginal managed public lands Significant damageSites and land of cultural importance Significant damageEconomic ImpactsLoss of visitor expenditure $170‒$180 millionBusiness self-reporting – directly impacted 18%Business self-reporting – indirectly impacted 52%Business self-reporting – tourism dependent 46%Tourism-dependent businesses 685Primary producers affected >450Livestock dead or missing 1,700Pasture burnt 16,800 haHorticultural crops burnt 250 haFencing destroyed 2,800 kmPrimary industry grants 97 Emergency transport subsidies 19Concessional loan applications 19Small business bushfire support grants 89Referrals for grant assistance 397
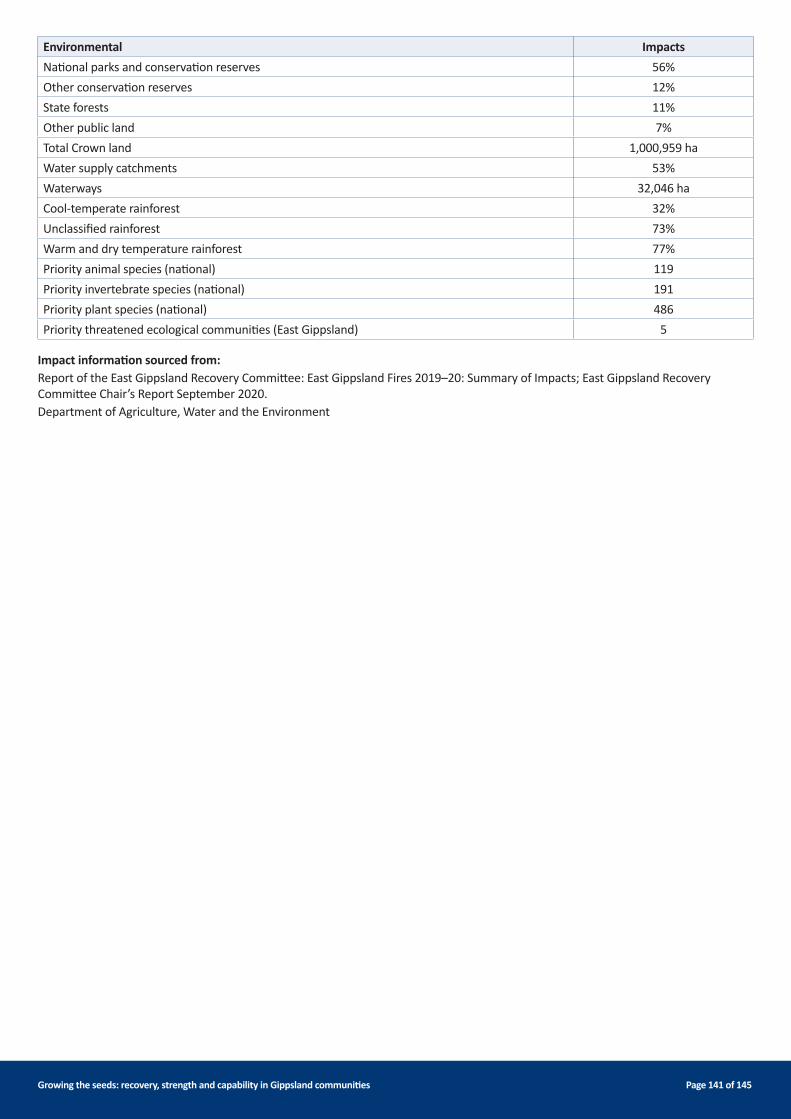
Growing the seeds: recovery, strength and capability in Gippsland communities Page 141 of 145
Environmental ImpactsNational parks and conservation reserves 56%Other conservation reserves 12%State forests 11%Other public land 7%Total Crown land 1,000,959 haWater supply catchments 53%Waterways 32,046 haCool-temperate rainforest 32%Unclassified rainforest 73%Warm and dry temperature rainforest 77%Priority animal species (national) 119Priority invertebrate species (national) 191Priority plant species (national) 486Priority threatened ecological communities (East Gippsland) 5
Impact information sourced from:Report of the East Gippsland Recovery Committee: East Gippsland Fires 2019–20: Summary of Impacts; East Gippsland Recovery Committee Chair’s Report September 2020.Department of Agriculture, Water and the Environment

Growing the seeds: recovery, strength and capability in Gippsland communities Page 142 of 145
Exposure Report for the Wellington Shire (Geoscience Australia)Localities: Briagolong (L), Golden Beach - Paradise Beach (L), Heyfield, Loch Sport (L), Maffra, Port Albert (L), Rosedale, Sale, Stratford, Wurruk (L), Yarram
Dwelling estimates where residents:Demographic* Event Nat (Av)All aged 65 or over 24.6% 16.9%Includes persons aged 14 years and under 19.9% 25.4%Includes an Indigenous person 1.8% 3%Single parent family 4.8% 5.5%In need of assistance for self-care activities 12.2% 10%Include persons not proficient in English 0.1% 0.9%Do not have access to a motor vehicle 5.1% 7.5%No one has completed Year 12 or higher 25.5% 15.6%Moved to the region in the last 1 year 9.0% 12%Moved to the region in the last 5 years 21.8% 32.1%Top 5 employing industry*Health Care Social Assistance, Agriculture Forestry Fishing, Retail Trade, Construction, Education Training
Building Exposure, V11 September 2020Residential EventPopulation 43,736Dwellings* 23,454Buildings 22,664Pre 1980 construction 14,527Pre-1990 probable asbestos** 18,897Reconstruction value $9,265,200,000Contents value $1,624,510,000CommercialBuilding count 801Reconstruction value $6,208,050,000IndustrialBuilding count 455Reconstruction value $1,233,580,000

Growing the seeds: recovery, strength and capability in Gippsland communities Page 143 of 145
2016 SEIFA IRSAD*Dwellings SEIFA decile 10 score (most advantaged)
—
SEIFA decile 9 score —SEIFA decile 8 score 1,168SEIFA decile 7 score 958SEIFA decile 6 score 2,562SEIFA decile 5 score 2,613SEIFA decile 4 score 3,838SEIFA decile 3 score 3,192SEIFA decile 2 score 3,142SEIFA decile 1 score (most disadvantaged) 5,937No SEIFA score 44
Economic*Low income ($1–$499/week) 34.0% 23.5%Medium income ($500–$1,499/week) 51.6% 53%High income ($1,500+/week) 13.0% 22.2%In public housing 3.2% 4.2%All unemployed 1.9% 1.1%
* Demographic information based on 2016 ABS Census. Residential demographic and economic information is not provided for dwelling counts less than 20 or when the population count is zero.
**Buildings may contain asbestos cement materials, especially in the eaves, internal and external wall cladding, ceilings (particularly in wet areas such as bathrooms and laundries), corrugated products (roofing and cladding) and fences.
Institution ExposureEducation Event Government Facilities EventSchool – Pre/Primary 30 Medicare Office 1School – Secondary 6 Centrelink Office 3School – Tertiary — Local Government Offices 1School – Other (Combined, Special) 5 Major Defence Facility 1
Correctional Facility 1Health and Welfare Emergency ServicesHospital – Public 3 Police Station 8Hospital – Private — Fire Station 43Nursing Home 3 Ambulance Station 5Retirement Home 2 SES Facility 6
Infrastructure ExposureUtility/Energy Event Transport EventPower Station – Major Renewable 1 Airport – Major Areas 3Power Station – Major Fossil Fuel 1 Airport – Major Terminals —Transmission – Substation 1 Airport – Landing Grounds 4Transmission – Electricity Lines (km) 190 Road – Major (km) 232Liquid Fuel – Refineries — Road – Arterial and Sub-arterial (km) 1,089Liquid Fuel – Terminals — Railway – Station 12Liquid Fuel – Depots — Railway –Tracks (km) 164Liquid Fuel – Petrol Stations 17 Maritime – Major Port —Gas Pipeline (km) 177 Maritime – Ferry Terminal —Oil Pipeline (km) —Off-shore Extraction Platform —Waste Management Site 12Waste Water Treatment Plant 6Major Dam Walls 1Telephone Exchange 28Broadcasting Studios (Radio and TV) 1

Growing the seeds: recovery, strength and capability in Gippsland communities Page 144 of 145
Business Exposure, ABR September 2020Number of businesses 9,146 Number of Registered Charity Organisations 81Accommodation and Food Services 301 Number of Primary Producers* 1,777Administrative and Support Services 585 Agriculture and Fishing Support Services 224Agriculture, Forestry and Fishing 1,782 Aquaculture —Arts and Recreation Services 249 Dairy Cattle Farming 496Construction 1,412 Deer Farming —Education and Training 233 Fishing 8Electricity, Gas, Water and Waste Services 18 Forestry and Logging 49Financial and Insurance Services 350 Forestry Support Services 14Health Care and Social Services 599 Fruit and Tree Nut Growing 15Information Media and Telecoms 55 Hunting and Trapping 9Manufacturing 322 Mushroom and Vegetable Growing 14Mining 34 Nursery and Floriculture Production 8Other Services 777 Other Crop Growing 16Professional, Scientific and Tech Serv 617 Other Livestock Farming 84Public Administration and Safety 29 Poultry Farming 7Rental, Hiring and Real Estate Services 608 Sheep, Beef Cattle and Grain Farming 833Retail Trade 624Transport, Postal and Warehousing 343Wholesale Trade 121Unclassified businesses 87
*Primary producer for counts greater than five
Agricultural Exposure, 2019Event Nat (Prop)
Agriculture Commodity Estimated Value 2019: $561,439,000 0%Estimated Agricultural Area (Ha): 393,200 3.0%Commodities include: Almonds, Apples, Apricots, Barley, Beans french runner, Beehives, Blueberries, Broccoli, Brussel sprouts, Canola, Capsicums, Carrots, Cauliflowers, Cereals for livestock, Cultivated turf, Cut flowers, Dairy cattle, Egg production, Goats, Grapes, Hens for eggs, Lettuces, Lupins, Maize, Meat cattle, Nurseries, Oats, Olives; Other berries, broadacre crops, livestock, vegetables; Pastures for hay, silage; Pears Nashi, Pigs, Plums, Potatoes, Pullets for eggs, Pumpkins, Sheep lambs, Sorghum, Sweet corn, Tomatoes, Triticale, Wheat

Growing the seeds: recovery, strength and capability in Gippsland communities Page 145 of 145
Environmental Exposure, September 2020World Heritage List, 2018Declared property: Total Area: 0 haNo features within the nominated boundaryBuffer zone: Total Area: 0 haNo features within the nominated boundaryNational Heritage List, 2020: (Status = Listed places and within listed place only)Historic: Total Area: 0 haNo features within the nominated boundaryIndigenous: Total Area: 0 haNo features within the nominated boundaryNatural: Total Area: 198,909 haAustralian Alps National Parks and Reserves: NSW (141.2ha, 0.0%), Australian Alps National Parks and Reserves, VIC (326,988.8ha, 39.0%)Commonwealth Heritage List, 2020: (Status = Listed places and within listed place only)Historic: Total Area: 0 haNo features within the nominated boundaryIndigenous: Total Area: 0 haNo features within the nominated boundaryNatural: Total Area: 0 haNo features within the nominated boundaryCollaborative Australia Protected Areas Database (CAPAD), 2018. IUCN Protected Area Man Categories:Ia – Strict Nature Reserve: Total Area: 14,721 haIb – Wilderness Area: Total Area: 126,221 haII – National Park: Total Area: 203, 679haIII – Natural Monument or Feature: Total Area: 7,685 haIV – Habitat/Species Management Area: Total Area: 4,766 haV – Protected Landscape/Seascape: Total Area: 6,385 haVI – Protected area with sustainable use of natural resources: Total Area: 25, 743 haWetlands of International Importance (Ramsar Sites), 2016:Gippsland Lakes – VIC (31,791.2ha, 52.0%) Total Area: 41,136 haInterim Biogeographic Regions for Australia (IBRA), Version 7: Total Area: 1,085,808 haNatural Resource Managements (NRM), 2017 Regions: Total Area: 1,808,881 ha