Embed Size (px)
Citation preview

Growth and Comparative Development
Oded Galor
AEA Continuing Education Program
Lecture I —AEA 2014
Oded Galor Growth and Comparative Development Lecture I — AEA 2014 1 / 61

Introduction Comparative Development
Income per Capita across the Globe in 2010
0-1000
1000-3
000
3000-5
000
5000-1
0000
10000-
15000
15000-
20000
20000-
30000
30000-
40000
40000+
Oded Galor Growth and Comparative Development Lecture I — AEA 2014 2 / 61

Introduction Comparative Development
Divergence across Regions: 1820—2010
0
5,000
10,000
15,000
20,000
25,000
30,000
1820 1850 1880 1910 1940 1970 2000
GD
P P
er C
apit
a (1
99
0 In
t'l $
)
Western Europe Western Offshoots Eastern Europe
Latin America Asia Africa
Source: Maddison Project (2013)
Oded Galor Growth and Comparative Development Lecture I — AEA 2014 3 / 61

Introduction Comparative Development
Regional Income per Capita: 1—2010
0
5,000
10,000
15,000
20,000
25,000
30,000
0 500 1000 1500 2000
GD
P P
er C
apit
a (1
99
0 In
t'l $
)
Western Europe Western Offshoots Eastern Europe
Latin America Asia Africa
Oded Galor Growth and Comparative Development Lecture I — AEA 2014 4 / 61

Introduction Comparative Development
Evolution of Inequality across Regions: 1—2010
Income per Capita (1990 Int’l $)
1 1000 1500 1820 2010
Western Offshoots 400 400 400 1,302 29,564
Western Europe 576 427 771 1,455 20,889
Latin America 400 400 416 628 6,767
Asia 456 470 568 591 6,307
Africa 472 425 414 486 2,034
Richest-Poorest Ratio 1.4 1.2 2 3 15
Western Offshoots: USA, Canada, Australia, New Zealand.
Oded Galor Growth and Comparative Development Lecture I — AEA 2014 5 / 61

Introduction Comparative Development
Income Distribution in 1960
.05
.1.1
5.2
.25
Den
sity
of C
ount
ries
4 6 8 10 12Log Income per Capita
1960
Oded Galor Growth and Comparative Development Lecture I — AEA 2014 6 / 61

Introduction Comparative Development
Lack of Convergence across Nations: 1960—1980
file:///C|/Users/Oded_Galor/Dropbox/Files2007/BOOKS/PUP-Revised/new material for chapter 2/denstiyR-1960 1980.gif[12/15/2013 1:22:42 PM]
Oded Galor Growth and Comparative Development Lecture I — AEA 2014 7 / 61
Introduction Comparative Development
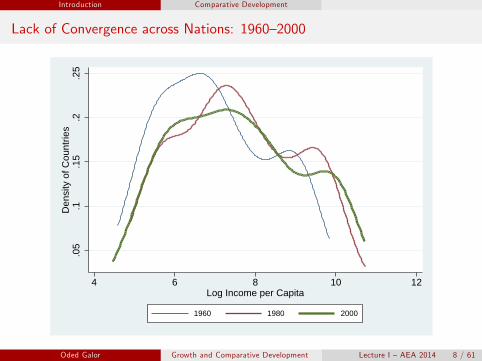
Lack of Convergence across Nations: 1960—2000
.05
.1.1
5.2
.25
Den
sity
of C
ount
ries
4 6 8 10 12Log Income per Capita
1960 1980 2000
Oded Galor Growth and Comparative Development Lecture I — AEA 2014 8 / 61

Introduction Comparative Development
Persistent Inequality across Nations: 1960—2000
ARG
AUSAUT
BDI
BEL
BEN
BFA
BGD
BHS
BLZ
BOL
BRABWA
CAF
CHE
CHL
CHN
CIVCMR
COG
COL
CRI
DNK
DOM
DZA
ECUEGY
ESP
FIN
FJI
FRA
GAB
GBR
GHA
GRC
GTM
GUY
HKG
HND
HTI
HUN
IDN
IND
IRLISL
ISRITA
JPN
KEN
KOR
LBR
LBY
LKA
LSO
LUX
MAR
MDG
MEX
MLT
MRT
MWI
MYS
NER
NGA
NIC
NLD
NOR
NPL
NZL
OMN
PAK
PAN
PER
PHL
PNG
PRI
PRT
PRY
RWA
SDNSEN
SGP
SLE
SLV
SWE
SYC
SYR
TCD
TGO
THA
TTOURY
USA
VCT
VEN
ZAF
ZAR
ZMB
ZWE
.4.6
.81
Ln G
DP
per
Cap
ita in
200
0 (r
elat
ive
to th
e U
S)
.4 .6 .8 1Ln GDP per Capita in 1960 (relative to the US)
Oded Galor Growth and Comparative Development Lecture I — AEA 2014 9 / 61

Introduction Comparative Development
Fundamental Research Questions
What is the origin of the vast inequality in income per capita acrosscountries and regions?
What accounts for the divergence in per-capita income across countriesin the past two centuries?
What are the factors that inhibited the convergence of poor economiestoward richer ones in the past decades?
What is the role of deep-rooted factors in explaining the observedpatterns of comparative development?
Oded Galor Growth and Comparative Development Lecture I — AEA 2014 10 / 61

Phases of Development
Phases of Development: Modes of Production
Hunting-Gathering
Agriculture Industry
Oded Galor Growth and Comparative Development Lecture I — AEA 2014 11 / 61

Phases of Development
Phases of Development: Standard of Living
The Malthusian Epoch
The Post-Malthusian Regime
The Modern Growth Regime
Oded Galor Growth and Comparative Development Lecture I — AEA 2014 12 / 61

Phases of Development
Phases of Development: Timeline of the Most Developed Economies
Malthusian Epoch (99.8%)
150K BP 1750s
Oded Galor Growth and Comparative Development Lecture I — AEA 2014 13 / 61

Phases of Development
Phases of Development: Timeline of the Most Developed Economies
Malthusian Epoch (99.8%)
150K BP 1750s
Post-Malthusian (0.1%)
1750s 1870s 2014
Oded Galor Growth and Comparative Development Lecture I — AEA 2014 14 / 61

Phases of Development
Phases of Development: Timeline of the Most Developed Economies
Malthusian Epoch (99.8%)
150K BP 1750s
Post-Malthusian (0.1%)
1750s 1870s 2014
1870s 2014
Modern Growth (0.1%)
Oded Galor Growth and Comparative Development Lecture I — AEA 2014 15 / 61

Phases of Development
World Income per Capita: 1—2010
0
2000
4000
6000
8000
0 250 500 750 1000 1250 1500 1750 2000
GD
P P
er C
apit
a (1
99
0 In
t'l $
)
Oded Galor Growth and Comparative Development Lecture I — AEA 2014 16 / 61

Phases of Development
Growth of World Income per Capita: 1—2010
0.0%
0.5%
1.0%
1.5%
1-1000 1000-1500 1500-1820 1820-2010
Oded Galor Growth and Comparative Development Lecture I — AEA 2014 17 / 61

Phases of Development The Malthusian Epoch
The Malthusian Epoch
Income per capita fluctuates around a subsistence level
Characteristics of the period:
Income per capita has a positive effect on population growthFixed factor of production (land) =⇒ Diminishing returns to labor
Technological progress, land expansion or adverse shock to population
=⇒ Temporary increase in the level of income per capita=⇒ Increase in the size of the population=⇒ Marginal productivity of labor returns to its previous level=⇒ No effect on the level of income per capita in the long run
Technologically advanced & land-rich economies:
Higher population densityLargely similar levels of income per-capita in the long-run
Oded Galor Growth and Comparative Development Lecture I — AEA 2014 18 / 61

Phases of Development The Malthusian Epoch
Malthusian Adjustments to the Black Death: England, 1250—1750
0.00
2.00
4.00
6.00
8.00
0
50
100
150
200
1255 1295 1335 1375 1415 1455 1495 1535 1575 1615 1655 1695 1735
Pop
ula
tio
n (
mill
ion
s)
Rea
l Far
m W
ages
(1
77
5=1
00
)
Real Wages Population
Oded Galor Growth and Comparative Development Lecture I — AEA 2014 19 / 61

Phases of Development The Malthusian Epoch
Land Productivity and Population Density in 1500
Conditional on transition timing, geographical factors, and continental fixed effects.
Source: Ashraf-Galor (AER 2011)
Oded Galor Growth and Comparative Development Lecture I — AEA 2014 20 / 61

Phases of Development The Malthusian Epoch
Land Productivity and Population Density in 1500 (Income Sample)
Conditional on transition timing, geographical factors, and continental fixed effects.
Source: Ashraf-Galor (AER 2011)
Oded Galor Growth and Comparative Development Lecture I — AEA 2014 21 / 61

Phases of Development The Malthusian Epoch
Land Productivity and Income per Capita in 1500
Conditional on transition timing, geographical factors, and continental fixed effects.
Source: Ashraf-Galor (AER 2011)
Oded Galor Growth and Comparative Development Lecture I — AEA 2014 22 / 61

Phases of Development The Malthusian Epoch
Technology and Population Density in 1500
Years elapsed since the Neolithic Transition reflects the technological level in 1500.
Conditional on land productivity, geographical factors, and continental fixed effects.
Source: Ashraf-Galor (AER 2011)
Oded Galor Growth and Comparative Development Lecture I — AEA 2014 23 / 61

Phases of Development The Malthusian Epoch
Technology and Population Density in 1500 (Income Sample)
Years elapsed since the Neolithic Transition reflects the technological level in 1500.
Conditional on land productivity, geographical factors, and continental fixed effects.
Source: Ashraf-Galor (AER 2011)
Oded Galor Growth and Comparative Development Lecture I — AEA 2014 24 / 61

Phases of Development The Malthusian Epoch
Technology and Income per Capita in 1500
Years elapsed since the Neolithic Transition reflects the technological level in 1500.
Conditional on land productivity, geographical factors, and continental fixed effects.
Source: Ashraf-Galor (AER 2011)
Oded Galor Growth and Comparative Development Lecture I — AEA 2014 25 / 61

Phases of Development The Post-Malthusian Regime
The Post-Malthusian Regime
Take-off from a Malthusian equilibrium:
Technological progress accelerates
Income per capita still has a positive effect on population growth
Technological progress generates:
Rapid increase in total outputRelatively slower increase in population (Malthusian adjustment)Increase in per-capita income
Faster growth of income per capita and population (relative to theMalthusian regime)
Oded Galor Growth and Comparative Development Lecture I — AEA 2014 26 / 61

Phases of Development The Post-Malthusian Regime
Regional Variation in the Timing of the Take-off
0
5,000
10,000
15,000
20,000
25,000
30,000
1700 1750 1800 1850 1900 1950 2000
GD
P P
er C
apit
a (1
99
0 In
t'l $
)
Western Europe Western Offshoots Eastern Europe
Latin America Asia Africa
Oded Galor Growth and Comparative Development Lecture I — AEA 2014 27 / 61
Phases of Development The Post-Malthusian Regime
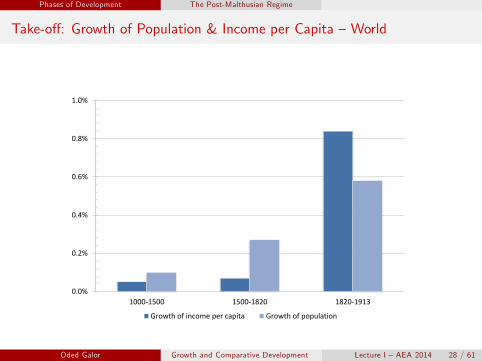
Take-off: Growth of Population & Income per Capita —World
0.0%
0.2%
0.4%
0.6%
0.8%
1.0%
1000-1500 1500-1820 1820-1913
Growth of income per capita Growth of population
Oded Galor Growth and Comparative Development Lecture I — AEA 2014 28 / 61

Phases of Development The Post-Malthusian Regime
Take-off: Growth of Population & Income per Capita —Western Offshoots
0.0%
0.5%
1.0%
1.5%
2.0%
2.5%
1000-1500 1500-1820 1820-1913
Growth of income per capita Growth of population
Oded Galor Growth and Comparative Development Lecture I — AEA 2014 29 / 61
Phases of Development The Post-Malthusian Regime
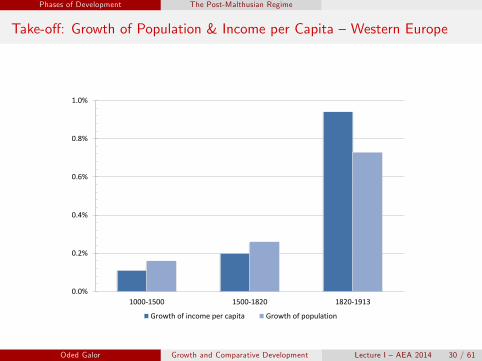
Take-off: Growth of Population & Income per Capita —Western Europe
0.0%
0.2%
0.4%
0.6%
0.8%
1.0%
1000-1500 1500-1820 1820-1913
Growth of income per capita Growth of population
Oded Galor Growth and Comparative Development Lecture I — AEA 2014 30 / 61

Phases of Development The Post-Malthusian Regime
Take-off: Growth of Population & Income per Capita —Latin America
0.0%
0.5%
1.0%
1.5%
1000-1500 1500-1820 1820-1913
Growth of income per capita Growth of population
Oded Galor Growth and Comparative Development Lecture I — AEA 2014 31 / 61

Phases of Development The Post-Malthusian Regime
Take-off: Growth of Population & Income per Capita —Africa
0.0%
0.2%
0.4%
0.6%
0.8%
1.0%
1000-1500 1500-1820 1820-1913
Growth of income per capita Growth of population
Oded Galor Growth and Comparative Development Lecture I — AEA 2014 32 / 61

Phases of Development The Post-Malthusian Regime
Take-off: Growth of Population & Income per Capita —Asia
0.0%
0.2%
0.4%
0.6%
0.8%
1.0%
1000-1500 1500-1820 1820-1973
Growth of income per capita Growth of population
Oded Galor Growth and Comparative Development Lecture I — AEA 2014 33 / 61

Phases of Development The Post-Malthusian Regime
Take-off & Increased Industrialization per Capita
0
225
450
675
1750 1800 1850 1900 1950 2000
Per
Cap
ita
Ind
ust
rial
izat
ion
USA Germany Canada United Kingdom France Japan
Oded Galor Growth and Comparative Development Lecture I — AEA 2014 34 / 61

Phases of Development The Post-Malthusian Regime
Take-off in Developed Economies & Decline in Industrialization in LDCs
0
10
20
30
1750 1800 1850 1900 1950 2000
Per
Cap
ita
Ind
ust
rial
izat
ion
Third World India China
Oded Galor Growth and Comparative Development Lecture I — AEA 2014 35 / 61

Phases of Development The Modern Growth Regime
The Modern Growth Regime
The emergence of sustained economic growth
Acceleration in technological progress
=⇒ Industrial demand for human capital
Human capital formation
=⇒ Decline in fertility rates=⇒ Further technological progress
Population growth declines
=⇒ Economic growth is freed from counterbalancing effects ofpopulation
Technological progress, human capital & decline in population growth
=⇒ Sustained economic growth
Oded Galor Growth and Comparative Development Lecture I — AEA 2014 36 / 61

Phases of Development The Modern Growth Regime
Sustained Economic Growth: 1870—2000
500
5,000
50,000
1870 1880 1890 1900 1910 1920 1930 1940 1950 1960 1970 1980 1990 2000
GD
P P
er C
apit
a (l
og
scal
e)
Western Europe Western Offshoots
Oded Galor Growth and Comparative Development Lecture I — AEA 2014 37 / 61

Phases of Development The Modern Growth Regime
Regional Variation in Growth of Income per Capita: 1950—2000
500
5,000
50,000
1950 1960 1970 1980 1990 2000
GD
P P
er C
apit
a (l
og
scal
e)
Western Europe Western Offshoots Africa
Asia Eastern Europe Latin America
Oded Galor Growth and Comparative Development Lecture I — AEA 2014 38 / 61

Phases of Development The Demographic Transition
Years Elapsed since the Onset of the Fertility Decline
0-15
15-30
30-45
45-60
60-75
75-90 90+ N.A
Oded Galor Growth and Comparative Development Lecture I — AEA 2014 39 / 61

Phases of Development The Demographic Transition
Early Fertility Decline —Western Offshoots
0.0%
0.5%
1.0%
1.5%
2.0%
2.5%
3.0%
1000-1500 1500-1820 1820-1870 1870-1913 1913-1950
Oded Galor Growth and Comparative Development Lecture I — AEA 2014 40 / 61
Phases of Development The Demographic Transition
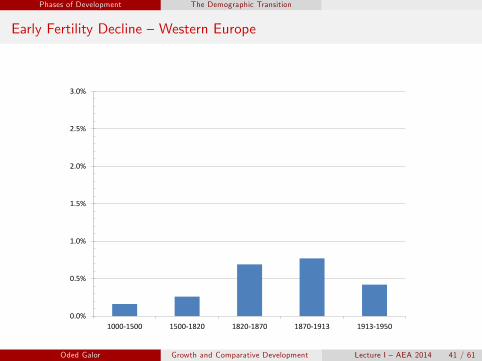
Early Fertility Decline —Western Europe
0.0%
0.5%
1.0%
1.5%
2.0%
2.5%
3.0%
1000-1500 1500-1820 1820-1870 1870-1913 1913-1950
Oded Galor Growth and Comparative Development Lecture I — AEA 2014 41 / 61

Phases of Development The Demographic Transition
Early Fertility Decline —Eastern Europe
0.0%
0.5%
1.0%
1.5%
2.0%
2.5%
3.0%
1000-1500 1500-1820 1820-1870 1870-1913 1913-1950
Oded Galor Growth and Comparative Development Lecture I — AEA 2014 42 / 61

Phases of Development The Demographic Transition
Late Fertility Decline —Latin America
0.0%
0.5%
1.0%
1.5%
2.0%
2.5%
3.0%
1000-1500 1500-1820 1820-1870 1870-1913 1913-1950 1950-1973 1973-1998
Oded Galor Growth and Comparative Development Lecture I — AEA 2014 43 / 61

Phases of Development The Demographic Transition
Late Fertility Decline —Asia
0.0%
0.5%
1.0%
1.5%
2.0%
2.5%
3.0%
1000-1500 1500-1820 1820-1870 1870-1913 1913-1950 1950-1973 1973-1998
Oded Galor Growth and Comparative Development Lecture I — AEA 2014 44 / 61

Phases of Development The Demographic Transition
Late Fertility Decline —Africa
0.0%
0.5%
1.0%
1.5%
2.0%
2.5%
3.0%
1000-1500 1500-1820 1820-1870 1870-1913 1913-1950 1950-1973 1973-1998 1998-2010
Oded Galor Growth and Comparative Development Lecture I — AEA 2014 45 / 61

Phases of Development The Demographic Transition
Timing of the Demographic Transition and Current Income per Capita
NPL
BTNLAO
MLI
AGO
GINNGA
TGO
LBR
NAM
MDG
SYR
ERI
IRN
BDI
LSO
KHMCOM
PRY
HTI
RWA
ETH
MNGNER
CAF
GTM
HND
LBYSAU
BGD
GMB
NICDJI
MRT
JOR
KWT
ZAF
DZA
SWZ
BENVNMCHNSDNZMB
CIV
GHA
BWA
SEN
GEO
MWI
ALB
KGZ
UZB
AZEARM
BHR
TUN
LBN
BOL
CMR
MAR
MEXKOR
ZWE
EGY
CHL
ISR
DOM
JPN
BLZMUS
IND
THASLV
ROM
ATGPAN
TZA
TTO
FINCANBRACRI
PER
BGR
ITA
PRT
DNKNOR
USA
GBRAUTVENNLD
PHL
CHE
BEL
IDN
DEUESPFRA
LKA
ARGGUY
HUN
SYC
SWECOLSUR
JAMURY
KEN
ECU
MYS4
20
24
Log
Inco
me P
er
Ca
pita in 2
005
2 1 0 1 2Years Elapsed since the Demographic Transition
coef = 1.3462847, (robust) se = .10852591, t = 12.41
Conditional on absolute latitude.
Oded Galor Growth and Comparative Development Lecture I — AEA 2014 46 / 61

Phases of Development The Demographic Transition
Timing of the Demographic Transition and Divergence across Regions
0
5,000
10,000
15,000
20,000
25,000
30,000
1870 1900 1930 1960 1990
GD
P P
er C
apit
a (1
99
0 In
t'l $
)
Western Europe Western Offshoots Eastern Europe
Latin America Asia Africa
Oded Galor Growth and Comparative Development Lecture I — AEA 2014 47 / 61

Challenges for Growth Theory The Malthusian Epoch
Puzzling Patterns for Growth Theory: The Malthusian Epoch
What accounts for the epoch of stagnation that characterized most ofhuman history?
Why did increased productivity lead to increased population rather thanhigher income per capita?
Why did episodes of technological progress in the pre-industrializationera fail to generate sustained economic growth?
Oded Galor Growth and Comparative Development Lecture I — AEA 2014 48 / 61

Challenges for Growth Theory The Transition from Stagnation to Growth
Puzzling Patterns for Growth Theory: Transition from Stagnation to Growth
What is the origin of the sudden increase in growth rates of income percapita and population?
What triggered the demographic transition?
Is a demographic transition critical for the transition to a state ofsustained economic growth?
What factors account for the transition from stagnation to growth ofDCs?
What are their implications for the hurdles faced by LDCs in the transi-tion from stagnation to growth?
Oded Galor Growth and Comparative Development Lecture I — AEA 2014 49 / 61

Challenges for Growth Theory Comparative Development
Puzzling Patterns for Growth Theory: Comparative Development
What accounts for the sudden take-off from stagnation to growth insome countries and the persistent stagnation in others?
What governs the differential timing of the demographic transitionacross the globe?
What is the origin of the vast inequality in income per capita thatemerged across countries in the past two centuries?
What is the contribution of deep rooted factors to the vast inequalityacross countries?
Has the earlier transition of advanced economies adversely affected theprocess of development in LDCs?
Oded Galor Growth and Comparative Development Lecture I — AEA 2014 50 / 61

Challenges for Growth Theory Limitations of Non-Unified Growth Theory
Non-Unified Growth Theory (GT)
Inconsistent with the development process over most of human history:
GT: growth rates decline in the transition to sustained growth
Evidence: non-decreasing growth rates in the development of DCs
GT: technological progress increases steady-state income per capita
Malthusian Epoch - tech progress had no effect on LR income
GT: does not capture the demographic transition (DT)
Evidence: DT is central for the take-off to modern growth
GT: does not capture the take-off from stagnation to growth
Evidence: key for the understanding of comparative development
GT: convergence
Evidence: divergence in the past two centuries
Oded Galor Growth and Comparative Development Lecture I — AEA 2014 51 / 61

Challenges for Growth Theory Limitations of Non-Unified Growth Theory
Non-Unified Growth Theory
Captures the role of factor accumulation and technological progress in themodern growth regime
Not designed to shed light on:
The historical origins of vast and persistent inequality across countries
The forces that triggered the transition of DCs from stagnation to growth
The hurdles faced by LDCs in their take-off from stagnation to growth
The factors that hindered convergence across countries
The role of deep rooted factors in comparative development
Oded Galor Growth and Comparative Development Lecture I — AEA 2014 52 / 61

Evolution of the Growth Literature Proximate Causes of Growth
Proximate Causes of Growth
Factor Accumulation:
Physical capital accumulation (Solow, QJE 1956)
Human capital accumulation (Lucas, JME 1998)
Technological Progress:
Endogenous Growth (Romer, JPE 1990; Grossman-Helpman, 1991; Aghion-Howitt, ECT 1992)
Oded Galor Growth and Comparative Development Lecture I — AEA 2014 53 / 61

Evolution of the Growth Literature Proximate Causes of Growth
Proximate Causes of Growth —Major Challenge
Why do some societies fail to:
Effi ciently invest in physical and human capital?Adopt advance technologies?
In the absence of barriers to accumulation and innovations,
Access to international capital marketsTechnological diffusionGlobal education and health campaigns
=⇒ convergence
Oded Galor Growth and Comparative Development Lecture I — AEA 2014 54 / 61

Evolution of the Growth Literature More Fundamental Causes of Growth
Barriers to Accumulation and Innovation
Inequality
Suboptimal accumulation of human and physical capital
Credit market imperfections (Galor-Zeira, RES 1993)Sociopolitical instability (Alesina et al., JEG 1996)
Inferior institutions (Engerman-Sokoloff, 1997)Ineffi cient provision of education (Galor-Moav-Vollrath, RES 2009)
Ethnic fractionalization
Sociopolitical instability & Ineffi cient provision of public goods
Suboptimal investment (Easterly-Levine, QJE 1997; Alesina et al., JEG 2003)
Institutions (limited protection of property rights & rule of law)
Reduced incentive to accumulate/innovate (North, 1981; Acemoglu-Robinson, 2012)
Social capital (limited trust & cooperation)
Increased investment cost (Putnam, 1993; Guiso et al., JEP 2006; Tabellini, JEEA 2010)
Oded Galor Growth and Comparative Development Lecture I — AEA 2014 55 / 61
Evolution of the Growth Literature More Fundamental Causes of Growth
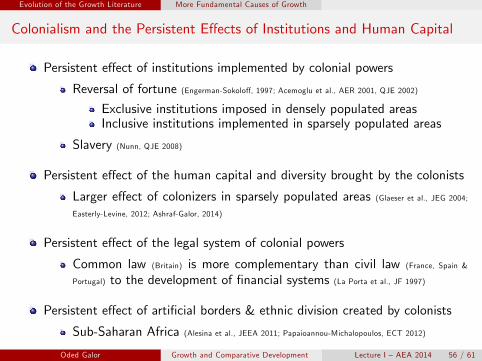
Colonialism and the Persistent Effects of Institutions and Human Capital
Persistent effect of institutions implemented by colonial powers
Reversal of fortune (Engerman-Sokoloff, 1997; Acemoglu et al., AER 2001, QJE 2002)
Exclusive institutions imposed in densely populated areasInclusive institutions implemented in sparsely populated areas
Slavery (Nunn, QJE 2008)
Persistent effect of the human capital and diversity brought by the colonists
Larger effect of colonizers in sparsely populated areas (Glaeser et al., JEG 2004;Easterly-Levine, 2012; Ashraf-Galor, 2014)
Persistent effect of the legal system of colonial powers
Common law (Britain) is more complementary than civil law (France, Spain &
Portugal) to the development of financial systems (La Porta et al., JF 1997)
Persistent effect of artificial borders & ethnic division created by colonists
Sub-Saharan Africa (Alesina et al., JEEA 2011; Papaioannou-Michalopoulos, ECT 2012)
Oded Galor Growth and Comparative Development Lecture I — AEA 2014 56 / 61

Evolution of the Growth Literature More Fundamental Causes of Growth
Origin and Persistence of Cultural Factors
Geographical origins and persistence of:
Trust & cooperation (Guiso et al., QJE 2009; Algan-Cahuc, AER 2010; Durante, 2010; Litina, 2012)
Cultural diversity (Ashraf-Galor, 2012)
The European Marriage Pattern (Voigtlander-Voth, AER 2013)
Female labor force participation (Alesina et al., QJE 2013)
Technological origins and persistence of:
Female emancipation & labor force participation (Galor-Weil, AER 1996; Fernández-
Fogli-Olivetti, QJE 2004; Greenwood-Seshadri-Yorukoglu, RES 2005; Doepke-Tertilt, QJE 2009)
Religious origins of:
Preferences for human capital (Becker-Woessmann, QJE 2009; Botticini-Eckstein, 2012)Work ethic & thrift & entrepreneurial spirit (Weber, 1905; Andersen et al., 2013)
Intergenerational transmission of:
Preferences for human capital (Galor-Moav, QJE 2002)Entrepreneurial spirit & thrift (Deopke-Zilibotti, QJE 2008; Galor-Michalopoulos, JET 2012)
Oded Galor Growth and Comparative Development Lecture I — AEA 2014 57 / 61

Evolution of the Growth Literature Ultimate Causes of Growth
Persistent Effects of Geographical Factors
Biogeographical conditions that triggered the Neolithic Revolution
Technological head-start: (Diamond, 1997; Olsson-Hibbs, EER, 2005)
Persistent effect on population density (1-1500) (Ashraf-Galor, AER 2011)No effect on contemporary income per capita (Ashraf-Galor, AER 2013)
Persistence effect on life expectancy (Galor-Moav, 2009)
Disease environment
Persistent effect on labor productivity & investment in human capital(Gallup-Sachs, 2001; Andersen-Dalgaard-Selaya, 2012)
Geographical isolation
Reduced trade and technological diffusion (Gallup-Mellinger-Sachs, 1999)
Persistence of culture conducive for innovations (Ashraf-Galor-Ozak, JEEA 2010)
Oded Galor Growth and Comparative Development Lecture I — AEA 2014 58 / 61

Evolution of the Growth Literature Ultimate Causes of Growth
Persistent Effects of Geographical Factors
Land suitable for large plantations
Inequality:
Extractive institutions (Engerman-Sokoloff, 1997)
Concentration of landownership:
Suboptimal investment in public education (Galor-Moav-Vollrath, RES 2009)
Soil quality conducive for agriculture
Specialization in unskilled-intensive goods
Reduces human capital formation & increases fertility & slows thetransition to modern growth (Galor-Mountford, RES 2008)
Oded Galor Growth and Comparative Development Lecture I — AEA 2014 59 / 61

Evolution of the Growth Literature Ultimate Causes of Growth
Persistent Effects of Geographical Factors
Range of soil quality
Emergence of geographical specific human capital =⇒ reduced mobility=⇒ ethnic fractionalization (Michalopoulos, AER 2012)
Persistent effect of ethnic fractionalization (Easterly-Levine, QJE 1997)
Ecological diversity & storable crops
Emergence & persistence of state capacity (Fenske, JEEA 2014; Mayshar-Moav-Neeman,2013)
Geographical determinants of body size
Determined fertility & income per capita in the Malthusian epoch andthe timing of the take-off (Dalgaard-Strulik, 2013)
Oded Galor Growth and Comparative Development Lecture I — AEA 2014 60 / 61

Evolution of the Growth Literature Ultimate Causes of Growth
Persistent Effects of Genetic Factors
Natural selection of traits that are complementary to the growth process:
Preference for education (Galor-Moav, QJE 2002; Galor-Klemp, 2013)
Entrepreneurial spirit (Galor-Michalopoulos, JET 2012)
Genetic distance between societies reduces:
Diffusion from the technological frontier (Spolaore-Wacziarg, QJE 2009)Interstate wars (Spolaore-Wacziarg, 2013)
Genetic diversity (GD) within a society:
Reduces cohesiveness:
Higher cultural fragmentation (Ashraf-Galor, AER-PP 2013)
Increased mistrust & prevalence of civil conflict (Arbatli-Ashraf-Galor, 2013)
Generates a wider range of complementarity traits conducive for innova-tions
Has a hump-shaped relationship with productivity (Ashraf-Galor, AER 2013)
Lower income in overly homogenous & diverse societies
Oded Galor Growth and Comparative Development Lecture I — AEA 2014 61 / 61