Embed Size (px)
Citation preview
The Dominican Population in the United States:
Growth and Distribution
A Report by the Migration Policy Institute September 2004
Commissioned by Aeropuertos Dominicanos Siglo XXI

Migration Policy Institute The Dominican Population in the United States: Growth and Distribution
i
ACKNOWLEDGEMENTS This report by the Migration Policy Institute (MPI) was commissioned by Aerodom to explore the size, characteristics, and geographic distribution of the Dominican population in the United States. The primary author was Dr. Elizabeth M. Grieco. The author gratefully acknowledges the efforts of MPI’s Dr. Kimberly Hamilton, Jonathan Pattee, and Colleen Coffey, and also would like to thank Jill Wilson for making the maps included in this report. The contributions of Dr. Ramona Hernandez, Director of the Dominican Studies Institute of City College, City University of New York are also gratefully appreciated. THE MIGRATION POLICY INSTITUTE The Migration Policy Institute is an independent, non-partisan, and non-profit think tank dedicated to the study of the movement of people worldwide. The Institute provides analysis, development, and evaluation of migration and refugee policies at the local, national, and international levels. Additional information is available at www.migrationpolicy.org and www.migrationinformation.org. You may also contact: Colleen Coffey, Communications Coordinator Migration Policy Institute 1400 16th Street NW, Suite 300 Washington, DC 20036-2257 Phone: 202-266-1940 E-mail: [email protected] AERODOM Aeropuertos Dominicanos Siglo XXI (Aerodom) is the company concessioned by the government of the Dominican Republic to develop, operate, and manage six Dominican airports for a period of 25 years. Included in Aerodom’s concession are the international airports of Santo Domingo, Puerto Plata, Samana, and Barahona. Aerodom promotes the growth of international tourism and trade in the Dominican Republic through the operation of world-class airport facilities and a highly proactive air service development program. For additional information about AERODOM, contact:
Ken Hassard, Commercial Director Craig Jenks, President Aeropuertos Dominicanos Siglo XXI, S.A. Airline/Aircraft Projects Inc. Av. Sarasota No. 20 6th Floor Torre Empresarial AIRD, Piso 10, La Julia 115 Fourth Avenue Santo Domingo, Republica Dominicana New York, New York 10003 Phone: 809-421-5888 Ext. 2216 Phone: 212-475-3449 E-mail: [email protected] E-mail: [email protected]
Migration Policy Institute The Dominican Population in the United States: Growth and Distribution
ii
TABLE OF CONTENTS EXECUTIVE SUMMARY.........................................................................................................................1 SIZE AND GROWTH................................................................................................................................3
Key Points Size of the Dominican Population The Dominican Foreign Born Growth of the Dominican Population Between 1990 and 2000 Projected Growth of the Dominican Population, 2000 to 2010
IMMIGRANT INFLOW.............................................................................................................................7
Key Points Types of Immigration Permanent Immigration Temporary Immigration Estimates of the Size of the Dominican Undocumented Population Year of Arrival Citizenship
DEMOGRAPHIC PROFILE ....................................................................................................................13
Key Points Male-to-Female Ratio Average Age and Age Distribution Educational Attainment of Dominicans Born in the United States
GEOGRAPHIC DISTRIBUTION: REGIONS, STATES, AND METROPOLITAN AREAS.............17
Key Points Regions States States of Growth Metropolitan Areas Metropolitan Areas: The Northeast Metropolitan Areas: Florida Metropolitan Areas: Future Growth
APPENDICES...........................................................................................................................................31 Appendix A: The Dominican Population, for the United States, Regions, and States: 1990 and 2000 Appendix B: The 40 Metropolitan Areas with the Largest Dominican Populations: 2000 Appendix C: Data Sources and Methodology ENDNOTES..............................................................................................................................................37

Migration Policy Institute The Dominican Population in the United States: Growth and Distribution
iii
REFERENCES..........................................................................................................................................38 MAPS
The Dominican Population in the United States..................................................................................19 The Dominican Population in the Northeastern United States ............................................................23 The Dominican Population in the New York Metropolitan Area........................................................24 The Dominican Population in the Boston Area ...................................................................................25 The Dominican Population in Florida..................................................................................................26

Migration Policy Institute The Dominican Population in the United States: Growth and Distribution
EXECUTIVE SUMMARY This study summarizes the growth and distribution of the Dominican population in the United States and discusses some of the unique characteristics of this community. The Dominican population experienced considerable growth between the census years of 1990 and 2000, fueled by high immigration in the early-to-mid 1990s. Immigration will continue to play a key role in the growth of the Dominican community for the foreseeable future. SIZE AND GROWTH • In 2000, the Dominican population was 1.1 million. • Between 1990 and 2000, the Dominican population grew by 89
percent. • The Dominican population is projected to be 1.3 million in 2004, 1.4
million in 2006, and 1.6 million in 2010. • Approximately two-thirds of the Dominican population is foreign
born. • Immigration has been – and will continue to be in the near future – the
driving force of growth in the Dominican population. IMMIGRANT INFLOW • The Dominican immigrant population was established through three
types of migration: 1) permanent, 2) temporary, and 3) unauthorized or illegal.
• Between 1998 and 2002, an average of 20,000 permanent immigrants were admitted each year to the United States from the Dominican Republic.
• Between 1998 and 2002, an average of over 200,000 temporary immigrants were admitted each year to the United States from the Dominican Republic. The majority of those admissions were for tourism and business.
• Research suggests that approximately 13 to 15 percent of immigrants from the Dominican Republic, or about 109,000 Dominican foreign born in the United States, are undocumented.
• Over 40 percent of all Dominican foreign born in the United States in 2000 arrived between 1990 and 2000, with almost one-fourth (24 percent) arriving between 1990 and 1995.
• Approximately one-third (37 percent) of all Dominican foreign born have naturalized while about two-thirds (63 percent) remain non-citizens.
1
Migration Policy Institute The Dominican Population in the United States: Growth and Distribution
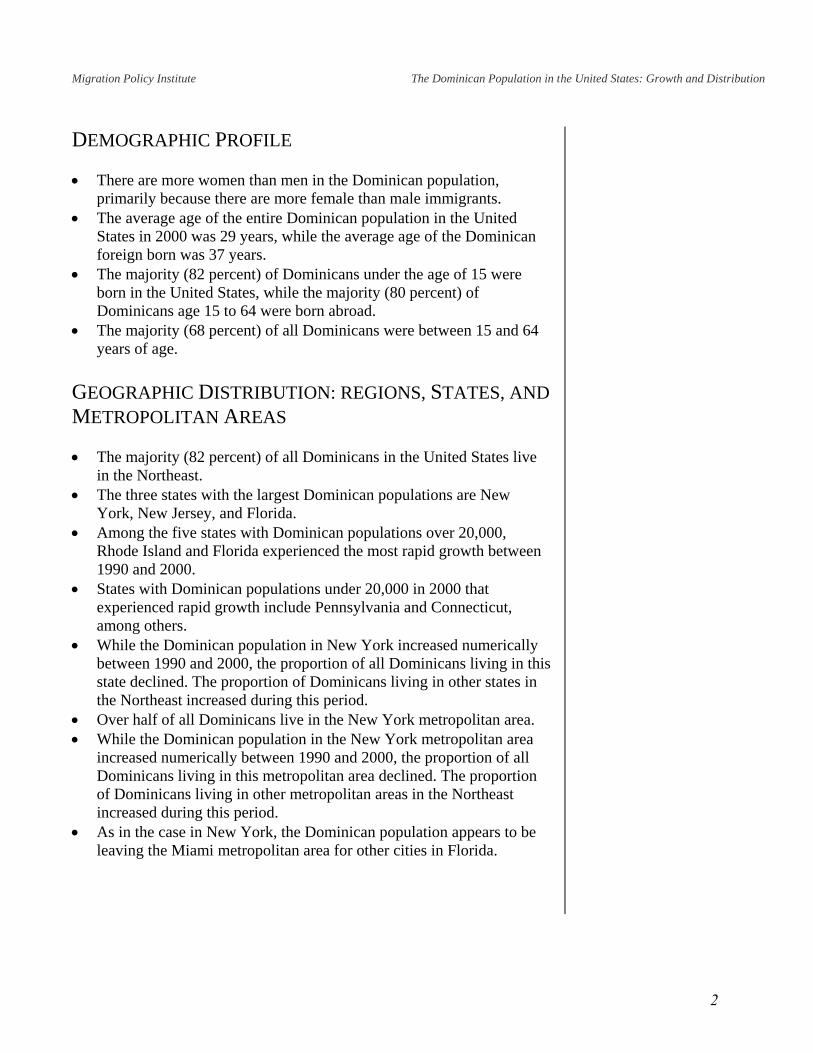
DEMOGRAPHIC PROFILE • There are more women than men in the Dominican population,
primarily because there are more female than male immigrants. • The average age of the entire Dominican population in the United
States in 2000 was 29 years, while the average age of the Dominican foreign born was 37 years.
• The majority (82 percent) of Dominicans under the age of 15 were born in the United States, while the majority (80 percent) of Dominicans age 15 to 64 were born abroad.
• The majority (68 percent) of all Dominicans were between 15 and 64 years of age.
GEOGRAPHIC DISTRIBUTION: REGIONS, STATES, AND METROPOLITAN AREAS • The majority (82 percent) of all Dominicans in the United States live
in the Northeast. • The three states with the largest Dominican populations are New
York, New Jersey, and Florida. • Among the five states with Dominican populations over 20,000,
Rhode Island and Florida experienced the most rapid growth between 1990 and 2000.
• States with Dominican populations under 20,000 in 2000 that experienced rapid growth include Pennsylvania and Connecticut, among others.
• While the Dominican population in New York increased numerically between 1990 and 2000, the proportion of all Dominicans living in this state declined. The proportion of Dominicans living in other states in the Northeast increased during this period.
• Over half of all Dominicans live in the New York metropolitan area. • While the Dominican population in the New York metropolitan area
increased numerically between 1990 and 2000, the proportion of all Dominicans living in this metropolitan area declined. The proportion of Dominicans living in other metropolitan areas in the Northeast increased during this period.
• As in the case in New York, the Dominican population appears to be leaving the Miami metropolitan area for other cities in Florida.
2

Migration Policy Institute The Dominican Population in the United States: Growth and Distribution
SIZE AND GROWTH KEY POINTS • In 2000, the Dominican population was 1.1 million. • Between 1990 and 2000, the Dominican population grew by 89
percent. • The Dominican population is projected to be 1.3 million in 2004, 1.4
million in 2006, and 1.6 million in 2010. • Approximately two-thirds of the Dominican population is foreign
born. • Immigration has been – and will continue to be in the near future – the
driving force of growth in the Dominican population. SIZE OF THE DOMINICAN POPULATION For this report, the Dominican population includes people 1) who were born in the Dominican Republic and 2) who define themselves as Dominican through origin or ancestry (see Box 1). In 1990, the size of the Dominican population was 586,700. By 2000, the Dominican population had increased to over 1.1 million.i Between 1990 and 2000, the Dominican population grew by 89 percent.
T T21aDs
In 1990, the Dominican population in the United States numbered 586,700, but by 2000, it was over 1.1 million.
Between 1990 and 2000, the Dominican population grew by 89 percent.
Two out of every
Box 1. Defining the Dominican Population In the United States, the term “Dominican” can refer to a person’s place of birth, origin, or ancestry. This broad definition simply reflects the composition of the Dominican community, which consists of both immigrants and United States natives who can trace their heritage to the Dominican Republic. To best reflect the characteristics and distribution of this population in its broadest sense, this report defines as part of the Dominican community anyone who 1) was born in the Dominican Republic and 2) self-reported Dominican as their origin or ancestry. This includes immigrants who were born in other countries, such as Mexico, Cuba, or Haiti.
HE DOMINICAN FOREIGN BORN
he bulk of the increase in the Dominican population between 1990 and 000 was the result of immigration. Of the total Dominican population of .1 million, 36 percent were U.S. nativesii while 64 percent were born broad (see Table 1). Most foreign-born Dominicans were born in the ominican Republic, but a small percentage were born in other countries,
uch as Mexico, Cuba, or Haiti. Of the 710,921 Dominican foreign born,
three Dominicans are foreign born. Immigration is the driving force of Dominican population growth.
3

Migration Policy Institute The Dominican Population in the United States: Growth and Distribution less than 4 percent were born outside of the Dominican Republic (see Box 2). Table 1. The Dominican Population, by Nativity: 2000 Nativity Number Percent Total 1,111,142 100.0 Native 400,221 36.0 Foreign born 710,921 64.0 Note: The Dominican population includes anyone who was born in the Dominican Republic or is of Dominican origin or ancestry. U.S. natives of Dominican descent include 13,585 who were born abroad of American parents. The Dominican foreign born includes those foreign born who were born in the Dominican Republic as well as those immigrants who were born in other countries and are of Dominican origin or ancestry. Source: U.S. Census Bureau, Census 2000, 5% PUMS File.
GB Tm TbfD2 Wfiwi6D
The term nativity refers to a person’s citizenship at birth. A native is someone who was a United States citizen at birth. The term foreign born refers to those who were not United States citizens at birth.
Between 1990 and 2000, the number of Dominicans born in
Box 2. Defining the Dominican Foreign Born In this report, the term “Dominican foreign born” is used to define any immigrant who is of Dominican origin or descent. This includes those foreign born who were born in the Dominican Republic as well as those immigrants who were born in other countries. When necessary, terms such as “Dominican-born immigrants” or “immigrants from the Dominican Republic” are used to separate Dominican immigrants born in the Dominican Republic from other immigrants of Dominican origin or descent.
ROWTH OF THE DOMINICAN POPULATION ETWEEN 1990 AND 2000
he total Dominican population increased from 586,700 in 1990 to 1.1 illion in 2000, representing an 89 percent growth rate (see Table 2).
he native population grew faster than the Dominican foreign born etween 1990 and 2000. The native population nearly doubled, increasing rom 203,723 in 1990 to 400,221 in 2000, or by 97 percent. The ominican foreign born increased from 382,977 in 1990 to 710,921 in 000, or by 86 percent.
hile the native population grew at a faster rate than the Dominican oreign born, the bulk of the growth between 1990 and 2000 was due to mmigration. Between 1990 and 2000, the Dominican population as a hole increased by 524,442 persons, while the immigrant population
ncreased by 327,944. The growth in the immigrant population represents 3 percent of the total growth. Clearly, immigration is the driving force of ominican population growth.
the United States nearly doubled in size, from 204,000 to over 400,000.
While the native population grew at a faster rate than the foreign-born population, the bulk of the growth in the Dominican population between 1990 and 2000 was due to immigration.
4

Migration Policy Institute The Dominican Population in the United States: Growth and Distribution
Table 2. The Dominican Population, by Nativity, Showing Percent Growth: 1990 and 2000
Place of birth 1990 2000
Numeric difference,
1990 to 2000
Percent change, 1990 to
2000 Total 586,700 1,111,142 524,442 89.4 Native 203,723 400,221 196,498 96.5 Foreign born 382,977 710,921 327,944 85.6 Note: The Dominican population includes anyone who was born in the Dominican Republic or is of Dominican origin or ancestry. The Dominican foreign born includes those foreign born who were born in the Dominican Republic as well as those immigrants who were born in other countries and are of Dominican origin or ancestry. Source: U.S. Census Bureau, 1990 Census of Population and Housing and Census 2000, 5% PUMS Files. PROJECTED GROWTH OF THE DOMINICAN POPULATION, 2000 TO 2010 Between 1990 and 2000, the Dominican population increased from 586,700 to 1.1 million, or by 524,442 persons. Over the following decade, the Dominican population is projected by the Migration Policy Institute to grow by an additional 454,433 persons, reaching 1.6 million in 2010 (see Table 3 and Figure 1). This suggests a population growth rate of 41 percent over the next decade. Table 3. Size of the Dominican Population in 1990 and 2000, Showing Projected Population Size in 2004, 2007, and 2010. Year Population size Census 1990 586,700 2000 1,111,142 Projected population size in: 2004 1,289,945 2006 1,380,683 2010 1,565,575 Source: U.S. Census Bureau, 1990 and 2000 Census, 5% PUMS Files; population projections by the Migration Policy Institute. See Appendix C for additional information on methodologies used to generate the Dominican population projections.
The size of the Dominican population is projected to be 1.3 million in 2004, 1.4 million in 2006, and 1.6 million in 2010.
These projections suggest the Dominican population will increase by 41 percent over the 2000 to 2010 decade.
5

Migration Policy Institute The Dominican Population in the United States: Growth and Distribution
Figure 1.Size of the Dominican Population in 1990 and 2000,
Showing Projected Population Size in2004, 2006, and 2010
0.6
1.1
1.3
1.6
1.4
0.0
0.2
0.4
0.6
0.8
1.0
1.2
1.4
1.6
1.8
1990
1992
1994
1996
1998
2000
2002
2004
2006
2008
2010
Source: U.S. Census Bureau, 1990 and 2000 Census, 5% PUMS Files;population projections by the Migration Policy Institute.
Num
ber
(in m
illio
ns)
During the 2000 to 2010 decade, the Dominican population is projected to increase by over 454,00 persons.
6

Migration Policy Institute The Dominican Population in the United States: Growth and Distribution
IMMIGRANT INFLOW KEY POINTS • The Dominican immigrant population was established through three
types of migration: 1) permanent, 2) temporary, and 3) unauthorized or illegal.
• Between 1998 and 2002, an average of 20,000 permanent immigrants were admitted each year to the United States from the Dominican Republic.
• Between 1998 and 2002, an average of over 200,000 temporary immigrants were admitted each year to the United States from the Dominican Republic. The majority of those admissions were for tourism and business.
• Research suggests that approximately 13 to 15 percent of immigrants from the Dominican Republic, or about 109,000 Dominican foreign born in the United States, are undocumented.
• Over 40 percent of all Dominican foreign born in the United States in 2000 arrived between 1990 and 2000, with almost one-fourth (24 percent) arriving between 1990 and 1995.
• Approximately one-third (37 percent) of all Dominican foreign born have naturalized while about two-thirds (63 percent) remain non-citizens.
TYPES OF IMMIGRATION The Dominican immigrant population is made up of three types of migrants: 1) permanent, 2) temporary, and 3) the unauthorized or illegal. Permanent immigrants are admitted into the United States for permanent settlement. Temporary immigrants are admitted for a specific purpose, such as tourism, business, to study, or for temporary employment. Although temporary immigrants are permitted to stay only for a defined period of time, many often change their status once in the United States (e.g., by obtaining a “green card,” through marriage, etc.). Unauthorized immigrants are those foreign-born persons who entered the United States illegally or who entered legally as temporary immigrants but remained in the United States after their visas had expired. There is a fourth type of migrant: refugees and asylees. However, only a very small number of Dominican foreign born (less than 200 between 1990 and 2000) became legal permanent residents as refugees and asylees.
Permanent immigrants are admitted into the United States for permanent settlement.
Temporary immigrants are admitted for a specific purpose, such as tourism, temporary employment, or to study.
Unauthorized immigrants are foreign-born persons who entered the United States illegally or entered legally but then remained after their visas had expired.
7
Migration Policy Institute The Dominican Population in the United States: Growth and Distribution
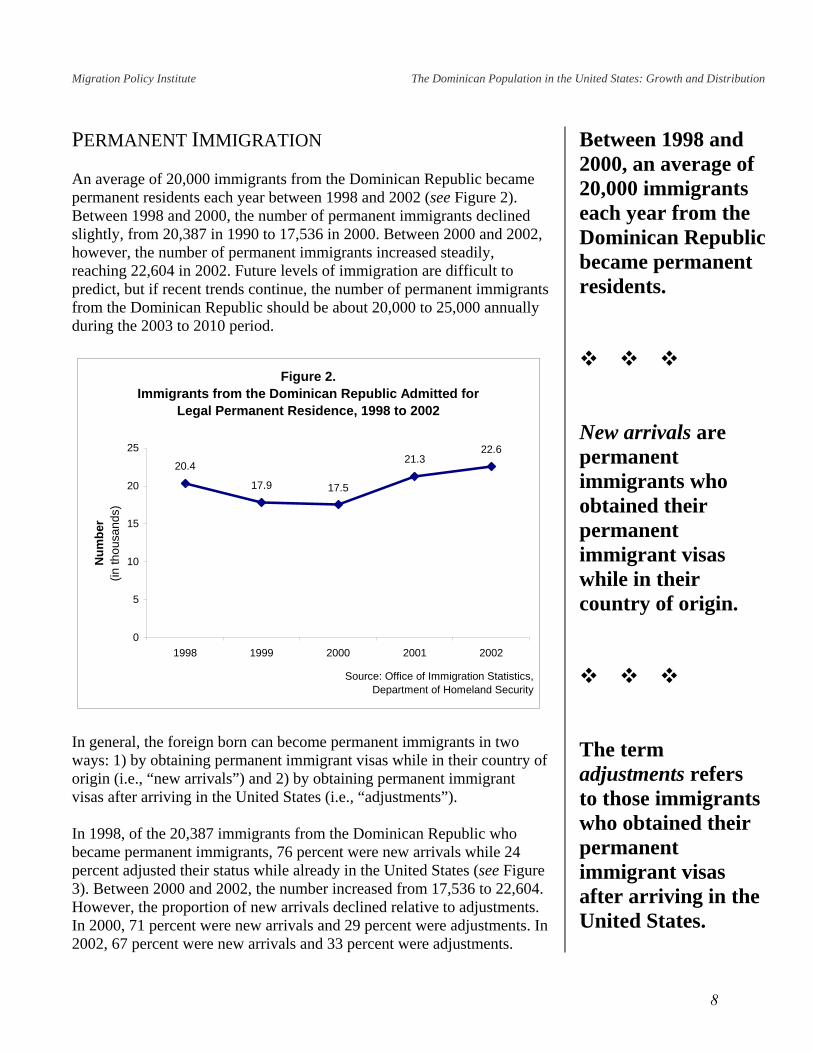
PERMANENT IMMIGRATION An average of 20,000 immigrants from the Dominican Republic became permanent residents each year between 1998 and 2002 (see Figure 2). Between 1998 and 2000, the number of permanent immigrants declined slightly, from 20,387 in 1990 to 17,536 in 2000. Between 2000 and 2002, however, the number of permanent immigrants increased steadily, reaching 22,604 in 2002. Future levels of immigration are difficult to predict, but if recent trends continue, the number of permanent immigrants from the Dominican Republic should be about 20,000 to 25,000 annually during the 2003 to 2010 period.
Figure 2.Immigrants from the Dominican Republic Admitted for
Legal Permanent Residence, 1998 to 2002
20.4
17.9 17.5
21.322.6
0
5
10
15
20
25
1998 1999 2000 2001 2002
Source: Office of Immigration Statistics,Department of Homeland Security
Num
ber
(in th
ousa
nds)
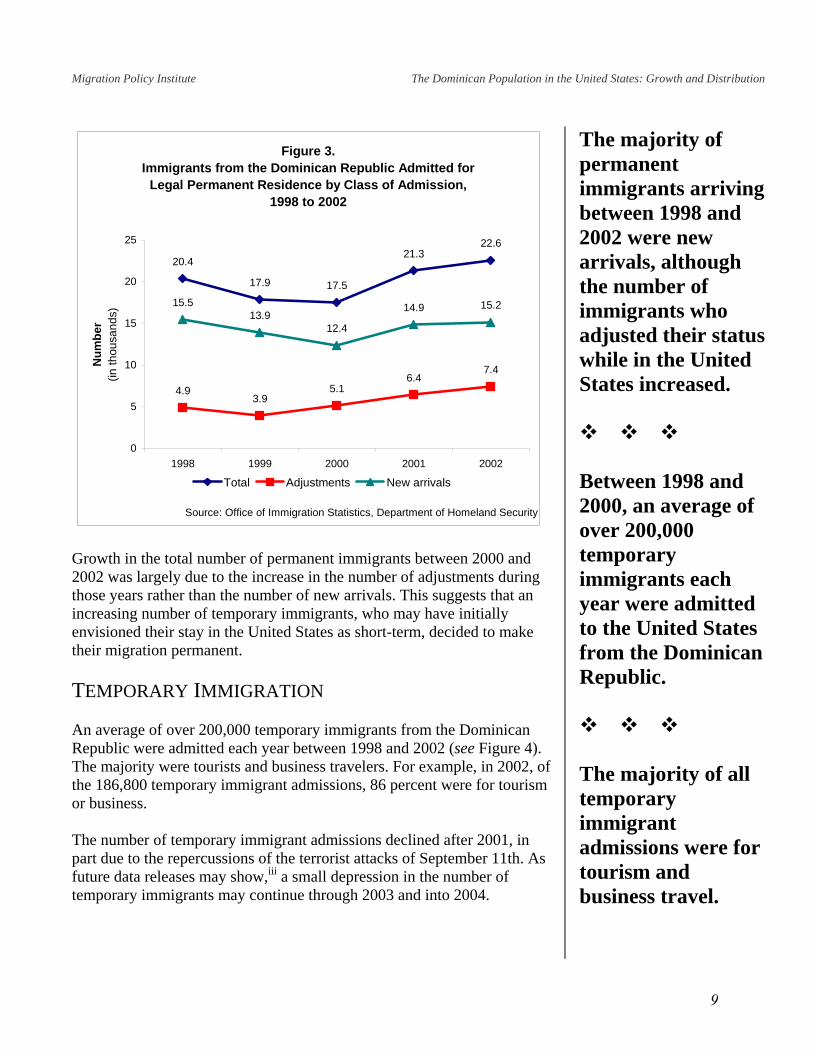
In general, the foreign born can become permanent immigrants in two ways: 1) by obtaining permanent immigrant visas while in their country of origin (i.e., “new arrivals”) and 2) by obtaining permanent immigrant visas after arriving in the United States (i.e., “adjustments”). In 1998, of the 20,387 immigrants from the Dominican Republic who became permanent immigrants, 76 percent were new arrivals while 24 percent adjusted their status while already in the United States (see Figure 3). Between 2000 and 2002, the number increased from 17,536 to 22,604. However, the proportion of new arrivals declined relative to adjustments. In 2000, 71 percent were new arrivals and 29 percent were adjustments. In 2002, 67 percent were new arrivals and 33 percent were adjustments.
Between 1998 and 2000, an average of 20,000 immigrants each year from the Dominican Republic became permanent residents.
New arrivals are permanent immigrants who obtained their permanent immigrant visas while in their country of origin.
The term adjustments refers to those immigrants who obtained their permanent immigrant visas after arriving in the United States.
8
Migration Policy Institute The Dominican Population in the United States: Growth and Distribution
Figure 3.Immigrants from the Dominican Republic Admitted for
Legal Permanent Residence by Class of Admission,1998 to 2002
20.4
17.9 17.5
21.322.6
4.93.9
5.16.4
7.4
15.513.9
12.4
14.9 15.2
0
5
10
15
20
25
1998 1999 2000 2001 2002
Source: Office of Immigration Statistics, Department of Homeland Security
Num
ber
(in th
ousa
nds)
Total Adjustments New arrivals
Growth in the total number of permanent immigrants between 2000 and 2002 was largely due to the increase in the number of adjustments during those years rather than the number of new arrivals. This suggests that an increasing number of temporary immigrants, who may have initially envisioned their stay in the United States as short-term, decided to make their migration permanent. TEMPORARY IMMIGRATION An average of over 200,000 temporary immigrants from the Dominican Republic were admitted each year between 1998 and 2002 (see Figure 4). The majority were tourists and business travelers. For example, in 2002, of the 186,800 temporary immigrant admissions, 86 percent were for tourism or business. The number of temporary immigrant admissions declined after 2001, in part due to the repercussions of the terrorist attacks of September 11th. As future data releases may show,iii a small depression in the number of temporary immigrants may continue through 2003 and into 2004.
The majority of permanent immigrants arriving between 1998 and 2002 were new arrivals, although the number of immigrants who adjusted their status while in the United States increased.
Between 1998 and 2000, an average of over 200,000 temporary immigrants each year were admitted to the United States from the Dominican Republic.
The majority of all temporary immigrant admissions were for tourism and business travel.
9

Migration Policy Institute The Dominican Population in the United States: Growth and Distribution
However, if the trends throughout the 1990s are any indication of future patterns, it is likely that the number of temporary immigrants coming to the United States will return to 190,000 to 200,000 admissions annually.
Figure 4.Non-Immigrants from the Dominican Republic Admitted by
Class of Admission, 1998 to 2002
203.7221.4
207.0 208.0186.8
191.6207.7
193.6 193.7
160.8
0
50
100
150
200
250
1998 1999 2000 2001 2002
Source: Office of Immigration Statistics, Department of Homeland Security
Num
ber
(in th
ousa
nds)
All classes Temporary visitors for business or pleasure
ESTIMATES OF THE SIZE OF THE DOMINICAN UNDOCUMENTED POPULATION Definitive counts of the undocumented population from the Dominican Republic are not available because there are no federally funded, nationally representative surveys that include a question on immigrant status (other than citizenship/non-citizenship). However, both the Department of Homeland Security’s Office of Immigration Statistics and the Urban Institute have generated estimates of the size of the undocumented population by country of origin based on census and survey data (see Table 4). These estimates suggest that in 2000 there were between 90,000 and 100,000 undocumented immigrants from the Dominican Republic. Given that there were approximately 690,000 Dominican-born immigrants in the United States in 2000, these numbers suggest that between 13 and 15 percent were undocumented. The proportion of Dominican foreign born who are undocumented is estimated to be lower than that of other Latin American immigrant groups. Research by Jeffery Passel (2002) suggests that, in 2000, over half of all foreign born from Mexico were undocumented. For the rest of Latin
Data on undocumented immigrants in the United States are based on estimates, not on actual counts.
Research suggests that, in 2000, between 13 and 15 percent of all immigrants from the Dominican Republic were undocumented.
The proportion of Dominican foreign born who are undocumented is lower than that for other Latin American immigrant groups.
10
Migration Policy Institute The Dominican Population in the United States: Growth and Distribution
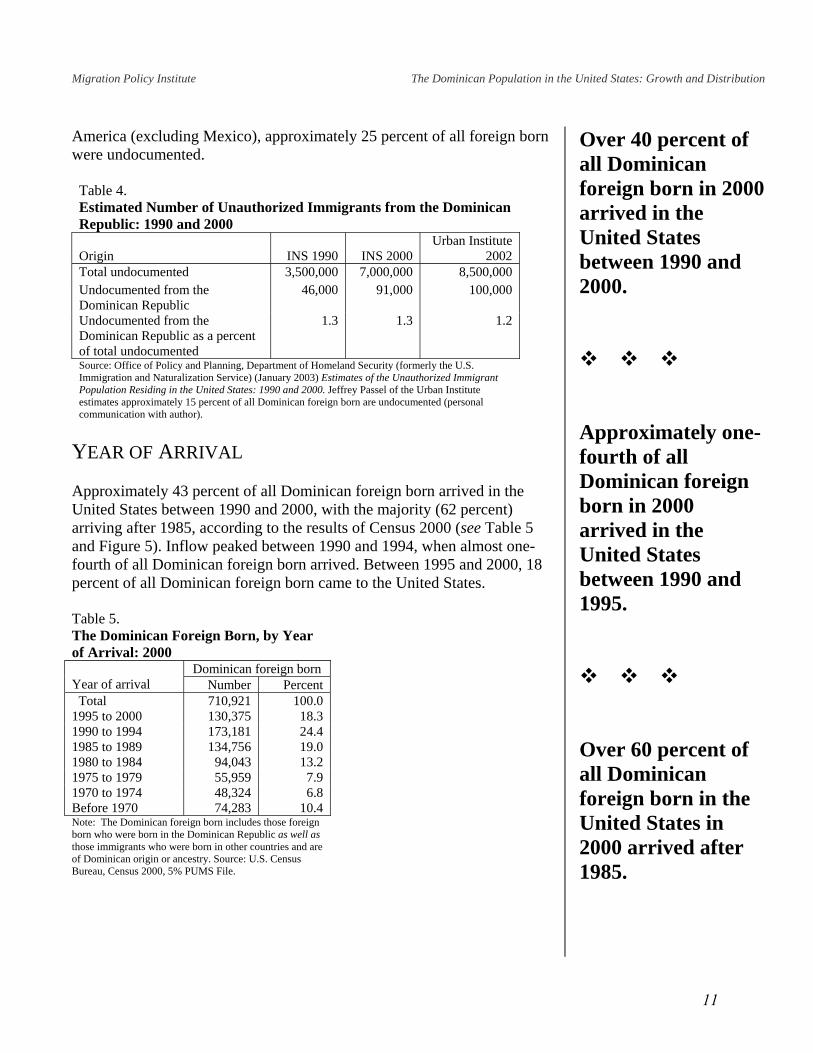
America (excluding Mexico), approximately 25 percent of all foreign born were undocumented. Table 4. Estimated Number of Unauthorized Immigrants from the Dominican Republic: 1990 and 2000
Origin INS 1990 INS 2000 Urban Institute
2002 Total undocumented 3,500,000 7,000,000 8,500,000 Undocumented from the Dominican Republic
46,000 91,000 100,000
Undocumented from the Dominican Republic as a percent of total undocumented
1.3 1.3 1.2
Source: Office of Policy and Planning, Department of Homeland Security (formerly the U.S. Immigration and Naturalization Service) (January 2003) Estimates of the Unauthorized Immigrant Population Residing in the United States: 1990 and 2000. Jeffrey Passel of the Urban Institute estimates approximately 15 percent of all Dominican foreign born are undocumented (personal communication with author).
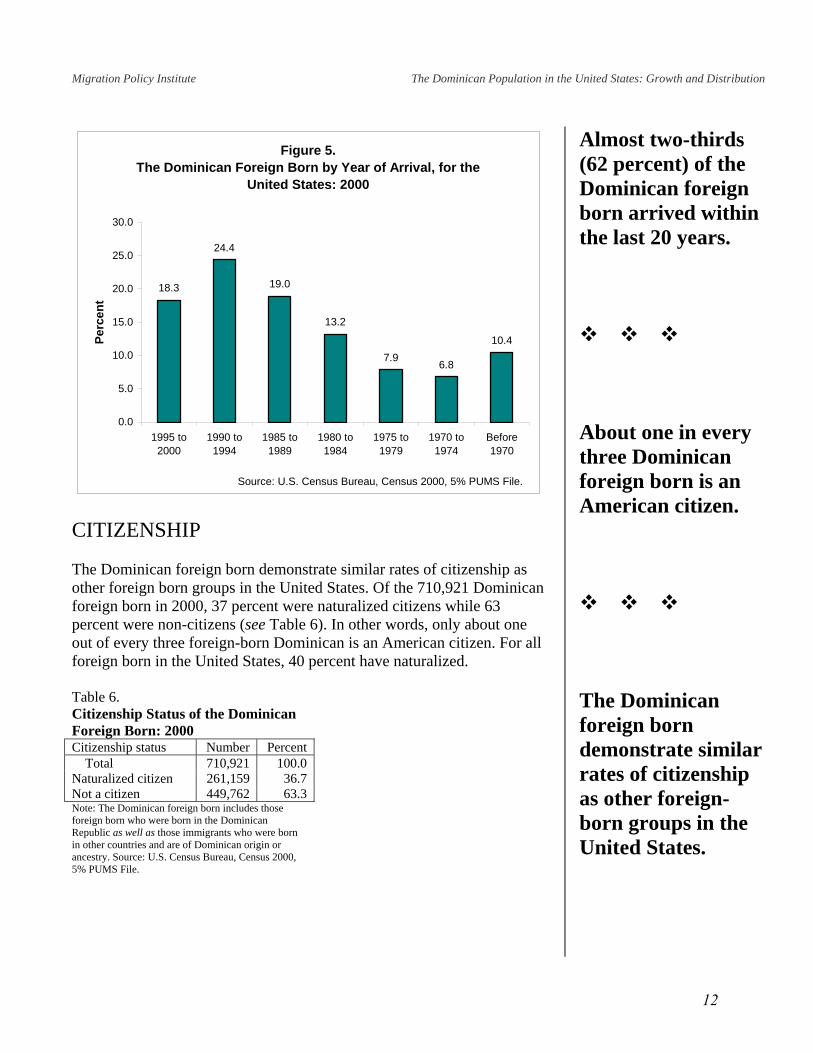
YEAR OF ARRIVAL Approximately 43 percent of all Dominican foreign born arrived in the United States between 1990 and 2000, with the majority (62 percent) arriving after 1985, according to the results of Census 2000 (see Table 5 and Figure 5). Inflow peaked between 1990 and 1994, when almost one-fourth of all Dominican foreign born arrived. Between 1995 and 2000, 18 percent of all Dominican foreign born came to the United States. Table 5. The Dominican Foreign Born, by Year of Arrival: 2000
Dominican foreign born Year of arrival Number Percent Total 710,921 100.0 1995 to 2000 130,375 18.3 1990 to 1994 173,181 24.4 1985 to 1989 134,756 19.0 1980 to 1984 94,043 13.2 1975 to 1979 55,959 7.9 1970 to 1974 48,324 6.8 Before 1970 74,283 10.4 Note: The Dominican foreign born includes those foreign born who were born in the Dominican Republic as well as those immigrants who were born in other countries and are of Dominican origin or ancestry. Source: U.S. Census Bureau, Census 2000, 5% PUMS File.
Over 40 percent of all Dominican foreign born in 2000 arrived in the United States between 1990 and 2000.
Approximately one-fourth of all Dominican foreign born in 2000 arrived in the United States between 1990 and 1995.
Over 60 percent of all Dominican foreign born in the United States in 2000 arrived after 1985.
11
Migration Policy Institute The Dominican Population in the United States: Growth and Distribution
Figure 5.The Dominican Foreign Born by Year of Arrival, for the
United States: 2000
18.3
24.4
19.0
13.2
7.96.8
10.4
0.0
5.0
10.0
15.0
20.0
25.0
30.0
1995 to2000
1990 to1994
1985 to1989
1980 to1984
1975 to1979
1970 to1974
Before1970
Source: U.S. Census Bureau, Census 2000, 5% PUMS File.
Perc
ent
CITIZENSHIP The Dominican foreign born demonstrate similar rates of citizenship as other foreign born groups in the United States. Of the 710,921 Dominican foreign born in 2000, 37 percent were naturalized citizens while 63 percent were non-citizens (see Table 6). In other words, only about one out of every three foreign-born Dominican is an American citizen. For all foreign born in the United States, 40 percent have naturalized. Table 6. Citizenship Status of the Dominican Foreign Born: 2000 Citizenship status Number Percent Total 710,921 100.0 Naturalized citizen 261,159 36.7 Not a citizen 449,762 63.3 Note: The Dominican foreign born includes those foreign born who were born in the Dominican Republic as well as those immigrants who were born in other countries and are of Dominican origin or ancestry. Source: U.S. Census Bureau, Census 2000, 5% PUMS File.
Almost two-thirds (62 percent) of the Dominican foreign born arrived within the last 20 years.
About one in every three Dominican foreign born is an American citizen.
The Dominican foreign born demonstrate similar rates of citizenship as other foreign-born groups in the United States.
12
Migration Policy Institute The Dominican Population in the United States: Growth and Distribution
DEMOGRAPHIC PROFILE KEY POINTS • There are more women than men in the Dominican population,
primarily because there are more female than male immigrants. • The average age of the entire Dominican population in the United
States in 2000 was 29 years, while the average age of the Dominican foreign born was 37 years.
• The majority (82 percent) of Dominicans under the age of 15 were born in the United States, while the majority (80 percent) of Dominicans age 15 to 64 were born abroad.
• The majority (68 percent) of all Dominicans were between 15 tand 64 years of age.
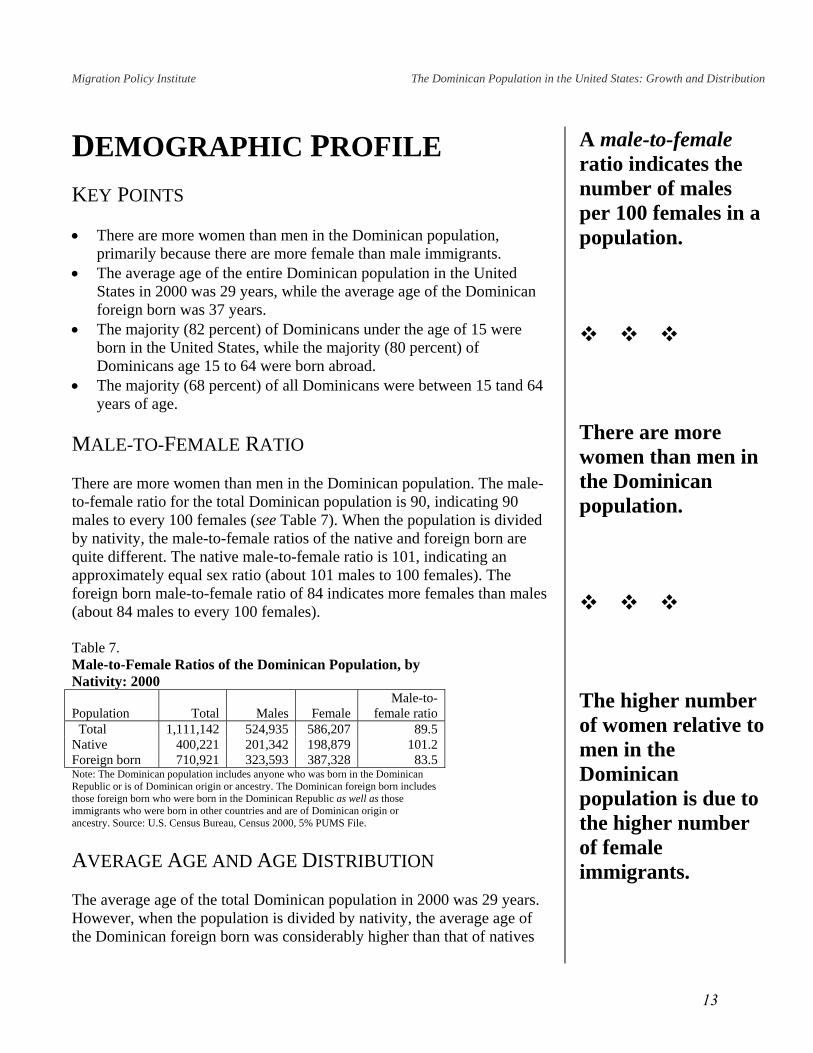
MALE-TO-FEMALE RATIO There are more women than men in the Dominican population. The male-to-female ratio for the total Dominican population is 90, indicating 90 males to every 100 females (see Table 7). When the population is divided by nativity, the male-to-female ratios of the native and foreign born are quite different. The native male-to-female ratio is 101, indicating an approximately equal sex ratio (about 101 males to 100 females). The foreign born male-to-female ratio of 84 indicates more females than males (about 84 males to every 100 females). Table 7. Male-to-Female Ratios of the Dominican Population, by Nativity: 2000
Population Total Males Female Male-to-
female ratio Total 1,111,142 524,935 586,207 89.5 Native 400,221 201,342 198,879 101.2 Foreign born 710,921 323,593 387,328 83.5 Note: The Dominican population includes anyone who was born in the Dominican Republic or is of Dominican origin or ancestry. The Dominican foreign born includes those foreign born who were born in the Dominican Republic as well as those immigrants who were born in other countries and are of Dominican origin or ancestry. Source: U.S. Census Bureau, Census 2000, 5% PUMS File. AVERAGE AGE AND AGE DISTRIBUTION The average age of the total Dominican population in 2000 was 29 years. However, when the population is divided by nativity, the average age of the Dominican foreign born was considerably higher than that of natives
A male-to-female ratio indicates the number of males per 100 females in a population.
There are more women than men in the Dominican population.
The higher number of women relative to men in the Dominican population is due to the higher number of female immigrants.
13

Migration Policy Institute The Dominican Population in the United States: Growth and Distribution
(see Figure 6). For the Dominican foreign born, the average age was 37, while the average age for natives was 14.
Figure 6.Average Age of the Dominican Population,
by Nativity: 2000
28.9
13.9
37.4
0
5
10
15
20
25
30
35
40
Total Dominicanpopulation
Native Dominican foreignborn
Source: U.S. Census Bureau, Census 2000, 5% PUMS File.
Age
The average age of the Dominican foreign born was higher because a higher percentage of immigrants were in the older age groups. Among the Dominican foreign born, 89 percent were 18 years of age or older in 2000, compared with only 30 percent of natives (see Table 8). By comparison, the average age of Dominicans who were U.S. natives was younger than the average for the Dominican foreign born because a higher percentage was under the age of 18. For Dominicans who were natives, 70 percent were under the age of 18 compared with 11 percent of the Dominican foreign born. Like most immigrant groups in the United States, the majority of the Dominican foreign born are in the economically active age groups. In 2000, over 85 percent of all Dominican foreign born were between the ages of 15 and 64, with only 7 percent under the age of 15 and 7 percent age 65 and over. By comparison, only 37 percent of Dominicans who were U.S. natives were age 15 to 64, with 62 percent under the age of 15 and less than 1 percent age 65 and over. Overall, 68 percent of the total Dominican population was between ages 15 and 64.
The average age of the Dominican population in 2000 was 29 years.
The average age of the Dominican foreign born in 2000 was 37 years, while the average age for natives was 14.
The average age of the Dominican foreign born was higher because a higher percentage of immigrants were in the older age groups. Almost 89 percent of all Dominican foreign born were 18 years of age or older, compared with 30 percent of natives.
14
Migration Policy Institute The Dominican Population in the United States: Growth and Distribution
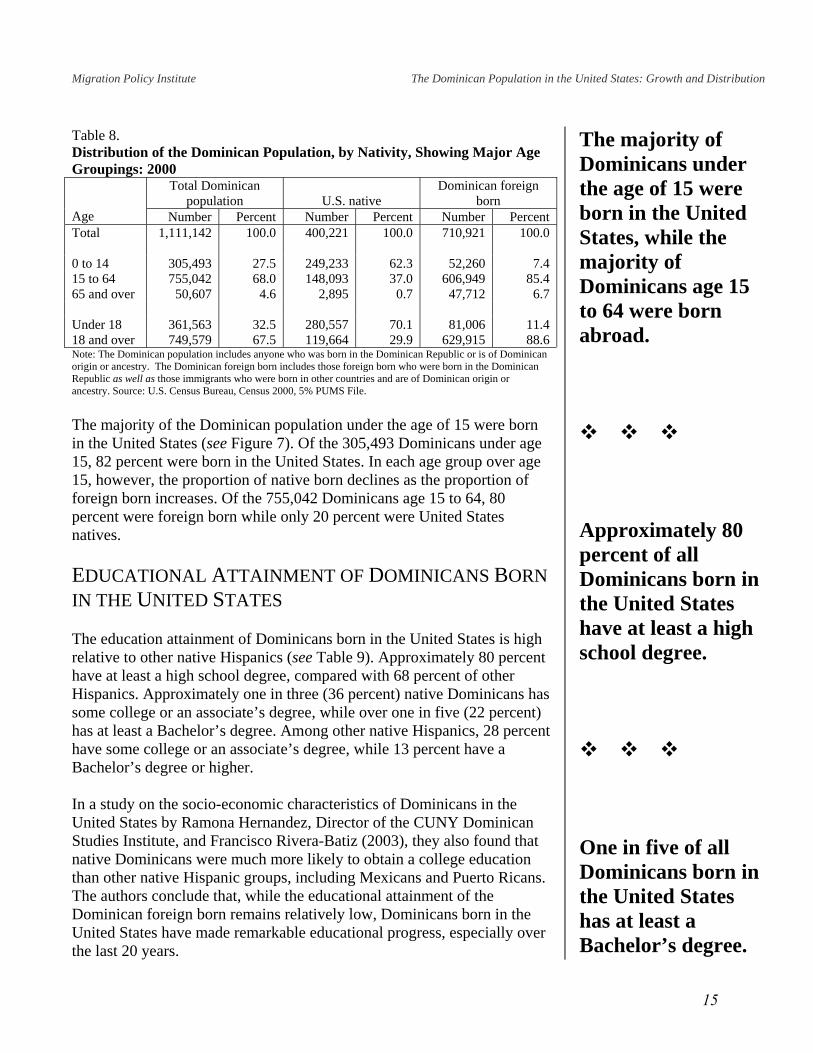
Table 8. Distribution of the Dominican Population, by Nativity, Showing Major Age Groupings: 2000
Total Dominican population U.S. native
Dominican foreign born
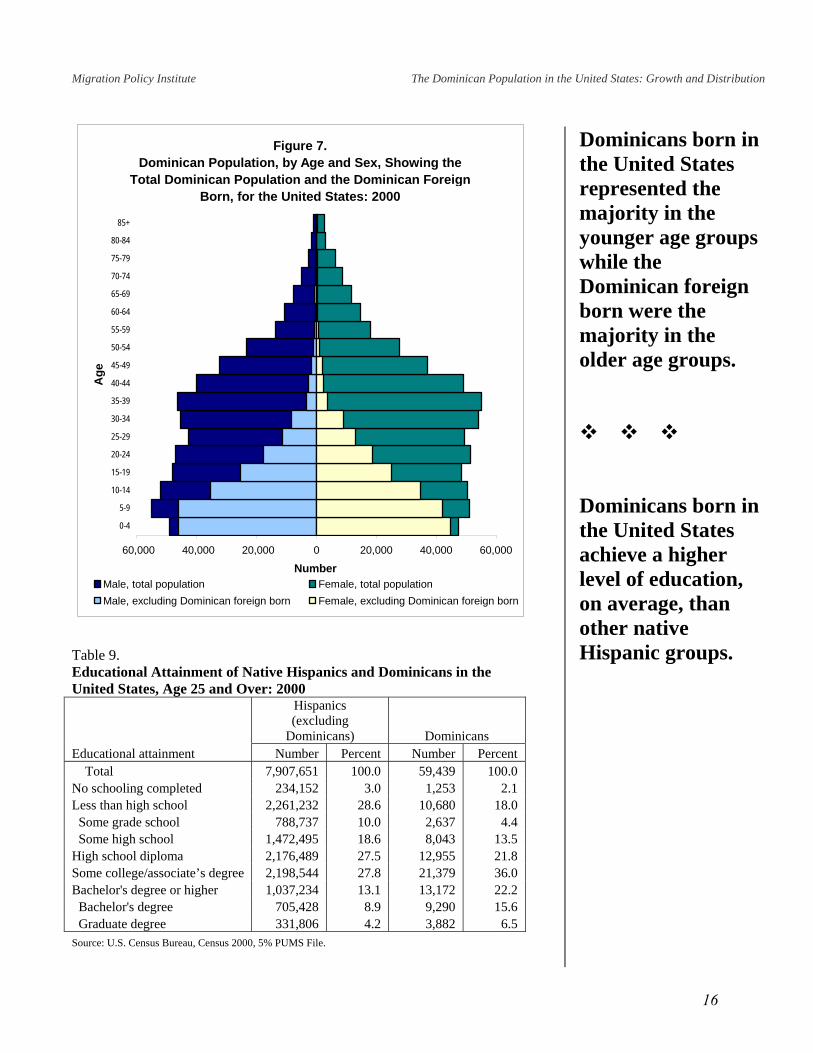
Age Number Percent Number Percent Number Percent Total 1,111,142 100.0 400,221 100.0 710,921 100.0 0 to 14 305,493 27.5 249,233 62.3 52,260 7.4 15 to 64 755,042 68.0 148,093 37.0 606,949 85.4 65 and over 50,607 4.6 2,895 0.7 47,712 6.7 Under 18 361,563 32.5 280,557 70.1 81,006 11.4 18 and over 749,579 67.5 119,664 29.9 629,915 88.6 Note: The Dominican population includes anyone who was born in the Dominican Republic or is of Dominican origin or ancestry. The Dominican foreign born includes those foreign born who were born in the Dominican Republic as well as those immigrants who were born in other countries and are of Dominican origin or ancestry. Source: U.S. Census Bureau, Census 2000, 5% PUMS File. The majority of the Dominican population under the age of 15 were born in the United States (see Figure 7). Of the 305,493 Dominicans under age 15, 82 percent were born in the United States. In each age group over age 15, however, the proportion of native born declines as the proportion of foreign born increases. Of the 755,042 Dominicans age 15 to 64, 80 percent were foreign born while only 20 percent were United States natives. EDUCATIONAL ATTAINMENT OF DOMINICANS BORN IN THE UNITED STATES The education attainment of Dominicans born in the United States is high relative to other native Hispanics (see Table 9). Approximately 80 percent have at least a high school degree, compared with 68 percent of other Hispanics. Approximately one in three (36 percent) native Dominicans has some college or an associate’s degree, while over one in five (22 percent) has at least a Bachelor’s degree. Among other native Hispanics, 28 percent have some college or an associate’s degree, while 13 percent have a Bachelor’s degree or higher. In a study on the socio-economic characteristics of Dominicans in the United States by Ramona Hernandez, Director of the CUNY Dominican Studies Institute, and Francisco Rivera-Batiz (2003), they also found that native Dominicans were much more likely to obtain a college education than other native Hispanic groups, including Mexicans and Puerto Ricans. The authors conclude that, while the educational attainment of the Dominican foreign born remains relatively low, Dominicans born in the United States have made remarkable educational progress, especially over the last 20 years.
The majority of Dominicans under the age of 15 were born in the United States, while the majority of Dominicans age 15 to 64 were born abroad.
Approximately 80 percent of all Dominicans born in the United States have at least a high school degree.
One in five of all Dominicans born in the United States has at least a Bachelor’s degree.
15
Migration Policy Institute The Dominican Population in the United States: Growth and Distribution
Table 9. Educational Attainment of Native Hispanics and Dominicans in the United States, Age 25 and Over: 2000
Hispanics (excluding
Dominicans) Dominicans Educational attainment Number Percent Number Percent Total 7,907,651 100.0 59,439 100.0 No schooling completed 234,152 3.0 1,253 2.1 Less than high school 2,261,232 28.6 10,680 18.0 Some grade school 788,737 10.0 2,637 4.4 Some high school 1,472,495 18.6 8,043 13.5 High school diploma 2,176,489 27.5 12,955 21.8 Some college/associate’s degree 2,198,544 27.8 21,379 36.0 Bachelor's degree or higher 1,037,234 13.1 13,172 22.2 Bachelor's degree 705,428 8.9 9,290 15.6 Graduate degree 331,806 4.2 3,882 6.5 Source: U.S. Census Bureau, Census 2000, 5% PUMS File.
ominicans born in
ups
foreign
s.
ominicans born in
,
ups.
Figure 7.Dominican Population, by Age and Sex, Showing the
Total Dominican Population and the Dominican Foreign Born, for the United States: 2000
60,000 40,000 20,000 0 20,000 40,000 60,000
0-4
5-9
10-14
15-19
20-24
25-29
30-34
35-39
40-44
45-49
50-54
55-59
60-64
65-69
70-74
75-79
80-84
85+
Age
NumberMale, total population Female, total populationMale, excluding Dominican foreign born Female, excluding Dominican foreign born
Dthe United States represented the majority in the younger age growhile the Dominicanborn were the majority in theolder age group
Dthe United States achieve a higher level of educationon average, than other native Hispanic gro
16

Migration Policy Institute The Dominican Population in the United States: Growth and Distribution
EY POINTS
The majority (82 percent) of all Dominicans in the United States live
• ith the largest Dominican populations are New
• inican populations over 20,000, een
• inican populations under 20,000 in 2000 that ut,
• inican population in New York increased numerically s
• York metropolitan area.
• he Dominican population appears to be
EGIONS
he Northeast of the United States remains the center of the Dominican
1.7
hile the Northeast remains dominant, there is some indication that the
Northeast declined, from 86 percent in 1990 to 82 percent in 2000. In
e vidence to suggest at the population shifting out of the
her
ew ersey, and Florida re the states with e largest number
f Dominicans.
GEOGRAPHIC DISTRIBUTION: REGIONS, STATES, AND METROPOLITAN AREAS K •
in the Northeast. The three states wYork, New Jersey, and Florida. Among the five states with DomRhode Island and Florida experienced the most rapid growth betw1990 and 2000. States with Domexperienced rapid growth include Pennsylvania and Connecticamong others. While the Dombetween 1990 and 2000, the proportion of all Dominicans living in thistate declined. The proportion of Dominicans living in other states in the Northeast increased during this period. Over half of all Dominicans live in the New
• While the Dominican population in the New York metropolitan area increased numerically between 1990 and 2000, the proportion of all Dominicans living in this metropolitan area declined. The proportionof Dominicans living in other metropolitan areas in the Northeast increased during this period. As in the case in New York, tleaving the Miami metropolitan area for other cities in Florida.
R Tpopulation. In 2000, over 82 percent of all Dominicans lived in the Northeast, with 14 percent in the South, 2.0 percent in the West, andpercent in the Midwest (see Table 10). Wpopulation is shifting to other regions, especially to the South. Between 1990 and 2000, the Dominican populations of all four regions increased numerically. However, the proportion of all Dominicans living in the
The majority of all Dominicans live in the Northeast.
here is somTethisNortheast to otregions, especially the South.
ew York, NNJatho
17

Migration Policy Institute The Dominican Population in the United States: Growth and Distribution
00 1990 v. 2000
Table 10. The Dominican Population, by Regionsiv in the United States: 1990 and 20
1990 2000
Area Total Percent of total Total
Percent of total
Numeric difference
Percent growth
United States 586,700 100.0 1,111,142 100.0 524,442 89.4Northeast 505,28 86.1 912, 82.1 4 0.59 010 06,721 8Midwest 6,905 19,304 1.2 1.7 12,399 179.6South 6 151,505 10.5 7,672 14.2 96,167 156.4West 13,001 2.2 22,156 2.0 9,155 70.4
Note: The Domes
inican pop des a Do Rep f Domitry. Source Bure ation ousin us 200
ulation inclu: U.
nyone whau
o was born in the minican a
ublic or is og
nican origin or ancPUMS Files.
S. Census , 1990 Census of Popul nd H and Cens 0, 5%
1990, 14 percent o minicans lived in the South, West, idwBy 2000, this proportion had risen to 18 percent.
f all Do and M est.
STATES
he ten states with the largest number of Dominicans in 2000 were New TYork, New JConnecticut,
ersey, Florida, Massachusetts, Rhode Island, Pennsylvania, California, Texas, and Maryland (see Table 11 and the map
tate Number Percent of total
entitled “The Dominican Population in the United States”). Over 57 percent of the Dominican population lived in New York, with 12 percent in New Jersey, 10 percent in Florida, and 7 percent in Massachusetts. Combined, the eight contiguous states of New York, New Jersey, Massachusetts, Rhode Island, Pennsylvania, Connecticut and Maryland account for 83 percent of the Dominican community. Table 11. States with the Largest Dominican Populations: 2000 S Total New York New Jersey
a
638,578 134,421
FloridMassachusetts
1,111,142 100.0 57.5 12.1
Rhode IslandPennsylvania
icut ConnectCalifornia Texas Maryland
109,705 75,986 26,254 19,556 15,261 12,118 8,986 8,947
9.9 6.8 2.4 1.8 1.4 1.1 0.8 0.8
Note: The Domthe Dominican R
inican population in one who was bornepublic or is of Do igin or ancestry.
ensus Bureau, Censu PUMS File.
cludes anyminican or
in
Source: U.S. C s 2000, 5%
Over half of all ominicans live in D
the state of New
0 and 000, the proportion f all Dominicans
he eight ontiguous states of ew York, New
ania,
unt f the
York.
Between 1992oliving in the state ofNew York declined.
Combined, tcNJersey, Massachusetts, Rhode Island, PennsylvConnecticut, andMaryland accofor 83 percent oDominican population.
18

CA
FL
PA
NYMA
NJ
CTRI
The Dominican Population in the United States*including the foreign born and those of Dominican origin and ancestry
*The states of Alaska and Hawaii each represented less than 1 percent of the total Dominican population in 2000.
LEGENDPercentage share of the
Dominican population by state
Source: U.S. Census Bureau,Census 2000, 5% PUMS file.
0 100 miles
100 km0
1.00 - 4.99
5.00 - 9.99
10.00 - 49.99
Less than 1.00
Over 50.00
Migration Policy Institute The Dominican Population in the United States: Growth and Distribution
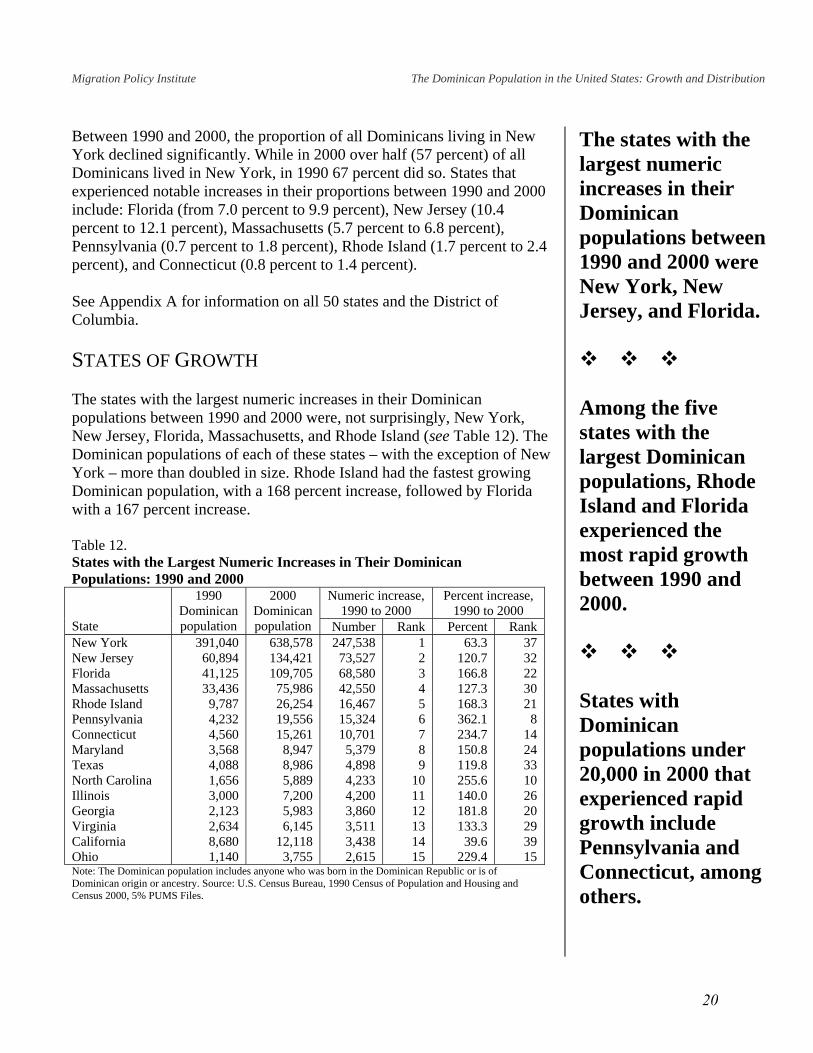
Between 1990 and 2000, the proportion of all Dominicans living in New York declined significantly. While in 2000 over half (57 percent) of all Dominicans lived in New York, in 1990 67 percent did so. States that experienced notable increases in their proportions between 1990 and 2000 include: Florida (from 7.0 percent to 9.9 percent), New Jersey (10.4 percent to 12.1 percent), Massachusetts (5.7 percent to 6.8 percent), Pennsylvania (0.7 percent to 1.8 percent), Rhode Island (1.7 percent to 2.4 percent), and Connecticut (0.8 percent to 1.4 percent). See Appendix A for information on all 50 states and the District of Columbia. STATES OF GROWTH The states with the largest numeric increases in their Dominican populations between 1990 and 2000 were, not surprisingly, New York, New Jersey, Florida, Massachusetts, and Rhode Island (see Table 12). The Dominican populations of each of these states – with the exception of New York – more than doubled in size. Rhode Island had the fastest growing Dominican population, with a 168 percent increase, followed by Florida with a 167 percent increase. Table 12. States with the Largest Numeric Increases in Their Dominican Populations: 1990 and 2000
Numeric increase, 1990 to 2000
Percent increase, 1990 to 2000
State
1990 Dominican population
2000 Dominican population Number Rank Percent Rank
New York New Jersey Florida Massachusetts Rhode Island Pennsylvania Connecticut Maryland Texas North Carolina Illinois Georgia Virginia California Ohio
391,040 60,894 41,125 33,436 9,787 4,232 4,560 3,568 4,088 1,656 3,000 2,123 2,634 8,680 1,140
638,578 134,421 109,705
75,986 26,254 19,556 15,261 8,947 8,986 5,889 7,200 5,983 6,145
12,118 3,755
247,538 73,527 68,580 42,550 16,467 15,324 10,701 5,379 4,898 4,233 4,200 3,860 3,511 3,438 2,615
1 2 3 4 5 6 7 8 9
10 11 12 13 14 15
63.3 120.7 166.8 127.3 168.3 362.1 234.7 150.8 119.8 255.6 140.0 181.8 133.3 39.6
229.4
37 32 22 30 21
8 14 24 33 10 26 20 29 39 15
Note: The Dominican population includes anyone who was born in the Dominican Republic or is of Dominican origin or ancestry. Source: U.S. Census Bureau, 1990 Census of Population and Housing and Census 2000, 5% PUMS Files.
The states with the largest numeric increases in their Dominican populations between 1990 and 2000 were New York, New Jersey, and Florida.
Among the five states with the largest Dominican populations, Rhode Island and Florida experienced the most rapid growth between 1990 and 2000.
States with Dominican populations under 20,000 in 2000 that experienced rapid growth include Pennsylvania and Connecticut, among others.
20
Migration Policy Institute The Dominican Population in the United States: Growth and Distribution
Among states with Dominican populations of less than 20,000 in 2000, Pennsylvania, Connecticut, North Carolina, and Ohio ranked among the top 15 with both the largest numeric increases and the largest percent increases between 1990 and 2000. METROPOLITAN AREAS There were eight metropolitan areas with Dominican populations over 20,000 in 2000 (see Table 13). The largest among these was New York, with a Dominican population of 597,918, followed by Miami (54,969), Bergen-Passaic (45,180), Boston (39,063) and Jersey City (38,454). Over half (54 percent) of all Dominicans in the United States in 2000 lived in the New York metropolitan area. Appendix B lists the 40 metropolitan areas with the largest Dominican populations in 2000. Table 13. Metropolitan Areas with the Largest Dominican Populations: 2000
Metropolitan area Total
population Percent of total
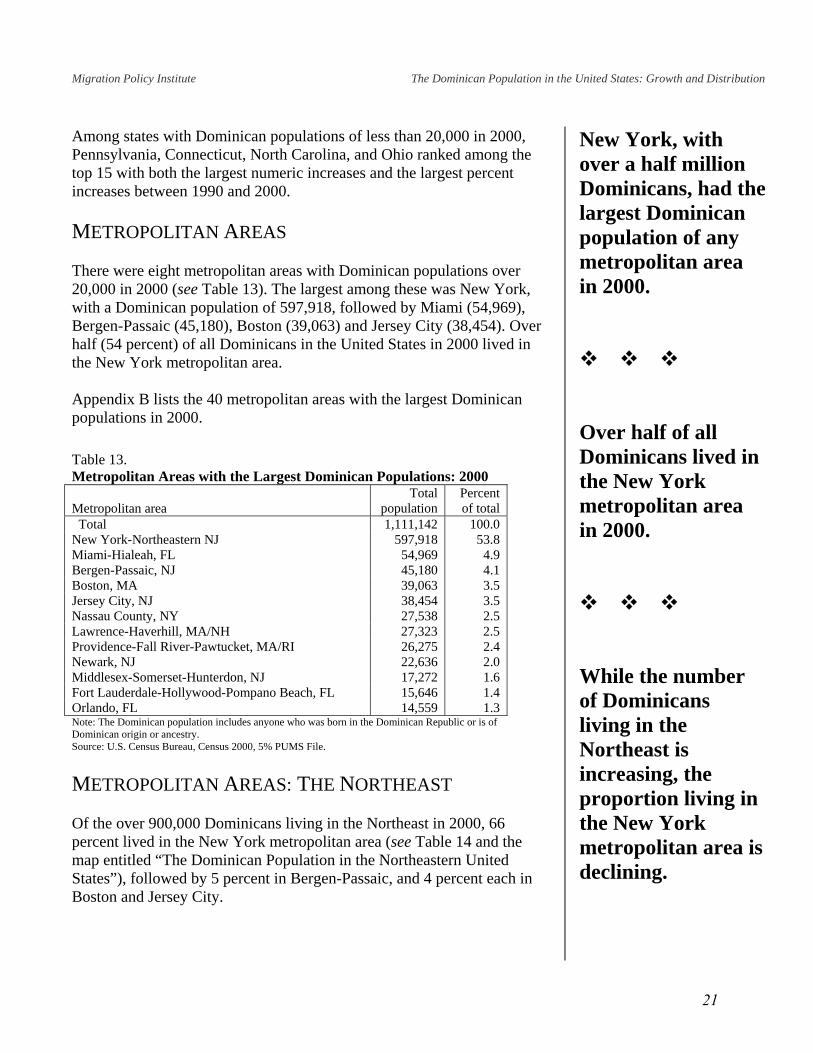
Total 1,111,142 100.0 New York-Northeastern NJ 597,918 53.8 Miami-Hialeah, FL 54,969 4.9 Bergen-Passaic, NJ 45,180 4.1 Boston, MA 39,063 3.5 Jersey City, NJ 38,454 3.5 Nassau County, NY 27,538 2.5 Lawrence-Haverhill, MA/NH 27,323 2.5 Providence-Fall River-Pawtucket, MA/RI 26,275 2.4 Newark, NJ 22,636 2.0 Middlesex-Somerset-Hunterdon, NJ 17,272 1.6 Fort Lauderdale-Hollywood-Pompano Beach, FL 15,646 1.4 Orlando, FL 14,559 1.3 Note: The Dominican population includes anyone who was born in the Dominican Republic or is of Dominican origin or ancestry. Source: U.S. Census Bureau, Census 2000, 5% PUMS File. METROPOLITAN AREAS: THE NORTHEAST Of the over 900,000 Dominicans living in the Northeast in 2000, 66 percent lived in the New York metropolitan area (see Table 14 and the map entitled “The Dominican Population in the Northeastern United States”), followed by 5 percent in Bergen-Passaic, and 4 percent each in Boston and Jersey City.
New York, with over a half million Dominicans, had the largest Dominican population of any metropolitan area in 2000.
Over half of all Dominicans lived in the New York metropolitan area in 2000.
While the number of Dominicans living in the Northeast is increasing, the proportion living in the New York metropolitan area is declining.
21
Migration Policy Institute The Dominican Population in the United States: Growth and Distribution
Table 14. Metropolitan Areas in the Northeast with the Largest Dominican Populations in 2000: 1990 and 2000
1990 2000 1990 v. 2000
Area Number Percent Number Percent Numeric
difference Percent growth
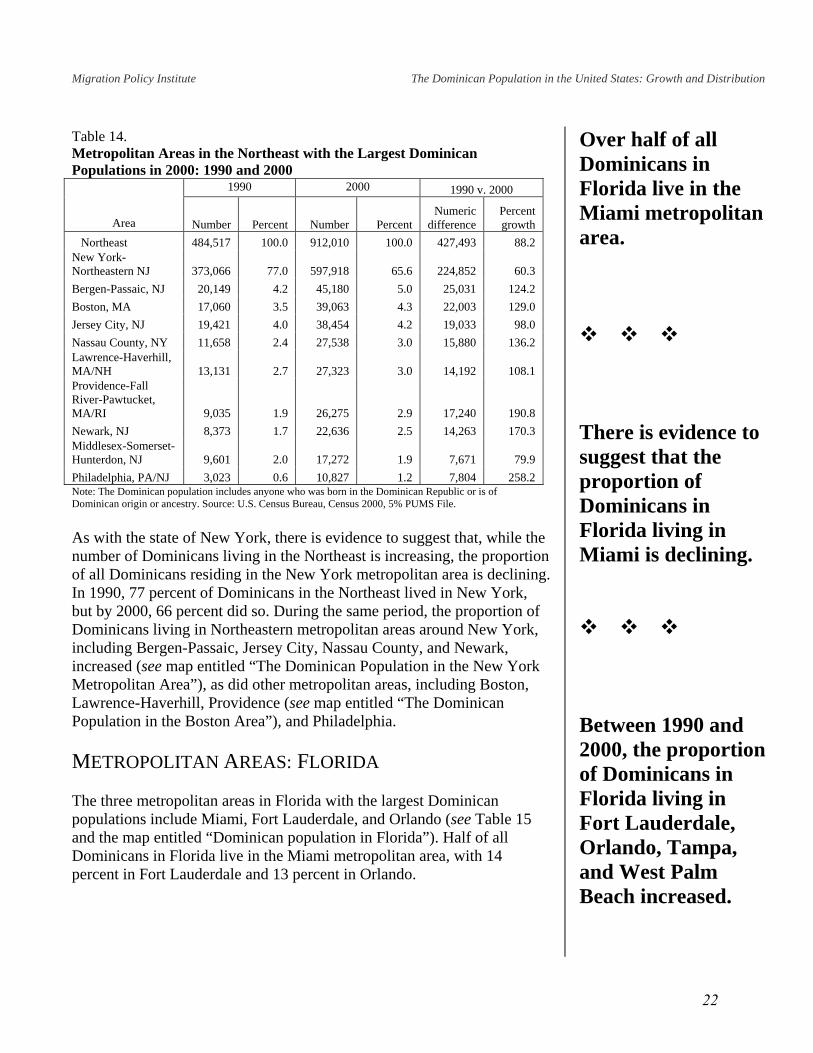
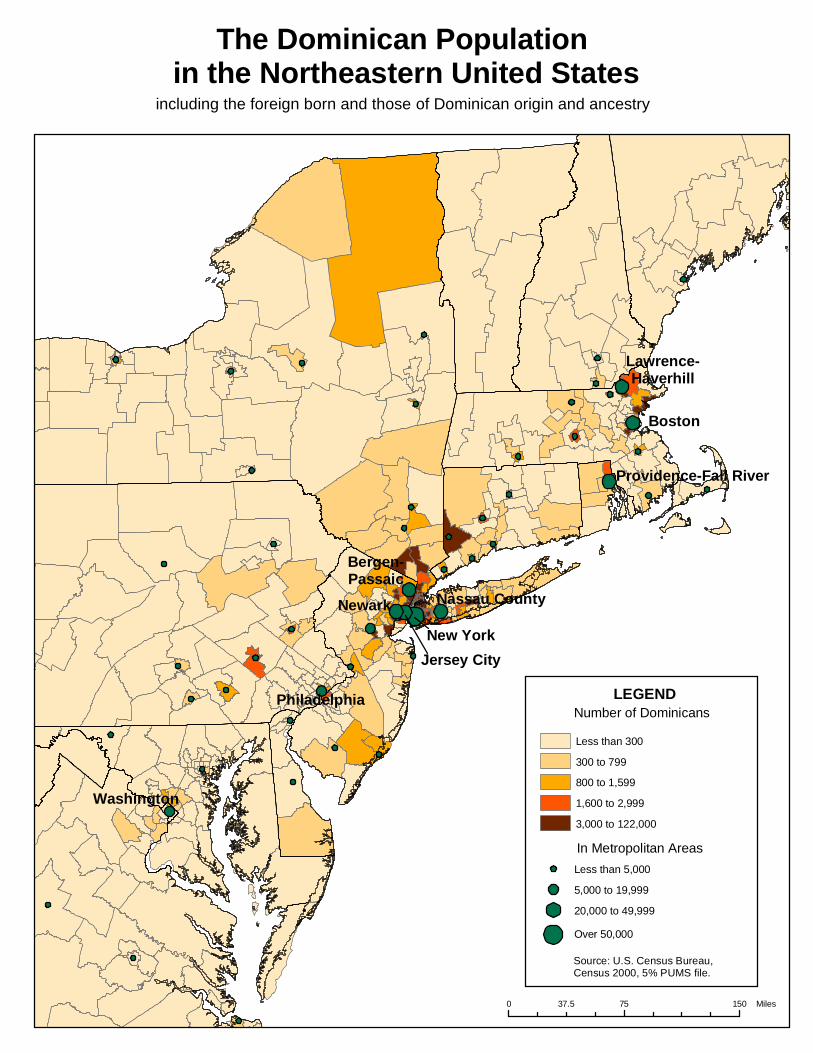
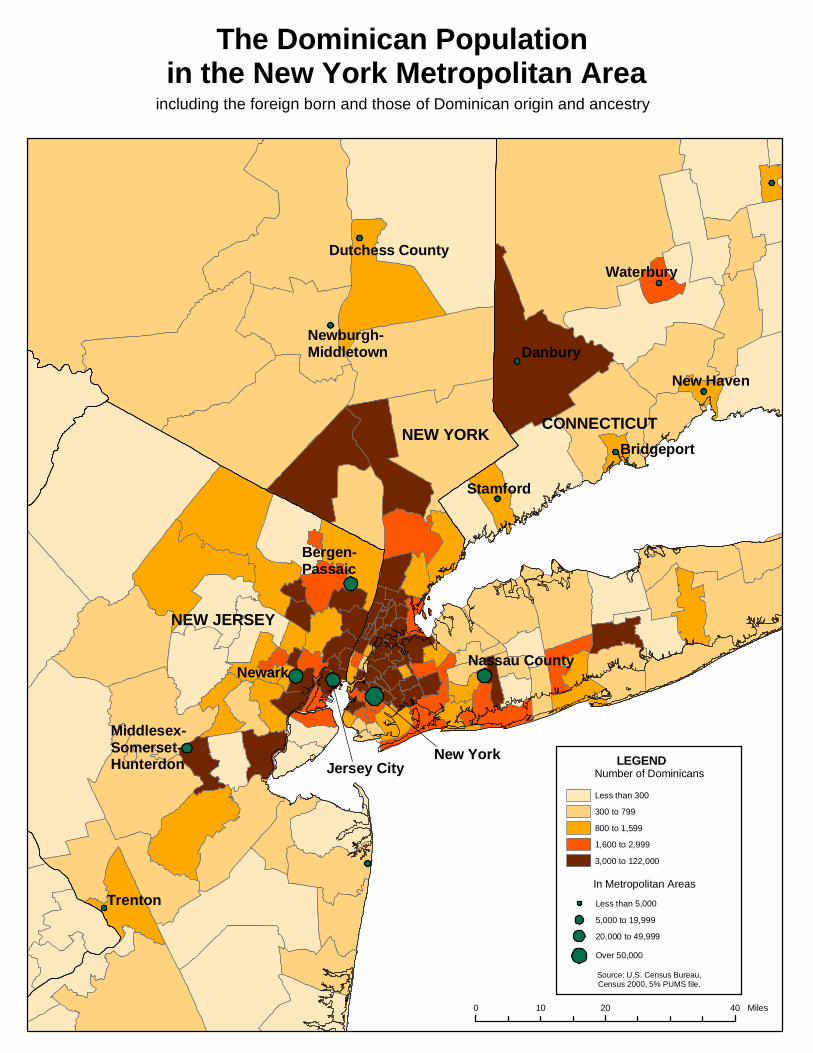
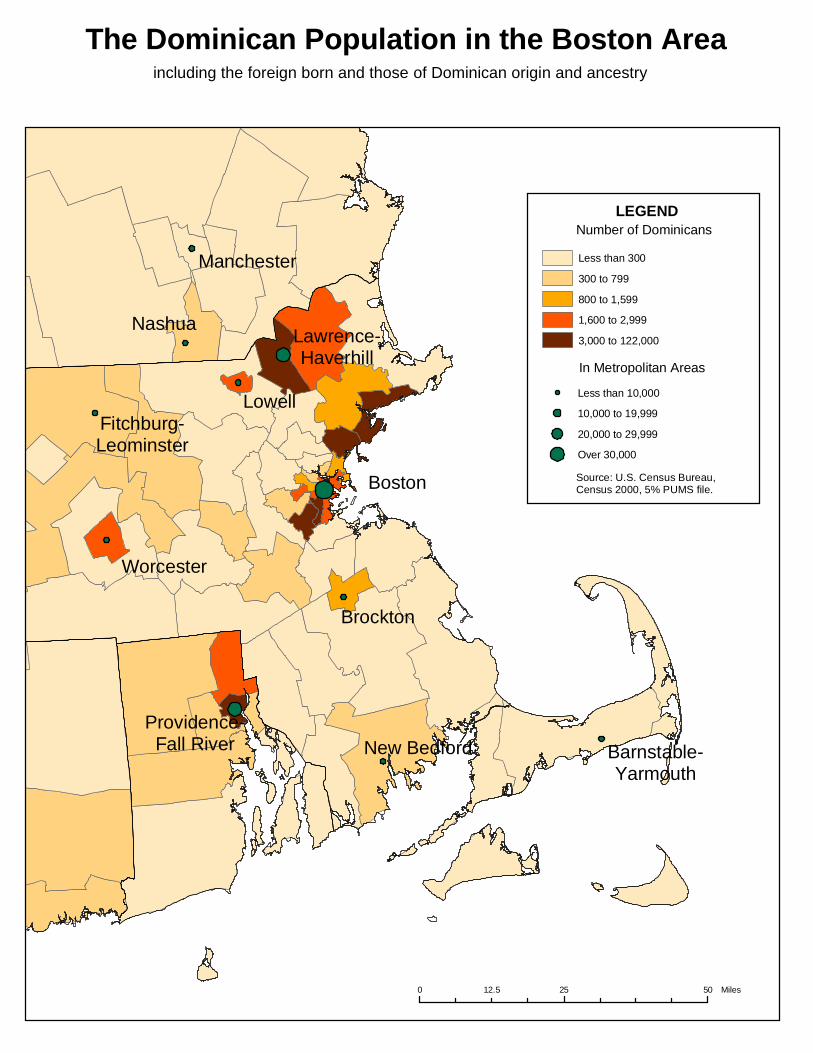
Northeast 484,517 100.0 912,010 100.0 427,493 88.2 New York-Northeastern NJ 373,066 77.0 597,918 65.6 224,852 60.3 Bergen-Passaic, NJ 20,149 4.2 45,180 5.0 25,031 124.2 Boston, MA 17,060 3.5 39,063 4.3 22,003 129.0 Jersey City, NJ 19,421 4.0 38,454 4.2 19,033 98.0 Nassau County, NY 11,658 2.4 27,538 3.0 15,880 136.2 Lawrence-Haverhill, MA/NH 13,131 2.7 27,323 3.0 14,192 108.1 Providence-Fall River-Pawtucket, MA/RI 9,035 1.9 26,275 2.9 17,240 190.8 Newark, NJ 8,373 1.7 22,636 2.5 14,263 170.3 Middlesex-Somerset-Hunterdon, NJ 9,601 2.0 17,272 1.9 7,671 79.9 Philadelphia, PA/NJ 3,023 0.6 10,827 1.2 7,804 258.2 Note: The Dominican population includes anyone who was born in the Dominican Republic or is of Dominican origin or ancestry. Source: U.S. Census Bureau, Census 2000, 5% PUMS File. As with the state of New York, there is evidence to suggest that, while the number of Dominicans living in the Northeast is increasing, the proportion of all Dominicans residing in the New York metropolitan area is declining. In 1990, 77 percent of Dominicans in the Northeast lived in New York, but by 2000, 66 percent did so. During the same period, the proportion of Dominicans living in Northeastern metropolitan areas around New York, including Bergen-Passaic, Jersey City, Nassau County, and Newark, increased (see map entitled “The Dominican Population in the New York Metropolitan Area”), as did other metropolitan areas, including Boston, Lawrence-Haverhill, Providence (see map entitled “The Dominican Population in the Boston Area”), and Philadelphia. METROPOLITAN AREAS: FLORIDA The three metropolitan areas in Florida with the largest Dominican populations include Miami, Fort Lauderdale, and Orlando (see Table 15 and the map entitled “Dominican population in Florida”). Half of all Dominicans in Florida live in the Miami metropolitan area, with 14 percent in Fort Lauderdale and 13 percent in Orlando.
Over half of all Dominicans in Florida live in the Miami metropolitan area.
There is evidence to suggest that the proportion of Dominicans in Florida living in Miami is declining.
Between 1990 and 2000, the proportion of Dominicans in Florida living in Fort Lauderdale, Orlando, Tampa, and West Palm Beach increased.
22
Philadelphia
Washington
New York
Providence-Fall River
Newark
Boston
Nassau County
Jersey City
Bergen-Passaic
Lawrence-Haverhill
The Dominican Population in the Northeastern United States
including the foreign born and those of Dominican origin and ancestry
0 75 15037.5 Miles
Source: U.S. Census Bureau,Census 2000, 5% PUMS file.
Less than 300
300 to 799
800 to 1,599
1,600 to 2,999
3,000 to 122,000
LEGENDNumber of Dominicans
5,000 to 19,999
20,000 to 49,999
Over 50,000
Less than 5,000
In Metropolitan Areas
New York
Nassau County
Jersey City
Newark
Bergen-Passaic
Middlesex-Somerset-Hunterdon
Stamford
Bridgeport
New Haven
DanburyNewburgh-Middletown
Waterbury
NEW JERSEY
NEW YORKCONNECTICUT
Dutchess County
Trenton
The Dominican Population in the New York Metropolitan Area
including the foreign born and those of Dominican origin and ancestry
0 20 4010 Miles
Source: U.S. Census Bureau,Census 2000, 5% PUMS file.
LEGENDNumber of Dominicans
Less than 300
300 to 799
800 to 1,599
1,600 to 2,999
3,000 to 122,000
In Metropolitan Areas
5,000 to 19,999
20,000 to 49,999
Over 50,000
Less than 5,000
Boston
Lowell
Nashua
Brockton
Lawrence-Haverhill
Worcester
Fitchburg-Leominster
Providence-Fall River
Manchester
New Bedford Barnstable-Yarmouth
The Dominican Population in the Boston Areaincluding the foreign born and those of Dominican origin and ancestry
0 25 5012.5 Miles
Source: U.S. Census Bureau,Census 2000, 5% PUMS file.
Less than 300
300 to 799
800 to 1,599
1,600 to 2,999
3,000 to 122,000
LEGENDNumber of Dominicans
In Metropolitan Areas
Less than 10,000
10,000 to 19,999
20,000 to 29,999
Over 30,000

Ocala
Naples
Orlando
Sarasota
Pensacola
Punta Gorda
Fort Pierce
Gainesville
Panama City
Tallahassee Jacksonville
Miami
Daytona Beach
Lakeland
Fort Myers
Tampa-St. Petersburg
Fort Walton Beach
Melbourne
Fort Lauderdale
West Palm Beach
The Dominican Population in Floridaincluding the foreign born and those of Dominican origin and ancestry
0 130 26065 Miles
LEGENDNumber of Dominicans
In Metropolitan Areas
Less than 5,000
10,000 to 15,999
Over 50,000
5,000 to 9,999
Less than 300
300 to 799
800 to 1,599
1,600 to 2,999
3,000 to 5,000
Source: U.S. Census Bureau,Census 2000, 5% PUMS file.
Migration Policy Institute The Dominican Population in the United States: Growth and Distribution
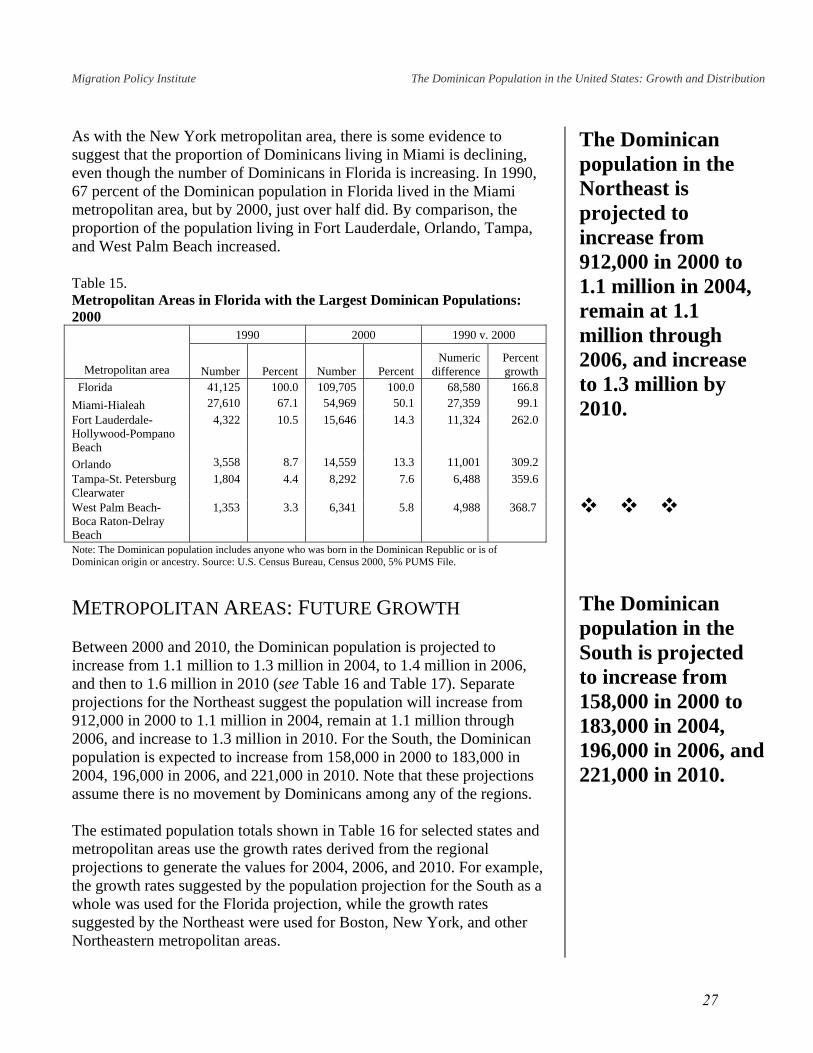
As with the New York metropolitan area, there is some evidence to suggest that the proportion of Dominicans living in Miami is declining, even though the number of Dominicans in Florida is increasing. In 1990, 67 percent of the Dominican population in Florida lived in the Miami metropolitan area, but by 2000, just over half did. By comparison, the proportion of the population living in Fort Lauderdale, Orlando, Tampa, and West Palm Beach increased. Table 15. Metropolitan Areas in Florida with the Largest Dominican Populations: 2000
1990 2000 1990 v. 2000
Metropolitan area Number Percent Number Percent Numeric
difference Percent growth
Florida 41,125 100.0 109,705 100.0 68,580 166.8 Miami-Hialeah 27,610 67.1 54,969 50.1 27,359 99.1 Fort Lauderdale-Hollywood-Pompano Beach
4,322 10.5 15,646 14.3 11,324 262.0
Orlando 3,558 8.7 14,559 13.3 11,001 309.2 Tampa-St. Petersburg Clearwater
1,804 4.4 8,292 7.6 6,488 359.6
West Palm Beach-Boca Raton-Delray Beach
1,353 3.3 6,341 5.8 4,988 368.7
Note: The Dominican population includes anyone who was born in the Dominican Republic or is of Dominican origin or ancestry. Source: U.S. Census Bureau, Census 2000, 5% PUMS File.
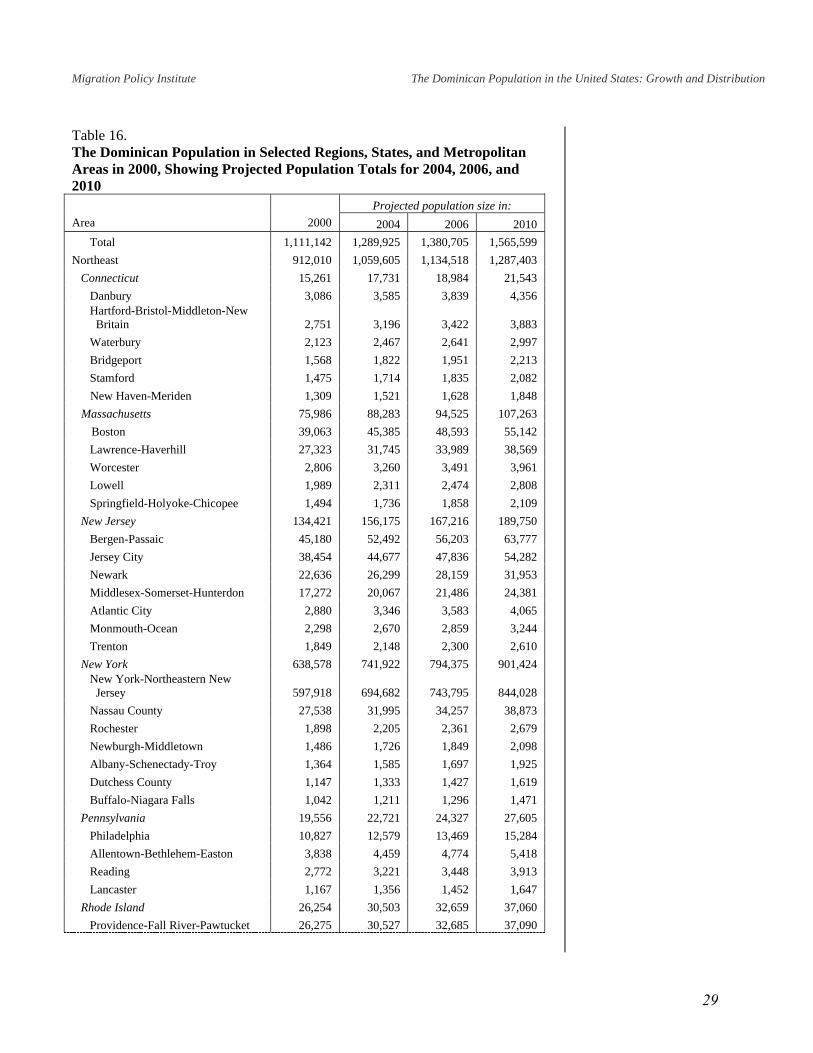
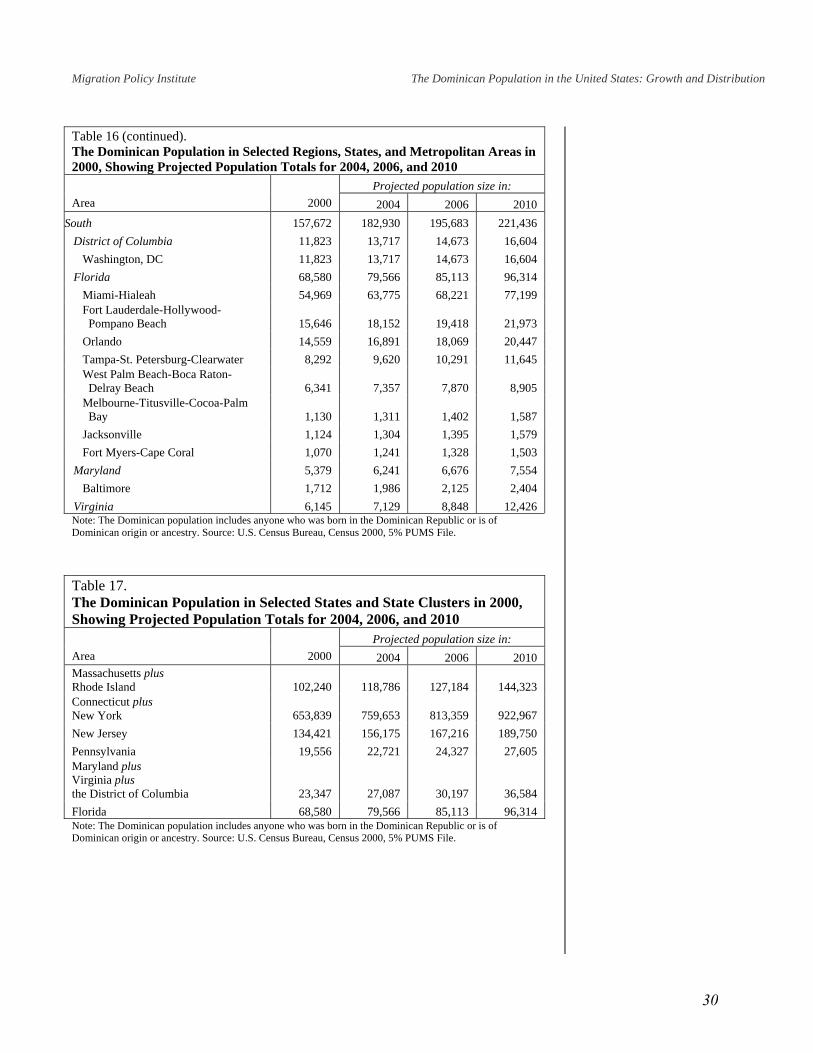
METROPOLITAN AREAS: FUTURE GROWTH Between 2000 and 2010, the Dominican population is projected to increase from 1.1 million to 1.3 million in 2004, to 1.4 million in 2006, and then to 1.6 million in 2010 (see Table 16 and Table 17). Separate projections for the Northeast suggest the population will increase from 912,000 in 2000 to 1.1 million in 2004, remain at 1.1 million through 2006, and increase to 1.3 million in 2010. For the South, the Dominican population is expected to increase from 158,000 in 2000 to 183,000 in 2004, 196,000 in 2006, and 221,000 in 2010. Note that these projections assume there is no movement by Dominicans among any of the regions. The estimated population totals shown in Table 16 for selected states and metropolitan areas use the growth rates derived from the regional projections to generate the values for 2004, 2006, and 2010. For example, the growth rates suggested by the population projection for the South as a whole was used for the Florida projection, while the growth rates suggested by the Northeast were used for Boston, New York, and other Northeastern metropolitan areas.
The Dominican population in the Northeast is projected to increase from 912,000 in 2000 to 1.1 million in 2004, remain at 1.1 million through 2006, and increase to 1.3 million by 2010.
The Dominican population in the South is projected to increase from 158,000 in 2000 to 183,000 in 2004, 196,000 in 2006, and 221,000 in 2010.
27
Migration Policy Institute The Dominican Population in the United States: Growth and Distribution
While this method likely provides reasonable estimates of future populations over the next ten years, especially for areas with large Dominican communities, it assumes a) an equivalent growth rate for all metropolitan areas within a region and b) no movement of Dominicans among metropolitan areas. Ultimately, the accuracy of these projections will depend on how these assumptions hold up through time. For example, research by Ramona Hernandez, Director of the CUNY Dominican Studies Institute, suggests that an increasing number of Dominican immigrants are moving from the Dominican Republic directly to Boston. She has also found that many Dominicans are migrating internally, moving from New York and other areas to Boston.v This research suggests that the growth rate of the Boston metropolitan area is likely to be higher than the growth rate for the Northeast region as a whole. This may mean that the Boston projection underestimates the future size of the Dominican population.
28
Migration Policy Institute The Dominican Population in the United States: Growth and Distribution
Table 16. The Dominican Population in Selected Regions, States, and Metropolitan Areas in 2000, Showing Projected Population Totals for 2004, 2006, and 2010
Projected population size in: Area 2000 2004 2006 2010 Total 1,111,142 1,289,925 1,380,705 1,565,599 Northeast 912,010 1,059,605 1,134,518 1,287,403 Connecticut 15,261 17,731 18,984 21,543 Danbury 3,086 3,585 3,839 4,356 Hartford-Bristol-Middleton-New Britain 2,751 3,196 3,422 3,883 Waterbury 2,123 2,467 2,641 2,997 Bridgeport 1,568 1,822 1,951 2,213 Stamford 1,475 1,714 1,835 2,082 New Haven-Meriden 1,309 1,521 1,628 1,848 Massachusetts 75,986 88,283 94,525 107,263
Boston 39,063 45,385 48,593 55,142 Lawrence-Haverhill 27,323 31,745 33,989 38,569 Worcester 2,806 3,260 3,491 3,961 Lowell 1,989 2,311 2,474 2,808 Springfield-Holyoke-Chicopee 1,494 1,736 1,858 2,109 New Jersey 134,421 156,175 167,216 189,750 Bergen-Passaic 45,180 52,492 56,203 63,777 Jersey City 38,454 44,677 47,836 54,282 Newark 22,636 26,299 28,159 31,953 Middlesex-Somerset-Hunterdon 17,272 20,067 21,486 24,381 Atlantic City 2,880 3,346 3,583 4,065 Monmouth-Ocean 2,298 2,670 2,859 3,244 Trenton 1,849 2,148 2,300 2,610 New York 638,578 741,922 794,375 901,424 New York-Northeastern New Jersey 597,918 694,682 743,795 844,028 Nassau County 27,538 31,995 34,257 38,873 Rochester 1,898 2,205 2,361 2,679 Newburgh-Middletown 1,486 1,726 1,849 2,098 Albany-Schenectady-Troy 1,364 1,585 1,697 1,925 Dutchess County 1,147 1,333 1,427 1,619 Buffalo-Niagara Falls 1,042 1,211 1,296 1,471 Pennsylvania 19,556 22,721 24,327 27,605 Philadelphia 10,827 12,579 13,469 15,284 Allentown-Bethlehem-Easton 3,838 4,459 4,774 5,418 Reading 2,772 3,221 3,448 3,913 Lancaster 1,167 1,356 1,452 1,647 Rhode Island 26,254 30,503 32,659 37,060 Providence-Fall River-Pawtucket 26,275 30,527 32,685 37,090
29
Migration Policy Institute The Dominican Population in the United States: Growth and Distribution
Table 16 (continued). The Dominican Population in Selected Regions, States, and Metropolitan Areas in 2000, Showing Projected Population Totals for 2004, 2006, and 2010
Projected population size in: Area 2000 2004 2006 2010
South 157,672 182,930 195,683 221,436 District of Columbia 11,823 13,717 14,673 16,604 Washington, DC 11,823 13,717 14,673 16,604 Florida 68,580 79,566 85,113 96,314 Miami-Hialeah 54,969 63,775 68,221 77,199 Fort Lauderdale-Hollywood- Pompano Beach 15,646 18,152 19,418 21,973 Orlando 14,559 16,891 18,069 20,447 Tampa-St. Petersburg-Clearwater 8,292 9,620 10,291 11,645 West Palm Beach-Boca Raton- Delray Beach 6,341 7,357 7,870 8,905 Melbourne-Titusville-Cocoa-Palm Bay 1,130 1,311 1,402 1,587 Jacksonville 1,124 1,304 1,395 1,579 Fort Myers-Cape Coral 1,070 1,241 1,328 1,503 Maryland 5,379 6,241 6,676 7,554 Baltimore 1,712 1,986 2,125 2,404 Virginia 6,145 7,129 8,848 12,426
Note: The Dominican population includes anyone who was born in the Dominican Republic or is of Dominican origin or ancestry. Source: U.S. Census Bureau, Census 2000, 5% PUMS File. Table 17. The Dominican Population in Selected States and State Clusters in 2000, Showing Projected Population Totals for 2004, 2006, and 2010
Projected population size in: Area 2000 2004 2006 2010 Massachusetts plus Rhode Island 102,240 118,786 127,184 144,323 Connecticut plus New York 653,839 759,653 813,359 922,967 New Jersey 134,421 156,175 167,216 189,750 Pennsylvania 19,556 22,721 24,327 27,605 Maryland plus Virginia plus the District of Columbia 23,347 27,087 30,197 36,584 Florida 68,580 79,566 85,113 96,314 Note: The Dominican population includes anyone who was born in the Dominican Republic or is of Dominican origin or ancestry. Source: U.S. Census Bureau, Census 2000, 5% PUMS File.
30

Migration Policy Institute The Dominican Population in the United States: Growth and Distribution
APPENDIX A The Dominican Population, for the United States, Regions, and States: 1990 and 2000
1990 2000 1990 v. 2000 Area Total
Percent of total Total
Percent of total
Numeric difference
Percent growth
United States 586,700 100.0 1,111,142 100.0 524,442 89.4Region Northeast 505,289 86.1 912,010 82.1 406,721 80.5 Midwest 6,905 1.2 19,304 1.7 12,399 179.6 South 61,505 10.5 157,672 14.2 96,167 156.4 West 13,001 2.2 22,156 2.0 9,155 70.4State Alabama 453 0.1 1,280 0.1 827 182.6 Alaska 546 0.1 1,206 0.1 660 120.9 Arizona 465 0.1 1,579 0.1 1,114 239.6 Arkansas 320 0.1 407 -- 87 27.2 California 8,680 1.5 12,118 1.1 3,438 39.6 Colorado 828 0.1 1,432 0.1 604 72.9 Connecticut 4,560 0.8 15,261 1.4 10,701 234.7 Delaware 227 -- 1,113 0.1 886 390.3
District of Columbia 1,842 0.3 2,153 0.2 311 16.9
Florida 41,125 7.0 109,705 9.9 68,580 166.8 Georgia 2,123 0.4 5,983 0.5 3,860 181.8 Hawaii 342 0.1 453 -- 111 32.5 Idaho 68 -- 221 -- 153 225.0 Illinois 3,000 0.5 7,200 0.6 4,200 140.0 Indiana 620 0.1 1,455 0.1 835 134.7 Iowa 240 -- 274 -- 34 14.2 Kansas 335 0.1 280 -- -55 -16.4 Kentucky 451 0.1 1,105 0.1 654 145.0 Louisiana 897 0.2 1,946 0.2 1,049 116.9 Maine 88 -- 438 -- 350 397.7 Maryland 3,568 0.6 8,947 0.8 5,379 150.8 Massachusetts 33,436 5.7 75,986 6.8 42,550 127.3 Michigan 1,236 0.2 3,591 0.3 2,355 190.5 Minnesota 32 -- 1,024 0.1 992 3,100.0 Mississippi 180 -- 515 -- 335 186.1 Missouri 155 -- 847 0.1 692 446.5 Montana 27 -- 92 -- 65 240.7 Nebraska 9 -- 197 -- 188 2,088.9 Nevada 669 0.1 1,692 0.2 1,023 152.9 New Hampshire 1,132 0.2 1,432 0.1 300 26.5 New Jersey 60,894 10.4 134,421 12.1 73,527 120.7 New Mexico 507 0.1 781 0.1 274 54.0 New York 391,040 66.7 638,578 57.5 247,538 63.3 North Carolina 1,656 0.3 5,889 0.5 4,233 255.6 North Dakota -- -- -- -- -- --
31
Migration Policy Institute The Dominican Population in the United States: Growth and Distribution
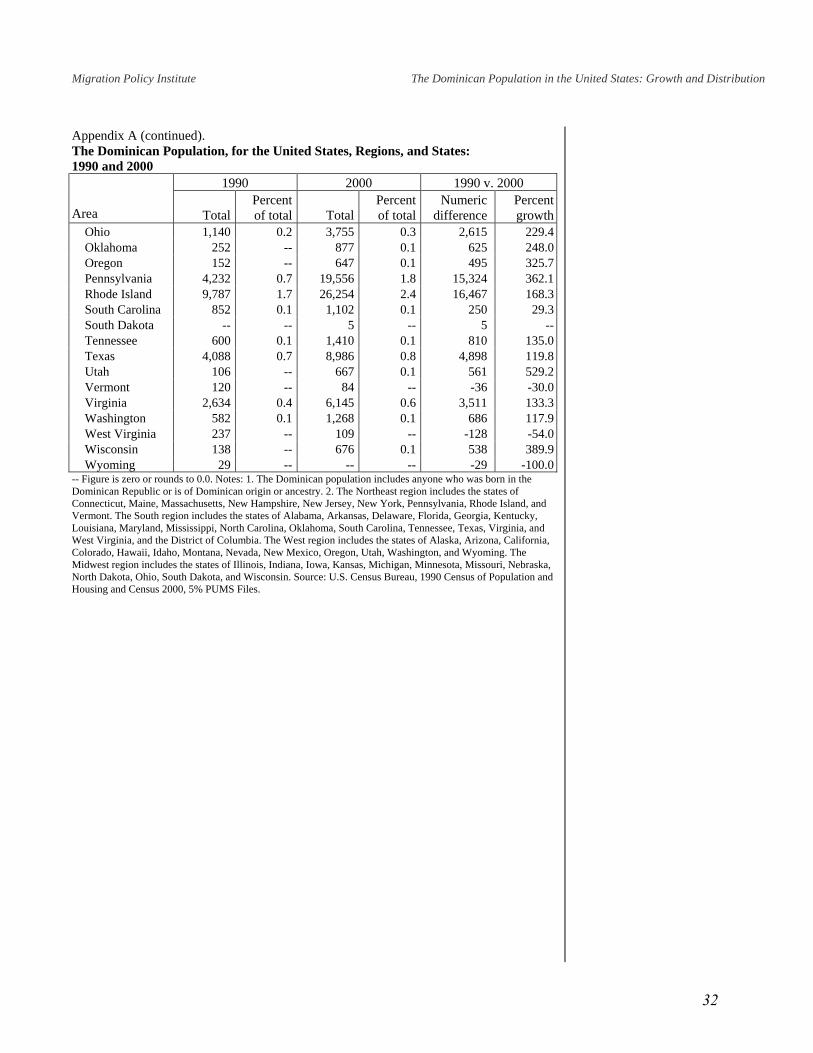
Appendix A (continued). The Dominican Population, for the United States, Regions, and States: 1990 and 2000
1990 2000 1990 v. 2000 Area Total
Percent of total Total
Percent of total
Numeric difference
Percent growth
Ohio 1,140 0.2 3,755 0.3 2,615 229.4 Oklahoma 252 -- 877 0.1 625 248.0 Oregon 152 -- 647 0.1 495 325.7 Pennsylvania 4,232 0.7 19,556 1.8 15,324 362.1 Rhode Island 9,787 1.7 26,254 2.4 16,467 168.3 South Carolina 852 0.1 1,102 0.1 250 29.3 South Dakota -- -- 5 -- 5 -- Tennessee 600 0.1 1,410 0.1 810 135.0 Texas 4,088 0.7 8,986 0.8 4,898 119.8 Utah 106 -- 667 0.1 561 529.2 Vermont 120 -- 84 -- -36 -30.0 Virginia 2,634 0.4 6,145 0.6 3,511 133.3 Washington 582 0.1 1,268 0.1 686 117.9 West Virginia 237 -- 109 -- -128 -54.0 Wisconsin 138 -- 676 0.1 538 389.9 Wyoming 29 -- -- -- -29 -100.0-- Figure is zero or rounds to 0.0. Notes: 1. The Dominican population includes anyone who was born in the Dominican Republic or is of Dominican origin or ancestry. 2. The Northeast region includes the states of Connecticut, Maine, Massachusetts, New Hampshire, New Jersey, New York, Pennsylvania, Rhode Island, and Vermont. The South region includes the states of Alabama, Arkansas, Delaware, Florida, Georgia, Kentucky, Louisiana, Maryland, Mississippi, North Carolina, Oklahoma, South Carolina, Tennessee, Texas, Virginia, and West Virginia, and the District of Columbia. The West region includes the states of Alaska, Arizona, California, Colorado, Hawaii, Idaho, Montana, Nevada, New Mexico, Oregon, Utah, Washington, and Wyoming. The Midwest region includes the states of Illinois, Indiana, Iowa, Kansas, Michigan, Minnesota, Missouri, Nebraska, North Dakota, Ohio, South Dakota, and Wisconsin. Source: U.S. Census Bureau, 1990 Census of Population and Housing and Census 2000, 5% PUMS Files.
32
Migration Policy Institute The Dominican Population in the United States: Growth and Distribution
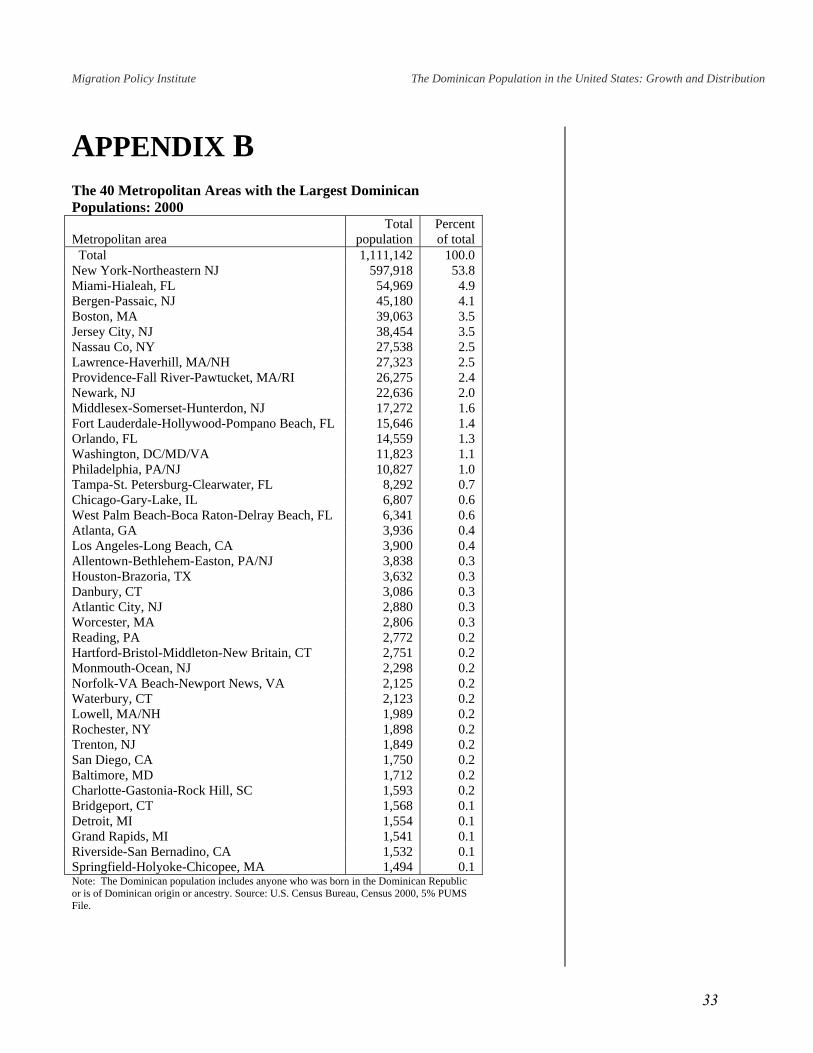
APPENDIX B The 40 Metropolitan Areas with the Largest Dominican Populations: 2000
Metropolitan area Total
population Percent of total
Total 1,111,142 100.0 New York-Northeastern NJ 597,918 53.8 Miami-Hialeah, FL 54,969 4.9 Bergen-Passaic, NJ 45,180 4.1 Boston, MA 39,063 3.5 Jersey City, NJ 38,454 3.5 Nassau Co, NY 27,538 2.5 Lawrence-Haverhill, MA/NH 27,323 2.5 Providence-Fall River-Pawtucket, MA/RI 26,275 2.4 Newark, NJ 22,636 2.0 Middlesex-Somerset-Hunterdon, NJ 17,272 1.6 Fort Lauderdale-Hollywood-Pompano Beach, FL 15,646 1.4 Orlando, FL 14,559 1.3 Washington, DC/MD/VA 11,823 1.1 Philadelphia, PA/NJ 10,827 1.0 Tampa-St. Petersburg-Clearwater, FL 8,292 0.7 Chicago-Gary-Lake, IL 6,807 0.6 West Palm Beach-Boca Raton-Delray Beach, FL 6,341 0.6 Atlanta, GA 3,936 0.4 Los Angeles-Long Beach, CA 3,900 0.4 Allentown-Bethlehem-Easton, PA/NJ 3,838 0.3 Houston-Brazoria, TX 3,632 0.3 Danbury, CT 3,086 0.3 Atlantic City, NJ 2,880 0.3 Worcester, MA 2,806 0.3 Reading, PA 2,772 0.2 Hartford-Bristol-Middleton-New Britain, CT 2,751 0.2 Monmouth-Ocean, NJ 2,298 0.2 Norfolk-VA Beach-Newport News, VA 2,125 0.2 Waterbury, CT 2,123 0.2 Lowell, MA/NH 1,989 0.2 Rochester, NY 1,898 0.2 Trenton, NJ 1,849 0.2 San Diego, CA 1,750 0.2 Baltimore, MD 1,712 0.2 Charlotte-Gastonia-Rock Hill, SC 1,593 0.2 Bridgeport, CT 1,568 0.1 Detroit, MI 1,554 0.1 Grand Rapids, MI 1,541 0.1 Riverside-San Bernadino, CA 1,532 0.1 Springfield-Holyoke-Chicopee, MA 1,494 0.1 Note: The Dominican population includes anyone who was born in the Dominican Republic or is of Dominican origin or ancestry. Source: U.S. Census Bureau, Census 2000, 5% PUMS File.
33

Migration Policy Institute The Dominican Population in the United States: Growth and Distribution
APPENDIX C: DATA SOURCES AND METHODOLOGY DATA This report is based on U.S. Census Bureau data, including the 1990 Census of Population and Housing and Census 2000. The 1990 and 2000 data were derived from the 5 percent public use micro-sample (PUMS) files available from the University of Minnesota’s IPUMS site (see http://www.ipums.umn.edu/usa/ for more information). All data refer to the Dominican population in the United States. DEFINING THE DOMINICAN POPULATION In this report, the Dominican population includes all those who were born in the Dominican Republic as well as those who define themselves as Dominican through origin or ancestry. This includes immigrants who were born in countries other than the Dominican Republic who reported their origin or ancestry as Dominican. CENSUS 2000 AND THE HISPANIC UNDERCOUNT The Hispanic population experienced considerable growth between 1990 and 2000, increasing from 22.4 million to 35.3 million. In spite of this growth, many experts felt that the 2000 counts for the smaller Hispanic origin groups, such as the Dominicans, were too low. There is evidence to suggest that this may be the case (see Cresce, Schmidley, and Ramirez 2004). The undercount was partly due to changes to the Hispanic origin question on the Census 2000 questionnaire, which no longer provided examples of specific groups (e.g., Colombian, Dominican, Salvadoran) as the questionnaire did in 1990. As a result, many respondents reported a general term, such as Hispanic or Latino, rather than a specific origin group, resulting in lower numbers for some Hispanic communities. The impact of the changes to the Hispanic origin question can be seen when the numbers of Dominican Hispanics, as enumerated by the 1990 and 2000 censuses, are compared with the numbers derived using a broader definition combining Hispanic origin, ancestry, and place of birth. The 1990 census enumerated 520,151 Dominican Hispanics. Using the broader definition, this report counted 586,700 persons as Dominican, a
34
Migration Policy Institute The Dominican Population in the United States: Growth and Distribution
difference of less than 50,000. In 2000, the census enumerated 764,945 Dominican Hispanics. Using the broader definition, this report counted 1,111,142 persons as Dominican, a difference of close to 350,000. DOMINICAN POPULATION PROJECTIONS The population projections included in this report use the component method and account for mortality, fertility, immigration and emigration by single year age-sex groups. The age-sex distribution for the total Dominican population and the Dominican foreign born were derived from the Census 2000 5% PUMS file. The age-specific death rates and age-specific fertility rates were derived from the “Population Projections of the United States by Age, Sex, Race, and Hispanic Origin, and Nativity: 1999 to 2100” (middle series, for 2000) published by the Population Projections Program, Population Division of the U.S. Census Bureau. For more information, see: http://www.census.gov/population/projections/nation/detail/np-dl-b.txt. The age-specific fertility and mortality rates were held constant for the 2000 to 2010 period, although the number of births and deaths fluctuated as a result of changes in the age-sex distribution each year, which was aged. The same fertility and mortality rates were used for native and foreign-born Dominicans. The total annual number of legal immigrant arrivals was estimated at 22,800. This number was based on the average number of permanent immigrant arrivals between 1997 and 1999 and includes an estimated 600 Dominicans from countries other than the Dominican Republic. The 22,800 arrivals were imputed an age and sex based on the age-sex distribution of the Dominican foreign born. The number of legal arrivals was held constant between 2000 and 2010. The total annual number of undocumented was estimated at 4,025. Work by Jeff Passel of the Urban Institute suggests that 15 percent of all immigrants from the Dominican Republic are undocumented. Assuming the 22,000 legal Dominican immigrants represent about 85 percent of all immigrants, approximately 3,885 undocumented immigrants represent the remaining 15 percent. Because about 4 percent of all Dominican immigrants were born in countries other than the Dominican Republic, an additional 140 undocumented were added, making a total of 4,025. The undocumented were imputed an age favoring age groups under 35. They were also imputed a sex based on the sex distribution of the Dominican
35
Migration Policy Institute The Dominican Population in the United States: Growth and Distribution
foreign born by age. The number of undocumented was held constant between 2000 and 2010. Rates of emigration were derived from Ahmed and Robinson (1994) and were annualized by Jeff Passel of the Urban Institute (personal communication). Emigration rates were held constant between 2000 and 2010 and were applied to the age-sex distribution of the total Dominican foreign born, which was aged through time. The population projections for the Northeast and South regions were completed in essentially the same manner. The only difference was that the distribution of permanent immigrants and the undocumented was based on the regional distribution of the total Dominican foreign-born population. Because 82 percent of all Dominican foreign born live in the Northeast, the Northeast was allotted 82 percent of all permanent and undocumented immigrants. The South, which has 13 percent of all Dominican foreign born, was allotted 13 percent of all permanent and undocumented immigrants. Internal immigration of Dominicans among regions was assumed to be negligible. The estimated population totals for selected states and metropolitan areas use the growth rates derived from the regional projections to generate the values for 2004, 2006, and 2010. For example, Florida uses the growth rates suggested by the population projection for the South as a whole, while Massachusetts uses the growth rates suggested by the Northeast. While this method likely provides reasonable estimates of future populations over the next ten years, especially for areas with large Dominican communities, it assumes a) an equivalent growth rate for all metropolitan areas within a region and b) no movement among metropolitan areas. Ultimately, the accuracy of these projections will depend on how these assumptions hold up through time.
36
Migration Policy Institute The Dominican Population in the United States: Growth and Distribution
ENDNOTES i Specifically, the Dominican population (1,111,142) includes those who were 1) born in the Dominican Republic (698,106), 2) not born in the Dominican Republic and reported Dominican as their Hispanic origin (261,688), 3) not born in the Dominican Republic and reported “Hispanic” or another general term (e.g., Latino) as their Hispanic origin and reported Dominican as one of their ancestries (93,830), and 4) not born in the Dominican Republic and reported Dominican as one of their ancestries, regardless of their Hispanic origin (57,518). ii A native is someone who was a United States citizen at birth. This includes 1) people born in one of the 50 states and the District of Columbia; 2) people born in the United States Insular Areas, such as Puerto Rico or Guam; and 3) people who were born abroad to at least one parent who was a United States citizen. By comparison, the term foreign born refers to those who were not United States citizens at birth. iii As of the writing of this report, the Department of Homeland Security Office of Immigration Statistics has not released immigration data for the years 2003 and 2004. iv The Northeast region includes the states of Connecticut, Maine, Massachusetts, New Hampshire, New Jersey, New York, Pennsylvania, Rhode Island, and Vermont. The South region includes the states of Alabama, Arkansas, Delaware, Florida, Georgia, Kentucky, Louisiana, Maryland, Mississippi, North Carolina, Oklahoma, South Carolina, Tennessee, Texas, Virginia, and West Virginia, and the District of Columbia. The West region includes the states of Alaska, Arizona, California, Colorado, Hawaii, Idaho, Montana, Nevada, New Mexico, Oregon, Utah, Washington, and Wyoming. The Midwest region includes the states of Illinois, Indiana, Iowa, Kansas, Michigan, Minnesota, Missouri, Nebraska, North Dakota, Ohio, South Dakota, and Wisconsin. v Personal communication with author.
37
Migration Policy Institute The Dominican Population in the United States: Growth and Distribution
REFERENCES Ahmed, Bashir and J. Gregory Robinson, U.S. Census Bureau, Population Division Working Paper Number 9, “Estimates of Emigration of the Foreign-Born Population: 1980-1990.” U.S. Census Bureau, Washington, DC, 2004. This paper is available on-line at: http://www.census.gov/population/www/techpap.html Cresce, Aurthur R., Audrey Dianne Schmidley, and Roberto R. Ramirez, U.S. Census Bureau, Population Division Working Paper Number 75, “Identification of Hispanic Ethnicity in Census 2000: Analysis of Data Quality for the Question on Hispanic Origin.” U.S. Census Bureau, Washington, DC, 2004. This paper is available on-line at: http://www.census.gov/population/www/techpap.html Hernandez, Ramona and Francisco L. Rivera-Batiz, CUNY Dominican Studies Institute, Dominican Research Monographs, “Dominicans in the United States: A Socio-Economic Profile, 2000.” CUNY Dominican Studies Institute, New York, 2003. Passel, Jeffery, “New Estimates of the Undocumented Population in the United States.” Migration Information Source, May 2002. This paper is available on-line at: http://www.migrationinformation.org/Feature/display.cfm?ID=19
38