Embed Size (px)
Citation preview

----
2 5 IIIF8 11111 25 IIIF8 11111 10 10 II f1W 1111111 22 w IIlpmiddot2
lUl I ~~~ tZ ~i~Iii Iiii I~ i m~ Ill u u11 11 lWLh
-
middot111I112~ 14 1111116 11111125 111114_ 1111116
MICROCOPY RESOLUTION TEST CHART MICROCOPY RESOLUTION TEST CHART NATIONAL BUqEAU OF STANDARDS-1963-A NATIONAL BUREAU Of STANDARDS-1963-A
Technical Bulletin No 925 bull NoremlJer 1946
bull VNITED STAT~S lttfi c -1~ ~
middotDEPARjMHNT OF AGRICULTURE ~ gt- bull l
Wj~~N~TON DC gt bull ~laquo~ ~ - ~
Growth and Rubber Accun1ulation in Guayule as Conditioned by Soil
Salinity and Irrigation Regime 1
By C H WADLEIGH seni01 chemist H G GAUCH lssociate physiologistand O C MAGISTAD formerly Direct01 Unitecl States Regional Salinity Laboratory Dilision of Soi1s Fe1middottilizers and Irrigation Bureau of Plant Industry Soils and AgriculturaL Enginee1ing Agricultural Reshysemch Administration
CONTENTS Page Page
Experimental procedure______ 2 Results-ContinuedResults _______bull____________________ ~ Concentration of soil Appearance of the plants___ solutions_______________
bull 15Quantitative growthresponses_______________________ 7 Ionic composition of soil
Rubber accumulation______ 8 extracts and soil solutions 18 Water requirement _________ 11 Discussion_________________ _________ 23 Conductance of the soil Summary_______________ ____ 31extracts _____________________ 13 Literature cited____________ 33
THE ACREAGE of guayule in the Southwestern States was increased extensively during 1942 through the efforts of the
~ Emergency Rubber Project Many areas in the irrigable valleys of this region contain soil that is either saline or subject to salinishyzation It~as almost inevitable therefore that some of the guashyyu~~lan~gs should have been made on slightly to moderately
~ salm soil~ Investigators of the Emergency Rubber Project workshy ingwith ~ayule early recognized that the growth response of J theJilan~as modified by soil salinity and that the plants were rJ) even kill in certain spots where the salt concentration of the a) soqiras derately high These investigators also recognized the1 de~bili of a quantitative study of the salt tolerance of the I plant si~ such information was not available in the literature
bull lt In order to supplement their field observations they called the
attention of the salinity laboratory to the need of such studies Consequently the investigation comprising this report was unshydertaken
1 Submitted for pUblication May 1946 This lork was performed under an allotment from the Special Research Fund authorized by Title I of the Bankhead-Jones Act of June 29 1935 and in cooperation with the agricultural experiment stations of Arizona California Colorado Idaho Montana Nevada New Mexico Oregon Utah Washington Wyoming and the Territory of Hawaii
2 TECHNICAL BULLETIN 925 U S DEPT OF AGRICUL1URE
Since sodium chloride (NaCl) and sodium sulfate (Na2S01) are the most common salts that occur in saline soils it follows that these two salts should be included in studies of salt tolerance of plants It also seemed desirable that laboratory studies on salt tolerance of guayule should be made with a saline soil on which this crop was being grown Since the effect of salt content of a soil upon plant response is conditioned by the status of the soil moisture it was considered expl~dient to incorporate variations in the soil-moisture regime into this experiment
EXPERIMENTAL PROCEDLIHE
The sample of Panoche loartJ used in this study was supplied by the United States Forest Service and was obtained 1312 miles east of Coalinga in Fresno County Calif from a tract planted to guayule At this location the top 18-inch horizon was found to be a light brownish-gray friable and slightly calcareous loam that was very porous and low in organic matter The 4 tons of soil that made up the sample were taken from the upper 10-inch horizon Laboratury tamination indicated that this soil conshytained 085 percent CaeOa The exchange capacity was found to be 161 milliequivalents (me) per middot100 grams and the exchange complex was almost completely saturated with calcium The saturated soil (21) 2 (320 percent water) had a pH value of 776 and a specific conductance of 54X10- ii at 25deg C When the soil was allowed to come to equilibrium with 144 percent moisture and the soil solution was displaced in a pressure-membrane apshyparatus (17Z8) this solutipn had a specific conductance of 102X10-r mhos per centimeter at 25deg and an osmotic pressure of 045 atmosphere and the solutes were made up almost entirely of calcium chloride and bicarbonate When the soil was moisshytened and allowed to come to equilibrium under J tension of 15 atmospheres in ihE pressure-membrane apparatus (]9 j it retained 855 percent moisture This corresponds fairly closely to the 1)(1 shy
manent wilting percentage of 92 as determined with sunflower plants The normal moisture-holding capacity (22) was found to be 181 percent The moisture sorption curve~ of this soil is given in figure 1
The experimental variables to be imposed upon this soil were as follows Salt treatment (all salt additions on dry-soil basis) nriqU(ltjoli
No added salt _ _ _ _ o 01 percent added Nael_ _ _ Ct 02 percent added NaCl _____ __ cmiddot 04 percent pdded NaCl _ _ __ Cj 02 percent cdded NaSO1 -- ______ __ S~ 04 percent added Na2S0 _____ __ SI 08 percent added Na2S01 ___ ___ _ SI
The irrigation schedules were 1 Soil irrigated with sufficient water to bring the moisture cmtent
to field capacity (approximately 20-percent moisture) when the averagl
bull
bull
bull 2 Italic numbers in parentheses refer to Literature Cited p 33
S The writers are indebted to Milton Fireman assockte soil scientist of this Bureau for the data from which the curve was drawn
3 GROWTH AND RUBBER ACCUMULATION IN GUAYULE
bull 16
15
14
13
12
II
(j) 10w 0 W I a 9 (j)
0 ~ 8 ~
z 7
(j)
z w 6 Ishybull 0
5
4
3
2
oL--L~__~-L__L-~~==L==c~==plusmn=d 8 9 10 II 12 13 14 15 16 17 18 19 20
SOIL MOISTURE (PERCENT) (ORY BASIS)
FIGURE 1-Relaticn between moisture tension and moisture percemage in a sample of Panache loam
bull soil moisture obtained by weighing entire drum plus soil of a culture reached 14 percent Tensiometers installed in certain soil cultures indishycated the 14-pprcent soil moisture corresponded with a tension of 300 to 400 cm of water at the 4-inch depth in the soil This regime is designatedby the letter L (low tension)
2 Soil irrigated with sufficient water to bring soil-moisture content to field capacity when average soil-moisture content of a culture reached 9 percent This series is designated by the letter H (high tension)
4 TECHNICAL BULLETIN 925 U So DEPT OF AGRICULTURE
3 Plants on irrigation schedule No 1 for first part vf experimental period (March 1 to July 9) and on irrigation schedule No2 for latter part of period (July 9 to December 1) This series is designated by letters L-H
Each irrigation regime was applied in combination with each salt treatment making 21 experimental variables All treatments were thrice replicated Steel drums with a 10-gallon capacity (adequate for 100 pounds of dry soil) were used as soil containers
The proper quantity of salt for each treatment was mixed with the screened soil ( inch) in a box suspended and rotated eccentrically Besides the designated salt 3 grams of 16-percent superphosphate and 85 grams of dry pulverized steer manure were added to each drum of soil With the aid of a mechanical mixer and packer 106 pounds of the soil at a moisture content of 5 percent were placed in each container The average volume weight of the soil in the drums so packed was found to be 128
Before transplanting the plants to the drums the soil-moisshyture content was brought to approximately the field capacity by the addition of 14 pounds of water to the surface of each drum or soil This treatment leached the surface soil and caused an accumulation of the salt in the lower parts of the soil mass For example when 02 percent NaCI was mixed with this soil the conductance of the extract of the saturated soil (32-percent moisshyture) was l290X10- ii mhos per centimeter at 25deg C A drum of soil to which 02 percent NaCI was incorporated was sampled 5 days after the initial heavy application of water The soil was segregated into trumiddotee horizons and the conductance of tire extract 01 the saturated soil from each horizon determined These conshyductance values in mhos per centimeter at 25deg C were (1) top horizon 630XlO-5 (2) middle horizon 129X10-5 and (3) bottom horizon 3100X 10-ubull Thus salt accumulation in the bottom of the containers was even more pronounced at the beginning of the experiment than at the end
Supplementary studies have indicated tHat a quasi-equilibshyrium in salt distribution within the containers was reached almost at the beginning of the experimental period as the result of the heavy initial irrigation and that the effect on salt movement downward of the lighter irrigations during the course of the experiment tended to be counteracted by salt movement upward during the irrigation interval This supplementary evidence inshydicated that in most treatments the pattern of salt distribution was not greatly different at the end of the experiment from that following the initial heavy irrigation This high degree of n0nshyuniformity in salt dlstribution within the soil however suggested the necessity of deJeloping a method (26) that would take this nonuniformity into ~ccount when evaluating the responses of the plants
During the course of the experiment the soil was irrIgated as required with Riverside tap water The average analysisl of this water in equivalents per million is as follo l IS 143 Ca 025
~ Furnished by courtesy of the Rubidoux Laboratory Riverside Calif
bull
bull
bull
5
bull
bull
bull
GROWTH AND RUBBER ACCUMULATION IN GUAYULE
Mg 180 Na 009 K 072 Cl 061 S04 and 222 HCO All water was added to the surface of the soil
The plants used in this study were obtained from the Alisal Nursery of the Emergency Rubber Project Salinas Calif As received they had taproots 20 to 25 cm long and 3 to 5 mm in diameter at the crown the tops had been trimmed to 5 to 8 cm in height They were first embedded in sand and allowed to initiate a new flush of growth before plants were selected for study On February 3 1943 after the plants had been in the sancl bed for about 5 weeks 63 uniform plants were selected out of the original 200 and each was washed free of sand and tramshyplanted to a drum of soil After transplanting them the soil wa washed in around the roots with 2 quarts of tap water so that the rootlets would not immediately come into contact with saline soil
During the course of the study the drums of soil were weighed every day to determine the average moisture content of the soH and when and what quantity of water should be applied At each Irrigation sufficient water was added to bring the average soilshymoisture content to 20 percent
On the first and fifteenth day of each month during thc course of the study the maximum height and maximum width of each plant was measured The product of these two measureshyments was taken as a growth index in order to have a rough measurement of the rate of growth of each plant during the course of the stUdy These growth measurements were subjected to stashytistical analysis and although th(~ firdings lend added support to the interpretations here presented it was decided to report the details of these growth-response curves dsewhere
The plants were harvested on December 1 1943 weighed and air-dried in difluse light When the tops vere dry the leacs were stripped cif and the stems and roots shipped to Raibrc Holmes of the Emergency Rubber Project Salinas Calif The analyses for resin and rubber content were carried out under his direction
After the plants had been harvested the soil in each drum was sampled This involved dividing the 15-inch depth into three 5-inch horizons The soil from each horizon was mixed air-dried and sampled for analysis Observations as to depth and density of root vnetration also were made at this time
Each of the 189 soil samples was brought to the saturation percentage (21) with distilled water and allowed to stand over night and the solution was extracted by placing the saturated soil on a Buchner funnel and applying suction The specific conshyductance of each extract was determined Certain extracts from selected treatments were subjected to complete inorganic analysis Also a part of the sample of soil from these selected treatments was adjusted to approximately 12-percent moisture and the soil solution displaced by means of the pressure-membrane apparatus 07 l8l The specific corductUl1ce oomlltic plls$ure and ionic composition of thesG solutions also WCre detenl1incd The methshyods of chemical anlyis suggested b~ RcmiddotitcmeiCl- i Ji) were folshylowed
6 TECHNICAL BULLETIN 025 U S DEPT OF AGRICULTURE
RESULTS
AlIEn~Cg OF TilE PLTS
At the termination of this experiment certain qualitative differences and similarities were noted in the appearances of plants grown under the different experimental conditions Plants grown on soil with O-added salt were in excellent condition reshygardless of soil-moisture regime Even at the time of greatest depletion of soil moisture no evidence of wilting was observed
Those grown on soil containing 01 percent NaGI were very similar in appearance to those with O-added salt Differences in soil-moisture regime in the presence of this quantity of salt likeshywise appeared to have few distinct qualitative effects upon the appearance of the plants
When there was 02 percent NaGI in the soil the plants grown under a low moisture-tension regime appeared normal Those that were shifted from the low to the high tension regime apshypeared to have a rather large proportion of their lower leaves dead or dying Plants at this salt level that had been grown under the high moisture-tension regime appeared dead or nearly so since the major portion of their leaves had died
Plants grown in the presence of 04 percent NaGI were just about normal when grown under the low soil-moisture-tension regime with the exception that there appeared to be a somewhat abnormally high proportion of dead leaves at the base Plants at this salt content of the soil thatwere shifted from the low to the high soil-moisture-tension regime were nearly dead at the time of harvest only the whorl of leaves just below the terminal buds still showing green Those grown on soil with 04 percent NaGl and continually maintained on the high soil-moisture-tenshysion regime had died some 3 months before the termination of the experiment
Plants grown in the presence of added Na~SO had a defishynitely different appearance from those grown in the presencf of added NaGl The leaves were a deeper bluish green and their glaucousness appeared to be more pronounced With 02 percent added Na2S0 the plants were remarkably similar to those in the control O-added salt series and even those with 04 percent added Na2S0 were quite similar to the control plants with the exception of the deeper bluish-green coloration of the leaves
Plants grown with 08 percent added Na~SO were outstandshying from those of other treatments in the unusually deep bluish green of the leaves and the appearance on them of an unusually pronounced development of glaucousness This level of Na2S0 did not induce an abnormal rate of dying of the lower leaves as was the case in the presence of the highest level of NaGl Difshyferential soil-moisture regimes did not appear to be associa ted with qualitative differences among the plants grown on soil to which Na2S01 had been added
bull
bull
bull
I
------
------------
bull
bull
bull
GROWfH A)1) RLBBER ACCU-nLATION I~ GLAx1LE 7
Qr YflT TI I GnowfII REPO~-E5
The average growth responses of the plants produced under the various experimental conditicns are shOvn in table 1 Figure 2 presents the trends in growth response as measured by green
TABLE 1-Grouth and rubber content oj guayule under the mrious experimental conditiOlls
_-shy ~~------
I I-f~ PublJt ~ ~t~ ~Llr~t R+ ~1 Rib TK
tl~ p~n Trtl~mltmiddot
tmiddot~
-~ - --- -~-- Int JJ pr PlTren (ir1
(IL - tJ~ i 525 35 l 0 (R j t) 1 Sampl ij 4 1 OL-H ~i A Ij 50 tj ~J 5 35
CL 5J ~4 4 fi 1 5 fi 4 4 H 157 15 gt 515 4 55 1 HZ IL-H 2Si 55 tj ~ 11 ) 73 1 a (L ~50- 4~H ~ (If H 15 l(H(ill 7u 11 1 1lt1 3 112 44 eL-H 1-) I Ji3
h ~ ~ li 5 U
fL I~ 4~ 1 551 114 5 (Ii () t110 0 0(LR 81 4 r 45 ~ S )
SoL 411 u ~ 5 4 1 4 60 tH 2SS ti S 5 tj iii 4 II oL-H 33 51 bull tt tl 44 6 IIgt
SL 3~ 8 0 52) 4 69 4 Ol ~-IH 15~ 4S 1 35 -513 276-shy~LmiddotH on 53 I 5 4~ ~OO Ii
6SoL 2S7 41 n 4 59 3 1 5SH 140 4- 4 94 ()ltJ 11SL-H 2il 24 4 00 lJI 73
-~-Poolfll tan~ari tnr j hI J t 1~ 1lt IS
I hbralJolS are explruned on p ~4 bull Error tmn oolteti Gn nmblilty in ultus rL Off r-rg L 1 1 H L-H mtl ~L
weight of tops and as conditioned by level of soil salinity at the various soil-moisture regimes Within a given salt level the smalshylest plants were those that were periodically subjected to high soil-moisture tension Within each soil-moisture regime increase in the concentration of NaCl in the soil vas associated with a marked decrease in vegetative growth These results parallel those previously reported for beans (Z J
When NaSO-l was added to the soil there was practically no decrease in vegetative growth until the added percentage of salt exceeded 04 percent For a given soil-moisture regime even with the addition of 08 percent NaSO-l the plants were definite1y larger than those grown in soil having 04 percent added NaCl The growth response in the NaS04 series indicates that the acshytual soil salinity was not nearly so high ilS that to be expected on the basis of the quantity of salt added to the soil Data preshysented in a later section (pp 15 to 23) vill aiel in explaining the results obtained for this series
The plants were air-dried only consequently the air-dry weights of the tops reported in table 2 include an undetermined quantity of imbibed water on the hydrophyllic colloids of the tissue At the time this study was carried out the writers were
8 TECHNICAL BULLETIN 925 U S DEPT OF AGRICULTURE
advised that oven-drying the tissue had a detrimental effect on rubber content The data presented in table 1 for mill able bush include the dried stems and main roots of the plants Since the trends for both dry weight of tops and millable bush almost coshy bull incide with those given in figure 2 for the green weight of tops 110 further discussion of these two criteria of growth is necessary
so middot I0r5~RE REGIME
--- LOW TEllS TON ------ H~H TENSfON
---- LOll - HIGH bull FIGURE 2-Growth of plants under the various experimental conditions
as measured by green weight of tops
RCBllIm ACCDIlLTIOi
The percentages of resin aJld of rubber in the millable bush and the absolute quantity of rubber in grams produced per plant are also presented in table 1 The variations in percentage of resin appeared to be minor and as such merit little consideration in the present study Variations in the percentage of rubber were rather marked and these are presented graphically in figure 3 1 as functions of the various experimental variables Within the low-tension soil-moisture regime 01 02 and 04 percent Nael in the soil resulted in a definite increase in percentage of rubber in the plants This relationship tends to corroborate the view that a moisture stress to the plant (in this case induced primarily by salt) is conducive to rubber formation It is also evident that in the absence of any added salt when the soil-moisture tension is permitted to approach a high yalue prior to irrigation as con- bull trasted with maintenance at a low level a marked increase in rubber accumulation resulted This is in agreement with the findings of Kelley and associates I1lJ
In the moisture series that were subjected to periods of high moisture tension or were shifted to this regime during the latter
9 GROWTH AND RUBBER ACCUMULATION IN GUAYULE
bull 6----------------------------------------------------- NaGI
SOIL- MOISTURE RpoundGIME
- LOW TENSION
0------- HIGH TENSION +--- LOW - HIGH
6 NaGI
bull
+
l t _---0 0 e-
+ ~ r
a w x a
~~ shy IDIFFERENCE REQUIRED ~ FOR SIGI1FICANCE ~
~ 0 t SOIL-MOISTURE REGIME
_ LOW TENSION + B
0------ HIGH TENSION 0 _____ __________ 0 _ L-__+-__-l--__l_OW----L--H_1G_H________---
Q o 2 3 4 ( 2
5A~T m DRY SOIL PERCENT l
FIGURE 3-A Percentage of rubber in the millable bush B absolute quantity of rubber produced per plant under the various treatments
bull part of the growing season however the presence of NaCl in the soil had a deleterious effect on rubber accumulation Since rubshyber is a derivative of the photosynthate of the plant it is to be e~pected that any condition that might impair photosynthesis or the accumulation of the products of photosynthesis wl)uld affect rubber accumulation High concentrations of the chloride ion in the substrate have been found detrimental to sugar formation
10 TECHNICAL BULLETIN 925 U S DEPT OF AGRICULTURE
TABLE 2-Water utilization by iJmiddotuayule under the various treatments --------~---------~--~-- ~ bull__--_- --- shy
Air-dry Wllter I Iuter per grum III -Treuhntml I ~ight 1~~I~i~t i -~ir-ltJ~) wlili~t~I-----of 10lll
ght 11 tot 11111 Huhlwr- _______________ __ i1~root)_____
CrtllII I Utera [Im Lilrra I Wm01 2010 303 151 a07 820Olf lau 5 ISU 138 3041 4ROOL-IL IU1U 238 148 aoe ~ 445
eI li4 I I 2iO LtlO 3 30 5~ 8(II 80 3 IIUI~ 140 J 17 IiO 2CL-H 1322 141i 130 5iO0
ICI i Wlil 1 2011 151 417 I Oii(11 334 I 113 ISO 5 20 I liIC1CL-H 1 80 13U 152 152 ~ 001
(1 02 2 j 165 I i9 02 05 5(H S 2 I 28 J 42 i 98 103 CJlrII _ 1
SL I I~ I a~ J 22 (is 3
811 bull laS1 181 134 21)1) 440SL-Hbull 1U3 0 I 234 143 282 330 SL 171)5 203 1 03 3 41 i2 GSJj 114 8 illS I 44 3 43 50 8SL-II 1026~ _- I 204 103 i 3S0 64 4 SI 1 104 183 4 7J 12a 0sn 1i0 () I 105 I 75 4 U3 01 4SL-II UO 0 112 187 4 51 1530
Sfnrulnrd rrrnr J 42 1 25 021 041 ____--0____lt ____ ~ ~_
bull Abhrcmtiuns lin explilltiIou II 2 -I 2 grror tlrm balctl on urlUbJlity ill (UaUrtS OL OIl 011 If etl~ (IL ~H ~~L II ami -II~
and starch accumulation in the potato plant (2 3) and there is some evidence that high concenkations of NaCl in the soil solushytion adversely affect the carbohydrate metabolism of the bean plant (27) If the chloride ion has this effect upon the photosynshythetic activity of the guayule plant the observed trends in rubber accumulation for the high soil-moisture-tension plants as affected by NaCI are within expectation
This however would not account for the apparent accumushylation of rubber in the presence of added NaCI in the low soilshymoisture-tension regime It was previously noted that plants periodically subjected to high soil-moisture tensions and high levels of NaCI showed an inordinate degree of dying of the lower leaves This abnormal lowering in the photosynthetic surface of the plant may account for the lower rubber production in plants subjected to the high concentrations of NaCl when the soilshymoisture regime involved high tension
When Na2S0 was added to the soil the effect on rubber accumulation showed somewhat different trends from those obshyserved in the NaCl series Thus in the low moisture-tension series added NalSOI had little if any significant effect on rubber accumulation as compared with the control O-added salt plants Within each respective salt level sllbjecting the plants to a high moisture-tension regime resulted in a significant increase in pershycentage of rubber with the exception of the plants grown with 08 percent added NaSO and shifted from the low to the high
bull
bull
bull
11 GROWTH AND RUBBER ACCU~IULATION IN GUAYUIE
bull tension-moisture regime This latter anomalous observation may be an analytical error It certainly cannot be readily explained on the basis of the data available
From an economic standpoint the yield of rubber per acre
bull
is a function of both vegetative growth and rubber percentage The present data may be evaluated in terms indicative of the rubber production per unit area by reference to figure 3 B showshying the relationship between grams of rubber accumulated per plant and the variou~ experimental variables In the NaCI series with the exception f the plants grown in O-added salt at low soil-moisture tension the periodic subjecton of plants to the hirrh m~)isture tension lowered the rubber yield as did also increasi~g the salt content of the soil The seemingly anomalous position of the af0rementioned plants on treatment OL was due to the relashytively low percentage of rlbber in these plants In the NaS04 series it is evident that for the most part an increase in the salinity of the soil is associated with a decrease in rubber producshytion with the exception that the control series tel1ded to produce plants with a lower absolute quantity of rUbber than those grown on soil containing 02 percent Na2S01 The soil-moisture regimes appeared to have little distinct effect in the NaSOI series except that in the O-added and O2-percent-added NaSOI series the plants shifting from low to high soil-moisture tension gave the highest quantities of rubber per plant of any in the experiment
Since much of the guayule now being grown is produced und0r riqation it is expedient to consider the water economy of this plant The average quantity of water supplied to each plant durshying the experimental period together with the ratios of the quantity of water added to dry-matter accumulation and to rubshyber production are presented in table 2 The applications of water per plant as conditioned by treatment follow the same ~el1eral trends as the ones shown in fir~ure 2 for ~rowth response ie the larger the plants the more water applied to the culture
bull
There were certain differences however in the ratio of drv matter produced in the plants per given quar)tity of water apshyplied With the exception of the C 1H plants that died 14 to 2D liters of irrigation water were applied during the experimental period for each gram of dry weight of tops produced The efshyficiency of water utilization tended to be higher under the irrishygation regimes involving high soil-moisture tension prior to irrishygation The data on water utilization perhaps have a mOre pracshytical bearing if considered on the basis of liters of water applied per gram of mi11able bush produced The trends for these data are shown in figure 4 bull 1 This indicatES that in the presence of O-added salt slightly less yatel was needed to produce a gram of millable bush under hIgh than under low moisture-tension regimes but the difference is not ~ignificant In terms of producshytion of miUable bush the mam pomt that these data bring out is that an increase in salt concentration of the soil is associated with a derrease in effidency of water utilization
12 fECHNICAL BULLETIN 925 U S DEPT OF AGRICULTURE
r NaGIIf) J ID W solL- MOISTURE REGIME J I
- LOW TENSION 5 I J I 0------- HIGH TENSION I ~ +--- LOW- HIGH I gt- p-+I ~ I C I
~ ~ ~ ~ 4 ~ I ffi 1 l a + ~ ffi -- ~ ~ I ___-0 I I ~
~ 3 tr---- I ~~-j ~ LI__l_-l___L--__L-_~IFt-F_ERE_N_C_EJR_EO_U_IR_E_D_FL0R_SI_GN_IF_ICLA_N_CE__--Ll
NaGI~160 ID
=gt o SOIL- MOISTURE REGIME
- o - LOW TENSION
~120 0------- HIGH TENSION
~ + --- LOW - HIGH -0
I - ~
ffi - a eo ~ ~ 7 ~ 0 k ~ 0-shy
+- +------0 p_-o
~J 4deg - r ---I ~ IDIFFERENCE REQUIRED FOR SIGNIFICANCE
ofL-B__l-__~I__~I___lI_ --__~__~__~___l_ o 2 3 4 0 2 4 6 8
SALT IN DRY SOIL (PERCENT)
FIGURE 4-Quantity of water applied (A) per gram of millable bush and (B) in terms of grams of rubber produced by the various treatments
The ratio of water application to grams of rubber produced is shown in figure 4 B It is evident that plants periodically subshyjected to high moisture tension had a significantly higher efficishyency of rubber production in terms of water application than those grown continually under the low moisture-tension regime
This differential however disappear8d in the presence of added saHs In the main the efficiency of rubber production in terms of water application tended to decrease with an increase in soil salinity The main exception to this was that undEr low soilshymoisture tension a small quantity of salt present in the soil tended to bring about an increase in the efficiency of rubber production per given quantity of water applied These data would indicate that where cost of irrigation water is a significant contributor to cost of production the presence of saline soil would tend to enshy
bull
bull
bull
13
bull
bull
bull
GROWTH AND RUBBER ACCUMULATION IN GUAYULE
hance considtrably the cost of rubber production For example under some treatments more than three times as much water is required to produce a gram of rubber as in others
CO~DLC1~CE DF THE SOIL EXmiddotrHcrS
In the preceding presentation the observations have been considered on the basis of percentage of salt actually mixed with the soil This criterion of classification however has two outshystanding weaknesses (1) As a result of adding water to the sur4 face only it is obvious that the salt added to the soil would not maintain its original uniform distribution but would tend to be leached towards the lower horizons (1) (2) the decreasein activity of the soil water induced by dissolved solids would not be directly related to the quantity of salt added to the soil but would be conditioned by reactions between the salt added and the chemical components of the soil itself The direction and degree of salt movement are shown in figure 5
As a general rule the salt content was lowest in the surface horizon of soil in the drums and highest in the deepest horizon The exceptions to this were that in the Hand L-H series of soilshymoisture treatments with 04 percent NaCl the salt content of the soil solution at the surface horizon was as high as in the lower horizons or higher This exceptional observation was related to the early death of the plants and the consequent cessation of irrigation which resulted in the salts migratillg surfaceward by capillarity and accumulating because of surface evaporation
Theoretically 2 grams of Na2S0-tdissolved in a given quanshytity of water should give rise to a slightly lower activity of the solvent than when 1 gram of NaCl is added to the same quantity of water The conductances of the extracts of the saturated soil (fig 5) show that this theoretical relationship was altered when these respective salts were added to this Panoche sgti1 Additions of Na2S0-t did not have a directly commensurate effect on the lowering of the activity of the soil moisture It is especially reshymarkable that in the surface horizon the addition of Na2S0-l had very little effect upon the conductance of the soil extract unless more than 04 percent of this salt was originally present This finding is related to the observations presented in figure 2 showshying that unless the soil initially contained more than 04 percent Na2S0-t there was little if any effect upon growth of guayule These data also suggest tl1at especially within the low moistureshytension regime the salt concentration of the surface horizon (5 inches) of soil was the main one affecting growth Such a correlation would be in agreement with the observations of Eaton (6) and Long (13) that roots of plants remove water mainly from the part of the substrat2 that has the lower osmotic pressure
This relation between the conductance of the extract from the surface horizon of the soil and the growth of the plant is shown in figure 6 It may be seen that within a given soil-moisture-tenshysion regime growth approaches a nearly linear relationship with the logarithm of the conductance of the soil extract of the surface horizon It is also evident that modifications in the soil-moisture
14 TECHNICAL BULLETIN 925 U S DEPT OF AGRICULTURE
3000 NaGI bull 2900
Ishy()
ltt a lshyx w 1000
J
0 if)
o W Ishyltt a J
~ if)
~ 2000
o )(
~
~ 1000
w () bullZ ltt Ishy()
J o SOIL HORIZONZ o () - UPPER THIRD
0---- MIDDLE THIRD ()
+-- LOWER THIRD~ 2000 () w c if)
1000
1 2 3 4 0 2 4 6 8 SALT IN DRY SOIL (PERCENT)
FIGURE 5-Specific conductance of the extract of the saturated soil found at the termination of the experiment for the different treatments
regime cause a definite displacement in plant response to sa- bull linity with the result that plants subjected to a high soil-moisshyture tension made consistently poorer growth than those of corshyresponding salt treatments subjected only to low soil-moisture tension
15
bull
bull
bull
GROWTH AND RUBBER ACCUMULATION IN GUAYULE
SOIL- MOISTURE REG I M E 400
---- LOW TENSION~ 0------- HIGH TENSION
+--- LOW - HIGH
Ul
ltt a () 300
Z ltl J a
a w a 200 I shy x ()
w o z w w ~ 100
100 200 500 1000 2000
K X 105 OF SATURATED SOIL EXTRACT LOG SCALE J
FIGURE 6-Relation between growth of plants and specific conductance of the extract of the saturated soil from the surface horizon
CONCENTIlATION 0[1 SOIL SOLllTIONS
The foregoing data on conductance of the soil extract were based on themiddot soil-moisture percentage at saturation Depending on the types of soil and salts present it is known that the qualitashytive composition of the soil solution will change with moisture percentage (7 16) Although it was expedient to make conducshytance determinations on the extract of the saturated soil on all 139 samples it would not have been feasible to extract this numshyber of samples at a low moisture content by use of the pressureshymembrane apparatus It did seem advisable however to evaluate the relation between the conductance of the soil solution at the saturation percentage and the conductance of the soil solution within the field-moisture range
As shown in table 3 the soil solution of certain selected samshyples was removed by means of the pressure-membrane apparatus at a moisture content of approximately 11 to 12 percent and the conductance of the solution determined The relation between the conductance of the soil extract made at the saturation pershycentage and that of the soil solution obtained at 12 percent soil moisture is shown in fiure 7 A It is evident that the relationshyship for soil to which NaCl was added is different from soil that
16 TECHNICAL BULLETIN 925 U S DEPT OF AGRICULTURE
received Na2S04 It is to be recalled that Panoche loam soil is almost saturated with calcium When Na2S04 was added to this calcium-saturated soil sodium entered the exchange complex bull liberating calcium and gypsum (CaSO2H20) was formed
3000
2000 c
o
Ii)) I 0
- Noel SERIESLl c--- N0 2S0 4 SERIES
I
O~____~____-L____-L____~______L-____~____~______~-J
o 2000 4000 lt 6000 8000 bull ~0r---------------------------------------------------~
I en 32 w J 0 en o
24
w a J
16 w a 0
t
i5 8 en o
deg0~----~----2~PO-0-----L---~--4o~0-0-----L----6-P~0-0----~----~_oLOO--J
FIGURE 7-0bserved relations between (A) the specific conductance of the extract of the saturated soil (32 percent H20) and that of the soil bull solution (12 percent rhO) and (B) the specific conductance and the osmotic pressure of the soil solution
It appears that the variation in the quantity of CaSOf in solution (16 24) at different percentages of soil moisture is inshyvolved in soils at which Na2S0 has been added The relationshy
bull
bull
bull
GROWTH AND RUBBER ACCUMULATION IN GUAYULE 17
ships in figure 7 A present a rather satisfactory basis for conshyversion of the conductance made at the saturation percentage to conductance of the soil solution at 12 percent moisture which is within the field-moisture range The cryoscopically determined osmotic pressure of the soil solutions at 12 percent soil moisture and also the osmotic pressure of the soil solutions that might be exshypected at different soil-moisture percentages are shown in table 3 The relation between the conductance of the solution and its osshymotic pressure is shown in figure 7 B This regression was found by the method of least squares to be 255 X 10-5 mhos per atmosshyphere Thus it is possible to convert the conductances presented in figure 6 for the soil extract at the saturation percentage to osshymotic pressures of the soil solution at various percentages within the field-moisture range
TABLE 3-Specific conductance and osmotic pressure of soil solutions
I Horizon HO I K X 10 I08moc- ~c~all~d I Osmot~rI(~= ctcd u~--Treatment (in thirds) as Ill 25deg( press at 12 pcr- ---[~---I~---I----
exlracted cenl HO 0 pcrrent I 12lwrrrnl 1)Irnl IS prcentI---------1---1 Almoshy i---l~l~ lmos- ~ 1 rercful 1 1JhlNJI I 1 pnerrs ~ lJu~reamp t pl(rt Ihcnl
OL-H I Tppcr 1002 211 07S 187 092 lOGO 055 Il 41i Lowcr 1117 736 237 685 2 94 221 1 170 I 1 47
(t1-H Tppcr lLl5l 507 L71 472 u21 I 50 l27 106 (Lower 10S8 I 4250 1846 I 3910 223 1 16 7 13 4 11 2
Cl-H tppcr 105S 8090 3628 7130 427 j 320 1 256 214 Lower 1087 (iOIO 2714 (1250 328 246 i 197 164
1 1 fL-fl lppcr 11631 235 165 228 1 213 160 I 281 107
tLoIIcr 1253 12301 447 121l0i 0221 467[ 374 311
f1 L-H lppcr I 1264 821 I 2 55 8G5 3 58 269 215 1 9 Lower I 1253 2960 11 42 3OIO 159 11l5 Y 55 725
The values for osmotic pressure given in table 3 include in addition to those for the actual solution from the pressure-memshybrane apparatus those calculated for the soil solution if the soil moisture had been at 9 12 15 or 18 percent Even at a high moisture content the osmotic pressure of the soil solution in the presence of 04 pFrcent NaCI would have been prohibitive to growth of most piants It is certain that the guayule in cultures CIL-H did not make the little growth they did in substrates havshying an osmotic pressure of the substrate of more than 20 atmosshypheres These cultures undoubtedly had a relatively low salt concentration in the surface horizon during the early part of the season This is indicated by data of Ayers and others (1) obshytained under comparable experimental conditions After the shift in soil-moisture regime these plants made little growth and conshysequently required little water This extended period without irrigation during the latter part of the experiment permitted the salt to migrate to the surface horizon owing to evaporation from the soil surface
For each respective increment in salt addition NaCI resulted in much higher values for the osmotic pressure of the soil solushytion than did NaSO
18 TECHNICAL BULLETIN 925 U S DEPT OF AGRICULTURE
IONIC CO~II)OSITION 0(1 SOIL EXTIlACTS A~D SOIL SOLUTIO~S
The type of data presented in figure 5 and table 3 suggested the advisability of determining the ionic composition of certain of the soil extracts and solutions Data for the ionic composition of the saturated soil extract for each horizon of soil for one repli shycate of the L-H series are given in table 4 The relationships involved are partially shown in figure 8 The striking featnre of
r-------------r-------~--
UPPER HORIZON LOWER HORIZON C
I NaGI
I NaGI
I
a w I shy
200 c w a VI I shy UJ J
gt
I I
l No
I
No Q bull
I
1$04
5 o w
I J I I
~ 100 I
I
P
Co + -- - +---~
~ _- 0-- _~~4~~~~=d~ ----=-=-0-=~J-Sf--4 I ------bullbull -------- i 1 4C 4~J ~ t$
FICURE 8-Composition of the extract of saturated soil from the upper and lower horizons in the soil containers
these data is the very high values found for soluble calcium and magnesium in the cultures receiving NaCl as compared with those receiving Na2 SO With reference to culture C I L-H the soluble calcium greatly exceeded the quantity added in the tap water indicating that most of this calcium was either displaced from the exchange complex or derived from the CaC03 present m the original soil The comparatively low values for Ca in the sulfate cultures is due to the low solubility of CaSO Ihat is the sulfate ion is present in excess in the sulfate cultures and the solubility of Ca will be largely determined by the solubility prodshyuct and ionic strength phenomena (24)
The ionic composition of the soil solutions adjusted to a 12shypercent soil moisture is shown in table 5 Also respective calcushylated values derived from the ionic composition of the saturated soil extract are given in table 4 In making this adjustment simshyple concentration of the COmponents was assumed It is obvious Ihat some of the calculated values for calcium would be imposshysible in the presence of the designated quantity of sulfate
bull
bull
bull
19
bull
bull
bull
GROWTH AND RUBBER ACCUMULATION IN GUAYULE
Within the cultures receiving added NaCl the concentration of sodium in the soil solution was only a fraction of the concenshytration of chloride even though these two ions were added in equivalent quantities This means that a considerable proportion ot the added sodium displaced the calcium and magnesium fron the exchange complex bringing about the relatively high conshycpntrations of the latter two ions in the solf solution
TARLE 4~ Analyses of saturated soil extracts [E~ p tn t(flUv-lltnt INr lniltIUlJAt 32 IWrftlll mulurfl
---- shy
Trr at Ilu~tm Tutal TotlDrum 0 Cn 1~ (1 IWOlIIn t)iMI tatlOU HUons __~___ _~T __ ~_~ -~~~- ~+---- _ _ ~ ___ __~----~----lt____ _____~ lt-
E 11 til E ji rn~ E p 111 E Jl 11l E I TIl E p trI E p m I~ J1 m E (I mrpPf 4 14 0 SS 4 O~ a tiS 2 19 a II ot 1 21
51 l01 II [~~~~r I~ ~3 2 ~~ f ~ ~J In 19 ~ lfJ 0 n ~n J~ ~
rpPr 610 oi 11 1 I 25 3111 58 (I II ~11JdI~ Iti G 2 26 a~g 47 1 257
LOI(( 94 7 14 5 49 9 149 1 bli
4 15 46 2 fi 3 21 J 97 707 llS - 86 77 liS 3 S3 1 75 123
22 64 so I 94 184 184
[]lI I(i 153 181 201 4 13 1 3 315 i 297 CLI ~lIudl~ aR 1 Ii 82 104 WI 185 2 1 169 IG5
Low 122 24 3 104 238 1 li3 2 11 250 242
rJl~r 321 52 4 90 1 90 2 39 398 S fl3 827 3 2 41 32 4 4 39 7 3G4 50 S 4i 9 81-111 t~~~~ ~~ 5 520 SO 13 4 862 i 514 112 105
rlJ~ 5 00 29 I 9 69 1 93 9 421 3 82 15 I 152 1020 I-JI ~ddl 264 378 754 3 84 100 t 102
100 255 553 lal ltlf 1~~ 1I 82 ~ 162 156
1 59 54 S 207 69j 3 gq i 14 51 6 i5 9 98 Ii 14 16 U (IS 182 l 8 I SO 21)7 193
S 87 ~22 103 209 5 Oi 2 25 225
Origlnll1oil bull bull bull bull 3 S2 i4 AI 2 fj(j 26 4 $2 4 07
It is to be noted that the concentration of chloride in the soll solution is consistently higher than that calculated from the conshycentration in the extract of the saturated soil Eaton and Sr)koloff (7) and Reitemeier r1 (jJ have previously observed this phenomeshynon It has been explained that the initial layers of water abOllt the colloidal particles are held by a relatively high force The vater thus bound undergoes a reduction in solvent power (5) causing a relative increase in the solute concentration of the 1111shybound water Obviously the lower the moisture content of the soil at which the soil solution is removed the greater the proshyportion of water that js bound and the greater the modification of this effect on concentration of solute Reitemeier rlM suggests that negative adsorption of monovalent anions may be involved in this phenomenon
Comparable data on the quantities of salt actually added to various drums of soil inclusive of that added by the irrigation water and on the quantities found in the extract of the saturated soil at the end of the experiment are given in table 6 It is obshyvious that the irrigation water added considerably more salt to the soil of the OL-H treatment than could be found in the soil
20 TECHNICAL BULLETIN 925 U S DEPT OF AGRICULTURE
solutions at the end of the experiment Disappearance of the HCOa could be accounted for on the basis of CO evolution 01 CaC03 precipitation The precipitation would also account for the disappearance of the calcium There is undoubtedly a modshyerate degree of error in the comparative figures which accounts [or the discrepancy in the values for chloride and sulfate The large difference in the quantity of sodium added in the irrigashytion water and that found in the soil extract is the most remarkshyable characteristic of the data in this table not cnly for the OL-H series but for all the salt treatments
TABLE 5-Comparison between the ionic composition of soil solutions and of saturated soil ex~racts both calculated to 12 percent soil moisture
1Trent I lIo~izon I I- I 1 -r~~-~~-I Drum 01 mOllt (In ISolulloll (n ~Ig No CI SO II( 0 cationa noi
thuds) --i--------middot---middot----I---middot---i-----I---I It b p m b p m E p m E p m E p m b p In f p m E p m
I i Soil soill II 20 I 1i0 1110 10 2 2 06 2 48 21 0 I 14 i rl)por Stllbull( 110 235 128 81 584 j 800 i 261 220I
51 OL-II I I i I i Lower Roil soln 50 2 7 71 I 21 3 48 0 212 3 10 70 2 73 3I 811nOXImiddot 512 I 78middot1 240 386 139 507 83 0 7i 6
iiSoil soln 20 7 2 ~5 21 7 30 8 716 2 28 45 3 40 2 Tllllcr lSnlllbullbullxt Ii 3 l 205 297 247 052 i 843 t ~II 0 426
s (TIILower Soil soln 1I 333
I541 115 404 6 33 1 2 i2
502 50a
i Sntll eXIj252 38 6 133 3US 9 28 I 4 43 424 412
Soil soln 30n I 55 I 420 838 t 3 GO i t 76 883 843I I lwerSatllbullbullt t 300 48 8 402 ii5 III 0 4 61 846 i91
44 IlL-if Low Soil soln i 404 584 240 702 I 55 2 211 702 706
Satn ~Xl 324 640 2i7 615 I 4 08 5 63 GnS 645
I iSoil soln 938 J58 103 126 4 46 204 21 3 19 1 I 11 rppor ~Halneximiddot1 S 561 la9 13 I 5 Oi I 637 100 23 0 220
I ~ Low~r Soil soln 2S0 G 27 117 51 4 884 S 14 151 148
Stll ext iO 7 J39 213 15 7j 230 13 i 298 2i9
ojl soln 25 0 j 3 21 i ill 10 0 I i2 5 I 90 99 3 86 4 rplr (n ~xt 67 I 4 24 146 5 52 IS6 10 6 217 202
os SL-ll Low(r ~Ii1S(iln 222 16 I 3i7 ao 0 308 971 415 354
~utn~ (d 70 5 236 592 27 4 557 13 5 GS 598
The explanation of this large disappearance of added sodium may be partly found in the phenomenon of exchange equilibrium The Gapon equation (9 14) has been found applicable to the equishylibrium between the ratio of sodium and calcium ions in the soil solution and the ratio of these cations on the exchange complex Thus
ICa+++ Mg++ J NaX _-_ ---X---=K
fNa+1 CaX
where [Ca+-+- +Mg++] and [Na+] are the millimolar concenshytrations of these ions in the soil solution and NaX and CaX repshyresent the milliequivalents of these cations adsorbed per 100 gm of dry soil In the sample of Panache loam studied the equilibshyrium constant (K) was found to be 0015 Using the previously mentioned base exchange capacity of this soil 161 me per 100 gm it was possible to calculate the average quantity of exchangeshy
bull
bull
bull
bullbull
bull
bull
GROWTH AND RUBBER ACCUMULATION IN GUAYULE 21
able sodium on the complex for each horizon of these seven salt treatments by the following rearrangement of the equation above toshy
0015 161 NaX=~
-=----=-=-shyICamiddot + MgH 1+ 0015 Na
The average percentage of sodium on the exchange complex for each drum of soil was also calculated There were 7300 me of exchange capacity to each 100 pounds of soil in a container and the original soil was found to have 05 percent exchangeable soshydium The comparison between the quantities of sodium calcushylated to have gone into the exchange complex on the basis of the Gapon equation and the difference between the quantity of soshydium added and that found in the soil extract are shown in table 7 Considering the limitations of the methodology the agleement IS remarkably close This is especially true if one considers that the presence of gypsum and calcium carbonate in a soil have an undetermined effect upon the equilibrium relationship as exshypressed by the Gapon equation r
TABLE 6 Quantities of [arious lOlls added to a drum of soil as compared with quantities foulld in the soil solulion
~--- ~-~ -en M~ Xa Ilro
~ yen- --- ~ ~Tnmiddotnttueut ----~----- ---I
Addd I FOtllI Addd Found IIded I Found Added 1 Found J--- ------------------ shybull11 r~ bull11 r i 1( J I t II r 11 r 11 t II tOL~ II 343 131 GO bullbull 432 101 533 36(L If - 5iO 1 48 85 1120 482 422 ~-shy(0111 185 900 32 165 li90 U06 286 271eImiddotJ 130 1420 25 240 3290 IS90 211 1
2~ I
lII 11 145 221 fiO ao litO 50 535 61SI II 2m 2711 52 48 2930 1040 460 amp51 II )-- 370 30 SI 5320 2180 I 266 02
C~ ~tJ Totll lIlHnJ Tothl uJons rriiJmut
1lt111lt1 Fuund IJI Fuuml Mmiddotd J~m1 ~ hltlmiddotd FUllllf -~ ~- - bullbull-- _~~~ u _
If II bull II IL bull ~
If 11 I lt If01 II 173 HJS Wi ~12 S3 2H MJ 2~n(1 If fd Jlh tt)1-1 1410 1140 1~50 lf~J1f1 Jl 1middot50 1 71t1 H ~(lOIl 1liO 2(11071
IYIO11 It 110 iWI 5~ 31bull L-I1t1 1550 a~50 UO()
n I ~I fit 4m 1t1 2~2fJ 10 2(10 - I Ii 14 If ~ S(l I 1~1 Ln I 1I~) 2~O I t21-1 11 1off f i Hi 1 f r j~ll ~middotau 51iJtl ~ Frl~n t1r hmiddotr ~uMt tlU Jlh~1( IIngUla1b uddl d li1h Url~ d flU (1r11 t Hf otttjrtu1 Nd
The data in tables 6 and 7 emphasize the modifications that took place in the soil complex as a result of the imposed treatshyments Three major modifications are ill evidence (1) Although sodium was the main cation added to the soil solution the soil solution or extract at equilibrium may be high in calcium (chloshyride series) (2) the total concentration of the soil solution or exshytractmay be much less than might be expeded on the basis of
~ Private communication from Milton Fireman of this Bureau
bullbull
22 TECHNICAL BULLETIN 925 U S DEPT OF AGRICULTURE
the quantity of soluble salt added (CaSO1 precipitation in SO eries) (3) the percentage of sodium on the exchange complex may become sufficiently high-I0 to 15 percent (21 )-to impose a detrimental effect on the soil structure
lAHLE 7--Relationship bewee disappearance of added sodium from lhe soil solution and increase in sodium on the exchange campex
------------ --~- --~ ~
Aw~(Sn IlIlrrnslill ) rliltrrllr b(w11 nddd ou (xrhulI~( r~rhlnglhlc S I IId fountl n 1tIblr III
rOlllpltmiddotxmiddot Iwr 100 PQunlls of soil Ixr 100 ltlIIds of sol-----_--__----shyIIlItluiraI IIIIItlIor-H 50 128 331
(I H 73~IIJ 7iS tCL I 1middot14 1050 1 884 (L-I 21J J 500 I 1400
fl~L1 140 j 000 i 1140 ~drll 21 3 1520 I 8901-11 14 3 24iO 3140
The modifications in the soil complex affected by the salt added cannot be ignored in the interpretation of the plant reshysponses Interpretation was further complicated however by variability in salt distribution within a drum of soil as illustrated by table 8 This table indicates what the concentration of chloshyride and sulfate would have been in the soil solution at the 12shypercent moisture value if all these added ions had remained in solution and had been uniformlv distributedmiddot within the soil solushytion of the different horizons The data in table 8 were derived from tables 4 and 5 Values not found in table 5 for the I2-percent moisture value were calculated with the aid of the relation beshytween comparable values determined at both 32- and the 12-pErshycent moisture values Table 8 shows that there would have b0en 165 e p m of chloride in the soil solution (C) if aU added chloshyride was uniformly distributed in the soil solution at 12-percent moisture It was observed in sand-culture studies that] 00 e p m of chloride were highly inhibitive to the growth of guayule (28)
Tn the present stUdy plants made very satisfactory qrowth in treatments receiving 01 percent Nael and 02 and 04 percent NaSO It is evident therefore that the relatively low cOI1Censhytrations of salt in thE) surface horizon (table 8) due to leaching or chemical reaction were highly important in permitting the good growth of guayule observed in these cultures The valuec for chloride round in the surface horizon of the CL-H and C(L-H treatments are undoubtedly abnormally high in view of the exshytent of growth observed especially in the series of plants conshytinuously on a low-tension soil-moisture regime That is these determinations were made after an appreciable interval following the final irrigation During this time salts would move back into the surface horizon that had been leached out at the time of irrishygation It appears that the average percentage of salt in the root 70ne of a plant may not be an adequate criterion on which to interpret plant response to a saline soil
bull
bull
bull
bull
bull
GROWTH AND RUBBER ACCUMULATION IN GUAYULE 23
lAnL~~ 8~ Distribution of the solllble chloride cwd sulfate among thrce
horizons
rPIHr HmJ ~1lulp Ilanl LOIIIf tir1
TJltn~n (J ~()t____ 7 (I ~OI ( IO- shy
dlkd Found lIltled 1 Found 1(I(lrd 1 luI Ild-l Foud 1ldJ 101111lt1 1ld1 Pmml ~-~ -- - - l --=----- _1 II II lt II r II ( II f 11 It 11 II It r II 01 11 102 2ti 200 31 14 0 21i IJ 2 It 4S (I 2ij 2J
II 11 105 10 S 21 16 tn 156 21 120 lIi5 4n4 21ltJ II 291 2Jl 14 5 40 2U7 1 1middot1 ij 2Uj 500 14 1I u(II 1 57j 83S 10 3 66 573 475 10 2 0 ijja 702 lU 1 Sa
C]middotI 11 1211 ~56 -I 46 31 23 2liu 42 0 31 5t 4 21lj 88 -I1IH 2 II 0 shy484 130 27 27 4~-I 120 1 43 0 484 IBOI H IIi HlO IJ2 7 Ii 16 l 24 ni2 210 Iti 3u 0 932 30S
t From hp Jtrr1 I htllh pI H l~tltt ill~ n HII 5lIt lhrd ullntr4llt fll ~ltuJtll ~jl bull
I)I~Cl ~~I()
The foregoing data emphasize the inadequacy of evaluating plant response entirely on the basis of the quantities of a conshystituent added to a soil as compared with a consideration of the resultant status of the soil complex and soil solution following the incorporation of the added constituent This is particularly the case in stUdies involving experimentally induced soil salinity On addition of a salt that changes both the quantitative and qualitative content of dissolved cations in the soil solution the equilibrium distribution of the adsorbed ions and those in the soil solution will be shifted Thus the status of the whole soil in the various treatments of this experiment was something quite different from what might be expected from merely c1issolvin[ a specified quantity of a given salt in a volume of vater equivashylent to that preent in the designated mass of soil
That it would be fallacious to interpret the observed plant responses as being conditioned by a given percentage of salt in lhe soil mass is obvious from the fore~oing This deficiency is not peculiar to this experiment however since virtual1y all studies of plant tolerance to soil salinity are similarly handicapped Salt distribution in an irrigated saline soil is always exceedshyingly gtariable since vater cannot move into and through a sui without transporting the solutes Consequent to this phenomeshynon a sample taken in a saline soil might prove quite meaninQshyless as to indicating the soil salinity in the absorbing zone of the loots Even though the sample were taken in what is normal1y regarded as the absorbing zone of thE) roots it is quite possible that a pocket of soil c1irectly below the irrigation furrow oLIle be much lower in salt and would therefore be the region of water absorption Thus the average stress upon the plant may nnt nead approach what would be indicated by the average salt content of the soil in the absorbing root zone because of the fact
24 TECHNICAL BULLETIN 925 U S DEPT OF AGRICULTURE
thatmiddot water is primarily absorbed in regions of minimum salt content (6 13)
In order to evaluate the soil-moisture stress upon the plants bull grown under the various degrees of salinity in these experiments an involved mathematiclill method was developed to arrive at the rate of change in soil-moisture stress over the absorbing zone of the roots during an irrigation interval (26) The method permitshyted taking into account variations in salt content with depth in the container of soil Integration of the relation between moisshyture stress and time permitted an evaluation of the average moisshyture stress upon the roots during an irrigation Interval The distribution of salt in a container was derived from the dllta in figure 5 These data converted to osmotic-pressure values of the soil solution by means of the relationships in figure 7 are given in table 9 The average rates of change in moisture content per container of soil with time during an irrigation interval are shown in figures 9 to 12 The values for moisture content shown are those observed during the month of August The corresponding rates of change in soil-moisture stress with time for the 14 exshyperip1ental conditions also are shown in figures 9 to 12
1ABLE 9-Calculated osmotic pressure of the soll solution at 12 percellt moisture
bull (I 13 2 ~~14 (II 160 111
186 ~d 189 ~II
jl 0 218
The typical rangfS in moisture content and moisture stress observed in the high and the low moisture-tension regimes of the O-salt treatments are shown in figure 9 A It is possible that the relatively small stress developed even in the OL treatment was effective in inhibiting growth of guayule From figure 1 it may be seen that depleting the soil moisture to 14 percent would not have brought about much more than half an atmosphere of tenmiddot sion Table 9 shows that appreciable quantities of salines had accumulated in the O-salt cultures from the irrigation water that is a major part of the moisture stress shown in figure 9 A was d~e to osmotic pressure On the basis of sand-culture studies (28) this osmotic pressure may have been sufficiently high to inhibit growth of guayule bull
Plants grown under the OR treatment developed a high stress-20 atmospheres-before being irrigated Yet these plants at no time showed evidence of wilting The tension on the soH moisture at the permanent-wilting percentage as determined by sunflower plants has been found to vary from 10 to 25 atmosshy
-- ------
25
bull GROWTH AND RUBBER ACCUMULATION IN GUAYULE
pheres (4 25) A xeromorphic species like guayule may stand even
bull higher tension values before showing evidence of wilting The fact remains however that guayule made considerably poorer
20~----------------------------------~-------------
18 bullbull ~-- IMOISTURE
16 shy
14
12
10
8
U1 o Z l
0 o U1
ubull o ~
o
14 shy
10
8
bull o
CONTENT
---
-shy
MOISTURE
STRESS-
MOISTUHE
SOIL MOISTURE REGIME
----- LOW TENSION ---- HIGH TENSION
_
SOIL MOISTURE REGIME
---- LOW TENSION
---- HIGH TENSION
3 4 5 G 7
TIME (QAYSI
20
18
16
14
12
10
8
6 If)
lJJ 4n
lJJ J
2 ii 0 z
0 ltt
24 If) If)
22 ~ I-If)
20 lJJ cr l
18 n 0
16
14
12
10
8
G
4
2
0
FlGURE 9-Rate of change in moisture content and moisture stress during an irrigation interval within (A) the control (O-salt) cultures and (E) cultures containing 01 percent NaC
bull
26 TECHNICAL BULLETIN 925 U S DEPT OF AGRICULTURE
growth on the OH than on the OL treatment It is evident that the high diffusion-pressure deficit developed in the soil moisture during the last day of the irrigation interval of the OH series would effect an increase in diffusion-prEssure deficit within the tissue fluids of the plant The development of such a stress would definitely inhibit growth processes (27)
lhe average ranges in moisture content and moIsture stress of the cultures containing 01 percent NaCl are shown in figure 9 B The maximum stress developed in the elL cultures was more than double that shown for OL treatment even though the difference in growth response of the respective plants WRS not large The maximum stress developed in the C1H cultures was only slightly greater than that shown for the OH treatment yet the plants were only about half as large as those on soil to which no salt was added A comparison of the stress-time curves for these two treatments shows that whereas this relationship is pronouncedly exponential in the OH cultures (fig 9 A) it is nearly linear under the conditions of the c1 H treatment (fig 9 B) This means that over an irrigation interval the C1H plants were subjected to a stress of more than 10 atmospheres during half the time in comparison to being subjected to such a stress for only a few hours as found for the OH cultures
The changes in moisture content and moisture stress in soil cultures containing 02 and 04 percent NaCl respectively are shown ill figure 10 The curves for stress-time in the high moisshyture-tension regime are definitely convex upward in marked contrast to the shape of the stress-time curve found for the OH treatment in figure 9 A
This change in shape of the stress-time curves with increasshying salt content of the substrate is considered to be of fundashymental importance in the explanation of plant response to saline soils Evidence indicates that a plant undergoes changes in its physiological status as the soil-moisture supply approaches the wilting percentage (101129) The rate at which internal changes may take place with respect to rate of change of external stress will condition the characteristics of the plant response For exshyample owing to the hyperbolic nature of the moisture-sorption curve (fig 1) the rate of change in external stress in a nOl1saline soil may be so rapid just above the wnting percentage that physiological adjustments within the plant could hardly be exshypected to keep pace Hence the plant may develop the symptoms of wilting very suddenly In a saline soil it is evident from figure 10 that the rate of change in external stress may be low Under such conditions the plant may be subject to a total soil-moisture stress that is equal to or in excess of the moisture tension at the wilting percentage for weeks at a time without the plant showshying symptoms of wilting Recent unpublished observations at this laboratory have confirmed this Plants exposed to such conshyditions make practically no growth the lower leaves abscise but the conventional symptoms of wilting may not appear
This interpretation of the importance of the rate of change in moisture stress just above the wilting percentage upon the
bull
bull
bull
----------
-------
27
20 bull
bull
bull
GROWTH AND RUBBER ACCUMULATION IN GUAYULE
r---------------------------------------------~------_22
18-MOISTURE ~CONTENT
16 16 14 --c
14
12 ---- 12 --shy
---shy10 10
8 8
SOIL MOISTURE REGIME
1 MOISTURE ----- LOW TENSION 6
11 STRESS HIGH--- TENSION c 4 11
A us
5 c e 2~a
0-III
0 J L-----~2----~----~----~~----LO-----L----~4----~16----~80~00 III TIME (DAYS) i lgtshye r-----------------------------------------------------~2611l
w ~ 4 a a w Q
---shyi 20 20 -MOISTURE 3 8 18
16 ~~~T
16 -- 14 - shy 14
12 -----shy
--------- 12
10
10
8 I SOIL MOISTURE REGIME 8
----- LOW TENSION MOISTURE 6--- HIGH TENSION1 STRESS
4
TIME (DAYS)
FIGURE 10-Rate of change in moisture content and moisture stress during an irrigation interval within cultures containing (A) 02 percent NaCl and (B) 04 percent NaCl
expression of symptoms of wilting by the plant is undoubtedly related to the very wide range in the energy values of the soil moisture at the wilting percentage found by Richards and Weaver (19) for soil samples on which wilting-range determinations have been made by Furl and Repve (8)
Figure 11 shows the rate of change in moisture content and moisture stress for the sulfate series of plants at both the low and
----
---
28 TECHNICAL BULLEnN 925 U S DEPT OF AGRICULTURE
20~---------------------------------------------------20
Ie 16 bull
~ MOISTURE 16 ~ CONTENT 16
~~ -
12 _--r__ __
10
~ 6 SOIL MOISTURE REGIME
4--- LOW TENSION --------~OISTURE ---- HIGH TENSIONA -shy
~- STRESS
OL-__~__-L__-L__~___L-__~__-L~ o
20~---------------------------------------------------20
_16 16 en
IJ)o 16 wzl6 a
wo a _14 t4 ~
o
bulloJ
012 12 ~ IJ) lt
gIO
t-
a middotW a OIL MOISTURE REGIME a --- LOW TENSIONw
----- HIGH TENSION~ P
B MOISTURE -STRESS
~__~__-L__-L__~___L-__~__-L~O
~__________________________________________________-20
16 IS
16 16
14 14----
~
12 - ~ 12
10 ---shy 10
MOISTURE shy6 STRESS~h
SOIL MOISTURE REGIME 6 uu --- lOW TENSION
---- HIGH TENSION 4
2
o o 2 7 bull
FIGURE ll--Rate of change in moisture content and moisture stress during an irrigation interval within cultures containing (A) 02 percent Na2S0 (B) 04 percent Na2S04 and (C) 08 percent Na2S04
29 GROWTH AND RUBBER ACCUltIULATION IN GUAYULE
bull high moisture-tension regimes Owing to the previously menshytioned chemical changes that took place in the soil to which Na2S0 was added the shapes of the stress-time curves differ somewhat from those curves derived for treatments receiving comparable quantities of NaCl Thus the time-stress curve for
Sl L
00 asLOLe
ltJgt Ilt lt CLc CI
gt- Joo S2 H z
OH oC 2 Llt c J SH
Sal ~ I- zoe c
c
W ~ I
z
bull 2 lO CI ~middot~l
_1 C4H~ c
7
S~i1-
6 z 0 w Cll S4Hu c w c -~ Sa Hc w
0
al CHgt c
4
oOl deg C2HSaL
3 B
I I 0 2 4 6 e 10 12 14 16 16
4VERAGE MOISTURE STRESS (ATMOSPHERES)
FIGURE 12-Relation between tne average moisture stress of the irrigashytion interval and (A) the growth of the plants and (B) the percentage of rubber in the millable bush
bull tbe S2H cultures (fig 11 A) was more similar to the curve deshyrived for the OH treatment (fig 9 A) than for the C1H cultures (fig 9 B) This of course is consistent with the observation that growth response on the S2H cultures was even slightly superior to that produced by the OH treatment and just about double the growth response observed under the C1H conditions On the
30 TECHNICAL BULLETIN 925 U S DEPT OF AGRICULTURE
other hand the trend of the stress-time curve for the SsH cultures (fig 11 C) is quite similar to that observed ll1del the CJH conshyditions and the growth response of the guayule under these two conditions is almost identical (table 1)
It is possible to integrate the areas under the stress-time curves given in figures 9 to 11 and arrive at d18 average inte- grated moisture stress for an irrigation interval by dividing by the duration in days of the irrigation interval fu) The average green weights of plants (tops) per treatment are plotted against the corresponding values for the average integrated moisture strepounds in figure 12 A This relatively close relationship between average moisture stress and growth of guayule corroborates the findings of Wadleigh and Ayers (27) pertaining Lgt a similar study in beans It is further evidence that water availabiJity to plants is conditioned largely by the total specific free energy of the soil moisture rather than by the status of one or mon~ separate factors that affect the total free energy The limitations of the method by which the average moisture stresses were calculated have been discussed by Wadleigh (26) In view of these limitashytions the closeness of the relationship observed in figure 12 11 is considered noteworthy as an endorsement of this method of apshyproach to the water relations of plants growing in saline soils
The observations on percentage of rubber in the millable bush are plotted against the respective observations for average soilshymoisture stress in figure 12 B That the observation for treatshyment SsL is completely out of line with the others is obvious It was mentioned with reference to figure 3 A that the percentage of rubber in the millable bush of treatment SsL was unexplainshyably anomalous and may represent an analytical error The writers believe that the lack of coherence of this point with tbe others does not seriously detract from the validity of the general trend shown in figure 12 B
It is evident that at the lower levels of moisture stress the percentage of rubber in the millable bush increased markedly with increase in stress For example the percentage of rubber in the OH plants was nearly double that of the OL plants This is in line with the observations of Kellev and associates (] 2) that an increase in moisture stress increased the rubber content of guayule In their work however increased moisture stress was induced largely by an increase in moisture tension since they were working with a nons aline soil That is treatments OL and OR of this report approximate the range of moisture stressmiddot covshyered in the studies of Kelley and others (12)
It is evident from figure 12 B that rubber percentage is inshycreased at the lower ranges of moisture stress whether the stress is induced by moisture tension or by osmotic forces in the soil solution It is especially pertinent to emphasize that the results of this experiment as presented in figure 12 B show that if the moisture stress becomes really high owing to a combination of both high soil-moisture tension and appreciable quantities of solutes in the soil solution the trend of the relation between rubshyber percentage and moisture stress is reversed These resuHs
bull
bull
bull
31
bull
bull
bull
GROWTH AND RUBBER ACCUlULATION IN GUAYULE
suggest that the positive relationship between rubber percentage and moisture stress as reported by Kelly and others f 12) is incomplete inasmuch as it appears to hold for only the lower range of average moisture stresses
The writars beliee it is physiologically valid to expect a marked decrease in rubber percentage at really high leels of moisture stress Obviously rubber is a derhative of the primary photosynthate of the plant
High moiture stresses have been found to influence the acshycumulation of photosynthate in other species 12fJ 3- Furthershymore it was iJbserved that when guayule plants were subjected to the higher levels of moisture stress studied the lower Jeaes of the plants died at an abnormally higher rate This condition cut down on the photosynthetic surface of the plants It would logically follow that conditions inhibiting the accumulation of primary photosynthetic reserves vould also inhibit the quantity of rubber synthesized
Sl AH
Guayule plants were grown in large containers holding 100 pounds of a Panache loam in various cultures of which the salt content was established at 0 01 02 and 04 percent NaCI and at 02 04 and 08 percent Na2S0j
Three different conditions of the soil-moisture regime were superimposed on each of the seven different salt levels
1 Irrigated when only about 50 percent of the available water had been removed lavailable water being taken as that present in the soil between the limits of the field capacity and the wilting percentage)
2 Irrigated when nearly all of the available water had been removed 3 Irrigated according to schedule (1) duing the first half of the
experimental period and according to schedule (2) during the latter half
Each salt-moisture level was thrice replicated Nursery-grown plants middotere transplanted to the soil containshy
ers on February 3 and hanested on December 1 1943 Growth of the plants was inhibited by increased degree of
depletion of the available soil moisture prior to irrigation Increasingly larger quantities of NaCI in the soil were associshy
ated with a progressively greater decrease in plant growth within each soU-moisture regime Additions of NaSO were not associshyated with significant decreases in growth response unless in excess of 04 percent
At low soil-moisture tension the presence of salt in the soil tended to be associated with an increase in percentage of rubber in the mil1able bush With moisture regimes involving high tenshysion increasing soil salinity was associated with marked deshycreases in rubber percentage
In general there was a marked decrease in yield of rubber per plant with increasing salinity and increased moisture tension the main exception being an increase in rubber with the presence of a small quantity of salt at low moisture tension
Increasing soil salinity was associated with an increase in the quantity of irrigation water required to produce a given weight
32 TECHNICAL BULLETIN 925 U S DEPT OF AGRICULTURE
of millable bush Likewise on an average an increase in salinity necessitated a marked increase in the quantity of irrigation water per gram of rubber produced
Surface irrigation of the soil containers caused a marked downward movement of the added salt
Within a given irrigation regime vegetative growth of the plants was closely associated with the specific conductance of the extract of the saturated soil from the surface horizon (upper 5 inches)
Analyses of the extracts of the saturated soils and of the displaced soil solutions showed that interactive effects had taken place between added solutes and the original soil components Addition of NaCl to this Panoche loam resulted in a displacement of some of the calcium from the exchange complex by sodium with the result that calcium made up as much as 50 percent of the cations in the soil solution Addition of Na2S01 to this soil also resulted in the displacement of calcium by sodium in the exchange complex and as a result solid phase CaSO1 of low solubility was formed This chemical reaction caused a lower concentration of the sail solution than would be expected on the basis of the quantity of salt added
A close relation was noted between the specific conductance of the extract of the saturated soil (32 percent H 2 0) and that of the displaced soil solution obtained at 12 percent moisture Owing to the effect of additional solid phase CaSO coming into solution with dilution the above relationship for the Na2S0I-treated son differed from that of the soil receiving NaCl A close relation existed between the specific conductance of the displaced soil solution and the osmotic pressure of this solution
The rate of change in the total soil-moisture stress (sum of moisture tension plus osmotic pressure of the soil solution) was determined for representative irrigation intervals for the various treatments It wasmiddot found that the shape of the derived stress-time curves differed markedly depending on the degree of salinity of the soil and the specific shapes of the different curves bore a definite relation to the nature of plant response in the nonsaline and saline soils
The average moisture stress during an irrigation interval was determined It was found that growth inhibition of guayule was closely related to the total moisture stress regardless of whether this stress was due predominately to moisture tension or to osmotic pressure of the soil solution
The percentage of rubber in the millable bush was found to be closely related to the average moisture stress ever an irrigashytion interval This relationship was found to be mal~kecny positive over the lower ranges of moisture stress It was immaterial to rubber accumulation whether this moisture stress was induced by tension or b~T osmotic pressure The curve for this relation however showed a decided maximum Average moisture stresses exceeding 6 atmospheres were progressively deleterious to rubshyber accumulation
bull
bull
bull
33 GROWTH AND RUBBER ACCUMULATION IN GUAYULE
bull LITERATURE CITED
(1) AYERS A D WADLEIGH C H and MAGISTAD O C 1943 THE INTERRELATIONSHIPS OF SALT CONCENTRATION AND SOIL
MOISTURE CONTENT WITH THE GROWTH OF BEANS Arner Soc Aglon Jour 35 796-810 illus
(2) BASSLAVSKAYA s S 1936 INFLUENCE OF THE CHLORIDE ION ON THE CONTENT OF CARBOshy
HYDBATES IN POTATO LEAVES Plant Physiol 11 863-871 illus
(3) --- and SYROESHKINA M 1936 INFLUENCE OF THE CHLORIDE ION ON THE CONTENT OF CHLOROPHYLL
IN THE LEAVES OF POTATOES Plant Physio 11 149-157 mus
(4) BODMAN G B and DAY P R 1943 FREEZING POINTS OF A GROUP OF CALIFORNIA SOILS AND THEIR
EXTRACTED CLAYS Soil Sci 55 225-246 mus
(5) BUEHRER T F and ROSE M S 1943 STUDIES IN SOIL STRUCTURE V BOUND WATER IN NORMAL AND
PUDDLED SOILS Ariz Agr Expt Sta Tech Bu 100 pp [154]-218 illus
(6) EATON F M 1941 WATER UPTAKE AND GROWTH AS INFLUENCEIJ BY INEQUALITIES
U THE CONCENTRATION OF THE SUBSTRATE Plant Physio 16 515-564 illus
(7) --- and SOKOLOFF V P
bull 1935 ABSORBED SODIUM IN SOILS AS AFFECTED BY THE SOIL-WATER
RATIO Soil Sci 40 237-247 (8) FURR J R and REEVE J O
1945 RANGE OF SOIL-MOISTURE PERCENTAGES THROUGH WHICH PLANTS UNDERGO PERMANENT WILTING IN SOME SOILS FROM SEMIARID IRRIGATED AREAS Jour Agr Res 71 149-170 mus
(9) GAPON E N 1933 ON THE THEORY OF EXCHANGE ADSOBPTION IN SOILS Jour Gen
Chern [U S S R] 3 144-163 illus
(10) HERRICK E M 1933 SEASONAL AND DIURNAL VARIATIONS IN THE OSMOTIC VALUES
AND SUCTION TENSION VALUES IN THE AERIAL PORTIONS OF AMBROSIA TRlFIDA Arner Jour Bot 20 18-34 illus
(11) HIBBARD R P and HARRINGTON O E bull 1916 THE DEPRESSION OF THE FREEZING POINT IN TRITURATED PLANT
TISSUES AND THE MAGNITUDE OF ITS DEPRESSION AS RELATED TO SOIL MOISTURE Physio Res 1 441-454
(12) KELLEY O J HUNTER A S and HOBBS C H 1945 THE EFFECT OF MOISTURE STRESS ON NURSERY-GROWN GUAYULE
WITH RESPECT TO THE AMOUNT AND TYPE OF GROWTH AND GBOWTH BESPONSE ON TRANSPLANTING Arner Soc Agron Jour 37 194-216 mus
(13) LONG E M 1943 THE EFFECT OF SALT ADDITIONS TO THE SUBSTRATE ON INTAKE OF
WATER AND NUTRIENTD BY ROOTS OF APPROACH GRAFTED TOMATO PLANTS Arner Jour Bot 30 594-601
(14) MAGISTAD O C FIREMAN M and MABRY B
bull 1944 COMPARISON OF BASE-EXCHANGE EQUATIONS FOUNDED ON THE LAW
OF MASS ACTION Soil Sci 57 371-379 (15) REITEMEIER R F
1943 SEMIMICROANALYSIS OF SALINE SOIL SOLUTIONS Indus and Engin Chern Analyt Ed 15 393-402 illus
(16) 1946 EFFECT OF MOISTURE CONTENT ON THE DISSOLVED AND EXCHANGEshy
ABLE IONS OF SOILS OF ARID BEGIONS Soil Sci 61 195-214 illus
34 TECHNICAL BULLETIN 925 U S DEPT OF AGRICULTURE
(17) REITEMEIER R F and RICHARDS L A 1944 RELIABILITY OF THE PRESSURE-MEMBRANE METHOD FOR EXTRACshy
TION OF SOIL SOLUTION Soil Sci 57 119-135 illus (18) RICHARDS L A bull
1941 A PRESSURE-MEMBRANE EXTRACTION APPARATUS FOR SOIL SOLUshyTION Soil Sci 51 377-386 illus
(19) --- and WEAVER L R 1944 MOISTURE RETENTION BY SOME IRRIGATED SOILS AS RELATED TO
SOIL-MOISTURE TENSION Jour Agr Res 69 215-235 illus (20) SCHNEIDER G W and CHILDERS N F
1941 INFLUENCE OF SOIL MOISTURE ON PHOTOSYNTHESIS RESPIRATION AND TRANSPIRATION OF APPLE LEAVES Plant Physio 16 565-583 illus
(21) SCOFIELD C S 1932 MEASURING THE SALINITY OF IRRIGATION WATEHS AND OF SOIL
SOLUTIONS WITH THE WHEATSTONE BRIDGE U S Dept Agr Cir 232 16 pp illus
(22) SHAW C F 1927 THE NORMAL MOISTURE CAPACITY OF SOILS Soil Sci 23
303-317 illus (23) SIGMOND E [SIGMOND A A J DE]
1938 THE PRINCIPLES OF SOIL SCIENCE 362 pp illus London (24) VANONI I E and CONRAD J P
1942 CALCIUM- AND SULFATE-ION CONCENTRATIONS IN A SOIL RECEIVshyING EXCESS GYPSUM AS INFLUENCED BY SEVERAL FACTORS Soil Sci 53 125-133
(25) VEIHMEYER F J and HENDRICKSON A H 1934 SOME PLANT AND SOIL-MOISTURE RELATIONS Amer Soil Survey
Assoc Bul 15 76-80 illus (26) WADLEIGH C H
1946 THE INTEGRATED SOIL MOiSTURE STRESS UPON A ROOT SYSTEM bullIN A LARGE CONTAINER OF SALINE SOIL Soil Sci 61 225-238 illus
(27) and AVERS A D 1945 GROWTH AND BIOCHEMICAL COMPOSITION OF BEAN PLANTS AS
CONDITIONED BY SOIL MOISTURE TENSION AND SALT CONCENshyTRATION Plant Physiol 20 106-132 ilIus
(28) and GAUCH H G 1944 THE INFLUENCE OF BlGH CONCENTRATIONS OF SODIUM SULFATE
SODIUM CHLORIDE CALCIUM CHLORIDE AND MAGNESIUM CHLOshyRIDE ON THE GROWTH OF GUAYULE IN SAND CULTURES Soil Sci 58399-403 illus
(29) GAUCH H G and DAVIES V 1943 THE TREND OF STARCH RESERVES IN BEAN PLANTS BEFORE AND
AFTER IRRIGATION OF A SALTNE SOIL Amer Soc Hort Sci Proc 43 201-209 ilIus
FOIsale by the SupelintCndent oC Documents U S Government Printing Office Washington 25 D C - Price IOc
bull u s GOVERNIENT PRINTING OFFICE 1946-700378
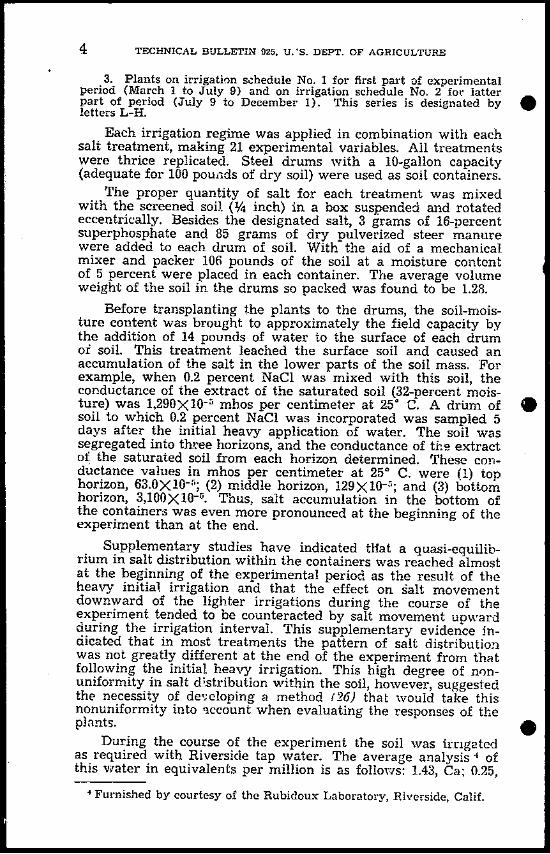

bull
bull
bull
GROWTH AND RUBBER ACCUMULATION IN GUAYULE 17
ships in figure 7 A present a rather satisfactory basis for conshyversion of the conductance made at the saturation percentage to conductance of the soil solution at 12 percent moisture which is within the field-moisture range The cryoscopically determined osmotic pressure of the soil solutions at 12 percent soil moisture and also the osmotic pressure of the soil solutions that might be exshypected at different soil-moisture percentages are shown in table 3 The relation between the conductance of the solution and its osshymotic pressure is shown in figure 7 B This regression was found by the method of least squares to be 255 X 10-5 mhos per atmosshyphere Thus it is possible to convert the conductances presented in figure 6 for the soil extract at the saturation percentage to osshymotic pressures of the soil solution at various percentages within the field-moisture range
TABLE 3-Specific conductance and osmotic pressure of soil solutions
I Horizon HO I K X 10 I08moc- ~c~all~d I Osmot~rI(~= ctcd u~--Treatment (in thirds) as Ill 25deg( press at 12 pcr- ---[~---I~---I----
exlracted cenl HO 0 pcrrent I 12lwrrrnl 1)Irnl IS prcentI---------1---1 Almoshy i---l~l~ lmos- ~ 1 rercful 1 1JhlNJI I 1 pnerrs ~ lJu~reamp t pl(rt Ihcnl
OL-H I Tppcr 1002 211 07S 187 092 lOGO 055 Il 41i Lowcr 1117 736 237 685 2 94 221 1 170 I 1 47
(t1-H Tppcr lLl5l 507 L71 472 u21 I 50 l27 106 (Lower 10S8 I 4250 1846 I 3910 223 1 16 7 13 4 11 2
Cl-H tppcr 105S 8090 3628 7130 427 j 320 1 256 214 Lower 1087 (iOIO 2714 (1250 328 246 i 197 164
1 1 fL-fl lppcr 11631 235 165 228 1 213 160 I 281 107
tLoIIcr 1253 12301 447 121l0i 0221 467[ 374 311
f1 L-H lppcr I 1264 821 I 2 55 8G5 3 58 269 215 1 9 Lower I 1253 2960 11 42 3OIO 159 11l5 Y 55 725
The values for osmotic pressure given in table 3 include in addition to those for the actual solution from the pressure-memshybrane apparatus those calculated for the soil solution if the soil moisture had been at 9 12 15 or 18 percent Even at a high moisture content the osmotic pressure of the soil solution in the presence of 04 pFrcent NaCI would have been prohibitive to growth of most piants It is certain that the guayule in cultures CIL-H did not make the little growth they did in substrates havshying an osmotic pressure of the substrate of more than 20 atmosshypheres These cultures undoubtedly had a relatively low salt concentration in the surface horizon during the early part of the season This is indicated by data of Ayers and others (1) obshytained under comparable experimental conditions After the shift in soil-moisture regime these plants made little growth and conshysequently required little water This extended period without irrigation during the latter part of the experiment permitted the salt to migrate to the surface horizon owing to evaporation from the soil surface
For each respective increment in salt addition NaCI resulted in much higher values for the osmotic pressure of the soil solushytion than did NaSO
18 TECHNICAL BULLETIN 925 U S DEPT OF AGRICULTURE
IONIC CO~II)OSITION 0(1 SOIL EXTIlACTS A~D SOIL SOLUTIO~S
The type of data presented in figure 5 and table 3 suggested the advisability of determining the ionic composition of certain of the soil extracts and solutions Data for the ionic composition of the saturated soil extract for each horizon of soil for one repli shycate of the L-H series are given in table 4 The relationships involved are partially shown in figure 8 The striking featnre of
r-------------r-------~--
UPPER HORIZON LOWER HORIZON C
I NaGI
I NaGI
I
a w I shy
200 c w a VI I shy UJ J
gt
I I
l No
I
No Q bull
I
1$04
5 o w
I J I I
~ 100 I
I
P
Co + -- - +---~
~ _- 0-- _~~4~~~~=d~ ----=-=-0-=~J-Sf--4 I ------bullbull -------- i 1 4C 4~J ~ t$
FICURE 8-Composition of the extract of saturated soil from the upper and lower horizons in the soil containers
these data is the very high values found for soluble calcium and magnesium in the cultures receiving NaCl as compared with those receiving Na2 SO With reference to culture C I L-H the soluble calcium greatly exceeded the quantity added in the tap water indicating that most of this calcium was either displaced from the exchange complex or derived from the CaC03 present m the original soil The comparatively low values for Ca in the sulfate cultures is due to the low solubility of CaSO Ihat is the sulfate ion is present in excess in the sulfate cultures and the solubility of Ca will be largely determined by the solubility prodshyuct and ionic strength phenomena (24)
The ionic composition of the soil solutions adjusted to a 12shypercent soil moisture is shown in table 5 Also respective calcushylated values derived from the ionic composition of the saturated soil extract are given in table 4 In making this adjustment simshyple concentration of the COmponents was assumed It is obvious Ihat some of the calculated values for calcium would be imposshysible in the presence of the designated quantity of sulfate
bull
bull
bull
19
bull
bull
bull
GROWTH AND RUBBER ACCUMULATION IN GUAYULE
Within the cultures receiving added NaCl the concentration of sodium in the soil solution was only a fraction of the concenshytration of chloride even though these two ions were added in equivalent quantities This means that a considerable proportion ot the added sodium displaced the calcium and magnesium fron the exchange complex bringing about the relatively high conshycpntrations of the latter two ions in the solf solution
TARLE 4~ Analyses of saturated soil extracts [E~ p tn t(flUv-lltnt INr lniltIUlJAt 32 IWrftlll mulurfl
---- shy
Trr at Ilu~tm Tutal TotlDrum 0 Cn 1~ (1 IWOlIIn t)iMI tatlOU HUons __~___ _~T __ ~_~ -~~~- ~+---- _ _ ~ ___ __~----~----lt____ _____~ lt-
E 11 til E ji rn~ E p 111 E Jl 11l E I TIl E p trI E p m I~ J1 m E (I mrpPf 4 14 0 SS 4 O~ a tiS 2 19 a II ot 1 21
51 l01 II [~~~~r I~ ~3 2 ~~ f ~ ~J In 19 ~ lfJ 0 n ~n J~ ~
rpPr 610 oi 11 1 I 25 3111 58 (I II ~11JdI~ Iti G 2 26 a~g 47 1 257
LOI(( 94 7 14 5 49 9 149 1 bli
4 15 46 2 fi 3 21 J 97 707 llS - 86 77 liS 3 S3 1 75 123
22 64 so I 94 184 184
[]lI I(i 153 181 201 4 13 1 3 315 i 297 CLI ~lIudl~ aR 1 Ii 82 104 WI 185 2 1 169 IG5
Low 122 24 3 104 238 1 li3 2 11 250 242
rJl~r 321 52 4 90 1 90 2 39 398 S fl3 827 3 2 41 32 4 4 39 7 3G4 50 S 4i 9 81-111 t~~~~ ~~ 5 520 SO 13 4 862 i 514 112 105
rlJ~ 5 00 29 I 9 69 1 93 9 421 3 82 15 I 152 1020 I-JI ~ddl 264 378 754 3 84 100 t 102
100 255 553 lal ltlf 1~~ 1I 82 ~ 162 156
1 59 54 S 207 69j 3 gq i 14 51 6 i5 9 98 Ii 14 16 U (IS 182 l 8 I SO 21)7 193
S 87 ~22 103 209 5 Oi 2 25 225
Origlnll1oil bull bull bull bull 3 S2 i4 AI 2 fj(j 26 4 $2 4 07
It is to be noted that the concentration of chloride in the soll solution is consistently higher than that calculated from the conshycentration in the extract of the saturated soil Eaton and Sr)koloff (7) and Reitemeier r1 (jJ have previously observed this phenomeshynon It has been explained that the initial layers of water abOllt the colloidal particles are held by a relatively high force The vater thus bound undergoes a reduction in solvent power (5) causing a relative increase in the solute concentration of the 1111shybound water Obviously the lower the moisture content of the soil at which the soil solution is removed the greater the proshyportion of water that js bound and the greater the modification of this effect on concentration of solute Reitemeier rlM suggests that negative adsorption of monovalent anions may be involved in this phenomenon
Comparable data on the quantities of salt actually added to various drums of soil inclusive of that added by the irrigation water and on the quantities found in the extract of the saturated soil at the end of the experiment are given in table 6 It is obshyvious that the irrigation water added considerably more salt to the soil of the OL-H treatment than could be found in the soil
20 TECHNICAL BULLETIN 925 U S DEPT OF AGRICULTURE
solutions at the end of the experiment Disappearance of the HCOa could be accounted for on the basis of CO evolution 01 CaC03 precipitation The precipitation would also account for the disappearance of the calcium There is undoubtedly a modshyerate degree of error in the comparative figures which accounts [or the discrepancy in the values for chloride and sulfate The large difference in the quantity of sodium added in the irrigashytion water and that found in the soil extract is the most remarkshyable characteristic of the data in this table not cnly for the OL-H series but for all the salt treatments
TABLE 5-Comparison between the ionic composition of soil solutions and of saturated soil ex~racts both calculated to 12 percent soil moisture
1Trent I lIo~izon I I- I 1 -r~~-~~-I Drum 01 mOllt (In ISolulloll (n ~Ig No CI SO II( 0 cationa noi
thuds) --i--------middot---middot----I---middot---i-----I---I It b p m b p m E p m E p m E p m b p In f p m E p m
I i Soil soill II 20 I 1i0 1110 10 2 2 06 2 48 21 0 I 14 i rl)por Stllbull( 110 235 128 81 584 j 800 i 261 220I
51 OL-II I I i I i Lower Roil soln 50 2 7 71 I 21 3 48 0 212 3 10 70 2 73 3I 811nOXImiddot 512 I 78middot1 240 386 139 507 83 0 7i 6
iiSoil soln 20 7 2 ~5 21 7 30 8 716 2 28 45 3 40 2 Tllllcr lSnlllbullbullxt Ii 3 l 205 297 247 052 i 843 t ~II 0 426
s (TIILower Soil soln 1I 333
I541 115 404 6 33 1 2 i2
502 50a
i Sntll eXIj252 38 6 133 3US 9 28 I 4 43 424 412
Soil soln 30n I 55 I 420 838 t 3 GO i t 76 883 843I I lwerSatllbullbullt t 300 48 8 402 ii5 III 0 4 61 846 i91
44 IlL-if Low Soil soln i 404 584 240 702 I 55 2 211 702 706
Satn ~Xl 324 640 2i7 615 I 4 08 5 63 GnS 645
I iSoil soln 938 J58 103 126 4 46 204 21 3 19 1 I 11 rppor ~Halneximiddot1 S 561 la9 13 I 5 Oi I 637 100 23 0 220
I ~ Low~r Soil soln 2S0 G 27 117 51 4 884 S 14 151 148
Stll ext iO 7 J39 213 15 7j 230 13 i 298 2i9
ojl soln 25 0 j 3 21 i ill 10 0 I i2 5 I 90 99 3 86 4 rplr (n ~xt 67 I 4 24 146 5 52 IS6 10 6 217 202
os SL-ll Low(r ~Ii1S(iln 222 16 I 3i7 ao 0 308 971 415 354
~utn~ (d 70 5 236 592 27 4 557 13 5 GS 598
The explanation of this large disappearance of added sodium may be partly found in the phenomenon of exchange equilibrium The Gapon equation (9 14) has been found applicable to the equishylibrium between the ratio of sodium and calcium ions in the soil solution and the ratio of these cations on the exchange complex Thus
ICa+++ Mg++ J NaX _-_ ---X---=K
fNa+1 CaX
where [Ca+-+- +Mg++] and [Na+] are the millimolar concenshytrations of these ions in the soil solution and NaX and CaX repshyresent the milliequivalents of these cations adsorbed per 100 gm of dry soil In the sample of Panache loam studied the equilibshyrium constant (K) was found to be 0015 Using the previously mentioned base exchange capacity of this soil 161 me per 100 gm it was possible to calculate the average quantity of exchangeshy
bull
bull
bull
bullbull
bull
bull
GROWTH AND RUBBER ACCUMULATION IN GUAYULE 21
able sodium on the complex for each horizon of these seven salt treatments by the following rearrangement of the equation above toshy
0015 161 NaX=~
-=----=-=-shyICamiddot + MgH 1+ 0015 Na
The average percentage of sodium on the exchange complex for each drum of soil was also calculated There were 7300 me of exchange capacity to each 100 pounds of soil in a container and the original soil was found to have 05 percent exchangeable soshydium The comparison between the quantities of sodium calcushylated to have gone into the exchange complex on the basis of the Gapon equation and the difference between the quantity of soshydium added and that found in the soil extract are shown in table 7 Considering the limitations of the methodology the agleement IS remarkably close This is especially true if one considers that the presence of gypsum and calcium carbonate in a soil have an undetermined effect upon the equilibrium relationship as exshypressed by the Gapon equation r
TABLE 6 Quantities of [arious lOlls added to a drum of soil as compared with quantities foulld in the soil solulion
~--- ~-~ -en M~ Xa Ilro
~ yen- --- ~ ~Tnmiddotnttueut ----~----- ---I
Addd I FOtllI Addd Found IIded I Found Added 1 Found J--- ------------------ shybull11 r~ bull11 r i 1( J I t II r 11 r 11 t II tOL~ II 343 131 GO bullbull 432 101 533 36(L If - 5iO 1 48 85 1120 482 422 ~-shy(0111 185 900 32 165 li90 U06 286 271eImiddotJ 130 1420 25 240 3290 IS90 211 1
2~ I
lII 11 145 221 fiO ao litO 50 535 61SI II 2m 2711 52 48 2930 1040 460 amp51 II )-- 370 30 SI 5320 2180 I 266 02
C~ ~tJ Totll lIlHnJ Tothl uJons rriiJmut
1lt111lt1 Fuund IJI Fuuml Mmiddotd J~m1 ~ hltlmiddotd FUllllf -~ ~- - bullbull-- _~~~ u _
If II bull II IL bull ~
If 11 I lt If01 II 173 HJS Wi ~12 S3 2H MJ 2~n(1 If fd Jlh tt)1-1 1410 1140 1~50 lf~J1f1 Jl 1middot50 1 71t1 H ~(lOIl 1liO 2(11071
IYIO11 It 110 iWI 5~ 31bull L-I1t1 1550 a~50 UO()
n I ~I fit 4m 1t1 2~2fJ 10 2(10 - I Ii 14 If ~ S(l I 1~1 Ln I 1I~) 2~O I t21-1 11 1off f i Hi 1 f r j~ll ~middotau 51iJtl ~ Frl~n t1r hmiddotr ~uMt tlU Jlh~1( IIngUla1b uddl d li1h Url~ d flU (1r11 t Hf otttjrtu1 Nd
The data in tables 6 and 7 emphasize the modifications that took place in the soil complex as a result of the imposed treatshyments Three major modifications are ill evidence (1) Although sodium was the main cation added to the soil solution the soil solution or extract at equilibrium may be high in calcium (chloshyride series) (2) the total concentration of the soil solution or exshytractmay be much less than might be expeded on the basis of
~ Private communication from Milton Fireman of this Bureau
bullbull
22 TECHNICAL BULLETIN 925 U S DEPT OF AGRICULTURE
the quantity of soluble salt added (CaSO1 precipitation in SO eries) (3) the percentage of sodium on the exchange complex may become sufficiently high-I0 to 15 percent (21 )-to impose a detrimental effect on the soil structure
lAHLE 7--Relationship bewee disappearance of added sodium from lhe soil solution and increase in sodium on the exchange campex
------------ --~- --~ ~
Aw~(Sn IlIlrrnslill ) rliltrrllr b(w11 nddd ou (xrhulI~( r~rhlnglhlc S I IId fountl n 1tIblr III
rOlllpltmiddotxmiddot Iwr 100 PQunlls of soil Ixr 100 ltlIIds of sol-----_--__----shyIIlItluiraI IIIIItlIor-H 50 128 331
(I H 73~IIJ 7iS tCL I 1middot14 1050 1 884 (L-I 21J J 500 I 1400
fl~L1 140 j 000 i 1140 ~drll 21 3 1520 I 8901-11 14 3 24iO 3140
The modifications in the soil complex affected by the salt added cannot be ignored in the interpretation of the plant reshysponses Interpretation was further complicated however by variability in salt distribution within a drum of soil as illustrated by table 8 This table indicates what the concentration of chloshyride and sulfate would have been in the soil solution at the 12shypercent moisture value if all these added ions had remained in solution and had been uniformlv distributedmiddot within the soil solushytion of the different horizons The data in table 8 were derived from tables 4 and 5 Values not found in table 5 for the I2-percent moisture value were calculated with the aid of the relation beshytween comparable values determined at both 32- and the 12-pErshycent moisture values Table 8 shows that there would have b0en 165 e p m of chloride in the soil solution (C) if aU added chloshyride was uniformly distributed in the soil solution at 12-percent moisture It was observed in sand-culture studies that] 00 e p m of chloride were highly inhibitive to the growth of guayule (28)
Tn the present stUdy plants made very satisfactory qrowth in treatments receiving 01 percent Nael and 02 and 04 percent NaSO It is evident therefore that the relatively low cOI1Censhytrations of salt in thE) surface horizon (table 8) due to leaching or chemical reaction were highly important in permitting the good growth of guayule observed in these cultures The valuec for chloride round in the surface horizon of the CL-H and C(L-H treatments are undoubtedly abnormally high in view of the exshytent of growth observed especially in the series of plants conshytinuously on a low-tension soil-moisture regime That is these determinations were made after an appreciable interval following the final irrigation During this time salts would move back into the surface horizon that had been leached out at the time of irrishygation It appears that the average percentage of salt in the root 70ne of a plant may not be an adequate criterion on which to interpret plant response to a saline soil
bull
bull
bull
bull
bull
GROWTH AND RUBBER ACCUMULATION IN GUAYULE 23
lAnL~~ 8~ Distribution of the solllble chloride cwd sulfate among thrce
horizons
rPIHr HmJ ~1lulp Ilanl LOIIIf tir1
TJltn~n (J ~()t____ 7 (I ~OI ( IO- shy
dlkd Found lIltled 1 Found 1(I(lrd 1 luI Ild-l Foud 1ldJ 101111lt1 1ld1 Pmml ~-~ -- - - l --=----- _1 II II lt II r II ( II f 11 It 11 II It r II 01 11 102 2ti 200 31 14 0 21i IJ 2 It 4S (I 2ij 2J
II 11 105 10 S 21 16 tn 156 21 120 lIi5 4n4 21ltJ II 291 2Jl 14 5 40 2U7 1 1middot1 ij 2Uj 500 14 1I u(II 1 57j 83S 10 3 66 573 475 10 2 0 ijja 702 lU 1 Sa
C]middotI 11 1211 ~56 -I 46 31 23 2liu 42 0 31 5t 4 21lj 88 -I1IH 2 II 0 shy484 130 27 27 4~-I 120 1 43 0 484 IBOI H IIi HlO IJ2 7 Ii 16 l 24 ni2 210 Iti 3u 0 932 30S
t From hp Jtrr1 I htllh pI H l~tltt ill~ n HII 5lIt lhrd ullntr4llt fll ~ltuJtll ~jl bull
I)I~Cl ~~I()
The foregoing data emphasize the inadequacy of evaluating plant response entirely on the basis of the quantities of a conshystituent added to a soil as compared with a consideration of the resultant status of the soil complex and soil solution following the incorporation of the added constituent This is particularly the case in stUdies involving experimentally induced soil salinity On addition of a salt that changes both the quantitative and qualitative content of dissolved cations in the soil solution the equilibrium distribution of the adsorbed ions and those in the soil solution will be shifted Thus the status of the whole soil in the various treatments of this experiment was something quite different from what might be expected from merely c1issolvin[ a specified quantity of a given salt in a volume of vater equivashylent to that preent in the designated mass of soil
That it would be fallacious to interpret the observed plant responses as being conditioned by a given percentage of salt in lhe soil mass is obvious from the fore~oing This deficiency is not peculiar to this experiment however since virtual1y all studies of plant tolerance to soil salinity are similarly handicapped Salt distribution in an irrigated saline soil is always exceedshyingly gtariable since vater cannot move into and through a sui without transporting the solutes Consequent to this phenomeshynon a sample taken in a saline soil might prove quite meaninQshyless as to indicating the soil salinity in the absorbing zone of the loots Even though the sample were taken in what is normal1y regarded as the absorbing zone of thE) roots it is quite possible that a pocket of soil c1irectly below the irrigation furrow oLIle be much lower in salt and would therefore be the region of water absorption Thus the average stress upon the plant may nnt nead approach what would be indicated by the average salt content of the soil in the absorbing root zone because of the fact
24 TECHNICAL BULLETIN 925 U S DEPT OF AGRICULTURE
thatmiddot water is primarily absorbed in regions of minimum salt content (6 13)
In order to evaluate the soil-moisture stress upon the plants bull grown under the various degrees of salinity in these experiments an involved mathematiclill method was developed to arrive at the rate of change in soil-moisture stress over the absorbing zone of the roots during an irrigation interval (26) The method permitshyted taking into account variations in salt content with depth in the container of soil Integration of the relation between moisshyture stress and time permitted an evaluation of the average moisshyture stress upon the roots during an irrigation Interval The distribution of salt in a container was derived from the dllta in figure 5 These data converted to osmotic-pressure values of the soil solution by means of the relationships in figure 7 are given in table 9 The average rates of change in moisture content per container of soil with time during an irrigation interval are shown in figures 9 to 12 The values for moisture content shown are those observed during the month of August The corresponding rates of change in soil-moisture stress with time for the 14 exshyperip1ental conditions also are shown in figures 9 to 12
1ABLE 9-Calculated osmotic pressure of the soll solution at 12 percellt moisture
bull (I 13 2 ~~14 (II 160 111
186 ~d 189 ~II
jl 0 218
The typical rangfS in moisture content and moisture stress observed in the high and the low moisture-tension regimes of the O-salt treatments are shown in figure 9 A It is possible that the relatively small stress developed even in the OL treatment was effective in inhibiting growth of guayule From figure 1 it may be seen that depleting the soil moisture to 14 percent would not have brought about much more than half an atmosphere of tenmiddot sion Table 9 shows that appreciable quantities of salines had accumulated in the O-salt cultures from the irrigation water that is a major part of the moisture stress shown in figure 9 A was d~e to osmotic pressure On the basis of sand-culture studies (28) this osmotic pressure may have been sufficiently high to inhibit growth of guayule bull
Plants grown under the OR treatment developed a high stress-20 atmospheres-before being irrigated Yet these plants at no time showed evidence of wilting The tension on the soH moisture at the permanent-wilting percentage as determined by sunflower plants has been found to vary from 10 to 25 atmosshy
-- ------
25
bull GROWTH AND RUBBER ACCUMULATION IN GUAYULE
pheres (4 25) A xeromorphic species like guayule may stand even
bull higher tension values before showing evidence of wilting The fact remains however that guayule made considerably poorer
20~----------------------------------~-------------
18 bullbull ~-- IMOISTURE
16 shy
14
12
10
8
U1 o Z l
0 o U1
ubull o ~
o
14 shy
10
8
bull o
CONTENT
---
-shy
MOISTURE
STRESS-
MOISTUHE
SOIL MOISTURE REGIME
----- LOW TENSION ---- HIGH TENSION
_
SOIL MOISTURE REGIME
---- LOW TENSION
---- HIGH TENSION
3 4 5 G 7
TIME (QAYSI
20
18
16
14
12
10
8
6 If)
lJJ 4n
lJJ J
2 ii 0 z
0 ltt
24 If) If)
22 ~ I-If)
20 lJJ cr l
18 n 0
16
14
12
10
8
G
4
2
0
FlGURE 9-Rate of change in moisture content and moisture stress during an irrigation interval within (A) the control (O-salt) cultures and (E) cultures containing 01 percent NaC
bull
26 TECHNICAL BULLETIN 925 U S DEPT OF AGRICULTURE
growth on the OH than on the OL treatment It is evident that the high diffusion-pressure deficit developed in the soil moisture during the last day of the irrigation interval of the OH series would effect an increase in diffusion-prEssure deficit within the tissue fluids of the plant The development of such a stress would definitely inhibit growth processes (27)
lhe average ranges in moisture content and moIsture stress of the cultures containing 01 percent NaCl are shown in figure 9 B The maximum stress developed in the elL cultures was more than double that shown for OL treatment even though the difference in growth response of the respective plants WRS not large The maximum stress developed in the C1H cultures was only slightly greater than that shown for the OH treatment yet the plants were only about half as large as those on soil to which no salt was added A comparison of the stress-time curves for these two treatments shows that whereas this relationship is pronouncedly exponential in the OH cultures (fig 9 A) it is nearly linear under the conditions of the c1 H treatment (fig 9 B) This means that over an irrigation interval the C1H plants were subjected to a stress of more than 10 atmospheres during half the time in comparison to being subjected to such a stress for only a few hours as found for the OH cultures
The changes in moisture content and moisture stress in soil cultures containing 02 and 04 percent NaCl respectively are shown ill figure 10 The curves for stress-time in the high moisshyture-tension regime are definitely convex upward in marked contrast to the shape of the stress-time curve found for the OH treatment in figure 9 A
This change in shape of the stress-time curves with increasshying salt content of the substrate is considered to be of fundashymental importance in the explanation of plant response to saline soils Evidence indicates that a plant undergoes changes in its physiological status as the soil-moisture supply approaches the wilting percentage (101129) The rate at which internal changes may take place with respect to rate of change of external stress will condition the characteristics of the plant response For exshyample owing to the hyperbolic nature of the moisture-sorption curve (fig 1) the rate of change in external stress in a nOl1saline soil may be so rapid just above the wnting percentage that physiological adjustments within the plant could hardly be exshypected to keep pace Hence the plant may develop the symptoms of wilting very suddenly In a saline soil it is evident from figure 10 that the rate of change in external stress may be low Under such conditions the plant may be subject to a total soil-moisture stress that is equal to or in excess of the moisture tension at the wilting percentage for weeks at a time without the plant showshying symptoms of wilting Recent unpublished observations at this laboratory have confirmed this Plants exposed to such conshyditions make practically no growth the lower leaves abscise but the conventional symptoms of wilting may not appear
This interpretation of the importance of the rate of change in moisture stress just above the wilting percentage upon the
bull
bull
bull
----------
-------
27
20 bull
bull
bull
GROWTH AND RUBBER ACCUMULATION IN GUAYULE
r---------------------------------------------~------_22
18-MOISTURE ~CONTENT
16 16 14 --c
14
12 ---- 12 --shy
---shy10 10
8 8
SOIL MOISTURE REGIME
1 MOISTURE ----- LOW TENSION 6
11 STRESS HIGH--- TENSION c 4 11
A us
5 c e 2~a
0-III
0 J L-----~2----~----~----~~----LO-----L----~4----~16----~80~00 III TIME (DAYS) i lgtshye r-----------------------------------------------------~2611l
w ~ 4 a a w Q
---shyi 20 20 -MOISTURE 3 8 18
16 ~~~T
16 -- 14 - shy 14
12 -----shy
--------- 12
10
10
8 I SOIL MOISTURE REGIME 8
----- LOW TENSION MOISTURE 6--- HIGH TENSION1 STRESS
4
TIME (DAYS)
FIGURE 10-Rate of change in moisture content and moisture stress during an irrigation interval within cultures containing (A) 02 percent NaCl and (B) 04 percent NaCl
expression of symptoms of wilting by the plant is undoubtedly related to the very wide range in the energy values of the soil moisture at the wilting percentage found by Richards and Weaver (19) for soil samples on which wilting-range determinations have been made by Furl and Repve (8)
Figure 11 shows the rate of change in moisture content and moisture stress for the sulfate series of plants at both the low and
----
---
28 TECHNICAL BULLEnN 925 U S DEPT OF AGRICULTURE
20~---------------------------------------------------20
Ie 16 bull
~ MOISTURE 16 ~ CONTENT 16
~~ -
12 _--r__ __
10
~ 6 SOIL MOISTURE REGIME
4--- LOW TENSION --------~OISTURE ---- HIGH TENSIONA -shy
~- STRESS
OL-__~__-L__-L__~___L-__~__-L~ o
20~---------------------------------------------------20
_16 16 en
IJ)o 16 wzl6 a
wo a _14 t4 ~
o
bulloJ
012 12 ~ IJ) lt
gIO
t-
a middotW a OIL MOISTURE REGIME a --- LOW TENSIONw
----- HIGH TENSION~ P
B MOISTURE -STRESS
~__~__-L__-L__~___L-__~__-L~O
~__________________________________________________-20
16 IS
16 16
14 14----
~
12 - ~ 12
10 ---shy 10
MOISTURE shy6 STRESS~h
SOIL MOISTURE REGIME 6 uu --- lOW TENSION
---- HIGH TENSION 4
2
o o 2 7 bull
FIGURE ll--Rate of change in moisture content and moisture stress during an irrigation interval within cultures containing (A) 02 percent Na2S0 (B) 04 percent Na2S04 and (C) 08 percent Na2S04
29 GROWTH AND RUBBER ACCUltIULATION IN GUAYULE
bull high moisture-tension regimes Owing to the previously menshytioned chemical changes that took place in the soil to which Na2S0 was added the shapes of the stress-time curves differ somewhat from those curves derived for treatments receiving comparable quantities of NaCl Thus the time-stress curve for
Sl L
00 asLOLe
ltJgt Ilt lt CLc CI
gt- Joo S2 H z
OH oC 2 Llt c J SH
Sal ~ I- zoe c
c
W ~ I
z
bull 2 lO CI ~middot~l
_1 C4H~ c
7
S~i1-
6 z 0 w Cll S4Hu c w c -~ Sa Hc w
0
al CHgt c
4
oOl deg C2HSaL
3 B
I I 0 2 4 6 e 10 12 14 16 16
4VERAGE MOISTURE STRESS (ATMOSPHERES)
FIGURE 12-Relation between tne average moisture stress of the irrigashytion interval and (A) the growth of the plants and (B) the percentage of rubber in the millable bush
bull tbe S2H cultures (fig 11 A) was more similar to the curve deshyrived for the OH treatment (fig 9 A) than for the C1H cultures (fig 9 B) This of course is consistent with the observation that growth response on the S2H cultures was even slightly superior to that produced by the OH treatment and just about double the growth response observed under the C1H conditions On the
30 TECHNICAL BULLETIN 925 U S DEPT OF AGRICULTURE
other hand the trend of the stress-time curve for the SsH cultures (fig 11 C) is quite similar to that observed ll1del the CJH conshyditions and the growth response of the guayule under these two conditions is almost identical (table 1)
It is possible to integrate the areas under the stress-time curves given in figures 9 to 11 and arrive at d18 average inte- grated moisture stress for an irrigation interval by dividing by the duration in days of the irrigation interval fu) The average green weights of plants (tops) per treatment are plotted against the corresponding values for the average integrated moisture strepounds in figure 12 A This relatively close relationship between average moisture stress and growth of guayule corroborates the findings of Wadleigh and Ayers (27) pertaining Lgt a similar study in beans It is further evidence that water availabiJity to plants is conditioned largely by the total specific free energy of the soil moisture rather than by the status of one or mon~ separate factors that affect the total free energy The limitations of the method by which the average moisture stresses were calculated have been discussed by Wadleigh (26) In view of these limitashytions the closeness of the relationship observed in figure 12 11 is considered noteworthy as an endorsement of this method of apshyproach to the water relations of plants growing in saline soils
The observations on percentage of rubber in the millable bush are plotted against the respective observations for average soilshymoisture stress in figure 12 B That the observation for treatshyment SsL is completely out of line with the others is obvious It was mentioned with reference to figure 3 A that the percentage of rubber in the millable bush of treatment SsL was unexplainshyably anomalous and may represent an analytical error The writers believe that the lack of coherence of this point with tbe others does not seriously detract from the validity of the general trend shown in figure 12 B
It is evident that at the lower levels of moisture stress the percentage of rubber in the millable bush increased markedly with increase in stress For example the percentage of rubber in the OH plants was nearly double that of the OL plants This is in line with the observations of Kellev and associates (] 2) that an increase in moisture stress increased the rubber content of guayule In their work however increased moisture stress was induced largely by an increase in moisture tension since they were working with a nons aline soil That is treatments OL and OR of this report approximate the range of moisture stressmiddot covshyered in the studies of Kelley and others (12)
It is evident from figure 12 B that rubber percentage is inshycreased at the lower ranges of moisture stress whether the stress is induced by moisture tension or by osmotic forces in the soil solution It is especially pertinent to emphasize that the results of this experiment as presented in figure 12 B show that if the moisture stress becomes really high owing to a combination of both high soil-moisture tension and appreciable quantities of solutes in the soil solution the trend of the relation between rubshyber percentage and moisture stress is reversed These resuHs
bull
bull
bull
31
bull
bull
bull
GROWTH AND RUBBER ACCUlULATION IN GUAYULE
suggest that the positive relationship between rubber percentage and moisture stress as reported by Kelly and others f 12) is incomplete inasmuch as it appears to hold for only the lower range of average moisture stresses
The writars beliee it is physiologically valid to expect a marked decrease in rubber percentage at really high leels of moisture stress Obviously rubber is a derhative of the primary photosynthate of the plant
High moiture stresses have been found to influence the acshycumulation of photosynthate in other species 12fJ 3- Furthershymore it was iJbserved that when guayule plants were subjected to the higher levels of moisture stress studied the lower Jeaes of the plants died at an abnormally higher rate This condition cut down on the photosynthetic surface of the plants It would logically follow that conditions inhibiting the accumulation of primary photosynthetic reserves vould also inhibit the quantity of rubber synthesized
Sl AH
Guayule plants were grown in large containers holding 100 pounds of a Panache loam in various cultures of which the salt content was established at 0 01 02 and 04 percent NaCI and at 02 04 and 08 percent Na2S0j
Three different conditions of the soil-moisture regime were superimposed on each of the seven different salt levels
1 Irrigated when only about 50 percent of the available water had been removed lavailable water being taken as that present in the soil between the limits of the field capacity and the wilting percentage)
2 Irrigated when nearly all of the available water had been removed 3 Irrigated according to schedule (1) duing the first half of the
experimental period and according to schedule (2) during the latter half
Each salt-moisture level was thrice replicated Nursery-grown plants middotere transplanted to the soil containshy
ers on February 3 and hanested on December 1 1943 Growth of the plants was inhibited by increased degree of
depletion of the available soil moisture prior to irrigation Increasingly larger quantities of NaCI in the soil were associshy
ated with a progressively greater decrease in plant growth within each soU-moisture regime Additions of NaSO were not associshyated with significant decreases in growth response unless in excess of 04 percent
At low soil-moisture tension the presence of salt in the soil tended to be associated with an increase in percentage of rubber in the mil1able bush With moisture regimes involving high tenshysion increasing soil salinity was associated with marked deshycreases in rubber percentage
In general there was a marked decrease in yield of rubber per plant with increasing salinity and increased moisture tension the main exception being an increase in rubber with the presence of a small quantity of salt at low moisture tension
Increasing soil salinity was associated with an increase in the quantity of irrigation water required to produce a given weight
32 TECHNICAL BULLETIN 925 U S DEPT OF AGRICULTURE
of millable bush Likewise on an average an increase in salinity necessitated a marked increase in the quantity of irrigation water per gram of rubber produced
Surface irrigation of the soil containers caused a marked downward movement of the added salt
Within a given irrigation regime vegetative growth of the plants was closely associated with the specific conductance of the extract of the saturated soil from the surface horizon (upper 5 inches)
Analyses of the extracts of the saturated soils and of the displaced soil solutions showed that interactive effects had taken place between added solutes and the original soil components Addition of NaCl to this Panoche loam resulted in a displacement of some of the calcium from the exchange complex by sodium with the result that calcium made up as much as 50 percent of the cations in the soil solution Addition of Na2S01 to this soil also resulted in the displacement of calcium by sodium in the exchange complex and as a result solid phase CaSO1 of low solubility was formed This chemical reaction caused a lower concentration of the sail solution than would be expected on the basis of the quantity of salt added
A close relation was noted between the specific conductance of the extract of the saturated soil (32 percent H 2 0) and that of the displaced soil solution obtained at 12 percent moisture Owing to the effect of additional solid phase CaSO coming into solution with dilution the above relationship for the Na2S0I-treated son differed from that of the soil receiving NaCl A close relation existed between the specific conductance of the displaced soil solution and the osmotic pressure of this solution
The rate of change in the total soil-moisture stress (sum of moisture tension plus osmotic pressure of the soil solution) was determined for representative irrigation intervals for the various treatments It wasmiddot found that the shape of the derived stress-time curves differed markedly depending on the degree of salinity of the soil and the specific shapes of the different curves bore a definite relation to the nature of plant response in the nonsaline and saline soils
The average moisture stress during an irrigation interval was determined It was found that growth inhibition of guayule was closely related to the total moisture stress regardless of whether this stress was due predominately to moisture tension or to osmotic pressure of the soil solution
The percentage of rubber in the millable bush was found to be closely related to the average moisture stress ever an irrigashytion interval This relationship was found to be mal~kecny positive over the lower ranges of moisture stress It was immaterial to rubber accumulation whether this moisture stress was induced by tension or b~T osmotic pressure The curve for this relation however showed a decided maximum Average moisture stresses exceeding 6 atmospheres were progressively deleterious to rubshyber accumulation
bull
bull
bull
33 GROWTH AND RUBBER ACCUMULATION IN GUAYULE
bull LITERATURE CITED
(1) AYERS A D WADLEIGH C H and MAGISTAD O C 1943 THE INTERRELATIONSHIPS OF SALT CONCENTRATION AND SOIL
MOISTURE CONTENT WITH THE GROWTH OF BEANS Arner Soc Aglon Jour 35 796-810 illus
(2) BASSLAVSKAYA s S 1936 INFLUENCE OF THE CHLORIDE ION ON THE CONTENT OF CARBOshy
HYDBATES IN POTATO LEAVES Plant Physiol 11 863-871 illus
(3) --- and SYROESHKINA M 1936 INFLUENCE OF THE CHLORIDE ION ON THE CONTENT OF CHLOROPHYLL
IN THE LEAVES OF POTATOES Plant Physio 11 149-157 mus
(4) BODMAN G B and DAY P R 1943 FREEZING POINTS OF A GROUP OF CALIFORNIA SOILS AND THEIR
EXTRACTED CLAYS Soil Sci 55 225-246 mus
(5) BUEHRER T F and ROSE M S 1943 STUDIES IN SOIL STRUCTURE V BOUND WATER IN NORMAL AND
PUDDLED SOILS Ariz Agr Expt Sta Tech Bu 100 pp [154]-218 illus
(6) EATON F M 1941 WATER UPTAKE AND GROWTH AS INFLUENCEIJ BY INEQUALITIES
U THE CONCENTRATION OF THE SUBSTRATE Plant Physio 16 515-564 illus
(7) --- and SOKOLOFF V P
bull 1935 ABSORBED SODIUM IN SOILS AS AFFECTED BY THE SOIL-WATER
RATIO Soil Sci 40 237-247 (8) FURR J R and REEVE J O
1945 RANGE OF SOIL-MOISTURE PERCENTAGES THROUGH WHICH PLANTS UNDERGO PERMANENT WILTING IN SOME SOILS FROM SEMIARID IRRIGATED AREAS Jour Agr Res 71 149-170 mus
(9) GAPON E N 1933 ON THE THEORY OF EXCHANGE ADSOBPTION IN SOILS Jour Gen
Chern [U S S R] 3 144-163 illus
(10) HERRICK E M 1933 SEASONAL AND DIURNAL VARIATIONS IN THE OSMOTIC VALUES
AND SUCTION TENSION VALUES IN THE AERIAL PORTIONS OF AMBROSIA TRlFIDA Arner Jour Bot 20 18-34 illus
(11) HIBBARD R P and HARRINGTON O E bull 1916 THE DEPRESSION OF THE FREEZING POINT IN TRITURATED PLANT
TISSUES AND THE MAGNITUDE OF ITS DEPRESSION AS RELATED TO SOIL MOISTURE Physio Res 1 441-454
(12) KELLEY O J HUNTER A S and HOBBS C H 1945 THE EFFECT OF MOISTURE STRESS ON NURSERY-GROWN GUAYULE
WITH RESPECT TO THE AMOUNT AND TYPE OF GROWTH AND GBOWTH BESPONSE ON TRANSPLANTING Arner Soc Agron Jour 37 194-216 mus
(13) LONG E M 1943 THE EFFECT OF SALT ADDITIONS TO THE SUBSTRATE ON INTAKE OF
WATER AND NUTRIENTD BY ROOTS OF APPROACH GRAFTED TOMATO PLANTS Arner Jour Bot 30 594-601
(14) MAGISTAD O C FIREMAN M and MABRY B
bull 1944 COMPARISON OF BASE-EXCHANGE EQUATIONS FOUNDED ON THE LAW
OF MASS ACTION Soil Sci 57 371-379 (15) REITEMEIER R F
1943 SEMIMICROANALYSIS OF SALINE SOIL SOLUTIONS Indus and Engin Chern Analyt Ed 15 393-402 illus
(16) 1946 EFFECT OF MOISTURE CONTENT ON THE DISSOLVED AND EXCHANGEshy
ABLE IONS OF SOILS OF ARID BEGIONS Soil Sci 61 195-214 illus
34 TECHNICAL BULLETIN 925 U S DEPT OF AGRICULTURE
(17) REITEMEIER R F and RICHARDS L A 1944 RELIABILITY OF THE PRESSURE-MEMBRANE METHOD FOR EXTRACshy
TION OF SOIL SOLUTION Soil Sci 57 119-135 illus (18) RICHARDS L A bull
1941 A PRESSURE-MEMBRANE EXTRACTION APPARATUS FOR SOIL SOLUshyTION Soil Sci 51 377-386 illus
(19) --- and WEAVER L R 1944 MOISTURE RETENTION BY SOME IRRIGATED SOILS AS RELATED TO
SOIL-MOISTURE TENSION Jour Agr Res 69 215-235 illus (20) SCHNEIDER G W and CHILDERS N F
1941 INFLUENCE OF SOIL MOISTURE ON PHOTOSYNTHESIS RESPIRATION AND TRANSPIRATION OF APPLE LEAVES Plant Physio 16 565-583 illus
(21) SCOFIELD C S 1932 MEASURING THE SALINITY OF IRRIGATION WATEHS AND OF SOIL
SOLUTIONS WITH THE WHEATSTONE BRIDGE U S Dept Agr Cir 232 16 pp illus
(22) SHAW C F 1927 THE NORMAL MOISTURE CAPACITY OF SOILS Soil Sci 23
303-317 illus (23) SIGMOND E [SIGMOND A A J DE]
1938 THE PRINCIPLES OF SOIL SCIENCE 362 pp illus London (24) VANONI I E and CONRAD J P
1942 CALCIUM- AND SULFATE-ION CONCENTRATIONS IN A SOIL RECEIVshyING EXCESS GYPSUM AS INFLUENCED BY SEVERAL FACTORS Soil Sci 53 125-133
(25) VEIHMEYER F J and HENDRICKSON A H 1934 SOME PLANT AND SOIL-MOISTURE RELATIONS Amer Soil Survey
Assoc Bul 15 76-80 illus (26) WADLEIGH C H
1946 THE INTEGRATED SOIL MOiSTURE STRESS UPON A ROOT SYSTEM bullIN A LARGE CONTAINER OF SALINE SOIL Soil Sci 61 225-238 illus
(27) and AVERS A D 1945 GROWTH AND BIOCHEMICAL COMPOSITION OF BEAN PLANTS AS
CONDITIONED BY SOIL MOISTURE TENSION AND SALT CONCENshyTRATION Plant Physiol 20 106-132 ilIus
(28) and GAUCH H G 1944 THE INFLUENCE OF BlGH CONCENTRATIONS OF SODIUM SULFATE
SODIUM CHLORIDE CALCIUM CHLORIDE AND MAGNESIUM CHLOshyRIDE ON THE GROWTH OF GUAYULE IN SAND CULTURES Soil Sci 58399-403 illus
(29) GAUCH H G and DAVIES V 1943 THE TREND OF STARCH RESERVES IN BEAN PLANTS BEFORE AND
AFTER IRRIGATION OF A SALTNE SOIL Amer Soc Hort Sci Proc 43 201-209 ilIus
FOIsale by the SupelintCndent oC Documents U S Government Printing Office Washington 25 D C - Price IOc
bull u s GOVERNIENT PRINTING OFFICE 1946-700378
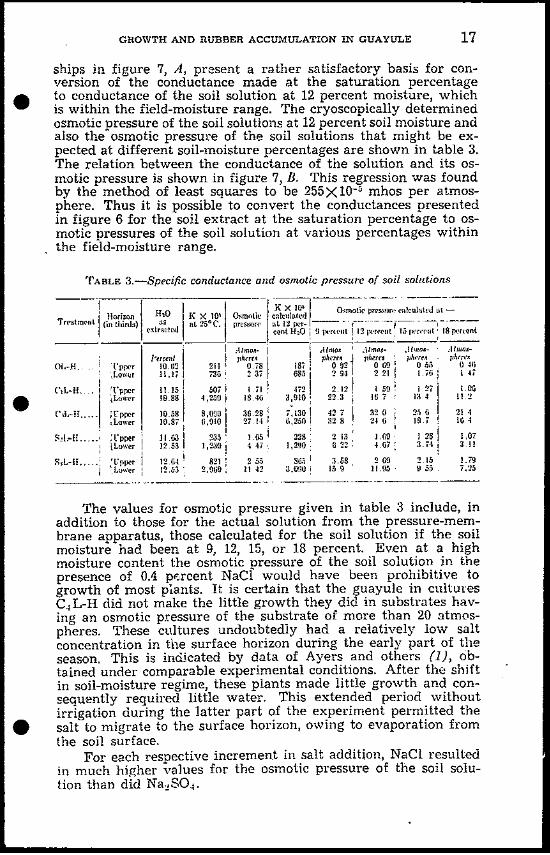

bullbull
bull
bull
GROWTH AND RUBBER ACCUMULATION IN GUAYULE 21
able sodium on the complex for each horizon of these seven salt treatments by the following rearrangement of the equation above toshy
0015 161 NaX=~
-=----=-=-shyICamiddot + MgH 1+ 0015 Na
The average percentage of sodium on the exchange complex for each drum of soil was also calculated There were 7300 me of exchange capacity to each 100 pounds of soil in a container and the original soil was found to have 05 percent exchangeable soshydium The comparison between the quantities of sodium calcushylated to have gone into the exchange complex on the basis of the Gapon equation and the difference between the quantity of soshydium added and that found in the soil extract are shown in table 7 Considering the limitations of the methodology the agleement IS remarkably close This is especially true if one considers that the presence of gypsum and calcium carbonate in a soil have an undetermined effect upon the equilibrium relationship as exshypressed by the Gapon equation r
TABLE 6 Quantities of [arious lOlls added to a drum of soil as compared with quantities foulld in the soil solulion
~--- ~-~ -en M~ Xa Ilro
~ yen- --- ~ ~Tnmiddotnttueut ----~----- ---I
Addd I FOtllI Addd Found IIded I Found Added 1 Found J--- ------------------ shybull11 r~ bull11 r i 1( J I t II r 11 r 11 t II tOL~ II 343 131 GO bullbull 432 101 533 36(L If - 5iO 1 48 85 1120 482 422 ~-shy(0111 185 900 32 165 li90 U06 286 271eImiddotJ 130 1420 25 240 3290 IS90 211 1
2~ I
lII 11 145 221 fiO ao litO 50 535 61SI II 2m 2711 52 48 2930 1040 460 amp51 II )-- 370 30 SI 5320 2180 I 266 02
C~ ~tJ Totll lIlHnJ Tothl uJons rriiJmut
1lt111lt1 Fuund IJI Fuuml Mmiddotd J~m1 ~ hltlmiddotd FUllllf -~ ~- - bullbull-- _~~~ u _
If II bull II IL bull ~
If 11 I lt If01 II 173 HJS Wi ~12 S3 2H MJ 2~n(1 If fd Jlh tt)1-1 1410 1140 1~50 lf~J1f1 Jl 1middot50 1 71t1 H ~(lOIl 1liO 2(11071
IYIO11 It 110 iWI 5~ 31bull L-I1t1 1550 a~50 UO()
n I ~I fit 4m 1t1 2~2fJ 10 2(10 - I Ii 14 If ~ S(l I 1~1 Ln I 1I~) 2~O I t21-1 11 1off f i Hi 1 f r j~ll ~middotau 51iJtl ~ Frl~n t1r hmiddotr ~uMt tlU Jlh~1( IIngUla1b uddl d li1h Url~ d flU (1r11 t Hf otttjrtu1 Nd
The data in tables 6 and 7 emphasize the modifications that took place in the soil complex as a result of the imposed treatshyments Three major modifications are ill evidence (1) Although sodium was the main cation added to the soil solution the soil solution or extract at equilibrium may be high in calcium (chloshyride series) (2) the total concentration of the soil solution or exshytractmay be much less than might be expeded on the basis of
~ Private communication from Milton Fireman of this Bureau
bullbull
22 TECHNICAL BULLETIN 925 U S DEPT OF AGRICULTURE
the quantity of soluble salt added (CaSO1 precipitation in SO eries) (3) the percentage of sodium on the exchange complex may become sufficiently high-I0 to 15 percent (21 )-to impose a detrimental effect on the soil structure
lAHLE 7--Relationship bewee disappearance of added sodium from lhe soil solution and increase in sodium on the exchange campex
------------ --~- --~ ~
Aw~(Sn IlIlrrnslill ) rliltrrllr b(w11 nddd ou (xrhulI~( r~rhlnglhlc S I IId fountl n 1tIblr III
rOlllpltmiddotxmiddot Iwr 100 PQunlls of soil Ixr 100 ltlIIds of sol-----_--__----shyIIlItluiraI IIIIItlIor-H 50 128 331
(I H 73~IIJ 7iS tCL I 1middot14 1050 1 884 (L-I 21J J 500 I 1400
fl~L1 140 j 000 i 1140 ~drll 21 3 1520 I 8901-11 14 3 24iO 3140
The modifications in the soil complex affected by the salt added cannot be ignored in the interpretation of the plant reshysponses Interpretation was further complicated however by variability in salt distribution within a drum of soil as illustrated by table 8 This table indicates what the concentration of chloshyride and sulfate would have been in the soil solution at the 12shypercent moisture value if all these added ions had remained in solution and had been uniformlv distributedmiddot within the soil solushytion of the different horizons The data in table 8 were derived from tables 4 and 5 Values not found in table 5 for the I2-percent moisture value were calculated with the aid of the relation beshytween comparable values determined at both 32- and the 12-pErshycent moisture values Table 8 shows that there would have b0en 165 e p m of chloride in the soil solution (C) if aU added chloshyride was uniformly distributed in the soil solution at 12-percent moisture It was observed in sand-culture studies that] 00 e p m of chloride were highly inhibitive to the growth of guayule (28)
Tn the present stUdy plants made very satisfactory qrowth in treatments receiving 01 percent Nael and 02 and 04 percent NaSO It is evident therefore that the relatively low cOI1Censhytrations of salt in thE) surface horizon (table 8) due to leaching or chemical reaction were highly important in permitting the good growth of guayule observed in these cultures The valuec for chloride round in the surface horizon of the CL-H and C(L-H treatments are undoubtedly abnormally high in view of the exshytent of growth observed especially in the series of plants conshytinuously on a low-tension soil-moisture regime That is these determinations were made after an appreciable interval following the final irrigation During this time salts would move back into the surface horizon that had been leached out at the time of irrishygation It appears that the average percentage of salt in the root 70ne of a plant may not be an adequate criterion on which to interpret plant response to a saline soil
bull
bull
bull
bull
bull
GROWTH AND RUBBER ACCUMULATION IN GUAYULE 23
lAnL~~ 8~ Distribution of the solllble chloride cwd sulfate among thrce
horizons
rPIHr HmJ ~1lulp Ilanl LOIIIf tir1
TJltn~n (J ~()t____ 7 (I ~OI ( IO- shy
dlkd Found lIltled 1 Found 1(I(lrd 1 luI Ild-l Foud 1ldJ 101111lt1 1ld1 Pmml ~-~ -- - - l --=----- _1 II II lt II r II ( II f 11 It 11 II It r II 01 11 102 2ti 200 31 14 0 21i IJ 2 It 4S (I 2ij 2J
II 11 105 10 S 21 16 tn 156 21 120 lIi5 4n4 21ltJ II 291 2Jl 14 5 40 2U7 1 1middot1 ij 2Uj 500 14 1I u(II 1 57j 83S 10 3 66 573 475 10 2 0 ijja 702 lU 1 Sa
C]middotI 11 1211 ~56 -I 46 31 23 2liu 42 0 31 5t 4 21lj 88 -I1IH 2 II 0 shy484 130 27 27 4~-I 120 1 43 0 484 IBOI H IIi HlO IJ2 7 Ii 16 l 24 ni2 210 Iti 3u 0 932 30S
t From hp Jtrr1 I htllh pI H l~tltt ill~ n HII 5lIt lhrd ullntr4llt fll ~ltuJtll ~jl bull
I)I~Cl ~~I()
The foregoing data emphasize the inadequacy of evaluating plant response entirely on the basis of the quantities of a conshystituent added to a soil as compared with a consideration of the resultant status of the soil complex and soil solution following the incorporation of the added constituent This is particularly the case in stUdies involving experimentally induced soil salinity On addition of a salt that changes both the quantitative and qualitative content of dissolved cations in the soil solution the equilibrium distribution of the adsorbed ions and those in the soil solution will be shifted Thus the status of the whole soil in the various treatments of this experiment was something quite different from what might be expected from merely c1issolvin[ a specified quantity of a given salt in a volume of vater equivashylent to that preent in the designated mass of soil
That it would be fallacious to interpret the observed plant responses as being conditioned by a given percentage of salt in lhe soil mass is obvious from the fore~oing This deficiency is not peculiar to this experiment however since virtual1y all studies of plant tolerance to soil salinity are similarly handicapped Salt distribution in an irrigated saline soil is always exceedshyingly gtariable since vater cannot move into and through a sui without transporting the solutes Consequent to this phenomeshynon a sample taken in a saline soil might prove quite meaninQshyless as to indicating the soil salinity in the absorbing zone of the loots Even though the sample were taken in what is normal1y regarded as the absorbing zone of thE) roots it is quite possible that a pocket of soil c1irectly below the irrigation furrow oLIle be much lower in salt and would therefore be the region of water absorption Thus the average stress upon the plant may nnt nead approach what would be indicated by the average salt content of the soil in the absorbing root zone because of the fact
24 TECHNICAL BULLETIN 925 U S DEPT OF AGRICULTURE
thatmiddot water is primarily absorbed in regions of minimum salt content (6 13)
In order to evaluate the soil-moisture stress upon the plants bull grown under the various degrees of salinity in these experiments an involved mathematiclill method was developed to arrive at the rate of change in soil-moisture stress over the absorbing zone of the roots during an irrigation interval (26) The method permitshyted taking into account variations in salt content with depth in the container of soil Integration of the relation between moisshyture stress and time permitted an evaluation of the average moisshyture stress upon the roots during an irrigation Interval The distribution of salt in a container was derived from the dllta in figure 5 These data converted to osmotic-pressure values of the soil solution by means of the relationships in figure 7 are given in table 9 The average rates of change in moisture content per container of soil with time during an irrigation interval are shown in figures 9 to 12 The values for moisture content shown are those observed during the month of August The corresponding rates of change in soil-moisture stress with time for the 14 exshyperip1ental conditions also are shown in figures 9 to 12
1ABLE 9-Calculated osmotic pressure of the soll solution at 12 percellt moisture
bull (I 13 2 ~~14 (II 160 111
186 ~d 189 ~II
jl 0 218
The typical rangfS in moisture content and moisture stress observed in the high and the low moisture-tension regimes of the O-salt treatments are shown in figure 9 A It is possible that the relatively small stress developed even in the OL treatment was effective in inhibiting growth of guayule From figure 1 it may be seen that depleting the soil moisture to 14 percent would not have brought about much more than half an atmosphere of tenmiddot sion Table 9 shows that appreciable quantities of salines had accumulated in the O-salt cultures from the irrigation water that is a major part of the moisture stress shown in figure 9 A was d~e to osmotic pressure On the basis of sand-culture studies (28) this osmotic pressure may have been sufficiently high to inhibit growth of guayule bull
Plants grown under the OR treatment developed a high stress-20 atmospheres-before being irrigated Yet these plants at no time showed evidence of wilting The tension on the soH moisture at the permanent-wilting percentage as determined by sunflower plants has been found to vary from 10 to 25 atmosshy
-- ------
25
bull GROWTH AND RUBBER ACCUMULATION IN GUAYULE
pheres (4 25) A xeromorphic species like guayule may stand even
bull higher tension values before showing evidence of wilting The fact remains however that guayule made considerably poorer
20~----------------------------------~-------------
18 bullbull ~-- IMOISTURE
16 shy
14
12
10
8
U1 o Z l
0 o U1
ubull o ~
o
14 shy
10
8
bull o
CONTENT
---
-shy
MOISTURE
STRESS-
MOISTUHE
SOIL MOISTURE REGIME
----- LOW TENSION ---- HIGH TENSION
_
SOIL MOISTURE REGIME
---- LOW TENSION
---- HIGH TENSION
3 4 5 G 7
TIME (QAYSI
20
18
16
14
12
10
8
6 If)
lJJ 4n
lJJ J
2 ii 0 z
0 ltt
24 If) If)
22 ~ I-If)
20 lJJ cr l
18 n 0
16
14
12
10
8
G
4
2
0
FlGURE 9-Rate of change in moisture content and moisture stress during an irrigation interval within (A) the control (O-salt) cultures and (E) cultures containing 01 percent NaC
bull
26 TECHNICAL BULLETIN 925 U S DEPT OF AGRICULTURE
growth on the OH than on the OL treatment It is evident that the high diffusion-pressure deficit developed in the soil moisture during the last day of the irrigation interval of the OH series would effect an increase in diffusion-prEssure deficit within the tissue fluids of the plant The development of such a stress would definitely inhibit growth processes (27)
lhe average ranges in moisture content and moIsture stress of the cultures containing 01 percent NaCl are shown in figure 9 B The maximum stress developed in the elL cultures was more than double that shown for OL treatment even though the difference in growth response of the respective plants WRS not large The maximum stress developed in the C1H cultures was only slightly greater than that shown for the OH treatment yet the plants were only about half as large as those on soil to which no salt was added A comparison of the stress-time curves for these two treatments shows that whereas this relationship is pronouncedly exponential in the OH cultures (fig 9 A) it is nearly linear under the conditions of the c1 H treatment (fig 9 B) This means that over an irrigation interval the C1H plants were subjected to a stress of more than 10 atmospheres during half the time in comparison to being subjected to such a stress for only a few hours as found for the OH cultures
The changes in moisture content and moisture stress in soil cultures containing 02 and 04 percent NaCl respectively are shown ill figure 10 The curves for stress-time in the high moisshyture-tension regime are definitely convex upward in marked contrast to the shape of the stress-time curve found for the OH treatment in figure 9 A
This change in shape of the stress-time curves with increasshying salt content of the substrate is considered to be of fundashymental importance in the explanation of plant response to saline soils Evidence indicates that a plant undergoes changes in its physiological status as the soil-moisture supply approaches the wilting percentage (101129) The rate at which internal changes may take place with respect to rate of change of external stress will condition the characteristics of the plant response For exshyample owing to the hyperbolic nature of the moisture-sorption curve (fig 1) the rate of change in external stress in a nOl1saline soil may be so rapid just above the wnting percentage that physiological adjustments within the plant could hardly be exshypected to keep pace Hence the plant may develop the symptoms of wilting very suddenly In a saline soil it is evident from figure 10 that the rate of change in external stress may be low Under such conditions the plant may be subject to a total soil-moisture stress that is equal to or in excess of the moisture tension at the wilting percentage for weeks at a time without the plant showshying symptoms of wilting Recent unpublished observations at this laboratory have confirmed this Plants exposed to such conshyditions make practically no growth the lower leaves abscise but the conventional symptoms of wilting may not appear
This interpretation of the importance of the rate of change in moisture stress just above the wilting percentage upon the
bull
bull
bull
----------
-------
27
20 bull
bull
bull
GROWTH AND RUBBER ACCUMULATION IN GUAYULE
r---------------------------------------------~------_22
18-MOISTURE ~CONTENT
16 16 14 --c
14
12 ---- 12 --shy
---shy10 10
8 8
SOIL MOISTURE REGIME
1 MOISTURE ----- LOW TENSION 6
11 STRESS HIGH--- TENSION c 4 11
A us
5 c e 2~a
0-III
0 J L-----~2----~----~----~~----LO-----L----~4----~16----~80~00 III TIME (DAYS) i lgtshye r-----------------------------------------------------~2611l
w ~ 4 a a w Q
---shyi 20 20 -MOISTURE 3 8 18
16 ~~~T
16 -- 14 - shy 14
12 -----shy
--------- 12
10
10
8 I SOIL MOISTURE REGIME 8
----- LOW TENSION MOISTURE 6--- HIGH TENSION1 STRESS
4
TIME (DAYS)
FIGURE 10-Rate of change in moisture content and moisture stress during an irrigation interval within cultures containing (A) 02 percent NaCl and (B) 04 percent NaCl
expression of symptoms of wilting by the plant is undoubtedly related to the very wide range in the energy values of the soil moisture at the wilting percentage found by Richards and Weaver (19) for soil samples on which wilting-range determinations have been made by Furl and Repve (8)
Figure 11 shows the rate of change in moisture content and moisture stress for the sulfate series of plants at both the low and
----
---
28 TECHNICAL BULLEnN 925 U S DEPT OF AGRICULTURE
20~---------------------------------------------------20
Ie 16 bull
~ MOISTURE 16 ~ CONTENT 16
~~ -
12 _--r__ __
10
~ 6 SOIL MOISTURE REGIME
4--- LOW TENSION --------~OISTURE ---- HIGH TENSIONA -shy
~- STRESS
OL-__~__-L__-L__~___L-__~__-L~ o
20~---------------------------------------------------20
_16 16 en
IJ)o 16 wzl6 a
wo a _14 t4 ~
o
bulloJ
012 12 ~ IJ) lt
gIO
t-
a middotW a OIL MOISTURE REGIME a --- LOW TENSIONw
----- HIGH TENSION~ P
B MOISTURE -STRESS
~__~__-L__-L__~___L-__~__-L~O
~__________________________________________________-20
16 IS
16 16
14 14----
~
12 - ~ 12
10 ---shy 10
MOISTURE shy6 STRESS~h
SOIL MOISTURE REGIME 6 uu --- lOW TENSION
---- HIGH TENSION 4
2
o o 2 7 bull
FIGURE ll--Rate of change in moisture content and moisture stress during an irrigation interval within cultures containing (A) 02 percent Na2S0 (B) 04 percent Na2S04 and (C) 08 percent Na2S04
29 GROWTH AND RUBBER ACCUltIULATION IN GUAYULE
bull high moisture-tension regimes Owing to the previously menshytioned chemical changes that took place in the soil to which Na2S0 was added the shapes of the stress-time curves differ somewhat from those curves derived for treatments receiving comparable quantities of NaCl Thus the time-stress curve for
Sl L
00 asLOLe
ltJgt Ilt lt CLc CI
gt- Joo S2 H z
OH oC 2 Llt c J SH
Sal ~ I- zoe c
c
W ~ I
z
bull 2 lO CI ~middot~l
_1 C4H~ c
7
S~i1-
6 z 0 w Cll S4Hu c w c -~ Sa Hc w
0
al CHgt c
4
oOl deg C2HSaL
3 B
I I 0 2 4 6 e 10 12 14 16 16
4VERAGE MOISTURE STRESS (ATMOSPHERES)
FIGURE 12-Relation between tne average moisture stress of the irrigashytion interval and (A) the growth of the plants and (B) the percentage of rubber in the millable bush
bull tbe S2H cultures (fig 11 A) was more similar to the curve deshyrived for the OH treatment (fig 9 A) than for the C1H cultures (fig 9 B) This of course is consistent with the observation that growth response on the S2H cultures was even slightly superior to that produced by the OH treatment and just about double the growth response observed under the C1H conditions On the
30 TECHNICAL BULLETIN 925 U S DEPT OF AGRICULTURE
other hand the trend of the stress-time curve for the SsH cultures (fig 11 C) is quite similar to that observed ll1del the CJH conshyditions and the growth response of the guayule under these two conditions is almost identical (table 1)
It is possible to integrate the areas under the stress-time curves given in figures 9 to 11 and arrive at d18 average inte- grated moisture stress for an irrigation interval by dividing by the duration in days of the irrigation interval fu) The average green weights of plants (tops) per treatment are plotted against the corresponding values for the average integrated moisture strepounds in figure 12 A This relatively close relationship between average moisture stress and growth of guayule corroborates the findings of Wadleigh and Ayers (27) pertaining Lgt a similar study in beans It is further evidence that water availabiJity to plants is conditioned largely by the total specific free energy of the soil moisture rather than by the status of one or mon~ separate factors that affect the total free energy The limitations of the method by which the average moisture stresses were calculated have been discussed by Wadleigh (26) In view of these limitashytions the closeness of the relationship observed in figure 12 11 is considered noteworthy as an endorsement of this method of apshyproach to the water relations of plants growing in saline soils
The observations on percentage of rubber in the millable bush are plotted against the respective observations for average soilshymoisture stress in figure 12 B That the observation for treatshyment SsL is completely out of line with the others is obvious It was mentioned with reference to figure 3 A that the percentage of rubber in the millable bush of treatment SsL was unexplainshyably anomalous and may represent an analytical error The writers believe that the lack of coherence of this point with tbe others does not seriously detract from the validity of the general trend shown in figure 12 B
It is evident that at the lower levels of moisture stress the percentage of rubber in the millable bush increased markedly with increase in stress For example the percentage of rubber in the OH plants was nearly double that of the OL plants This is in line with the observations of Kellev and associates (] 2) that an increase in moisture stress increased the rubber content of guayule In their work however increased moisture stress was induced largely by an increase in moisture tension since they were working with a nons aline soil That is treatments OL and OR of this report approximate the range of moisture stressmiddot covshyered in the studies of Kelley and others (12)
It is evident from figure 12 B that rubber percentage is inshycreased at the lower ranges of moisture stress whether the stress is induced by moisture tension or by osmotic forces in the soil solution It is especially pertinent to emphasize that the results of this experiment as presented in figure 12 B show that if the moisture stress becomes really high owing to a combination of both high soil-moisture tension and appreciable quantities of solutes in the soil solution the trend of the relation between rubshyber percentage and moisture stress is reversed These resuHs
bull
bull
bull
31
bull
bull
bull
GROWTH AND RUBBER ACCUlULATION IN GUAYULE
suggest that the positive relationship between rubber percentage and moisture stress as reported by Kelly and others f 12) is incomplete inasmuch as it appears to hold for only the lower range of average moisture stresses
The writars beliee it is physiologically valid to expect a marked decrease in rubber percentage at really high leels of moisture stress Obviously rubber is a derhative of the primary photosynthate of the plant
High moiture stresses have been found to influence the acshycumulation of photosynthate in other species 12fJ 3- Furthershymore it was iJbserved that when guayule plants were subjected to the higher levels of moisture stress studied the lower Jeaes of the plants died at an abnormally higher rate This condition cut down on the photosynthetic surface of the plants It would logically follow that conditions inhibiting the accumulation of primary photosynthetic reserves vould also inhibit the quantity of rubber synthesized
Sl AH
Guayule plants were grown in large containers holding 100 pounds of a Panache loam in various cultures of which the salt content was established at 0 01 02 and 04 percent NaCI and at 02 04 and 08 percent Na2S0j
Three different conditions of the soil-moisture regime were superimposed on each of the seven different salt levels
1 Irrigated when only about 50 percent of the available water had been removed lavailable water being taken as that present in the soil between the limits of the field capacity and the wilting percentage)
2 Irrigated when nearly all of the available water had been removed 3 Irrigated according to schedule (1) duing the first half of the
experimental period and according to schedule (2) during the latter half
Each salt-moisture level was thrice replicated Nursery-grown plants middotere transplanted to the soil containshy
ers on February 3 and hanested on December 1 1943 Growth of the plants was inhibited by increased degree of
depletion of the available soil moisture prior to irrigation Increasingly larger quantities of NaCI in the soil were associshy
ated with a progressively greater decrease in plant growth within each soU-moisture regime Additions of NaSO were not associshyated with significant decreases in growth response unless in excess of 04 percent
At low soil-moisture tension the presence of salt in the soil tended to be associated with an increase in percentage of rubber in the mil1able bush With moisture regimes involving high tenshysion increasing soil salinity was associated with marked deshycreases in rubber percentage
In general there was a marked decrease in yield of rubber per plant with increasing salinity and increased moisture tension the main exception being an increase in rubber with the presence of a small quantity of salt at low moisture tension
Increasing soil salinity was associated with an increase in the quantity of irrigation water required to produce a given weight
32 TECHNICAL BULLETIN 925 U S DEPT OF AGRICULTURE
of millable bush Likewise on an average an increase in salinity necessitated a marked increase in the quantity of irrigation water per gram of rubber produced
Surface irrigation of the soil containers caused a marked downward movement of the added salt
Within a given irrigation regime vegetative growth of the plants was closely associated with the specific conductance of the extract of the saturated soil from the surface horizon (upper 5 inches)
Analyses of the extracts of the saturated soils and of the displaced soil solutions showed that interactive effects had taken place between added solutes and the original soil components Addition of NaCl to this Panoche loam resulted in a displacement of some of the calcium from the exchange complex by sodium with the result that calcium made up as much as 50 percent of the cations in the soil solution Addition of Na2S01 to this soil also resulted in the displacement of calcium by sodium in the exchange complex and as a result solid phase CaSO1 of low solubility was formed This chemical reaction caused a lower concentration of the sail solution than would be expected on the basis of the quantity of salt added
A close relation was noted between the specific conductance of the extract of the saturated soil (32 percent H 2 0) and that of the displaced soil solution obtained at 12 percent moisture Owing to the effect of additional solid phase CaSO coming into solution with dilution the above relationship for the Na2S0I-treated son differed from that of the soil receiving NaCl A close relation existed between the specific conductance of the displaced soil solution and the osmotic pressure of this solution
The rate of change in the total soil-moisture stress (sum of moisture tension plus osmotic pressure of the soil solution) was determined for representative irrigation intervals for the various treatments It wasmiddot found that the shape of the derived stress-time curves differed markedly depending on the degree of salinity of the soil and the specific shapes of the different curves bore a definite relation to the nature of plant response in the nonsaline and saline soils
The average moisture stress during an irrigation interval was determined It was found that growth inhibition of guayule was closely related to the total moisture stress regardless of whether this stress was due predominately to moisture tension or to osmotic pressure of the soil solution
The percentage of rubber in the millable bush was found to be closely related to the average moisture stress ever an irrigashytion interval This relationship was found to be mal~kecny positive over the lower ranges of moisture stress It was immaterial to rubber accumulation whether this moisture stress was induced by tension or b~T osmotic pressure The curve for this relation however showed a decided maximum Average moisture stresses exceeding 6 atmospheres were progressively deleterious to rubshyber accumulation
bull
bull
bull
33 GROWTH AND RUBBER ACCUMULATION IN GUAYULE
bull LITERATURE CITED
(1) AYERS A D WADLEIGH C H and MAGISTAD O C 1943 THE INTERRELATIONSHIPS OF SALT CONCENTRATION AND SOIL
MOISTURE CONTENT WITH THE GROWTH OF BEANS Arner Soc Aglon Jour 35 796-810 illus
(2) BASSLAVSKAYA s S 1936 INFLUENCE OF THE CHLORIDE ION ON THE CONTENT OF CARBOshy
HYDBATES IN POTATO LEAVES Plant Physiol 11 863-871 illus
(3) --- and SYROESHKINA M 1936 INFLUENCE OF THE CHLORIDE ION ON THE CONTENT OF CHLOROPHYLL
IN THE LEAVES OF POTATOES Plant Physio 11 149-157 mus
(4) BODMAN G B and DAY P R 1943 FREEZING POINTS OF A GROUP OF CALIFORNIA SOILS AND THEIR
EXTRACTED CLAYS Soil Sci 55 225-246 mus
(5) BUEHRER T F and ROSE M S 1943 STUDIES IN SOIL STRUCTURE V BOUND WATER IN NORMAL AND
PUDDLED SOILS Ariz Agr Expt Sta Tech Bu 100 pp [154]-218 illus
(6) EATON F M 1941 WATER UPTAKE AND GROWTH AS INFLUENCEIJ BY INEQUALITIES
U THE CONCENTRATION OF THE SUBSTRATE Plant Physio 16 515-564 illus
(7) --- and SOKOLOFF V P
bull 1935 ABSORBED SODIUM IN SOILS AS AFFECTED BY THE SOIL-WATER
RATIO Soil Sci 40 237-247 (8) FURR J R and REEVE J O
1945 RANGE OF SOIL-MOISTURE PERCENTAGES THROUGH WHICH PLANTS UNDERGO PERMANENT WILTING IN SOME SOILS FROM SEMIARID IRRIGATED AREAS Jour Agr Res 71 149-170 mus
(9) GAPON E N 1933 ON THE THEORY OF EXCHANGE ADSOBPTION IN SOILS Jour Gen
Chern [U S S R] 3 144-163 illus
(10) HERRICK E M 1933 SEASONAL AND DIURNAL VARIATIONS IN THE OSMOTIC VALUES
AND SUCTION TENSION VALUES IN THE AERIAL PORTIONS OF AMBROSIA TRlFIDA Arner Jour Bot 20 18-34 illus
(11) HIBBARD R P and HARRINGTON O E bull 1916 THE DEPRESSION OF THE FREEZING POINT IN TRITURATED PLANT
TISSUES AND THE MAGNITUDE OF ITS DEPRESSION AS RELATED TO SOIL MOISTURE Physio Res 1 441-454
(12) KELLEY O J HUNTER A S and HOBBS C H 1945 THE EFFECT OF MOISTURE STRESS ON NURSERY-GROWN GUAYULE
WITH RESPECT TO THE AMOUNT AND TYPE OF GROWTH AND GBOWTH BESPONSE ON TRANSPLANTING Arner Soc Agron Jour 37 194-216 mus
(13) LONG E M 1943 THE EFFECT OF SALT ADDITIONS TO THE SUBSTRATE ON INTAKE OF
WATER AND NUTRIENTD BY ROOTS OF APPROACH GRAFTED TOMATO PLANTS Arner Jour Bot 30 594-601
(14) MAGISTAD O C FIREMAN M and MABRY B
bull 1944 COMPARISON OF BASE-EXCHANGE EQUATIONS FOUNDED ON THE LAW
OF MASS ACTION Soil Sci 57 371-379 (15) REITEMEIER R F
1943 SEMIMICROANALYSIS OF SALINE SOIL SOLUTIONS Indus and Engin Chern Analyt Ed 15 393-402 illus
(16) 1946 EFFECT OF MOISTURE CONTENT ON THE DISSOLVED AND EXCHANGEshy
ABLE IONS OF SOILS OF ARID BEGIONS Soil Sci 61 195-214 illus
34 TECHNICAL BULLETIN 925 U S DEPT OF AGRICULTURE
(17) REITEMEIER R F and RICHARDS L A 1944 RELIABILITY OF THE PRESSURE-MEMBRANE METHOD FOR EXTRACshy
TION OF SOIL SOLUTION Soil Sci 57 119-135 illus (18) RICHARDS L A bull
1941 A PRESSURE-MEMBRANE EXTRACTION APPARATUS FOR SOIL SOLUshyTION Soil Sci 51 377-386 illus
(19) --- and WEAVER L R 1944 MOISTURE RETENTION BY SOME IRRIGATED SOILS AS RELATED TO
SOIL-MOISTURE TENSION Jour Agr Res 69 215-235 illus (20) SCHNEIDER G W and CHILDERS N F
1941 INFLUENCE OF SOIL MOISTURE ON PHOTOSYNTHESIS RESPIRATION AND TRANSPIRATION OF APPLE LEAVES Plant Physio 16 565-583 illus
(21) SCOFIELD C S 1932 MEASURING THE SALINITY OF IRRIGATION WATEHS AND OF SOIL
SOLUTIONS WITH THE WHEATSTONE BRIDGE U S Dept Agr Cir 232 16 pp illus
(22) SHAW C F 1927 THE NORMAL MOISTURE CAPACITY OF SOILS Soil Sci 23
303-317 illus (23) SIGMOND E [SIGMOND A A J DE]
1938 THE PRINCIPLES OF SOIL SCIENCE 362 pp illus London (24) VANONI I E and CONRAD J P
1942 CALCIUM- AND SULFATE-ION CONCENTRATIONS IN A SOIL RECEIVshyING EXCESS GYPSUM AS INFLUENCED BY SEVERAL FACTORS Soil Sci 53 125-133
(25) VEIHMEYER F J and HENDRICKSON A H 1934 SOME PLANT AND SOIL-MOISTURE RELATIONS Amer Soil Survey
Assoc Bul 15 76-80 illus (26) WADLEIGH C H
1946 THE INTEGRATED SOIL MOiSTURE STRESS UPON A ROOT SYSTEM bullIN A LARGE CONTAINER OF SALINE SOIL Soil Sci 61 225-238 illus
(27) and AVERS A D 1945 GROWTH AND BIOCHEMICAL COMPOSITION OF BEAN PLANTS AS
CONDITIONED BY SOIL MOISTURE TENSION AND SALT CONCENshyTRATION Plant Physiol 20 106-132 ilIus
(28) and GAUCH H G 1944 THE INFLUENCE OF BlGH CONCENTRATIONS OF SODIUM SULFATE
SODIUM CHLORIDE CALCIUM CHLORIDE AND MAGNESIUM CHLOshyRIDE ON THE GROWTH OF GUAYULE IN SAND CULTURES Soil Sci 58399-403 illus
(29) GAUCH H G and DAVIES V 1943 THE TREND OF STARCH RESERVES IN BEAN PLANTS BEFORE AND
AFTER IRRIGATION OF A SALTNE SOIL Amer Soc Hort Sci Proc 43 201-209 ilIus
FOIsale by the SupelintCndent oC Documents U S Government Printing Office Washington 25 D C - Price IOc
bull u s GOVERNIENT PRINTING OFFICE 1946-700378

bull
bull
bull
GROWTH AND RUBBER ACCUMULATION IN GUAYULE 23
lAnL~~ 8~ Distribution of the solllble chloride cwd sulfate among thrce
horizons
rPIHr HmJ ~1lulp Ilanl LOIIIf tir1
TJltn~n (J ~()t____ 7 (I ~OI ( IO- shy
dlkd Found lIltled 1 Found 1(I(lrd 1 luI Ild-l Foud 1ldJ 101111lt1 1ld1 Pmml ~-~ -- - - l --=----- _1 II II lt II r II ( II f 11 It 11 II It r II 01 11 102 2ti 200 31 14 0 21i IJ 2 It 4S (I 2ij 2J
II 11 105 10 S 21 16 tn 156 21 120 lIi5 4n4 21ltJ II 291 2Jl 14 5 40 2U7 1 1middot1 ij 2Uj 500 14 1I u(II 1 57j 83S 10 3 66 573 475 10 2 0 ijja 702 lU 1 Sa
C]middotI 11 1211 ~56 -I 46 31 23 2liu 42 0 31 5t 4 21lj 88 -I1IH 2 II 0 shy484 130 27 27 4~-I 120 1 43 0 484 IBOI H IIi HlO IJ2 7 Ii 16 l 24 ni2 210 Iti 3u 0 932 30S
t From hp Jtrr1 I htllh pI H l~tltt ill~ n HII 5lIt lhrd ullntr4llt fll ~ltuJtll ~jl bull
I)I~Cl ~~I()
The foregoing data emphasize the inadequacy of evaluating plant response entirely on the basis of the quantities of a conshystituent added to a soil as compared with a consideration of the resultant status of the soil complex and soil solution following the incorporation of the added constituent This is particularly the case in stUdies involving experimentally induced soil salinity On addition of a salt that changes both the quantitative and qualitative content of dissolved cations in the soil solution the equilibrium distribution of the adsorbed ions and those in the soil solution will be shifted Thus the status of the whole soil in the various treatments of this experiment was something quite different from what might be expected from merely c1issolvin[ a specified quantity of a given salt in a volume of vater equivashylent to that preent in the designated mass of soil
That it would be fallacious to interpret the observed plant responses as being conditioned by a given percentage of salt in lhe soil mass is obvious from the fore~oing This deficiency is not peculiar to this experiment however since virtual1y all studies of plant tolerance to soil salinity are similarly handicapped Salt distribution in an irrigated saline soil is always exceedshyingly gtariable since vater cannot move into and through a sui without transporting the solutes Consequent to this phenomeshynon a sample taken in a saline soil might prove quite meaninQshyless as to indicating the soil salinity in the absorbing zone of the loots Even though the sample were taken in what is normal1y regarded as the absorbing zone of thE) roots it is quite possible that a pocket of soil c1irectly below the irrigation furrow oLIle be much lower in salt and would therefore be the region of water absorption Thus the average stress upon the plant may nnt nead approach what would be indicated by the average salt content of the soil in the absorbing root zone because of the fact
24 TECHNICAL BULLETIN 925 U S DEPT OF AGRICULTURE
thatmiddot water is primarily absorbed in regions of minimum salt content (6 13)
In order to evaluate the soil-moisture stress upon the plants bull grown under the various degrees of salinity in these experiments an involved mathematiclill method was developed to arrive at the rate of change in soil-moisture stress over the absorbing zone of the roots during an irrigation interval (26) The method permitshyted taking into account variations in salt content with depth in the container of soil Integration of the relation between moisshyture stress and time permitted an evaluation of the average moisshyture stress upon the roots during an irrigation Interval The distribution of salt in a container was derived from the dllta in figure 5 These data converted to osmotic-pressure values of the soil solution by means of the relationships in figure 7 are given in table 9 The average rates of change in moisture content per container of soil with time during an irrigation interval are shown in figures 9 to 12 The values for moisture content shown are those observed during the month of August The corresponding rates of change in soil-moisture stress with time for the 14 exshyperip1ental conditions also are shown in figures 9 to 12
1ABLE 9-Calculated osmotic pressure of the soll solution at 12 percellt moisture
bull (I 13 2 ~~14 (II 160 111
186 ~d 189 ~II
jl 0 218
The typical rangfS in moisture content and moisture stress observed in the high and the low moisture-tension regimes of the O-salt treatments are shown in figure 9 A It is possible that the relatively small stress developed even in the OL treatment was effective in inhibiting growth of guayule From figure 1 it may be seen that depleting the soil moisture to 14 percent would not have brought about much more than half an atmosphere of tenmiddot sion Table 9 shows that appreciable quantities of salines had accumulated in the O-salt cultures from the irrigation water that is a major part of the moisture stress shown in figure 9 A was d~e to osmotic pressure On the basis of sand-culture studies (28) this osmotic pressure may have been sufficiently high to inhibit growth of guayule bull
Plants grown under the OR treatment developed a high stress-20 atmospheres-before being irrigated Yet these plants at no time showed evidence of wilting The tension on the soH moisture at the permanent-wilting percentage as determined by sunflower plants has been found to vary from 10 to 25 atmosshy
-- ------
25
bull GROWTH AND RUBBER ACCUMULATION IN GUAYULE
pheres (4 25) A xeromorphic species like guayule may stand even
bull higher tension values before showing evidence of wilting The fact remains however that guayule made considerably poorer
20~----------------------------------~-------------
18 bullbull ~-- IMOISTURE
16 shy
14
12
10
8
U1 o Z l
0 o U1
ubull o ~
o
14 shy
10
8
bull o
CONTENT
---
-shy
MOISTURE
STRESS-
MOISTUHE
SOIL MOISTURE REGIME
----- LOW TENSION ---- HIGH TENSION
_
SOIL MOISTURE REGIME
---- LOW TENSION
---- HIGH TENSION
3 4 5 G 7
TIME (QAYSI
20
18
16
14
12
10
8
6 If)
lJJ 4n
lJJ J
2 ii 0 z
0 ltt
24 If) If)
22 ~ I-If)
20 lJJ cr l
18 n 0
16
14
12
10
8
G
4
2
0
FlGURE 9-Rate of change in moisture content and moisture stress during an irrigation interval within (A) the control (O-salt) cultures and (E) cultures containing 01 percent NaC
bull
26 TECHNICAL BULLETIN 925 U S DEPT OF AGRICULTURE
growth on the OH than on the OL treatment It is evident that the high diffusion-pressure deficit developed in the soil moisture during the last day of the irrigation interval of the OH series would effect an increase in diffusion-prEssure deficit within the tissue fluids of the plant The development of such a stress would definitely inhibit growth processes (27)
lhe average ranges in moisture content and moIsture stress of the cultures containing 01 percent NaCl are shown in figure 9 B The maximum stress developed in the elL cultures was more than double that shown for OL treatment even though the difference in growth response of the respective plants WRS not large The maximum stress developed in the C1H cultures was only slightly greater than that shown for the OH treatment yet the plants were only about half as large as those on soil to which no salt was added A comparison of the stress-time curves for these two treatments shows that whereas this relationship is pronouncedly exponential in the OH cultures (fig 9 A) it is nearly linear under the conditions of the c1 H treatment (fig 9 B) This means that over an irrigation interval the C1H plants were subjected to a stress of more than 10 atmospheres during half the time in comparison to being subjected to such a stress for only a few hours as found for the OH cultures
The changes in moisture content and moisture stress in soil cultures containing 02 and 04 percent NaCl respectively are shown ill figure 10 The curves for stress-time in the high moisshyture-tension regime are definitely convex upward in marked contrast to the shape of the stress-time curve found for the OH treatment in figure 9 A
This change in shape of the stress-time curves with increasshying salt content of the substrate is considered to be of fundashymental importance in the explanation of plant response to saline soils Evidence indicates that a plant undergoes changes in its physiological status as the soil-moisture supply approaches the wilting percentage (101129) The rate at which internal changes may take place with respect to rate of change of external stress will condition the characteristics of the plant response For exshyample owing to the hyperbolic nature of the moisture-sorption curve (fig 1) the rate of change in external stress in a nOl1saline soil may be so rapid just above the wnting percentage that physiological adjustments within the plant could hardly be exshypected to keep pace Hence the plant may develop the symptoms of wilting very suddenly In a saline soil it is evident from figure 10 that the rate of change in external stress may be low Under such conditions the plant may be subject to a total soil-moisture stress that is equal to or in excess of the moisture tension at the wilting percentage for weeks at a time without the plant showshying symptoms of wilting Recent unpublished observations at this laboratory have confirmed this Plants exposed to such conshyditions make practically no growth the lower leaves abscise but the conventional symptoms of wilting may not appear
This interpretation of the importance of the rate of change in moisture stress just above the wilting percentage upon the
bull
bull
bull
----------
-------
27
20 bull
bull
bull
GROWTH AND RUBBER ACCUMULATION IN GUAYULE
r---------------------------------------------~------_22
18-MOISTURE ~CONTENT
16 16 14 --c
14
12 ---- 12 --shy
---shy10 10
8 8
SOIL MOISTURE REGIME
1 MOISTURE ----- LOW TENSION 6
11 STRESS HIGH--- TENSION c 4 11
A us
5 c e 2~a
0-III
0 J L-----~2----~----~----~~----LO-----L----~4----~16----~80~00 III TIME (DAYS) i lgtshye r-----------------------------------------------------~2611l
w ~ 4 a a w Q
---shyi 20 20 -MOISTURE 3 8 18
16 ~~~T
16 -- 14 - shy 14
12 -----shy
--------- 12
10
10
8 I SOIL MOISTURE REGIME 8
----- LOW TENSION MOISTURE 6--- HIGH TENSION1 STRESS
4
TIME (DAYS)
FIGURE 10-Rate of change in moisture content and moisture stress during an irrigation interval within cultures containing (A) 02 percent NaCl and (B) 04 percent NaCl
expression of symptoms of wilting by the plant is undoubtedly related to the very wide range in the energy values of the soil moisture at the wilting percentage found by Richards and Weaver (19) for soil samples on which wilting-range determinations have been made by Furl and Repve (8)
Figure 11 shows the rate of change in moisture content and moisture stress for the sulfate series of plants at both the low and
----
---
28 TECHNICAL BULLEnN 925 U S DEPT OF AGRICULTURE
20~---------------------------------------------------20
Ie 16 bull
~ MOISTURE 16 ~ CONTENT 16
~~ -
12 _--r__ __
10
~ 6 SOIL MOISTURE REGIME
4--- LOW TENSION --------~OISTURE ---- HIGH TENSIONA -shy
~- STRESS
OL-__~__-L__-L__~___L-__~__-L~ o
20~---------------------------------------------------20
_16 16 en
IJ)o 16 wzl6 a
wo a _14 t4 ~
o
bulloJ
012 12 ~ IJ) lt
gIO
t-
a middotW a OIL MOISTURE REGIME a --- LOW TENSIONw
----- HIGH TENSION~ P
B MOISTURE -STRESS
~__~__-L__-L__~___L-__~__-L~O
~__________________________________________________-20
16 IS
16 16
14 14----
~
12 - ~ 12
10 ---shy 10
MOISTURE shy6 STRESS~h
SOIL MOISTURE REGIME 6 uu --- lOW TENSION
---- HIGH TENSION 4
2
o o 2 7 bull
FIGURE ll--Rate of change in moisture content and moisture stress during an irrigation interval within cultures containing (A) 02 percent Na2S0 (B) 04 percent Na2S04 and (C) 08 percent Na2S04
29 GROWTH AND RUBBER ACCUltIULATION IN GUAYULE
bull high moisture-tension regimes Owing to the previously menshytioned chemical changes that took place in the soil to which Na2S0 was added the shapes of the stress-time curves differ somewhat from those curves derived for treatments receiving comparable quantities of NaCl Thus the time-stress curve for
Sl L
00 asLOLe
ltJgt Ilt lt CLc CI
gt- Joo S2 H z
OH oC 2 Llt c J SH
Sal ~ I- zoe c
c
W ~ I
z
bull 2 lO CI ~middot~l
_1 C4H~ c
7
S~i1-
6 z 0 w Cll S4Hu c w c -~ Sa Hc w
0
al CHgt c
4
oOl deg C2HSaL
3 B
I I 0 2 4 6 e 10 12 14 16 16
4VERAGE MOISTURE STRESS (ATMOSPHERES)
FIGURE 12-Relation between tne average moisture stress of the irrigashytion interval and (A) the growth of the plants and (B) the percentage of rubber in the millable bush
bull tbe S2H cultures (fig 11 A) was more similar to the curve deshyrived for the OH treatment (fig 9 A) than for the C1H cultures (fig 9 B) This of course is consistent with the observation that growth response on the S2H cultures was even slightly superior to that produced by the OH treatment and just about double the growth response observed under the C1H conditions On the
30 TECHNICAL BULLETIN 925 U S DEPT OF AGRICULTURE
other hand the trend of the stress-time curve for the SsH cultures (fig 11 C) is quite similar to that observed ll1del the CJH conshyditions and the growth response of the guayule under these two conditions is almost identical (table 1)
It is possible to integrate the areas under the stress-time curves given in figures 9 to 11 and arrive at d18 average inte- grated moisture stress for an irrigation interval by dividing by the duration in days of the irrigation interval fu) The average green weights of plants (tops) per treatment are plotted against the corresponding values for the average integrated moisture strepounds in figure 12 A This relatively close relationship between average moisture stress and growth of guayule corroborates the findings of Wadleigh and Ayers (27) pertaining Lgt a similar study in beans It is further evidence that water availabiJity to plants is conditioned largely by the total specific free energy of the soil moisture rather than by the status of one or mon~ separate factors that affect the total free energy The limitations of the method by which the average moisture stresses were calculated have been discussed by Wadleigh (26) In view of these limitashytions the closeness of the relationship observed in figure 12 11 is considered noteworthy as an endorsement of this method of apshyproach to the water relations of plants growing in saline soils
The observations on percentage of rubber in the millable bush are plotted against the respective observations for average soilshymoisture stress in figure 12 B That the observation for treatshyment SsL is completely out of line with the others is obvious It was mentioned with reference to figure 3 A that the percentage of rubber in the millable bush of treatment SsL was unexplainshyably anomalous and may represent an analytical error The writers believe that the lack of coherence of this point with tbe others does not seriously detract from the validity of the general trend shown in figure 12 B
It is evident that at the lower levels of moisture stress the percentage of rubber in the millable bush increased markedly with increase in stress For example the percentage of rubber in the OH plants was nearly double that of the OL plants This is in line with the observations of Kellev and associates (] 2) that an increase in moisture stress increased the rubber content of guayule In their work however increased moisture stress was induced largely by an increase in moisture tension since they were working with a nons aline soil That is treatments OL and OR of this report approximate the range of moisture stressmiddot covshyered in the studies of Kelley and others (12)
It is evident from figure 12 B that rubber percentage is inshycreased at the lower ranges of moisture stress whether the stress is induced by moisture tension or by osmotic forces in the soil solution It is especially pertinent to emphasize that the results of this experiment as presented in figure 12 B show that if the moisture stress becomes really high owing to a combination of both high soil-moisture tension and appreciable quantities of solutes in the soil solution the trend of the relation between rubshyber percentage and moisture stress is reversed These resuHs
bull
bull
bull
31
bull
bull
bull
GROWTH AND RUBBER ACCUlULATION IN GUAYULE
suggest that the positive relationship between rubber percentage and moisture stress as reported by Kelly and others f 12) is incomplete inasmuch as it appears to hold for only the lower range of average moisture stresses
The writars beliee it is physiologically valid to expect a marked decrease in rubber percentage at really high leels of moisture stress Obviously rubber is a derhative of the primary photosynthate of the plant
High moiture stresses have been found to influence the acshycumulation of photosynthate in other species 12fJ 3- Furthershymore it was iJbserved that when guayule plants were subjected to the higher levels of moisture stress studied the lower Jeaes of the plants died at an abnormally higher rate This condition cut down on the photosynthetic surface of the plants It would logically follow that conditions inhibiting the accumulation of primary photosynthetic reserves vould also inhibit the quantity of rubber synthesized
Sl AH
Guayule plants were grown in large containers holding 100 pounds of a Panache loam in various cultures of which the salt content was established at 0 01 02 and 04 percent NaCI and at 02 04 and 08 percent Na2S0j
Three different conditions of the soil-moisture regime were superimposed on each of the seven different salt levels
1 Irrigated when only about 50 percent of the available water had been removed lavailable water being taken as that present in the soil between the limits of the field capacity and the wilting percentage)
2 Irrigated when nearly all of the available water had been removed 3 Irrigated according to schedule (1) duing the first half of the
experimental period and according to schedule (2) during the latter half
Each salt-moisture level was thrice replicated Nursery-grown plants middotere transplanted to the soil containshy
ers on February 3 and hanested on December 1 1943 Growth of the plants was inhibited by increased degree of
depletion of the available soil moisture prior to irrigation Increasingly larger quantities of NaCI in the soil were associshy
ated with a progressively greater decrease in plant growth within each soU-moisture regime Additions of NaSO were not associshyated with significant decreases in growth response unless in excess of 04 percent
At low soil-moisture tension the presence of salt in the soil tended to be associated with an increase in percentage of rubber in the mil1able bush With moisture regimes involving high tenshysion increasing soil salinity was associated with marked deshycreases in rubber percentage
In general there was a marked decrease in yield of rubber per plant with increasing salinity and increased moisture tension the main exception being an increase in rubber with the presence of a small quantity of salt at low moisture tension
Increasing soil salinity was associated with an increase in the quantity of irrigation water required to produce a given weight
32 TECHNICAL BULLETIN 925 U S DEPT OF AGRICULTURE
of millable bush Likewise on an average an increase in salinity necessitated a marked increase in the quantity of irrigation water per gram of rubber produced
Surface irrigation of the soil containers caused a marked downward movement of the added salt
Within a given irrigation regime vegetative growth of the plants was closely associated with the specific conductance of the extract of the saturated soil from the surface horizon (upper 5 inches)
Analyses of the extracts of the saturated soils and of the displaced soil solutions showed that interactive effects had taken place between added solutes and the original soil components Addition of NaCl to this Panoche loam resulted in a displacement of some of the calcium from the exchange complex by sodium with the result that calcium made up as much as 50 percent of the cations in the soil solution Addition of Na2S01 to this soil also resulted in the displacement of calcium by sodium in the exchange complex and as a result solid phase CaSO1 of low solubility was formed This chemical reaction caused a lower concentration of the sail solution than would be expected on the basis of the quantity of salt added
A close relation was noted between the specific conductance of the extract of the saturated soil (32 percent H 2 0) and that of the displaced soil solution obtained at 12 percent moisture Owing to the effect of additional solid phase CaSO coming into solution with dilution the above relationship for the Na2S0I-treated son differed from that of the soil receiving NaCl A close relation existed between the specific conductance of the displaced soil solution and the osmotic pressure of this solution
The rate of change in the total soil-moisture stress (sum of moisture tension plus osmotic pressure of the soil solution) was determined for representative irrigation intervals for the various treatments It wasmiddot found that the shape of the derived stress-time curves differed markedly depending on the degree of salinity of the soil and the specific shapes of the different curves bore a definite relation to the nature of plant response in the nonsaline and saline soils
The average moisture stress during an irrigation interval was determined It was found that growth inhibition of guayule was closely related to the total moisture stress regardless of whether this stress was due predominately to moisture tension or to osmotic pressure of the soil solution
The percentage of rubber in the millable bush was found to be closely related to the average moisture stress ever an irrigashytion interval This relationship was found to be mal~kecny positive over the lower ranges of moisture stress It was immaterial to rubber accumulation whether this moisture stress was induced by tension or b~T osmotic pressure The curve for this relation however showed a decided maximum Average moisture stresses exceeding 6 atmospheres were progressively deleterious to rubshyber accumulation
bull
bull
bull
33 GROWTH AND RUBBER ACCUMULATION IN GUAYULE
bull LITERATURE CITED
(1) AYERS A D WADLEIGH C H and MAGISTAD O C 1943 THE INTERRELATIONSHIPS OF SALT CONCENTRATION AND SOIL
MOISTURE CONTENT WITH THE GROWTH OF BEANS Arner Soc Aglon Jour 35 796-810 illus
(2) BASSLAVSKAYA s S 1936 INFLUENCE OF THE CHLORIDE ION ON THE CONTENT OF CARBOshy
HYDBATES IN POTATO LEAVES Plant Physiol 11 863-871 illus
(3) --- and SYROESHKINA M 1936 INFLUENCE OF THE CHLORIDE ION ON THE CONTENT OF CHLOROPHYLL
IN THE LEAVES OF POTATOES Plant Physio 11 149-157 mus
(4) BODMAN G B and DAY P R 1943 FREEZING POINTS OF A GROUP OF CALIFORNIA SOILS AND THEIR
EXTRACTED CLAYS Soil Sci 55 225-246 mus
(5) BUEHRER T F and ROSE M S 1943 STUDIES IN SOIL STRUCTURE V BOUND WATER IN NORMAL AND
PUDDLED SOILS Ariz Agr Expt Sta Tech Bu 100 pp [154]-218 illus
(6) EATON F M 1941 WATER UPTAKE AND GROWTH AS INFLUENCEIJ BY INEQUALITIES
U THE CONCENTRATION OF THE SUBSTRATE Plant Physio 16 515-564 illus
(7) --- and SOKOLOFF V P
bull 1935 ABSORBED SODIUM IN SOILS AS AFFECTED BY THE SOIL-WATER
RATIO Soil Sci 40 237-247 (8) FURR J R and REEVE J O
1945 RANGE OF SOIL-MOISTURE PERCENTAGES THROUGH WHICH PLANTS UNDERGO PERMANENT WILTING IN SOME SOILS FROM SEMIARID IRRIGATED AREAS Jour Agr Res 71 149-170 mus
(9) GAPON E N 1933 ON THE THEORY OF EXCHANGE ADSOBPTION IN SOILS Jour Gen
Chern [U S S R] 3 144-163 illus
(10) HERRICK E M 1933 SEASONAL AND DIURNAL VARIATIONS IN THE OSMOTIC VALUES
AND SUCTION TENSION VALUES IN THE AERIAL PORTIONS OF AMBROSIA TRlFIDA Arner Jour Bot 20 18-34 illus
(11) HIBBARD R P and HARRINGTON O E bull 1916 THE DEPRESSION OF THE FREEZING POINT IN TRITURATED PLANT
TISSUES AND THE MAGNITUDE OF ITS DEPRESSION AS RELATED TO SOIL MOISTURE Physio Res 1 441-454
(12) KELLEY O J HUNTER A S and HOBBS C H 1945 THE EFFECT OF MOISTURE STRESS ON NURSERY-GROWN GUAYULE
WITH RESPECT TO THE AMOUNT AND TYPE OF GROWTH AND GBOWTH BESPONSE ON TRANSPLANTING Arner Soc Agron Jour 37 194-216 mus
(13) LONG E M 1943 THE EFFECT OF SALT ADDITIONS TO THE SUBSTRATE ON INTAKE OF
WATER AND NUTRIENTD BY ROOTS OF APPROACH GRAFTED TOMATO PLANTS Arner Jour Bot 30 594-601
(14) MAGISTAD O C FIREMAN M and MABRY B
bull 1944 COMPARISON OF BASE-EXCHANGE EQUATIONS FOUNDED ON THE LAW
OF MASS ACTION Soil Sci 57 371-379 (15) REITEMEIER R F
1943 SEMIMICROANALYSIS OF SALINE SOIL SOLUTIONS Indus and Engin Chern Analyt Ed 15 393-402 illus
(16) 1946 EFFECT OF MOISTURE CONTENT ON THE DISSOLVED AND EXCHANGEshy
ABLE IONS OF SOILS OF ARID BEGIONS Soil Sci 61 195-214 illus
34 TECHNICAL BULLETIN 925 U S DEPT OF AGRICULTURE
(17) REITEMEIER R F and RICHARDS L A 1944 RELIABILITY OF THE PRESSURE-MEMBRANE METHOD FOR EXTRACshy
TION OF SOIL SOLUTION Soil Sci 57 119-135 illus (18) RICHARDS L A bull
1941 A PRESSURE-MEMBRANE EXTRACTION APPARATUS FOR SOIL SOLUshyTION Soil Sci 51 377-386 illus
(19) --- and WEAVER L R 1944 MOISTURE RETENTION BY SOME IRRIGATED SOILS AS RELATED TO
SOIL-MOISTURE TENSION Jour Agr Res 69 215-235 illus (20) SCHNEIDER G W and CHILDERS N F
1941 INFLUENCE OF SOIL MOISTURE ON PHOTOSYNTHESIS RESPIRATION AND TRANSPIRATION OF APPLE LEAVES Plant Physio 16 565-583 illus
(21) SCOFIELD C S 1932 MEASURING THE SALINITY OF IRRIGATION WATEHS AND OF SOIL
SOLUTIONS WITH THE WHEATSTONE BRIDGE U S Dept Agr Cir 232 16 pp illus
(22) SHAW C F 1927 THE NORMAL MOISTURE CAPACITY OF SOILS Soil Sci 23
303-317 illus (23) SIGMOND E [SIGMOND A A J DE]
1938 THE PRINCIPLES OF SOIL SCIENCE 362 pp illus London (24) VANONI I E and CONRAD J P
1942 CALCIUM- AND SULFATE-ION CONCENTRATIONS IN A SOIL RECEIVshyING EXCESS GYPSUM AS INFLUENCED BY SEVERAL FACTORS Soil Sci 53 125-133
(25) VEIHMEYER F J and HENDRICKSON A H 1934 SOME PLANT AND SOIL-MOISTURE RELATIONS Amer Soil Survey
Assoc Bul 15 76-80 illus (26) WADLEIGH C H
1946 THE INTEGRATED SOIL MOiSTURE STRESS UPON A ROOT SYSTEM bullIN A LARGE CONTAINER OF SALINE SOIL Soil Sci 61 225-238 illus
(27) and AVERS A D 1945 GROWTH AND BIOCHEMICAL COMPOSITION OF BEAN PLANTS AS
CONDITIONED BY SOIL MOISTURE TENSION AND SALT CONCENshyTRATION Plant Physiol 20 106-132 ilIus
(28) and GAUCH H G 1944 THE INFLUENCE OF BlGH CONCENTRATIONS OF SODIUM SULFATE
SODIUM CHLORIDE CALCIUM CHLORIDE AND MAGNESIUM CHLOshyRIDE ON THE GROWTH OF GUAYULE IN SAND CULTURES Soil Sci 58399-403 illus
(29) GAUCH H G and DAVIES V 1943 THE TREND OF STARCH RESERVES IN BEAN PLANTS BEFORE AND
AFTER IRRIGATION OF A SALTNE SOIL Amer Soc Hort Sci Proc 43 201-209 ilIus
FOIsale by the SupelintCndent oC Documents U S Government Printing Office Washington 25 D C - Price IOc
bull u s GOVERNIENT PRINTING OFFICE 1946-700378
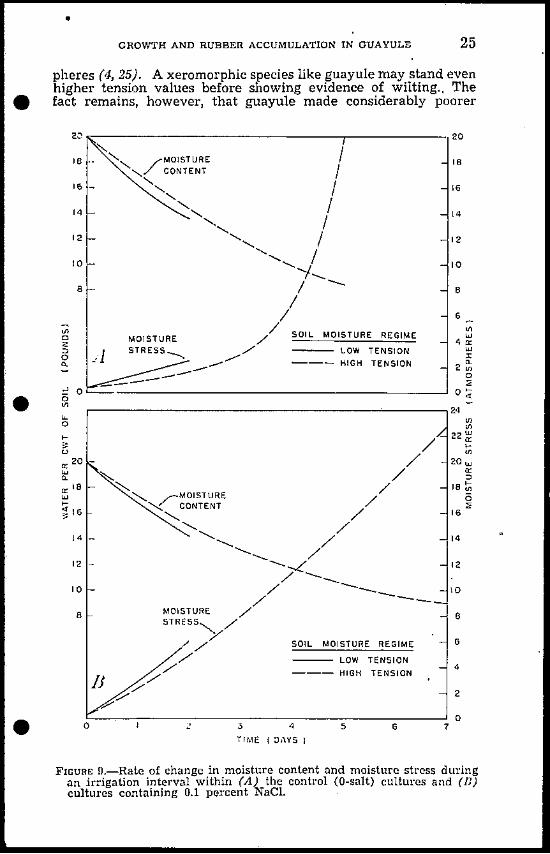
bull
26 TECHNICAL BULLETIN 925 U S DEPT OF AGRICULTURE
growth on the OH than on the OL treatment It is evident that the high diffusion-pressure deficit developed in the soil moisture during the last day of the irrigation interval of the OH series would effect an increase in diffusion-prEssure deficit within the tissue fluids of the plant The development of such a stress would definitely inhibit growth processes (27)
lhe average ranges in moisture content and moIsture stress of the cultures containing 01 percent NaCl are shown in figure 9 B The maximum stress developed in the elL cultures was more than double that shown for OL treatment even though the difference in growth response of the respective plants WRS not large The maximum stress developed in the C1H cultures was only slightly greater than that shown for the OH treatment yet the plants were only about half as large as those on soil to which no salt was added A comparison of the stress-time curves for these two treatments shows that whereas this relationship is pronouncedly exponential in the OH cultures (fig 9 A) it is nearly linear under the conditions of the c1 H treatment (fig 9 B) This means that over an irrigation interval the C1H plants were subjected to a stress of more than 10 atmospheres during half the time in comparison to being subjected to such a stress for only a few hours as found for the OH cultures
The changes in moisture content and moisture stress in soil cultures containing 02 and 04 percent NaCl respectively are shown ill figure 10 The curves for stress-time in the high moisshyture-tension regime are definitely convex upward in marked contrast to the shape of the stress-time curve found for the OH treatment in figure 9 A
This change in shape of the stress-time curves with increasshying salt content of the substrate is considered to be of fundashymental importance in the explanation of plant response to saline soils Evidence indicates that a plant undergoes changes in its physiological status as the soil-moisture supply approaches the wilting percentage (101129) The rate at which internal changes may take place with respect to rate of change of external stress will condition the characteristics of the plant response For exshyample owing to the hyperbolic nature of the moisture-sorption curve (fig 1) the rate of change in external stress in a nOl1saline soil may be so rapid just above the wnting percentage that physiological adjustments within the plant could hardly be exshypected to keep pace Hence the plant may develop the symptoms of wilting very suddenly In a saline soil it is evident from figure 10 that the rate of change in external stress may be low Under such conditions the plant may be subject to a total soil-moisture stress that is equal to or in excess of the moisture tension at the wilting percentage for weeks at a time without the plant showshying symptoms of wilting Recent unpublished observations at this laboratory have confirmed this Plants exposed to such conshyditions make practically no growth the lower leaves abscise but the conventional symptoms of wilting may not appear
This interpretation of the importance of the rate of change in moisture stress just above the wilting percentage upon the
bull
bull
bull
----------
-------
27
20 bull
bull
bull
GROWTH AND RUBBER ACCUMULATION IN GUAYULE
r---------------------------------------------~------_22
18-MOISTURE ~CONTENT
16 16 14 --c
14
12 ---- 12 --shy
---shy10 10
8 8
SOIL MOISTURE REGIME
1 MOISTURE ----- LOW TENSION 6
11 STRESS HIGH--- TENSION c 4 11
A us
5 c e 2~a
0-III
0 J L-----~2----~----~----~~----LO-----L----~4----~16----~80~00 III TIME (DAYS) i lgtshye r-----------------------------------------------------~2611l
w ~ 4 a a w Q
---shyi 20 20 -MOISTURE 3 8 18
16 ~~~T
16 -- 14 - shy 14
12 -----shy
--------- 12
10
10
8 I SOIL MOISTURE REGIME 8
----- LOW TENSION MOISTURE 6--- HIGH TENSION1 STRESS
4
TIME (DAYS)
FIGURE 10-Rate of change in moisture content and moisture stress during an irrigation interval within cultures containing (A) 02 percent NaCl and (B) 04 percent NaCl
expression of symptoms of wilting by the plant is undoubtedly related to the very wide range in the energy values of the soil moisture at the wilting percentage found by Richards and Weaver (19) for soil samples on which wilting-range determinations have been made by Furl and Repve (8)
Figure 11 shows the rate of change in moisture content and moisture stress for the sulfate series of plants at both the low and
----
---
28 TECHNICAL BULLEnN 925 U S DEPT OF AGRICULTURE
20~---------------------------------------------------20
Ie 16 bull
~ MOISTURE 16 ~ CONTENT 16
~~ -
12 _--r__ __
10
~ 6 SOIL MOISTURE REGIME
4--- LOW TENSION --------~OISTURE ---- HIGH TENSIONA -shy
~- STRESS
OL-__~__-L__-L__~___L-__~__-L~ o
20~---------------------------------------------------20
_16 16 en
IJ)o 16 wzl6 a
wo a _14 t4 ~
o
bulloJ
012 12 ~ IJ) lt
gIO
t-
a middotW a OIL MOISTURE REGIME a --- LOW TENSIONw
----- HIGH TENSION~ P
B MOISTURE -STRESS
~__~__-L__-L__~___L-__~__-L~O
~__________________________________________________-20
16 IS
16 16
14 14----
~
12 - ~ 12
10 ---shy 10
MOISTURE shy6 STRESS~h
SOIL MOISTURE REGIME 6 uu --- lOW TENSION
---- HIGH TENSION 4
2
o o 2 7 bull
FIGURE ll--Rate of change in moisture content and moisture stress during an irrigation interval within cultures containing (A) 02 percent Na2S0 (B) 04 percent Na2S04 and (C) 08 percent Na2S04
29 GROWTH AND RUBBER ACCUltIULATION IN GUAYULE
bull high moisture-tension regimes Owing to the previously menshytioned chemical changes that took place in the soil to which Na2S0 was added the shapes of the stress-time curves differ somewhat from those curves derived for treatments receiving comparable quantities of NaCl Thus the time-stress curve for
Sl L
00 asLOLe
ltJgt Ilt lt CLc CI
gt- Joo S2 H z
OH oC 2 Llt c J SH
Sal ~ I- zoe c
c
W ~ I
z
bull 2 lO CI ~middot~l
_1 C4H~ c
7
S~i1-
6 z 0 w Cll S4Hu c w c -~ Sa Hc w
0
al CHgt c
4
oOl deg C2HSaL
3 B
I I 0 2 4 6 e 10 12 14 16 16
4VERAGE MOISTURE STRESS (ATMOSPHERES)
FIGURE 12-Relation between tne average moisture stress of the irrigashytion interval and (A) the growth of the plants and (B) the percentage of rubber in the millable bush
bull tbe S2H cultures (fig 11 A) was more similar to the curve deshyrived for the OH treatment (fig 9 A) than for the C1H cultures (fig 9 B) This of course is consistent with the observation that growth response on the S2H cultures was even slightly superior to that produced by the OH treatment and just about double the growth response observed under the C1H conditions On the
30 TECHNICAL BULLETIN 925 U S DEPT OF AGRICULTURE
other hand the trend of the stress-time curve for the SsH cultures (fig 11 C) is quite similar to that observed ll1del the CJH conshyditions and the growth response of the guayule under these two conditions is almost identical (table 1)
It is possible to integrate the areas under the stress-time curves given in figures 9 to 11 and arrive at d18 average inte- grated moisture stress for an irrigation interval by dividing by the duration in days of the irrigation interval fu) The average green weights of plants (tops) per treatment are plotted against the corresponding values for the average integrated moisture strepounds in figure 12 A This relatively close relationship between average moisture stress and growth of guayule corroborates the findings of Wadleigh and Ayers (27) pertaining Lgt a similar study in beans It is further evidence that water availabiJity to plants is conditioned largely by the total specific free energy of the soil moisture rather than by the status of one or mon~ separate factors that affect the total free energy The limitations of the method by which the average moisture stresses were calculated have been discussed by Wadleigh (26) In view of these limitashytions the closeness of the relationship observed in figure 12 11 is considered noteworthy as an endorsement of this method of apshyproach to the water relations of plants growing in saline soils
The observations on percentage of rubber in the millable bush are plotted against the respective observations for average soilshymoisture stress in figure 12 B That the observation for treatshyment SsL is completely out of line with the others is obvious It was mentioned with reference to figure 3 A that the percentage of rubber in the millable bush of treatment SsL was unexplainshyably anomalous and may represent an analytical error The writers believe that the lack of coherence of this point with tbe others does not seriously detract from the validity of the general trend shown in figure 12 B
It is evident that at the lower levels of moisture stress the percentage of rubber in the millable bush increased markedly with increase in stress For example the percentage of rubber in the OH plants was nearly double that of the OL plants This is in line with the observations of Kellev and associates (] 2) that an increase in moisture stress increased the rubber content of guayule In their work however increased moisture stress was induced largely by an increase in moisture tension since they were working with a nons aline soil That is treatments OL and OR of this report approximate the range of moisture stressmiddot covshyered in the studies of Kelley and others (12)
It is evident from figure 12 B that rubber percentage is inshycreased at the lower ranges of moisture stress whether the stress is induced by moisture tension or by osmotic forces in the soil solution It is especially pertinent to emphasize that the results of this experiment as presented in figure 12 B show that if the moisture stress becomes really high owing to a combination of both high soil-moisture tension and appreciable quantities of solutes in the soil solution the trend of the relation between rubshyber percentage and moisture stress is reversed These resuHs
bull
bull
bull
31
bull
bull
bull
GROWTH AND RUBBER ACCUlULATION IN GUAYULE
suggest that the positive relationship between rubber percentage and moisture stress as reported by Kelly and others f 12) is incomplete inasmuch as it appears to hold for only the lower range of average moisture stresses
The writars beliee it is physiologically valid to expect a marked decrease in rubber percentage at really high leels of moisture stress Obviously rubber is a derhative of the primary photosynthate of the plant
High moiture stresses have been found to influence the acshycumulation of photosynthate in other species 12fJ 3- Furthershymore it was iJbserved that when guayule plants were subjected to the higher levels of moisture stress studied the lower Jeaes of the plants died at an abnormally higher rate This condition cut down on the photosynthetic surface of the plants It would logically follow that conditions inhibiting the accumulation of primary photosynthetic reserves vould also inhibit the quantity of rubber synthesized
Sl AH
Guayule plants were grown in large containers holding 100 pounds of a Panache loam in various cultures of which the salt content was established at 0 01 02 and 04 percent NaCI and at 02 04 and 08 percent Na2S0j
Three different conditions of the soil-moisture regime were superimposed on each of the seven different salt levels
1 Irrigated when only about 50 percent of the available water had been removed lavailable water being taken as that present in the soil between the limits of the field capacity and the wilting percentage)
2 Irrigated when nearly all of the available water had been removed 3 Irrigated according to schedule (1) duing the first half of the
experimental period and according to schedule (2) during the latter half
Each salt-moisture level was thrice replicated Nursery-grown plants middotere transplanted to the soil containshy
ers on February 3 and hanested on December 1 1943 Growth of the plants was inhibited by increased degree of
depletion of the available soil moisture prior to irrigation Increasingly larger quantities of NaCI in the soil were associshy
ated with a progressively greater decrease in plant growth within each soU-moisture regime Additions of NaSO were not associshyated with significant decreases in growth response unless in excess of 04 percent
At low soil-moisture tension the presence of salt in the soil tended to be associated with an increase in percentage of rubber in the mil1able bush With moisture regimes involving high tenshysion increasing soil salinity was associated with marked deshycreases in rubber percentage
In general there was a marked decrease in yield of rubber per plant with increasing salinity and increased moisture tension the main exception being an increase in rubber with the presence of a small quantity of salt at low moisture tension
Increasing soil salinity was associated with an increase in the quantity of irrigation water required to produce a given weight
32 TECHNICAL BULLETIN 925 U S DEPT OF AGRICULTURE
of millable bush Likewise on an average an increase in salinity necessitated a marked increase in the quantity of irrigation water per gram of rubber produced
Surface irrigation of the soil containers caused a marked downward movement of the added salt
Within a given irrigation regime vegetative growth of the plants was closely associated with the specific conductance of the extract of the saturated soil from the surface horizon (upper 5 inches)
Analyses of the extracts of the saturated soils and of the displaced soil solutions showed that interactive effects had taken place between added solutes and the original soil components Addition of NaCl to this Panoche loam resulted in a displacement of some of the calcium from the exchange complex by sodium with the result that calcium made up as much as 50 percent of the cations in the soil solution Addition of Na2S01 to this soil also resulted in the displacement of calcium by sodium in the exchange complex and as a result solid phase CaSO1 of low solubility was formed This chemical reaction caused a lower concentration of the sail solution than would be expected on the basis of the quantity of salt added
A close relation was noted between the specific conductance of the extract of the saturated soil (32 percent H 2 0) and that of the displaced soil solution obtained at 12 percent moisture Owing to the effect of additional solid phase CaSO coming into solution with dilution the above relationship for the Na2S0I-treated son differed from that of the soil receiving NaCl A close relation existed between the specific conductance of the displaced soil solution and the osmotic pressure of this solution
The rate of change in the total soil-moisture stress (sum of moisture tension plus osmotic pressure of the soil solution) was determined for representative irrigation intervals for the various treatments It wasmiddot found that the shape of the derived stress-time curves differed markedly depending on the degree of salinity of the soil and the specific shapes of the different curves bore a definite relation to the nature of plant response in the nonsaline and saline soils
The average moisture stress during an irrigation interval was determined It was found that growth inhibition of guayule was closely related to the total moisture stress regardless of whether this stress was due predominately to moisture tension or to osmotic pressure of the soil solution
The percentage of rubber in the millable bush was found to be closely related to the average moisture stress ever an irrigashytion interval This relationship was found to be mal~kecny positive over the lower ranges of moisture stress It was immaterial to rubber accumulation whether this moisture stress was induced by tension or b~T osmotic pressure The curve for this relation however showed a decided maximum Average moisture stresses exceeding 6 atmospheres were progressively deleterious to rubshyber accumulation
bull
bull
bull
33 GROWTH AND RUBBER ACCUMULATION IN GUAYULE
bull LITERATURE CITED
(1) AYERS A D WADLEIGH C H and MAGISTAD O C 1943 THE INTERRELATIONSHIPS OF SALT CONCENTRATION AND SOIL
MOISTURE CONTENT WITH THE GROWTH OF BEANS Arner Soc Aglon Jour 35 796-810 illus
(2) BASSLAVSKAYA s S 1936 INFLUENCE OF THE CHLORIDE ION ON THE CONTENT OF CARBOshy
HYDBATES IN POTATO LEAVES Plant Physiol 11 863-871 illus
(3) --- and SYROESHKINA M 1936 INFLUENCE OF THE CHLORIDE ION ON THE CONTENT OF CHLOROPHYLL
IN THE LEAVES OF POTATOES Plant Physio 11 149-157 mus
(4) BODMAN G B and DAY P R 1943 FREEZING POINTS OF A GROUP OF CALIFORNIA SOILS AND THEIR
EXTRACTED CLAYS Soil Sci 55 225-246 mus
(5) BUEHRER T F and ROSE M S 1943 STUDIES IN SOIL STRUCTURE V BOUND WATER IN NORMAL AND
PUDDLED SOILS Ariz Agr Expt Sta Tech Bu 100 pp [154]-218 illus
(6) EATON F M 1941 WATER UPTAKE AND GROWTH AS INFLUENCEIJ BY INEQUALITIES
U THE CONCENTRATION OF THE SUBSTRATE Plant Physio 16 515-564 illus
(7) --- and SOKOLOFF V P
bull 1935 ABSORBED SODIUM IN SOILS AS AFFECTED BY THE SOIL-WATER
RATIO Soil Sci 40 237-247 (8) FURR J R and REEVE J O
1945 RANGE OF SOIL-MOISTURE PERCENTAGES THROUGH WHICH PLANTS UNDERGO PERMANENT WILTING IN SOME SOILS FROM SEMIARID IRRIGATED AREAS Jour Agr Res 71 149-170 mus
(9) GAPON E N 1933 ON THE THEORY OF EXCHANGE ADSOBPTION IN SOILS Jour Gen
Chern [U S S R] 3 144-163 illus
(10) HERRICK E M 1933 SEASONAL AND DIURNAL VARIATIONS IN THE OSMOTIC VALUES
AND SUCTION TENSION VALUES IN THE AERIAL PORTIONS OF AMBROSIA TRlFIDA Arner Jour Bot 20 18-34 illus
(11) HIBBARD R P and HARRINGTON O E bull 1916 THE DEPRESSION OF THE FREEZING POINT IN TRITURATED PLANT
TISSUES AND THE MAGNITUDE OF ITS DEPRESSION AS RELATED TO SOIL MOISTURE Physio Res 1 441-454
(12) KELLEY O J HUNTER A S and HOBBS C H 1945 THE EFFECT OF MOISTURE STRESS ON NURSERY-GROWN GUAYULE
WITH RESPECT TO THE AMOUNT AND TYPE OF GROWTH AND GBOWTH BESPONSE ON TRANSPLANTING Arner Soc Agron Jour 37 194-216 mus
(13) LONG E M 1943 THE EFFECT OF SALT ADDITIONS TO THE SUBSTRATE ON INTAKE OF
WATER AND NUTRIENTD BY ROOTS OF APPROACH GRAFTED TOMATO PLANTS Arner Jour Bot 30 594-601
(14) MAGISTAD O C FIREMAN M and MABRY B
bull 1944 COMPARISON OF BASE-EXCHANGE EQUATIONS FOUNDED ON THE LAW
OF MASS ACTION Soil Sci 57 371-379 (15) REITEMEIER R F
1943 SEMIMICROANALYSIS OF SALINE SOIL SOLUTIONS Indus and Engin Chern Analyt Ed 15 393-402 illus
(16) 1946 EFFECT OF MOISTURE CONTENT ON THE DISSOLVED AND EXCHANGEshy
ABLE IONS OF SOILS OF ARID BEGIONS Soil Sci 61 195-214 illus
34 TECHNICAL BULLETIN 925 U S DEPT OF AGRICULTURE
(17) REITEMEIER R F and RICHARDS L A 1944 RELIABILITY OF THE PRESSURE-MEMBRANE METHOD FOR EXTRACshy
TION OF SOIL SOLUTION Soil Sci 57 119-135 illus (18) RICHARDS L A bull
1941 A PRESSURE-MEMBRANE EXTRACTION APPARATUS FOR SOIL SOLUshyTION Soil Sci 51 377-386 illus
(19) --- and WEAVER L R 1944 MOISTURE RETENTION BY SOME IRRIGATED SOILS AS RELATED TO
SOIL-MOISTURE TENSION Jour Agr Res 69 215-235 illus (20) SCHNEIDER G W and CHILDERS N F
1941 INFLUENCE OF SOIL MOISTURE ON PHOTOSYNTHESIS RESPIRATION AND TRANSPIRATION OF APPLE LEAVES Plant Physio 16 565-583 illus
(21) SCOFIELD C S 1932 MEASURING THE SALINITY OF IRRIGATION WATEHS AND OF SOIL
SOLUTIONS WITH THE WHEATSTONE BRIDGE U S Dept Agr Cir 232 16 pp illus
(22) SHAW C F 1927 THE NORMAL MOISTURE CAPACITY OF SOILS Soil Sci 23
303-317 illus (23) SIGMOND E [SIGMOND A A J DE]
1938 THE PRINCIPLES OF SOIL SCIENCE 362 pp illus London (24) VANONI I E and CONRAD J P
1942 CALCIUM- AND SULFATE-ION CONCENTRATIONS IN A SOIL RECEIVshyING EXCESS GYPSUM AS INFLUENCED BY SEVERAL FACTORS Soil Sci 53 125-133
(25) VEIHMEYER F J and HENDRICKSON A H 1934 SOME PLANT AND SOIL-MOISTURE RELATIONS Amer Soil Survey
Assoc Bul 15 76-80 illus (26) WADLEIGH C H
1946 THE INTEGRATED SOIL MOiSTURE STRESS UPON A ROOT SYSTEM bullIN A LARGE CONTAINER OF SALINE SOIL Soil Sci 61 225-238 illus
(27) and AVERS A D 1945 GROWTH AND BIOCHEMICAL COMPOSITION OF BEAN PLANTS AS
CONDITIONED BY SOIL MOISTURE TENSION AND SALT CONCENshyTRATION Plant Physiol 20 106-132 ilIus
(28) and GAUCH H G 1944 THE INFLUENCE OF BlGH CONCENTRATIONS OF SODIUM SULFATE
SODIUM CHLORIDE CALCIUM CHLORIDE AND MAGNESIUM CHLOshyRIDE ON THE GROWTH OF GUAYULE IN SAND CULTURES Soil Sci 58399-403 illus
(29) GAUCH H G and DAVIES V 1943 THE TREND OF STARCH RESERVES IN BEAN PLANTS BEFORE AND
AFTER IRRIGATION OF A SALTNE SOIL Amer Soc Hort Sci Proc 43 201-209 ilIus
FOIsale by the SupelintCndent oC Documents U S Government Printing Office Washington 25 D C - Price IOc
bull u s GOVERNIENT PRINTING OFFICE 1946-700378