Embed Size (px)
Citation preview
Journal of Tropical Forest Science 20(1): 66–75 (2008)66
GROWTH AND VOLUME EQUATIONS DEVELOPED FROM STEM ANALYSIS FOR TECTONA GRANDIS IN COSTA RICA
D. Perez
Apartado 733-2250, Tres Rios, Cartago, Costa Rica. E-mail: [email protected]
Received March 2007
PEREZ, D. 2008. Growth and volume equations developed from stem analysis for Tectona grandis in Costa Rica. Management prescriptions and growth projections for Tectona grandis in Costa Rica very often lack high quality supporting data. The present research focused on the use of stem analysis techniques for constructing diameter at breast height (dbh), total height and volume equations, and their comparison with existing models developed from temporal and permanent sample plots. A total of 25 trees, with ages between 8 and 46 years, dbh between 9.4 and 55.4 cm, and total height between 12.4 and 33.3 m, were felled for stem analysis. Previous developed models for teak in Costa Rica using sample plot databases were satisfactorily ‘duplicated’ by models developed with stem analysis data. Stem analysis has proven to be a useful tool for creating a growth database in the absence of consecutive measurements or for supporting existing chronological databases.
Keywords: Tree-ring, management, projections, silviculture, wood quality
PEREZ, D. 2008. Model pertumbuhan dan model isi padu yang dibangunkan daripada analisis batang pokok Tectona grandis di Costa Rica. Penentuan pihak pengurusan dan unjuran pertumbuhan pokok Tectona grandis di Costa Rica kerap kekurangan data sokongan berkualiti tinggi. Kajian ini menumpu kepada penggunaan teknik analisis batang untuk membangunkan model-model diameter aras dada (dbh), jumlah ketinggian dan isi padu serta membandingkan model-model ini dengan model terdahulu yang dibangunkan daripada plot sampel sementara dan plot kekal. Sebanyak 25 batang pokok antara usia 8 tahun dengan 46 tahun, dbh antara 9.4 cm dengan 55.4 cm dan jumlah ketinggian antara 12.4 m dengan 33.3 m ditebang untuk analisis batang. Model yang dibangunkan menggunakan analisis batang memberi keputusan yang sama dengan model terdahulu yang dibangunkan untuk pokok jati di Costa Rica menggunakan pangkalan data plot sampel. Analisis batang terbukti alat yang berguna untuk membangunkan pangkalan data pertumbuhan apabila tiada terdapat ukuran berturutan atau untuk menyokong pangkalan data kronologi yang sedia ada.
INTRODUCTION
Forest plantations provides high return on investment and high quality wood timber. In Costa Rica and many other countries in Central America, reforestation projects represent a considerable portion of the overall forested areas and are a primary source of income. Tectona grandis has been one of the most preferred species for investment opportunities, due to its high wood quality and excellent growth performance. Management prescriptions and growth projections for T. grandis in Costa Rica very often lack high quality supporting data. Within the next 10 years, most of the teak plantations in Costa Rica will be thinned for a third or forth time, or even harvested at rotation ages of between 20 and 30 years. Information on wood prices, management options and related costs, final
yield (total and merchantable volume according to market requirements), management options, and growth/yield projections are urgently needed to derive the real stock and estimated value of T. grandis available in the country. Temporary sample plots provide one-time measurements; their use requiring strong assumptions that are usually violated in practice (Clutter et al. 1983, Walters et al. 1989). When available, sequences of consecutive measurements on permanent sample plots are widely considered the best basis for prediction of individual and stand development. Tree-ring or stem analysis in the tropics exists more than 100 years ago (Worbes 2002). Stem analysis reconstructs past diameter and height growth from growth ring observations on dissected sample trees (Dahms 1963, Curtis 1964). From the diameter and
Journal of Tropical Forest Science 20(1): 66–75 (2008) 67
height growth information, changes in stem form, and hence, in volume growth, can be determined for a given tree. Less intensive stem analysis procedures are employed to determine tree taper and current volume. A major use of stem analysis is in reconstructing a tree height development for fitting height–age equations (Dyer & Bailey 1987). Several studies on stem analysis have been carried out for modelling different growth parameters and for a variety of forest species. Garcia (2005) compared site index models developed with stem analysis data and permanent sample plot data for Pinus pinaster in northern Spain. Drake et al. (2003) carried out a retrospective evaluation (by means of stem analysis) for determining a thinning opportunity in a 24-year-old Douglas fir (Pseudotsuga menziesii) stand in Chile, while Dyer and Bailey (1987) tested six methods for estimating true heights from stem analysis data using 28 loblolly pine trees in Georgia. In other similar studies, yield tables and volume equations were developed using stem analysis data (Reed & Green 1984, Rosot et al. 1993). Stem analysis had also been implemented for evaluating pruning regimes and environmental relationships (Fritts 1990, Friedl et al. 1997). Very few studies on stem analysis in Costa Rica have been reported in the literature. Perez et al. (1999) carried out stem analysis of 8- to 46-year-old T. grandis trees in Costa Rica as an aid for supporting the sample plot data collected and used for construction of empirical growth models and management scenarios. Mora and Gomez (2003) developed volume tables and equations by means of stem analysis of T. grandis trees in the Pacific region of Costa Rica. This paper deals with three different kinds of models that differ in scope, difficulty and in limitations of stem analysis as a data source:1. The use of stem analysis data for developing volume tables/equations 2. Stand height growth models3. Yield projections The present research focused on the use of stem analysis techniques for constructing diameter at breast height (dbh), total height and volume equations, and their comparison with existing models developed from temporal and permanent sample plots (TSP, PSP). The
study is aimed at identifying possible scopes for implementing the technique of stem analysis when data from sample plot measurements are scarce or absent, or simply not enough for developing proper growth projections and management guidelines.
MATERIALS AND METHODS
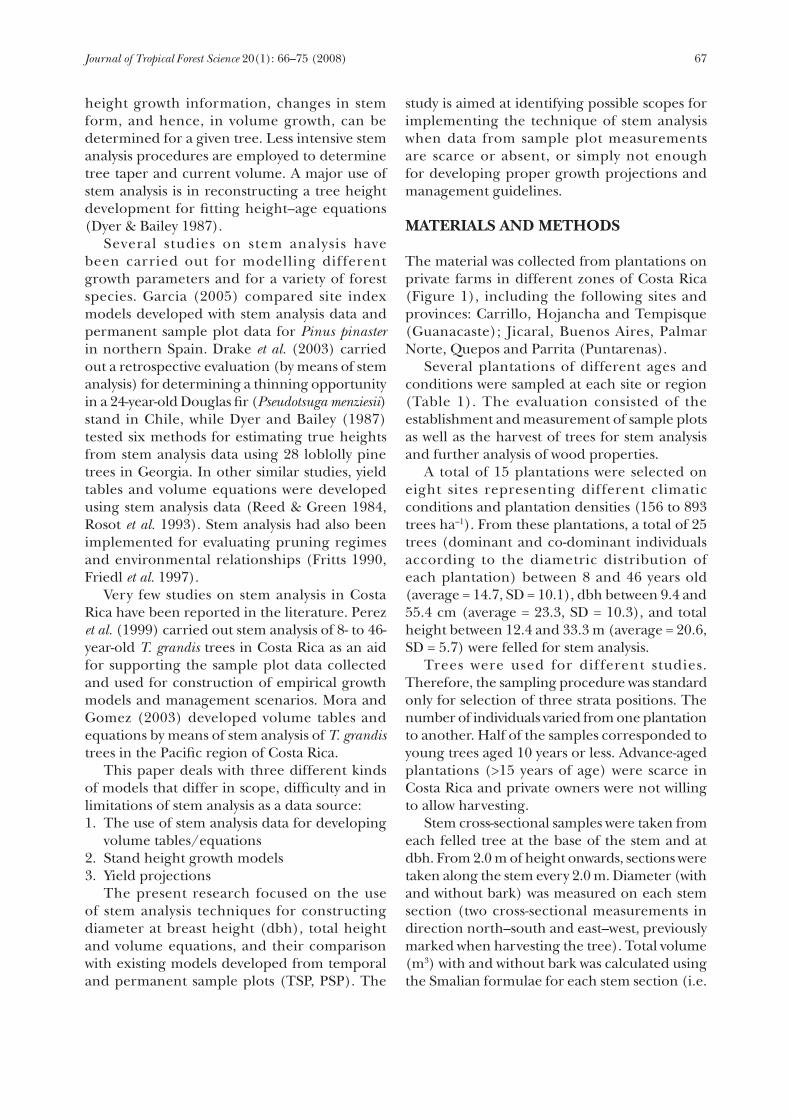
The material was collected from plantations on private farms in different zones of Costa Rica (Figure 1), including the following sites and provinces: Carrillo, Hojancha and Tempisque (Guanacaste); Jicaral, Buenos Aires, Palmar Norte, Quepos and Parrita (Puntarenas). Several plantations of different ages and conditions were sampled at each site or region (Table 1). The evaluation consisted of the establishment and measurement of sample plots as well as the harvest of trees for stem analysis and further analysis of wood properties. A total of 15 plantations were selected on eight sites representing different climatic conditions and plantation densities (156 to 893 trees ha–1). From these plantations, a total of 25 trees (dominant and co-dominant individuals according to the diametric distribution of each plantation) between 8 and 46 years old (average = 14.7, SD = 10.1), dbh between 9.4 and 55.4 cm (average = 23.3, SD = 10.3), and total height between 12.4 and 33.3 m (average = 20.6, SD = 5.7) were felled for stem analysis. Trees were used for different studies. Therefore, the sampling procedure was standard only for selection of three strata positions. The number of individuals varied from one plantation to another. Half of the samples corresponded to young trees aged 10 years or less. Advance-aged plantations (>15 years of age) were scarce in Costa Rica and private owners were not willing to allow harvesting. Stem cross-sectional samples were taken from each felled tree at the base of the stem and at dbh. From 2.0 m of height onwards, sections were taken along the stem every 2.0 m. Diameter (with and without bark) was measured on each stem section (two cross-sectional measurements in direction north–south and east–west, previously marked when harvesting the tree). Total volume (m3) with and without bark was calculated using the Smalian formulae for each stem section (i.e.
Journal of Tropical Forest Science 20(1): 66–75 (2008)68
Figure 1 Location of Tectona grandis plantations evaluated in Costa Rica. For site codes, see Table 1.
Table 1 General data from research sites in Costa Rica where teak plantations were evaluated and trees were harvested for stem analysis
Site Dry Mean annual code Location Precipitation months Elevation temperature Stand density Ageb
(mm year–1)a (m) (oC) (trees ha–1) (years)
1 Carrillo 1659 6 100 26.1 667-736 8-10 2 Jicaral 1659 6 85 26.8 333-750 11-18 3 Tempisque 1901 6 30 27.1 389 14-20 4 Garza 2205 6 90 25.9 816 6 5 San Carlos 3393 1 90 26.1 640-1600 8 6 Parrita 3117 3 25 26.0 156-541 13-47 7 Quepos 3900 3 70 25.9 775 19 8 Palmar Norte 3644 3 80 27.0 893 23 9 Buenos Aires 3627 4 300 27.0 357 27
a Months with less than 100 mm annual rainfallb Single age entry means that sampled trees were of the same age (does not mean average age).
N
Journal of Tropical Forest Science 20(1): 66–75 (2008) 69
0.0–1.3, 1.3–2.0, 2.0–4.0, 4.0–6.0 m, etc.). The last stem section (from the last taken disc to the tip of the tree) was calculated as a geometric cone. On each stem section, the growth rings were counted and measured from pith to bark, following the direction north–south (previously marked in the field). Measurements were carried out using a caliper to a precision of ± 1.0 mm. Any sector of the cross-sectional sample with any irregularity was discarded and the radial measurements were taken in the next clear portion of the sample. The bark thickness at different ages was estimated as a percentage of the stem diameter without bark based on the relationship at the moment of harvesting. Of the 25 sample trees, a total of 368 samples (cross-sections) were obtained from stem analysis. A potential bias in the estimate of tree height corresponding to a given age in a cross-cut section can arise from sectioning of the stem, and a number of studies have investigated the extent of such bias for temperate and coniferous species (Carmean 1972, Dyer & Bailey 1987). For estimating the length of the ‘hidden tip’, different methods listed by Rayner (1991) were tested, selecting that of Carmean (1972) as best procedure. Following similar procedures, growth models (age–dbh and age–total height) and volume equations developed by Perez and Kanninen (2005), and Perez and Kanninen (2003) respectively, were developed using the stem analysis database and compared. For the development of the average height growth model, the equation cited by Perez (2005) equation was used:
H = a*(1 – Expb*Age)c (1)
where H = average height (m) Age = plantation age (years) a = 60, b = -0.070, c = 1.165
For the development of the average dbh growth model, the Perez (2005) equation was used:
Dbh = a*(1 – Expb*Age)c (2)
where dbh = average dbh (m)
Age = plantation age (years) a = 35, b = -0.090, c = 1.100 For the development of the total volume model, the Perez and Kanninen (2003) equation was used:
(3)
where V = total volume over bark (m3) dbh = diameter at breast height a = -0.0884, b = 0.0297
Perez and Kanninen (2005) developed ‘competition factors’ and growth models for stand scenarios, aiming at representing the growth potential of the T. grandis under intensive management practices in Costa Rica. Based on these ecological criteria, and following the methodology used by Alder (1979), a curve of maximum observed CAIdbh values was plotted against stand basal area. An exponential function was fitted to points of maximum CAIdbh line. A second index used in this study contemplates the relationship between the size and the spatial distribution of the canopy with the amount of light intercepted by the leaves, followed by an appropriate plantation density definition for an optimum crown development and the consequent optimization of tree growth (Suri 1975, Beadle 1997). Crown closure is commonly assumed to represent the threshold of strong competitive interaction and stand development (Jack & Long 1996). Finally, a third density index was based on the concept of maximum number of trees possibly encountered in a stand and their negative correlation with the average diameter. The curve representing this relationship assumes a straight-line form when plotted on logarithmic paper and is termed the “reference curve” (Reineke 1933).
RESULTS
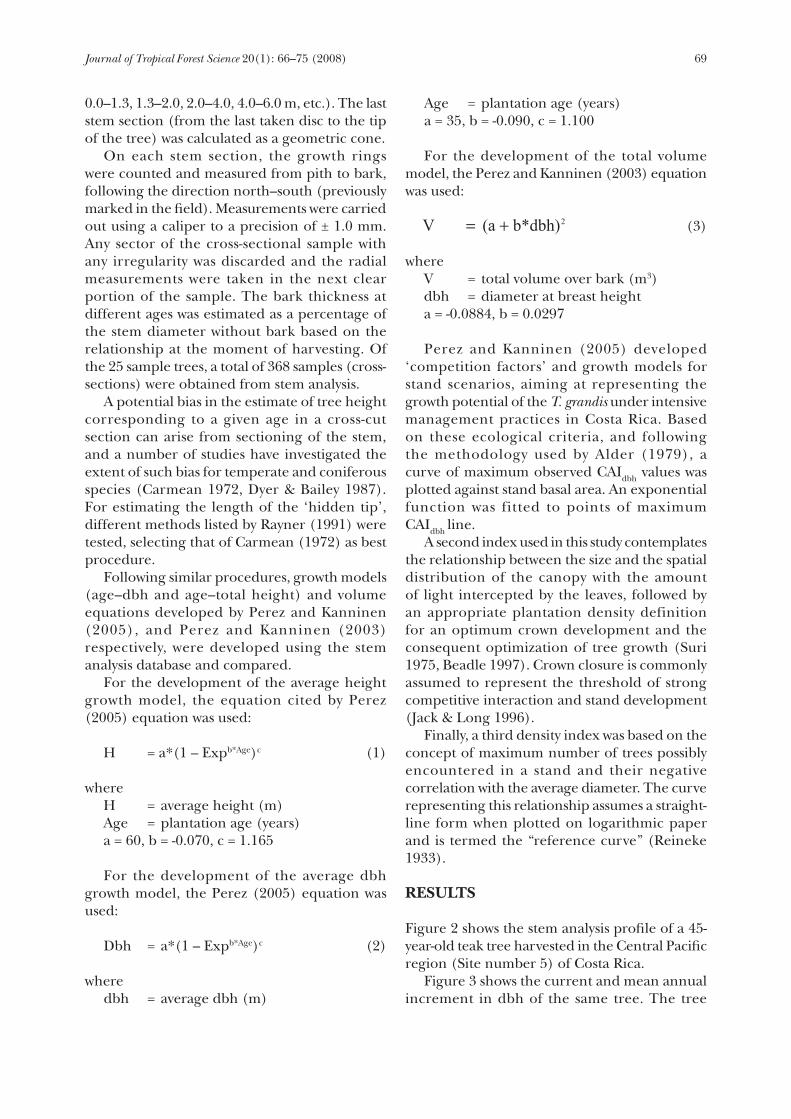
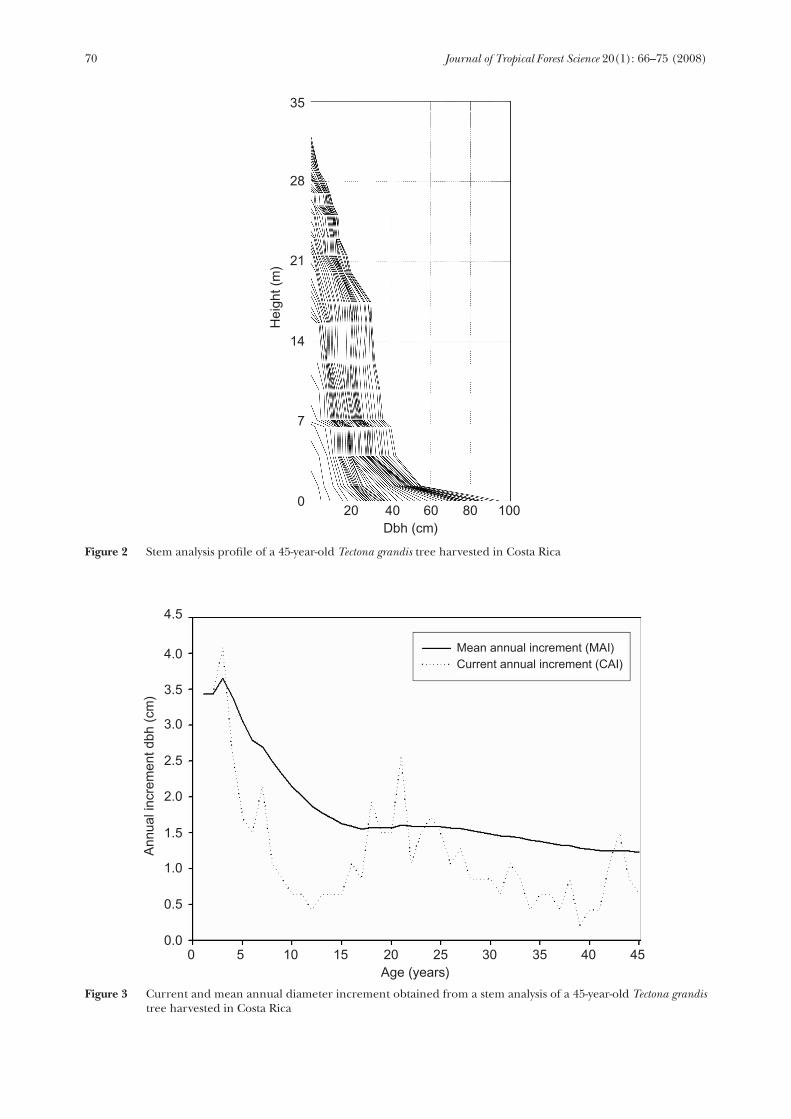
Figure 2 shows the stem analysis profile of a 45-year-old teak tree harvested in the Central Pacific region (Site number 5) of Costa Rica. Figure 3 shows the current and mean annual increment in dbh of the same tree. The tree
(a ��b*dbh)� V 2�
Journal of Tropical Forest Science 20(1): 66–75 (2008)70
Figure 2 Stem analysis profile of a 45-year-old Tectona grandis tree harvested in Costa Rica
Figure 3 Current and mean annual diameter increment obtained from a stem analysis of a 45-year-old Tectona grandis tree harvested in Costa Rica
20 40 60 80 100Dbh (cm)
35
28
21
14
7
0
Hei
ght (
m)
4.5
Ann
ual i
ncre
men
t dbh
(cm
)
4.0
3.5
3.0
2.5
2.0
1.5
1.0
0.5
0.00
Age (years)5 10 15 20 25 30 35 40 45
Mean annual increment (MAI)Current annual increment (CAI)
Journal of Tropical Forest Science 20(1): 66–75 (2008) 71
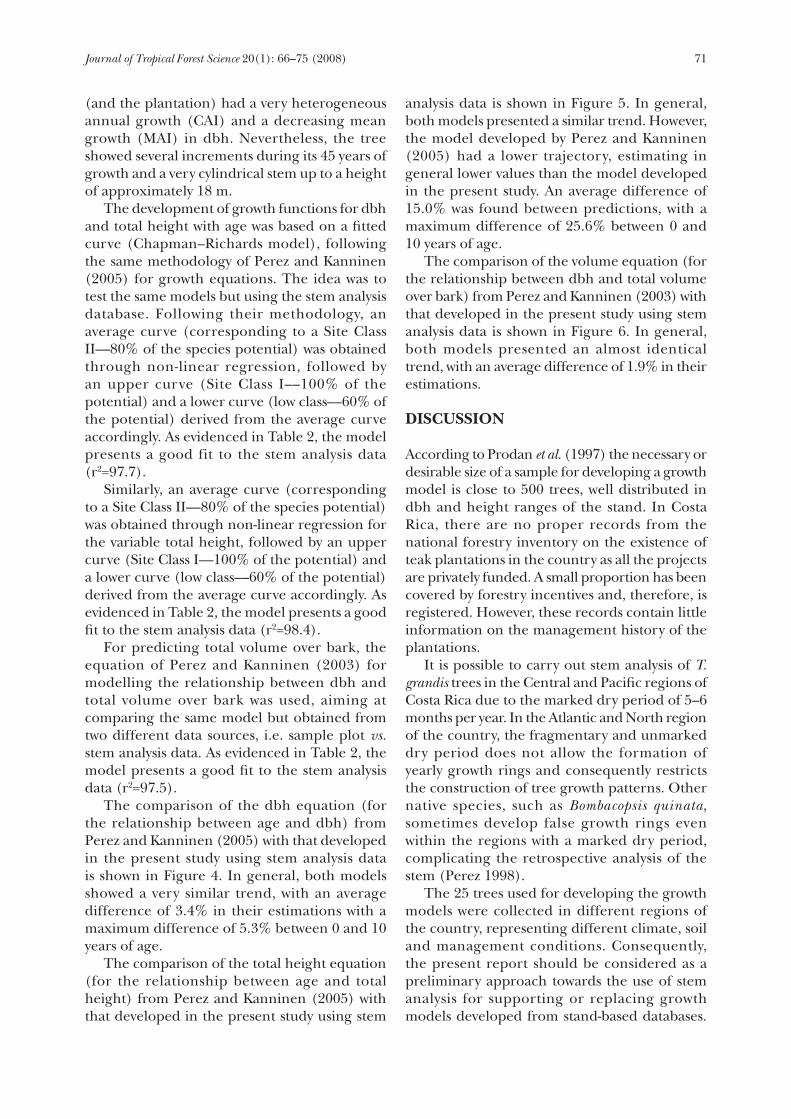
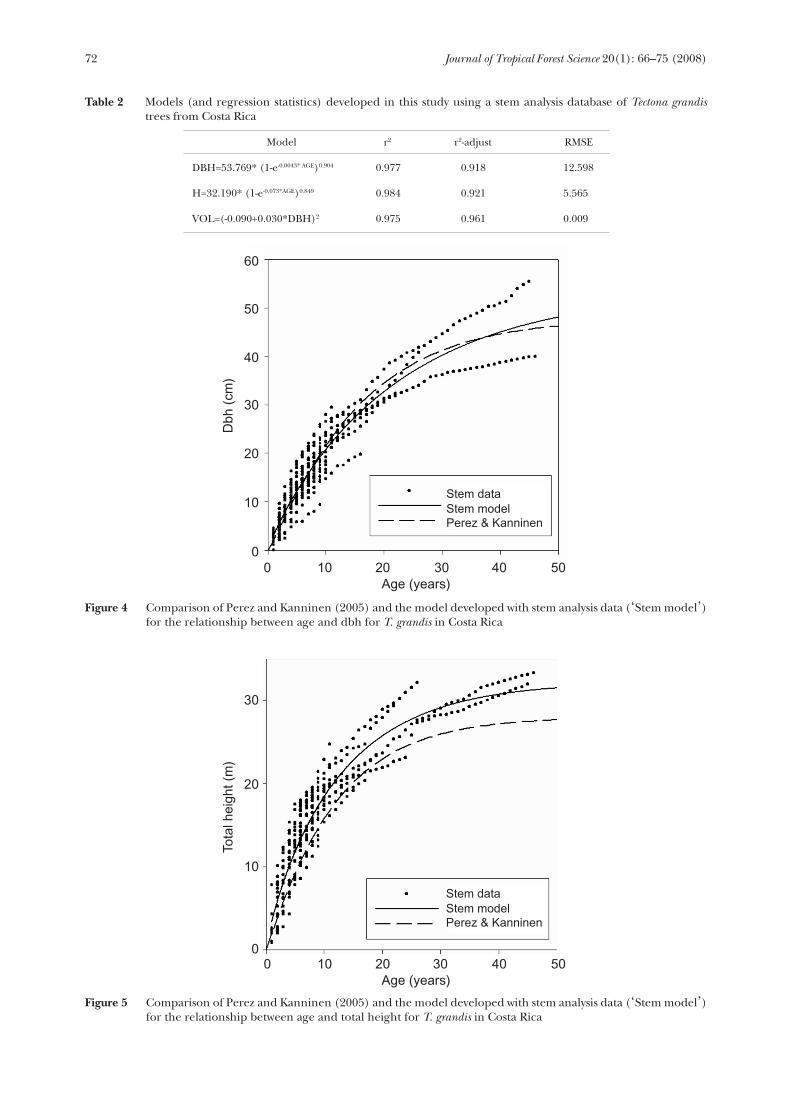
(and the plantation) had a very heterogeneous annual growth (CAI) and a decreasing mean growth (MAI) in dbh. Nevertheless, the tree showed several increments during its 45 years of growth and a very cylindrical stem up to a height of approximately 18 m. The development of growth functions for dbh and total height with age was based on a fitted curve (Chapman–Richards model), following the same methodology of Perez and Kanninen (2005) for growth equations. The idea was to test the same models but using the stem analysis database. Following their methodology, an average curve (corresponding to a Site Class II––80% of the species potential) was obtained through non-linear regression, followed by an upper curve (Site Class I––100% of the potential) and a lower curve (low class––60% of the potential) derived from the average curve accordingly. As evidenced in Table 2, the model presents a good fit to the stem analysis data (r2=97.7). Similarly, an average curve (corresponding to a Site Class II––80% of the species potential) was obtained through non-linear regression for the variable total height, followed by an upper curve (Site Class I––100% of the potential) and a lower curve (low class––60% of the potential) derived from the average curve accordingly. As evidenced in Table 2, the model presents a good fit to the stem analysis data (r2=98.4). For predicting total volume over bark, the equation of Perez and Kanninen (2003) for modelling the relationship between dbh and total volume over bark was used, aiming at comparing the same model but obtained from two different data sources, i.e. sample plot vs. stem analysis data. As evidenced in Table 2, the model presents a good fit to the stem analysis data (r2=97.5). The comparison of the dbh equation (for the relationship between age and dbh) from Perez and Kanninen (2005) with that developed in the present study using stem analysis data is shown in Figure 4. In general, both models showed a very similar trend, with an average difference of 3.4% in their estimations with a maximum difference of 5.3% between 0 and 10 years of age. The comparison of the total height equation (for the relationship between age and total height) from Perez and Kanninen (2005) with that developed in the present study using stem
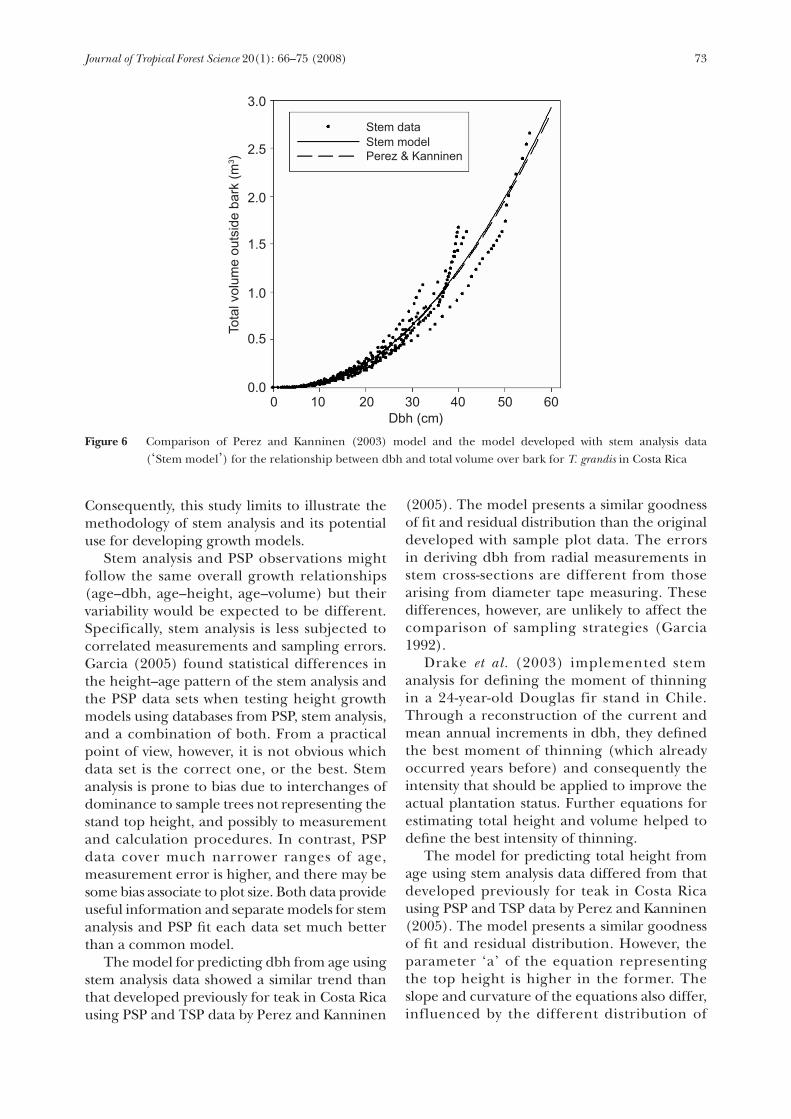
analysis data is shown in Figure 5. In general, both models presented a similar trend. However, the model developed by Perez and Kanninen (2005) had a lower trajectory, estimating in general lower values than the model developed in the present study. An average difference of 15.0% was found between predictions, with a maximum difference of 25.6% between 0 and 10 years of age. The comparison of the volume equation (for the relationship between dbh and total volume over bark) from Perez and Kanninen (2003) with that developed in the present study using stem analysis data is shown in Figure 6. In general, both models presented an almost identical trend, with an average difference of 1.9% in their estimations.
DISCUSSION
According to Prodan et al. (1997) the necessary or desirable size of a sample for developing a growth model is close to 500 trees, well distributed in dbh and height ranges of the stand. In Costa Rica, there are no proper records from the national forestry inventory on the existence of teak plantations in the country as all the projects are privately funded. A small proportion has been covered by forestry incentives and, therefore, is registered. However, these records contain little information on the management history of the plantations. It is possible to carry out stem analysis of T. grandis trees in the Central and Pacific regions of Costa Rica due to the marked dry period of 5–6 months per year. In the Atlantic and North region of the country, the fragmentary and unmarked dry period does not allow the formation of yearly growth rings and consequently restricts the construction of tree growth patterns. Other native species, such as Bombacopsis quinata, sometimes develop false growth rings even within the regions with a marked dry period, complicating the retrospective analysis of the stem (Perez 1998). The 25 trees used for developing the growth models were collected in different regions of the country, representing different climate, soil and management conditions. Consequently, the present report should be considered as a preliminary approach towards the use of stem analysis for supporting or replacing growth models developed from stand-based databases.
Journal of Tropical Forest Science 20(1): 66–75 (2008)72
Table 2 Models (and regression statistics) developed in this study using a stem analysis database of Tectona grandis trees from Costa Rica
Model r2 r2-adjust RMSE
DBH=53.769* (1-e-0.0043* AGE)0.904 0.977 0.918 12.598
H=32.190* (1-e-0.073*AGE)0.849 0.984 0.921 5.565
VOL=(-0.090+0.030*DBH)2 0.975 0.961 0.009
Figure 4 Comparison of Perez and Kanninen (2005) and the model developed with stem analysis data (‘Stem model’) for the relationship between age and dbh for T. grandis in Costa Rica
60
Dbh
(cm
)
50
40
30
20
10
00
Age (years)10 20 30 40 50
Stem dataStem modelPerez & Kanninen
0Age (years)
10 20 30 40 50
30
Tota
l hei
ght (
m)
20
10
0
Stem dataStem modelPerez & Kanninen
Figure 5 Comparison of Perez and Kanninen (2005) and the model developed with stem analysis data (‘Stem model’) for the relationship between age and total height for T. grandis in Costa Rica
Journal of Tropical Forest Science 20(1): 66–75 (2008) 73
Consequently, this study limits to illustrate the methodology of stem analysis and its potential use for developing growth models. Stem analysis and PSP observations might follow the same overall growth relationships (age–dbh, age–height, age–volume) but their variability would be expected to be different. Specifically, stem analysis is less subjected to correlated measurements and sampling errors. Garcia (2005) found statistical differences in the height–age pattern of the stem analysis and the PSP data sets when testing height growth models using databases from PSP, stem analysis, and a combination of both. From a practical point of view, however, it is not obvious which data set is the correct one, or the best. Stem analysis is prone to bias due to interchanges of dominance to sample trees not representing the stand top height, and possibly to measurement and calculation procedures. In contrast, PSP data cover much narrower ranges of age, measurement error is higher, and there may be some bias associate to plot size. Both data provide useful information and separate models for stem analysis and PSP fit each data set much better than a common model. The model for predicting dbh from age using stem analysis data showed a similar trend than that developed previously for teak in Costa Rica using PSP and TSP data by Perez and Kanninen
(2005). The model presents a similar goodness of fit and residual distribution than the original developed with sample plot data. The errors in deriving dbh from radial measurements in stem cross-sections are different from those arising from diameter tape measuring. These differences, however, are unlikely to affect the comparison of sampling strategies (Garcia 1992). Drake et al. (2003) implemented stem analysis for defining the moment of thinning in a 24-year-old Douglas fir stand in Chile. Through a reconstruction of the current and mean annual increments in dbh, they defined the best moment of thinning (which already occurred years before) and consequently the intensity that should be applied to improve the actual plantation status. Further equations for estimating total height and volume helped to define the best intensity of thinning. The model for predicting total height from age using stem analysis data differed from that developed previously for teak in Costa Rica using PSP and TSP data by Perez and Kanninen (2005). The model presents a similar goodness of fit and residual distribution. However, the parameter ‘a’ of the equation representing the top height is higher in the former. The slope and curvature of the equations also differ, influenced by the different distribution of
3.0
Tota
l vol
ume
outs
ide
bark
(m
3 )
2.5
2.0
1.5
1.0
0.5
0.00
Dbh (cm)10 20 30 40 50 60
Figure 6 Comparison of Perez and Kanninen (2003) model and the model developed with stem analysis data (‘Stem model’) for the relationship between dbh and total volume over bark for T. grandis in Costa Rica
Stem dataStem modelPerez & Kanninen
Journal of Tropical Forest Science 20(1): 66–75 (2008)74
datasets. In both cases, the limited availability of growth data (ages higher than 10 years) may be influencing the encountered differences. Nevertheless, a difference of 3 m in estimating the total height of a 20-year-old stand may occur as well with PSP data, considering the implied errors of height measurements as well as the inherent height variability. Nevertheless, this error of 3 m when estimating total height with the developed models of this study must be considered. Many studies have used stem analysis data for developing height and site index models (Dyer & Bailey 1987, Rayner 1991, Garcia 2005). Friedl et al. (1997) implemented the technique of stem analysis for developing a pruning methodology for Pinus taeda in Argentina. The use of height–age relationships obtained from stem analysis helped to define the moments and intensities of pruning as part of a comprehensive analysis of stem profile and knotted-free core projections. The model for predicting total volume from dbh using stem analysis data showed a very similar trend than that developed previously for teak in Costa Rica using PSP and TSP data by Perez and Kanninen (2005). The model presents a similar goodness of fit and residual distribution than the original developed with sample plot data. In addition, the volume equation of Perez and Kanninen (2003) has been previously compared with models developed in Costa Rica and elsewhere and found to be one of the best models available for the estimation of total volume of teak in Costa Rica (Gomez & Mora 2003). Consequently, it can be assumed that the volume equation developed using stem analysis information is suitable for predicting total volume of teak trees in Costa Rica. As dbh is certainly influenced by stand density and inter-tree competition, only dynamic models can explain the influence of thinning on tree growth. Nevertheless, the stem analysis technique may explain this effect to some extent, as the thinning can be accounted in the cross-section profile of trees as evidenced in Figure 3.
CONCLUSIONS
Stem analysis has proven to be a useful tool for creating a growth database in the absence of consecutive measurements or for supporting existing chronological databases. However, stem analysis technique should be used as support
to Permanent Sample Plot data for developing growth models. Previous developed models for teak in Costa Rica using sample plot databases were satisfactorily ‘duplicated’ by models developed with stem analysis data. Present models were developed using a database of harvested trees in different regions in Costa, therefore the use of these models should be preceded by a local calibration if high precision is expected. It is recommended to enlarge the present study with more stem analysis coming from trees older than 15 years. A more efficient tree selection strategy should be developed for any large study on stem analysis.
REFERENCES
A LDER, D . 1979 . A d i s tance - independent t ree model for exotic conifer plantations in East Africa. Forest Science 25: 59–71.
BEADLE, C. L. 1997. Dynamics of leaf and canopy development. Pp. 169–204 in Sadanandan Nambiar, E. K. & Brown A. G. (Eds.) Management of Soil, Nutrients and Water in Tropical Plantation Forests. Australian Centre for International Agricultural Research, Canberra.
CARMEAN, W. H. 1972. Site index curves for upland oaks in the Central States. Forest Science 18: 102–120.
CLUTTER, J. L., FORTSON, J. C., PIENAAR, L. V., BRISTER, G.H. & BAILEY R. L. 1983. Timber Management: a Quantitative Approach. Wiley, New York.
CURTIS, R. O. 1964. A stem-analysis approach to site–index curves. Forest Science 10: 241–256.
DAHMS, W. G. 1963. Correction for possible bias in developing site index curves from sectioned tree data. Journal of Forestry 61: 25–27.
DRAKE, F., ACUÑA, E. & SALAS, S. 2003. Evaluacion retrospectiva para determinar la oportunidad de raleo en un rodal de pino oregon de 24 años. Bosque 24: 85–91.
DYER, M. E. & BAILEY, R. L. 1987. A test of six methods for estimating true heights from stem analysis data. Forest Science 33: 3–13.
FRIEDL, R. A., GELID, M., BERNIO, J. C. & ISIDRO, F. 1997. Aplicacion del analisis fustal en la evaluacion de regimens de poda en Pinus taeda en Misiones, Argentina. Yvyrareta 8: 22–34.
FRITTS, H. C. 1990. Modeling tree-ring and environmental relationships for dendrochronological analysis. In Process Modeling of Forest Growth Responses to Environmental Stress. Timber Press, Portland.
GARCIA, O. 1992. Sampling for tree-ring analysis. Paper presented at the IUFRO Conference ‘Integrating Forest Information over Space and Time’. 13–17 January 1992, Canberra.
GARCIA, O. 2005. Comparing and combining stem analysis and permanent sample plot data in site index models. Forest Science 51: 277–283.
Journal of Tropical Forest Science 20(1): 66–75 (2008) 75
GOMEZ, M. & MORA, F. 2003. Comparacion de modelos y unificacion de ecuaciones de volumen para arboles individuales en plantaciones de teca (Tectona grandis) en Costa Rica. In Chaves, E. (Ed.) Plantaciones de Teca-Posibilidades y Perspectivas Para su Desarrollo. INISEFOR, Universidad Nacional, Heredia.
JACK, S. B. & LONG, J. N. 1996. Linkages between silviculture and ecology: an analysis of density management diagrams. Forest Ecology and Management 86: 205–220.
MORA, F. A. & GOMEZ, M. 2003. Ecuaciones y tablas de volumen para arboles individuales en plantaciones de teca de la vertiente atlantica de Costa Rica. In Chaves, E. (Ed.) Plantaciones de Teca-Posibilidades y Perspectivas Para su Desarrollo. INISEFOR, Universidad Nacional, Heredia.
PEREZ, D. 1998. Desarrollo de escenarios de crecimiento con base en la relacion de la composición y la estructura de copa con la productividad en plantaciones de Tectona grandis y Bombacopsis quinata en Costa Rica. MSc thesis, CATIE, Turrialba.
PEREZ, D. 2005. Stand growth scenarios for Tectona grandis plantations in Costa Rica. PhD thesis, University of Helsinki.
PEREZ, D. & KANNINEN, M. 2003. Provisional equations for estimating total and merchantable volume of Tectona grandis trees in Costa Rica. Forests, Trees and Livelihoods 13: 345–359.
PEREZ, D. & KANNINEN, M. 2005. Stand growth scenarios for Tectona grandis plantations in Costa Rica. Forest Ecology and Management 210: 425–441.
PEREZ, D., UGALDE, L. A. & KANNINEN, M. 1999. Desarrollo de escenarios de crecimiento para plantaciones de teca (Tectona grandis) en Costa Rica. Revista Forestal Centroamericana 31: 16–22.
PRODAN, M., PETERS, R., COX, F. & REAL, P. 1997. Mensura Forestal. Proyecto IICA/GTZ sobre Agricultura, Recursos Naturales y Desarrollo Sostenible. IICA, BMZ/GTZ, San Jose, Costa Rica.
RAYNER, M. E. 1991. Estimation of true height from karri (Eucalyptus diversicolor) stem analysis data. Australian Forest 54: 105–108.
REED, D. D. & GREEN, E. J. 1984. Compatible stem taper and volume ratio equations. Forest Science 30: 977–990.
REINEKE, L. H. 1933. Perfecting a stand-density index for even-aged forests. Journal of Agricultural Research 46: 627–638.
ROSOT, N. C., EMERENCIANO, D. B. & ROSOT, M. A. 1993. Yield tables for Araucaria angustifolia plantations by stem analysis in southern Brazil. In Growth and yield estimation for successive forest inventories. Forskningsserien 3: 239–249.
SURI, S. K. 1975. Correlation studies between bole diameter and crown projection area as an aid to thinning. Indian Forester 101: 539–549.
WALTERS, D. K., GREGOIRE, T. G. & BURKHART, H. E. 1989. Consistent estimation of site index curves fitted to temporary plot data. Biometrics 45: 23–33.
WORBES, M. 2002. One hundred years of tree-ring research in the tropics––a brief history and an outlook to future challenges. Dendrochronologia 20: 217–232.


![04 - kinematic equations - kinematics of growthbiomechanics.stanford.edu/me337_12/me337_s04.pdf · 04 - kinematic equations - kinematics of growth ... [2] kinematics of growth 16](https://img.pdfslide.net/doc/110x75/5b634e617f8b9af84b8bbf38/04-kinematic-equations-kinematics-of-04-kinematic-equations-kinematics.jpg)