Embed Size (px)
Citation preview
* Research Scholar, School of Social Sciences, Guru Nanak Dev University, Amritsar** Senior Assistant Professor, School of Social Sciences, Guru Nanak Dev University, Amritsar
GROWTH DRIVERS FOR INDIA AND CHINA:A COMPARISON
Richika Nanda* and Anjali Mehra**
Abstract: The study attempts to discuss the major growth drivers of India and China; for thisa comprehensive analysis is made by taking socio economic variables for both countries for 30years. The results show that in India tertiary sector variables are influencing growth whileindustry related variables are retarding growth. On the other hand, in case of China variablesrelated to physical infrastructure affect economic growth positively whereas variables relatedto demographics are negatively affecting economic growth along with weak social infrastructure.
Key Words: Reforms, Growth Drivers, Sustained economic growth, Growth retarders,Growth Enhancers
JEL Classification: O1, O2, O4
INTRODUCTION
China and India, the two surplus labour countries, were noted for their strengthand might in the past but the recent history of these countries is replete withcolonization and feudal incompetence personifying these countries with theeconomic stagnation during 18th to mid 19th century. These countries, consideredas economic laggards, were engrossed in their problems like poverty,unemployment, impoverishment, lack of self sustainability etc. and weredesignated to play the peripheral roles in the global economy. At the time ofindependence, both countries shared similar structural problems with highunemployment, poverty and inequality prevailing in the economy, but with dawnof the twenty first century, the policy makers in these countries started realizingthat the foundation of credible national security and quality of life is based on thewell being of their population. Thus, there was a change in the attitude ofpolicymakers with a shift towards industrial and service sectors in comparison tothe agriculture sector to ensure employment and reduction of poverty andinequality. The rise of these countries from peripheral status created by decades ofimperialist controls is the result of gradual market reforms and global integrationundertaken by them. The ever increasing demand matched with supply of goods
I J A B E R, Vol. 13, No. 3, (2015): 1113-1131
1114 � Richika Nanda and Anjali Mehra
and services has resulted in China becoming a global supplier of manufacturedgoods and India becoming the world’s BPO. China and India termed as ‘twinengines of economic growth’(term coined by Jim O Neillfrom Gold man Sachsin2005) are also amongst BRICS nations Acknowledging the remarkableperformance of China and India, in its Super Cycle Report the Standard CharteredBank predicted that the world economy would reach $308 trillion by 2030 andChina and India would be $73 trillion economy and $30 trillion economiesrespectively. (ET News Service, 2011).
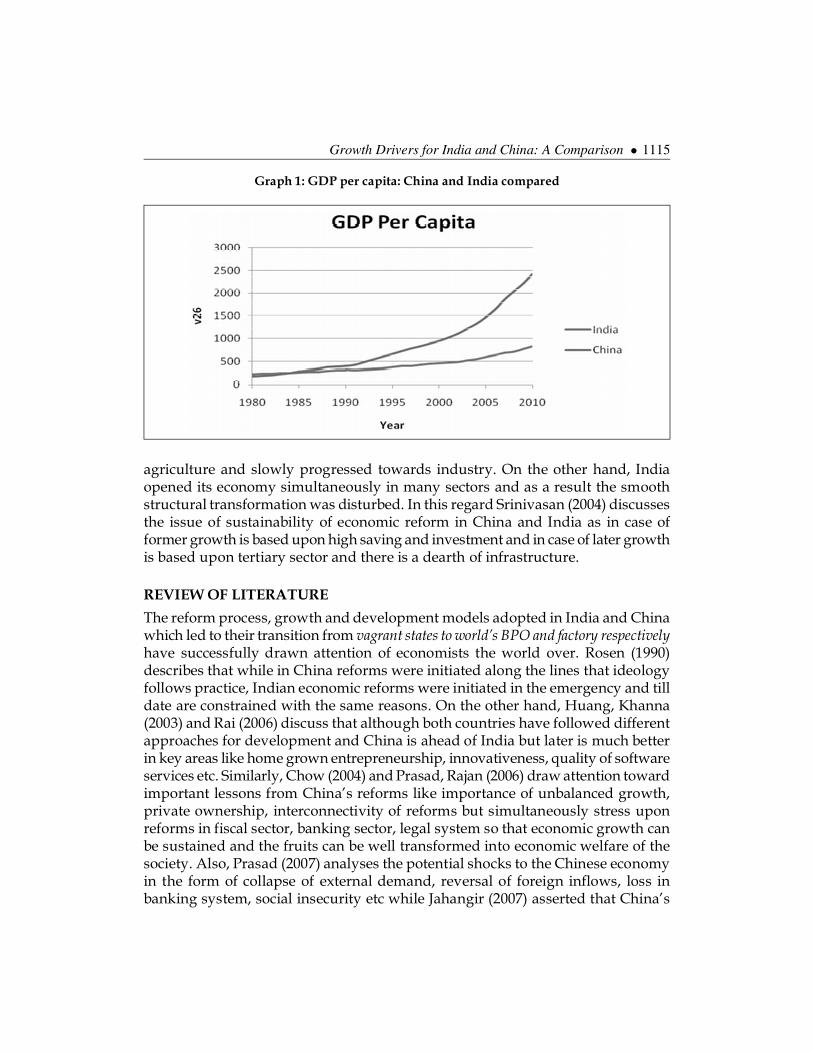
Main highlights of economic reform in these countries is given in the tablebelow and their impact on GDP per capita can be analysed from the graph whichfollows the table:
Table 1Timeline of economic reforms in India
S. No. Time period Main features
1 1980- 1990 Export incentives, Relaxation in industrial controls, Expansion in theopen general license list etc.
2 1990 onwards • Macroeconomic reforms like reduction in food and fertilizersubsidies, reduction in public expenditure, taxation reforms etc.
• Sector specific reforms like abolishment of import licensing,opening up of SEZs, deregulation of domestic industry, initiationof public enterprise reform, reduction in reserved industries,banking sector reforms like strengthening of capital base,introduction of prudent norms.
3 2000 onwards Opening up of insurance sector, continued disinvestment in publicsector enterprises, reforms in infrastructure sector, allowing of FDI inretail, pension reform etc.
Source:Authors’ preparations
Table 2Timeline of economic reforms in China
S. No. Time period Main features
1 1980 onwards Household responsibility system in agriculture, open door policytowards FDI, township and village enterprises reform setting up ofexport promotion zones, price reforms etc.
2 1994 onwards Fiscal reforms, banking reforms were strengthened, educationreforms, legal system reforms etc.
Source:Authors’ preparations
The graph shows that GDP per capita has increased in both the countries from1980 but the increase in China’s GDP is more sharp and it can be concluded thatthe sequencing of economic reforms is very important if the desired results are tobe achieved; China has gained on this account as it started its reforms with
Growth Drivers for India and China: A Comparison � 1115
agriculture and slowly progressed towards industry. On the other hand, Indiaopened its economy simultaneously in many sectors and as a result the smoothstructural transformation was disturbed. In this regard Srinivasan (2004) discussesthe issue of sustainability of economic reform in China and India as in case offormer growth is based upon high saving and investment and in case of later growthis based upon tertiary sector and there is a dearth of infrastructure.
REVIEW OF LITERATURE
The reform process, growth and development models adopted in India and Chinawhich led to their transition from vagrant states to world’s BPO and factory respectivelyhave successfully drawn attention of economists the world over. Rosen (1990)describes that while in China reforms were initiated along the lines that ideologyfollows practice, Indian economic reforms were initiated in the emergency and tilldate are constrained with the same reasons. On the other hand, Huang, Khanna(2003) and Rai (2006) discuss that although both countries have followed differentapproaches for development and China is ahead of India but later is much betterin key areas like home grown entrepreneurship, innovativeness, quality of softwareservices etc. Similarly, Chow (2004) and Prasad, Rajan (2006) draw attention towardimportant lessons from China’s reforms like importance of unbalanced growth,private ownership, interconnectivity of reforms but simultaneously stress uponreforms in fiscal sector, banking sector, legal system so that economic growth canbe sustained and the fruits can be well transformed into economic welfare of thesociety. Also, Prasad (2007) analyses the potential shocks to the Chinese economyin the form of collapse of external demand, reversal of foreign inflows, loss inbanking system, social insecurity etc while Jahangir (2007) asserted that China’s
Graph 1: GDP per capita: China and India compared
1116 � Richika Nanda and Anjali Mehra
growth strategy has relied on high savings, high investment and high externaldemand which are viewed as unsustainable growth drivers as there can beovercapacity, deflation and exposure of economy to international forces.
Kumar U and Subramaniam A (2011) stress that with the growth ofmacroeconomic sector during 2000-2009, inequality amongst Indian states increasedand low evidence was found for demographic dividend to affect economicdynamism in the country. While Tyers, Golley and Bain (2006) in their studyprojected that with decline in China’s labor force and India’s growing populationIndia is set to become fastest growing economy in the world. Analysing anotheraspect of growth, Wu (2008) stated that Economic Growth in China and India hasnot led to catch-up effects in the relatively poor regions in these countries aspostulated by the new growth theories thus putting a question mark over theinclusiveness and balanced aspects of the economic growth. Similarly, Holscher(2010) stressed that improvement in public services could reduce rigidities inincome distribution which would enhance economic growth. While discussingsustainable economic development, Beretta and Lenti (2012) stressed upon bilateraltrade as an important and sustainable driver of economic growth between Chinaand India and right exploitation of comparative advantage of each country wouldbenefit the other with the help of trade. Also Kalyanaran GK (2008) analyzed thatChina’s growth is fuelled by input of huge resources while that of India’s growthis fuelled by efficiency and productivity which is more sustainable in the longrun.
Regarding future policy implications, Li Y and Zhang B (2008) stressed thatemerging economies trying to emulate China and India’s growth withmanufacturing and service sectors as growth engines, should utilise comparativeand absolute advantage. In addition, Garnaut (1996) identified key policy decisionsfor sustained rapid growth in China and India such as price, macroeconomic andoutput stability, which need to overcome the weak legal system and policyindecisiveness respectively in both the countries. Also for China and India, focusshould shift towards balanced growth as lopsided development based oninvestment, manufacturing and service potential could lose its effectiveness. Thussectoral balancing and structural balancing is required through reforms.
From above reviews, it is clear that there is enough literature on economicreforms, development process and its impact on agriculture, industry, infrastructureand services in economies of India and China but most studies do not focus onsustainability of reforms. In order to assess sustainability of economic growth anddevelopment, the focus should be on on the fact that in these economies the shareof natural capital (combined value of forests, energy, minerals, crop land, pastureland, protected areas and non-timber forests) surpass the value of physical capital(Barbier, 1998), as well as on the contemporary issues with which these economiesare struggling (i.e. effective utilisation of democratic dividend, ensuring transparent
Growth Drivers for India and China: A Comparison � 1117
corporate governance, reinstating business ethics etc.) regarding which very lessliterature is available. Also the studies have focussed upon one or the other aspectsof development and comprehensive studies including all the variables of socioeconomic development are very less.
Against this background, the study attempts to find out growth drivers of Indiaand China. The objectives of the study are to:
1 analyse the growth influencers in India as well as China.2 compare the retarders of economic growth in India and China so that
suitable policy measures are adopted to address them.The present study is divided into four sections including the present one:
Section II is devoted to database and methodology; Section III comparativelyanalyses the drivers of growth and the last Section IV summarises the discussionwith policy implications for both countries.
Section II: Database and Methodology
In the context of present study, secondary data has been culled from the WorldDevelopment Indicators, World Economic Outlook, Research Series of GoldmanSachs, HSBC etc. As the economic reforms in China were initiated in 1980 andmild liberalization in India also started in 1980s as well as keeping in mind theavailability of the data the time period for the study is 30 years i.e. from 1980-2010. 57 variables representing different aspects of socioeconomic development of botheconomies were selected. These include:
• Agriculture sector
• Industry variables
• Tertiary sector variables
• Demographic
• Infrastructure
1. Physical2. Social
• Macroeconomic
• External sector
The detailed variables taken against above mentioned broad sectors and labelledin the study from V1-V57 are:
V1: Agricultural Machinery, Tractors per sq. km of arable land
V2: Agricultural Land as Per cent of land area
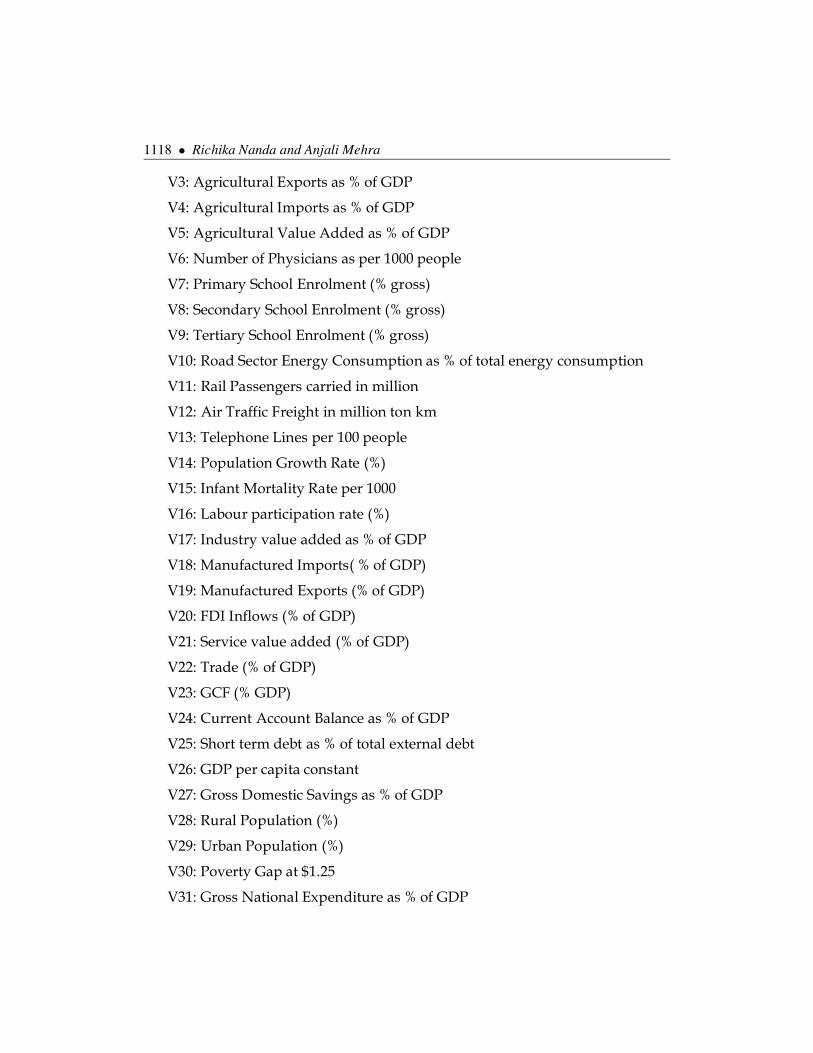
1118 � Richika Nanda and Anjali Mehra
V3: Agricultural Exports as % of GDP
V4: Agricultural Imports as % of GDP
V5: Agricultural Value Added as % of GDP
V6: Number of Physicians as per 1000 people
V7: Primary School Enrolment (% gross)
V8: Secondary School Enrolment (% gross)
V9: Tertiary School Enrolment (% gross)
V10: Road Sector Energy Consumption as % of total energy consumption
V11: Rail Passengers carried in million
V12: Air Traffic Freight in million ton km
V13: Telephone Lines per 100 people
V14: Population Growth Rate (%)
V15: Infant Mortality Rate per 1000
V16: Labour participation rate (%)
V17: Industry value added as % of GDP
V18: Manufactured Imports( % of GDP)
V19: Manufactured Exports (% of GDP)
V20: FDI Inflows (% of GDP)
V21: Service value added (% of GDP)
V22: Trade (% of GDP)
V23: GCF (% GDP)
V24: Current Account Balance as % of GDP
V25: Short term debt as % of total external debt
V26: GDP per capita constant
V27: Gross Domestic Savings as % of GDP
V28: Rural Population (%)
V29: Urban Population (%)
V30: Poverty Gap at $1.25
V31: Gross National Expenditure as % of GDP
Growth Drivers for India and China: A Comparison � 1119
V32: Inflation at constant prices
V33: Broad Money as % of GDP
V34: Worker Remittances (%)
V35: External Debt Stock as % of GNI
V36: Total Debt Stock
V37: Claims on central Government (% GDP)
V38: Household final consumption expenditure (% annual growth)
V39: Life Expectancy at birth, total in years
V40: Net ODA (% of GNI)
V41: Real Interest Rate (%)
V42: Lending rate (%)
V43: Electric Power consumption KWH
V44: CO2 Emissions (PPP)
V45: Stocks Traded, total value as % GDP
V46: Improved Sanitation Facilities as percentage of population with access
V47: Improved Water Access as percentage of population with access
V48: Incidence of Tuberculosis per 100000 people
V49: Legal Rights Index
V50: Time to Export as in Number of days
V51: Unemployment (%)
V52: Health Expenditure as % of GDP
V53: R&D Expenditure (%)
V54: Internet Users per 1000
V55: Mobile Cellular Subscriptions per 1000
V56: Tax Revenue as % of GDP
V57: Portfolio Equity Inflows as % of GDP
It is pertinent to mention here that as the data for variables describing theimportance of corporate governance, business ethics and social viability ofdevelopment projects was available only from 1991 onwards, the information forearlier time periods has been extrapolated.
1120 � Richika Nanda and Anjali Mehra
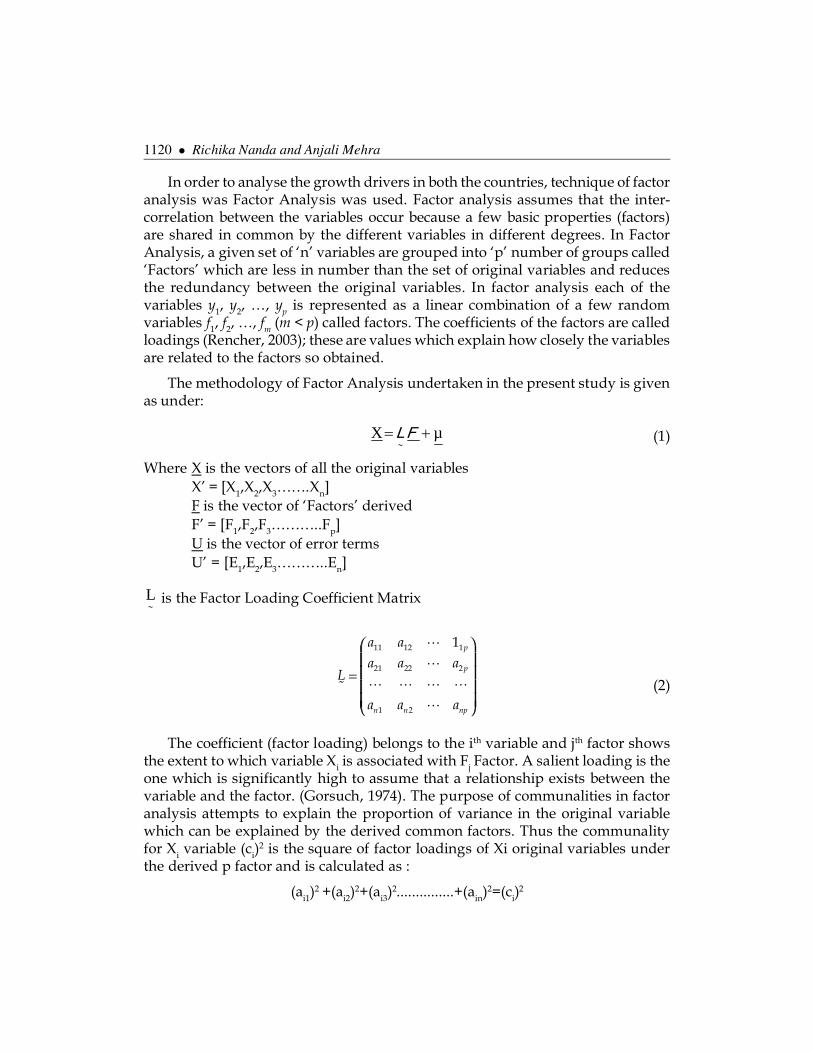
In order to analyse the growth drivers in both the countries, technique of factoranalysis was Factor Analysis was used. Factor analysis assumes that the inter-correlation between the variables occur because a few basic properties (factors)are shared in common by the different variables in different degrees. In FactorAnalysis, a given set of ‘n’ variables are grouped into ‘p’ number of groups called‘Factors’ which are less in number than the set of original variables and reducesthe redundancy between the original variables. In factor analysis each of thevariables y1, y2, …, yp is represented as a linear combination of a few randomvariables f1, f2, …, fm (m < p) called factors. The coefficients of the factors are calledloadings (Rencher, 2003); these are values which explain how closely the variablesare related to the factors so obtained.
The methodology of Factor Analysis undertaken in the present study is givenas under:
µX ���FL (1)
Where X is the vectors of all the original variablesX’ = [X1,X2,X3…….Xn]F is the vector of ‘Factors’ derivedF’ = [F1,F2,F3………..Fp]U is the vector of error termsU’ = [E1,E2,E3………..En]
�L is the Factor Loading Coefficient Matrix
11 12 1
21 22 2
1 2
1 p
p
n n np
a aa a a
L
a a a
�
�
� � � ��
�
(2)
The coefficient (factor loading) belongs to the ith variable and jth factor showsthe extent to which variable Xi is associated with Fj Factor. A salient loading is theone which is significantly high to assume that a relationship exists between thevariable and the factor. (Gorsuch, 1974). The purpose of communalities in factoranalysis attempts to explain the proportion of variance in the original variablewhich can be explained by the derived common factors. Thus the communalityfor Xi variable (ci)
2 is the square of factor loadings of Xi original variables underthe derived p factor and is calculated as :
(ai1)2 +(ai2)
2+(ai3)2...............+(ain)
2=(ci)2
Growth Drivers for India and China: A Comparison � 1121
In order to have a better explanation of the variables, the factor loadings wererotated using Kaiser’s- Varimax Criterion for Rotation (Kaiser, 1958).SPSS 17 wasapplied and the interpretation of results is as under
Section III: Results and Discussion
The results of factor analysis shows that for both countries, six factors were derived.In case of India, it was observed that the six factors together accounted for 92.69per cent of total variance with first factor accounting for 63 per cent of variation,factor two having 14 per cent variance, factor three having 6 per cent, factor fourhaving 4 per cent variance and factor five and six accounting for 2 and 1 per centof total variance respectively. The communality values varied from 0.714-0.998 i.e.71% to 99% suggesting that six factors derived were significant to account for mostof variation in the original variation in the original variables. The first factorincluded 38 of the original variables (those having Factor loadings ��0.5) and thesewere:
• Tertiary School Enrolment (% gross)• Workers Remittances (%)• Rail Passengers carried in million• Gross Domestic savings (5 of GDP)• Trade (% of GDP)• Gross capital formation (% of GDP)• Net ODA (% of GNI)• CO2 emissions in PPP• Poverty Gap at $1.25• Improved Sanitation Facilities (5 of population with access)• Services Value added (% of GDP)• Infant mortality rate per 1000• Labor participation rate (%)• Urban population (%)• Real Interest rate (%)• Gross national expenditure (% of GDP)Perusal of the table further shows that it is a bipolar factor i.e. these factor has
two dimensions i.e. some variables like v9, v34, v11, v27, v1,..................have positiveloadings and can be termed as “growth enhancers” as they are said to positivelyeffect economic growth and therefore government should emphasise on them.
In order to analyse the individual variables responsible for affecting theeconomic growth, factor loadings were taken. It was also found that variables
1122 � Richika Nanda and Anjali Mehra
affected economic growth positively and negatively i.e. the bipolar factors werealso there. In case of India, 38 variables had significant factor loadings (>0.5) andout of these 11 variables have negative factor loadings. The variables which affectgrowth positively i.e. high positive factor loadings have been termed as ‘Growthenhancers.’
In case of India, the results of the factor analysis showed that the variablewhich affected growth the most was Tertiary school enrolment with factor loading0.958 which symbolises policy initiatives taken for attainment of good highereducation level in India have started bearing positive results. The variable withsecond highest factor loading is Workers’ Remittances and the variable is associatedwith a very high degree of stability as a source of foreign capital flows. The thirdvariable affecting growth positively is Number of Rail Passengers in millionshighlighting the importance of Indian railways as the largest profit making publicenterprise.
The next variable with high factor loading is Gross Domestic Savings as thesaving rate is more than 35 per cent in India; sustainability of Indian economicgrowth in future depends a lot on this factor. The other highly contributing variablesfor growth are macroeconomic variables like Gross Capital formation, Trade (percent of GDP), external sector variables like Service Value added, Net ODA etc. Thepolicy shift like ‘look east policy’ and look beyond west policy has helped India toexplore many new potential markets in South East Asia and Africa apart from itsconventional trading partners in America and Europe resulting in increase in thevolume of international trade. Agricultural Machinery in terms of number ofTractors, Improved sanitation facilities, Number of mobile cellular subscriptions,Current Account Balance, External Debt Stock, Number of Physicians, Air TrafficFreight, Secondary School Enrolment, Rural Population as percentage of totalpopulation are some other high loading variables affecting and enhancing growthin a positive way. The existence of a large number of positive growth drivers frommacroeconomic, external, service and infrastructure industries indicate that Indiangrowth trajectory has strong fundamentals which could enhance sustainability ofeconomic growth.
On the other hand, variables like Agriculture value added, Industry value addedand value of stocks traded, Infant mortality rate, labour participation rate andpercentage of urban population are some variables with high factor loadings butwith negative sign showing that these variables could retard the momentum ofeconomic growth in India. These drivers are termed as ‘Growth Retarders’ in thisstudy. The growth model of India exhibits transition from agrarian economy toservice sector and industry related variables coming out to be growth retarderssuggest that Indian economy still lacks proper industrial base required for sustainedeconomic development. Also, volatile nature of Indian stock market and uncertaintyrelated with FIIs is still a big fear for the think tanks and policy makers. India still
Growth Drivers for India and China: A Comparison � 1123
lags behind in infrastructure development which is a foundation for industrialdevelopment; thus highlighting the need for second generation economic reformswith focus on development of industry. These are areas for improvement if theeconomic growth is to be sustained.
Table 3Total Variance explained India
Components Number of Initial Eigenvariables included Values
Total % of variance Cumulative %
1 38 36.127 63.381 63.812 14 8.455 14.834 78.2153 3 3.501 6.141 84.3564 2 2.400 4.211 88.5675 2 1.265 2.219 90.7866 0 1.087 1.907 92.693
Source: Authors’ Calculations
Table 4Factor Analysis results
Rotated Component Matrix
Component
1 2 3 4 5 6
v9 .958 .066 .092 -.105 .203 -.011v34 .955 .225 -.037 -.024 .080 .076v11 .948 .178 .118 -.094 .196 .062v27 .946 .215 .075 -.074 .179 .113v1 .936 .297 -.072 -.066 .115 .108v17 -.931 -.242 .231 .070 -.080 -.061v5 -.926 -.300 .104 -.068 -.075 -.147v22 .923 .318 -.167 .037 .041 .033v23 .914 .215 .029 -.200 .088 .240v45 -.913 -.335 .093 .039 -.077 -.180v40 .909 .384 -.086 .029 .078 .099v44 .892 .415 .033 .003 .093 .126v30 .886 .436 -.070 .053 .076 .089v29 -.886 -.436 .070 -.053 -.076 -.089v15 -.879 -.401 .138 .027 -.072 -.180v46 .878 .268 -.124 -.088 -.140 -.069v31 -.877 -.437 .012 -.138 -.065 -.079v55 .875 -.026 .255 -.119 .368 .020v8 .874 .377 .130 .056 .180 .140v21 .870 .151 .208 -.253 -.177 .162
contd. table 4
1124 � Richika Nanda and Anjali Mehra
v35 .870 .262 -.204 -.266 -.071 -.013v24 .869 .085 .105 -.018 .151 .386v16 -.865 -.465 .116 -.072 -.050 -.096v7 .865 .200 .202 -.010 .269 .263v6 .853 .402 -.178 .054 .003 .093v41 -.851 -.236 .229 -.185 .040 -.139v12 .840 -.009 .443 .038 .151 .180v28 .836 .208 .027 .098 .177 .389v43 -.833 -.125 .462 .052 -.138 -.031v14 .790 .341 -.486 -.062 -.037 .024v56 .779 -.064 .446 -.110 .390 -.038v47 .711 .675 -.097 -.090 .100 .078v54 .706 .652 -.205 -.081 .038 .060v3 -.660 -.572 .022 -.322 -.106 .221v32 .636 -.403 .350 -.437 -.008 .215v18 .636 .141 .187 .178 .138 .632v2 -.574 .066 .002 .415 -.280 -.404v38 -.490 -.387 .438 -.124 -.117 -.468v39 .485 -.071 .065 -.272 .211 .409v51 .266 .917 -.260 .009 .014 .008v53 .428 .886 -.126 -.041 .044 -.004v49 .480 .859 -.111 -.048 .062 .054v57 .506 .832 -.042 -.088 .016 .160v52 .263 .821 .074 -.077 .113 -.025v48 .575 .796 -.115 -.065 .074 .062v36 -.333 .761 .238 .415 -.080 -.105v50 .620 .757 -.004 -.092 .090 .112v20 .151 .741 -.304 .379 -.066 -.120v37 .027 .728 -.238 .376 -.241 .276v10 .074 .632 .394 .525 .142 .072v25 .054 .192 -.851 -.139 -.066 -.015c26 .547 -.349 .665 -.065 .113 .220v33 -.369 .071 .620 -.325 .372 -.063v19 .113 -.002 .061 .869 -.070 .093v4 -.557 .223 -.181 .647 -.212 -.187v42 -.167 -.199 -.182 .252 -.719 -.180v58 .555 -.069 .067 .087 .691 .033
Source:Authors’ Calculations
In case of China, from the empirical analysis it was observed that the six factorstogether accounted for 94 per cent of total variance with first factor accounting for72 per cent of variation, factor two having 8 per cent variance, factor three having6 per cent, factor four having 2.8 per cent variance and factor five and six accountingfor 2.5 and 2.2 per cent of total variance respectively. The communality values
Component
1 2 3 4 5 6
Growth Drivers for India and China: A Comparison � 1125
varied from 0.541-0.999 suggesting that six factors derived were significant toaccount for most of variation in the original variation in the original variables.Majority of variables were included in factor 1 like:
1 Mobile Cellular Subscriptions per 10002 Tax Revenue (% of GDP)3 Air Traffic Freight in million ton km4 Tertiary School Enrolment (% Gross)5 Electric Power Consumption (KWH)6 GDP per capita7 Internet users per 10008 Rail Passengers carried in million9 Agricultural Machinery, Tractors per sq km of arable land10 Telephone Lines per 100 people11 R&D expenditure (%)12 Workers Remittances (%)13 Time to export, number of days14 Gross Domestic savings (% of GDP)15 Industry value added (% of GDP)16 Portfolio equity inflows (% of GDP)17 Value of stocks traded (% of GDP)18 Infant mortality rate per 100019 Population growth rate (%)20 Labor participation rate (%)21 Poverty gap at $ 1.2522 External Debt Stock (% of GNI)Out of the growth enhancer variables included in factor I, the most important
variable which has affected economic growth is Number of mobile cellularsubscriptions with highest factor loading of 0.989. The variable with second highestfactor loading of 0.973 is Tax revenue highlighting the efficiency of tax collectionmechanism in China.
The next high contributing variables are those related to infrastructure like AirTraffic Freight with factor loading 0.967, Tertiary school enrolment (0.964), ElectricPower Consumption (0.956), Number of Internet Users (0.955), Telephone Lines(0.884), Secondary School Enrolment (0.844), Road energy consumption (0.820),Number of railway passengers (0.922). These results highlight the fact that China’sdevelopment model is largely based upon infrastructure and the sector has
1126 � Richika Nanda and Anjali Mehra
contributed towards economic growth to a very large extent. The other variableswhich have played a significant role in economic growth are, Workers remittances,Time taken to export, Value of stocks traded, Gross Domestic Savings, Portfolioequities, Life expectancy etc.
Therefore, a substantive share in the development of China’s economy isaccrued to the amount of workers remittances which is a very reliable and stablesource of foreign capital investment, business competitiveness, savings as the solehighest contributor towards capital formation. Thus the main drivers of Chineseeconomic growth are indicators of physical infrastructure- a quite distinct featurefrom Indian economic growth. On the other hand, growth retarder variables likeInfant mortality rate, labour participation rate, percentage of rural population,population growth rate, poverty gap ratio, agriculture value added, Net ODA arehaving negative impact over economic growth in China.
The results indicate that the issue of declining working population which hasbeen raised time and again has started showing its effects on growth. Also anotherimportant lagged areas of China’s development model is unequal spread of fruitsof economic growth especially over the rural areas is brought into light in thisstudy as well. This indicates that emphasis has to be given on these areas so thatthey can be improved and can contribute passively towards growth. The mainchallenges for China are present in these areas as the working population in Chinais projected to decline over the next thirty year time period (Wilson, 2003).
Rural regions have been neglected and the gap between urban and rural haswidened up which stresses the need for balanced regional development. Also, ashighlighted in the study, social investments in terms of health and education arealso very important for a country’s all around development but here physicalinfrastructure have been set up at the cost of social investments which needs to beimproved through more investment on health sector.
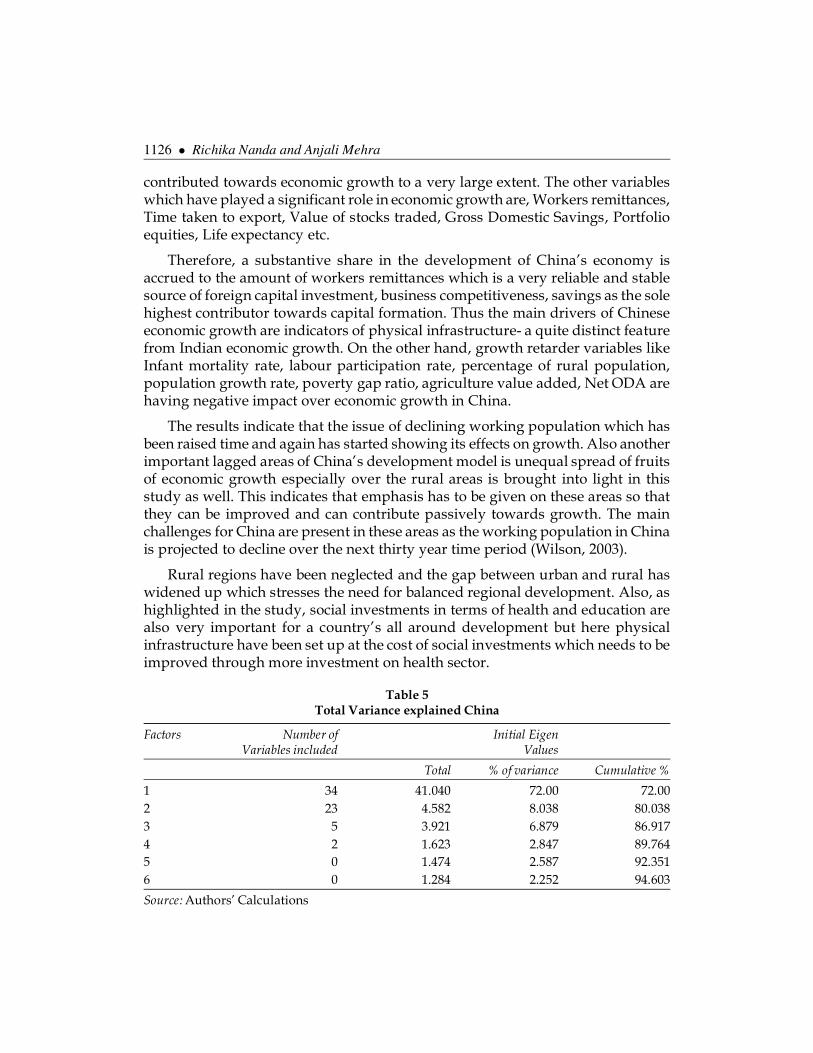
Table 5Total Variance explained China
Factors Number of Initial EigenVariables included Values
Total % of variance Cumulative %
1 34 41.040 72.00 72.002 23 4.582 8.038 80.0383 5 3.921 6.879 86.9174 2 1.623 2.847 89.7645 0 1.474 2.587 92.3516 0 1.284 2.252 94.603
Source: Authors’ Calculations
Growth Drivers for India and China: A Comparison � 1127
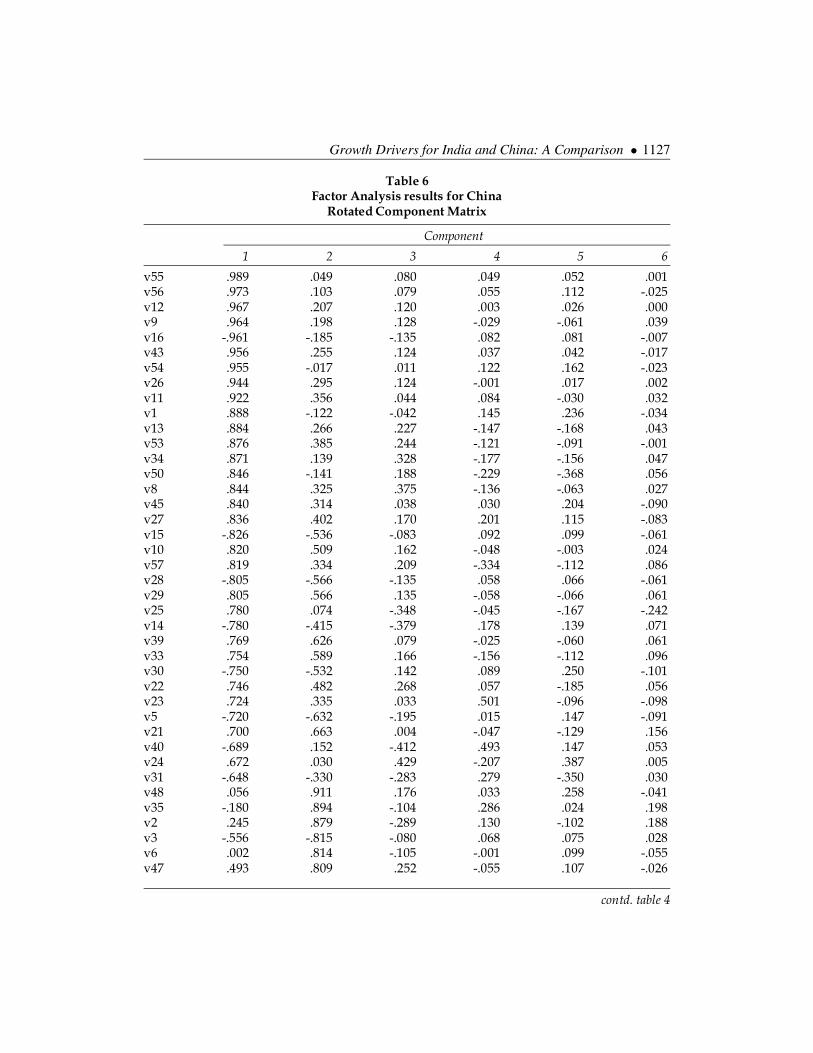
Table 6Factor Analysis results for China
Rotated Component Matrix
Component
1 2 3 4 5 6
v55 .989 .049 .080 .049 .052 .001v56 .973 .103 .079 .055 .112 -.025v12 .967 .207 .120 .003 .026 .000v9 .964 .198 .128 -.029 -.061 .039v16 -.961 -.185 -.135 .082 .081 -.007v43 .956 .255 .124 .037 .042 -.017v54 .955 -.017 .011 .122 .162 -.023v26 .944 .295 .124 -.001 .017 .002v11 .922 .356 .044 .084 -.030 .032v1 .888 -.122 -.042 .145 .236 -.034v13 .884 .266 .227 -.147 -.168 .043v53 .876 .385 .244 -.121 -.091 -.001v34 .871 .139 .328 -.177 -.156 .047v50 .846 -.141 .188 -.229 -.368 .056v8 .844 .325 .375 -.136 -.063 .027v45 .840 .314 .038 .030 .204 -.090v27 .836 .402 .170 .201 .115 -.083v15 -.826 -.536 -.083 .092 .099 -.061v10 .820 .509 .162 -.048 -.003 .024v57 .819 .334 .209 -.334 -.112 .086v28 -.805 -.566 -.135 .058 .066 -.061v29 .805 .566 .135 -.058 -.066 .061v25 .780 .074 -.348 -.045 -.167 -.242v14 -.780 -.415 -.379 .178 .139 .071v39 .769 .626 .079 -.025 -.060 .061v33 .754 .589 .166 -.156 -.112 .096v30 -.750 -.532 .142 .089 .250 -.101v22 .746 .482 .268 .057 -.185 .056v23 .724 .335 .033 .501 -.096 -.098v5 -.720 -.632 -.195 .015 .147 -.091v21 .700 .663 .004 -.047 -.129 .156v40 -.689 .152 -.412 .493 .147 .053v24 .672 .030 .429 -.207 .387 .005v31 -.648 -.330 -.283 .279 -.350 .030v48 .056 .911 .176 .033 .258 -.041v35 -.180 .894 -.104 .286 .024 .198v2 .245 .879 -.289 .130 -.102 .188v3 -.556 -.815 -.080 .068 .075 .028v6 .002 .814 -.105 -.001 .099 -.055v47 .493 .809 .252 -.055 .107 -.026
contd. table 4
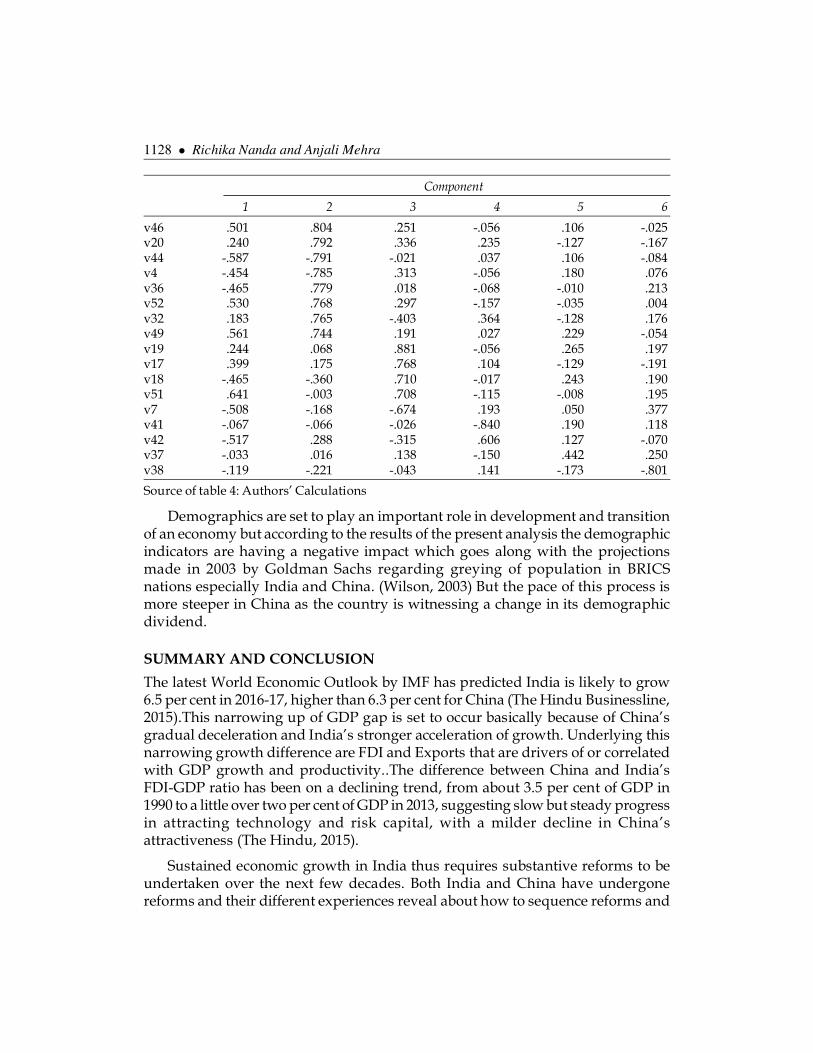
1128 � Richika Nanda and Anjali Mehra
v46 .501 .804 .251 -.056 .106 -.025v20 .240 .792 .336 .235 -.127 -.167v44 -.587 -.791 -.021 .037 .106 -.084v4 -.454 -.785 .313 -.056 .180 .076v36 -.465 .779 .018 -.068 -.010 .213v52 .530 .768 .297 -.157 -.035 .004v32 .183 .765 -.403 .364 -.128 .176v49 .561 .744 .191 .027 .229 -.054v19 .244 .068 .881 -.056 .265 .197v17 .399 .175 .768 .104 -.129 -.191v18 -.465 -.360 .710 -.017 .243 .190v51 .641 -.003 .708 -.115 -.008 .195v7 -.508 -.168 -.674 .193 .050 .377v41 -.067 -.066 -.026 -.840 .190 .118v42 -.517 .288 -.315 .606 .127 -.070v37 -.033 .016 .138 -.150 .442 .250v38 -.119 -.221 -.043 .141 -.173 -.801
Source of table 4: Authors’ Calculations
Demographics are set to play an important role in development and transitionof an economy but according to the results of the present analysis the demographicindicators are having a negative impact which goes along with the projectionsmade in 2003 by Goldman Sachs regarding greying of population in BRICSnations especially India and China. (Wilson, 2003) But the pace of this process ismore steeper in China as the country is witnessing a change in its demographicdividend.
SUMMARY AND CONCLUSION
The latest World Economic Outlook by IMF has predicted India is likely to grow6.5 per cent in 2016-17, higher than 6.3 per cent for China (The Hindu Businessline,2015).This narrowing up of GDP gap is set to occur basically because of China’sgradual deceleration and India’s stronger acceleration of growth. Underlying thisnarrowing growth difference are FDI and Exports that are drivers of or correlatedwith GDP growth and productivity..The difference between China and India’sFDI-GDP ratio has been on a declining trend, from about 3.5 per cent of GDP in1990 to a little over two per cent of GDP in 2013, suggesting slow but steady progressin attracting technology and risk capital, with a milder decline in China’sattractiveness (The Hindu, 2015).
Sustained economic growth in India thus requires substantive reforms to beundertaken over the next few decades. Both India and China have undergonereforms and their different experiences reveal about how to sequence reforms and
Component
1 2 3 4 5 6
Growth Drivers for India and China: A Comparison � 1129
how to stimulate growth with their help. Therefore, whereas India has witnessedservice sector led growth, China moved on the path of development on basis of itsstrong physical infrastructure. Both economies have made remarkable progress inpast three decades; China’s economic performance has been a bit balanced thanIndia’s but the health of Chinese financial sector is not very good. Whereasrebalancing is the biggest problem associated with Chinese economic growth, Indianeeds to build up a strong infrastructural base. China’s future growth will hit thedemographic barrier as declining workforce will create a shortage of skilled andunskilled labour whereas India still has the opportunity to exploit the workingpopulation as the stage of declining working population has not reached in India.
Policy measures for China
From the above analysis it is clear that China has a strong infrastructure base whichserves as the driver of economic growth but social investments have been neglectedwhich should be re emphasised.
1 This would imply an extension of public goods like healthcare, education,housing towards common public.
2 China needs to move towards higher-value-added economic activities andboost Private Consumption which is again a long term growth driver.
3 Improvement in social security and promotion of fiscal transfers towardshouseholds should be done as tax revenue is a major driver of growthand thus the benefits should be equally distributed.
4 Therefore, fiscal policy can be used to boost domestic demand- a moresustainable variable of economic growth.
Policy measures for India1 The above analysis shows that tertiary sector is a major contributor towards
economic growth whereas industry sector still comes out to be laggard interms of drivers of growth in India. Structural measures are needed tohelp boost private investment as India will continue to have strong supportfrom favourable demographic trends.
2 Increase in investment in growth oriented projects and continuedimprovements like those related to infrastructure, which would help togenerate productive capacity are required.
3 Strong legal systems, efficacy of regulatory environments, incentivsinginnovations and a framework for protecting intellectual property rightsis the need of hour if sustainable economic development is to be attained.
4 Efficient macroeconomic policy is needed to tackle problems likeinflation which is becoming a serious hurdle in the way of economicdevelopment.
1130 � Richika Nanda and Anjali Mehra
5 Improvement of social security and social infrastructure like health andeducation is required if India has to keep up the pace with the globalizedworld.
China has installed a much better and comprehensive rule based system thanIndia but its judicial infrastructure is quite weak. The over politicizedadministration and lengthy decision making process, corruption, corporate scamsand the governance deficit puts India on the backfoot in this case. DemographicDividend is an economic potential, thus it is very important to reap it efficiently sothat the benefits of the economic growth can be sustained for future generations.The success or failure of each country to maintain their rapid growth into thefuture will have a tremendous impact not only on their own economies but on theworld economy as a whole.
ReferencesAziz, J. (2007), Rebalancing China’s Economy: What does Growth Theory Tell us? IMF WP/
06/291: 1-33.
Barbier, E. (1998), The concept of Sustainable economic Development. in Edward B. Barbier(Ed.) The Economics of Environment and Development: Selected Essays. United Kingdom:Edward Elgar Publishing Limited.
Bardhan, P. (2010), Awakening Giants of Clay: Assessing the economic rise of China and India.New Delhi: Oxford University Press.
Beretta, S. (2012), India and China: Trading with each other and the World. Economic & PoliticalWeekly. XLVII (44). November 3, 2012.
Chow, G. (2004), Economic Growth and Reform in China. Annals of Economics and Finance. 5.
Eswar, P. (2006), Modernizing China’s Growth Paradigm. IZA Discussion Paper No. 2248.
ET Newsservice (2011), India will grow Faster than China in Next 20 years. The EconomicTimes. May 26, 2011: 9.
Garnaut, R. (2001), Growth without Miracles. New Delhi: Oxford University Press.
Gorsuch, R. L. (1974), Factor Analysis. U.S.A: W.B. Saunders Company Philadelphia.
Holscher, J. (2010), China and India in the Global Economy. Economic Systems. United States:Elsevier, Vol.34 (3): 212-217.
http://www.imf.org/external/pubs/ft/wp/2006/wp06291.pdf
Huang, Y. (2003), Can India Overtake China? Foreign Policy. Washington Post. NewsweekInteractive. Washington D.C. No. 137: 74-81.
Kaiser, H.F. (1958), The Varimax Criterion for Analytic Rotation in Factor Analysis,Psychometrica, 23, 187-200.
Kalyanaran GK. (2008), India’s Economic Growth and Market potential: Benchmarked againstChina. Journal of Indian Business Research. December 2008.
Kumar, R. (2007), Sustainability of Economic Growth in India. The Centre for InternationalGovernance Innovation. Working Paper Emerging Economies. No. 25.
Growth Drivers for India and China: A Comparison � 1131
Kundra, A. (2009), India China: A Comparative Analysis of FDI Policy and Performance. NewDelhi: Academic Foundation.
Panagariya, A. (2008), India-The Emerging Giant. New York: Oxford University Press.
Prasad, E. (2007), Is the Chinese Growth Miracle Built to Last? China Economy Review. UnitedStates: Elsevier. Vol. 20 (1): 1-22.
Prasad, ES. (2006), Modernizing China’s Growth Paradigm. IZA Discussion Paper No. 2248.
Rencher, A. C. (2003), Factor Analysis, in Methods of Multivariate Analysis. Second Edition.New York. NY: John Wiley & Sons Inc.
Rosen, G. (1990), India and China: Perspectives on Contrasting Styles of Economic Reform.Journal of Asian Economics. 1 (2).
Srinivasan, TN. (2004), China and India: Economic Performance, Competition and Cooperation:an update. Journal of Asian Economics. United States: Elsevier. Vol. 15, (4): 613-636.
The Hindu (2015), Tracking two growth stories. 29 April 2015, http://www.thehindu.com/opinion/lead/india-and-china-tracking-two-growth-stories/article7151377.ece
The Hindu Businessline (2015), “India’s GDP growth rate set to surpass China’s in 2016-17:IMF,” 20 January 2015, http://www.thehindubusinessline.com/economy/indias-gdp-growth-rate-set-to-surpass-chinas-in-201617-imf/article6805727.ece
Tyres, R. (2006), Projected Economic growth in China and India: The role of Demographicchange. College of Business and economics. Australian national University. Working paperin Economics and Econometrics no. 477.
Wilson, D. (2003), Dreaming with BRICs: The Path to 2050. http://www2.goldmansachs.com/ideas/brics/book/00-dreaming.pdf.
Wu, Y. (2008), Comparing Regional Development in China and India. UNU-WIDER ResearchPaper No. 2008/13.


![Forecasting Earth Quake Using Back Propagation Algorithm ...serialsjournals.com/serialjournalmanager/pdf/1483683448.pdf · successful implementation of predicting earthquakes. [1]](https://img.pdfslide.net/doc/110x75/5aaa47487f8b9a95188de25c/forecasting-earth-quake-using-back-propagation-algorithm-implementation-of-predicting.jpg)