Embed Size (px)
Citation preview
GROWTH HORMONE AND NUTRITIONAL REGULATION OF
INSULIN-LIKE GROWTH FACTOR-I GENE EXPRESSION
YING WANG
Dissertation submitted to the Faculty of the Virginia Polytechnic Institute and State
University in partial fulfillment of the requirements for the degree of
DOCTOR OF PHILOSOPHY
in
Animal and Poultry Sciences
Dr. H. Jiang, Chairman
Dr. R. M. Akers
Dr. E. J. Smith
Dr. K. E. Webb, Jr.
Dr. E. A. Wong
December 8, 2005
Blacksburg, Virginia
Key Words: Insulin-like growth factor-I, Growth hormone, Nutrition, Signal transducer
and activator of transcription 5, Transcriptional regulation
Copyright 2005, YING WANG
GROWTH HORMONE AND NUTRITIONAL REGULATION OF
INSULIN-LIKE GROWTH FACTOR-I GENE EXPRESSION
by
Ying Wang
Dr. Honglin Jiang, Chairman
Department of Animal and Poultry Sciences
(ABSTRACT)
The objectives of this research were to characterize insulin-like growth factor-I
(IGF-I) gene expression in cattle, to determine how IGF-I gene expression is affected by
nutritional intake and growth hormone (GH) in cattle, and to identify the regulatory DNA
region that mediates GH stimulation of IGF-I gene expression. It was found that
transcription of the IGF-I gene in cattle was initiated from both exon 1 and exon 2,
generating class 1 and class 2 IGF-I mRNA, respectively. Both classes of IGF-I mRNA
appeared to be ubiquitously expressed, with the highest level in liver and with class 1
being more abundant than class 2 in all tissues examined. Class 1 IGF-I mRNA may be
also translated more efficiently than class 2 IGF-I mRNA. Liver expression of IGF-I
mRNA was decreased (P < 0.01) by food deprivation in cattle, and this decrease was due
to an equivalent decrease in both classes of IGF-I mRNA. Liver expression of IGF-I
mRNA was increased (P < 0.01) by GH, and this increase resulted mainly from increased
expression of class 2 IGF-I mRNA. Using cotransfection analyses, a ~700 bp
chromosomal region ~75 kb 5' from the first exon of the human IGF-I gene was found to
enhance reporter gene expression in the presence of constitutively active signal
iii
transducer and activator of transcription 5 (STAT5) proteins, transcription factors that are
known to be essential for GH-increased IGF-I gene expression. This 700 bp DNA region
contains two STAT5-binding sites that appear to be conserved in mammals including
cattle. Electrophoretic mobility shift assays and cotransfection analyses confirmed their
ability to bind to STAT5 proteins and to mediate STAT5 activation of gene expression,
respectively. Chromatin immunoprecipitation assays indicated that overexpressed
constitutively active STAT5b protein bound to the chromosomal region containing these
two STAT5-binding sites in Hep G2 cells, and this binding was associated with increased
expression of IGF-I mRNA. These two STAT5-binding sites were also able to mediate
GH-induced STAT5 activation of gene expression in reconstituted GH-responsive cells.
These results together suggest that the distal DNA region that contains two STAT5-
binding sites may mediate GH-induced STAT5 activation of IGF-I gene transcription in
vivo.
Key Words: Insulin-like growth factor-I, Growth hormone, Nutrition, Signal transducer
and activator of transcription 5, Transcriptional regulation

iv
Acknowledgements
I would like to express my sincerest gratitude to my advisor Dr. Honglin Jiang for
giving me this opportunity to further my education. I thank him for his guidance and
encouragement throughout my graduate study. I was fortunate to have him as my advisor.
I am deeply indebted to Drs. Michael Akers, Edward Smith, Kenny Webb and
Eric Wong for their guidance, comments, encouragement and willingness to serve on my
committee.
Special gratitude is extended to Sara Price and Bettina Heid for their technical
assistance during my graduate study at Virginia Tech.
Thanks also go to my friends including Yinli Zhou, Miaozong Wu, Satyanarayana
Eleswarapu, Qingfu Xu, Xunjun Xiao, Junmei Zhao and Jin Zhang for their support and
encouragement, both in and out of the lab, and for helpful discussion about research and
life. I will forever cherish the memories of the good times I had with them.
I am grateful to the faculty and staff of the Department of Animal and Poultry
Sciences for their support and assistance during my study here. I also would like to thank
the John Lee Pratt Fellowship program and USDA CSREES National Research Initiative
Grant 2001-35205-11732 (to H. Jiang) for providing the financial support.
My deepest thanks go to my husband and my parents, who stand by me through
all times here in Blacksburg and beyond. Without their love, support and understanding, I
would not have made it this far. Thank You!
v
Table of Contents
ABSTRACT....................................................................................................................... ii Acknowledgements .......................................................................................................... iv List of Tables ................................................................................................................... vii List of Figures................................................................................................................. viii Introduction....................................................................................................................... 1 Chapter I Review of Literature ....................................................................................... 3
Introduction..................................................................................................................... 3 Mature IGF-I Protein ...................................................................................................... 3 IGF-I Actions .................................................................................................................. 4
The roles of IGF-I in cell growth, differentiation and death ...................................... 4 Metabolic effects of IGF-I........................................................................................... 5 The role of IGF-I in body growth ............................................................................... 5 Other physiological actions ........................................................................................ 7 IGF-I and diseases ...................................................................................................... 8
Mechanism of IGF-I action............................................................................................. 9 IGF-I receptors ........................................................................................................... 9 IGF-I signaling pathway........................................................................................... 10 IGFBPs ..................................................................................................................... 12 Endocrine, paracrine and autocrine mechanisms of action ..................................... 14
Molecular Organization ................................................................................................ 16 IGF-I gene structure ................................................................................................. 16 IGF-I mRNA structure .............................................................................................. 17 IGF-I precursor protein ............................................................................................ 20 Functional importance of IGF-I mRNA and protein size and sequence heterogeneity................................................................................................................................... 23
Regulation of IGF-I Gene Expression .......................................................................... 26 Tissue-specific factors............................................................................................... 26 Hormonal regulation ................................................................................................ 27 Nutritional regulation ............................................................................................... 34 Developmental regulation......................................................................................... 39 Other factors that regulate IGF-I gene expression................................................... 42
Summary ....................................................................................................................... 43 Chapter II Cloning and Characterization of the Bovine Class 1 and Class 2 Insulin-Like Growth Factor-I mRNA ........................................................................................ 44
Abstract ......................................................................................................................... 44 Introduction................................................................................................................... 45
vi
Materials and Methods.................................................................................................. 46 Results........................................................................................................................... 52 Discussion..................................................................................................................... 55
Chapter III Effects of Food Deprivation and Growth Hormone on Liver Insulin-Like Growth Factor-I Gene Expression in Steers........................................................ 65
Abstract ......................................................................................................................... 65 Introduction................................................................................................................... 66 Materials and Methods.................................................................................................. 67 Results........................................................................................................................... 69 Discussion..................................................................................................................... 70
Chapter IV Identification of a Distal STAT5-Binding DNA Region That May Mediate Growth Hormone Regulation of Insulin-Like Growth Factor-I Gene Expression........................................................................................................................ 79
Abstract ......................................................................................................................... 79 Introduction................................................................................................................... 81 Materials and Methods.................................................................................................. 83 Results........................................................................................................................... 94 Discussion................................................................................................................... 105
Conclusions .................................................................................................................... 124 Literature Cited ............................................................................................................ 126 Vita ................................................................................................................................. 163
vii
List of Tables Table 2.1. Sequences of primers used in this study. ......................................................... 58 Table 4.1. Sequences of oligonucleotides used in this study.. ........................................ 109 Table 4.2. Plasmid constructs used in this study. ........................................................... 110
viii
List of Figures Figure 1.1. Schematic representation of intracellular signaling pathways activated by
IGF-I. .............................................................................................................. 12 Figure 1.2. Schematic representation of rat IGF-I gene and mRNA structures................ 20 Figure 1.3. Schematic representation of rat IGF-I precursors and mature protein. .......... 23 Figure 1.4. Major signaling pathways initiated by binding of GH to its receptor. ........... 30 Figure 2.1. Cloning of the 5’-end regions of bovine class 1 and class 2 IGF-I mRNA.... 60 Figure 2.2. Diagram of riboprobes and corresponding mRNA. ....................................... 61 Figure 2.3. Tissue distribution of class 1 and class 2 IGF-I mRNA................................. 63 Figure 2.4. Effects of class 1 and class 2 IGF-I 5’-UTR on translational efficiency of
luciferase RNA................................................................................................ 64 Figure 3.1. Diagram of riboprobes and corresponding mRNA. ....................................... 74 Figure 3.2. Effect of food deprivation on the levels of IGF-I mRNA in the liver of steers.
......................................................................................................................... 76 Figure 3.3. Effects of GH on total and both classes of IGF-I mRNA expression in steer
liver. ................................................................................................................ 78 Figure 4.1. Transfection analysis of bovine IGF-I proximal promoter reporter gene
construct (bIGF-I-3.7K) in Hep G2 and C2C12 cells................................... 111 Figure 4.2. Identification of STAT5-binding enhancers from a 170 kb chromosomal
region containing IGF-I gene and 5’-flanking region................................... 112 Figure 4.3. A distal 5’-flanking region of IGF-I gene is evolutionarily conserved and
contains two consensus STAT5 binding sites............................................... 114 Figure 4.4. The STAT5 binding sites-containing 700 bp distal 5’-flanking region of IGF-I
gene can function as an enhancer to mediate STAT5 activation of gene expression. .................................................................................................... 116
Figure 4.5. Electrophoretic mobility shift assay of the two putative STAT5 binding sites........................................................................................................................ 118
Figure 4.6. The two STAT5-binding sites are required for the distal 5'-flanking region of IGF-I gene to mediate STAT5 activation of gene expression. ..................... 119
Figure 4.7. Binding of STAT5bCA to the STAT5-binding site-containing distal 5'-flanking region of IGF-I gene is associated with increased expression of IGF-I mRNA in Hep G2 cells.............................................................................................. 120
Figure 4.8. The distal 5'-flanking region of IGF-I gene can mediate GH-induced STAT5 activation of gene expression........................................................................ 122
1
Introduction Insulin-like growth factor-I (IGF-I) is a key stimulator of growth and
development in animals. The production of IGF-I in the body is controlled by growth
hormone (GH) and nutritional status. Growth hormone, a hormone that itself plays an
essential role in postnatal growth in animals, stimulates IGF-I gene expression, and for
this relationship, most of the growth-stimulating effects of GH are believed to be
mediated by IGF-I. Increased nutritional intake is often associated with increased IGF-I
concentration in the circulation and increased growth, whereas decreased nutritional
intake usually leads to decreased IGF-I concentration in the blood and growth retardation,
a potential mechanism for reserving energy for the brain during undernutrition. The
mechanisms by which GH and nutritional status regulate IGF-I production in animals are
not fully understood. Therefore, the research reported in this dissertation was conducted
toward a better understanding of these mechanisms. Most of this dissertation research
was targeted to cattle, because cattle are agriculturally important animals and
understanding how GH and nutritional intake regulate IGF-I gene expression in them
might help develop novel approaches to improving their productivity. In rodents and
humans the IGF-I gene is expressed as mRNA variants that differ in the 5’ and 3’ ends. It
was not known whether the IGF-I gene is expressed in a similar manner in cattle. This
dissertation research was therefore started with cloning and characterizing the bovine
IGF-I mRNA variants. The second part of this dissertation research was conducted to
determine how the expressions of different IGF-I mRNA variants in cattle were affected
by GH and food deprivation, an extreme situation of undernutrition. The last portion of
2
this dissertation research was focused on identifying the regulatory DNA region that
mediates GH stimulation of IGF-I gene expression, a long-standing question in studying
the mechanism of GH regulation of IGF-I gene expression.
3
Chapter I Review of Literature
Introduction
Insulin-like growth factor-I and II (IGF-I and IGF-II) were initially discovered by
their ability to mediate the stimulating effect of growth hormone (GH) on matrix protein
synthesis in hypophysectomized rats, as determined by a sulfate incorporation assay
(Salmon and Daughaday, 1957). Besides their growth-promoting effects (Daughaday and
Reeder, 1966; Zingg and Froesch, 1973), these factors also displayed many of the
biological activities of insulin (Antoniades et al., 1958; Froesch et al., 1963). In 1976,
these factors were purified from human serum (Rinderknecht and Humbel, 1976), and
sequencing of them revealed that they shared ~ 70% amino acid (aa) residues
(Rinderknecht and Humbel, 1978a, b), and ~ 50% homologous to human proinsulin. For
this reason, they were named insulin-like growth factor-I (IGF-I) and insulin-like growth
factor-II (IGF-II).
Despite structural similarities, IGF-I and IGF-II are distinct in many other aspects,
including tissue distribution, functions, and mechanism of action. In this review, I will
focus on IGF-I, as my dissertation research is centered on IGF-I. I will review the
structure and function of IGF-I, the mechanism of IGF-I action, and IGF-I gene
expression as well as regulation of IGF-I gene expression.
Mature IGF-I Protein
In most species, the mature IGF-I protein is a 70 aa, single chain polypeptide
containing an amino-terminal B region of 29 aa, a central C domain of 12 aa, an A
4
domain of 21 aa, and a carboxyl-terminal D region of 8 aa (Rotwein et al., 1986; Wong et
al., 1989). The mature IGF-I protein contains six evolutionarily conserved cysteine
residues. Since the cysteines are involved in formation of intraprotein disulfide bonds, the
IGF-I molecules from different species likely exhibit a similar three-dimensional
topography. In addition to the six cysteines, three tyrosine residues at positions 24, 31
and 60 are also conserved in different species, and they have been shown to be important
for high-affinity binding to its receptor (Bayne et al., 1990).
Besides the 70 aa mature IGF-I protein, a truncated form of IGF-I, des-IGF-I, was
identified from several tissues (Sara et al., 1986; Karey et al., 1989; Ogasawara et al.,
1989). Des-IGF-I lacks the first three amino acids of the B domain, and has a markedly
lower affinity for IGF binding proteins (IGFBPs) (Carlsson-Skwirut et al., 1989; Ballard
et al., 1991), and therefore, is biologically distinct from full-length IGF-I. For example,
compared to IGF-I, des-IGF-I was more potent in stimulating mammary blood flow, but
less effective in enhancing neuronal survival (Carlsson-Skwirut et al., 1989; Prosser et al.,
1995; Werther et al., 1998).
IGF-I Actions
The roles of IGF-I in cell growth, differentiation and death
IGF-I stimulates DNA synthesis and proliferation of a variety of cells, including
fibroblasts (Pietrzkowski et al., 1992), chondrocytes (Olney et al., 2004), lymphocytes
(Hettmer et al., 2005) and thymic epithelial cells (Timsit et al., 1992). Earlier studies
showed that IGF-I regulated cell progression from G1 to S phase (Stiles et al., 1979);
however, a more recent study demonstrated that the transit from G2 to M phase, not from
5
G1 to S phase, was profoundly retarded in IGF-I null cells, suggesting that IGF-I may be
required for timely progression through later phases of the cell cycle (Adesanya et al.,
1999).
Complementary to its stimulation of cell proliferation, IGF-I also functions as a
survival factor by preventing apoptosis. This anti-apoptotic effect has been shown in cell
types as diverse as cardiac myoblasts (Hong et al., 2001), epithelial cells (Ahmad et al.,
1999), neural cells (Zhong et al., 2005) and osteoblasts (Tumber et al., 2000).
At the completion of division (M phase), the daughter cells may re-enter the cell
cycle or undergo terminal differentiation. IGF-I has been demonstrated to induce
differentiation of adipocytes (Scavo et al., 2004), chondrocytes (Phornphutkul et al.,
2004), myoblasts (Florini et al., 1996) and neural cells (Pahlman et al., 1991).
Metabolic effects of IGF-I
IGF-I administration has a net anabolic effect on nitrogen balance through
increasing amino acid uptake and whole body protein synthesis rates, and decreasing
protein breakdown and nitrogen excretion (Fryburg, 1994; Fryburg et al., 1995). IGF-I
potently stimulates glucose uptake and glycogen synthesis, but decreases hepatic glucose
production leading to hypoglycemia (Schoenle et al., 1991; Boulware et al., 1992;
Dimitriadis et al., 1992). IGF-I infusion also lowers free fatty acid, triglycerides, and
cholesterol levels in blood (Miell et al., 1992; Turkalj et al., 1992).
The role of IGF-I in body growth
Infusion of IGF-I to growth-arrested animals, such as hypophysectomized and
diabetic rats, can restore growth rate (Schoenle et al., 1982; Scheiwiller et al., 1986; Zapf,
6
1998). Similar effects are also observed in humans. Clinically, recombinant human IGF-I
has been used in the treatment of patients with Laron syndrome (GH insensitivity
syndrome) since the late 1980’s (Backeljauw and Underwood, 1996; Ranke et al., 1999).
Transgenic mice overexpressing human IGF-I were approximately 30% heavier than
control mice (Mathews et al., 1988a). More dramatic changes were observed in
transgenic mice carrying either GH or growth hormone releasing factor fusion genes. The
body weights of these transgenic mice were twice those of the normal littermates
(Palmiter et al., 1983; Mathews et al., 1988b). The increase in body weight occurred 3
weeks after birth and was concomitant with the increase of circulating IGF-I, suggesting
that the growth-promoting activity of GH is, at least in part, mediated by increased IGF-I
production (Mathews et al., 1988b).
The most convincing evidence demonstrating that IGF-I plays a critical role in
both embryonic and postnatal growth came from animals deficient in the IGF-I gene. The
IGF-I knockout mice not only had reduced birth weight (~ 60% of normal newborns), but
also displayed severe muscle dystrophy and most (> 95%) of them died shortly after birth
(Liu et al., 1993; Powell-Braxton et al., 1993). The survivors continued to exhibit growth
retardation postnatally, reaching only 30% of normal adult weight, and both sexes of
IGF-I knockout adult mice were infertile (Baker et al., 1993; Baker et al., 1996).
Moreover, injection of recombinant human GH to the homozygous IGF-I-deficient mice
from postnatal day 14 (P14) to P56 failed to stimulate their growth, whereas the wild-
type mice having the same treatment exhibited accelerated growth (~ 30% of increase in
body weight) (Liu and LeRoith, 1999). In two human patients, a homozygous deletion of
7
part of the IGF-I gene coding region (Woods et al., 1996) or a homozygous missense
mutation in the IGF-I gene (Walenkamp et al., 2005) is associated with severe
intrauterine and postnatal growth failure, sensorineural deafness and mental retardation,
indicating a critical role of IGF-I in human growth too.
Other physiological actions
Hormone secretion from many cell types is regulated by IGF-I, with feedback
inhibition of GH secretion from pituitary somatotropes being the most typical example
(Pellizas et al., 2000). Progesterone production in granulosa cells (Seto-Young et al.,
2003), secretion of several steroid hormones and steroidogenic response to
adrenocorticotropic hormone (ACTH) in adrenocortical cells (l'Allemand et al., 1996),
and thymulin secretion from thymic epithelium (Timsit et al., 1992) are all stimulated by
IGF-I.
The responsiveness of mature immune cells to antigens can be affected by
interactions of immunocompetent cells with IGF-I. For example, macrophages pretreated
with IGF-I and subsequently stimulated with endotoxin showed increased production of
tumor necrosis factor (TNF)-α (Renier et al., 1996). T- and B-cells isolated from spleen
and lymph nodes of IGF-I pretreated rats were more responsive to mitogens or antigen
stimulation (Clark et al., 1993). In vivo experiments have also demonstrated that an IGF-I
pretreatment can improve host defense and primary antibody response in animals
(Robbins et al., 1994; Inoue et al., 1995).
IGF-I also plays an important role in cellular motility. IGF-I significantly
stimulates cell migration in a variety of cells, including melanoma cells (Stracke et al.,
8
1989), neuroblastoma cells (Leventhal et al., 1997), and kidney proximal tubule cells
(Cao et al., 2005). Earlier studies showed that the stimulation of cell migration by IGF-I
required tyrosine phosphorylation of paxillin and focal adhesion kinase (FAK), thereby
interacting with members of the integrin family (Jones et al., 1995; Leventhal et al.,
1997). However, a more recent study suggested that IGF-I-stimulated kidney proximal
tubule cell migration was independent of tyrosine phosphorylation of FAK (Cao et al.,
2005).
IGF-I and diseases
As discussed earlier, IGF-I not only stimulates proliferation but also inhibits
apoptosis in various cell types, including many tumor cell lines (Parrizas et al., 1997;
Alexia et al., 2004; Rosendahl and Forsberg, 2004). The combination of these mitogenic
and anti-apoptotic effects of IGF-I might have a profound impact on tumor growth
(Papatsoris et al., 2005). IGF-I also plays a role in the metastatic process through
influencing cellular motility (Stracke et al., 1989; Brooks et al., 1997). In addition to
direct effects, IGF-I also affects cancer cell growth through interaction with other
mitogenic growth factors and hormones. For instance, tamoxifen, an estrogen receptor
antagonist, blocked IGF-I-mediated proliferation of breast cancer cells in vitro
(Guvakova and Surmacz, 1997), suggesting a potential cross-talk between IGF-I and
estrogen in breast cancer development. Similarly, IGF-I signaling pathway might
sensitize androgen receptor to suboptimal stimulation and enhance the mitogenic actions
of epidermal growth factor (EGF) in prostate cancer (Putz et al., 1999; Orio et al., 2002).
9
IGF-I has also been shown to be involved in some neurological diseases, such as
Parkinson’s disease (PD), amyotrophic lateral sclerosis, and Alzheimer's disease (AD).
AD is an irreversible, progressive disorder in which neurons deteriorate, resulting in the
loss of cognitive functions, primarily memory and movement coordination. It is now
widely accepted that the pathological cascade leading to AD is initiated by the
accumulation of amyloid plaques in the brain (Selkoe, 2001). There was an inverse
relationship between the levels of circulating IGF-I and brain amyloid in mouse models
with AD, and administration of IGF-I stimulated amyloid clearance out of the brain into
the circulation to protect neurons from deleterious effects of amyloid (Carro et al., 2002).
Evidence also suggested that decreased IGF-I in the aged may increase amyloid, which in
turn disrupts IGF-I signaling pathway and causes IGF-I resistance to result in late-onset
AD (Carro and Torres-Aleman, 2004).
Mechanism of IGF-I action
IGF-I receptors
IGF-I can bind to a family of transmembrane receptors, including IGF-I receptor
(IGF-IR), insulin receptor, and IGF-II/mannose-6-phosphate (M-6-P) receptor, with most
of the biological actions of IGF-I being mediated through IGF-IR (Jones and Clemmons,
1995; LeRoith et al., 1995; Le Roith et al., 2001).
IGF-IR is a heterotetrameric complex comprised of two α- and two β-subunits.
Each α-subunit contains 706 aa, and each β-subunit contains 627 aa (Ullrich et al., 1986).
One α-subunit and one β-subunit are linked by a disulfide bond to form an αβ-half-
receptor, which, in turn, is linked to another αβ-half-receptor by two disulfide bonds
10
between the two α-subunits to form the mature, functional receptor. The α-subunit is
localized entirely extracellularly and contains a cysteine-rich domain which is necessary
for high-affinity IGF-I binding (Kjeldsen et al., 1991; Schumacher et al., 1991; Soos et al.,
1992). The β-subunit spans the membrane and is localized primarily intracellularly. Its
intracellular portion contains a tyrosine kinase domain whose activation is crucial for the
propagation of IGF-I effects (Gronborg et al., 1993; Hernandez-Sanchez et al., 1995).
IGF-I signaling pathway
IGF-I binding to the α-subunit of IGF-IR induces autophosphorylation of the β-
subunit. After autophosphorylation, the activated IGF-IR is able to phosphorylate other
tyrosine-containing substrates, including insulin receptor substrate 1 (IRS-1), Src-
homology 2-containing protein (SHC) and p85 which is the regulatory subunit of
phosphatidylinositol-3’-kinase (PI3’K) (Jones and Clemmons, 1995; LeRoith et al., 1995).
Activated p85 induces activation of the catalytic subunit of PI3’K, p110, to initiate the
PI3’K signaling pathway. IRS-1 protein is an adaptor protein with a phosphotyrosine
binding domain and multiple tyrosine residue-containing motifs. Phosphorylated IRS-1
protein acts as a docking protein for several downstream adaptor proteins, including p85,
growth factor receptor-binding protein 2/son of sevenless (Grb2/SOS), phosphotyrosine
phosphatase Syp and kinase Nck. Tyrosine phosphorylated SHC also binds to Grb2/SOS
complex. The complex is tightly associated with Ras, resulting in membrane association
and activation of Raf. Thereafter, mitogen-activated protein kinase kinase (MEK)
phosphorylates subsequent kinases such as extracellular regulated kinase (ERK) and S6
kinase. Apparently, IGF-I can activate the mitogen-activated protein kinase (MAPK)
11
signaling pathway via both the IRS-1-Grb2/SOS and the SHC-Grb2/SOS pathways, but
IRS-1 protein plays a more predominant role in the activation of the PI3’K pathway. IGF-
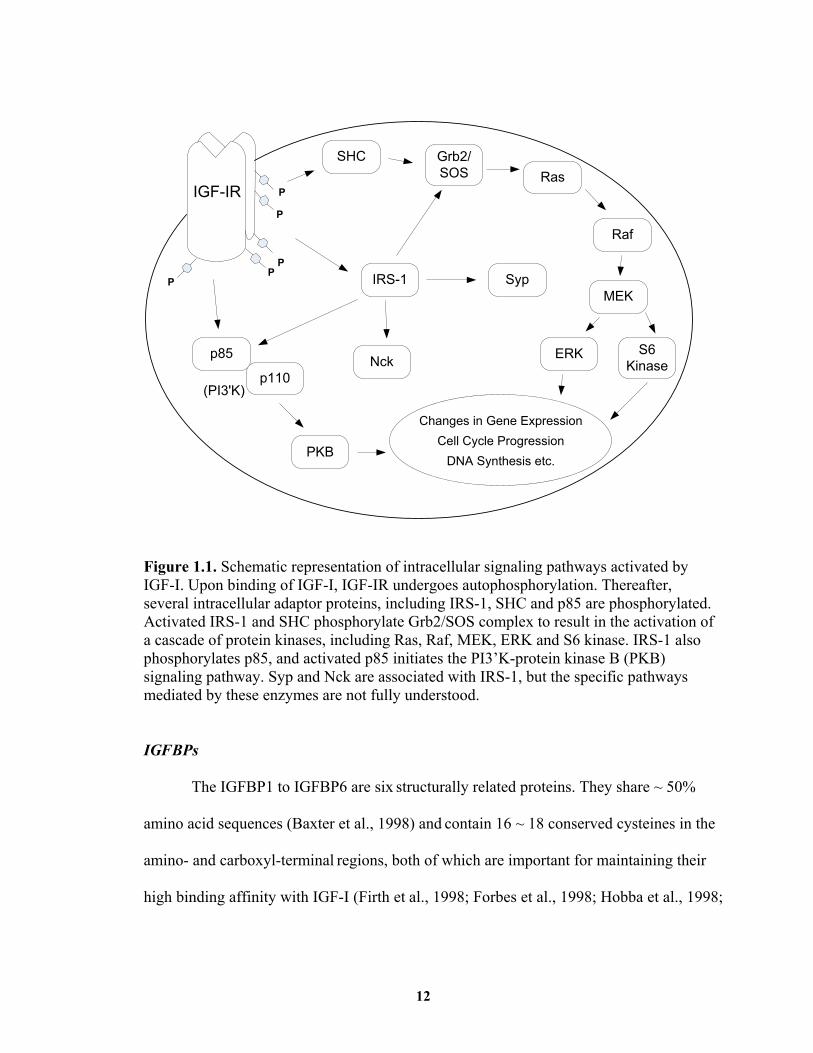
I-activated multiple signaling pathways via IGF-IR are shown in Figure 1.1.
It is well established that different effects of IGF-I are mediated by different
signaling pathways. The mitogenic effects of IGF-I are mediated, at least in part, by the
MAPK signaling pathway (Lu and Campisi, 1992; Ge and Rudikoff, 2000; Alexia et al.,
2004). Both PI3’-K and MAPK pathways have been implicated to be involved in anti-
apoptotic effects of IGF-I in many cell types (Parrizas et al., 1997; Ge and Rudikoff,
2000; Liu et al., 2003). The differential effects of IGF-I in various cells may require
different signaling pathways (Kim et al., 1997; Phornphutkul et al., 2004; Scavo et al.,
2004).
12
IGF-IR
PP
P
P
P
SHC Grb2/SOS
Changes in Gene Expression Cell Cycle Progression
DNA Synthesis etc.
Ras
Raf
p85
IRS-1MEK
PKB
Syp
Nck ERK S6 Kinase
(PI3'K)p110
Figure 1.1. Schematic representation of intracellular signaling pathways activated by IGF-I. Upon binding of IGF-I, IGF-IR undergoes autophosphorylation. Thereafter, several intracellular adaptor proteins, including IRS-1, SHC and p85 are phosphorylated. Activated IRS-1 and SHC phosphorylate Grb2/SOS complex to result in the activation of a cascade of protein kinases, including Ras, Raf, MEK, ERK and S6 kinase. IRS-1 also phosphorylates p85, and activated p85 initiates the PI3’K-protein kinase B (PKB) signaling pathway. Syp and Nck are associated with IRS-1, but the specific pathways mediated by these enzymes are not fully understood.
IGFBPs
The IGFBP1 to IGFBP6 are six structurally related proteins. They share ~ 50%
amino acid sequences (Baxter et al., 1998) and contain 16 ~ 18 conserved cysteines in the
amino- and carboxyl-terminal regions, both of which are important for maintaining their
high binding affinity with IGF-I (Firth et al., 1998; Forbes et al., 1998; Hobba et al., 1998;
13
Twigg et al., 1998). In serum, almost all IGF-I proteins are bound by IGFBPs, which
function as carrier proteins; as a result, IGFBPs prolong the half-lives of IGF-I proteins
by protecting them from proteolytic degradation, and regulate their metabolic clearance
(Guler et al., 1989). Although IGF-I can bind to all IGFBPs, in serum most of IGF-I
proteins circulate with IGFBP3 or IGFBP5 and a non-IGF binding component named
acid-labile subunit (ALS), forming 130 to 150 kDa ternary complexes (Baxter and Martin,
1989; Twigg and Baxter, 1998). Ternary complexed IGF-I proteins are believed to have
restricted bioavailability due to the inability of the complexes to traverse the capillary
barrier. However, release of IGF-I from this complex appears to increase during a variety
of particular conditions, such as pregnancy (Hossenlopp et al., 1990; Kubler et al., 1998),
and surgery (Davenport et al., 1992) to meet the requirement of more IGF-I. Once they
are released from the large complexes, IGF-I proteins bind to IGFBP1 and IGFBP2 to
form small complexes, which are believed to facilitate the transport of IGF-I from serum
to tissue (Brewer et al., 1988; Bar et al., 1990; Jones et al., 1993). Therefore, IGFBPs can
control the efflux of IGF-I from the vascular space.
In addition to being the serum transport proteins for IGF-I, IGFBPs can directly
modulate IGF-I activity. The inhibitory effects of IGFBPs on IGF-I action, at all aspects
from cell proliferation and differentiation to cell function to hypoglycemic activity to
whole body growth, exist for all six IGFBPs (Peterkofsky et al., 1994; Rajkumar et al.,
1995; Kiepe et al., 2001; Flint et al., 2003; Xi et al., 2004). However, IGFBPs also have
stimulatory effects on IGF-I action (Lee et al., 1996; Matsumoto et al., 2000; Giannini et
al., 2001). Therefore, the effects of IGFBPs on IGF-I actions depend on many variables,
14
including culture condition, cell type, IGFBP dose and post-translational modification
(Busby et al., 1988; Ewton et al., 1998; Matsumoto et al., 2000; Kiepe et al., 2002).
Endocrine, paracrine and autocrine mechanisms of action
First line of evidence for endocrine action of IGF-I came from the observations
that serum from hypophysectomized rats treated with GH was able to stimulate sulfate
uptake and DNA synthesis in cartilage; however, the serum from hypophysectomized rats
was ineffective (Salmon and Daughaday, 1957; Daughaday and Reeder, 1966).
Administration of IGF-I to animals and humans subcutaneously can increase body weight,
suggesting that IGF-I is able to stimulate somatic growth by traveling through the
circulation (Zapf, 1998; Ranke et al., 1999).
In 1999, mice with liver IGF-I deficiency (LID mice) were created using
homologous recombination (Sjogren et al., 1999; Yakar et al., 1999). The LID mice had a
70% lower circulating IGF-I level than their wild-type littermates, supporting the
conclusion that the majority of circulating IGF-I is from liver. LID mice displayed
muscle-specific insulin resistance, increased blood pressure and reduced cortical radial
growth and axial skeletal growth (Sjogren et al., 2001; Yakar et al., 2001; Sjogren et al.,
2002; Tivesten et al., 2002), all suggesting the importance of circulating IGF-I. However,
surprisingly, the LID pups were born with normal body weights, grew at a normal rate
and were fertile, which argues against the traditional view that the circulating IGF-I
controls normal growth and development. However, the results from ALS-deficient mice
(ALSKO) and double knockout LID+ALSKO mice suggest that circulating IGF-I does
play a role in somatic growth (Ueki et al., 2000; Yakar et al., 2002). ALSKO mice had
15
60% less circulating IGF-I than wild-type mice and showed modest postnatal somatic
growth retardation (~ 15% reductions in the weights) as well as significantly reduced
linear bone growth. Double knockout mice exhibited a further reduction in serum IGF-I
level (85 ~ 90% decrease) and a more significant reduction in linear growth (~ 30%
reduction in body weight). Further measurements of clearance rate of IGF-I from serum
demonstrated that turnover rate of IGF-I was higher in ALSKO and LID+ALSKO mice
than in control and LID mice. These observations support the notion that it is not only the
total amount of IGF-I in the circulation that plays a role in somatic growth, but its
bioavailability as well. These observations, however, do not tell whether the normal
growth and development in LID mice results from the remaining 25% of circulating IGF-
I or autocrine/paracrine action of IGF-I. Generation of mutant mice with specific deletion
of IGF-I in other tissues should help to address this question.
There is some other evidence supporting paracrine and/or autocrine actions of
IGF-I. IGF-I is expressed by multiple cell types in culture and in virtually every tissue in
vivo (D'Ercole et al., 1980; D'Ercole et al., 1984). The transgenic mice that overexpress
IGF-I in specific tissues, without altering the circulating IGF-I level, exhibit tissue-
specific overgrowth (Coleman et al., 1995; Weber et al., 1998; Delaughter et al., 1999;
Guo et al., 2005). IGF-I concentration is often increased at sites of injury and/or repair,
indicating paracrine or autocrine roles of IGF-I during organ regeneration and in repair
following injury (Hammerman and Miller, 1997; Musaro et al., 2001; Sanz et al., 2005).
16
Molecular Organization
Since the first IGF-I cDNA sequence was reported by Jansen et al. in 1983, the
IGF-I gene, mRNA and deduced amino acid sequences have been determined for a
number of species, including human, mouse, rat and cattle. By aligning these sequences,
it is shown that the basic structure of IGF-I gene is conserved throughout 550 million
years of vertebrate evolution (Nagamatsu et al., 1991). These sequences also show that
the IGF-I gene and mRNA structures are much more complex than anticipated from
mature IGF-I polypeptide sequence.
IGF-I gene structure
The IGF-I gene is a single-copy gene in mammals and birds (Shimatsu and
Rotwein, 1987a; Fawcett and Bulfield, 1990), but there is evidence suggesting the
existence of a duplicate, non-allelic IGF-I gene in Xenopus (Shuldiner et al., 1990) and
some fish (Kavsan et al., 1994; Chen et al., 2001). The IGF-I gene has an unexpectedly
large size, ranging in length from less than 20 kb in salmon (Kavsan et al., 1993), 50 kb
in chicken (Kajimoto and Rotwein, 1991), to more than 80 kb in rat and human. The rat,
mouse and human IGF-I genes consist of six exons and five introns. Compared to the
sizes of exons, the introns are much larger; for example, the intron between exons 3 and 4
of the human IGF-I gene spans more than 50 kb. There is evidence suggesting that the
large size of these introns is not caused by the presence of another evolutionarily
conserved gene within IGF-I gene (Kajimoto and Rotwein, 1991).
17
IGF-I mRNA structure
Transcription of IGF-I gene in human and rat can be initiated from exon 1 or exon
2; therefore, both exons 1 and 2 are called leader exons. Both exons 1 and 2 are
exclusively spliced onto exon 3, generating mRNA containing exon 1, the so called class
1 IGF-I mRNA or mRNA containing exon 2, the so called class 2 IGF-I mRNA (Rotwein
et al., 1986; Roberts et al., 1987a; Bucci et al., 1989; Tobin et al., 1990; Holthuizen,
1991). In addition to human and rat, pig (Bell et al., 1990; Muller and Brem, 1990) and
sheep (Wong et al., 1989) IGF-I genes are also transcribed into class 1 and class 2 mRNA.
Exon 2-like sequence has not been found in chicken and some fish species. In sheep,
transcription of IGF-I gene can be also initiated from a third leader exon, exon 1W
(Wong et al., 1989; Dickson et al., 1991). Exon 1W is located around 200 bp upstream of
exon 1 (Ohlsen et al., 1993). Within each of these leader exons, several transcription start
sites are used. Studies in human, rat and sheep showed that transcription initiation in exon
1 was dispersed, spreading over several hundred base pairs; whereas transcription
initiation in exon 2 was from several localized start sites, except one that was located
more than 700 bp upstream from the 3’ end of exon 2 (Adamo et al., 1991a; Jansen et al.,
1991; Ohlsen et al., 1993). Besides using multiple leader exons and multiple transcription
start sites in the production of IGF-I mRNA containing different 5’ ends, a unique ‘intra-
exonic splicing’ has been identified in rat IGF-I mRNA, in which a 186 bp segment
flanked by splice junctions in exon 1 is spliced out (Shimatsu and Rotwein, 1987b; Foyt
et al., 1991).
18
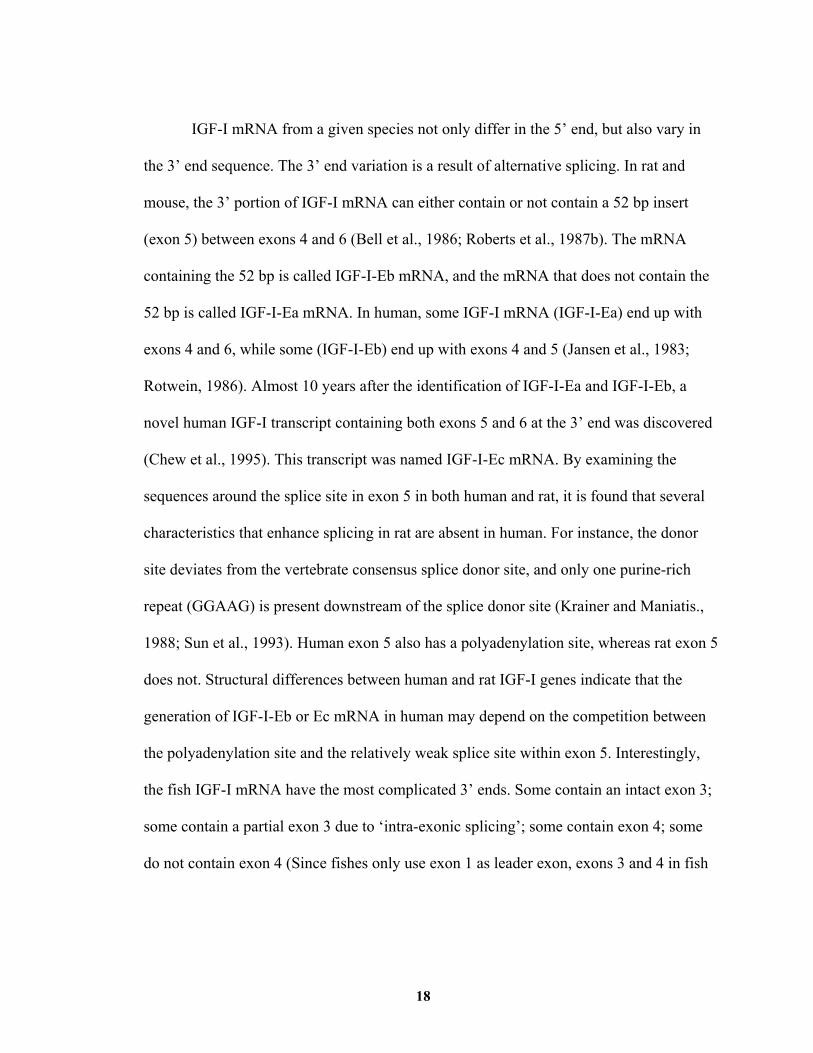
IGF-I mRNA from a given species not only differ in the 5’ end, but also vary in
the 3’ end sequence. The 3’ end variation is a result of alternative splicing. In rat and
mouse, the 3’ portion of IGF-I mRNA can either contain or not contain a 52 bp insert
(exon 5) between exons 4 and 6 (Bell et al., 1986; Roberts et al., 1987b). The mRNA
containing the 52 bp is called IGF-I-Eb mRNA, and the mRNA that does not contain the
52 bp is called IGF-I-Ea mRNA. In human, some IGF-I mRNA (IGF-I-Ea) end up with
exons 4 and 6, while some (IGF-I-Eb) end up with exons 4 and 5 (Jansen et al., 1983;
Rotwein, 1986). Almost 10 years after the identification of IGF-I-Ea and IGF-I-Eb, a
novel human IGF-I transcript containing both exons 5 and 6 at the 3’ end was discovered
(Chew et al., 1995). This transcript was named IGF-I-Ec mRNA. By examining the
sequences around the splice site in exon 5 in both human and rat, it is found that several
characteristics that enhance splicing in rat are absent in human. For instance, the donor
site deviates from the vertebrate consensus splice donor site, and only one purine-rich
repeat (GGAAG) is present downstream of the splice donor site (Krainer and Maniatis.,
1988; Sun et al., 1993). Human exon 5 also has a polyadenylation site, whereas rat exon 5
does not. Structural differences between human and rat IGF-I genes indicate that the
generation of IGF-I-Eb or Ec mRNA in human may depend on the competition between
the polyadenylation site and the relatively weak splice site within exon 5. Interestingly,
the fish IGF-I mRNA have the most complicated 3’ ends. Some contain an intact exon 3;
some contain a partial exon 3 due to ‘intra-exonic splicing’; some contain exon 4; some
do not contain exon 4 (Since fishes only use exon 1 as leader exon, exons 3 and 4 in fish
19
IGF-I gene correspond to exons 4 and 5 in rat IGF-I gene) (Shamblott and Chen, 1993;
Wallis and Devlin, 1993).
Transcription from multiple leader exons, use of multiple transcription initiation
sites, and alternative RNA splicing do result in IGF-I mRNA that differ in size. However,
at least in rat, variable lengths of IGF-I mRNA from 7 kb down to 1 kb occur principally
as a result of use of different polyadenylation sites and hence different sizes of 3’-
untranslated region (UTR) (Shimatsu and Rotwein, 1987a; Lund et al., 1989). Similar
size heterogeneity of IGF-I mRNA is also observed in human (Rotwein, 1986), mouse
(Bell et al., 1986), horse (Nixon et al., 1999) and some other species (Wong et al., 1989;
Kajimoto and Rotwein, 1990). However, in chicken and salmon, only a single
predominant IGF-I mRNA can be detected (Kajimoto and Rotwein, 1989; Wallis and
Devlin, 1993). All IGF-I mRNA variants are mature, cytoplasmic and probably
functional. In addition, there is no strict association of use of a particular leader exon,
transcription start site, or 3’ exon splicing mechanism with the utilization of a particular
polyadenylation site (Lund, 1994).
20
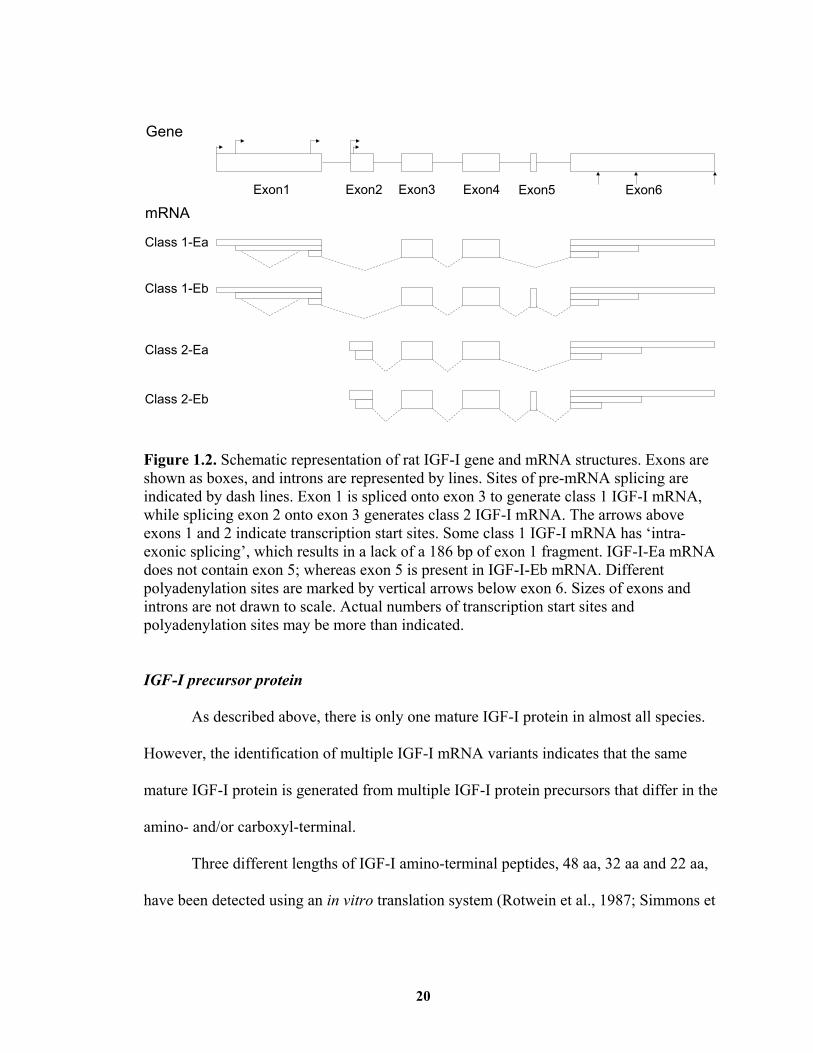
mRNAExon1 Exon2 Exon3 Exon4 Exon5 Exon6
Gene
Class 1-Ea
Class 2-Ea
Class 1-Eb
Class 2-Eb
Figure 1.2. Schematic representation of rat IGF-I gene and mRNA structures. Exons are shown as boxes, and introns are represented by lines. Sites of pre-mRNA splicing are indicated by dash lines. Exon 1 is spliced onto exon 3 to generate class 1 IGF-I mRNA, while splicing exon 2 onto exon 3 generates class 2 IGF-I mRNA. The arrows above exons 1 and 2 indicate transcription start sites. Some class 1 IGF-I mRNA has ‘intra-exonic splicing’, which results in a lack of a 186 bp of exon 1 fragment. IGF-I-Ea mRNA does not contain exon 5; whereas exon 5 is present in IGF-I-Eb mRNA. Different polyadenylation sites are marked by vertical arrows below exon 6. Sizes of exons and introns are not drawn to scale. Actual numbers of transcription start sites and polyadenylation sites may be more than indicated.
IGF-I precursor protein
As described above, there is only one mature IGF-I protein in almost all species.
However, the identification of multiple IGF-I mRNA variants indicates that the same
mature IGF-I protein is generated from multiple IGF-I protein precursors that differ in the
amino- and/or carboxyl-terminal.
Three different lengths of IGF-I amino-terminal peptides, 48 aa, 32 aa and 22 aa,
have been detected using an in vitro translation system (Rotwein et al., 1987; Simmons et
21
al., 1993; Yang et al., 1995). For exon 1-containing transcripts, prepro-IGF-I translation
can be initiated at both the Met-48 codon in exon 1, a codon that is 48 codons upstream
from the codon for the first aa of mature IGF-I protein, and the Met-22 codon in exon 3,
with the former being preferentially used. For some class 1 IGF-I mRNA transcribed
from the site downstream of the Met-48 codon, the Met-22 codon is of course the only
available translation start codon. Translation of IGF-I mRNA transcribed from exon 2
initiates at both the Met-32 codon in exon 2 and the Met-22 codon in exon 3, with 80% of
translation being initiated at the Met-32 codon. As mentioned above, sheep IGF-I can be
transcribed from exon 1W. However, exon 1W does not contain an in-frame start codon;
therefore, translation of exon 1W-containing IGF-I mRNA initiates from the Met-22
codon in exon 3 (Ohlsen et al., 1993). The amino-terminal peptides of all prepro-IGF-I
have typical features of eukaryotic signal peptide, and all of them have been shown to be
cleaved translationally by pancreatic microsomes, suggesting they each function as signal
peptides in vivo (Rotwein et al., 1987; Simmons et al., 1993; Yang et al., 1995). The sites
of both translation initiation and translational cleavage of the signal peptide are conserved
between species (Kajimoto and Rotwein, 1989; 1990; Otte et al., 1996; Kermouni et al.,
1998; Ayson et al., 2002).
Besides the signal peptide, E domain at the carboxyl end of the prepro-IGF-I is
also released during maturation (Rotwein et al., 1986). In mouse and rat, IGF-I-Ea and Eb
mRNA encode 35 and 41 aa E peptides, respectively. The first 16 aa of the E domain are
encoded by exon 4, which are included in both IGF-I-Ea and Eb mRNA. So, this part of
E domain is identical in prepro-IGF-I-Ea and Eb. As a consequence of insertion of exon 5
22
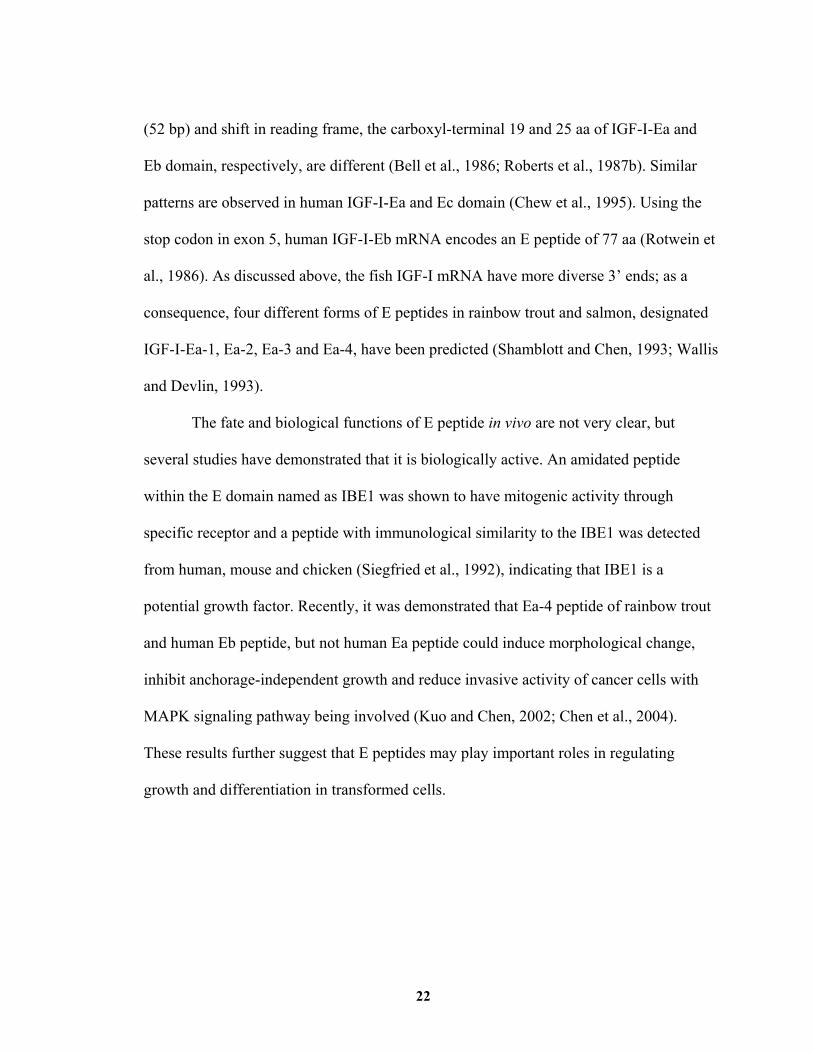
(52 bp) and shift in reading frame, the carboxyl-terminal 19 and 25 aa of IGF-I-Ea and
Eb domain, respectively, are different (Bell et al., 1986; Roberts et al., 1987b). Similar
patterns are observed in human IGF-I-Ea and Ec domain (Chew et al., 1995). Using the
stop codon in exon 5, human IGF-I-Eb mRNA encodes an E peptide of 77 aa (Rotwein et
al., 1986). As discussed above, the fish IGF-I mRNA have more diverse 3’ ends; as a
consequence, four different forms of E peptides in rainbow trout and salmon, designated
IGF-I-Ea-1, Ea-2, Ea-3 and Ea-4, have been predicted (Shamblott and Chen, 1993; Wallis
and Devlin, 1993).
The fate and biological functions of E peptide in vivo are not very clear, but
several studies have demonstrated that it is biologically active. An amidated peptide
within the E domain named as IBE1 was shown to have mitogenic activity through
specific receptor and a peptide with immunological similarity to the IBE1 was detected
from human, mouse and chicken (Siegfried et al., 1992), indicating that IBE1 is a
potential growth factor. Recently, it was demonstrated that Ea-4 peptide of rainbow trout
and human Eb peptide, but not human Ea peptide could induce morphological change,
inhibit anchorage-independent growth and reduce invasive activity of cancer cells with
MAPK signaling pathway being involved (Kuo and Chen, 2002; Chen et al., 2004).
These results further suggest that E peptides may play important roles in regulating
growth and differentiation in transformed cells.
23
C A D E
C A D E
C A D E
4 6
4 65
4 6
C A D E
4 65
C A D E
4 6
E
4 65
Prepro IGF-I
Class1 Ea
Class1 Eb
Class2 Ea
Class2 Eb
Ea*
Eb*
Mature IGF-I
Signal
3
B
Signal
3
2
Signal
3
B
2
Signal
3
B
1
Signal
3
B
1
Signal
3
B
C A DB
C A DB
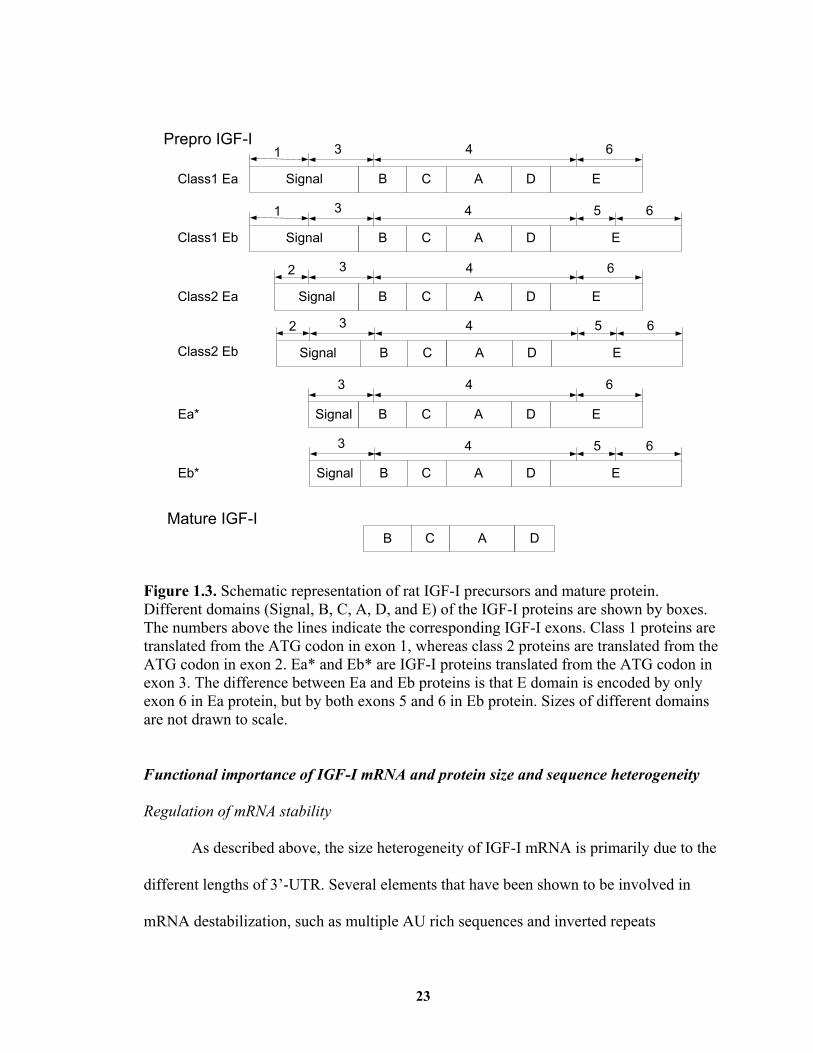
Figure 1.3. Schematic representation of rat IGF-I precursors and mature protein. Different domains (Signal, B, C, A, D, and E) of the IGF-I proteins are shown by boxes. The numbers above the lines indicate the corresponding IGF-I exons. Class 1 proteins are translated from the ATG codon in exon 1, whereas class 2 proteins are translated from the ATG codon in exon 2. Ea* and Eb* are IGF-I proteins translated from the ATG codon in exon 3. The difference between Ea and Eb proteins is that E domain is encoded by only exon 6 in Ea protein, but by both exons 5 and 6 in Eb protein. Sizes of different domains are not drawn to scale. Functional importance of IGF-I mRNA and protein size and sequence heterogeneity
Regulation of mRNA stability
As described above, the size heterogeneity of IGF-I mRNA is primarily due to the
different lengths of 3’-UTR. Several elements that have been shown to be involved in
mRNA destabilization, such as multiple AU rich sequences and inverted repeats
24
(Muskens et al., 2000; Dean et al., 2004; Gingerich et al., 2004), are present in the long
3’-UTR sequence of the 7 kb IGF-I mRNA (Steenbergh et al., 1991; Hoyt et al., 1992).
Indeed, the 7 kb IGF-I mRNA are less stable than the smaller forms, as demonstrated by
both in vitro and in vivo studies (Hepler et al., 1990). Thus, the size heterogeneity in IGF-
I mRNA provides a molecular basis for post-transcriptional control of IGF-I gene
expression at the level of mRNA stability.
Regulation of translational efficiency
Translational efficiency of higher eukaryotic mRNA is determined primarily by
the sequence surrounding the translation start codon. Short 5’-UTR, secondary structure
and upstream AUG usually inhibit translation (Kozak, 1991; 1999). In rat liver, class 1
IGF-I mRNA was predominant in the polysomal fraction, while class 2 IGF-I mRNA
constituted only a small fraction of the total polysomal RNA (Foyt et al., 1991; Foyt et al.,
1992), suggesting that more class 1 than class 2 IGF-I mRNA is translated. It may be
caused by the shorter 5’-UTR in class 2 IGF-I mRNA compared to class 1 IGF-I mRNA.
For different class 1 IGF-I transcripts, the translational efficiency was inversely
proportional to the length of the 5’-UTR (Foyt et al., 1992; Yang et al., 1995). It can be
assumed that a structure rather than the length has adverse effects on translation.
Mutational analyses indicated that the lack of the upstream two AUG motifs in the leader
sequences might contribute to the greater translational efficiency of shorter transcripts. It
is becoming increasingly clear that the 3’-UTR of an mRNA can have the same important
role in regulating translation as the 5’-UTR (Kozak, 2004). The 7 kb IGF-I mRNA were
associated with polysomes at much lower levels than smaller forms (Foyt et al., 1991;
25
O'Sullivan et al., 2002). This is perhaps because they contain long 3’-UTR. Thus, the
different 5’-UTR and 3’-UTR of IGF-I mRNA variants may control IGF-I gene
expression at the level of translation.
Post-translational regulation
Using green fluorescent protein (GFP)-fusions, Tan et al. (2002) found that
nuclear and nucleolar localizations were seen more in the context of the exon 2-encoded,
rather than the exon 1-encoded IGF-I signal peptide, indicating that the structure and/or
the length of IGF-I signal peptides may affect intracellular transport. In addition to the
signal peptide sequences, a nucleolar localization signal present in the carboxyl-terminal
part of the Eb domain of human IGF-I protein also directs IGF-I protein to localize in the
nucleus and strongly in the nucleolus (Tan et al., 2002). Since this region is encoded by
3’ portion of exon 5 which is not present in IGF-I mRNA encoding human IGF-I-Ea and
Ec proteins, human IGF-I-Ea and Ec proteins may have different cellular localization
pattern from IGF-I-Eb protein.
Glycosylation is the principal chemical modification to most secretory proteins.
Glycosylation can alter the conformation, stability, bioactivity and cellular location of
proteins (Helenius and Aebi, 2001). There are two glycosylation sites in the Ea domain of
rat pro-IGF-I, and both can be N-glycosylated in vitro (Bach et al., 1990; Simmons et al.,
1993). The Ea peptides of all characterized mammalian IGF-I precursors and
corresponding chicken, Xenopus, and salmon Ea peptides contain at least one N-
glycosylation motif (Hepler and Lund, 1990). The physiological significance of
glycosylation of Ea domain of IGF-I proteins remains to be elucidated. It should be
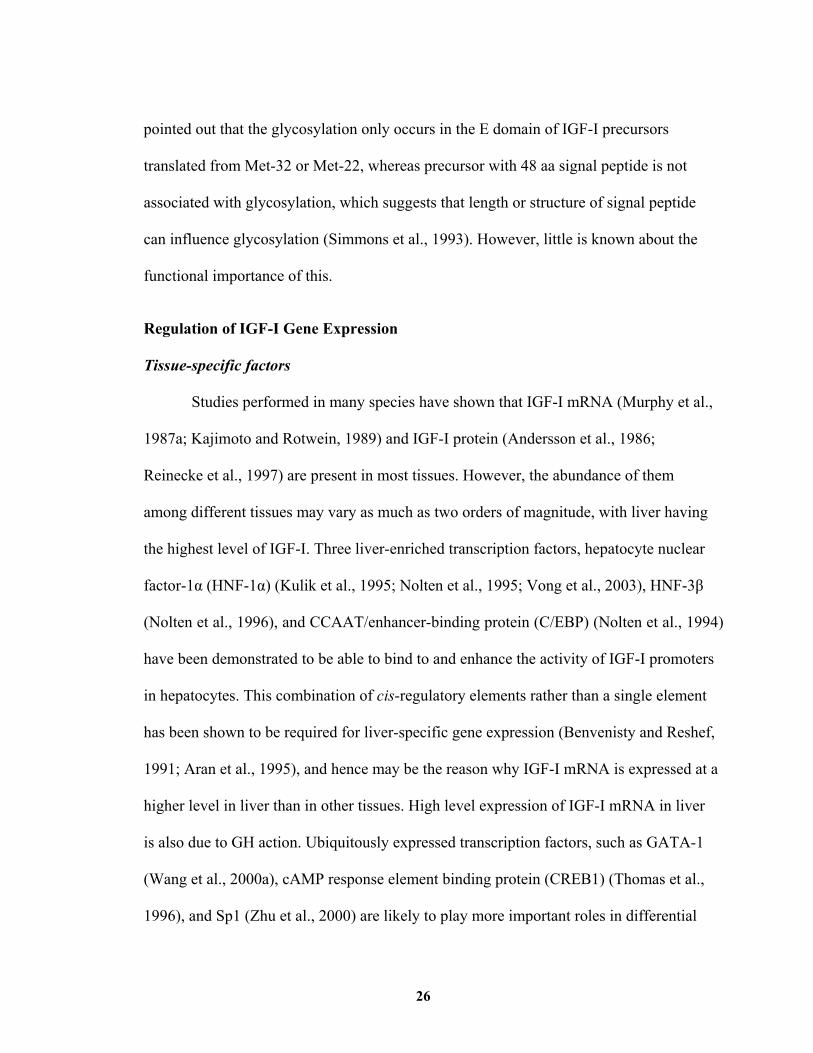
26
pointed out that the glycosylation only occurs in the E domain of IGF-I precursors
translated from Met-32 or Met-22, whereas precursor with 48 aa signal peptide is not
associated with glycosylation, which suggests that length or structure of signal peptide
can influence glycosylation (Simmons et al., 1993). However, little is known about the
functional importance of this.
Regulation of IGF-I Gene Expression
Tissue-specific factors
Studies performed in many species have shown that IGF-I mRNA (Murphy et al.,
1987a; Kajimoto and Rotwein, 1989) and IGF-I protein (Andersson et al., 1986;
Reinecke et al., 1997) are present in most tissues. However, the abundance of them
among different tissues may vary as much as two orders of magnitude, with liver having
the highest level of IGF-I. Three liver-enriched transcription factors, hepatocyte nuclear
factor-1α (HNF-1α) (Kulik et al., 1995; Nolten et al., 1995; Vong et al., 2003), HNF-3β
(Nolten et al., 1996), and CCAAT/enhancer-binding protein (C/EBP) (Nolten et al., 1994)
have been demonstrated to be able to bind to and enhance the activity of IGF-I promoters
in hepatocytes. This combination of cis-regulatory elements rather than a single element
has been shown to be required for liver-specific gene expression (Benvenisty and Reshef,
1991; Aran et al., 1995), and hence may be the reason why IGF-I mRNA is expressed at a
higher level in liver than in other tissues. High level expression of IGF-I mRNA in liver
is also due to GH action. Ubiquitously expressed transcription factors, such as GATA-1
(Wang et al., 2000a), cAMP response element binding protein (CREB1) (Thomas et al.,
1996), and Sp1 (Zhu et al., 2000) are likely to play more important roles in differential
27
expression of IGF-I gene in extra-hepatic tissues (Jansen et al., 1992; An and Lowe, 1995;
Mittanck et al., 1997).
As discussed earlier, IGF-I mRNA is a heterogeneous and complex family. The
IGF-I mRNA variants are expressed differently among tissues, with class 2 and IGF-I-Eb
mRNA representing significantly higher percentage of total IGF-I mRNA in liver than in
other tissues (Hoyt et al., 1988; Lowe et al., 1988; Shemer et al., 1992).
Hormonal regulation
By growth hormone
In animal models in which pituitary GH secretion is impaired, hepatic IGF-I
mRNA level is very low; treatment with GH can restore the IGF-I mRNA to its normal
level, suggesting IGF-I gene expression in liver is predominantly controlled by GH
(Mathews et al., 1986; Roberts et al., 1986). In response to GH, both high- and low-
molecular-weight IGF-I mRNA increase coordinately, indicating that GH has no
preference for a polyadenylation site in stimulating IGF-I expression (Roberts et al., 1986;
Bichell et al., 1992). Besides liver, IGF-I gene expression in many extra-hepatic tissues,
including heart, kidney, mammary gland, skeletal muscle and adipose tissue, is also under
the control of GH (Roberts et al., 1987b; Isgaard et al., 1989; Kleinberg et al., 1990;
Vikman et al., 1991). A pulsatile pattern of GH secretion is more efficient than
continuous pattern in activating IGF-I gene expression (Isgaard et al., 1988; Frost et al.,
2002).
Stimulation of IGF-I gene expression by GH is quick and appears to be
independent of new protein synthesis (Gronowski and Rotwein, 1995; Gronowski et al.,
28
1996). In response to GH, the increase in nuclear pre-IGF-I mRNA preceded appearance
of mature IGF-I mRNA in the cytoplasm (Bichell et al., 1992; Gronowski and Rotwein,
1995), and degradation of IGF-I mRNA was independent of the presence of GH (Doglio
et al., 1987), which together support that GH enhances IGF-I expression primarily at the
level of transcription. Direct supporting evidence came from nuclear run-on assay. Using
this assay, several groups have demonstrated that the rapid change in IGF-I mRNA
abundance in response to GH is a result of increased transcription rate (Mathews et al.,
1986; Doglio et al., 1987; Bichell et al., 1992).
In order to determine how GH regulates IGF-I transcription, several DNA-protein
interaction sites in the proximal promoter of IGF-I gene identified by an in vitro
footprinting assay were characterized for binding specificity and regulation by GH.
However, none of them was changed in the hypophysectomized and GH-treated rats
(Thomas et al., 1994; Le Stunff et al., 1995). In addition to the proximal promoter region,
Bichell et al. (1992) mapped the GH-dependent DNase I hypersensitive sites in the entire
rat IGF-I gene spanning more than 120 kb. They found that a DNase I hypersensitive site
(HS7) located in the second intron was absent in hypophysectomized rats but appeared
after GH injection. Subsequent dimethylsulfate (DMS) in vivo footprinting studies
localized HS7 to an approximately 350 bp intron 2 region. However, DNA-protein
interactions at this region remained constant after GH treatment in vitro and in vivo
(Thomas et al., 1995). These observations indicate GH may induce alterations in
nucleosome organization rather than stimulate DNA-protein interaction, or GH induces

29
DNA-protein interaction beyond the 120 kb genomic DNA region covered by the
footprinting analysis.
Delineation of the GH signaling pathway has provided clues to how GH might
activate IGF-I gene expression (Kopchick and Andry, 2000; Piwien-Pilipuk et al., 2002).
GH binding to its receptor recruits and activates the receptor-associated Janus kinase
(JAK); activated JAK in turn phosphorylates tyrosines within itself and the GH receptor.
These tyrosines form binding sites for a number of signaling proteins, which initiate
several signaling pathways that ultimately subserve multiple GH-related biological
functions. The main signaling pathways stimulated by GH include the signal transducer
and activator of transcription (STAT) pathway, the IRS-PI3’K pathway and the Shc-Ras-
MAPK pathway (Figure 1.4).
30
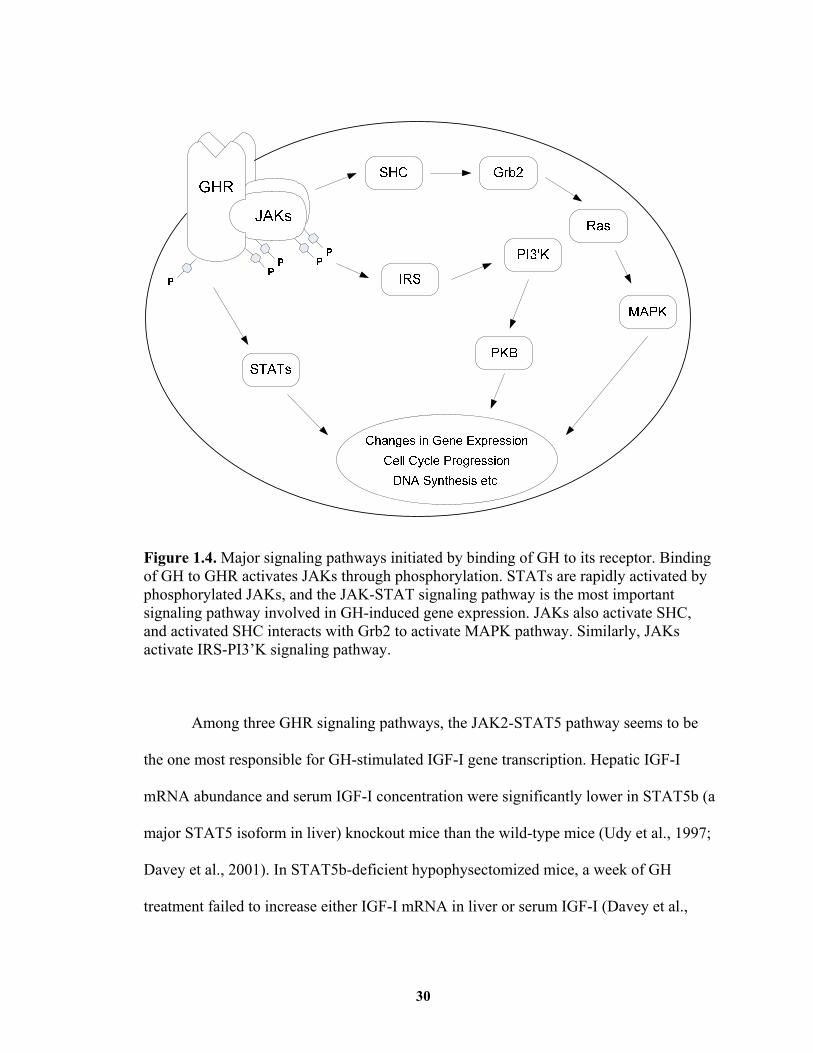
Figure 1.4. Major signaling pathways initiated by binding of GH to its receptor. Binding of GH to GHR activates JAKs through phosphorylation. STATs are rapidly activated by phosphorylated JAKs, and the JAK-STAT signaling pathway is the most important signaling pathway involved in GH-induced gene expression. JAKs also activate SHC, and activated SHC interacts with Grb2 to activate MAPK pathway. Similarly, JAKs activate IRS-PI3’K signaling pathway.
Among three GHR signaling pathways, the JAK2-STAT5 pathway seems to be
the one most responsible for GH-stimulated IGF-I gene transcription. Hepatic IGF-I
mRNA abundance and serum IGF-I concentration were significantly lower in STAT5b (a
major STAT5 isoform in liver) knockout mice than the wild-type mice (Udy et al., 1997;
Davey et al., 2001). In STAT5b-deficient hypophysectomized mice, a week of GH
treatment failed to increase either IGF-I mRNA in liver or serum IGF-I (Davey et al.,
31
2001). In human patients bearing STAT5b mutations, serum IGF-I concentration was
markedly low, being less than 10% of the normal level. Moreover, GH treatment was
unable to increase IGF-I mRNA abundance in cultured fibroblasts isolated from the
patient or serum IGF-I concentration (Kofoed et al., 2003; Hwa et al., 2005). More
recently, two adult siblings who had a truncated GHR resulting in a selective loss of
STAT5 signaling were reported to have much less serum IGF-I than normal people
(Milward et al., 2004). In cell lines and in animals, GH rapidly stimulates the tyrosine
phosphorylation and activation of STAT3, MAPKs and PKB, and GH-increased IGF-I is
concomitant with these changes (Gronowski et al., 1995; Gronowski et al., 1996;
Sadowski et al., 2001; Frost et al., 2002). Moreover, an inhibitor of JAK3 blocked GH
activation of STAT3, and completely abrogated GH-induced IGF-I gene expression
whereas it did not inhibit STAT5 phosphorylation (Frost et al., 2002). Thus, GH-induced
IGF-I transcription likely involves factors in addition to STAT5.
By estrogen
Estrogen is a key stimulator of IGF-I gene expression in the uterus, as evidenced
by undetectable IGF-I mRNA level in the uterus in ovariectomized rodents, but a rapid
accumulation of IGF-I mRNA after acute or chronic estrogen treatment (Murphy et al.,
1987b; Murphy and Friesen, 1988; Kapur et al., 1992). Similar stimulatory effects of
estrogen on uterine IGF-I gene expression have been observed in prepubertal animals,
where a single injection of estrogen caused a significant increase in IGF-I mRNA
abundance (Murphy and Luo, 1989; Simmen et al., 1990), and in human, where both the
32
mRNA and protein levels are highest in the endometrium during the proliferative phase
of the menstrual cycle (Giudice et al., 1993; Zhou et al., 1994).
Estrogen exerts its biological effects in cells through estrogen receptor (ER), a
member of the nuclear receptor family (Evans, 1988; Klinge, 2001). ER is an intracellular
transcription factor and is expressed as two isoforms, ERα and ERβ. Estrogen binding to
ER promotes ER dimerization and nuclear localization. In the nucleus, ER binds to DNA
sequences, termed estrogen responsive elements (EREs), in the regulatory regions of
target genes. Klotz et al. (2000) showed that ERα was required for activation of uterine
IGF-I gene expression by clinical and environmental estrogens; however, no consensus
ERE has been identified in either human or murine IGF-I gene (Bourdeau et al., 2004).
In addition to binding to specific DNA sequences, ER can regulate gene
transcription through interaction with chromatin remodeling proteins, or other
transcription factors (Gottlicher et al., 1998). Umayahara et al. (1994) showed that
estrogen activated the chicken IGF-I gene expression through enhancing c-Fos and c-Jun
binding to the activating protein-1 (AP-1) motif. In the uterus, estrogen stimulated
expression of androgen receptor (AR) (Pelletier et al., 2004). Flutamide, an anti-androgen
has been reported to block estrogen stimulation of IGF-I gene expression in the uterus
(Weihua et al., 2002). Thus, stimulation of IGF-I transcription in the uterus may be
indirectly mediated by AR, although the underlying mechanism is unknown.
GH-induced increases in hepatic IGF-I mRNA abundance and serum IGF-I
concentration were significantly attenuated by administration of estrogen in rats (Murphy
and Friesen, 1988). Serum IGF-I level also fell in estrogen-treated women (Duursma et
33
al., 1984; Dawson-Hughes et al., 1986; Cano et al., 1999). Thus, in addition to the direct
effect on IGF-I gene expression in the uterus, estrogen may also modulate GH regulation
of IGF-I gene expression in liver. However, how exactly estrogen affects GH induction
of IGF-I gene expression in liver is also unknown.
By insulin
Hepatic IGF-I mRNA abundance and serum IGF-I level are much lower in
diabetic rats than normal rats, and they are restored toward normal after treatment with
insulin, suggesting insulin is an important regulator of IGF-I gene expression (Pao et al.,
1992; Frystyk et al., 2003). It is further shown that insulin regulates IGF-I gene
expression at the transcriptional level (Pao et al., 1992; Pao et al., 1993), and that it
stimulates the expression of both classes of IGF-I mRNA (Adamo et al., 1991b).
Using both transient transfection and primer extension assays, Pao et al. (1995)
identified a region downstream of the transcription start site in exon 1 important for
insulin regulation of IGF-I transcription. This region was found to contain six DNA-
protein binding sites, and two of them (region III and V) were necessary for the diabetes-
associated reduction in IGF-I gene transcription. Region III contains a GCGC core
sequence, which may recognize C/EBP proteins (Zhu et al., 1999). Region V sequences
recognize several nuclear factors, including Sp1 and insulin-responsive binding protein
(IRBP), which interacts with the TTAT core sequence (Kaytor et al., 2001b). The binding
of IRBP to the TTAT element was increased by insulin, and this binding facilitated the
interactions between Sp1 and its binding site within region V (Kaytor et al., 2001a). It
was also shown that the PI3’K signaling pathway is involved in insulin-activated IRBP
34
binding to the TTAT element (Kaytor et al., 2001b); however, the exact component of
IRBP has not been identified.
Nutritional regulation
Effects of energy and protein intake
In human and animal models, serum IGF-I concentrations are markedly reduced
during fasting (Clemmons et al., 1981; Emler and Schalch, 1987; Pierce et al., 2005), or
during protein and/or calorie restriction (Grant et al., 1973; Hintz et al., 1978; Lemozy et
al., 1994; Radcliff et al., 2004) but increased promptly with refeeding, suggesting the
importance of energy and protein intake in maintenance of IGF-I level. Direct evidence
showing that both protein and energy can regulate circulating IGF-I concentration first
came from refeeding experiments on human volunteers (Isley et al., 1983; 1984). These
studies found the presence of a threshold energy requirement, below which optimal
protein intake would not raise IGF-I level, and that the more energy or protein added to
the diet, the larger the increase in IGF-I concentration. These findings were confirmed by
subsequent studies (Weller et al., 1994; Smith et al., 2002). In addition to the amount of
protein, the composition of the protein also affects blood IGF-I level, since refeeding an
essential amino acid-rich diet caused a greater increase in serum IGF-I concentration than
refeeding a diet rich in nonessential amino acids (Clemmons et al., 1985). Similarly, the
source of energy is also important, with carbohydrate content of the diet being the major
determinant (Snyder et al., 1989).
35
Effects of specific nutrients
The effect of glucose on IGF-I gene expression has been studied in cell culture
systems. Data from tumor cells (Straus and Burke, 1995; Wang et al., 2000b) showed that
the levels of both classes of IGF-I mRNA and protein were increased by a high
concentration of glucose, and there was no quantitative difference in the responses of the
two classes of transcripts. However, the result from primary rat hepatocytes was
somewhat contradictory. (Goya et al., 1999) reported that glucose can only stimulate
IGF-I transcription in the presence of low doses of insulin, and the effect was only
observed in fetal hepatocytes but not adult hepatocytes. The basis for the different effects
of glucose on IGF-I gene expression in different cell types is still unclear; however, it is
very likely related to the characteristic of different cells and the culture medium.
Amino acid availability has been reported to regulate IGF-I gene expression in
vitro as well as in vivo. In rats, serum IGF-I concentration was significantly reduced
when a single essential amino acid or all amino acids were excluded from the diet
(Takenaka et al., 2000). In cultured primary rat hepatocytes, elevated amino acid
concentration in the medium caused a dose-dependent increase in IGF-I mRNA level;
amino acid deprivation in the medium decreased the abundance of IGF-I mRNA (Phillips
et al., 1991; Thissen et al., 1994b). It has been shown that specific amino acids, such as
arginine (Kirk et al., 1993), glutamine (Ziegler et al., 1996), and tryptophan (Phillips and
Unterman, 1984) can up-regulate IGF-I production.
36
In addition to glucose and amino acids, potassium (Hsu et al., 1997), zinc (Ninh et
al., 1995) and vitamin A (Fu et al., 2001b) have been reported to up-regulate IGF-I gene
expression too.
Molecular mechanisms underlying nutritional regulation of IGF-I gene expression
During fasting, IGF-I mRNA abundance is decreased in tissues, especially in liver,
while circulating IGF-I is decreased. Because the majority of blood IGF-I is from liver,
fasting-induced reduction of blood IGF-I is probably at least partly caused by the
declined hepatic IGF-I mRNA abundance (Adamo et al., 1991b; Lemozy et al., 1994).
However, the exact level(s) at which IGF-I mRNA is reduced is not completely
elucidated, and the studies on this have contradictory findings. Some studies indicate that
transcription rate of the IGF-I gene is decreased in fasted or protein-deprived animals
compared to controls (Straus and Takemoto, 1990a; Hayden et al., 1994); whereas, other
studies suggest undernutrition down-regulates hepatic IGF-I gene expression mainly at
the post-transcriptional level by delaying IGF-I pre-mRNA splicing, thereby attenuating
mature IGF-I mRNA generation, or by decreasing the stability of cytoplasmic IGF-I
mRNA (Hayden and Straus, 1995; Zhang et al., 1998).
Regulation of IGF-I synthesis by nutrition may also be exerted at the translational
and post-translational levels because some discrepancies have been observed between the
magnitude of the changes in serum IGF-I concentration and that of IGF-I mRNA
abundance (Davenport et al., 1990; Thissen et al., 1991a). Although dietary protein
restriction does not affect binding of IGF-I mRNA to polysomes (Ketelslegers et al.,
1995), one of the mechanisms involved in the initiation of translation, the number and
37
average size of the IGF-I mRNA polysomes in protein-restricted animals are decreased
(Thissen and Underwood, 1992). In blood, IGF-I protein is stabilized in a 130 to 150 kDa
ternary complex with IGFBP3 and ALS. Decreased IGFBP3 and ALS levels are also
observed in undernourished animals, providing a possible reason for enhanced clearance
rate of serum IGF-I (Thissen et al., 1991b; Frystyk et al., 1999). In contrast to changes in
IGFBP3 concentration, serum IGFBP1 and IGFBP2 levels are generally increased during
malnutrition (Straus and Takemoto, 1990a; Frystyk et al., 1999), and IGF-I is
preferentially bound to these two binding proteins in protein-restricted animals
(Takahashi et al., 1990; Thissen et al., 1992). As mentioned before, binding of IGF-I with
IGFBP1 and IGFBP2 forms a small complex, which is more easily to be transported out
of the vascular space compared to the large complex with IGFBP3 and ALS. Therefore,
protein restriction may stimulate IGF-I movement to the extravascular space, thereby
enhancing its clearance and degradation.
Since GH is the most important factor regulating IGF-I gene expression, changes
in IGF-I mRNA level under different nutritional status may be due to the changes in GH
signaling pathway. In all species except rodent, basal GH secretion is increased during
fasting (Ho et al., 1988; Buonomo and Baile, 1991; Pierce et al., 2005). Furthermore,
administration of GH fails to increase circulating IGF-I concentration in these animals
including rodent (Miller et al., 1981; Maes et al., 1988), suggesting that nutritional
deprivation induces a GH resistance. This status of GH resistance has been widely
believed to be due to a reduction in hepatic GH binding capacity by decreased GHR
abundance (Postel-Vinay et al., 1982; Straus and Takemoto, 1990b; Fukada et al., 2004).
38
However, a recent study suggested that this GH resistance was due to impaired
postreceptor signaling in liver through reduced phosphorylation of GHR, JAK2, and
STAT5 proteins, and that the inhibition of JAK2 activity was perhaps caused by
increased abundance of suppressors of cytokine signaling 3 (SOCS3) (Beauloye et al.,
2002).
In addition to GH, the levels of insulin, glucocorticoid, thyroid hormone and some
other hormones are also altered by different nutritional status (Frystyk et al., 1999;
Dauncey et al., 2001). These hormones have been shown to modulate IGF-I gene
expression in vivo, so nutrition-induced changes in IGF-I production may be indirectly
caused by these hormones (Luo and Murphy, 1989; Wolf et al., 1989; McCarthy et al.,
1990; Pao et al., 1992).
As reviewed earlier, both glucose and amino acids can affect IGF-I mRNA
abundance. These effects are likely caused by more than one mechanism. Glucose
appeared to stimulate IGF-I gene transcription perhaps through a product of glycolysis
(Straus and Burke, 1995; Goya et al., 1999); increased glucose also seemed to increase
IGF-I mRNA stability (Goya et al., 1999; Wang et al., 2000b). Similarly, amino acids
have been shown to influence IGF-I gene transcription rate and mRNA stability,
especially that of the 7 kb IGF-I mRNA (Pao et al., 1993; Zhang et al., 1998). Whether
these effects of glucose or amino acids on IGF-I gene expression are mediated by
changes in GHR and GH signaling pathway have not been studied.
39
Summary
Nutrition is an important regulator of IGF-I synthesis. Both energy deficiency and
protein depletion, as well as specific micronutrient deficiency can inhibit the production
of IGF-I. This nutritional regulation of IGF-I expression appears to be tissue specific,
with IGF-I mRNA level being more affected in liver, muscle and kidney than in other
tissues, such as stomach and heart (Lowe et al., 1989; Leaman et al., 1990). The response
of IGF-I to nutritional changes in an animal varies with its age and weight. More
significant alterations in IGF-I expression occur in younger animals than older ones
(Fliesen et al., 1989; Calikoglu et al., 2001), and in normal weight humans than in obese
people (Gama et al., 1990; Tagliaferri et al., 1998).
Developmental regulation
In view of the roles of IGF-I in embryonic development and postnatal growth, it is
not surprising that IGF-I is expressed throughout the entire life. Serum IGF-I
concentration is relatively low in the fetal stage, but increases dramatically shortly after
birth. During postnatal growth, IGF-I concentration continues to rise until puberty, and
the rate of increase undergoes a sharp upsurge at puberty. After that, a slow decrease with
age is observed, which results in a very low IGF-I level in the aged (Daughaday and
Rotwein, 1989; Kikuchi et al., 1992; Argente et al., 1993).
IGF-I mRNA is detectable at the early stage of embryogenesis, even several hours
after fertilization in Sparus aurata (Fukenstein et al., 1996), or during the first embryo
cleavage in mouse (Doherty et al., 1994). After organogenesis, IGF-I gene expression is
regulated in a tissue-specific manner. Hepatic IGF-I mRNA level is very low before birth,
40
but increases rapidly during the neonatal period. Hepatic IGF-I mRNA reaches the
highest level at the peak of postnatal growth, followed by a slow decline after early
adulthood (Burnside and Cogburn, 1992; Shoba et al., 1999; Richards et al., 2005). This
pattern is about the same as the changes of serum IGF-I concentration, which strongly
suggests that liver is the major site of IGF-I synthesis and principal source of circulating
IGF-I after birth. A similar pattern is also observed for IGF-I mRNA in heart and kidney,
with relatively smaller neonatal increases in these two tissues (Lindenbergh-Kortleve et
al., 1997; Shoba et al., 1999). In contrast, in some other tissues, such as skeletal muscle,
stomach, intestine and testis, the maximum expression of IGF-I mRNA occurs around the
early stage of organ development, and then declines to maintain a stable level during
adulthood (Adamo et al., 1989; Shoba et al., 1999; Fu et al., 2001a; Freier et al., 2005).
Brain has its unique expression pattern of IGF-I mRNA during development. IGF-I
abundance is relative high in brain during embryonic development, and increases
gradually during the neonatal period, but decreases significantly with maturation,
reaching the lowest point at peripuberty (Adamo et al., 1989; Shoba et al., 1999; Richards
et al., 2005). Lung IGF-I mRNA level is highest during fetal growth and exhibit only
minor changes during the postnatal period (Davenport et al., 1988; Adamo et al., 1989;
Shoba et al., 1999). Even within a tissue, there are regional differences in the
developmental patterns of IGF-I expression (Bach et al., 1991; Lindenbergh-Kortleve et
al., 1997). For example, the change pattern in cerebral cortex and hypothalamus is similar
with the one seen for the whole brain; however, there are no developmental changes in
IGF-I mRNA level in brain stem and cerebellum, and the IGF-I mRNA expression in

41
olfactory bulb is decreased dramatically at the time of birth (Bach et al., 1991). Since
cerebral cortex comprises a large part of the brain mass, it is not surprising that the
change in pattern of IGF-I mRNA expression in this part of the brain is consistent with
the one in whole brain.
Developmental changes of IGF-I mRNA expression not only differ between
tissues, but also between IGF-I mRNA variants. In general, neonatal increase of the class
2 transcript is delayed compared to the class 1 transcript (Hoyt et al., 1988; Shemer et al.,
1992; Shoba et al., 1999). Selection of transcription start sites within exon 1 in kidney is
also under developmental regulation. In kidney, transcription initiation occurs exclusively
at position -345 (where +1 is the 3’ end of exon 1) during the late fetal and neonatal stage,
but transcription initiation at position -245 appears and increases rapidly after weaning
(Shemer et al., 1992). A recent study also showed that in rat liver, the abundance of class
1 Eb mRNA decreased from 2- to 4-week of postnatal growth, whereas the levels of other
types of IGF-I transcripts increased during this period (Lin and Oberbauer, 1998).
To define the molecular mechanisms underlying the developmental regulation of
IGF-I gene expression, Shoba et al. (1999) investigated the expression of GHR and some
other components of the GH signaling pathway together with IGF-I during postnatal
development. Coordinate expression of IGF-I and GHR mRNA is observed in different
tissues, but changes in the protein level of different signaling molecules are not in parallel
with those of IGF-I. Although further study is needed to determine whether changes in
the level of activated proteins parallel changes in IGF-I gene expression, this study has
indicated that GHR expression is important for tissue-specific expression of the IGF-I

42
gene during postnatal development. Besides this, the DNase I hypersensitive site (HS7)
that is regulated by GH is weakly present in the second postnatal week, but fully
hypersensitive in adulthood (Bichell et al., 1992; Kikuchi et al., 1992). This is
concomitant with the induction of the class 2 transcript and approximate onset of hepatic
GH sensitivity. Taken together, these observations suggest that postnatal regulation of
IGF-I gene expression, especially the delayed increase in the class 2 mRNA and the
continued increase in the class 1 transcript two weeks after birth is GH dependent.
However, the situation is quite different during embryonic development and the neonatal
period. In the chicken embryo, the accumulation of IGF-I mRNA and protein precedes
the ontological activation of GH (Kikuchi et al., 1991). In rat liver, two DNase I
hypersensitive sites (HS2 and HS3) were shown to occur on day 1 after birth, and they
became fully hypersensitive by day 7; however, they were not activated by GH (Kikuchi
et al., 1992). These observations suggest GH-independent activation of IGF-I gene
expression in early embryonic development and the neonatal period.
Other factors that regulate IGF-I gene expression
Besides the factors mentioned above, there are many other factors that can
regulate IGF-I gene expression. Serum IGF-I concentration and IGF-I mRNA level in
several tissues, including liver, muscle and kidney, have been shown to decrease in
various types of inflammatory conditions, such as sepsis (Lang et al., 1996), thermal
injury (Ghahary et al., 1994), and trauma (Wojnar et al., 1995). Some anti-proliferative
agents including retinoic acid (Lowe et al., 1992) and double-stranded RNA (Chacko and
Adamo, 2000) all markedly inhibit IGF-I production by regulation of transcription and/or
43
mRNA stability. In cultured cells, cell density may influence IGF-I gene expression in a
cell type-specific manner. For example, when C6 glioma cells grew to postconfluence,
IGF-I mRNA abundance was increased more than 200-fold partially due to
transcriptional activation; whereas cell density had no effect on IGF-I gene expression in
OVCAR-3 cells (Wang and Adamo, 2000).
Summary
Since its discovery in 1950’s, much has been learnt about IGF-I, including its
functions, mechanism of action, gene expression and regulation. However, many
questions still remain to be answered, such as the molecular mechanisms underlying GH
and nutritional regulation of IGF-I gene expression, the relative importance of endocrine
versus paracrine/autocrine actions. Given the roles of IGF-I in animal and human
physiology and pathology, the addressing of these questions may help develop new
approaches to improving animal productivity and making rational therapeutic decisions.
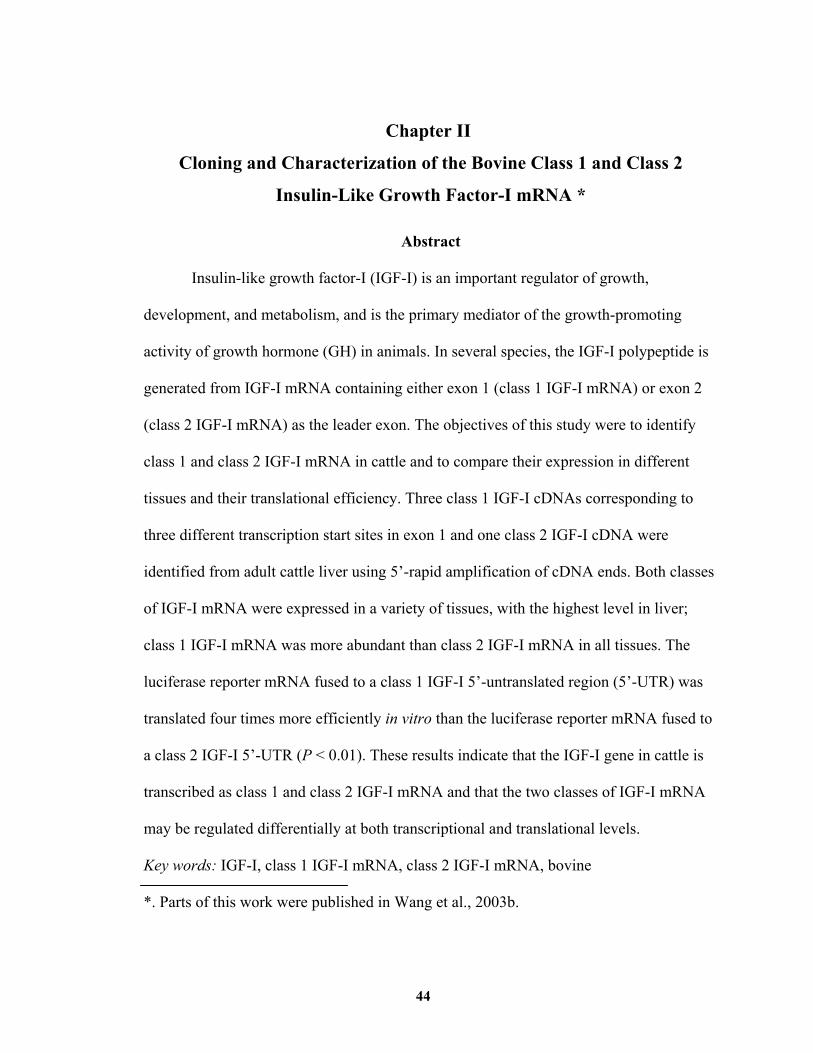
44
Chapter II Cloning and Characterization of the Bovine Class 1 and Class 2
Insulin-Like Growth Factor-I mRNA *
Abstract
Insulin-like growth factor-I (IGF-I) is an important regulator of growth,
development, and metabolism, and is the primary mediator of the growth-promoting
activity of growth hormone (GH) in animals. In several species, the IGF-I polypeptide is
generated from IGF-I mRNA containing either exon 1 (class 1 IGF-I mRNA) or exon 2
(class 2 IGF-I mRNA) as the leader exon. The objectives of this study were to identify
class 1 and class 2 IGF-I mRNA in cattle and to compare their expression in different
tissues and their translational efficiency. Three class 1 IGF-I cDNAs corresponding to
three different transcription start sites in exon 1 and one class 2 IGF-I cDNA were
identified from adult cattle liver using 5’-rapid amplification of cDNA ends. Both classes
of IGF-I mRNA were expressed in a variety of tissues, with the highest level in liver;
class 1 IGF-I mRNA was more abundant than class 2 IGF-I mRNA in all tissues. The
luciferase reporter mRNA fused to a class 1 IGF-I 5’-untranslated region (5’-UTR) was
translated four times more efficiently in vitro than the luciferase reporter mRNA fused to
a class 2 IGF-I 5’-UTR (P < 0.01). These results indicate that the IGF-I gene in cattle is
transcribed as class 1 and class 2 IGF-I mRNA and that the two classes of IGF-I mRNA
may be regulated differentially at both transcriptional and translational levels.
Key words: IGF-I, class 1 IGF-I mRNA, class 2 IGF-I mRNA, bovine
*. Parts of this work were published in Wang et al., 2003b.
45
Introduction
IGF-I is essential for animal growth, development, and metabolism (Daughaday
and Rotwein, 1989). The primary source of IGF-I is liver, from which IGF-I is released
into the blood and acts in an endocrine mode on other tissues. IGF-I is also synthesized in
many extra-hepatic tissues, where it functions in an autocrine or paracrine manner
(D'Ercole et al., 1984).
The mature IGF-I is a 70 aa polypeptide; it is expressed from a gene consisting of
six exons (exons 1 to 6) and spanning more than 80 kb of genomic DNA in humans and
rats (Rotwein et al., 1986; Shimatsu and Rotwein, 1987a; Dickson et al., 1991; Kajimoto
and Rotwein, 1991). In several species, including humans (Jansen et al., 1991), rats
(Lowe et al., 1987), and sheep (Wong et al., 1989), transcription of IGF-I gene is initiated
from both exon 1 and exon 2, generating IGF-I mRNA containing either exon 1 (class 1
IGF-I mRNA) or exon 2 (class 2 IGF-I mRNA) as the leader exon (Holthuizen et al.,
1991). The two classes of IGF-I mRNA encode prepro-IGF-I proteins differing in the
signal peptide, but give rise to the same mature IGF-I polypeptide after the different
signal peptides are cleaved (Holthuizen et al., 1991).
It has been reported that in rats the two classes of IGF-I mRNA differ in tissue
specificity, abundance, and regulation by nutritional and hormonal factors (Lowe et al.,
1987; 1989; Hall et al., 1992). Class 1 IGF-I mRNA is expressed at a relatively high level
in all tissues, whereas class 2 IGF-I mRNA is expressed in a few tissues at a low level
except liver (Lowe et al., 1987). The rat class 1 and class 2 IGF-I mRNA also differ in
translational efficiency (Foyt et al., 1991; 1992; Yang et al., 1995). Differential
46
expression and translation of class 1 and class 2 IGF-I mRNA have also been
demonstrated in sheep (Wong et al., 1989; Pell et al., 1993; O'Sullivan et al., 2002) and
humans (Jansen et al., 1991).
As in other species, IGF-I also plays an important role in development, growth,
and metabolism in cattle (Cohick, 1998; Renaville et al., 2002; Oksbjerg et al., 2004). As
part of the long-term goal to understand the molecular mechanisms by which IGF-I gene
expression is regulated, the objectives of this study were to identify the bovine class 1
and class 2 IGF-I mRNA and to compare their expression in different tissues as well as
their translational efficiency.
Materials and Methods
Tissue collection
All tissues used in this study, except testis were collected from an adult cow
(nonlactating and nonpregnant) at slaughter. Testis was collected from a bull at slaughter.
Tissues were immediately frozen in liquid nitrogen and stored at -80 °C until RNA
extraction.
RNA extraction
Total RNA from bovine tissues was extracted using TRI Reagent (Molecular
Research Center, Inc., Cincinnati, OH). Poly(A) RNA was extracted from total RNA
using the OligotexTM mRNA kit (Qiagen, Chatsworth, CA), according to the
manufacturer’s instructions. RNA concentration was calculated based on the absorbance
at 260 nm. RNA quality was confirmed by electrophoresis on agarose-formaldehyde gels.
47
5'-Rapid application of cDNA ends (5'-RACE)
The 5’-RACE system (Invitrogen, Carlsbad, CA) was used to amplify the 5’-end
region of bovine IGF-I cDNA. The primers are summarized in Table 2.1 and Figure 2.1A.
One microgram of liver poly(A) RNA was reverse-transcribed at 42 °C for 1 h in 1 × first
strand buffer with 4 pmol of a bovine IGF-I exon 4-specific primer (bIGF-I-E4R1), 10
nmol of deoxynucleotide triphosphates (dNTPs), 250 nmol of dithiothreitol (DTT) and 40
U of SuperScriptTM II reverse transcriptase. All cDNA products were treated with 2 U of
RNase H at 37 °C for 30 min, and purified with High Pure PCR Product Purification Kit
(Roche Applied Science, Indianapolis, IN). A homopolymeric cytosine tail was added to
the 3’-terminal of the cDNA using 5 nmol of dCTP and 30 U of terminal
deoxyribonucleotide transferase at 37 °C for 15 min. The dCTP-tailed cDNA was used as
template in a PCR to amplify the IGF-I cDNA region upstream of exon 4 with the reverse
primer being bIGF-I-E4R2 and the forward primer being the abridged anchor primer
(AAP). The reaction mixture consisted of 5 μL of template, 5 μmol of dNTPs, 1 U of Taq
DNA polymerase and 10 pmol of each primer. This PCR was performed under 35 cycles
of 94 ºC for 30 s, 55 ºC for 30 s, and 72 ºC for 1 min. The product of this PCR was
diluted at 1:1000, and 1 μL of the diluted product was used as template in a second PCR
to amplify the IGF-I cDNA region upstream of exon 3 with the reverse primer being
bIGF-I-E3R1 and the forward primer being the abridged universal amplification primer
(AUAP). This second PCR was carried out under 35 cycles of 94 ºC for 30 s, 60 ºC for 30
s, and 72 ºC for 1 min.
48
Cloning and subcloning
The products of the 5’-RACE were separated on an agarose gel; the major DNA
bands were isolated from the gel and ligated into pGEM-T Easy vector (Promega,
Madison, WI), according to the manufacturer’s instructions. The ligation was
transformed into Escherichia coli strain DH10B cells by electroporation, and selected on
LB/ampicillin/5-bromo-4-chloro-3-indolyl-β-D-galactopyranoside (X-Gal)/isopropyl-β-
D-thiogalactopyranoside (IPTG) plates. The plasmid DNA was isolated using the
QIAprep Spin Miniprep Kit (Qiagen), and digested with EcoR I to determine if it
contains an insert.
The 5’-UTR of class 1 IGF-I mRNA was amplified by PCR from the plasmid
bIGF-C1A-pGEM containing the longest class 1 IGF-I cDNA with primers UTR-F and
bIGF-E1R1 (Table 2.1). The 5’-UTR of class 2 IGF-I mRNA was amplified from the
plasmid bIGF-C2-pGEM containing class 2 IGF-I cDNA with primers UTR-F and bIGF-
E2R1 (Table 2.1). Both PCR, in a total volume of 25 μL, contained 0.1 ng of template
and 10 pmol forward and reverse primers, and were performed under 35 cycles of 93 ºC
for 1 min, 58 ºC for 1 min, and 72 ºC for 1 min. The PCR products were digested with
restriction enzymes Hind III and Nco I, and inserted immediately upstream of the
translation start codon of the firefly luciferase reporter gene in pGL3-Control vector
(Promega), creating constructs bIGF-C1A-pGL3C and bIGF-C2-pGL3C, respectively.
The constructs, pGL3C-T7 and pRLSV40-T7, which contained a T7 promoter inserted
immediately upstream of the firefly luciferase reporter gene in pGL3-Control and the
49
Renilla luciferase reporter gene in pRLSV40 vector respectively, were prepared in a
previous study (Jiang and Lucy, 2001).
The orientations and sequences of the inserts in all constructs were verified by
DNA sequencing.
Sequencing and sequence analysis
The sequencing reaction was set up using Big Dye Terminator Ready Reaction
Kit (Applied Biosystems, Foster City, CA) with 400 ng of the plasmid, 3.6 pmol of T7
promoter primer or a luciferase gene specific reverse primer designated as pGL2B-260R,
and was run for 50 cycles of 96°C for 10 s, 50 ºC for 10 s, and 60 ºC for 4 min. The
cleanup and electrophoresis of these sequencing reactions were performed by Virginia
Bioinformatics Institute (Blacksburg, VA). Sequence analysis was carried out using the
Blast program (http://www.ncbi.nlm.nih.gov).
Ribonuclease protection assay (RPA)
The RPA was used to determine the relative abundance of class 1 and class 2
IGF-I mRNA in bovine tissues. The plasmid bIGF-C1A-pGEM containing a 433 bp class
1 bovine IGF-I 5’-end cDNA (Figure 2.1C) and the plasmid bIGF-C2-pGEM containing
a 203 bp class 2 bovine IGF-I 5’-end cDNA (Figure 2.1C) were linearized with
restriction enzymes Nco I and Spe I, respectively. Antisense RNA probes were
synthesized from the linearized plasmids by in vitro transcription. One hundred and fifty
nanograms of linearized plasmids were mixed with 10 nmol of ATP, UTP and GTP
(Promega), 100 pmol of CTP (Promega), 50 μCi of 32P-CTP (3,000 Ci/mmol, 10 mCi/mL)
(PerkinElmer Life and Analytical Sciences, Inc., Boston, MA), 250 nmol of DTT, 1 μL
50
of RNase inhibitor (Promega) and 1μl of T7 or SP6 RNA polymerase (Promega) in 1 ×
transcription buffer (Promega). The mixture was incubated at 37 °C for 1 h, and then
treated with 2 μL of DNase I (Promega) at 37 °C for 20 min. The 32P-labeled probes were
purified with phenol-chloroform extraction followed by filtration (1,100 g at 4 °C for 4
min) through Quick Spin Sephadex G-50 columns (Roche Applied Science). The activity
of the probes was estimated by liquid scintillation counting, and the quality of the probes
was verified by electrophoresis on 6% polyacrylamide gels containing 7 M urea.
Similarly, the bovine glyceraldehyde-3-phosphate dehydrogenase (GAPDH) antisense
probe was generated from a bovine GAPDH cDNA plasmid (Kobayashi et al., 1999). The
relationships between the riboprobes synthesized from IGF-I cDNAs and their
corresponding mRNA transcripts are illustrated in Figure 2.2.
The RPA was performed using the RPA II kit (Ambion, Austin, TX). Briefly, 50
μg of total RNA were mixed with 5 × 10⁵ dpm of class 1 or class 2 IGF-I antisense
riboprobe, and 2 × 10⁴ dpm of GAPDH probe in a total volume of 20 μL hybridization
buffer. The mixture was incubated at 42 ºC for 16 h and then digested with 200 μL of
1:100 diluted ribonucleases A and T1 at 37 °C for 45 min. The ribonuclease-protected
RNA fragments were precipitated and resolved on 6% polyacrylamide gels containing 7
M urea. After gel electrophoresis, gels were dried and exposed to phosphor screens.
Exposed phosphor screens were scanned on a Molecular Imager FX System (Bio-Rad
Laboratories, Hercules, CA). The densities of protected bands were quantified using
Quantity One software (BioRad), and were used to represent the abundance of the
corresponding mRNA.
51
In vitro transcription and in vitro translation
The plasmids bIGF-C1A-pGL3C and bIGF-C2-pGL3C were linearized with
restriction enzyme BamH I; the linearized plasmids were used as templates in in vitro
transcription reactions to synthesize firefly luciferase RNA with the 5’ end fused with
either a bovine class 1 IGF-I 5’-UTR or a bovine class 2 IGF-I 5’-UTR. The firefly and
Renilla luciferase RNA that were not linked with IGF-I 5’-UTR were synthesized from
pGL3C-T7 and pRLSV40-T7 plasmids, respectively. The in vitro transcription reactions
were performed using the RiboMAX Large Scale RNA Production System (Promega).
One and half micrograms of linearized plasmids were incubated with 20 nmol of ATP,
CTP, GTP and UTP, 500 nmol of DTT, 1 μL of RNase inhibitor and 2 μL of T7 RNA
polymerase, and the mixture was incuabated at 37 °C for 2 h, followed by treating with 2
μl of DNase I at 37 °C for 15 min. The transcribed RNA were purified with phenol-
chloroform extraction and quantified by measuring their absorbance at 260 nm. The
concentration and integrity of the synthesized RNA were verified by gel electrophoresis.
In vitro translation was carried out using the Rabbit Reticulocyte Lysate System
(Promega) essentially as described previously (Jiang and Lucy, 2001). Briefly, 0.15 pmol
of each IGF-I 5’-UTR-luciferase RNA and 1.5 fmol of Renilla luciferase RNA were
mixed up with 4 μL of rabbit reticulocyte lysate, 6 U of RNase inhibitor, and 20 μM
amino acid mixture, and adjusted to a total volume of 8 μL with water. The mixture was
incubated at 30°C for 1 h. The activities of translated firefly luciferase and Renilla
luciferase proteins were measured with the Dual Luciferase Assay kit (Promega) on a
TD-20e luminometer (Tuner Designs, Sunnyvale, CA), according to the manufacturer’s
52
instructions. Each translation reaction was repeated four times in duplicate. Tube-to-tube
variation in translational efficiency was controlled by normalizing the luciferase activity
resulted from the IGF-I 5’-UTR-luciferase RNA to that of the co-translated Renilla
luciferase RNA.
Statistical analysis
Effects of class 1 and class 2 IGF-I 5’-UTR on translational efficiency of
luciferase RNA were analyzed using the General Linear Model (GLM) procedure of SAS
(SAS Institute Inc., Cary, NC). The statistical model is Yij = μ + αi + εij. μ represents
mean; αi represents ith treatment effect; εij represents error of treatment i.
Results
Cloning and sequencing of the 5’ ends of bovine class 1 and class 2 IGF-I mRNA
To determine whether the IGF-I gene is expressed as class 1 and class 2 IGF-I
mRNA in cattle, a 5’-RACE was performed on adult cattle liver mRNA. The 5’-RACE
generated four major cDNA products (Figure 2.1B). As revealed by sequencing, three
cDNA bands (bands C1-A, C1-B, and C1-C in Figure 2.1B) contained 297, 249 and 188
bp of IGF-I exon 1, respectively, at the 5’ end and 136 bp of IGF-I exon 3 at the 3’ end;
these three cDNA products corresponded to three class 1 IGF-I mRNA variants
transcribed from three different transcription start sites within exon 1. The fourth cDNA
band (band C2 in Figure 2.1B) contained 67 bp of IGF-I exon 2 and the same 136 bp
exon 3 region; this cDNA band represented a class 2 IGF-I mRNA.
The cloned bovine IGF-I exon 1 and exon 2 each contained an ATG codon in-
frame with the open reading frame in exons 3 and 4 for the mature IGF-I protein
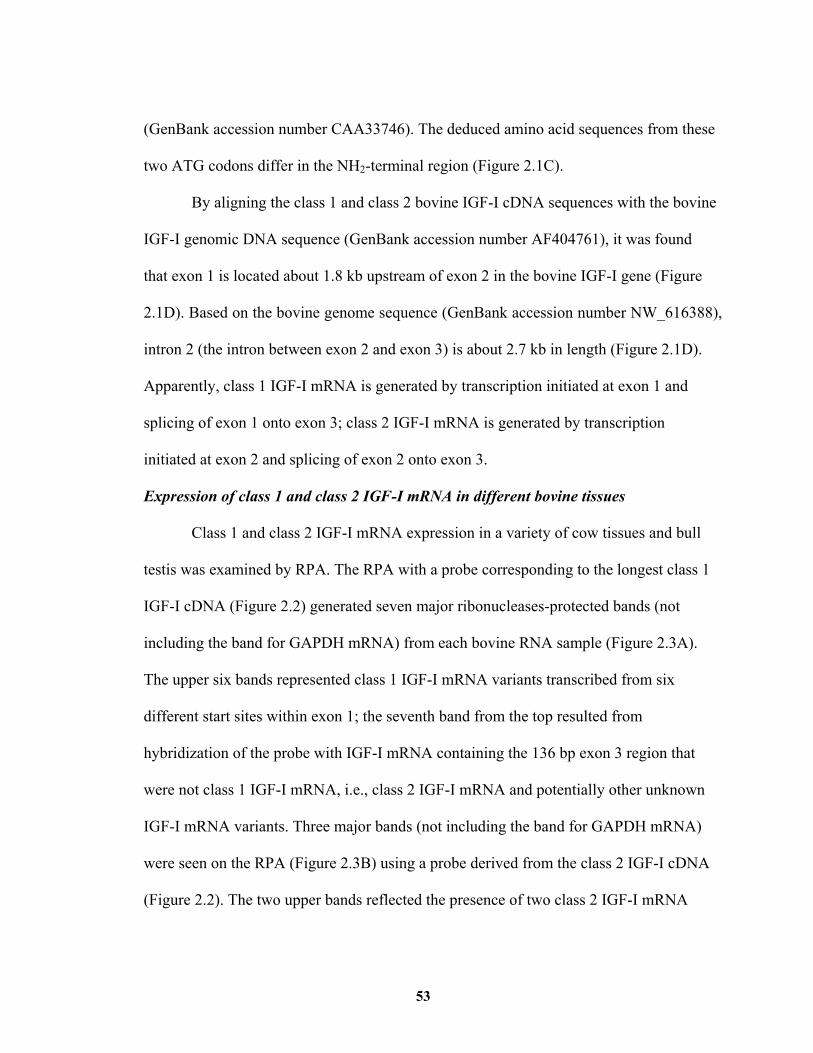
53
(GenBank accession number CAA33746). The deduced amino acid sequences from these
two ATG codons differ in the NH2-terminal region (Figure 2.1C).
By aligning the class 1 and class 2 bovine IGF-I cDNA sequences with the bovine
IGF-I genomic DNA sequence (GenBank accession number AF404761), it was found
that exon 1 is located about 1.8 kb upstream of exon 2 in the bovine IGF-I gene (Figure
2.1D). Based on the bovine genome sequence (GenBank accession number NW_616388),
intron 2 (the intron between exon 2 and exon 3) is about 2.7 kb in length (Figure 2.1D).
Apparently, class 1 IGF-I mRNA is generated by transcription initiated at exon 1 and
splicing of exon 1 onto exon 3; class 2 IGF-I mRNA is generated by transcription
initiated at exon 2 and splicing of exon 2 onto exon 3.
Expression of class 1 and class 2 IGF-I mRNA in different bovine tissues
Class 1 and class 2 IGF-I mRNA expression in a variety of cow tissues and bull
testis was examined by RPA. The RPA with a probe corresponding to the longest class 1
IGF-I cDNA (Figure 2.2) generated seven major ribonucleases-protected bands (not
including the band for GAPDH mRNA) from each bovine RNA sample (Figure 2.3A).
The upper six bands represented class 1 IGF-I mRNA variants transcribed from six
different start sites within exon 1; the seventh band from the top resulted from
hybridization of the probe with IGF-I mRNA containing the 136 bp exon 3 region that
were not class 1 IGF-I mRNA, i.e., class 2 IGF-I mRNA and potentially other unknown
IGF-I mRNA variants. Three major bands (not including the band for GAPDH mRNA)
were seen on the RPA (Figure 2.3B) using a probe derived from the class 2 IGF-I cDNA
(Figure 2.2). The two upper bands reflected the presence of two class 2 IGF-I mRNA
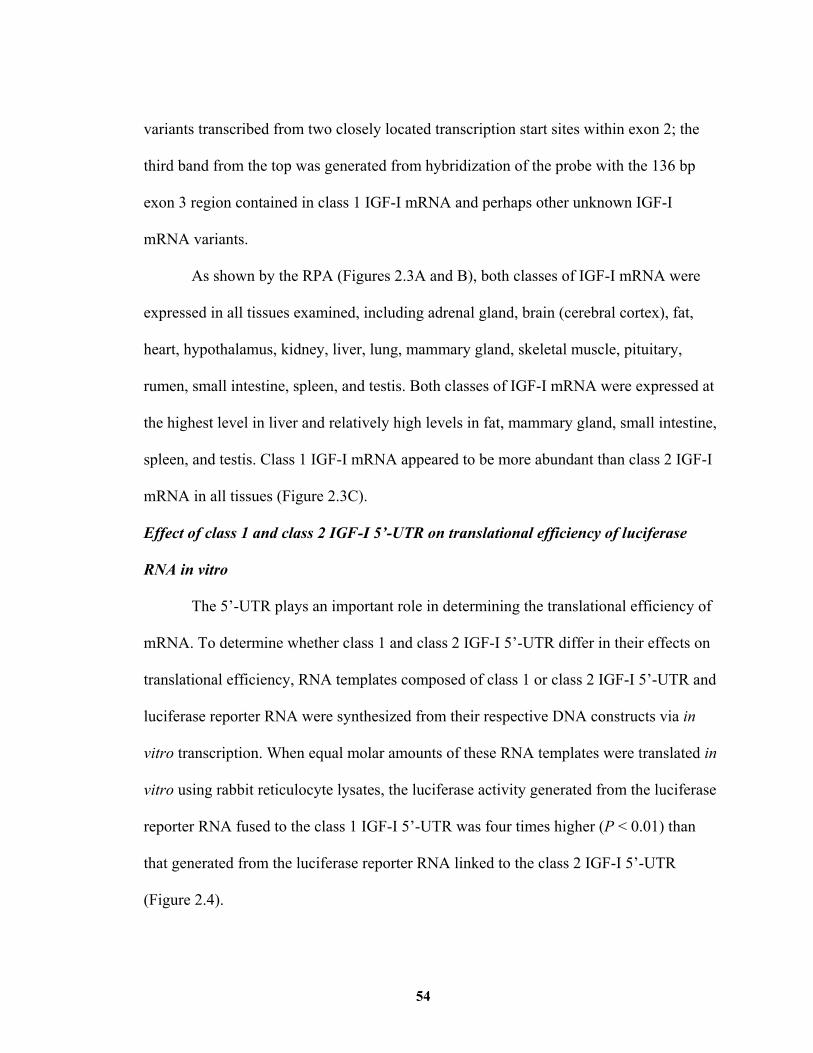
54
variants transcribed from two closely located transcription start sites within exon 2; the
third band from the top was generated from hybridization of the probe with the 136 bp
exon 3 region contained in class 1 IGF-I mRNA and perhaps other unknown IGF-I
mRNA variants.
As shown by the RPA (Figures 2.3A and B), both classes of IGF-I mRNA were
expressed in all tissues examined, including adrenal gland, brain (cerebral cortex), fat,
heart, hypothalamus, kidney, liver, lung, mammary gland, skeletal muscle, pituitary,
rumen, small intestine, spleen, and testis. Both classes of IGF-I mRNA were expressed at
the highest level in liver and relatively high levels in fat, mammary gland, small intestine,
spleen, and testis. Class 1 IGF-I mRNA appeared to be more abundant than class 2 IGF-I
mRNA in all tissues (Figure 2.3C).
Effect of class 1 and class 2 IGF-I 5’-UTR on translational efficiency of luciferase
RNA in vitro
The 5’-UTR plays an important role in determining the translational efficiency of
mRNA. To determine whether class 1 and class 2 IGF-I 5’-UTR differ in their effects on
translational efficiency, RNA templates composed of class 1 or class 2 IGF-I 5’-UTR and
luciferase reporter RNA were synthesized from their respective DNA constructs via in
vitro transcription. When equal molar amounts of these RNA templates were translated in
vitro using rabbit reticulocyte lysates, the luciferase activity generated from the luciferase
reporter RNA fused to the class 1 IGF-I 5’-UTR was four times higher (P < 0.01) than
that generated from the luciferase reporter RNA linked to the class 2 IGF-I 5’-UTR
(Figure 2.4).
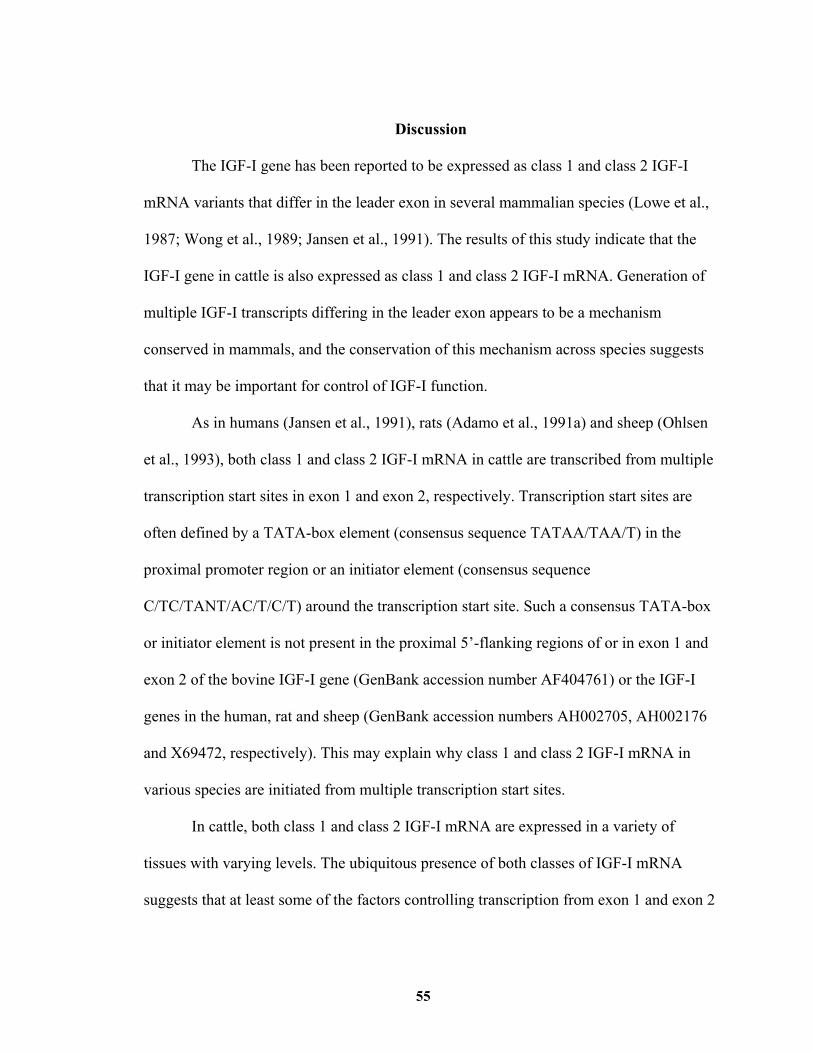
55
Discussion
The IGF-I gene has been reported to be expressed as class 1 and class 2 IGF-I
mRNA variants that differ in the leader exon in several mammalian species (Lowe et al.,
1987; Wong et al., 1989; Jansen et al., 1991). The results of this study indicate that the
IGF-I gene in cattle is also expressed as class 1 and class 2 IGF-I mRNA. Generation of
multiple IGF-I transcripts differing in the leader exon appears to be a mechanism
conserved in mammals, and the conservation of this mechanism across species suggests
that it may be important for control of IGF-I function.
As in humans (Jansen et al., 1991), rats (Adamo et al., 1991a) and sheep (Ohlsen
et al., 1993), both class 1 and class 2 IGF-I mRNA in cattle are transcribed from multiple
transcription start sites in exon 1 and exon 2, respectively. Transcription start sites are
often defined by a TATA-box element (consensus sequence TATAA/TAA/T) in the
proximal promoter region or an initiator element (consensus sequence
C/TC/TANT/AC/T/C/T) around the transcription start site. Such a consensus TATA-box
or initiator element is not present in the proximal 5’-flanking regions of or in exon 1 and
exon 2 of the bovine IGF-I gene (GenBank accession number AF404761) or the IGF-I
genes in the human, rat and sheep (GenBank accession numbers AH002705, AH002176
and X69472, respectively). This may explain why class 1 and class 2 IGF-I mRNA in
various species are initiated from multiple transcription start sites.
In cattle, both class 1 and class 2 IGF-I mRNA are expressed in a variety of
tissues with varying levels. The ubiquitous presence of both classes of IGF-I mRNA
suggests that at least some of the factors controlling transcription from exon 1 and exon 2
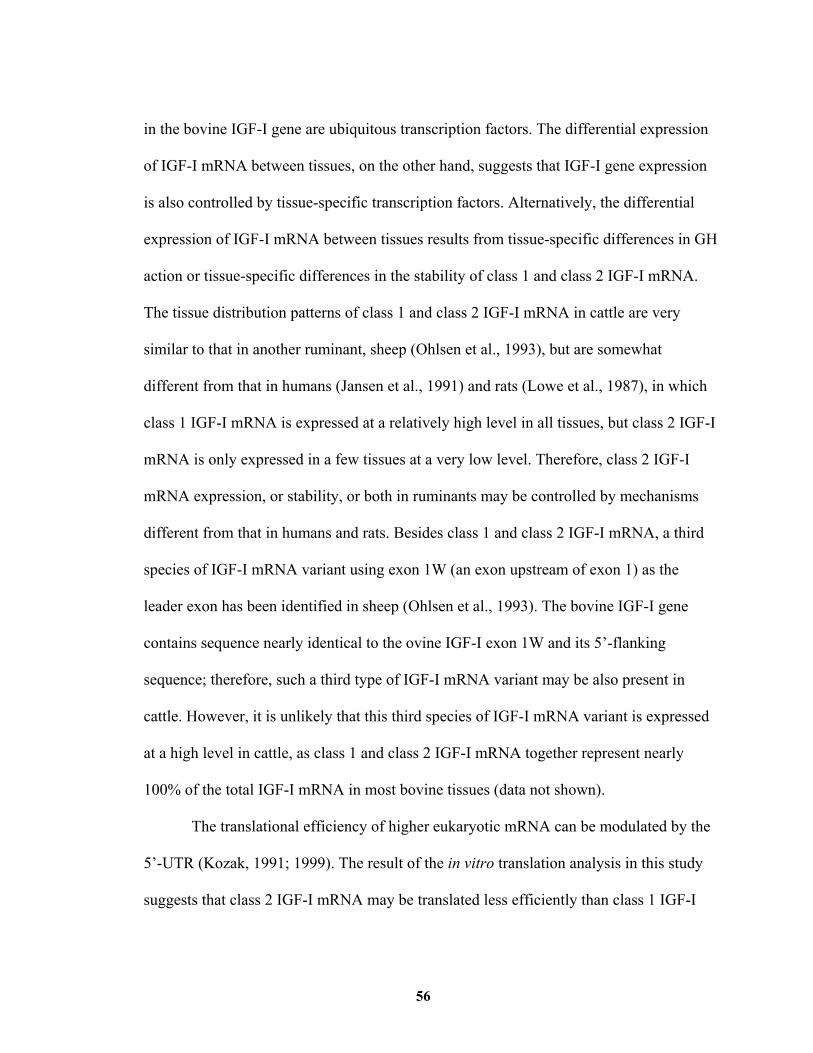
56
in the bovine IGF-I gene are ubiquitous transcription factors. The differential expression
of IGF-I mRNA between tissues, on the other hand, suggests that IGF-I gene expression
is also controlled by tissue-specific transcription factors. Alternatively, the differential
expression of IGF-I mRNA between tissues results from tissue-specific differences in GH
action or tissue-specific differences in the stability of class 1 and class 2 IGF-I mRNA.
The tissue distribution patterns of class 1 and class 2 IGF-I mRNA in cattle are very
similar to that in another ruminant, sheep (Ohlsen et al., 1993), but are somewhat
different from that in humans (Jansen et al., 1991) and rats (Lowe et al., 1987), in which
class 1 IGF-I mRNA is expressed at a relatively high level in all tissues, but class 2 IGF-I
mRNA is only expressed in a few tissues at a very low level. Therefore, class 2 IGF-I
mRNA expression, or stability, or both in ruminants may be controlled by mechanisms
different from that in humans and rats. Besides class 1 and class 2 IGF-I mRNA, a third
species of IGF-I mRNA variant using exon 1W (an exon upstream of exon 1) as the
leader exon has been identified in sheep (Ohlsen et al., 1993). The bovine IGF-I gene
contains sequence nearly identical to the ovine IGF-I exon 1W and its 5’-flanking
sequence; therefore, such a third type of IGF-I mRNA variant may be also present in
cattle. However, it is unlikely that this third species of IGF-I mRNA variant is expressed
at a high level in cattle, as class 1 and class 2 IGF-I mRNA together represent nearly
100% of the total IGF-I mRNA in most bovine tissues (data not shown).
The translational efficiency of higher eukaryotic mRNA can be modulated by the
5’-UTR (Kozak, 1991; 1999). The result of the in vitro translation analysis in this study
suggests that class 2 IGF-I mRNA may be translated less efficiently than class 1 IGF-I
57
mRNA in vivo due to different 5’-UTR. That class 2 IGF-I mRNA is translated less
efficiently than class 1 IGF-I mRNA is consistent with the observation that in rat liver
class 2 IGF-I mRNA is much less enriched on polysomes than class 1 IGF-I mRNA even
when class 2 IGF-I mRNA expression is significantly increased (Foyt et al., 1991; Foyt et
al., 1992). The 5’-UTR causing inefficient translation often contains structural features
such as upstream AUG codons, secondary structures with high −ΔGo and high GC
content (Kozak, 1991; 1999). However, none of these structures are contained in class 2
IGF-I 5’-UTR. Therefore, how class 2 IGF-I 5’-UTR causes its associated mRNA to be
translated less efficiently than class 1 IGF-I 5’-UTR remains an intriguing question to be
addressed.
In summary, the IGF-I gene is expressed as class 1 and class 2 IGF-I mRNA
variants in cattle. Both classes of IGF-I mRNA are expressed in a variety of tissues. Basal
expression of class 1 IGF-I mRNA is higher than that of class 2 IGF-I mRNA, and class 1
IGF-I mRNA may be also translated more efficiently than class 2 IGF-I mRNA. These
findings suggest that expression of class 1 IGF-I mRNA may play a more important role
than class 2 IGF-I mRNA in providing a basal level of IGF-I for normal development and
growth.
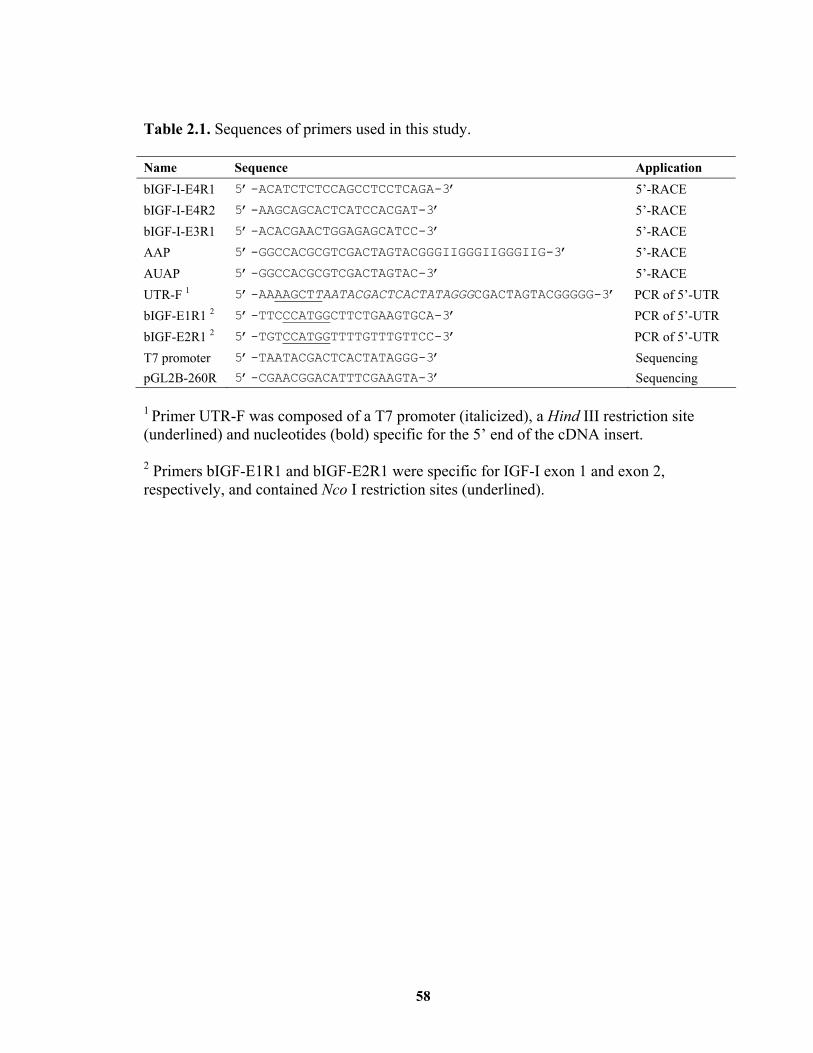
58
Table 2.1. Sequences of primers used in this study. Name Sequence Application bIGF-I-E4R1 5’-ACATCTCTCCAGCCTCCTCAGA-3’ 5’-RACE bIGF-I-E4R2 5’-AAGCAGCACTCATCCACGAT-3’ 5’-RACE bIGF-I-E3R1 5’-ACACGAACTGGAGAGCATCC-3’ 5’-RACE AAP 5’-GGCCACGCGTCGACTAGTACGGGIIGGGIIGGGIIG-3’ 5’-RACE AUAP 5’-GGCCACGCGTCGACTAGTAC-3’ 5’-RACE UTR-F 1 5’-AAAAGCTTAATACGACTCACTATAGGGCGACTAGTACGGGGG-3’ PCR of 5’-UTR bIGF-E1R1 2 5’-TTCCCATGGCTTCTGAAGTGCA-3’ PCR of 5’-UTR bIGF-E2R1 2 5’-TGTCCATGGTTTTGTTTGTTCC-3’ PCR of 5’-UTR T7 promoter 5’-TAATACGACTCACTATAGGG-3’ Sequencing pGL2B-260R 5’-CGAACGGACATTTCGAAGTA-3’ Sequencing 1 Primer UTR-F was composed of a T7 promoter (italicized), a Hind III restriction site (underlined) and nucleotides (bold) specific for the 5’ end of the cDNA insert. 2 Primers bIGF-E1R1 and bIGF-E2R1 were specific for IGF-I exon 1 and exon 2, respectively, and contained Nco I restriction sites (underlined).
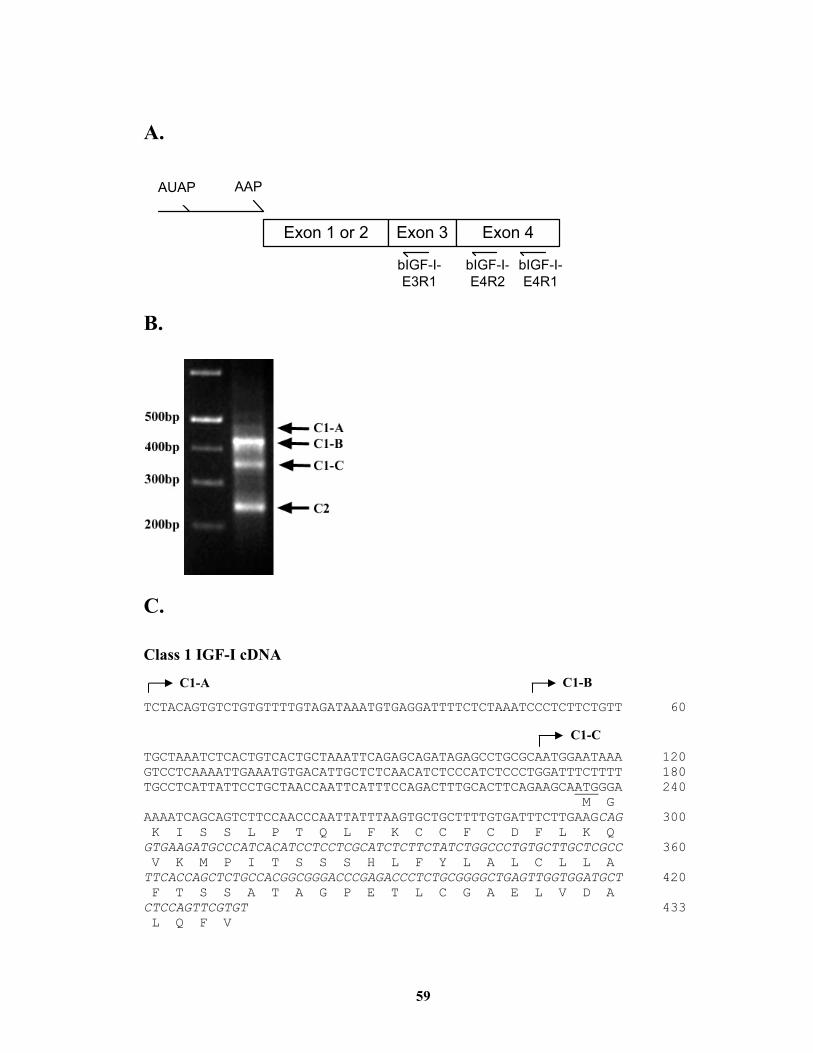
59
A.
AUAP AAP
bIGF-I-E3R1
bIGF-I-E4R2
bIGF-I-E4R1
Exon 1 or 2 Exon 3 Exon 4
B.
C.
Class 1 IGF-I cDNA
TCTACAGTGTCTGTGTTTTGTAGATAAATGTGAGGATTTTCTCTAAATCCCTCTTCTGTT 60
TGCTAAATCTCACTGTCACTGCTAAATTCAGAGCAGATAGAGCCTGCGCAATGGAATAAA 120 GTCCTCAAAATTGAAATGTGACATTGCTCTCAACATCTCCCATCTCCCTGGATTTCTTTT 180 TGCCTCATTATTCCTGCTAACCAATTCATTTCCAGACTTTGCACTTCAGAAGCAATGGGA 240 M G AAAATCAGCAGTCTTCCAACCCAATTATTTAAGTGCTGCTTTTGTGATTTCTTGAAGCAG 300 K I S S L P T Q L F K C C F C D F L K Q GTGAAGATGCCCATCACATCCTCCTCGCATCTCTTCTATCTGGCCCTGTGCTTGCTCGCC 360 V K M P I T S S S H L F Y L A L C L L A TTCACCAGCTCTGCCACGGCGGGACCCGAGACCCTCTGCGGGGCTGAGTTGGTGGATGCT 420 F T S S A T A G P E T L C G A E L V D A CTCCAGTTCGTGT 433 L Q F V
C1-B
C1-C
C1-A
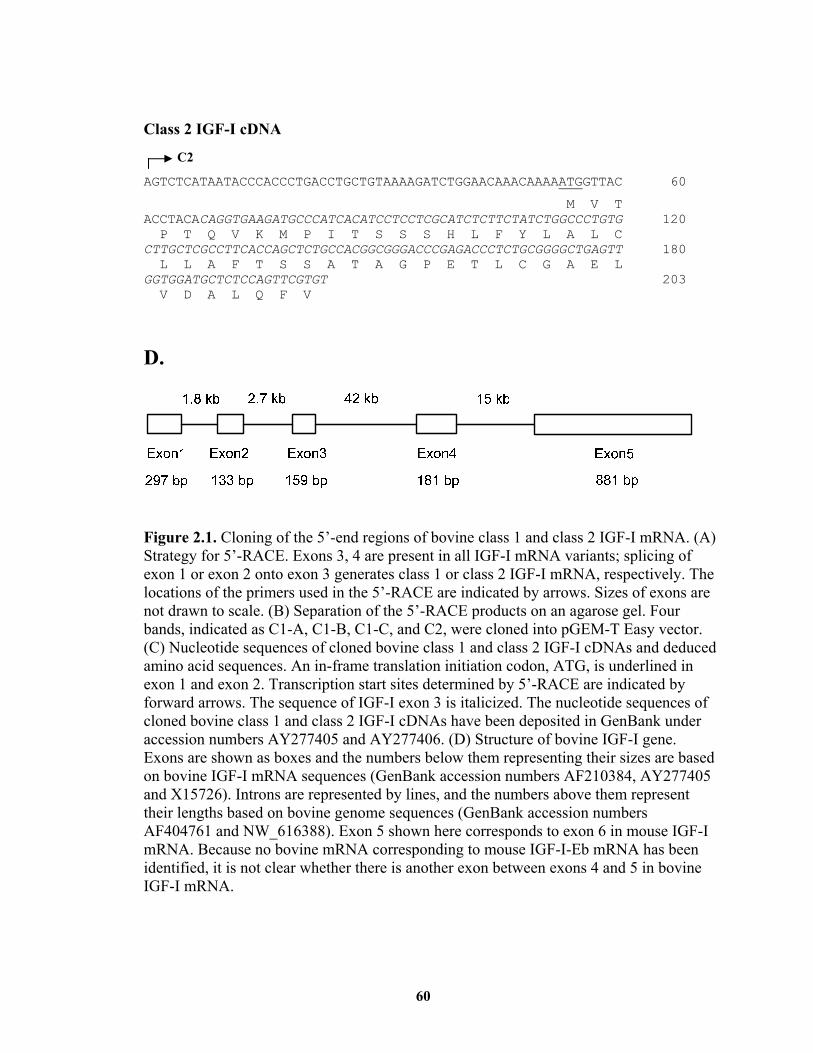
60
Class 2 IGF-I cDNA
AGTCTCATAATACCCACCCTGACCTGCTGTAAAAGATCTGGAACAAACAAAAATGGTTAC 60
M V T ACCTACACAGGTGAAGATGCCCATCACATCCTCCTCGCATCTCTTCTATCTGGCCCTGTG 120 P T Q V K M P I T S S S H L F Y L A L C CTTGCTCGCCTTCACCAGCTCTGCCACGGCGGGACCCGAGACCCTCTGCGGGGCTGAGTT 180 L L A F T S S A T A G P E T L C G A E L GGTGGATGCTCTCCAGTTCGTGT 203 V D A L Q F V
D.
Figure 2.1. Cloning of the 5’-end regions of bovine class 1 and class 2 IGF-I mRNA. (A) Strategy for 5’-RACE. Exons 3, 4 are present in all IGF-I mRNA variants; splicing of exon 1 or exon 2 onto exon 3 generates class 1 or class 2 IGF-I mRNA, respectively. The locations of the primers used in the 5’-RACE are indicated by arrows. Sizes of exons are not drawn to scale. (B) Separation of the 5’-RACE products on an agarose gel. Four bands, indicated as C1-A, C1-B, C1-C, and C2, were cloned into pGEM-T Easy vector. (C) Nucleotide sequences of cloned bovine class 1 and class 2 IGF-I cDNAs and deduced amino acid sequences. An in-frame translation initiation codon, ATG, is underlined in exon 1 and exon 2. Transcription start sites determined by 5’-RACE are indicated by forward arrows. The sequence of IGF-I exon 3 is italicized. The nucleotide sequences of cloned bovine class 1 and class 2 IGF-I cDNAs have been deposited in GenBank under accession numbers AY277405 and AY277406. (D) Structure of bovine IGF-I gene. Exons are shown as boxes and the numbers below them representing their sizes are based on bovine IGF-I mRNA sequences (GenBank accession numbers AF210384, AY277405 and X15726). Introns are represented by lines, and the numbers above them represent their lengths based on bovine genome sequences (GenBank accession numbers AF404761 and NW_616388). Exon 5 shown here corresponds to exon 6 in mouse IGF-I mRNA. Because no bovine mRNA corresponding to mouse IGF-I-Eb mRNA has been identified, it is not clear whether there is another exon between exons 4 and 5 in bovine IGF-I mRNA.
C2
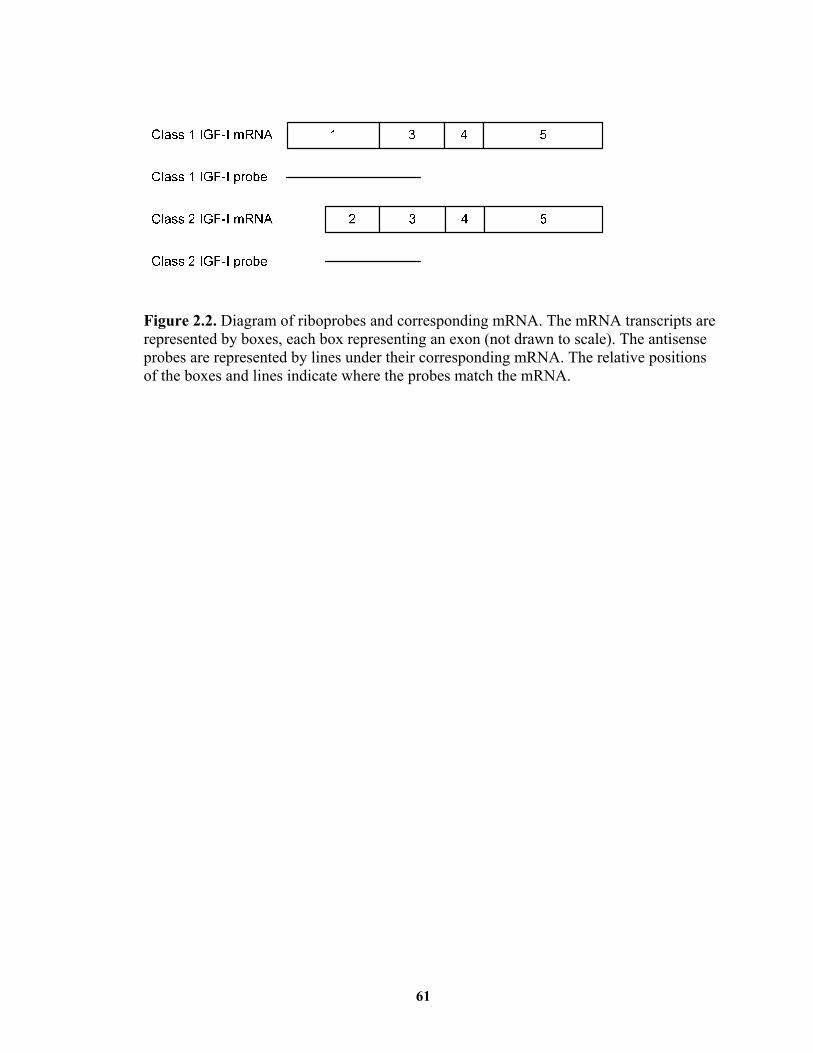
61
Figure 2.2. Diagram of riboprobes and corresponding mRNA. The mRNA transcripts are represented by boxes, each box representing an exon (not drawn to scale). The antisense probes are represented by lines under their corresponding mRNA. The relative positions of the boxes and lines indicate where the probes match the mRNA.
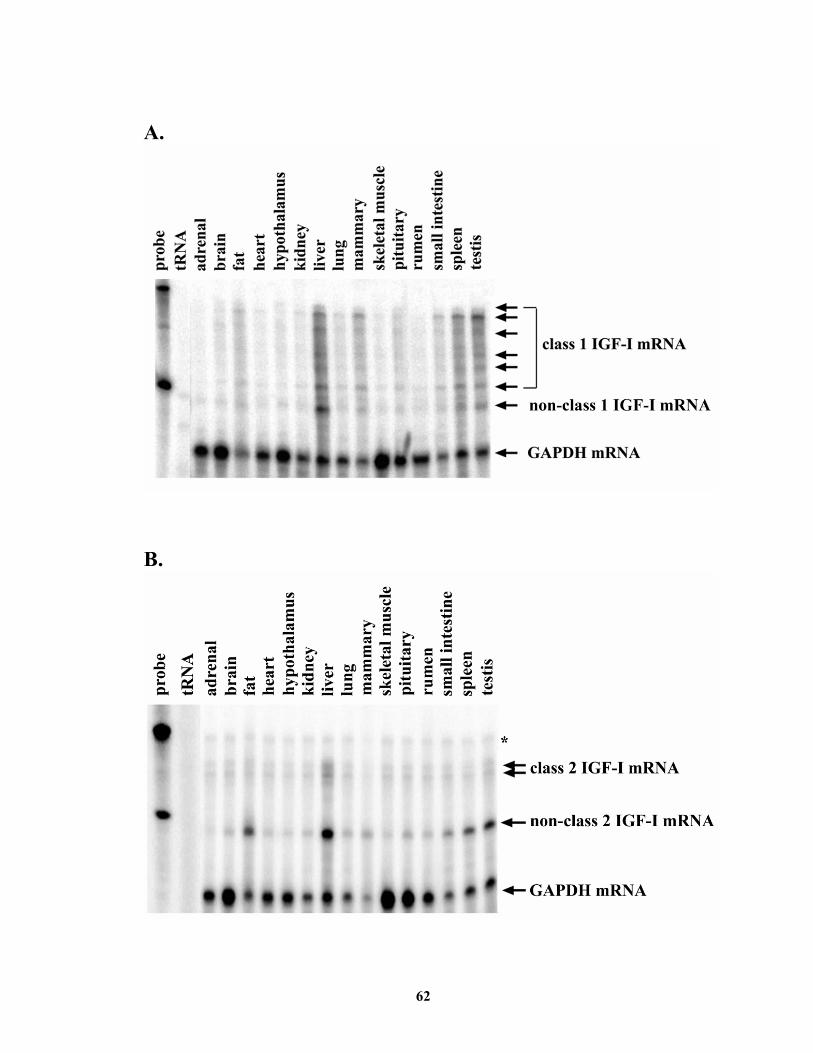
62
A.
B.
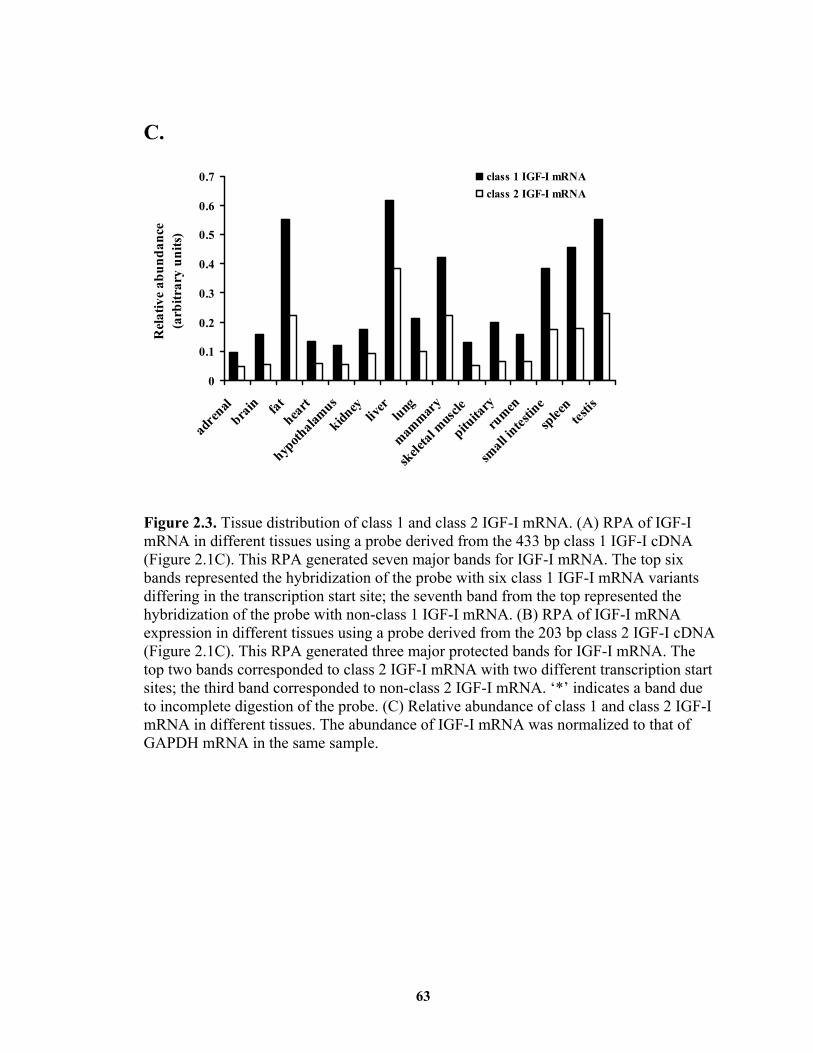
63
C.
0
0.1
0.2
0.3
0.4
0.5
0.6
0.7
adren
albra
in fathea
rt
hypoth
alamus
kidney
liver
lung
mammar
y
skele
tal m
uscle
pituita
ry
rumen
small i
ntestin
esp
leen
testis
Rel
ativ
e ab
unda
nce
(arb
itrar
y un
its)
class 1 IGF-I mRNAclass 2 IGF-I mRNA
Figure 2.3. Tissue distribution of class 1 and class 2 IGF-I mRNA. (A) RPA of IGF-I mRNA in different tissues using a probe derived from the 433 bp class 1 IGF-I cDNA (Figure 2.1C). This RPA generated seven major bands for IGF-I mRNA. The top six bands represented the hybridization of the probe with six class 1 IGF-I mRNA variants differing in the transcription start site; the seventh band from the top represented the hybridization of the probe with non-class 1 IGF-I mRNA. (B) RPA of IGF-I mRNA expression in different tissues using a probe derived from the 203 bp class 2 IGF-I cDNA (Figure 2.1C). This RPA generated three major protected bands for IGF-I mRNA. The top two bands corresponded to class 2 IGF-I mRNA with two different transcription start sites; the third band corresponded to non-class 2 IGF-I mRNA. ‘*’ indicates a band due to incomplete digestion of the probe. (C) Relative abundance of class 1 and class 2 IGF-I mRNA in different tissues. The abundance of IGF-I mRNA was normalized to that of GAPDH mRNA in the same sample.
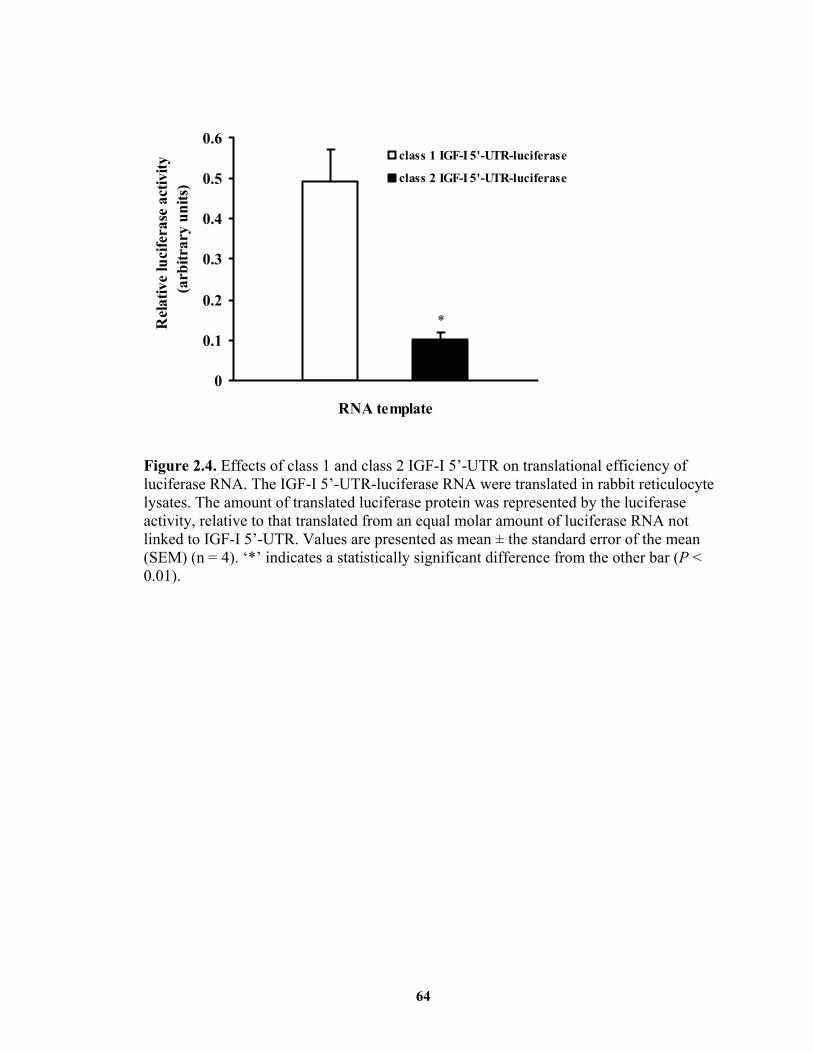
64
0
0.1
0.2
0.3
0.4
0.5
0.6
RNA template
Rel
ativ
e lu
cife
rase
act
ivity
(a
rbitr
ary
units
)
class 1 IGF-I 5'-UTR-luciferase
class 2 IGF-I 5'-UTR-luciferase
*
Figure 2.4. Effects of class 1 and class 2 IGF-I 5’-UTR on translational efficiency of luciferase RNA. The IGF-I 5’-UTR-luciferase RNA were translated in rabbit reticulocyte lysates. The amount of translated luciferase protein was represented by the luciferase activity, relative to that translated from an equal molar amount of luciferase RNA not linked to IGF-I 5’-UTR. Values are presented as mean ± the standard error of the mean (SEM) (n = 4). ‘*’ indicates a statistically significant difference from the other bar (P < 0.01).
65
Chapter III Effects of Food Deprivation and Growth Hormone on Liver
Insulin-Like Growth Factor-I Gene Expression in Steers *
Abstract
Nutritional deprivation decreases serum insulin-like growth factor-I (IGF-I)
concentration in a variety of species, whereas growth hormone (GH) treatment increases
the level of IGF-I in blood. The major source of circulating IGF-I is liver. Therefore,
changes in serum IGF-I by nutritional deprivation and GH might be due to changes in
IGF-I mRNA abundance in liver. In this study, we determined the effects of food
deprivation and GH administration on the level of total IGF-I mRNA as well as the levels
of both classes of IGF-I mRNA in the liver of steers. Food deprivation for nearly 3 d
decreased the abundance of total IGF-I mRNA in liver by 75% (P < 0.01), and this
decrease was associated with an equivalent decrease in the levels of both class 1 and class
2 IGF-I mRNA. Six h after a single intramuscular injection of 500 mg of recombinant
bovine GH, the abundance of total IGF-I mRNA in liver was increase by 100% (P <
0.01), and this increase was mainly caused by an increase of class 2 IGF-I mRNA. These
results suggest that food deprivation- and GH-induced changes in the level of circulating
IGF-I in steers may be due to changed expression of total IGF-I mRNA in liver.
Key words: IGF-I, food deprivation, GH, steer, liver
*. Parts of this work were published in Wang et al., 2003a.
66
Introduction
Nutrition and GH are two important factors regulating animal growth, and both of
them work through changing the production of growth factors such as IGF-I. In a variety
of species, growth retardation caused by food deprivation or GH impairment is
accompanied by a decrease in blood IGF-I concentration (McKern et al., 1981; Thissen et
al., 1994a). The food deprivation- and GH-induced changes in blood IGF-I are thought to
be caused by changed synthesis of IGF-I in liver because the majority of blood IGF-I is
secreted from liver (Sjogren et al., 1999). In many species, IGF-I mRNA is heterogeneous,
with some containing exon 1 as the leader exon (class 1 IGF-I mRNA) and some
containing exon 2 as the leader exon (class 2 IGF-I mRNA). In rats, it has been reported
that food deprivation decreases the levels of both classes of IGF-I mRNA in liver, with a
greater decrease in class 2 IGF-I mRNA (Lowe et al., 1989). In response to GH, the
major hormonal regulator of IGF-I, the expression of both class 1 and class 2 IGF-I
mRNA was increased, but the increase in class 2 IGF-I mRNA is two-fold higher than
that in class 1 IGF-I mRNA (Lowe et al., 1987; Hall et al., 1992).
As reported in Chapter II, the bovine IGF-I mRNA is also expressed as class 1
and class 2 variants. The objectives of this study were to examine the effects of food
deprivation and GH on the levels of both classes of IGF-I mRNA variants and total IGF-I
mRNA in the liver of steers.
67
Materials and Methods
Animals and tissue collection
Angus steers (n = 12) that were between 8 and 9 mo of age and weighed 274 ± 18
kg (mean ± SD) were maintained in a pasture at the Virginia Tech beef cattle farm
(Blacksburg, VA). Each steer had free access to grass and water and also received 2.3 kg
daily of a grain supplement containing ~ 3.2 x 10⁴ kJ digestible energy and 17% crude
protein. Steers were acclimated to periodic confinement before the following experiments.
Steers were randomly assigned to two groups, with each group containing six steers. One
group (fed group) continued to have free access to grass, water and the daily supplement;
the other group (food-deprived group) had access to water only. Sixty-two hours after
food deprivation was initiated, a liver biopsy sample of ~ 200 mg was taken from each
steer.
Another ten steers (311 ± 34 kg body weights) were randomly allocated to two
groups, with five in each group. The steers in one group received a single intramuscular
injection of 500 mg of recombinant bovine GH (Monsanto Company, St. Louis, MO),
and the steers in the other group were treated with saline. Six hours after injection, liver
samples were collected from each steer via biopsy. These ten steers had free access to
grass and water during the experiment.
The liver biopsy was performed according to a procedure described previously
(Oxender et al., 1971). Liver tissue samples were immediately frozen in liquid nitrogen
and stored at -80 °C until RNA extraction. The animal-related procedures were approved
by the Virginia Tech Animal Care Committee.
68
RNA extraction and ribonuclease protection assay (RPA)
Total RNA from liver tissue samples was isolated using TRI Reagent (Molecular
Research Center, Inc.), according to the manufacturer’s instructions. RNA concentration
was determined by measuring absorbance at 260 nm and RNA integrity was verified by
electrophoresis on formaldehyde-agarose gels.
RPA was used to determine the levels of total IGF-I mRNA, class 1 and class 2
IGF-I mRNA variants, and glyceraldehyde-3-phosphate dehydrogenase (GAPDH)
mRNA. The antisense probes for the RPA were synthesized by in vitro transcription of
appropriate cDNA plasmids as described in Chapter II. The cDNA plasmid used to
synthesize the antisense probe for analysis of total IGF-I mRNA was a pGEM-T Easy
plasmid containing a 200 bp cDNA insert that corresponded to 137 bp of exon 3 and 63
bp of exon 4 of the bovine IGF-I gene (provided by Dr. Matthew C. Lucy from
University of Missouri, Columbia, MO; (Kobayashi et al., 1999). The cDNA plasmid
used to synthesize the antisense probe for analysis of class 1 IGF-I mRNA variants was
bIGF-C1A-pGEM containing a 433 bp cDNA insert that was composed of 297 bp of
exon 1 and 136 bp of exon 3 of the bovine IGF-I gene. The cDNA plasmid used to
synthesize the antisense probe for analysis of class 2 IGF-I mRNA was bIGF-C2-pGEM
containing a 203 bp cDNA insert corresponding to 67 bp of exon 2 and 136 bp of exon 3
of the bovine IGF-I gene. Both of them were generated by 5’-RACE in Chapter II. The
relationships between the riboprobes synthesized from these IGF-I cDNAs and their
corresponding mRNA transcripts are illustrated in Figure 3.1. The RPA was carried out
on 30 µg of total RNA using the RPA II kit (Ambion), according to the manufacturer’s
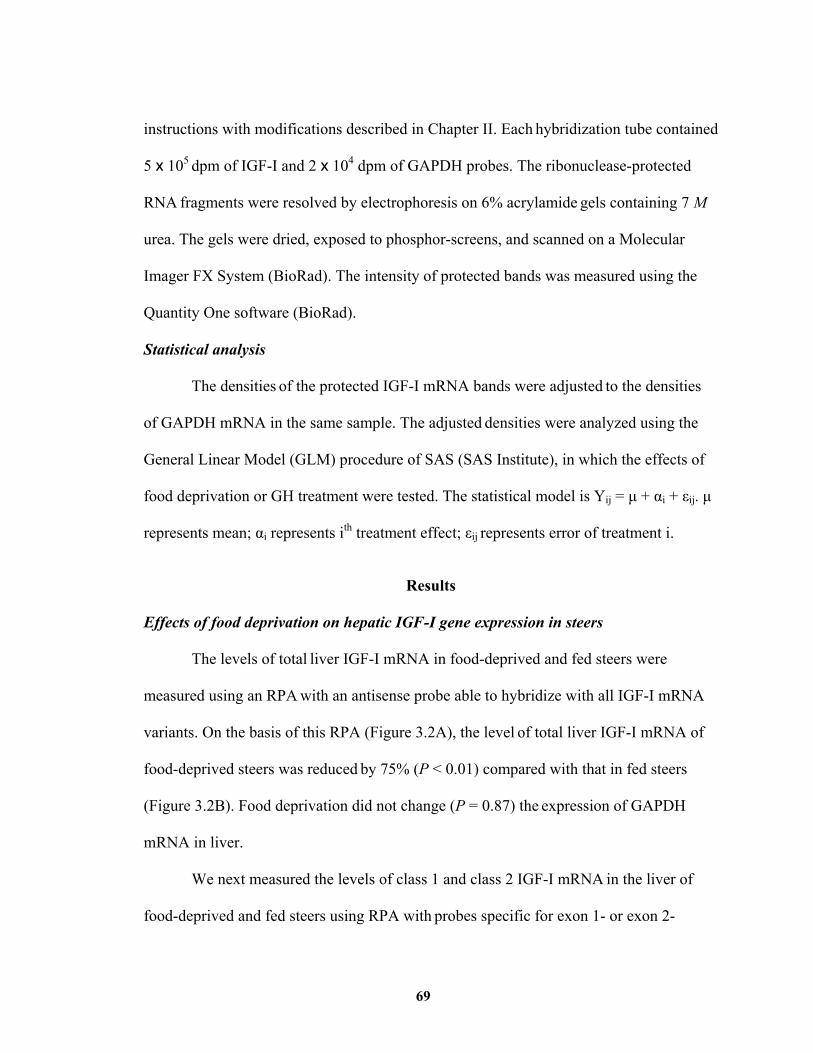
69
instructions with modifications described in Chapter II. Each hybridization tube contained
5 x 10⁵ dpm of IGF-I and 2 x 10⁴ dpm of GAPDH probes. The ribonuclease-protected
RNA fragments were resolved by electrophoresis on 6% acrylamide gels containing 7 M
urea. The gels were dried, exposed to phosphor-screens, and scanned on a Molecular
Imager FX System (BioRad). The intensity of protected bands was measured using the
Quantity One software (BioRad).
Statistical analysis
The densities of the protected IGF-I mRNA bands were adjusted to the densities
of GAPDH mRNA in the same sample. The adjusted densities were analyzed using the
General Linear Model (GLM) procedure of SAS (SAS Institute), in which the effects of
food deprivation or GH treatment were tested. The statistical model is Yij = μ + αi + εij. μ
represents mean; αi represents ith treatment effect; εij represents error of treatment i.
Results
Effects of food deprivation on hepatic IGF-I gene expression in steers
The levels of total liver IGF-I mRNA in food-deprived and fed steers were
measured using an RPA with an antisense probe able to hybridize with all IGF-I mRNA
variants. On the basis of this RPA (Figure 3.2A), the level of total liver IGF-I mRNA of
food-deprived steers was reduced by 75% (P < 0.01) compared with that in fed steers
(Figure 3.2B). Food deprivation did not change (P = 0.87) the expression of GAPDH
mRNA in liver.
We next measured the levels of class 1 and class 2 IGF-I mRNA in the liver of
food-deprived and fed steers using RPA with probes specific for exon 1- or exon 2-
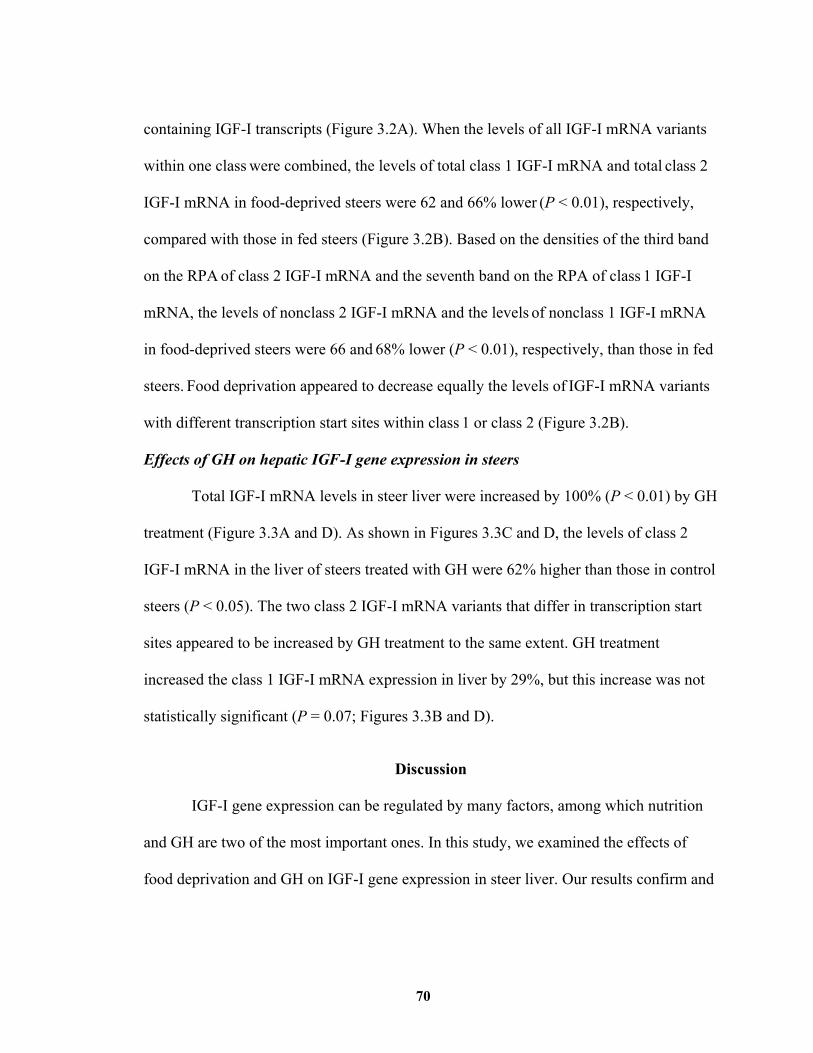
70
containing IGF-I transcripts (Figure 3.2A). When the levels of all IGF-I mRNA variants
within one class were combined, the levels of total class 1 IGF-I mRNA and total class 2
IGF-I mRNA in food-deprived steers were 62 and 66% lower (P < 0.01), respectively,
compared with those in fed steers (Figure 3.2B). Based on the densities of the third band
on the RPA of class 2 IGF-I mRNA and the seventh band on the RPA of class 1 IGF-I
mRNA, the levels of nonclass 2 IGF-I mRNA and the levels of nonclass 1 IGF-I mRNA
in food-deprived steers were 66 and 68% lower (P < 0.01), respectively, than those in fed
steers. Food deprivation appeared to decrease equally the levels of IGF-I mRNA variants
with different transcription start sites within class 1 or class 2 (Figure 3.2B).
Effects of GH on hepatic IGF-I gene expression in steers
Total IGF-I mRNA levels in steer liver were increased by 100% (P < 0.01) by GH
treatment (Figure 3.3A and D). As shown in Figures 3.3C and D, the levels of class 2
IGF-I mRNA in the liver of steers treated with GH were 62% higher than those in control
steers (P < 0.05). The two class 2 IGF-I mRNA variants that differ in transcription start
sites appeared to be increased by GH treatment to the same extent. GH treatment
increased the class 1 IGF-I mRNA expression in liver by 29%, but this increase was not
statistically significant (P = 0.07; Figures 3.3B and D).
Discussion
IGF-I gene expression can be regulated by many factors, among which nutrition
and GH are two of the most important ones. In this study, we examined the effects of
food deprivation and GH on IGF-I gene expression in steer liver. Our results confirm and
71
extend the knowledge of how food deprivation and GH affect hepatic IGF-I gene
expression.
In this study, we found that food deprivation for nearly 3 d caused a 75% decrease
in liver total IGF-I mRNA in steers. Because it is unlikely that the translatability of IGF-I
mRNA is increased during food deprivation (Thissen et al., 1991a), a 75% decrease in
liver IGF-I mRNA suggests a similar level of reduction in liver production of IGF-I
protein. Because the IGF-I secreted from liver contributes to the majority of blood IGF-I
(Sjogren et al., 1999), a 75% decrease in liver IGF-I mRNA level would significantly
decrease blood IGF-I concentration in food-deprived steers, which was confirmed by a
radioimmunoassay showing a 63% reduction in serum IGF-I in these steers (Wang et al.,
2003a).
The food deprivation-induced decreases in liver IGF-I mRNA in rats were
reported to be mediated at multiple levels, including reduced transcription of the IGF-I
gene (Straus and Takemoto, 1990a; Hayden et al., 1994), decreased processing of IGF-I
pre-mRNA (Zhang et al., 1998) and decreased stability of IGF-I mRNA (Zhang et al.,
1998). Little is known about how food deprivation decreases IGF-I gene transcription, the
processing of IGF-I pre-mRNA or the stability of IGF-I mRNA. It is difficult to address
these questions due to the presence of multiple forms of IGF-I mRNA in liver. In rats,
food deprivation decreases both class 1 and class 2 IGF-I mRNA in liver, with a much
greater effect on class 2 IGF-I mRNA (Lowe et al., 1989), suggesting that different
mechanisms mediate the effect of food deprivation on class 1 and class 2 IGF-I mRNA in
rats. This does not mean, however, that a similar mechanism explains effects of food
72
deprivation on IGF-I in all species. Indeed, we found that food deprivation equally
decreased class 1 and class 2 IGF-I mRNA in cattle and also equally decreased the IGF-I
mRNA variants with different transcription start sites within each class. These results
suggest that, unlike rodents, a common mechanism may mediate the food deprivation-
induced decreases in the levels of different IGF-I mRNA variants in cattle. We speculate
that this common mechanism involves a decrease in the activity of a transcription factor
that controls the transcription from both exon 1 and exon 2 of the IGF-I gene (hence the
transcription from both exon 1 and exon 2 is decreased) and/or a decrease in the binding
of a RNA binding protein to both class 1 and class 2 IGF-I pre-mRNA (hence the
processing of both classes of IGF-I pre-mRNA is decreased) and/or a decrease in the
binding of an RNA binding protein to all mature IGF-I transcripts (hence all IGF-I
transcripts are destabilized). These possibilities should be tested in future studies.
It has been known for decades that GH can increase IGF-I gene expression in
liver (Mathews et al., 1986; Roberts et al., 1986). In this study, we confirmed that GH can
increase the level of total IGF-I mRNA in cattle liver. We also observed that only the
level of class 2 IGF-I mRNA was increased in response to GH in cattle liver. Similar
effects of GH on liver IGF-I mRNA expression, including a greater increase in class 2
IGF-I mRNA, have also been observed in rats (Lowe et al., 1987) and sheep (Pell et al.,
1993), suggesting that a common mechanism mediates the GH regulation of IGF-I gene
expression across species. Studies in mice (Mathews et al., 1986) and rats (Bichell et al.,
1992) indicate that GH increases IGF-I mRNA expression in liver predominantly through
increased transcription. However, a recent study on GH regulation of IGF-I mRNA in
73
lambs suggests that GH not only increases IGF-I transcription from both exon 1 and exon
2, but also increases the stability of class 2 IGF-I mRNA (O'Sullivan et al., 2002).
Whether the GH-induced greater increase in class 2 IGF-I mRNA in cattle liver is also
due to increased stability of class 2 IGF-I mRNA remains to be determined in future
studies.
In summary, the results of this study suggest that the food deprivation-induced
decrease in total IGF-I mRNA abundance in steers may be caused by the coordinate
decrease in the levels of all IGF-I mRNA transcripts in liver. However, the increased
abundance of total IGF-I mRNA in response to GH may be mainly caused by a greater
increase in class 2 IGF-I mRNA.
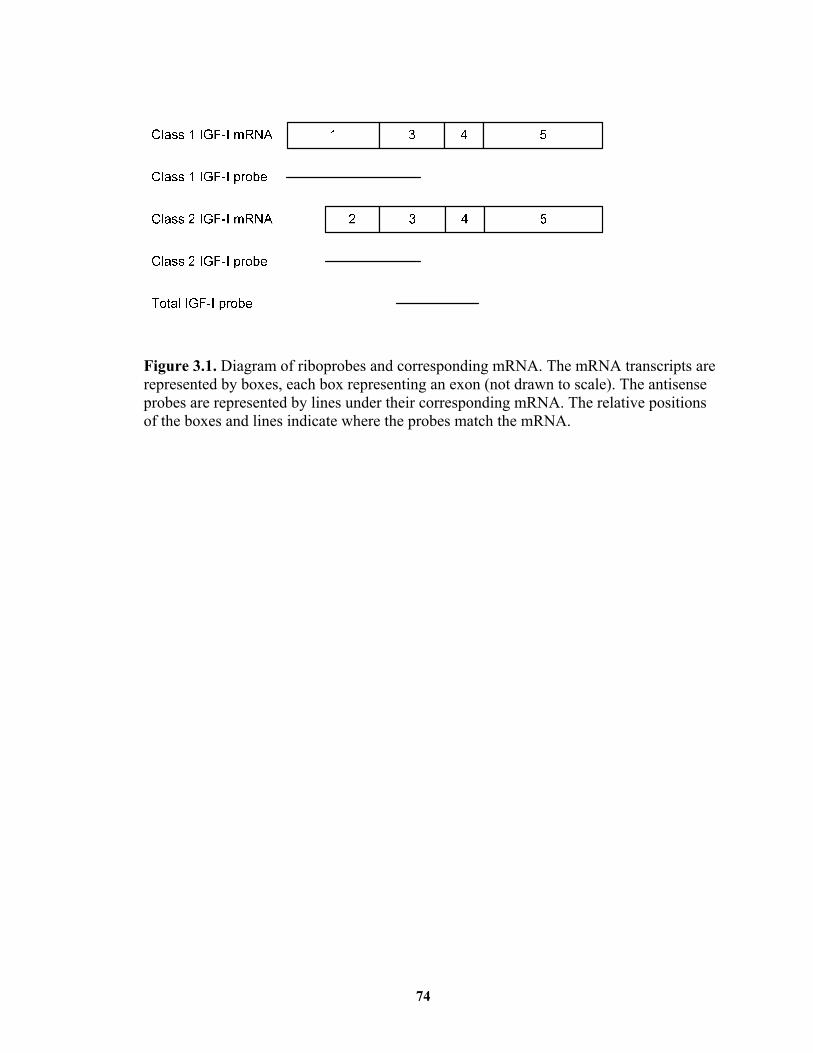
74
Figure 3.1. Diagram of riboprobes and corresponding mRNA. The mRNA transcripts are represented by boxes, each box representing an exon (not drawn to scale). The antisense probes are represented by lines under their corresponding mRNA. The relative positions of the boxes and lines indicate where the probes match the mRNA.
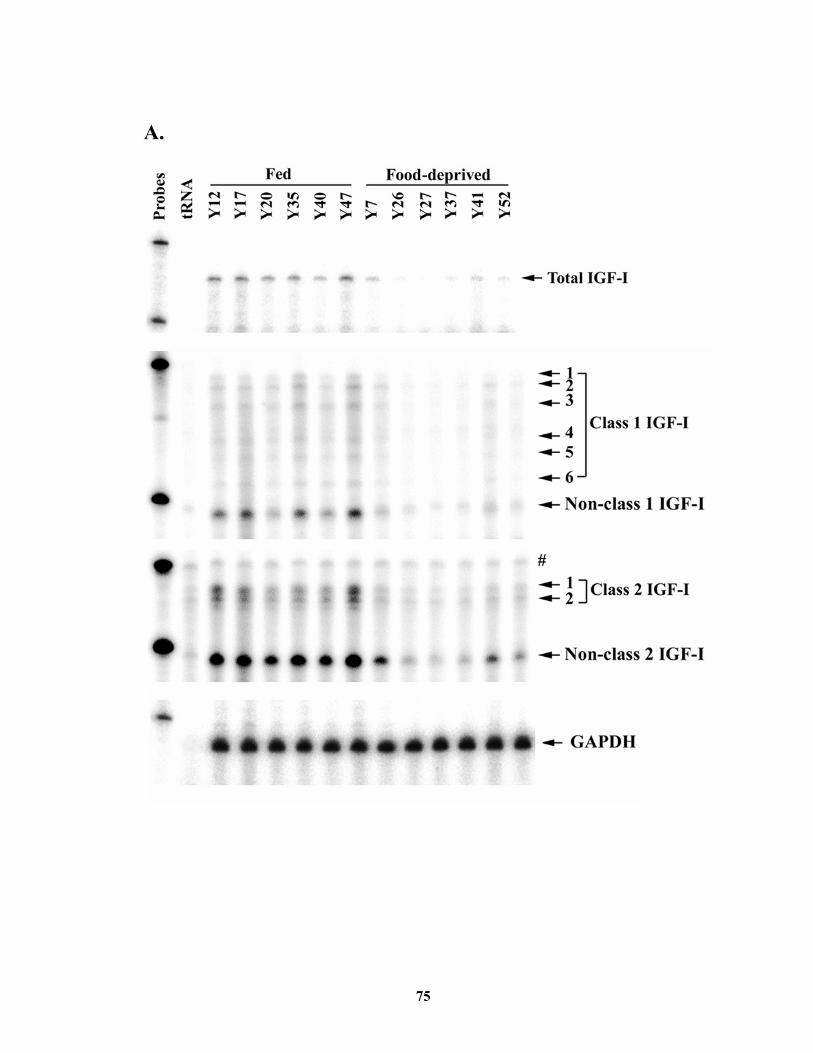
75
A.
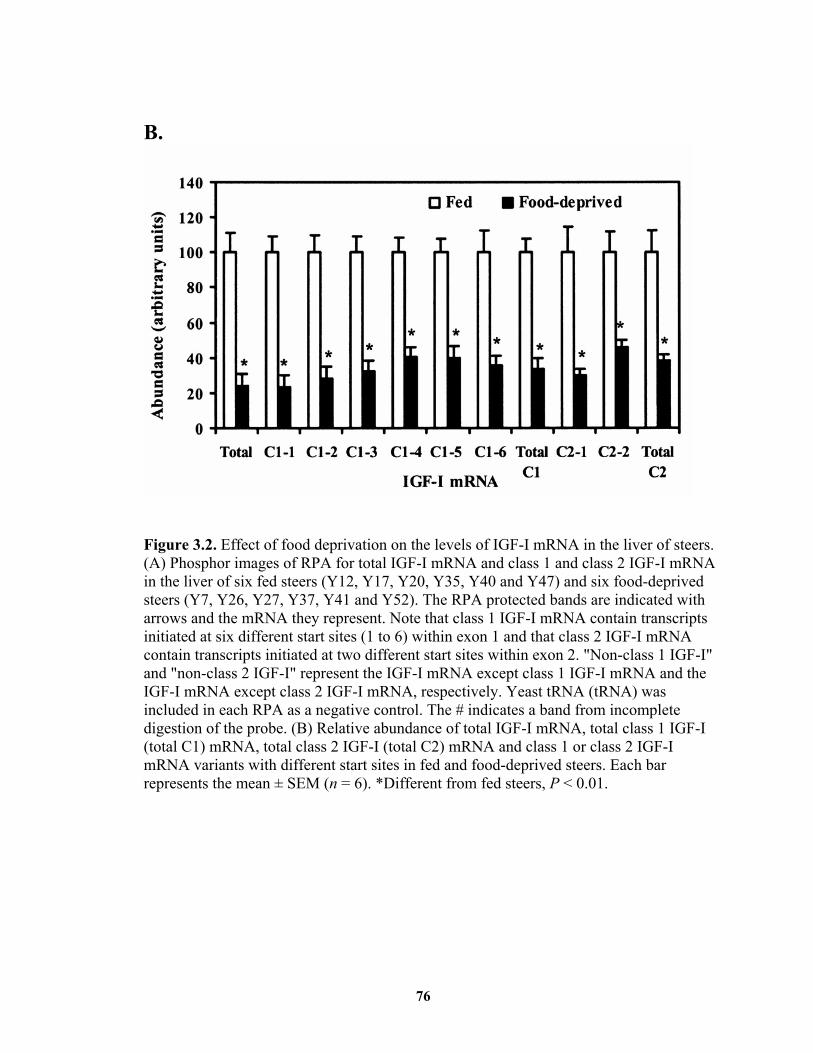
76
B.
Figure 3.2. Effect of food deprivation on the levels of IGF-I mRNA in the liver of steers. (A) Phosphor images of RPA for total IGF-I mRNA and class 1 and class 2 IGF-I mRNA in the liver of six fed steers (Y12, Y17, Y20, Y35, Y40 and Y47) and six food-deprived steers (Y7, Y26, Y27, Y37, Y41 and Y52). The RPA protected bands are indicated with arrows and the mRNA they represent. Note that class 1 IGF-I mRNA contain transcripts initiated at six different start sites (1 to 6) within exon 1 and that class 2 IGF-I mRNA contain transcripts initiated at two different start sites within exon 2. "Non-class 1 IGF-I" and "non-class 2 IGF-I" represent the IGF-I mRNA except class 1 IGF-I mRNA and the IGF-I mRNA except class 2 IGF-I mRNA, respectively. Yeast tRNA (tRNA) was included in each RPA as a negative control. The # indicates a band from incomplete digestion of the probe. (B) Relative abundance of total IGF-I mRNA, total class 1 IGF-I (total C1) mRNA, total class 2 IGF-I (total C2) mRNA and class 1 or class 2 IGF-I mRNA variants with different start sites in fed and food-deprived steers. Each bar represents the mean ± SEM (n = 6). *Different from fed steers, P < 0.01.
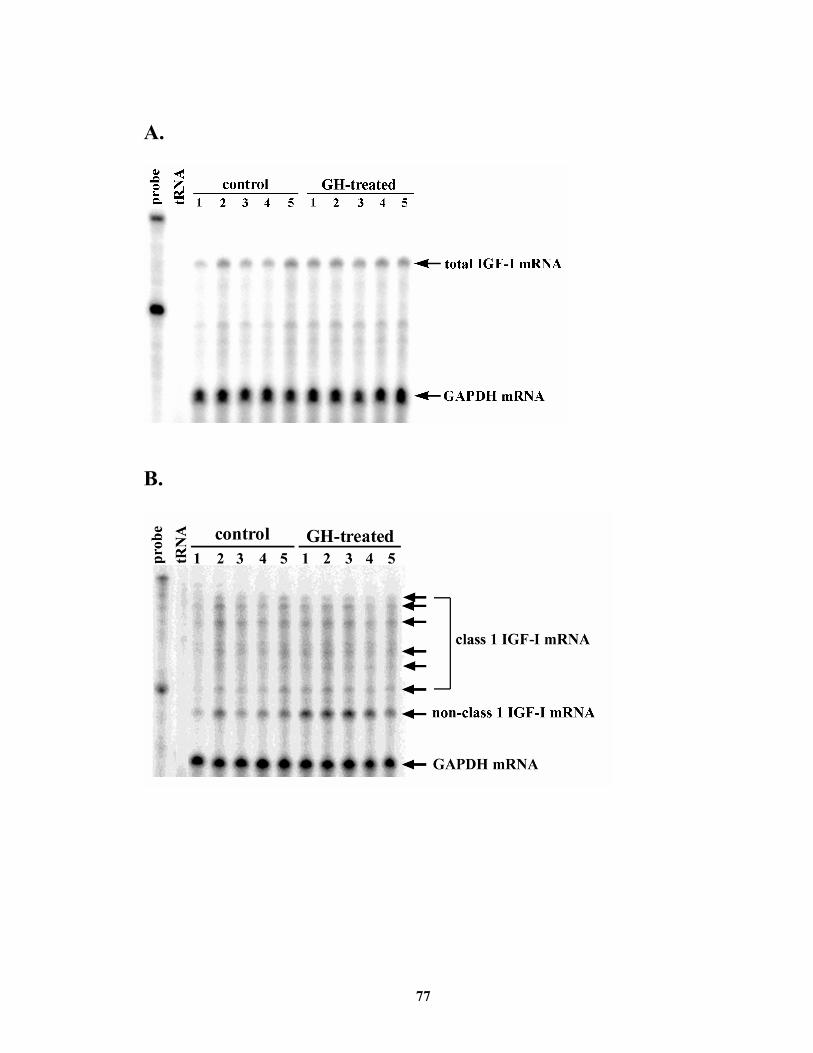
77
A.
B.
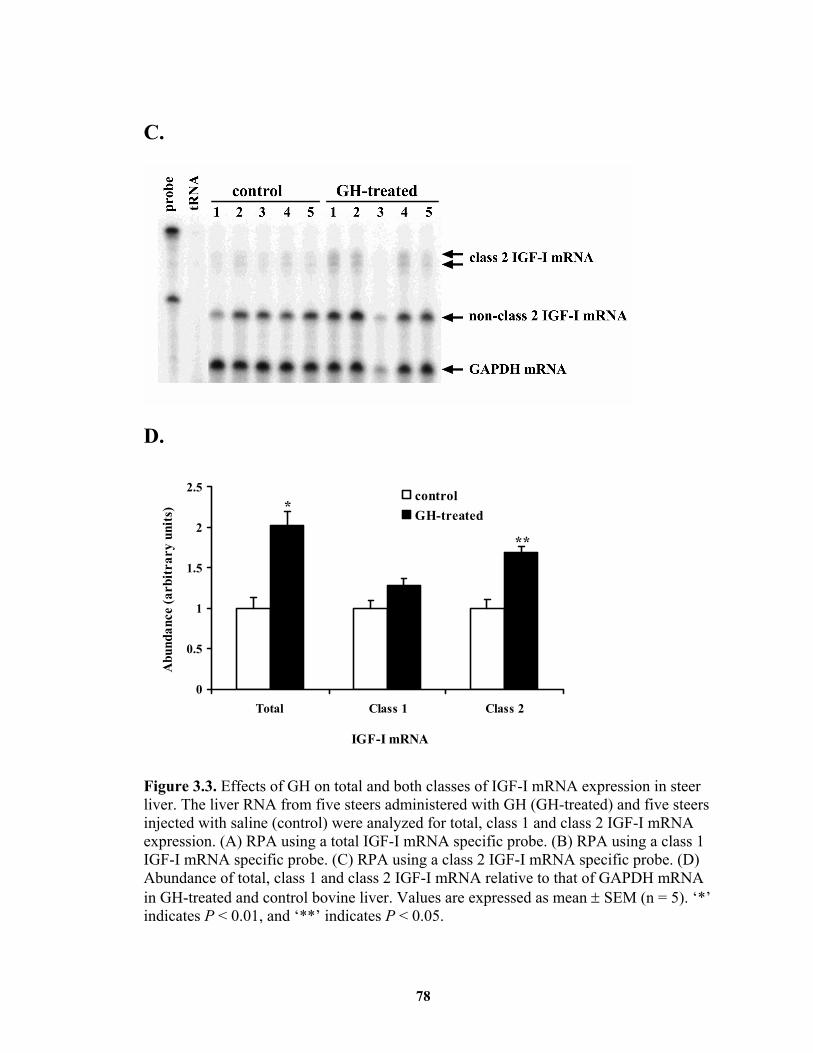
78
C.
D.
0
0.5
1
1.5
2
2.5
Total Class 1 Class 2
IGF-I mRNA
Abu
ndan
ce (a
rbitr
ary
units
)
controlGH-treated*
**
Figure 3.3. Effects of GH on total and both classes of IGF-I mRNA expression in steer liver. The liver RNA from five steers administered with GH (GH-treated) and five steers injected with saline (control) were analyzed for total, class 1 and class 2 IGF-I mRNA expression. (A) RPA using a total IGF-I mRNA specific probe. (B) RPA using a class 1 IGF-I mRNA specific probe. (C) RPA using a class 2 IGF-I mRNA specific probe. (D) Abundance of total, class 1 and class 2 IGF-I mRNA relative to that of GAPDH mRNA in GH-treated and control bovine liver. Values are expressed as mean ± SEM (n = 5). ‘*’ indicates P < 0.01, and ‘**’ indicates P < 0.05.
79
Chapter IV Identification of a Distal STAT5-Binding DNA Region That May
Mediate Growth Hormone Regulation of Insulin-Like
Growth Factor-I Gene Expression *
Abstract
Growth hormone (GH) regulates insulin-like growth factor-I (IGF-I) gene
expression through signal transducer and activator of transcription 5b (STAT5b) and
STAT5a. The objective of this study was to identify the cis-regulatory DNA region
involved in this process. By cotransfection analyses of shotgun DNA fragments of a
bacterial artificial chromosome sequence containing the entire human IGF-I gene and a
large 5'-flanking region, a ~ 700 bp DNA region ~ 75 kb 5' to the IGF-I gene was found
to have the ability to enhance gene expression from both heterologous and homologous
promoters in the presence of constitutively active STAT5a or STAT5b. This 700 bp DNA
region contains two closely located consensus STAT5-binding sites, and its sequence
appears to be evolutionarily conserved. Electrophoretic mobility shift assays verified the
ability of the two putative STAT5-binding sites to bind to STAT5a and STAT5b.
Cotransfection analyses confirmed that both STAT5-binding sites were necessary for the
700 bp DNA region to mediate STAT5a or STAT5b activation of gene transcription.
Chromatin immunoprecipitation assays demonstrated that the chromosomal region
containing these two STAT5-binding sites was bound by overexpressed constitutively
active STAT5b protein in Hep G2 cells and that the binding was accompanied by
*. Parts of this work were published in Wang and Jiang, 2005.
80
increased expression of IGF-I mRNA, as shown by real time PCR analysis. In
reconstituted GH-responsive cells, this 700 bp DNA region was able to mediate GH-
induced STAT5a or STAT5b activation of gene expression. These results together
suggest that this STAT5-binding sites-containing distal 5'-flanking region of IGF-I gene
may be an enhancer mediating GH-induced STAT5 activation of IGF-I gene transcription.
Key words: IGF-I, GH, STAT5, enhancer
81
Introduction
IGF-I is an important endocrine and paracrine regulator of cell proliferation and
metabolism (Daughaday and Rotwein, 1989). Most of the circulating IGF-I is produced
from liver (Sjogren et al., 1999), and IGF-I production in this tissue is primarily
controlled by pituitary GH at the transcriptional level (Mathews et al., 1986; Bichell et al.,
1992). GH regulation of IGF-I gene expression has been known for decades, but the
underlying mechanism is not completely understood. Since the effect of GH on IGF-I
gene expression is rapid (Bichell et al., 1992; Gronowski and Rotwein, 1995) and
independent of protein synthesis (Gronowski et al., 1996), GH-induced IGF-I gene
expression is believed to result from GH-induced direct interaction of transcription
factors with regulatory DNA regions in the IGF-I gene. A lot of work has been attempted
to map such regulatory DNA regions (Thomas et al., 1994; Le Stunff et al., 1995;
Thomas et al., 1995; Ye et al., 1997; Benbassat et al., 1999), but a convincing GH-
responsive regulatory element has not been identified. The slow progress in identifying
the cis-regulatory DNA regions mediating GH induction of IGF-I gene transcription is
perhaps due to the lack of convenient GH-responsive cell lines and the complexity of
IGF-I gene structure.
Signal transducer and activator of transcription 5b (STAT5b) is a well established
component of the GH signaling pathway (Kopchick and Andry, 2000; Piwien-Pilipuk et
al., 2002). The STAT5b-null mice had 50% less liver IGF-I mRNA and 30% lower serum
IGF-I concentration than the wild-type mice (Udy et al., 1997; Davey et al., 2001) and
did not increase liver IGF-I mRNA abundance or blood IGF-I concentration in response
82
to GH treatment (Davey et al., 2001). Overexpression of a dominant-negative STAT5b
mutant completely prevented GH-induced IGF-I gene expression in liver, whereas that of
a constitutively active STAT5b mutant led to robust, GH-independent IGF-I gene
expression in the hypophysectomized rats (Woelfle et al., 2003a). Mutation of the
STAT5b gene or GHR gene, which causes a defect in the STAT5 signaling pathway, has
been recently discovered to cause growth hormone insensitivity, including reduced serum
IGF-I concentration in human patients (Kofoed et al., 2003; Milward et al., 2004; Hwa et
al., 2005). These findings together indicate that STAT5b is a key transcription factor
mediating GH regulation of IGF-I gene transcription. In addition to STAT5b, STAT5a, a
protein that is 96% identical in sequence to STAT5b (Liu et al., 1995) and recognizes the
same DNA sequence as STAT5b (Ehret et al., 2001), may be another transcription factor
mediating GH stimulation of IGF-I gene transcription. Supporting this role of STAT5a is
the observation that STAT5a and STAT5b double knock-out mice had lower serum IGF-I
level and showed greater growth retardation than STAT5b knockout mice (Teglund et al.,
1998).
Because GH stimulation of IGF-I gene expression may be directly mediated by
STAT5, the cis-regulatory DNA regions involved might be the regions that contain
STAT5-binding sites. A region within the rat IGF-I intron 2 has recently been identified
to contain two STAT5-binding sites and to mediate GH-stimulated IGF-I gene expression
in the liver of rats (Woelfle et al., 2003b). However, the corresponding bovine and human
IGF-I intron 2 regions bear limited sequence homology to the rat IGF-I intron 2 region
and contain only one putative STAT5-binding site. We therefore hypothesized that GH-
83
induced STAT5 activation of IGF-I gene expression in bovine and human might be
mediated by DNA regions other than or in addition to the IGF-I intron 2 region. The
objective of this study was to identify additional cis-regulatory DNA region involved in
GH-induced STAT5 activation of IGF-I gene transcription.
Materials and Methods
Genomic DNA extraction
Genomic DNA from the bovine tissue was isolated by standard proteinase K
digestion followed by phenol-chloroform extraction. The concentration and quality of
extracted DNA were determined by spectrophotometry and electrophoresis.
Bacterial artificial chromosome (BAC) library screening
A 200 bp bovine IGF-I exon 4 DNA fragment was amplified by PCR using 200
ng of bovine genomic DNA as template, 0.4 μM of primers bIGF-I-E4F1 and bIGF-I-
E4R3 (Table 4.1), 0.2 mM of dNTPs and 2.5 U of Taq DNA polymerase (Promega). The
PCR fragment was labeled with 32P-dATP (3000Ci/mmol, 10mCi/mL) (PerkinElmer Life
and Analytical Sciences, Inc.) using Prime-It II Random Primer Labeling Kit (Stratagene,
La Jolla, CA), according to the manufacturer’s instructions. Briefly, 25 ng of template
and 10 pmol of primer bIGF-I-E4R3 were mixed up with water, and denatured at 100 °C
for 5 min. The template-primer mixture was subsequently added with 10 μL of 5 × primer
buffer, 5 μL of 32P-dATP, and 1 μL of Klenow DNA polymerase. The labeling reaction
was carried out at 37 °C for 30 min and stopped by adding 2 μL of stop mix. A 1.9 kb
bovine IGF-I fragment corresponding to exon 1 and 5’-flanking region was released from
plasmid bIGF-I-1.9K by digestion of the plasmid with Kpn I and Xho I, and labeled with
84
32P-dATP using Prime-a-Gene Labeling System (Promega), according to the
manufacturer’s instructions. Briefly, 30 ng of template was denatured at 100 °C for 5 min,
and then mixed with 10 μl of 5 × labeling buffer, 1 nmol of dCTP, dTTP, and dGTP, 5
μL of 32P-dATP, and 1 μL of Klenow DNA polymerase. The mixture was incubated at
room temperature for 1 h, and the reaction was terminated by heating at 100 °C for 2 min.
Both labeled fragments were purified using Quick Spin Sephadex G-50 columns (Roche
Applied Science), and used as probes in screening a bovine BAC library (BAC-PAC
Resources, Children's Hospital Oakland Research Institute, Oakland, CA). This library
had approximately six-fold total genomic representation and was gridded onto six nylon
filters, each containing 18,432 independent clones in duplicate. Filters were
prehybridized in a solution containing 50% formamide, 5 × SSPE (20 × SSPE = 3 M
NaCl, 0.2 M NaH2PO4 and 0.02 M EDTA), 5 × Denhardt’s solution (50 × Denhardt’s
solution = 1% Ficoll 400, 1% polyvinylpyrrolidone and 1% BSA), 0.1% SDS and 100
μg/mL of sheared herring testis DNA at 42 °C for 5 h. Hybridization was performed at 42
°C overnight in the same prehybridization buffer except about 107 dpm of probes were
added. After hybridization, filters were washed twice with 2 × SSC (20 × SSC = 3 M
NaCl and 0.3 M sodium citrate) and 0.5% SDS at room temperature for 15 min each, and
three times with 1 × SSC and 0.1% SDS at 65 °C for 30 min each. Filters were exposed
to X-ray films at -80 °C for 4 d before developing. Positive clones were purchased from
BAC-PAC Resources. Two sets of PCR were performed to confirm the inclusion of IGF-
I gene. One PCR was performed using BAC DNA as template, and primers bIGF-I-E4F1
and bIGF-I-E4R3 (Table 4.1) under 35 cycles of 94 ºC for 1 min, 55 ºC for 30 s, and 72
85
ºC for 45 s. Another PCR was performed using BAC DNA as template, and primers
bIGF-IP1381F and bIGF-I-PR1 (Table 4.1) under 35 cycles of 94 ºC for 1 min, 58 ºC for
45 s, and 72 ºC for 90 s.
Shotgun library construction
A BAC clone (RP11-210L7) containing the entire human IGF-I gene and ~ 84 kb
5'-flanking region was purchased from BAC-PAC Resources. The BAC plasmid DNA
was purified using a Plasmid Maxiprep kit (Qiagen), and the quality was confirmed by
electrophoresis. The plasmid DNA was sheared by sonication with five pulses of 5 s each
at power setting 35% using the sonic dismembrator model 300 (Fisher Scientific
International Inc., Pittsburgh, PA). The sonicated DNA was size-fractionated by gel
electrophoresis, and fragments between 2 and 4 kb were selected and purified using a
QIAquick Gel Extraction kit (Qiagen). Ends of DNA fragments were blunted with T4 and
Klenow DNA polymerases (Promega). The pGL2-Promoter vector (Promega) was
digested with Sma I, and then dephosphorylated with calf intestinal alkaline phosphatase
(CIAP) (Promega). The end-repaired DNA fragments were ligated into pGL2-Promoter
vector at the Sma I site, and transformed into E. coli strain DH10B cells by
electroporation. Approximately 300 clones were randomly picked to verify the inclusion
of inserts in the plasmids.
Plasmid construction
A 1,882 bp bovine IGF-I genomic DNA fragment containing 1,852 bp 5’-flanking
region of exon 1 and 30 bp of exon 1 was amplified by PCR using 200 ng of bovine
genomic DNA as template and primers bIGF-I-PF1 and bIGF-I-PR1 (Table 4.1). A 3,776
86
bp bovine IGF-I genomic region spanning from 1,852 bp upstream from exon 1 to 42 bp
downstream from exon 2 was amplified by PCR using 200 ng of bovine genomic DNA as
template, and primers bIGF-I-PF1 and bIGF-I-PR2 (Table 4.1). These two PCR products
were digested with Kpn I and Xho I, and cloned into pGL2-Basic vector (Promega)
digested with the same restriction enzymes to generate plasmid bIGF-I-1.9K and bIGF-I-
3.7K, respectively. A 940 bp promoter 1 of human IGF-I gene, from which class 1 IGF-I
mRNA is transcribed, was amplified from a human IGF-I-containing BAC clone (RP11-
210L7) by PCR with primers hIGF-I-82400F and bIGF-I-PR1 (Table 4.1). This PCR
product was subsequently cloned into pGL2-Basic vector between the Kpn I and Xho I
restriction sites to generate plasmid IGFP1-pGL2B. From the same BAC clone, a 2871
bp human IGF-I intron 2 region was amplified by PCR using primers bIGF-I-E2F3993
and bIGF-I-E3R1 (Table 4.1) and cloned into the pGL2-Promoter vector between the
Sma I and Kpn I sites, resulting a construct named IGF-Intron2-pGL2P. The 700 bp distal
5'-flanking region of human IGF-I gene, identified as a STAT5-binding enhancer in this
study, was amplified by PCR using primers hIGF-I-7312F and hIGF-I-8004R (Table 4.1).
The PCR product was digested with Sma I and Kpn I restriction enzymes and inserted
upstream of the luciferase reporter gene in pGL2-Basic vector, of the SV40 promoter in
pGL2-Promoter vector, of the human IGF-I promoter in IGFP1-pGL2B, or of the
thymidine kinase (TK) promoter in pGL2TK vector to generate plasmids 700bp-pGL2B,
700bp-pGL2P, 700bp-IGFP1-pGL2B, or 700bp-pGL2TK, respectively. The pGL2TK
vector was prepared by inserting the TK promoter from pSPI-LUC plasmid (provided by
Dr. Tim Wood from Karolinska Institute, Novum, Huddinge, Sweden; Wood et al., 1997)
87
into pGL2-Basic vector. The corresponding 700 bp distal 5'-flanking region of bovine
IGF-I gene was amplified by PCR from a bovine BAC clone (RP42-161J14, isolated by
screening bovine BAC library) using primers hIGF-I-7312F and hIGF-I-8004R, and
cloned into pGL2-Promoter vector to generate b700bp-pGL2P. Six copies of a growth
hormone response element (GHRE), each containing two adjacent STAT5-binding sites,
were removed from pSPI-LUC I (Wood et al., 1997) and inserted upstream in pGL2-
Promoter vector to generate construct GHRE.
The first putative STAT5-binding sites in the 700 bp distal 5'-flanking region of
IGF-I gene in plasmid 700bp-pGL2P was mutated by PCR-based site-directed
mutagenesis. Briefly, two sets of PCR were performed using plasmid 700bp-pGL2P as
templates, and primers hIGF-I-7312F and hIGF-I-7426R in one set, and primers hIGF-I-
7403F and hIGF-I-8004R in another set (Table 4.1). The products of two PCR were
purified following gel electrophoresis and they combined to serve as template in a third
PCR using primers hIGF-I-7312F and hIGF-I-8004R (Table 4.1). The product of this
PCR was digested with Sma I and Kpn I, and cloned into pGL2P vector to generate
mutation construct 700bpm1-pGL2P. The other two mutation constructs, 700bpm2-
pGL2P (in which the second STAT5-binding site was mutated) and 700bpm3-pGL2P (in
which both STAT5-binding sites were mutated) were generated by a similar strategy with
sequence-specific primers (Table 4.1). The mutated inserts from these pGL2P-based
constructs were also subcloned into pGL2TK vector at Sma I and Kpn I sites to generate
the pGL2TK-based mutation constructs 700bpm1-pGL2TK, 700bpm2-pGL2TK, and
700bpm3-pGL2TK, respectively.
88
A full-length bovine GHR cDNA fragment was released from bGHR-PCR2.1
plasmid which was cloned previously in this lab (Dr. H. Jiang, unpublished data), and
subcloned into the BamH I and Xba I sites of pcDNA3.1 to generate plasmid pcDNA3-
bGHR. The ability of the pcDNA3-bGHR plasmid to express GHR protein was verified
by in vitro transcription and translation in rabbit reticulocyte lysates (Promega) in the
presence of [35S]methionine (PerkinElmer Life And Analytical Sciences, Inc.).
The inserts in all constructs mentioned above were verified by sequencing using
primers listed in Table 4.1.
The expression plasmids encoding wild-type mouse STAT5a, constitutively
active STAT5a mutant STAT5a-N642H, and wild-type mouse STAT5b were provided by
Dr. Kouichi Ariyoshi (The University of Tokyo, Tokyo, Japan) (Ariyoshi et al., 2000).
The plasmid encoding constitutively active STAT5b mutant STAT5bCA was provided by
Dr. Peter Rotwein (Oregon Health and Science University, Portland, OR; Woelfle et al.,
2003a).
Cell culture
FIB cells, a bovine embryo-derived cell line (provided by Dr. R. M. Akers from
Virginia Polytechnic Institute and State University, Blacksburg, VA), MAC-T cells, a
bovine mammary epithelial cell line (Huynh et al., 1991) and C2C12 cells, a mouse
myogenic cell line (ATCC, Manassas, VA) were cultured in Dulbecco's modified Eagle's
medium with 4 mM of L-glutamine, 100 U/mL of penicillin, 100 μg/mL of streptomycin,
and 10% fetal bovine serum. CHO cells, a Chinese hamster ovary cell line (Puck et al.,
1958), Hep G2 cells (ATCC) and Huh-7 cells (Nakabayashi et al., 1982), two hepatoma-
89
derived cell lines were grown in minimum essential medium containing 1 mM of sodium
pyruvate, 2 mM of L-glutamine, 100 U/mL of penicillin, 100 μg/mL of streptomycin, and
10% fetal bovine serum. All cells were cultured at 37 °C in a humidified 5% CO2
atmosphere. All reagents used in cell culture were from Sigma-Aldrich, Inc. (St. Louis,
MO).
Transfection analysis
In all the transfection analyses, cells at a density of 3 × 10⁴ per well were plated
onto 24-well plates 24 h before transfection, and the luciferase activities were measured
using the Dual Luciferase Reporter Assay System (Promega) according to the
manufacturer’s instruction.
To identify STAT5-responsive IGF-I DNA regions, 0.5 µg of reporter gene
construct and 40 ng of constitutively active STAT5 expression plasmid were
cotransfected with 1 ng of pRL-CMV (transfection efficiency control plasmid from
Promega) into 50% confluent MAC-T cells in 24-well plates using FuGENE 6 (Roche
Applied Science), and the luciferase activities were measured 48 h after transfection.
In transfection analyses to determine GH response of bovine IGF-I proximal
promoter, 2 μg of reporter gene construct (bIGF-I-3.7K) and 0.2 ng of pRL-CMV were
transfected with (in FIB, Hep G2, and Huh 7 cells) or without (in C2C12 cells) 200 ng of
bovine GHR expression plasmid pcDNA3-bGHR. To determine the ability of 700 bp
region to mediate GH-induced gene expression, cells in each well were transfected with
0.5 µg of the respective reporter gene construct, 200 ng of bovine GHR expression
plasmid, 200 ng of wild-type STAT5a or STAT5b expression plasmid, and 1 ng of pRL-
90
CMV. In these two assays, the medium was replaced with serum-free medium 24 h after
transfection, and the cells were grown for a further 16 h. Following that, the medium was
replaced with serum-free medium containing 500 ng/mL recombinant bovine GH
(provided by the National Hormone and Peptide Program), and the cells were grown for
another 8 h before luciferase assay.
Nuclear protein extraction
Approximately 1 x 10⁶ CHO cells were plated in 100-mm dishes 24 h before
transfection. In one experiment, cells were transfected with 20 μg of empty vector
(pcDNA3.1), or constitutively active STAT5 expression plasmid. Forty-eight hours later,
the nuclear proteins were extracted. In another experiment, cells were transfected with 10
μg of bovine GHR expression plasmid and 10 μg of wild-type STAT5 expression plasmid.
Forty hours after transfection, the medium was replaced with serum-free medium, and the
cells were grown for a further 8 h. Following that, the medium was replaced with serum-
free medium containing 500 ng/mL recombinant bovine GH, and nuclear proteins were
extracted 30 min later.
Nuclear protein extraction was carried out according to a standard protocol
(Ausubel et al., 1994). Briefly, cells were scraped from the dishes in PBS at 4 °C and
pelleted at 1,811 g for 10 min. Cells were lysed in cell lysis buffer (10 mM HEPES pH =
7.9, 1.5 mM MgCl2, 10 mM KCl, 0.2 mM PMSF, 0.5 mM DTT), and then homogenized
with 10 up-and-down strokes in a glass Dounce homogenizer using type B pestle to
release nuclei. Nuclei were collected after centrifugation at 3,220 g for 15 min at 4 °C,
and then resuspended in low-salt buffer (20 mM HEPES pH = 7.9, 25% glycerol, 1.5 mM
91
MgCl2, 20 mM KCl, 0.2 mM EDTA, 0.2 mM PMSF, 0.5 mM DTT). Following that,
high-salt buffer (20 mM HEPES pH = 7.9, 25% glycerol, 1.5 mM MgCl2, 1.2 M KCl, 0.2
mM EDTA, 0.2 mM PMSF, 0.5 mM DTT) was added dropwise, and the suspension was
incubated on a rotating platform at 4 °C for 30 min. The nuclear extracts were collected
by centrifuging at 20,817 g for 30 min at 4 °C, and dialysed to remove salts using Slide-
a-lyzer Mini Dialysis Units (Pierce Biotechnology, Inc., Rockford, IL) in a dialysis buffer
(20 mM HEPES pH = 7.9, 20% glycerol, 100 mM KCl, 0.2 mM EDTA, 0.2 mM PMSF,
0.5 mM DTT) for 2 h at 4 °C. Protein concentration was determined using a Bio-Rad
Protein Assay Kit (BioRad).
Electrophoretic mobility shift assay (EMSA)
Complementary oligonucleotides (Table 4.1) corresponding to the two putative
STAT5-binding sites in the distal 5'-flanking region of human IGF-I gene were annealed
by heating to 90 °C for 10 min and slowly cooling to 25 °C over 1 h. Approximately 500
ng of double-stranded oligonucleotides were end-labeled with 32P using 1 μL of T4
polynucleotide kinase (Promega) and 5 μL of [γ-32P]ATP (30 Ci/mmol, 2 mCi/mL)
(PerkinElmer Life and Analytical Sciences, Inc.) for 1 h at 37 °C. The 32P-labeled probes
were purified with phenol-chloroform extraction followed by filtration through Quick
Spin Sephadex G-25 columns (Roche Applied Science). The activity of the probes was
estimated by liquid scintillation counting.
Ten microgram of nuclear proteins were incubated with 2 µg of anti-STAT5a
(Upstate Biotechnology, Inc., Lake Placid, NY), anti-STAT5b antibody (Abcam Inc.,
Cambridge, MA), or 2 µg of the corresponding preimmune serum in reaction buffer
92
containing 20% glycerol, 20 mM Tris-HCl, pH = 7.5, 100 mM KCl, 1 mM DTT, 1 mM
EDTA, and 2 µg of poly(dI-dC) for 1 h at 4 °C. The binding reactions were subsequently
added with 1 x 10⁵ dpm of 32P-labeled oligonucleotide probe, and the incubations were
continued for 1 h at 4 °C. The reactions were resolved on native 6% polyacrylamide gels.
After electrophoresis, the gels were dried, exposed to phosphor screens, and scanned on a
Molecular Imager FX System (Bio-Rad).
Chromatin immunoprecipitation (ChIP) assay
This assay was performed as described (Weinmann and Farnham, 2002) with
minor modifications. Approximately 1 x 10⁶ Hep G2 cells were transiently transfected
with 20 µg of STAT5bCA expression plasmid. Forty-eight hours after transfection, the
cells were cross-linked with 1% formaldehyde for 15 min at room temperature, followed
by termination of the reaction with 125 mM glycine. Cells were washed with ice cold
PBS containing protease inhibitors (1 mM PMSF, 1 μg/mL aprotinin and 1μg/mL
pepstatin A) and scraped from the dishes, followed by centrifuging at 1,811 g for 10 min
at 4 °C. Cells were lysed in cell lysis buffer (10 mM HEPES pH = 7.9, 1.5 mM MgCl2, 10
mM KCl, 0.2 mM PMSF, 0.5 mM DTT), and then homogenized with 10 up-and-down
strokes in a glass Dounce homogenizer using type B pestle to release nuclei. Nuclei were
collected after centrifugation at 3,220 g for 15 min at 4 °C. The nuclei were subsequently
sonicated with 10 pulses of 10 s each at power setting 35% using the sonic dismembrator
model 300 (Fisher) at 4 °C. The following steps were performed using a ChIP kit,
following the manufacturer's directions (Upstate Biotechnology, Inc.) with minor
modifications. Briefly, 10% of the sonicated chromatin was saved as "input," and the rest
93
was cleared twice to reduce nonspecific immunoprecipitation with salmon sperm
DNA/protein A-agarose slurry at 4 °C for 30 min. One half of the precleared chromatin
was incubated with 3 µg of anti-STAT5b antibody (Abcam Inc.), and the other half was
incubated with 3 µg of preimmune rabbit serum at 4 °C overnight. The
immunocomplexes were collected with protein A-agarose and washed stringently to
remove nonspecific antibody binding, which included once with low salt immune
complex wash buffer, once with high salt immune complex wash buffer, once with LiCl
immune complex wash buffer, and twice with TE buffer. After washing, the DNA-
protein complexes were eluted, and the cross-linking was reversed by incubation at 65 °C
overnight. The DNA from input-, antibody-, or preimmune serum-treated chromatin
samples was isolated and purified by standard proteinase K digestion, phenol-chloroform
extraction, and ethanol precipitation. The purified DNA from each sample was
resuspended in 20 µL of water. From the purified DNA, the relative levels of the STAT5-
binding site-containing distal 5'-flanking region of IGF-I gene were quantified by PCR
with primers hIGF-I-7336F and hIGF-I-7674R (Table 4.1) under 35 cycles of 94 °C for 1
min, 55 °C for 1 min, and 72 °C for 30 s, and the relative levels of IGF-I exon 4 were
quantified by PCR with primers bIGF-I-E4F1 and bIGF-I-E4R3 (Table 4.1) under 35
cycles of 94 °C for 30 s, 55 °C for 30 s, and 72 °C for 45 s.
Real time reverse transcription-PCR
Approximately 1 x 10⁶ Hep G2 cells were transiently transfected with 20 µg of
STAT5bCA expression plasmid. Total RNA was isolated 48 h after transfection using TRI
reagent (Molecular Research Center, Inc.). The RNA quality was confirmed by gel
94
electrophoresis. One microgram of RNA was reverse transcribed using 10 pmol of
dNTPs, 250 nmol of DTT, 200 ng of random hexamers, 0.5 μL of RNasin ribonuclease
inhibitor, and 1 μL of ImProm-IITM reverse transcriptase (Promega) in 1 × first-strand
buffer at 42 °C for 2 h. The levels of IGF-I mRNA and GAPDH mRNA were
subsequently quantified with real time PCR using TaqMan Gene Expression Assays
identification numbers Hs00153126_m1 and Hs99999905_m1, respectively, and TaqMan
Universal PCR Master Mix on an Applied Biosystems 7300 Real Time PCR System
(Applied Biosystems). The real time PCR conditions were 50 cycles of 95 °C for 15 s and
60 °C for 1 min. The real time PCR data were analyzed using the 2 TC−ΔΔ method,
according to the manufacturer’s directions.
Statistical analysis
The luciferase activity data from transfection and real time PCR analyses were
analyzed by one-factor analysis of variance, followed by t test to compare two means or
the Tukey test to compare multiple means. All of the statistical analyses were performed
using the respective programs of SAS (SAS Institute). The statistical model is Yij = μ + αi
+ εij. μ represents mean; αi represents ith treatment effect; εij represents error of treatment i.
All of the data are expressed as the means ± SEM.
Results
Bovine IGF-I proximal promoter does not appear to contain a growth hormone-
responsive element
Regulatory DNA elements are often identified in the proximal promoter region;
therefore, we determined whether a 3.7 kb bovine IGF-I DNA region containing
95
promoters for both class 1 and class 2 IGF-I mRNA contains GH-responsive elements.
The promoter reporter construct (bIGF-I-3.7K) was transfected into different cell lines,
including FIB, Hep G2, Huh-7 and C2C12 cells. FIB cells are fibroblasts and were shown
to express IGF-I mRNA in culture (Dr. R. M. Akers, personal communication). Hep G2
and Huh-7 cells are human hepatoma-derived cell lines. Since liver is the major source of
IGF-I production and has the highest response to GH, these two hepatoma-derived cell
lines may still have GH-responsiveness. A mouse myogenic C2C12 cell line has been
demonstrated to express IGF-I mRNA and rapidly respond to physiological levels of GH
(Sadowski et al., 2001; Frost et al., 2002), and therefore might be a good model system to
study GH regulation of IGF-I mRNA. However, the bovine IGF-I promoter reporter gene
construct did not respond to GH in Hep G2 or C2C12 cells (Figure 4.1) or FIB or Huh-7
cells (data not shown). These observations are consistent with many studies that
attempted to identify GH-responsive DNA regions in the IGF-I promoter or IGF-I
intronic regions proximal to the transcription start site (Thomas et al., 1994; Le Stunff et
al., 1995; Thomas et al., 1995; Ye et al., 1997; Benbassat et al., 1999), suggesting that the
proximal promoter region does not contain a GH-responsive element. Alternatively, the
cell systems used do not contain appropriate GH signaling pathways, or are not sensitive
enough for transient transfection analysis of GH-responsive elements.
Identification of STAT5-binding enhancers in a 170 kb human chromosomal region
containing the IGF-I gene
To identify potential distal GH-responsive DNA regions, we mapped a 170 kb
BAC sequence containing the entire human IGF-I gene and the ~ 84 kb 5'-flanking region
96
for STAT5-binding enhancers, which might be the regions mediating GH activation of
IGF-I gene expression in bovine (At that time, most of the bovine IGF-I genomic
sequence was not available). A shotgun library of this 170 kb BAC insert was constructed
in the enhancer-less pGL2-Promoter vector pGL2P. From this library, 115 plasmids,
which contained inserts 2 ~ 4 kb and were estimated to give a two-fold coverage of the
170 kb BAC sequence, were each cotransfected with a plasmid expressing the
constitutively active STAT5 mutant STAT5a-N642H (Ariyoshi et al., 2000) or the empty
plasmid into MAC-T cells. As shown in Figure 4.3, the activity of the positive control
construct GHRE that contains 12 copies of STAT5-binding site from the Spi 2.1 gene
(Wood et al., 1997) was increased 6.5-fold on average by STAT5a-N642H, validating the
effectiveness of the assay in identifying STAT5-responsive enhancers. The increases (or
decreases) in reporter gene expression from most of the IGF-I DNA-containing pGL2P
plasmids were within two standard deviations (0.267) of that from the vector plasmid
(Figure 4.4), and these changes were considered not significant. The increases in reporter
gene expression from five plasmids, plasmids 11, 43, 73, 74, and 94, were greater than
two standard deviations of that from pGL2P (Figure 4.2), and the DNA inserts in these
five plasmids were believed to have the ability to mediate STAT5 activation of gene
expression and were selected to be sequenced. By aligning the sequences of these inserts
with the sequence (GenBank accession number AC010202) of the 170 kb BAC insert, the
inserts in plasmids 11, 43, 73, and 94 were found to belong to the 5'-flanking region of
the IGF-I gene and the insert in plasmid 74 corresponded to IGF-I exon 3 and its
downstream region. The inserts in plasmids 73 and 94 were further found to overlap over
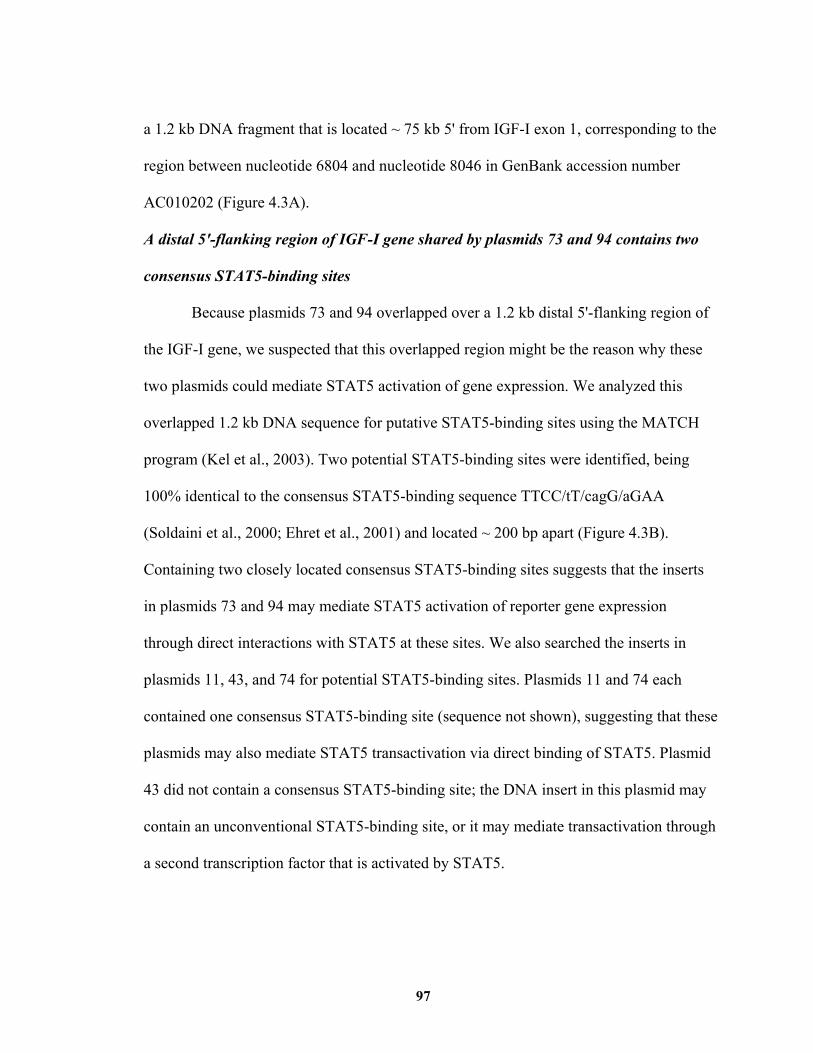
97
a 1.2 kb DNA fragment that is located ~ 75 kb 5' from IGF-I exon 1, corresponding to the
region between nucleotide 6804 and nucleotide 8046 in GenBank accession number
AC010202 (Figure 4.3A).
A distal 5'-flanking region of IGF-I gene shared by plasmids 73 and 94 contains two
consensus STAT5-binding sites
Because plasmids 73 and 94 overlapped over a 1.2 kb distal 5'-flanking region of
the IGF-I gene, we suspected that this overlapped region might be the reason why these
two plasmids could mediate STAT5 activation of gene expression. We analyzed this
overlapped 1.2 kb DNA sequence for putative STAT5-binding sites using the MATCH
program (Kel et al., 2003). Two potential STAT5-binding sites were identified, being
100% identical to the consensus STAT5-binding sequence TTCC/tT/cagG/aGAA
(Soldaini et al., 2000; Ehret et al., 2001) and located ~ 200 bp apart (Figure 4.3B).
Containing two closely located consensus STAT5-binding sites suggests that the inserts
in plasmids 73 and 94 may mediate STAT5 activation of reporter gene expression
through direct interactions with STAT5 at these sites. We also searched the inserts in
plasmids 11, 43, and 74 for potential STAT5-binding sites. Plasmids 11 and 74 each
contained one consensus STAT5-binding site (sequence not shown), suggesting that these
plasmids may also mediate STAT5 transactivation via direct binding of STAT5. Plasmid
43 did not contain a consensus STAT5-binding site; the DNA insert in this plasmid may
contain an unconventional STAT5-binding site, or it may mediate transactivation through
a second transcription factor that is activated by STAT5.
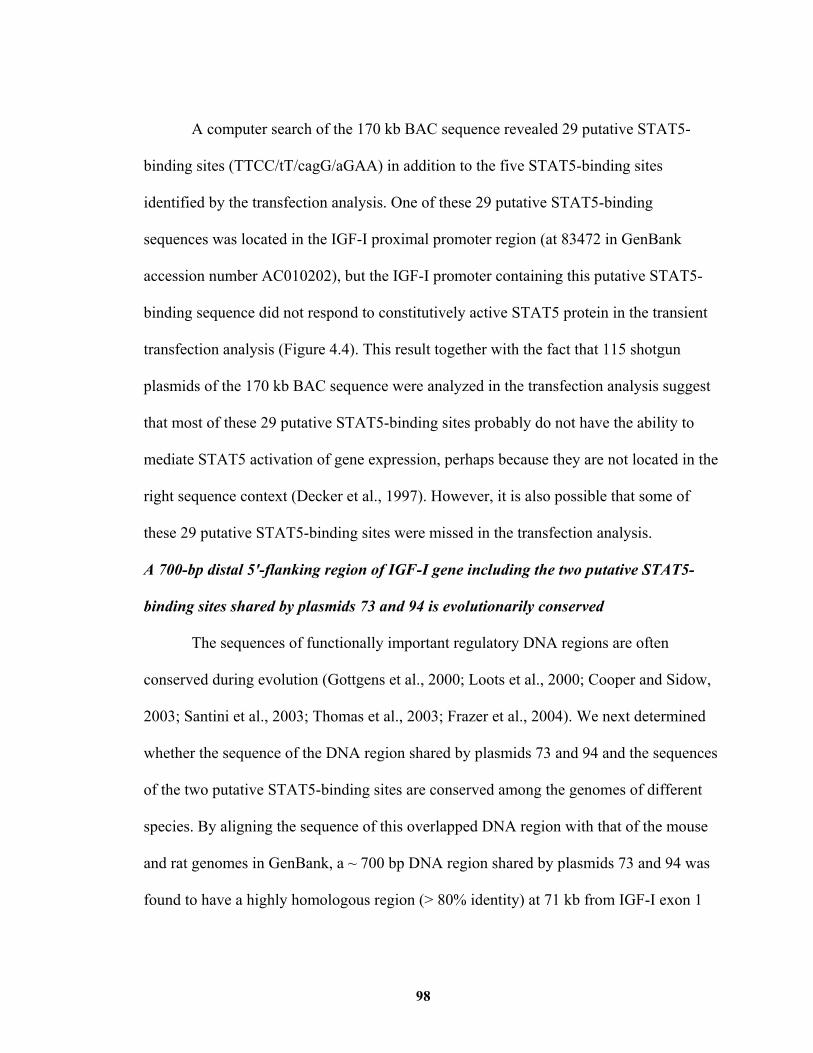
98
A computer search of the 170 kb BAC sequence revealed 29 putative STAT5-
binding sites (TTCC/tT/cagG/aGAA) in addition to the five STAT5-binding sites
identified by the transfection analysis. One of these 29 putative STAT5-binding
sequences was located in the IGF-I proximal promoter region (at 83472 in GenBank
accession number AC010202), but the IGF-I promoter containing this putative STAT5-
binding sequence did not respond to constitutively active STAT5 protein in the transient
transfection analysis (Figure 4.4). This result together with the fact that 115 shotgun
plasmids of the 170 kb BAC sequence were analyzed in the transfection analysis suggest
that most of these 29 putative STAT5-binding sites probably do not have the ability to
mediate STAT5 activation of gene expression, perhaps because they are not located in the
right sequence context (Decker et al., 1997). However, it is also possible that some of
these 29 putative STAT5-binding sites were missed in the transfection analysis.
A 700-bp distal 5'-flanking region of IGF-I gene including the two putative STAT5-
binding sites shared by plasmids 73 and 94 is evolutionarily conserved
The sequences of functionally important regulatory DNA regions are often
conserved during evolution (Gottgens et al., 2000; Loots et al., 2000; Cooper and Sidow,
2003; Santini et al., 2003; Thomas et al., 2003; Frazer et al., 2004). We next determined
whether the sequence of the DNA region shared by plasmids 73 and 94 and the sequences
of the two putative STAT5-binding sites are conserved among the genomes of different
species. By aligning the sequence of this overlapped DNA region with that of the mouse
and rat genomes in GenBank, a ~ 700 bp DNA region shared by plasmids 73 and 94 was
found to have a highly homologous region (> 80% identity) at 71 kb from IGF-I exon 1
99
in the mouse genome and at 74 kb from IGF-I exon 1 in the rat genome (Figure 4.3B).
Blast result showed that the 700 bp region was also conserved (> 90%) in the bovine
genome. Using PCR, from a BAC clone containing the bovine IGF-I gene (RP42-161J14),
which was isolated by screening a bovine BAC library with a bovine IGF-I promoter-
specific probe, we were able to amplify a bovine DNA region that is more than 90%
identical to the 700 bp distal 5'-flanking region of human IGF-I gene (Figure 4.3B),
suggesting that the conserved 700 bp region is also located near (< 200 kb) the IGF-I
gene in the bovine genome. The 700 bp region is not conserved in the chicken and fish
genomes; however, since it has not been confirmed that GH can regulate IGF-I gene
expression in these two species, it is hard to tell the importance of the 700 bp region.
A similar sequence alignment, however, revealed that none of the putative
STAT5-binding sites in plasmids 11, 43, and 74, which were identified in the transfection
analysis (Figure 4.2) were located in homologous regions between the human genome
and the bovine, mouse and rat genomes. Within 29 additional putative STAT5-binding
sites in the 170 kb BAC sequence which were identified based on their sequences, only
one was conserved (> 80%) across these four species. This site is located in an intronic
region about 50 kb downstream from exon 3; however, it did not respond to
constitutively active STAT5 protein in the transient transfection analysis.
The 700 bp distal 5'-flanking region of IGF-I gene can function as a STAT5-
responsive enhancer
To determine whether the evolutionarily conserved, STAT5-binding site-
containing 700 bp distal 5'-flanking region of IGF-I gene can mediate transactivation by
100
STAT5, the 700 bp DNA region was inserted 5' to the SV40 promoter in the enhancer-
less pGL2P plasmid to generate plasmid 700bpIGF-pGL2P. As shown in Figure 4.4, the
reporter gene expression from the SV40 promoter in this plasmid was increased (P < 0.01)
by the constitutively active STAT5a mutant STAT5a-N642H (Figure 4.4A) or the
constitutively active STAT5b mutant STAT5bCA (Figure 4.4B). In the same
cotransfection analyses, the corresponding bovine 700 bp region has a similar effect
(Figure 4.4A and B). However, a human IGF-I intron 2 region corresponding to the
recently identified GH-responsive rat IGF-I intron 2 region (Woelfle et al., 2003b) was
unable to mediate STAT5a (Figure 4.4A) or STAT5b (Figure 4.4B) activation of reporter
gene expression.
To determine whether the 700 bp DNA region can also mediate STAT5 activation
of gene transcription from IGF-I promoter, cotransfection analyses were performed on
plasmids IGFP1-pGL2B and 700bp-IGFP1-pGL2B, each containing a human IGF-I
promoter. As can be seen from Figure 4.4, STAT5a-N642H (Figure 4.4A) or STAT5bCA
(Figure 4.4B) activated (P < 0.01 for STAT5a-N642H, P < 0.05 for STAT5bCA) reporter
gene expression from construct 700bp-IGFP1-pGL2B, indicating that the 700 bp DNA
region can mediate STAT5 activation of gene transcription from IGF-I promoter.
However, the extent to which 700bp-IGFP1-pGL2B was activated by STAT5a-N642H or
STAT5bCA was less than the extent to which 700bp-pGL2P was activated (Figure 4.4).
The reason for this difference was perhaps because the MAC-T cells used in this
transfection analysis did not contain sufficient protein factors to interact with the IGF-I
proximal promoter.
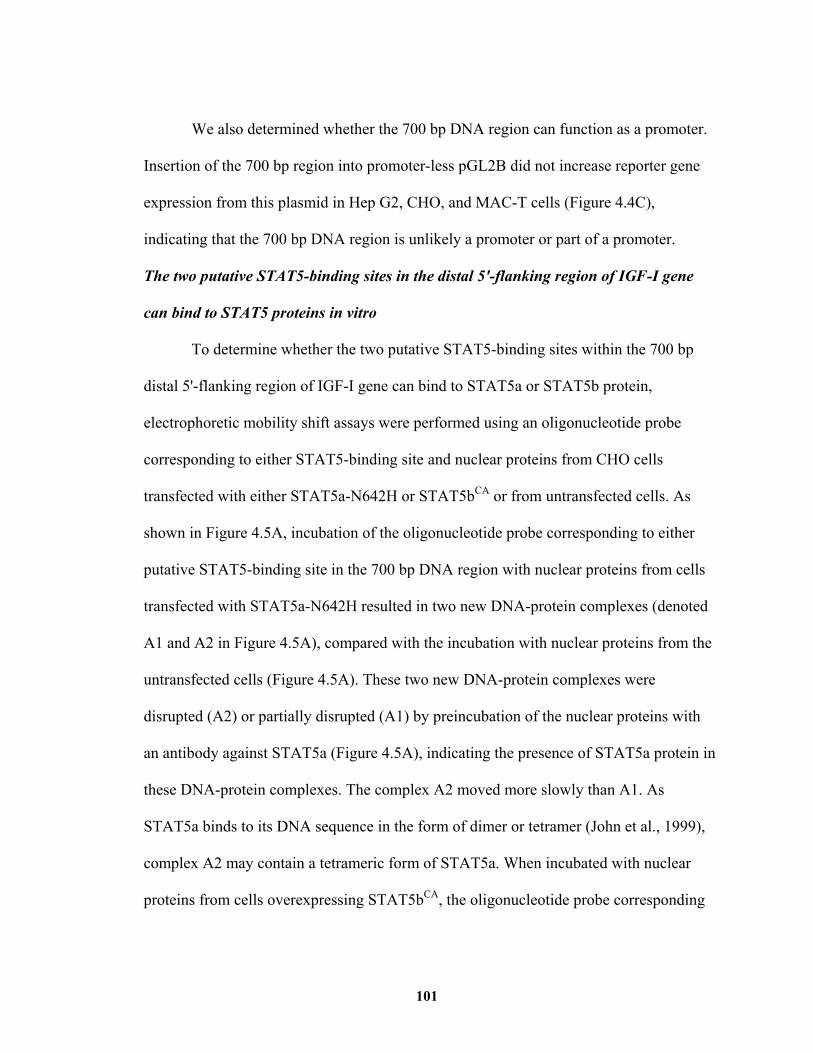
101
We also determined whether the 700 bp DNA region can function as a promoter.
Insertion of the 700 bp region into promoter-less pGL2B did not increase reporter gene
expression from this plasmid in Hep G2, CHO, and MAC-T cells (Figure 4.4C),
indicating that the 700 bp DNA region is unlikely a promoter or part of a promoter.
The two putative STAT5-binding sites in the distal 5'-flanking region of IGF-I gene
can bind to STAT5 proteins in vitro
To determine whether the two putative STAT5-binding sites within the 700 bp
distal 5'-flanking region of IGF-I gene can bind to STAT5a or STAT5b protein,
electrophoretic mobility shift assays were performed using an oligonucleotide probe
corresponding to either STAT5-binding site and nuclear proteins from CHO cells
transfected with either STAT5a-N642H or STAT5bCA or from untransfected cells. As
shown in Figure 4.5A, incubation of the oligonucleotide probe corresponding to either
putative STAT5-binding site in the 700 bp DNA region with nuclear proteins from cells
transfected with STAT5a-N642H resulted in two new DNA-protein complexes (denoted
A1 and A2 in Figure 4.5A), compared with the incubation with nuclear proteins from the
untransfected cells (Figure 4.5A). These two new DNA-protein complexes were
disrupted (A2) or partially disrupted (A1) by preincubation of the nuclear proteins with
an antibody against STAT5a (Figure 4.5A), indicating the presence of STAT5a protein in
these DNA-protein complexes. The complex A2 moved more slowly than A1. As
STAT5a binds to its DNA sequence in the form of dimer or tetramer (John et al., 1999),
complex A2 may contain a tetrameric form of STAT5a. When incubated with nuclear
proteins from cells overexpressing STAT5bCA, the oligonucleotide probe corresponding
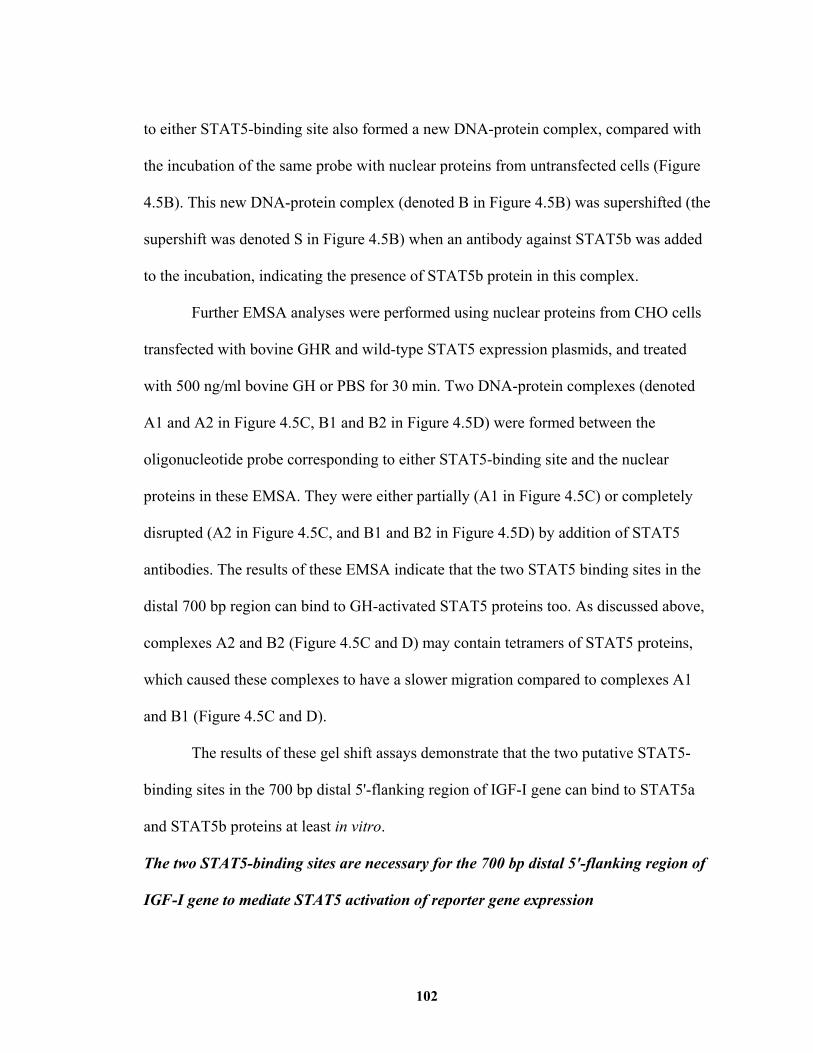
102
to either STAT5-binding site also formed a new DNA-protein complex, compared with
the incubation of the same probe with nuclear proteins from untransfected cells (Figure
4.5B). This new DNA-protein complex (denoted B in Figure 4.5B) was supershifted (the
supershift was denoted S in Figure 4.5B) when an antibody against STAT5b was added
to the incubation, indicating the presence of STAT5b protein in this complex.
Further EMSA analyses were performed using nuclear proteins from CHO cells
transfected with bovine GHR and wild-type STAT5 expression plasmids, and treated
with 500 ng/ml bovine GH or PBS for 30 min. Two DNA-protein complexes (denoted
A1 and A2 in Figure 4.5C, B1 and B2 in Figure 4.5D) were formed between the
oligonucleotide probe corresponding to either STAT5-binding site and the nuclear
proteins in these EMSA. They were either partially (A1 in Figure 4.5C) or completely
disrupted (A2 in Figure 4.5C, and B1 and B2 in Figure 4.5D) by addition of STAT5
antibodies. The results of these EMSA indicate that the two STAT5 binding sites in the
distal 700 bp region can bind to GH-activated STAT5 proteins too. As discussed above,
complexes A2 and B2 (Figure 4.5C and D) may contain tetramers of STAT5 proteins,
which caused these complexes to have a slower migration compared to complexes A1
and B1 (Figure 4.5C and D).
The results of these gel shift assays demonstrate that the two putative STAT5-
binding sites in the 700 bp distal 5'-flanking region of IGF-I gene can bind to STAT5a
and STAT5b proteins at least in vitro.
The two STAT5-binding sites are necessary for the 700 bp distal 5'-flanking region of
IGF-I gene to mediate STAT5 activation of reporter gene expression
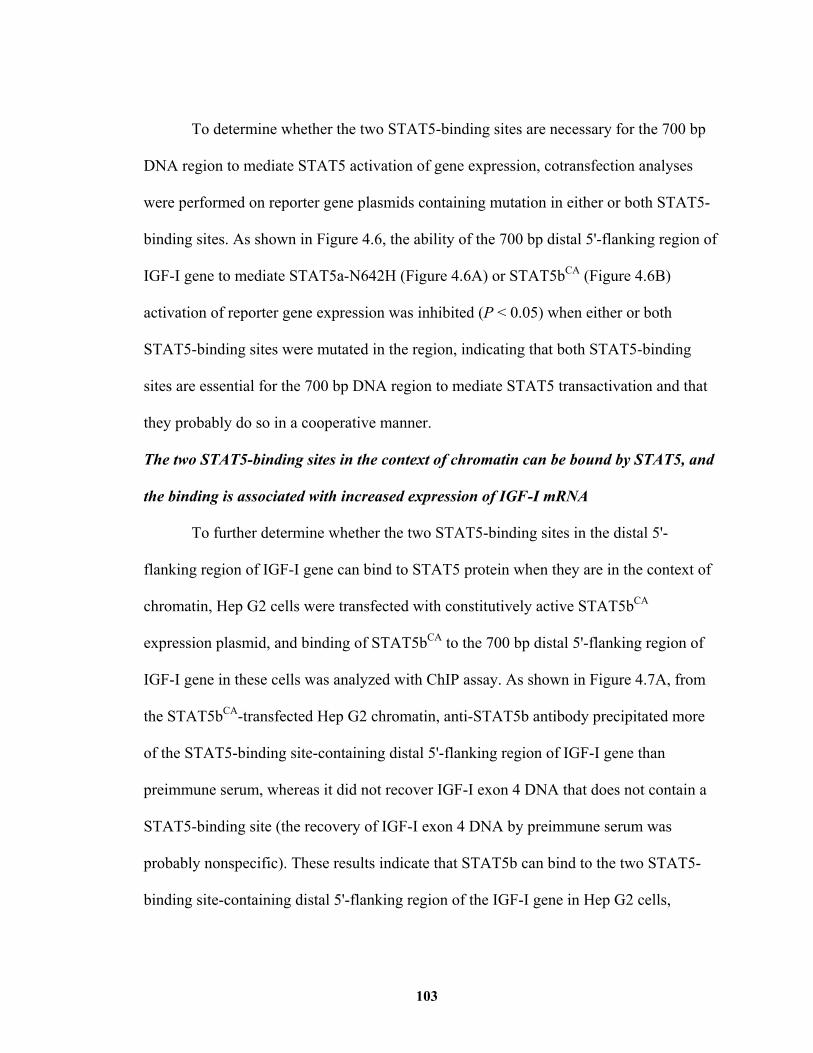
103
To determine whether the two STAT5-binding sites are necessary for the 700 bp
DNA region to mediate STAT5 activation of gene expression, cotransfection analyses
were performed on reporter gene plasmids containing mutation in either or both STAT5-
binding sites. As shown in Figure 4.6, the ability of the 700 bp distal 5'-flanking region of
IGF-I gene to mediate STAT5a-N642H (Figure 4.6A) or STAT5bCA (Figure 4.6B)
activation of reporter gene expression was inhibited (P < 0.05) when either or both
STAT5-binding sites were mutated in the region, indicating that both STAT5-binding
sites are essential for the 700 bp DNA region to mediate STAT5 transactivation and that
they probably do so in a cooperative manner.
The two STAT5-binding sites in the context of chromatin can be bound by STAT5, and
the binding is associated with increased expression of IGF-I mRNA
To further determine whether the two STAT5-binding sites in the distal 5'-
flanking region of IGF-I gene can bind to STAT5 protein when they are in the context of
chromatin, Hep G2 cells were transfected with constitutively active STAT5bCA
expression plasmid, and binding of STAT5bCA to the 700 bp distal 5'-flanking region of
IGF-I gene in these cells was analyzed with ChIP assay. As shown in Figure 4.7A, from
the STAT5bCA-transfected Hep G2 chromatin, anti-STAT5b antibody precipitated more
of the STAT5-binding site-containing distal 5'-flanking region of IGF-I gene than
preimmune serum, whereas it did not recover IGF-I exon 4 DNA that does not contain a
STAT5-binding site (the recovery of IGF-I exon 4 DNA by preimmune serum was
probably nonspecific). These results indicate that STAT5b can bind to the two STAT5-
binding site-containing distal 5'-flanking region of the IGF-I gene in Hep G2 cells,
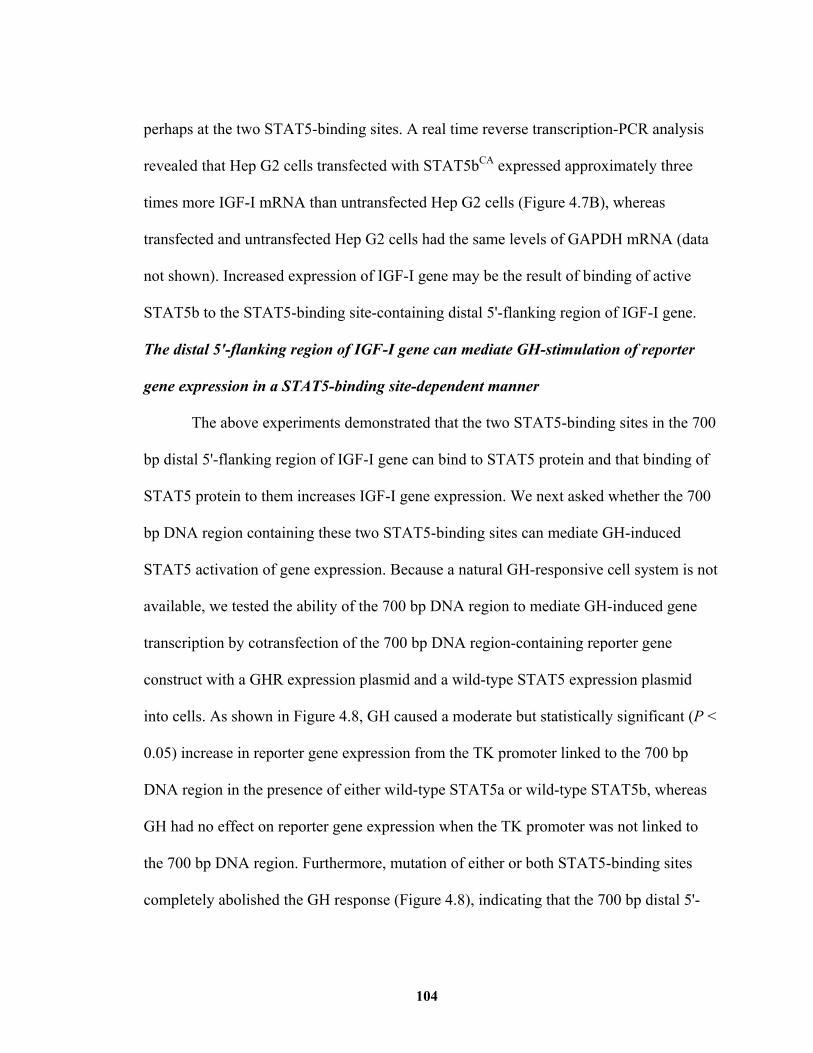
104
perhaps at the two STAT5-binding sites. A real time reverse transcription-PCR analysis
revealed that Hep G2 cells transfected with STAT5bCA expressed approximately three
times more IGF-I mRNA than untransfected Hep G2 cells (Figure 4.7B), whereas
transfected and untransfected Hep G2 cells had the same levels of GAPDH mRNA (data
not shown). Increased expression of IGF-I gene may be the result of binding of active
STAT5b to the STAT5-binding site-containing distal 5'-flanking region of IGF-I gene.
The distal 5'-flanking region of IGF-I gene can mediate GH-stimulation of reporter
gene expression in a STAT5-binding site-dependent manner
The above experiments demonstrated that the two STAT5-binding sites in the 700
bp distal 5'-flanking region of IGF-I gene can bind to STAT5 protein and that binding of
STAT5 protein to them increases IGF-I gene expression. We next asked whether the 700
bp DNA region containing these two STAT5-binding sites can mediate GH-induced
STAT5 activation of gene expression. Because a natural GH-responsive cell system is not
available, we tested the ability of the 700 bp DNA region to mediate GH-induced gene
transcription by cotransfection of the 700 bp DNA region-containing reporter gene
construct with a GHR expression plasmid and a wild-type STAT5 expression plasmid
into cells. As shown in Figure 4.8, GH caused a moderate but statistically significant (P <
0.05) increase in reporter gene expression from the TK promoter linked to the 700 bp
DNA region in the presence of either wild-type STAT5a or wild-type STAT5b, whereas
GH had no effect on reporter gene expression when the TK promoter was not linked to
the 700 bp DNA region. Furthermore, mutation of either or both STAT5-binding sites
completely abolished the GH response (Figure 4.8), indicating that the 700 bp distal 5'-
105
flanking region of IGF-I gene mediated GH-induced STAT5 activation of gene
expression through the two STAT5-binding sites.
Discussion
Because of the lack of convenient GH-responsive, IGF-I expressing cell systems,
and complex IGF-I gene structure, it has been difficult to identify the cis-regulatory DNA
regions that mediate GH regulation of IGF-I gene expression. Therefore, we took an
indirect approach to identify these cis-regulatory DNA regions. Based on recent findings
that GH regulation of IGF-I gene expression in liver depends on STAT5b (Udy et al.,
1997; Teglund et al., 1998; Davey et al., 2001; Woelfle et al., 2003a) and STAT5a
(Teglund et al., 1998), we screened the entire human IGF-I gene and an extensive 5'-
flanking region of this gene for sequences that can function as STAT5-binding enhancers
through cotransfection analysis of shotgun DNA fragments of an IGF-I DNA-containing
BAC clone in the presence of constitutively active STAT5a (Ariyoshi et al., 2000). A 700
bp DNA region 75 kb upstream of IGF-I exon 1 was found to have the ability to mediate
STAT5 activation of gene expression. This region contains two closely located STAT5-
binding sites that were demonstrated to be able to bind to STAT5 proteins. Binding of
STAT5 to this region increased gene expression from both heterologous and homologous
promoters. Binding of STAT5 to the region in chromatin was associated with increased
IGF-I mRNA expression. These results indicate that this two STAT5-binding site-
containing distal 5'-flanking region of IGF-I gene may be a cis-regulatory region that
mediates GH-induced STAT5 activation of IGF-I gene expression.
106
Recently, an intron 2 region of the rat IGF-I gene was found to contain two
STAT5-binding sites that mediate GH-induced STAT5 activation of IGF-I gene
expression in the rat liver (Woelfle et al., 2003b). However, the corresponding human
and bovine IGF-I intron 2 region appears to contain only one STAT5-binding site. In the
cotransfection analysis, the human IGF-I intron 2 region was unable to enhance gene
expression in the presence of constitutively active STAT5 protein. These observations
suggest that, unlike the rat IGF-I intron 2 region, the human and bovine IGF-I intron 2
region probably does not play an important role, if it plays a role, in mediating GH-
induced STAT5 activation of IGF-I gene expression. Compared with the intron 2 region,
the distal 5'-flanking region of the human IGF-I gene identified in this study contains two
perfect STAT5-binding sites that can bind to STAT5 and mediate STAT5 activation of
gene expression. Therefore, GH-induced STAT5 activation of IGF-I gene expression in
humans and probably in some other species is more likely mediated by this distal 5'-
flanking region than by the intron 2 region.
The sequences of functionally important regulatory DNA regions are often
conserved during evolution (Gottgens et al., 2000; Loots et al., 2000; Cooper and Sidow,
2003; Santini et al., 2003; Thomas et al., 2003; Frazer et al., 2004). The corresponding
STAT5-binding distal 5'-flanking regions of the IGF-I genes from rat, mouse, human, and
bovine are highly similar in sequence, being 85% identical over a 700 bp region. In
contrast, the sequences of the corresponding IGF-I intron 2 regions are only moderately
homologous among these species, being 64% identical over a 160 bp region (data not
shown). Thus, we speculate that the STAT5-binding distal 5'-flanking region of IGF-I
107
gene identified in this study may be an enhancer mediating GH-induced STAT5
activation of IGF-I gene expression in a wide variety of species, and some evidence has
already shown that it is true in bovine (Figure 4.4) and rat (Chia et al., 2005). If this distal
5'-flanking region of IGF-I gene indeed mediates GH stimulation of IGF-I gene
expression in mice and rats, it may explain why previous searches of IGF-I DNA regions
proximal to the transcription start site failed to identify GH-responsive regulatory regions
(Thomas et al., 1994; Le Stunff et al., 1995), why reporter gene constructs containing the
IGF-I promoter and proximal introns were not GH-responsive in the liver of transgenic
mice (Ye et al., 1997), and why screening a 30 kb rat 5'-flanking region of IGF-I gene did
not detect any GH-responsive DNA-protein interactions in the liver (Bichell et al., 1992).
The results from this study strongly suggest that the two STAT5-binding site-
containing distal 5'-flanking region of IGF-I gene is a cis-regulatory DNA region that
mediates GH-induced STAT5 activation of IGF-I gene expression in humans and perhaps
in other species as well. It remains to be determined whether this distal STAT5-binding
enhancer is sufficient for GH stimulation of IGF-I gene expression and how the
interaction between this distal enhancer and STAT5 protein activates IGF-I gene
transcription. Given its distance from the IGF-I gene, this STAT5-binding enhancer can
be categorized as a long range enhancer. An increasing number of such long range
enhancers have been identified (Jarman et al., 1991; Blackwood and Kadonaga, 1998;
Carter et al., 2002; Calhoun and Levine, 2003; Nobrega et al., 2003; Serizawa et al.,
2003). Several mechanisms have been proposed for how long range enhancers affect
transcription (Blackwood and Kadonaga, 1998; Bonifer, 1999; Carter et al., 2002;
108
Bondarenko et al., 2003), including DNA looping and direct interaction with RNA
polymerase II and indirect interaction with RNA polymerase II through mediators,
chromatin remodeling complexes, or transcription factors binding to the proximal
promoter. Which of these mechanisms is used by the distal enhancer and STAT5 protein
in mediating GH-stimulation of IGF-I transcription remains to be tested.
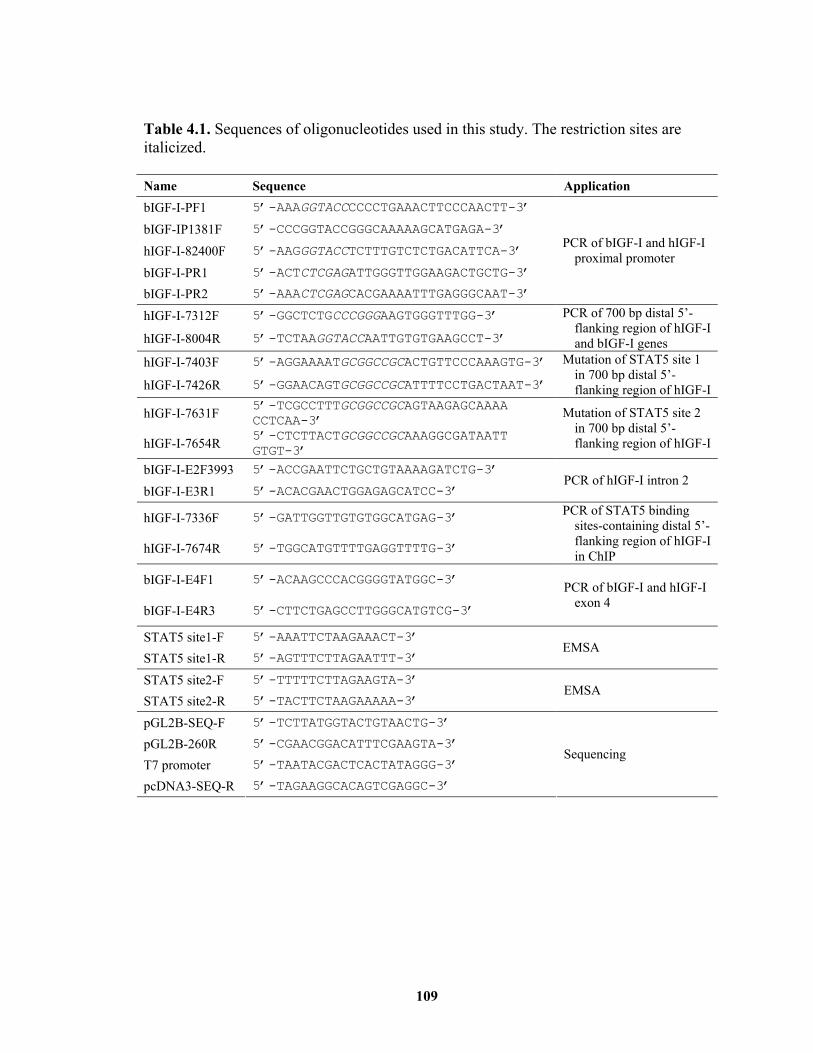
109
Table 4.1. Sequences of oligonucleotides used in this study. The restriction sites are italicized. Name Sequence Application bIGF-I-PF1 5’-AAAGGTACCCCCCTGAAACTTCCCAACTT-3’
bIGF-IP1381F 5’-CCCGGTACCGGGCAAAAAGCATGAGA-3’
hIGF-I-82400F 5’-AAGGGTACCTCTTTGTCTCTGACATTCA-3’
bIGF-I-PR1 5’-ACTCTCGAGATTGGGTTGGAAGACTGCTG-3’
bIGF-I-PR2 5’-AAACTCGAGCACGAAAATTTGAGGGCAAT-3’
PCR of bIGF-I and hIGF-I proximal promoter
hIGF-I-7312F 5’-GGCTCTGCCCGGGAAGTGGGTTTGG-3’
hIGF-I-8004R 5’-TCTAAGGTACCAATTGTGTGAAGCCT-3’
PCR of 700 bp distal 5’-flanking region of hIGF-I and bIGF-I genes
hIGF-I-7403F 5’-AGGAAAATGCGGCCGCACTGTTCCCAAAGTG-3’
hIGF-I-7426R 5’-GGAACAGTGCGGCCGCATTTTCCTGACTAAT-3’
Mutation of STAT5 site 1 in 700 bp distal 5’-flanking region of hIGF-I
hIGF-I-7631F 5’-TCGCCTTTGCGGCCGCAGTAAGAGCAAAA CCTCAA-3’
hIGF-I-7654R 5’-CTCTTACTGCGGCCGCAAAGGCGATAATT GTGT-3’
Mutation of STAT5 site 2 in 700 bp distal 5’-flanking region of hIGF-I
bIGF-I-E2F3993 5’-ACCGAATTCTGCTGTAAAAGATCTG-3’
bIGF-I-E3R1 5’-ACACGAACTGGAGAGCATCC-3’ PCR of hIGF-I intron 2
hIGF-I-7336F 5’-GATTGGTTGTGTGGCATGAG-3’
hIGF-I-7674R 5’-TGGCATGTTTTGAGGTTTTG-3’
PCR of STAT5 binding sites-containing distal 5’-flanking region of hIGF-I in ChIP
bIGF-I-E4F1 5’-ACAAGCCCACGGGGTATGGC-3’
bIGF-I-E4R3 5’-CTTCTGAGCCTTGGGCATGTCG-3’
PCR of bIGF-I and hIGF-I exon 4
STAT5 site1-F 5’-AAATTCTAAGAAACT-3’
STAT5 site1-R 5’-AGTTTCTTAGAATTT-3’ EMSA
STAT5 site2-F 5’-TTTTTCTTAGAAGTA-3’
STAT5 site2-R 5’-TACTTCTAAGAAAAA-3’ EMSA
pGL2B-SEQ-F 5’-TCTTATGGTACTGTAACTG-3’
pGL2B-260R 5’-CGAACGGACATTTCGAAGTA-3’
T7 promoter 5’-TAATACGACTCACTATAGGG-3’
pcDNA3-SEQ-R 5’-TAGAAGGCACAGTCGAGGC-3’
Sequencing
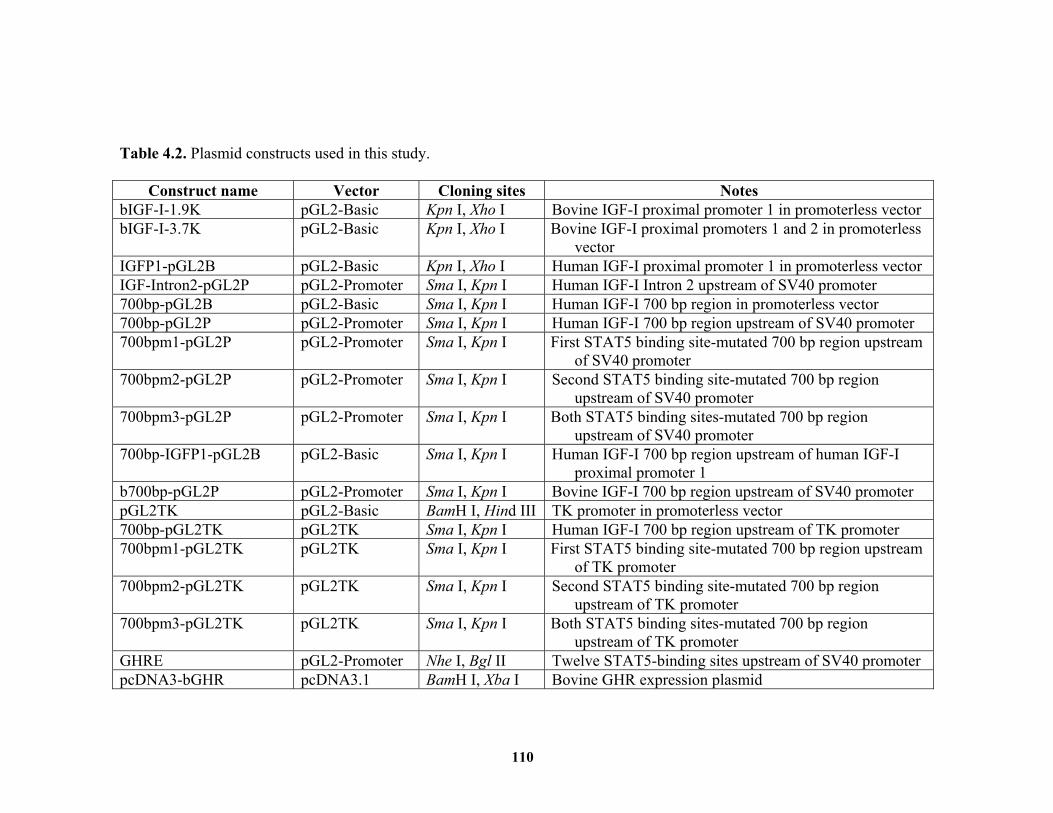
110
Table 4.2. Plasmid constructs used in this study.
Construct name Vector Cloning sites Notes bIGF-I-1.9K pGL2-Basic Kpn I, Xho I Bovine IGF-I proximal promoter 1 in promoterless vector bIGF-I-3.7K pGL2-Basic Kpn I, Xho I Bovine IGF-I proximal promoters 1 and 2 in promoterless
vector IGFP1-pGL2B pGL2-Basic Kpn I, Xho I Human IGF-I proximal promoter 1 in promoterless vector IGF-Intron2-pGL2P pGL2-Promoter Sma I, Kpn I Human IGF-I Intron 2 upstream of SV40 promoter 700bp-pGL2B pGL2-Basic Sma I, Kpn I Human IGF-I 700 bp region in promoterless vector 700bp-pGL2P pGL2-Promoter Sma I, Kpn I Human IGF-I 700 bp region upstream of SV40 promoter 700bpm1-pGL2P pGL2-Promoter Sma I, Kpn I First STAT5 binding site-mutated 700 bp region upstream
of SV40 promoter 700bpm2-pGL2P pGL2-Promoter Sma I, Kpn I Second STAT5 binding site-mutated 700 bp region
upstream of SV40 promoter 700bpm3-pGL2P pGL2-Promoter Sma I, Kpn I Both STAT5 binding sites-mutated 700 bp region
upstream of SV40 promoter 700bp-IGFP1-pGL2B pGL2-Basic Sma I, Kpn I Human IGF-I 700 bp region upstream of human IGF-I
proximal promoter 1 b700bp-pGL2P pGL2-Promoter Sma I, Kpn I Bovine IGF-I 700 bp region upstream of SV40 promoter pGL2TK pGL2-Basic BamH I, Hind III TK promoter in promoterless vector 700bp-pGL2TK pGL2TK Sma I, Kpn I Human IGF-I 700 bp region upstream of TK promoter 700bpm1-pGL2TK pGL2TK Sma I, Kpn I First STAT5 binding site-mutated 700 bp region upstream
of TK promoter 700bpm2-pGL2TK pGL2TK Sma I, Kpn I Second STAT5 binding site-mutated 700 bp region
upstream of TK promoter 700bpm3-pGL2TK pGL2TK Sma I, Kpn I Both STAT5 binding sites-mutated 700 bp region
upstream of TK promoter GHRE pGL2-Promoter Nhe I, Bgl II Twelve STAT5-binding sites upstream of SV40 promoter pcDNA3-bGHR pcDNA3.1 BamH I, Xba I Bovine GHR expression plasmid
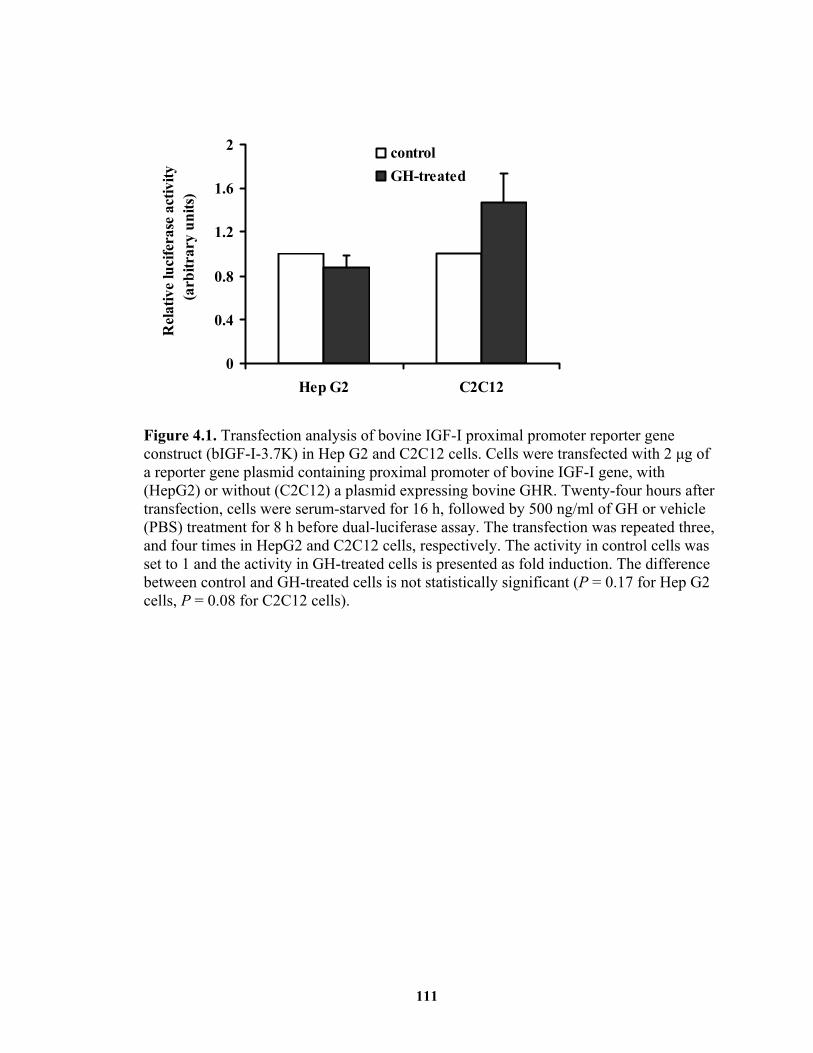
111
0
0.4
0.8
1.2
1.6
2
Hep G2 C2C12
Rel
ativ
e lu
cife
rase
act
ivity
(a
rbitr
ary
units
)
controlGH-treated
Figure 4.1. Transfection analysis of bovine IGF-I proximal promoter reporter gene construct (bIGF-I-3.7K) in Hep G2 and C2C12 cells. Cells were transfected with 2 μg of a reporter gene plasmid containing proximal promoter of bovine IGF-I gene, with (HepG2) or without (C2C12) a plasmid expressing bovine GHR. Twenty-four hours after transfection, cells were serum-starved for 16 h, followed by 500 ng/ml of GH or vehicle (PBS) treatment for 8 h before dual-luciferase assay. The transfection was repeated three, and four times in HepG2 and C2C12 cells, respectively. The activity in control cells was set to 1 and the activity in GH-treated cells is presented as fold induction. The difference between control and GH-treated cells is not statistically significant (P = 0.17 for Hep G2 cells, P = 0.08 for C2C12 cells).
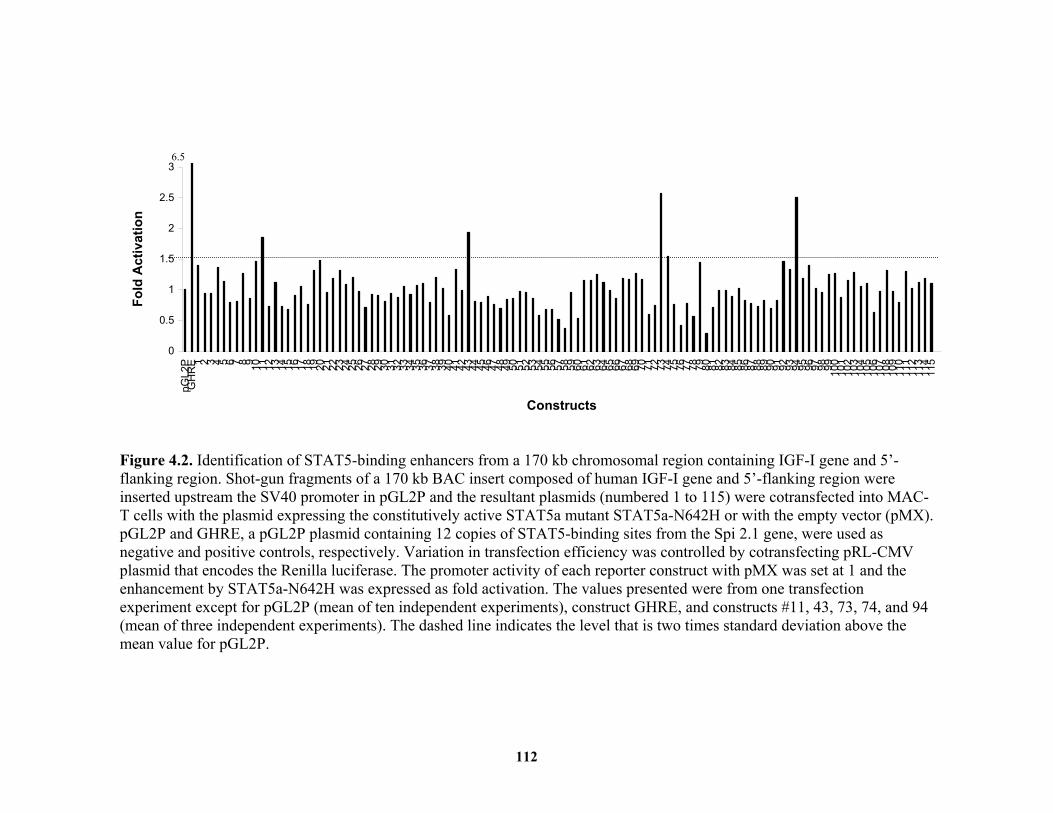
112
0
0.5
1
1.5
2
2.5
3
pGL2
PG
HR
E 1 2 3 4 5 6 7 8 9 10 11 12 13 14 15 16 17 18 19 20 21 22 23 24 25 26 27 28 29 30 31 32 33 34 35 36 37 38 39 40 41 42 43 44 45 46 47 48 49 50 51 52 53 54 55 56 57 58 59 60 61 62 63 64 65 66 67 68 69 70 71 72 73 74 75 76 77 78 79 80 81 82 83 84 85 86 87 88 89 90 91 92 93 94 95 96 97 98 99 100
101
102
103
104
105
106
107
108
109
110
111
112
113
114
115
Constructs
Fold
Act
ivat
ion
6.5
Figure 4.2. Identification of STAT5-binding enhancers from a 170 kb chromosomal region containing IGF-I gene and 5’-flanking region. Shot-gun fragments of a 170 kb BAC insert composed of human IGF-I gene and 5’-flanking region were inserted upstream the SV40 promoter in pGL2P and the resultant plasmids (numbered 1 to 115) were cotransfected into MAC-T cells with the plasmid expressing the constitutively active STAT5a mutant STAT5a-N642H or with the empty vector (pMX). pGL2P and GHRE, a pGL2P plasmid containing 12 copies of STAT5-binding sites from the Spi 2.1 gene, were used as negative and positive controls, respectively. Variation in transfection efficiency was controlled by cotransfecting pRL-CMV plasmid that encodes the Renilla luciferase. The promoter activity of each reporter construct with pMX was set at 1 and the enhancement by STAT5a-N642H was expressed as fold activation. The values presented were from one transfection experiment except for pGL2P (mean of ten independent experiments), construct GHRE, and constructs #11, 43, 73, 74, and 94 (mean of three independent experiments). The dashed line indicates the level that is two times standard deviation above the mean value for pGL2P.
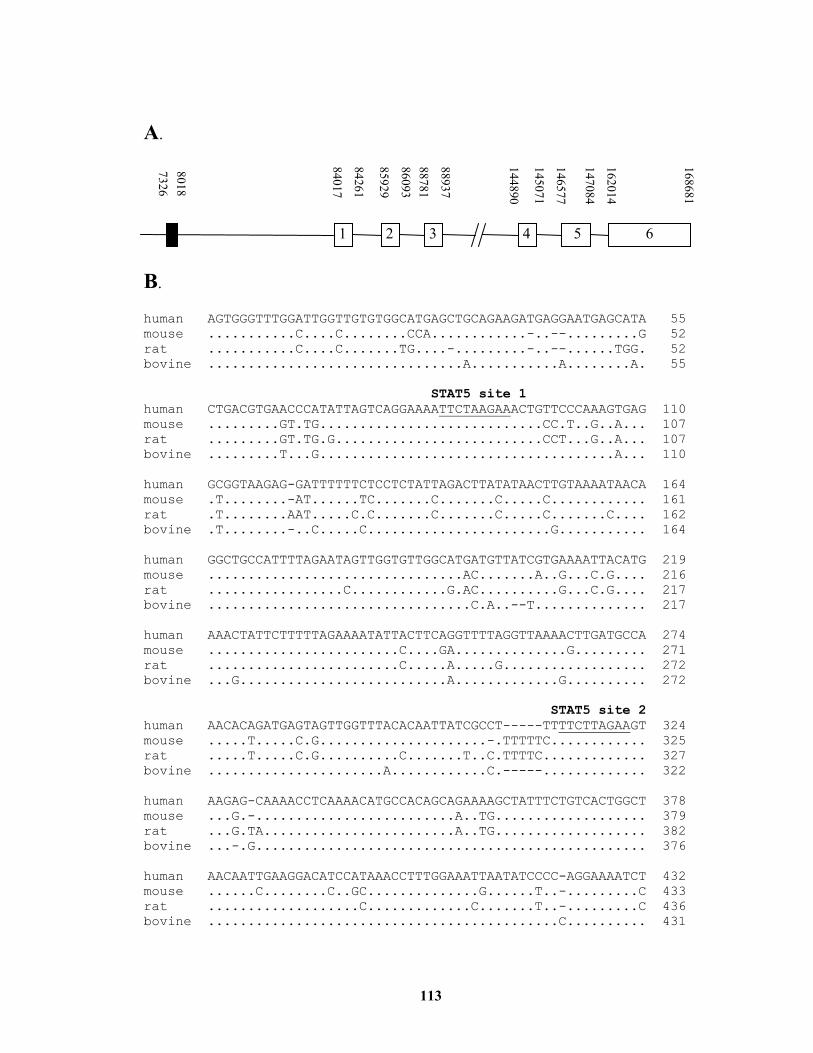
113
A.
B. human AGTGGGTTTGGATTGGTTGTGTGGCATGAGCTGCAGAAGATGAGGAATGAGCATA 55 mouse ...........C....C........CCA............-..--.........G 52 rat ...........C....C.......TG....-.........-..--......TGG. 52 bovine ................................A...........A........A. 55 STAT5 site 1 human CTGACGTGAACCCATATTAGTCAGGAAAATTCTAAGAAACTGTTCCCAAAGTGAG 110 mouse .........GT.TG............................CC.T..G..A... 107 rat .........GT.TG.G..........................CCT...G..A... 107 bovine .........T...G.....................................A... 110 human GCGGTAAGAG-GATTTTTTCTCCTCTATTAGACTTATATAACTTGTAAAATAACA 164 mouse .T........-AT......TC.......C.......C.....C............ 161 rat .T........AAT.....C.C.......C.......C.....C.......C.... 162 bovine .T........-..C.....C.......................G........... 164 human GGCTGCCATTTTAGAATAGTTGGTGTTGGCATGATGTTATCGTGAAAATTACATG 219 mouse ................................AC.......A..G...C.G.... 216 rat .................C............G.AC..........G...C.G.... 217 bovine .................................C.A..--T.............. 217 human AAACTATTCTTTTTAGAAAATATTACTTCAGGTTTTAGGTTAAAACTTGATGCCA 274 mouse ........................C....GA..............G......... 271 rat ........................C.....A.....G.................. 272 bovine ...G..........................A.............G.......... 272 STAT5 site 2 human AACACAGATGAGTAGTTGGTTTACACAATTATCGCCT-----TTTTCTTAGAAGT 324 mouse .....T.....C.G.....................-.TTTTTC............ 325 rat .....T.....C.G..........C.......T..C.TTTTC............. 327 bovine ......................A............C.-----............. 322 human AAGAG-CAAAACCTCAAAACATGCCACAGCAGAAAAGCTATTTCTGTCACTGGCT 378 mouse ...G.-.........................A..TG................... 379 rat ...G.TA........................A..TG................... 382 bovine ...-.G................................................. 376 human AACAATTGAAGGACATCCATAAACCTTTGGAAATTAATATCCCC-AGGAAAATCT 432 mouse ......C........C..GC..............G......T..-.........C 433 rat ...................C.............C.......T..-.........C 436 bovine ............................................C.......... 431
1 2 3 4 5 6
84017
84261
85929
8609388781
88937
145071
146577
147084
162014
144890
168681
8018 7326
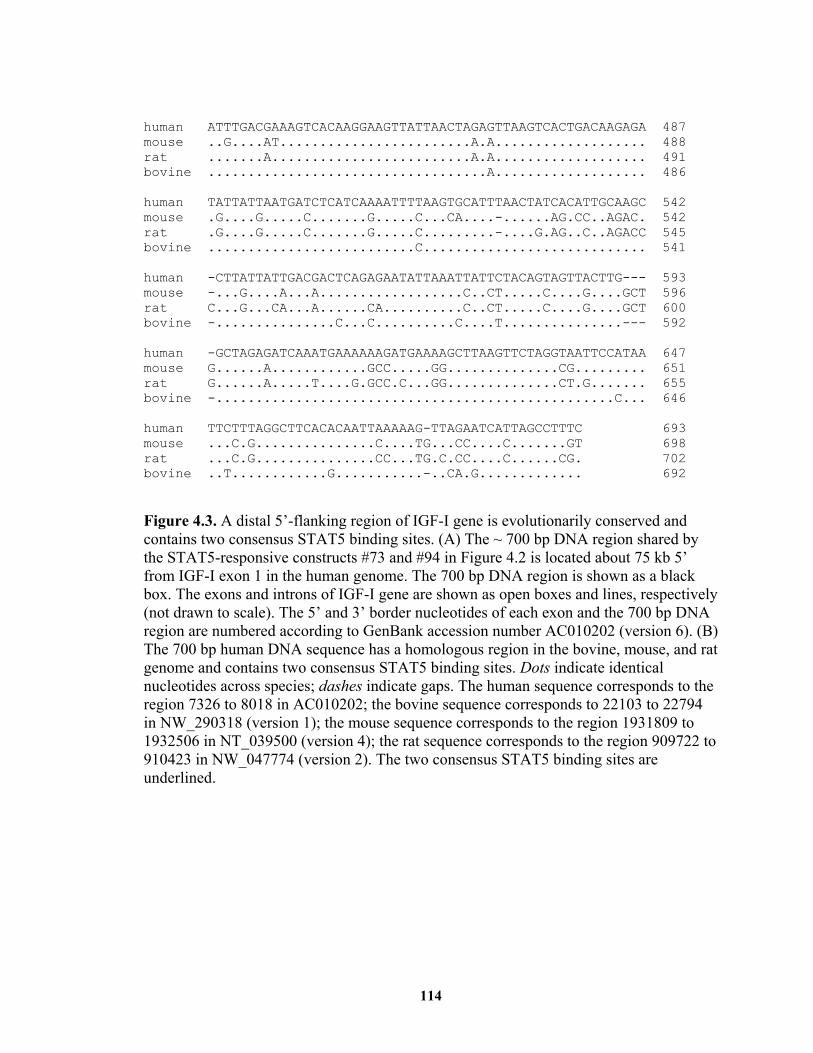
114
human ATTTGACGAAAGTCACAAGGAAGTTATTAACTAGAGTTAAGTCACTGACAAGAGA 487 mouse ..G....AT........................A.A................... 488 rat .......A.........................A.A................... 491 bovine ...................................A................... 486 human TATTATTAATGATCTCATCAAAATTTTAAGTGCATTTAACTATCACATTGCAAGC 542 mouse .G....G.....C.......G.....C...CA....-......AG.CC..AGAC. 542 rat .G....G.....C.......G.....C.........-....G.AG..C..AGACC 545 bovine ..........................C............................ 541 human -CTTATTATTGACGACTCAGAGAATATTAAATTATTCTACAGTAGTTACTTG--- 593 mouse -...G....A...A..................C..CT.....C....G....GCT 596 rat C...G...CA...A......CA..........C..CT.....C....G....GCT 600 bovine -...............C...C..........C....T...............--- 592 human -GCTAGAGATCAAATGAAAAAAGATGAAAAGCTTAAGTTCTAGGTAATTCCATAA 647 mouse G......A............GCC.....GG..............CG......... 651 rat G......A.....T....G.GCC.C...GG..............CT.G....... 655 bovine -..................................................C... 646 human TTCTTTAGGCTTCACACAATTAAAAAG-TTAGAATCATTAGCCTTTC 693 mouse ...C.G...............C....TG...CC....C.......GT 698 rat ...C.G...............CC...TG.C.CC....C......CG. 702 bovine ..T............G...........-..CA.G............. 692 Figure 4.3. A distal 5’-flanking region of IGF-I gene is evolutionarily conserved and contains two consensus STAT5 binding sites. (A) The ~ 700 bp DNA region shared by the STAT5-responsive constructs #73 and #94 in Figure 4.2 is located about 75 kb 5’ from IGF-I exon 1 in the human genome. The 700 bp DNA region is shown as a black box. The exons and introns of IGF-I gene are shown as open boxes and lines, respectively (not drawn to scale). The 5’ and 3’ border nucleotides of each exon and the 700 bp DNA region are numbered according to GenBank accession number AC010202 (version 6). (B) The 700 bp human DNA sequence has a homologous region in the bovine, mouse, and rat genome and contains two consensus STAT5 binding sites. Dots indicate identical nucleotides across species; dashes indicate gaps. The human sequence corresponds to the region 7326 to 8018 in AC010202; the bovine sequence corresponds to 22103 to 22794 in NW_290318 (version 1); the mouse sequence corresponds to the region 1931809 to 1932506 in NT_039500 (version 4); the rat sequence corresponds to the region 909722 to 910423 in NW_047774 (version 2). The two consensus STAT5 binding sites are underlined.
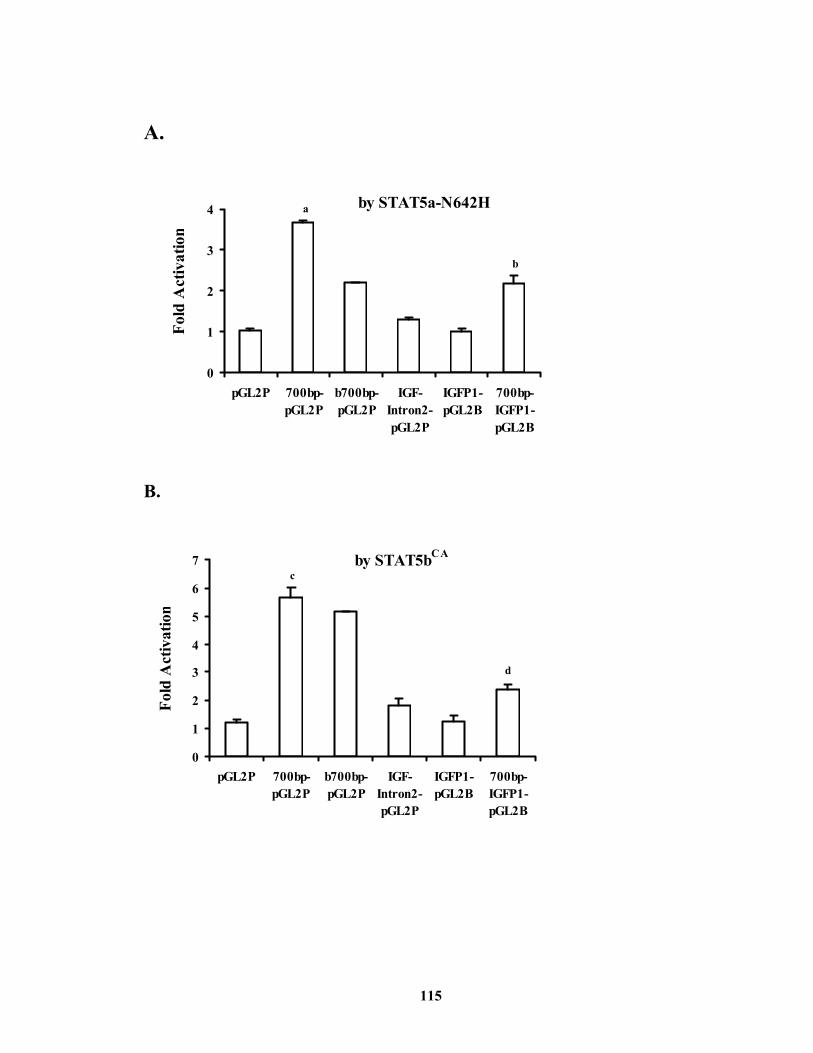
115
A.
by STAT5a-N642H
0
1
2
3
4
pGL2P 700bp-pGL2P
b700bp-pGL2P
IGF-Intron2-pGL2P
IGFP1-pGL2B
700bp-IGFP1-pGL2B
Fold
Act
ivat
ion
a
b
B.
by STAT5bCA
0
1
2
3
4
5
6
7
pGL2P 700bp-pGL2P
b700bp-pGL2P
IGF-Intron2-pGL2P
IGFP1-pGL2B
700bp-IGFP1-pGL2B
Fold
Act
ivat
ion
c
d
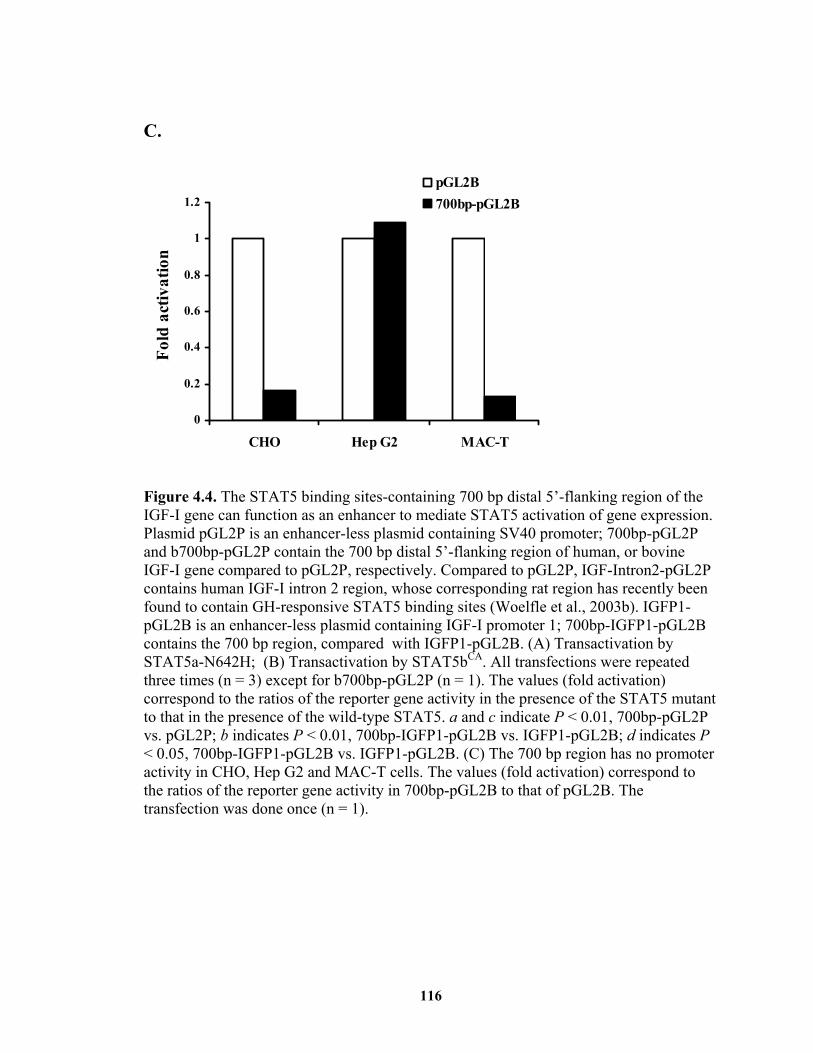
116
C.
0
0.2
0.4
0.6
0.8
1
1.2
CHO Hep G2 MAC-T
Fold
act
ivat
ion
pGL2B700bp-pGL2B
Figure 4.4. The STAT5 binding sites-containing 700 bp distal 5’-flanking region of the IGF-I gene can function as an enhancer to mediate STAT5 activation of gene expression. Plasmid pGL2P is an enhancer-less plasmid containing SV40 promoter; 700bp-pGL2P and b700bp-pGL2P contain the 700 bp distal 5’-flanking region of human, or bovine IGF-I gene compared to pGL2P, respectively. Compared to pGL2P, IGF-Intron2-pGL2P contains human IGF-I intron 2 region, whose corresponding rat region has recently been found to contain GH-responsive STAT5 binding sites (Woelfle et al., 2003b). IGFP1-pGL2B is an enhancer-less plasmid containing IGF-I promoter 1; 700bp-IGFP1-pGL2B contains the 700 bp region, compared with IGFP1-pGL2B. (A) Transactivation by STAT5a-N642H; (B) Transactivation by STAT5bCA. All transfections were repeated three times (n = 3) except for b700bp-pGL2P (n = 1). The values (fold activation) correspond to the ratios of the reporter gene activity in the presence of the STAT5 mutant to that in the presence of the wild-type STAT5. a and c indicate P < 0.01, 700bp-pGL2P vs. pGL2P; b indicates P < 0.01, 700bp-IGFP1-pGL2B vs. IGFP1-pGL2B; d indicates P < 0.05, 700bp-IGFP1-pGL2B vs. IGFP1-pGL2B. (C) The 700 bp region has no promoter activity in CHO, Hep G2 and MAC-T cells. The values (fold activation) correspond to the ratios of the reporter gene activity in 700bp-pGL2B to that of pGL2B. The transfection was done once (n = 1).
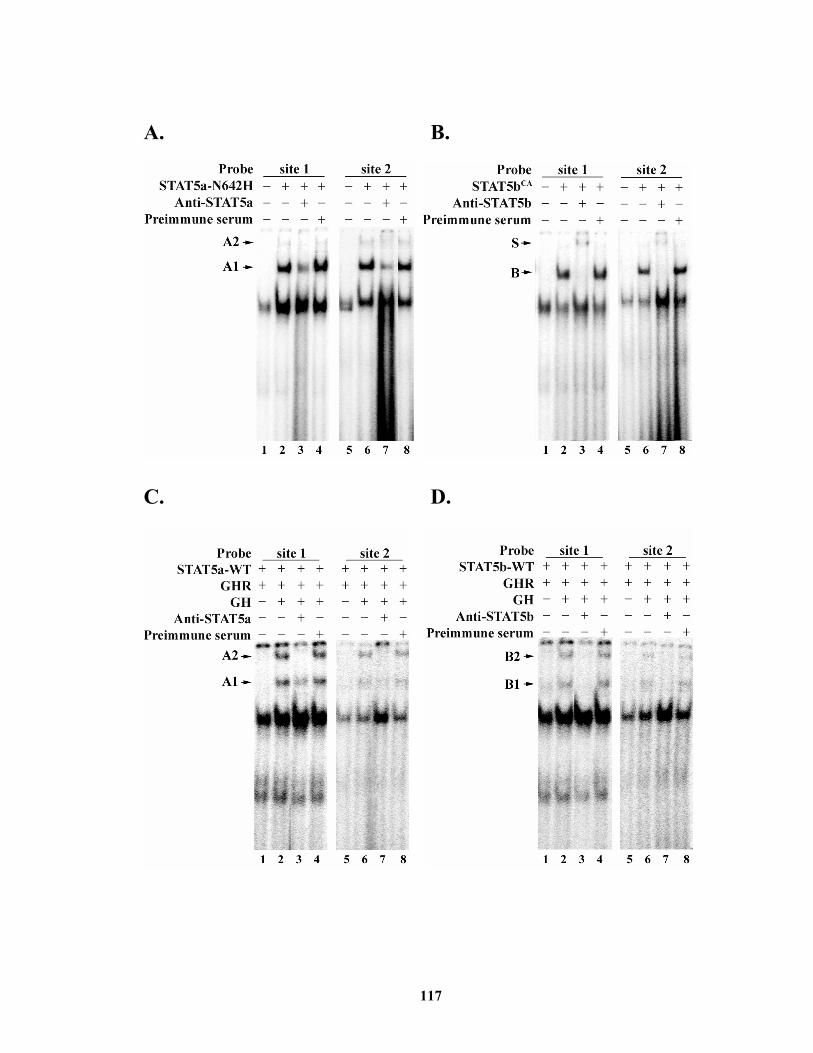
117
A. B.
C. D.
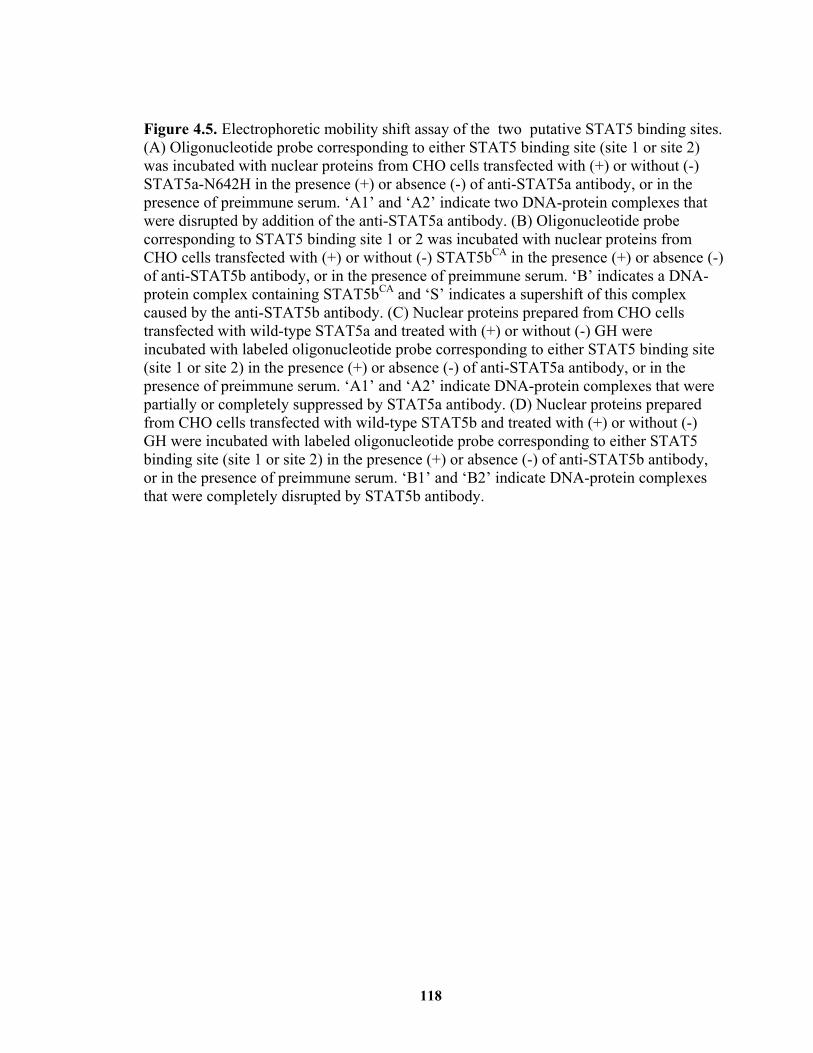
118
Figure 4.5. Electrophoretic mobility shift assay of the two putative STAT5 binding sites. (A) Oligonucleotide probe corresponding to either STAT5 binding site (site 1 or site 2) was incubated with nuclear proteins from CHO cells transfected with (+) or without (-) STAT5a-N642H in the presence (+) or absence (-) of anti-STAT5a antibody, or in the presence of preimmune serum. ‘A1’ and ‘A2’ indicate two DNA-protein complexes that were disrupted by addition of the anti-STAT5a antibody. (B) Oligonucleotide probe corresponding to STAT5 binding site 1 or 2 was incubated with nuclear proteins from CHO cells transfected with (+) or without (-) STAT5bCA in the presence (+) or absence (-) of anti-STAT5b antibody, or in the presence of preimmune serum. ‘B’ indicates a DNA-protein complex containing STAT5bCA and ‘S’ indicates a supershift of this complex caused by the anti-STAT5b antibody. (C) Nuclear proteins prepared from CHO cells transfected with wild-type STAT5a and treated with (+) or without (-) GH were incubated with labeled oligonucleotide probe corresponding to either STAT5 binding site (site 1 or site 2) in the presence (+) or absence (-) of anti-STAT5a antibody, or in the presence of preimmune serum. ‘A1’ and ‘A2’ indicate DNA-protein complexes that were partially or completely suppressed by STAT5a antibody. (D) Nuclear proteins prepared from CHO cells transfected with wild-type STAT5b and treated with (+) or without (-) GH were incubated with labeled oligonucleotide probe corresponding to either STAT5 binding site (site 1 or site 2) in the presence (+) or absence (-) of anti-STAT5b antibody, or in the presence of preimmune serum. ‘B1’ and ‘B2’ indicate DNA-protein complexes that were completely disrupted by STAT5b antibody.
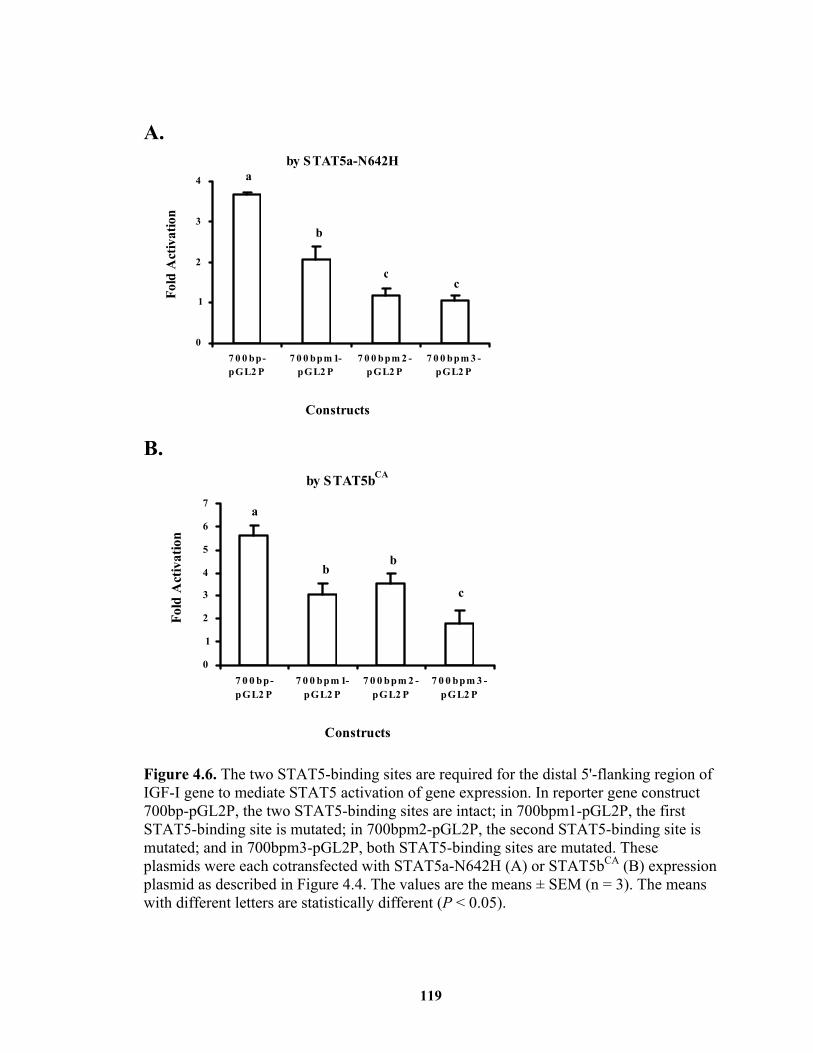
119
A. by STAT5a-N642H
0
1
2
3
4
7 0 0 bp-pGL2 P
7 0 0 bpm 1-pGL2 P
7 0 0 bpm 2 -pGL2 P
7 0 0 bpm 3 -pGL2 P
Constructs
Fold
Act
ivat
ion
b
cc
a
B. by STAT5bCA
0
1
2
3
4
5
6
7
7 0 0 bp-pGL2 P
7 0 0 bpm 1-pGL2 P
7 0 0 bpm 2 -pGL2 P
7 0 0 bpm 3 -pGL2 P
Constructs
Fold
Act
ivat
ion
b
c
a
b
Figure 4.6. The two STAT5-binding sites are required for the distal 5'-flanking region of IGF-I gene to mediate STAT5 activation of gene expression. In reporter gene construct 700bp-pGL2P, the two STAT5-binding sites are intact; in 700bpm1-pGL2P, the first STAT5-binding site is mutated; in 700bpm2-pGL2P, the second STAT5-binding site is mutated; and in 700bpm3-pGL2P, both STAT5-binding sites are mutated. These plasmids were each cotransfected with STAT5a-N642H (A) or STAT5bCA (B) expression plasmid as described in Figure 4.4. The values are the means ± SEM (n = 3). The means with different letters are statistically different (P < 0.05).
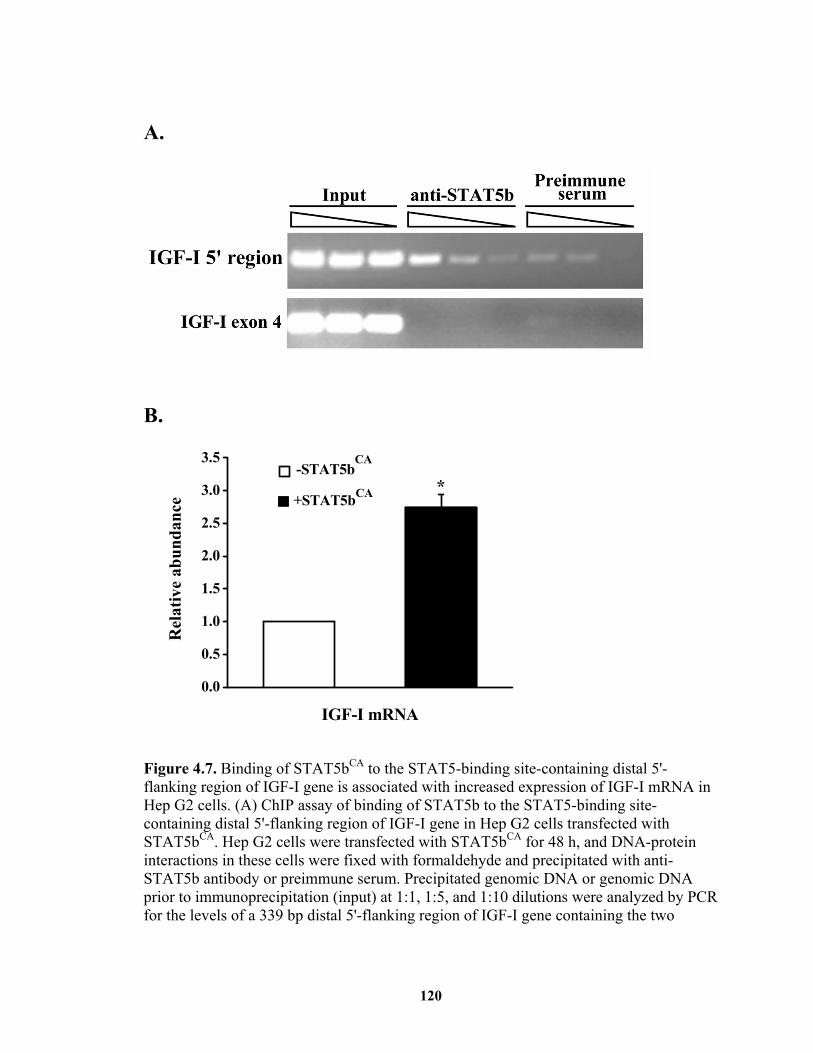
120
A.
B.
0.0
0.5
1.0
1.5
2.0
2.5
3.0
3.5
+STAT5bCA
Rel
ativ
e ab
unda
nce
IGF-I mRNA
*-STAT5b
CA
Figure 4.7. Binding of STAT5bCA to the STAT5-binding site-containing distal 5'-flanking region of IGF-I gene is associated with increased expression of IGF-I mRNA in Hep G2 cells. (A) ChIP assay of binding of STAT5b to the STAT5-binding site-containing distal 5'-flanking region of IGF-I gene in Hep G2 cells transfected with STAT5bCA. Hep G2 cells were transfected with STAT5bCA for 48 h, and DNA-protein interactions in these cells were fixed with formaldehyde and precipitated with anti-STAT5b antibody or preimmune serum. Precipitated genomic DNA or genomic DNA prior to immunoprecipitation (input) at 1:1, 1:5, and 1:10 dilutions were analyzed by PCR for the levels of a 339 bp distal 5'-flanking region of IGF-I gene containing the two
121
STAT5-binding sites and a 182 bp region corresponding to IGF-I exon 4, denoted IGF-I 5' region and IGF-I exon 4, respectively. (B) Real time PCR of IGF-I mRNA in Hep G2 cells transfected with STAT5bCA or untransfected Hep G2 cells. The real time PCR was performed using TaqMan Gene Expression Assays for human IGF-I and GAPDH mRNA from ABI on ABI 7300 real time PCR System. The values are the means ± SEM (n = 3) after normalization to GAPDH mRNA levels (internal control). *, P < 0.05, + STAT5bCA versus – STAT5bCA.
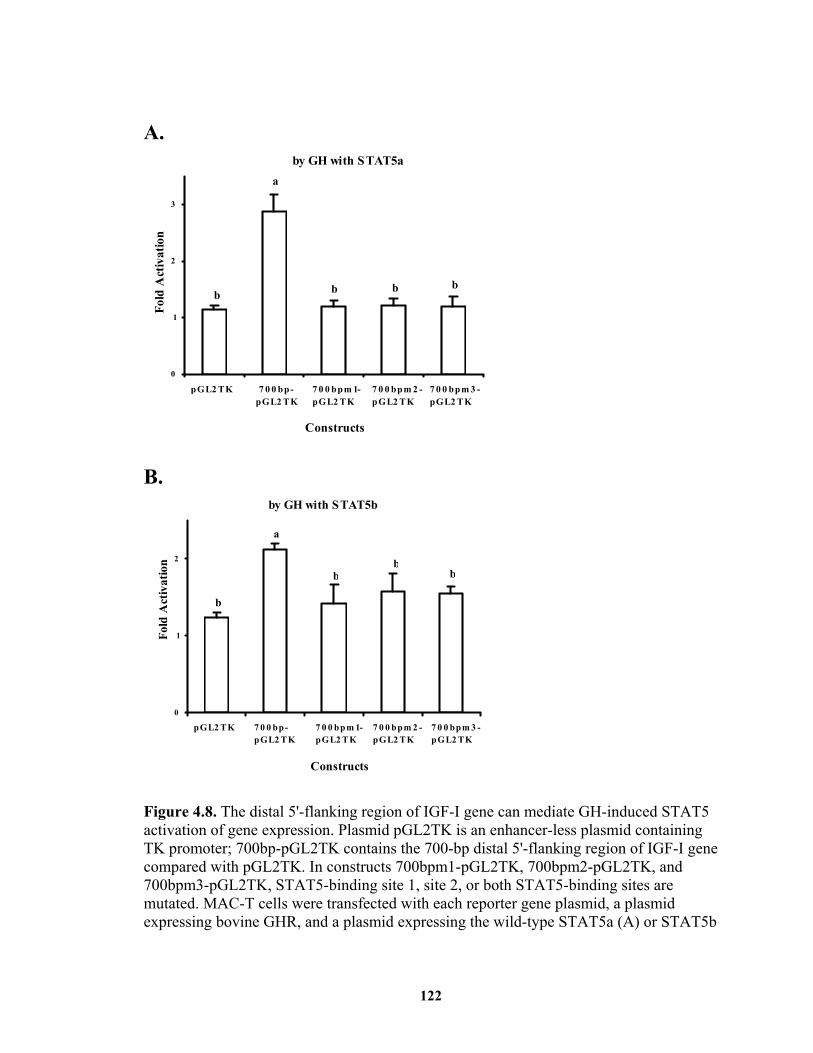
122
A. by GH with STAT5a
0
1
2
3
Constructs
Fold
Act
ivat
ion
a
bbbb
pGL2 TK 7 0 0 bp-pGL2 TK
7 0 0 bpm 1-pGL2 TK
7 0 0 bpm 2 -pGL2 TK
7 0 0 bpm 3 -pGL2 TK
B.
by GH with STAT5b
0
1
2
Constructs
Fold
Act
ivat
ion
a
bb
b
b
pGL2 TK 7 0 0 bp-pGL2 TK
7 0 0 bpm 1-pGL2 TK
7 0 0 bpm 2 -pGL2 TK
7 0 0 bpm 3 -pGL2 TK
Figure 4.8. The distal 5'-flanking region of IGF-I gene can mediate GH-induced STAT5 activation of gene expression. Plasmid pGL2TK is an enhancer-less plasmid containing TK promoter; 700bp-pGL2TK contains the 700-bp distal 5'-flanking region of IGF-I gene compared with pGL2TK. In constructs 700bpm1-pGL2TK, 700bpm2-pGL2TK, and 700bpm3-pGL2TK, STAT5-binding site 1, site 2, or both STAT5-binding sites are mutated. MAC-T cells were transfected with each reporter gene plasmid, a plasmid expressing bovine GHR, and a plasmid expressing the wild-type STAT5a (A) or STAT5b
123
(B). Twenty-four h after transfection, the cells were serum-starved for 16 h, followed by GH or vehicle treatment for 8 h before dual luciferase assay. The values are expressed as the means ± SEM (n = 3). The means with different letters are statistically different (P < 0.05).
124
Conclusions
The IGF-I gene plays as an important role in growth, development and
metabolism in mammals including cattle. This dissertation research shed some light on
how the IGF-I gene is expressed and how IGF-I gene expression is regulated by GH and
nutritional intake in cattle, an agriculturally important species. Based on this research, the
bovine IGF-I gene is expressed as class 1 and class 2 IGF-I mRNA variants in many
tissues; class 1 IGF-I mRNA is more abundant and probably translated more efficiently
than class 2 IGF-I mRNA in a given tissue. These characteristics of IGF-I gene
expression in cattle are similar to those in other mammals. The research also indicates
that in cattle GH stimulates a greater increase in class 2 IGF-I mRNA than in class 1 IGF-
I mRNA in the liver, whereas food deprivation causes equivalent decreases in them. This
subtle difference between the effect of GH and that of food deprivation on IGF-I gene
expression may suggest that the latter effect is not solely mediated by GH resistance, as
widely believed by the field. Therefore, future investigation of the mechanism of
nutritional regulation of IGF-I gene expression should extend beyond the effect of
nutritional status on GH receptor signaling.
The major finding of this dissertation research is the identification of a distal 5’-
flanking region of the IGF-I gene as a potential enhancer that mediates GH-induced
STAT5 activation of IGF-I gene expression, based on a variety of in vitro studies and the
apparently evolutionary conservation of the sequence of the DNA region. While this
dissertation is under revision, an electronic publication (Chia et al., 2005) by Rotwein’s
group in collaboration with our lab presented evidence that the corresponding DNA
125
region in the rat liver was bound by STAT5b in response to GH. Therefore, the distal 5’-
flanking region of the IGF-I gene identified in this research likely plays an important role
in mediating GH regulation of IGF-I gene expression in animals, including cattle. Given
the role of this DNA region in binding to GH-induced STAT5 protein, it is possible that
the cattle that do not bear the right sequence for this DNA region may produce less IGF-I
in response to GH action and hence less meat or milk than the cattle containing the right
sequence. We recommend that breeding cattle be screened for whether they contain the
right sequence for this DNA region.
126
Literature Cited Adamo, M. L., H. Ben-Hur, D. LeRoith, and C. T. Roberts, Jr. 1991a. Transcription
initiation in the two leader exons of the rat IGF-I gene occurs from disperse versus localized sites. Biochem. Biophys. Res. Commun. 176: 887-893.
Adamo, M. L., H. Ben-Hur, C. T. Roberts, Jr., and D. LeRoith. 1991b. Regulation of start
site usage in the leader exons of the rat insulin-like growth factor-I gene by development, fasting, and diabetes. Mol. Endocrinol. 5: 1677-1686.
Adamo, M., W. L. Lowe, Jr., D. LeRoith, and C. T. Roberts, Jr. 1989. Insulin-like growth
factor I messenger ribonucleic acids with alternative 5'-untranslated regions are differentially expressed during development of the rat. Endocrinology 124: 2737-2744.
Adesanya, O. O., J. Zhou, C. Samathanam, L. Powell-Braxton, and C. A. Bondy. 1999.
Insulin-like growth factor 1 is required for G2 progression in the estradiol-induced mitotic cycle. Proc. Natl. Acad. Sci. U. S. A. 96: 3287-3291.
Ahmad, S., N. Singh, and R. I. Glazer. 1999. Role of AKT1 in 17beta-estradiol- and
insulin-like growth factor I (IGF-I)-dependent proliferation and prevention of apoptosis in MCF-7 breast carcinoma cells. Biochem. Pharmacol. 58: 425-430.
Alexia, C., M. Lasfer, and A. Groyer. 2004. Role of constitutively activated and insulin-
like growth factor-stimulated ERK1/2 signaling in human hepatoma cell proliferation and apoptosis: evidence for heterogeneity of tumor cell lines. Ann. N. Y. Acad. Sci. 1030: 219-229.
An, M. R., and W. L. Lowe, Jr. 1995. The major promoter of the rat insulin-like growth
factor-I gene binds a protein complex that is required for basal expression. Mol. Cell. Endocrinol. 114: 77-89.
Andersson, I., H. Billig, L. Fryklund, H. A. Hansson, O. Isaksson, J. Isgaard, A. Nilsson,
B. Rozell, A. Skottner, and S. Stemme. 1986. Localization of IGF-I in adult rats. Immunohistochemical studies. Acta Physiol. Scand. 126: 311-312.
Antoniades, H. N., P. M. Beigelman, R. B. Pennell, G. W. Thorn, and J. L. Oncley. 1958.
Insulin-like activity of human plasma constituents. III. Elution of insulin-like activity from cationic exchange resins. Metabolism 7: 266-268.
Aran, A., H. Cassuto, and L. Reshef. 1995. Cooperation between transcription factors
regulates liver development. Biol. Neonate 67: 387-396.
127
Argente, J., V. Barrios, J. Pozo, M. T. Munoz, F. Hervas, M. Stene, and M. Hernandez. 1993. Normative data for insulin-like growth factors (IGFs), IGF-binding proteins, and growth hormone-binding protein in a healthy Spanish pediatric population: age- and sex-related changes. J. Clin. Endocrinol. Metab. 77: 1522-1528.
Ariyoshi, K., T. Nosaka, K. Yamada, M. Onishi, Y. Oka, A. Miyajima, and T. Kitamura.
2000. Constitutive activation of STAT5 by a point mutation in the SH2 domain. J. Biol. Chem. 275: 24407-24413.
Ausubel, F. M., R. Brent, R. E. Kingston, D. D. Moore, J. G. Seidman, J. A. Smith, and K.
Stouhl. 1994. Page 12·0·1-12·4·11 in Current Protocols in Molecular Biology. John Wiley & Sons Inc., New York, NY.
Ayson, F. G., E. G. de Jesus, S. Moriyama, S. Hyodo, B. Funkenstein, A. Gertler, and H.
Kawauchi. 2002. Differential expression of insulin-like growth factor I and II mRNAs during embryogenesis and early larval development in rabbitfish, Siganus guttatus. Gen. Comp. Endocrinol. 126: 165-174.
Bach, M. A., C. T. Roberts, Jr., E. P. Smith, and D. LeRoith. 1990. Alternative splicing
produces messenger RNAs encoding insulin-like growth factor-I prohormones that are differentially glycosylated in vitro. Mol. Endocrinol. 4: 899-904.
Bach, M. A., Z. Shen-Orr, W. L. Lowe, Jr., C. T. Roberts, Jr., and D. LeRoith. 1991.
Insulin-like growth factor I mRNA levels are developmentally regulated in specific regions of the rat brain. Brain Res. Mol. Brain Res. 10: 43-48.
Backeljauw, P. F., and L. E. Underwood. 1996. Prolonged treatment with recombinant
insulin-like growth factor-I in children with growth hormone insensitivity syndrome--a clinical research center study. GHIS Collaborative Group. J. Clin. Endocrinol. Metab. 81: 3312-3317.
Baker, J., M. P. Hardy, J. Zhou, C. Bondy, F. Lupu, A. R. Bellve, and A. Efstratiadis.
1996. Effects of an Igf1 gene null mutation on mouse reproduction. Mol. Endocrinol. 10: 903-918.
Baker, J., J. P. Liu, E. J. Robertson, and A. Efstratiadis. 1993. Role of insulin-like growth
factors in embryonic and postnatal growth. Cell 75: 73-82. Ballard, F. J., S. E. Knowles, P. E. Walton, K. Edson, P. C. Owens, M. A. Mohler, and B.
L. Ferraiolo. 1991. Plasma clearance and tissue distribution of labelled insulin-like growth factor-I (IGF-I), IGF-II and des(1-3)IGF-I in rats. J. Endocrinol. 128: 197-204.
128
Bar, R. S., D. R. Clemmons, M. Boes, W. H. Busby, B. A. Booth, B. L. Dake, and A. Sandra. 1990. Transcapillary permeability and subendothelial distribution of endothelial and amniotic fluid insulin-like growth factor binding proteins in the rat heart. Endocrinology 127: 1078-1086.
Baxter, R. C., M. A. Binoux, D. R. Clemmons, C. A. Conover, S. L. Drop, J. M. Holly, S.
Mohan, Y. Oh, and R. G. Rosenfeld. 1998. Recommendations for nomenclature of the insulin-like growth factor binding protein superfamily. Endocrinology 139: 4036.
Baxter, R. C., and J. L. Martin. 1989. Structure of the Mr 140,000 growth hormone-
dependent insulin-like growth factor binding protein complex: determination by reconstitution and affinity-labeling. Proc. Natl. Acad. Sci. U. S. A. 86: 6898-6902.
Bayne, M. L., J. Applebaum, G. G. Chicchi, R. E. Miller, and M. A. Cascieri. 1990. The
roles of tyrosines 24, 31, and 60 in the high affinity binding of insulin-like growth factor-I to the type 1 insulin-like growth factor receptor. J. Biol. Chem. 265: 15648-15652.
Beauloye, V., B. Willems, V. de Coninck, S. J. Frank, M. Edery, and J. P. Thissen. 2002.
Impairment of liver GH receptor signaling by fasting. Endocrinology 143: 792-800.
Bell, G. I., M. M. Stempien, N. M. Fong, and L. B. Rall. 1986. Sequences of liver cDNAs
encoding two different mouse insulin-like growth factor I precursors. Nucleic Acids Res. 14: 7873-7882.
Bell, G. I., M. M. Stempien, N. M. Fong, and S. Seino. 1990. Sequence of a cDNA
encoding guinea pig IGF-I. Nucleic Acids Res. 18: 4275. Benbassat, C., L. N. Shoba, M. Newman, M. L. Adamo, S. J. Frank, and W. L. Lowe, Jr.
1999. Growth hormone-mediated regulation of insulin-like growth factor I promoter activity in C6 glioma cells. Endocrinology 140: 3073-3081.
Benvenisty, N., and L. Reshef. 1991. Regulation of tissue- and development-specific
gene expression in the liver. Biol. Neonate 59: 181-189. Bichell, D. P., K. Kikuchi, and P. Rotwein. 1992. Growth hormone rapidly activates
insulin-like growth factor I gene transcription in vivo. Mol. Endocrinol. 6: 1899-1908.
Blackwood, E. M., and J. T. Kadonaga. 1998. Going the distance: a current view of
enhancer action. Science 281: 60-63.
129
Bondarenko, V. A., Y. V. Liu, Y. I. Jiang, and V. M. Studitsky. 2003. Communication over a large distance: enhancers and insulators. Biochem. Cell Biol. 81: 241-251.
Bonifer, C. 1999. Long-distance chromatin mechanisms controlling tissue-specific gene
locus activation. Gene 238: 277-289. Boulware, S. D., W. V. Tamborlane, L. S. Matthews, and R. S. Sherwin. 1992. Diverse
effects of insulin-like growth factor I on glucose, lipid, and amino acid metabolism. Am. J. Physiol. 262: E130-133.
Bourdeau, V., J. Deschenes, R. Metivier, Y. Nagai, D. Nguyen, N. Bretschneider, F.
Gannon, J. H. White, and S. Mader. 2004. Genome-wide identification of high-affinity estrogen response elements in human and mouse. Mol. Endocrinol. 18: 1411-1427.
Brewer, M. T., G. L. Stetler, C. H. Squires, R. C. Thompson, W. H. Busby, and D. R.
Clemmons. 1988. Cloning, characterization, and expression of a human insulin-like growth factor binding protein. Biochem. Biophys. Res. Commun. 152: 1289-1297.
Brooks, P. C., R. L. Klemke, S. Schon, J. M. Lewis, M. A. Schwartz, and D. A. Cheresh.
1997. Insulin-like growth factor receptor cooperates with integrin alpha v beta 5 to promote tumor cell dissemination in vivo. J. Clin. Invest. 99: 1390-1398.
Bucci, C., P. Mallucci, C. T. Roberts, R. Frunzio, and C. B. Bruni. 1989. Nucleotide
sequence of a genomic fragment of the rat IGF-I gene spanning an alternate 5' non coding exon. Nucleic Acids Res 17: 3596.
Buonomo, F. C., and C. A. Baile. 1991. Influence of nutritional deprivation on insulin-
like growth factor I, somatotropin, and metabolic hormones in swine. J. Anim. Sci. 69: 755-760.
Burnside, J., and L. A. Cogburn. 1992. Developmental expression of hepatic growth
hormone receptor and insulin-like growth factor-I mRNA in the chicken. Mol. Cell. Endocrinol. 89: 91-96.
Busby, W. H., Jr., D. G. Klapper, and D. R. Clemmons. 1988. Purification of a 31,000-
dalton insulin-like growth factor binding protein from human amniotic fluid. Isolation of two forms with different biologic actions. J. Biol. Chem. 263: 14203-14210.
Calhoun, V. C., and M. Levine. 2003. Long-range enhancer-promoter interactions in the
Scr-Antp interval of the Drosophila Antennapedia complex. Proc. Natl. Acad. Sci. U. S. A. 100: 9878-9883.
130
Calikoglu, A., A. Karayal, and A. D'Ercole. 2001. Nutritional regulation of IGF-I expression during brain development in mice. Pediatr. Res. 49: 197-202.
Cano, A., C. Castelo-Branco, and J. J. Tarin. 1999. Effect of menopause and different
combined estradiol-progestin regimens on basal and growth hormone-releasing hormone-stimulated serum growth hormone, insulin-like growth factor-1, insulin-like growth factor binding protein (IGFBP)-1, and IGFBP-3 levels. Fertil. Steril. 71: 261-267.
Cao, Y., M. R. Baig, L. L. Hamm, K. Wu, and E. E. Simon. 2005. Growth factors
stimulate kidney proximal tubule cell migration independent of augmented tyrosine phosphorylation of focal adhesion kinase. Biochem. Biophys. Res. Commun. 328: 560-566.
Carlsson-Skwirut, C., M. Lake, M. Hartmanis, K. Hall, and V. R. Sara. 1989. A
comparison of the biological activity of the recombinant intact and truncated insulin-like growth factor 1 (IGF-1). Biochim. Biophys. Acta 1011: 192-197.
Carro, E., J. L. Trejo, T. Gomez-Isla, D. LeRoith, and I. Torres-Aleman. 2002. Serum
insulin-like growth factor I regulates brain amyloid-beta levels. Nat. Med. 8: 1390-1397.
Carter, D., L. Chakalova, C. S. Osborne, Y. F. Dai, and P. Fraser. 2002. Long-range
chromatin regulatory interactions in vivo. Nat. Genet. 32: 623-626. Chacko, M. S., and M. L. Adamo. 2000. Double-stranded ribonucleic acid decreases C6
rat glioma cell numbers: effects on insulin-like growth factor I gene expression and action. Endocrinology 141: 3546-3555.
Chen, M. J., P. P. Chiou, B. Y. Yang, H. C. Lo, J. K. Son, J. Hendricks, G. Bailey, and T.
T. Chen. 2004. Development of rainbow trout hepatoma cell lines: effect of pro-IGF-I Ea4-peptide on morphological changes and anchorage-independent growth. In Vitro Cell. Dev. Biol. Anim. 40: 118-128.
Chen, M. H., G. Lin, H. Gong, C. Weng, C. Chang, and J. Wu. 2001. The
characterization of prepro-insulin-like growth factor-1 Ea-2 expression and insulin-like growth factor-1 genes (devoid 81 bp) in the zebrafish (Danio rerio). Gene 268: 67-75.
Chew, S. L., P. Lavender, A. J. Clark, and R. J. Ross. 1995. An alternatively spliced
human insulin-like growth factor-I transcript with hepatic tissue expression that diverts away from the mitogenic IBE1 peptide. Endocrinology 136: 1939-1944.
131
Chia, D. J., M. Ono, J. Woelfle, M. Schlessinger-Massart, H. Jiang, and P. Rotwein. 2005. Characterization of distinct stat5B binding sites that mediate growth hormone-stimulated IGF-I gene transcription. J. Biol. Chem.
Clark, R., J. Strasser, S. McCabe, K. Robbins, and P. Jardieu. 1993. Insulin-like growth
factor-1 stimulation of lymphopoiesis. J. Clin. Invest. 92: 540-548. Clemmons, D. R., A. Klibanski, L. E. Underwood, J. W. McArthur, E. C. Ridgway, I. Z.
Beitins, and J. J. Van Wyk. 1981. Reduction of plasma immunoreactive somatomedin C during fasting in humans. J. Clin. Endocrinol. Metab. 53: 1247-1250.
Clemmons, D. R., M. M. Seek, and L. E. Underwood. 1985. Supplemental essential
amino acids augment the somatomedin-C/insulin-like growth factor I response to refeeding after fasting. Metabolism. 34: 391-395.
Cohick, W. S. 1998. Role of the insulin-like growth factors and their binding proteins in
lactation. J. Dairy Sci. 81: 1769-1777. Coleman, M. E., F. DeMayo, K. C. Yin, H. M. Lee, R. Geske, C. Montgomery, and R. J.
Schwartz. 1995. Myogenic vector expression of insulin-like growth factor I stimulates muscle cell differentiation and myofiber hypertrophy in transgenic mice. J. Biol. Chem. 270: 12109-12116.
Cooper, G. M., and A. Sidow. 2003. Genomic regulatory regions: insights from
comparative sequence analysis. Curr. Opin. Genet. Dev. 13: 604-610. D'Ercole, A. J., G. T. Applewhite, and L. E. Underwood. 1980. Evidence that
somatomedin is synthesized by multiple tissues in the fetus. Dev. Biol. 75: 315-328.
D'Ercole, A. J., A. D. Stiles, and L. E. Underwood. 1984. Tissue concentrations of
somatomedin C: further evidence for multiple sites of synthesis and paracrine or autocrine mechanisms of action. Proc. Natl. Acad. Sci. U. S. A. 81: 935-939.
Daughaday, W. H., and C. Reeder. 1966. Synchronous activation of DNA synthesis in
hypophysectomized rat cartilage by growth hormone. J. Lab. Clin. Med. 68: 357-368.
Daughaday, W. H., and P. Rotwein. 1989. Insulin-like growth factors I and II. Peptide,
messenger ribonucleic acid and gene structures, serum, and tissue concentrations. Endocr. Rev. 10: 68-91.
132
Dauncey, M. J., P. White, K. A. Burton, and M. Katsumata. 2001. Nutrition-hormone receptor-gene interactions: implications for development and disease. Proc. Nutr. Soc. 60: 63-72.
Davenport, M. L., A. J. D'Ercole, J. C. Azizkhan, and P. K. Lund. 1988. Somatomedin-
C/insulinlike growth factor I (Sm-C/IGF-I) and insulinlike growth factor II (IGF-II) mRNAs during lung development in the rat. Exp. Lung Res. 14: 607-618.
Davenport, M. L., A. J. D'Ercole, and L. E. Underwood. 1990. Effect of maternal fasting
on fetal growth, serum insulin-like growth factors (IGFs), and tissue IGF messenger ribonucleic acids. Endocrinology 126: 2062-2067.
Davenport, M. L., W. L. Isley, J. B. Pucilowska, L. B. Pemberton, B. Lyman, L. E.
Underwood, and D. R. Clemmons. 1992. Insulin-like growth factor-binding protein-3 proteolysis is induced after elective surgery. J. Clin. Endocrinol. Metab. 75: 590-595.
Davey, H. W., T. Xie, M. J. McLachlan, R. J. Wilkins, D. J. Waxman, and D. R. Grattan.
2001. STAT5b is required for GH-induced liver IGF-I gene expression. Endocrinology 142: 3836-3841.
Dawson-Hughes, B., D. Stern, J. Goldman, and S. Reichlin. 1986. Regulation of growth
hormone and somatomedin-C secretion in postmenopausal women: effect of physiological estrogen replacement. J. Clin. Endocrinol. Metab. 63: 424-432.
Dean, J. L., G. Sully, A. R. Clark, and J. Saklatvala. 2004. The involvement of AU-rich
element-binding proteins in p38 mitogen-activated protein kinase pathway-mediated mRNA stabilisation. Cell. Signal. 16: 1113-1121.
Decker, T., P. Kovarik, and A. Meinke. 1997. GAS elements: a few nucleotides with a
major impact on cytokine-induced gene expression. J. Interferon Cytokine Res. 17: 121-134.
Delaughter, M. C., G. E. Taffet, M. L. Fiorotto, M. L. Entman, and R. J. Schwartz. 1999.
Local insulin-like growth factor I expression induces physiologic, then pathologic, cardiac hypertrophy in transgenic mice. FASEB J. 13: 1923-1929.
Dickson, M. C., J. C. Saunders, and R. S. Gilmour. 1991. The ovine insulin-like growth
factor-I gene: characterization, expression and identification of a putative promoter. J. Mol. Endocrinol. 6: 17-31.
Dimitriadis, G., M. Parry-Billings, S. Bevan, D. Dunger, T. Piva, U. Krause, G. Wegener,
and E. A. Newsholme. 1992. Effects of insulin-like growth factor I on the rates of
133
glucose transport and utilization in rat skeletal muscle in vitro. Biochem. J. 285: 269-274.
Doglio, A., C. Dani, G. Fredrikson, P. Grimaldi, and G. Ailhaud. 1987. Acute regulation
of insulin-like growth factor-I gene expression by growth hormone during adipose cell differentiation. EMBO J. 6: 4011-4016.
Doherty, A. S., G. L. Temeles, and R. M. Schultz. 1994. Temporal pattern of IGF-I
expression during mouse preimplantation embryogenesis. Mol. Reprod. Dev. 37: 21-26.
Duursma, S. A., J. W. Bijlsma, H. C. Van Paassen, S. C. van Buul-Offers, and A.
Skottner-Lundin. 1984. Changes in serum somatomedin and growth hormone concentrations after 3 weeks oestrogen substitution in post-menopausal women; a pilot study. Acta Endocrinol. (Copenh). 106: 527-531.
Ehret, G. B., P. Reichenbach, U. Schindler, C. M. Horvath, S. Fritz, M. Nabholz, and P.
Bucher. 2001. DNA binding specificity of different STAT proteins. Comparison of in vitro specificity with natural target sites. J. Biol. Chem. 276: 6675-6688.
Emler, C. A., and D. S. Schalch. 1987. Nutritionally-induced changes in hepatic insulin-
like growth factor I (IGF-I) gene expression in rats. Endocrinology 120: 832-834. Evans, R. M. 1988. The steroid and thyroid hormone receptor superfamily. Science 240:
889-895. Ewton, D. Z., S. A. Coolican, S. Mohan, S. D. Chernausek, and J. R. Florini. 1998.
Modulation of insulin-like growth factor actions in L6A1 myoblasts by insulin-like growth factor binding protein (IGFBP)-4 and IGFBP-5: a dual role for IGFBP-5. J. Cell. Physiol. 177: 47-57.
Fawcett, D. H., and G. Bulfield. 1990. Molecular cloning, sequence analysis and
expression of putative chicken insulin-like growth factor-I cDNAs. J. Mol. Endocrinol. 4: 201-211.
Firth, S. M., U. Ganeshprasad, and R. C. Baxter. 1998. Structural determinants of ligand
and cell surface binding of insulin-like growth factor-binding protein-3. J. Biol. Chem. 273: 2631-2638.
Fliesen, T., D. Maiter, G. Gerard, L. E. Underwood, M. Maes, and J. M. Ketelslegers.
1989. Reduction of serum insulin-like growth factor-I by dietary protein restriction is age dependent. Pediatr. Res. 26: 415-419.
134
Flint, D. J., J. Beattie, and G. J. Allan. 2003. Modulation of the actions of IGFs by IGFBP-5 in the mammary gland. Horm. Metab. Res. 35: 809-815.
Florini, J. R., D. Z. Ewton, and S. A. Coolican. 1996. Growth hormone and the insulin-
like growth factor system in myogenesis. Endocr. Rev. 17: 481-517. Forbes, B. E., D. Turner, S. J. Hodge, K. A. McNeil, G. Forsberg, and J. C. Wallace.
1998. Localization of an insulin-like growth factor (IGF) binding site of bovine IGF binding protein-2 using disulfide mapping and deletion mutation analysis of the C-terminal domain. J. Biol. Chem. 273: 4647-4652.
Foyt, H. L., F. Lanau, M. Woloschak, D. LeRoith, and C. T. Roberts, Jr. 1992. Effect of
growth hormone on levels of differentially processed insulin-like growth factor I mRNAs in total and polysomal mRNA populations. Mol. Endocrinol. 6: 1881-1888.
Foyt, H. L., D. LeRoith, and C. T. Roberts, Jr. 1991. Differential association of insulin-
like growth factor I mRNA variants with polysomes in vivo. J. Biol. Chem. 266: 7300-7305.
Frazer, K. A., H. Tao, K. Osoegawa, P. J. de Jong, X. Chen, M. F. Doherty, and D. R.
Cox. 2004. Noncoding sequences conserved in a limited number of mammals in the SIM2 interval are frequently functional. Genome Res. 14: 367-372.
Freier, S., M. Eran, C. Reinus, I. Ariel, J. Faber, M. Wilschanski, and D. Braverman.
2005. Relative expression and localization of the insulin-like growth factor system components in the fetal, child and adult intestine. J. Pediatr. Gastroenterol. Nutr. 40: 202-209.
Froesch, E. R., H. Buergi, E. B. Ramseier, P. Bally, and A. Labhart. 1963. Antibody-
suppressible and nonsuppressible insulin-like activities in human serum and their physiologic significance. an insulin assay with adipose tissue of increased precision and specificity. J. Clin. Invest. 42: 1816-1834.
Frost, R. A., G. J. Nystrom, and C. H. Lang. 2002. Regulation of IGF-I mRNA and signal
transducers and activators of transcription-3 and -5 (Stat-3 and -5) by GH in C2C12 myoblasts. Endocrinology 143: 492-503.
Fryburg, D. A. 1994. Insulin-like growth factor I exerts growth hormone- and insulin-like
actions on human muscle protein metabolism. Am. J. Physiol. 267: E331-336. Fryburg, D. A., L. A. Jahn, S. A. Hill, D. M. Oliveras, and E. J. Barrett. 1995. Insulin and
insulin-like growth factor-I enhance human skeletal muscle protein anabolism
135
during hyperaminoacidemia by different mechanisms. J. Clin. Invest. 96: 1722-1729.
Frystyk, J., T. Bek, A. Flyvbjerg, C. Skjaerbaek, and H. Orskov. 2003. The relationship
between the circulating IGF system and the presence of retinopathy in Type 1 diabetic patients. Diabet. Med. 20: 269-276.
Frystyk, J., P. J. Delhanty, C. Skjaerbaek, and R. C. Baxter. 1999. Changes in the
circulating IGF system during short-term fasting and refeeding in rats. Am. J. Physiol. 277: E245-252.
Fu, Z., T. Kubo, T. Noguchi, and H. Kato. 2001a. Developmental changes in the mRNA
levels of IGF-I and its related genes in the reproductive organs of Japanese quail (Coturnix coturnix japonica). Growth Horm. IGF Res. 11: 24-33.
Fu, Z., T. Noguchi, and H. Kato. 2001b. Vitamin A deficiency reduces insulin-like
growth factor (IGF)-I gene expression and increases IGF-I receptor and insulin receptor gene expression in tissues of Japanese quail (Coturnix coturnix japonica). J. Nutr. 131: 1189-1194.
Fukada, H., Y. Ozaki, A. L. Pierce, S. Adachi, K. Yamauchi, A. Hara, P. Swanson, and
W. W. Dickhoff. 2004. Salmon growth hormone receptor: molecular cloning, ligand specificity, and response to fasting. Gen. Comp. Endocrinol. 139: 61-71.
Fukenstein, B., R. Shemer, R. Amuly, and I. Cohen. 1996. Nucleotide sequence of the
promoter region of Sparus aurata insulin-like growth factor I gene and expression of IGF-I in eggs and embryos. Mol. Mar. Biol. Biotechnol. 5: 43-51.
Gama, R., J. D. Teale, and V. Marks. 1990. The effect of synthetic very low calorie diets
on the GH-IGF-1 axis in obese subjects. Clin. Chim. Acta 188: 31-38. Ge, N. L., and S. Rudikoff. 2000. Insulin-like growth factor I is a dual effector of
multiple myeloma cell growth. Blood 96: 2856-2861. Ghahary, A., S. Fu, Y. J. Shen, H. A. Shankowsky, and E. E. Tredget. 1994. Differential
effects of thermal injury on circulating insulin-like growth factor binding proteins in burn patients. Mol. Cell. Biochem. 135: 171-180.
Giannini, S., B. Cresci, L. Pala, A. Ciucci, A. Franchini, C. Manuelli, Y. Fujita-
Yamaguchi, P. Cappugi, R. Zonefrati, and C. M. Rotella. 2001. IGFBPs modulate IGF-I- and high glucose-controlled growth of human retinal endothelial cells. J. Endocrinol. 171: 273-284.
136
Gingerich, T. J., J. J. Feige, and J. LaMarre. 2004. AU-rich elements and the control of gene expression through regulated mRNA stability. Anim Health Res Rev 5: 49-63.
Giudice, L. C., B. A. Dsupin, I. H. Jin, T. H. Vu, and A. R. Hoffman. 1993. Differential
expression of messenger ribonucleic acids encoding insulin-like growth factors and their receptors in human uterine endometrium and decidua. J. Clin. Endocrinol. Metab. 76: 1115-1122.
Gottgens, B., L. M. Barton, J. G. Gilbert, A. J. Bench, M. J. Sanchez, S. Bahn, S. Mistry,
D. Grafham, A. McMurray, M. Vaudin, E. Amaya, D. R. Bentley, A. R. Green, and A. M. Sinclair. 2000. Analysis of vertebrate SCL loci identifies conserved enhancers. Nat. Biotechnol. 18: 181-186.
Gottlicher, M., S. Heck, and P. Herrlich. 1998. Transcriptional cross-talk, the second
mode of steroid hormone receptor action. J. Mol. Med. 76: 480-489. Goya, L., A. de la Puente, S. Ramos, M. A. Martin, F. Escriva, and A. M. Pascual-Leone.
1999. Regulation of insulin-like growth factor-I and -II by glucose in primary cultures of fetal rat hepatocytes. J. Biol. Chem. 274: 24633-24640.
Grant, D. B., J. Hambley, D. Becker, and B. L. Pimstone. 1973. Reduced sulphation
factor in undernourished children. Arch. Dis. Child. 48: 596-600. Gronborg, M., B. S. Wulff, J. S. Rasmussen, T. Kjeldsen, and S. Gammeltoft. 1993.
Structure-function relationship of the insulin-like growth factor-I receptor tyrosine kinase. J. Biol. Chem. 268: 23435-23440.
Gronowski, A. M., C. Le Stunff, and P. Rotwein. 1996. Acute nuclear actions of growth
hormone (GH): cycloheximide inhibits inducible activator protein-1 activity, but does not block GH-regulated signal transducer and activator of transcription activation or gene expression. Endocrinology 137: 55-64.
Gronowski, A. M., and P. Rotwein. 1995. Rapid changes in gene expression after in vivo
growth hormone treatment. Endocrinology 136: 4741-4748. Gronowski, A. M., Z. Zhong, Z. Wen, M. J. Thomas, J. E. Darnell, Jr., and P. Rotwein.
1995. In vivo growth hormone treatment rapidly stimulates the tyrosine phosphorylation and activation of Stat3. Mol. Endocrinol. 9: 171-177.
Guler, H. P., J. Zapf, C. Schmid, and E. R. Froesch. 1989. Insulin-like growth factors I
and II in healthy man. Estimations of half-lives and production rates. Acta Endocrinol. (Copenh). 121: 753-758.
137
Guo, Y., Y. Lu, D. Houle, K. Robertson, Z. Tang, J. J. Kopchick, Y. L. Liu, and J. L. Liu. 2005. Pancreatic islet-specific expression of an insulin-like growth factor-I transgene compensates islet cell growth in growth hormone receptor gene-deficient mice. Endocrinology 146: 2602-2609.
Guvakova, M. A., and E. Surmacz. 1997. Tamoxifen interferes with the insulin-like
growth factor I receptor (IGF-IR) signaling pathway in breast cancer cells. Cancer Res. 57: 2606-2610.
Hall, L. J., Y. Kajimoto, D. Bichell, S. W. Kim, P. L. James, D. Counts, L. J. Nixon, G.
Tobin, and P. Rotwein. 1992. Functional analysis of the rat insulin-like growth factor I gene and identification of an IGF-I gene promoter. DNA Cell Biol. 11: 301-313.
Hammerman, M. R., and S. B. Miller. 1997. Effects of growth hormone and insulin-like
growth factor I on renal growth and function. J. Pediatr. 131: S17-19. Hayden, J. M., N. W. Marten, E. J. Burke, and D. S. Straus. 1994. The effect of fasting on
insulin-like growth factor-I nuclear transcript abundance in rat liver. Endocrinology 134: 760-768.
Hayden, J. M., and D. S. Straus. 1995. IGF-I and serine protease inhibitor 2.1 nuclear
transcript abundance in rat liver during protein restriction. J. Endocrinol. 145: 397-407.
Helenius, A., and M. Aebi. 2001. Intracellular functions of N-linked glycans. Science 291:
2364-2369. Hepler, J. E., and P. K. Lund. 1990. Molecular biology of the insulin-like growth factors.
Relevance to nervous system function. Mol. Neurobiol. 4: 93-127. Hepler, J. E., J. J. Van Wyk, and P. K. Lund. 1990. Different half-lives of insulin-like
growth factor I mRNAs that differ in length of 3' untranslated sequence. Endocrinology 127: 1550-1552.
Hernandez-Sanchez, C., V. Blakesley, T. Kalebic, L. Helman, and D. LeRoith. 1995. The
role of the tyrosine kinase domain of the insulin-like growth factor-I receptor in intracellular signaling, cellular proliferation, and tumorigenesis. J. Biol. Chem. 270: 29176-29181.
Hettmer, S., L. Dannecker, J. Foell, M. W. Elmlinger, and G. E. Dannecker. 2005. Effects
of insulin-like growth factors and insulin-like growth factor binding protein-2 on the in vitro proliferation of peripheral blood mononuclear cells. Hum. Immunol. 66: 95-103.
138
Hintz, R. L., R. Suskind, K. Amatayakul, O. Thanangkul, and R. Olson. 1978. Plasma somatomedin and growth hormone values in children with protein-calorie malnutrition. J. Pediatr. 92: 153-156.
Ho, K. Y., J. D. Veldhuis, M. L. Johnson, R. Furlanetto, W. S. Evans, K. G. Alberti, and
M. O. Thorner. 1988. Fasting enhances growth hormone secretion and amplifies the complex rhythms of growth hormone secretion in man. J. Clin. Invest. 81: 968-975.
Hobba, G. D., A. Lothgren, E. Holmberg, B. E. Forbes, G. L. Francis, and J. C. Wallace.
1998. Alanine screening mutagenesis establishes tyrosine 60 of bovine insulin-like growth factor binding protein-2 as a determinant of insulin-like growth factor binding. J. Biol. Chem. 273: 19691-19698.
Holthuizen, P. 1991. Revised nomenclature for the insulin-like growth factor genes and
transcripts. Page 733-736 in Modern Concepts of Insulin-Like Growth Factors. Elsevier Press, New York, NY.
Hong, F., S. J. Kwon, B. S. Jhun, S. S. Kim, J. Ha, S. J. Kim, N. W. Sohn, C. Kang, and I.
Kang. 2001. Insulin-like growth factor-1 protects H9c2 cardiac myoblasts from oxidative stress-induced apoptosis via phosphatidylinositol 3-kinase and extracellular signal-regulated kinase pathways. Life Sci. 68: 1095-1105.
Hossenlopp, P., B. Segovia, C. Lassarre, M. Roghani, M. Bredon, and M. Binoux. 1990.
Evidence of enzymatic degradation of insulin-like growth factor-binding proteins in the 150K complex during pregnancy. J. Clin. Endocrinol. Metab. 71: 797-805.
Hoyt, E. C., J. E. Hepler, J. J. Van Wyk, and P. K. Lund. 1992. Structural
characterization of exon 6 of the rat IGF-I gene. DNA Cell Biol. 11: 433-441. Hoyt, E. C., J. J. Van Wyk, and P. K. Lund. 1988. Tissue and development specific
regulation of a complex family of rat insulin-like growth factor I messenger ribonucleic acids. Mol. Endocrinol. 2: 1077-1086.
Hsu, F. W., T. Tsao, and R. Rabkin. 1997. The IGF-I axis in kidney and skeletal muscle
of potassium deficient rats. Kidney Int. 52: 363-370. Huynh, H. T., G. Robitaille, and J. D. Turner. 1991. Establishment of bovine mammary
epithelial cells (MAC-T): an in vitro model for bovine lactation. Exp. Cell Res. 197: 191-199.
Hwa, V., B. Little, P. Adiyaman, E. M. Kofoed, K. L. Pratt, G. Ocal, M. Berberoglu, and
R. G. Rosenfeld. 2005. Severe growth hormone insensitivity resulting from total
139
absence of signal transducer and activator of transcription 5b. J. Clin. Endocrinol. Metab. 90: 4260-4266.
Inoue, T., H. Saito, R. Fukushima, T. Inaba, M. T. Lin, K. Fukatsu, and T. Muto. 1995.
Growth hormone and insulinlike growth factor I enhance host defense in a murine sepsis model. Arch. Surg. 130: 1115-1122.
Isgaard, J., L. Carlsson, O. G. Isaksson, and J. O. Jansson. 1988. Pulsatile intravenous
growth hormone (GH) infusion to hypophysectomized rats increases insulin-like growth factor I messenger ribonucleic acid in skeletal tissues more effectively than continuous GH infusion. Endocrinology 123: 2605-2610.
Isgaard, J., A. Nilsson, K. Vikman, and O. G. Isaksson. 1989. Growth hormone regulates
the level of insulin-like growth factor-I mRNA in rat skeletal muscle. J. Endocrinol. 120: 107-112.
Isley, W. L., L. E. Underwood, and D. R. Clemmons. 1983. Dietary components that
regulate serum somatomedin-C concentrations in humans. J. Clin. Invest. 71: 175-182.
Isley, W. L., L. E. Underwood, and D. R. Clemmons. 1984. Changes in plasma
somatomedin-C in response to ingestion of diets with variable protein and energy content. JPEN. J. Parenter. Enteral Nutr. 8: 407-411.
Jansen, E., P. H. Steenbergh, D. LeRoith, C. T. Roberts, Jr., and J. S. Sussenbach. 1991.
Identification of multiple transcription start sites in the human insulin-like growth factor-I gene. Mol. Cell. Endocrinol. 78: 115-125.
Jansen, E., P. H. Steenbergh, F. M. van Schaik, and J. S. Sussenbach. 1992. The human
IGF-I gene contains two cell type-specifically regulated promoters. Biochem. Biophys. Res. Commun. 187: 1219-1226.
Jansen, M., F. M. van Schaik, A. T. Ricker, B. Bullock, D. E. Woods, K. H. Gabbay, A.
L. Nussbaum, J. S. Sussenbach, and J. L. Van den Brande. 1983. Sequence of cDNA encoding human insulin-like growth factor I precursor. Nature 306: 609-611.
Jarman, A. P., W. G. Wood, J. A. Sharpe, G. Gourdon, H. Ayyub, and D. R. Higgs. 1991.
Characterization of the major regulatory element upstream of the human alpha-globin gene cluster. Mol. Cell. Biol. 11: 4679-4689.
Jiang, H., and M. C. Lucy. 2001. Variants of the 5'-untranslated region of the bovine
growth hormone receptor mRNA: isolation, expression and effects on translational efficiency. Gene 265: 45-53.
140
John, S., U. Vinkemeier, E. Soldaini, J. E. Darnell, Jr., and W. J. Leonard. 1999. The significance of tetramerization in promoter recruitment by Stat5. Mol. Cell. Biol. 19: 1910-1918.
Jones, J. I., and D. R. Clemmons. 1995. Insulin-like growth factors and their binding
proteins: biological actions. Endocr. Rev. 16: 3-34. Jones, J. I., M. E. Doerr, and D. R. Clemmons. 1995. Cell migration: interactions among
integrins, IGFs and IGFBPs. Prog. Growth Factor Res. 6: 319-327. Jones, J. I., A. Gockerman, W. H. Busby, Jr., G. Wright, and D. R. Clemmons. 1993.
Insulin-like growth factor binding protein 1 stimulates cell migration and binds to the alpha 5 beta 1 integrin by means of its Arg-Gly-Asp sequence. Proc. Natl. Acad. Sci. U. S. A. 90: 10553-10557.
Kajimoto, Y., and P. Rotwein. 1989. Structure and expression of a chicken insulin-like
growth factor I precursor. Mol. Endocrinol. 3: 1907-1913. Kajimoto, Y., and P. Rotwein. 1990. Evolution of insulin-like growth factor I (IGF-I):
structure and expression of an IGF-I precursor from Xenopus laevis. Mol. Endocrinol. 4: 217-226.
Kajimoto, Y., and P. Rotwein. 1991. Structure of the chicken insulin-like growth factor I
gene reveals conserved promoter elements. J. Biol. Chem. 266: 9724-9731. Kapur, S., H. Tamada, S. K. Dey, and G. K. Andrews. 1992. Expression of insulin-like
growth factor-I (IGF-I) and its receptor in the peri-implantation mouse uterus, and cell-specific regulation of IGF-I gene expression by estradiol and progesterone. Biol. Reprod. 46: 208-219.
Karey, K. P., H. Marquardt, and D. A. Sirbasku. 1989. Human platelet-derived mitogens.
I. Identification of insulinlike growth factors I and II by purification and N alpha amino acid sequence analysis. Blood 74: 1084-1092.
Kavsan, V. M., V. A. Grebenjuk, A. P. Koval, A. S. Skorokhod, C. T. Roberts, Jr., and D.
Leroith. 1994. Isolation of a second nonallelic insulin-like growth factor I gene from the salmon genome. DNA Cell Biol. 13: 555-559.
Kavsan, V. M., A. P. Koval, V. A. Grebenjuk, S. J. Chan, D. F. Steiner, C. T. Roberts, Jr.,
and D. LeRoith. 1993. Structure of the chum salmon insulin-like growth factor I gene. DNA Cell Biol. 12: 729-737.
141
Kaytor, E. N., J. L. Zhu, C. I. Pao, and L. S. Phillips. 2001a. Insulin-responsive nuclear proteins facilitate Sp1 interactions with the insulin-like growth factor-I gene. J. Biol. Chem. 276: 36896-36901.
Kaytor, E. N., J. L. Zhu, C. I. Pao, and L. S. Phillips. 2001b. Physiological concentrations
of insulin promote binding of nuclear proteins to the insulin-like growth factor I gene. Endocrinology 142: 1041-1049.
Kel, A. E., E. Gossling, I. Reuter, E. Cheremushkin, O. V. Kel-Margoulis, and E.
Wingender. 2003. MATCH: A tool for searching transcription factor binding sites in DNA sequences. Nucleic Acids Res 31: 3576-3579.
Kermouni, A., S. S. Mahmoud, S. Wang, M. Moloney, and H. R. Habibi. 1998. Cloning
of a full-length insulin-like growth factor-I complementary DNA in the goldfish liver and ovary and development of a quantitative PCR method for its measurement. Gen. Comp. Endocrinol. 111: 51-60.
Ketelslegers, J. M., D. Maiter, M. Maes, L. E. Underwood, and J. P. Thissen. 1995.
Nutritional regulation of insulin-like growth factor-I. Metabolism. 44: 50-57. Kiepe, D., D. L. Andress, S. Mohan, L. Standker, T. Ulinski, R. Himmele, O. Mehls, and
B. Tonshoff. 2001. Intact IGF-binding protein-4 and -5 and their respective fragments isolated from chronic renal failure serum differentially modulate IGF-I actions in cultured growth plate chondrocytes. J. Am. Soc. Nephrol. 12: 2400-2410.
Kiepe, D., T. Ulinski, D. R. Powell, S. K. Durham, O. Mehls, and B. Tonshoff. 2002.
Differential effects of insulin-like growth factor binding proteins-1, -2, -3, and -6 on cultured growth plate chondrocytes. Kidney Int. 62: 1591-1600.
Kikuchi, K., D. P. Bichell, and P. Rotwein. 1992. Chromatin changes accompany the
developmental activation of insulin-like growth factor I gene transcription. J. Biol. Chem. 267: 21505-21511.
Kikuchi, K., F. C. Buonomo, Y. Kajimoto, and P. Rotwein. 1991. Expression of insulin-
like growth factor-I during chicken development. Endocrinology 128: 1323-1328. Kim, B., P. S. Leventhal, A. R. Saltiel, and E. L. Feldman. 1997. Insulin-like growth
factor-I-mediated neurite outgrowth in vitro requires mitogen-activated protein kinase activation. J. Biol. Chem. 272: 21268-21273.
Kirk, S. J., M. Hurson, M. C. Regan, D. R. Holt, H. L. Wasserkrug, and A. Barbul. 1993.
Arginine stimulates wound healing and immune function in elderly human beings. Surgery 114: 155-159; discussion 160.
142
Kjeldsen, T., A. S. Andersen, F. C. Wiberg, J. S. Rasmussen, L. Schaffer, P. Balschmidt, K. B. Moller, and N. P. Moller. 1991. The ligand specificities of the insulin receptor and the insulin-like growth factor I receptor reside in different regions of a common binding site. Proc. Natl. Acad. Sci. U. S. A. 88: 4404-4408.
Kleinberg, D. L., W. Ruan, V. Catanese, C. B. Newman, and M. Feldman. 1990. Non-
lactogenic effects of growth hormone on growth and insulin-like growth factor-I messenger ribonucleic acid of rat mammary gland. Endocrinology 126: 3274-3276.
Klinge, C. M. 2001. Estrogen receptor interaction with estrogen response elements.
Nucleic Acids Res 29: 2905-2919. Klotz, D. M., S. C. Hewitt, K. S. Korach, and R. P. Diaugustine. 2000. Activation of a
uterine insulin-like growth factor I signaling pathway by clinical and environmental estrogens: requirement of estrogen receptor-alpha. Endocrinology 141: 3430-3439.
Kobayashi, Y., C. K. Boyd, C. J. Bracken, W. R. Lamberson, D. H. Keisler, and M. C.
Lucy. 1999. Reduced growth hormone receptor (GHR) messenger ribonucleic acid in liver of periparturient cattle is caused by a specific down-regulation of GHR 1A that is associated with decreased insulin-like growth factor I. Endocrinology 140: 3947-3954.
Kofoed, E. M., V. Hwa, B. Little, K. A. Woods, C. K. Buckway, J. Tsubaki, K. L. Pratt,
L. Bezrodnik, H. Jasper, A. Tepper, J. J. Heinrich, and R. G. Rosenfeld. 2003. Growth hormone insensitivity associated with a STAT5b mutation. N. Engl. J. Med. 349: 1139-1147.
Kopchick, J. J., and J. M. Andry. 2000. Growth hormone (GH), GH receptor, and signal
transduction. Mol. Genet. Metab. 71: 293-314. Kozak, M. 1991. Structural features in eukaryotic mRNAs that modulate the initiation of
translation. J. Biol. Chem. 266: 19867-19870. Kozak, M. 1999. Initiation of translation in prokaryotes and eukaryotes. Gene 234: 187-
208. Kozak, M. 2004. How strong is the case for regulation of the initiation step of translation
by elements at the 3' end of eukaryotic mRNAs? Gene 343: 41-54. Krainer, A. R., and T. Maniatis. 1988. Page 131-206 in Transcription and Splicing. IRL
Press, Washington, DC.
143
Kubler, B., S. Cowell, J. Zapf, and T. Braulke. 1998. Proteolysis of insulin-like growth factor binding proteins by a novel 50-kilodalton metalloproteinase in human pregnancy serum. Endocrinology 139: 1556-1563.
Kulik, V. P., V. M. Kavsan, F. M. van Schaik, L. A. Nolten, P. H. Steenbergh, and J. S.
Sussenbach. 1995. The promoter of the salmon insulin-like growth factor I gene is activated by hepatocyte nuclear factor 1. J. Biol. Chem. 270: 1068-1073.
Kuo, Y. H., and T. T. Chen. 2002. Novel activities of pro-IGF-I E peptides: regulation of
morphological differentiation and anchorage-independent growth in human neuroblastoma cells. Exp. Cell Res. 280: 75-89.
l'Allemand, D., A. Penhoat, M. C. Lebrethon, R. Ardevol, V. Baehr, W. Oelkers, and J.
M. Saez. 1996. Insulin-like growth factors enhance steroidogenic enzyme and corticotropin receptor messenger ribonucleic acid levels and corticotropin steroidogenic responsiveness in cultured human adrenocortical cells. J. Clin. Endocrinol. Metab. 81: 3892-3897.
Lang, C. H., J. Fan, R. Cooney, and T. C. Vary. 1996. IL-1 receptor antagonist attenuates
sepsis-induced alterations in the IGF system and protein synthesis. Am. J. Physiol. 270: E430-437.
Le Roith, D., C. Bondy, S. Yakar, J. L. Liu, and A. Butler. 2001. The somatomedin
hypothesis: 2001. Endocr. Rev. 22: 53-74. Le Stunff, C., M. J. Thomas, and P. Rotwein. 1995. Rapid activation of rat insulin-like
growth factor-I gene transcription by growth hormone reveals no changes in deoxyribonucleic acid-protein interactions within the second promoter. Endocrinology 136: 2230-2237.
Leaman, D. W., F. A. Simmen, T. G. Ramsay, and M. E. White. 1990. Insulin-like
growth factor-I and -II messenger RNA expression in muscle, heart, and liver of streptozotocin-diabetic swine. Endocrinology 126: 2850-2857.
Lee, Y. R., Y. Oshita, R. Tsuboi, and H. Ogawa. 1996. Combination of insulin-like
growth factor (IGF)-I and IGF-binding protein-1 promotes fibroblast-embedded collagen gel contraction. Endocrinology 137: 5278-5283.
Lemozy, S., J. B. Pucilowska, and L. E. Underwood. 1994. Reduction of insulin-like
growth factor-I (IGF-I) in protein-restricted rats is associated with differential regulation of IGF-binding protein messenger ribonucleic acids in liver and kidney, and peptides in liver and serum. Endocrinology 135: 617-623.
144
LeRoith, D., H. Werner, D. Beitner-Johnson, and C. T. Roberts, Jr. 1995. Molecular and cellular aspects of the insulin-like growth factor I receptor. Endocr. Rev. 16: 143-163.
Leventhal, P. S., E. A. Shelden, B. Kim, and E. L. Feldman. 1997. Tyrosine
phosphorylation of paxillin and focal adhesion kinase during insulin-like growth factor-I-stimulated lamellipodial advance. J. Biol. Chem. 272: 5214-5218.
Lin, W. W., and A. M. Oberbauer. 1998. Alternative splicing of insulin-like growth
factor I mRNA is developmentally regulated in the rat and mouse with preferential exon 2 usage in the mouse. Growth Horm. IGF Res. 8: 225-233.
Lindenbergh-Kortleve, D. J., R. R. Rosato, J. W. van Neck, J. Nauta, M. van Kleffens, C.
Groffen, E. C. Zwarthoff, and S. L. Drop. 1997. Gene expression of the insulin-like growth factor system during mouse kidney development. Mol. Cell. Endocrinol. 132: 81-91.
Liu, E., H. K. Law, and Y. L. Lau. 2003. Insulin-like growth factor I promotes maturation
and inhibits apoptosis of immature cord blood monocyte-derived dendritic cells through MEK and PI 3-kinase pathways. Pediatr. Res. 54: 919-925.
Liu, J. L., and D. LeRoith. 1999. Insulin-like growth factor I is essential for postnatal
growth in response to growth hormone. Endocrinology 140: 5178-5184. Liu, J. P., J. Baker, A. S. Perkins, E. J. Robertson, and A. Efstratiadis. 1993. Mice
carrying null mutations of the genes encoding insulin-like growth factor I (Igf-1) and type 1 IGF receptor (Igf1r). Cell 75: 59-72.
Liu, X., G. W. Robinson, F. Gouilleux, B. Groner, and L. Hennighausen. 1995. Cloning
and expression of Stat5 and an additional homologue (Stat5b) involved in prolactin signal transduction in mouse mammary tissue. Proc. Natl. Acad. Sci. U. S. A. 92: 8831-8835.
Loots, G. G., R. M. Locksley, C. M. Blankespoor, Z. E. Wang, W. Miller, E. M. Rubin,
and K. A. Frazer. 2000. Identification of a coordinate regulator of interleukins 4, 13, and 5 by cross-species sequence comparisons. Science 288: 136-140.
Lowe, W. L., Jr., M. Adamo, H. Werner, C. T. Roberts, Jr., and D. LeRoith. 1989.
Regulation by fasting of rat insulin-like growth factor I and its receptor. Effects on gene expression and binding. J. Clin. Invest. 84: 619-626.
Lowe, W. L., Jr., S. R. Lasky, D. LeRoith, and C. T. Roberts, Jr. 1988. Distribution and
regulation of rat insulin-like growth factor I messenger ribonucleic acids encoding
145
alternative carboxyterminal E-peptides: evidence for differential processing and regulation in liver. Mol. Endocrinol. 2: 528-535.
Lowe, W. L., Jr., T. Meyer, C. W. Karpen, and L. R. Lorentzen. 1992. Regulation of
insulin-like growth factor I production in rat C6 glioma cells: possible role as an autocrine/paracrine growth factor. Endocrinology 130: 2683-2691.
Lowe, W. L., Jr., C. T. Roberts, Jr., S. R. Lasky, and D. LeRoith. 1987. Differential
expression of alternative 5' untranslated regions in mRNAs encoding rat insulin-like growth factor I. Proc. Natl. Acad. Sci. U. S. A. 84: 8946-8950.
Lu, K., and J. Campisi. 1992. Ras proteins are essential and selective for the action of
insulin-like growth factor 1 late in the G1 phase of the cell cycle in BALB/c murine fibroblasts. Proc. Natl. Acad. Sci. U. S. A. 89: 3889-3893.
Lund, P. K. 1994. Insulin-like growth factor I: molecular biology and relevance to tissue-
specific expression and action. Recent Prog. Horm. Res. 49: 125-148. Lund, P. K., E. C. Hoyt, and J. J. Van Wyk. 1989. The size heterogeneity of rat insulin-
like growth factor-I mRNAs is due primarily to differences in the length of 3'-untranslated sequence. Mol. Endocrinol. 3: 2054-2061.
Luo, J. M., and L. J. Murphy. 1989. Dexamethasone inhibits growth hormone induction
of insulin-like growth factor-I (IGF-I) messenger ribonucleic acid (mRNA) in hypophysectomized rats and reduces IGF-I mRNA abundance in the intact rat. Endocrinology 125: 165-171.
Maes, M., Y. Amand, L. E. Underwood, D. Maiter, and J. M. Ketelslegers. 1988.
Decreased serum insulin-like growth factor I response to growth hormone in hypophysectomized rats fed a low protein diet: evidence for a postreceptor defect. Acta Endocrinol. (Copenh). 117: 320-326.
Mathews, L. S., R. E. Hammer, R. R. Behringer, A. J. D'Ercole, G. I. Bell, R. L. Brinster,
and R. D. Palmiter. 1988a. Growth enhancement of transgenic mice expressing human insulin-like growth factor I. Endocrinology 123: 2827-2833.
Mathews, L. S., R. E. Hammer, R. L. Brinster, and R. D. Palmiter. 1988b. Expression of
insulin-like growth factor I in transgenic mice with elevated levels of growth hormone is correlated with growth. Endocrinology 123: 433-437.
Mathews, L. S., G. Norstedt, and R. D. Palmiter. 1986. Regulation of insulin-like growth
factor I gene expression by growth hormone. Proc. Natl. Acad. Sci. U. S. A. 83: 9343-9347.
146
Matsumoto, T., T. Tsurumoto, M. B. Goldring, and H. Shindo. 2000. Differential effects of IGF-binding proteins, IGFBP-3 and IGFBP-5, on IGF-I action and binding to cell membranes of immortalized human chondrocytes. J. Endocrinol. 166: 29-37.
McCarthy, T. L., M. Centrella, and E. Canalis. 1990. Cortisol inhibits the synthesis of
insulin-like growth factor-I in skeletal cells. Endocrinology 126: 1569-1575. McKern, N. M., D. B. Cheek, and W. G. Crewther. 1981. Sulfate uptake and
somatomedin levels in the "little" (lit/lit) mouse. Aust. J. Biol. Sci. 34: 221-230. Miell, J. P., A. M. Taylor, J. Jones, C. R. Buchanan, J. Rennie, R. Sherwood, R. Leicester,
and R. J. Ross. 1992. Administration of human recombinant insulin-like growth factor-I to patients following major gastrointestinal surgery. Clin. Endocrinol. (Oxf). 37: 542-551.
Miller, L. L., D. S. Schalch, and B. Draznin. 1981. Role of the liver in regulating
somatomedin activity: effects of streptozotocin diabetes and starvation on the synthesis and release of insulin-like growth factor and its carrier protein by the isolated perfused rat liver. Endocrinology 108: 1265-1271.
Milward, A., L. Metherell, M. Maamra, M. J. Barahona, I. R. Wilkinson, C. Camacho-
Hubner, M. O. Savage, C. M. Bidlingmaier, A. J. Clark, R. J. Ross, and S. M. Webb. 2004. Growth hormone (GH) insensitivity syndrome due to a GH receptor truncated after Box1, resulting in isolated failure of STAT 5 signal transduction. J. Clin. Endocrinol. Metab. 89: 1259-1266.
Mittanck, D. W., S. W. Kim, and P. Rotwein. 1997. Essential promoter elements are
located within the 5' untranslated region of human insulin-like growth factor-I exon I. Mol. Cell. Endocrinol. 126: 153-163.
Muller, M., and G. Brem. 1990. Nucleotide sequence of porcine insulin-like growth
factor. 1:5' untranslated region, exons 1 and 2 and mRNA. Nucleic Acids Res 18: 364.
Murphy, L. J., G. I. Bell, and H. G. Friesen. 1987a. Tissue distribution of insulin-like
growth factor I and II messenger ribonucleic acid in the adult rat. Endocrinology 120: 1279-1282.
Murphy, L. J., and H. G. Friesen. 1988. Differential effects of estrogen and growth
hormone on uterine and hepatic insulin-like growth factor I gene expression in the ovariectomized hypophysectomized rat. Endocrinology 122: 325-332.
Murphy, L. J., and J. M. Luo. 1989. Effects of cycloheximide on hepatic and uterine
insulin-like growth factor-I mRNA. Mol. Cell. Endocrinol. 64: 81-86.
147
Murphy, L. J., L. C. Murphy, and H. G. Friesen. 1987b. Estrogen induces insulin-like growth factor-I expression in the rat uterus. Mol. Endocrinol. 1: 445-450.
Musaro, A., K. McCullagh, A. Paul, L. Houghton, G. Dobrowolny, M. Molinaro, E. R.
Barton, H. L. Sweeney, and N. Rosenthal. 2001. Localized Igf-1 transgene expression sustains hypertrophy and regeneration in senescent skeletal muscle. Nat. Genet. 27: 195-200.
Muskens, M. W., A. P. Vissers, J. N. Mol, and J. M. Kooter. 2000. Role of inverted DNA
repeats in transcriptional and post-transcriptional gene silencing. Plant Mol. Biol. 43: 243-260.
Nagamatsu, S., S. J. Chan, S. Falkmer, and D. F. Steiner. 1991. Evolution of the insulin
gene superfamily. Sequence of a preproinsulin-like growth factor cDNA from the Atlantic hagfish. J. Biol. Chem. 266: 2397-2402.
Nakabayashi, H., K. Taketa, K. Miyano, T. Yamane, and J. Sato. 1982. Growth of human
hepatoma cells lines with differentiated functions in chemically defined medium. Cancer Res. 42: 3858-3863.
Ninh, N. X., J. P. Thissen, D. Maiter, E. Adam, N. Mulumba, and J. M. Ketelslegers.
1995. Reduced liver insulin-like growth factor-I gene expression in young zinc-deprived rats is associated with a decrease in liver growth hormone (GH) receptors and serum GH-binding protein. J. Endocrinol. 144: 449-456.
Nixon, A. J., B. D. Brower-Toland, and L. J. Sandell. 1999. Primary nucleotide structure
of predominant and alternate splice forms of equine insulin-like growth factor I and their gene expression patterns in tissues. Am. J. Vet. Res. 60: 1234-1241.
Nobrega, M. A., I. Ovcharenko, V. Afzal, and E. M. Rubin. 2003. Scanning human gene
deserts for long-range enhancers. Science 302: 413. Nolten, L. A., P. H. Steenbergh, and J. S. Sussenbach. 1995. Hepatocyte nuclear factor 1
alpha activates promoter 1 of the human insulin-like growth factor I gene via two distinct binding sites. Mol. Endocrinol. 9: 1488-1499.
Nolten, L. A., P. H. Steenbergh, and J. S. Sussenbach. 1996. The hepatocyte nuclear
factor 3beta stimulates the transcription of the human insulin-like growth factor I gene in a direct and indirect manner. J. Biol. Chem. 271: 31846-31854.
Nolten, L. A., F. M. van Schaik, P. H. Steenbergh, and J. S. Sussenbach. 1994.
Expression of the insulin-like growth factor I gene is stimulated by the liver-enriched transcription factors C/EBP alpha and LAP. Mol. Endocrinol. 8: 1636-1645.
148
O'Sullivan, D. C., T. A. Szestak, and J. M. Pell. 2002. Regulation of IGF-I mRNA by GH: putative functions for class 1 and 2 message. Am J Physiol Endocrinol Metab 283: E251-258.
Ogasawara, M., K. P. Karey, H. Marquardt, and D. A. Sirbasku. 1989. Identification and
purification of truncated insulin-like growth factor I from porcine uterus. Evidence for high biological potency. Biochemistry (Mosc). 28: 2710-2721.
Ohlsen, S. M., D. M. Dean, and E. A. Wong. 1993. Characterization of multiple
transcription initiation sites of the ovine insulin-like growth factor-I gene and expression profiles of three alternatively spliced transcripts. DNA Cell Biol. 12: 243-251.
Oksbjerg, N., F. Gondret, and M. Vestergaard. 2004. Basic principles of muscle
development and growth in meat-producing mammals as affected by the insulin-like growth factor (IGF) system. Domest. Anim. Endocrinol. 27: 219-240.
Olney, R. C., J. Wang, J. E. Sylvester, and E. B. Mougey. 2004. Growth factor regulation
of human growth plate chondrocyte proliferation in vitro. Biochem. Biophys. Res. Commun. 317: 1171-1182.
Orio, F., Jr., B. Terouanne, V. Georget, S. Lumbroso, C. Avances, C. Siatka, and C.
Sultan. 2002. Potential action of IGF-1 and EGF on androgen receptor nuclear transfer and transactivation in normal and cancer human prostate cell lines. Mol. Cell. Endocrinol. 198: 105-114.
Otte, K., B. Rozell, A. Gessbo, and W. Engstrom. 1996. Cloning and sequencing of an
equine insulin-like growth factor I cDNA and its expression in fetal and adult tissues. Gen. Comp. Endocrinol. 102: 11-15.
Oxender, W. D., E. W. Askew, J. D. Benson, and R. S. Emery. 1971. Biopsy of liver,
adipose tissue and mammary gland of lactating cows. J. Dairy Sci. 54: 286-288. Pahlman, S., G. Meyerson, E. Lindgren, M. Schalling, and I. Johansson. 1991. Insulin-
like growth factor I shifts from promoting cell division to potentiating maturation during neuronal differentiation. Proc. Natl. Acad. Sci. U. S. A. 88: 9994-9998.
Palmiter, R. D., G. Norstedt, R. E. Gelinas, R. E. Hammer, and R. L. Brinster. 1983.
Metallothionein-human GH fusion genes stimulate growth of mice. Science 222: 809-814.
Pao, C. I., P. K. Farmer, S. Begovic, S. Goldstein, G. J. Wu, and L. S. Phillips. 1992.
Expression of hepatic insulin-like growth factor-I and insulin-like growth factor-
149
binding protein-1 genes is transcriptionally regulated in streptozotocin-diabetic rats. Mol. Endocrinol. 6: 969-977.
Pao, C. I., P. K. Farmer, S. Begovic, B. C. Villafuerte, G. J. Wu, D. G. Robertson, and L.
S. Phillips. 1993. Regulation of insulin-like growth factor-I (IGF-I) and IGF-binding protein 1 gene transcription by hormones and provision of amino acids in rat hepatocytes. Mol. Endocrinol. 7: 1561-1568.
Pao, C. I., J. L. Zhu, D. G. Robertson, K. W. Lin, P. K. Farmer, S. Begovic, G. J. Wu,
and L. S. Phillips. 1995. Transcriptional regulation of the rat insulin-like growth factor-I gene involves metabolism-dependent binding of nuclear proteins to a downstream region. J. Biol. Chem. 270: 24917-24923.
Papatsoris, A. G., M. V. Karamouzis, and A. G. Papavassiliou. 2005. Novel insights into
the implication of the IGF-1 network in prostate cancer. Trends Mol Med 11: 52-55.
Parrizas, M., A. R. Saltiel, and D. LeRoith. 1997. Insulin-like growth factor 1 inhibits
apoptosis using the phosphatidylinositol 3'-kinase and mitogen-activated protein kinase pathways. J. Biol. Chem. 272: 154-161.
Pell, J. M., J. C. Saunders, and R. S. Gilmour. 1993. Differential regulation of
transcription initiation from insulin-like growth factor-I (IGF-I) leader exons and of tissue IGF-I expression in response to changed growth hormone and nutritional status in sheep. Endocrinology 132: 1797-1807.
Pelletier, G., V. Luu-The, S. Li, and F. Labrie. 2004. Localization and estrogenic
regulation of androgen receptor mRNA expression in the mouse uterus and vagina. J. Endocrinol. 180: 77-85.
Pellizas, C. G., M. Bonaterra, A. L. De Paul, A. Aoki, A. H. Coleoni, and A. I. Torres.
2000. Somatotroph response to periodical IGF-I administration to male rats. Acta Histochem. 102: 439-451.
Peterkofsky, B., A. Gosiewska, D. E. Kipp, V. Shah, and S. Wilson. 1994. Circulating
insulin-like growth factor binding proteins (IGFBPs) 1 and 2 induced in vitamin C-deficient or fasted guinea pigs inhibit IGF-I action in cultured cells. Growth Factors 10: 229-241.
Phillips, L. S., S. Goldstein, and C. I. Pao. 1991. Nutrition and somatomedin. XXVI.
Molecular regulation of IGF-I by insulin in cultured rat hepatocytes. Diabetes 40: 1525-1530.
150
Phillips, L. S., and T. G. Unterman. 1984. Somatomedin activity in disorders of nutrition and metabolism. Clin. Endocrinol. Metab. 13: 145-189.
Phornphutkul, C., K. Y. Wu, X. Yang, Q. Chen, and P. A. Gruppuso. 2004. Insulin-like
growth factor-I signaling is modified during chondrocyte differentiation. J. Endocrinol. 183: 477-486.
Pierce, A. L., M. Shimizu, B. R. Beckman, D. M. Baker, and W. W. Dickhoff. 2005.
Time course of the GH/IGF axis response to fasting and increased ration in chinook salmon (Oncorhynchus tshawytscha). Gen. Comp. Endocrinol. 140: 192-202.
Pietrzkowski, Z., C. Sell, R. Lammers, A. Ullrich, and R. Baserga. 1992. Roles of
insulinlike growth factor 1 (IGF-1) and the IGF-1 receptor in epidermal growth factor-stimulated growth of 3T3 cells. Mol. Cell. Biol. 12: 3883-3889.
Piwien-Pilipuk, G., J. S. Huo, and J. Schwartz. 2002. Growth hormone signal
transduction. J. Pediatr. Endocrinol. Metab. 15: 771-786. Postel-Vinay, M. C., E. Cohen-Tanugi, and J. Charrier. 1982. Growth hormone receptors
in rat liver membranes: effects of fasting and refeeding, and correlation with plasma somatomedin activity. Mol. Cell. Endocrinol. 28: 657-669.
Powell-Braxton, L., P. Hollingshead, C. Warburton, M. Dowd, S. Pitts-Meek, D. Dalton,
N. Gillett, and T. A. Stewart. 1993. IGF-I is required for normal embryonic growth in mice. Genes Dev. 7: 2609-2617.
Prosser, C. G., S. R. Davis, S. C. Hodgkinson, and M. A. Mohler. 1995.
Pharmacokinetics and bioactivity of intact versus truncated IGF-I during a 24-h infusion into lactating goats. J. Endocrinol. 144: 99-107.
Puck, T. T., S. J. Cieciura, and A. Robinson. 1958. Genetics of somatic mammalian cells.
III. Long-term cultivation of euploid cells from human and animal subjects. J. Exp. Med. 108: 945-956.
Putz, T., Z. Culig, I. E. Eder, C. Nessler-Menardi, G. Bartsch, H. Grunicke, F. Uberall,
and H. Klocker. 1999. Epidermal growth factor (EGF) receptor blockade inhibits the action of EGF, insulin-like growth factor I, and a protein kinase A activator on the mitogen-activated protein kinase pathway in prostate cancer cell lines. Cancer Res. 59: 227-233.
Radcliff, R. P., M. J. VandeHaar, Y. Kobayashi, B. K. Sharma, H. A. Tucker, and M. C.
Lucy. 2004. Effect of dietary energy and somatotropin on components of the somatotropic axis in Holstein heifers. J. Dairy Sci. 87: 1229-1235.
151
Rajkumar, K., D. Barron, M. S. Lewitt, and L. J. Murphy. 1995. Growth retardation and hyperglycemia in insulin-like growth factor binding protein-1 transgenic mice. Endocrinology 136: 4029-4034.
Ranke, M. B., M. O. Savage, P. G. Chatelain, M. A. Preece, R. G. Rosenfeld, and P.
Wilton. 1999. Long-term treatment of growth hormone insensitivity syndrome with IGF-I. Results of the European Multicentre Study. The Working Group on Growth Hormone Insensitivity Syndromes. Horm. Res. 51: 128-134.
Reinecke, M., A. Schmid, R. Ermatinger, and D. Loffing-Cueni. 1997. Insulin-like
growth factor I in the teleost Oreochromis mossambicus, the tilapia: gene sequence, tissue expression, and cellular localization. Endocrinology 138: 3613-3619.
Renaville, R., M. Hammadi, and D. Portetelle. 2002. Role of the somatotropic axis in the
mammalian metabolism. Domest. Anim. Endocrinol. 23: 351-360. Renier, G., I. Clement, A. C. Desfaits, and A. Lambert. 1996. Direct stimulatory effect of
insulin-like growth factor-I on monocyte and macrophage tumor necrosis factor-alpha production. Endocrinology 137: 4611-4618.
Richards, M. P., S. M. Poch, and J. P. McMurtry. 2005. Expression of insulin-like growth
factor system genes in liver and brain tissue during embryonic and post-hatch development of the turkey. Comp. Biochem. Physiol. A. Mol. Integr. Physiol. 141: 76-86.
Rinderknecht, E., and R. E. Humbel. 1976. Polypeptides with nonsuppressible insulin-
like and cell-growth promoting activities in human serum: isolation, chemical characterization, and some biological properties of forms I and II. Proc. Natl. Acad. Sci. U. S. A. 73: 2365-2369.
Rinderknecht, E., and R. E. Humbel. 1978a. The amino acid sequence of human insulin-
like growth factor I and its structural homology with proinsulin. J. Biol. Chem. 253: 2769-2776.
Rinderknecht, E., and R. E. Humbel. 1978b. Primary structure of human insulin-like
growth factor II. FEBS Lett. 89: 283-286. Robbins, K., S. McCabe, T. Scheiner, J. Strasser, R. Clark, and P. Jardieu. 1994.
Immunological effects of insulin-like growth factor-I--enhancement of immunoglobulin synthesis. Clin. Exp. Immunol. 95: 337-342.
152
Roberts, C. T., Jr., A. L. Brown, D. E. Graham, S. Seelig, S. Berry, K. H. Gabbay, and M. M. Rechler. 1986. Growth hormone regulates the abundance of insulin-like growth factor I RNA in adult rat liver. J. Biol. Chem. 261: 10025-10028.
Roberts, C. T., Jr., S. R. Lasky, W. L. Lowe, Jr., and D. LeRoith. 1987a. Rat IGF-I
cDNA's contain multiple 5'-untranslated regions. Biochem. Biophys. Res. Commun. 146: 1154-1159.
Roberts, C. T., Jr., S. R. Lasky, W. L. Lowe, Jr., W. T. Seaman, and D. LeRoith. 1987b.
Molecular cloning of rat insulin-like growth factor I complementary deoxyribonucleic acids: differential messenger ribonucleic acid processing and regulation by growth hormone in extrahepatic tissues. Mol. Endocrinol. 1: 243-248.
Rosendahl, A., and G. Forsberg. 2004. Influence of IGF-IR stimulation or blockade on
proliferation of human renal cell carcinoma cell lines. Int. J. Oncol. 25: 1327-1336.
Rotwein, P. 1986. Two insulin-like growth factor I messenger RNAs are expressed in
human liver. Proc. Natl. Acad. Sci. U. S. A. 83: 77-81. Rotwein, P., R. J. Folz, and J. I. Gordon. 1987. Biosynthesis of human insulin-like
growth factor I (IGF-I). The primary translation product of IGF-I mRNA contains an unusual 48-amino acid signal peptide. J. Biol. Chem. 262: 11807-11812.
Rotwein, P., K. M. Pollock, D. K. Didier, and G. G. Krivi. 1986. Organization and
sequence of the human insulin-like growth factor I gene. Alternative RNA processing produces two insulin-like growth factor I precursor peptides. J. Biol. Chem. 261: 4828-4832.
Sadowski, C. L., T. T. Wheeler, L. H. Wang, and H. B. Sadowski. 2001. GH regulation
of IGF-I and suppressor of cytokine signaling gene expression in C2C12 skeletal muscle cells. Endocrinology 142: 3890-3900.
Salmon, W. D., Jr., and W. H. Daughaday. 1957. A hormonally controlled serum factor
which stimulates sulfate incorporation by cartilage in vitro. J. Lab. Clin. Med. 49: 825-836.
Santini, S., J. L. Boore, and A. Meyer. 2003. Evolutionary conservation of regulatory
elements in vertebrate Hox gene clusters. Genome Res. 13: 1111-1122. Sanz, S., J. B. Pucilowska, S. Liu, C. M. Rodriguez-Ortigosa, P. K. Lund, D. A. Brenner,
C. R. Fuller, J. G. Simmons, A. Pardo, M. L. Martinez-Chantar, J. A. Fagin, and J. Prieto. 2005. Expression of insulin-like growth factor I by activated hepatic
153
stellate cells reduces fibrogenesis and enhances regeneration after liver injury. Gut 54: 134-141.
Sara, V. R., C. Carlsson-Skwirut, C. Andersson, E. Hall, B. Sjogren, A. Holmgren, and H.
Jornvall. 1986. Characterization of somatomedins from human fetal brain: identification of a variant form of insulin-like growth factor I. Proc. Natl. Acad. Sci. U. S. A. 83: 4904-4907.
Scavo, L. M., M. Karas, M. Murray, and D. Leroith. 2004. Insulin-like growth factor-I
stimulates both cell growth and lipogenesis during differentiation of human mesenchymal stem cells into adipocytes. J. Clin. Endocrinol. Metab. 89: 3543-3553.
Scheiwiller, E., H. P. Guler, J. Merryweather, C. Scandella, W. Maerki, J. Zapf, and E. R.
Froesch. 1986. Growth restoration of insulin-deficient diabetic rats by recombinant human insulin-like growth factor I. Nature 323: 169-171.
Schoenle, E., J. Zapf, R. E. Humbel, and E. R. Froesch. 1982. Insulin-like growth factor I
stimulates growth in hypophysectomized rats. Nature 296: 252-253. Schoenle, E. J., P. D. Zenobi, T. Torresani, E. A. Werder, M. Zachmann, and E. R.
Froesch. 1991. Recombinant human insulin-like growth factor I (rhIGF I) reduces hyperglycaemia in patients with extreme insulin resistance. Diabetologia 34: 675-679.
Schumacher, R., L. Mosthaf, J. Schlessinger, D. Brandenburg, and A. Ullrich. 1991.
Insulin and insulin-like growth factor-1 binding specificity is determined by distinct regions of their cognate receptors. J. Biol. Chem. 266: 19288-19295.
Selkoe, D. J. 2001. Clearing the brain's amyloid cobwebs. Neuron 32: 177-180. Serizawa, S., K. Miyamichi, H. Nakatani, M. Suzuki, M. Saito, Y. Yoshihara, and H.
Sakano. 2003. Negative feedback regulation ensures the one receptor-one olfactory neuron rule in mouse. Science 302: 2088-2094.
Seto-Young, D., J. Zajac, H. C. Liu, Z. Rosenwaks, and L. Poretsky. 2003. The role of
mitogen-activated protein kinase in insulin and insulin-like growth factor I (IGF-I) signaling cascades for progesterone and IGF-binding protein-1 production in human granulosa cells. J. Clin. Endocrinol. Metab. 88: 3385-3391.
Shamblott, M. J., and T. T. Chen. 1993. Age-related and tissue-specific levels of five
forms of insulin-like growth factor mRNA in a teleost. Mol. Mar. Biol. Biotechnol. 2: 351-361.
154
Shemer, J., M. L. Adamo, C. T. Roberts, Jr., and D. LeRoith. 1992. Tissue-specific transcription start site usage in the leader exons of the rat insulin-like growth factor-I gene: evidence for differential regulation in the developing kidney. Endocrinology 131: 2793-2799.
Shimatsu, A., and P. Rotwein. 1987a. Mosaic evolution of the insulin-like growth factors.
Organization, sequence, and expression of the rat insulin-like growth factor I gene. J. Biol. Chem. 262: 7894-7900.
Shimatsu, A., and P. Rotwein. 1987b. Sequence of two rat insulin-like growth factor I
mRNAs differing within the 5' untranslated region. Nucleic Acids Res 15: 7196. Shoba, L., M. R. An, S. J. Frank, and W. L. Lowe, Jr. 1999. Developmental regulation of
insulin-like growth factor-I and growth hormone receptor gene expression. Mol. Cell. Endocrinol. 152: 125-136.
Shuldiner, A. R., A. Nirula, L. A. Scott, and J. Roth. 1990. Evidence that Xenopus laevis
contains two different nonallelic insulin-like growth factor-I genes. Biochem. Biophys. Res. Commun. 166: 223-230.
Siegfried, J. M., P. G. Kasprzyk, A. M. Treston, J. L. Mulshine, K. A. Quinn, and F.
Cuttitta. 1992. A mitogenic peptide amide encoded within the E peptide domain of the insulin-like growth factor IB prohormone. Proc. Natl. Acad. Sci. U. S. A. 89: 8107-8111.
Simmen, R. C., F. A. Simmen, A. Hofig, S. J. Farmer, and F. W. Bazer. 1990. Hormonal
regulation of insulin-like growth factor gene expression in pig uterus. Endocrinology 127: 2166-2174.
Simmons, J. G., J. J. Van Wyk, E. C. Hoyt, and P. K. Lund. 1993. Multiple transcription
start sites in the rat insulin-like growth factor-I gene give rise to IGF-I mRNAs that encode different IGF-I precursors and are processed differently in vitro. Growth Factors 9: 205-221.
Sjogren, K., J. L. Liu, K. Blad, S. Skrtic, O. Vidal, V. Wallenius, D. LeRoith, J. Tornell,
O. G. Isaksson, J. O. Jansson, and C. Ohlsson. 1999. Liver-derived insulin-like growth factor I (IGF-I) is the principal source of IGF-I in blood but is not required for postnatal body growth in mice. Proc. Natl. Acad. Sci. U. S. A. 96: 7088-7092.
Sjogren, K., M. Sheng, S. Moverare, J. L. Liu, K. Wallenius, J. Tornell, O. Isaksson, J. O.
Jansson, S. Mohan, and C. Ohlsson. 2002. Effects of liver-derived insulin-like growth factor I on bone metabolism in mice. J. Bone Miner. Res. 17: 1977-1987.
155
Sjogren, K., K. Wallenius, J. L. Liu, Y. M. Bohlooly, G. Pacini, L. Svensson, J. Tornell, O. G. Isaksson, B. Ahren, J. O. Jansson, and C. Ohlsson. 2001. Liver-derived IGF-I is of importance for normal carbohydrate and lipid metabolism. Diabetes 50: 1539-1545.
Smith, J. M., M. E. Van Amburgh, M. C. Diaz, M. C. Lucy, and D. E. Bauman. 2002.
Effect of nutrient intake on the development of the somatotropic axis and its responsiveness to GH in Holstein bull calves. J. Anim. Sci. 80: 1528-1537.
Snyder, D. K., D. R. Clemmons, and L. E. Underwood. 1989. Dietary carbohydrate
content determines responsiveness to growth hormone in energy-restricted humans. J. Clin. Endocrinol. Metab. 69: 745-752.
Soldaini, E., S. John, S. Moro, J. Bollenbacher, U. Schindler, and W. J. Leonard. 2000.
DNA binding site selection of dimeric and tetrameric Stat5 proteins reveals a large repertoire of divergent tetrameric Stat5a binding sites. Mol. Cell. Biol. 20: 389-401.
Soos, M. A., C. E. Field, R. Lammers, A. Ullrich, B. Zhang, R. A. Roth, A. S. Andersen,
T. Kjeldsen, and K. Siddle. 1992. A panel of monoclonal antibodies for the type I insulin-like growth factor receptor. Epitope mapping, effects on ligand binding, and biological activity. J. Biol. Chem. 267: 12955-12963.
Steenbergh, P. H., A. M. Koonen-Reemst, C. B. Cleutjens, and J. S. Sussenbach. 1991.
Complete nucleotide sequence of the high molecular weight human IGF-I mRNA. Biochem. Biophys. Res. Commun. 175: 507-514.
Stiles, C. D., G. T. Capone, C. D. Scher, H. N. Antoniades, J. J. Van Wyk, and W. J.
Pledger. 1979. Dual control of cell growth by somatomedins and platelet-derived growth factor. Proc. Natl. Acad. Sci. U. S. A. 76: 1279-1283.
Stracke, M. L., J. D. Engel, L. W. Wilson, M. M. Rechler, L. A. Liotta, and E.
Schiffmann. 1989. The type I insulin-like growth factor receptor is a motility receptor in human melanoma cells. J. Biol. Chem. 264: 21544-21549.
Straus, D. S., and E. J. Burke. 1995. Glucose stimulates IGF-I gene expression in C6
glioma cells. Endocrinology 136: 365-368. Straus, D. S., and C. D. Takemoto. 1990a. Effect of dietary protein deprivation on
insulin-like growth factor (IGF)-I and -II, IGF binding protein-2, and serum albumin gene expression in rat. Endocrinology 127: 1849-1860.
156
Straus, D. S., and C. D. Takemoto. 1990b. Effect of fasting on insulin-like growth factor-I (IGF-I) and growth hormone receptor mRNA levels and IGF-I gene transcription in rat liver. Mol. Endocrinol. 4: 91-100.
Sun, Q., A. Mayeda, R. K. Hampson, A. R. Krainer, and F. M. Rottman. 1993. General
splicing factor SF2/ASF promotes alternative splicing by binding to an exonic splicing enhancer. Genes Dev. 7: 2598-2608.
Tagliaferri, M., M. Scacchi, A. I. Pincelli, M. E. Berselli, P. Silvestri, A. Montesano, S.
Ortolani, A. Dubini, and F. Cavagnini. 1998. Metabolic effects of biosynthetic growth hormone treatment in severely energy-restricted obese women. Int. J. Obes. Relat. Metab. Disord. 22: 836-841.
Takahashi, S., M. Kajikawa, T. Umezawa, S. Takahashi, H. Kato, Y. Miura, T. J. Nam, T.
Noguchi, and H. Naito. 1990. Effect of dietary proteins on the plasma immunoreactive insulin-like growth factor-1/somatomedin C concentration in the rat. Br. J. Nutr. 63: 521-534.
Takenaka, A., N. Oki, S. I. Takahashi, and T. Noguchi. 2000. Dietary restriction of single
essential amino acids reduces plasma insulin-like growth factor-I (IGF-I) but does not affect plasma IGF-binding protein-1 in rats. J. Nutr. 130: 2910-2914.
Tan, D. S., A. Cook, and S. L. Chew. 2002. Nucleolar localization of an isoform of the
IGF-I precursor. BMC Cell Biol 3: 17. Teglund, S., C. McKay, E. Schuetz, J. M. van Deursen, D. Stravopodis, D. Wang, M.
Brown, S. Bodner, G. Grosveld, and J. N. Ihle. 1998. Stat5a and Stat5b proteins have essential and nonessential, or redundant, roles in cytokine responses. Cell 93: 841-850.
Thissen, J. P., M. L. Davenport, J. B. Pucilowska, M. V. Miles, and L. E. Underwood.
1992. Increased serum clearance and degradation of 125I-labeled IGF-I in protein-restricted rats. Am. J. Physiol. 262: E406-411.
Thissen, J. P., J. M. Ketelslegers, and L. E. Underwood. 1994a. Nutritional regulation of
the insulin-like growth factors. Endocr. Rev. 15: 80-101. Thissen, J. P., J. B. Pucilowska, and L. E. Underwood. 1994b. Differential regulation of
insulin-like growth factor I (IGF-I) and IGF binding protein-1 messenger ribonucleic acids by amino acid availability and growth hormone in rat hepatocyte primary culture. Endocrinology 134: 1570-1576.
Thissen, J. P., S. Triest, B. M. Moats-Staats, L. E. Underwood, T. Mauerhoff, D. Maiter,
and J. M. Ketelslegers. 1991a. Evidence that pretranslational and translational
157
defects decrease serum insulin-like growth factor-I concentrations during dietary protein restriction. Endocrinology 129: 429-435.
Thissen, J. P., and L. E. Underwood. 1992. Translational status of the insulin-like growth
factor-I mRNAs in liver of protein-restricted rats. J. Endocrinol. 132: 141-147. Thissen, J. P., L. E. Underwood, D. Maiter, M. Maes, D. R. Clemmons, and J. M.
Ketelslegers. 1991b. Failure of insulin-like growth factor-I (IGF-I) infusion to promote growth in protein-restricted rats despite normalization of serum IGF-I concentrations. Endocrinology 128: 885-890.
Thomas, J. W., J. W. Touchman, R. W. Blakesley, G. G. Bouffard, S. M. Beckstrom-
Sternberg, E. H. Margulies, M. Blanchette, A. C. Siepel, P. J. Thomas, J. C. McDowell, B. Maskeri, N. F. Hansen, M. S. Schwartz, R. J. Weber, W. J. Kent, D. Karolchik, T. C. Bruen, R. Bevan, D. J. Cutler, S. Schwartz, L. Elnitski, J. R. Idol, A. B. Prasad, S. Q. Lee-Lin, V. V. Maduro, T. J. Summers, M. E. Portnoy, N. L. Dietrich, N. Akhter, K. Ayele, B. Benjamin, K. Cariaga, C. P. Brinkley, S. Y. Brooks, S. Granite, X. Guan, J. Gupta, P. Haghighi, S. L. Ho, M. C. Huang, E. Karlins, P. L. Laric, R. Legaspi, M. J. Lim, Q. L. Maduro, C. A. Masiello, S. D. Mastrian, J. C. McCloskey, R. Pearson, S. Stantripop, E. E. Tiongson, J. T. Tran, C. Tsurgeon, J. L. Vogt, M. A. Walker, K. D. Wetherby, L. S. Wiggins, A. C. Young, L. H. Zhang, K. Osoegawa, B. Zhu, B. Zhao, C. L. Shu, P. J. De Jong, C. E. Lawrence, A. F. Smit, A. Chakravarti, D. Haussler, P. Green, W. Miller, and E. D. Green. 2003. Comparative analyses of multi-species sequences from targeted genomic regions. Nature 424: 788-793.
Thomas, M. J., K. Kikuchi, D. P. Bichell, and P. Rotwein. 1994. Rapid activation of rat
insulin-like growth factor-I gene transcription by growth hormone reveals no alterations in deoxyribonucleic acid-protein interactions within the major promoter. Endocrinology 135: 1584-1592.
Thomas, M. J., K. Kikuchi, D. P. Bichell, and P. Rotwein. 1995. Characterization of
deoxyribonucleic acid-protein interactions at a growth hormone-inducible nuclease hypersensitive site in the rat insulin-like growth factor-I gene. Endocrinology 136: 562-569.
Thomas, M. J., Y. Umayahara, H. Shu, M. Centrella, P. Rotwein, and T. L. McCarthy.
1996. Identification of the cAMP response element that controls transcriptional activation of the insulin-like growth factor-I gene by prostaglandin E2 in osteoblasts. J. Biol. Chem. 271: 21835-21841.
Timsit, J., W. Savino, B. Safieh, P. Chanson, M. C. Gagnerault, J. F. Bach, and M.
Dardenne. 1992. Growth hormone and insulin-like growth factor-I stimulate
158
hormonal function and proliferation of thymic epithelial cells. J. Clin. Endocrinol. Metab. 75: 183-188.
Tivesten, A., E. Bollano, I. Andersson, S. Fitzgerald, K. Caidahl, K. Sjogren, O. Skott, J.
L. Liu, R. Mobini, O. G. Isaksson, J. O. Jansson, C. Ohlsson, G. Bergstrom, and J. Isgaard. 2002. Liver-derived insulin-like growth factor-I is involved in the regulation of blood pressure in mice. Endocrinology 143: 4235-4242.
Tobin, G., D. Yee, N. Brunner, and P. Rotwein. 1990. A novel human insulin-like growth
factor I messenger RNA is expressed in normal and tumor cells. Mol. Endocrinol. 4: 1914-1920.
Tumber, A., M. C. Meikle, and P. A. Hill. 2000. Autocrine signals promote osteoblast
survival in culture. J. Endocrinol. 167: 383-390. Turkalj, I., U. Keller, R. Ninnis, S. Vosmeer, and W. Stauffacher. 1992. Effect of
increasing doses of recombinant human insulin-like growth factor-I on glucose, lipid, and leucine metabolism in man. J. Clin. Endocrinol. Metab. 75: 1186-1191.
Twigg, S. M., and R. C. Baxter. 1998. Insulin-like growth factor (IGF)-binding protein 5
forms an alternative ternary complex with IGFs and the acid-labile subunit. J. Biol. Chem. 273: 6074-6079.
Twigg, S. M., M. C. Kiefer, J. Zapf, and R. C. Baxter. 1998. Insulin-like growth factor-
binding protein 5 complexes with the acid-labile subunit. Role of the carboxyl-terminal domain. J. Biol. Chem. 273: 28791-28798.
Udy, G. B., R. P. Towers, R. G. Snell, R. J. Wilkins, S. H. Park, P. A. Ram, D. J.
Waxman, and H. W. Davey. 1997. Requirement of STAT5b for sexual dimorphism of body growth rates and liver gene expression. Proc. Natl. Acad. Sci. U. S. A. 94: 7239-7244.
Ueki, I., G. T. Ooi, M. L. Tremblay, K. R. Hurst, L. A. Bach, and Y. R. Boisclair. 2000.
Inactivation of the acid labile subunit gene in mice results in mild retardation of postnatal growth despite profound disruptions in the circulating insulin-like growth factor system. Proc. Natl. Acad. Sci. U. S. A. 97: 6868-6873.
Ullrich, A., A. Gray, A. W. Tam, T. Yang-Feng, M. Tsubokawa, C. Collins, W. Henzel,
T. Le Bon, S. Kathuria, E. Chen, and et al. 1986. Insulin-like growth factor I receptor primary structure: comparison with insulin receptor suggests structural determinants that define functional specificity. EMBO J. 5: 2503-2512.
Umayahara, Y., R. Kawamori, H. Watada, E. Imano, N. Iwama, T. Morishima, Y.
Yamasaki, Y. Kajimoto, and T. Kamada. 1994. Estrogen regulation of the insulin-
159
like growth factor I gene transcription involves an AP-1 enhancer. J. Biol. Chem. 269: 16433-16442.
Vikman, K., J. Isgaard, and S. Eden. 1991. Growth hormone regulation of insulin-like
growth factor-I mRNA in rat adipose tissue and isolated rat adipocytes. J. Endocrinol. 131: 139-145.
Vong, Q. P., K. M. Chan, K. Leung, and C. H. Cheng. 2003. Common carp insulin-like
growth factor-I gene: complete nucleotide sequence and functional characterization of the 5'-flanking region. Gene 322: 145-156.
Walenkamp, M. J., M. Karperien, A. M. Pereira, Y. Hilhorst-Hofstee, J. van Doorn, J. W.
Chen, S. Mohan, A. Denley, B. Forbes, H. A. van Duyvenvoorde, S. W. van Thiel, C. A. Sluimers, J. J. Bax, J. A. de Laat, M. B. Breuning, J. A. Romijn, and J. M. Wit. 2005. Homozygous and heterozygous expression of a novel insulin-like growth factor-I mutation. J. Clin. Endocrinol. Metab. 90: 2855-2864.
Wallis, A. E., and R. H. Devlin. 1993. Duplicate insulin-like growth factor-I genes in
salmon display alternative splicing pathways. Mol. Endocrinol. 7: 409-422. Wang, L., and M. L. Adamo. 2000. Cell density influences insulin-like growth factor I
gene expression in a cell type-specific manner. Endocrinology 141: 2481-2489. Wang, Y., S. Eleswarapu, W. E. Beal, W. S. Swecker, Jr., R. M. Akers, and H. Jiang.
2003a. Reduced serum insulin-like growth factor (IGF) I is associated with reduced liver IGF-I mRNA and liver growth hormone receptor mRNA in food-deprived cattle. J. Nutr. 133: 2555-2560.
Wang, Y., and H. Jiang. 2005. Identification of a distal STAT5-binding DNA region that
may mediate growth hormone regulation of insulin-like growth factor-I gene expression. J. Biol. Chem. 280: 10955-10963.
Wang, Y., S. E. Price, and H. Jiang. 2003b. Cloning and characterization of the bovine
class 1 and class 2 insulin-like growth factor-I mRNAs. Domest. Anim. Endocrinol. 25: 315-328.
Wang, L., X. Wang, and M. L. Adamo. 2000a. Two putative GATA motifs in the
proximal exon 1 promoter of the rat insulin-like growth factor I gene regulate basal promoter activity. Endocrinology 141: 1118-1126.
Wang, L., H. Yang, and M. L. Adamo. 2000b. Glucose starvation reduces IGF-I mRNA
in tumor cells: evidence for an effect on mRNA stability. Biochem. Biophys. Res. Commun. 269: 336-346.
160
Weber, M. S., P. L. Boyle, B. A. Corl, E. A. Wong, F. C. Gwazdauskas, and R. M. Akers. 1998. Expression of ovine insulin-like growth factor-1 (IGF-1) stimulates alveolar bud development in mammary glands of transgenic mice. Endocrine 8: 251-259.
Weihua, Z., J. Ekman, A. Almkvist, S. Saji, L. Wang, M. Warner, and J. A. Gustafsson.
2002. Involvement of androgen receptor in 17beta-estradiol-induced cell proliferation in rat uterus. Biol. Reprod. 67: 616-623.
Weller, P. A., M. J. Dauncey, P. C. Bates, J. M. Brameld, P. J. Buttery, and R. S. Gilmour. 1994. Regulation of porcine insulin-like growth factor I and growth hormone receptor mRNA expression by energy status. Am. J. Physiol. 266: E776-785.
Werther, G. A., V. Russo, N. Baker, and G. Butler. 1998. The role of the insulin-like
growth factor system in the developing brain. Horm. Res. 49 Suppl 1: 37-40. Woelfle, J., J. Billiard, and P. Rotwein. 2003a. Acute control of insulin-like growth
factor-I gene transcription by growth hormone through Stat5b. J. Biol. Chem. 278: 22696-22702.
Woelfle, J., D. J. Chia, and P. Rotwein. 2003b. Mechanisms of growth hormone (GH)
action. Identification of conserved Stat5 binding sites that mediate GH-induced insulin-like growth factor-I gene activation. J. Biol. Chem. 278: 51261-51266.
Wojnar, M. M., J. Fan, R. A. Frost, M. C. Gelato, and C. H. Lang. 1995. Alterations in
the insulin-like growth factor system in trauma patients. Am. J. Physiol. 268: R970-977.
Wolf, M., S. H. Ingbar, and A. C. Moses. 1989. Thyroid hormone and growth hormone
interact to regulate insulin-like growth factor-I messenger ribonucleic acid and circulating levels in the rat. Endocrinology 125: 2905-2914.
Wong, E. A., S. M. Ohlsen, J. A. Godfredson, D. M. Dean, and J. E. Wheaton. 1989.
Cloning of ovine insulin-like growth factor-I cDNAs: heterogeneity in the mRNA population. DNA 8: 649-657.
Wood, T. J., D. Sliva, P. E. Lobie, F. Goullieux, A. L. Mui, B. Groner, G. Norstedt, and L.
A. Haldosen. 1997. Specificity of transcription enhancement via the STAT responsive element in the serine protease inhibitor 2.1 promoter. Mol. Cell. Endocrinol. 130: 69-81.
Woods, K. A., C. Camacho-Hubner, M. O. Savage, and A. J. Clark. 1996. Intrauterine
growth retardation and postnatal growth failure associated with deletion of the insulin-like growth factor I gene. N. Engl. J. Med. 335: 1363-1367.
161
Xi, G., E. Kamanga-Sollo, M. S. Pampusch, M. E. White, M. R. Hathaway, and W. R. Dayton. 2004. Effect of recombinant porcine IGFBP-3 on IGF-I and long-R3-IGF-I-stimulated proliferation and differentiation of L6 myogenic cells. J. Cell. Physiol. 200: 387-394.
Yakar, S., J. L. Liu, A. M. Fernandez, Y. Wu, A. V. Schally, J. Frystyk, S. D. Chernausek,
W. Mejia, and D. Le Roith. 2001. Liver-specific igf-1 gene deletion leads to muscle insulin insensitivity. Diabetes 50: 1110-1118.
Yakar, S., J. L. Liu, B. Stannard, A. Butler, D. Accili, B. Sauer, and D. LeRoith. 1999.
Normal growth and development in the absence of hepatic insulin-like growth factor I. Proc. Natl. Acad. Sci. U. S. A. 96: 7324-7329.
Yakar, S., C. J. Rosen, W. G. Beamer, C. L. Ackert-Bicknell, Y. Wu, J. L. Liu, G. T. Ooi,
J. Setser, J. Frystyk, Y. R. Boisclair, and D. LeRoith. 2002. Circulating levels of IGF-1 directly regulate bone growth and density. J. Clin. Invest. 110: 771-781.
Yang, H., M. L. Adamo, A. P. Koval, M. C. McGuinness, H. Ben-Hur, Y. Yang, D.
LeRoith, and C. T. Roberts, Jr. 1995. Alternative leader sequences in insulin-like growth factor I mRNAs modulate translational efficiency and encode multiple signal peptides. Mol. Endocrinol. 9: 1380-1395.
Ye, P., Y. Umayahara, D. Ritter, T. Bunting, H. Auman, P. Rotwein, and A. J. D'Ercole.
1997. Regulation of insulin-like growth factor I (IGF-I) gene expression in brain of transgenic mice expressing an IGF-I-luciferase fusion gene. Endocrinology 138: 5466-5475.
Zapf, J. 1998. Growth promotion by insulin-like growth factor I in hypophysectomized
and diabetic rats. Mol. Cell. Endocrinol. 140: 143-149. Zhang, J., D. Chrysis, and L. E. Underwood. 1998. Reduction of hepatic insulin-like
growth factor I (IGF-I) messenger ribonucleic acid (mRNA) during fasting is associated with diminished splicing of IGF-I pre-mRNA and decreased stability of cytoplasmic IGF-I mRNA. Endocrinology 139: 4523-4530.
Zhong, J., J. Deng, J. Phan, S. Dlouhy, H. Wu, W. Yao, P. Ye, A. J. D'Ercole, and W. H.
Lee. 2005. Insulin-like growth factor-I protects granule neurons from apoptosis and improves ataxia in weaver mice. J. Neurosci. Res. 80: 481-490.
Zhou, J., B. A. Dsupin, L. C. Giudice, and C. A. Bondy. 1994. Insulin-like growth factor
system gene expression in human endometrium during the menstrual cycle. J. Clin. Endocrinol. Metab. 79: 1723-1734.
162
Zhu, J. L., E. N. Kaytor, C. I. Pao, X. P. Meng, and L. S. Phillips. 2000. Involvement of Sp1 in the transcriptional regulation of the rat insulin-like growth factor-1 gene. Mol. Cell. Endocrinol. 164: 205-218.
Zhu, J. L., C. I. Pao, E. Hunter, Jr., K. W. Lin, G. J. Wu, and L. S. Phillips. 1999.
Identification of core sequences involved in metabolism-dependent nuclear protein binding to the rat insulin-like growth factor I gene. Endocrinology 140: 4761-4771.
Ziegler, T. R., M. P. Mantell, J. C. Chow, J. L. Rombeau, and R. J. Smith. 1996. Gut adaptation and the insulin-like growth factor system: regulation by glutamine and IGF-I administration. Am. J. Physiol. 271: G866-875.
Zingg, A. E., and E. R. Froesch. 1973. Effects of partially purified preparations with
nonsuppressible insulin-like activity (NSILA-S) on sulfate incorporation into rat and chicken cartilage. Diabetologia 9: 472-476.
163
Vita
Ying Wang was born on July 14, 1976 in Nanjing, Jiangsu Province, China. She
graduated from Nanjing Normal University, with a Bachelor of Science in Biology in
July 1998 and a Master of Science degree in Molecular Genetics in 2001. In 2002, she
enrolled in a Doctor of Philosophy program under the direction of Dr. H. Jiang in the
Department of Animal and Poultry Sciences at Virginia Polytechnic Institute and State
University. She is a member of the American Society of Animal Science and the
Endocrine Society.