Embed Size (px)
Citation preview

Berkeley Research Group | 1800 M Street NW, Second Floor | Washington, DC | 20036
WHITE PAPER | NOVEMBER 2014
Aaron [email protected]
Prepared By:
Healthcare
GROWTH OF THE 340B PROGRAM:PAST TRENDS, FUTURE PROJECTIONS
Copyright ©2014 by Berkeley Research Group, LLC. Except as may be expressly provided elsewhere in this publication, permission is hereby granted to produce and distribute copies of individual works from this publication for non-profit educational purposes, provided that the author, source, and copyright notice are included on each copy. This permission is in addition to rights of reproduction granted under Sections 107, 108, and other provisions of the U.S. Copyright Act and its amendments.
Disclaimer: The opinions expressed in this publication are those of the individual author and do not represent the opinions of BRG or its other employees and affiliates. This study was funded by the Alliance for Integrity and Reform of 340B. The information provided in the publication is not intended to and does not render legal, accounting, tax, or other professional advice or services, and no client relationship is established with BRG by making any information available in this publication, or from you transmitting an email or other message to us. None of the information contained herein should be used as a substitute for consultation with competent advisors.
GROWTH OF THE 340B PROGRAM
WHITE PAPER BERKELEY RESEARCH GROUP
1
Executive Summary
The 340B program provides certain healthcare providers (referred to as “covered entities”) access to deeply discounted pharmaceuticals for outpatient use. Congress created the program in 1992 to help uninsured and vulnerable patients gain better access to prescription medicines by restoring discounts that had been provided voluntarily before the Medicaid rebate statute created a disincentive to providing those discounts. Recent government reports have noted the dramatic growth in the 340B program and questioned whether this growth is benefiting underserved patients, given that the Health Resources and Services Administration (HRSA) has not imposed any requirements on disproportionate share hospital (DSH) hospitals on how to use savings realized through the 340B program.1 These questions are particularly relevant because DSH hospitals now account for over 80 percent of total 340B sales.2 These reports have also raised interest in the various factors that have contributed to the growth in 340B participation by DSH hospitals, which has been the result of policy changes that have both directly and indirectly impacted the 340B program.
This paper demonstrates that during the past decade, hundreds of new hospitals became eligible for and enrolled in the 340B program under the eligibility pathway for DSH hospitals. This has contributed to dramatic growth in the program, which has seen total sales increase from $1.1 billion3 in 1997 to more than $7 billion by 2013.4 In the same period, DSH hospitals’ share of total 340B sales has increased from 42 percent5 to more than 80 percent.6 Although newly eligible DSH entities have been a significant driver of growth, that is not the only growth driver. Hospital acquisitions of satellite clinics, multiple-contract pharmacy arrangements, and changes in the Affordable Care Act (ACA) have also contributed to this growth. This study seeks to better understand historical and future growth in the 340B program by:
• Identifying and measuring the impact of historical drivers of growth in the 340B program
• Determining which historical drivers will continue to expand the 340B program during the next five years, and identifying new growth drivers
• Estimating both total 340B purchases to be made by covered entities and total 340B discounts to be paid by pharmaceutical manufacturers during the next five years
Using a combination of data maintained by HRSA’s Office of Pharmacy Affairs (OPA), aggregated data from manufacturers on 340B discounts, and other third-party data, a series of analyses were constructed to assess historical growth in the 340B program. Models were then built to estimate future growth in the 340B program given the current legislative and regulatory frameworks. Based on this analysis, the author arrived at the following conclusions:
1 The number of DSH hospitals enrolled in the 340B program increased from 185 entities in 2003 to approximately 970 entities by 2013. Over this same period, newly enrolled DSH entities have been the single biggest driver of growth in
1 Stuart Wright, “Memorandum Report: Contract Pharmacy Arrangements in the 340B Program, OEI-05-13-00431,” Department of Health and Human Services, Office of Inspector General (February 4, 2014), accessed at: https://oig.hhs.gov/oei/reports/oei-05-13-00431.pdf; U.S. Government Accountability Office, “DRUG PRICING: Manufacturer Discounts in the 340B Program Offer Benefits, but Federal Oversight Needs Improvement,” GAO-11-836 (September 23, 2011), accessed at: http://www.gao.gov/products/GAO-11-836; Ariel Winter and Daniel Zabinski, “The 340B Drug Pricing Program,” MedPAC (November 6, 2014), accessed at: http://www.medpac.gov/documents/november-2014-meeting-presentation-the-340b-drug-pricing-program.pdf?sfvrsn=0
2 Analysis by BRG experts of more than $7.1 billion in 340B sales from 2010 to 2013 provided by five pharmaceutical manufacturers.
3 Anna Cook and Ning Dong, An Analysis of Purchases, Savings and Participation in the PHS Drug Pricing Program, Mathematica Policy Research Inc. (July 8, 1999).
4 Winter and Zabinski (2014).
5 Winter and Zabinski (2014).
6 Analysis by BRG experts of more than $7.1 billion in 340B sales from 2010 to 2013 provided by five pharmaceutical manufacturers.
WHITE PAPER
GROWTH OF THE 340B PROGRAM
BERKELEY RESEARCH GROUP
2
the 340B program accounting for an estimated 50 percent of total 2013 340B drug sales. Most recently, between 2010 and 2013, overall 340B sales to DSH hospitals have grown by 96 percent, which is a function of factors including new hospital enrollments, community healthcare practice acquisitions and contract pharmacy arrangements.
2 Absent substantive changes in legislation by Congress or rulemaking by HRSA, the 340B program will continue to grow at a significant rate during the next five years and is projected to account for more than $16 billion in drug sales (at the discounted 340B price) by 2019. This growth will be driven primarily by hospital acquisitions of community practices, contract pharmacy utilization, and expansion of the Medicaid program pursuant to the ACA.
3 By 2019, it is projected that pharmaceutical drug manufacturers will be paying more than $11 billion in discounts annually for outpatient drugs purchased by covered entities through the 340B program.
Historical Growth in the 340B Program
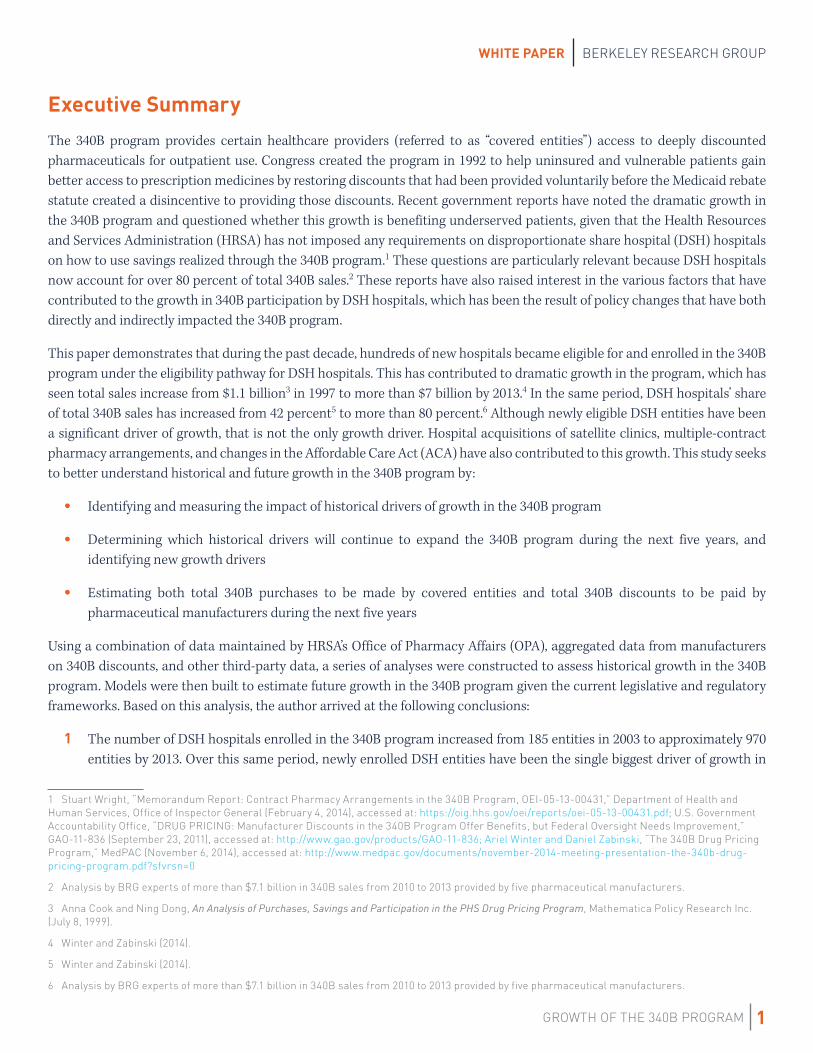
Established in 1992 through section 340B of the Public Health Service Act, the 340B program requires manufacturers to offer discounted pharmaceuticals to covered entities for eligible outpatient use. There is little research on sales volume through the program during its early years, but by 1997 the 340B program accounted for $1.1 billion in drug sales.7 However, as shown in Figure 1, the program has grown dramatically since that time, particularly over the last ten years, and now represents at least $7.1 billion in total 340B drug sales. This figure is probably closer to $8 billion in 340B drug sales, as the 2013 sales total in Figure 1 is based on data from Apexus that excludes direct sales and other 340B sales not captured by Apexus (e.g. ADAP rebate sales). This point is illustrated through a comparison of the 2004 sales figure below ($2.65 billion), which is calculated using 340B purchase history from covered entities and includes direct sales and other 340B sales not captured by Apexus, and the 2005 sales figure ($2.4 billion) which is based on Apexus data and excludes some 340B sales. The apparent decrease in sales is most likely a function of Apexus reporting on an incomplete dataset.
FIGURE 1
Mathematica Study8
Mathematica Study9
Apexus
Apexus
Apexus10
7 Cook and Dong (1999).
8 Cook and Dong (1999).
9 Robert Schultz, So Limpa-Amara, Julita Milliner-Waddell and Frank Potter, The PHS 340B Drug Pricing Program: Results of a Survey of Eligible Entities, Mathematica Policy Research Inc. (August 30, 2004).
10 Winter and Zabinski (2014).
Estimated 340B Purchase Volume (billions)
$0.88–$1.2
$2.65
$2.4
$5.3
$7.1
Source
1997
2004
2005
2010
2013
GROWTH OF THE 340B PROGRAM
WHITE PAPER BERKELEY RESEARCH GROUP
3
31%
50%
5%
3% 2%
2% 2%
5%
Percentage of Total 2011–2013 340B Purchases by Entity Type
DSH Enrolled Pre-2004
DSH Enrolled 2004 or Later
HIV
CH
CAH
SCH
PED
Other
Percentage of Total 340B Sales by Entity Type
This recent growth in the 340B program is driven by legislative, regulatory, and covered entity behavioral factors. Some factors played a larger role earlier in this period; others have fueled more recent growth. By analyzing the OPA database and aggregated manufacturer data, four key drivers of historical growth were identified:
• Increase in the number of 340B-enrolled DSH hospitals
• Acquisitions of satellite clinics by DSH hospitals
• Expansion of contract pharmacy arrangements
• Creation of new eligibility categories in the Affordable Care Act
Increase in 340B Enrolled DSH Hospitals
The number of DSH hospitals participating in the 340B program has grown significantly over time and is a primary driver of overall growth in the program. Several factors, including the Medicare Modernization Act (which changed the way DSH percentages were calculated for certain hospitals) and increased Medicaid enrollment following the Great Recession (which increased the DSH percentage for many hospitals), greatly increased the number of entities that met the DSH percentage requirement (11.75 percent) for participation in the 340B program.11 From 2003 to 2013, the number of 340B DSH hospitals increased from 185 to 968, and currently about one-third of all hospitals are participating in the 340B program.12
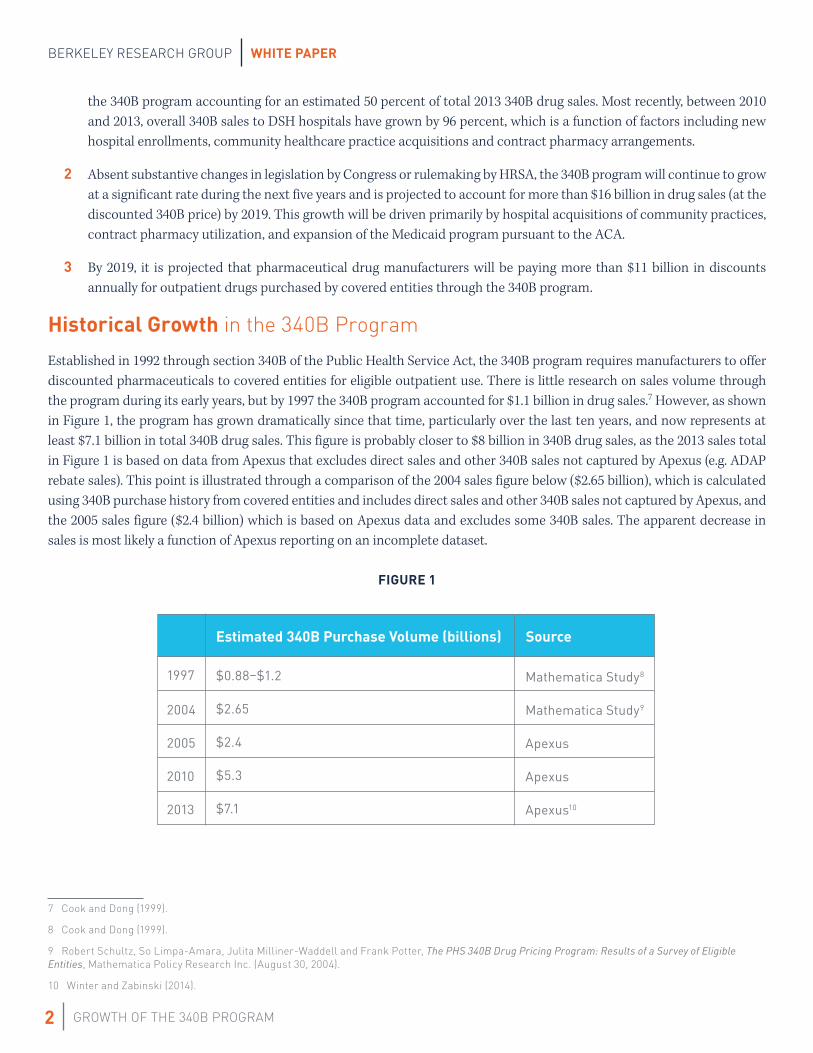
The growth in DSH hospital enrollments is significant because these entities are the single largest purchaser of 340B drugs. A 1997 study of 340B drug sales determined that DSH hospitals accounted for 42 percent of total 340B sales.13 By 2013, this percentage had increased to more than 80 percent, and the approximately 890 DSH hospitals that have enrolled in the program since 2004 accounted for more than 50 percent of total 2013 340B sales (see Figure 2). The larger number of DSH hospital enrollments is also significant because these entities are actively expanding 340B sales through the acquisition of community oncology practices and contract pharmacy arrangements, as discussed in the following two sections of this report.
FIGURE 214
11 Public Law 108–173
12 Analysis by BRG experts of OPA 340B covered entity enrollments.
13 Cook and Dong (1999).
14 Analysis by BRG experts of more than $7.1 billion in 340B sales from 2010 to 2013 provided by five pharmaceutical manufacturers. DSH = Disproportionate Share Hospital, HIV = Ryan White Clinics (all types), CH = Community Health Centers, CAH = Critical Access Hospitals, SCH = Sole Community Hospitals, PED = Pediatric Hospitals, Other = All other types of 340B covered entities.
Source
WHITE PAPER
GROWTH OF THE 340B PROGRAM
BERKELEY RESEARCH GROUP
4
DSH Hospitals’ Acquisitions of Community Oncology Practices
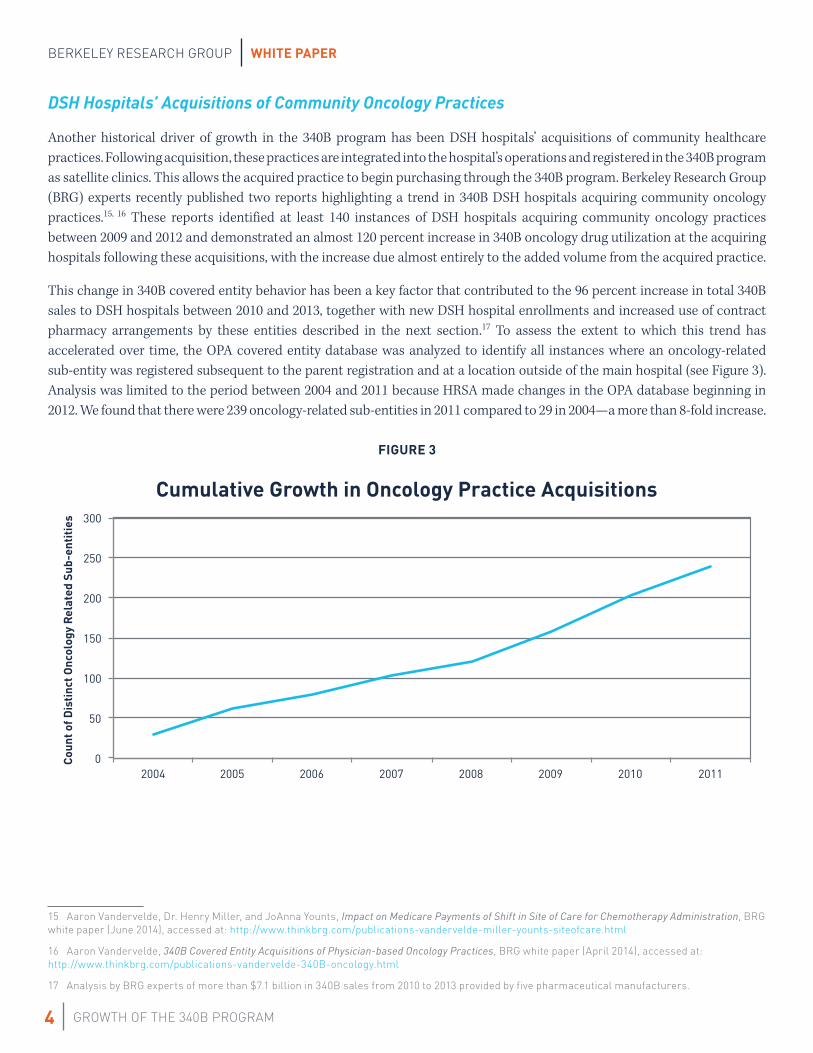
Another historical driver of growth in the 340B program has been DSH hospitals’ acquisitions of community healthcare practices. Following acquisition, these practices are integrated into the hospital’s operations and registered in the 340B program as satellite clinics. This allows the acquired practice to begin purchasing through the 340B program. Berkeley Research Group (BRG) experts recently published two reports highlighting a trend in 340B DSH hospitals acquiring community oncology practices.15, 16 These reports identified at least 140 instances of DSH hospitals acquiring community oncology practices between 2009 and 2012 and demonstrated an almost 120 percent increase in 340B oncology drug utilization at the acquiring hospitals following these acquisitions, with the increase due almost entirely to the added volume from the acquired practice.
This change in 340B covered entity behavior has been a key factor that contributed to the 96 percent increase in total 340B sales to DSH hospitals between 2010 and 2013, together with new DSH hospital enrollments and increased use of contract pharmacy arrangements by these entities described in the next section.17 To assess the extent to which this trend has accelerated over time, the OPA covered entity database was analyzed to identify all instances where an oncology-related sub-entity was registered subsequent to the parent registration and at a location outside of the main hospital (see Figure 3). Analysis was limited to the period between 2004 and 2011 because HRSA made changes in the OPA database beginning in 2012. We found that there were 239 oncology-related sub-entities in 2011 compared to 29 in 2004—a more than 8-fold increase.
FIGURE 3
15 Aaron Vandervelde, Dr. Henry Miller, and JoAnna Younts, Impact on Medicare Payments of Shift in Site of Care for Chemotherapy Administration, BRG white paper (June 2014), accessed at: http://www.thinkbrg.com/publications-vandervelde-miller-younts-siteofcare.html
16 Aaron Vandervelde, 340B Covered Entity Acquisitions of Physician-based Oncology Practices, BRG white paper (April 2014), accessed at: http://www.thinkbrg.com/publications-vandervelde-340B-oncology.html
17 Analysis by BRG experts of more than $7.1 billion in 340B sales from 2010 to 2013 provided by five pharmaceutical manufacturers.
0
50
100
150
200
250
300
2004 2005 2006 2007 2008 2009 2010 2011
Coun
t of D
isti
nct O
ncol
ogy
Rela
ted
Sub-
enti
ties
Cumulative Growth in Oncology Practice Acquisitions

GROWTH OF THE 340B PROGRAM
WHITE PAPER BERKELEY RESEARCH GROUP
5
0
100
200
300
400
500
600
700
1 2 3 4 1 2 3 4 1 2 3 4 1 2 3 4 1 2 3 4
2010 2011 2012 2013 2014
Coun
t of D
SH H
ospi
tals
wit
h 5+
Con
trac
t Pha
rmac
ies
Quarter
Recent Trend in 340B DSH Hospital Adoption of Large Numbers of Contract Pharmacy Networks
DSH Hospitals with 5 or More Contract Pharmacies
Contract Pharmacy Arrangement Expansion
In 1996, HRSA issued guidance stating that it would allow 340B covered entities to contract with a single retail pharmacy to dispense 340B drugs to eligible patients.18 In 2010, following a demonstration project that allowed approximately 30 covered entities to contract with more than one contract pharmacy, subject to stringent annual audit requirements, HRSA issued guidance allowing all 340B covered entities to contract with an unlimited number of pharmacies (retail, specialty, or mail order).19 Notably, this 2010 guidance did not continue the requirement for annual audits, although HRSA stated in the guidance that it does recommend independent audits. Following this 2010 guidance, the number of 340B covered entities contracting with multiple pharmacies and the number of contract pharmacy arrangements per covered entity have grown dramatically.
Figure 4 demonstrates that DSH hospitals have rapidly adopted arrangements with multiple contract pharmacies since 2010. While community health centers have also adopted these arrangements, because far fewer patients are seen in these settings, the impact of these arrangements on 340B sales is much less. As of October 2014, almost two-thirds of all 340B DSH hospitals had established contract pharmacy arrangements with at least five distinct pharmacies and many DSH hospitals had arrangements with more than 50 pharmacies. Based on an analysis of aggregated manufacturer data, the majority (61 percent) of all sales going through contract pharmacies can be traced back to a DSH hospital and overall contract pharmacy utilization at 340B DSH hospitals doubled from 440,000 units in 2010 to 880,000 units in 2013.20 Contract pharmacy arrangements—in conjunction with new DSH enrollments and community oncology practice acquisitions—have contributed to the 96 percent increase in the total 340B sales to DSH hospitals between 2010 and 2013. While there was similar growth in community health center 340B sales during this time period, these sales continue to account for a very small percent of total 340B sales.21
FIGURE 422
18 61 FR 43549, August 23, 1996.
19 75 FR 10272, March 5, 2010.
20 Analysis by BRG experts of more than $7.1 billion in 340B sales from 2010 to 2013 provided by five pharmaceutical manufacturers.
21 Analysis by BRG experts of more than $7.1 billion in 340B sales from 2010 to 2013 provided by five pharmaceutical manufacturers.
22 A DSH hospital is determined to have five or more contract pharmacy arrangements if at least five distinct pharmacies are contracted with either the parent entity or any of the sub-entities.

WHITE PAPER
GROWTH OF THE 340B PROGRAM
BERKELEY RESEARCH GROUP
6
Impact of the Affordable Care Act, 2010–2013
The Affordable Care Act established new eligibility categories in the 340B program for pediatric hospitals,23 critical access hospitals, sole community hospitals, rural referral centers, and freestanding cancer centers.24 To date, more than 1,100 of the approximately 1,600 entities potentially eligible under these new pathways have enrolled in the 340B program and remain active as of October 1, 2014.25 These entities are typically much smaller than DSH hospitals in terms of outpatient revenue and therefore purchase much smaller volumes of 340B drugs. Currently, these entities account for about 9 percent of total 340B drug sales and thus represent a notable increase in the 340B program. Although the majority of entities eligible through these pathways have already enrolled in the 340B program, there likely will be additional future growth attributable to these types of hospitals as additional new enrollments occur.
Future Growth in the 340B Program
Despite a decade of growth in the 340B program, there is every indication that the program will continue to rapidly expand during the next five years. Each of the four trends that were identified as having contributed significantly to historical growth will continue to impact future 340B growth: increase in 340B-enrolled DSH hospitals, DSH hospitals’ acquisitions of satellite clinics, contract pharmacy arrangement expansion, and changes made by the Affordable Care Act. With respect to this first trend, the Affordable Care Act’s Medicaid expansion that began in 2014 is expected to accelerate the trend in newly eligible DSH hospitals. Using the historical analysis of growth, a series of models were developed that estimate future growth in the 340B program attributable to each growth driver. Figure 5 shows the results of this modeling and forecasts $16.8 billion (at the 340B price) in total 340B sales by 2019.
FIGURE 526
23 Pediatric hospitals began participating in the 340B program as early as October 2009. However, the Patient Protection and Affordable Care Act also established a 340B eligibility category specific to pediatric hospitals and clarified the DSH eligibility criteria for these hospitals.
24 Public Law 111 – 148.
25 Analysis by BRG experts of the OPA database and CMS hospital cost reports.
26 340B sales estimates include all 340B program purchases including direct sales and ADAP rebates sales not typically included in Apexus figures. Growth attributable to health reform refers to new enrollments of critical access hospitals while growth attributable to Medicaid expansion refers to new enrollments of hospitals with a DSH eligibility criterion.
$0
$2
$4
$6
$8
$10
$12
$14
$16
$18
2014 2015 2016 2017 2018 2019
Tota
l 340
Sal
es in
$B
Estimated Sales through the 340B Program at the 340B Price
2013 Estimated 340B Program Sales Contract Pharmacies Oncology Practice Acquisitions Medicaid Expansion Health Reform
$8.8B
$10.1B
$12.3B
$13.9B
$15.2B $16.8B

GROWTH OF THE 340B PROGRAM
WHITE PAPER BERKELEY RESEARCH GROUP
7
Assuming the 340B price represents a 40 percent discount off wholesale acquisition cost, the $16.8 billion in 340B drug sales in 2019 will result in pharmaceutical manufacturers paying more than $11 billion in 340B discounts for 340B sales made in 2019. Appendix A provides a more detailed discussion of the methodology used to develop estimates of future growth in the 340B program.
DSH Hospitals’ Acquisitions of Community Oncology Practices
Both of the two previously referenced studies27 on 340B DSH hospitals’ community oncology practice acquisitions and the analysis of historical registrations of oncology-related sub-entities indicate a clear trend in expansion of 340B drug sales through the acquisition of community oncology practices. In addition to oncology acquisitions, a review of sub-entity names listed in the OPA database also identified dialysis centers, pain clinics and diagnostic/imaging facilities as potential targets of hospital acquisitions.
External market forces such as declining reimbursement for physician-based oncology services are putting pressure on the financial health of community practices. This pressure makes these independent practices vulnerable to acquisitions from 340B DSH hospitals, which are able to leverage the 340B discounts and higher hospital reimbursements to make economically attractive offers to acquire the practices. These built-in advantages typically make these clinics more profitable after acquisition by a 340B hospital than they were when operated independently; hospitals are able to receive both higher reimbursement rates and 340B discounts without any other changes to the formerly independent practice. Our model estimates these acquisitions likely will contribute an additional $1.5 billion in 340B drug sales by 2019.
Expansion of Contract Pharmacy Arrangements
Based on historical contract-pharmacy adoption rates, it is likely that more than 90 percent of DSH hospitals will have contract pharmacies as part of their 340B operations by 2019. As noted in Figure 2 above, DSH hospitals account for 81 percent of total 340B sales and will be the primary driver of 340B utilization growth through contract pharmacies.
There is also evidence that the use of contract pharmacies is evolving. Figure 4 demonstrates that the number of DSH hospitals with five or more contract pharmacies is increasing, which indicates that hospitals are covering a broader geographical area through their contract pharmacy arrangements. The inclusion of specialty pharmacies as a contract pharmacy is also a new dynamic in the 340B program. Specialty pharmacies focus on the distribution of specialty pharmaceuticals which typically have higher costs and greater complexity (e.g. storage, dosing, monitoring, testing, etc.) than other pharmaceuticals dispensed through retail pharmacies. This will result in an increase in the average cost per 340B prescription due to specialty pharmacies’ focus on higher-cost pharmaceuticals. Figure 6 shows recent growth in the number of contract specialty pharmacy arrangements registered on the OPA database by DSH hospitals from Q1 2010 through Q4 2014.
27 Vandervelde, Miller, and Younts (2014), Vandervelde (2014).

WHITE PAPER
GROWTH OF THE 340B PROGRAM
BERKELEY RESEARCH GROUP
8
FIGURE 6
These recent changes demonstrate that covered entities are seeking new ways to expand 340B utilization through the use of contract pharmacies. Based on the analysis of historical growth and recent changes in 340B contract-pharmacy network design, our model predicts that contract pharmacy utilization will account for more than $5.5 billion in 340B sales by 2019.
Impact of the Affordable Care Act, 2014 and Beyond
The final driver of future growth in the 340B program during the next five years will be the enrollment of newly eligible entities due to two principal changes made by the Affordable Care Act. As discussed above, there continue to be new enrollments of hospitals that became eligible for the 340B program as a direct result of the Affordable Care Act. Although the number of these new registrations should continue to decline during the next three years, our model predicts incremental 340B sales at entities that enroll in 2014 or later of more than $90 million by 2019.
The Affordable Care Act’s Medicaid expansion will also create newly eligible DSH, pediatric and sole community hospitals. The DSH percentage is calculated, in part, based on the total number of Medicaid inpatient days at the hospital. As more individuals become eligible for Medicaid, total Medicaid inpatients days will increase and the DSH percentage of hospitals seeing these patients will also increase. Many hospitals that may not have been eligible due to a DSH percentage below the 11.75 percent threshold ( for DSH hospitals) or 8 percent threshold ( for sole community hospitals) could become newly eligible following Medicaid expansion. Our model identifies as many as 350 hospitals that could become newly eligible, which may result in incremental 340B sales of more than $1.4 billion by 2019.
Conclusion
The 340B program has experienced substantial growth during the last decade and there is every indication that this growth will continue in the next five years. Increased participation by DSH hospitals, hospital acquisitions of community oncology practices, expansion of contract pharmacy arrangements, and changes made by the Affordable Care Act all have contributed to this historical growth and will continue to drive growth in the future. By 2019, we project total 340B drug sales to exceed $16 billion.
-
50
100
150
200
250
300
350
Q1_10
Q2_10
Q3_10
Q4_10
Q1_11
Q2_11
Q3_11
Q4_11
Q1_12
Q2_12
Q3_12
Q4_12
Q1_13
Q2_13
Q3_13
Q4_13
Q1_14
Q2_14
Q3_14
Q4_14
Recent Growth in Contract Specialty Pharmacy Arrangements with 340B DSH Hospitals
Contract Specialty Pharmacy Arrangements with 340B DSH Hospitals

GROWTH OF THE 340B PROGRAM
WHITE PAPER BERKELEY RESEARCH GROUP
9
This growth in 340B has had unintended consequences and may contribute to shifts in the site of care, which can increase costs to both payers and patients.28 Additionally, while 340B covered entities will benefit from the estimated $11 billion in 340B discounts that pharmaceutical manufacturers will pay on sales through the 340B program in 2019, the overall benefit of the program to patients is unclear. Although non-hospital entities typically are required to reinvest 340B discounts into services for vulnerable patients, the hospitals that account for more than 80 percent of total 340B sales typically do not face such requirements.
Appendix A – Forecast Methodology
Provided below is a more detailed description of the methodology used to forecast growth in 340B sales and discounts through 2019. The forecasting model included three distinct modules. Each is discussed individually below.
Community Oncology Practice Acquisitions by Hospitals
The forecasting model is focused entirely on growth in oncology practice acquisitions because of both the relative size of oncology practice acquisitions compared to other types of community healthcare practices and the availability of research on the effect of oncology practice acquisitions on 340B sales. Because the impact of acquisitions of other types of community healthcare practices is not included, the estimate may understate the overall impact of this growth driver.
The methodology used to estimate growth in 340B sales attributable to oncology practice acquisitions included forecasting the number of future oncology practice acquisitions and estimating the incremental sales of oncology-related drugs through the 340B program attributable to an average oncology practice. To forecast the number of future oncology-practice acquisitions, the author relied on research identifying the number of 340B covered entities that made at least one oncology practice acquisition between 2009 and 2012.29 Results from this research identify more than 40 oncology practice acquisitions per year by 2012 and a growth trend in the number of practice acquisitions per year. The decrease in oncology practice acquisitions in 2018 and 2019 reflect the potential for a smaller pool of financially attractive acquisition targets by 2018. Based on this research, incremental oncology practice acquisitions were assumed as follows:
28 Vandervelde, Miller, and Younts (2014).
29 Vandervelde, Miller, and Younts (2014).
2014
40
2015
50
2016
60
2017
60
2018
40
2019
40
WHITE PAPER
GROWTH OF THE 340B PROGRAM
BERKELEY RESEARCH GROUP
10
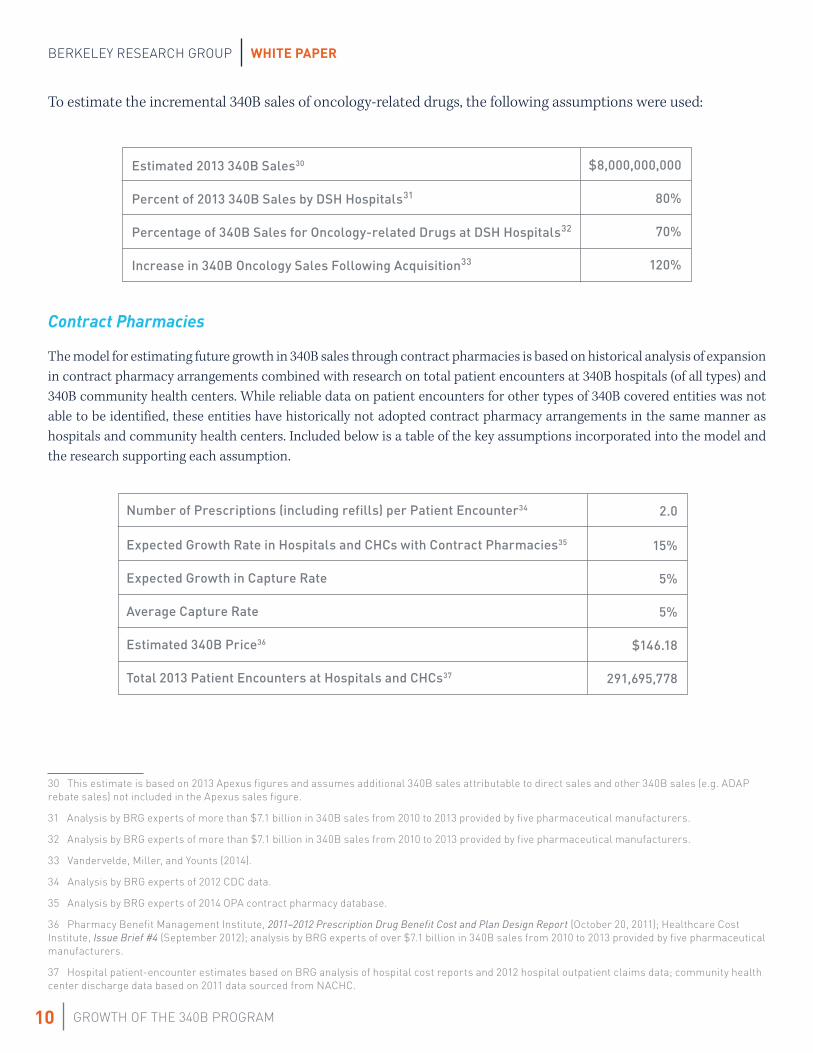
To estimate the incremental 340B sales of oncology-related drugs, the following assumptions were used:
Estimated 2013 340B Sales30
Percent of 2013 340B Sales by DSH Hospitals31
Percentage of 340B Sales for Oncology-related Drugs at DSH Hospitals32
Increase in 340B Oncology Sales Following Acquisition33
Contract Pharmacies
The model for estimating future growth in 340B sales through contract pharmacies is based on historical analysis of expansion in contract pharmacy arrangements combined with research on total patient encounters at 340B hospitals (of all types) and 340B community health centers. While reliable data on patient encounters for other types of 340B covered entities was not able to be identified, these entities have historically not adopted contract pharmacy arrangements in the same manner as hospitals and community health centers. Included below is a table of the key assumptions incorporated into the model and the research supporting each assumption.
Number of Prescriptions (including refills) per Patient Encounter34
Expected Growth Rate in Hospitals and CHCs with Contract Pharmacies35
Expected Growth in Capture Rate
Average Capture Rate
Estimated 340B Price36
Total 2013 Patient Encounters at Hospitals and CHCs37
30 This estimate is based on 2013 Apexus figures and assumes additional 340B sales attributable to direct sales and other 340B sales (e.g. ADAP rebate sales) not included in the Apexus sales figure.
31 Analysis by BRG experts of more than $7.1 billion in 340B sales from 2010 to 2013 provided by five pharmaceutical manufacturers.
32 Analysis by BRG experts of more than $7.1 billion in 340B sales from 2010 to 2013 provided by five pharmaceutical manufacturers.
33 Vandervelde, Miller, and Younts (2014).
34 Analysis by BRG experts of 2012 CDC data.
35 Analysis by BRG experts of 2014 OPA contract pharmacy database.
36 Pharmacy Benefit Management Institute, 2011–2012 Prescription Drug Benefit Cost and Plan Design Report (October 20, 2011); Healthcare Cost Institute, Issue Brief #4 (September 2012); analysis by BRG experts of over $7.1 billion in 340B sales from 2010 to 2013 provided by five pharmaceutical manufacturers.
37 Hospital patient-encounter estimates based on BRG analysis of hospital cost reports and 2012 hospital outpatient claims data; community health center discharge data based on 2011 data sourced from NACHC.
2.0
15%
5%
5%
$146.18
291,695,778
$8,000,000,000
80%
70%
120%
GROWTH OF THE 340B PROGRAM
WHITE PAPER BERKELEY RESEARCH GROUP
11
Based on the assumptions outlined above, the author estimated total prescriptions filled through a 340B contract pharmacy and multiplied those prescriptions by the estimated average 340B price. The estimated average 340B price is based on average branded pharmaceutical reimbursement rates in 2012. This figure is used to account for the bias towards higher cost generic and branded pharmaceuticals in contract pharmacies and supported by Dr. Rena Conti’s research indicating that 46 percent of all 340B contract pharmacy prescriptions and 93 percent of higher cost specialty pharmaceutical prescriptions are for branded pharmaceuticals.38
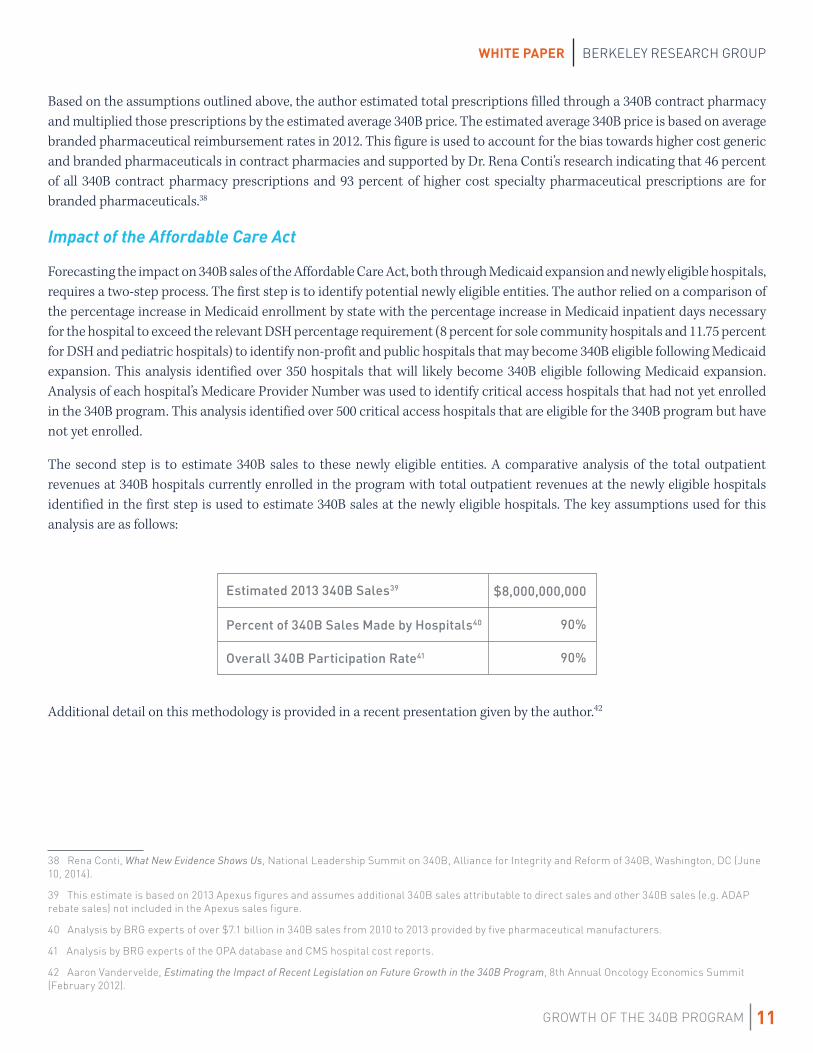
Impact of the Affordable Care Act
Forecasting the impact on 340B sales of the Affordable Care Act, both through Medicaid expansion and newly eligible hospitals, requires a two-step process. The first step is to identify potential newly eligible entities. The author relied on a comparison of the percentage increase in Medicaid enrollment by state with the percentage increase in Medicaid inpatient days necessary for the hospital to exceed the relevant DSH percentage requirement (8 percent for sole community hospitals and 11.75 percent for DSH and pediatric hospitals) to identify non-profit and public hospitals that may become 340B eligible following Medicaid expansion. This analysis identified over 350 hospitals that will likely become 340B eligible following Medicaid expansion. Analysis of each hospital’s Medicare Provider Number was used to identify critical access hospitals that had not yet enrolled in the 340B program. This analysis identified over 500 critical access hospitals that are eligible for the 340B program but have not yet enrolled.
The second step is to estimate 340B sales to these newly eligible entities. A comparative analysis of the total outpatient revenues at 340B hospitals currently enrolled in the program with total outpatient revenues at the newly eligible hospitals identified in the first step is used to estimate 340B sales at the newly eligible hospitals. The key assumptions used for this analysis are as follows:
Estimated 2013 340B Sales39
Percent of 340B Sales Made by Hospitals40
Overall 340B Participation Rate41
Additional detail on this methodology is provided in a recent presentation given by the author.42
38 Rena Conti, What New Evidence Shows Us, National Leadership Summit on 340B, Alliance for Integrity and Reform of 340B, Washington, DC (June 10, 2014).
39 This estimate is based on 2013 Apexus figures and assumes additional 340B sales attributable to direct sales and other 340B sales (e.g. ADAP rebate sales) not included in the Apexus sales figure.
40 Analysis by BRG experts of over $7.1 billion in 340B sales from 2010 to 2013 provided by five pharmaceutical manufacturers.
41 Analysis by BRG experts of the OPA database and CMS hospital cost reports.
42 Aaron Vandervelde, Estimating the Impact of Recent Legislation on Future Growth in the 340B Program, 8th Annual Oncology Economics Summit (February 2012).
$8,000,000,000
90%
90%
WHITE PAPER
GROWTH OF THE 340B PROGRAM
BERKELEY RESEARCH GROUP
12
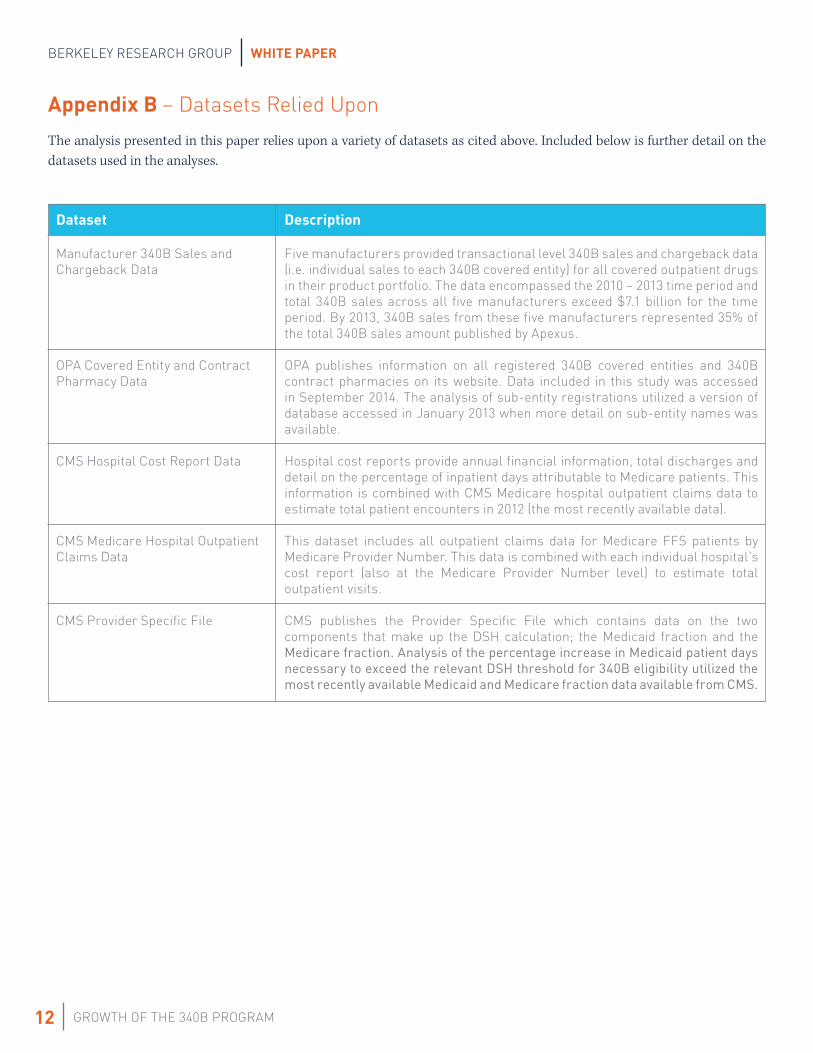
Appendix B – Datasets Relied Upon
The analysis presented in this paper relies upon a variety of datasets as cited above. Included below is further detail on the datasets used in the analyses.
Dataset
Manufacturer 340B Sales and Chargeback Data
OPA Covered Entity and Contract Pharmacy Data
CMS Hospital Cost Report Data
CMS Medicare Hospital Outpatient Claims Data
CMS Provider Specific File
Description
Five manufacturers provided transactional level 340B sales and chargeback data (i.e. individual sales to each 340B covered entity) for all covered outpatient drugs in their product portfolio. The data encompassed the 2010 – 2013 time period and total 340B sales across all five manufacturers exceed $7.1 billion for the time period. By 2013, 340B sales from these five manufacturers represented 35% of the total 340B sales amount published by Apexus.
OPA publishes information on all registered 340B covered entities and 340B contract pharmacies on its website. Data included in this study was accessed in September 2014. The analysis of sub-entity registrations utilized a version of database accessed in January 2013 when more detail on sub-entity names was available.
Hospital cost reports provide annual financial information, total discharges and detail on the percentage of inpatient days attributable to Medicare patients. This information is combined with CMS Medicare hospital outpatient claims data to estimate total patient encounters in 2012 (the most recently available data).
This dataset includes all outpatient claims data for Medicare FFS patients by Medicare Provider Number. This data is combined with each individual hospital’s cost report (also at the Medicare Provider Number level) to estimate total outpatient visits.
CMS publishes the Provider Specific File which contains data on the two components that make up the DSH calculation; the Medicaid fraction and the Medicare fraction. Analysis of the percentage increase in Medicaid patient days necessary to exceed the relevant DSH threshold for 340B eligibility utilized the most recently available Medicaid and Medicare fraction data available from CMS.

About the Author
Aaron VanderveldeAaron Vandervelde has over 10 years of experience providing strategy, health policy, and litigation consulting services to clients in the healthcare industry. He specializes in financial and economic analysis of health policy and provides litigation consulting services related to issues arising from contracts and transactions between healthcare entities. Specifically, he focuses on deriving strategic insight through the integration and analysis of large, complex data sets including claims data, internal and external sales data, and publicly available health data.
Mr. Vandervelde’s practice is focused primarily on clients across the healthcare continuum, including Fortune 500 pharmaceutical manufacturers and biotech companies, health insurers, pharmacy benefit managers, and others. He has assisted clients in a variety of strategic health policy analyses, federal investigations, contract disputes, litigation, and arbitration.
About Berkeley Research Group
Berkeley Research Group, LLC (thinkbrg.com) is a leading global strategic advisory and expert consulting firm that provides independent expert testimony, authoritative studies, strategic advice, data analytics, and regulatory and dispute support to Fortune 500 corporations, government agencies, major law firms, and regulatory bodies around the world. BRG experts and consultants combine intellectual rigor with practical, real-world experience and an in-depth understanding of industries and markets. Their expertise spans economics and finance, data analytics and statistics, and public policy in many of the major sectors of our economy, including healthcare, banking, information technology, energy, construction, and real estate. BRG is headquartered in Emeryville, California, with offices across the United States and in Australia, Canada, Latin America, and the United Kingdom.
THINKBRG.COM