Embed Size (px)
Citation preview

193
OECD Economic Outlook
volume 2013/1
© OECD 2013
Chapter 4
GROWTH PROSPECTSAND FISCAL REQUIREMENTS
OVER THE LONG TERM

4. GROWTH PROSPECTS AND FISCAL REQUIREMENTS OVER THE LONG TERM
OECD ECONOMIC OUTLOOK, VOLUME 2013/1 © OECD 2013194
Summary● Growth of the present non-OECD will continue to outpace that of the present OECD, but the difference
will narrow substantially over coming decades. From over 7% per year recently, non-OECD growth may
decline to around 4½ per cent per annum in 2030. Until around 2020, China is set to have the highest
growth rate among major countries, but could be then surpassed by India.
● China will likely pass the United States as the world’s largest economy in the next few years and India
has probably recently surpassed Japan to be third largest. By the early 2030s, the BRIICS combined GDP
should roughly equal that of the OECD (based on current membership), compared with just over half
that of the OECD now.
● Between now and 2060, GDP per capita is seen to increase more than eightfold in India and sixfold in
Indonesia and China, whereas GDP per capita in the highest-income OECD countries may only roughly
double over this period. Nevertheless, today’s lowest income countries will still have large gaps in GDP
per capita compared with the highest income countries; India, Indonesia and Brazil could have GDP per
capita levels (on a current PPP basis) which will only be 30-40% of that of the United States in 2060.
● In terms of geographical distribution, there will be a big shift in the share of world GDP accounted for by
Asia, at the expense of both North America and Europe; having accounted for about one-quarter of
global GDP (at current PPPs) at the beginning of the century, Asia’s share has already risen to over one-
third and is expected to reach one-half by the late 2030s and stabilise slightly above that level in the
2050s.
● The required fiscal consolidation, measured in terms of the average change in the underlying primary
balance, to gradually reduce gross government debt to 60% of GDP by around 2030 differs accross
countries. About two-thirds of OECD countries will have debt exceeding this ratio in 2014, but of these
more than half will require relatively little (less than 1 percentage point of GDP) or no further
consolidation, over and above that projected to 2014, to achieve a 60% target. A second group of
countries – France, Iceland, Ireland and Spain – require average consolidation of between 1 and
3 percentage points of GDP beyond 2014, but this represents less than one-third of the required post-
crisis consolidation.
● A third group of countries – Greece, Portugal, United Kingdom and United States – all have debt ratios
exceeding 100% of GDP and require larger average consolidation of between 3 and 6 percentage points of
GDP. Finally, Japan has a massive average fiscal consolidation requirement beyond 2014 of 11 percentage
points, just to stabilise the debt ratio by 2030, suggesting that an approach of gradual fiscal consolidation
will not be sufficient on its own to tackle the government indebtedness and will need to be
supplemented by other policies.
● These calculations of consolidation requirements are likely to understate the necessary fiscal efforts for
a number of reasons. Firstly, increased pressures on public spending from health and pensions, will add
about 2¾ percentage points of GDP to required fiscal efforts by 2030, for a typical OECD country, but with
considerable cross-country variation and a much greater increase in some countries. A second reason
why consolidation requirements will be larger is that the required profile of the underlying primary
balance is likely to involve an intermediate peak increase which is greater than the average increase

4. GROWTH PROSPECTS AND FISCAL REQUIREMENTS OVER THE LONG TERM
OECD ECONOMIC OUTLOOK, VOLUME 2013/1 © OECD 2013 195
referred to above. Among the countries that require most consolidation, the peak measure in these
projections is typically 2-4 percentage points of GDP higher than the average measure of consolidation.
Finally, uncertainty is related to the loss in potential output due to the crisis and there is a risk that
countries in which the recovery is delayed suffer further losses in potential output due to hysteresis
effects which will aggravate consolidation requirements.
● Going beyond the relatively passive structural reform agenda in the baseline, a stylised package of
structural policy reforms which move countries to best policy practice in a number of areas could raise
GDP for the median OECD country by about 20% by 2060, albeit with smaller effects for countries already
close to best practice. For the non-OECD G20 countries, where greater policy change is needed to move
to best practice, reforms could raise GDP by more than a third by 2060. The largest gains result from the
reform of product market regulations, raising productivity and GDP in the median OECD country by 17%
and in the non-OECD by about 30% over the long run. Educational reforms in the BRIICS could raise GDP
by 2060 by between 5% and 8%, with the largest effect in India where average years of schooling are
currently very low and the baseline foresees only gradual convergence to leading countries.
● The average gains from reforms which raise labour utilisation are smaller, but there are large gains in
selected OECD economies from lowering structural unemployment (in particular Estonia, Greece,
Poland, Slovak Republic and Spain) and raising labour force participation (in particular Czech Republic,
Hungary, Italy, Poland and Slovak Republic). Such reforms may be more beneficial in easing fiscal
consolidation requirements than reforms which raise productivity.

4. GROWTH PROSPECTS AND FISCAL REQUIREMENTS OVER THE LONG TERM
OECD ECONOMIC OUTLOOK, VOLUME 2013/1 © OECD 2013196
Long-term growth projections for the global economy
This chapter describeslong-term projections for
the global economy
Coming decades will witness massive changes in the global economy,
particularly in terms of the relative size of the major economies, in living
standards and in the pattern of global saving and investment. This
chapter is an attempt to provide orders of magnitude for these changes
through a set of long-term growth projections, that extend the short-term
projections presented in Chapters 1 to 3 to 2060 using a modelling
framework described in Johansson et al. (2013) and summarised in
Box 4.1.1 Bearing in mind all the caveats that apply to this kind of exercise,
these projections are then used as a back-drop for the analysis of fiscal
imbalances and consolidation needs and the effects of structural reforms
on medium- and long-term growth.
1. The country coverage in this modelling exercise is all OECD countries and allG20 non-OECD countries which together accounted for about 90% of nominalworld GDP in 2010. This limitation in the country coverage should beparticularly borne in mind in interpreting statements throughout the chapterconcerning shares of world GDP or country rankings.
Box 4.1. The modelling framework for long-term economic projections
The global model used to extend the short-term Economic Outlook projections to 2060 is described inJohansson et al. (2013). The country coverage is all OECD countries as well as current non-OECD G20countries (Argentina, Brazil, China, India, Indonesia, the Russian Federation, Saudi Arabia and SouthAfrica), equivalent to about 90% of world GDP in 2010 at market exchange rates. The level of detail in whichOECD economies are modelled is greater than for non-OECD economies, reflecting wider data availabilityfor OECD countries, particularly in respect of fiscal accounts.
The backbone of the model is a consistent set of long-run projections for potential output. Potentialoutput is based on a Cobb-Douglas production function with constant returns to scale featuring physicalcapital, human capital (based on gradually declining returns to average years of schooling) and labour asproduction factors plus labour-augmenting technological progress. By projecting these trend inputcomponents, assuming a degree of convergence in total factor productivity and human capital, potentialoutput is projected out to 2060. The degree of convergence in total factor productivity depends on thestarting point, with countries farther away from the technology frontier converging faster, but it alsodepends on the country’s own structural conditions and policies, hence the ’conditional convergence’nomenclature. In the long run, productivity in all countries will tend to grow at the same rate determinedby the worldwide rate of technical progress, but cross-country GDP per capita gaps remain, mainlyreflecting differences in technology levels, capital intensity, human capital and labour utilisation, which inturn partly depend on differences in structural conditions and policies.

4. GROWTH PROSPECTS AND FISCAL REQUIREMENTS OVER THE LONG TERM
OECD ECONOMIC OUTLOOK, VOLUME 2013/1 © OECD 2013 197
Output is assumed toreturn to potential over four
to five years
The long-term growth scenarios are anchored on the short-term
projections for 2014, beyond which output gaps are assumed to close
smoothly, typically over a period of four to five years, depending on their
initial size. This implies above-trend growth for the first few years of the
projections in countries with negative output gaps in 2014, including
where this gap is exceptionally large such as Greece, Ireland, Portugal and
Spain. Also, despite continued and, in many cases, large negative output
gaps over this period, it is assumed that no country experiences sustained
deflation. Once the output gap is closed, output grows in line with
potential and monetary policy ensures that inflation returns to a country
or region-specific target (see Box 4.2). The projections presented in this
chapter thus provide a benign, even optimistic, medium-term outlook for
the world economy (Table 4.1).
Box 4.1. The modelling framework for long-term economic projections (cont.)
Private saving rates for OECD countries are determined according to recent OECD empirical work(Kerdrain et al., 2010) which suggests that demographic effects, captured by old-age and youth dependencyratios, are important drivers of long-term trends in saving, but with additional effects from the fiscalbalance, the terms of trade, productivity growth, net oil balances and the availability of credit. Total savingin OECD countries is determined as the sum of public and private saving, although there is a 40% offset ofany improvement in public saving from reduced private saving due to partial Ricardian equivalence (in linewith recent OECD estimates, for example Röhn, 2011). For non-OECD countries, the total saving rate isdetermined according to an equation, which is close to being a total economy variant of the private savingequation for the OECD, with effects from the old-age and youth dependency ratios, the terms of trade, theavailability of credit, the level of public expenditure (as a proxy for public social protection) and productivitygrowth.
Movements in global interest rates ensure that global saving and investment remain aligned, whereasimbalances at the national level are reflected in current account balances. An exception is a group of majornon-OECD oil exporting countries, defined to include Saudi Arabia, Russia as well as 27 smaller non-OECDcountries. For these countries, no individual projections of current balances are made. Rather, thecombined current account balance of all non-OECD oil exporting countries is calculated based onprojections of their balance of trade in oil.
Current account imbalances are accumulated to provide a proxy for foreign asset positions – with higherlevels of external indebtedness leading to higher country-specific risk premiums that are reflected inmarket interest rates, consistent with the findings of Lane and Milesi-Ferret (2001) and Rose (2010). This isimplemented as an increase of 2 basis points in interest rates for every percentage point increase in theratio of net external debt to GDP. For countries that are net creditors, there is no discount placed on theirdomestic interest rate since no evidence for one has been found in empirical work.
Fiscal closure rules acting on the primary balance ensure that the ratio of government debt to GDP isstable either at recent levels or by targeting a specific (usually lower) debt-to-GDP ratio, which in thebaseline here is 60%. Debt service responds to changes in debt and market interest rates, but with lagswhich reflect the maturity structure of debt. Higher debt levels are assumed to entail higher country-specific fiscal risk premia consistent with the findings of Égert (2010) and Laubach (2009): for everypercentage point that the debt ratio exceeds a threshold of 75% of GDP, the fiscal risk premium applied tolong-term interest rates increases by 2 basis points, with an additional increase of 2 basis points for everypercentage point that the debt ratio exceeds 125%. No allowance for an additional interest rate premium ismade for countries which do not have their own national currency.

4. GROWTH PROSPECTS AND FISCAL REQUIREMENTS OVER THE LONG TERM
OECD ECONOMIC OUTLOOK, VOLUME 2013/1 © OECD 2013198
Box 4.2. Assumptions in the baseline long-term scenario
The baseline scenario includes the following assumptions for the period beyond the short-termprojection horizon that ends in 2014:
● Cross-country comparisons of levels of GDP and GDP per capita are made in terms of current purchasingpower parities (PPPs). PPPs are projected on the basis of differences in aggregate inflation and a relativeprice effect (reflecting the relative price of tradeables and non-tradeables) which is related to changes inrelative living standards, through the so-called Harrod-Balassa-Samuelson effect, based on the empiricalwork of Frankel (2006). Nominal exchange rates adjust in line with relative aggregate inflation rates andalso correct the level of the real exchange rate in line with predictions of the Harrod-Balassa-Samuelsoneffect. The upshot is that the GDP of low-income countries like India and China rise somewhat less overthe projection, relative to high-income countries such as the United States, when measured on a currentPPP basis than on a fixed PPP basis.
Assumptions regarding monetary and fiscal policy are as follows:
● Policy interest rates continue to normalise as output gaps close and beyond that are directed to convergeon a neutral real short-term rate, which in turn follows the potential growth rate of the economy.
● The target for inflation is generally taken to be 2%, with the following exceptions: Australia, Poland,Iceland and Norway target 2.5%; Chile, Hungary, Mexico and Korea target 3%; Argentina, China, India andRussia target 4%; Brazil, Indonesia and South Africa target 4.5%; and Turkey targets 5%.
● For those countries with initial gross general government debt in excess of 60% of GDP, fiscal policy isdirected towards convergence on this debt level. Otherwise, for countries where debt is initially belowthe 60% threshold, fiscal policy is directed to stabilising the gross government debt ratio. To achieve theseobjectives for the debt ratio, fiscal consolidation is assumed to take place through a gradualimprovement in the underlying primary balance, with a maximum cap on consolidation in any singleyear of ½ percentage point of GDP. It should be noted that this assumption may contradict currentgovernment plans and is not necessarily consistent with national or supra-national fiscal objectives,targets or rules. No allowance is made for Keynesian effects of consolidation on demand.
● Effects on public budgets from population ageing and continued upward pressures on health spendingare not explicitly included, or, put differently, they are implicitly assumed to be alleviated throughreforms of relevant spending programmes or offset by other budgetary measures (see Box 4.4).
Assumptions regarding structural policies are as follows:
● Policy influences on labour force participation differ between two stages of the projections. Recently-legislated pension reforms that involve an increase in the normal retirement age by 2030 are assumed tobe implemented as planned, and the participation rates of older workers adjusted accordingly. Incountries where no such reforms have been undertaken, retirement behaviour is assumed to reflect onlyeffects coming from a rising education level. Beyond 2030, a more stylised assumption is adoptedwhereby the share of active life in life expectancy is assumed to remain constant, hence the legalpensionable age is implicitly assumed to be indexed to longevity.
● Structural unemployment in OECD countries gradually returns to the lowest value estimated between2007 and 2014. Unemployment in non-OECD countries where the level is currently above the OECDaverage is assumed to gradually converge to the OECD average, while it remains unchanged in countriescurrently below the OECD average.
● The long-term trend increase in average years of schooling per worker (the basis for estimating humancapital) is assumed to continue in all countries, and is calculated to have a modest positive effect onaggregate labour force participation.
● Product market and trade regulations are assumed to gradually converge towards the average regulatorystance observed in OECD countries in 2011 in countries where regulations are currently more restrictive,while for other countries, regulations remains unchanged.
● For non-OECD countries, a gradual increase in public spending on social protection is assumed,amounting on average to an increase of four percentage points of GDP to a level of provision similar tothe average OECD country. It is further assumed that this is financed in a way so as to have no effect onpublic saving.

4. GROWTH PROSPECTS AND FISCAL REQUIREMENTS OVER THE LONG TERM
OECD ECONOMIC OUTLOOK, VOLUME 2013/1 © OECD 2013 199
Table 4.1. Growth in total economy potential output and its componentsAnnual averages, percentage change
1 2 http://dx.doi.org/10.1787/888932838292
Output
Gap
Potential real GDP
growth
Potential labour productivity
growth (output per worker)
Potential employment
growth
Real
GDP
growth
2001- 2012- 2018- 2031- 2001- 2012- 2018- 2031- 2001- 2012- 2018- 2031- 2012-
2012 2007 2017 2030 2060 2007 2017 2030 2060 2007 2017 2030 2060 2017
Australia -0.9 3.2 3.3 3.0 1.9 1.1 1.9 2.1 1.5 2.1 1.4 0.9 0.5 3.5 Austria -1.6 2.1 1.7 1.8 1.3 1.1 1.0 1.6 1.3 1.0 0.7 0.1 -0.1 1.7 Belgium -0.8 1.8 1.5 2.2 1.8 0.8 0.8 1.9 1.4 0.9 0.6 0.3 0.3 1.3 Canada -0.4 2.6 2.0 2.2 1.9 0.8 1.1 1.7 1.5 1.7 0.9 0.4 0.3 2.0 Chile 0.2 4.0 5.0 3.3 1.4 1.7 2.9 2.2 1.5 2.3 2.0 1.1 0.0 5.0 Czech Republic -2.5 3.6 2.1 2.9 1.6 3.4 2.0 3.1 2.0 0.3 0.2 -0.2 -0.4 1.9 Denmark -3.2 1.4 1.0 1.8 1.9 0.9 0.8 1.6 1.8 0.5 0.2 0.1 0.1 1.2 Estonia2 -1.7 5.1 3.0 3.0 1.7 4.4 2.9 3.2 2.2 0.7 0.1 -0.2 -0.4 3.4 Finland -1.4 2.7 1.5 2.1 1.4 1.5 1.4 2.3 1.4 1.1 0.1 -0.2 0.1 1.5 France -2.4 1.7 1.5 2.3 1.4 0.8 1.2 2.1 1.2 0.8 0.4 0.2 0.1 1.6 Germany 0.1 1.2 1.2 0.9 0.7 0.8 1.0 1.5 1.4 0.4 0.2 -0.6 -0.7 1.1 Greece -11.7 2.8 -0.5 3.2 1.3 1.6 0.2 2.6 1.6 1.1 -0.8 0.6 -0.3 0.1 Hungary -3.3 2.7 1.3 3.1 1.8 2.9 1.1 3.0 2.4 -0.2 0.2 0.1 -0.6 1.4 Iceland -4.2 3.7 0.8 2.2 2.0 2.2 0.4 1.5 1.7 1.4 0.4 0.7 0.3 1.6 Ireland -7.9 5.4 1.4 3.0 1.6 2.4 1.1 1.7 0.9 2.9 0.4 1.2 0.7 2.5 Israel 1.0 3.5 3.5 2.8 2.5 0.9 1.2 1.2 1.4 2.6 2.2 1.5 1.2 3.2 Italy -4.5 1.1 0.1 2.0 1.4 0.2 0.0 1.6 1.5 0.9 0.1 0.4 -0.1 0.3 Japan -0.8 0.7 0.8 1.1 1.1 0.9 1.2 1.7 1.8 -0.2 -0.4 -0.5 -0.7 1.2 Korea -3.1 4.5 4.1 3.3 0.6 3.2 3.4 3.4 1.3 1.2 0.7 0.0 -0.7 4.1 Luxembourg -2.5 4.1 2.6 2.6 1.5 0.5 0.2 1.5 1.2 3.6 2.4 1.0 0.4 2.6 Mexico -0.4 2.4 3.2 3.6 2.7 0.7 1.0 1.9 2.3 1.7 2.1 1.6 0.4 3.5 Netherlands -2.7 1.9 1.4 2.1 1.5 0.9 0.9 2.1 1.6 1.0 0.5 0.0 -0.1 1.3 New Zealand -1.5 3.1 2.4 2.4 1.9 0.7 1.4 1.6 1.5 2.4 1.0 0.8 0.4 2.8 Norway1 -0.5 3.0 2.7 2.4 1.6 1.7 1.6 1.9 1.2 1.2 1.2 0.5 0.4 3.0 Poland 0.7 4.1 2.9 2.2 0.8 3.4 2.9 2.7 1.7 0.7 0.0 -0.5 -0.9 2.5 Portugal -6.7 1.6 0.2 2.1 1.5 1.2 0.5 1.8 1.9 0.4 -0.3 0.3 -0.4 0.5 Slovak Republic -0.5 4.4 3.2 2.4 0.9 3.8 3.0 2.8 1.7 0.6 0.2 -0.4 -0.8 2.8 Slovenia -3.3 3.2 1.1 2.8 1.5 2.6 1.4 2.9 1.9 0.7 -0.3 -0.1 -0.3 0.9 Spain -7.7 3.3 0.8 3.0 1.5 0.6 1.1 1.8 1.6 2.8 -0.3 1.2 -0.1 1.4 Sweden -1.4 2.6 2.7 2.5 1.5 2.0 1.9 2.2 1.2 0.6 0.8 0.3 0.2 2.6 Switzerland -0.9 1.9 2.1 2.2 1.6 0.8 1.0 1.9 1.7 1.0 1.1 0.3 -0.1 2.0 United Kingdom -2.1 2.5 1.7 2.6 2.0 1.6 0.9 2.0 1.6 0.9 0.8 0.6 0.4 1.8 United States -3.0 2.4 2.0 2.1 1.7 1.7 1.5 1.7 1.1 0.7 0.5 0.4 0.5 2.5 Turkey -2.1 4.0 5.1 4.3 1.9 2.6 2.5 2.5 1.6 1.3 2.5 1.7 0.3 4.8 Argentina2 6.7 3.7 3.8 3.1 2.3 0.6 2.1 1.8 2.1 3.1 1.6 1.2 0.2 2.3 Brazil -1.1 3.0 3.7 3.6 2.0 0.8 2.2 2.7 2.4 2.2 1.4 0.8 -0.4 3.3 China 0.1 10.2 8.4 5.4 2.1 9.2 7.9 5.8 3.0 0.9 0.5 -0.3 -0.9 8.1 Indonesia 0.5 4.1 6.0 5.2 3.4 2.1 4.0 4.2 3.6 1.9 1.9 1.0 -0.1 6.0 India 0.1 7.0 6.9 6.8 4.3 5.2 5.0 4.9 3.7 1.7 1.8 1.8 0.6 6.3 Russian federation -1.7 5.4 3.3 2.8 1.3 4.6 4.4 3.5 2.0 0.7 -1.1 -0.7 -0.7 3.5 South Africa -2.5 3.1 4.6 4.9 2.3 2.0 2.7 2.8 1.9 1.1 1.9 2.0 0.4 4.7 Euro area2 -2.9 1.7 1.0 2.0 1.3 0.8 0.9 1.8 1.5 1.0 0.1 0.2 -0.2 1.2 OECD2 -2.3 2.1 1.9 2.3 1.6 1.3 1.3 1.8 1.5 0.9 0.6 0.4 0.1 2.2 Non-OECD 0.7 7.1 6.8 5.3 2.8 5.7 5.7 4.6 2.9 1.3 1.0 0.6 -0.2 6.4 World2 3.5 3.7 3.6 2.2 2.3 2.8 3.0 2.3 1.2 0.9 0.6 -0.1 3.8
1. Based on measures of mainland GDP.2. Reported growth for 2001-2007 starts in 2002. For Argentina, it starts in 2003.Source: OECD Economic Outlook 93 long-term database.

4. GROWTH PROSPECTS AND FISCAL REQUIREMENTS OVER THE LONG TERM
OECD ECONOMIC OUTLOOK, VOLUME 2013/1 © OECD 2013200
The crisis is assumed tohave had permanent
adverse effects only on thelevel of potential output
Another optimistic assumption that underlies the scenarios
presented here is that the crisis has only reduced the level of trend or
potential output and has had no permanent adverse effect on its
growth rate. Compared with pre-crisis trends, the level of aggregate
OECD potential output, has been revised downwards by about 3%
though the median adjustment across countries is about 6% (Box 4.3).
There are, however, a number of smaller OECD countries, for which
such estimates suggest losses exceeding 10% of potential output
relative to pre-crisis trends. Some of this loss in potential output is
assumed to be reversed over the medium term as hysteresis-induced
increases in the structural rate of unemployment are reversed and the
structural rate of unemployment gradually returns to pre-crisis levels.
It is also assumed that even very large output gaps close fairly quickly,
with any multiplier effects from further fiscal consolidation being
ignored. An alternative, whereby large negative output gaps persist for
several years, raises the downside risk that hysteresis-type effects drag
down the level of potential output further and on a more permanent
basis.
Policies play an importantrole in the baseline scenario
Structural and fiscal policies play an important role in the
projections presented here. The projection framework takes into
account the impact of labour market and retirement policies on
developments in unemployment and labour force participation, the
impact of product market and trade regulations on innovation and
technological diffusion, as well as the impact of fiscal consolidation in
advanced economies and enhanced welfare policies in emerging
economies on saving, global imbalances, indebtedness and capital
accumulation via changes in the cost of capital. Over a time-horizon
covering several decades, these structural conditions and policies are
likely to evolve and so the baseline scenario incorporates a number of
policy developments seen as probable in several areas (Box 4.2).2 While
these policy changes are significant, there remains considerable scope
for further structural reforms to improve trend growth, as explored in
variant scenarios (see below).
Productivity convergenceimplies faster growth in the
BRIICS...
A defining feature of the long-term projections is “conditional
convergence” in trend labour productivity (Figure 4.1) which occurs as
countries move closer to the technological frontier, increase human
capital by raising years of schooling to catch up with leading countries3
2. Baseline projections for European programme countries (e.g. Greece) do nottake into account the impact of structural reforms announced in the recentprogrammes, which could alter growth prospects and fiscal positions for thesecountries.
3. The level of schooling of the cohort aged 25-29 for all countries is assumed toconverge towards the leading country with a speed of convergence of 1% peryear. While this is equal to the observed speed of convergence over 1960-2005across all countries, there is likely to be potential for a much faster rate ofcatch-up for countries which are furthest behind, particularly where majorreforms would have a large impact on primary and secondary education.

4. GROWTH PROSPECTS AND FISCAL REQUIREMENTS OVER THE LONG TERM
OECD ECONOMIC OUTLOOK, VOLUME 2013/1 © OECD 2013 201
Box 4.3. The effect of the crisis on potential output
The crisis is likely to have resulted in a permanent loss in the level of potential output for most OECDcountries, so that even with a continuing recovery, GDP may not catch-up to its pre-crisis trajectory. Theextent of these losses is very uncertain, because of the difficulty of knowing what the counter-factualwould be and because of the difficulties of disentangling what the effect of the crisis is from other effects,including policy changes. Estimates here are derived from comparing current estimates of potential outputper head of the working population with an extrapolation of the pre-crisis trend (over 2000-07) in potentialoutput per head of the working population. Potential output is normalised on the population of working agebecause some slowdown in potential growth was always expected for demographic reasons and this shouldnot be attributed to the crisis. This method implies a reduction in aggregate OECD-wide potential output ofjust under 3% (see figure below), which is similar to an estimate that is obtained from comparingprojections of potential output made prior to the crisis with the latest projections. It is also similar in broadterms to estimates that were made shortly after the onset of the crisis (OECD, 2010a).
Estimated effects of the crisis on the potential output of OECD countriesPercentage reduction in potential output relative to pre-crisis trend
Source: OECD Economic Outlook 93 long-term database.1 2 http://dx.doi.org/10.1787/888932836658
There is, however, wide variation in the estimated effect of the crisis on individual countries. Theestimated effect on the median OECD country is about double the effect on the area-wide aggregate,reflecting that smaller countries have typically been hit harder than larger ones. On this basis, the effect ofthe crisis on potential has been small in Japan and Germany and reduced output by less than 2½ per centfor the United States. Other countries where the estimated effect of the crisis is relatively small includeAustria, Australia, Israel, Mexico and Switzerland. Conversely the estimated effect is to reduce potentialoutput in 2014 by more than 10% for Czech Republic, Hungary, Ireland, Iceland, Slovenia, Estonia, Greeceand Luxembourg.
A few countries, notably Ireland and Spain, have experienced a very marked slowdown in the growth ofthe population of working age, which is not due to standard demographic developments, but rather arisesbecause of a sharp decline in net immigration flows which probably should be attributed to the effect of thecrisis, but is not included as such in these calculations, which may therefore err on the side of optimism forthese countries.
2007 2008 2009 2010 2011 2012 2013 2014 2015 2016-14
-12
-10
-8
-6
-4
-2
0%
-14
-12
-10
-8
-6
-4
-2
0%
Lower/upper quartilesMedian OECD countryOECD aggregate

4. GROWTH PROSPECTS AND FISCAL REQUIREMENTS OVER THE LONG TERM
OECD ECONOMIC OUTLOOK, VOLUME 2013/1 © OECD 2013202
and increase physical capital per worker.4 This implies that countries that
are the furthest behind in terms of the level of productivity today are
likely to grow the fastest in the future. In particular, for China, India and
Indonesia (which currently have the lowest levels of trend productivity
among the sample of countries considered here) trend productivity
Figure 4.1. Convergence in living standards is driven by trend productivity
1. GDP per capita for Norway in panel A includes oil production, while the measure of productivity in panel B excludes oil and is basedon mainland GDP only.
2. Luxembourg has a very high GDP per capita because it is boosted by an exceptionally high ratio of employment to resident population,due to cross border workers.
Source: OECD Economic Outlook 93 long-term database.1 2 http://dx.doi.org/10.1787/888932836715
IND CHN ZAF TUR HUN POL EST SVK CZE ISR NZL ITA EA15 GBR FIN DEU SWE NLD AUT USA NOR¹IDN BRA MEX ARG RUS CHL GRC PRT SVN KOR ESP JPN FRA ISL BEL DNK CAN IRL AUS CHE LUX²
0
20
40
60
80
100
120
140
160
180
0
20
40
60
80
100
120
140
160
1802012 2030 2060
Relative GDP per capita, based on current PPPs (USA=100)
IND CHN ZAF TUR HUN POL EST SVK CZE ISR NZL ITA EA15 GBR FIN DEU SWE NLD AUT USA NOR¹IDN BRA MEX ARG RUS CHL GRC PRT SVN KOR ESP JPN FRA ISL BEL DNK CAN IRL AUS CHE LUX²
0
20
40
60
80
100
120
0
20
40
60
80
100
1202012 2030 2060
Trend labour productivity (USA=100)
4. Conditional convergence implies that there is not complete convergence inproductivity levels even in the long run, rather differences in productivity levelswill persist because of permanent differences in structural characteristics,including policy settings. Nevertheless, as economies converge on their ownsteady-state path the growth rate of trend productivity will tend towards acommon rate determined by the growth rate of technical progress.

4. GROWTH PROSPECTS AND FISCAL REQUIREMENTS OVER THE LONG TERM
OECD ECONOMIC OUTLOOK, VOLUME 2013/1 © OECD 2013 203
growth will average three to four times that of the OECD between now and
2030, and, although gradually declining over the entire projection, will be
double that of the OECD over the period 2030-60.
… as well as in low-incomeOECD countries...
Convergence of trend labour productivity is also a feature, albeit less
striking, of the pattern of long-term growth among OECD countries. Thus,
those countries with currently low productivity levels (including the OECD
Eastern European economies, Turkey and Mexico) typically experience
long-term trend productivity growth rates of 2-3% per annum, compared
with about 1½ per cent per annum for countries like the United States,
which are at, or close to, the productivity frontier. The projected growth
rate of trend productivity does not, however, always conform to this
pattern, in particular over the medium term because of inertia, so that
those countries which have experienced poor trend productivity growth
recently (including Portugal, Greece and Italy) experience only a modest
pick-up before 2020.
… but convergence isincomplete
While growth is generally more rapid in low-income countries, a
complete catch-up in productivity levels does not generally occur even by
2060. This is not only because it would take longer for those countries
which start furthest from the productivity frontier, though in some cases
such as upgrading of education levels convergence is bound to be very
slow, but also because differences in structural policies and other
structural factors matter and can prevent complete catch-up; in the
present modelling framework important differences in underlying
productivity levels are attributed to differences in structural policy
settings as represented by the degree of competition-friendly product
market regulation. Furthermore, differences in GDP per capita will persist
because of differences in labour utilisation due to different structural
characteristics of the labour market, including structural policy settings,
as well as demographic differences.
Potential employmentgrowth is slowing fordemographic reasons
The contribution to growth from labour utilisation is slowing nearly
everywhere, reflecting demographic factors, particularly ageing, as the
population of working age and aggregate participation rates grow more
slowly. This occurs even though the baseline scenario embodies
retirement reforms that are sufficient to maintain a stable proportion of
life expectancy in the labour force beyond 2030 (up to 2030, known
retirement policy is included). Aggregate OECD employment growth,
while slowing, remains positive throughout, but important exceptions
include Japan, Germany, Korea and some Eastern-European economies
where employment growth becomes negative. There is even wider
variation among the BRIICS: both China and Russia are expected to
experience strong negative employment growth over the long term,
particularly beyond 2030; whereas India experiences very strong positive
employment growth to 2030 and positive, albeit slowing, growth rates
beyond.

4. GROWTH PROSPECTS AND FISCAL REQUIREMENTS OVER THE LONG TERM
OECD ECONOMIC OUTLOOK, VOLUME 2013/1 © OECD 2013204
Labour utilisation will bepushed down by an
increasing dependencyratio...
Beyond 2030 pressures on labour utilisation from ageing populations
will tend to reduce GDP per capita in a majority of countries (Figure 4.2,
upper panel). In itself, aggregate population growth has no immediate
implications for GDP per capita in the modelling framework used for the
projection. However, the projected decline in the share of working-age
population due to ageing will have a negative impact in most countries
(Figure 4.2, lower panel). The conclusion tends to be the same whatever
definition of working age is used – here it is ages 15 to 74 – as long as a
fixed age range is considered. Large declines in the working-age share of
more than 10 percentage points to 2060 occur in Slovenia, Slovak
Republic, Czech Republic, Poland and especially in Japan and Korea.
Exceptions to this decline in the share of the working age population
occur to 2030 in several low-income countries (Turkey, Mexico, Chile,
India, Indonesia, Brazil and China); however, this is only sustained beyond
2030 in India, while China is projected to experience a particularly strong
turnaround.
… but can be offset byhigher participation,
including through laterretirement
A rise in the labour force participation rate in a majority of countries
helps to offset some of the negative effect on labour utilisation from the
declining share of people of working age (Figure 4.2, middle panel). This
arises partly because of a continuation of the observed trend for later
cohorts to participate more in the workforce at a given age than earlier
cohorts did before them. Up to 2030, the labour force participation
projections also incorporate legislated reforms to public retirement
schemes which in a number of cases increase the age of retirement.
Beyond 2030, labour force participation is boosted by an assumption that
participation in the workforce rises in line with increasing life expectancy,
which corresponds roughly with the notion that effective retirement ages
increase in line with life expectancy. Assuming fixed retirement ages over
a long horizon with rising life expectancy would have undermined the
realism of the exercise.
OECD potential growthmoderates over the longer
term
Aggregate OECD output growth picks up to between 2 and 2¼ per cent
per annum to 2030, slightly higher than the pre-crisis trend because post-
crisis slack is being absorbed and structural unemployment reverts to pre-
crisis levels. It then slows to 1¾ per cent per annum to 2060, reflecting a
gradual slowing in trend productivity as more countries get closer to the
frontier and as potential employment slows for demographic reasons. The
differential between non-OECD and OECD growth remains positive but
narrows continuously, with non-OECD potential (and actual) growth rates
falling from around 7% per annum currently to about 4½ per cent per annum
by 2030 and 2% per annum by 2060, but still implying a massive upheaval in
the structure of the global economy over coming decades (Figure 4.3).
The growing importance ofChina and India is already
apparent
● In the short term, these trends imply that China will pass the United
States as the world’s largest economy in the next few years and India
has probably recently just surpassed Japan to be third largest (all
comparisons, here and below, are based on projected current PPPs).

4. GROWTH PROSPECTS AND FISCAL REQUIREMENTS OVER THE LONG TERM
OECD ECONOMIC OUTLOOK, VOLUME 2013/1 © OECD 2013 205
Figure 4.2. Changes in labour utilisation and its componentsChange compared to 2012, in percentage points
Source: OECD Economic Outlook 93 long-term database.1 2 http://dx.doi.org/10.1787/888932836734
TUR CHL ARG IDN ISR HUN EST GRC OECD NZL AUS KOR SWE NLD DEU JPN CHE CAN USA SVN FINMEX IND LUX BRA ESP IRL PRT ITA GBR AUT EA15 BEL FRA DNK NOR POL CZE SVK CHN ISL RUS
-15
-10
-5
0
5
10
15%
-15
-10
-5
0
5
10
15%
2030 2060
Potential employment as a percentage of total population
TUR CHL ARG IDN ISR HUN EST GRC OECD NZL AUS KOR SWE NLD DEU JPN CHE CAN USA SVN FINMEX IND LUX BRA ESP IRL PRT ITA GBR AUT EA15 BEL FRA DNK NOR POL CZE SVK CHN ISL RUS
-10
-5
0
5
10
15%
-10
-5
0
5
10
15%
Labour force participation rate, 15-74
TUR CHL ARG IDN ISR HUN EST GRC OECD NZL AUS KOR SWE NLD DEU JPN CHE CAN USA SVN FINMEX IND LUX BRA ESP IRL PRT ITA GBR AUT EA15 BEL FRA DNK NOR POL CZE SVK CHN ISL RUS
-15
-10
-5
0
5
10%
-15
-10
-5
0
5
10%
Working-age population (15-74) as a percentage of total population

4. GROWTH PROSPECTS AND FISCAL REQUIREMENTS OVER THE LONG TERM
OECD ECONOMIC OUTLOOK, VOLUME 2013/1 © OECD 2013206
The BRIICS will eventuallysurpass the OECD
● By 2030, the BRIICS’ combined GDP will roughly equal that of the OECD
(based on current membership), compared with just over half that of
the OECD now, with Brazil and Russia becoming the fifth and sixth
largest world economies. By 2060, the BRIICS’ GDP could surpass that of
Figure 4.3. There will be major changes in the composition of global GDPPercentage of world GDP
Note: World is here defined as the sum of OECD countries plus Argentina, Brazil, China, Indonesia, India, the Russian Federation, SaudiArabia and South Africa.Source: OECD Economic Outlook 93 long-term database.
1 2 http://dx.doi.org/10.1787/888932836753
23%
United States
7% Japan
17%
Other G7
19%
Other OECD
16%China
6% India 13%
Other non-OECD
GDP at current PPP in 2010
26%
United States
10%Japan
21%
Other G7
20%Other OECD
10%China
3% India10%
Other non-OECD
GDP at market exchange rates in 2010
17%
United States
4%Japan
12% Other G7
17%
Other OECD
26%
China
11% India13%
Other non-OECD
GDP at current PPP in 2030
21%
United States
5% Japan
14%Other G7
19%
Other OECD
23%China
7% India 12%
Other non-OECD
GDP at market exchange rates in 2030
15%
United States
3%
Japan
9% Other G7
15%
Other OECD25%
China
21% India
12%
Other non-OECD
GDP at current PPP in 2060
18%
United States
3%Japan
11% Other G7
16%
Other OECD
25%
China
16% India
12%Other non-OECD
GDP at market exchange rates in 2060
4. GROWTH PROSPECTS AND FISCAL REQUIREMENTS OVER THE LONG TERM
OECD ECONOMIC OUTLOOK, VOLUME 2013/1 © OECD 2013 207
the OECD by one-third, with China followed by India being the largest
economies, Indonesia ranked fourth and Brazil sixth.
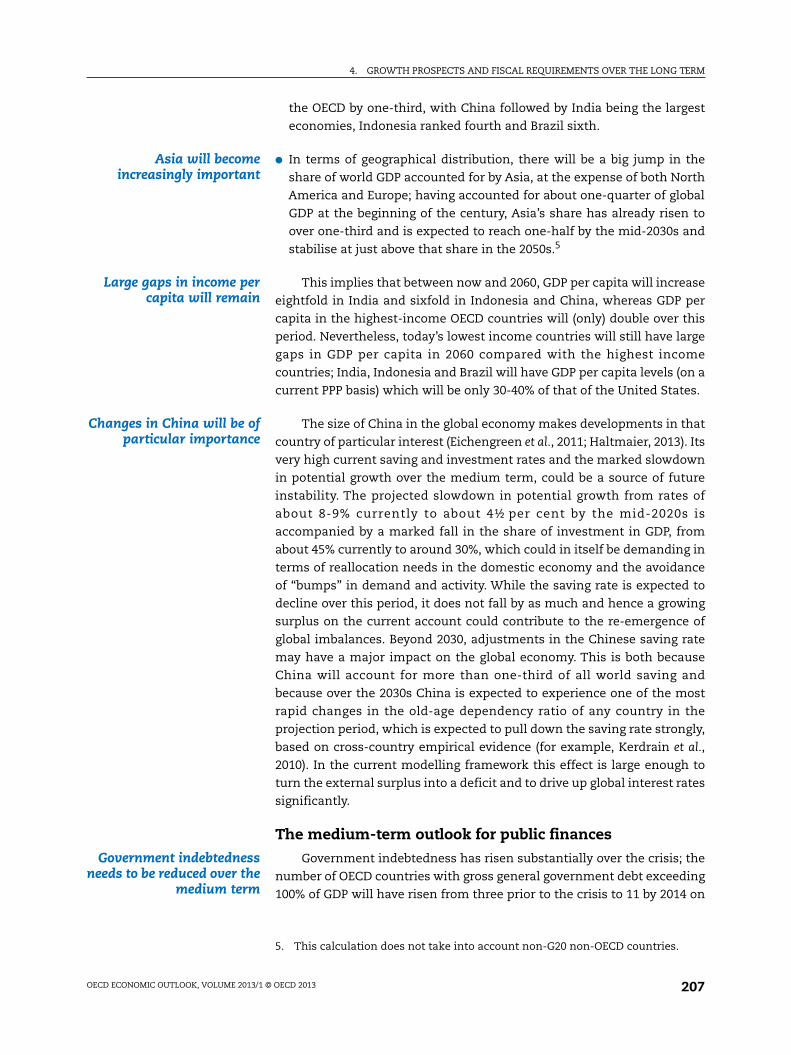
Asia will becomeincreasingly important
● In terms of geographical distribution, there will be a big jump in the
share of world GDP accounted for by Asia, at the expense of both North
America and Europe; having accounted for about one-quarter of global
GDP at the beginning of the century, Asia’s share has already risen to
over one-third and is expected to reach one-half by the mid-2030s and
stabilise at just above that share in the 2050s.5
Large gaps in income percapita will remain
This implies that between now and 2060, GDP per capita will increase
eightfold in India and sixfold in Indonesia and China, whereas GDP per
capita in the highest-income OECD countries will (only) double over this
period. Nevertheless, today’s lowest income countries will still have large
gaps in GDP per capita in 2060 compared with the highest income
countries; India, Indonesia and Brazil will have GDP per capita levels (on a
current PPP basis) which will be only 30-40% of that of the United States.
Changes in China will be ofparticular importance
The size of China in the global economy makes developments in that
country of particular interest (Eichengreen et al., 2011; Haltmaier, 2013). Its
very high current saving and investment rates and the marked slowdown
in potential growth over the medium term, could be a source of future
instability. The projected slowdown in potential growth from rates of
about 8-9% currently to about 4½ per cent by the mid-2020s is
accompanied by a marked fall in the share of investment in GDP, from
about 45% currently to around 30%, which could in itself be demanding in
terms of reallocation needs in the domestic economy and the avoidance
of “bumps” in demand and activity. While the saving rate is expected to
decline over this period, it does not fall by as much and hence a growing
surplus on the current account could contribute to the re-emergence of
global imbalances. Beyond 2030, adjustments in the Chinese saving rate
may have a major impact on the global economy. This is both because
China will account for more than one-third of all world saving and
because over the 2030s China is expected to experience one of the most
rapid changes in the old-age dependency ratio of any country in the
projection period, which is expected to pull down the saving rate strongly,
based on cross-country empirical evidence (for example, Kerdrain et al.,
2010). In the current modelling framework this effect is large enough to
turn the external surplus into a deficit and to drive up global interest rates
significantly.
The medium-term outlook for public finances
Government indebtednessneeds to be reduced over the
medium term
Government indebtedness has risen substantially over the crisis; the
number of OECD countries with gross general government debt exceeding
100% of GDP will have risen from three prior to the crisis to 11 by 2014 on
5. This calculation does not take into account non-G20 non-OECD countries.

4. GROWTH PROSPECTS AND FISCAL REQUIREMENTS OVER THE LONG TERM
OECD ECONOMIC OUTLOOK, VOLUME 2013/1 © OECD 2013208
the basis of the short-term projections. A range of empirical studies,6
suggest high government indebtedness is associated with lower growth,
although the strength and shape of the relationship is likely to vary over
time and with a number of country-specific factors. A likely transmission
mechanism from higher indebtedness is through higher domestic interest
rates which gradually reduce investment, capital intensity and research
and development, and hence growth, over the medium term. Additional
reasons for reducing indebtedness are that it can inhibit counter-cyclical
fiscal policy – whether discretionary or automatic – during a severe
downturn and also increase the vulnerability of government finances to
adverse shocks, with the risk of a vicious cycle in debt dynamics if higher
interest rates result from financial market concerns about fiscal
sustainability.
Government debt is reducedto 60% of GDP in the
baseline
In the baseline scenario, and in line with earlier exercises of this kind,
it is thus assumed that for those countries with 2014 gross general
government debt in excess of 60% of GDP, fiscal policy is directed towards
achieving that level, although the choice of this particular level is
somewhat arbitrary. For countries where debt is initially below the 60%
threshold, fiscal policy is directed to stabilising the gross government debt
ratio. Over and above the improvement in the fiscal balance which results
from the operation of the automatic stabilisers as output gaps close, fiscal
consolidation is assumed to take place through a gradual improvement in
the underlying primary balance. There is a maximum cap on
consolidation in any single year of ½ percentage point of GDP, so the speed
at which the debt target is achieved could be considered as unambitious
and in some cases falls well short of governments’ stated intentions.
On a net debt measure thesituation looks less
problematic for somecountries
The focus here is on the concept of gross government debt, but net
debt (net of financial assets held by government) is also important. Gross
debt is preferable when looking at the borrowing needs of governments as
it is a good approximation of the debt that must be financed on the
markets. When looking at debt burdens and long-term sustainability,
however, the net debt measure is conceptually preferable as it represents
the amount of debt that would remain if the government were to liquidate
all the financial assets it holds. The gap between gross and net debt is
particularly large for Norway (gross debt of 34% of GDP in 2011 against a
6. A non-exhaustive list of recent studies finding a negative link between growthand government indebtedness is: Égert (2012) finds some evidence in favour ofa negative non-linear relationship between debt and growth, although resultsare sensitive to the sample period, country coverage and data frequency and,when detected, the negative nonlinear effect kicks in at levels of public debtbetween 20% and 60% of GDP; Kumar and Woo (2010) find that each10 percentage point increase in the gross debt-to-GDP ratio is associated with aslowdown in annual real per-capita GDP growth of about 0.15-0.2 percentagepoints per year for advanced economies, the effect being larger when debt goesabove 90% of GDP; Cecchetti et al. (2011) find that government debt can be a dragon growth beyond a threshold of 85% of GDP; whereas Elmeskov and Sutherland(2012) find lower debt thresholds, of around 40% and 70% of GDP.

4. GROWTH PROSPECTS AND FISCAL REQUIREMENTS OVER THE LONG TERM
OECD ECONOMIC OUTLOOK, VOLUME 2013/1 © OECD 2013 209
net debt of -158%), Japan (211% vs 127%), Sweden (49% vs -21%), Finland
(58% vs -54%) and Canada (83% vs 32%). The more practical reason to focus
on gross debt is that it is more cross-country comparable because data on
financial assets are of unequal quality across countries, although for
countries that have large government financial assets a gross debt target
of 60% may appear unduly stringent.
Debt exceeds 60% of GDP intwo-thirds of OECD
countries
More than one-third of OECD countries have maintained gross public
debt below 60% of GDP through the crisis (including Australia, Czech
Republic, Denmark, Estonia, Korea, Luxembourg, New Zealand, Norway,
Slovak Republic, Slovenia, Sweden and Switzerland). Of the remaining
OECD countries, the following groups can be identified in terms of further
consolidation requirements beyond 2014, here measured as the difference
between the projected underlying primary balance in 2014 and the average
underlying primary balance to 2030 which is required to stabilise debt at
60% by that year (Table 4.2 and Figure 4.4):7
Of these, many need littlefurther consolidation to
reduce debt
● A large group of countries require little (less than 1 percentage point of
GDP) or no further average consolidation beyond 2014 to achieve the
60% target by 2030: Austria, Belgium, Czech Republic, Germany,
Hungary, Israel, Italy, Netherlands, Poland, Slovak Republic and
Slovenia. Most of these countries have debt ratios which are already not
far from 60%, or where this is not the case (Italy and Belgium), went into
the crisis already running an underlying primary surplus. Most of these
countries have front-loaded consolidation so that the average
requirement beyond 2014 is less than one-fifth of what will have
already been achieved over 2010-14.
Another group requiresmore consolidation butmuch has already been
front-loaded
● A second group of countries require average consolidation of between 1
and 3 percentage points of GDP: France, Iceland, Ireland and Spain. All
of these countries have also front-loaded consolidation so that this
average requirement beyond 2014 is less than one-third of the required
post-crisis consolidation.
A few countries requiresubstantial further
consolidation
● A third group of countries all have debt ratios exceeding 100% of GDP
and require larger average consolidation of between 3 and 6 percentage
points of GDP: Greece, Portugal, United Kingdom and United States. Of
these, the United Kingdom will only have completed about one-third of
7. The measure of average consolidation is taken as the difference between theunderlying primary balance in the initial year (here 2014) and the average of theunderlying primary balance in each year up to 2030, except for those countrieswhere the debt target is reached after 2030 (Greece, Portugal, United Kingdomand United States), where the average is taken to the year in which governmentdebt reaches the 60% target. Japan is an exception because the debt target of60% is not even reached by 2060 in the baseline which, however, should also beseen in the light of gross assets of some 80% of GDP. The measure of averageconsolidation is conceptually similar to, and empirically closely correlatedwith, measures of the so-called “fiscal gap”, which measures the immediateincrease in the underlying primary balance, which if sustained, will ensure aparticular debt target is reached in a particular year (Sutherland et al., 2012).

4. GROWTH PROSPECTS AND FISCAL REQUIREMENTS OVER THE LONG TERM
OECD ECONOMIC OUTLOOK, VOLUME 2013/1 © OECD 2013210
Table 4.2. Fiscal trends with debt ratio targeting (60%)As percentage of nominal GDP (unless otherwise specified)
1 2 http://dx.doi.org/10.1787/888932838311
Consoli-
dation1
Consolidation from
2014 to achieve debt
target2
Financial
balances3
Net financial
liabilities4
Gross financial
liabilities5
2012-14 Average Peak 2012 2020 2030 2012 2020 2030 2012 2020 2030
Australia 3.0 0.1 0.3 -3.3 0.1 -0.3 10.9 7.7 6.4 32.4 29.2 28.0 Austria 0.5 -0.1 1.6 -2.5 1.6 -0.9 50.8 34.0 25.1 84.9 68.6 59.7 Belgium 1.6 0.5 2.6 -4.0 2.6 -1.4 82.0 58.1 38.1 104.1 79.5 59.5 Canada 1.0 1.5 2.8 -3.2 2.0 -0.4 34.5 24.8 11.6 85.5 72.9 59.7 Czech Republic 0.3 1.0 1.4 -4.4 0.0 -0.5 11.8 15.3 12.7 55.9 59.4 56.9 Denmark 0.3 -0.9 0.0 -4.1 -0.4 -0.5 7.0 12.0 11.7 58.9 60.1 59.9 Estonia -0.3 -0.2 0.0 -0.3 1.6 1.2 -32.7 -28.1 -28.9 14.2 16.3 15.5 Finland 0.8 1.7 2.6 -2.3 3.9 2.2 -54.6 -49.6 -57.4 63.3 67.4 59.6 France 2.4 2.4 4.3 -4.9 2.0 0.1 70.7 56.3 20.5 109.7 96.2 60.5 Germany -0.1 0.0 1.5 0.2 1.7 -0.6 50.9 30.5 23.1 89.2 67.2 59.7 Greece 3.2 3.2 8.1 -10.0 -1.9 8.0 102.8 110.3 32.6 165.6 170.0 92.2 Hungary 0.7 1.1 2.8 -2.0 0.8 -1.6 60.4 46.0 31.4 89.0 74.1 59.5 Iceland 1.7 1.9 4.3 -3.4 3.3 1.5 60.5 28.8 -10.8 131.8 100.1 60.5 Ireland 3.1 2.5 5.0 -7.5 1.3 0.5 79.5 69.4 22.3 123.3 108.4 61.3 Israel 1.2 1.2 2.3 -5.1 -1.2 -2.5 - - - 72.9 66.5 59.8 Italy 1.5 0.4 3.6 -2.9 4.6 -0.5 112.9 82.0 32.6 140.2 108.9 59.5 Japan 2.0 11.3 21.0 -9.9 -6.0 -5.6 135.9 159.8 169.1 219.1 243.0 252.3 Korea 0.0 -1.1 0.0 2.1 2.4 1.8 -37.7 -36.3 -36.4 35.1 36.4 36.3 Luxembourg 1.5 -0.7 0.0 -0.8 2.2 1.6 -45.9 -39.1 -40.3 28.4 35.3 34.0 Netherlands 1.8 0.8 2.1 -4.0 1.7 -0.8 42.0 32.5 21.9 82.6 70.3 59.7 New Zealand 2.0 -0.1 0.2 -3.9 -0.8 -0.6 8.3 13.5 13.9 44.3 49.4 49.9 Poland 2.4 1.1 1.2 -3.9 -1.1 -1.3 34.5 35.2 33.4 62.6 61.9 60.1 Portugal 2.1 3.7 7.7 -6.4 -1.3 5.3 88.5 95.3 37.4 138.8 139.4 81.6 Slovak Republic 3.9 -0.1 0.3 -4.3 -0.7 -0.9 25.1 25.5 23.7 56.6 57.4 55.7 Slovenia 2.3 -0.1 1.4 -4.0 1.4 -0.3 8.2 13.1 6.7 61.0 65.9 59.5 Spain 2.8 2.5 4.9 -10.6 0.3 -0.5 61.0 65.7 30.2 90.5 94.8 59.3 Sweden 0.5 0.5 0.8 -0.7 1.9 1.0 -23.3 -22.1 -25.1 48.7 49.9 47.0 Switzerland -0.1 -0.9 0.0 0.7 0.3 0.0 5.5 0.7 0.2 43.8 39.0 38.5 United Kingdom 1.7 5.9 10.0 -6.5 -3.5 0.3 70.9 83.8 66.3 103.9 116.8 99.3 United States 2.9 4.0 6.6 -8.7 -1.6 1.4 87.1 84.5 49.4 106.3 104.1 69.0 Euro Area 1.4 1.1 2.4 -3.7 2.0 -0.1 66.3 50.7 23.7 103.9 87.6 60.6
OECD 2.0 2.6 3.7 -5.7 -0.6 0.1 70.9 66.8 43.3 108.8 104.5 80.7
Note: These fiscal projections are the consequence of applying a stylised fiscal consolidation path and should not be interpreted as a forecast.1. Consolidation is measured as the change in the underlying primary balance.2.
3. General government fiscal surplus (+) or deficit (-) as a percentage of GDP.4.
5.
Source: OECD Economic Outlook 93 long-term database.
Includes all financial liabilities as defined by the system of national accounts (where data availability permits) and covers the general government sector,which is a consolidation of central, state and local governments and the social security sector. The definition of gross debt differs from the Maastrichtdefinition used to assess EU fiscal positions.
Over the projection period, countries with gross government debt ratios in excess of 60% of GDP are assumed to gradually reduce debt to this level,whereas other countries stabilise debt ratios at their current levels. Consolidation requirements from 2014 to achieve these objectives are measured intwo ways: average consolidation measures the difference between the underlying primary balance in 2014 and its average over the period to 2030 (oruntil the debt ratio stabilises); peak consolidation measures the difference between the underlying primary balance and its peak over the period until 2030(or the debt ratio stabilises).
Includes all financial liabilities minus financial assets as defined by the system of national accounts (where data availability permits) and covers thegeneral government sector, which is a consolidation of central, state and local governments and the social security sector. The definition of gross debtdiffers from the Maastricht definition used to assess EU fiscal positions.

4. GROWTH PROSPECTS AND FISCAL REQUIREMENTS OVER THE LONG TERM
OECD ECONOMIC OUTLOOK, VOLUME 2013/1 © OECD 2013 211
the required post-crisis consolidation by 2014, whereas the United
States will have completed just over half and Portugal about two-thirds.
Greece would still require another 3½ percentage points of
consolidation, despite having undertaken 10 percentage points of
consolidation between 2010 and 2014, though this does not take into
account any potential debt relief.
Japan is a special caserequiring a combination of
policies to reduce debt
● Finally, and despite a massive average fiscal consolidation requirement
beyond 2014 of 11 percentage points, the scenario for Japan only
manages to broadly stabilise debt between 2014 and 2030. Indeed, this
result underlines that, for Japan, an approach of gradual fiscal
consolidation will not be sufficient to tackle the government
indebtedness on its own and will need to be supplemented by other
policies (see Box 1.4 in Chapter 1). That said, large assets suggest that in
any case the 60% debt target is unduly ambitious for Japan.
Nonetheless, it is in the nature of long-term fiscal adjustment paths
that the exact end-point for debt matters relatively little for
consolidation requirements which are determined primarily by the
initial imbalance which is particularly large in the case of Japan.
Health and pensionpressures add to
consolidation requirements
The preceding calculations are likely to understate overall fiscal
policy requirements for a number of reasons. Firstly, increased pressures
on public spending from health and pensions (Box 4.4) are not explicitly
incorporated in the fiscal projections, but will need to be offset or
counteracted to contain government indebtedness (Figure 4.5). To put it
differently, governments will have to run to stand still. Recent OECD work
(Oliveira Martins and de la Maisonneuve, 2013) suggests that increased
Figure 4.4. Consolidation requirements to reduce government debt to 60 per cent of GDPChange in the underlying primary balance, percentage points of GDP
Note: The average measure of consolidation is the difference between the underlying primary balance in 2014 and the average underlyingprimary balance between 2015 and 2030, except for those countries for which the debt target is only achieved after 2030, in which casethe average is calculated up until the year that the debt target is achieved.Source: Source: OECD Economic Outlook 93 long-term database.
1 2 http://dx.doi.org/10.1787/888932836772
DEU AUT BEL CAN ITA CZE OECD ISL SVK IRL USA JPNISR FIN NLD HUN EA15 SVN POL FRA GBR ESP PRT GRC
-2
0
2
4
6
8
10
12
14
16%
-2
0
2
4
6
8
10
12
14
16%
2010-14 Average 2014-2030

4. GROWTH PROSPECTS AND FISCAL REQUIREMENTS OVER THE LONG TERM
OECD ECONOMIC OUTLOOK, VOLUME 2013/1 © OECD 2013212
Box 4.4. Changing health and pension expenditures
Public expenditure on pensions has been growing faster than national income and in many countries isexpected to continue to do so in coming decades. While past pension reforms (OECD, 2011), have reduced thebudgetary costs of pensions through lower benefits and increased retirement ages, they have been insufficientto stabilise spending, not least because of the demographic effect as a larger proportion of the populationreaches retirement age and people live longer. Around half of OECD countries are in the process of increasingpension ages or have already legislated change for the future. Nevertheless, public spending on pensions for atypical OECD country could still increase by about 1¼ percentage points of GDP to 2030 (see table below).
Recent OECD work (Oliveira Martins and de la Maisonneuve, 2013) suggests that in a “cost containmentscenario”, which assumes that policies act more strongly than in the past to rein in expenditure growth,OECD public expenditure on health and long-term care could still rise by an average of 1½ percentagepoints of GDP between 2014 and 2030. In a “cost-pressure scenario”, which assumes no stepped-up policyaction, the increase in expenditure rises by an additional one-third. Significant differences in health andlong-term care spending emerge across OECD countries, reflecting differences in factors such asdemographic trends and the initial starting point concerning income and the extent of informal long-termcare supply. Korea, Chile, Turkey and Mexico, for example, are projected to experience above averageincreases in public health expenditures.
Changes in public spending on health and pensions for selected OECD countriesChange 2014-30, percentage points of GDP
1 2 http://dx.doi.org/10.1787/888932838330
Health care1
Long-term care1
Pensions Total
Australia 1.2 0.2 0.7 2.1Austria 1.3 0.2 2.5 4.1Belgium 1.1 0.3 4.3 5.6Canada 1.4 0.2 1.5 3.2Chile 1.4 0.5 1.9Czech Republic 1.1 0.2 -0.1 1.3Denmark 1.3 0.2 0.5 2.0Estonia 0.9 0.2 -0.5 0.7Finland 1.2 0.2 3.4 4.8France 1.2 0.2 0.4 1.7Germany 1.3 0.3 1.3 2.9Greece 1.2 0.3 0.4 1.9Hungary 0.9 0.3 -0.8 0.4Ireland 1.2 0.1 1.3 2.7Iceland 1.2 0.2 1.4 2.8Israel 1.3 0.3 0.5 2.1Italy 1.3 0.3 -0.7 0.8Japan 1.4 0.3 1.7Korea 1.7 0.4 1.6 3.6Luxembourg 1.4 0.3 4.7 6.3Mexico 1.3 0.4 0.3 2.0Netherlands 1.4 0.3 2.3 4.0Norway 1.3 0.2 3.3 4.9New Zealand 1.1 0.1 2.0 3.2Poland 1.1 0.2 -0.6 0.7Portugal 1.3 0.2 0.5 2.0Slovak Republic 1.2 0.3 1.5 3.0Slovenia 1.3 0.3 2.0 3.6Spain 1.3 0.4 0.4 2.1Sweden 1.0 0.1 0.5 1.7Switzerland 1.3 0.2 1.7 3.3Turkey 1.2 0.3 1.2 2.7United Kingdom 1.1 0.2 0.1 1.4United States 1.2 0.1 0.3 1.6OECD (unweighted) average 1.2 0.3 1.2 2.7
Note: Where projections are not available over the period 2014-30, linear interpolation has been applied.1. Assuming cost-containment (Oliveira Martins and de la Maisonneuve, 2013). Source: European Commission (2012), OECD Pensions at a Glance (2011). Merola and Sutherland (2012), Bank of Israel.

4. GROWTH PROSPECTS AND FISCAL REQUIREMENTS OVER THE LONG TERM
OECD ECONOMIC OUTLOOK, VOLUME 2013/1 © OECD 2013 213
spending on health could amount to about 1½ percentage points of GDP
by 2030 for a typical OECD country even under a “cost containment
scenario” that would involve greater success than in the past in curtailing
that part of health care and long-term care spending increases which
cannot be ascribed to identifiable influences such as income growth,
demographic changes, female labour force participation, etc. The average
increase in pension costs across OECD countries is slightly less at
1¼ percentage point of GDP by 2030, but with wide variation and a much
greater increase in some countries (for example by more than
4 percentage points of GDP in Belgium and Luxembourg to 2030).
A peak measure ofconsolidation requirements
exceeds the averagemeasure
A second reason why fiscal efforts will be larger is that the required
profile of the underlying primary balance is likely to involve an intermediate
peak increase which is greater than the average increase referred to above (see
Box 4.5). This is because of the need to put debt on a declining path towards
the target. Once on that path, declining debt interest payments allow for
some relaxation of effort while achieving a gradual convergence to the target.
Among the countries that require most consolidation, the peak measure in
these projections is typically 2-4 percentage points of GDP higher than the
average measure of consolidation.8 However, many different time paths
Figure 4.5. Broader fiscal efforts to reduce government debt to 60 per cent of GDPChange in the underlying primary balance, percentage points of GDP
1. The average measure of consolidation is the difference between the primary balance in 2014 and the average primary balancebetween 2015 and 2030, except for those countries for which the debt target is only achieved after 2030, in which case the average iscalculated up until the year that the debt target is achieved.
Source: OECD Economic Outlook 93 long-term database.1 2 http://dx.doi.org/10.1787/888932836791
SWE DNK CHE HUN AUT LUX CZE FIN POL FRA ISL USA ESP PRT GRCEST KOR DEU ITA NZL AUS CAN NLD BEL SVN GBR SVK IRL JPN
-4
-2
0
2
4
6
8
10
12
14
16
18
20%
-4
-2
0
2
4
6
8
10
12
14
16
18
20%
2010-14Average to 2030¹Increased spending on pensions and health
8. The peak measure is, however, more dependent on the particular fiscaladjustment profile used to achieve the debt target, of which the baselinerepresents one specific case. For example, it might be possible to bring debtdown to the target by a given year either through increasing the primarysurplus to a very high level and then reducing it quickly, or alternatively bymaintaining the primary surplus at a more modest level, but over a muchlonger period before reducing it. The peak measure of consolidation would belarger in the first case, although the difference between the averageconsolidation measures would typically be relatively small.

4. GROWTH PROSPECTS AND FISCAL REQUIREMENTS OVER THE LONG TERM
OECD ECONOMIC OUTLOOK, VOLUME 2013/1 © OECD 2013214
Box 4.5. Measuring fiscal consolidation requirements
This box explains the measures which are used to summarise fiscal consolidation requirements toreduce gross government debt ratios to 60% of GDP in Table 4.2 and Figures 4.4 and 4.5. The target for thegovernment debt-to-GDP ratio is achieved here using a rule for the underlying primary balance describedin Rawdanowicz (2012), which is constrained by placing a cap on the maximum annual change in theunderlying primary fiscal balance of ½ per cent of GDP. However, many alternative time paths could beimagined. Nonetheless, a common feature of such time paths would usually involve a peak in theadjustment of the primary balance to put debt on a downward trajectory towards the target followed bysome gradual relaxation as declining debt leads to lower debt service payments and convergence towards(rather than overshooting of) the target debt allows a reduction in the pace of debt reduction.
Given the non-linear profile of the underlying primary balance there is an issue of how the requiredconsolidation effort can be summarised into a single number. For example, for France in the baselinescenario, the underlying primary surplus increases from 1.1% of GDP in 2014 to a peak primary surplus ofnearly 5½ per cent of GDP in 2023, before falling and subsequently stabilising at a primary surplus ofbetween 1 to 1¼ per cent of GDP beyond 2030, consistent with a stable government debt-to-GDP ratio of 60%(see figure below).
Fiscal consolidation profile for France to achieve a 60% government debt target by 2030Underlying primary balance as a percentage of GDP
Source: OECD Economic Outlook 93 long-term database.1 2 http://dx.doi.org/10.1787/888932836677
The summary measure of fiscal consolidation emphasised in this chapter is the difference between theunderlying primary balance in the initial year (here 2014) and the average primary balance to 2030. In thisexample, for France the average increase from 2014 to 2030 is just under 2½ percentage points of GDP. Theaverage measure has the advantage that it is reasonably robust to alternative fiscal consolidation profileswhich achieve the debt target around the same year. The average measure is, however, significantly lessthan the peak consolidation effort between 2014 and 2022 of over 4 percentage points of GDP. Thus in somerespects the average measure understates the required consolidation effort before the debt target iseventually achieved and for this reason the peak measures of consolidation are reported in Table 4.2 and inthe following figure as an example of the kind of adjustment that may be necessary to put debt on adownward path towards the target.
2010 2012 2014 2016 2018 2020 2022 2024 2026 2028 2030-4
-2
0
2
4
6%
-4
-2
0
2
4
6%
Peak
Average

4. GROWTH PROSPECTS AND FISCAL REQUIREMENTS OVER THE LONG TERM
OECD ECONOMIC OUTLOOK, VOLUME 2013/1 © OECD 2013 215
towards the debt target can be imagined and the measure of peak fiscal
effort is strongly sensitive to the exact path chosen, which is why this
chapter, in line with its predecessor, emphasises the measure of average
adjustment.
Fiscal consolidation willreduce interest rates and
global imbalances
While OECD-wide interest rates are still projected to rise as output
gaps close and policy rates normalise, lower government indebtedness
will damp the rise in interest rates through a number of channels: firstly,
it will lower fiscal risk premia, which are assumed to increase with the
excess of government debt levels above 75% of GDP; secondly, to the
extent that lower government debt reduces net external debt, it will also
reduce country-specific risk premia on domestic interest rates; and
finally, additional fiscal consolidation will boost global savings which will
tend to reduce interest rates in all countries. Overall, fiscal consolidation
in the baseline scenario reduces OECD real long-term interest rates by
about 50 basis points and, through this channel, boosts OECD potential
growth by an average of about 0.1 percentage point per annum over the
period to 2030, with larger effects on those countries undertaking most
consolidation. Because consolidation requirements are typically greater
in countries which are prone to running current account deficits, fiscal
consolidation will also tend to reduce the scale of global imbalances
(measured as the absolute sum of all current account balances
Box 4.5. Measuring fiscal consolidation requirements (cont.)
Alternative summary measures of consolidation requirementsChange in the underlying primary balance, percentage points of GDP
1. The average measure of consolidation is the difference between the primary balance in 2014 and the average primary balancebetween 2015 and 2030, except for those countries for which the debt target is only achieved after 2030, in which case theaverage is calculated up until the year that the debt target is achieved.
Source: OECD Economic Outlook 93 long-term database.1 2 http://dx.doi.org/10.1787/888932836696
SVK CZE DEU NLD EA15 BEL HUN OECD FRA IRL PRT GBRPOL SVN AUT ISR FIN CAN ITA ISL ESP USA GRC JPN
-2
0
2
4
6
8
10
12
14
16
18
20
22%
-2
0
2
4
6
8
10
12
14
16
18
20
22%
Average consolidation to 2030¹Excess of peak consolidation over average

4. GROWTH PROSPECTS AND FISCAL REQUIREMENTS OVER THE LONG TERM
OECD ECONOMIC OUTLOOK, VOLUME 2013/1 © OECD 2013216
normalised on world GDP) over the medium term by up to one-tenth (see
also Box 1.3 in Chapter 1).9
Structural policies can boost growth
There is considerable scopeto improve structural
policies in most countries…
Cross-country differences in structural policy settings represent an
opportunity to adjust policy towards “best practice” and so boost incomes
and welfare, as well as in some cases to bolster fiscal sustainability and
reduce current account imbalances. In contrast to the detailed country-
specific recommendations of the OECD’s annual Going for Growth
publication (for example, OECD, 2013), the approach taken here is more
stylised to gauge the order of magnitude of effects on growth over the
medium and long term from reforms in a number of broad areas.
... in product marketregulation…
● There is a range of firm, industry and macro-level evidence to suggest
that product market regulation has an impact on trend productivity, not
least via the pace at which it adjusts towards the international
frontier.10 Indeed, this is confirmed by the empirical work underlying
the current modelling framework (Johansson et al., 2013), so that more
pro-competitive product market regulation, as quantified by the OECD’s
product market regulation index (PMR), is found to boost long-term
productivity. Whereas in the baseline scenario, PMR is assumed to
gradually improve to at least the OECD average, an alternative scenario
is considered here whereby it gradually improves to current best
practice.11
... education… ● Reforms that promote the accumulation of human capital are among
the most important for boosting long-run living standards (Cohen and
Soto, 2007; Bouis et al., 2011). While policy priorities for reform of
education systems have been identified for many OECD countries, they
are a particular priority for the BRIICS where there is a focus on primary
and secondary education (OECD, 2013). Indeed, there is likely to be a
larger benefit to reforms where average years of schooling are initially
low, as empirical evidence would suggest that the returns from boosting
coverage and performance in primary and secondary education are
greater than for tertiary education.12 In order to simulate the effect of
education reforms in the BRIICS a variant scenario with faster
convergence in human capital was constructed based on past historical
episodes for low-income countries during which educational levels rose
particularly quickly. During these episodes – which include countries
9. These effects are calculated relative to a counter-factual scenario (not reportedin further detail here) in which fiscal policy is directed so as to hold governmentdebt-to-GDP ratios stable.
10. See for example Bourlès et al., 2010; Barone and Cingano, 2011; Conway et al.,2006; Bas and Causa, 2012.
11. Best practice in terms of PMR, based on the last survey in 2008, was found to befor the United Kingdom.
12. This is reflected in the current modelling framework whereby human capitalimprovement is modelled as a decreasing function of additional years ofschooling.

4. GROWTH PROSPECTS AND FISCAL REQUIREMENTS OVER THE LONG TERM
OECD ECONOMIC OUTLOOK, VOLUME 2013/1 © OECD 2013 217
with major reforms to enhance primary and secondary coverage and
performance, such as Korea in the 1950s and 1960s or Mexico and Chile
in the 1980s – the annual speed of convergence in education levels was
on average around 50% higher than in the baseline. The variant
scenario is based on the assumption that this faster speed of
convergence in educational attainment applies to the BRIICs from 2014
onwards.
... retirement policies… ● Population ageing will have an adverse impact on labour utilisation and
also important fiscal implications in terms of possible increased
pension costs. Around half of OECD countries have begun increasing
pension ages or plan to do so in the near future and these reforms are
incorporated in the baseline up to 2030, at which point it is further
assumed that working lives are extended in line with increasing life
expectancy. A variant scenario considers deeper labour market reforms
in which cross-country differences in active life expectancy are
progressively eliminated, with the share of life expectancy which is
spent in the labour market slowly converging in all countries towards
that observed in Switzerland, one of the leading countries in terms of
aggregate participation.
... and in the labour market ● Recent OECD recommendations for structural reform priorities have
shown an increasing focus on the labour market, reflecting the job-
market legacy of the crisis. Recommendations to reduce structural
unemployment include reform of tax and benefit systems, active labour
market policies and job protection legislation. In the baseline scenario
the structural unemployment rate is assumed to gradually return to
pre-crisis levels in each country. In the variant scenario no attempt is
made to evaluate the scope to reduce the unemployment rate further
based on structural policy characteristics of individual countries, rather
a stylised assumption is made that through a combination of polices
the structural unemployment can be gradually reduced to 5% in those
countries where it would otherwise exceed it.
Structural reforms couldlead to large GDP gains for
some countries…
Each of the policy reforms was simulated separately and then
together as a package. The GDP effect of a combined package of measures
simulated in all countries are typically less than the sum of each policy
reform simulated separately because the combined package would lead to
faster global growth, higher investment demand and so upward pressure
on global interest rates. The effect of a combined package of measures
also differs widely across countries, according to how far away they are
from best practice initially in each of the policy areas (Figure 4.6).
Aggregate OECD wide output is about 12% higher in 2060, but this
understates the benefits for many countries because the larger OECD
countries are typically closer to best practice. Indeed, the long-term gain
in GDP for the median OECD country is about 20%. For the non-OECD,
where there is greater scope for implementing best practice policies,
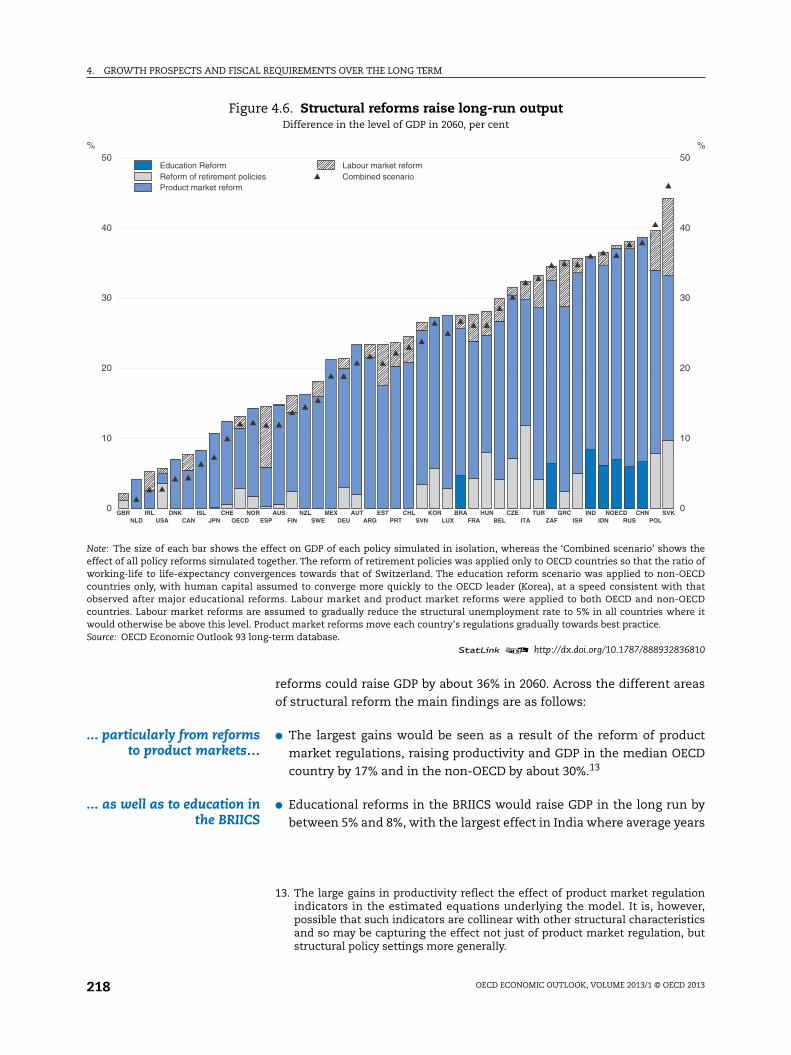
4. GROWTH PROSPECTS AND FISCAL REQUIREMENTS OVER THE LONG TERM
OECD ECONOMIC OUTLOOK, VOLUME 2013/1 © OECD 2013218
reforms could raise GDP by about 36% in 2060. Across the different areas
of structural reform the main findings are as follows:
... particularly from reformsto product markets…
● The largest gains would be seen as a result of the reform of product
market regulations, raising productivity and GDP in the median OECD
country by 17% and in the non-OECD by about 30%.13
... as well as to education inthe BRIICS
● Educational reforms in the BRIICS would raise GDP in the long run by
between 5% and 8%, with the largest effect in India where average years
Figure 4.6. Structural reforms raise long-run outputDifference in the level of GDP in 2060, per cent
Note: The size of each bar shows the effect on GDP of each policy simulated in isolation, whereas the ‘Combined scenario’ shows theeffect of all policy reforms simulated together. The reform of retirement policies was applied only to OECD countries so that the ratio ofworking-life to life-expectancy convergences towards that of Switzerland. The education reform scenario was applied to non-OECDcountries only, with human capital assumed to converge more quickly to the OECD leader (Korea), at a speed consistent with thatobserved after major educational reforms. Labour market and product market reforms were applied to both OECD and non-OECDcountries. Labour market reforms are assumed to gradually reduce the structural unemployment rate to 5% in all countries where itwould otherwise be above this level. Product market reforms move each country's regulations gradually towards best practice.Source: OECD Economic Outlook 93 long-term database.
1 2 http://dx.doi.org/10.1787/888932836810
GBR IRL DNK ISL CHE NOR AUS NZL MEX AUT EST CHL KOR BRA HUN CZE TUR GRC IND NOECD CHN SVKNLD USA CAN JPN OECD ESP FIN SWE DEU ARG PRT SVN LUX FRA BEL ITA ZAF ISR IDN RUS POL
0
10
20
30
40
50%
0
10
20
30
40
50%
Education ReformReform of retirement policiesProduct market reform
Labour market reformCombined scenario
13. The large gains in productivity reflect the effect of product market regulationindicators in the estimated equations underlying the model. It is, however,possible that such indicators are collinear with other structural characteristicsand so may be capturing the effect not just of product market regulation, butstructural policy settings more generally.
4. GROWTH PROSPECTS AND FISCAL REQUIREMENTS OVER THE LONG TERM
OECD ECONOMIC OUTLOOK, VOLUME 2013/1 © OECD 2013 219
of schooling are currently very low. The lags before GDP increases are,
however, more pronounced compared to the other policy reforms.
Scope for reforms that raiselabour utilisation varies
widely
● Reforms directed at raising participation have widely varying impacts
across OECD countries, with the largest gains in those countries where
participation rates of older workers and females are currently low; GDP
is increased by 7-12% in Czech Republic, Hungary, Italy, Poland and
Slovak Republic. As these larger effects would occur partly through a
disproportionate increase in the female participation rate, it suggests
that reforms would need to include increased childcare provision. The
labour market reforms directed at lowering the structural unemployment
rate have smaller effects on aggregate OECD output, but with large
effects of between 6-11% in a few countries such as Estonia, Greece,
Poland, Slovak Republic and Spain.
Higher labour utilisationpromotes fiscal
sustainability
Finally, it might be noted that while there may be greater scope for
long-run gains to GDP from policies that promote productivity, GDP
increases brought about by policies that increase labour utilisation are
likely to have a greater effect in boosting fiscal sustainability. This is
because higher employment increases GDP and tax revenues, reduces
unemployment benefits and, to the extent the additional employment is
in the private sector, public spending falls as a share of GDP (OECD,
2010b).14 On this basis, each percentage point improvement in
employment improves government financial balances by between 0.3%
and 0.7% of GDP, with the effect largest in countries where the ratio of
public to private sector employment and unemployment-related benefits
are initially highest.15 For countries with the largest employment gains
from structural reforms (Slovak Republic and Poland), or where public
sector employment is high and unemployment-related benefits more
generous (Belgium and France), or for countries where some combination
of the two holds (Hungary, Italy and Spain), such effects imply a direct
improvement in underlying fiscal balances of 5-8 percentage points of
GDP. In the scenarios reported here, such fiscal savings are not taken into
account which implies that these countries would find reaching their debt
target easier.
14. Increases in trend productivity also increase GDP and tax revenue, but over themedium term are also likely to lead to higher wages, including in the publicsector, so that the medium-term implications for fiscal balances may be lessfavourable.
15. These figures are based on stylised calculations using the OECD’s regularelasticities for cyclical adjustments, for further details see OECD (2010b).

4. GROWTH PROSPECTS AND FISCAL REQUIREMENTS OVER THE LONG TERM
OECD ECONOMIC OUTLOOK, VOLUME 2013/1 © OECD 2013220
Bibliography
Barone, G. and F. Cingano (2011), “Service Regulation and Growth: Evidence fromOECD Countries”, Economic Journal, Vol. 121.
Bas, M. and O. Causa (2012), “Trade and Product Market Policies in Upstream Sectorsand Productivity in Downstream Sectors: Firm-level Evidence from China”,OECD Economics Department Working Papers, No. 990, OECD Publishing.
Bouis, R., R. Duval and F. Murtin (2011), “The Policy and Institutional Drivers ofEconomic Growth Across OECD and Non-OECD Economies: New Evidence fromGrowth Regressions”, OECD Economics Department Working Papers, No. 843, OECDPublishing.
Bourlès, R., G. Cette, J. Lopez, J. Mairesse and G. Nicoletti (2010), “Do Product MarketRegulations in Upstream Sectors Curb Productivity Growth?: Panel DataEvidence for OECD Countries”, OECD Economics Department Working Papers,No. 791.
Cecchetti, S., M. Mohanty and F. Zampolli (2011), “The Real Effects of Debt”, BISWorking Papers, No. 352.
Cohen and Soto (2007), “Growth and Human Capital: Good Data, Good Results”,Journal of Economic Growth, Vol. 12.
Conway, P.,D. de Rosa, G. Nicoletti and F. Steiner (2006), “Regulation, Competitionand Productivity Convergence”, OECD Economics Department Working Papers,No. 509, OECD Publishing.
European Commission (2012), “The 2012 Ageing Report, Economic and BudgetaryProjections for the 27 EU Member States”, European Economy 2/2012.
Égert, B. (2010), “Fiscal Policy Reaction to the Cycle in the OECD: Pro- or Counter-Cyclical?”, OECD Economics Department Working Papers No. 763, OECD Publishing.
Égert, B. (2012), “Public Debt, Economic Growth and Nonlinear Effects: Myth orReality?”, OECD Economics Department Working Papers No. 993, OECD Publishing.
Eichengreen, B., D. Park and K. Shin (2011), “When Fast Growing Economies SlowDown: International Evidence and Implications for China”, NBER Working Papers,No. 16919.
Elmeskov, J. and D. Sutherland (2012), “Post-Crisis Debt Overhang: GrowthImplications Across Countries”, paper prepared for the Reserve Bank of India’sSecond International Research Conference 2012, 1-2 February, Mumbai, India.
Frankel, J. (2006), “The Balassa-Samuelson Relationship and the Renminbi”, HarvardWorking Paper, December.
Haltmaier, J. (2013), “Challenges for the Future of Chinese Economic Growth”,Federal Reserve Board, International Finance Discussion Papers, No. 1072.
Johansson, A., Y. Guillemette, F. Murtin, D. Turner, G. Nicoletti, C. de laMaisonneuve, P. Bagnoli, G. Bousquet and F. Spinelli (2013), “Long-Term GrowthScenarios”, OECD Economics Department Working Papers, No. 1000, OECDPublishing.
Kerdrain, C., I. Koske and I. Wanner (2010), “The Impact of Structural Policies onSaving Investment and Current Accounts”, OECD Economics Department WorkingPapers, No. 815, OECD Publishing.
Kumar, M. S. and J. Woo (2010), “Public Debt and Growth”, IMF Working Papers,No. 10/174.
Lane, P. R. and G. M. Milesi-Ferreti (2001), “Long-Term Capital Movements”, Centrefor Economic Policy Research, Discussion Paper No. 2873.
Laubach, T. (2009), “New Evidence on the Interest Rate Effects of Budget Deficitsand Debt”, Journal of the European Economic Association, Vol. 7.
OECD (2010a), Economic Outlook No. 87, “Prospects for Growth and Imbalancesbeyond the Short-term”, Chapter 4, OECD Publishing.

4. GROWTH PROSPECTS AND FISCAL REQUIREMENTS OVER THE LONG TERM
OECD ECONOMIC OUTLOOK, VOLUME 2013/1 © OECD 2013 221
OECD (2010b), Economic Outlook No. 88, “Fiscal Consolidation Requirements, Timing,Instruments and Institutional Arrangements”, Chapter 4, OECD Publishing.
OECD (2011), Pensions at a Glance, OECD Publishing.
OECD (2013), Going for Growth, OECD Publishing.
Oliveira Martins, J. and C. de la Maisonneuve (2013), “Public Spending on Health andLong-Term Care: a New Set of Projections”, OECD Economics Department WorkingPapers, OECD Publishing, forthcoming.
Rawdanowicz, L. (2012), “Choosing the Pace of Fiscal Consolidation”, OECDEconomics Department Working Papers, No. 992, OECD Publishing.
Röhn, O. (2011), “New Evidence on the Private Saving Offset and RicardianEquivalence”, OECD Economics Department Working Papers, No. 762, OECDPublishing.
Rose, D. (2010), “The Influence of Foreign Assets and Liabilities on Real InterestRates”, Institute of Policy Studies Working Paper 10/09.
Sutherland, D., P. Hoeller and R. Merola (2012), “Fiscal Consolidation: Part 1. HowMuch is Needed and How to Reduce Debt to a Prudent Level?”, OECD EconomicsDepartment Working Papers, No. 932, OECD Publishing.