Embed Size (px)
Citation preview
163
Netherlands Journal of Sea Research 29 (1-3): 163-172 (1992)
GROWTH VARIATION OF NEWLY SETTLED WINTER FLOUNDER (PSEUDOPLEURONECTES AMERICANUS)IN NEW JERSEY ESTUARIES
AS DETERMINED BY OTOLITH MICROSTRUCTURE
SUSAN M. SOGARD* and KENNETH W. ABLE Marine Field Station, Institute of Marine and Coastal Sciences, Rutgers University, Great Bay Boulevard, Tuckerton,
NJ 08087, U.S.A.
ABSTRACT
In an effort to determine differential patterns of growth for juvenile winter flounder, otolith incre- ments were examined from individuals collected from 4 sites spanning the coastline of New Jersey, U.S.A. (approximately 200 km) in late May 1990. Increment widths in 3 sections of the left sagitta were measured with an image analysis system, and the number of post-metamorphic increments counted. A linear regression equation based on the correspondence between otolith growth and somatic growth was used to calculate daily growth rates from the mean increment width in each otolith section. Fishes collected from the most northern site (Sandy Hook) and a mid-coast site (Great Bay) were significantly smaller in total length than the other 2 sites (Barnegat Bay and Wildwood). Based on increment counts and widths, fishes at Sandy Hook were smaller be- cause they were younger in post-metamorphic age; mean increment counts at the other 3 sites did not differ from each other but were all signifi- cantly greater than for Sandy Hook. In contrast, fishes at Great Bay were smaller because they had a slower growth rate; the other 3 sites had similar growth rates that were all significantly greater than the Great Bay site. Thus, age and growth information recorded in the otolith incre- ments allowed distinction of 2 underlying reasons for different size-frequency distributions.
1. INTRODUCTION
Variability in growth rates of fishes during the early part of the juvenile stage can have a marked in- fluence on successful recruitment to the subsequent adult population (HOUDE, 1987). The benefits of rapid growth operate in one way by decreasing the range of vulnerability to predators. Size-selective predation typically concentrates on smaller fishes (e.g. PARKER,
1971; POST & EVANS, 1989a). Individuals that grow quickly will spend less time in the more vulnerable size ranges, thus enhancing their probability of sur- vival. A large size at the end of the nursery period can also have continued benefits for an individual by increasing the probability of surviving the first winter (POST & EVANS, 1989b) or ensuring a relative size difference that is maintained into adulthood, with pre- sumed subsequent competitive advantages.
We typically have little information concerning growth rates at the level of the individual during the period of juvenile residence in nursery habitats. Such growth estimates are particularly important for the first few weeks of the juvenile stage, since this period may be crucial in determining an individual's proba- bility of survival.
New otolith increments provide a potential means of obtaining growth rates of individuals under natural conditions. The width between adjacent increments has been proposed to directly correspond with the amount of somatic growth during that time interval. A significant correspondence has been verified ex- perimentally in a variety of species (WILSON & LAR- KIN, 1982; VOLK et al., 1984; NEILSON & GEEN, 1985; BRADFORD & GEEN, 1987; ALHOSSAINI & PITCHER, 1988). However, recent concerns about the strength of this correspondence have led to comparisons of the otolith size - fish size scaling under different en- vironmental conditions (MOSEGAARD et al., 1988; RE- ZNICK etal., 1989; SECOR & DEAN, 1989). These latter studies have generally concluded that, because otolith growth tends to be more conservative than so- matic growth, increment widths may overestimate so- matic growth rates during very slow periods and underestimate somatic growth during rapid in- creases in length or weight. Thus, detailed under- standing of scaling relationships is necessary before using otolith increments to estimate natural growth rates.
The winter flounder (Pseudopleuronectes america-
*Present address: Hatfield Marine Science Center, Oregon State University, Newport, OR 97365, U.S.A.
164 S.M. SOGARD & K.W. ABLE
nus) is an economically important flatfish along the northeast coast of North America. Spawning occurs inside estuaries in winter months, with adults migrat- ing offshore as water temperatures rise in spring (PEARCY, 1962). Despite the potential for mixing of stocks during summer residence offshore, winter flounder are comprised of discrete, localized stocks, with adults presumably returning to their natal estu- ary for spawning (PERLMUTTER, 1947; SAILA, 1961). For New Jersey in particular, tagging studies con- ducted by DANILA & KENNISH (1981) indicate distinct stocks associated with each major estuary. PEARCY (1962) noted several factors that reduce dispersion of winter flounder eggs and larvae, including production of demersal, adhesive eggs, benthos-oriented larval behaviour, and metamorphosis at a relatively small size (for a flatfish). SAUCERMAN (1990) demonstrated limited movement of young-of-the-year winter flound- er during their summer residence in shallow estua- rine habitats. These characteristics of limited mixing of adult populations and limited movement of larval and juvenile winter flounder suggest that individual estuaries support discrete local populations. Thus, contrasts in development and growth across different estuaries may have a genetic component due to utili- zation by different stocks.
In a previous study, SOGARD (1990) compared short-term growth rates of juvenile winter flounder at 4 sites, 2 in Great Bay and 2 in Little Egg Harbor, New Jersey. At each site, fishes were held in cages placed on vegetated (Ulva lactuca in Great Bay and Zostera marina in Little Egg Harbor) and unvegetated sub- strates. In 2-way ANOVAs comparing factors of site and habitat (vegetated vs. unvegetated), site had a significant effect on growth in length in 4 out of 5 ex- periments (with the fastest growth always at one of the Great Bay sites), while habitat was significant in only one experiment (faster growth on unvegetated substrates), suggesting that physical location was more important than habitat in its influence on winter flounder growth. Contrasts in growth rates across the 4 sites were remarkably consistent across the differ- ent experiments, conducted in 2 different years, in- dicating persistence in relative quality of the sites. Growth was not directly related to prey densities, which were measured in each cage, but there was a negative correlation of growth with the silt/clay frac- tion of the sediments; faster growth occurred on san- dier sediments. Slower growth at the Little Egg Harbor sites was potentially also related to higher water temperatures compared to the Great Bay sites.
Caging experiments can provide precise measure- ment of individual growth during a discrete period of time. They are limited in scope and time-consuming, however, and growth rates of fishes held in en- closures may not reflect growth of unrestrained fish- es. In the present study we used growth information
recorded in the otoliths to estimate natural growth rates and compare them to rates determined in cag- ing experiments. In addition, we compared growth rates at different locations on a broader geographic scale. By using otoliths, we could estimate short-term growth rates at different stages in an individual's life, and determine if contrasts in length-frequency distri- butions were due to variation in growth or variation in settlement dates.
Acknowledgments.--We thank Dan Roelke, Dave Witting, Rich McBride, Roland Hagen, Lynn Wulff, and Matthew Pearson for assistance in the field and laboratory. Margie Szedlmayer developed the com- puter programs used in the image analysis system. The study was funded by a grant to S. Sogard from the Electric Power Research Institute. This paper is Rutgers University Institute of Marine and Coastal Sciences publication number 91-37.
2. MATERIALS AND METHODS
2.1. DAILY INCREMENT PATTERNS
Characteristic features of the sagittae of juvenile winter flounder have been previously described (SOGARD, 1991), and will only be outlined here. Ac- cessory primordia or secondary growth centres con- sistently form on the periphery of the sagittae during metamorphosis, just prior to completion of eye migra- tion. This prominent pattern allows ready distinction of increments deposited during the juvenile stage from the earlier increments deposited during the lar- val stage. Increments counted from the innermost secondary growth centre to the otolith edge cor- respond to the post-metamorphic age of an individu- al. Verification of a daily pattern of increment deposition was straightforward for winter flounder in a positive phase of growth, but increments were not entirely resolvable or were less than daily for slowly growing fishes (SOGARD, 1991).
2.2. OTOLITH GROWTH - SOMATIC GROWTH CORRESPONDENCE
To determine the degree of correspondence of otolith growth with somatic growth, SOGARD (1991) com- pared growth in total length with the amount of otolith material following a tetracycline-induced fluorescent mark on the sagitta. Juvenile flounders were im- mersed in a bath of oxytetracycline dihydrate, then held in 1-m 2 cages in the field for experiments com- paring growth across different habitats (SOGARD, 1990). Individual measurements of otolith growth and somatic growth during the 10-day trials were com- pared by least squares regressions, resulting in the following equation:
OTOLITH DETERMINATION OF GROWTH VARIATION IN WINTER FLOUNDER 165
otolith growth=8.71 . somatic growth+2.402, t,
where otolith growth is the increase in rostral radius of the left sagitta (in #m), somatic growth is the in- crease in total length (in mm) and t is the time dura- tion (in days). The linear relationship was highly significant (F=273.4, P <0.001) and had an r 2 value of 0.73. We concluded that the correspondence of otolith growth to somatic growth was strong enough to allow estimation of reasonably accurate growth rates from increment widths of wild caught fishes.
2.3. SAMPLE COLLECTIONS
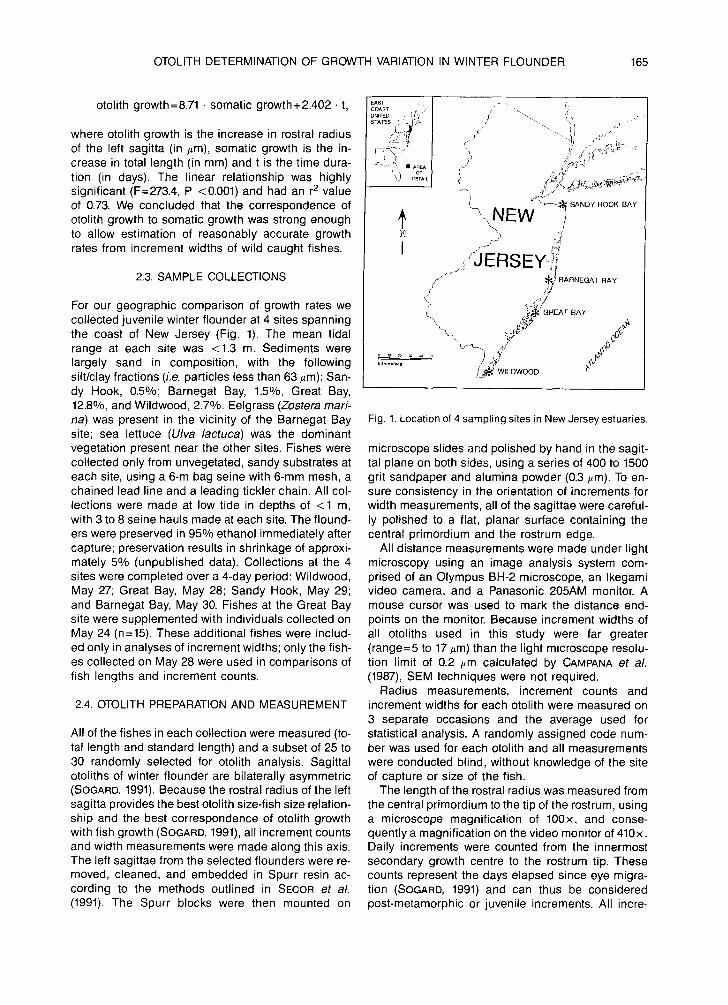
For our geographic comparison of growth rates we collected juvenile winter flounder at 4 sites spanning the coast of New Jersey (Fig. 1). The mean tidal range at each site was <1.3 m, Sediments were largely sand in composition, with the following silt/clay fractions (i.e. particles less than 63/~m): San- dy Hook, 0.5% ; Barnegat Bay, 1.5% , Great Bay, 12.8% , and Wildwood, 2.7%. Eelgrass (Zostera mari- na) was present in the vicinity of the Barnegat Bay site; sea lettuce (Ulva lactuca) was the dominant vegetation present near the other sites. Fishes were collected only from unvegetated, sandy substrates at each site, using a 6-m bag seine with 6-mm mesh, a chained lead line and a leading tickler chain. All col- lections were made at low tide in depths of <1 m, with 3 to 8 seine hauls made at each site. The flound- ers were preserved in 95% ethanol immediately after capture; preservation results in shrinkage of approxi- mately 5% (unpublished data). Collections at the 4 sites were completed over a 4-day period: Wildwood, May 27; Great Bay, May 28; Sandy Hook, May 29; and Barnegat Bay, May 30. Fishes at the Great Bay site were supplemented with individuals collected on May 24 (n=15). These additional fishes were includ- ed only in analyses of increment widths; only the fish- es collected on May 28 were used in comparisons of fish lengths and increment counts.
2.4. OTOLITH PREPARATION AND MEASUREMENT
All of the fishes in each collection were measured (to- tal length and standard length) and a subset of 25 to 30 randomly selected for otolith analysis. Sagittal otoliths of winter flounder are bilaterally asymmetric (SOGARD, 1991). Because the rostral radius of the left sagitta provides the best otolith size-fish size relation- ship and the best correspondence of otolith growth with fish growth (SOGARD, 1991), all increment counts and width measurements were made along this axis. The left sagittae from the selected flounders were re- moved, cleaned, and embedded in Spurr resin ac- cording to the methods outlined in SECOR et al. (1991). The Spurr blocks were then mounted on
f , cs " ~ SANDY HOOK BAY
ERSEY f
,/ / D~ w.owooo
Fig. 1. Location of 4 sampling sites in New Jersey estuaries.
microscope slides and polished by hand in the sagit- tal plane on both sides, using a series of 400 to 1500 grit sandpaper and alumina powder (0.3 #m). To en- sure consistency in the orientation of increments for width measurements, all of the sagittae were careful- ly polished to a flat, planar surface containing the central primordium and the rostrum edge.
All distance measurements were made under light microscopy using an image analysis system com- prised of an Olympus BH-2 microscope, an Ikegami video camera, and a Panasonic 205AM monitor. A mouse cursor was used to mark the distance end- points on the monitor. Because increment widths of all otoliths used in this study were far greater (range=5 to 17/~m) than the light microscope resolu- tion limit of 0.2 #m calculated by CAMPANA et al. (1987), SEM techniques were not required.
Radius measurements, increment counts and increment widths for each otolith were measured on 3 separate occasions and the average used for statistical analysis. A randomly assigned code num- ber was used for each otolith and all measurements were conducted blind, without knowledge of the site of capture or size of the fish.
The length of the rostral radius was measured from the central primordium to the tip of the rostrum, using a microscope magnification of 100x, and conse- quently a magnification on the video monitor of 410x. Daily increments were counted from the innermost secondary growth centre to the rostrum tip. These counts represent the days elapsed since eye migra- tion (SOGARD, 1991) and can thus be considered post-metamorphic or juvenile increments. All incre-
166 S.M. SOGARD & K.W. ABLE
~0 900 c o
o
E 800
co • 700 o
o 600
o
500
4OO
~2 4
~ ~ 2 2 2 222(= 4
3 I 4
BB (2) Wl (4) SH (~)
GB (3)
50 55 40 45 50 55 60 65 Total length (mm)
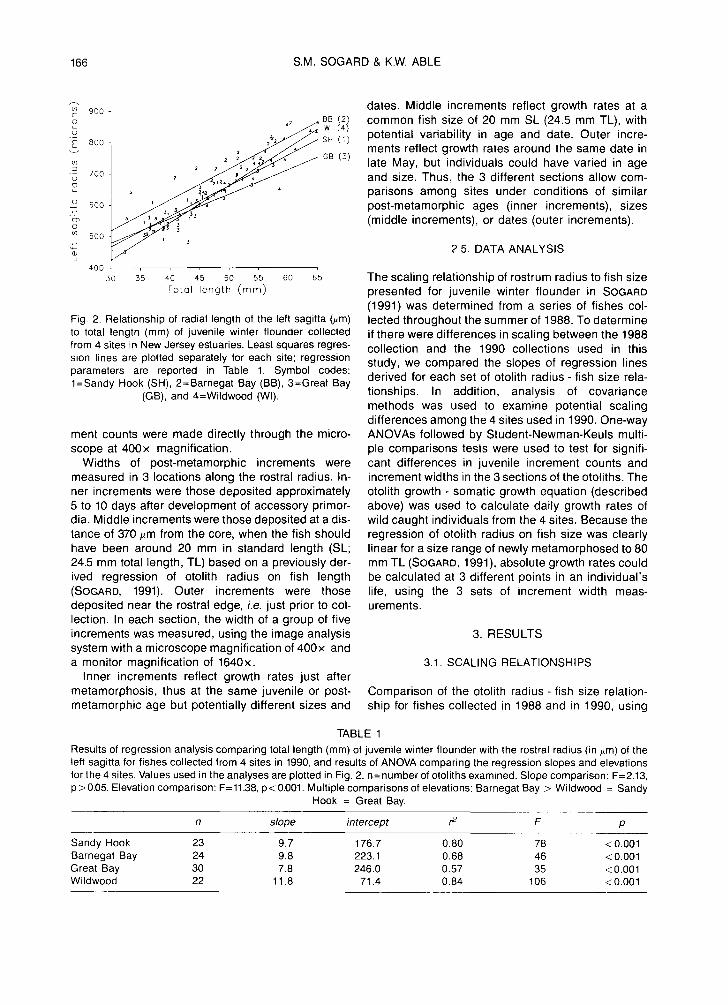
Fig. 2. Relationship of radial length of the left sagitta (#m) to total length (mm) of juvenile winter flounder collected from 4 sites in New Jersey estuaries. Least squares regres- sion lines are plotted separately for each site; regression parameters are reported in Table 1. Symbol codes: 1=Sandy Hook (SH), 2=Barnegat Bay (BB), 3=Great Bay
(GB), and 4=Wildwood (Wl).
ment counts were made directly through the micro- scope at 400x magnification.
Widths of post-metamorphic increments were measured in 3 locations along the rostral radius. In- ner increments were those deposited approximately 5 to 10 days after development of accessory primor- dia. Middle increments were those deposited at a dis- tance of 370 #m from the core, when the fish should have been around 20 mm in standard length (SL; 24.5 mm total length, TL) based on a previously der- ived regression of otolith radius on fish length (SOGARD, 1991). Outer increments were those deposited near the rostral edge, i.e. just prior to col- lection. In each section, the width of a group of five increments was measured, using the image analysis system with a microscope magnification of 400x and a monitor magnification of 1640x.
Inner increments reflect growth rates just after metamorphosis, thus at the same juvenile or post- metamorphic age but potentially different sizes and
dates. Middle increments reflect growth rates at a common fish size of 20 mm SL (24.5 mm TL), with potential variabil ity in age and date. Outer incre- ments reflect growth rates around the same date in late May, but individuals could have varied in age and size. Thus, the 3 different sections allow com- parisons among sites under conditions of similar post-metamorphic ages (inner increments), sizes (middle increments), or dates (outer increments).
2.5. DATA ANALYSIS
The scaling relationship of rostrum radius to fish size presented for juvenile winter f lounder in SOGARD (1991) was determined from a series of fishes col- lected throughout the summer of 1988. To determine if there were differences in scaling between the 1988 collection and the 1990 collections used in this study, we compared the slopes of regression lines derived for each set of otolith radius - fish size rela- tionships. In addition, analysis of covariance methods was used to examine potential scaling differences among the 4 sites used in 1990. One-way ANOVAs followed by Student-Newman-Keuls multi- ple comparisons tests were used to test for signifi- cant differences in juvenile increment counts and increment widths in the 3 sections of the otoliths. The otolith growth - somatic growth equation (described above) was used to calculate daily growth rates of wild caught individuals from the 4 sites. Because the regression of otolith radius on fish size was clearly linear for a size range of newly metamorphosed to 80 mm TL (SOGARD, 1991), absolute growth rates could be calculated at 3 different points in an individual 's life, using the 3 sets of increment width meas- urements.
3. RESULTS
3.1. SCALING RELATIONSHIPS
Comparison of the otolith radius - fish size relation- ship for fishes collected in 1988 and in 1990, using
TABLE 1 Results of regression analysis comparing total length (mm) of juvenile winter flounder with the rostral radius (in #m) of the left sagitta for fishes collected from 4 sites in 1990, and results of ANOVA comparing the regression slopes and elevations for the 4 sites. Values used in the analyses are plotted in Fig. 2. n=number of otoliths examined. Slope comparison: F=2.13, p > 0,05. Elevation comparison: F= 11.38, p < 0.001. Multiple comparisons of elevations: Barnegat Bay > Wildwood = Sandy
Hook = Great Bay.
n slope intercept r 2 F p
Sandy Hook 23 9.7 176.7 0.80 78 < 0.001 Barnegat Bay 24 9.8 223.1 0.68 46 < 0.001 Great Bay 30 7.8 246.0 0.57 35 < 0.001 Wildwood 22 11.8 71.4 0.84 106 < 0.001
OTOLITH DETERMINATION OF GROWTH VARIATION IN WINTER FLOUNDER 167
similarly sized winter flounders, revealed no signifi- cant difference in slope (t=1.09, P>0.05). Thus, the 1988 and 1990 fishes had similar increases in otolith Inner secf.lon Middle section radius with increase in fish size. Among the 4 sites ~ used in 1990 collections, there was no significant :~ ~2 :~ ~2 difference in slope, but the Barnegat Bay regression ~ ~o ~ ~o had a significantly higher elevation (Fig. 2, Table 1); ~ thus, at the same fish size, otoliths were slightly larg- b 6 b 6 er for Barnegat Bay fishes than for the other sites. ~_ 4 ~ 4 However, the lack of a significant difference among slopes indicated a consistency in the amount of ~ otolith growth occurring with each unit of somatic SH BB GB Wl SH BB GB Wl growth. Otoliths of the Barnegat Bay fishes may have ,: ~4 ] Ou te r s e c t i o n ~ 70 ]
been~t relatively larger at the time °f metam°rph°sis" 2 '2 ~ W ~ Sondy Hook ~ i ~ ~ ~= 108 ~ E~ 6 0 ~ 50
c 40 °
4 c 4 ~r~ 20
0 Z 0 1 SH BB GB Wl SH BB GB Wl ] Bornegat Boy
H Site Site 8
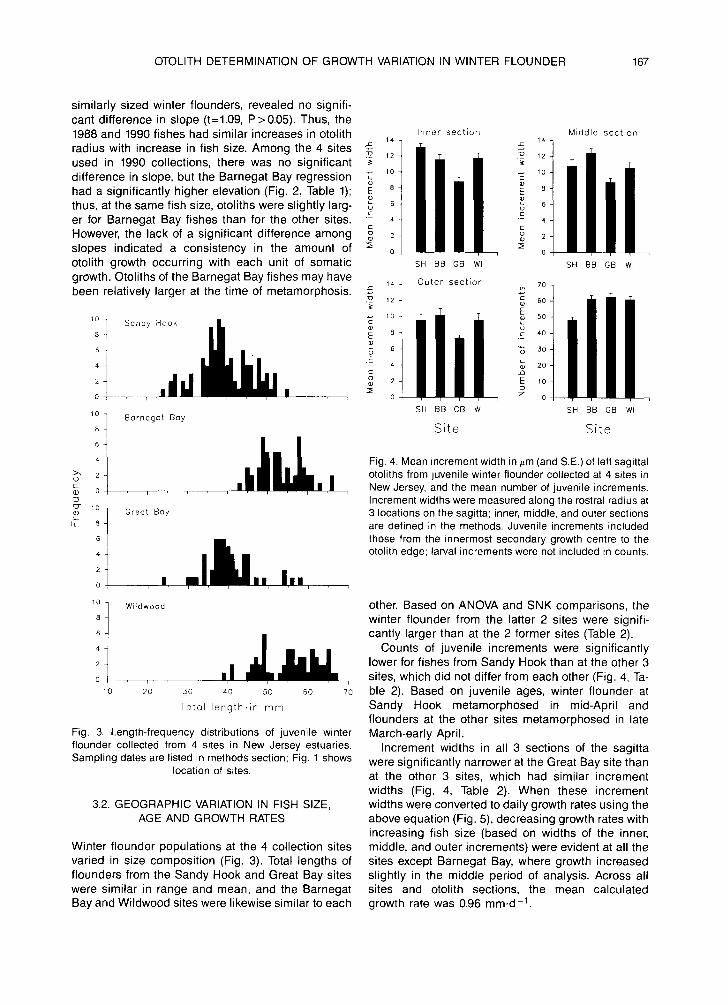
4 Fig. 4. Mean increment width in ~m (and S.E.) of left sagittal o >, 2 otoliths from juvenile winter flounder collected at 4 sites in
o New Jersey, and the mean number of juvenile increments.
O- 1~ t Great Bay ~2
4
1068 t Wildwood
2L_ o ~0 2o 50 4o 5o 60 7o
TotQI length.in mm
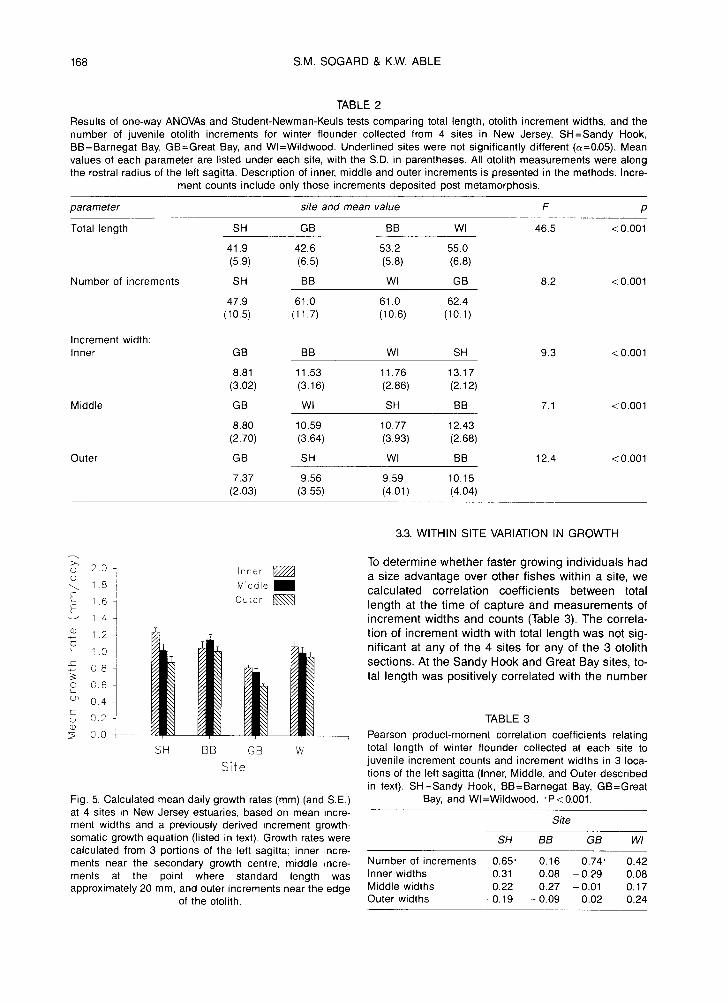
Fig. 3. Length-frequency distributions of juvenile winter flounder collected from 4 sites in New Jersey estuaries. Sampling dates are listed in methods section; Fig. 1 shows
location of sites.
3.2. GEOGRAPHIC VARIATION IN FISH SIZE, AGE AND GROWTH RATES
Winter f lounder populations at the 4 collection sites varied in size composition (Fig. 3). Total lengths of f lounders from the Sandy Hook and Great Bay sites were similar in range and mean, and the Barnegat Bay and Wildwood sites were likewise similar to each
Increment widths were measured along the rostral radius at 3 locations on the sagitta; inner, middle, and outer sections are defined in the methods. Juvenile increments included those from the innermost secondary growth centre to the otolith edge; larval increments were not included in counts.
other. Based on ANOVA and SNK comparisons, the winter f lounder from the latter 2 sites were signifi- cantly larger than at the 2 former sites (Table 2).
Counts of juvenile increments were signif icantly lower for fishes from Sandy Hook than at the other 3 sites, which did not differ from each other (Fig. 4, Ta- ble 2). Based on juvenile ages, winter f lounder at Sandy Hook metamorphosed in mid-April and flounders at the other sites metamorphosed in late March-early April.
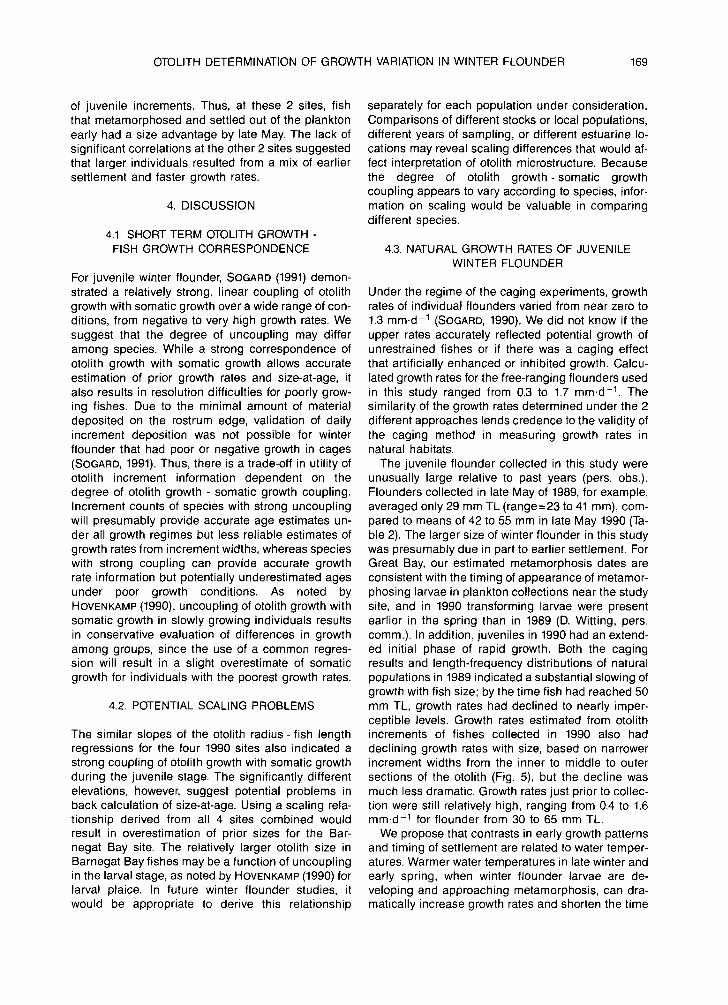
Increment widths in all 3 sections of the sagitta were signif icantly narrower at the Great Bay site than at the other 3 sites, which had similar increment widths (Fig. 4, Table 2). When these increment widths were converted to daily growth rates using the above equation (Fig. 5), decreasing growth rates with increasing fish size (based on widths of the inner, middle, and outer increments) were evident at all the sites except Barnegat Bay, where growth increased slightly in the middle period of analysis. Across all sites and otolith sections, the mean calculated growth rate was 0.96 mm.d-1.
168 S.M. SOGARD & K.W. ABLE
TABLE 2
Results of one-way ANOVAs and Student-Newman-Keuls tests comparing total length, otolith increment widths, and the number of juvenile otolith increments for winter flounder collected from 4 sites in New Jersey. SH=Sandy Hook, BB=Barnegat Bay, GB=Great Bay, and Wl=Wildwood. Underlined sites were not significantly different (o~=0.05). Mean values of each parameter are listed under each site, with the S.D. in parentheses. All otolith measurements were along the rostral radius of the left sagitta. Description of inner, middle and outer increments is presented in the methods. Incre-
ment counts include only those increments deposited post metamorphosis.
parameter site and mean value F p
Total length SH GB BB Wl 46.5 < 0.001
41.9 42.6 53.2 55.0 (5.9) (6.5) (5.8) (6.8)
Number of increments SH BB WI GB 8.2 <0.001
47.9 61.0 61.0 62.4 (10.5) (11.7) (10.6) (10.1)
Increment width: Inner
Middle
Outer
GB BB WI SH 9.3 <0.001
8.81 11.53 11.76 13.17 (3.02) (3.16) (2.86) (2.12)
GB WI SH BB 7.1 <0.001
8.80 10.59 10.77 12.43 (2.70) (3.64) (3.93) (2.68)
GB SH Wl BB 12.4 < 0.001
7.37 9.56 9.59 10.15 (2.03) (3.55) (4.01) (4.04)
c~ 2 . 0 -
1.84 16 I
- ~ 1.4 4
~ 1 2 i ~ 1.0
X Z ' ~ 0.8 o 0.6 c~ 0.4
cs 0.2 © ~; 0.0
inner I ~ Middle m Outer
SH BB CB Wl
Site
Fig. 5. Calculated mean daily growth rates (mm) (and S.E.) at 4 sites in New Jersey estuaries, based on mean incre- ment widths and a previously derived increment growth- somatic growth equation (listed in text). Growth rates were calculated from 3 portions of the left sagitta; inner incre- ments near the secondary growth centre, middle incre- ments at the point where standard length was approximately 20 mm, and outer increments near the edge
of the otolith.
3.3. WITHIN SITE VARIATION IN GROWTH
To determine whether faster growing individuals had a size advantage over other fishes within a site, we calculated correlation coefficients between total length at the t ime of capture and measurements of increment widths and counts (Table 3). The correla- tion of increment width with total length was not sig- nificant at any of the 4 sites for any of the 3 otolith sections. At the Sandy Hook and Great Bay sites, to- tal length was positively correlated with the number
TABLE 3 Pearson product-moment correlation coefficients relating total length of winter flounder collected at each site to juvenile increment counts and increment widths in 3 loca- tions of the left sagitta (Inner, Middle, and Outer described in text). SH=Sandy Hook, BB=Barnegat Bay, GB=Great
Bay, and Wl =Wildwood. * P < 0.001.
Site
SH BB GB WI
Number of increments 0.65' 0.16 0.74* 0.42 Inner widths 0.31 0.08 -0.29 0.08 Middle widths 0.22 0.27 -0.01 0.17 Outer widths -0.19 -0.09 -0.02 0.24
OTOLITH DETERMINATION OF GROWTH VARIATION IN WINTER FLOUNDER 169
of juvenile increments. Thus, at these 2 sites, fish that metamorphosed and settled out of the plankton early had a size advantage by late May. The lack of significant correlations at the other 2 sites suggested that larger individuals resulted from a mix of earlier settlement and faster growth rates.
4. DISCUSSION
4.1. SHORT TERM OTOLITH GROWTH - FISH GROWTH CORRESPONDENCE
For juvenile winter flounder, SOGARD (1991) demon- strated a relatively strong, linear coupling of otolith growth with somatic growth over a wide range of con- ditions, from negative to very high growth rates. We suggest that the degree of uncoupling may differ among species. While a strong correspondence of otolith growth with somatic growth allows accurate estimation of prior growth rates and size-at-age, it also results in resolution difficulties for poorly grow- ing fishes. Due to the minimal amount of material deposited on the rostrum edge, validation of daily increment deposition was not possible for winter flounder that had poor or negative growth in cages (SOGARD, 1991). Thus, there is a trade-off in utility of otolith increment information dependent on the degree of otolith growth - somatic growth coupling. Increment counts of species with strong uncoupling will presumably provide accurate age estimates un- der all growth regimes but less reliable estimates of growth rates from increment widths, whereas species with strong coupling can provide accurate growth rate information but potentially underestimated ages under poor growth conditions. As noted by HOVENKAMP (1990), uncoupling of otolith growth with somatic growth in slowly growing individuals results in conservative evaluation of differences in growth among groups, since the use of a common regres- sion will result in a slight overestimate of somatic growth for individuals with the poorest growth rates.
4.2. POTENTIAL SCALING PROBLEMS
The similar slopes of the otolith radius- fish length regressions for the four 1990 sites also indicated a strong coupling of otolith growth with somatic growth during the juvenile stage. The significantly different elevations, however, suggest potential problems in back calculation of size-at-age. Using a scaling rela- tionship derived from all 4 sites combined would result in overestimation of prior sizes for the Bar- negat Bay site. The relatively larger otolith size in Barnegat Bay fishes may be a function of uncoupling in the larval stage, as noted by HOVENKAMP (1990) for larval plaice. In future winter flounder studies, it would be appropriate to derive this relationship
separately for each population under consideration. Comparisons of different stocks or local populations, different years of sampling, or different estuarine lo- cations may reveal scaling differences that would af- fect interpretation of otolith microstructure. Because the degree of otolith growth-somatic growth coupling appears to vary according to species, infor- mation on scaling would be valuable in comparing different species.
4.3. NATURAL GROWTH RATES OF JUVENILE WINTER FLOUNDER
Under the regime of the caging experiments, growth rates of individual flounders varied from near zero to 1.3 mm.d-1 (SOGARD, 1990). We did not know if the upper rates accurately reflected potential growth of unrestrained fishes or if there was a caging effect that artificially enhanced or inhibited growth. Calcu- lated growth rates for the free-ranging flounders used in this study ranged from 0.3 to 1.7 mm.d -1. The similarity of the growth rates determined under the 2 different approaches lends credence to the validity of the caging method in measuring growth rates in natural habitats.
The juvenile flounder collected in this study were unusually large relative to past years (pers. obs.). Flounders collected in late May of 1989, for example, averaged only 29 mm TL (range=23 to 41 mm), com- pared to means of 42 to 55 mm in late May 1990 (Ta- ble 2). The larger size of winter flounder in this study was presumably due in part to earlier settlement. For Great Bay, our estimated metamorphosis dates are consistent with the timing of appearance of metamor- phosing larvae in plankton collections near the study site, and in 1990 transforming larvae were present earlier in the spring than in 1989 (D. Witting, pers. comm.). In addition, juveniles in 1990 had an extend- ed initial phase of rapid growth. Both the caging results and length-frequency distributions of natural populations in 1989 indicated a substantial slowing of growth with fish size; by the time fish had reached 50 mm TL, growth rates had declined to nearly imper- ceptible levels. Growth rates estimated from otolith increments of fishes collected in 1990 also had declining growth rates with size, based on narrower increment widths from the inner to middle to outer sections of the otolith (Fig. 5), but the decline was much less dramatic. Growth rates just prior to collec- tion were still relatively high, ranging from 0.4 to 1.6 mm-d-1 for flounder from 30 to 65 mm TL.
We propose that contrasts in early growth patterns and timing of settlement are related to water temper- atures. Warmer water temperatures in late winter and early spring, when winter flounder larvae are de- veloping and approaching metamorphosis, can dra- matically increase growth rates and shorten the time
170 S.M. SOGARD & K.W. ABLE
to metamorphosis. In laboratory experiments, LAUR- ENCE (1975) found that a 3 ° increase in water temper- ature (from 5 to 8°C) decreased time to metamorphosis by 31 days. February water tempera- tures measured on a daily basis in Great Bay were significantly warmer in 1990 than in the 3 preceding years, with a mean of 6.0°C, compared to 1.2°C in 1987, 3.1°C in 1988, and 4.0°C in 1989 (unpublished data, SNK comparisons, p<0.01). Although not sig- nificant, March water temperatures were also higher than in the 3 preceding years, with means of 5.8°C in 1987, 6.7°C in 1988, 5.8°C in 1989, and 7.6°C in 1990. April and May temperatures in 1990 were more simi- lar to preceding years.
Warm temperatures are beneficial to growth but only up to some optimum level. In juvenile plaice, for example, there is a direct relationship of absolute growth with water temperature up to about 20°C (ZIJLSTRA etal., 1982; VAN DER VEER, 1986). At higher temperatures, however, the young plaice display ob- vious stress responses and stop foraging activity (BERGHAHN & KARAKIRI, 1990). PEARCY (1962) noted that juvenile winter flounder tend to avoid high water temperatures. In New Jersey, winter flounder are near the southern limit of their range, and typical summer water temperatures (consistently >20°C from June through August in shallow habitats; SOGARD, 1990) may be too high for optimal growth. Flounders settling earlier in the spring would be able to maintain rapid growth rates for a longer period of time before water temperatures increased to detrimental levels. We suggest that the large size of juvenile winter flounder at the end of May in 1990 was a result of the combined effects of early settlement and extended rapid growth prior to summer water temperature conditions. Presumably, a warm spring followed by a moderate summer would provide the best temperature regime for juvenile winter flounder.
Our assumptions regarding the importance of tem- perature effects on growth rate need to be document- ed experimentally. The consequences of a delay in metamorphosis and settlement were, however, clear- ly evident in the Sandy Hook fishes, which in late May were significantly smaller than Barnegat Bay and Wildwood fishes despite similar growth rates.
Another potential factor resulting in the relatively large size of winter flounder in 1990 is food availabili- ty. KARAKIRI et al. (1989) noted striking differences in the mean size of juvenile plaice (Pleuronectes plates- sa) collected at the same time in different years and in the same year at different sites in a temperate es- tuarine area, the Wadden Sea. Otolith analysis rev- ealed similar times of settlement but large differences in growth rates, reflected in varying incre- ment widths. KARAKIRI et al. (1989) attributed these contrasts in growth rates to differences in food availa- bility. We did not have an index of prey densities at
the 4 sites used in this study, but it is possible that foraging conditions in 1990 were superior to other years.
4.4. CONTRASTS IN GROWTH AMONG ESTUARIES
We believe the seine collections were representative samples of the population of recently settled juveniles at each site. Capture efficiencies by a 6-mm mesh seine were not likely to vary greatly across the size range of winter flounder present at the end of May. Because sediment characteristics were similar at the 4 sites, the operation of the seine should have been comparable. Tidal migrations and size stratifi- cation by depth have not been reported for early juvenile winter flounder, although young-of-the-year (YOY) may move into deeper water later in the sum- mer. A three-year monthly trawling programme (otter trawl with 6-mm mesh cod end) in deeper waters of the Little Egg Harbor and Great Bay estuaries cap- tured only adult winter flounder until mid-June, with high catches of YOY in July and August (unpubl. data).
The geographic comparison revealed significant contrasts in size distribution of winter flounder in different estuaries, and demonstrated different rea- sons for those contrasts. Sandy Hook fishes were smaller because they had settled out of the plankton later, while Great Bay fishes were smaller because they had slower growth rates. Because juvenile winter flounder probably have a limited home range (SAUCERMAN, 1990), the derived juvenile ages and growth rates should reflect conditions in the immedi- ate vicinity of the collection site, with a high probabili- ty that fishes had remained in the area after settlement. Under this assumption, growth rates were relatively consistent among individuals within a site (Fig. 5); the coefficient of variation for daily growth rate within a site and otolith section ranged from 19 to 36%. Correlation analysis (Table 3) also in- dicated that within-site variability in growth rates was not substantial enough to effect the observed range in total lengths at collection. Variability in juvenile age (and thus time of settlement) was more influential. Thus, the estuary in which a flounder occurred had a greater effect on growth rate than individual differ- ences in growth capacity.
We were not able to determine the underlying rea- sons for different settlement dates and different growth rates in the 4 estuaries used in this study. Potentially important factors include temperature re- gimes, resource quality, differential predation, and genetic differences of local populations. Relative contrasts in growth among the 4 sites were consis- tent for all 3 sections of the otoliths, suggesting that relative differences in the influential parameters were maintained at least up to the point of fish collection.
OTOLITH DETERMINATION OF GROWTH VARIATION IN WINTER FLOUNDER 171
Growth rate variability between years and between geographic locations has been documented previ- ously for both adult (HOWE & COATES, 1975) and juvenile winter f lounder (PEARCY, 1962; NORTHEAST UTILITIES SERVICE COMPANY, 1988). For example, faster growth rates in the Niantic River, Connecticut during the early post-settlement phase resulted in fishes that were twice the size of winter f lounder in adjacent Niantic Bay (NORTHEAST UTILITIES SERVICE COMPANY, 1988). If size is as important to an individu- al winter f lounder as recent theoretical considera- tions suggest (HOUDE, 1987), this high plasticity in growth underscores the significance of variability in the environmental conditions encountered by fishes settling out of the plankton.
5. REFERENCES
ALHOSSAINI, M. & T.J. PITCHER, 1988. The relation between daily rings, body growth and environmental factors in plaice, Pleuronectes platessa L., juvenile otoliths.--J. Fish Biol. 33: 409-418.
BERGHAHN, R. & M. KARAKIRI, 1990. Experimental induction of biological tags in otoliths of 0-group plaice Pleuronectes platessa by starvation, temperature, and UV-B radiation.--Mar. Ecol. Prog. Ser. 67: 227-233.
BRADFORD, M.J. & G.H. GEEN, 1987. Size and growth of juvenile chinook salmon back-calculated from otolith growth increments. In: R.C. SUMMERFELT. Age and growth of fish. Iowa State University Press, Ames, Iowa: 453-462.
CAMPANA, S.E., J.A. GAGNE & J. MUNRO, 1987. Otolith microstructure of larval herring (Clupea harengus): image or reality?--Can. J. Fish. Aquat. Sci. 44: 1922-1929.
DANILA, D.J. & M.J. KENNISH, 1981. Tagging study of winter flounder (Pseudopleuronectes americanus) in Bar- negat Bay, New Jersey. In: Proceedings of Oceans 82 Conference, Boston: 759-764.
HOUDE, E.D., 1987. Fish early life dynamics and recruitment variability.--Am Fish. Soc. Syrup. 2: 17-29.
HOVENKAMP, F., 1990. Growth differences in larval plaice Pleuronectes platessa in the Southern Bight of the North Sea as indicated by otolith increments and RNA/DNA ratios.--Mar. Ecol. Prog. Ser. 58: 205-215.
HOWE, A.B. & RG. COATES, 1975. Winter flounder move- ments, growth and mortality off Massachusetts.- Trans. Am. Fish. Soc. 104: 13-29.
KARAKIRI, M., R. BERGHAHN & H. VON WESTERNHAGEN, 1989. Growth differences in 0-group plaice Pleuronectes platessa as revealed by otolith micros- tructure analysis.--Mar. Ecol. Prog. Ser. 55: 15-22.
LAURENCE, G.C., 1975. Laboratory growth and metabolism of the winter flounder Pseudopleuronectes america- nus from hatching through metamorphosis at three temperatures.--Mar. Biol. 32: 223-229.
MOSEGAARD, H., H. SVEDANG & K, TABERMAN, 1988. Un- coupling between somatic and otolith growth in arctic char (Salvelinus alpinus) as an effect of differences in temperature response.--Can. J. Fish. Aquat. Sci. 45: 1514-1524.
NEILSON, J.D. & G.H. GEEN, 1985. Effects of feeding re- gimes and diel temperature cycles on otolith incre- ment formation in juvenile chinook salmon (Oncorhynchus tshawytscha).--Fish. Bull. 83: 91-101.
NORTHEAST UTILITIES SERVICE COMPANY, 1988. Winter flounder studies. In: Monitoring the marine environ- ment of Long Island Sound at Millstone Nuclear Power Station. Annual report, 1988: 239-316.
PARKER, R.R., 1971. Size selective predation among juvenile salmonid fishes in a British Columbia inlet.-- J. Fish. Res. Bd Can. 28: 1503-1510.
PEARCY, W.G., 1962. Ecology of an estuarine population of winter flounder, Pseudopleuronectes americanus (Walbaum). Parts I-IV.--Bull. Bingham. Oceanogr. Coll. 18: 1-78.
PERLMUTTER, A., 1947. The blackback flounder and its fish- ery in New England and New York.--Bull. Bingham Oceanogr. Coll. 11: 1-92.
POST, J.R. & D.C. EVANS, 1989a. Experimental evidence of size-dependent predation mortality in juvenile yellow perch.--Can. J. Zool. 67: 521-523.
----, 1989b. Size-dependent overwinter mortality of young- of-the-year yellow perch (Perca flavescens): laborato- ry, in situ enclosure, and field experiments.--Can. J. Fish. Aquat. Sci. 46: 1958-1968.
REZNICK, D., E. LINDBECK & H. BRYGA, 1989. Slower growth results in larger otoliths - an experimental test with guppies (Poec;iia reticulata).--Can. J. Fish. Aquat. Sci. 46: 108-112.
SAILA, S.B., 1961. A study of winter flounder movements.-- Limnol. Oceanogr. 6" 292-298.
SAUCERMAN, S., 1990. Movement, distribution and produc- tivity of post metamorphic winter flounder (Pseu- dopleuronectes americanus) in different habitats in Waquoit Bay, Massachusetts. M.S. thesis, University of Massachusetts. 1-83.
SECOR, D.H. & J.M. DEAN, 1989. Somatic growth effects on the otolith - fish size relationship in young pond-reared striped bass, Morone saxatilis.--Can. J. Fish. Aquat. Sci. 46: 113-121.
SECOR, D.H., J.M. DEAN & E.H. LABAN, 1991. Manual for otolith removal and preparation for microstructural ex- amination.--Belle Baruch Inst. Techn. Rep. BIl191-1: 1-85.
SOGARD, S.M., 1990. Parameters of habitat quality for epibenthic fishes and decapod crustaceans in New Jersey estuaries. Ph.D. dissertation, Rutgers Universi- ty, New Brunswick, New Jersey: 1-195.
,1991. Interpretation of otolith microstructure in juvenile winter flounder (Pseudopleuronectes americanus): ontogenetic development, daily increment validation, and somatic growth relationships.--Can. J. Fish. Aquat. Sci. 48: 1862-1871.
VEER, H.W. VAN DER, 1986. Immigration, settlement, and density-dependent mortality of a larval and early post- larval 0-group plaice (Pleuronectes platessa) popula- tion in the western Wadden Sea.-- Mar. Ecol. Prog. Ser. 29: 223-236.
VOLK, E.C., R.C. WISSIMAR, C.A. SIMENSTAD & DM. EGGERS, 1984. Relationship between otolith microstructure and the growth rate of juvenile chum salmon (Oncorhyn- chus keta) under different prey rations.--Can. J. Fish. Aquat. Sci. 41: 126-133.

172 S.M. SOGARD & K.W. ABLE
WILSON, K.H. & F~A. LARKIN, 1982. Relationship between thickness of daily growth increments in sagittae and change in body weight of sockeye salmon (Oncorhyn- chus nerka) fry.--Can. J. Fish. Aquat. Sci. 39: 1335-1339.
ZIJLSTRA, J.J., R. DAPPER & J.J. WITTE, 1982. Settlement, growth and mortality of post-larval plaice (Pleuronectes platessa) in the western Wadden Sea.--Neth. J. Sea Res. 15: 250-272.