Embed Size (px)
Citation preview

IOC Manuals and Guides No. 22, 1st rev. ed.
Page 1
GTSPP Real-Time Quality Control Manual
Revised Edition, 2010
UNESCO
Manuals and Guides 22

(Version 1.0)
Manuals and Guides 22
GTSPP Real-Time Quality Control Manual
Revised Edition, 2010
UNESCO 2010

IOC Manuals and Guides No. 22, Revised version 1.0
Ostend, 3 December 2010
English only
The designations employed and the presentations of the
material in this publication do not imply the expression of
any opinion whatsoever on the part of the Secretariats of
UNESCO and IOC concerning legal status of any country
or territory, or its authorities, or concerning the delimita-
tions of the frontiers of any country or territory.
For bibliographic purposes this document should be cited as follows:
GTSPP Real-Time Quality Control Manual, First Revised Edition.
UNESCO-IOC 2010. (IOC Manuals and Guides No. 22, Revised Edition.)
(IOC/2010/MG/22Rev.)
English only
Note: The initial version of the manual was published in 1990 (SC-90/WS-74)
Published in 2010
by the United Nations Educational, Scientific and Cultural Organization
7, Place de Fontenoy, 75352, Paris 07 SP
UNESCO 2010
Printed in France


IOC Manuals and Guides, 22 Rev.
Page (i)
TABLE OF CONTENTS
page
1. INTRODUCTION............................................................................................................. 1
2. QUALITY FLAGGING ................................................................................................... 2
3. INSTRUMENTATION KNOWLEDGE ........................................................................ 3
4. TEST MONITORING ...................................................................................................... 3
5. PRE AND POST PROCESSING .................................................................................... 4
6. QUALITY CONTROL TESTS ....................................................................................... 4
7. IMPLEMENTATION DETAILS .................................................................................... 6
8. ACKNOWLEDGEMENTS ............................................................................................. 6
9. BIBLIOGRAPHY ............................................................................................................. 6
ANNEX A: DUPLICATES MANAGEMENT SYSTEM
ANNEX B: QUALITY CONTROL TESTS
ANNEX C: IMPLEMENTATION DETAILS
ANNEX D: QUALITY CONTROL VERSION HISTORY


Version 1.0 IOC Manuals and Guides, 22 Rev.
1. INTRODUCTION
This Manual has been produced within the context of the Global Temperature-Salinity Profile
Programme (GTSPP). Because the work of assuring the quality of data handled by the
Programme is shared amongst data centres, it is important to have both consistent and well
documented procedures. This Manual describes the means by which data quality is assessed
and the actions taken as a result of the procedures.
The GTSPP handles all temperature and salinity profile data. This includes observations
collected using water samplers, continuous profiling instruments such as CTDs, thermistor
chain data and observations acquired using thermosalinographs. These data will reach data
processing centres of the Programme through the real-time channels of the Global
Telecommunication System (GTS) of the World Meteorological Organization (WMO) or in
delayed mode through the IODE system.
The procedures described here are intended to cover only the above-mentioned data types and
specifically for data sent through the GTS. However, there are obvious generalizations that
can be made to other data types. Because of this, it is expected that this Manual will serve as
a base on which to build more extensive procedures for the aforementioned data types and to
broaden to other types, as well. Indeed, in some cases, tests of data types that are not strictly
part of this Programme are incorporated into this Manual simply because they are of obvious
use and because these data types are often associated with the data of interest to the GTSPP.
Updates to this Manual are carried out as new procedures are recommended to the GTSPP
and as these are accepted by the Programme Steering Group. Readers are encouraged to make
suggestions on both how to improve existing tests, and of new tests that should be
considered. In both cases, it is important to explain how the suggestion improves or expands
upon the existing suite of tests. Suggestions may be forwarded to any participants of the
GTSPP and these will be directed to the Steering Group. As tests are suggested but before
incorporation, they will be documented in a section of the Manual. This will provide a means
to accumulate suggestions, to disseminate them and solicit comments.
This Manual describes procedures that make extensive use of flags to indicate data quality.
To make full use of this effort, participants of the GTSPP have agreed that data access based
on quality flags will be available. That is, GTSPP participants will permit the selection of
data from their archives based on quality flags as well as other criteria. These flags are
always included with any data transfers that take place. Because the flags are always
included, and because of the policy regarding changes to data, as described later, a user can
expect the participants to disseminate data at any stage of processing. Furthermore, GTSPP
participants have agreed to retain copies of the data as originally received and to make these
available to the user if requested.
The implementation of the tests in this Manual requires interactive software to be written.
The operator is consulted in the setting of flags or possibly in changing data values. In each
case, information is provided to the operator to help them decide what action to take. In the
descriptions of the tests, certain specific items of information and data displays are included.
So, for example, when a station position fails a test of platform speed, a track chart of the
platform is used. The amount of information displayed and the presentation technique is
dependent upon the hardware and software capabilities at the implementation site. For this

IOC Manuals and Guides, 22 Rev.
Page 2
reason, the information to be displayed, and the method of presentation should be treated as
recommendations.
2. QUALITY FLAGGING
The purpose of this Manual is to set standards for quality control of real-time data and to
describe exactly the screening process that is employed. By reading this document, users may
assess the applicability of the procedures to their requirements and thereby judge whether
they need do further work before using the data.
Attached to every profile is a number indicating the version of the Quality Control Manual
which describes the tests employed. As the procedures documented by this Manual are
expanded to include others or to refine the older tests, a new version flag will be assigned. It
is recognized that the suite of tests performed will undergo modifications with time. For this
reason it is necessary to record which version of quality control procedures have been applied
to the data. This version number is associated with updates to this Manual. The version
applied is to be assigned to each profile as it is processed and to be carried thereafter with the
data. This document constitutes version 1.13.
Also attached to every profile is a number that indicates which tests have been employed.
This number is constructed as follows. Each test of the Quality Control Manual is assigned an
index number to base 2. The number that describes the suite of tests employed against a
profile is the sum of the index numbers of the tests used. The index number is given with
every test documented in this Manual. This number is then written in base 16. So the digits 0
through 9 represent numbers from 0 through 9, A=10 through to F=15. As an example, if
there are 10 tests, and all are employed, the Test Number is then 3FF.
If a participating Data Centre applies tests other than those described in this Manual, it should
supply documentation with the data to explain the other tests. The use of other tests is
indicated by a version number for the Manual that has a digit in the hundredths place. So, for
example, a Version of 1.02 indicates that a Data Centre has used the tests described in
version 1.0 of the QC Manual but have also applied other tests (indicated by the digit 2) of
their own. Each Data Centre may assign this last digit in a fashion suitable to their own
operations.
The second type of flag is used to indicate the quality of the data. It is considered
unproductive to attach a flag describing the result of each test performed to every observation
since this may result in numerous flags that generally would not be used. Instead, it is
deemed necessary to be able to assign flags to individual or groups of data values to indicate
the confidence in the value. Participants of the GTSPP have agreed that the following rules
shall apply:
1. Both independent and dependent variables can have a flag assignment.
2. Data aggregations (in the case here these are entire profiles) can also be assigned a
flag. So the word element used later implies aggregations as well.
3. The flags indicating data quality are:

IOC Manuals and Guides, 22 Rev.
Page 3
0 = No quality control has been assigned to this element
1 = The element appears to be correct
2 = The element appears to be probably good
3 = The element appears doubtful
4 = The element appears erroneous
5 = The element has been changed
6 to 8 = Reserved for future use
9 = The element is missing
The philosophy for flag assignment adopted by this Manual is that it is generally inadvisable
to change data. Changes should only be made when it is clear what the change should be and
that if a change were not made the data would be unusable. It is expected that subsequent
versions of the Manual will improve on this.
The test descriptions allow for inferring values for those that have failed the test procedures.
The inference of a correct value is done at the discretion of the person doing the quality
control. It should be based on information which is not available to the test procedure but
which the operator has at hand and assists in knowing what the correct value should be.
Values should be changed only when there is certainty what is the correct value. In the
instance where data values are changed, the original value is also preserved and is available
to users or to other tests if needed.
Finally, because quality assessment is shared over processing centres, it is possible that data
flagged as doubtful by one centre will be considered acceptable by another or vice versa.
Flags can be changed by any processing centre as long as a record is kept of what the changes
are.
The use of the flagging scheme described here will meet the stated requirements of the
GTSPP. It is recognized that as new testing procedures are developed, it will be necessary to
re-examine data. With version flags preserved with the data, it will be possible to identify
what has been done and therefore how best to approach the task of passing data through
newer quality control procedures.
3. INSTRUMENTATION KNOWLEDGE
It is recognized that knowledge of the instrumentation used to make an observation can be
useful in the assessment of the quality of the data. Likewise, knowledge of the platform from
which the data were collected can also be used. Where available, this instrumentation
knowledge should be sent with the data to the GTSPP participants. The present version of
this Manual suggests tests that make use of instrumentation knowledge if available. It is
expected that subsequent versions of the Manual will improve on this.
4. TEST MONITORING
All processing centres should monitor the performance of their quality control tests. In this
way, deficiencies can be identified and recommendations made to improve procedures. These
recommendations should be sent to the Steering Group designated to maintain this Manual.
They will be discussed and included as appropriate in subsequent versions of the Manual.

IOC Manuals and Guides, 22 Rev.
Page 4
5. PRE- AND POST-PROCESSING
The quality control tests described in the appendix assume a basic scrutiny has been applied
to the data. Explicitly, the data have passed a format checking procedure which ensures that
alphanumeric occurs where expected and no illegal characters are present. It does not assume
that values of variables have been checked to see if they are physically possible.
None of the tests described here automatically assigns a quality flag without the approval of
the person doing the quality assessment. When a value or element fails a test, a
recommendation of the flag to be assigned is made. The person doing the quality assessment
then must decide the appropriate flag to use from a list of recommendations. The tests do
restrict the flags that may be assigned in that a user is not permitted to assign any flag to a
value or element failing a test.
There is a need to find and remove data duplications. A check for duplicate reports is
necessary to eliminate statistical biases which would arise in products incorporating the same
data more than once. In searching, the distinction between exact and inexact duplicates
should be kept in mind. An exact duplicate is a report in which all the physical variable
groups (including space-time coordinates) are identical to those of a previous report of the
same type from the same platform. An inexact duplicate will have at least one difference.
Annex A contains the algorithm proposed by the Marine Environmental Data Service for the
identification of duplicates. It discusses the implementation of the technique for data received
in both real-time and delayed mode. In the context of this Manual, only the discussions of the
handling of real-time data are relevant. The algorithm is based on near coincidences of
position, and time. This means that tests 1.1 to 1.4 and test 2.1 of this Manual must be applied
before duplications are sought. The basic criterion for a possible duplication is based on the
experience of the TOGA Subsurface Data Centre. So, if stations are collected within 15
minutes or 5 km of each other, they may be duplicates. The identification of the stations of
potential duplicates are then examined as well as the data to resolve whether or not a
duplication exists. Then, other tests of the quality control are run on the output of the
duplicates test. In this way, as little as possible is done before duplications are tested for.
There will also be a need for scientific assessment of the data quality. This would involve
subjecting the data to a different set of tests by applying knowledge of the characteristics of
the processes from which observations have been collected. It may also be that more data
may be gathered together so that more sophisticated statistical tests can be applied. As such
tests become generally accepted and an established application procedure developed, they
could be incorporated into the context of this Manual and become part of the regular
screening process conducted by participants of this Programme.
6. QUALITY CONTROL TESTS
The complete set of tests is included in Annex B. Each description has a number of sections
that are always present. A description of the information that each contains follows:
Test Name: This is the short name of the test. Each test is numbered for ease of reference.

IOC Manuals and Guides, 22 Rev.
Page 5
Prerequisites: This describes what tests are assumed to have applied before and what
preparation of the data set is suggested before application of the test. If will also describe
what information files are required.
Description: This section describes how the test is implemented and what actions are taken
based on the results of the test.
History: This records any changes that have taken place in the test procedure and the date on
which they were recorded. This section will record the evolution of a test procedure through
the various versions of the Manual.
Rules: This section lists the rules that are applied to affect the various tests. Their numbering
is for reference value only since they have been written so that they may be implemented in
any order.
The tests have been grouped according to stages. The first stage is concerned with
determining that the position, the time, and the identification of a profile are sensible. The
second stage is concerned with resolving impossible values for variables. The next stage
examines the consistency of the incoming data with respect to references such as
climatologies. The next section looks at the internal consistency within the data set.
The grouping of the tests suggests a logical order of implementation in that the simpler, more
basic tests occur before more complicated ones. The order of presentation of tests within a
stage does not imply an order in implementation. In fact, should a value be changed as a
result of a test, the new value should be retested by all of the tests within the stage. Indeed,
since data values can be changed, the implementation of these tests cannot take place in a
strictly sequential fashion.
The tests detailed by this Manual cannot be mutually exclusive in examining the various
properties and characteristics of the data. As much as possible, each test should focus on a
particular property to test if the data value or profile conforms to expectations. Modifications
to old tests will be incorporated as they refine the focus of the test. New tests will be added to
examine properties of data that are not adequately covered by this version.
Each of the tests has been written from the point of view that the data being examined have
not been before. The difference this makes is that quality flag assignments do not check if the
flag has already been set to something other than 0 (meaning no quality control has been
performed). If this is not the case, the rules as written will need modifications to check if the
flag has previously been set. If this is the case, and a flag indicates the value was changed, the
user should be informed of the original value of the data before another change is performed.
Then, if the flag is reset, the changed value should be preserved in the history of the station if
the flag is set to be anything else. In other cases, where a flag is changed but the observation
is untouched, it is not necessary to record the old flag, but simply to record that data have
passed through a second organization and the quality tests done there.
The tests described in stage 5 represent a visual inspection of the data as received and usually
after all other tests have been completed. This stage is necessary to ensure that no
questionable data values pass through the suite of tests employed without being detected. The
testing and flagging procedure of this stage relies upon the experience and knowledge of the
person conducting the test. As experience is gained with the tests contained within this

IOC Manuals and Guides, 22 Rev.
Page 6
Manual, the processes used in the visual inspection of stage 5 will be converted to objective
tests included in other sections of the Manual. However, there will always be a need to
conduct this visual inspection as the final judgment of the validity of the data.
7. IMPLEMENTATION DETAILS
Annex C contains some details of how certain of the tests are implemented in particular
cases. The purpose of their inclusion is to provide further details that may assist others in
understanding the details of a test procedure.
8. ACKNOWLEDGEMENTS
Contributions to the contents of the first edition of the manual were made by J.R. Keeley, S.
Levitus, D. McLain, N. Mikhailov, C. Noe, J. P. Rebert, B. Searle, and W. White. Others
have assisted in suggestions of how to improve tests and clarify the text. . C. Sun finalized
the first revision of the manual. Information describing test procedures carried out by various
organizations are noted in the Bibliography section. This Manual reflects the knowledge
described by the references.
9. BIBLIOGRAPHY
1. Guidelines for evaluating and screening bathythermograph data, ICES Working Group
on Marine Data Management, September, 1986.
2. Note sur les contrôles effectués à Paris sur les données BATHY et TESAC par le centre
SMISO, P. LeLay, Member of IGOSS OTA, 5 July 1988.
3. Guide to Data Collection and Location Services Using Service Argos, Marine
Meteorology and Related Oceanographic Activities Report 10, WMO/TD-No.262, 1988,
Revised edition, 104 pp.
4. Guide to Drifting Buoys, IOC/WMO Manuals and Guides, 20, 1988, 69 pp.
5. Ocean Temperature Fields, Northern Hemisphere Grid, 1985–1988, Office of Ocean
Services, National Ocean Service, NOAA, June 1988.
6. Ocean Temperature Fields, Southern Hemisphere Grid, 1985–1988, Office of Ocean
Services, National Ocean Service, NOAA, July 1989.
7. Guide to Operational Procedures for the Collection and Exchange of IGOSS Data,
IOC/WMO Manuals and Guides 3, Revised June, 1989, 68 pp.
8. Personal Communication, N. Mikhailov, 19 September 1989.
9. Quality Improvement Profile System (QUIPS), Functional Description, R. Bauer,
Compass Systems, 1987.
10. Seasonal Anomalies of Temperature and Salinity in the Northwest Atlantic in 1983,
Canadian Technical Report of Hydrography and Ocean Sciences,74, March 1988.
11. Reineger and Ross Interpolation Method, in Oceans IV: A Processing, Archiving and
Retrieval System for Oceanographic Station Data, Marine Environmental Data Service
Manuscript Report Series, 15, 1970, pp 40-41.
12. Marine Data Platforms - An Interactive Inventory, G. Soneira, W. Woodward and C.
Noe, 7 pp.
13. Guidelines for Evaluating and Screening Bathythermographic Data, ICES Working

IOC Manuals and Guides, 22 Rev.
Page 7
Group on Data Management, September 1986, 4 pp.
14. Data Monitoring and Quality Control of Marine Observations, W.S. Richardson and P.T.
Reilly.
15. IOC/IODE Manual of Quality Control Algorithms and Procedures for Oceanographic
Data Going into International Oceanographic Data Exchange, draft, 1989.
16. IOC/WMO Guide to Operational Procedures for the Collection and Exchange of IGOSS
Data, Manuals & Guides, 3, 68 pp, 1988.
17. Algorithms for the Computation of Fundamental Properties of Seawater, UNESCO
Technical Papers in Marine Science, 44, UNESCO, 1983.


Version 1.0 IOC Manuals and Guides, 22 Rev.
Annex A
ANNEX A
DUPLICATES MANAGEMENT SYSTEM
The first step is to prepare the input file for the programme. This involves a pre-scan of the
input file to identify the date/time range covered by the data to be processed through the
duplicates management system and loaded into the database.
Once the pre-scan has identified the date/time range, a retrieval of data from all ocean
vertical profile type databases for that time range is submitted. The data from the databases
and the input file are sort/merged by date/time and the resulting file serves as input to the
duplicates management programme.
This process enables the duplicates management system to deal with duplicates in the input
file, and between the input file and the databases. It provides for the identification, for
example, of a CTD observation duplicating a TESAC received earlier and will specify the de-
activation of the TESAC so that requests for temperature and salinity data will not result in
duplicate observations being given to the user.
Potential duplicates are reviewed with respect to a target message. The review is forwarded in
time for a window of delta-t. There is no need to go backwards as the target message would
already have been reviewed with respect to a previous target.
The list of potential duplicates is established by examining each message in the delta-t
window with respect to the target message in terms of coincidences of platform
identification, date and time; and both observations occurring in a delta-t, delta-d window (15
minutes and 5 km in the initial implementation of the system).
Once the list of potential duplicates is established with respect to the target observation and
all observations within the delta-t window forward, more detailed analysis of the list occurs.
The first step is to attempt to remove entries from the list according to two criteria. Each
observation is examined once more relative to the target. If the position is different from the
position of the target by more than delta-d (5 km) the observation is removed from the list.
This can occur in the case of an identification/time duplicate.
The second check examines the subsurface information for the target and each other
observation on the duplicates list.
At this point it becomes necessary to consider an additional factor, the source of the
observation which is carried in the databases as a variable named STREAM_IDENT.
The STREAM_IDENT identifies the observation source as a GTSPP BATHY, delayed mode
XBT, an observation from the scientific QC stream, etc. It is relatively easy to compare sub-
surface profiles from two BATHY messages because a duplicate observation should have the
same depths and temperatures, or very nearly so. However, a comparison of a BATHY trace
to a delayed mode XBT trace is not straight forward.

IOC Manuals and Guides, 22 Rev.
Annex A – page 2
This means that the sub-surface test can at this time only be carried out automatically on
observations from the same or similar streams. Similar streams would include the delayed
mode XBT and scientific QC streams as the sub-surface variables are not changed in this
step.
At this time, the concept of reviewable and non-reviewable decisions by the duplicates
checking programme is introduced. Once the duplicates checking programme has produced
an output file containing all data and the database update decision, a post processor is run to
permit review and alteration of "reviewable" decisions by an operator. At the post processor
stage, non-reviewable decisions are accepted and are not referred to the operator.
As implied above, there are "reviewable" and "non-reviewable" decisions. The following are
the tests and types of decisions (i.e. reviewable or non-reviewable) that are included in the
sub-surface checking algorithm. Note that the algorithm must deal with cases of different
profiles attached to the two messages. This would occur for a CTD reporting salinity as well
as temperature when the GTS message included only temperature.
If the observations are from non-similar streams, the profiles are assumed to be duplicates
and the decision is reviewable.
If for all profiles, the depths and variables are the same, the profiles are assumed to be
duplicates and the decision is non-reviewable.
If for all profiles, the depths and variables to some level involving more than n levels or 80 %
of the maximum depth range are the same, the profiles are assumed to be duplicates and the
decision is reviewable.
If more than 80 % of depths and variables are different for all profiles the observation is
assumed not to be a duplicate and is removed from the duplicates list. The decision is non-
reviewable.
The goal of this strategy is to refer all grey area decisions to the operator in the post-
processor phase. As capabilities in duplicate detection improve, attempts will be made to
implement software to reduce the requirements for operator review.
After completion of the final duplicates list, further processing becomes a question of
deciding on the action to be taken with each observation on the final duplicates list. These
decisions are based on a priorization of the STREAM_IDENTs occurring in the input file
(which now contains the data from the database as well) stream and whether the observations
come from the original input stream or the database.
The next group of decisions regarding the duplicates list is to decide the actions necessary in
regard to updating the observations into the database, removing them from the database, or
altering their "active status". The principles are as follows:
Duplicates from the same or similar input streams are not entered into the database. If such a
duplicate occurs, then the decision depends on a control parameter set for the run. This
control parameter specifies either "database priority" or "input stream priority". If the control
parameter specifies "database priority", then the database copy and the duplicate in the input
stream are marked to be "ignored" at database update which leaves the existing copy in the

IOC Manuals and Guides, 22 Rev.
Annex A – page 3
database. If the control parameter specifies "input stream priority" then the database copy is
marked to be "deleted" from the database and the input stream copy is marked to be
"updated" into the database which replaces the copy in the database with the input stream
copy.
This facility provides the ability to correct data in the database by reprocessing the data and
then updating back into the database.
If there are duplicates from two different input streams, then the observation with the highest
priority in the STREAM_IDENT priority list is chosen to be the active copy. The
observation(s) in the database with the lower priority will be marked to be "flagged inactive"
during the update. The highest priority will be flagged to be "updated" if it is not already in
the database or it will be flagged to be "ignored" in the update if it is already present and is to
be left there.
Thus, all observations in the input stream to the duplicates management system (including the
ones that have been extracted from the databases following the prescan) are written to an
output file with flags to indicate the appropriate action to be taken at update time. This output
file is passed to the post processor.
The post processor is an interactive programme that presents textual and graphic information
to the operator in a form that allows him or her to judge whether the decision made by the
duplicates management system was appropriate. If the operator disagrees with the decision,
the decision can be altered at this stage relative to the observations that were on the final
duplicates list. The final product of the post processor programme is a data file that is ready
for input to the database update system.
Note that in the GTSPP implementation of the duplicates management system, there are
several separate databases including a BATHY database, a TESAC database, a bottle
database, an MBT/XBT database, and a CTD database. The processing systems described
here open and deal with all these databases during duplicates checking and update phases of
the data management system as if they were in fact one database.


Version 1.0 IOC Manuals and Guides, 22 Rev.
Annex B
ANNEX B
QUALITY CONTROL TESTS
This Annex lists the test names with their index number in parentheses after each. They are
grouped by stages, and within Stage 1 they are presented in order of application. Tests in
other stages may be applied in any order, but generally Stage 2 tests should be done before
Stage 3 and so on.
Stage 1: Location and Identification Tests
1.1 Platform Identification (1)
1.2 Impossible Date/Time (2)
1.3 Impossible Location (4)
1.4 Position on Land (8)
1.5 Impossible Speed (16)
1.6 Impossible Sounding (32)
Stage 2: Profile Tests
2.1 Global Impossible Parameter Values (64)
2.2 Regional Impossible Parameter Values (128)
2.3 Increasing Depth (256)
2.4 Profile Envelop (512)
2.5 Constant Profile (1024)
2.6 Freezing Point (2048)
2.7 Spike (4096)
2.8 Top and Bottom Spike (8192)
2.9 Gradient (16384)
2.10 Density Inversion (32768)
2.11 Bottom (8388608)
2.12 Temperature Inversion (16777216)
Stage 3: Climatology Tests
3.1 Levitus Seasonal Statistics (65536)
3.2 Emery and Dewar Climatology (131072)
3.3 Asheville Climatology (262144)
3.4 Levitus Monthly Climatology (524288)
Stage 4: Profile Consistency Tests
4.1 Waterfall (1048576)
Stage 5: Visual Inspection
5.1 Cruise Track (2097152)
5.2 Profiles (4194304)

IOC Manuals and Guides, 22 Rev.
Annex B – page 2
Test Name: 1.1 Platform Identification
Prerequisites: A list of known platform identifiers
: Sort the file by identifier
Description:
This test is the very first to be done. It takes a data file and compares the station identifiers to
a list of known identifiers. If the incoming identifier is not known, the user can either keep
the station or try to infer the correct identifier.
The test starts by checking the identifier of the first station in the incoming file against a list
of known identifiers to see if there is an exact match. If there is, the station is checked to
determine if it is the last in the file. If it is, the test is complete. If it is not, the identifier is set
to be the next in the file and this is checked against the list of known identifiers.
If the identifier was not in the list of known identifiers, the file is checked to determine if
there is another identifier exactly the same in the incoming file. If so, it is added to a list of
known identifiers and the identifier checked to see if it is the last in the file. If there is only
one of the identifier in the file, it is assumed to be wrong.
The user can choose to infer the correct identifier. If this is not chosen, the identifier is added
to the list of known identifiers. Then, the identifier is checked to see if it is the last in the file
and processing continues as already described.
If the user chooses to infer the correct identifier, a corrected value may be supplied. Then a
track chart is displayed of the stations in the file with the supplied identifier.
The user can then choose to accept the inferred identifier. If accepted, the identifier is
changed and then checked to see if it is the last in the file and actions continue as described
previously. If all choices are rejected the results from the second rule are presented and so on.
If all possible inferences are rejected, the user may choose to preserve the identifier as
already described.
History: None
Rules:
1.1.1 : Set the ID to be the first identifier in the file
: 1.1.2
1.1.2 IF : The identifier exists in the list of known identifiers
THEN : 1.1.3
ELSE : 1.1.5

IOC Manuals and Guides, 22 Rev.
Annex B – page 3
1.1.3 IF : The ID is the last in the file
THEN : Next test
ELSE : 1.1.4
1.1.4 : Set the ID to be the next in the file
: 1.1.2
1.1.5 IF : There is more than one identifier in the incoming file
THEN : 1.1.6
ELSE : 1.1.7
1.1.6 : Notify the user that the ID was added to the list of known identifiers
: Add the ID to the list of known identifiers
: 1.1.3
1.1.7 IF : The user chooses to infer the correct identifier
THEN : 1.1.8
ELSE : 1.1.6
1.1.8 : Accept the user supplied new identifier
: Display the track chart of the new identifier;
: 1.1.9
1.1.9 IF : The user chooses to accept the inferred identifier
THEN : 1.1.11
ELSE : 1.1.10
1.1.10 IF : The user chooses to try another inference
THEN : 1.1.8
ELSE : 1.1.6
1.1.11 : Preserve the original identifier : Substitute the new identifier
: Set the quality flag on the identifier to be "5", changed
: 1.1.3

IOC Manuals and Guides, 22 Rev.
Annex B – page 4
Test 1.1: Platform Identification

IOC Manuals and Guides, 22 Rev.
Annex B – page 5
Test Name: 1.2 Impossible Date and Time
Prerequisites : Platform Identification Test
: Sort the file chronologically by identifier
Description: This tests if the date and time of the observation is sensible. It does so by breaking the test
into a number of parts. So, the year, month, day, hour and minutes are tested separately. Each
part has a capability to infer a correct value if the given one fails the testing. The rules for the
inferencing are listed in each part.
The first part tests if the year is in the past. If it is not, the user can flag the year as wrong or
try to infer the correct year. The quality flag on the year is set appropriately.
The second part tests if the month is a value between 1 and 12 and if the date is not greater
than the present. If any of these fail, the user can choose to flag the month, or to try to infer
the correct value. The quality flag is set based on the user's choice.
The third part tests if the day is a value permitted for the given month and year, if the year or
month have not already been flagged as erroneous, and if the year, month, day are not greater
than the present. If any of these fail, the user can choose to flag the day, or to try to infer the
correct value. The quality flag is set based on the user's choice. This test allows for real-time
data by testing data derived from this source has a date that is within 30 days of the present.
The fourth part tests if the hour is a value between 0 and 23 and if the time is not greater than
the present. If any of these fail, the user can choose to flag the hour, or to try to infer the
correct value. The quality flag is set based on the user's choice.
The last part tests if the minutes are a value between 0 and 59 and if the time is not greater
than the present. If any of these fail, the user can choose to flag the minutes, or to try to infer
the correct value. The quality flag is set based on the user's choice.
PART 1: This part begins by setting the station to be the first in the file. It then checks if the
year is greater than the present year. If not, a marker is tested (this is set if a change has been
made to the year as a result of an inference). If set, it is cleared, and processing passes to Part
2. If the marker was not set, the quality flag is set to be good and processing goes to Part 2. If
the year is greater than the present year, it is in error. The identifier of the station is examined
to see if it is unique (i.e. there is only one station with this identifier). If not unique, the
identifier, position, date and time of the station under consideration is displayed. As well, the
same information for all of the other stations with the same identifier is also displayed. A
track chart is also displayed. If the identifier is not known, the same information as described
above is displayed for the station under consideration. As well, the same information for
other stations in the same neighbourhood is displayed. Then the user can choose to set the
quality flag on the year to be erroneous.
If the user chooses to flag the year as erroneous, the quality flag is set appropriately and
testing proceeds to Part 2. If not, the user can choose to try to infer the correct year.
The identifier, position, date and time of the station under consideration is displayed. As well,
the same information for all of the other stations inferred to be the same is also displayed.
IOC Manuals and Guides, 22 Rev.
Annex B – page 6
The user can choose to accept the inferred value. If so, the original value of the year is
preserved, the value is changed and the quality flag set to be changed. Processing proceeds to
Part 2.
If the user rejects all of the inferences, the year is flagged as erroneous and processing
continues as already described.
PART 2 begins by testing if the month is a value between 1 and 12. If it is, the quality flag
on the year is tested to see if it is set to be erroneous. If not set to be erroneous, the year and
month are tested to determine if they are greater than the present. If not, a marker is tested
(this is set if a change has been made to the month as a result of an inference). If set, it is
cleared, and processing passes to Part 3. If the marker was not set the quality flag on the
month is set to be good and testing continues in Part 3. If the date is greater than the present,
or if the quality flag on the year is set to be erroneous, or if the month is not between 1 and
12, then the identifier is checked.
If not unique, the identifier, position, date and time of the station under consideration is
displayed. As well, the same information for all of the other stations with the same identifier
is also displayed. Also a track chart is displayed. If the identifier is unique, the same
information as described above is displayed for the station under consideration. As well, the
same information for other stations in the same neighbourhood is displayed. Then the user
can choose to set the quality flag on the month to be doubtful.
If the user chooses to flag the month as doubtful, the quality flag is set appropriately and
testing proceeds to Part 3. If not, the user can choose to set the quality flag to be erroneous. If
the user chooses to flag the month as erroneous, the quality flag is set appropriately and
testing proceeds to Part 3. If not, the user can choose to try to infer the correct month.
If an inference can be made, the identifier, position, date and time of the station under
consideration is displayed. Along with this is shown the track chart of the station. As well,
the same information for all of the other stations inferred to be the same is also displayed.
The user can choose to accept the inferred value. If so, and only the month is inferred to be
different, the original value of the month is preserved, the value is changed and the quality
flag set to be changed. The new value is then tested to ensure it is not greater than the present
and processing proceeds as already described. If the month and year are inferred to be
different, the original values are preserved, the quality flags on both are set to be changed, the
marker is set and processing passes back to Part 1 to check that the year is not greater than
present and processing proceeds as described before.
If an inference cannot be made, the quality flag on the month is set to be erroneous and
processing continues with Part 3.
PART 3 begins by testing if the day is valid given the year and month. If it is, the quality flag
on the year and month are tested to see if either is set to be erroneous. If not set to be
erroneous, the year, month, day is tested to determine if they are greater than the present. If
not, a marker is tested (this is set if a change has been made to the day as a result of an
inference). If set, it is cleared, and processing passes to Part 4. If the marker was not set the
quality flag on the day is set to be good and testing continues in Part 4. If the data did arrive
in real-time, the date is checked that it is within 30 days of the present. If it is, the marker is
checked as already described.

IOC Manuals and Guides, 22 Rev.
Annex B – page 7
If the real-time data are older than 30 days, the user can choose to ignore this or proceed to
set a quality flag. If the user chooses to set a flag, or if the date is greater than the present, or
if the quality flag on the year or month is set to be erroneous, or if the day is not valid then
the identifier is checked.
If the identifier is not unique, the identifier, position, date and time of the station under
consideration is displayed. As well, the same information for all of the other stations with the
same identifier is also displayed. Along with this is shown the track chart of the stations. If
the identifier is unique, the same information as described above is displayed for the station
under consideration. As well, the same information for other stations in the same
neighbourhood is displayed. Then the user can choose to set the quality flag on the day to be
doubtful.
If the user chooses to flag the day as doubtful, the quality flag is set appropriately and testing
proceeds to Part 4. If not, the user can choose to set the quality flag to be erroneous. If the
user chooses to flag the day as erroneous, the quality flag is set appropriately and testing
proceeds to Part 4. If not, the user can choose to try to infer the correct day.
If an inference can be made, the identifier, position, date and time of the station under
consideration is displayed. Along with this is shown the track chart of the station. As well,
the same information for all of the other stations inferred to be the same is also displayed.
The user can choose to accept the inferred value. If so, and only the day is inferred to be
different, the original value of the day is preserved, the value is changed and the quality flag
set to be changed. The new value is then tested to ensure it is not greater than the present and
processing proceeds as already described. If the day and month are inferred to be different,
the original values are preserved, the quality flags are set to be changed, the marker is set and
processing passes back to Part 2 to check that the month and year are not greater than present
and processing proceeds as described before. If the day, month and year are inferred to be
different, the original values are preserved, the quality flags are set to be changed, the marker
is set and processing passes back to Part 1 to check that the day, month and year are not
greater than present and processing proceeds as described before.
If an inference cannot be made, the quality flag on the day is set to be erroneous and
processing continues with Part 4.
PART 4 begins by testing if the hour is valid, that is between 0 and 23. If it is, the quality
flag on the year, month and day are tested to see if any are set to be erroneous. If not set to be
erroneous, the year, month, day and hour are tested to determine if they are greater than the
present. If not, a marker is tested (this is set if a change has been made to the hour as a result
of an inference). If set, it is cleared, and processing passes to Part 5. If the marker was not set
the quality flag on the hour is set to be good and testing continues in Part 5.
If the date is greater than the present, or if the quality flag on the year, month or day is set to
be erroneous then the identifier is checked.
If the hour was not between 0 and 23, it is tested to be the value of 24. If not, the identifier is
tested. If the hour was set to 24, the hour is reset to 0, and the day incremented by one.
Months and years may have to be incremented as well. Then the quality flags on the day,
month and year are tested as described above.

IOC Manuals and Guides, 22 Rev.
Annex B – page 8
If the identifier is not unique, the identifier, position, date and time of the station under
consideration is displayed. As well, the same information for all of the other stations with the
same identifier is also displayed. Along with this is shown the track chart of the station. If the
identifier is unique, the same information as described above is displayed for the station
under consideration. As well, the same information for other stations in the same
neighbourhood is displayed. Then the user can choose to set the quality flag on the hour to be
doubtful.
If the user chooses to flag the hour as doubtful, the quality flag is set appropriately and
testing proceeds to Part 5. If not, the user can choose to set the quality flag to be erroneous. If
the user chooses to flag the hour as erroneous, the quality flag is set appropriately and testing
proceeds to Part 5. If not, the user can choose to try to infer the correct hour.
If an inference can be made, the identifier, position, date and time of the station under
consideration is displayed. As well, the same information for all of the other stations inferred
to be the same is also displayed. Along with this is shown the track chart of the station. The
user can choose to accept the inferred value. If so, and only the hour is inferred to be
different, the original value of the hour is preserved, the value is changed and the quality flag
set to be changed. The new value is then tested to ensure it is not greater than the present and
processing proceeds as already described. If the hour and day are inferred to be different, the
original values are preserved, the quality flags are set to be changed, the marker is set and
processing passes back to Part 3 to check if the day, month and year are greater than present
and processing proceeds as described before. If the hour, day and month are inferred to be
different, the original values are preserved, the quality flags are set to be changed, the marker
is set and processing passes back to Part 2 to check that the month and year are not greater
than present and processing proceeds as described before. If the hour, day, month and year
are inferred to be different, the original values are preserved, the quality flags are set to be
changed, the marker is set and processing passes back to Part 1 to check that the year is not
greater than present and processing proceeds as described before.
If an inference cannot be made, the quality flag on the hour is set to be erroneous and
processing continues with Part 5.
PART 5 begins by testing if the minute is valid, that is between 0 and 59. If it is, the quality
flag on the year, month, day and hour are tested to see if any are set to be erroneous. If not set
to be erroneous, the year, month, day, hour and minute are tested to determine if they are
greater than the present. If not, a marker is tested (this is set if a change has been made to the
minute as a result of an inference). If set, it is cleared, and the next station is tested. If the
marker was not set the quality flag on the hour is set to be good and a test is made to see if
there is another station.
If the date is greater than the present, or if the quality flag on the year, month, day or minute
is set to be erroneous then the identifier is checked.
If the minute was not between 0 and 59, it is tested to be the value of 60. If not, the identifier
is tested. If the minute was set to 60, the minute is reset to 0, and the hour incremented by
one. Days, months and years may have to be incremented as well. Then the quality flags on
the hour, day, month and year are tested as described above.

IOC Manuals and Guides, 22 Rev.
Annex B – page 9
If the identifier is not unique, the identifier, position, date and time of the station under
consideration is displayed. As well, the same information for all of the other stations with the
same identifier is also displayed. Along with this is shown the track chart of the station. If the
identifier is unique, the same information as described above is displayed for the station
under consideration. As well, the same information for other stations in the same
neighbourhood is displayed. Then the user can choose to set the quality flag on the minute to
be doubtful.
If the user chooses to flag the minute as doubtful, the quality flag is set appropriately and
testing proceeds to a next station. If not, the user can choose to set the quality flag to be
erroneous. If the user chooses to flag the minute as erroneous, the quality flag is set
appropriately and testing proceeds to the next station. If not, the user can choose to try to
infer the correct minute. At this time there are no rules for inferring the correct minute.
However, the logic has been built into the rules below to permit inclusion of such rules when
they are available. Since an inference cannot be made, the quality flag is set to be erroneous
and processing continues with a next station.
History: Modified July 1994 to not require a user to flag data older than 30 days as doubtful
or erroneous.
Rules:
Part 1:
1.2.1 : Set the station to be the first in the file
: 1.2.2
1.2.2 IF : The observed year is greater than the present year
THEN : 1.2.5
ELSE : 1.2.3
1.2.3 IF : MARK has been set
THEN : Clear MARK
: 1.2.18
ELSE : 1.2.4
1.2.4 : Set the quality flag on the year to be "1", good
: 1.2.18
1.2.5 IF : The platform identifier is unique
THEN : 1.2.7
ELSE : 1.2.6
1.2.6 : Display the ID, position and date of the ID in question
: Display the same information for any other identifiers with the same ID
: Display the track chart
: 1.2.8
1.2.7 : Display the ID, position and date of the ID in question
: Display the same information for any other identifiers in the neighbourhood of the

IOC Manuals and Guides, 22 Rev.
Annex B – page 10
ID under consideration
: 1.2.8
1.2.8 IF : The user chooses to flag the year as erroneous
THEN : 1.2.9
ELSE : 1.2.10
1.2.9 : Set the quality flag on the year to be "4", erroneous
: 1.2.18
1.2.10 IF : The user chooses to infer a value
THEN : 1.2.12
ELSE : 1.2.11
1.2.11 : Notify the user that the quality flag on the year will be set to be erroneous
: 1.2.9
1.2.12 : Display the ID, position and date of the ID in question
: Display the same information for the other stations with the inferred identifier
: Display the track chart
: 1.2.13
1.2.13 IF : The user accepts an inferred year
THEN : 1.2.15
ELSE : 1.2.14
1.2.14 IF : The user chooses to try another inference
THEN : 1.2.10
ELSE : 1.2.9
1.2.15 : Preserve the original value of the year
: Change the year to the inferred value
: Set the quality flag on the year to be "5", changed
: Set MARK
: 1.2.18
Part 2:
1.2.18 IF : The month is between 1 and 12
THEN : 1.2.19
ELSE : 1.2.23
1.2.19 IF : The quality flag on the year is set to be erroneous
THEN : 1.2.23
ELSE : 1.2.20
1.2.20 IF : The year and month are greater than the present
THEN : 1.2.23
ELSE : 1.2.21

IOC Manuals and Guides, 22 Rev.
Annex B – page 11
1.2.21 IF : MARK is set
THEN : Clear MARK
: 1.2.38
ELSE : 1.2.22
1.2.22 : Set the quality flag on the month to be "1" good
: 1.2.38
1.2.23 IF : The identifier of the station is unique
THEN : 1.2.25
ELSE : 1.2.24
1.2.24 : Display the ID, position and date of the ID in question
: Display the same information for any other identifiers with the same ID
: Display the track chart
: 1.2.26
1.2.25 : Display the ID, position and date of the ID in question
: Display the same information for any other identifiers in the neighbourhood of the
ID under consideration
: 1.2.26
1.2.26 IF : The user chooses to flag the month as doubtful
THEN : 1.2.27
ELSE : 1.2.28
1.2.27 : Set the quality flag on the month to be "3", doubtful
: 1.2.38
1.2.28 IF : The user chooses to flag the month as erroneous
THEN : 1.2.29
ELSE : 1.2.30
1.2.29 : Set the quality flag on the month to be "4", erroneous
: 1.2.38
1.2.30 IF : An inference can be made of the correct month
THEN : 1.2.32
ELSE : 1.2.31
1.2.31 : Notify the user that no inferences can be made
: Notify the user that the quality flag on the month will be set to be erroneous
: 1.2.29
1.2.32 : Display the ID, position and date of the ID in question
: Display the same information for the other stations with the inferred identifier
: Display the track chart
: 1.2.33

IOC Manuals and Guides, 22 Rev.
Annex B – page 12
1.2.33 IF : The user accepts the inferred month
THEN : 1.2.35
ELSE : 1.2.34
1.2.34 IF : The user chooses to try another inference
THEN : 1.2.30
ELSE : Notify the user that the month will be flagged as erroneous
: 1.2.29
1.2.35 IF : Only the month should be changed
THEN : 1.2.36
ELSE : 1.2.37
1.2.36 : Preserve the original value of the month
: Change the month to the inferred value
: Set the quality flag on the month to be "5", changed
: Set MARK
: 1.2.20
1.2.37 : Preserve the original value of the month
: Change the month to the inferred value
: Set the quality flag on the month to be "5", changed
: Preserve the original value of the year
: Change the year to the inferred value
: Set the quality flag on the year to be "5", changed
: Set MARK
: 1.2.2
Part 3:
1.2.38 IF : The day is possible for the given month and year
THEN : 1.2.39
ELSE : 1.2.44
1.2.39 IF : Either the quality flag on the month or year is set to be erroneous
THEN : 1.2.44
ELSE : 1.2.40
1.2.40 IF : The year, month, day is greater than the present
THEN : 1.2.44
ELSE : 1.2.42
1.2.41 IF : MARK is set
THEN : Clear MARK
: 1.2.62
ELSE : 1.2.43
1.2.42 IF : The year, month, day is older than 30 days from the present
THEN : 1.2.61
ELSE : 1.2.41

IOC Manuals and Guides, 22 Rev.
Annex B – page 13
1.2.43 : Set the quality flag on the day to be "1", good
: 1.2.62
1.2.44 IF : The identifier of the station is not unique
THEN : 1.2.45
ELSE : 1.2.46
1.2.45 : Display the ID, position and date of the ID in question
: Display the same information for any other identifiers in the neighbourhood of the
ID under consideration
: Display the track chart
: 1.2.47
1.2.46 : Display the ID, position and date of the ID in question
: Display the same information for any other identifiers with the same ID
: 1.2.47
1.2.47 IF : The user chooses to flag the day as doubtful
THEN : 1.2.48
ELSE : 1.2.49
1.2.48 : Set the quality flag on the day to be "3", doubtful
: 1.2.62
1.2.49 IF : The user chooses to flag the day as erroneous
THEN : 1.2.50
ELSE : 1.2.51
1.2.50 : Set the quality flag on the day to be "4", erroneous
: 1.2.62
1.2.51 : IF : An inference can be made of the correct day
THEN : 1.2.53
ELSE : 1.2.52
1.2.52 : Notify the user that the quality flag on the day will be set to be erroneous
: 1.2.50
1.2.53 : Display the ID, position and date of the ID in question
: Display the same information for the other stations with the inferred identifier
: Display the track chart
: 1.2.54
1.2.54 IF : The user accepts the inferred day
THEN : 1.2.56
ELSE : 1.2.55
1.2.55 IF : The user chooses to try another inference
THEN : 1.2.51
IOC Manuals and Guides, 22 Rev.
Annex B – page 14
ELSE : Notify the user that the day will be flagged as erroneous
: 1.2.50
1.2.56 IF : Only the day should be changed
THEN : 1.2.57
ELSE : 1.2.58
1.2.57 : Preserve the original value of the day
: Change the day to the inferred value
: Set the quality flag on the day to be "5", changed
: Set MARK
: 1.2.40
1.2.58 IF : Only the day and month should be changed
THEN : 1.2.59
ELSE : 1.2.60
1.2.59 : Preserve the original value of the day
: Change the day to the inferred value
: Set the quality flag on the day to be "5", changed
: Preserve the original value of the month
: Change the month to the inferred value
: Set the quality flag on the month to be "5", changed
: Set MARK
: 1.2.20
1.2.60 : Preserve the original value of the day
: Change the day to the inferred value
: Set the quality flag on the day to be "5", changed
: Preserve the original value of the month
: Change the month to the inferred value
: Set the quality flag on the month to be "5", changed
: Preserve the original value of the year
: Change the year to the inferred value
: Set the quality flag on the year to be "5", changed
: Set MARK
: 1.2.2
1.2.61 IF : The user chooses not to flag the day
THEN : 1.2.62
ELSE : 1.2.44
Part 4:
1.2.62 IF : The hour is a number between 0 and 23 inclusive
THEN : 1.2.63
ELSE : 1.2.67

IOC Manuals and Guides, 22 Rev.
Annex B – page 15
1.2.63 IF : Any of the year, month or day have a quality flag set to be erroneous
THEN : 1.2.69
ELSE : 1.2.64
1.2.64 IF : The year, month, day, hour is greater than the present
THEN : 1.2.69
ELSE : 1.2.65
1.2.65 IF : The MARK is set
THEN : 1.2.88
ELSE : 1.2.66
1.2.66 : Set the quality flag on the hour to be "1", good
: 1.2.88
1.2.67 IF : The hour is equal to 24
THEN : 1.2.68
ELSE : 1.2.69
1.2.68 : Preserve the original value of the hour
: Set the hour to be 0
: Set the quality flag on the hour to be "5", changed
: Preserve the original value of the day
: Set the day to be 1 greater than the original value
: Set the quality flag on the day to be "5", changed
: Increment the value of the month and year if appropriate
: 1.2.63
1.2.69 IF : The identifier of the station is not unique
THEN : 1.2.70
ELSE : 1.2.71
1.2.70 : Display the ID, position and date of the ID in question
: Display the same information for any other identifiers with the same ID
: Display the track chart
: 1.2.72
1.2.71 : Display the ID, position and date of the ID in question
: Display the track chart
: 1.2.72
1.2.72 IF : The user chooses to flag the hour as doubtful
THEN : 1.2.73
ELSE : 1.2.74
1.2.73 : Set the quality flag on the hour to be "3", doubtful
: 1.2.88

IOC Manuals and Guides, 22 Rev.
Annex B – page 16
1.2.74 IF : The user chooses to flag the hour as erroneous
THEN : 1.2.75
ELSE : 1.2.76
1.2.75 : Set the quality flag on the hour to be "4", erroneous
: 1.2.88
1.2.76 IF : An inference can be made of the correct hour
THEN : 1.2.77
ELSE : 1.2.75
1.2.77 : Display the ID, position and date of the ID in question
: Display the same information for the other stations with the inferred identifier
: 1.2.78
1.2.78 IF : The user accepts the inferred hour
THEN : 1.2.80
ELSE : 1.2.79
1.2.79 IF : The user chooses to try another inference
THEN : 1.2.76
ELSE : Notify the user that the hour will be flagged as erroneous
: 1.2.75
1.2.80 IF : Only the hour should be changed
THEN : 1.2.81
ELSE : 1.2.82
1.2.81 : Preserve the original value of the hour
: Change the hour to the inferred value
: Set the quality flag on the hour to be "5", changed
: Set MARK
: 1.2.64
1.2.82 IF : Only the hour and day should be changed
THEN : 1.2.83
ELSE : 1.2.84
1.2.83 : Preserve the original value of the hour
: Change the hour to the inferred value
: Set the quality flag on the hour to be "5", changed
: Preserve the original value of the day
: Change the day to the inferred value
: Set the quality flag on the day to be "5", changed
: Set MARK
: 1.2.40
1.2.84 IF : Only the hour, day and month should be changed
THEN : 1.2.85
ELSE : 1.2.86

IOC Manuals and Guides, 22 Rev.
Annex B – page 17
1.2.85 : Preserve the original value of the hour
: Change the hour to the inferred value
: Set the quality flag on the hour to be "5", changed
: Preserve the original value of the day
: Change the day to the inferred value
: Set the quality flag on the day to be "5", changed
: Preserve the original value of the month
: Change the month to the inferred value
: Set the quality flag on the month to be "5", changed
: Set MARK
: 1.2.20
1.2.86 : Preserve the original value of the hour
: Change the hour to the inferred value
: Set the quality flag on the hour to be "5", changed
: Preserve the original value of the day
: Change the day to the inferred value
: Set the quality flag on the day to be "5", changed
: Preserve the original value of the month
: Change the month to the inferred value
: Set the quality flag on the month to be "5", changed
: Preserve the original value of the year
: Change the year to the inferred value
: Set the quality flag on the year to be "5", changed
: Set MARK
: 1.2.2
Part 5:
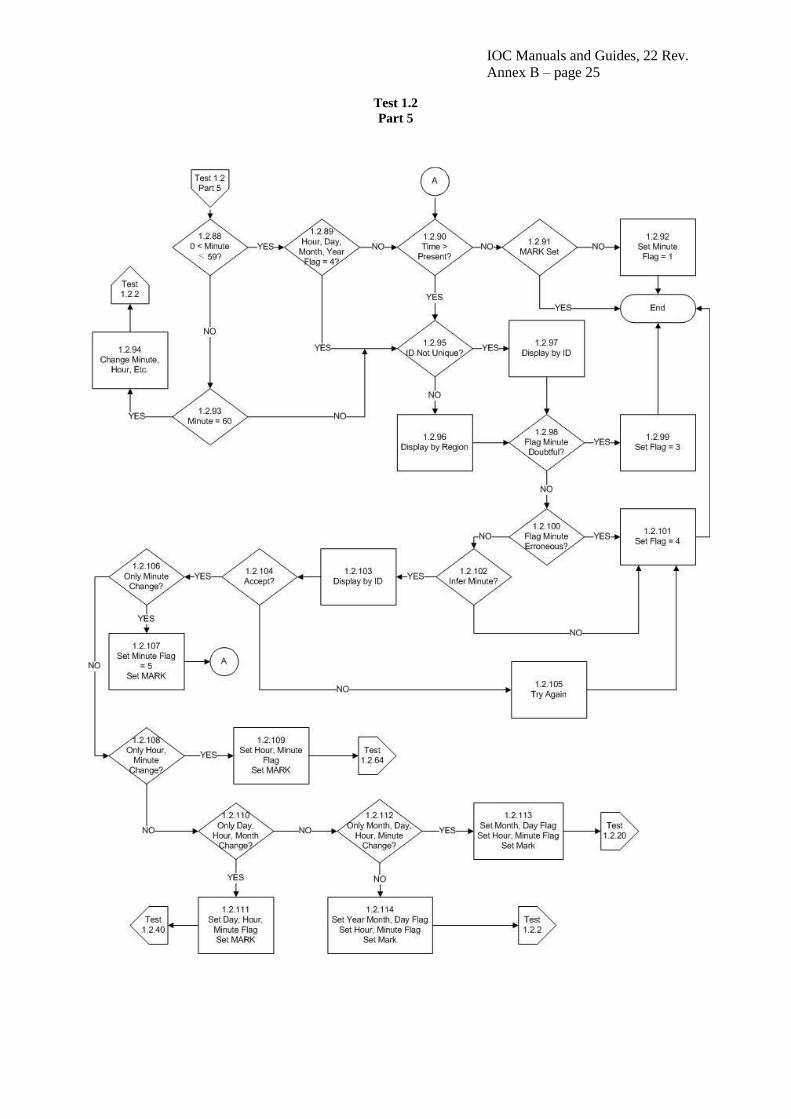
1.2.88 IF : The minute is a value between 0 and 59
THEN : 1.2.89
ELSE : 1.2.93
1.2.89 IF : Any of the quality flags on the hour, day, month or year is set to be erroneous
THEN : 1.2.95
ELSE : 1.2.90
1.2.90 IF : The year, month, day, hour, minute is greater than the present
THEN : 1.2.95
ELSE : 1.2.91
1.2.91 IF : The marker is set
THEN : Test the next station
ELSE : 1.2.92
1.2.92 : Set the quality flag on the minute to be "1" good
: Test the next station

IOC Manuals and Guides, 22 Rev.
Annex B – page 18
1.2.93 IF : The minute is equal to 60
THEN : 1.2.94
ELSE : 1.2.95
1.2.94 : Set the minute to be 00
: Increment the hour by 1
: Increment the day, month and year as appropriate
: 1.2.2
1.2.95 IF : The identifier of the station is unique
THEN : 1.2.97
ELSE : 1.2.96
1.2.96 : Display the ID, position and date of the ID in question
: Display the same information for any other identifiers in the neighbourhood of the
ID under consideration
: 1.2.98
1.2.97 : Display the ID, position and date of the ID in question
: Display the same information for any other identifiers with the same ID
: Display the track chart
: 1.2.98
1.2.98 IF : The user chooses to flag the minute as doubtful
THEN : 1.2.99
ELSE : 1.2.100
1.2.99 : Set the quality flag on the minute to be "3", doubtful
: Test the next station
1.2.100 IF : The user chooses to flag the minute as erroneous
THEN : 1.2.101
ELSE : 1.2.102
1.2.101: Set the quality flag on the minute to be "4", erroneous
: Test the next station
1.2.102 IF : An inference can be made of the correct minute
THEN : 1.2.103
ELSE : 1.2.101
1.2.103: Display the ID, position and date of the ID in question
: Display the same information for the other stations with the inferred identifier
: Display the track chart
: 1.2.104
1.2.104 IF : The user accepts the inferred minute
THEN : 1.2.106
ELSE : 1.2.105

IOC Manuals and Guides, 22 Rev.
Annex B – page 19
1.2.105: Notify the user that the minute will be flagged as erroneous
: 1.2.101
1.2.106 IF : Only the minute should be changed
THEN : 1.2.107
ELSE : 1.2.108
1.2.107: Preserve the original value of the minute
: Change the minute to the inferred value
: Set the quality flag on the minute to be "5", changed
: Set MARK
: 1.2.90
1.2.108 IF : Only the minute and hour should be changed
THEN : 1.2.109
ELSE : 1.2.110
1.2.109: Preserve the original value of the minute
: Change the minute to the inferred value
: Set the quality flag on the minute to be "5", changed
: Preserve the original value of the hour
: Change the hour to the inferred value
: Set the quality flag on the hour to be "5", changed
: Set MARK
: 1.2.64
1.2.110 IF : Only the minute, hour and day should be changed
THEN : 1.2.111
ELSE : 1.2.112
1.2.111: Preserve the original value of the minute
: Change the minute to the inferred value
: Set the quality flag on the minute to be "5", changed
: Preserve the original value of the hour
: Change the hour to the inferred value
: Set the quality flag on the hour to be "5", changed
: Preserve the original value of the day
: Change the day to the inferred value
: Set the quality flag on the day to be "5", changed
: Set MARK
: 1.2.40
1.2.112 IF : Only the minute, hour, day and month should be changed
THEN : 1.2.113
ELSE : 1.2.114
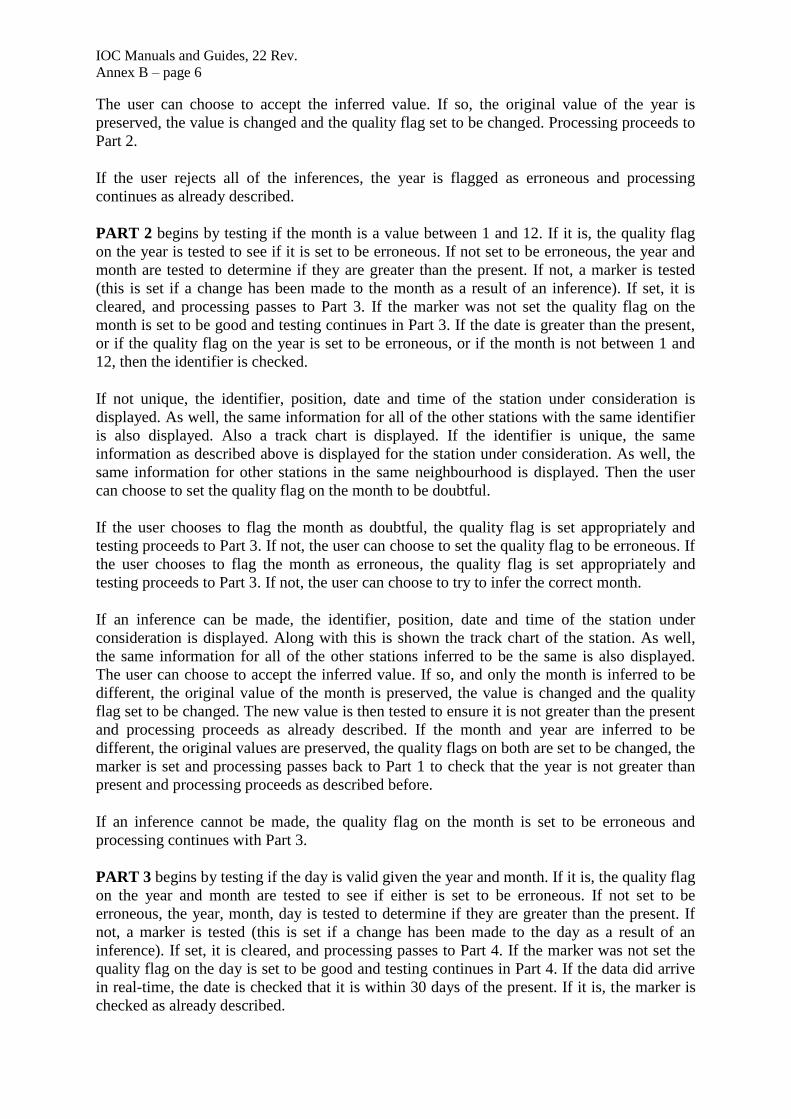
1.2.113: Preserve the original value of the minute
: Change the minute to the inferred value
: Set the quality flag on the minute to be "5", changed
: Preserve the original value of the hour

IOC Manuals and Guides, 22 Rev.
Annex B – page 20
: Change the hour to the inferred value
: Set the quality flag on the hour to be "5", changed
: Preserve the original value of the day
: Change the day to the inferred value
: Set the quality flag on the day to be "5", changed
: Preserve the original value of the month
: Change the month to the inferred value
: Set the quality flag on the month to be "5", changed
: Set MARK
: 1.2.20
1.2.114: Preserve the original value of the minute. Change the minute to the inferred value
: Set the quality flag on the minute to be "5", changed
: Preserve the original value of the hour. Change the hour to the inferred value
: Set the quality flag on the hour to be "5", changed
: Preserve the original value of the day. Change the day to the inferred value
: Set the quality flag on the day to be "5", changed
: Preserve the original value of the month. Change the month to the inferred value
: Set the quality flag on the month to be "5", changed
: Preserve the original value of the year. Change the year to the inferred value
: Set the quality flag on the year to be "5", changed
: Set MARK
: 1.2.2

IOC Manuals and Guides, 22 Rev.
Annex B – page 21
Test 1.2
Part 1

IOC Manuals and Guides, 22 Rev.
Annex B – page 22
Test 1.2
Part 2

IOC Manuals and Guides, 22 Rev.
Annex B – page 23
Test 1.2
Part 3

IOC Manuals and Guides, 22 Rev.
Annex B – page 24
Test 1.2
Part 4
IOC Manuals and Guides, 22 Rev.
Annex B – page 25
Test 1.2
Part 5

IOC Manuals and Guides, 22 Rev.
Annex B – page 26
Test Name: 1.3 Impossible Location
Prerequisites : Platform Identification Test
: Impossible Date and Time Test
: Sort the file by identifier and date/time
Description:
This tests if the location of the observation is sensible. It does so by breaking the test into 2
parts. The two parts simply check that the latitude and longitude have possible values.
PART 1 begins by checking if the latitude lies between 90 degrees south and 90 degrees
north inclusive. If it does, processing passes immediately to Part 2. If not, the identifier of the
station is checked to see if it is known. If the identifier is known, the identifier, latitude,
longitude, date and time of the station under consideration is listed. Also listed is the same
information for all other stations with the same identifier in the incoming file. Processing
then allows the user to flag the latitude as erroneous. If the identifier is not known, the user
may choose to flag the latitude as erroneous.
If the user chooses to flag the latitude as erroneous, the quality flag is set to be "4", and
processing passes to Part 2.
If the user chooses not to flag the latitude as erroneous, a latitude may be inferred. If the user
chooses not to do this, the quality flag is set to be "4" and processing passes to Part 2.
If an inference can be made, the user may do so. If the inference is accepted, the original
value is preserved, the value changed to the new one, the quality flag set to be "5", changed
and processing passes to Part 2.
PART 2 proceeds exactly the same as part 1 except the longitude is examined. In this case,
the longitude must lie between 180 degrees west and 180 degrees east. Note that longitudes
given using a different co-ordinate system must be converted. After the longitude is checked
in this way, processing passes to the next station.
History: None
Rules:
Part 1:
1.3.1 IF : The latitude lies between plus or minus 90 degrees
THEN : 1.3.13
ELSE : 1.3.2
1.3.2 IF : The identifier of the station is known
THEN : 1.3.3
ELSE : 1.3.4

IOC Manuals and Guides, 22 Rev.
Annex B – page 27
1.3.3 : List the identifier, latitude, longitude and date of the station with the suspect latitude
: List the identifiers, latitudes, longitudes and dates of all of the stations with the same
identifier
: Display the track chart
: 1.3.4
1.3.4 IF : The user chooses to set the quality flag on the latitude as erroneous
THEN : 1.3.5
ELSE : 1.3.6
1.3.5 : Set the quality flag on the latitude for the suspect station to be "4", erroneous
: 1.3.13
1.3.6 IF : The user chooses to infer the latitude
THEN : 1.3.7
ELSE : 1.3.5
1.3.7 IF : The user chooses to accept an inference
THEN : 1.3.9
ELSE : 1.3.8
1.3.8 IF : The user chooses to try to make another inference
THEN : 1.3.6
ELSE : 1.3.5
1.3.9 : Preserve the original value of the latitude
: Replace the original latitude with the inferred value
: Set the quality flag on the latitude to be "5", changed
: 1.3.13
Part 2:
1.3.13 IF : The longitude lies between plus or minus 180 degrees
THEN : Test the next station
ELSE : 1.3.14
1.3.14 IF : The identifier of the station is known
THEN : 1.3.15
ELSE : 1.3.16
1.3.15 : List the identifier, latitude, longitude and date of the station with the suspect latitude
: List the identifiers, latitudes, longitudes and dates of all of the stations with the same
identifier
: Display the track chart
: 1.3.16
1.3.16 IF : The user chooses to set the quality flag on the longitude as erroneous
THEN : 1.3.17
ELSE : 1.3.18

IOC Manuals and Guides, 22 Rev.
Annex B – page 28
1.3.17 : Set the quality flag on the longitude for the suspect station to be "4", erroneous
: Test the next station
1.3.18 IF : The user chooses to infer the longitude
THEN : 1.3.19
ELSE : 1.3.17
1.3.19 IF : The user chooses to accept an inference
THEN : 1.3.21
ELSE : 1.3.20
1.3.20 IF : The user chooses to try to make another inference
THEN : 1.3.18
ELSE : 1.3.17
1.3.21 : Preserve the original value of the longitude
: Replace the original longitude with the inferred value
: Set the quality flag on the longitude to be "5", changed
: Test the next station.

IOC Manuals and Guides, 22 Rev.
Annex B – page 29
Test 1.3
Impossible Location

IOC Manuals and Guides, 22 Rev.
Annex B – page 30
Test Name: 1.4 Position on Land
Prerequisites : Platform Identification Test
: Impossible Date and Time Test
: Impossible Position Test
: A file of ocean bathymetry
: Sort the file by identifier and date/time
Description:
This tests if the location of the observation is on land or water. It does so by comparing the
location with a file of known bathymetric values. The user can choose to alter the recorded
sounding, or the location of the station.
The test begins by checking if the latitude or longitude of the station has a quality flag set to
be erroneous. If so, the next station is examined. If the position is not flagged as erroneous,
then the position of the station is checked against a file of the ocean bathymetry to determine
if the location is on land or not. If the station is at sea, it is examined to determine if there is a
sounding and that the attached quality flag is not set to be erroneous. If there is no sounding,
or if the value is flagged as erroneous, processing passes to the next station.
If the sounding is present and not flagged as erroneous, it is compared with the known water
depth at the location of the station. If they agree, to within 10%, processing passes to the next
station.
If the sounding and position do not agree, the identifier, date, time, position, sounding, depth
from a bathymetry file and quality flags are displayed for the station under consideration and
other stations in the neighbourhood. Also the track chart is displayed. The user can then
choose to try to infer the correct sounding.
If the user chooses not to infer the sounding, the user can choose to flag the sounding as
doubtful. If accepted, the quality flag is set to be "3" and processing passes to the next
station. If the user chooses not to flag the sounding as doubtful, it is flagged as erroneous and
processing automatically passes to the next station.
If the user accepts an inferred value, the original value is preserved, the inferred value
replaces the original value, the quality flag on the sounding set to be changed, and processing
passes to the next station.
If the station was determined to be on land, the identifier is examined to see if it is known. If
not, the user can choose to flag the position as doubtful. If this is accepted, the quality flags
on the latitude and longitude are set to be " 3 " and processing proceeds to the next station.
If the user rejects flagging the position as doubtful, the latitude and longitude are flagged as
erroneous and processing proceeds to the next station.
If the identifier is known, the identifier, date, time, latitude, longitude and quality flags of the
other stations with the same identifier are shown along with the same information for the
suspect station. The user may choose to infer the correct position of the station. If the user

IOC Manuals and Guides, 22 Rev.
Annex B – page 31
chooses not to infer the position, they may choose to flag the position as doubtful as
described above.
If the user chooses to accept the inference, the original value(s) of the position is preserved,
the new value(s) substituted, the quality flag set to be changed, and processing passes to
check once more that the location is at sea. If the user chooses to not accept the inference,
another may be tried. If no other is available or no other to be tried, the user can choose to
flag the position as doubtful as described before.
History: None
Rules:
1.4.1 IF : The quality flag on the latitude or longitude is set to be erroneous
THEN : Test the next station
ELSE : 1.4.2
1.4.2 IF : The station location is at sea
THEN : 1.4.3
ELSE : 1.4.16
1.4.3 IF : There is a sounding value
THEN : 1.4.4
ELSE : Test the next station
1.4.4 IF : The value of the sounding is within 10% of the bathymetry at the location
THEN : Test the next station
ELSE : 1.4.5
1.4.5 : Display the identifier, date, time, latitude, longitude, sounding, depth and quality
flags for the station under consideration
: Display the identifier, date, time, latitude, longitude, sounding,
depth and quality flags for other stations in the neighbourhood of the station under
consideration
: 1.4.6
1.4.6 IF : The user chooses to infer the sounding
THEN : 1.4.7
ELSE : 1.4.10
1.4.7 IF : The user chooses to accept the inference
THEN : 1.4.9
ELSE : 1.4.8
1.4.8 IF : The user chooses to try another choice
THEN : 1.4.6
ELSE : 1.4.10
1.4.9 : Preserve the original value of the sounding
: Replace the sounding with the inferred value

IOC Manuals and Guides, 22 Rev.
Annex B – page 32
: Set quality flag on the sounding to be "5", changed
: Test the next station
1.4.10 IF : The user chooses to flag the sounding as doubtful
THEN : 1.4.11
ELSE : 1.4.12
1.4.11 : Set the quality flag on the sounding to be "3", doubtful
: Test the next station
1.4.12 : Set the quality flag on the sounding to be "4", erroneous
: Test the next station
1.4.16 IF : The identifier of the station is known
THEN : 1.4.17
ELSE : 1.4.22
1.4.17 : Display the identifier, date, time, latitude, longitude, sounding, depth and quality
flags for the station under consideration
: Display the identifier, date, time, latitude, longitude, sounding, depth and quality
flags for other stations with the same identifier
: Display a track chart
: 1.4.18
1.4.18 IF : The user chooses to infer the position
THEN : 1.4.19
ELSE : 1.4.22
1.4.19 IF : The user chooses to accept the inference
THEN : 1.4.21
ELSE : 1.4.20
1.4.20 IF : The user chooses to try another choice
THEN : 1.4.18
ELSE : 1.4.22
1.4.21 : Preserve the original value of the position
: Replace the position with the inferred value
: Set quality flag on the position to be "5", changed
: 1.4.2
1.4.22 IF : The user chooses to flag the position as doubtful
THEN : 1.4.23
ELSE : 1.4.24
1.4.23 : Set the quality flag on the position to be "3", doubtful
: Test the next station
1.4.24 : Set the quality flag on the position to be "4", erroneous
: Test the next station

IOC Manuals and Guides, 22 Rev.
Annex B – page 33
Test 1,4 Position on Land
Part 1

IOC Manuals and Guides, 22 Rev.
Annex B – page 34
Test 1.4 Position on Land
Part 2

IOC Manuals and Guides, 22 Rev.
Annex B – page 35
Test Name: 1.5 Impossible Speed
Prerequisites : Platform Identification Test
: Impossible Date and Time Test
: Impossible Position Test
: A file of ship identifiers and maximum possible speeds
: Sort the file by identifier and chronologically.
Description:
This tests if the speed of the platform conforms to the characteristics known of the platform.
It makes use of a table of platform identifiers that records the maximum speed possible for
each. Note that it tests the speed between two stations and if a problem is found, it assumes
the problem lies with the station later in time.
The test begins by checking if there is more than one station of the identifier under
consideration. If not, no testing can be performed. If there is more than one station, the
identifier of the platform is tested to determine if it is known. If it is not, no test of the speed
may be performed and testing passes to the next station. If the identifier is known, the quality
flags on the position, date and time of the station is checked. If any of these flags are set to be
erroneous, processing passes to the next station. If none are set to erroneous, the speed of the
platform between the first two stations is calculated based on the separation in location and
time. This is compared to the maximum allowed speed for the platform. If the speed does not
exceed the maximum, the next station is used to calculate the speed between stations.
If the speed exceeds the maximum allowed, the identifier, latitude, longitude, date, time and
quality flags for each are displayed for all of the stations with the identifier under
consideration. A track chart is also displayed. The user may then choose to examine the
position of the later station of the pair that was used to calculate speed.
If the user chooses to examine the position, they may then choose to infer the correct
position. If this is not selected, the user may choose to set the quality flag on the position as
doubtful. If this is accepted, the quality flag is set to be doubtful, a marker set and the next
station tested.
If the user chooses not to flag the position as doubtful, they may choose to flag it as
erroneous. If this is accepted, the quality flag is set to be erroneous, a marker set and the next
station tested.
If the user chooses to infer a position and then accepts the choice, the original position is
preserved, the new position substituted, the quality flag set to indicate the position to be
changed, the marker set to indicate the position was examined and processing passes to
allowing the user to choose if the date and time should be examined.
If the user chooses not to flag the position as erroneous, or if the user chooses not to examine
the position, they may then choose to examine the date and time of the station later in time. If
this is not accepted, a marker is tested to see if the position was examined. If it was,
processing passes to the next station. If it was not set, a marker is examined to see if the date
and time was checked. If set, processing passes to the next station. If neither marker has been

IOC Manuals and Guides, 22 Rev.
Annex B – page 36
set, the quality flags on the latitude, longitude, date and time are all set to be doubtful, the
user informed of this and processing passes to the next station.
If the user chooses to examine the date and time, then they may choose to infer the date and
time. If they choose not to, they can choose to flag the date and time as doubtful. If so, the
quality flags on the year, month, day, hour and minute are set to be doubtful. Then processing
passes to the next station. If the user chooses not to flag the date and time as doubtful, they
can choose to flag them as erroneous. If so, the quality flags on the year, month, day, hour
and minute are set to be doubtful. Then processing passes to the next station.
If the user chooses not to flag the date and time as erroneous, processing passes to ask the
user if they wish to examine the position as described before.
The user may choose to infer the date and time and if they choose to accept it, the original
value of the date and time are preserved, the new one substituted, the quality flag set to
changed, and a marker set. Then if the marker indicating the position has already been looked
at, processing passes to the next station. If the marker was not set, processing allows the user
to choose if the position should be examined.
History: None
Rules:
1.5.1 IF : There is more than 1 station with the same identifier
THEN : 1.5.2
ELSE : Test the next station
1.5.2 IF : The identifier is known
THEN : 1.5.3
ELSE : Test the next station
1.5.3 IF : Either the latitude or longitude have a quality flag set to be erroneous
THEN : Test the next station
ELSE : 1.5.4
1.5.4 IF : The year, month, day, hour or minute have a quality flag set to be erroneous
THEN : Test the next station
ELSE : 1.5.5
1.5.5 IF : The speed between the station in question and the next earlier station is less than
or equal to the maximum speed for the platform
THEN : Test the next station
ELSE : 1.5.6
1.5.6 : Display the identifier, latitude, longitude, year, month, day, hour, minute and quality
flags for the later station
: Display the identifier, latitude, longitude, year, month, day, hour, minute and quality
flags for the earlier station
: Display a track chart
: 1.5.7

IOC Manuals and Guides, 22 Rev.
Annex B – page 37
1.5.7 IF : The user chooses to examine the position
THEN : 1.5.8
ELSE : 1.5.20
1.5.8 IF : The user chooses to infer the position of the later station
THEN : 1.5.9
ELSE : 1.5.13
1.5.9 IF : The user chooses to accept the choice
THEN : 1.5.11
ELSE : 1.5.10
1.5.10 IF : The user chooses to try again
THEN : 1.5.8
ELSE : 1.5.13
1.5.11 : Preserve the original value of the position
: Change the value of the position according to the inferred value
: Set the quality flag on the position to be "5", changed
: Set the position marker
: 1.5.12
1.5.12 IF : The date marker is set
THEN : Test the next station
ELSE : 1.5.20
1.5.13 IF : The user chooses to flag the position as doubtful
THEN : 1.5.14
ELSE : 1.5.15
1.5.14 : Set the quality flags on the latitude and longitude to be "3", doubtful
: Test the next station
1.5.15 IF : The user chooses to flag the position as erroneous
THEN : 1.5.16
ELSE : 1.5.20
1.5.16 : Set the quality flags on the latitude and longitude to be "4", erroneous
: Test the next station
1.5.20 IF : The user chooses to examine the date and time of the second station
THEN : 1.5.24
ELSE : 1.5.21
1.5.21 IF : The position marker has been set
THEN : Test the next station
ELSE : 1.5.22

IOC Manuals and Guides, 22 Rev.
Annex B – page 38
1.5.22 IF : The date marker has been set
THEN : Test the next station
ELSE : 1.5.23
1.5.23 : Set the quality flags on the latitude and longitude to be "3", >doubtful
: Set the quality flags on the year, month, day, hour and minute to be doubtful
: Test the next station
1.5.24 IF : The user chooses to infer the date and time of the later station
THEN : 1.5.25
ELSE : 1.5.29
1.5.25 IF : The user chooses to accept the choice
THEN : 1.5.27
ELSE : 1.5.26
1.5.26 IF : The user chooses to try again
THEN : 1.5.24
ELSE : 1.5.29
1.5.27 : Preserve the original value of the date and time
: Change the value of the date and time according to the inferred value
: Set the quality flag on the date to be "5", changed
: Set the date marker
: 1.5.28
1.5.28 IF : The position marker is set
THEN : Test the next station
ELSE : 1.5.7
1.5.29 IF : The user chooses to flag the date and time as doubtful
THEN : 1.5.30
ELSE : 1.5.31
1.5.30 : Set the quality flags on the year, month, day, hour and minute to be doubtful
: Test the next station
1.5.31 IF : The user chooses to flag the date and time as erroneous
THEN : 1.5.32
ELSE : 1.5.7
1.5.32 : Set the quality flags on the year, month, day, hour and minute to be erroneous
: Test the next station

IOC Manuals and Guides, 22 Rev.
Annex B – page 39
1.5 Impossible Speed
Part 1

IOC Manuals and Guides, 22 Rev.
Annex B – page 40
1.5 Impossible Speed
Part 2

IOC Manuals and Guides, 22 Rev.
Annex B – page 41
1.5 Impossible Speed
Part 3

IOC Manuals and Guides, 22 Rev.
Annex B – page 42
Test Name: 1.6 Impossible Sounding
Prerequisites : Platform Identification Test
: Impossible Date and Time Test
: Impossible Location Test
: Sort the file by identifier
: Digital bathymetry file
Description:
This tests if the sounding is sensible given a digital bathymetry.
The test begins by checking if the latitude or longitude of the station has a quality flag set to
be erroneous. If so, the next station is examined. If the position is flagged as erroneous, the
station is checked to see if the sounding is present. If present, the quality flag is set to be
unchecked. If the sounding is not present, the next station is tested.
If the position is not flagged as erroneous, the station is checked to see if the sounding is
present. If not present, the next station is tested. If the sounding is present, it is tested to be
within 10% of the bathymetry. If it is, the quality flag on the sounding is set to be good.
If the sounding does not agree with the bathymetry, the user can choose to set the quality flag
to be doubtful. If this is chosen, the quality flag is set to be doubtful. If the user chooses not
to flag the sounding as doubtful, it is flagged as erroneous. No matter which flag is set,
processing passes to test the next station.
History: None
Rules:
1.6.1 IF : The quality flag on the latitude or longitude is set to be erroneous
THEN : 1.6.2
ELSE : 1.6.4
1.6.2 IF : The sounding is present
THEN : 1.6.3
ELSE : Test the next station
1.6.3 : Set the quality flag on the sounding to be unchecked
: Test the next station
1.6.4 IF : The sounding is present
THEN : 1.6.5
ELSE : Test the next station
1.6.5 IF : The sounding is within 10% of the bathymetry
THEN : 1.6.6
ELSE : 1.6.7

IOC Manuals and Guides, 22 Rev.
Annex B – page 43
1.6.6 : Set the quality flag on the sounding to be good
: Test the next station
1.6.7 IF : The user chooses to flag the sounding as doubtful
THEN : 1.6.8
ELSE : 1.6.9
1.6.8 : Set the quality flag on the sounding to be doubtful
: Test the next station
1.6.9 : Set the quality flag on the sounding to be erroneous
: Test the next station

IOC Manuals and Guides, 22 Rev.
Annex B – page 44
1.6 Impossible Sounding

IOC Manuals and Guides, 22 Rev.
Annex B – page 45
Test Name: 2.1 Global Impossible Parameter Values
Prerequisites: All of Stage 1 tests
: The data should be sorted by identifier. For each unique identifier, the data
should be sorted by increasing observation date and time ignoring any quality
flags.
: All directional values should be converted on input to values between 0 and
360 degrees with north being zero degrees and east being 90 degrees.
Description:
These rules are used to check if observed parameter values are within probable globally
defined limits. It begins by examining the first parameter at the shallowest depth and
proceeds to look at other parameter values at the same depth before looking at values at the
next depth. The test begins by examining if the parameter value exceeds the maximum
recorded in table 2.1 below. If it does not, the value is tested against the minimum value as is
described below. If it does exceed the maximum, the identifier for the profile is checked to
see if it is known. If it is unknown, the identifier and value of the parameter at all depths of
the profile are displayed. As well, the same information for the depth being considered in the
suspect profile at other profiles in the neighborhood are displayed. If the identifier is known,
the identifier and value of the parameter at all depths of the profile and the same information
for the depth being considered in the suspect profile for other profiles with the same identifier
in the input file are displayed. In either case, the user can then choose to infer the value or
not. If the user chooses not to infer the value, they may choose to flag the value as doubtful.
If an inference is made, the original value is changed, the original is preserved and the quality
flag set to "changed". Then a marker is tested to see if the value has been tested against the
minimum value. If so, the next parameter value is tested. If not, the test checks the value
against the permitted minimum as in table 2.1 below.
If the user chooses to flag a value as doubtful, the quality flag is set to be doubtful. If not set
as doubtful, it is set as erroneous. In either case, the marker is then tested as described above.
The test then goes on to test if the same parameter value is less than or equal to the minimum
value recorded in table 2.l. If it is not, the parameter is tested to see if it is the wind direction.
If not, the quality flag is tested to see if it has already been set. If so that next parameter is
tested. If not, the quality flag is set to good, and the next parameter tested.
If the value is equal to the minimum, the parameter is examined further to see if it is
recording a direction. If not, the quality flag is examined and if not set already, it is set to be
good. If already set or when set to good, the next parameter is tested.
If it is a direction, and the value is equal to the minimum, and the data source uses this
minimum to indicate calm conditions, the quality flag is examined if any of these conditions
are not met. If all of the conditions are met, the corresponding speed value is examined. For
example, if wind direction was the parameter derived from a GTS source, and the value was
zero, the wind speed value would be tested. If the speed value is zero, the quality flag is
examined. If not zero, the identifier is examined to see if it is known. If it is unknown, the
identifier, speed and direction at all depths of the profile are displayed. As well, the same
information for the depth being considered in the suspect profile at other profiles in the

IOC Manuals and Guides, 22 Rev.
Annex B – page 46
neighbourhood are displayed. If the identifier is known, the identifier, speed and direction at
all depths of the profile and the same information for the depth being considered in the
suspect profile for other profiles with the same identifier in the input file are displayed. In
either case, the user can then choose to infer either the speed or direction value.
If an inference is made, the original value is saved and the quality flag set to "changed". Then
the next parameter is tested.
If the user chooses not to infer a value, they may choose to flag the value as doubtful. If this
is not accepted, the value is flagged as erroneous. In either case, the next parameter is then
tested.
Table 2.1: Global Impossible Parameter Values
Parameter Min Max Units
Air Pressure 850 1060 hectoPascals
Air Pressure Tendency -30 30 hPa/hour
Air Temperature (Dry) -80 40 degreesC
Alkalinity 800 4000 micromoles/lt
Ammonia 0 50 micromoles/lt
Carbonate alkalinity 800 2300 micromoles/lt
Chlorophyll-a 0 30 milligrams/m3
Chlorophyll-b 0 30 milligrams/m3
Chlorophyll-c 0 30 milligrams/m3
Cloud Amount 0 9 oktas (WMO code 2700)
Cloud Code 0 9 code table
Current Direction 0 360 degrees
Current Speed 0 3 m/sec
Depth 0 10000 m
Dissolved Oxygen 0 650 millimoles/m3
Fluorescence -0.5 10 volts
Fluorescence 0 100 percent
Fluorescence 0 30 milligrams/m3
Fluoride 0 0.12 mg/lt
Light transmission 0 100 percent
Nitrate 0 50 micromoles/lt
Nitrite 0 4 micromoles/lt
Particulate carbon 0 1000 mg/lt
pH 6.5 9.0 none
Phaeophytin 0 25 milligrams/m3
Phosphate 0 4 micromoles/lt
Salinity 0 41 psu
Silicate 0 300 micromoles/lt
Sounding 0 10,000 M
Sound velocity 1425 1575 m/sec
Total nitrogen 0 50 millimoles/m3
Total phosphorous 0 20 micromoles/lt
Water Temperature -2.0 40 degreesC
Wave Height 0 30 m

IOC Manuals and Guides, 22 Rev.
Annex B – page 47
Parameter Min Max Units
Wave Period 0 25 Sec
Weather Code 0 99 code table
Wind Direction 0 360 degrees
Wind Speed 0 60 m/sec
History: 6 Mar, 2000: The parameter Sound velocity was added. Weather code max
was changed to 99
8 Mar, 2002: The maximum value for alkalinity was changed to 4000
Rules:
2.1.1 IF :The parameter value is greater than the maximum value in table 2.1
THEN : 2.1.2
ELSE : Set MARK 2.1.16
2.1.2 IF : The identifier is known
THEN : 2.1.3
ELSE : 2.1.4
2.1.3 : Display the identifier and parameter values for the profile with the suspect value
: Display the identifiers and parameter values for all other stations with the same
identifier in the incoming file and at the same depth as the suspect value
: 2.1.5
2.1.4 : Display the identifier and parameter values for the profile with the suspect value
: Display the identifiers and parameter values for other stations in the incoming file
and in the neighbourhood of the profile in question and at the same depth as the
suspect value
: 2.1.5
2.1.5 IF : The user wishes to infer the value
THEN : 2.1.9
ELSE : 2.1.6
2.1.6 IF : The user wishes to flag the value as doubtful
THEN : 2.1.7
ELSE : 2.1.8
2.1.7 : Set the quality flag on the value to be "3", doubtful
: 2.1.12
2.1.8 : Notify the user that the quality flag is set to erroneous
: Set the quality flag on the value to be "4", erroneous
: 2.1.12
2.1.9 IF : The user chooses to accept an inference
THEN : 2.1.11
ELSE : 2.1.10

IOC Manuals and Guides, 22 Rev.
Annex B – page 48
2.1.10 IF : The user chooses to try again
THEN : 2.1.5
ELSE : 2.1.6
2.1.11 : Preserve the original value
: Reset the parameter value to the new value
: Set the quality flag on the parameter to "5", changed
: 2.1.12
2.1.12 IF : A MARK is set indicating that the value has been tested against the maximum
value
THEN : Clear MARK
: Test the next parameter
ELSE : Set MARK to indicate the value has been tested against the maximum
: 2.1.16
2.1.16 IF : The parameter value is less than the minimum value in table 2.1
THEN : 2.1.2
ELSE : 2.1.17
2.1.17 IF : The parameter is a direction
THEN : 2.1.20
ELSE : 2.1.18
2.1.18 IF : The quality flag is already set
THEN : Clear MARK
: Test the next parameter
ELSE : 2.1.19
2.1.19 : Set the quality flag to be good
: Clear MARK
: Test the next parameter
2.1.20 IF : The parameter value equals the minimum value in table 2.1
THEN : 2.1.21
ELSE : 2.1.18
2.1.21 IF : The data source uses the minimum direction value to indicate calm conditions
THEN : 2.1.22
ELSE : 2.1.18
2.1.22 IF : The corresponding parameter value for speed has a value of zero
THEN : 2.1.18
ELSE : 2.1.23
2.1.23 IF : The identifier of the profile is known
THEN : 2.1.25
ELSE : 2.1.24

IOC Manuals and Guides, 22 Rev.
Annex B – page 49
2.1.24 : Display the identifier, speed and direction for the profile with the suspect value
: Display the identifier, speed and direction for other stations in the incoming file and
in the neighbourhood of the profile in question and at the same depth as the suspect
value
: 2.1.26
2.1.25 : Display the identifier, speed and direction for the profile with the suspect value
: Display the identifier, speed and direction for all other stations with the same
identifier in the incoming file and at the same depth as the suspect value
: 2.1.26
2.1.26 IF : The user chooses to infer the speed and/or direction
THEN : 2.1.30
ELSE : 2.1.27
2.1.27 IF : The user chooses to flag the value as doubtful
THEN : 2.1.28
ELSE : 2.1.29
2.1.28 : Set the quality flag on the value to be "3", doubtful
: Clear MARK
: Test the next parameter
2.1.29 : Notify the user that the quality flag is set to erroneous
: Set the quality flag on the value to be "4", erroneous
: Clear MARK
: Test the next parameter
2.1.30 IF : The user chooses to accept an inference
THEN : 2.1.32
ELSE : 2.1.31
2.1.31 IF : The user chooses to try again
THEN : 2.1.26
ELSE : 2.1.27
2.1.32 : Preserve the original value of speed and/or direction
: Reset the speed and/or direction to the new value(s)
: Set the quality flag on the speed and/or direction to "5", changed Clear MARK
: Test the next parameter

IOC Manuals and Guides, 22 Rev.
Annex B – page 50
Test 2.1 Global Impossible Parameter Values
Part 1

IOC Manuals and Guides, 22 Rev.
Annex B – page 51
Test 2.1 Global Impossible Parameter Values
Part 2

IOC Manuals and Guides, 22 Rev.
Annex B – page 52
Test Name: 2.2 Regional Impossible Parameter Values
Prerequisites :All of Stage 1 tests
: Global Impossible Parameter Values Test.
: The data should be sorted by identifier. For each unique identifier, the data
should be sorted by increasing observation date and time ignoring any quality
flags.
: All directional values should be converted on input to values between 0 and
360 degrees with north being zero degrees and east being 90 degrees.
Description:
This test allows for a more precise examination of parameter values based on the geographic
region in which the observation was made. To begin, the quality flags on the latitude and
longitude are examined. If either is flagged as erroneous, the data from the next station are
examined. If the position is not erroneous, and the station lies within the boundaries of a
geographic region given in table 2.2, then the parameter value is tested against values given
in the same table. If no test is given, the data at the next station are tested. If the data lie
within a region defined in Table 2.2, the same rules, and logic is used as in the Global
Impossible Parameter Test.
Table 2.2 Regional Impossible Parameter Values
Region Name Location
Mediterranean Sea 30N,6W; 30N,40E; 40N,35E; 42N,20E; 50N,15E; 40N,5E; 30N,6W
Parameter Min Max Units
Water temperature 13.0 40.0 degrees
Salinity 0 40 psu
Depth/sounding 0 5200 m
Region Name Location
Red Sea 10N,40E; 20N,50E; 30N,30E; 10N,40E
Parameter Min Max Units
Water temperature 21.7 40.0 degrees
Salinity 0 40 psu
Depth/sounding 0 3500 m
History: None
Rules:
2.2.1 IF : The latitude or longitude has a quality flag of erroneous
THEN : Test the next station
ELSE : 2.2.2
2.2.2 IF : The station lies within a region(s) defined in table 2.2
THEN : 2.2.3
ELSE : Test the next station
2.2.3 : (Execute the rules of the Global Impossible Parameter Test)

IOC Manuals and Guides, 22 Rev.
Annex B – page 53
Test 2.2 Impossible Regional Parameter Value

IOC Manuals and Guides, 22 Rev.
Annex B – page 54
Test Name: 2.3 Increasing Depth
Prerequisites : All of Stage 1 tests
: Depths are ordered from shallowest to deepest in a profile.
Description:
These rules test if the depths of the observations are monotonically increasing. DEPTH1
always refers to the depth being examined, DEPTH2 to another depth at the station. The test
begins by determining if there is more than one depth in the profile. If not, the next profile is
examined. If there is more than one depth, DEPTH1 is set to the first depth and the quality
flag is examined. If this quality flag is set to erroneous, DEPTH1 is tested to determine if it is
the deepest in the profile. If it is, the next profile is examined. If it is not, DEPTH1 is set to
the next depth, and this test of the quality flag repeated. If DEPTH1 is not indicated as
erroneous, DEPTH2 is set to be the next depth and the quality flag on it is tested. If it is set as
erroneous, DEPTH2 is tested if it is the deepest. If so, the next profile is examined. If not,
DEPTH2 is set to the next depth and the test of the quality flags repeated. If the quality flag is
not set to erroneous, DEPTH2 is tested to be greater than DEPTH1. If it is greater, DEPTH1
is set to DEPTH2. Then, DEPTH2 is tested to determine if it is the deepest in the profile as
described above. If DEPTH2 is not greater than DEPTH1, the user can flag DEPTH2 as
doubtful or erroneous. In either case, DEPTH1 is set to DEPTH2 and the process repeats
down the profile until the deepest depth is tested. At this point, the next profile is tested.
History: None
Rules:
2.3.1 IF : There is more than 1 depth in the profile
THEN : 2.3.2
ELSE : Test the next profile
2.3.2 : Set DEPTH1 to be the first depth
: 2.3.3
2.3.3 IF : The value of DEPTH1 has a quality flag set to be erroneous
THEN : 2.3.4
ELSE : 2.3.6
2.3.4 IF : DEPTH1 is the deepest depth in the profile
THEN : Test the next profile
ELSE : 2.3.5
2.3.5 : Set DEPTH1 to be the next depth in the profile
: 2.3.3
2.3.6 : Set DEPTH2 to be the next depth in the profile
: 2.3.7

IOC Manuals and Guides, 22 Rev.
Annex B – page 55
2.3.7 IF : The value of DEPTH2 has a quality flag set to be erroneous
THEN : 2.3.8
ELSE : 2.3.9
2.3.8 IF : DEPTH2 is the deepest depth in the profile
THEN : Test the next profile
ELSE : 2.3.6
2.3.9 IF : DEPTH2 is deeper than DEPTH1
THEN : 2.3.10
ELSE : 2.3.11
2.3.10 : Change the quality flag on the depth from "0", unchecked, to >"1", correct
: Set DEPTH1 = DEPTH2
: 2.3.8
2.3.11 IF : The user chooses to flag DEPTH2 as doubtful
THEN : 2.3.12
ELSE : 2.3.13
2.3.12 : Set the quality flag on DEPTH2 to "3", doubtful
: Set DEPTH1 = DEPTH2
: 2.3.8
2.3.13 : Notify the user that the value is flagged as erroneous
: Set the quality flag on DEPTH2 to "4", erroneous
: Set DEPTH1 = DEPTH2
: 2.3.4

IOC Manuals and Guides, 22 Rev.
Annex B – page 56
Test 2.3 Increasing Depth

IOC Manuals and Guides, 22 Rev.
Annex B – page 57
Test Name: 2.4 Global Profile Envelop
Prerequisites : All of Stage 1 tests
: Global Impossible Parameter Value test.
: Parameter values are ordered from shallowest to deepest depth.
: Profiles are sorted by identifier, then increasing date and time for each
identifier.
Description:
These rules test if the observed values lie within an envelope of permitted values within depth
ranges. It begins by ensuring that the first parameter recorded at a station has a defined
envelope. If not, it tests if there is another parameter at the station to test. If not, the next
station is tested. If there is another parameter at the station, it is tested to see if there is a
defined envelope as just described.
If an envelope is defined for the parameter profile under consideration, the quality flag for the
first depth is examined. If it is set to erroneous, the depth is tested to see if it is the deepest. If
so the station is tested to see if there is another parameter to be tested. If the depth is not the
deepest, the depth is set to be the next, and the quality flag on the depth is tested as described.
If the quality flag on the depth is not set to erroneous, the quality flag on the parameter value
is examined. If it is set to erroneous, the depth is examined to see if it is the deepest.
If the parameter flag is not set to erroneous, the parameter value is tested to lie within the
envelope defined in table 2.4. If it lies within, the depth is tested if it is the deepest. If the
value lies outside of the envelope the identifier of the station is examined to see if it is
known. If not, the entire parameter profile and quality flags are displayed. The parameter
values and quality flags at the same depth and at stations in the neighbourhood of the station
with the suspect value are also displayed. If the identifier is known, the same information as
above is displayed but now for stations with the same identifier as the station with the suspect
value. The user can then choose to infer the value of the suspect parameter.
If the user chooses to infer the value, it may be flagged as doubtful. If this is selected, the
quality flag on the value is set to be doubtful, and the depth tested to determine if it is the
deepest. If the user rejects flagging the value as doubtful, it is flagged as erroneous, and the
depth tested as just described.
The user may choose to infer the value, the results are displayed and then may choose to
accept it or not. If accepted, the old value is preserved, the new value substituted for it and
the quality flag set to changed. If the user rejects the choice, they may choose to try again or
flag the profile as doubtful.
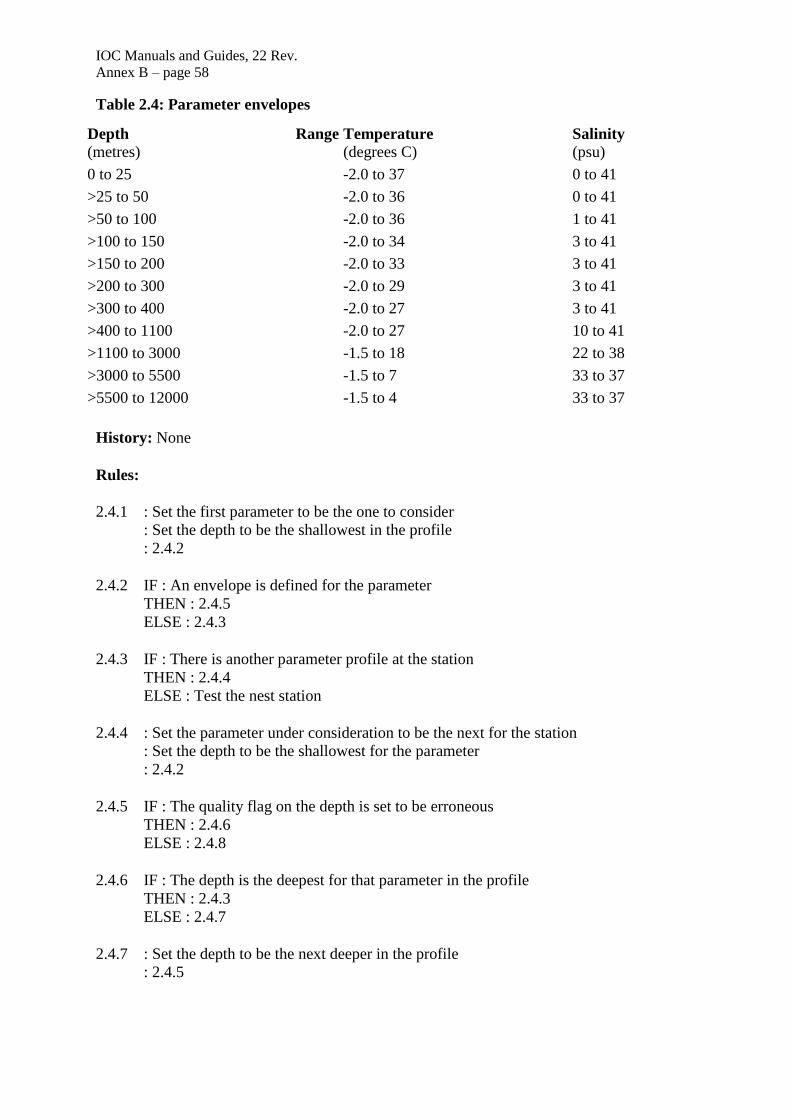
IOC Manuals and Guides, 22 Rev.
Annex B – page 58
Table 2.4: Parameter envelopes
Depth Range
(metres) Temperature
(degrees C) Salinity
(psu)
0 to 25 -2.0 to 37 0 to 41
>25 to 50 -2.0 to 36 0 to 41
>50 to 100 -2.0 to 36 1 to 41
>100 to 150 -2.0 to 34 3 to 41
>150 to 200 -2.0 to 33 3 to 41
>200 to 300 -2.0 to 29 3 to 41
>300 to 400 -2.0 to 27 3 to 41
>400 to 1100 -2.0 to 27 10 to 41
>1100 to 3000 -1.5 to 18 22 to 38
>3000 to 5500 -1.5 to 7 33 to 37
>5500 to 12000 -1.5 to 4 33 to 37
History: None
Rules:
2.4.1 : Set the first parameter to be the one to consider
: Set the depth to be the shallowest in the profile
: 2.4.2
2.4.2 IF : An envelope is defined for the parameter
THEN : 2.4.5
ELSE : 2.4.3
2.4.3 IF : There is another parameter profile at the station
THEN : 2.4.4
ELSE : Test the nest station
2.4.4 : Set the parameter under consideration to be the next for the station
: Set the depth to be the shallowest for the parameter
: 2.4.2
2.4.5 IF : The quality flag on the depth is set to be erroneous
THEN : 2.4.6
ELSE : 2.4.8
2.4.6 IF : The depth is the deepest for that parameter in the profile
THEN : 2.4.3
ELSE : 2.4.7
2.4.7 : Set the depth to be the next deeper in the profile
: 2.4.5

IOC Manuals and Guides, 22 Rev.
Annex B – page 59
2.4.8 IF : The quality flag on the parameter is set to erroneous
THEN : 2.4.6
ELSE : 2.4.9
2.4.9 IF : The parameter value lies within the envelope defined in table 2.4
THEN : 2.4.6
ELSE : 2.4.10
2.4.10 IF : The identifier of the station is known
THEN : 2.4.11
ELSE : 2.4.12
2.4.11 : Display the identifier, parameter values and quality flags at all depths in the profile
under consideration
: Display the identifier, parameter values and quality flags at the same depth as the
suspect value at all stations with the same identifier as the suspect station
: 2.4.13
2.4.12 : Display the identifier, parameter values and quality flags at all depths in the profile
under consideration
: Display the identifier, parameter values and quality flags at the same depth as the
suspect value at all stations in the neighbourhood of the suspect station
: 2.4.13
2.4.13 IF : The user chooses to infer the parameter value
THEN : 2.4.17
ELSE : 2.4.14
2.4.14 IF : The user chooses to flag the value as doubtful
THEN : 2.4.15
ELSE : 2.4.16
2.4.15 : Set the quality flag on the value to "3", doubtful
: 2.4.6
2.4.16 : Set the quality flag on the value to "4", erroneous
: 2.4.6
2.4.17 IF : The user chooses to accept an inference
THEN : 2.4.19
ELSE : 2.4.18
2.4.18 IF : The user chooses to try again
THEN : 2.4.13
ELSE : 2.4.14
2.4.19 : Preserve the original value of the parameter
: Reset the parameter value to the new value
: Set the quality flag on the parameter to "5", changed
: 2.4.6

IOC Manuals and Guides, 22 Rev.
Annex B – page 60
Test 2.4 Global Profile Envelope

IOC Manuals and Guides, 22 Rev.
Annex B – page 61
Test Name: 2.5 Constant Profile
Prerequisites : All of Stage 1 tests.
: Global Impossible Parameter Value test.
: Profiles sorted by identifier and by increasing date and time for each identifier.
: Depths are ordered from shallowest to deepest.
Description:
The test is applied in two forms to data received through the GTS. The first applies to those
stations that have data digitized at inflection points. If not digitized at inflection points, the
second form of the test is applied.
If the data were digitized at inflection points, then there must be observations at more than 2
depths. If not, the next profile is examined. If there are more than two depths, DEPTH1 is set
to be the first depth, DEPTH2 the next depth and DEPTH3 the next depth. VALUE1,
VALUE2 and VALUE3 are set to be the values of the parameter at the depths just defined. If
any of the quality flags at the three depths is set to be erroneous, DEPTH3 is tested to
determine if it is the deepest. If so, the next profile is tested. If not, DEPTH1 is set to
DEPTH2, DEPTH2 is set to DEPTH3, VALUE1 is set to VALUE2 and VALUE2 is set to
VALUE3. DEPTH3 is set to the next depth in the profile and VALUE3 to the value of the
parameter at the new DEPTH3. Then the quality flags on the depths are tested as described
before.
If none of the quality flags on the three depths is set to be erroneous, the same test is applied
to the quality flags on the corresponding three parameter values. If any one is set to be
erroneous, DEPTH3 is tested to be the deepest in the profile with subsequent actions
described above. If none are set to be erroneous, then the three values are tested to determine
if they are all identical. If they are not, DEPTH3 is tested to be deepest in the profile. If they
are all the same, the profile identifier is tested to determine if it is known. If known, the entire
parameter-depth profile with quality flags is displayed. As well, the parameter values at other
stations with the same identifier and in the same depth range as DEPTH2 are displayed. If the
identifier is not known, the profile is displayed as described above. As well, the parameter
values from other profiles in the neighbourhood of the profile under consideration and in the
same depth range as DEPTH2 are displayed. In either case, the user is then asked if the
parameter value at DEPTH2 should be inferred. If so, the user makes the inference and may
accept. If accepted, the original value is preserved, the new value substituted, the quality flag
on the parameter value at DEPTH2 is set to "5", changed, and then the DEPTH3 is tested to
be the deepest in the profile. If no inference is accepted, the user can choose to set the quality
flag on the value to be doubtful or erroneous or not at all. If they choose to set a flag, this is
done and DEPTH3 tested to see if it is the deepest in the profile.
If the data were digitized at selected depths, then the profile is examined to determine if there
is more than one observation in the profile. If not, the next profile is examined. If there is,
DEPTH1 is set to the first depth, DEPTH2 to the next depth, and parameter values, VALUE1
and VALUE2, set to the values of the parameters at DEPTH1 and DEPTH2. If any of the
quality flags on the two depths is set to be erroneous, then DEPTH2 is examined to see if it is
the deepest in the profile. If it is, a marker is examined to see if it indicates the parameter
values are the same at all depths. If not, the next profile is examined. If the marker has been

IOC Manuals and Guides, 22 Rev.
Annex B – page 62
set, that is all values are the same in the profile, then all quality flags on parameter values
which are not set to erroneous are set to doubtful, and the next profile examined.
If DEPTH2 is not the deepest in the profile, DEPTH1 is set to DEPTH2, DEPTH2 to the next
depth in the profile and the corresponding parameter values are reset. Then the test of the
quality flags on the depths is conducted.
If neither of the quality flags on the depths is set to be erroneous, the quality flags on
VALUE1 and VALUE2 are examined to see if either is set to be erroneous. If one is,
DEPTH2 is tested to be the deepest in the profile, and actions proceed as described above. If
neither flag is set to be erroneous, the two values are tested to determine if they are equal. If
not, the next profile is tested. If they are, a marker is set, indicating the two parameter values
are identical. Then DEPTH2 is tested to see if it is the deepest. The test then proceeds as
described above.
History: Modified July 1994 to not require value to be flagged as doubtful or erroneous.
Rules:
2.5.1 IF : The data were digitized at inflection points
THEN : 2.5.2
ELSE : 2.5.20
2.5.2 IF : There are observations at more than 2 depths in the profile
THEN : 2.5.3
ELSE : Test the next profile
2.5.3 : Set DEPTH1 to the first depth in the profile, DEPTH2 to be the next depth and
DEPTH3 to be the next depth
: Set VALUE1 to the parameter value at the first depth in the profile, VALUE2 to the
parameter value at the next depth and VALUE3 to be the parameter value at the next
depth
: 2.5.4
2.5.4 IF : Any of DEPTH1, DEPTH2 or DEPTH3 have a quality flag set to erroneous
THEN : 2.5.5
ELSE :2.5.7
2.5.5 IF : DEPTH3 is the deepest in the profile
THEN : Test the next profile
ELSE : 2.5.6
2.5.6 : Set DEPTH1 = DEPTH2, DEPTH2 = DEPTH3, DEPTH3 = the next depth in the
profile
: Set VALUE1 = VALUE2, VALUE2 = VALUE3, VALUE3 = the parameter value at
the next depth in the profile
: 2.5.4

IOC Manuals and Guides, 22 Rev.
Annex B – page 63
2.5.7 IF : Any of VALUE1, VALUE2, VALUE3 have a quality flag set to erroneous
THEN : 2.5.5
ELSE : 2.5.8
2.5.8 IF : VALUE1 = VALUE2 = VALUE3
THEN : 2.5.10
ELSE : 2.5.5
2.5.10 IF : The profile identifier is known
THEN : 2.5.11
ELSE : 2.5.12
2.5.11 : Display the parameter values, depths and quality flags for the entire profile under
consideration
: Display the parameter values, depths, flags and observation times for all profiles
with the same identifier and in the same depth range as DEPTH2
: 2.5.13
2.5.12 : Display the parameter values, depths and quality flags for the entire profile under
consideration
: Display the parameter values, depths, flags and observation times for all profiles in
the neighbourhood of the profile under consideration and in the same depth range as
DEPTH2
: 2.5.13
2.5.13 IF : The user chooses to infer a value for VALUE2
THEN : 2.5.14
ELSE : 2.5.16
2.5.14 IF : The user accepts the inferred value
THEN : 2.5.15
ELSE : 2.5.16
2.5.15 : Infer the value for VALUE2
: Preserve the original value of the parameter
: Set the new value to be the inferred one
: Set the quality flag on the parameter value to be "5", changed
: 2.5.5
2.5.16 IF : The user chooses to flag VALUE2 as doubtful
THEN : 2.5.17
ELSE : 2.5.18
2.5.17 : Set the quality flag on VALUE2 to be "3", doubtful
: 2.5.5
2.5.18 IF : The user chooses to flag VALUE2 as wrong
THEN : 2.5.19
ELSE : 2.5.5

IOC Manuals and Guides, 22 Rev.
Annex B – page 64
2.5.19 : Notify the user that the quality flag has been set to erroneous
: Set the quality flag on VALUE2 to be "4", erroneous
: 2.5.5
2.5.20 IF : There are observations at more than one depth in the profile
THEN : 2.5.21
ELSE : Test the next profile
2.5.21 : Set DEPTH1 to the first depth in the profile, DEPTH2 to be the next depth
: Set VALUE1 to the parameter value at the first depth in the >profile, VALUE2 to
the parameter value at the next depth
: 2.5.22
2.5.22 IF : Any of DEPTH1 or DEPTH2 have a quality flag set to erroneous
THEN : 2.5.23
ELSE : 2.5.25
2.5.23 IF : DEPTH2 is the deepest in the profile
THEN : 2.5.28
ELSE : 2.5.24
2.5.24 : Set DEPTH1 DEPTH2, and DEPTH2 = the next depth in the profile
: Set VALUE1 VALUE2, VALUE2 = to the parameter value at the next depth in the
profile
: 2.5.22
2.5.25 IF : Either of VALUE1 or VALUE2 have a quality flag set to erroneous
THEN : 2.5.23
ELSE : 2.5.26
2.5.26 IF : VALUE1 = VALUE2
THEN : 2.5.27
ELSE : Test the next profile
2.5.27 : Set MARK indicating that the last values examined were identical
: 2.5.23
2.5.28 IF : The MARK was set indicating the last values were identical
THEN : 2.5.29
ELSE : Test the next profile
2.5.29 : For all of the quality flags on parameter values in the profile which are not set to be
erroneous, set them to "3", doubtful
: Test the next profile

IOC Manuals and Guides, 22 Rev.
Annex B – page 65
Test 2.5 Constant Profile
Part 1

IOC Manuals and Guides, 22 Rev.
Annex B – page 66
Test 2.5 Constant Profile
Part 2

IOC Manuals and Guides, 22 Rev.
Annex B – page 67
Test Name: 2.6 Freezing Point Test
Prerequisites : All of Stage 1 tests.
: Global Impossible Parameter Value test.
: Sort by profile identifiers and date time in identifier.
Description:
This test if the observed temperature at a given depth and salinity is colder than the calculated
freezing point temperature. The algorithm for this is described below. It is expressed as a
relationship between temperature, salinity and pressure. Conversions of depth to pressure
may be made using the algorithm given in the reference below.
The test begins by determining if both temperature and salinity observations at the same
pressure exist for the profile. If not, the next station is tested. If so, the PRESSURE is set to
the first pressure, and TEMP and SAL set to the temperature and salinity values at
PRESSURE. The quality flags on both TEMP and SAL are examined. If either flag is set to
be erroneous, the pressure is tested to see if it is the deepest in the profile. If it is, test the next
station. If not, set PRESSURE, TEMP and SAL to the values at the next pressure and then
test the quality flags on TEMP and SAL.
If the quality flags on both TEMP and SAL are not set to be erroneous, then test the flag on
PRESSURE. If it is set to be erroneous, test if the pressure is the deepest in the profile and
continue as described above. If the quality flag on the pressure is not set to be erroneous, test
if the salinity lies within the range of 27 to 35 PSU. If not, test if the pressure is the deepest.
If the salinity is in the range, then calculate the freezing temperature based on the salinity and
pressure using the algorithm below. If the observed temperature is greater than or equal to the
calculated freezing temperature, then test if the pressure is the deepest in the profile. If the
observed temperature is less than the calculated freezing temperature, then test if the profile
identifier is known. If known, display the entire temperature and salinity profile, with quality
flags. As well, display the temperature and salinity values and quality flags from the same
pressure range as that under consideration and at the other profiles with the same identifier. If
the identifier is not known, display all of the same information, but this time from profiles in
the neighbourhood of the profile under consideration. Then, for either display ask the user if
they wish to infer the values for temperature and/or salinity. If so, infer the values, preserve
the original and set the quality flag to 5. The inferred value must lie within the permitted
Global Impossible Parameter Values. Then, test if the salinity lies within 27 to 35 PSU and
proceed as described above.
If the user chooses not to infer values, temperature and/or salinity values may be flagged as
doubtful or erroneous. In either case, the appropriate quality flag(s) is set and the pressure is
tested to determine if it is the deepest in the profile.
The inferred value is the calculated freezing temperature.

IOC Manuals and Guides, 22 Rev.
Annex B – page 68
Algorithm:
T = -0.0575*S + 1.710523E-3*S3/2
- 2.154996E-4*S2 - 7.53E-4*P
Where T is the calculated freezing point temperature,
S is the salinity in PSU and must lie between 27 and 35,
P is the pressure level in decibars of the observed salinity
Reference: UNESCO Technical Papers in Marine Science #44, Algorithms for Computation
of Fundamental Properties of Seawater, UNESCO, 1983.
History: None
Rules:
2.6.1 IF : There are both temperature and salinity profiles at the station
THEN : 2.6.2
ELSE : Test the next station
2.6.2 : Set PRESSURE to be the first pressure in the profile
: Set TEMP and SAL to be the temperature and salinity at PRESSURE
: 2.6.3
2.6.3 IF : Either TEMP or SAL has a quality flag set to be erroneous
THEN : 2.6.4
ELSE : 2.6.6
2.6.4 IF : PRESSURE is the deepest in the profile
THEN : Test the next station
ELSE : 2.6.5
2.6.5 : Set PRESSURE to be the next in the profile
: Set TEMP and SAL to be the temperature and salinity at PRESSURE
: 2.6.3
2.6.6 IF : The quality flag on PRESSURE is set to be erroneous
THEN : 2.6.4
ELSE : 2.6.7
2.6.7 IF : SAL lies between 27 and 35 PSU
THEN : 2.6.8
ELSE : 2.6.4
2.6.8 IF : TEMP is greater than or equal to the calculated freezing >point temperature
THEN : 2.6.4
ELSE : 2.6.9
2.6.9 IF : The identifier of the station is known
THEN : 2.6.11
ELSE : 2.6.10

IOC Manuals and Guides, 22 Rev.
Annex B – page 69
2.6.10 : Display the profiles of temperature and salinity by pressure with the associated
quality flags
: Display the values and flags of the temperature and salinity in the same pressure
range as PRESSURE for stations in the neighbourhood of the station under
consideration
: 2.6.12
2.6.11 : Display the profiles of temperature and salinity by pressure with the associated
quality flags
: Display the values and flags of the temperature and salinity in the same pressure
range as PRESSURE for stations with the same identifier as the station under
consideration
: 2.6.12
2.6.12 IF : The user chooses to infer a value for TEMP and/or SAL
THEN : 2.6.13
ELSE : 2.6.14
2.6.13 : Infer the value(s) for TEMP and/or SAL
: Preserve the original value(s) of TEMP and/or SAL
: Set the quality flag(s) on TEMP and/or SAL to be "5", changed
: 2.6.7
2.6.14 IF : The user chooses to flag TEMP and/or SAL as doubtful
THEN : 2.6.15
ELSE : 2.6.16
2.6.15 : Set the quality flag on TEMP and/or SAL to be "3", doubtful
: 2.6.4
2.6.16 : Notify the user that the quality flag on TEMP has been set to erroneous
: Set the quality flag on TEMP to "4", erroneous
: 2.6.4

IOC Manuals and Guides, 22 Rev.
Annex B – page 70
Test 2.6 Freezing Point Test

IOC Manuals and Guides, 22 Rev.
Annex B – page 71
Test Name: 2.7 Spike Test
Prerequisites : All of Stage 1 tests.
: Global Impossible Parameter Value test.
: Sort by profile identifiers and date time in identifier.
Description:
This test uses the procedures described in WMO/IOC Manuals and Guides #3 to determine if
a value in a profile represents a spike. Note that the threshold value for salinity has been
modified.
Algorithm:
If | V2 - (V3 + V1)/2| - |V1-V3| /2 > V_THRESHOLD
Then the V2 exceeds the spike test
Parameter Threshold
Temperature 2.0 degrees C
Salinity 0.3 PSU
History: None
Rules:
2.7.1 IF : There are observations at more than two depths in the profile
THEN : 2.7.2
ELSE : Test the next station
2.7.2 : Set DEPTH to be the first depth in the profile, DEPTH2 to be the next depth in the
profile and DEPTH3 to be the next depth
: Set VALUE1 to be the value of the parameter at DEPTH1, VALUE2 to be the value
of the parameter at DEPTH2 and VALUE3 to be the value of the parameter at
DEPTH3
: 2.7.3
2.7.3 IF : Any of DEPTH1, DEPTH2 or DEPTH3 have a quality flag set to be erroneous
THEN : 2.7.4
ELSE : 2.7.6
2.7.4 IF : DEPTH3 is the deepest in the profile
THEN : Test the next station
ELSE : 2.7.5
2.7.5 : Set DEPTH1 to DEPTH2, DEPTH2 to DEPTH3 and DEPTH3 to be the next in the
profile
: Set VALUE1 to VALUE2, VALUE2 to VALUE3 and VALUE3 to be the value of

IOC Manuals and Guides, 22 Rev.
Annex B – page 72
the parameter at DEPTH3
: 2.7.3
2.7.6 IF : The quality flag on VALUE1, VALUE2 or VALUE3 is set to be erroneous
THEN : 2.7.7
ELSE : 2.7.9
2.7.7 IF : There are any other parameters available for these depths
THEN : 2.7.8
ELSE : 2.7.4
2.7.8 : Set VALUE1, VALUE2, VALUE3 to be values of the next parameter at depths
DEPTH1, DEPTH2 and DEPTH3
: 2.7.6
2.7.9 IF : The VALUE2 exceeds the spike test described above
THEN : 2.7.10
ELSE : 2.7.7
2.7.10 IF : The identifier of the station is known
THEN : 2.7.11
ELSE : 2.7.12
2.7.11 : Display the profiles by depth with the associated quality flags
: Display VALUE2 and flags of the same parameter in the same depth range as
DEPTH2 for stations with the same identifier as the station under consideration
: 2.7.13
2.7.12 : Display the profiles by depth with the associated quality flags
: Display VALUE2 and flags of the same parameter in the same depth range as
DEPTH2 for stations in the neighbourhood of the station under consideration
: 2.3.13
2.7.13 IF : The user chooses to infer a value for VALUE2
THEN : 2.7.14
ELSE : 2.7.16
2.7.14 IF : The user chooses to accept the inferred value
THEN : 2.7.15
ELSE : 2.7.16
2.7.15 : Preserve the original value
: Substitute the new value
: Set the quality flag(s) on VALUE2 to be "5", changed
: 2.7.7
2.7.16 IF : The user chooses to flag VALUE2 as doubtful
THEN : 2.7.17
ELSE : 2.7.18

IOC Manuals and Guides, 22 Rev.
Annex B – page 73
2.7.17 : Set the quality flag on VALUE2 to be "3", doubtful
: 2.7.7
2.7.18 : Notify the user that the quality flag on VALUE2 has been set to erroneous
: Set the quality flag on VALUE2 to "4", erroneous
: 2.7.7

IOC Manuals and Guides, 22 Rev.
Annex B – page 74
Test 2.7 Spike Test

IOC Manuals and Guides, 22 Rev.
Annex B – page 75
Test Name: 2.8 Top and Bottom Spike
Prerequisites : All of Stage 1 tests.
: Global Impossible Parameter Value test.
: Profiles sorted by identifier and by increasing date and time for each
identifier.
Description:
This test examines the shallowest and deepest observations to see if there is a spike present.
To conduct the test, the depth and parameter values must not be flagged as erroneous. The
algorithm to test for a spike is described below.
The test starts by ensuring the profile under consideration has observations at more than one
depth. If not, the next station is tested. If there is more than one depth, DEPTH1 is set to the
shallowest depth and DEPTH2 to the next depth. VALUE1 and VALUE2 are set to be the
values of the first parameter in the station corresponding to DEPTH1 and DEPTH2.
The quality flags on the depths are examined next. If one of them is set to be erroneous, a
marker is examined to see if the top spike test was completed. If the marker is not set,
DEPTH2 is set to be the deepest depth in the profile, and DEPTH1 to be the next shallower
depth. VALUE1 and VALUE2 are set to be the values of the first parameter corresponding to
DEPTH1 and DEPTH2. At this time, the marker is set declaring the top spike test was
completed. The quality flags on the depths are then tested and action proceeds as described
above.
If the marker is set, the station is tested to see if there is another parameter available. If not,
the next station is examined. If there is another parameter, depths and values are set as
described later and processing continues to check the quality flags on the depths.
If neither of the quality flags on the depths is set to be erroneous, the quality flags on the
parameter values under consideration are examined. If either is set to be erroneous, the data
are examined to see if there is another parameter observed at the depths under consideration.
If not, the marker is set declaring the top spike test is complete. Processing then passes to
check this marker and action proceeds as described above. If there are other parameters,
VALUE1 and VALUE2 are set to be the parameter values of the next parameter at the depths
under consideration. Next the quality flags on the depths are tested and actions continue as
described above.
If neither of the parameter values under consideration have a quality flag set to be erroneous,
the values are examined to determine if there is a spike at the top or bottom (whichever is
being tested at the time). If there is no spike, other parameters at the same depths are looked
for and actions proceed as described previously.
If a spike is found, the identifier of the station is examined. If the identifier is known, the
entire profile of the parameter at the station is displayed along with the associated quality
flags. As well, the parameter values and flags in the same depth range at all other stations
with the same identifier are displayed. If the identifier is not known, the same information as
just described is displayed but this time the parameter values at all other stations in the
neighbourhood of the suspect profile are displayed. In either case, the user can choose to infer

IOC Manuals and Guides, 22 Rev.
Annex B – page 76
a correct value for either the surface value (for the top spike test) or the deepest value (for the
bottom spike test).
If the user chooses to infer the value, the results are displayed and, if the user accepts the
choice under consideration, the original value is preserved, the new value is inserted and the
quality flag on the value set to changed. The new value is then checked to be sure it does not
fail the spike test and action proceeds as described before. If the user rejects the inference,
they may try another.
If the user chooses not to infer a value, the value may be flagged as doubtful.
If the user chooses to flag the value as doubtful, the quality flag on the value is set to be
doubtful and the station is checked to see if there are more parameters at the station. If the
user chooses not to flag the value as doubtful, it is flagged as erroneous, and the station is
checked to see if there are more parameters.
Algorithm:
Top Spike
IF VDN < (Vl - V2) < VUP
then no spike is detected
Parameter VDN VUP Units
Temperature -10.0 10.0 degrees C.
Salinity -5.0 5.0 PSU
Bottom Spike
IF VDN < (V2 - Vl) < VUP
then no spike is detected
Parameter VDN VUP Units
Temperature -10.0 10.0 degrees C.
Salinity -5.0 5.0 PSU
History: None
Rules:
2.8.1 IF : There is more than 1 depth in the profile
THEN : 2.8.2
ELSE : Examine the next station
2.8.2 : Set P to be the first parameter with associated depths
: Set Z1 to be the shallowest depth for P
: Set Z2 to be the next shallowest depth for P
: Set VI to be the value of P at Z1
: Set V2 to be the value of P at Z2
: 2.8.3
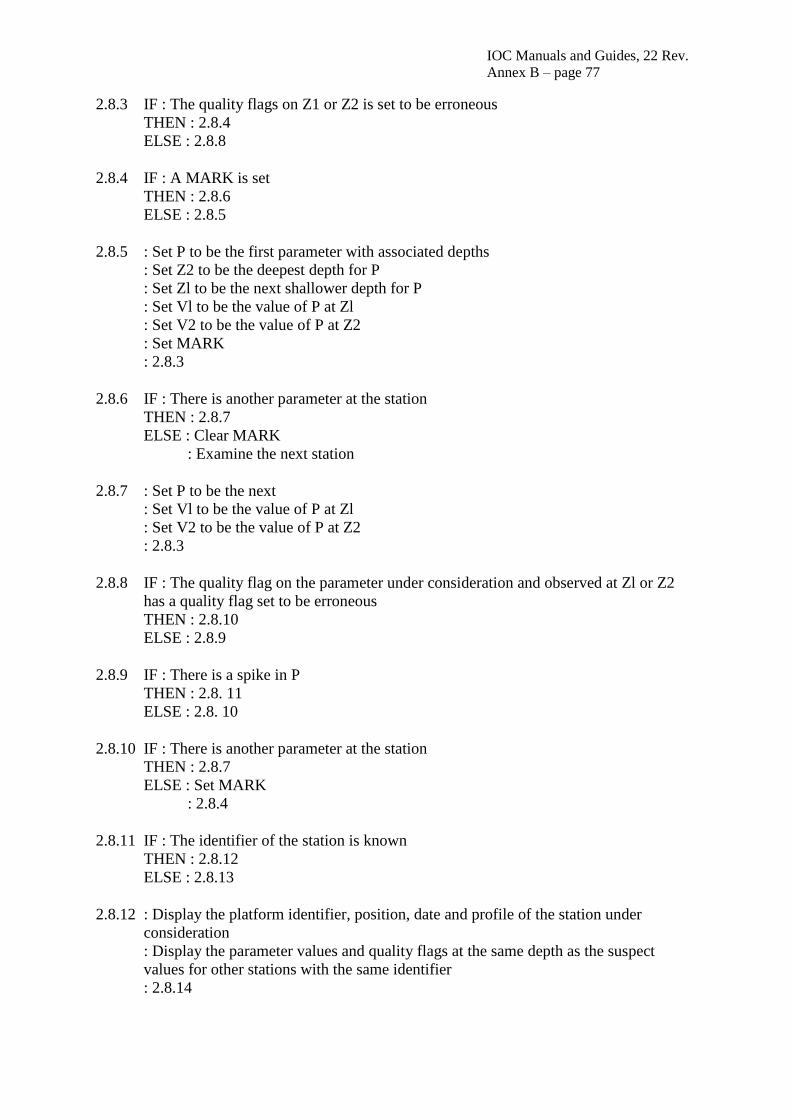
IOC Manuals and Guides, 22 Rev.
Annex B – page 77
2.8.3 IF : The quality flags on Z1 or Z2 is set to be erroneous
THEN : 2.8.4
ELSE : 2.8.8
2.8.4 IF : A MARK is set
THEN : 2.8.6
ELSE : 2.8.5
2.8.5 : Set P to be the first parameter with associated depths
: Set Z2 to be the deepest depth for P
: Set Zl to be the next shallower depth for P
: Set Vl to be the value of P at Zl
: Set V2 to be the value of P at Z2
: Set MARK
: 2.8.3
2.8.6 IF : There is another parameter at the station
THEN : 2.8.7
ELSE : Clear MARK
: Examine the next station
2.8.7 : Set P to be the next
: Set Vl to be the value of P at Zl
: Set V2 to be the value of P at Z2
: 2.8.3
2.8.8 IF : The quality flag on the parameter under consideration and observed at Zl or Z2
has a quality flag set to be erroneous
THEN : 2.8.10
ELSE : 2.8.9
2.8.9 IF : There is a spike in P
THEN : 2.8. 11
ELSE : 2.8. 10
2.8.10 IF : There is another parameter at the station
THEN : 2.8.7
ELSE : Set MARK
: 2.8.4
2.8.11 IF : The identifier of the station is known
THEN : 2.8.12
ELSE : 2.8.13
2.8.12 : Display the platform identifier, position, date and profile of the station under
consideration
: Display the parameter values and quality flags at the same depth as the suspect
values for other stations with the same identifier
: 2.8.14

IOC Manuals and Guides, 22 Rev.
Annex B – page 78
2.8.13 : Display the platform identifier, position, date and profile of the station under
consideration
: Display the parameter values and quality flags at the same depth as the suspect
values for other stations in the same region
: 2.8.14
2.8.14 IF : The user chooses to infer the value
THEN : 2.8.18
ELSE : 2.8.15
2.8.15 IF : The user chooses to flag the top or bottom observation as doubtful
THEN : 2.8.16
ELSE : 2.8.17
2.8.16 : Set the quality flag on the top or bottom observation to be "3", doubtful
: 2.8.10
2.8.17 : Notify the user that the quality flag on the top or bottom observation will be set to
"4", erroneous
: Set the quality flag on the top or bottom observation to be "4",erroneous
: 2.8.10
2.8.18 IF : The user chooses to accept an inference
THEN : 2.8.20
ELSE : 2.8.19
2.8.19 IF : The user chooses to try again
THEN : 2.8.14
ELSE : 2.8.15
2.8.20 : Preserve the original value and depth
: Substitute the inferred value
: Set the quality flag on the new value to be "5", changed
: 2.8.9

IOC Manuals and Guides, 22 Rev.
Annex B – page 79
Test 2.8 Top and Bottom Test
IOC Manuals and Guides, 22 Rev.
Annex B – page 80
Test Name: 2.9 Gradient Test
Prerequisites : All of Stage 1 tests.
: Global Impossible Parameter Value test.
: Profiles sorted by identifier and by increasing date and time for each
identifier.
Description:
This test checks that the gradient between two adjacent pairs of points does not exceed a
certain threshold given in table 2.9 below.
The test starts by ensuring the profile under consideration has observations at more than two
depths. If not, the next station is tested. If there are more than two depths, DEPTH1 is set to
be the first depth, DEPTH2 to be the next depth and DEPTH3 to be the next depth in the
profile. VALUE1, VALUE2 and VALUE3 are set to the values of the first parameter at the
corresponding depths. Next, the quality flags on the three depths are examined to see if any
one is set to be erroneous. If so, DEPTH3 is tested if it is the deepest in the profile. If so, the
next station is tested. If DEPTH3 is not the deepest, DEPTH1 is set to DEPTH2, DEPTH2 to
DEPTH3 and DEPTH3 to the next depth in the profile. Values for VALUE1, VALUE2 and
VALUE3 are set to be those for the first parameter at the corresponding depths. Next the
quality flags on the depth are examined and the actions are described above.
If none of the quality flags on the depths are set to be erroneous, the quality flags on the
values are examined. If any one of these is set to be erroneous, the station is examined to see
if there are other parameters not yet tested at the depths under consideration. If there are no
other parameters, DEPTH3 is tested to be the deepest and actions proceed as described
before. If there are other parameters, VALUE1, VALUE2 and VALUE3 are set to the values
of the next parameter at the depths under consideration. The quality flags on the depths are
tested as described above.
If none of the quality flags on the values is set to be erroneous, VALUE2 is tested to see if
the gradients between values above and below in the profile are reasonable. If they are, the
station is examined to see if there are other parameters not yet tested at the depths under
consideration. The resulting actions are described above.
If the gradient test fails, the identifier of the station is examined to determine if it is known. If
the identifier is known, the entire profile of the parameter at the station is displayed along
with the associated quality flags. As well, the parameter values and flags in the same depth
range at all other stations with the same identifier are displayed. If the identifier is not known,
the same information as just described is displayed but this time the parameter values at all
other stations in the neighbourhood of the suspect profile are displayed. In either case, the
user can then choose to infer a correct value for VALUE2.
If the user chooses not to infer a value, they may choose to flag the value as doubtful. If
accepted, the quality flag is set to be doubtful and processing checks if there are more
parameters at the given depths. If the user chooses not to flag the value as doubtful, it is
flagged as erroneous and checks are made if there are more parameters.
If the user chooses to infer a value they are presented with the results.

IOC Manuals and Guides, 22 Rev.
Annex B – page 81
If the user chooses to accept the inferred value, the original is preserved, the new value is
inserted and the quality flag on the value set to changed. The new value is then checked to
ensure it passes the gradient test.
Algorithm: IF (| V2 - (V1 + V3)/2 | > V_GRAD
then V2 fails the gradient test
Table 2.9
Parameter V_GRAD Units
Temperature 10 degrees C
Salinity 5 PSU
History: None
Rules:
2.9.1 IF : There are more than 3 depths
THEN : 2.9.2
ELSE : Examine the next station
2.9.2 : Set P to be the first parameter at the station
: Set DEPTH1, DEPTH2 and DEPTH3 to be the shallowest depths for P
: Set VALUE1, VALUE2 and VALUE3 to be the values of the parameters at the three
depths
: 2.9.3
2.9.3 IF : Any of the quality flags on the depths are set to be erroneous
THEN : 2.9.4
ELSE : 2.9.6
2.9.4 IF : DEPTH3 is the deepest depth available at the station
THEN : Examine the next station
ELSE : 2.9.5
2.9.5 : Set P to be the first parameter at the station
: Set DEPTH1 = DEPTH2, DEPTH2 = DEPTH3 and DEPTH3 to be the next in the
profile for P
: Set VALUE1, VALUE2 and VALUE3 to be the values of the parameters at the three
depths
: 2.9.3
2.9.6 IF : Any of the quality flags on the values are set to be erroneous
THEN : 2.9.7
ELSE : 2.9.9
2.9.7 IF : There are other parameters to be examined at the given set of depths
THEN : 2.9.8
ELSE : 2.9.4

IOC Manuals and Guides, 22 Rev.
Annex B – page 82
2.9.8 : Set P to be the next parameter at the station
: Set DEPTH1, DEPTH2 and DEPTH3 to be the shallowest depths for P
: Set VALUE1, VALUE2 and VALUE3 to be the values of the parameters at the three
depths
: 2.9.3
2.9.9 IF : The gradients of the values exceed the permitted thresholds
THEN : 2.9.10
ELSE : 2.9.7
2.9.10 IF : The identifier of the station is known
THEN : 2.9.12
ELSE : 2.9.11
2.9.11 : Display the platform identifier, position, date and profile of the station under
consideration
: Display the parameter values and quality flags at the same depth as the suspect
values for other stations in the same region
: 2.9.13
2.9.12 : Display the platform identifier, position, date and profile of the station under
consideration
: Display the parameter values and quality flags at the same depth as the suspect
values for other stations with the same identifier
: 2.9.13
2.9.13 IF : The user chooses to infer the value
THEN : 2.9.17
ELSE : 2.9.14
2.9.14 IF : The user chooses to flag VALUE2 as doubtful
THEN : 2.9.15
ELSE : 2.9.16
2.9.15 : Set the quality flag on VALUE2 to be "3", doubtful
: 2.9.7
2.9.16 : Notify the user that the quality flag on VALUE2 will be set to "4", erroneous
: Set the quality flag on VALUE2 to be "4", erroneous
: 2.9.7
2.9.17 IF : The user chooses to accept an inference
THEN : 2.9.19
ELSE : 2.9.18
2.9.18 IF : The user chooses to examine another inference
THEN : 2.9.13
ELSE : 2.9.14
IOC Manuals and Guides, 22 Rev.
Annex B – page 83
2.9.19 : Preserve the original value and depth
: Substitute the inferred value
: Set the quality flag on the new value to be "5", changed
: 2.9.9

IOC Manuals and Guides, 22 Rev.
Annex B – page 84
Test 2.9 Gradient Test

IOC Manuals and Guides, 22 Rev.
Annex B – page 85
Test Name: 2.10 Density Inversion Test
Prerequisites : All of Stage 1 tests.
: Global Impossible Parameter Value test.
: Profiles sorted by identifier and by increasing date and time for each
identifier.
Description:
This test checks that there is no density inversion as depth increases.
The test starts by ensuring the profile under consideration has observations at more than one
depth. If not, the next station is tested. If there is more than one depth, DEPTH1 is set to be
the first depth, and DEPTH2 to be the next depth. The quality flags on the depths are
examined to see if any one is set to be erroneous. If so, DEPTH2 is tested if it is the deepest
in the profile. If so, the next station is tested. If DEPTH2 is not the deepest, DEPTH1 is set to
DEPTH2, and DEPTH2 to the next depth in the profile.
If none of the quality flags on the depths are set to be erroneous, the profile is tested to ensure
that both a temperature and a salinity are present. If not, the depth is tested to determine if it
is the deepest. If both present, the quality flags on the temperature and salinity values are
examined. If any one of these is set to be erroneous, the station is examined to see if
DEPTH2 is the deepest depth and processing proceeds as already described.
If none of the quality flags on the values is set to be erroneous, the density is calculated at
DEPTH1 and DEPTH2 and compared. If the density at DEPTH2 is greater than or equal to
that at DEPTH1, DEPTH2 is tested to see if it is the deepest in the profile.
If the density at the deeper depth is less than that at the shallower depth, the identifier of the
station is examined to determine if it is known. If the identifier is known, the temperature,
salinity and density profiles at the station are displayed along with the associated quality
flags. As well, the same variables and flags in the same depth range at all other stations with
the same identifier are displayed. If the identifier is not known, the same information as just
described is displayed but this time the parameter values at all other stations in the
neighbourhood of the suspect profile are displayed. In either case, the user can then choose to
infer a correct value for VALUE2.
If the user chooses not to infer a value, they may choose to flag the value as doubtful. If
accepted, the quality flag is set to be doubtful and processing checks if there are more
parameters at the given depths. If the user chooses not to flag the value as doubtful, it is
flagged as erroneous and DEPTH2 then checked to determine if it the deepest in the profile.
If the user chooses to infer a value, the user is presented with the results.
If the user chooses to accept the inferred value, the original is preserved, the new value is
inserted and the quality flag on the value set to changed. The new value is then checked to
ensure it passes the density inversion test.

IOC Manuals and Guides, 22 Rev.
Annex B – page 86
History: None
Rules:
2.10.1 IF : There is more than 1 depth
THEN : 2.10.2
ELSE : Examine the next station
2.10.2 : Set DEPTH1, and DEPTH2 to be the shallowest depths
: 2.10.3
2.10.3 IF : Any of the quality flags on the depths are set to be erroneous
THEN : 2.10.4
ELSE : 2.10.6
2.10.4 IF : DEPTH2 is the deepest depth available at the station
THEN : Examine the next station
ELSE : 2.10.5
2.10.5 : Set DEPTH1 = DEPTH2, and DEPTH2 to be the next depth
: 2.10.3
2.10.6 IF : Both a temperature and salinity observation are present at DEPTH1 and DEPTH2
THEN : 2.10.7
ELSE : 2.10.4
2.10.7 IF : Any of the quality flags on the temperatures or salinities are set to be erroneous
THEN : 2.10.4
ELSE : 2.10.8
2.10.8 IF : The calculated density at DEPTH2 is less than that at DEPTH1
THEN : 2.10.9
ELSE : 2.10.4
2.10.9 IF : The identifier of the station is known
THEN : 2.10.11
ELSE : 2.10.10
2.10.10: Display the platform identifier, position, date and profile of the station under
consideration
: Display the parameter values and quality flags at the same depth as the suspect
values for other stations in the same region
: 2.10.12
2.10.11: Display the platform identifier, position, date and profile of the station under
consideration
: Display the parameter values and quality flags at the same depth as the suspect
values for other stations with the same identifier
: 2.10.12

IOC Manuals and Guides, 22 Rev.
Annex B – page 87
2.10.12 IF : The user chooses to infer the values of the temperature and salinity at DEPTH2
THEN : 2.10.16
ELSE : 2.10.13
2.10.13 IF : The user chooses to flag the temperature and/or salinity at DEPTH2 as doubtful
THEN : 2.10.14
ELSE : 2.10.15
2.10.14: Set the quality flag on the temperature and/or salinity to be >"3",doubtful
: 2.10.4
2.10.15: Set the quality flag on the temperature and/or salinity to be "4", erroneous
: 2.10.4
2.10.16 IF : The user chooses to accept an inference
THEN : 2.10.18
ELSE : 2.10.17
2.10.17 IF : The user chooses to examine another inference
THEN : 2.10.12
ELSE : 2.10.13
2.10.18: Preserve the original value and depth
: Substitute the inferred value
: Set the quality flag on the new value to be "5", changed
: 2.10.4

IOC Manuals and Guides, 22 Rev.
Annex B – page 88
Test 2.10 Density Inversion

IOC Manuals and Guides, 22 Rev.
Annex B – page 89
Test Name: 2.11 Bottom Test
Prerequisites: A bathymetry file
Description:
The test begins with the bathymetry file in the location of the station being examined to find
the maximum permitted depth at the station. In the case of the bathymetry file defined at
every 5 minutes of latitude and longitude, the 16 grid points surrounding the station location
are examined and the maximum permitted depth is set to the maximum depth found in these
16 grid points. Zerr is added to this maximum depth to take care of uncertainties near shore
and to compensate for depth uncertainties as measured by some instruments. Then the depth
of the deepest observation in the profile is examined. If the deepest observation depth is
shallower than the deepest bathymetric depth, the next station is tested.
If the observation depth exceeds the bathymetric depth, the user is asked to confirm that the
depth should be flagged as doubtful. If this is confirmed, the flag is set and the profile tested
to see if there is another depth in the profile. If there is, the profile depth is set to be the next
shallower depth in the profile and the test procedure performed once more. If there is no
shallower depth, the next station is tested.
If the user does not confirm that the depth should be flagged as doubtful, the profile is tested
to see if there is another depth and testing continues as described above.
Zerr = 50m.
History: None
Rules:
2.11.1 : Set Zmax = maximum depth from bathymetry + Zerr
: Z = deepest depth in the profile
: 2.11.2
2.11.2 IF : The quality flag of Z is equal to 4
THEN : 2.11.4
ELSE : 2.11.3
2.11.3 IF : Z is greater than Zmax
THEN : 2.11.5
ELSE : Go to the next station
2.11.4 IF : There are any shallower depths in the profile
THEN : 2.11.7
ELSE : Go to the next station
2.11.5 IF : The user chooses to flag Z as doubtful
THEN : 2.11.6
ELSE : 2.11.4
IOC Manuals and Guides, 22 Rev.
Annex B – page 90
2.11.6 : Set the flag on Z to "3", doubtful
: 2.11.4
2.11.7 : Set Z = the next shallower depth
: 2.11.2

IOC Manuals and Guides, 22 Rev.
Annex B – page 91
Test 2.11 Bottom Test
IOC Manuals and Guides, 22 Rev.
Annex B – page 92
Test Name: 2.12 Temperature Inversion Test
Prerequisites: All of Stage 1 tests
Description:
This test operates by searching for both a local minimum and a local maximum occurring in a
temperature profile within a layer not more than 50 m in thickness. Neither the local
minimum nor maximum can occur at the top or bottom of the layer in consideration. Because
of expected variability in surface layers of the ocean, the test is not performed on
temperatures at depths less than 75 m. Likewise, because temperature inversion signatures
are expected in colder waters, the test is applied only to those profiles where no observed
temperature is less than 4 degrees C. Only those depth and temperature values which have
not been flagged as erroneous are tested.
The test begins by ensuring that there are at least four depths in the profile, since this is the
minimum number needed to meet the conditions of the test. If there are not, processing passes
to the next available temperature profile. If there are, Z1 is set to be the shallowest depth and
T1 to be the temperature at this depth at which both depth and temperature have not been
flagged as erroneous. Then Z1 is tested to be greater than 75 m. If not, the profile is examined
to find the next deeper depth at which both depth and temperature have not been flagged as
erroneous and Z1 is set to be this depth and T1 to be this temperature. The depth Z1 is again
tested to be greater than 75 m.
If Z1 is greater than 75 m, T1 is tested to be warmer than 4 degrees. If not, the test stops and
processing goes to the next temperature profile. If it is, the profile is examined to find the
next deeper depth at which both depth and temperature have not been flagged as erroneous
and Z2 is set to be this depth and T2 to be this temperature. T2 is now tested to be warmer
than 4 degrees. If not, the test stops and processing goes to the next temperature profile. If it
is, the profile is examined to find the next deeper depth at which both depth and temperature
have not been flagged as erroneous and Z3 is set to be this depth and T3 to be this
temperature. T3 is now tested to be warmer than 4 degrees. If not, the test stops and
processing goes to the next temperature profile.
If T3 is greater than 4 degrees, T2 is tested to be more than 0.1 degrees colder than the
average of T1 and T3. If it is, Z2 is stored in an array of local minima. The array of local
maxima is examined to see if there is a local maximum shallower than Z2. If there is not, the
profile is examined to find the next deeper depth at which both depth and temperature have
not been flagged as erroneous. If there is not, processing passes to the next temperature
profile. If there is, Z1 is set to Z2, T1 is set to T2, Z2 is set to Z3, T2 is set to T3, Z3 is set to
the next deeper Z, and T3 is set to be the temperature at this next depth. Then T3 is tested to
be warmer than 4 degrees. If not, the test stops and processing goes to the next temperature
profile.
If there exists a local maximum shallower than Z2, then the difference in depth is calculated
between the depth immediately shallower than the local maximum and the depth immediately
deeper than Z2 (and with a flag not set to be erroneous). If this depth is less than 50 m a
possible inversion has been found. If not, the profile is examined to find the next deeper
depth at which both depth and temperature have not been flagged as erroneous and
processing continues as described above.

IOC Manuals and Guides, 22 Rev.
Annex B – page 93
If a possible inversion is found, the user can choose to flag all temperatures at depths below
Z2 as erroneous, as doubtful or not at all. Once the flags are set, processing passes to the next
temperature profile.
If T2 is not more than 0.1 degrees colder than the average of T1 and T3 it is tested to be more
than 0.1 degrees warmer than the average of T1 and T3. If it is not, the profile is examined to
find the next deeper depth at which both depth and temperature have not been flagged as
erroneous and processing continues as described above.
If the temperature at T2 is 0.1 degrees warmer than the average of T1 and T3 a local
maximum has been found. Z2 is stored in an array of local maxima. The array of local
minima is examined to see if there is one shallower than Z2. If there is not, the profile is
examined to find the next deeper depth at which both depth and temperature have not been
flagged as erroneous and processing continues as described above.
If there exists a local minimum shallower than Z2, then the difference in depth is calculated
between the depth immediately shallower than the local minimum and the depth immediately
deeper than Z2 (and with a flag not set to be erroneous). If this depth difference is less than
50 m a possible inversion has been found. If not, the profile is examined to find the next
deeper depth at which both depth and temperature have not been flagged as erroneous and
processing continues as described above.
If a possible inversion has been found, processing continues as described above.
Table 2.12
Variable Value Description
MinZ 75 m the minimum depth before the test is applied.
MinT 4 degrees C the minimum temperature below which the test is not applied.
LayerZ 50 m the depth range over which an inversion must occur to fail the
test.
Tol 0.1 degrees C the tolerance permitted before a local minimum is detected
History: None
Rules:
2.12.1 IF : There are 4 or more depths in the profile which are not flagged as erroneous
THEN : 2.12.2
ELSE : Go to next temperature profile
2.12.2 : Set Z1 = shallowest depth
: T1 = temperature at the shallowest depth where Z, T quality flags not set to
erroneous
: 2.12.3
2.12.3 IF : Z1 > MinZ
THEN : 2.12.6
ELSE : 2.12.4

IOC Manuals and Guides, 22 Rev.
Annex B – page 94
2.12.4 IF : There is another deeper Z and T with quality flags not set to be erroneous
THEN : 2.12.5
ELSE : Test the next temperature profile
2.12.5 : Set Z1 = Z, T1 = T
: 2.12.3
2.12.6 IF : T1 > MinT
THEN : 2.12.7
ELSE : Test the next temperature profile
2.12.7 IF : There is another deeper Z and T with quality flags not set to be erroneous
THEN : 2.12.8
ELSE : Test the next temperature profile
2.12.8 : Set Z2 = Z, T2 = T
: 2.12.9
2.12.9 IF : T2 > MinT
THEN : 2.12.10
ELSE : Test the next temperature profile
2.12.10 IF : There is another deeper Z and T with quality flags not set to be erroneous
THEN : 2.12.11
ELSE : Test the next temperature profile
2.12.11: Set Z3 = Z, T3 = T
: 2.12.12
2.12.12 IF : T3 > MinT
THEN : 2.12.13
ELSE : Test the next temperature profile
2.12.13 IF : T2 < ( (T1+T3)/2) - Tol )
THEN : 2.12.14
ELSE : 2.12.21
2.12.14: Store Z2 as local minimum, Zmin
: 2.12.15
2.12.15 IF : There exists a local maximum, Zmax, above Z2
THEN : 2.12.16
ELSE : 2.12.23
2.12.16 IF: The difference in depth between the depth shallower than Zmax and the depth
deeper (and not flagged as erroneous) than Zmin is < LayerZ
THEN : 2.12.17
ELSE : 2.12.23

IOC Manuals and Guides, 22 Rev.
Annex B – page 95
2.12.17 IF : The user chooses to flag all temperatures at depths below Zmin as erroneous
THEN : 2.12.18
ELSE : 2.12.19
2.12.18: Set the quality flags of these temperatures to "4", erroneous
: Test the next temperature profile
2.12.19 IF : The user chooses to flag all temperatures at depths below Zmin as doubtful
THEN : 2.12.20
ELSE : 2.12.23
2.12.20: Set the quality flags of these temperatures to "3", doubtful
: Test the next temperature profile
2.12.21 IF : T2 > ( (T1+T3)/2) + Tol )
THEN : 2.12.22
ELSE : 2.12.23
2.12.22: Store Z2 as a local maximum
: 2.12.25
2.12.23 IF : There is another deeper Z, T with quality flags not set to erroneous
THEN : 2.12.24
ELSE : Test the next temperature profile
2.12.24: Set Z1 = Z2, Z2 = Z3, Z3 = next deeper Z
: T1 = T2, T2 = T3, T3 = temperature at next deeper Z
: 2.12.12
2.12.25 IF : There exists a local minimum shallower than Z2
THEN : 2.12.26
ELSE : 2.12.23
2.12.26 IF : The difference in depth between the depth shallower than Zmin and the depth
deeper (and not flagged as erroneous) than Zmax is < LayerZ
THEN : 2.12.17
ELSE : 2.12.23

IOC Manuals and Guides, 22 Rev.
Annex B – page 96
Test 2.12 Temperature Inversion

IOC Manuals and Guides, 22 Rev.
Annex B – page 97
Test Name: 3.1 Levitus Seasonal Statistics
Prerequisites : All of Stage 1 tests.
: Global Impossible Parameter Value test.
: Profiles should be sorted by latitude and longitude.
Description:
This test determines if the temperature and salinity observations lie within certain ranges of
the mean value given by the Levitus Seasonal Statistics Atlas. If the profile lies close to land
and the depth is less than 50 metres, the observed value should lie within 5 standard
deviations of the mean value. For all other locations the observed value should lie within 3
standard deviations.
The test begins by checking that the quality flags on neither the latitude nor the longitude are
set to be erroneous. If they are the next station is tested. If not, the test starts by setting the
first depth under consideration to be the shallowest in the profile. The station is tested to
determine if there is a temperature value at the depth in question. If there is not, the station is
tested to see if there is a salinity observation. If there is no salinity, the depth is tested to
determine if it is the deepest available in the profile. If it is, the next station is tested. If the
depth is not the deepest, the next depth is examined and a marker is cleared. This marker is
used to indicate that the last variable tested was salinity. Again the station is tested to
determine if there is a temperature at the new depth.
If there is a temperature observation at the depth, the parameter value is set to the observed
temperature and the quality flag on the depth is tested. If the quality flag is set to be
erroneous, the climatology test cannot be applied and so the depth is checked if it is the
deepest. Processing from this step proceeds as already described.
If the quality flag on the depth is not set to be erroneous, then the quality flag on the
parameter under consideration is checked. If this is set to be erroneous, the marker (described
above) is examined. If this marker has been set, the depth is examined to determine if it is the
deepest in the profile. If the marker has not been set, the station is tested to see if there exists
a salinity observation at the depth under consideration. If there is not, the depth is tested to
see if it is the deepest in the profile.
If there is a salinity observation, the parameter value is set to be the observed salinity and the
marker is set. Next the quality flag on the depth is tested and processing proceeds as
previously described.
If the parameter flag is not set to be erroneous, the location is tested to be within 1000
kilometres (this distance is defined by the way the mean values were calculated in the Levitus
atlas) of land. If it is, the depth is tested to see if it is less than 50 metres. If this is also true,
the parameter value is tested to see if it lies within 5 standard deviations of the climatological
mean at the station position and the given depth. If so, the marker is checked and action
proceeds as described before. If the observation exceeds the range, the parameter values are
displayed and processing continues as described later.
If the observation is not within 1000 kilometres of land or if it is not less than 50 metres, then
the parameter value is tested to see if it lies within 3 standard deviations of the climatological

IOC Manuals and Guides, 22 Rev.
Annex B – page 98
mean at the station position and the given depth. If this is true, the marker is checked and
processing proceeds as already described.
If the parameter value is outside of the prescribed limits, the parameter profile is displayed
along with the climatological mean and the appropriate standard deviation limit at the same
location. Parameter values at neighbouring stations within the same depth range are also
displayed. The user may then choose to set the quality flag on the parameter at the depth to be
inconsistent. If the flag is not already set to be inconsistent, the user must confirm the change
of the flag. If not confirmed, no action is taken. If confirmed, the quality flag is changed to
inconsistent. If the user chooses not to set the flag to be inconsistent, the user may choose not
to flag the value or to flag it as doubtful. No matter what action is performed against the
quality flag, afterwards the marker is checked and processing continues as already described
above.
History: Modified July 1994 to not require the user to flag a value as inconsistent.
Rules:
3.1.1 IF : Any one of the latitude or longitude has a quality flag set to be erroneous
THEN : Test the next station
ELSE : 3.1.2
3.1.2 : Set DEPTH to be the shallowest depth in the profile
: Set VALUE to be the value of the temperature observation at DEPTH
: 3.1.3
3.1.3 IF : There is a temperature observation at DEPTH
THEN : 3.1.8
ELSE : 3.1.4
3.1.4 IF : There is a salinity observation at DEPTH
THEN : 3.1.6
ELSE : 3.1.5
3.1.5 IF : DEPTH is the deepest in the profile
THEN : Test the next station
ELSE : 3.1.7
3.1.6 : Set the parameter value, VALUE, to be the observed salinity at DEPTH
: Set MARK to indicate that salinity is the parameter under consideration
: 3.1.9
3.1.7 : Set DEPTH to be the next deeper depth in the profile
: Clear MARK
: 3.1.3
3.1.8 : Set the parameter value, VALUE, to be the observed temperature at DEPTH
: 3.1.9

IOC Manuals and Guides, 22 Rev.
Annex B – page 99
3.1.9 IF : The quality flag on DEPTH is set to be erroneous
THEN : 3.1.5
ELSE : 3.1.10
3.1.10 IF : The quality flag on VALUE is set to be erroneous
THEN : 3.1.11
ELSE : 3.1.12
3.1.11 IF : MARK is set
THEN : 3.1.5
ELSE : 3.1.4
3.1.12 IF : The station is within 1000 km of the coast
THEN : 3.1.13
ELSE : 3.1.14
3.1.13 IF : DEPTH is less than 50 meters
THEN : 3.1.15
ELSE : 3.1.14
3.1.14 IF : VALUE1 lies within 3 standard deviations of the climatological mean DEPTH
and at the same location as the station
THEN : 3.1.11
ELSE : 3.1.16
3.1.15 IF : VALUE1 lies within 5 standard deviations of the climatological mean DEPTH
and at the same location as the station
THEN : 3.1.11
ELSE : 3.1.16
3.1.16 : Display the parameter profile in question
: Display the climatological mean and 3 or 5 standard deviations as appropriate
: Display parameter values in the same depth range for neighbouring stations
: 3.1.17
3.1.17 IF : The user chooses to flag VALUE as inconsistent
THEN : 3.1.18
ELSE : 3.1.21
3.1.18 IF : The quality flag on VALUE is already set to be inconsistent
THEN : 3.1.11
ELSE : 3.1.19
3.1.19 IF : The user confirms to change the quality flag from doubtful to inconsistent
THEN : 3.1.20
ELSE : 3.1.11
3.1.20 : Set the quality flag on VALUE at DEPTH to "2", inconsistent
: 3.1.11

IOC Manuals and Guides, 22 Rev.
Annex B – page 100
3.1.21 IF : The user chooses to flag VALUE as doubtful
THEN : 3.1.22
ELSE : 3.1.11
3.1.22 : Notify the user that the quality flag on VALUE will be set to doubtful
: Set the quality flag on VALUE at DEPTH to "3", doubtful
: 3.1.11

IOC Manuals and Guides, 22 Rev.
Annex B – page 101
Test 3.1 Levitus Seasonal Statistics

IOC Manuals and Guides, 22 Rev.
Annex B – page 102
Test Name: 3.2 Emery and Dewar Climatology
Prerequisites : All of Stage 1 tests.
: Global Impossible Parameter Value test.
: Profiles are sorted by latitude and longitude within the region covered by the
atlas. This is 10 degrees south to 60 degrees north latitude for both the Atlantic
and Pacific oceans. The Atlantic ocean stretches from 0 degrees west to 80
degrees west longitude. The Pacific Ocean extends from 80 degrees west to
120 degrees east longitude.
Description:
This test uses the Emery and Dewar climatology to test if the observed temperatures and
salinities lie within 3 standard deviations of the climatological mean. It also tests if a salinity
at a given temperature lies within 3 standard deviations of the climatological salinity at the
given temperature.
The test begins by ensuring that neither the latitude nor longitude has a quality flag set to be
erroneous. If one is set, the next station is tested. If both are fine, the depth is set to be the
shallowest in the profile and the quality flag is tested. If it is set to be erroneous, the testing
proceeds to Part 3.
If the quality flag on the depth is not set to be erroneous, but there is no temperature
observation at the depth, testing proceeds to Part 2. If there is a temperature, but the quality
flag is set to be erroneous, processing passes to Part 2. If the quality flag is not set to be
erroneous, the temperature is tested to be within 3 standard deviations of the climatological
mean at the given depth. If the observation lies within this limit, testing proceeds to Part 2.
If the temperature lies beyond 3 standard deviations from the mean, the temperature profile is
displayed. The climatological temperature profile and 3 standard deviations is also displayed.
As well, temperature values in the same depth range from neighbouring stations are
displayed. The user may then choose to flag the temperature as inconsistent. If he chooses not
to do so, the quality flag on the temperature is set to be doubtful and testing proceeds to Part
2.
If the user chooses to flag the temperature as inconsistent, but it has a quality flag assigned as
doubtful, the user must confirm the decision. If confirmed,, the flag is changed from doubtful
to inconsistent. If not confirmed, the flag remains as doubtful. If the flag was not already set
to be doubtful, the flag is set to be inconsistent as chosen by the user. In any case, the testing
then proceeds to Part 2.
Part 2 of the test checks if there is a salinity observation at the depth under consideration. If
not, the depth is checked to see if it is the deepest in the profile. If it is, testing proceeds to the
next station. If it is not, the depth is set to be the next deeper in the profile and the quality flag
on the depth tested. Actions proceed as described before.
If there is a salinity but its quality flag is set to be erroneous, the depth is tested to determine
if it is the deepest in the profile. Testing from this point proceeds as already described above.
If the quality flag on the salinity is not set to be erroneous, the value is tested to lie within 3
standard deviations of the climatological mean at the depth under consideration. The

IOC Manuals and Guides, 22 Rev.
Annex B – page 103
treatment of salinity is the same as previously described for temperature. After the quality
flag has been set, testing proceeds to Part 3.
Part 3 begins by testing if either the temperature or the salinity has a quality flag set to be
erroneous. If so, the depth is tested to determine if it is the deepest in the profile and actions
proceed as already described. If both values are fine, the salinity value is tested to lie within 3
standard deviations of the climatological mean salinity at the given temperature. If it does,
the depth is tested to determine if it is the deepest, and so on. If it lies outside of 3 standard
deviations, the temperature-salinity curve is displayed for the station. At the same time, the
climatological T-S curve and 3 standard deviations of salinity from the mean is displayed.
Finally, temperature and salinity values in the same depth range but at neighbouring stations
are displayed. The user may then choose to set the quality flags on the temperature and/or
salinity. Processing proceeds as described before. After the flags are set, the depth is tested to
determine if it is the deepest in the profile. Subsequent actions have already been described.
History: None
Rules:
3.2.1 IF : Any one of latitude, or longitude has a quality flag set to be erroneous
THEN : Test the next station
ELSE : 3.2.2
3.2.2 : Set DEPTH to be the shallowest depth in the profile
: 3.2.3
3.2.3 IF : The quality flag on DEPTH is set to be erroneous
THEN : 3.2.24
ELSE : 3.2.4
3.2.4 IF : There is a temperature observation at DEPTH
THEN : 3.2.5
ELSE : 3.2.13
3.2.5 IF : The quality flag on temperature is set to be erroneous
THEN : 3.2.13
ELSE : 3.2.6
3.2.6 IF : The temperature value lies within 3 standard deviations of the climatological
mean at the given depth for the given station location
THEN : 3.2.13
ELSE : 3.2.7
3.2.7 : Display the entire temperature profile with quality flags
: Display the climatological mean and 3 standard deviations
: Display temperature and quality flags in the same depth range from neighbouring
stations
: 3.2.8

IOC Manuals and Guides, 22 Rev.
Annex B – page 104
3.2.8 IF : The user chooses to set the quality flag on the temperature to be inconsistent
THEN : 3.2.10
ELSE : 3.2.9
3.2.9 : Notify the user that the quality flag on the temperature will be set to doubtful
: Set the quality flag on the temperature to "3", doubtful
: 3.2.13
3.2.10 IF : The quality flag on temperature is already set to be doubtful
THEN : 3.2.11
ELSE : 3.2.12
3.2.11 IF : The user confirms that the quality flag on temperature should be changed from
doubtful to inconsistent
THEN : 3.2.12
ELSE : 3.2.13
3.2.12 : Set the quality flag on the temperature to "2", inconsistent
: 3.2.13
3.2.13 IF : There is a salinity observation at DEPTH
THEN : 3.2.16
ELSE : 3.2.14
3.2.14 IF : Depth is the deepest in the profile
THEN : Test the next station
ELSE : 3.2.15
3.2.15 : Set DEPTH to be the next in the profile
: 3.2.3
3.2.16 IF : The quality flag on salinity is set to be erroneous
THEN : 3.2.14
ELSE : 3.2.17
3.2.17 IF : The salinity observation lies within 3 standard deviations of the climatological
mean at the given depth and location
THEN : 3.2.24
ELSE : 3.2.18
3.2.18 : Display the entire salinity profile with quality flags
: Display the climatological mean and 3 standard deviations
: Display salinity and quality flags in the same depth range from neighbouring stations
: 3.2.19
3.2.19 IF : The user chooses to set the quality flag on salinity to be inconsistent
THEN : 3.2.21
ELSE : 3.2.20

IOC Manuals and Guides, 22 Rev.
Annex B – page 105
3.2.20 : Notify the user that the quality flag on the salinity will be set to doubtful
: Set the quality flag on the salinity to "3", doubtful
: 3.2.24
3.2.21 IF : The quality flag on salinity is already set to be doubtful
THEN : 3.2.23
ELSE : 3.2.22
3.2.22 : Set the quality flag on the salinity to "2", inconsistent
: 3.2.24
3.2.23 IF : The user confirms that the quality flag on salinity should be changed from
doubtful to inconsistent
THEN : 3.2.22
ELSE : 3.2.24
3.2.24 IF : The quality flag on temperature is set to be erroneous
THEN : 3.2.14
ELSE : 3.2.25
3.2.25 IF : The quality flag on salinity is set to be erroneous
THEN : 3.2.14
ELSE : 3.2.26
3.2.26 IF : The salinity observation lies within 3 standard deviations of the climatological
salinity at the given temperature and location
THEN : 3.2.14
ELSE : 3.2.27
3.2.27 : Display the temperature-salinity profile with quality flags
: Display the climatological temperature-salinity profile and 3 standard deviations
: Display the temperature-salinity values and quality flags at the same depth range
from neighbouring stations
: 3.2.28
3.2.28 IF : The user chooses to set the quality flag on temperature and/or salinity to be
inconsistent
THEN : 3.2.30
ELSE : 3.2.29
3.2.29 : Notify the user that the quality flag on the temperature and/or salinity will be set to
doubtful
: Set the quality flag on the temperature and/or salinity to "3", doubtful
: 3.2.14
3.2.30 IF : The quality flag on temperature and/or salinity is already set to be doubtful
THEN : 3.2.32
ELSE : 3.2.31

IOC Manuals and Guides, 22 Rev.
Annex B – page 106
3.2.31 : Set the quality flag on the temperature and/or salinity to "2", inconsistent
: 3.2.14
3.2.32 IF : The user confirms that the quality flag on temperature and/or salinity should be
changed from doubtful to inconsistent
THEN : 3.2.31
ELSE : 3.2.14

IOC Manuals and Guides, 22 Rev.
Annex B – page 107
Test 3.2 Emery and Dewar Climatology
Part 1

IOC Manuals and Guides, 22 Rev.
Annex B – page 108
Test 3.2 Emery and Dewar Climatology
Part 2

IOC Manuals and Guides, 22 Rev.
Annex B – page 109
Test 3.2 Emery and Dewar Climatology
Part 3

IOC Manuals and Guides, 22 Rev.
Annex B – page 110
Test Name: 3.3 Asheville SST Climatology
Prerequisites: All of Stage 1 tests.
: Global Impossible Parameter Value test.
: The stations are sorted by latitude and longitude.
Description:
This test determines if the observed sea surface temperature lies within 3 standard deviations
of the Asheville climatological mean for the given location and month.
The test starts by determining if any one of the latitude, longitude or month has a quality flag
set to be erroneous. If so, the next station is tested. If not, but if there is no surface
observation, the next station is tested. If there is a sea surface temperature observation but it
has a quality flag set to be erroneous, the next station is tested.
If the surface temperature observation is fine, and it lies within 3 standard deviations of the
climatological mean for the given location and month, then the next station is tested. If the
observation lies outside of the limit, the surface value is displayed along with the
climatological mean, 3 standard deviations from the mean, and surface temperatures from
neighbouring stations. The user may then choose to set the quality flag to be inconsistent. If
not, the flag is set to be doubtful.
If the user chooses to set the flag to be inconsistent, but the present value is already set to be
doubtful, the user must confirm the flag be changed. If confirmed, the flag is changed from
doubtful to inconsistent, otherwise it is left unaltered. After the quality flag has been set, the
next station is tested.
History: None
Rules:
3.3.1 IF : Any one of latitude, longitude or month has a quality flag set to be erroneous
THEN : Test the next station
ELSE : 3.3.2
3.3.2 IF : There is an observation at the surface
THEN : 3.3.3
ELSE : Test the next station
3.3.3 IF : There is a surface temperature observation
THEN : 3.3.4
ELSE : Test the next station
3.3.4 IF : The quality flag on the temperature is set to be erroneous
THEN : Test the next station
ELSE : 3.3.5
3.3.5 IF : The temperature value lies within 3 standard deviations of the climatological
mean at the given location in the given month
IOC Manuals and Guides, 22 Rev.
Annex B – page 111
THEN : Test the next station
ELSE : 3.3.6
3.3.6 : Display the temperature and its quality flag
: Display the climatological temperature and 3 standard >deviations
: Display surface temperatures from neighbouring stations in the same month
: 3.3.7
3.3.7 IF : The user chooses to set the quality flag on the temperature to be inconsistent
THEN : 3.3.9
ELSE : 3.3.8
3.3.8 : Notify the user that the quality flag on the temperature will be set to be doubtful
: Set the quality flag on the temperature to "3", doubtful
: Test the next station
3.3.9 IF : The quality flag on the temperature is already set to be doubtful
THEN : 3.3. 11
ELSE : 3.3.10
3.3.10 : Set the quality flag on the temperature to be "2", inconsistent
: Test the next station
3.3.11 IF : The user confirms the quality flag should be changed from doubtful to
inconsistent
THEN : 3.3.10
ELSE : Test the next station
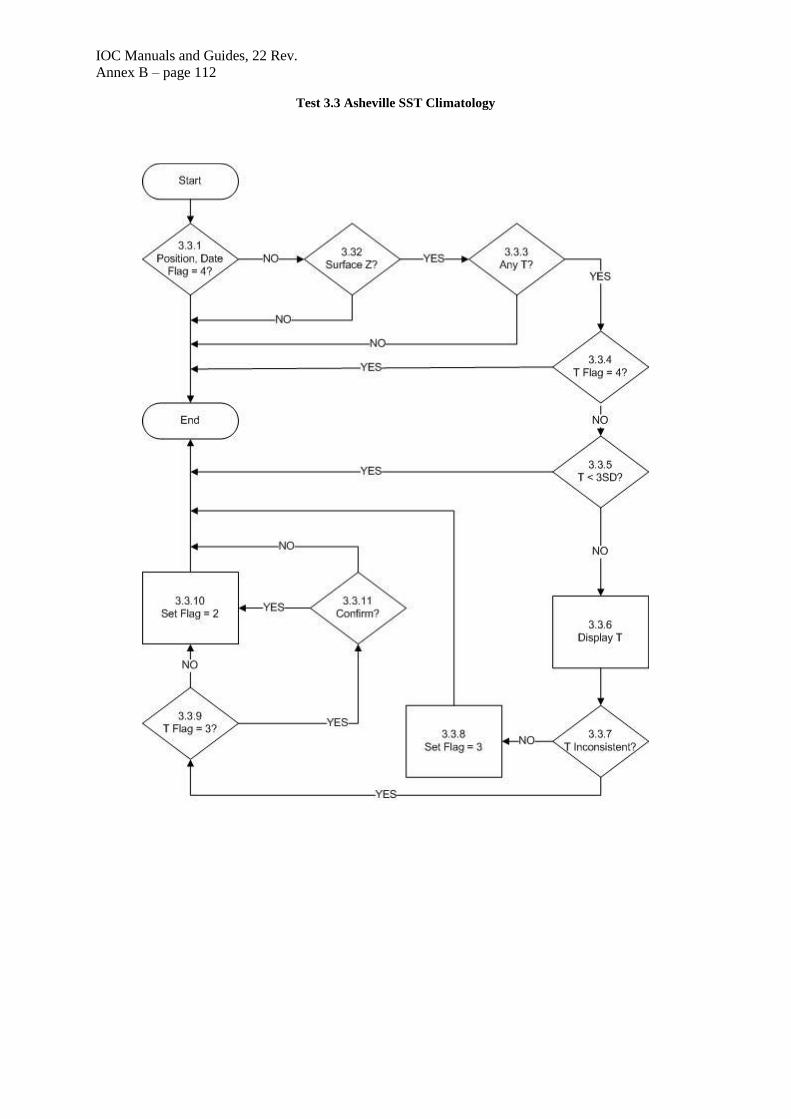
IOC Manuals and Guides, 22 Rev.
Annex B – page 112
Test 3.3 Asheville SST Climatology

IOC Manuals and Guides, 22 Rev.
Annex B – page 113
Test Name: 3.4 Levitus Monthly Climatology
Prerequisites : All of Stage 1 tests.
: Global Impossible Parameter Value test.
: The stations are sorted by latitude and longitude.
Description:
This test compares the mean and standard deviations of an observed profile to that of the
Monthly Levitus climatology of temperature and salinity. If the values derived from the
observations lie within a specified threshold then the observed profile is considered to have
passed. The thresholds are given in table 3.4 below.
The test begins by ensuring that the quality flag on the latitude, longitude and month are not
set to be erroneous. If any one is, the next station is tested. If not, the first depth is examined
and the parameter under consideration is set to be temperature, or salinity if there is no
temperature. The quality flag on the depth is tested to determine if it is set to be erroneous. If
so, the depth is tested to see if it is the deepest. If it is not the deepest, the depth is set to be
the next in the profile, the parameter to be the temperature or salinity as before and the flag
tested on the depth. If the depth is the deepest, profile properties are tested as will be
described later.
If the quality flag on the depth is not set to be erroneous. the quality flag on the parameter
under consideration is examined. If the flag is set to be erroneous, the station is examined to
determine if there is another parameter (salinity) available. If there is, the parameter value is
set to be that for the next parameter and the quality flag tested as just described. If there are
no more parameters, the depth is tested to see if it is the deepest in the profile and processing
proceeds as described before.
If the depth is the deepest in the profile, the mean and standard deviation of the observed
profile parameters are calculated and the same properties are calculated for the climatological
profiles at the same location and month. Then if the absolute difference between the observed
mean and the climatological mean of a given parameter exceeds the threshold set in table 3.4,
display the information as will be described. If not, test if the absolute difference of the
standard deviation of the observed profile from its mean to the same quantity as for the
climatological profile exceed the threshold given in table 3.4. If not, repeat these tests for the
next parameter at the station, or if there is no other, test the next station.
If the threshold is exceeded, display both the observed parameter profile, and the
climatological mean. The user may then choose to set the quality flag on the parameter
profile to be inconsistent. If the user denies this, the quality flag is set to be doubtful. If the
user confirms the flag should be set to be inconsistent, but the flag is already set to be
doubtful, the user must confirm the flags be changed. If confirmed, the flag on the parameter
profile is changed from doubtful to inconsistent. If denied, no change of the quality flag is
made. If the flag was not set to be doubtful, it is set to be inconsistent as the user chose to do.
The next parameter is then tested or if there is no other parameter, the next station is tested.

IOC Manuals and Guides, 22 Rev.
Annex B – page 114
Table 3.4 Thresholds (set on 20 April, 1990)
Parameter Threshold Units
Mean temperature 0.5 degrees C
Mean salinity 0.2 PSU
Standard deviation of temperature TBD
Standard deviation of salinity TBD
Note: TBD = to be determined
History: None
Rules:
3.4.1 IF : Any one of the latitude, longitude or month has the quality flag set to be
erroneous
THEN : Test the next station
ELSE : 3.4.2
3.4.2 : Set DEPTH to be the shallowest depth in the profile
: Set VALUE to be the temperature at DEPTH, or salinity if temperature is not
present
: 3.4.3
3.4.3 IF : The quality flag on DEPTH is set to be erroneous
THEN : 3.4.4
ELSE : 3.4.6
3.4.4 IF : DEPTH is the deepest in the profile
THEN : 3.4.10
ELSE : 3.4.5
3.4.5 : Set DEPTH to be the next deeper in the profile
: Set VALUE to be the temperature at DEPTH, or the salinity if temperature is not
present
: 3.4.3
3.4.6 IF : The quality flag on VALUE is set to be erroneous
THEN : 3.4.8
ELSE : 3.4.7
3.4.7 : Calculate the summed value of VALUE over the profile.
: Calculate the summed difference of the value at DEPTH from the climatological
mean over the profile
: Sum the number of observations and means over the profile
: 3.4.8
3.4.8 IF : There is another parameter observed at DEPTH
THEN : 3.4.9
ELSE : 3.4.4

IOC Manuals and Guides, 22 Rev.
Annex B – page 115
3.4.9 : Set VALUE to the value of the next parameter at DEPTH
: 3.4.6
3.4.10 : Set the summed value under consideration to be that for the first parameter
: Set the summed difference value under consideration to be that for the first
parameter
: Set the number of values under consideration to be that for the first parameter
: 3.4.11
3.4.11 IF : The difference between the mean value of the observations of the parameter and
the mean value of the climatology is less then a specified threshold value, and the difference
between the standard deviation of the observations of the parameter and the standard
deviation of the climatology is less then a specified threshold value
THEN : 3.4.12
ELSE : 3.4.14
3.4.12 IF : There are summed values and summed differences for other parameters in the
profile
THEN : 3.4.13
ELSE : Test the next station
3.4.13 : Set the summed value under consideration to be that for the >next parameter
: Set the summed difference value under consideration to be that for the next
parameter
: Set the number of values under consideration to be that for the next parameter
: 3.4.11
3.4.14 : Display the observed profile
: Display the climatological profile from the same location and month
: 3.4.15
3.4.15 IF : The user chooses to flag the parameter profile as inconsistent
THEN : 3.4.17
ELSE : 3.4.16
3.4.16 : Notify the user that the profile flag will be set to doubtful
: Set the quality flag on the profile to "3", doubtful
: 3.4.12
3.4.17 IF : The profile flag is already set to be doubtful
THEN : 3.4.19
ELSE : 3.4.18
3.4.18 : Set the quality flag on the profile to "2", inconsistent
: 3.4.12
3.4.19 IF : The user confirms that the quality flag on the profile should be changed from
doubtful to inconsistent
THEN : 3.4.18
ELSE : 3.4.12

IOC Manuals and Guides, 22 Rev.
Annex B – page 116
Test 3.4 Levitus Monthly Climatology

IOC Manuals and Guides, 22 Rev.
Annex B – page 117
Test Name: 4.1 Waterfall
Prerequisites : All of Stage 1 tests.
: Global Impossible Parameter Value test.
: Sort the stations in the incoming file by identifier and date and time for each
identifier
Description:
This test examines adjacent profiles in an incoming file to determine if they are similar in
form. It does so by computing the difference of each profile from its mean and then
comparing these differences. If they lie below a given threshold, the profiles pass the test. In
order to do this test, the profiles must be interpolated to the same set of depths. The Reineger-
Ross interpolation scheme is used and only those points and depths with quality flags not set
to be erroneous are used. As well, it is considered that the two profiles must be collected
within 500 kilometres and 5 days of each other.
The test begins with the first identifier in the file. All of the stations with this identifier are
examined to compose a list of the available parameters. Then, the first parameter is selected.
The first station is tested to determine if a profile exists for the parameter under
consideration. If it does not exist, the station is checked to see if it is the last for the identifier.
If it is not, the next station is tested to see if a profile for the parameter exists.
If the station is the last for the identifier, the parameter is checked to determine if it is the last
of the list of available parameters. If not, the parameter to be considered is set to be the next
on the list, a marker (used to indicate a first profile of a pair has been found) is cleared and
the station under consideration set to be the first for the identifier. The station is tested to see
if a profile exists for the parameter and processing continues as already described.
If the parameter was the last on the list for a particular identifier, then the identifier is
checked to see if it is the last in the file. If not, the identifier under consideration is set to be
the next in the file. Then the list of available parameters for this identifier is composed and
processing continues as already described. If it was the last identifier, this test is complete.
If a profile exists for the parameter in question, the marker is checked to see if it is set. If not,
the marker is set and the profile is assigned to be the first in the pair to be considered. Then,
the station is checked to see if it is the last for the identifier and processing continues as
already described.
If the marker was already set, the profile being considered is assigned to be the second in the
pair to be considered. The two profiles are then tested to determine if they have been
collected within 500 kilometres and 5 days of each other. If not, the first profile is discarded
and the second profile is assigned to be the first of a new pair. The station is then checked to
see if it was the last for that identifier and processing continues as described above.
If the two profiles were collected sufficiently close together in time and space they are
interpolated in depth to the same set of standard depths. If quality flags on the individual
depths of parameter values are set to be erroneous, then they are not used in the interpolation.
Once the interpolation is complete, the mean of each profile is calculated. The test proceeds
by examining one depth at a time beginning with the shallowest. The mean is subtracted from

IOC Manuals and Guides, 22 Rev.
Annex B – page 118
the interpolated value for each profile respectively and then the two differences are
subtracted. This absolute value of the result is checked against the threshold for the parameter
given in table 4.1 below. If it lies below the threshold, the depth is examined to see if it is the
deepest in the profiles. If it is not, the values at the next depth are examined as described
above. If it is the deepest, the first profile is discarded, the second profile is set to be the first
in the pair and processing proceeds as already described.
If the result exceeds the threshold, the two profiles are displayed as well as any other from
the same identifier that lie within 500 kilometres and 5 days of either of the two profiles in
the pair. Also displayed are the interpolations to the two profiles. The user can then choose to
set the quality flag on the second profile. If not, the quality flag on the first may be set. If not,
the depth is tested to determine if it is the deepest and processing continues as previously
described.
If the user chooses to set the quality flag on either of the profiles, the same process is
followed. First the user can choose to set the flag to be inconsistent. If so, the flag is checked
to ensure it is not already set to be doubtful. If not, the flag is set to be inconsistent and the
depth tested to be the deepest. If the flag was already set to doubtful, the user must confirm
that it be changed from doubtful to inconsistent. If confirmed, the change is made. If not
confirmed, or if the user chose not to flag the profile as inconsistent, the user can now choose
to flag it as doubtful. If denied, the flag remains unaltered. If accepted, the flag is set to
doubtful, and the depth tested to determine if it is the deepest in the profiles. Further
processing from here has already been described.
Table 4.1 Thresholds for absolute differences between parameter values in a pair of profiles
Parameter Threshold Units
Temperature 0.5 degrees C
Salinity 0.3 PSU
References:
1. Reiniger, R.F. and C.K. Ross, 1968. A method of interpolation with application to
oceanographic data. Deep Sea Research, V15, pp185-193.
History: None
Rules:
4.1.1 : Set ID to the first identifier in the list in the incoming file
: 4.1.2
4.1.2 : Derive the list of parameters for all of the stations with the given identifier
: Set PARM to be the first in the list of parameters
: 4.1.3
4.1.3 : Set the station under consideration to be the first
: 4.1.4

IOC Manuals and Guides, 22 Rev.
Annex B – page 119
4.1.4 IF : There is a profile of the given PARM for this station
THEN : 4.1.11
ELSE : 4.1.5
4.1.5 IF : The station is the last with this identifier
THEN : 4.1.7
ELSE : 4.1.6
4.1.6 : Set the station under consideration to be the next for this identifier
: 4.1.4
4.1.7 IF : PARM is the last of the list of parameters for the given identifier
THEN : 4.1.9
ELSE : 4.1.8
4.1.8 : Set PARM to be the next in the list for the given identifier
: Clear MARK
: 4.1.3
4.1.9 IF : The identifier under consideration is the last one in the file
THEN : Test the next station
ELSE : 4.1.10
4.1.10 : Set ID to be the next identifier in the incoming file
: 4.1.2
4.1.11 IF : The profile has the quality flag set to be erroneous
THEN : 4.1.5
ELSE : 4.1.12
4.1.12 IF : MARK has been set
THEN : 4.1.14
ELSE : 4.1.13
4.1.13 : Set MARK
: Set PROFILE1 to be the present profile
: 4.1.5
4.1.14 : Set PROFILE2 to be the present profile
: 4.1.15
4.1.15 IF : PROFILE1 is within 500 kilometers and 5 days of PROFILE2
THEN : 4.1.17
ELSE : 4.1.16
4.1.16 : Set PROFILE2 = PROFILE1
: 4.1.5
4.1.17 : Interpolate the data for both PROFILE1 and PROFILE2 so that the data are
represented at the same depths

IOC Manuals and Guides, 22 Rev.
Annex B – page 120
: Calculate the mean of each profile
: Set DEPTH to be the first in the profiles
: 4.1.18
4.1.18 : Calculate the difference between the mean and the value at DEPTH for PROFILE1,
call it DIFF1
: Calculate the same quantity for PROFILE2, call it DIFF2
: 4.1.19
4.1.19 IF : The absolute value of DIFF1 minus DIFF2 is less than a given threshold
THEN : 4.1.20
ELSE : 4.1.22
4.1.20 IF : DEPTH is the deepest in the profiles
THEN : 4.1.16
ELSE : 4.1.21
4.1.21 : Set DEPTH to be the next in the profiles
: 4.1.18
4.1.22 : Display PROFILE1
: Display PROFILE2
: Display profiles of the same parameter for the same identifier that are within 500
kilometers and 5 days of either PROFILE1 or PROFILE2
: 4.1.23
4.1.23 IF : The user chooses to set the quality flag on PROFILE2
THEN : 4.1.25
ELSE : 4.1.24
4.1.24 IF : The user chooses to set the quality flag on PROFILE1
THEN : 4.1.25
ELSE : 4.1.20
4.1.25 IF : The user chooses to set the quality flag on the profile to be inconsistent
THEN : 4.1.26
ELSE : 4.1.29
4.1.26 IF : The quality flag on the profile is already set to be doubtful
THEN : Notify the user how the flag is presently set
: 4.1.28
ELSE : 4.1.27
4.1.27 : Set the quality flag on the profile to be "2", inconsistent
: 4.1.16
4.1.28 IF : The user confirms that the quality flag should be changed
THEN : 4.1.27
ELSE : 4.1.29

IOC Manuals and Guides, 22 Rev.
Annex B – page 121
4.1.29 IF : The user chooses to set the quality flag on the profile to be doubtful
THEN : 4.1.30
ELSE : 4.1.16
4.1.30 : Set the quality flag on the profile to be "3", doubtful
: 4.1.16

IOC Manuals and Guides, 22 Rev.
Annex B – page 122
Test 4.1 Waterfall Test

IOC Manuals and Guides, 22 Rev.
Annex B – page 123
Test Name: 5.1 Cruise Track
Prerequisites: None
Description:
This test involves the visual inspection of the data as received at the processing centre. The
stations of observations should be arranged in what constitute "cruises". For data received in
real-time, a cruise would be the collection of stations from a single ship and arranged in
chronological order of collection. The cruise track for each is plotted showing the location of
each station and a coastline map of the region. The person reviewing it should satisfy
themselves that the stations appear to follow in an appropriate sequence and relationship to
each other.
History: None
Rules: None

IOC Manuals and Guides, 22 Rev.
Annex B – page 124
Test Name: 5.2 Profiles
Prerequisites: None
Description:
The profiles of the observations should be viewed at each station. This review will identify
any questionable variations in the parameters and set quality flags as appropriate. In special
cases, where further information is available, or where the error and necessary correction are
beyond doubt, the person conducting the review may alter the data value. Should this occur,
the quality flag must be set to "5" to indicate the value was changed, and the original value is
retained elsewhere in the record.
Processing centres may choose to calculate other variables based on those received in order
to help assess the observed values. For example, a calculation of the density profile based on
temperature and salinity will help to determine if the observed values are reasonable. There
are numerous other possibilities. Processing centres should be prepared to supply written
documentation of the procedures employed in this stage of processing.
History: None
Rules: None

Version 1.0 IOC Manuals and Guides, 22 Rev.
Annex C
ANNEX C
IMPLEMENTATION DETAILS
This annex is organized by tests described in Annex B. It gives more details of how certain of
the tests are implemented in the GTSPP and at particular participating sites of GTSPP.
Test 1.4: Position on Land
GTSPP implementation of this test makes use of a file which contains the depth of water at
every 5 minutes of latitude and longitude. The depth values are referenced to the exact 5
minute value (i.e. 5 minutes, 10 minutes, 15 minutes and so on) of the latitude and longitude.
GTSPP implements this test in an interactive graphics program so that a technician will be
alerted that a given station location has failed the test and can take appropriate actions.
The bathymetric data are organized in an indexed file to permit rapid access. The primary key
is the one degree square of the depth. When checking the position of a station, the first step is
to locate the one degree square in which it lies. The depths are then retrieved for the
appropriate one degree square of the station (depending if the station is close to a boundary of
one degree squares, then adjacent squares are retrieved). Then the four closest five minute
locations are determined which surround the station. Next the additional 12 closest five
minute locations are determined. That is, the location of the station is surrounded by the
sixteen closest depth values from the five minute bathymetry file. The depth of water at each
of the five minute locations is tested to see if it is greater than zero (locations on land are
given a value of zero in the five minute file). If 15 of 16 five minute locations have depths
greater than 0, the station is decided to be in the water and the test is passed.
The five minute file used by GTSPP does not include certain inland seas. Before the test is
applied, stations located in the Aral Sea, Caspian Sea and Great Lakes are excluded. The
following table gives the latitude, longitude boundaries used to exclude stations.
Name Latitude Longitude
Great Lakes 40-50 N 75-95 W
Aral Sea 42-48 N 58-62 E
Caspian Sea 35-48 N 45-55 E


Version 1.0 IOC Manuals and Guides, 22 Rev.
Annex D
ANNEX D
QUALITY CONTROL VERSION HISTORY
Old Version
Number
New Version
Number Date Action
1.0 1.0 Jan, 1990 Original QC software
1.0 1.1 Jul, 1994 Test 1.2 Impossible Date/Time: Modified so that
data older than 30 days is not automatically
flagged as doubtful or erroneous.
Test 2.5 Constant Profile: Modified to not
require value to be flagged as doubtful or
erroneous.
Test 2.11: Added.
Test 2.12: Added.
Test 3.1 Levitus Seasonal Statistics: No longer
require that values outside climatology
automatically are flagged as "2".
1.1 1.11 Mar, 2000 Test 2.2 Global Impossible Parameter Values:
The parameter
Sound velocity was added. Weather code max
was changed to 99
1.11 1.12 Apr, 2001 Test 2.1 Global Impossible Parameter Values:
Change the limits for salinity to 41 PSU. Change
temperature limits to -2.0 to 40.
Test 2.2 Regional Impossible Parameter Values:
Add salinity limits into both the Red and
Mediterranean Seas. Make them 0-40 PSU.
Test 2.4 Global Profile Envelop: Change salinity
limits from 0 to 1100m
1.12 1.13 Mar, 2002 Test 2.1 Global Impossible Parameter Values:
The maximum value for alkalinity was changed
to 4000
[end]