Embed Size (px)
Citation preview

Task No: YY86731
Guidance Document for Performance Measurement
of Highway Structures
Part B3: Reliability Performance Indicator
Report prepared by:
Report prepared on behalf of:
Highways Agency
CSS Bridges Group
2007
PERFORMANCE MEASUREMENT OF HIGHWAY STRUCTURES Part B3: Reliability Performance Indicator
ii 2007
Contents Section Page
1. Introduction 1 1.1 Reliability Performance Indicator Definition 1 1.2 Background, Objectives and Scope 1 1.3 Terminology 1
2. Overview of Reliability PI Procedure 2 2.1 General Approach 2 2.2 Reliability PI Scale 2 2.3 Reliability PI Score 3 2.4 Other Highway Structure Owners 3 2.5 Steps in the Reliability PI Procedure 3
3. Data Requirements 6 3.1 Relevant Structure Types 6 3.2 Essential and Desirable Data 7
4. Structure Reliability Evaluation 8 4.1 Reliability 8 4.2 Critical Element 8
5. Probability of Failure 10 5.1 Overview of the Probability of Failure Procedure 10 5.2 Live Load Rating, LLR 12
5.2.1 Category 1 – Assessed Structures 13 5.2.2 Category 2 – Structures not included in the Assessment Programme 14 5.2.3 Category 3 – Structures still to be Assessed 15
5.3 Footways beside Carriageways Factor, FFbC 15 5.4 Interim Measures Adjustment Factor, FIM 16 5.5 Condition Assessment 18
5.5.1 Condition Adjustment Factor, FCON 18 5.5.2 Condition Factor, FC (BD21) 20
5.6 Inspection Accessibility, FIA 22 5.7 Monitoring Factor, FMON 22
6. Consequence of Failure 23 6.1 Overview of Consequence of Failure Procedure 23 6.2 Casualty Score, CasS 24

PERFORMANCE MEASUREMENT OF HIGHWAY STRUCTURES Part B3: Reliability Performance Indicator
iii 2007
6.3 Reconstruction Score, RCS 26 6.4 Disruption Score, DisS 26
6.4.1 Increased Journey Length, IJLkm 27 6.4.2 Duration of Reconstruction, DurS 28
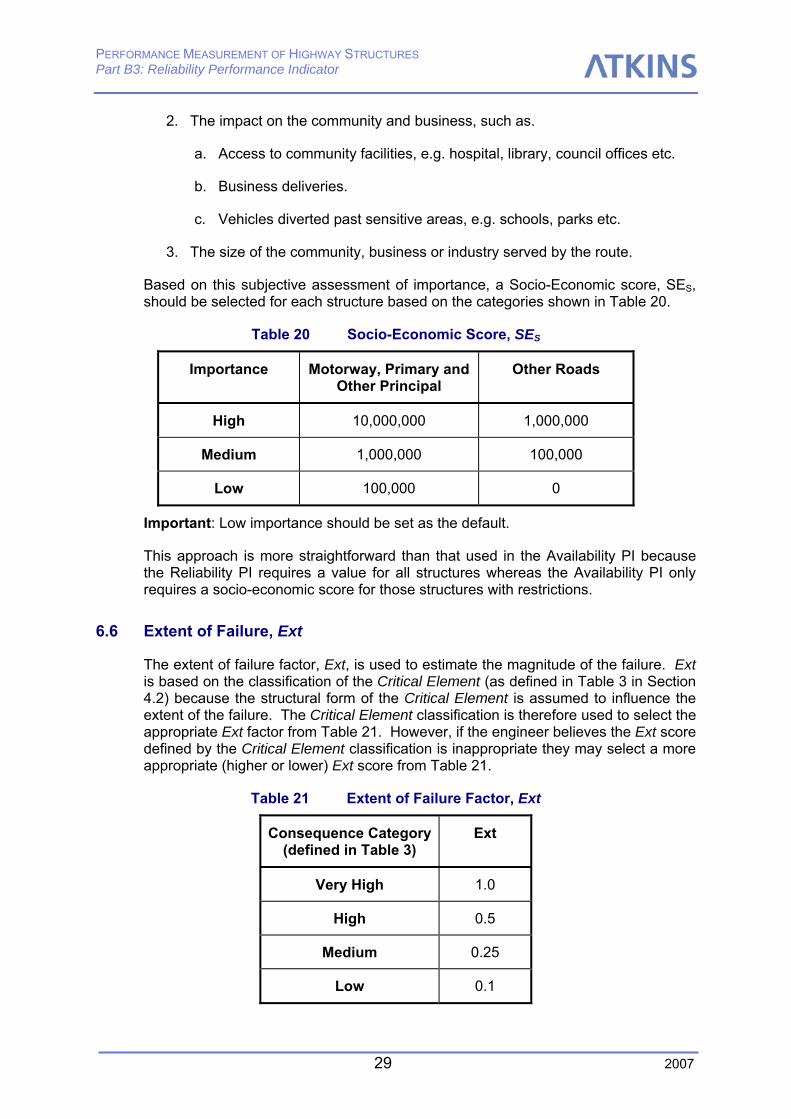
6.5 Socio-Economic Score, SES 28 6.6 Extent of Failure, Ext 29
7. Reliability PI Score 30 7.1 Individual Structure Risk and Reliability PI 30 7.2 Structure Group and Stock Reliability PI 31 7.3 Reliability PI Scale 31
8. References 33
APPENDIX A Live Load Rating and Probability of Failure 34
APPENDIX B Casualty Assumptions 36
PERFORMANCE MEASUREMENT OF HIGHWAY STRUCTURES Part B3: Reliability Performance Indicator
iv 2007
List of Tables Table 1 Structure Types Included and Excluded from Reliability PI 6 Table 2 Essential and Desirable Data 7 Table 3 Critical Elements 9 Table 4 Assessment Categories 12 Table 5 Pf-LLR given assessed capacity and current 40 tonne loading 14 Table 6 Pf-LLR for Structures Not Included in the Assessment Programme 14 Table 7 Pf-LLR for Superstructure Elements Still to be Assessed 15 Table 8 Interim Measures 17 Table 9 FIM for Restricted Structures 17 Table 10 Generic Severity Descriptions 18 Table 11 Extent Codes 19 Table 12 Condition Adjustment Factor, FCON 20 Table 13 Modification factors for change in Condition since last assessment, FCON 21 Table 14 Inspection Accessibility Factor, FIA 22 Table 15 Monitoring Adjustment Factors, FMON 22 Table 16 Route Scores for highways, RS 25 Table 17 Routes score for other obstacles/route types, RS 25 Table 18 Increased Journey Length Score, IJLkm 28 Table 19 Duration of Reconstruction Factor, DurS 28 Table 20 Socio-Economic Score, SES 29 Table 21 Extent of Failure Factor, Ext 29 Table 22 Individual Structure Reliability PI Categories 32 Table 23 Structure Stock Reliability PI Categories 32
List of Figures Figure 1 Flowchart of Reliability PI Procedure 5 Figure 2 Retaining Wall Reliability Requirements 6 Figure 3 Overview of Probability of Failure Procedure 11 Figure 4 Footways besides Carriageways 16 Figure 5 Applying FCON 20 Figure 6 Risk and Reliability PI relationship 30 Figure 7 Probability of failure as a function of Live Load Rating 35
PERFORMANCE MEASUREMENT OF HIGHWAY STRUCTURES Part B3: Reliability Performance Indicator
1 2007
1. Introduction
1.1 Reliability Performance Indicator Definition
The Reliability PI is defined as:
A representation of the ability of the structure stock to support traffic, and other appropriate loading, taking into account the consequence of failure.
1.2 Background, Objectives and Scope
The background, objectives and scope are discussed in Part A: Framework for Performance Measurement.
1.3 Terminology
The following terminology is used by the Reliability PI procedure:
• Live Load Rating – the terminology used for the live load capacity (in tonnes) assigned to the structure at design or assessment.

PERFORMANCE MEASUREMENT OF HIGHWAY STRUCTURES Part B3: Reliability Performance Indicator
2 2007
2. Overview of Reliability PI Procedure
2.1 General Approach
The aim of the Reliability Performance Indicator (PI) is to represent the ability of a structure to support traffic, and other appropriate, loads and take into account the consequence of failure to road users, businesses and communities. The Reliability PI is defined as:
Reliability PI = f(Probability of Failure, Consequence of Failure)
Where the probability and consequence of failure are defined as:
Probability of Failure - given the current condition, assessed capacity, loading, safeguards/restrictions etc., what is the likelihood that an element or part of the structure will fail?
Consequence of Failure - given that a failure occurs what are the likely consequences in terms of casualties, traffic delay costs, reconstruction costs and socio-economic impact?
The quantification of failure probabilities and consequences has the potential of creating a highly involved and complex procedure requiring significant quantities of data. This approach is not practical for the Reliability PI because:
• All relevant structures are included in the Reliability PI calculation therefore it must be relatively straightforward and require minimal effort and data.
• The procedure must align, where possible, with readily available data and/or data that are required for good Asset Management. A large number of data fields must not be created solely for the purpose of PI reporting.
A procedure has been developed that utilises the principles of the probability and consequence of failure. The procedure can be readily programmed and has been designed to operate on minimal/coarse data, but can also make full use of more detailed data when available.
It is important to note that the Reliability PI does not cover scour, vehicle impact (pier, deck or parapet) or other similar risks, for this reason the term Reliability has been used instead of Risk or Safety.
2.2 Reliability PI Scale
The Reliability PI scale is from 0 to 100, where 0 represents an unacceptable level of reliability and 100 represents a high level of reliability. Individual structures, tactical sets and the structure stock are all scored on the 0 to 100 scale. The scale is divided into five bands (Very Good, Good, Fair, Poor and Very Poor) with generic reliability descriptions for each, these are presented in Section 7.3.
PERFORMANCE MEASUREMENT OF HIGHWAY STRUCTURES Part B3: Reliability Performance Indicator
3 2007
2.3 Reliability PI Score
All structures, under stewardship of the authority, that support traffic and other appropriate loading are included in the Reliability PI. One Reliability PI score is evaluated per structure.
The Reliability PI for structure groups and the stock is simply the average of the individual structures that make up the group/stock, see Section 7. It is not a weighted average, like the Condition PI, because the importance of a structure is implicit in the Reliability PI calculation.
2.4 Other Highway Structure Owners
The Reliability PI excludes structures that are within the footprint of an authority’s highway but under the stewardship of another authority. However, this does not preclude an authority from using this procedure to assess the reliability of these structures, although it is unlikely that the authority would hold the necessary information for structures not under their stewardship.
Important: In reporting the Reliability PI an authority should, first and foremost, report the value for structures under their stewardship. This may be supplemented by further Reliability PI scores that illustrate the reliability of structures owned by other authorities.
2.5 Steps in the Reliability PI Procedure
An overview of the Reliability PI procedure is shown in Figure 1, the steps involved are summarised below.
Step 1 – Select Structure Group
It is recommended that the Reliability PI is evaluated for groups of structures (Tactical Sets) as well as the stock as a whole. The structure stock may be subdivided into separate groups in order to analyse the Reliability PI in more detail, for example, bridges, retaining walls, route corridor, material type etc.
Step 2 – Select Individual Structure
The Reliability PI is evaluated at individual structure level for all appropriate structures, therefore each structure is selected in turn, see Section 3.1
Step 3 – Compile Data
The data required to evaluate the Reliability PI are defined in Section 3.2, e.g. Live Load Rating, change in critical element condition, route type served, span length etc.
Step 4 – Identify Critical Load Bearing Element
For structures that have been assessed, the Reliability PI is based on the critical load bearing element on the structure, which is selected based on assessment data and/or condition data, see Section 4.

PERFORMANCE MEASUREMENT OF HIGHWAY STRUCTURES Part B3: Reliability Performance Indicator
4 2007
Step 5 - Evaluate the Probability of Failure
The simplified notional probability of failure is based on the Live Load Rating of the structure. The Live Load Rating is compiled from design or assessment records if available otherwise a procedure is provided for deriving a probability of failure when assessment data is not available. The probability of failure is modified, where appropriate, to account for change in condition of the critical load bearing element, interim measures, monitoring activity and inspection accessibility, see Section 5.
Step 6 – Evaluate the Consequence of Failure
The consequence of failure of a structure is based on casualties, reconstruction costs, user disruption, Socio-Economic impact, reconstruction duration and the extent of failure, see Section 6.
Step 7 – Evaluate Reliability PI
Risk is the product of the Probability and Consequence of Failure. The risk score is converted to a Reliability PI, see Section 7.1.
Step 8 – Next Structure
Select the next structure within this structure group.
Step 9 – Evaluate Structure Group Reliability PI
The structure group Reliability PI is the average of all the individual structure scores in the group, see Section 7.2.
Step 10 – Next Structure Group
Select the next structure group for which the Reliability PI calculation will be performed.
Step 11 – Evaluate Structure Stock Reliability PI
The structure stock Reliability PI is the average of all the individual structure scores, see Section 7.2.

PERFORMANCE MEASUREMENT OF HIGHWAY STRUCTURES Part B3: Reliability Performance Indicator
5 2007
Figure 1 Flowchart of Reliability PI Procedure
3. Compile Data (Section 3)
5. Evaluate Probability of
Failure (Section 5)
6. Evaluate Consequence of
Failure (Section 6)
8. Next Structure?
10. Next Structure Group?
9. Evaluate Structure Group
Reliability PI
11. Structure Stock Reliability PI
Yes
Yes
No
No
7. Evaluate Individual Structure Reliability PI
(Section 7)
START
END
2. Select Structure
1. Select Structure Group (Table 1)
4. Identify Critical Element
(Section 4)
PERFORMANCE MEASUREMENT OF HIGHWAY STRUCTURES Part B3: Reliability Performance Indicator
6 2007
3. Data Requirements
3.1 Relevant Structure Types
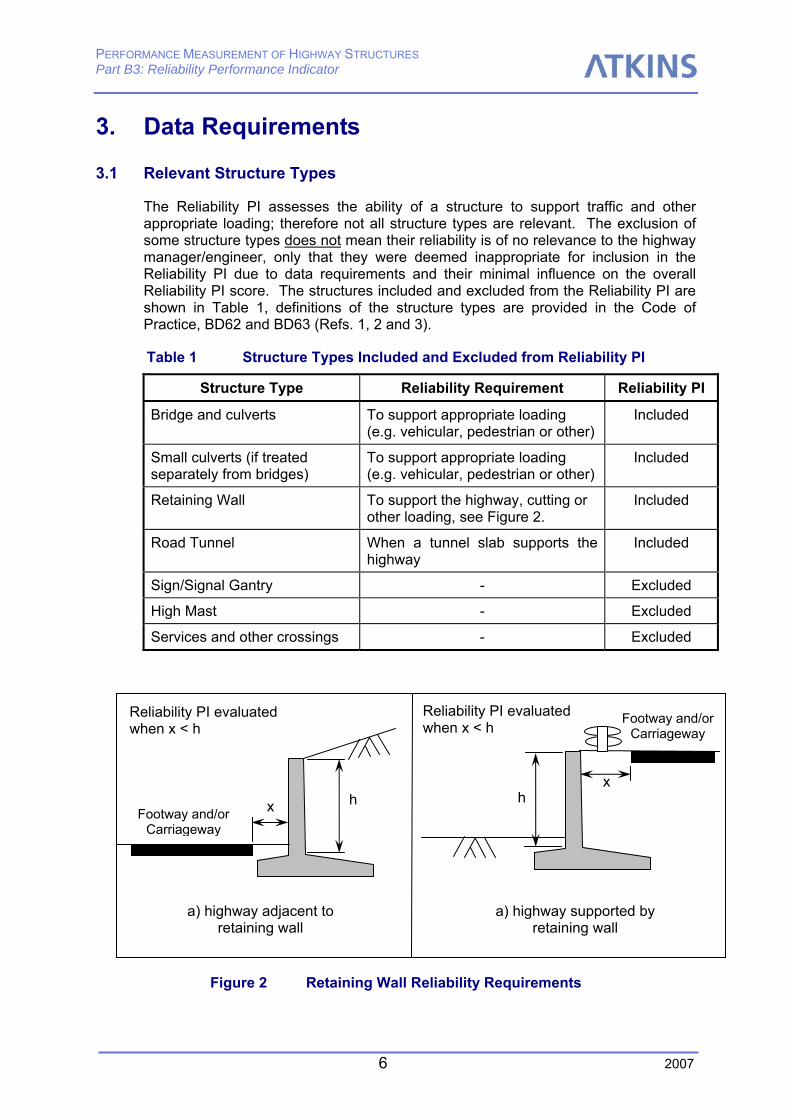
The Reliability PI assesses the ability of a structure to support traffic and other appropriate loading; therefore not all structure types are relevant. The exclusion of some structure types does not mean their reliability is of no relevance to the highway manager/engineer, only that they were deemed inappropriate for inclusion in the Reliability PI due to data requirements and their minimal influence on the overall Reliability PI score. The structures included and excluded from the Reliability PI are shown in Table 1, definitions of the structure types are provided in the Code of Practice, BD62 and BD63 (Refs. 1, 2 and 3).
Table 1 Structure Types Included and Excluded from Reliability PI
Structure Type Reliability Requirement Reliability PI
Bridge and culverts To support appropriate loading (e.g. vehicular, pedestrian or other)
Included
Small culverts (if treated separately from bridges)
To support appropriate loading (e.g. vehicular, pedestrian or other)
Included
Retaining Wall To support the highway, cutting or other loading, see Figure 2.
Included
Road Tunnel When a tunnel slab supports the highway
Included
Sign/Signal Gantry - Excluded
High Mast - Excluded
Services and other crossings - Excluded
Figure 2 Retaining Wall Reliability Requirements
Footway and/or Carriageway
a) highway adjacent to retaining wall
Footway and/or Carriageway
a) highway supported by retaining wall
x h
Reliability PI evaluated when x < h
Reliability PI evaluated when x < h
h x
PERFORMANCE MEASUREMENT OF HIGHWAY STRUCTURES Part B3: Reliability Performance Indicator
7 2007
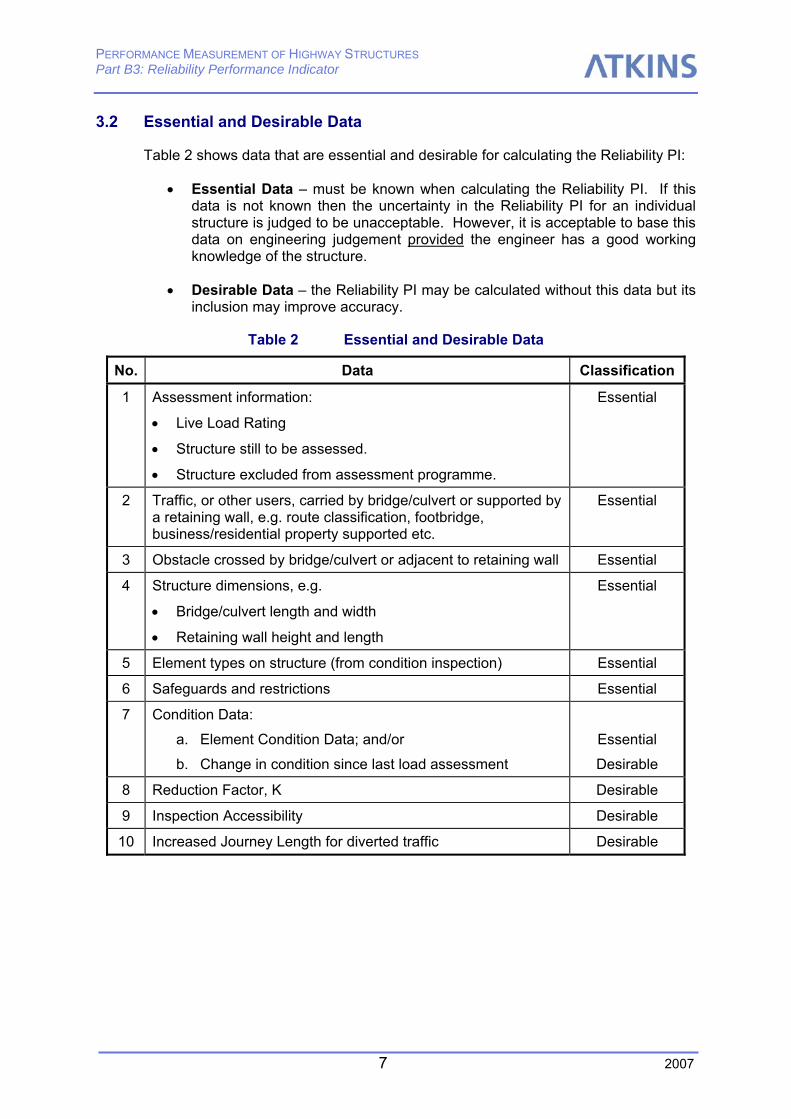
3.2 Essential and Desirable Data
Table 2 shows data that are essential and desirable for calculating the Reliability PI:
• Essential Data – must be known when calculating the Reliability PI. If this data is not known then the uncertainty in the Reliability PI for an individual structure is judged to be unacceptable. However, it is acceptable to base this data on engineering judgement provided the engineer has a good working knowledge of the structure.
• Desirable Data – the Reliability PI may be calculated without this data but its inclusion may improve accuracy.
Table 2 Essential and Desirable Data
No. Data Classification
1 Assessment information:
• Live Load Rating
• Structure still to be assessed.
• Structure excluded from assessment programme.
Essential
2 Traffic, or other users, carried by bridge/culvert or supported by a retaining wall, e.g. route classification, footbridge, business/residential property supported etc.
Essential
3 Obstacle crossed by bridge/culvert or adjacent to retaining wall Essential
4 Structure dimensions, e.g.
• Bridge/culvert length and width
• Retaining wall height and length
Essential
5 Element types on structure (from condition inspection) Essential
6 Safeguards and restrictions Essential
7 Condition Data:
a. Element Condition Data; and/or
b. Change in condition since last load assessment
Essential
Desirable
8 Reduction Factor, K Desirable
9 Inspection Accessibility Desirable
10 Increased Journey Length for diverted traffic Desirable

PERFORMANCE MEASUREMENT OF HIGHWAY STRUCTURES Part B3: Reliability Performance Indicator
8 2007
4. Structure Reliability Evaluation
4.1 Reliability
The reliability of a highway structure can be evaluated as a function of all the individual element reliabilities on the structure as shown in Equation 1a.
Structure Reliability = f(RE1, RE2, RE3…REn)
Equation 1a
Where n = the number of elements on the structure
REi = Reliability score for Element i
Equation 1a is the ideal approach however this is not wholly necessary because the reliability score of a structure is normally dominated by the element with the lowest capacity and/or in the worst condition. The individual structure reliability can therefore be more simply defined as:
Structure Reliability = (Reliability of Critical Element)
Equation 1b
The Reliability PI adopts the approach shown in Equation 1b. Therefore the Probability of Failure and Consequence of Failure are evaluated relevant to the Critical Element.
4.2 Critical Element
The Reliability PI is concerned with the primary load carrying/supporting function of the structure. Therefore Critical Elements are limited to those that govern structural capacity, see Table 3. The categories in Table 3 align with the Importance Classifications used in Part B1: Condition Performance Indicator. Table 3 does not show any elements in the Medium and Low Importance categories because these elements they do not govern structural capacity.
The Critical Element is selected from Table 3 based on the following rules:
1. Known Critical Element – the assessment records identify the critical load bearing element, e.g. main beams, transverse beams, foundations. This element is used in the Reliability PI procedure.
2. Unknown Critical Element – assessment records do not identify the critical load bearing element or the structure has not been assessed. Therefore, the element from Table 3 that has the worst Severity condition rating is used as the Critical Element in the Reliability PI. If two elements have the same Severity condition rating then the element in the higher consequence category in Table 3 is taken as the Critical Element, if they are in the same consequence category then the element with the higher Extent rating is used as the Critical Element.
PERFORMANCE MEASUREMENT OF HIGHWAY STRUCTURES Part B3: Reliability Performance Indicator
9 2007
The consequence category (left hand column of Table 3) is used in the Consequence of Failure calculation in Section 6. Higher importance elements are assumed to cause more extensive failures and thereby have greater Consequence of Failure.
Table 3 Critical Elements
Consequence (Importance)
Category
Superstructure Elements Substructure and Retaining Wall Elements
Very High Bridges
• Primary deck element
• Transverse Beams
• Secondary deck element
• Half joints
• Tie beam/rod
• Parapet beam or cantilever
Bridges
• Pier/column
• Cross-head/capping beam
• Foundations
Retaining Walls
• Primary Element
• Secondary element
Small Culvert
• Culvert
High Bridges
• Deck Bracing
• Bearings
Bridges
• Foundations
• Abutments
• Spandrel Wall
Retaining Walls
• N/A
Small Culvert
• Headwall
Medium N/A N/A
Low N/A N/A
A distinction is made in Table 3 between superstructure and substructure elements; this distinction is used by the Probability of Failure procedure, in Section 5.2.3.
PERFORMANCE MEASUREMENT OF HIGHWAY STRUCTURES Part B3: Reliability Performance Indicator
10 2007
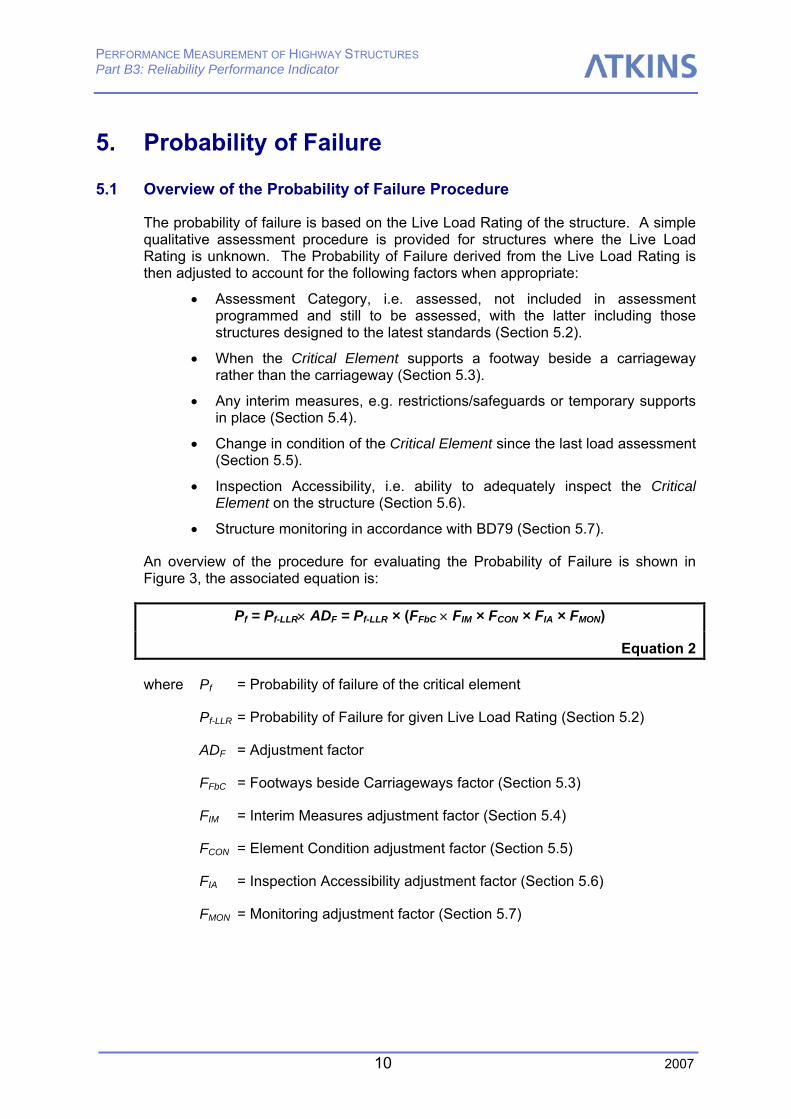
5. Probability of Failure
5.1 Overview of the Probability of Failure Procedure
The probability of failure is based on the Live Load Rating of the structure. A simple qualitative assessment procedure is provided for structures where the Live Load Rating is unknown. The Probability of Failure derived from the Live Load Rating is then adjusted to account for the following factors when appropriate:
• Assessment Category, i.e. assessed, not included in assessment programmed and still to be assessed, with the latter including those structures designed to the latest standards (Section 5.2).
• When the Critical Element supports a footway beside a carriageway rather than the carriageway (Section 5.3).
• Any interim measures, e.g. restrictions/safeguards or temporary supports in place (Section 5.4).
• Change in condition of the Critical Element since the last load assessment (Section 5.5).
• Inspection Accessibility, i.e. ability to adequately inspect the Critical Element on the structure (Section 5.6).
• Structure monitoring in accordance with BD79 (Section 5.7).
An overview of the procedure for evaluating the Probability of Failure is shown in Figure 3, the associated equation is:
Pf = Pf-LLR× ADF = Pf-LLR × (FFbC × FIM × FCON × FIA × FMON)
Equation 2
where Pf = Probability of failure of the critical element
Pf-LLR = Probability of Failure for given Live Load Rating (Section 5.2)
ADF = Adjustment factor
FFbC = Footways beside Carriageways factor (Section 5.3)
FIM = Interim Measures adjustment factor (Section 5.4)
FCON = Element Condition adjustment factor (Section 5.5)
FIA = Inspection Accessibility adjustment factor (Section 5.6)
FMON = Monitoring adjustment factor (Section 5.7)

PERFORMANCE MEASUREMENT OF HIGHWAY STRUCTURES Part B3: Reliability Performance Indicator
11 2007
Figure 3 Overview of Probability of Failure Procedure
Section 5.2
Select Critical Element (Section 4.2)
Structure has been
Assessed?
Not included in Assessment Programme?
Still to be assessed?
Section 5.2.1 Section 5.2.2 Section 5.2.3
Interim Measure?
(Section 5.4)
Are other factors applicable? (Table 8)
Pf = 1×10⁻⁸
Condition Factor,
Section 5.5
Monitoring Factor,
Section 5.7 END
Interim Measure
factor = 1.0
NO
YES YES
YES
NO
NO
NO
Inspection Accessibility
Factor, Section 5.6
Interim Measure Factor
(Table 8)
START
YES
Footway beside carriageway
factor, Section 5.3
PERFORMANCE MEASUREMENT OF HIGHWAY STRUCTURES Part B3: Reliability Performance Indicator
12 2007
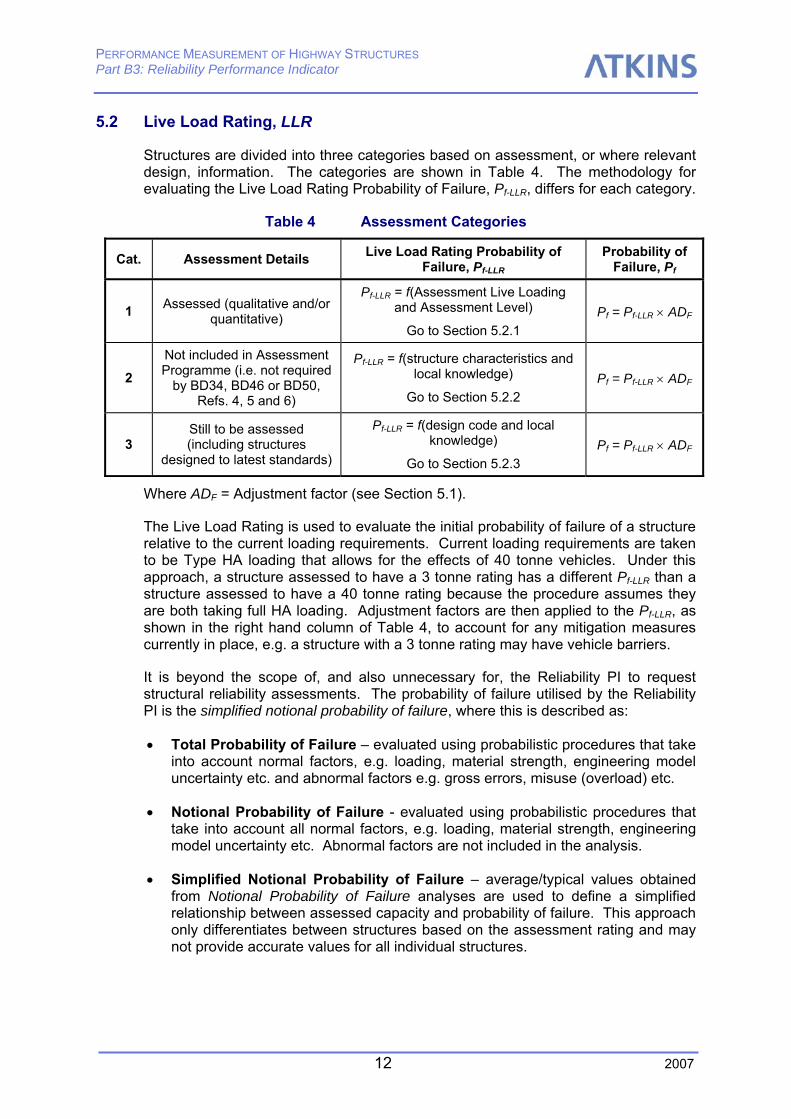
5.2 Live Load Rating, LLR
Structures are divided into three categories based on assessment, or where relevant design, information. The categories are shown in Table 4. The methodology for evaluating the Live Load Rating Probability of Failure, Pf-LLR, differs for each category.
Table 4 Assessment Categories
Cat. Assessment Details Live Load Rating Probability of Failure, Pf-LLR
Probability of Failure, Pf
1 Assessed (qualitative and/or quantitative)
Pf-LLR = f(Assessment Live Loading and Assessment Level)
Go to Section 5.2.1 Pf = Pf-LLR × ADF
2 Not included in Assessment Programme (i.e. not required
by BD34, BD46 or BD50, Refs. 4, 5 and 6)
Pf-LLR = f(structure characteristics and local knowledge)
Go to Section 5.2.2 Pf = Pf-LLR × ADF
3 Still to be assessed (including structures
designed to latest standards)
Pf-LLR = f(design code and local knowledge)
Go to Section 5.2.3 Pf = Pf-LLR × ADF
Where ADF = Adjustment factor (see Section 5.1).
The Live Load Rating is used to evaluate the initial probability of failure of a structure relative to the current loading requirements. Current loading requirements are taken to be Type HA loading that allows for the effects of 40 tonne vehicles. Under this approach, a structure assessed to have a 3 tonne rating has a different Pf-LLR than a structure assessed to have a 40 tonne rating because the procedure assumes they are both taking full HA loading. Adjustment factors are then applied to the Pf-LLR, as shown in the right hand column of Table 4, to account for any mitigation measures currently in place, e.g. a structure with a 3 tonne rating may have vehicle barriers.
It is beyond the scope of, and also unnecessary for, the Reliability PI to request structural reliability assessments. The probability of failure utilised by the Reliability PI is the simplified notional probability of failure, where this is described as:
• Total Probability of Failure – evaluated using probabilistic procedures that take into account normal factors, e.g. loading, material strength, engineering model uncertainty etc. and abnormal factors e.g. gross errors, misuse (overload) etc.
• Notional Probability of Failure - evaluated using probabilistic procedures that take into account all normal factors, e.g. loading, material strength, engineering model uncertainty etc. Abnormal factors are not included in the analysis.
• Simplified Notional Probability of Failure – average/typical values obtained from Notional Probability of Failure analyses are used to define a simplified relationship between assessed capacity and probability of failure. This approach only differentiates between structures based on the assessment rating and may not provide accurate values for all individual structures.
PERFORMANCE MEASUREMENT OF HIGHWAY STRUCTURES Part B3: Reliability Performance Indicator
13 2007
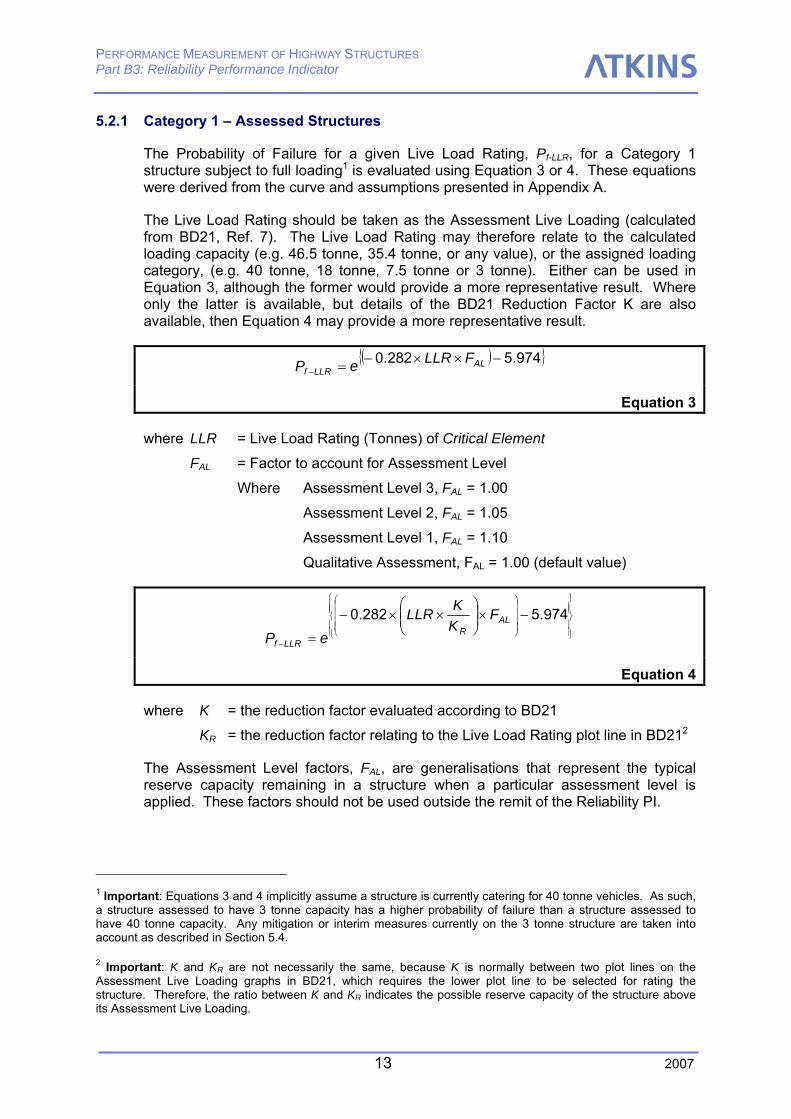
5.2.1 Category 1 – Assessed Structures
The Probability of Failure for a given Live Load Rating, Pf-LLR, for a Category 1 structure subject to full loading1 is evaluated using Equation 3 or 4. These equations were derived from the curve and assumptions presented in Appendix A.
The Live Load Rating should be taken as the Assessment Live Loading (calculated from BD21, Ref. 7). The Live Load Rating may therefore relate to the calculated loading capacity (e.g. 46.5 tonne, 35.4 tonne, or any value), or the assigned loading category, (e.g. 40 tonne, 18 tonne, 7.5 tonne or 3 tonne). Either can be used in Equation 3, although the former would provide a more representative result. Where only the latter is available, but details of the BD21 Reduction Factor K are also available, then Equation 4 may provide a more representative result.
( ){ }974.5282.0 −××−=−AL
LLRfFLLReP
Equation 3
where LLR = Live Load Rating (Tonnes) of Critical Element
FAL = Factor to account for Assessment Level
Where Assessment Level 3, FAL = 1.00
Assessment Level 2, FAL = 1.05
Assessment Level 1, FAL = 1.10
Qualitative Assessment, FAL = 1.00 (default value)
⎪⎪⎭
⎪⎪⎬
⎫
⎪⎪⎩
⎪⎪⎨
⎧
⎟⎟⎟⎟
⎠
⎞
⎜⎜⎜⎜
⎝
⎛
−
−×⎟⎟⎠
⎞⎜⎜⎝
⎛××−
=
974.5282.0 ALR
LLRf
FKKLLR
eP
Equation 4
where K = the reduction factor evaluated according to BD21
KR = the reduction factor relating to the Live Load Rating plot line in BD212
The Assessment Level factors, FAL, are generalisations that represent the typical reserve capacity remaining in a structure when a particular assessment level is applied. These factors should not be used outside the remit of the Reliability PI.
1 Important: Equations 3 and 4 implicitly assume a structure is currently catering for 40 tonne vehicles. As such, a structure assessed to have 3 tonne capacity has a higher probability of failure than a structure assessed to have 40 tonne capacity. Any mitigation or interim measures currently on the 3 tonne structure are taken into account as described in Section 5.4.
2 Important: K and KR are not necessarily the same, because K is normally between two plot lines on the Assessment Live Loading graphs in BD21, which requires the lower plot line to be selected for rating the structure. Therefore, the ratio between K and KR indicates the possible reserve capacity of the structure above its Assessment Live Loading.
PERFORMANCE MEASUREMENT OF HIGHWAY STRUCTURES Part B3: Reliability Performance Indicator
14 2007
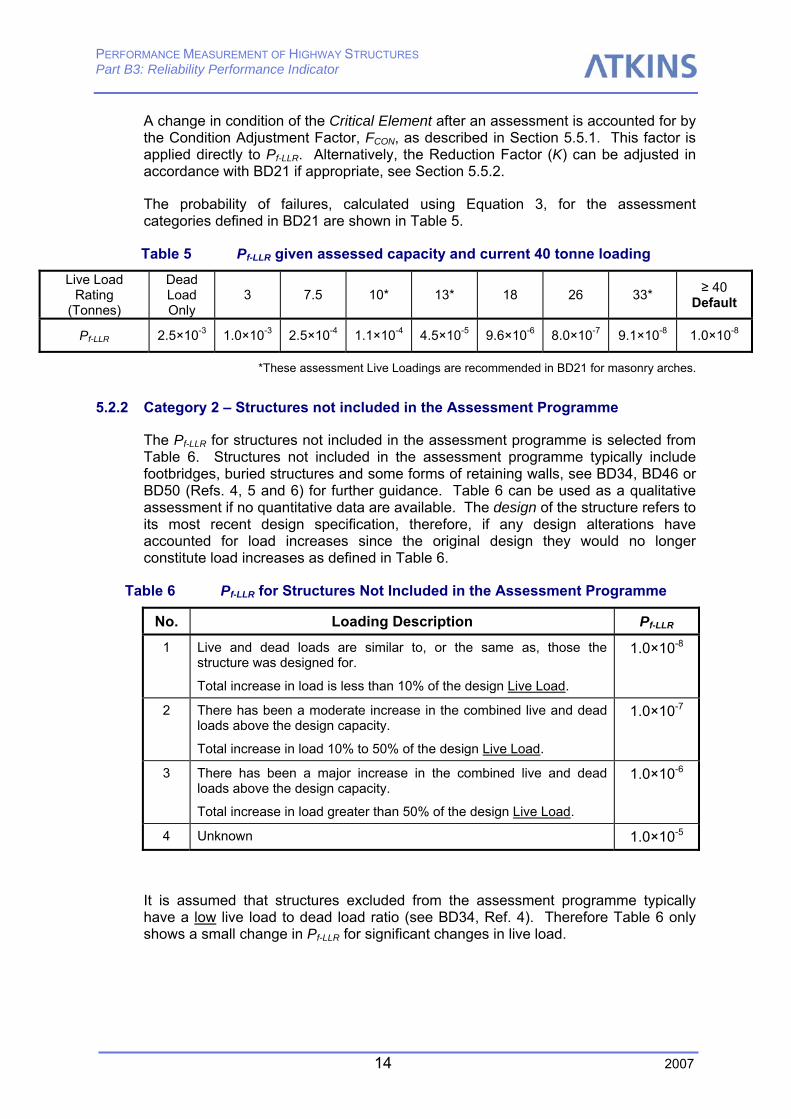
A change in condition of the Critical Element after an assessment is accounted for by the Condition Adjustment Factor, FCON, as described in Section 5.5.1. This factor is applied directly to Pf-LLR. Alternatively, the Reduction Factor (K) can be adjusted in accordance with BD21 if appropriate, see Section 5.5.2.
The probability of failures, calculated using Equation 3, for the assessment categories defined in BD21 are shown in Table 5.
Table 5 Pf-LLR given assessed capacity and current 40 tonne loading
Live Load Rating
(Tonnes)
Dead Load Only
3 7.5 10* 13* 18 26 33* ≥ 40 Default
Pf-LLR 2.5×10⁻³ 1.0×10⁻³ 2.5×10⁻⁴ 1.1×10⁻⁴ 4.5×10⁻⁵ 9.6×10⁻⁶ 8.0×10⁻⁷ 9.1×10⁻⁸ 1.0×10⁻⁸
*These assessment Live Loadings are recommended in BD21 for masonry arches.
5.2.2 Category 2 – Structures not included in the Assessment Programme
The Pf-LLR for structures not included in the assessment programme is selected from Table 6. Structures not included in the assessment programme typically include footbridges, buried structures and some forms of retaining walls, see BD34, BD46 or BD50 (Refs. 4, 5 and 6) for further guidance. Table 6 can be used as a qualitative assessment if no quantitative data are available. The design of the structure refers to its most recent design specification, therefore, if any design alterations have accounted for load increases since the original design they would no longer constitute load increases as defined in Table 6.
Table 6 Pf-LLR for Structures Not Included in the Assessment Programme
No. Loading Description Pf-LLR
1 Live and dead loads are similar to, or the same as, those the structure was designed for.
Total increase in load is less than 10% of the design Live Load.
1.0×10⁻⁸
2 There has been a moderate increase in the combined live and dead loads above the design capacity.
Total increase in load 10% to 50% of the design Live Load.
1.0×10⁻⁷
3 There has been a major increase in the combined live and dead loads above the design capacity.
Total increase in load greater than 50% of the design Live Load.
1.0×10⁻⁶
4 Unknown 1.0×10⁻⁵
It is assumed that structures excluded from the assessment programme typically have a low live load to dead load ratio (see BD34, Ref. 4). Therefore Table 6 only shows a small change in Pf-LLR for significant changes in live load.
PERFORMANCE MEASUREMENT OF HIGHWAY STRUCTURES Part B3: Reliability Performance Indicator
15 2007
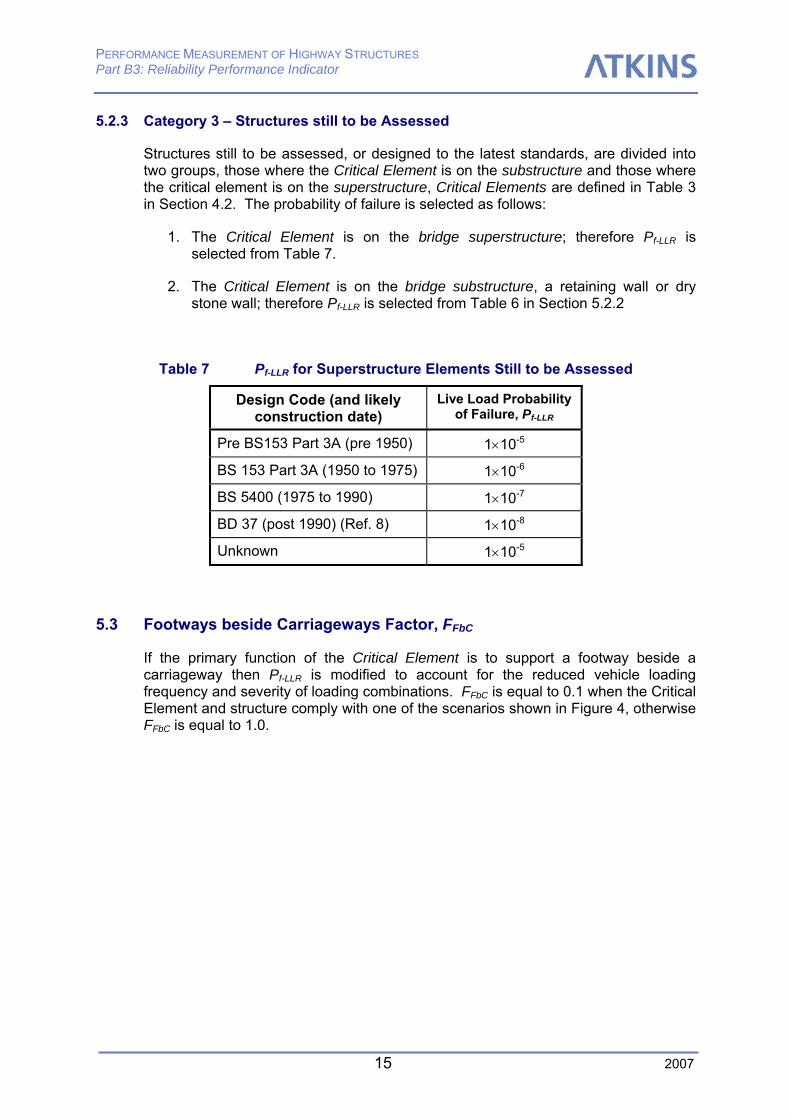
5.2.3 Category 3 – Structures still to be Assessed
Structures still to be assessed, or designed to the latest standards, are divided into two groups, those where the Critical Element is on the substructure and those where the critical element is on the superstructure, Critical Elements are defined in Table 3 in Section 4.2. The probability of failure is selected as follows:
1. The Critical Element is on the bridge superstructure; therefore Pf-LLR is selected from Table 7.
2. The Critical Element is on the bridge substructure, a retaining wall or dry stone wall; therefore Pf-LLR is selected from Table 6 in Section 5.2.2
Table 7 Pf-LLR for Superstructure Elements Still to be Assessed
Design Code (and likely construction date)
Live Load Probability of Failure, Pf-LLR
Pre BS153 Part 3A (pre 1950) 1×10⁻⁵
BS 153 Part 3A (1950 to 1975) 1×10⁻⁶
BS 5400 (1975 to 1990) 1×10⁻⁷
BD 37 (post 1990) (Ref. 8) 1×10⁻⁸
Unknown 1×10⁻⁵
5.3 Footways beside Carriageways Factor, FFbC
If the primary function of the Critical Element is to support a footway beside a carriageway then Pf-LLR is modified to account for the reduced vehicle loading frequency and severity of loading combinations. FFbC is equal to 0.1 when the Critical Element and structure comply with one of the scenarios shown in Figure 4, otherwise FFbC is equal to 1.0.
PERFORMANCE MEASUREMENT OF HIGHWAY STRUCTURES Part B3: Reliability Performance Indicator
16 2007
Figure 4 Footways besides Carriageways
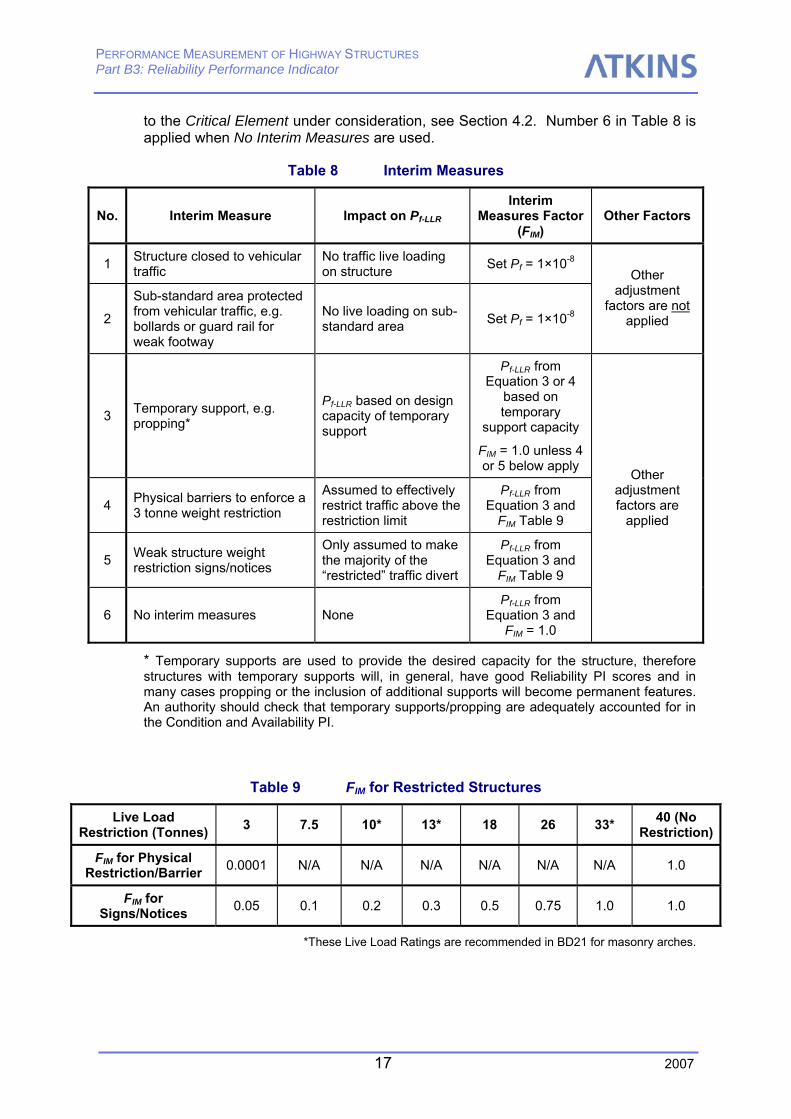
5.4 Interim Measures Adjustment Factor, FIM
Interim measures, in the context of the Reliability PI, are those that:
• Protect substandard structures, or a substandard area of a structure, from traffic loading; or
• Assist the structure in supporting the loading.
The interim measures considered, and their associated impact on the Pf-LLR, are shown in Table 8. The interim measure factor, FIM, selected form Table 8 must relate
1) Critical Element is an edge beam/cantilever that only carries the footway
Carriageway Footway
Critical Element
2) Critical Element is spandrel wall that primarily supports the footway. Only applicable when a ≥ b, where b is measured at the arch quarter points
Arch Barrel
Parapets
Fill b
Footway
Carriageway a a
b a 3) Critical Element is retaining
wall that primarily supports the footway. Only applicable when a ≥ b
Carriageway Footway
PERFORMANCE MEASUREMENT OF HIGHWAY STRUCTURES Part B3: Reliability Performance Indicator
17 2007
to the Critical Element under consideration, see Section 4.2. Number 6 in Table 8 is applied when No Interim Measures are used.
Table 8 Interim Measures
No. Interim Measure Impact on Pf-LLR Interim
Measures Factor (FIM)
Other Factors
1 Structure closed to vehicular traffic
No traffic live loading on structure Set Pf = 1×10⁻⁸
2
Sub-standard area protected from vehicular traffic, e.g. bollards or guard rail for weak footway
No live loading on sub-standard area Set Pf = 1×10⁻⁸
Other adjustment
factors are not applied
3 Temporary support, e.g. propping*
Pf-LLR based on design capacity of temporary support
Pf-LLR from Equation 3 or 4
based on temporary
support capacity
FIM = 1.0 unless 4 or 5 below apply
4 Physical barriers to enforce a 3 tonne weight restriction
Assumed to effectively restrict traffic above the restriction limit
Pf-LLR from Equation 3 and
FIM Table 9
5 Weak structure weight restriction signs/notices
Only assumed to make the majority of the “restricted” traffic divert
Pf-LLR from Equation 3 and
FIM Table 9
6 No interim measures None Pf-LLR from
Equation 3 and FIM = 1.0
Other adjustment factors are
applied
* Temporary supports are used to provide the desired capacity for the structure, therefore structures with temporary supports will, in general, have good Reliability PI scores and in many cases propping or the inclusion of additional supports will become permanent features. An authority should check that temporary supports/propping are adequately accounted for in the Condition and Availability PI.
Table 9 FIM for Restricted Structures
Live Load Restriction (Tonnes) 3 7.5 10* 13* 18 26 33* 40 (No
Restriction)
FIM for Physical Restriction/Barrier 0.0001 N/A N/A N/A N/A N/A N/A 1.0
FIM for Signs/Notices 0.05 0.1 0.2 0.3 0.5 0.75 1.0 1.0
*These Live Load Ratings are recommended in BD21 for masonry arches.

PERFORMANCE MEASUREMENT OF HIGHWAY STRUCTURES Part B3: Reliability Performance Indicator
18 2007
5.5 Condition Assessment
This section describes how the Probability of Failure is amended to account for the latest reported condition of the Critical Element. An authority may adopt either of the following approaches to carry out the condition assessment:
1. Condition Adjustment Factor, FCON (Section 5.5.1) – a simplified assessment procedure developed specifically for use with the Reliability PI. The latest condition data is used to directly amend the Probability of Failure evaluated in Section 5.2.
2. Condition Factor, FC (Section 5.5.2) – the latest condition data is used to re-assess the structure as described in BD21 (Ref. 7).
The former should be used for the Reliability PI. The BD21 approach has only been included for completeness and to indicate that it should be used (and not the Reliability PI procedure) if there are genuine concerns about the safety or load carrying capacity of the structure. The BD21 assessment should not be performed solely for the purpose of the Reliability PI evaluation.
5.5.1 Condition Adjustment Factor, FCON
FCON assumes that condition deterioration is directly proportional to decreasing load carrying capacity. This assumption may not hold true in all cases but it is deemed adequate for the Reliability PI evaluation. The severity/extent ratings used by FCON are shown in Table 10 and Table 11, see HA (Ref. 9) and CSS BCI (Ref. 10) guidance for additional details. If the condition data has not been reported on this scale then it should be translated to the Severity/Extent scale as described in Part B1.
Table 10 Generic Severity Descriptions
Code Description
1 As new condition or defect has no significant effect on the element (visually or functionally).
2 Early signs of deterioration, minor defect/damage, no reduction in functionality of element.
3 Moderate defect/damage, some loss of functionality could be expected
4 Severe defect/damage, significant loss of functionality and/or element is close to failure/collapse
5 The element is non-functional/failed
PERFORMANCE MEASUREMENT OF HIGHWAY STRUCTURES Part B3: Reliability Performance Indicator
19 2007
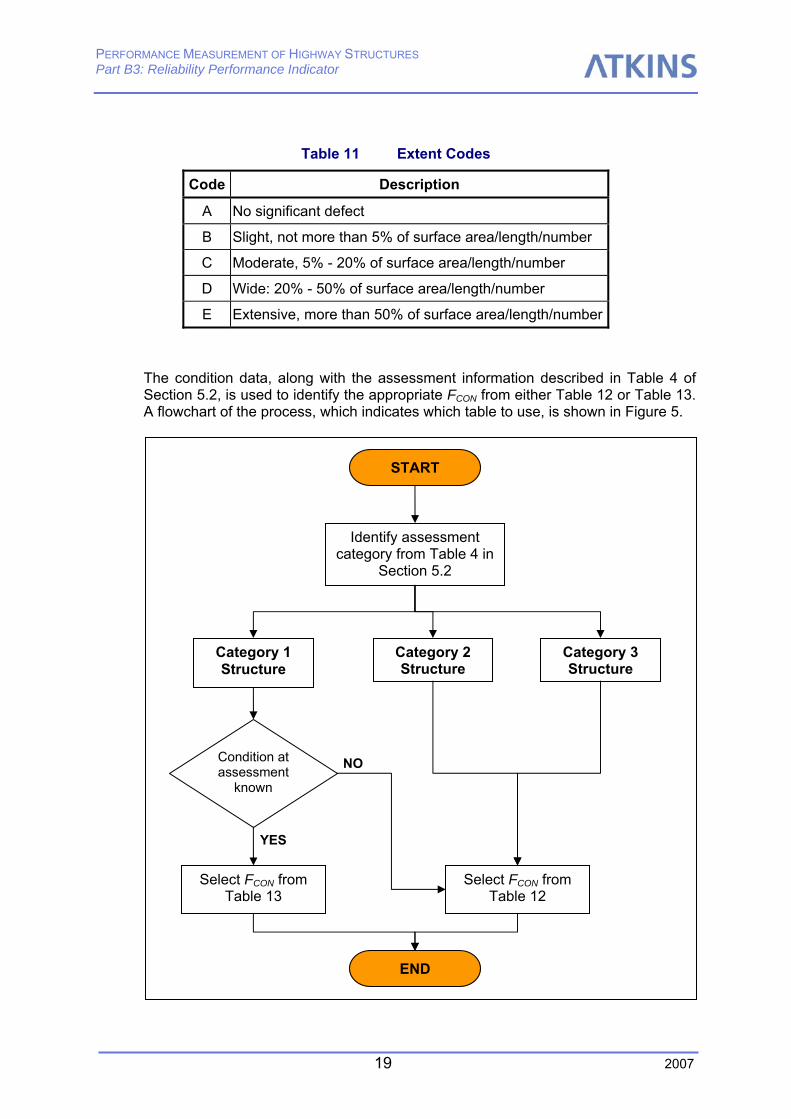
Table 11 Extent Codes
Code Description
A No significant defect
B Slight, not more than 5% of surface area/length/number
C Moderate, 5% - 20% of surface area/length/number
D Wide: 20% - 50% of surface area/length/number
E Extensive, more than 50% of surface area/length/number
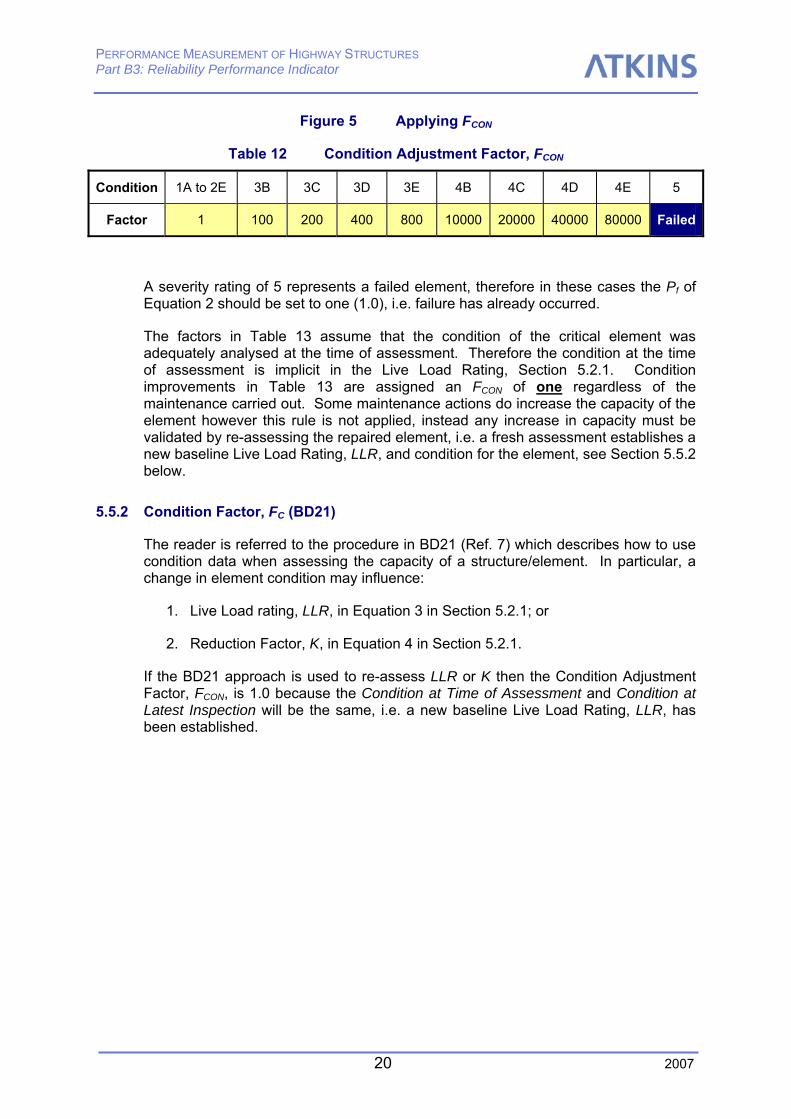
The condition data, along with the assessment information described in Table 4 of Section 5.2, is used to identify the appropriate FCON from either Table 12 or Table 13. A flowchart of the process, which indicates which table to use, is shown in Figure 5.
Category 1 Structure
Category 3 Structure
Category 2 Structure
Select FCON from Table 12
Condition at assessment
known
Select FCON from Table 13
START
Identify assessment category from Table 4 in
Section 5.2
END
NO
YES
PERFORMANCE MEASUREMENT OF HIGHWAY STRUCTURES Part B3: Reliability Performance Indicator
20 2007
Figure 5 Applying FCON
Table 12 Condition Adjustment Factor, FCON
Condition 1A to 2E 3B 3C 3D 3E 4B 4C 4D 4E 5
Factor 1 100 200 400 800 10000 20000 40000 80000 Failed
A severity rating of 5 represents a failed element, therefore in these cases the Pf of Equation 2 should be set to one (1.0), i.e. failure has already occurred.
The factors in Table 13 assume that the condition of the critical element was adequately analysed at the time of assessment. Therefore the condition at the time of assessment is implicit in the Live Load Rating, Section 5.2.1. Condition improvements in Table 13 are assigned an FCON of one regardless of the maintenance carried out. Some maintenance actions do increase the capacity of the element however this rule is not applied, instead any increase in capacity must be validated by re-assessing the repaired element, i.e. a fresh assessment establishes a new baseline Live Load Rating, LLR, and condition for the element, see Section 5.5.2 below.
5.5.2 Condition Factor, FC (BD21)
The reader is referred to the procedure in BD21 (Ref. 7) which describes how to use condition data when assessing the capacity of a structure/element. In particular, a change in element condition may influence:
1. Live Load rating, LLR, in Equation 3 in Section 5.2.1; or
2. Reduction Factor, K, in Equation 4 in Section 5.2.1.
If the BD21 approach is used to re-assess LLR or K then the Condition Adjustment Factor, FCON, is 1.0 because the Condition at Time of Assessment and Condition at Latest Inspection will be the same, i.e. a new baseline Live Load Rating, LLR, has been established.

PERFORMANCE MEASUREMENT OF HIGHWAY STRUCTURES Part B3: Reliability Performance Indicator
21 2007
Table 13 Modification factors for change in Condition since last assessment, FCON
Condition at Time of Assessment
1A 2B 2C 2D 2E 3B 3C 3D 3E 4B 4C 4D 4E 5
1A 1 1 1 1 1 1 1 1 1 1 1 1 1 Failed
2B 1 1 1 1 1 1 1 1 1 1 1 1 1 Failed
2C 1 1 1 1 1 1 1 1 1 1 1 1 1 Failed
2D 1 1 1 1 1 1 1 1 1 1 1 1 1 Failed
2E 1 1 1 1 1 1 1 1 1 1 1 1 1 Failed
3B 100 100 100 100 100 1 1 1 1 1 1 1 1 Failed
3C 200 200 200 200 200 2 1 1 1 1 1 1 1 Failed
3D 400 400 400 400 400 4 2 1 1 1 1 1 1 Failed
3E 800 800 800 800 800 8 4 2 1 1 1 1 1 Failed
4B 10000 10000 10000 10000 10000 100 100 100 100 1 1 1 1 Failed
4C 20000 20000 20000 20000 20000 200 200 200 200 2 1 1 1 Failed
4D 40000 40000 40000 40000 40000 400 400 400 400 4 2 1 1 Failed
4E 80000 80000 80000 80000 80000 800 800 800 800 8 4 2 1 Failed
Con
ditio
n at
Lat
est I
nspe
ctio
n af
ter
Ass
essm
ent
5 Failed Failed Failed Failed Failed Failed Failed Failed Failed Failed Failed Failed Failed Failed
where Failed = a failed element when in the severity rating is 5, a Pf of one (1.0) is assigned to Equation 2.
PERFORMANCE MEASUREMENT OF HIGHWAY STRUCTURES Part B3: Reliability Performance Indicator
22 2007
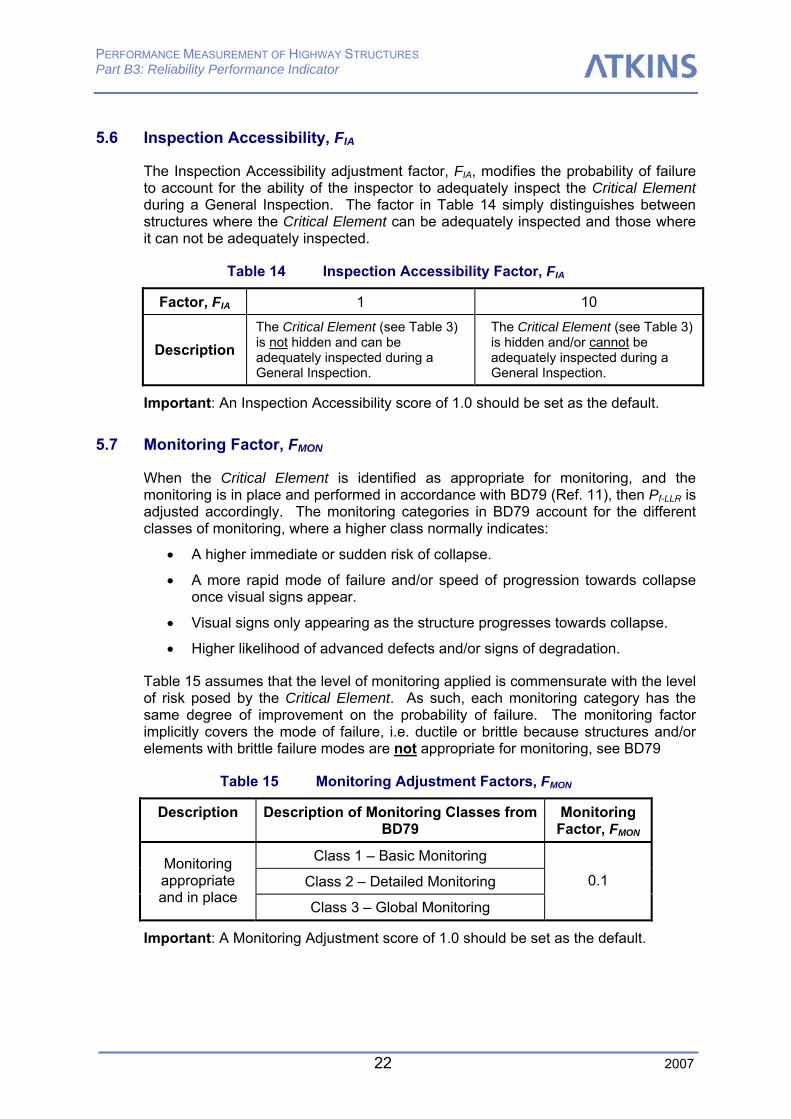
5.6 Inspection Accessibility, FIA
The Inspection Accessibility adjustment factor, FIA, modifies the probability of failure to account for the ability of the inspector to adequately inspect the Critical Element during a General Inspection. The factor in Table 14 simply distinguishes between structures where the Critical Element can be adequately inspected and those where it can not be adequately inspected.
Table 14 Inspection Accessibility Factor, FIA
Factor, FIA 1 10
Description The Critical Element (see Table 3) is not hidden and can be adequately inspected during a General Inspection.
The Critical Element (see Table 3) is hidden and/or cannot be adequately inspected during a General Inspection.
Important: An Inspection Accessibility score of 1.0 should be set as the default.
5.7 Monitoring Factor, FMON
When the Critical Element is identified as appropriate for monitoring, and the monitoring is in place and performed in accordance with BD79 (Ref. 11), then Pf-LLR is adjusted accordingly. The monitoring categories in BD79 account for the different classes of monitoring, where a higher class normally indicates:
• A higher immediate or sudden risk of collapse.
• A more rapid mode of failure and/or speed of progression towards collapse once visual signs appear.
• Visual signs only appearing as the structure progresses towards collapse.
• Higher likelihood of advanced defects and/or signs of degradation.
Table 15 assumes that the level of monitoring applied is commensurate with the level of risk posed by the Critical Element. As such, each monitoring category has the same degree of improvement on the probability of failure. The monitoring factor implicitly covers the mode of failure, i.e. ductile or brittle because structures and/or elements with brittle failure modes are not appropriate for monitoring, see BD79
Table 15 Monitoring Adjustment Factors, FMON
Description Description of Monitoring Classes from BD79
Monitoring Factor, FMON
Class 1 – Basic Monitoring
Class 2 – Detailed Monitoring Monitoring appropriate and in place
Class 3 – Global Monitoring
0.1
Important: A Monitoring Adjustment score of 1.0 should be set as the default.

PERFORMANCE MEASUREMENT OF HIGHWAY STRUCTURES Part B3: Reliability Performance Indicator
23 2007
6. Consequence of Failure
6.1 Overview of Consequence of Failure Procedure
The consequence of failure procedure was originally developed to include:
1. Traffic disruption = f(traffic volume, duration of reconstruction, extent of failure, diversion routes)
2. Obstacle crossed = f(obstacle crossed, duration of reconstruction, extent of failure, diversion routes)
3. Reconstruction cost = f(structure dimensions, extent of failure, unit reconstruction costs)
4. Casualties = f(traffic volume, obstacle crossed, structure dimensions, extent of failure)
5. Socio-Economic Impact = f(impact on community/area, duration of reconstruction, extent of failure)
All of the above factors were included and evaluated explicitly in the initial consequence model. Although the model produced reasonable and meaningful scores it also created an overly complex and data intensive procedure. This was not desirable because the Reliability PI needs to be evaluated for the majority of the structures in the stock and as such should be relatively straightforward with minimal data requirements
A sensitivity study demonstrated that the complexity of the procedure could be significantly reduced by making a number of generic simplifications. The simplifications retained the fundamental meaning and sensitivity of the complex model but enabled the procedure to be streamlined. The Consequence of Failure is thus described by Equation 5.
Cf = (4 × Casualty Score + Reconstruction Score +
0.5 × Disruption Score + Socio-Economic Impact Score) × Ext
( ) ( )[ ] ExtSEDisRCCasC SSSSf ×+×++×= 5.04
but Cf not > 100,000,000
Equation 5
Where CasS = Casualty Score, see Section 6.2
RCS = Reconstruction Score, see Section 6.3
DisS = Disruption Score, see Section 6.4
SES = Socio-Economic Impact Score, see Section 6.5
Ext = Extent of failure score, see Section 6.6
PERFORMANCE MEASUREMENT OF HIGHWAY STRUCTURES Part B3: Reliability Performance Indicator
24 2007
4 = adjustment factor to represent the higher importance of casualties
0.5 = adjustment factor to represents the lower importance of disruption
Equation 5 produces a score where each point is the equivalent of one pound (£1). Therefore, when the Consequence of Failure is combined with the Probability of Failure the risk score is in monetary terms.
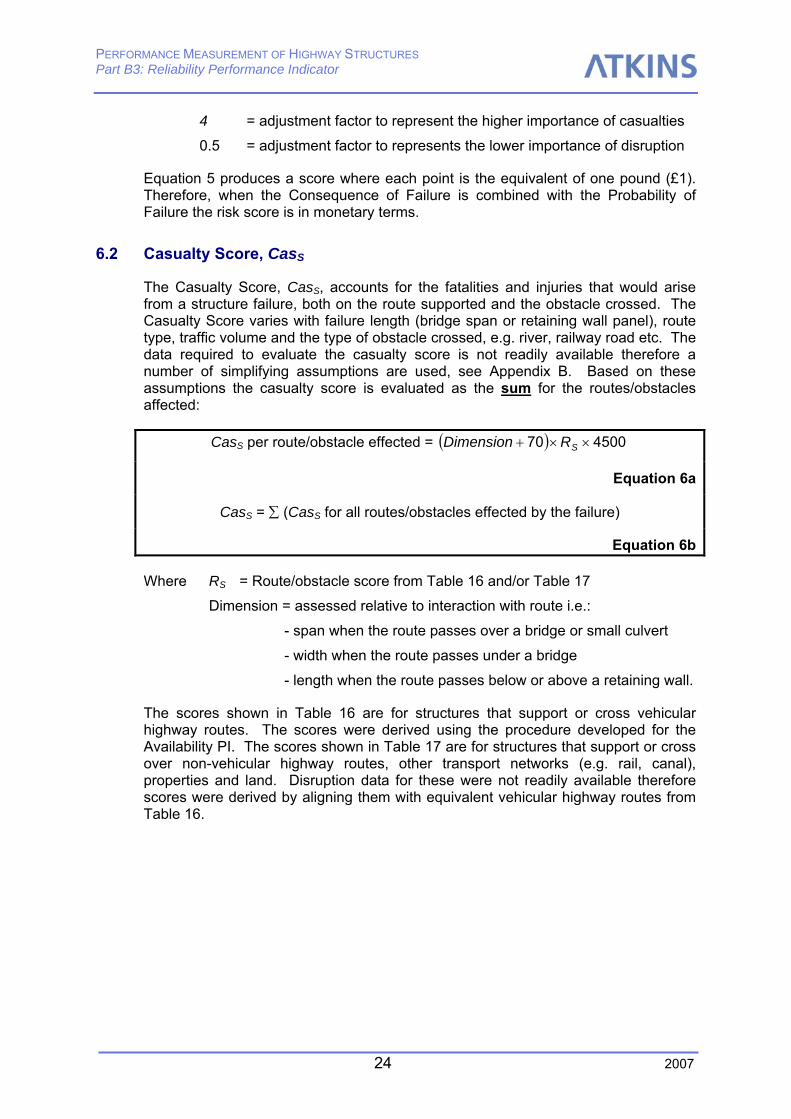
6.2 Casualty Score, CasS
The Casualty Score, CasS, accounts for the fatalities and injuries that would arise from a structure failure, both on the route supported and the obstacle crossed. The Casualty Score varies with failure length (bridge span or retaining wall panel), route type, traffic volume and the type of obstacle crossed, e.g. river, railway road etc. The data required to evaluate the casualty score is not readily available therefore a number of simplifying assumptions are used, see Appendix B. Based on these assumptions the casualty score is evaluated as the sum for the routes/obstacles affected:
CasS per route/obstacle effected = ( ) 450070 ××+ SRDimension
Equation 6a
CasS = ∑ (CasS for all routes/obstacles effected by the failure)
Equation 6b
Where RS = Route/obstacle score from Table 16 and/or Table 17
Dimension = assessed relative to interaction with route i.e.:
- span when the route passes over a bridge or small culvert
- width when the route passes under a bridge
- length when the route passes below or above a retaining wall.
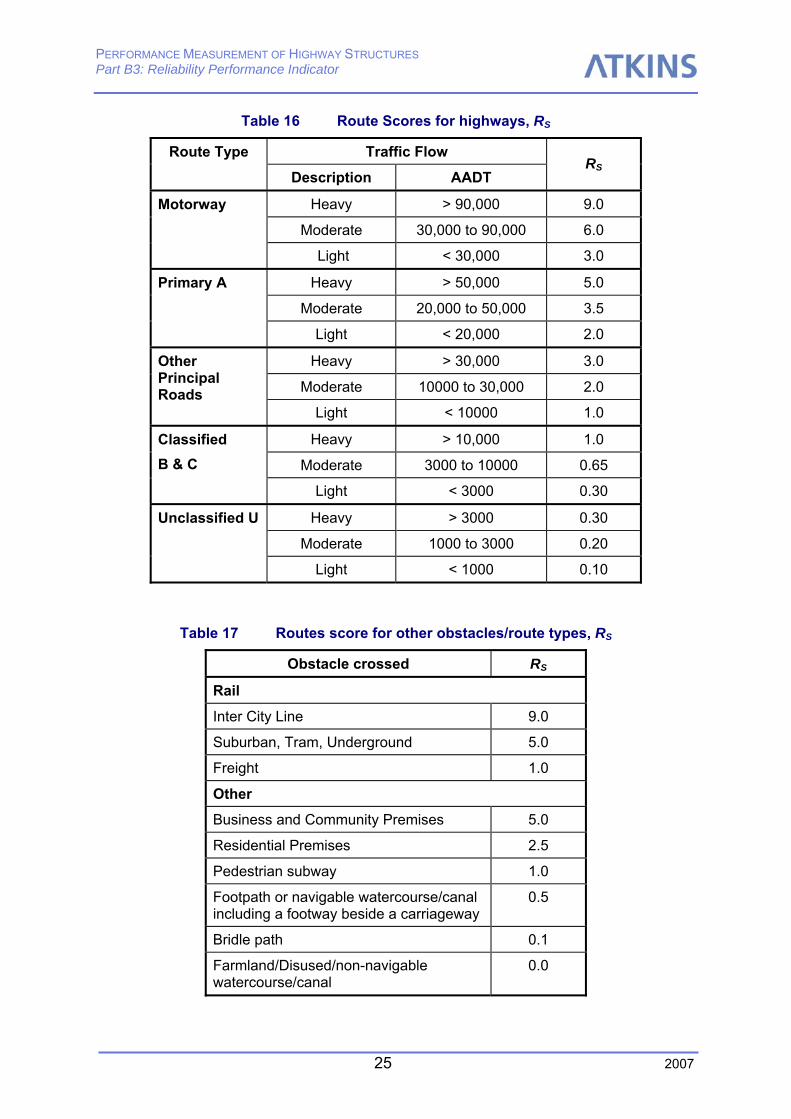
The scores shown in Table 16 are for structures that support or cross vehicular highway routes. The scores were derived using the procedure developed for the Availability PI. The scores shown in Table 17 are for structures that support or cross over non-vehicular highway routes, other transport networks (e.g. rail, canal), properties and land. Disruption data for these were not readily available therefore scores were derived by aligning them with equivalent vehicular highway routes from Table 16.
PERFORMANCE MEASUREMENT OF HIGHWAY STRUCTURES Part B3: Reliability Performance Indicator
25 2007
Table 16 Route Scores for highways, RS
Traffic Flow Route Type
Description AADT RS
Heavy > 90,000 9.0
Moderate 30,000 to 90,000 6.0
Motorway
Light < 30,000 3.0
Heavy > 50,000 5.0
Moderate 20,000 to 50,000 3.5
Primary A
Light < 20,000 2.0
Heavy > 30,000 3.0
Moderate 10000 to 30,000 2.0
Other Principal Roads
Light < 10000 1.0
Heavy > 10,000 1.0
Moderate 3000 to 10000 0.65
Classified B & C
Light < 3000 0.30
Heavy > 3000 0.30
Moderate 1000 to 3000 0.20
Unclassified U
Light < 1000 0.10
Table 17 Routes score for other obstacles/route types, RS
Obstacle crossed RS
Rail
Inter City Line 9.0
Suburban, Tram, Underground 5.0
Freight 1.0
Other
Business and Community Premises 5.0
Residential Premises 2.5
Pedestrian subway 1.0
Footpath or navigable watercourse/canal including a footway beside a carriageway
0.5
Bridle path 0.1
Farmland/Disused/non-navigable watercourse/canal
0.0

PERFORMANCE MEASUREMENT OF HIGHWAY STRUCTURES Part B3: Reliability Performance Indicator
26 2007
6.3 Reconstruction Score, RCS
The Reconstruction Score, RCS, is equal to the monetary value of reconstruction.
Important: If an authority holds reconstruction cost information for their structures, for example, Gross Replacement Costs for asset valuation, they should use this information for RCS. Otherwise, they may use the following generic equations which are based on a sample of recent construction projects.
Reconstruction score for bridges
( )( ) ( )[ ] ( ) ( ) 50000174251242426.9 max +×+×+××+×= LWWLspanRCS
Equation 7a
Reconstruction score for small culverts
RCS = 282 × L × W
Equation 7b
Reconstruction score for retaining walls
( )[ ] ( )LHHRCS ××+×= 881264
Equation 7c
Where spanmax = maximum span length for the bridge (m)
L = overall length of bridge, culvert or wall (m)
W = width of bridge or culvert (m)
H = retained height of retaining wall (m)
Where retained height is the level of fill at the back of the wall above the finished ground level at the front of the structure.
Important: For bridges with more than three spans it is highly unlikely that a failure would require more than three spans to be reconstructed; as such it is unrealistic for RCS to be based on the replacement cost of the whole structure. Instead, RCS should be based on the reconstruction cost of three spans.
6.4 Disruption Score, DisS
The disruption score, DisS, reflects the extra cost to road users caused by a failure. The extra cost is taken to be the extra user and vehicle costs incurred due to a longer journey length. A simplified relationship has been developed, based on the principles established by the Availability PI, that takes into account the traffic volume, the increased journey length, vehicle/user costs and the duration of the disruption.
Important: The disruption score should be the summation of each route (highway and other) effected by the failure of a structure.

PERFORMANCE MEASUREMENT OF HIGHWAY STRUCTURES Part B3: Reliability Performance Indicator
27 2007
Disruption score for highways and other route types
DisS = f(traffic volume, increased journey length,
vehicle/user costs, duration of disruption)
DisS per route effected by the failure = ( ) DurIJLR kmS ×××1500
Equation 8a
DisS = ∑DisS per route effected by the failure
Equation 8b
Where
RS = Route/obstacle score from Table 16 and/or Table 17
IJLkm = Increased Journey Length in km, see Section 6.4.1
1500 = factor relating to costs per user/vehicle per km travelled
DurS = duration score based on span/panel length, see Section 6.4.2
Equation 8a was evaluated using highway traffic information. Data on other route types (railways, footways, waterways etc.) was not readily available therefore the same equation is used for other route types by selecting the equivalent RS value from Table 17.
6.4.1 Increased Journey Length, IJLkm
The diversion route scores are based on the Increased Journey Length, IJL, procedure used by the Availability PI. The increased journey length is defined as:
Motorway, Primary A and Other Principal Routes
Increased Journey Length = (Length of diversion route from junction A to B)
– (Length of original route from junction A to B)
Classified B & C and Unclassified U Routes
Increased Journey Length =
Distance from one side of the restricted structure to the other via a diversion
More prescriptive guidance, including diagrams, is provided in Section 5.7 of Part B2: Availability PI. The IJLkm is selected from Table 18 below.
Important: It is recommended that an IJLkm of No Alternative is used for railways and navigable waterways. An increased journey length of Very Short should be used as the default setting.

PERFORMANCE MEASUREMENT OF HIGHWAY STRUCTURES Part B3: Reliability Performance Indicator
28 2007
Table 18 Increased Journey Length Score, IJLkm
Preferred Diversion Route
Increased Journey Length, km
IJLkm
Very Short < 2km 1
Short 2 to 5km 3.5
Medium 5 to 10km 7.5
Long 10 to 20km 15
Very Long > 20km 25
No alternative - 50
6.4.2 Duration of Reconstruction, DurS
The duration of reconstruction is based on the size of the structure, i.e. bridge span or length and retaining wall height. The duration of the reconstruction, DurS, implicitly covers:
1. Duration of the failure investigation.
2. Duration of design and checking.
3. Duration of site preparation and preliminaries.
4. Duration of reconstruction.
The duration is based on the total reconstruction period and this is factored by Ext (see Equation 5 in Section 6.1) to take into the account the actual extent of the failure, see Section 6.6 below. The reconstruction duration for retaining walls is based on the height because a finite length of the wall is assumed to fail. The duration, DurS, in days, is selected from Table 19.
Table 19 Duration of Reconstruction Factor, DurS
Bridge/Span Length < 5m 5 to 10m 10 to 25m 25 to 50m > 50m
Small Culverts All sizes - - - -
Retaining Wall Height < 2m 2 to 4m > 4m - -
Motorway, Primary and Other Principal
30 30 45 60 90 DurS (days)
Other Roads 30 60 90 120 180
6.5 Socio-Economic Score, SES
The Socio-Economic impact of a failure is difficult to quantify because it is the cost to a community and/or businesses. Therefore, a subjective assessment of the importance of a structure should be made, taking into account:
1. The impact on emergency vehicle access.
PERFORMANCE MEASUREMENT OF HIGHWAY STRUCTURES Part B3: Reliability Performance Indicator
29 2007
2. The impact on the community and business, such as.
a. Access to community facilities, e.g. hospital, library, council offices etc.
b. Business deliveries.
c. Vehicles diverted past sensitive areas, e.g. schools, parks etc.
3. The size of the community, business or industry served by the route.
Based on this subjective assessment of importance, a Socio-Economic score, SES, should be selected for each structure based on the categories shown in Table 20.
Table 20 Socio-Economic Score, SES
Importance Motorway, Primary and Other Principal
Other Roads
High 10,000,000 1,000,000
Medium 1,000,000 100,000
Low 100,000 0
Important: Low importance should be set as the default.
This approach is more straightforward than that used in the Availability PI because the Reliability PI requires a value for all structures whereas the Availability PI only requires a socio-economic score for those structures with restrictions.
6.6 Extent of Failure, Ext
The extent of failure factor, Ext, is used to estimate the magnitude of the failure. Ext is based on the classification of the Critical Element (as defined in Table 3 in Section 4.2) because the structural form of the Critical Element is assumed to influence the extent of the failure. The Critical Element classification is therefore used to select the appropriate Ext factor from Table 21. However, if the engineer believes the Ext score defined by the Critical Element classification is inappropriate they may select a more appropriate (higher or lower) Ext score from Table 21.
Table 21 Extent of Failure Factor, Ext
Consequence Category (defined in Table 3)
Ext
Very High 1.0
High 0.5
Medium 0.25
Low 0.1

PERFORMANCE MEASUREMENT OF HIGHWAY STRUCTURES Part B3: Reliability Performance Indicator
30 2007
7. Reliability PI Score
7.1 Individual Structure Risk and Reliability PI
The risk posed by an individual structure is calculated using Equation 9.
Individual Structural Risk = Probability of Failure × Consequences of Failure
Equation 9
The risk scores are categorised as:
• Risk score ≤ 1.0 – structural capacity is adequate and/or consequence of failure is low; and
• Risk score ≥ 10,000 – structural capacity may represent an unacceptable risk to road users and/or the consequence of failure is high.
• Risk score > 1.0 and < 10,000 – structural capacity and consequence of failure are gradually changing between the aforementioned bounds.
The relationship between the risk score and the Reliability PI is shown in Figure 6.
0
10
20
30
40
50
60
70
80
90
100
1 10 100 1000 10000
Risk (Pf x Cf) - Ln Scale
Relia
bilit
y PI
Figure 6 Risk and Reliability PI relationship
Figure 6 shows the Reliability PI scale aligned with upper (10,000) and lower (1.0) risk bounds. The Reliability PI score, and the above graph, are calculated using the following equations.
PERFORMANCE MEASUREMENT OF HIGHWAY STRUCTURES Part B3: Reliability Performance Indicator
31 2007
Individual Structure Reliability PI
If Risk ≤ 1 then
Reliability PI = 100
If Risk > 1 and ≤ 10,000 then
Reliability PI = ( )[ ]Riskln857.10100 ×−
If Risk > 10,000 then
Reliability PI = 0
Equation 10
7.2 Structure Group and Stock Reliability PI
The structure group and stock Reliability PI are the average of the individual Reliability PI scores. Therefore the structure group or stock score are calculated using Equation 11.
( )N
score PIy Reliabilit IndividualPIy Reliabilit Stock or Group ∑=
Equation 11
Where N = total number of structures in the structure group or stock for which Reliability PI scores have been evaluated.
7.3 Reliability PI Scale
The Reliability PI is evaluated on a scale of 0 to 100 where:
• 0 represents very poor/unaceptable structural reliability; and
• 100 represents very good structural reliability.
Descriptions of the Reliability PI categories, applicable to individual structures, are shown in Table 22. The Reliability PI categories align with the Condition PI and Availability PI categories.
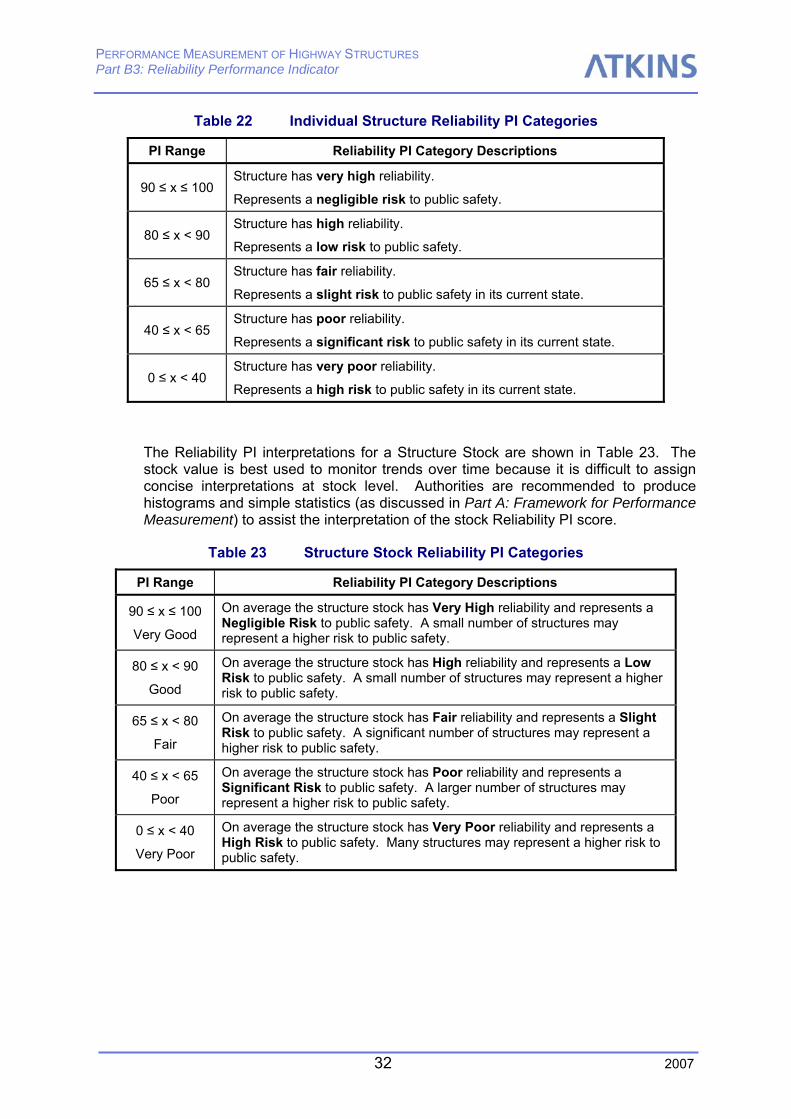
PERFORMANCE MEASUREMENT OF HIGHWAY STRUCTURES Part B3: Reliability Performance Indicator
32 2007
Table 22 Individual Structure Reliability PI Categories
PI Range Reliability PI Category Descriptions
90 ≤ x ≤ 100 Structure has very high reliability.
Represents a negligible risk to public safety.
80 ≤ x < 90 Structure has high reliability.
Represents a low risk to public safety.
65 ≤ x < 80 Structure has fair reliability.
Represents a slight risk to public safety in its current state.
40 ≤ x < 65 Structure has poor reliability.
Represents a significant risk to public safety in its current state.
0 ≤ x < 40 Structure has very poor reliability.
Represents a high risk to public safety in its current state.
The Reliability PI interpretations for a Structure Stock are shown in Table 23. The stock value is best used to monitor trends over time because it is difficult to assign concise interpretations at stock level. Authorities are recommended to produce histograms and simple statistics (as discussed in Part A: Framework for Performance Measurement) to assist the interpretation of the stock Reliability PI score.
Table 23 Structure Stock Reliability PI Categories
PI Range Reliability PI Category Descriptions
90 ≤ x ≤ 100
Very Good
On average the structure stock has Very High reliability and represents a Negligible Risk to public safety. A small number of structures may represent a higher risk to public safety.
80 ≤ x < 90
Good
On average the structure stock has High reliability and represents a Low Risk to public safety. A small number of structures may represent a higher risk to public safety.
65 ≤ x < 80
Fair
On average the structure stock has Fair reliability and represents a Slight Risk to public safety. A significant number of structures may represent a higher risk to public safety.
40 ≤ x < 65
Poor
On average the structure stock has Poor reliability and represents a Significant Risk to public safety. A larger number of structures may represent a higher risk to public safety.
0 ≤ x < 40
Very Poor
On average the structure stock has Very Poor reliability and represents a High Risk to public safety. Many structures may represent a higher risk to public safety.
PERFORMANCE MEASUREMENT OF HIGHWAY STRUCTURES Part B3: Reliability Performance Indicator
33 2007
8. References 1. Management of Highway Structures: A Code of Practice, UK Bridges Group,
September 2005, TSO.
2. BD62 As Built, Operational and Maintenance Records for Highway Structures (DMRB 3.2.1).
3. BD63 Inspection of Highway Structures (DMRB 3.1.4).
4. BD34: Technical Requirements for the Assessment and Strengthening Programme for Highway Structures: Stage 1 – Older Short Span Bridges and Retaining Structures (DMRB 3.4).
5. BD46: Technical Requirements for the Assessment and Strengthening Programme for Highway Structures: Stage 2 – Modern Short Span Bridges (DMRB 3.4.1).
6. BD50: Technical Requirements for the Assessment and Strengthening Programme for Highway Structures: Stage 3 – Long Span Bridges (DMRB 3.4.2).
7. BD21: The assessment of highway bridges and structures (DMRB 3.4.3).
8. BD37: Loads for Highway Bridges (DMRB 1.3.14).
9. SMIS – A guide for structure inspectors, Highway Agency
10. CSS Bridge Condition Indicators Volume 2: Bridge Inspection Reporting, April 2002.
11. BD79: The management of sub-standard highway structures (DMRB 3.4.18).
12. Road Accidents Great Britain 1998, DETR.
13. Reducing Risks, Protecting People; HSE’s Decision Making Process, HSE, 2001.
14. Economic Assessment of Road Maintenance: The QUADRO Manual: Part 2 – the valuation of costs in QUADRO, Highways Agency, May 2002.
PERFORMANCE MEASUREMENT OF HIGHWAY STRUCTURES Part B3: Reliability Performance Indicator
34 2007
APPENDIX A Live Load Rating and Probability of Failure
PERFORMANCE MEASUREMENT OF HIGHWAY STRUCTURES Part B3: Reliability Performance Indicator
35 2007
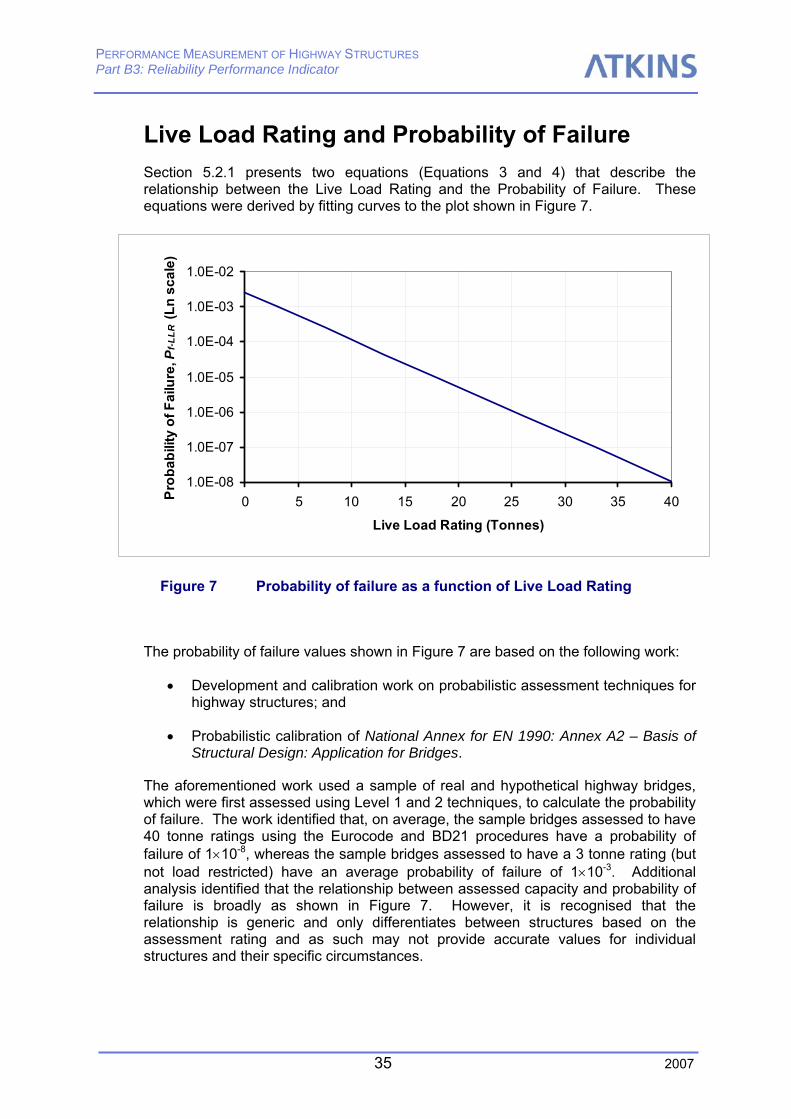
Live Load Rating and Probability of Failure Section 5.2.1 presents two equations (Equations 3 and 4) that describe the relationship between the Live Load Rating and the Probability of Failure. These equations were derived by fitting curves to the plot shown in Figure 7.
1.0E-08
1.0E-07
1.0E-06
1.0E-05
1.0E-04
1.0E-03
1.0E-02
0 5 10 15 20 25 30 35 40
Live Load Rating (Tonnes)
Prob
abili
ty o
f Fai
lure
, Pf-
LLR
(Ln
scal
e)
Figure 7 Probability of failure as a function of Live Load Rating
The probability of failure values shown in Figure 7 are based on the following work:
• Development and calibration work on probabilistic assessment techniques for highway structures; and
• Probabilistic calibration of National Annex for EN 1990: Annex A2 – Basis of Structural Design: Application for Bridges.
The aforementioned work used a sample of real and hypothetical highway bridges, which were first assessed using Level 1 and 2 techniques, to calculate the probability of failure. The work identified that, on average, the sample bridges assessed to have 40 tonne ratings using the Eurocode and BD21 procedures have a probability of failure of 1×10⁻⁸, whereas the sample bridges assessed to have a 3 tonne rating (but not load restricted) have an average probability of failure of 1×10⁻³. Additional analysis identified that the relationship between assessed capacity and probability of failure is broadly as shown in Figure 7. However, it is recognised that the relationship is generic and only differentiates between structures based on the assessment rating and as such may not provide accurate values for individual structures and their specific circumstances.
PERFORMANCE MEASUREMENT OF HIGHWAY STRUCTURES Part B3: Reliability Performance Indicator
36 2007
APPENDIX B Casualty Assumptions

PERFORMANCE MEASUREMENT OF HIGHWAY STRUCTURES Part B3: Reliability Performance Indicator
37 2007
Casualty Assumptions The simplifying assumptions used to derive the Casualty Score equation are:
1. The casualty costs are the same for a given road type whether it is crossing over or passing under a bridge.
2. Fatalities and injuries are as defined in Ref. 12 (Road Accidents Great Britain 1998, DETR), and:
o one fatality is equivalent to £1,000,000 (HSE value of preventing a fatality, VPF, Ref. 13),
o one serious injury is equivalent to £250,000.
o one slight injury is equivalent to £10,000.
3. Given a failure occurs it is assumed that for vehicles directly involved:
o ¼ of vehicle occupants are fatalities
o ½ of vehicle occupants are serious injuries; and
o ¼ of vehicle occupants are slight injuries.
4. Stopping distances are taken from the Highway Code, average speed of 80km/hr assumed.
5. Vehicle occupancy taken from QUADRO, Ref. 14.
6. Vehicle proportions taken from QUADRO, Ref. 14.
7. Road occupancy taken as 16 hours per day.