Embed Size (px)
Citation preview

Authors: Andrea Turner, Juliet Willetts, Simon Fane, Damien Giurco, Joanne Chong, Alex Kazaglis and Stuart White Institute for Sustainable Futures, University of Technology Sydney
Guide to Demand Management and Integrated Resource Planning

The original Guide to Demand Management was released by WSAA in July 2008 and should be cited as: Turner, A., Willetts, J., Fane, S., Giurco, D., Kazaglis, A., and White S., 2008. Guide to Demand Management. Prepared by the Institute for Sustainable Futures, University of Technology, Sydney for Water Services Association of Australia Inc. This Guide is an update of the original (2008) and should be cited as: Turner, A., Willets, J., Fane, S., Giurco, D., Chong, J., Kazaglis, A., and White S., 2010. Guide to Demand Management and Integrated Resource Planning. Prepared by the Institute for Sustainable Futures, University of Technology Sydney for the National Water Commission and the Water Services Association of Australia, Inc.
Guide to Demand Management i
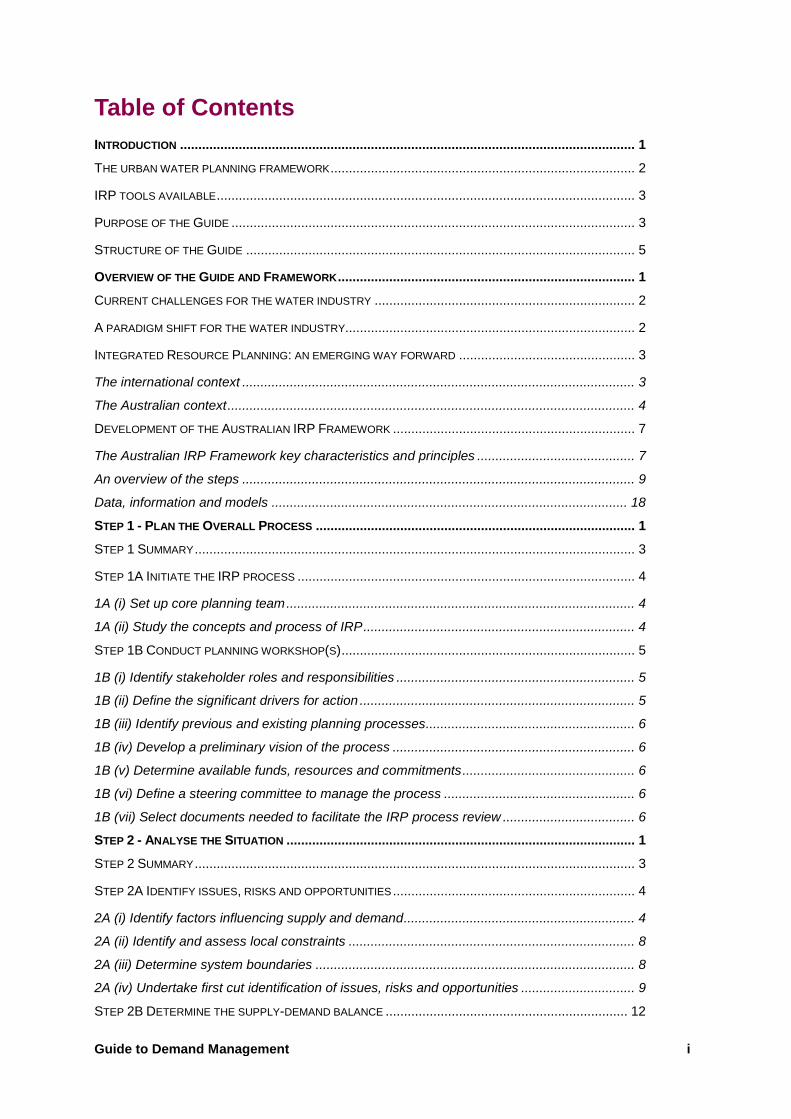
Table of Contents INTRODUCTION ............................................................................................................................ 1 THE URBAN WATER PLANNING FRAMEWORK ................................................................................... 2
IRP TOOLS AVAILABLE .................................................................................................................. 3
PURPOSE OF THE GUIDE .............................................................................................................. 3
STRUCTURE OF THE GUIDE .......................................................................................................... 5
OVERVIEW OF THE GUIDE AND FRAMEWORK ................................................................................. 1 CURRENT CHALLENGES FOR THE WATER INDUSTRY ....................................................................... 2
A PARADIGM SHIFT FOR THE WATER INDUSTRY............................................................................... 2
INTEGRATED RESOURCE PLANNING: AN EMERGING WAY FORWARD ................................................ 3
The international context ........................................................................................................... 3 The Australian context ............................................................................................................... 4 DEVELOPMENT OF THE AUSTRALIAN IRP FRAMEWORK .................................................................. 7
The Australian IRP Framework key characteristics and principles ........................................... 7 An overview of the steps ........................................................................................................... 9 Data, information and models ................................................................................................. 18 STEP 1 - PLAN THE OVERALL PROCESS ....................................................................................... 1 STEP 1 SUMMARY ........................................................................................................................ 3
STEP 1A INITIATE THE IRP PROCESS ............................................................................................ 4
1A (i) Set up core planning team ............................................................................................... 4 1A (ii) Study the concepts and process of IRP .......................................................................... 4 STEP 1B CONDUCT PLANNING WORKSHOP(S) ................................................................................ 5
1B (i) Identify stakeholder roles and responsibilities ................................................................. 5 1B (ii) Define the significant drivers for action ........................................................................... 5 1B (iii) Identify previous and existing planning processes ......................................................... 6 1B (iv) Develop a preliminary vision of the process .................................................................. 6 1B (v) Determine available funds, resources and commitments ............................................... 6 1B (vi) Define a steering committee to manage the process .................................................... 6 1B (vii) Select documents needed to facilitate the IRP process review .................................... 6 STEP 2 - ANALYSE THE SITUATION ............................................................................................... 1 STEP 2 SUMMARY ........................................................................................................................ 3
STEP 2A IDENTIFY ISSUES, RISKS AND OPPORTUNITIES .................................................................. 4
2A (i) Identify factors influencing supply and demand ............................................................... 4 2A (ii) Identify and assess local constraints .............................................................................. 8 2A (iii) Determine system boundaries ....................................................................................... 8 2A (iv) Undertake first cut identification of issues, risks and opportunities ............................... 9 STEP 2B DETERMINE THE SUPPLY-DEMAND BALANCE .................................................................. 12

ii Guide to Demand Management
2B (i) Assess demand forecasting methods ............................................................................ 12 2B (ii) Choose a demand forecasting method ......................................................................... 16 2B (iii) Consider your data needs ............................................................................................ 17 2B (iv) Choose model .............................................................................................................. 19 2B (v) Collect demographic data ............................................................................................. 19 2B (vi) Collect utility-side data ................................................................................................. 24 2B (vii) Conduct sector-based demand forecast ..................................................................... 30 2B (viii) Collect customer-side data for sector/end use demand forecasting .......................... 32 2B (ix) Consider data collection methods ................................................................................ 38 2B (x) Conduct sector-based or end use-based demand forecasting ..................................... 41 STEP 2C RE-ASSESS ISSUES, RISKS AND OPPORTUNITIES ............................................................ 42
2C (i) Communicate and interpret the supply-demand balance .............................................. 42 2C (ii) Re-assess the priorities of the region ........................................................................... 42 STEP 2D SET PLANNING OBJECTIVES .......................................................................................... 43
STEP 3 - DEVELOP THE RESPONSE ............................................................................................... 1 STEP 3 SUMMARY ........................................................................................................................ 3
STEP 3A FRAME THE ANALYSIS ..................................................................................................... 4
3A (i) Re-establish the objectives in the analytical context ....................................................... 4 3A (ii) Determine the depth of analysis ..................................................................................... 4 STEP 3B IDENTIFY AND DESIGN POTENTIAL OPTIONS ...................................................................... 6
3B (i) Identify water conservation potential ............................................................................... 7 3B (ii) Identify potential for potable water source substitution ................................................... 9 3B (iii) Identify factors that affect option design ........................................................................ 9 3B (iv) Design options ............................................................................................................. 12 STEP 3C ANALYSE INDIVIDUAL OPTIONS ...................................................................................... 20
3C (i) Determine the cost perspectives ................................................................................... 21 3C (ii) Determine the cost elements ........................................................................................ 24 3C (iii) Determine the cost criteria to be used ......................................................................... 28 3C (iv) Calculate the net present value and unit cost of each option ...................................... 30 3C (v) Rank the options ........................................................................................................... 31 STEP 3D ANALYSE GROUPED OPTIONS AND SCENARIOS............................................................... 34
3D (i) Decide on appropriate scope of analysis ...................................................................... 34 3D (ii) Decide on assessment approach and conduct assessment ........................................ 34 STEP 4 - IMPLEMENT THE RESPONSE ............................................................................................ 1 STEP 4 SUMMARY ........................................................................................................................ 3
STEP 4A PLAN DEMAND-SIDE IMPLEMENTATION ............................................................................. 4
4A (i) Form stakeholder reference group .................................................................................. 4 4A (ii) Identify demand management team ............................................................................... 5

Guide to Demand Management iii
4A (iii) Develop budget plans..................................................................................................... 6 4A (iv) Develop a communication strategy ................................................................................ 7 4A (v) Consider contractual arrangements ................................................................................ 9 4A (vi) Identify training needs .................................................................................................. 11 4A (vii) Identify data gaps ........................................................................................................ 11 4A (viii) Schedule monitoring and evaluation .......................................................................... 11 4A (ix) Coordinate with other agencies ................................................................................... 11 4A (x) Document implementation plan .................................................................................... 12 STEP 4B UNDERTAKE PILOT PROGRAM ....................................................................................... 15
4B (i) Determine implementation issues .................................................................................. 15 4B (ii) Determine how to fill data gaps ..................................................................................... 16 4B (iii) Determine how to analyse and use new data .............................................................. 17 STEP 4C IMPLEMENT FULL PROGRAM .......................................................................................... 19
4C (i) Adjust implementation plan based on pilot findings ...................................................... 19 4C (ii) Conduct implementation activities ................................................................................ 19 STEP 5 - MONITOR, EVALUATE & REVIEW ..................................................................................... 1 STEP 5 SUMMARY ........................................................................................................................ 3
STEP 5A MONITOR AND EVALUATE INDIVIDUAL PROGRAMS ............................................................. 4
5A (i) Monitor and evaluate outcomes and processes in the residential sector ........................ 4 5A (ii) Monitor and evaluate outcomes and processes in the non-residential sector .............. 12 STEP 5B MONITOR AND EVALUATE FULL SUITE OF PROGRAMS ...................................................... 16
5B (i) Comparative advantages and disadvantages of programs ........................................... 16 5B (ii) Analyse how programs collectively meet planning objectives ...................................... 16 STEP 5C REVIEW OF THE IRP PROCESS ..................................................................................... 18
5C (i) Decide focus and scope of the review ........................................................................... 18 5C (ii) Collate relevant information documented during the IRP process ............................... 19 5C (iii) Talk to people involved in IRP process ........................................................................ 19 5C (iv) Analyse and reflect on the information collected ......................................................... 19 5C (v) Disseminate results of the review ................................................................................. 19 Appendix A. National Urban Water Planning Principles……………………………………..1-2
Appendix B. Data binning………………………………………………………………………….1
Glossary……………………………………………………………………………………………….1-6
References ……………………………………………………………………………………………1-9

iv Guide to Demand Management
List of Tables TABLE 1 DIFFERENCE BETWEEN TRADITIONAL PLANNING AND IRP PROCESS (ADAPTED FROM BEECHER 1995) TABLE 2 - 1 BENEFITS AND LIMITATIONS OF DEMAND FORECASTING METHODS TABLE 2 - 2 TYPICAL DATA COLLECTION METHODS TABLE 2 - 3 POSSIBLE OBJECTIVES FOR INTEGRATED RESOURCE PLANNING IN THE ELECTRICITY INDUSTRY, AS DESCRIBED IN TELLUS INSTITUTE (2000) TABLE 3 - 1 OBJECTIVE, CHOICE AND ASSESSMENT TABLE 3 - 2 LEVEL AND DEPTH OF ANALYSIS FOR DIFFERENT PLANNING GOALS TABLE 3 - 3 FACTORS OR POLICY ACTIONS THAT INFLUENCE YIELD OR DEMAND TABLE 3 - 4 OPTIONS TABLE 3 - 5 TYPICAL COSTS TABLE 4 - 1 COMMUNICATIVE AND EDUCATIVE TOOLS TABLE 4 - 2 KEY ELEMENTS OF AN IMPLEMENTATION PLAN TABLE 5 - 1 A SELECTION OF EVALUATION LITERATURE TABLE 5 - 2 COMPARISON OF SOME COMMON METHODS TO EVALUATE WATER SAVINGS

Guide to Demand Management v
List of Figures FIGURE 1 THE AUSTRALIAN INTEGRATED RESOURCE PLANNING FRAMEWORK FIGURE 1 - 1 PLAN THE OVERALL PROCESS FIGURE 2 - 1 ANALYSE THE SITUATION FIGURE 2 - 2 FACTORS THAT INFLUENCE DEMAND (WHITE 2003 P15) FIGURE 2 - 3 PROJECTION OF DEMAND BASED ON PER CAPITA DEMAND USING DIFFERENT TIME PERIODS (WHITE 1996) FIGURE 2 - 4 EXAMPLE OF COMPARISON OF DEMAND METHODS (TURNER ET AL, 2005) FIGURE 2 - 5 SIMPLIFIED EXAMPLE OF A SYSTEM (TURNER ET AL, 2005) FIGURE 2 - 6 DATA/INFORMATION COLLECTION (TURNER ET AL, 2005) FIGURE 2 - 7 TYPICAL EXAMPLE OF AN ABS DEMOGRAPHIC MAP FIGURE 2 - 8 ABS TABLE B18 FIGURE 2 - 9 ABS TABLE B19 FIGURE 2 - 10 STANDARD IWA DEFINITIONS OF TERMS RELATING TO NON REVENUE WATER (SOURCE: IWA, 2000) FIGURE 2 - 11 DEMAND FOR SHOWERS – EXAMPLE FIGURE 2 - 12 EXAMPLE OF CLOTHES WASHER STOCK MODEL OUTPUT, FOR AUSTRALIA AS A WHOLE (WHITE ET AL., 2004) FIGURE 3 - 1 STEP 3 DEVELOP THE RESPONSE FIGURE 3 - 2 DISAGGREGATION OF DEMAND TO DETERMINE CONSERVATION POTENTIAL (TURNER ET AL, 2005) FIGURE 3 - 3 STRUCTURAL AND BEHAVIOURAL CHANGES FIGURE 3 - 4 DISAGGREGATED COSTS, AVOIDED COSTS AND EXTERNALITIES AND MAIN COST PERSPECTIVES FIGURE 3 - 5 POTENTIAL AND ACTUAL CONTRIBUTIONS TO YIELD FIGURE 4 - 1 STEP 4 - IMPLEMENT THE RESPONSE FIGURE 5 - 1 STEP 5 MONITOR, EVALUATE AND REVIEW

vi Guide to Demand Management
List of Examples EXAMPLE 2 - 1 PERTH SUPPLY STORAGES EXAMPLE 2 - 2 PARTICIPATORY PROCESSES EXAMPLE 2 - 3 VISUAL INSPECTION AND REGRESSION ANALYSIS USED FOR ALICE SPRINGS EXAMPLE 2 - 4 ASSESSMENT OF SEASONALITY FOR ALICE SPRINGS EXAMPLE 2 - 5 STRATEGY LEVEL ANALYSIS – DEMAND FORECASTING FOR THE ACT WATER RESOURCES STRATEGY (CANBERRA) EXAMPLE 2 - 6 CHANGE OF STOCK IN TOILETS IN SYDNEY EXAMPLE 2 - 7 METHODS USED TO COLLECT DATA ON END USES IN ALICE SPRINGS EXAMPLE 3 - 1 COLLECTION OF DATA FOR CENTRAL HIGHLANDS WATER OPTIONS DEVELOPMENT EXAMPLE 3 - 2 OPTIONS CONSIDERED FOR THE ACT WATER RESOURCES STRATEGY EXAMPLE 3 - 3 SET OF SUPPLY AND DEMAND-SIDE OPTIONS EXAMPLE 3 - 4 CALCULATION OF GREENHOUSE GAS EMISSIONS FOR SUPPLY AND DEMAND-SIDE OPTIONS EXAMPLE 3 - 5 RANKING OPTIONS ACCORDING TO UNIT COST FOR SUPPLY-DEMAND BALANCE ANALYSIS EXAMPLE 4 - 1 KALGOORLIE–BOULDER WATER EFFICIENCY PROGRAM EXAMPLE 4 - 2 PUBLIC HOUSING BUDGET PLANNING EXAMPLE 4 - 3 CONTRACTING FOR AN INDOOR RESIDENTIAL RETROFIT EXAMPLE 4 - 4 METROPOLITAN WATER DIRECTORATE FOR THE GREATER SYDNEY REGION EXAMPLE 4 - 5 COLLECTING DATA FROM RESIDENTIAL DWELLINGS DURING A PILOT PROGRAM EXAMPLE 4 - 6 UNDERSTANDING REGIONAL BEHAVIOURAL DIFFERENCES THROUGH A PILOT PROGRAM EXAMPLE 5 - 1 GOLD COAST RAIN TANKS EXAMPLE 5 - 2 EVALUATION OF THE SYDNEY WATER RESIDENTIAL RETROFIT (TURNER ET AL 2005) EXAMPLE 5 - 3 NON-RESIDENTIAL EVALUATION UNDERTAKEN FOR SYDNEY WATER CORPORATION (PLANT ET AL, 2006) EXAMPLE 5 - 4 SYDNEY WATER CORPORATION REPORTING ON COST AND SAVINGS

Guide to Demand Management Introduction – page 1
INTRODUCTION
Introduction – page 2 Guide to Demand Management
A planning framework urban water This Guide lays out a way to undertake urban water planning, using a consistent framework, which creates benefits for the whole community. It was originally developed by the Institute for Sustainable Futures (ISF) at the University of Technology Sydney for the Water Services Association of Australia (WSAA) and has been updated with the support of the Australian Government’s National Water Commission (NWC). The Guide is intended for both WSAA members and the broader Australian water industry.
Integrated Resource Planning (IRP) is the foundation of the Guide. Internationally, IRP is considered a best practice planning framework for urban water. It has been used to varying extents by water utilities, councils and water resource managers across Australia since the early 1990s. In several Australian jurisdictions, IRP is embedded as a policy and/or regulatory requirement.
IRP considers both demand and supply-side options and treats them equally when determining how to close the supply–demand gap. The Australian water industry is now experiencing a growing need to better understand the demand for water. Specifically, practitioners need new skills in detailed demand forecasting and how to develop, implement and evaluate demand management options. In response to this, the Guide presents introductory material on these subjects within the context of an overall IRP process.
The IRP framework assists water authorities to:
• forecast water demand more accurately by understanding in detail where and how water is used
• determine the gap between available supply and projected demand, the supply–demand balance
• develop and analyse options to fill the supply–demand gap, that consider the full spectrum of options available using consistent economic and sustainability assessment methods
• plan and implement the preferred suite of options
• evaluate the options implemented and the planning objectives identified.
Detailed supply-side analysis will need to be considered in parallel with the demand-side actions described in the Guide. This includes a thorough understanding of the yield of the water supply system, and the importance of the ‘levels of service’ objectives in determining the yield. The Framework for Urban Water Resources Planning, WSAA Occasional Paper No 14 (Erlanger & Neal, 2005), provides a useful description and analysis of these issues.
Using such an IRP process for long-term supply-demand balance planning is different to contingency planning for drought management. Contingency planning for drought management can use many of the principles of IRP, but this Guide does not deal in detail with the associated issues of restrictions’ program design and implementation, emergency supply options or accelerated demand management in a drought context. It is, however, extremely important that planning for drought take into account the impacts of measures introduced during a drought on the long-term supply-demand balance and the implications for the total cost of water supply.
In Australia, components of the IRP process have been applied in areas as small as Exmouth in Western Australia (residential population 2500), to Alice Springs (current population about 27,000) and to large regions such as Sydney (current population over 4.5 million). It is a flexible framework applicable to any planning region. It can be used at different levels of detail, from a rough first cut or a strategic level requiring minimal data collection and manipulation, to the detailed level necessary for continuous implementation.
An associated modelling tool (the Integrated Supply–Demand Planning model) was originally developed by Sydney Water Corporation, ISF and CSIRO, and is based on the principles of IRP. The model is currently used to manage nearly half the urban water demand in Australia and has also been updated with support from the NWC. The aim of the Guide and related tools is to help the broader water industry and WSAA members understand the principles of IRP and to embed the principles and practice of IRP in urban water planning across Australia.

Introduction
Guide to Demand Management Introduction – page 3
IRP tools a va ilab le WSAA and NWC recognise the strengths of the IRP process, particularly in the current era of urban water planning. In Australia, we have moved away from considering only supply-side options, to embrace demand-side options including water efficiency and potable source substitution. In response, WSAA’s suite of tools, recently updated and extended by NWC, assist industry practitioners to do this in their own time and to apply the IRP process to each unique regional situation.
The tools currently available include:
• The Guide – a step-by-step guide that systematically takes water authorities through the principles and process of IRP and how to apply them (with a purposeful emphasis on introducing the demand-side methods that are required). This version of the Guide (2010) has been updated with reference to the new Resource Papers that discuss and clarify specifics of the IRP process.
• The Integrated Supply Demand Planning (iSDP) model, manual and training – a generic model that assists water authorities to develop a specific model to forecast water demand more accurately, develop demand-side options and compare them to supply-side options using consistent economic and sustainability assessment methods.
• The Demand Management and IRP Training Package – a scalable training package that provides background on the IRP process, demand management and an introduction to using the iSDP model. (Contact Institute for Sustainable Futures, if interested in the training.)
• Resource Papers – A suite of resources were developed as part of a NWC funded project ‘Integrated Resource Planning for Urban Water.’ These resources, introduced below, draw on the principles of IRP and build on a body of work previously undertaken for WSAA.
• A case study application of the IRP framework and iSDP model to the City of Wagga Wagga.
The intent is to develop and refine the tools and resources as more members and industry practitioners adopt the IRP process across Australia. Hence, the Guide should be considered as a stepping-stone toward confidently managing the demand-side within the context of IRP. It provides multiple references for users to consult for further detail on specific subject areas. Trial and experience will engender a deeper understanding of the subject and its many intricacies. It is envisaged that as more WSAA members and industry practitioners become familiar with IRP and apply it, that the suite of tools and resources will grow in number and depth. Please see http://urbanwaterirp.net.au/ for latest updates.
Purpos e of the Guide The purpose of the Guide is to assist the broader water industry and WSAA members to integrate IRP into their water planning processes. It aims to introduce water utilities, local government authorities and water resource managers to the principles of IRP and to guide them through the process step-by-step. As with any process, some steps are repeated as circumstances and data availability change. By working through the process methodically, the Guide provides essential knowledge about the demand-side actions required within the IRP process.
Many users will already have undertaken parts of the IRP process, such as implementing a water efficiency program, and be familiar with that aspect. However, few will have undertaken the full process and thus, the Guide intends to provide the full picture and show how the entire process can create significant benefits in terms of planning and managing water resources. The greatest benefit to water authorities will come from being able to use a clear and transparent adaptive management process.
The Guide does not attempt to advise water authorities on how to calculate the yield or water supply availability of their existing water sources or how to design and implement supply-side options, as much current water industry literature already focuses on these issues. Rather, the Guide focuses on new methods and skills needed by the industry, such as:

Introduction – page 4 Guide to Demand Management
• how to calculate the demand for water more accurately (using sector and end use based demand forecasting methods that disaggregate demand) and then compare this to the calculated yield, to estimate the supply-demand gap
• how to develop and design demand-side options
• how to compare demand and supply-side options to determine the most economically, socially and environmentally appropriate suite of options to fill the supply–demand gap
• how to implement and evaluate demand-side options to determine their effectiveness in filling the supply–demand gap.
The Guide focuses on the demand-side but within the context of holistic supply–demand planning. As such, it is the first Australian resource to integrate issues of supply and demand. Many current manuals and tools exist to assist water authorities to determine their yield and to design supply-side options and a number of Australian and international publications assist water authorities to learn more about demand forecasting and demand-side options development. However, this Guide exists to bring the supply and demand-side planning together within the Australian context and to provide consistency in methodology and terminology; essentials if the water industry is to use demand-side planning effectively in the future.
The Updated Guide builds on the former WSAA publications;
• Wise Water Management – A Demand Management Manual for Water Utilities (White 1998).
• Original guide – Guide to Demand Management (Turner et al. 2008)
The Guide aims to provide an approach for use at different levels of analysis depending on need, from strategic or first-cut planning to highly detailed planning. Additionally, the Guide provides an approach able to answer different planning questions, for example:
• how to achieve a specific demand management target
• how to achieve the supply–demand balance in the most sustainable way.
For each step of the process, the Guide identifies essential actions and the information needed to conduct strategic or first-cut planning. It then provides advice on possible greater levels of detail or rigour to achieve detailed planning for the supply–demand balance, so that users can be flexible in their level of analysis.
The Guide can be used in different ways. A user can follow the whole IRP process, following a logical sequence of steps in which some repetition occurs, based on feedback from each set of results. Equally, the reader can access different sections to address a specific issue or to answer a specific question. However, we strongly urge familiarity with the entire process before using the Guide like this. This is to minimise the risk of investing an unjustified amount of time and/or resources in a relatively minor component of the entire planning process.
This version of the Guide (2010) has been updated and also links where appropriate to NWC’s new Resource Papers. The Resource Papers inform and assist those involved in urban water planning as they deal with emerging issues in supply-demand planning.
Introduction
Guide to Demand Management Introduction – page 5
Struc ture o f the Guide Overview – The overview firstly gives background to the need for the IRP process and its history. It identifies challenges faced by the water industry today and provides water authorities with an explanation of how the IRP process was developed internationally and nationally. Secondly, the overview provides a summary of each step of the IRP process, for the reader to gain a clear picture of the whole process.
The Steps – These sections assists water authorities to understand the principles of IRP, to follow the steps in a logical sequence, to relate them to their own context and to undertake appropriate actions to apply them to their own water service area. Detailed information is given for the demand-side and it is expected that other sources will be consulted to conduct parallel processes for the supply-side. To help the reader, this part of the Guide provides advice on who should be involved, what to do, what information and data is needed, how you might analyse the data and where to look for further information. Examples and case studies are included to describe instances of the principles or steps having been undertaken and use of the tools. Authors’ notes comment on common issues or hurdles that may arise.
Resource Papers:
Complementary analytical techniques for urban water forecasting in IRP (Fyfe et al. 2010b). This resource paper details a number of demand analysis techniques which can be used alongside the sector based and end-use based demand forecasting approaches described in this Guide. These techniques can be used to unpack the various factors influencing water demand from historical demand data. The paper then describes how these factors should then be considered in demand forecasting. It provides a full review of the range of available techniques, examples of their use, potential limitations and guidance on which techniques make sense for what purpose. Techniques addressed by the paper include: climate correction, trend identification, differentiating base and seasonal demand, peak demand forecasting, analysis of demographics and land-use, and analysis of behavioural responses.
Incorporating climate change into Urban Water Integrated Resource Planning (Fane et al. 2010b). This resource paper provides background information on the implications of climate change for urban water supplies and urban water demand in Australia. The aim is to inform decisions about how water utilities will manage climate change risks. The paper seeks to scope out the problem of climate change from an urban water planner’s perspective and introduce approaches and methods that can be useful when incorporating climate change into urban water supply-demand planning in Australia.
Sustainability Assessment in Urban Water Integrated Resource Planning (Fane et al. 2010a). Support is provided in this resource paper for water planners to make informed decisions about how to incorporate sustainability impacts into options assessment for urban water. It provides guidance on selecting the best approach, identifying the implications of method chose, and determining the data needed to complete a sustainability assessment. Specifically the resource paper compares the assessment of sustainability impacts via multi-criteria analysis to assessments based on the monetisation of impacts as ‘externalities’ through non-market valuation techniques.
Techniques for estimating water saved through demand management and restrictions (Fyfe et al. 2010a). This resource paper provides water practitioners with a broad understanding of the analytical techniques that can be used in the evaluation of water savings and also advise on how choose an analytical technique dependent on data availability. The paper specifically deals with quantifying the water savings achieved in demand management programs and how evaluation can assist water service providers to determine whether they have achieved targets for reducing water demand. It also addresses how evaluation can be utilised to improve both demand management programs and restrictions design.

Guide to Demand Management Overview – page 1
OVERVIEW OF THE GUIDE AND FRAMEWORK

Guide to Demand Management Overview – page 2
Current cha llenges for the water indus try Both in Australia and internationally, the water industry is adapting to a new and demanding situation. On the one hand, existing potable water supplies in many regions are fast reaching their limits with water demand projected to rise with population growth. On the other hand, climate change and new demands on scarce water resources, such as environmental flows for rivers threaten to reduce supply availability. Added to this is a set of policy objectives that call for a robust and transparent comparison of all demand and supply-side options, the examination of all the social, environmental and economic costs and benefits, and increasingly require public involvement and consultation. As these challenges play out, Australian water authorities face the difficulties of planning wisely, accurately predicting water demand, managing that demand, and timing new supply initiatives. Water authorities are experiencing pressure both to provide risk-free solutions and to meet demand reduction targets sometimes set with little analysis of their cost or feasibility in a given region.
In financial terms, the same water authorities must remain financially viable despite potential lost revenue through demand management initiatives and periods of restrictions due to drought. They are expected to provide the best solutions against economic, social and environmental criteria and often to develop solutions that are outside their sphere of control. They are then expected to unpack the complexities of price determination to ‘pass through’ the costs of more sustainable solutions to consumers who will in part reap the benefits, such as in the case of reduced energy bills from water efficiency options. In many cases, passing through part of the cost of such options is the only way the water authorities can contemplate managing sustainable options.
A parad igm s hift for the wate r indus try With the complex issues facing the water industry, an era of change has begun and a paradigm shift in thinking and approach is occurring.
With concerns about future climate and environmental issues, large-scale dams are no longer seen as the sole option for securing long-term water supplies. A diverse portfolio of water efficiency, potable source substitution with rainwater, stormwater and recycled water and new climate independent supply options is now required. Likewise ‘readiness options’ will now be a part of contingency planning for drought management together with more traditional water restrictions. In addition, stakeholders should be engaged in urban water planning and appropriate levels of service should be determined in consultation with communities, so that the frequency, severity and duration of water restrictions is understood by the community and mutually agreed (Erlanger & Neal 2005). The management of water supply-demand is becoming integrated with the management of the other aspects of the urban water cycle. The new paradigm is typified by the National urban water planning principles developed by the Council of Australian Governments (COAG) – see Appendix A.
This means that water authorities must now become ‘water service providers’ rather than commodity suppliers. They must develop expertise in multiple fields such as engineering and new technologies, environmental and social sciences, economics, marketing, policy, customer care, health, consultation and applied research. They will need to develop solutions that lie outside their immediate sphere of control and to communicate with multiple stakeholders to achieve objectives sometimes thrust upon them such as demand management, reuse and stormwater targets. They will need guidelines and management arrangements for new and expanding technologies such as close personal contact reuse systems. They will need to pilot and evaluate new technologies and options to test their effectiveness for widespread adoption. They will need to consider what new institutional arrangements are required, and what their role is, to manage the community’s water resources effectively.
Water authorities therefore need to diversify their skills and become leaders in this new era.
Further Reading
For further reading on levels of service:
Erlanger, P. & Neal, B. 2005, Framework for Urban Water Resource Planning, WSAA Occasional Paper No. 14, June 2005, Water Services Association of Australia, Melbourne.

Overview
Guide to Demand Management Overview – page 3
In tegra ted Res ource P lanning: an emerging way forward The in te rna tiona l context Over the last three decades, various approaches have been under development internationally. Today we are well prepared to respond to the current challenges facing the water industry and to develop the capacity of water service providers during this period of change. Interestingly, the origins of the most promising approach lie in the history of electricity resource planning, not water resource planning. The energy industry recognised in the early 1980’s that the traditional planning methods focused only on construction of electricity supply infrastructure and ignored opportunities to make existing networks more productive. This led to the development of what they termed ‘Integrated Resource Planning’ (IRP) in which a full range of both supply-side and demand-side options are assessed against a common set of planning objectives or criteria (Swisher et al. 1997; Tellus Institute 2000; Vickers 2001).
During the 1990s, various actors around the world translated these new ideas about resource planning to the water industry. In the US, the focus has been primarily on the demand-side. Leaders in this field have been the California Urban Water Conservation Council (CUWCC) and the American Water Works Association (AWWA) who have developed methodologies to better forecast water demand and design and assess water conservation options. These approaches make use of end use analysis where water demand is disaggregated into the end uses of water (e.g. toilets and showers) in the same way as was done in the electricity industry. In the UK, the corporatisation of the water industry led two of its regulatory bodies, the Office of Water Services (OFWAT) and the UK Environment Agency (UKEA) to develop and adopt procedures to ensure that water utilities manage both water demand as well as supply. Current practice for all UK water utilities is now to resolve the supply-demand balance, and consider both demand and supply-side options in the same framework, as proposed by the IRP approach (UK Environment Agency 2003).1
Further Reading
For background information about integrated resource planning and details of its application to the electricity sector, please see the following two references. Both these references provide useful approaches, methods and tools that translate from the electricity sector to the water sector:
Swisher, J. N., Jannuzzi, G de M., Redlinger, RY. 1997, Tools and Methods for Integrated Resources Planning: improving energy efficiency and protecting the environment. Roskilde, Denmark, UNEP Collaborating Centre on Energy and Environment, Riso National Laboratory.
Tellus Institute, 2000, Best Practices Guide: Integrated Resource Planning for Electricity, The Energy Group, Institute of International Education, Washington DC.
For an outline of the UK water industry’s approach to IRP, please see the following reference. This document is a guiding document for water authorities in the UK to utilise to balance supply and demand and follows a similar IRP process to the one presented in the Guide:
UK Environment Agency, 2008, Water Resources Planning Guideline, November 2008.
Ashley, R., Blackwood, D., Butler, D. & Jowitt, P. 2004, Sustainable water services: a procedural guide, IWA Publishing, London.
For information about the development of demand management in the United States over the last fifteen years, please see:
American Water Works Association, 1994, Integrated Resource Planning: A Balanced Approach to Water Resources Decision-Making, prepared for American Water Works Association (AWWA) Research Foundation by Barakat and Chamberlin, American Water Works Association, Denver, Colorado, USA.
American Water Works Association, 2006, Water conservation programs: a planning manual, 1st edn, American Water Works Association, Denver, USA.
1 The UK Environmental Agency website will have the UK’s current water resources planning guide as well as Water Resource Management Plans submitted by all water companies as submitting management plans is now a statutory requirement.

Overview – page 4 Guide to Demand Management
American Water Works Association, 2001, Water Resources Planning Manual, M50, (2001) American Water Works Association, Denver, Colorado, USA.
Dziegielewski, B., Opitz, EM, Kiefer, JC., & Baumann, DD., 1993, Evaluating Urban Water Conservation Programs: a procedures manual, American Water Works Association.
Feldman, M., Maddaus, WO., & Loomis, J., 2003, Calculating avoided costs attributable to urban water use efficiency measures: A literature review, California Urban Water Conservation Council, Sacramento, California, USA.
Harberg, R. J., 1997, Planning and Managing Reliable Urban Water Systems. Denver, Colorado, American Water Works Association.
Levin, E., Carlin, M., Maddaus, WO., 2005, 'Defining the conservation potential for San Francisco’s 28 wholesale customers', Proceedings of Efficient2005, Santiago, Chile, February.
Maddaus, W., Gleason, G., & Darmody, J., 1996, Integrating Conservation into Water Supply Planning, Journal American Water Works Association, Volume 88, No. 11, pp.57-67, American Water Works Association, Denver, Colorado, USA.
Stockholm Environment Institute, 2007, Water evaluation and planning system user guide, Boston Tellus Institute, Stockholm Environment Institute, Boston, USA.
Vickers, A., 2001, Handbook of Water Use and Conservation. Water Flow Press, Amherst, Massachusetts, USA.
For a recent text that covers approaches to demand management, please see:
Gleick, PJ., Haasz, D., Henge-Jeck, C., Srinivasan, V., Wolff, G., Kao Cushing, K., & Mann, A., 2003, Waste not, Want not: the potential for urban water conservation in California, Pacific Institute for Studies in Development, Environment and Security, Oakland, California, USA.
For additional references on planning frameworks please see:
Karamouz, M., Szidarovszky, F. & Zahraie, B., 2003, Water Resources systems analysis, Lewis Publishers: Boca Raton, Florida, USA.
Keeney, R., 1982, Decision analysis: an overview, Operations Research, 30(5): 803-838.
Lundie, S., Ashbolt, N., Livingston, D., Lai, E., Karrman, E., & Blaikie, J., 2005, Sustainability framework - methodology for evaluating the overall sustainability of urban water systems: UNSW.
Mitchell, C., Turner, A., Cordell, D., Fane, S. & White, S., 2004, Water conservation is dead: long live water conservation, 2nd IWA Leading Edge Conference on Sustainability in Water Limited Environments, Sydney 8-10 November 2004.
Turner, A., Willetts, J. & White, S., 2006a, ‘The International Demand Management Framework – Stage 1 – Final Report’, report prepared by the Institute for Sustainable Futures for Canal de Isabel II, Spain
The Aus tra lian context In the Australian context, components of the IRP process have been applied since the mid 1990s to varying degrees. For example, Least Cost Planning (LCP)2
2 Least Cost Planning is a term that was developed in the application of these ideas in the electricity industry in the United States in the 1970s to refer to the use of cost-effectiveness analysis across supply- and demand-side options. In the Guide, the broader term, Integrated Resource Planning is used to encompass the process described in each of the Chapters, which is larger than the cost-effectiveness analysis alone.
, water efficiency and IRP studies all exist in the literature and practice. The titles of much of this literature appear to be narrowly focused on water efficiency or LCP but often incorporate and use the principles of the broader IRP process. Hence, when this literature is combined, a long and extensive history is seen of how IRP has been considered and applied in the Australian water industry. The focus of most of this work is on the application of IRP principles to the medium or long term supply-demand balance rather than to drought management planning. The principles of IRP can be applied to drought management planning, such as the planning and implementation of restrictions and emergency supply or demand management measures, but this has received less attention until recently, and is not the primary focus of this Guide.

Overview
Guide to Demand Management Overview – page 5
Some of the ea rly examples of the us e of IRP in Aus tra lia 1. In 1995, the Water Corporation of Western Australia implemented a $3.5M water efficiency
program for a population of 30,000 in Kalgoorlie-Boulder. It was implemented to reduce the costs of providing potable water to the area. The water efficiency program included indoor retrofitting, outdoor programs, water audits and loans for non-residential customers, and an education campaign. The program was the first in the world to consider such a comprehensive combination of water efficiency options. To do so, the study involved crossing professional boundaries and using skills in water efficiency program design, economic analysis, marketing and advertising, demographics and demand analysis. Not only was water demand considered in detail and options developed using a consistent economic methodology, but also the preferred options were largely implemented and the water savings later evaluated. Hence, the team undertaking the Kalgoorlie-Boulder project worked through most of the key elements of the IRP process (Botica & White 1996, White 1998: 141).
2. Other early examples were in Streaky Bay (SA) in the early 1990s and Lismore (NSW) in the mid-1990s (White 1998: 137). In these examples, water efficiency trials were implemented and evaluated to determine whether they could be used to fill the supply–demand gap in preference to supply options. Another water efficiency program was implemented in the mid-1990s within the jurisdiction of Rous County Council (NSW), to defer development of a major new supply source due to public pressure and the supporting evidence from the options developed and cost benefit analysis (White 1997).
3. The first major Australian application of the IRP process was by Sydney Water Corporation (SWC) in 1997-98. SWC was able to determine how to achieve targets of a 25% and 35% reduction in per capita demand by 2001 and 2011 respectively, based on 1991 levels. As part of The Sydney Water Least Cost Planning Study, (White and Howe 1998) the first detailed water demand forecasting model (end use model) in Australia was developed. In addition, an options model (an integral part of the end use model) was developed, which considered over 40 different options to reduce demand using economic analysis consistent with IRP. In 1999, SWC began implementing the majority of the programs and has subsequently evaluated both the residential and non-residential programs (Howe and White 1999, Turner et al 2005a).
4. Aspects of IRP were subsequently used in the Sydney context on a number of occasions such as: the Upper Blue Mountains (ISF 1999a), Illawarra (ISF 1999b), by the Independent Expert Panel on Environmental Flows in the Hawkesbury-Nepean3, the 2004 Metro Water Plan for Sydney and more recently, the 2006 Metro Water Plan for Sydney4
5. From a regulatory perspective, the principles of IRP have been used by the NSW Independent Pricing and Regulatory Tribunal (White 1998) in its requirements for Sydney Water Corporation and Hunter Water Corporation. In Western Australia, the State Water Strategy states that IRP is required in water planning.
.
6. In 2001 a study was completed to determine the potential for water use efficiency improvements in the Queensland urban water sector using a Least Cost Planning approach to develop options to increase the efficiency of water use and to estimate the costs and benefits of implementing such options (Montgomery Watson 2000; QDNR 2001). The approach was intended to inform an appropriate balance between system operation or capacity expansion costs and the savings associated with programs aimed at increasing the efficiency of water use.
7. The Melbourne End Use and Options Model developed for the three water retailers and Melbourne Water.
8. The review of the demand management program in Perth for the Water Corporation and the development of an iSDP model.
3 http://www.dnr.nsw.gov.au/water/pdf/h-n_forum2004water_sydney.pdf 4 http://www.waterforlife.nsw.gov.au/

Overview – page 6 Guide to Demand Management
9. The sector-based analysis and options model development in Canberra as part of the ACT Water Strategy (Turner & White 2003; Turner et al. 2005b), and the subsequent development of an iSDP model with a full sector/end use-based forecast.
10. The application of the Integrated Water Cycle Management Planning process as part of the requirements of the NSW Department of Energy Utilities and Sustainability, in many regional towns and cities in NSW (Beatty et al. 2002).
With NWC support a case study of the application of the IRP framework and iSDP model has been recently been developed by ISF based on Wagga Wagga.
Further Reading
Information on water efficiency programs in Australia and elsewhere may be found in:
Botica, R. & White, S., 1996, ‘Kalgoorlie-Boulder: The Water Efficient City’, Water: the Journal of the Australian Water and Wastewater Association, 23, 5, 14-17.
United Nations, 2003, Guide to preparing urban water efficiency plans, Maddaus (Ed.), Water Resources Series, vol. No. 83, Economic and Social Commission for Asia and the Pacific (ESCAP).
White, SB., 1994, ‘Blueprint for a Water Efficient City - Report of the Kalgoorlie-Boulder Water Use Efficiency Study’, report prepared for the Water Authority of W.A., Preferred Options (Asia-Pacific) Pty Ltd, Lismore NSW, December.
White, SB., 1997, ‘The Rous Regional Water Efficiency Program: Final Report of the Rous Regional Demand Management Strategy’, report prepared for Rous County Council, Preferred Options (Asia-Pacific) Pty Ltd, Lismore NSW, March.
Application of least cost planning, a component of IRP, in Australia and more broadly:
Beatty, R., Chapman, S., & Maddaus, W., 2002, Benefit Cost Analysis with an End Use Model, AWWA Water Sources, Las Vegas, January.
Beatty R., 2007, Sustainable Urban Water Cycle Management - Building Capacity in the Australian Water Industry, Proceedings of Ozwater 2007, MWH Sydney.
Beatty, R., O'Brien, S., & Beatty, K., 2006, Fifteen Years of Drought, Demand Management and Pricing Reform in Urban Water, What's Gone Right, What's Gone Wrong and What's Needed for the Future? Enviro 06 Conference, Melbourne, May 2006.
Howe, C. & White, S., 1999, ‘Integrated Resource Planning for Water and Wastewater: Sydney Case Studies’, Water International, 24(4):356-362.
Institute for Sustainable Futures, 1999a, Reducing Wastewater in the Upper Blue Mountains: A Least Cost Planning Study for the Upper Blue Mountains Wastewater Strategy, Sydney Water Corporation, Sydney, Australia
Institute for Sustainable Futures, 1999b, Sydney Water Illawarra Least Cost Planning Study Draft Report Sydney Water Corporation, Sydney, Australia
Montgomery Watson, 2000, Improving Water Use Efficiency in Queensland’s Urban Communities, report prepared for the Queensland Department of Natural Resources, November.
Queensland Department of Natural Resources, 2000, Improving Water Use Efficiency in Queensland’s Urban Communities. Prepared by Bill Maddaus, Brett Stewart, Jack Weber, Shane O’Brien, Montgomery and Watson Australia, November 2000
Turner, A., White, S., Beatty, K., & Gregory, A., 2005a, 'Results of the Largest Residential Demand Management Program in Australia’, International Conference on the Efficient Use and Management of Urban Water, Santiago, Chile, 15-17 March 2005.
Turner, A., White, S. & Bickford, G., 2005b, 'The Canberra Least Cost Planning Case Study', International Conference on the Efficient Use and Management of Urban Water, Santiago, Chile, 15-17 March 2005.

Overview
Guide to Demand Management Overview – page 7
Turner, A. & White, S., 2003, ACT Water Strategy: Preliminary demand management and least cost planning assessment, October 2003.
Turner, A., Campbell, S. & White, S., 2004, 'Methods Used to Develop an End Use Model & Demand Management Program for an Arid Zone' Biennial World Water Congress, Marrakech, Morocco 19-24 September 2004.
Turner, A., Campbell, S., White, S. & Milne, G., 2003, Alice Springs Water Efficiency Study, July 2003.
White, S. & Howe, C, 1998, Water Efficiency and Reuse: a Least Cost Planning Approach proceedings of the 6th NSW Recycled Water Seminar Australian Water and Wastewater Association, Sydney Australia
White, S. (ed), 1998, ‘Wise water management: a demand management manual for water utilities’, Australian Water Services Association Research Report No. 86, November 1998.
White, S., 1999, ‘Integrated resource planning in the Australian water industry’, Proceedings of CONSERV99, American Water Works Association, Monterey, California, February.
Using IRP requires a very distinct shift in how we think about water planning, how we provide water services and the kinds of tools and resources needed. Without this shift, planning processes will either remain confined to a limited set of alternatives or continue to assess different types of solutions using different frameworks, thus hindering any kind of true integration and comparison of the most sustainable options.
This is the reason for WSAA’s and NWC’s support of the Guide and associated tools and resources and the need for ongoing applied research and knowledge sharing in this field by water service providers, consultants and research organisations alike.
De velopment of the Aus tra lian IRP Framework The Australian IRP process presented in the Guide is a synthesis of the latest developments in research and practice in this area of water resource management. The authors have studied a variety of frameworks to inform its development (Tellus Institute 2000; UK Environment Agency 2003; Karamouz 2003; Gleick et al. 2003; Mitchell 2004; Lundie et al. 2005; Erlanger & Neal 2005). In addition, generalised models developed for decision analysis have been consulted (Keeney 1982). Refer to previous ‘Further reading’ boxes in this section for full references.
A reference group of national and international practitioners were involved in the initial development of the Framework as part of a complementary project. This project, the ‘International Demand Management Framework’, is being auspiced by the International Water Association’s (IWA’s) Specialist Group – Efficient Operation and Management, under Task Force No. 7. The reference group for this project assisted in identifying key international literature for the development of the Framework and Guide, reviewing the IRP process defined, and a set of criteria that classify it as best practice (Turner et al. 2006a).
A steering committee of key WSAA members, some of whom are also members of the IWA reference group has provided input through peer review to develop the Guide. NWC has supported the update of 2010 version of the Guide however the essential structure remains unaltered.
The Aus tra lian IRP Framework key charac te ris tics and princ ip les Planning water resources and services is a complex task involving multiple (and often conflicting) objectives, stakeholders, options, risks and uncertainties. For this reason a structured approach to decision-making is the backbone of the whole process. The steps provided in the Guide provide a systematic, transparent process. The authors intend that these steps will be performed more than once, each time at an appropriate level of depth for the given context from strategic to a detailed implementation level. We describe this approach as ‘iterative’, and it is a key feature of IRP.

Overview – page 8 Guide to Demand Management
Charac te ris tic s Key characteristics that make IRP different to more traditional planning processes are highlighted in Table 1. These differences relate to the planning orientation, process and issues addressed. Table 1 Difference between traditional planning and IRP process (adapted from Beecher 1995)
Criteria Traditional Integrated Resource Planning
Planning orientation
Resource options Supply options with little diversity Supply management and demand management options, efficiency and diversity are encouraged
Resource ownership and control Centralised and utility-owned Decentralised utilities, customers and others
Scope of planning Single objective, usually to add to supply capacity
Multiple objectives determined in the planning process
Assessment criteria Maximise reliability and minimise process
Multiple criteria, including cost control, risk management, environmental protection, community
Resource selection Based on a commitment to a specific option Based on developing a mix of options
Planning process
Nature of the process Closed, inflexible, internally oriented Open, flexible, externally oriented
Judgement and preferences Implicit Explicit
Conflict management Conventional dispute resolution Consensus-building
Stakeholders Utility and its rate-payers Multiple interests
Stakeholders’ role Disputants Participants
Planning issues
Supply reliability A high priority A decision variable
Environmental quality A planning constraint A planning objective
Cost considerations Direct utility system costs Direct and indirect costs, including environmental and social externalities
Role of pricing A mechanism to recover costs An economic signal to guide consumption and way in which to share costs and benefits between different stakeholders
Efficiency An operational concern A resource option
Trade-offs Hidden or ignored Openly addressed
Risk and uncertainty Should be avoided or reduced Should be analysed and managed
Princ ip les Key principles that apply in practice in the Australian context and form the basis of the steps within the Framework and Guide are derived from the characteristics of IRP shown in Table 1.
The key principles of IRP include:
• Water service provision – This principle recognises that it is the service that is required (e.g. clean clothes and aesthetically pleasing gardens) and not the water itself. This ultimately leads to the principle that a kilolitre of water saved per year is equivalent to a kilolitre of water supplied per year.
Overview
Guide to Demand Management Overview – page 9
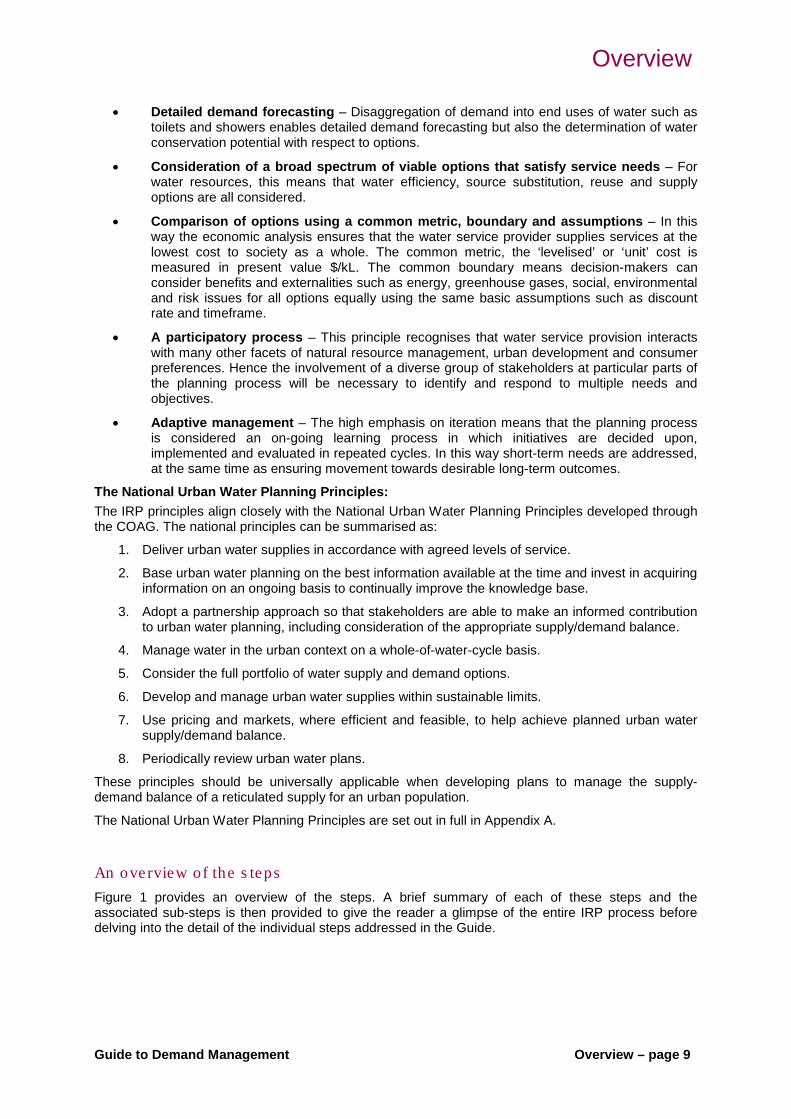
• Detailed demand forecasting – Disaggregation of demand into end uses of water such as toilets and showers enables detailed demand forecasting but also the determination of water conservation potential with respect to options.
• Consideration of a broad spectrum of viable options that satisfy service needs – For water resources, this means that water efficiency, source substitution, reuse and supply options are all considered.
• Comparison of options using a common metric, boundary and assumptions – In this way the economic analysis ensures that the water service provider supplies services at the lowest cost to society as a whole. The common metric, the ‘levelised’ or ‘unit’ cost is measured in present value $/kL. The common boundary means decision-makers can consider benefits and externalities such as energy, greenhouse gases, social, environmental and risk issues for all options equally using the same basic assumptions such as discount rate and timeframe.
• A participatory process – This principle recognises that water service provision interacts with many other facets of natural resource management, urban development and consumer preferences. Hence the involvement of a diverse group of stakeholders at particular parts of the planning process will be necessary to identify and respond to multiple needs and objectives.
• Adaptive management – The high emphasis on iteration means that the planning process is considered an on-going learning process in which initiatives are decided upon, implemented and evaluated in repeated cycles. In this way short-term needs are addressed, at the same time as ensuring movement towards desirable long-term outcomes.
The National Urban Water Planning Principles: The IRP principles align closely with the National Urban Water Planning Principles developed through the COAG. The national principles can be summarised as:
1. Deliver urban water supplies in accordance with agreed levels of service.
2. Base urban water planning on the best information available at the time and invest in acquiring information on an ongoing basis to continually improve the knowledge base.
3. Adopt a partnership approach so that stakeholders are able to make an informed contribution to urban water planning, including consideration of the appropriate supply/demand balance.
4. Manage water in the urban context on a whole-of-water-cycle basis.
5. Consider the full portfolio of water supply and demand options.
6. Develop and manage urban water supplies within sustainable limits.
7. Use pricing and markets, where efficient and feasible, to help achieve planned urban water supply/demand balance.
8. Periodically review urban water plans.
These principles should be universally applicable when developing plans to manage the supply-demand balance of a reticulated supply for an urban population.
The National Urban Water Planning Principles are set out in full in Appendix A.
An overview of the s teps Figure 1 provides an overview of the steps. A brief summary of each of these steps and the associated sub-steps is then provided to give the reader a glimpse of the entire IRP process before delving into the detail of the individual steps addressed in the Guide.

Overview – page 10 Guide to Demand Management
Figure 1 The Australian Integrated Resource Planning Framework

Overview
Guide to Demand Management Overview – page 11
Step 1: P lan the overa ll p roces s It is crucial to begin the planning process by agreeing upon the purpose, form and scope of all steps of the framework. This means identifying which stakeholders will be involved, what role they will take and seeking clarity about the resources available for the planning process (i.e. funding and personnel).
Since the IRP process can be followed at different levels of detail in this step you will need to determine the appropriate depth of analysis required for the other steps, depending on timing and context (i.e. strategic/first cut or more detailed).
STEP 1: PLAN THE OVERALL PROCESS
1A Initiate the IRP Process
(iv) Set up core planning team
(v) Study the concepts and process of IRP
1B Conduct planning workshops
(i) Identify stakeholder roles and responsibilities
(ii) Define the significant drivers for action
(iii) Identify previous and existing planning processes
(iv) Develop a preliminary vision of the process
(v) Determine available funds, resources and commitments
(vi) Define a steering committee to manage the process
(vii) Decide on documents needed to facilitate IRP process review
During Step 1, it will be helpful to consult with the following Resource Papers: Incorporating climate change into Urban Water IRP (Fane et al. 2010b). Specifically Section 3 which includes setting planning objectives for an urban water systems in the face of climate change. This section also discusses how dealing with the uncertainties associated with climate change is likely to require a more adaptive approach to planning. Sustainability Assessment in Urban Water Integrated Resource Planning (Fane et al. 2010a). Specifically, the seven characteristics of ‘good practice’ (in Section 2.3), the role of stakeholder participation in assessment and the place of stakeholders within the governance arrangements for urban water planning more generally (in Section 3) and Sections 4 and 5 on the alternative approach to assessment of sustainability impacts,
Overview – page 12 Guide to Demand Management
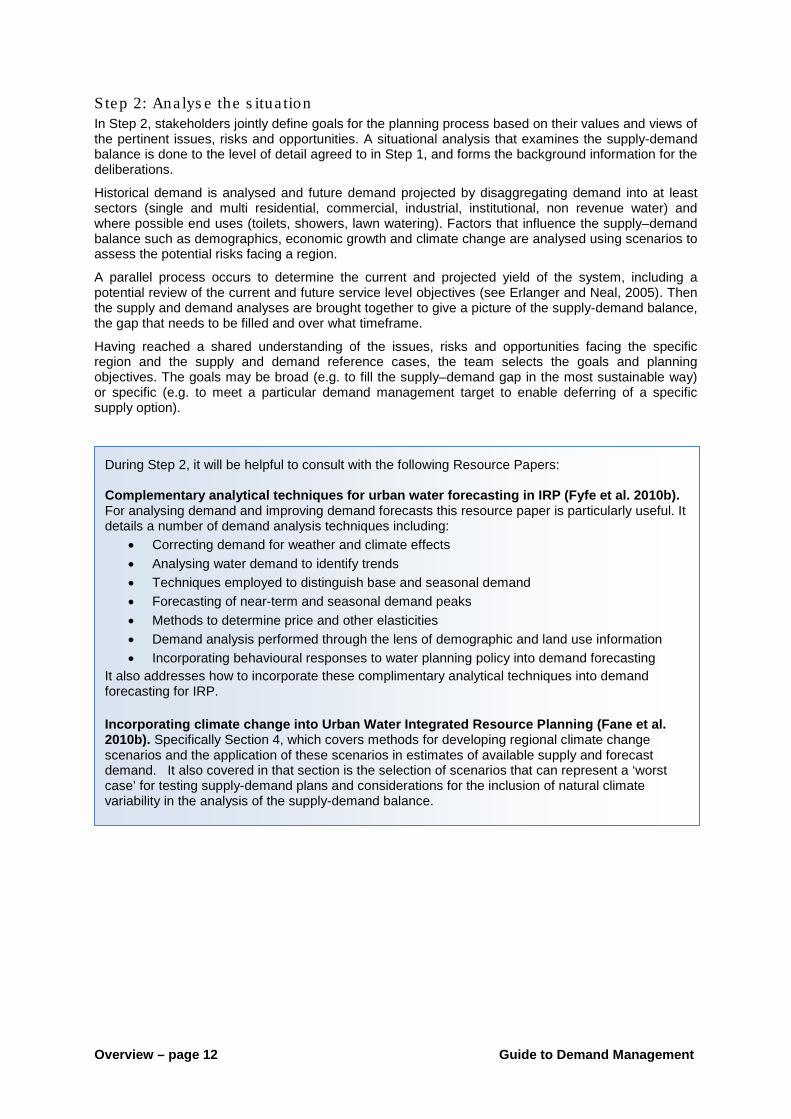
Step 2: Ana lys e the s itua tion In Step 2, stakeholders jointly define goals for the planning process based on their values and views of the pertinent issues, risks and opportunities. A situational analysis that examines the supply-demand balance is done to the level of detail agreed to in Step 1, and forms the background information for the deliberations.
Historical demand is analysed and future demand projected by disaggregating demand into at least sectors (single and multi residential, commercial, industrial, institutional, non revenue water) and where possible end uses (toilets, showers, lawn watering). Factors that influence the supply–demand balance such as demographics, economic growth and climate change are analysed using scenarios to assess the potential risks facing a region.
A parallel process occurs to determine the current and projected yield of the system, including a potential review of the current and future service level objectives (see Erlanger and Neal, 2005). Then the supply and demand analyses are brought together to give a picture of the supply-demand balance, the gap that needs to be filled and over what timeframe.
Having reached a shared understanding of the issues, risks and opportunities facing the specific region and the supply and demand reference cases, the team selects the goals and planning objectives. The goals may be broad (e.g. to fill the supply–demand gap in the most sustainable way) or specific (e.g. to meet a particular demand management target to enable deferring of a specific supply option).
During Step 2, it will be helpful to consult with the following Resource Papers: Complementary analytical techniques for urban water forecasting in IRP (Fyfe et al. 2010b). For analysing demand and improving demand forecasts this resource paper is particularly useful. It details a number of demand analysis techniques including:
• Correcting demand for weather and climate effects • Analysing water demand to identify trends • Techniques employed to distinguish base and seasonal demand • Forecasting of near-term and seasonal demand peaks • Methods to determine price and other elasticities • Demand analysis performed through the lens of demographic and land use information • Incorporating behavioural responses to water planning policy into demand forecasting
It also addresses how to incorporate these complimentary analytical techniques into demand forecasting for IRP. Incorporating climate change into Urban Water Integrated Resource Planning (Fane et al. 2010b). Specifically Section 4, which covers methods for developing regional climate change scenarios and the application of these scenarios in estimates of available supply and forecast demand. It also covered in that section is the selection of scenarios that can represent a ‘worst case’ for testing supply-demand plans and considerations for the inclusion of natural climate variability in the analysis of the supply-demand balance.

Overview
Guide to Demand Management Overview – page 13
STEP 2: ANALYSE THE SITUATION
2A Identify Issues, risks and opportunities
(i) Identify factors influencing supply and demand
(ii) Identify and assess local constraints
(iii) Determine system boundaries
(iv) Undertake first-cut identification of issues, risks and opportunities
2B Determine the supply-demand balance
DEMAND SIDE SUPPLY SIDE
(i) Assess demand forecasting methods
(ii) Choose a demand forecasting method
(i) Identify and assess factors that influence yield (e.g. restrictions, environmental flow releases, climate change)
(ii) Undertake research and community engagement to determine appropriate levels of service (e.g. restrictions frequency and duration)
(iii) Calculate yield of water supply system using appropriate hydrological modelling
Sector-based method
(iii) Consider your data needs
(iv) Choose model
(v) Collect demographic data
(vi) Collect utility-side data
(vii) Conduct sector-based demand forecast
Sector/end use based method
(viii) Collect customer-side data (ix) Consider data collection methods
(x) Conduct sector/end use based demand forecast
2C Re-assess issues, risks and opportunities
(i) Communicate and interpret supply-demand balance
(ii) Re-assess the priorities of the region
2D Set planning objectives (e.g. targets, goals)

Overview – page 14 Guide to Demand Management
Step 3: Deve lop the res pons e Developing the response is a complex step in the IRP process and some activities may need to be revisited as work progresses. It is important to make uncertainties and assumptions explicit throughout the process and to involve the right people. The major steps involve:
• Framing the analysis to be used (e.g. assessment using whole of society costing, inclusion of quantifiable benefit analysis, setting of analysis criteria).
• Considering a wide range of potential options. They fall into four main categories of water efficiency, potable source substitution, reuse and additional supply.
• Analysing the options. The scope of analysis under Steps 1 and 2 will determine how much depth of analysis to do on the options. As a minimum, analysis will include water savings/supply of each option and a calculation of whole of society costs. More detailed analysis will consider benefits and then assess sustainability, using technical, social, environmental and political factors. All analysis uses consistent boundaries, timelines and assumptions.
• Deliberating on which options are most promising, using the options analysis. This stage involves grouping the options to meet the goals set earlier in Step 2 (e.g. filling the supply–demand gap, achieving a demand management target).
• Comparing groups on the basis of the criteria set (e.g. least cost to society, highest benefit, reduction of risk) and how they perform under potential scenarios set by stakeholders.
In Step 3 it is the stakeholder group who ultimately determine the preferred response through a transparent, deliberative and participatory process.
During Step 3, it will be helpful to consult with the following Resource Papers: Incorporating Climate Change into Urban Water Integrated Resource Planning (Fane et al. 2010b). Specifically Section 5 which includes the designing individual supply and demand-side options, developing diverse portfolios of options and approaches for managing climate uncertainty. This section also addresses how to account for the greenhouse gas emissions in order to manage and mitigate the greenhouse gas impact of any response. Sustainability Assessment in Urban Water Integrated Resource Planning (Fane et al. 2010a). Support is provided in this paper for informed decisions about how water planners will incorporate sustainability impacts into the assessment of options and portfolios. It provides guidance on identifying, estimating and measuring externalities in dollar terms. It also provides guidance using multiple criteria approaches to sustainability assessment as part of IRP.
Overview
Guide to Demand Management Overview – page 15
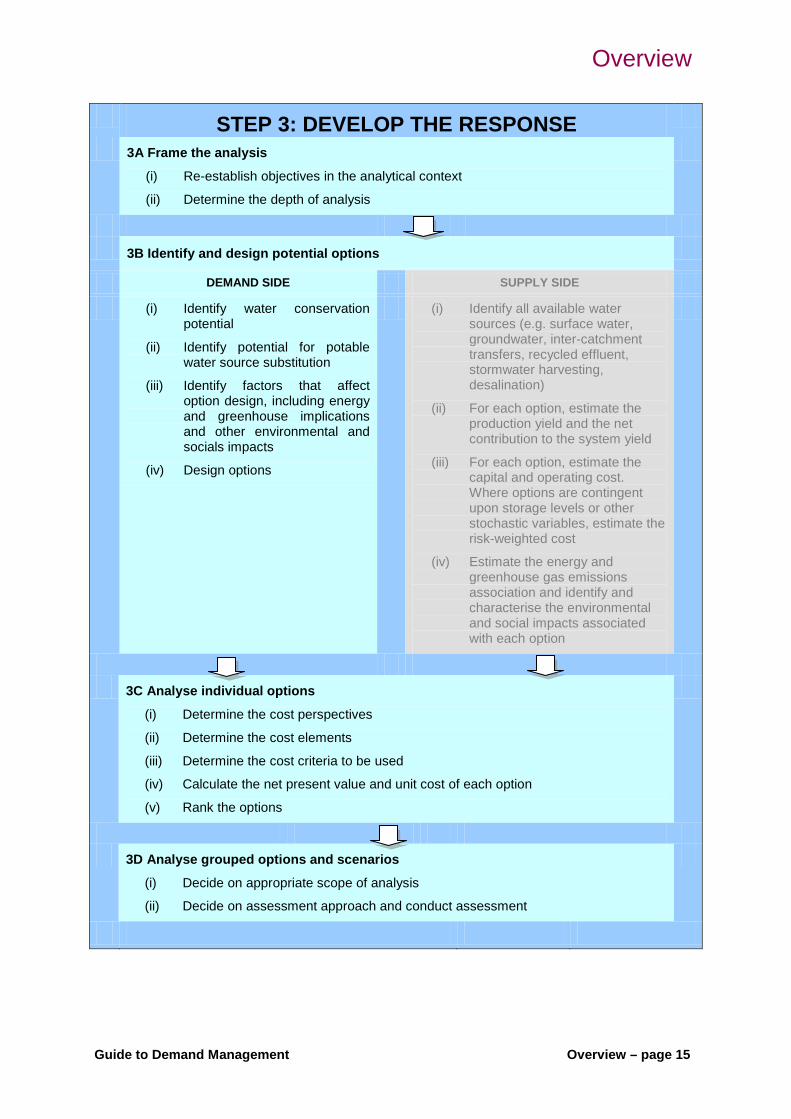
STEP 3: DEVELOP THE RESPONSE
3A Frame the analysis
(i) Re-establish objectives in the analytical context
(ii) Determine the depth of analysis
3B Identify and design potential options
DEMAND SIDE SUPPLY SIDE
(i) Identify water conservation potential
(ii) Identify potential for potable water source substitution
(iii) Identify factors that affect option design, including energy and greenhouse implications and other environmental and socials impacts
(iv) Design options
(i) Identify all available water sources (e.g. surface water, groundwater, inter-catchment transfers, recycled effluent, stormwater harvesting, desalination)
(ii) For each option, estimate the production yield and the net contribution to the system yield
(iii) For each option, estimate the capital and operating cost. Where options are contingent upon storage levels or other stochastic variables, estimate the risk-weighted cost
(iv) Estimate the energy and greenhouse gas emissions association and identify and characterise the environmental and social impacts associated with each option
3C Analyse individual options
(i) Determine the cost perspectives
(ii) Determine the cost elements
(iii) Determine the cost criteria to be used
(iv) Calculate the net present value and unit cost of each option
(v) Rank the options
3D Analyse grouped options and scenarios
(i) Decide on appropriate scope of analysis
(ii) Decide on assessment approach and conduct assessment

Overview – page 16 Guide to Demand Management
Step 4: Implement res pons e This step involves pre-implementation activities and the actual implementation itself. After identifying the preferred response, the team will identify roles and responsibilities of stakeholders, the management team, timing, budgets, details of the individual programs, training needs, communication and education strategies and plans for monitoring and evaluation. All these factors make up the detailed implementation plan. Conducting pilots of individual options will be necessary to work out costs, logistics and effectiveness. The implementation plan may also require new institutional and cost sharing arrangements for specific programs, which will need to be included in the plan. The implementation itself will require appropriately skilled staff and the stakeholder participation according to agreed responsibilities.
STEP 4: IMPLEMENT THE RESPONSE
4A Plan demand-side implementation
(i) Form stakeholder reference group
(ii) Identify demand management team
(iii) Develop budget plans
(iv) Develop a communication strategy
(v) Consider contractual arrangements
(vi) Identify training needs
(vii) Identify data gaps
(viii) Schedule monitoring and evaluation
(ix) Coordinate with other agencies
(x) Document implementation plan
Supply-side planning and implementation
(i) Feasibility study
(ii) Detailed design
(iii) Develop budget plans
(iv) Establish and implement community consultation strategy
(v) Environmental approvals
(vi) Calling tenders
(vii) Contract management
(viii) Commissioning
`
4B Undertake pilot program
(i) Determine implementation issues
(ii) Determine how to fill data gaps
(iii) Determine how to analyse and use new data
4C Implement full program
(i) Adjust implementation plan based on pilot findings
(ii) Conduct implementation activities
Overview
Guide to Demand Management Overview – page 17
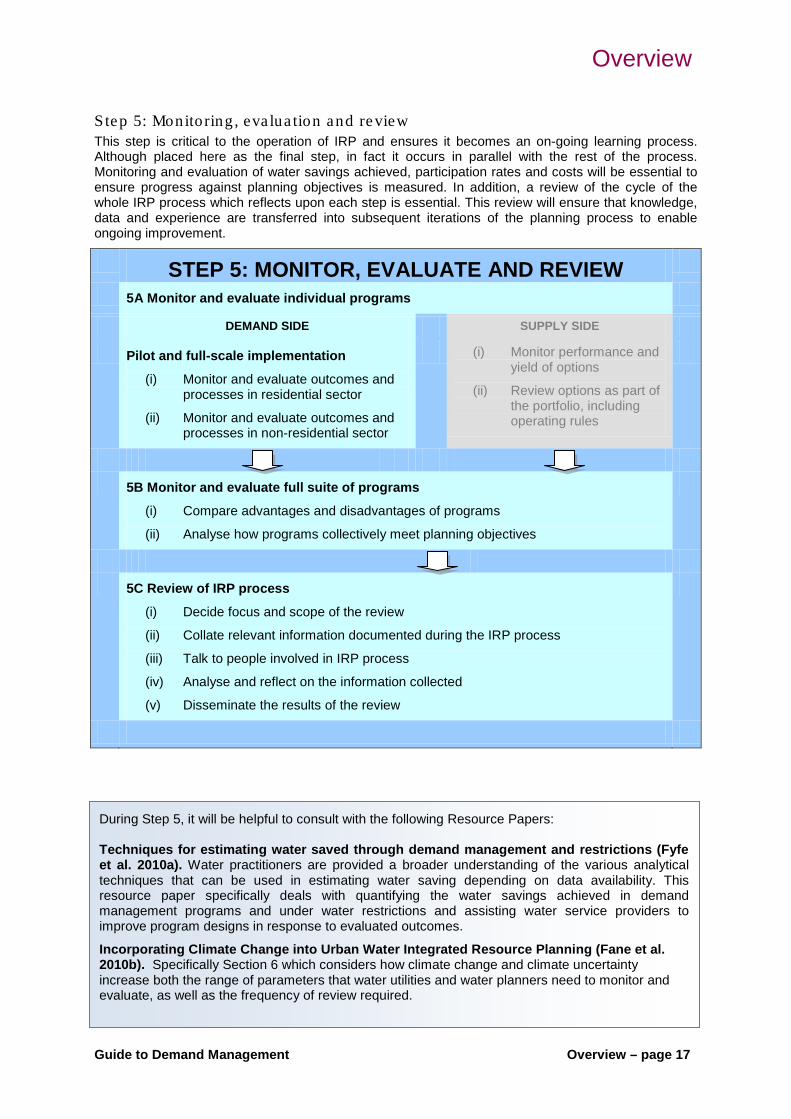
Step 5: Monitoring , eva lua tion and re view This step is critical to the operation of IRP and ensures it becomes an on-going learning process. Although placed here as the final step, in fact it occurs in parallel with the rest of the process. Monitoring and evaluation of water savings achieved, participation rates and costs will be essential to ensure progress against planning objectives is measured. In addition, a review of the cycle of the whole IRP process which reflects upon each step is essential. This review will ensure that knowledge, data and experience are transferred into subsequent iterations of the planning process to enable ongoing improvement.
STEP 5: MONITOR, EVALUATE AND REVIEW
5A Monitor and evaluate individual programs
DEMAND SIDE SUPPLY SIDE
Pilot and full-scale implementation
(i) Monitor and evaluate outcomes and processes in residential sector
(ii) Monitor and evaluate outcomes and processes in non-residential sector
(i) Monitor performance and yield of options
(ii) Review options as part of the portfolio, including operating rules
5B Monitor and evaluate full suite of programs
(i) Compare advantages and disadvantages of programs
(ii) Analyse how programs collectively meet planning objectives
5C Review of IRP process
(i) Decide focus and scope of the review
(ii) Collate relevant information documented during the IRP process
(iii) Talk to people involved in IRP process
(iv) Analyse and reflect on the information collected
(v) Disseminate the results of the review
During Step 5, it will be helpful to consult with the following Resource Papers: Techniques for estimating water saved through demand management and restrictions (Fyfe et al. 2010a). Water practitioners are provided a broader understanding of the various analytical techniques that can be used in estimating water saving depending on data availability. This resource paper specifically deals with quantifying the water savings achieved in demand management programs and under water restrictions and assisting water service providers to improve program designs in response to evaluated outcomes.
Incorporating Climate Change into Urban Water Integrated Resource Planning (Fane et al. 2010b). Specifically Section 6 which considers how climate change and climate uncertainty increase both the range of parameters that water utilities and water planners need to monitor and evaluate, as well as the frequency of review required.

Overview – page 18 Guide to Demand Management
Da ta , in formation and mode ls Data and various analytical models inform the IRP decision-making process. Depending on the level of analysis agreed upon as part of Step 1, significant data collection will be needed. The quality of data collected and methods used need to be explicit, well documented and match the requirements. Using actual data from the local region is far preferable to theoretical data wherever this is practicable. Use of data from another region (for example measured savings from a similar implemented program), needs to be made explicit and highlighted as a potential data gap that needs to be filled.
The models and analysis required by the IRP process are dependent on the level of analysis being undertaken, (e.g. first cut high level strategic or detailed analysis following a period of demand management implementation). They can include:
• a water demand forecasting model and associated options model forming a transparent reference point for assumptions and data sources and calculations so users and decision makers can understand the basis of outputs (in the iSDP model, for example, referenced documents and spreadsheets can be stored within the model database to aid auditing processes)
• regression analysis and analysis to, for example, correct bulk water demand for climate to assist in uncovering average demand and track whether implemented demand management programs are achieving set demand reduction targets
• a model that can be used in combination with a yield model to determine the potential affects of climate change.
Guide to Demand Management Step 1 – page 1
STEP 1 - PLAN THE OVERALL PROCESS
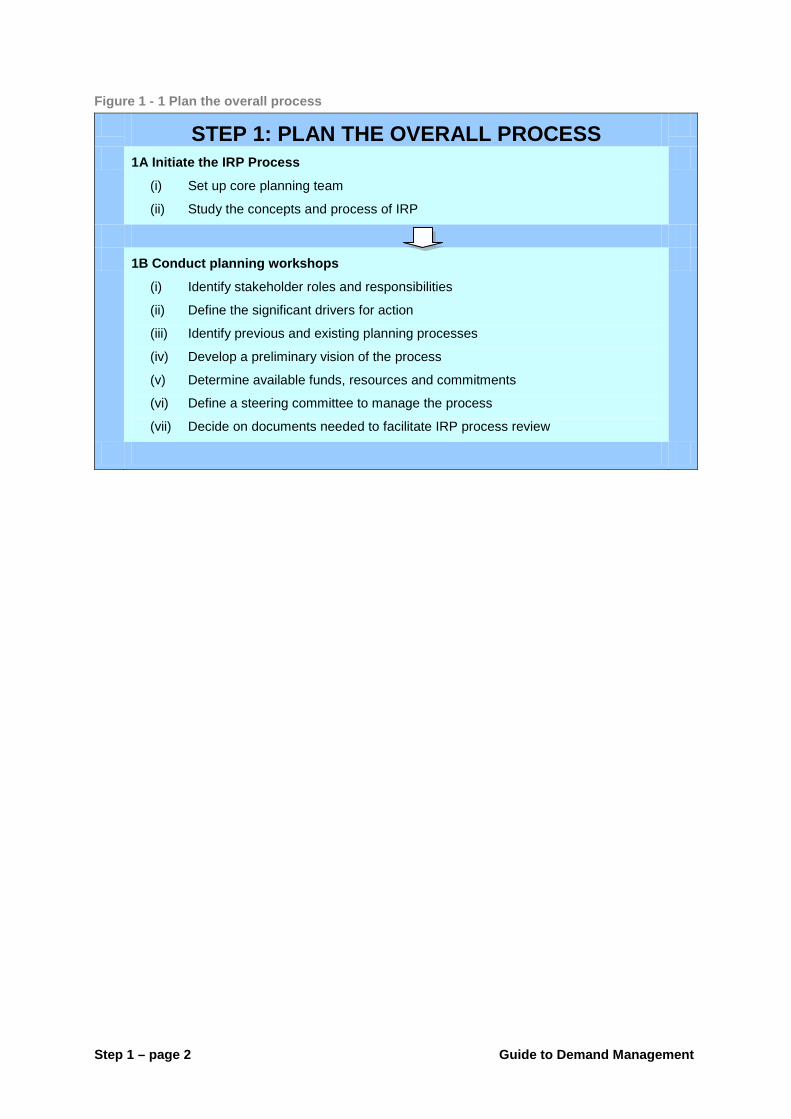
Step 1 – page 2 Guide to Demand Management
Figure 1 - 1 Plan the overall process
STEP 1: PLAN THE OVERALL PROCESS
1A Initiate the IRP Process
(i) Set up core planning team
(ii) Study the concepts and process of IRP
1B Conduct planning workshops
(i) Identify stakeholder roles and responsibilities
(ii) Define the significant drivers for action
(iii) Identify previous and existing planning processes
(iv) Develop a preliminary vision of the process
(v) Determine available funds, resources and commitments
(vi) Define a steering committee to manage the process
(vii) Decide on documents needed to facilitate IRP process review

Step 1 – Plan the Overall Process
Guide to Demand Management Step 1 – page 3
Step 1 Summary Step 1 is a way to think through the entire IRP process before getting involved in detailed analysis. In this step it is recognised that water authorities are one set of numerous and diverse stakeholders that need to be actively involved in the IRP process from the start. Timely and appropriate involvement of other stakeholders will be critical to its effectiveness.
Conducting Step 1 carefully will produce a clear plan of action for those involved and encourage ownership of the process by the multiple stakeholders. Step 1 has two components and involves:
• initiating the process which will include a core planning team getting up to speed with the concepts, process, time and resources needed
• conducting planning workshops for key stakeholders to come to agreement on the overarching decisions and to engage with and plan the subsequent steps.
Figure 1-1 summarises the sub-steps required as part of Step 1.

Step 1 – page 4 Guide to Demand Management
Step 1A In itia te the IRP proces s 1A (i) Se t up core p lanning team Many reasons exist to initiate an IRP process. In some cases, the active leadership of staff in a water authority who see the benefits of the process for their region may be responsible. In others, a state-based regulation may require it. The motivation for IRP will influence how the process is followed, whether the proposed planning outcomes are implemented and whether the IRP process becomes embedded in future planning cycles. It is important to acknowledge how and why the process is initiated, its alignment with previous and current planned work, the people involved and their understanding of IRP.
The core planning team will need to think through how to plan the process effectively. At a minimum, the group will include the strategic planner and/or water efficiency manager of the water authority in the region. In cases where aspects of the IRP process have already been considered, a reference group and core management committee may already exist.
1A (ii) S tudy the concepts and proces s of IRP Because IRP is different to traditional planning approaches, key individuals initiating the use of the process should become familiar with the contents of the Guide, the scope of the IRP process and tools available. This includes understanding the capacities of demand forecasting and options models, such as the iSDP model, and the availability of resource such as the NWC funded Resource Papers and Wagga Wagga case study example.
The overview and summary at the beginning of each step of the IRP process provides context and an outline of each step of the process. More detailed reading of the Guide is recommended for key individuals who have some knowledge of IRP and who will be leading their team through the process.
For those less experienced in IRP, the Demand Management and IRP training may be useful this can be arranged through various organisations including Institute for Sustainable Futures, UTS.
Section 3 of the resource paper Incorporating climate change into Urban Water Integrated Resource Planning (Fane et al. 2010b) discusses how climate change and the associated uncertainty around future climate needs to be considered during stage 1 of an IRP process (and how this will affect the process overall). It specifically address the issues of setting planning objectives in the face of climate change and the need to set objectives for mitigating the greenhouse gas emissions that result from water service provision, alongside the objective of adapting urban water systems to climate change. The section also highlights how the uncertainties associated with climate change mean that urban water planning will need to become more adaptive and what this might mean for planning an IRP process.
Step 1 – Plan the Overall Process
Guide to Demand Management Step 1 – page 5
Step 1B Conduct p lanning works hop(s ) One or more planning workshops at this early stage will:
• clarify who should be involved
• determine the drivers for undertaking the IRP process
• identify previous and/or existing work to be considered
• facilitate decision-making on how the IRP process will be undertaken.
The number of planning meetings and stakeholders involved will vary depending on the situation and regional context. The primary principle should be to maximise inclusiveness. Some further tips for successful workshops with high quality outcomes are:
• the use of an independent facilitator for each workshop
• making stakeholder roles clear to all participants from the outset (e.g. what decision-making authority they will hold) to establish appropriate expectations
The suggested content and processes for the planning workshop(s) are described in 1B (i) to 1B (vii).
1B (i) Identify s takeholder ro les and res pons ib ilities The choice of stakeholders to be involved in the IRP process will depend on the local context.
A small local water authority or utility undertaking the IRP process for the first time might be driven by regional planning and reporting requirements. They may wish to involve only stakeholders within the organisation for discussions at a strategic planning level. Even when the primary stakeholders are internal to the organisation, authorities should consider a diverse group such as supply planners, staff with some responsibility for demand management and environmental planners etc. to obtain a broader perspective.
In more complex or detailed situations where perhaps the IRP process has already started, (e.g. the review of the Metropolitan Water Plan for Sydney) a diverse group of internal and external stakeholders should be involved from the start.
In other regions, where water planning has been the subject of several different planning processes over a number of years, a broader stakeholder group including community and representatives from various trades (e.g. plumbing, gardening) may already exist (i.e. the Alice Springs Urban Water Management Strategy Reference Group).
Once identified, each stakeholder’s roles and responsibilities should be clearly articulated when they are invited to participate.
1B (ii) Define the s ignificant drive rs for ac tion Here the group discusses its perspectives on the most significant regional issues requiring resolution, and how water resources planning and management relates to these issues. It will become clear that the actions taken within the IRP process will vary depending on the original motivation. The aim is to include multiple views to provide a broad context within which to carry out the IRP process and to create a shared understanding amongst stakeholders of the reasons why the IRP process is being initiated.
Some of the reasons for initiating the process might be:
• an on-going drought situation
• an increased focus on water supply and demand in the face of climate change
• a proactive water authority wanting to undertake the process for the first time to determine the supply–demand balance
• a larger utility that has undertaken the process previously and now wishes to review how it is tracking against its targets in terms of supply and demand.
Step 1 – page 6 Guide to Demand Management
1B (iii) Identify pre vious and exis ting p lanning proces s es It will be essential to identify previously conducted and existing planning processes in the region and to develop synergies with them wherever possible and appropriate. For example, where detailed studies are being undertaken independently for supply and reuse, the IRP process can incorporate those within an overarching and holistic planning investigation. It may be difficult to accommodate the drivers and the timing within the IRP process. However, if dialogue can start early, then those in charge of the independent processes are kept informed and the data being collected can be put to full use in all processes. Such communication will also ensure that duplication of work is minimised as far as possible.
1B (iv) De ve lop a pre liminary vis ion of the proces s The overall IRP process is shown in Figure 1 (refer to the previous Overview section of this Guide). It has five distinct steps, each with supporting models and data and information needs. Part of the purpose of the planning workshop will be to think through the appropriate scope or level of detail for each step. In agreeing to a broad vision, the group should work through:
• the broader context and the main drivers for initiating the IRP process
• as a minimum, agree to perform all five steps at a high level (e.g. undertake a first-cut strategic plan)
• if the process has in part been undertaken in the past and further detail is required, determine how to undertake the process in more detail considering monetary and staff resources and time for staff training.
1B (v) De te rmine ava ilab le funds , re s ources and commitments Ideally, the IRP process will be supported by several agencies as well as the water authority. It is important to clarify how available resources (monetary, people and data) will be secured and to gain commitment from all parties to fulfil their responsibilities.
1B (vi) Define a s tee ring committee to manage the proces s Forming a group to oversee and manage the IRP process will be important for organisation and accountability. A consistent group of individuals within the steering committee will provide leadership throughout a complex process with multiple participants. Consistency in the steering committee facilitates knowledge transfer and good decision-making. The steering committee should preferably arrange to meet on a regular basis to ensure that individuals with set responsibilities are held accountable and to ensure the process is undertaken as planned.
1B (vii) Se lec t documents needed to fac ilita te the IRP proces s review The IRP process is cyclic and continuing. Variations in supply and demand will always occur and regional contexts and constraints will change. To achieve and maintain a balance requires on-going adjustment. Ultimately, the IRP process is a learning process with repeated cycles of planning. Gradually, organisations will improve data availability and quality, achieve greater accuracy of the supporting models and improve decision-making.
In many situations climate change adaptation will be a central rationale for conducting an IRP process. Section 3 of the Climate Change resource paper (Fane et al. 2010b) discusses how stakeholders can have very different perspectives on what climate change adaptation should entail. Four alternative perspectives are characterised. These provide a useful starting point for discussing how various people and organisations ‘frame the problem’ of climate change adaptation for the urban water system in question.
The Sustainability Assessment resource paper (Fane et al. 2010a) can assist with thinking through the way sustainability aspects should be dealt with in the IRP process

Step 1 – Plan the Overall Process
Guide to Demand Management Step 1 – page 7
To formalise and make explicit the learning process, Step 5 is a formal review of the IRP process, which is in addition to the review processes (e.g. of pilot programs) that are occurring throughout. Hence, as a part of Step 1, the group should make some basic decisions about the scope and detail of the end review and put in place appropriate mechanisms to capture important aspects of the planning process as it occurs to facilitate the review process.

Guide to Demand Management Step 2 – page 1
STEP 2 - ANALYSE THE SITUATION
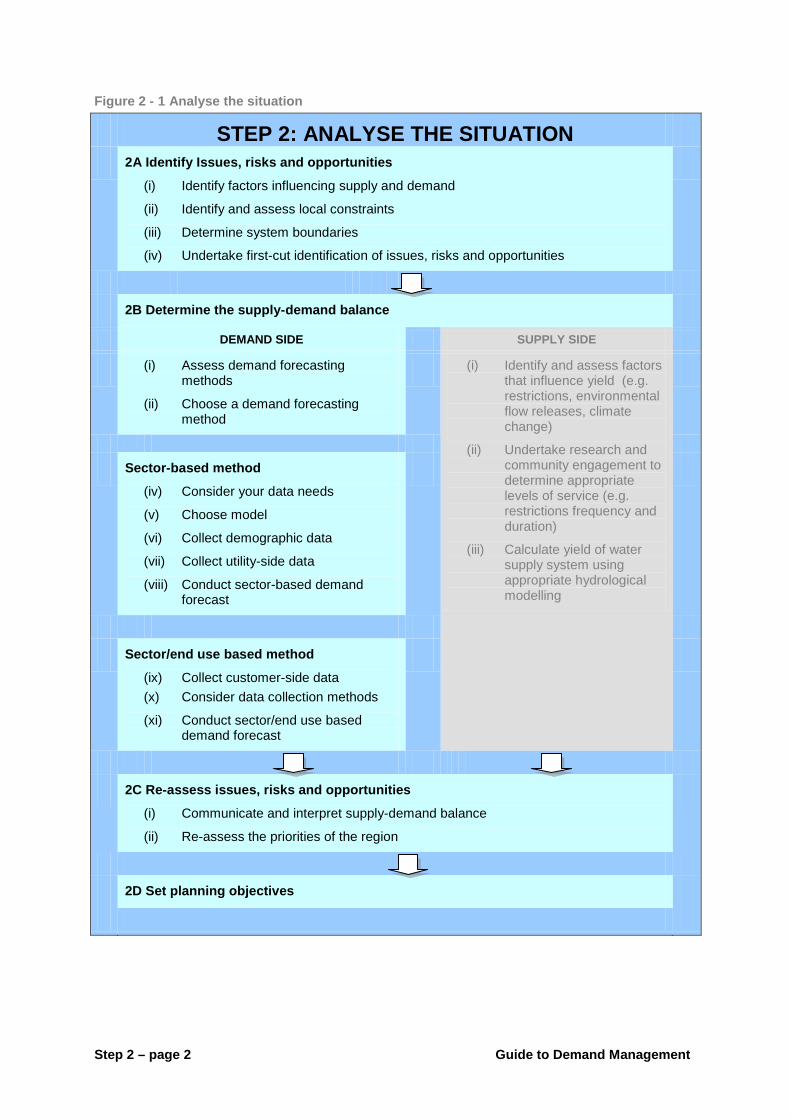
Step 2 – page 2 Guide to Demand Management
Figure 2 - 1 Analyse the situation
STEP 2: ANALYSE THE SITUATION
2A Identify Issues, risks and opportunities
(i) Identify factors influencing supply and demand
(ii) Identify and assess local constraints
(iii) Determine system boundaries
(iv) Undertake first-cut identification of issues, risks and opportunities
2B Determine the supply-demand balance
DEMAND SIDE SUPPLY SIDE
(i) Assess demand forecasting methods
(ii) Choose a demand forecasting method
(i) Identify and assess factors that influence yield (e.g. restrictions, environmental flow releases, climate change)
(ii) Undertake research and community engagement to determine appropriate levels of service (e.g. restrictions frequency and duration)
(iii) Calculate yield of water supply system using appropriate hydrological modelling
Sector-based method
(iv) Consider your data needs
(v) Choose model
(vi) Collect demographic data
(vii) Collect utility-side data
(viii) Conduct sector-based demand forecast
Sector/end use based method
(ix) Collect customer-side data (x) Consider data collection methods
(xi) Conduct sector/end use based demand forecast
2C Re-assess issues, risks and opportunities
(i) Communicate and interpret supply-demand balance
(ii) Re-assess the priorities of the region
2D Set planning objectives
Step 2 – Analyse the Situation
Guide to Demand Management Step 2 – page 3
Step 2 Summary This step focuses on identifying regional issues and determining the difference between supply and demand (the supply-demand balance). Step 2 is primarily about defining the problem to be solved, which is highly specific to each region. Only when the problem is identified can the appropriate response be found as part of Step 3.
. The outcomes sought in this Step are:
• a shared understanding of the issues, risks and opportunities that have been identified through informed discussions by various stakeholders
• an appropriately detailed reference case for water demand that can be compared with the yield of supply to determine the supply-demand balance
• a shared vision of the goals that need to be achieved.
Step 2A is where issues, risks and opportunities are identified and Step 2B is where the supply-demand balance is determined.
Water service providers are already very familiar with how to calculate the yield of their respective water supply systems and there is significant guidance in this field (see also Erlanger and Neal 2005). However, they are less familiar with calculating demand using detailed forecasting methods based on disaggregation. Hence, Step 2B focuses on how to determine the projected water demand.
Step 2 – page 4 Guide to Demand Management
Step 2A Identify is s ues , ris ks and opportunitie s 2A (i) Identify fac tors in fluenc ing s upply and demand Every region has specific characteristics, including:
• projected changes in climate
• demographic and land use characteristics
• existing potable and non-potable water supply sources and systems
• water using appliances
• water usage practices in terms of customer behaviour.
That is, a number of ‘factors’ directly influence both the yield from supply sources and the amount of water used in a specific region (historically, now and in the future), thus affecting the supply-demand balance. These factors need to be identified for the local context and explicitly considered when identifying issues, risks and opportunities.
Fac tors a ffec ting s upply yie ld A number of factors can influence the estimated yield of the supply system:
• The characteristics of the supply system, for example:
different surface and groundwater resources the number and capacity of the surface and service reservoirs the characteristics of the surface water catchment feeding the surface water reserves
(e.g. vegetation growth, fires in the catchment) the rainfall and inflow patterns.
• Changes in modelling the hydrology of the system, for instance:
in Perth, more recent climate and inflow data has shown the potential need to de-rate or reduce the yield of the system (refer to Example 2–1).
in Sydney, more recent climate and inflow data together with minor improvements to the Sydney catchment WATHNET hydrological simulation model have led to a decrease in yield.
• Supply system operating rules, such as:
inter-catchment transfers and the use of alternative potable sources such as groundwater reserves used to optimise the system
environmental flow release rules for specific watercourses or environmental allocations for groundwater sources
the use of flow returns from wastewater treatment plants that can be a substitute for environmental flows and free-up surface reservoir flows for potable supply
minimum operating levels in surface reservoirs/water courses to maintain social requirements for recreational or business activities
existing service level requirements
Climate Change can be expected to affect both available supply and water demand, although the impacts on demand are likely to be less than the impact on supply in most regions. As part of ‘analysing the situation’ it is therefore necessary to consider the impact of climate change in the region. Ideally regional climate change scenarios will be developed and incorporated into the estimates on both sides of the supply-demand balance. Section 4 of the Climate Change resource paper (Fane et al. 2010b) discusses generating climate change scenarios and incorporating these into forecasts of supply and demand. A range of methods exist for this and the approaches available are discussed in the resource paper.

Step 2 – Analyse the Situation
Guide to Demand Management Step 2 – page 5
• Drought response rules, such as:
reliability (e.g. percentage of time in restrictions) robustness (e.g. duration of restrictions) security (e.g. percentage of time the system should not approach emptiness) trigger levels for restrictions and the depth of restrictions (expected savings to be
achieved at various levels of restrictions) trigger levels for ‘readiness options’ and emergency supplies. These may include
groundwater reserves, desalination plants etc.
An additional consideration in regions that use some form of permanent restrictions or have implemented significant outdoor water efficiency programs is ‘demand hardening’. This is when a proportion of discretionary demand, likely to be primarily associated with outdoor use, will have already been affected in the residential component of demand. Demand hardening will make it more difficult to achieve the previously assumed magnitude of reduction in demand at particular restrictions trigger levels. This will change the yield of the system and needs to be taken into consideration when setting the rules for a drought response strategy and the assumed demand reduction during restrictions.
Authors’ Note: Restrictions
Water restrictions need to be considered as a ‘supply-side’ and not a ‘demand management’ option. Restriction rules are designed to increase the annual amount of water that can be safely drawn from storages without risk of failure, by slowing demand when storages get low. They are temporary actions, which rely upon a reduction in discretionary demand such as outdoor water use. Demand management refers to actions that reduce the demand for water in a lasting way and without a reduction in the quality of service provided.
Care must be taken during options analysis under Step 3 not to confuse restrictions with demand management options.

Step 2 – page 6 Guide to Demand Management
Example 2 - 1 Perth supply storages
Due to a number of factors, including the potential effects of long-term climate change, there has been a significant depletion in both the surface water and some groundwater reserves in the Integrated Water Supply System (IWSS) for Perth.
The graph below shows that flows in rivers and streams replenishing the major dams which supply up to half of Perth’s drinking water have reduced significantly in recent years potentially due to the impact of climate change. Average total flow from 1997 to 2006 was only 31% of the average from 1911 to 1974. Corresponding reductions in groundwater recharge have also been observed and production from a number of bores has been ceased due to falling groundwater levels.
The State Water Strategy requires that integrated resource planning be used to assess how to fill the supply-demand gap. Integrated resource planning has been implemented for the IWSS, which services Perth and a number of other areas, to improve demand prediction and formalise the comparison of supply and demand-side options.
Water conservation programs have played an important part in Perth’s source planning since the 1980’s and comprehensive water efficiency strategies and programs were introduced in 2002. At the same time source augmentation programs have continued, including commissioning of a 45 GL per year seawater desalination plant in 2006 and a second plant currently under construction. A strategy known as “Security through Diversity” which also includes surface and groundwater source development, forest thinning to improve catchment performance, water trading with irrigators, water recycling and improved water use efficiency, was introduced in 2004.
The integrated resource planning process provides an appropriate way to consider and compare supply and demand-side options.
Source – Rod Burton, Water Corporation
Yearly Streamflow for Major Surface Water Sources - IWSS
0
100
200
300
400
500
600
700
800
900
1000
1911
1914
1917
1920
1923
1926
1929
1932
1935
1938
1941
1944
1947
1950
1953
1956
1959
1962
1965
1968
1971
1974
1977
1980
1983
1986
1989
1992
1995
1998
2001
2004
Tota
l Ann
ual I
nflo
w to
Per
th D
ams
(GL)
Annual Total
1911 to 1974 av (338 GL)
1975 to 1996 av (177 GL)
1997 to 2006 av (106 GL)
Note: A year is taken as May to April - 2005/06 inflow is an estimate only
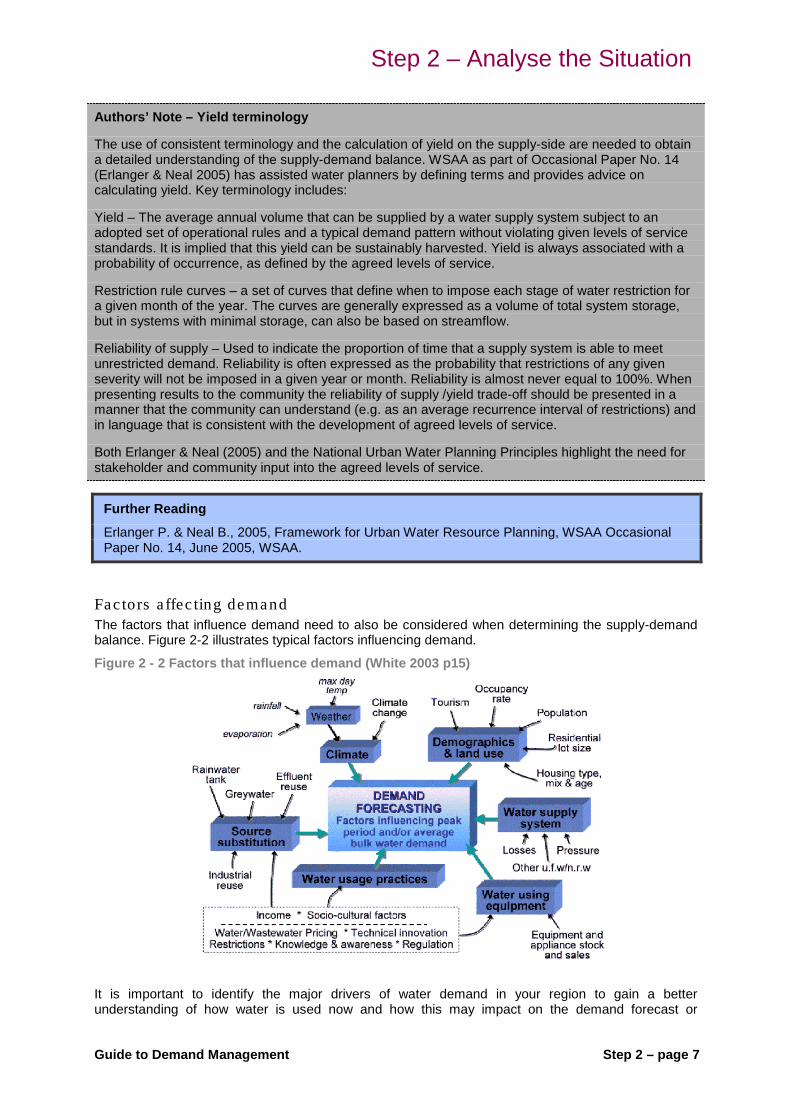
Step 2 – Analyse the Situation
Guide to Demand Management Step 2 – page 7
Authors’ Note – Yield terminology
The use of consistent terminology and the calculation of yield on the supply-side are needed to obtain a detailed understanding of the supply-demand balance. WSAA as part of Occasional Paper No. 14 (Erlanger & Neal 2005) has assisted water planners by defining terms and provides advice on calculating yield. Key terminology includes:
Yield – The average annual volume that can be supplied by a water supply system subject to an adopted set of operational rules and a typical demand pattern without violating given levels of service standards. It is implied that this yield can be sustainably harvested. Yield is always associated with a probability of occurrence, as defined by the agreed levels of service.
Restriction rule curves – a set of curves that define when to impose each stage of water restriction for a given month of the year. The curves are generally expressed as a volume of total system storage, but in systems with minimal storage, can also be based on streamflow.
Reliability of supply – Used to indicate the proportion of time that a supply system is able to meet unrestricted demand. Reliability is often expressed as the probability that restrictions of any given severity will not be imposed in a given year or month. Reliability is almost never equal to 100%. When presenting results to the community the reliability of supply /yield trade-off should be presented in a manner that the community can understand (e.g. as an average recurrence interval of restrictions) and in language that is consistent with the development of agreed levels of service.
Both Erlanger & Neal (2005) and the National Urban Water Planning Principles highlight the need for stakeholder and community input into the agreed levels of service.
Further Reading
Erlanger P. & Neal B., 2005, Framework for Urban Water Resource Planning, WSAA Occasional Paper No. 14, June 2005, WSAA.
Fac tors a ffec ting demand The factors that influence demand need to also be considered when determining the supply-demand balance. Figure 2-2 illustrates typical factors influencing demand.
Figure 2 - 2 Factors that influence demand (White 2003 p15)
It is important to identify the major drivers of water demand in your region to gain a better understanding of how water is used now and how this may impact on the demand forecast or

Step 2 – page 8 Guide to Demand Management
reference case. For example, in certain areas on the north coast of NSW, tourism has a significant impact on demand. In Sydney, with urban consolidation (mainly associated with the increase in the proportion of multi-residential properties with little or no garden) means demand per capita and per household is expected to decrease. In areas such as Perth where households have private bores tapping into a non-potable supply there is a large proportion of water that has not been accounted for in per capita or per household demand figures because it is not part of the potable system. Only now, with the use of the iSDP model can this ‘hidden’ component of water demand be accounted for to obtain a ‘total’ water demand picture.
Step 2B considers these factors in more depth when analysing current and future demand as part of the reference case demand for a specific region.
2A (ii) Identify and as s es s loca l cons tra in ts An overview of the factors affecting the yield of supply available, the demand and the local constraints at an early stage of the planning process will make sure that no major issues are overlooked. In many cases, the most acute problems will be obvious (e.g. average water demand in a region outstripping available yield forcing the need for investment in potable supply, potable source substitution and/or demand-side options). However, it will always be worth systematically examining the possibilities to reveal the inherent constraints and sometimes less obvious opportunities such as:
• peak water demand constraints – where a reduction in peak water demand would facilitate optimisation of the system and enable it to cater for future growth
• high operating costs for water and/or wastewater transport and treatment – where water efficiency or more localised provision of water and/or wastewater services may provide significant cost reduction benefits
• localised wastewater system constraints – where a reduction in indoor water demand could enable the same system to cater for additional customers without the need for augmentation
• stormwater constraints – where localised rainwater and stormwater capture could provide for specific non-potable end uses and defer the need to upgrade an existing stormwater system due to urbanisation and replacement of permeable areas with non-permeable surfaces
• high growth and need for new subdivisions – where the use of the latest water efficiency technology and decentralised/distributed water and wastewater systems can be used as alternatives to augmenting the existing system.
2A (iii) De te rmine s ys tem boundaries A decision about the ‘system boundary’ for the planning process determines what to include and exclude in the collation of data, subsequent analysis and overall planning. Examples of system boundaries may include:
• the current water supply system
• the water service provision area extended to adjacent smaller existing or new towns
• the wastewater service area boundary if wastewater or its disposal is the main constraint
• a geographical or topographical boundary that incorporates stormwater runoff characteristics of the region.
It is likely that a range of stakeholders will need to be consulted in determining the appropriate system boundary.
Climate Change can be expected to affect future water demand. This impact is likely to be greater for inland regions where increasing temperatures will not be offset by increasing humidity. Section 3.3 of the Climate Change resource paper (Fane et al. 2010b) discusses the impact of climate change on demand forecasting.

Step 2 – Analyse the Situation
Guide to Demand Management Step 2 – page 9
2A (iv) Undertake firs t cu t identifica tion of is s ues , ris ks and opportunitie s It is important for the team that will be conducting the analysis, and other stakeholders that will ultimately be involved, to do a “first cut” identification of the issues, risks and opportunities for the region before detailed data collection and analysis under Step 2B. This will help make them aware of available information, the factors that influence demand and the system boundary being analysed.
In each location, the IRP process will be triggered for different reasons, as noted in Step 1B (ii). In Step 2A, the steering committee can reassess these perceived triggers or imposed targets, and uncover the underlying issues, risks and opportunities. This means the most appropriate response will be implemented and ensure that investment is not wasted on a perceived or unfounded need.
For best results, a participatory process should be used to think through the trade-offs that are inherent in the need to meet the supply-demand balance, environmental flows and inter-catchment transfers. Wherever possible community engagement should be set up in the process. A participatory process will provide a common and shared understanding about the issues, risks and opportunities for the region. It will also give the group a shared understanding of the assumptions being used and the limitations of the data/information available. The outcome of the process will be planning goals that will help direct investment choices in Step 2B and the collection of appropriate information regarding the supply-demand balance.
The number of stakeholders involved and the extent of community engagement may be large or small depending on the scale or depth of this iteration of the IRP process. As a minimum, members from different departments (e.g. water supply strategic/ operational departments, demand management, sewerage, stormwater) of the water authority should be involved. If possible, extending this group to include other agencies (such as the regulatory agency, environmental agency, land use planning agency) and community representatives will diversify the views heard and help align the initial planning objectives with other groups’ agendas.
Basic information on the region being analysed will be required in this Step. Much of this information will already be available to the water service provider or can be easily collated for the process.
Data/information you will need:
Maps and basic water service provision plans of the area being analysed for those less familiar with the boundary and system characteristics of the region being analysed.
Plans of growth areas.
Historical annual potable demand and projected demand together with assumptions.
Projected populations and if possible other demographic information such as household types and occupancy.
Any information on water sector breakdowns from the customer meter database such as residential, non-residential, non revenue water. Much of this basic data is now required for inclusion in the National Performance Reports, prepared by the NWC and WSAA, or in other state benchmarking reports (NSW DWE 2009). All the data from the National Performance Reports is available in an easily used spreadsheet form from the NWC website.
Any current information on the volume of potable water substitution (e.g. private bores, rainwater tanks, greywater systems, utility managed effluent reuse).
Current water supply system characteristics such as capital and operating costs, pipeline distribution systems, pump stations, losses, pressure, and current system constraints.
Climate information and historical annual trends (rainfall, evaporation, temperature) that may have affected yield or the demand for water over time.
Information on other factors that may have affected demand historically such as previous restrictions periods, tariff changes or demand management programs.

Step 2 – page 10 Guide to Demand Management
Recommended pa rtic ipa tory proces s An interactive, participatory and deliberative decision-making process should be undertaken in the form of a facilitated workshop. Examples of large Australian participatory processes used for water management are provided in Example 2–2.
Inevitably, points of view will differ and may even conflict and so quality facilitation will help ensure constructive dialogue and identify points of uncertainty for further investigation.
The workshop will need to include the available information about the region in a clear format. This is particularly important for those participants who are less familiar with the details of the region but who will be valuable in providing a fresh or new perspective. The workshop should also ensure all the key issues, risks and opportunities are raised. To gain the most from the participants in the discussion both divergence and convergence should be used.
Divergence is where participants are encouraged to debate and generate many ideas. Participatory methods that stimulate divergence include:
• Backcasting – defining a desirable future vision and mapping the steps required to achieve that vision. The four typical steps are problem definition (including for example the timing and geographical issues), development of a future image of the desired vision, analysis of a path to attain that vision and consideration of policy development.
• Scenario building – may be useful to explore perspectives on potential risks such as climate change, significant population growth, economic growth, drought or other potential changes or risks.
Convergence may be achieved through jointly defining and articulating a set of objectives that capture the most important issues raised. If community representatives are involved in the process, it is important that ways to integrate their perspective are ensured. Example 2-2 identifies participatory processes that have been used in the initial stages of an IRP process.
At this stage it is important to keep discussions broad brush, as more detailed, accurate analysis will follow in subsequent steps. The purpose here is simply to map out the territory and form a common understanding and vision.
This is the point to clearly re-iterate what needs to be done next, at what level of detail, when and by whom and the resources available/needed. The outcomes of the participatory workshop will involve reassessment of resources or timing identified in Step 1B. These will need to be considered by the steering committee set up as part of Step 1.
Documentation of the process and outcomes of this sub-step and workshop is essential for planning and later reflection.
Example 2 - 2 Participatory processes
In both Perth and Melbourne, large-scale processes for involving the community in discussion regarding the development of the water strategy were undertaken. In the case of Melbourne, this was represented by the Melbourne Water Resources Review chaired by Professor Nancy Millis and with extensive involvement of utilities, state agencies, NGOs and interested members of the community through submissions and workshops.
In the case of Perth, for the development of the State Water Strategy, several large public meetings culminated in a summit held at Parliament House, with input from many stakeholders and included some citizens randomly selected from respondents to newspaper advertisements.
Similar processes have been undertaken in the ACT (See www.thinkwater.act.gov.au/).
Significant potential exists to extend innovative, deliberative processes with processes that use random selection more comprehensively, are undertaken over an extended period with significant input from experts and stakeholder groups, and have a major input to the decision-making process (see Carson & Gelber 2001).

Step 2 – Analyse the Situation
Guide to Demand Management Step 2 – page 11
Further Reading
For further information on participatory processes in decision making:
De Marchi, B., Funtowicz S., Lo Cascio, S. & Munda, G. 2000, ‘Combining participative and institutional approaches with multi-criteria evaluation. An empirical study for water issues in Toina, Sicily’, Ecological Economics. 34(2), 267–282.
Renn, O., 1999, 'A Model for an Analytic-Deliberative Process in Risk Management', Environmental Science & Technology, vol. 33, no. 18, pp. 3049–3055.
Carson, L. & Gelber, K., 2001, Ideas for Community Consultation: A Report, Prepared for the NSW Department of Urban Affairs and Planning, February 2001.
Lundie, S., Ashbolt, N., Livingston, D., Lai, E., Karrman, E., & Blaikie, J., 2005. Sustainability framework – methodology for evaluating the overall sustainability of urban water systems: UNSW.
For more information about the technique of backcasting, please see:
Mitchell, C. & White, S., 2003, 'Forecasting and backcasting for sustainable urban water futures' Water Vol 30 No 5, August 2003.
Robinson, JB., 1982, 'Energy Backcasting: Now, you will have an appreciation of the specific issues, risks and opportunities in the defined region and gained an initial idea of key planning goals for the region. Next, it is important to clarify the supply-demand balance at the appropriate level of detail. Will it be a proposed method of policy analysis?' Energy Policy, Vol. 10 No. 4, 337–344.
Van de Kerkhof, M., Hisschemoller, M., & Spanjersberg, M., 2002, 'Shaping Diversity in Participatory Foresight Studies: Experiences with Interactive Backcasting in a Stakeholder Assessment on Long-Term Climate Policy in The Netherlands' Greener Management International 37, Spring, 85–99.
For more information about scenario-building examples within the water industry, please see:
Alcamo, J. & Ribeiro, T., 2001, "Scenarios as tools for international assessments." Environmental Issue Report. Experts' corner report: Prospects and Scenarios No. 5(24).
Cubillo F., 2003, Drought, Risk Management and Reliability, Efficient2003, Tenerife, Spain.
Westcott, 2003, A Scenario Approach to Demand Forecasting, Efficient2003 2nd International Conference in Efficient Use and Management of Water for Urban Supply, Tenerife, Spain, April 2003.
Lundie S., Peters G., & Beavis, P., 2004, Life Cycle Assessment for Sustainable Metropolitan Water Systems Planning, Environ. Sci. Technol. 38:13,3465–3473.
Swart, RJ., Raskin, P., & Robinson, J., 2004, 'The Problem of the Future: Sustainability Science and Scenario Analysis', Global Environmental Change Part A, vol. 14, no. 2, pp. 137–146.
For a further background on stakeholder and public participation in the context of IRP see section 3.1 in the Sustainability Assessment resource paper (Fane et al. 2010a).

Step 2 – page 12 Guide to Demand Management
Step 2B Determine the s upply-demand ba lance After completing Step 2A you will have an appreciation of the specific issues, risks and opportunities in the defined region and have gained an initial idea of key planning goals. Next, it is important to clarify the supply-demand balance at the appropriate level of detail (e.g. strategic, an internal water service providers first cut assessment or detailed IRP assessment).
Step 2B involves comparing the ‘reference case’ projected water demand under a ‘do nothing’ or ‘business as usual’ scenario (where no planned intervention is likely to affect the long term water demand) against the yield of the system. The difference or ‘balance’ is the volume of water that will need to be filled by potable supply, potable source substitution and/or demand-side options.
By investigating both the yield and reference case demand in depth, a water service provider can determine:
• when the supply-demand balance may become an issue
• where and how water is used so that the water conservation potential in a region can be identified.
Knowing the supply-demand balance and water conservation potential accurately can help to provide an adaptive and cost effective response for each specific region.
In Step 2B the sub-steps have been grouped in the following way:
• Steps 2B (i) and (ii) help the reader decide which demand forecasting method to use
• Steps 2B (iii) to (vii) cover the data needs, available models, collection of demographic and utility-side (bulk water and customer-metered demand) data, and show how to conduct a sector-based forecast
• Steps 2B (viii) to (x) explain what further data collection (on the customer-side, including appliance stock data) is needed to conduct a sector/end use based forecast and how to analyse the data to produce such a forecast.
Although presented in a linear sequence, it is likely that many of the steps will be conducted both in parallel and iteratively as new data becomes available.
2B (i) As s es s demand forecas ting methods There are three key methods used for demand forecasting:
• historical demand forecasting using per capita demand • disaggregation of demand into sectors • disaggregation of demand into sectors and end uses.
The main characteristics of each approach are described below followed by a comparison between the methods to demonstrate the benefits and limitations of each.
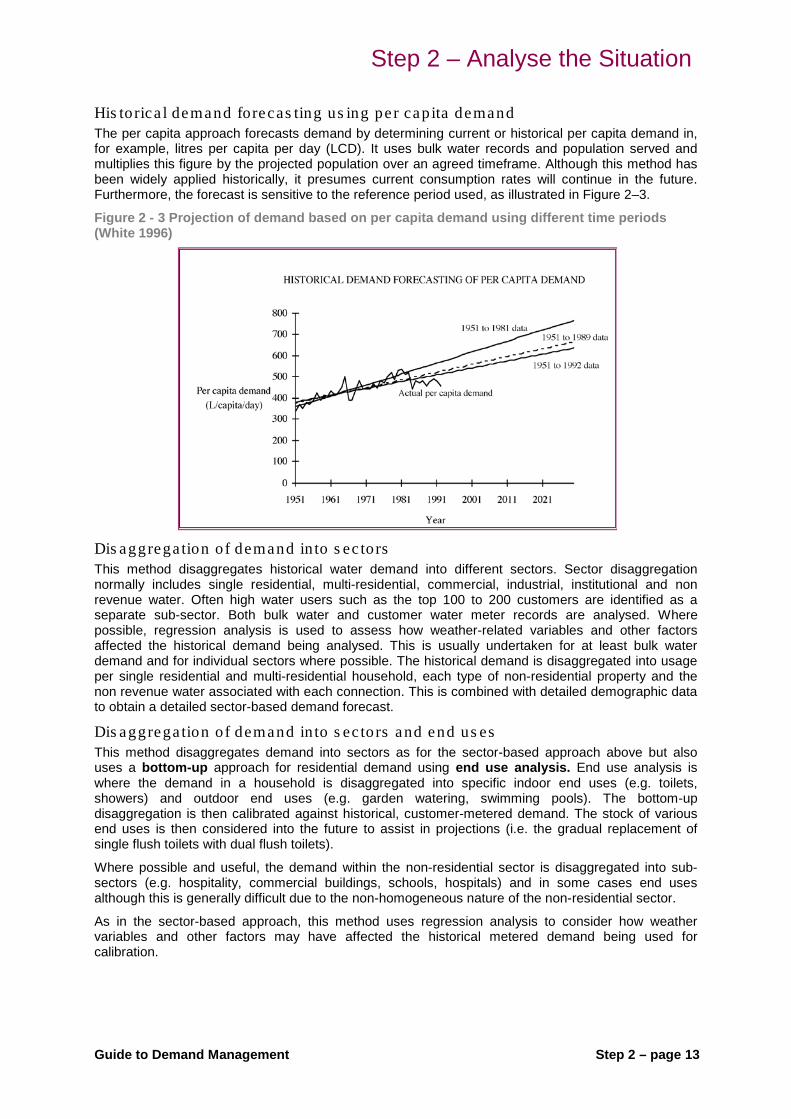
Step 2 – Analyse the Situation
Guide to Demand Management Step 2 – page 13
His torica l demand forecas ting us ing pe r capita demand The per capita approach forecasts demand by determining current or historical per capita demand in, for example, litres per capita per day (LCD). It uses bulk water records and population served and multiplies this figure by the projected population over an agreed timeframe. Although this method has been widely applied historically, it presumes current consumption rates will continue in the future. Furthermore, the forecast is sensitive to the reference period used, as illustrated in Figure 2–3.
Figure 2 - 3 Projection of demand based on per capita demand using different time periods (White 1996)
Dis aggrega tion of demand in to s ec tors This method disaggregates historical water demand into different sectors. Sector disaggregation normally includes single residential, multi-residential, commercial, industrial, institutional and non revenue water. Often high water users such as the top 100 to 200 customers are identified as a separate sub-sector. Both bulk water and customer water meter records are analysed. Where possible, regression analysis is used to assess how weather-related variables and other factors affected the historical demand being analysed. This is usually undertaken for at least bulk water demand and for individual sectors where possible. The historical demand is disaggregated into usage per single residential and multi-residential household, each type of non-residential property and the non revenue water associated with each connection. This is combined with detailed demographic data to obtain a detailed sector-based demand forecast.
Dis aggrega tion of demand in to s ec tors and end us es This method disaggregates demand into sectors as for the sector-based approach above but also uses a bottom-up approach for residential demand using end use analysis. End use analysis is where the demand in a household is disaggregated into specific indoor end uses (e.g. toilets, showers) and outdoor end uses (e.g. garden watering, swimming pools). The bottom-up disaggregation is then calibrated against historical, customer-metered demand. The stock of various end uses is then considered into the future to assist in projections (i.e. the gradual replacement of single flush toilets with dual flush toilets).
Where possible and useful, the demand within the non-residential sector is disaggregated into sub-sectors (e.g. hospitality, commercial buildings, schools, hospitals) and in some cases end uses although this is generally difficult due to the non-homogeneous nature of the non-residential sector.
As in the sector-based approach, this method uses regression analysis to consider how weather variables and other factors may have affected the historical metered demand being used for calibration.

Step 2 – page 14 Guide to Demand Management
Advantages and d is advantages of demand forecas ting methods The advantages and disadvantages of the different methods are detailed in Table 2-1. In essence, there are two main reasons why it is worth the additional effort of conducting at least a sector-based forecast, and if possible an end use-based forecast. These are as follows:
• Firstly, the more detailed the reference case, the better informed the decision-making. For example, Figure 2-4 shows a comparison of the use of the above three demand forecasting methods using real data from Melbourne and demonstrates how the end use-based approach in this case has given a more refined and lower forecast of the reference case demand5
• Secondly, disaggregation of demand into sectors and end uses provides much-needed information for choosing appropriate demand management strategies, since it shows where and how water is being used.
. In locations where the trigger for supply augmentation is at a specific yield, Figure 2-4 shows how having a more detailed reference case can potentially defer the need to consider augmentation for several years. Deferring capital expenditure can provide significant economic benefits to a region.
Figure 2 - 4 Example of comparison of demand methods (Turner et al. 2005)
5 In some locations, such as developing countries, technology is shifting from pour flush toilets to higher water-using technology from the US and the UK. In these cases, the reference case could be higher.

Guide to Demand Management Step 2 – page 15
Table 2 - 1 Benefits and limitations of demand forecasting methods Method Benefits Limitations
1. Historical demand forecasting using per capita demand
Common approach Quick and easy
Projects current or recent historical situation, which may have been affected by other factors (e.g. annual climate variations, restrictions, water efficiency programs). Does not consider how demand for individual sectors and or end uses may change over time Care needs to be taken over which historical timeframe should be used as the basis for linear extrapolation. Does not provide information on current efficiency for options analysis.
2. Disaggregation into sectors
Enables appreciation of how water is used in different sectors to help consider various historical and projected factors that may affect demand (e.g. how climate has affected historical demand in each sector or how changes in housing type and occupancy ratio in the residential sectors may change demand in the future). Useful for first use of IRP process or where preparing a Water Planning Strategy in a short timeframe. Accounts for non-potable water demand supplies to a limited extent (e.g. rainwater tanks, grey water systems, groundwater bores, reuse systems). Considers demand per household, per non-residential property and per person.
Demand predominantly limited to current or historical situation Does not consider how demand for end uses may change over time Does not provide information on current efficiency for options analysis Takes longer than previous method and is dependent on data availability
3. Disaggregation into sectors/end uses
Enables appreciation of how water is used in different sectors and end uses, which assists in considering historical and projected factors that may affect demand (e.g. as for 2 above plus how water using technology may change demand). Useful when time is available to work through the IRP framework or when more detailed analysis is required after developing a draft Water Planning Strategy. Critical approach when implementing water efficiency programs in a region to assist in forecasting water demand more accurately, finding the water saving potential available in a specific region and assisting in assessing how programs have achieved targets.
Disaggregation and modelling dependent on available data/information. Needs dedicated resources as part of an ongoing program of work as requires new skills and familiarity with the approach as well as often significant data collection. Where data quality is low requires sensitivity analysis for assumptions made.
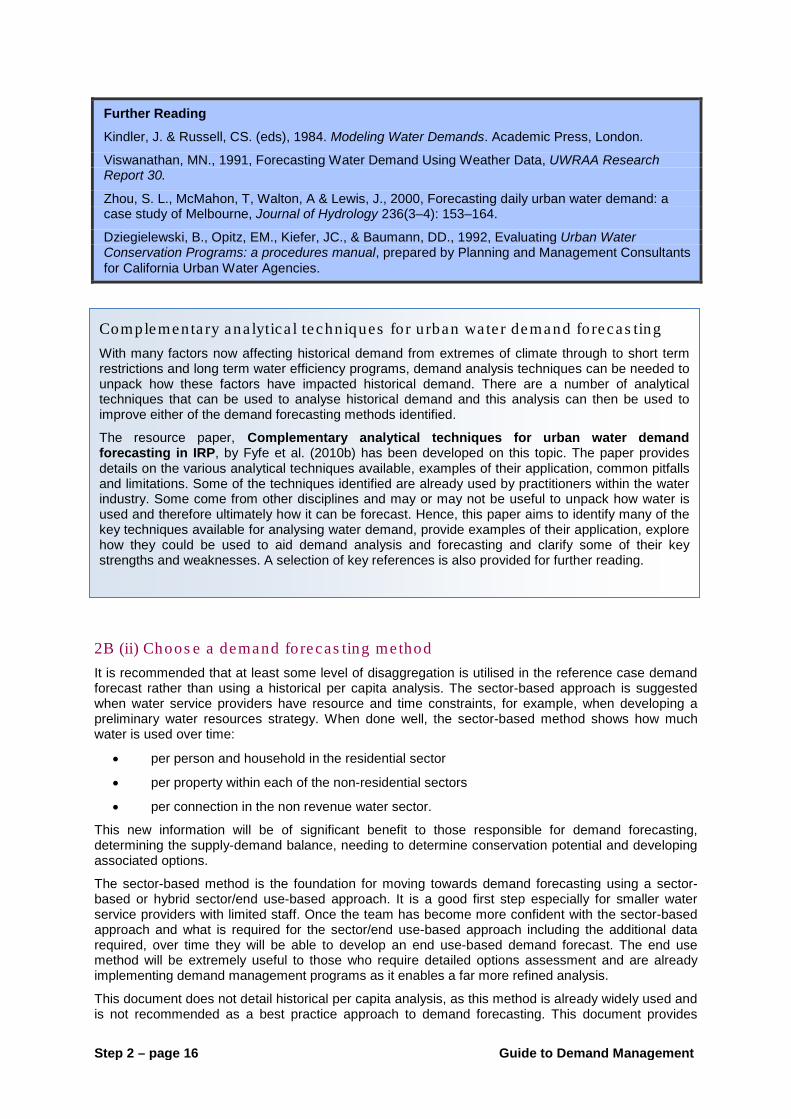
Step 2 – page 16 Guide to Demand Management
Further Reading
Kindler, J. & Russell, CS. (eds), 1984. Modeling Water Demands. Academic Press, London.
Viswanathan, MN., 1991, Forecasting Water Demand Using Weather Data, UWRAA Research Report 30.
Zhou, S. L., McMahon, T, Walton, A & Lewis, J., 2000, Forecasting daily urban water demand: a case study of Melbourne, Journal of Hydrology 236(3–4): 153–164.
Dziegielewski, B., Opitz, EM., Kiefer, JC., & Baumann, DD., 1992, Evaluating Urban Water Conservation Programs: a procedures manual, prepared by Planning and Management Consultants for California Urban Water Agencies.
2B (ii) Choos e a demand forecas ting method It is recommended that at least some level of disaggregation is utilised in the reference case demand forecast rather than using a historical per capita analysis. The sector-based approach is suggested when water service providers have resource and time constraints, for example, when developing a preliminary water resources strategy. When done well, the sector-based method shows how much water is used over time:
• per person and household in the residential sector
• per property within each of the non-residential sectors
• per connection in the non revenue water sector.
This new information will be of significant benefit to those responsible for demand forecasting, determining the supply-demand balance, needing to determine conservation potential and developing associated options.
The sector-based method is the foundation for moving towards demand forecasting using a sector-based or hybrid sector/end use-based approach. It is a good first step especially for smaller water service providers with limited staff. Once the team has become more confident with the sector-based approach and what is required for the sector/end use-based approach including the additional data required, over time they will be able to develop an end use-based demand forecast. The end use method will be extremely useful to those who require detailed options assessment and are already implementing demand management programs as it enables a far more refined analysis.
This document does not detail historical per capita analysis, as this method is already widely used and is not recommended as a best practice approach to demand forecasting. This document provides
Complementa ry ana lytica l techniques for urban wa te r demand forecas ting With many factors now affecting historical demand from extremes of climate through to short term restrictions and long term water efficiency programs, demand analysis techniques can be needed to unpack how these factors have impacted historical demand. There are a number of analytical techniques that can be used to analyse historical demand and this analysis can then be used to improve either of the demand forecasting methods identified.
The resource paper, Complementary analytical techniques for urban water demand forecasting in IRP, by Fyfe et al. (2010b) has been developed on this topic. The paper provides details on the various analytical techniques available, examples of their application, common pitfalls and limitations. Some of the techniques identified are already used by practitioners within the water industry. Some come from other disciplines and may or may not be useful to unpack how water is used and therefore ultimately how it can be forecast. Hence, this paper aims to identify many of the key techniques available for analysing water demand, provide examples of their application, explore how they could be used to aid demand analysis and forecasting and clarify some of their key strengths and weaknesses. A selection of key references is also provided for further reading.

Step 2 – Analyse the Situation
Guide to Demand Management Step 2 – page 17
details on both sector and sector/end use-based approaches as little guidance is currently available in the Australian context and both of these methods are recommended for different circumstances. The following steps lead the reader through these two approaches, beginning with sector-based forecast as the foundation followed by the steps needed to conduct sector/end use analysis. These should be read in conjunction with the new resource paper Complementary analytical techniques for urban water forecasting in IRP (Fyfe et al. 2010b) which will further assist analysts to refine their demand forecasting.
2B (iii) Cons ide r your da ta needs To forecast demand using sector and sector/end use-based approaches requires the collection and analysis of a range of different data sets from various sources. To streamline this process it is important to consider the area being analysed as a ‘system’. Figures 2-5 and 2-6 provide a simplified system to assist in identifying the ‘utility’ and ‘customer’ sides of that system and what data may need to be collected and analysed.
Data collection will involve both primary and secondary data collection. Secondary data collection (i.e. the collection of data from other studies and/or areas that is extrapolated or interpolated for use in the area being assessed) can be a very useful and low cost method to obtain information for the area being assessed, especially for stock and end use data. However, to improve accuracy, primary data collection (original or specific data) for the area being assessed will be necessary at some point. Different data collection methods can be used. These are discussed further in Step 2B (ix).
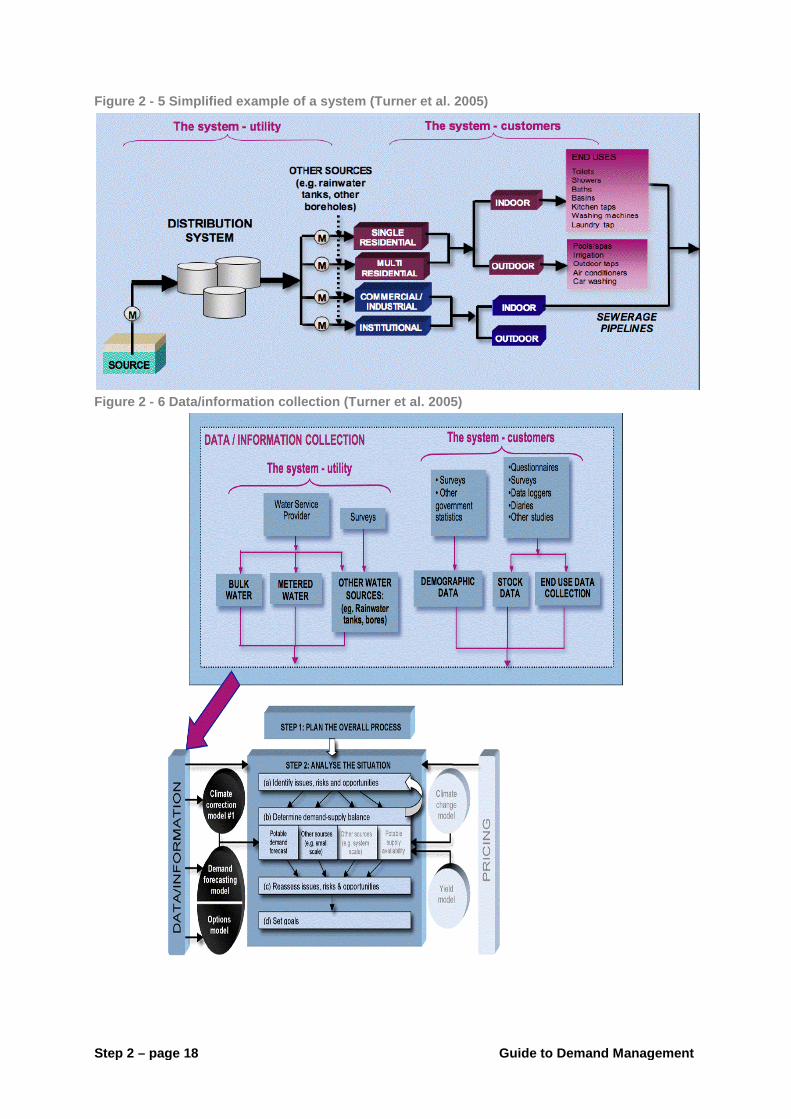
Step 2 – page 18 Guide to Demand Management
Figure 2 - 5 Simplified example of a system (Turner et al. 2005)
Figure 2 - 6 Data/information collection (Turner et al. 2005)

Step 2 – Analyse the Situation
Guide to Demand Management Step 2 – page 19
2B (iv) Choos e mode l The choice of model used to calculate the demand forecast will affect the data and format required. Therefore, the decision of which model to use must be made in conjunction with decisions about the method of demand forecasting adopted, the data to be collected, how and when it will be collected and who is available for data collection and associated analysis.
NWC and WSAA have supported the development of an iSDP model to assist water services providers across Australia who undertake sector and sector/end use-based demand forecasting and recommends the use of this model. It has been developed in such a way that as particular elements of the model are refined by individual water service providers (i.e. Sydney Water Corporation who assisted in its original development) these improvements can be shared amongst other users by simply importing the new format to the version being used.
Other models of varying sophistication exist such as:
• IWR-MAIN developed by the US Army Corps of Engineers (www.iwrmain.com),
• the decision support system (DSS) developed for regional water service providers in NSW,
• AWE tracking tool, currently customised for WA (www.allianceforwaterefficiency.org/Tracking-Tool.aspx) which is primarily a options assessment tool
• and other models developed by private consultants.
Each of these models has benefits and limitations. For simplicity this document assumes the use of the iSDP model and refers to it throughout the following steps.
2B (v) Collec t demographic da ta Water service providers are familiar with the standard historical and projected population data available from ABS, which is sometimes adjusted by the local planning authority. However, when using sector and sector/end use-based analysis additional information is required.
Data/information you will need
Historical total population and more specifically the population in single (detached, and sometimes semi-detached, houses) and in multi-residential households (flats and units)
Historical number of households for both single and multi-residential households
Historical occupancy ratio for both single and multi-residential households
Projections for each of the above over the chosen timeframe.
WSAA Occasional Paper No 15 (Birrell et al. 2005) considers some of the demographic influences on demand across Australia.
His torica l in formation ABS has maps that show the statistical division (SD), statistical subdivision (SSD) and statistical local area (SLA) for a chosen region. Where regions are split between different service providers such as in Melbourne this level of detail can be very useful to draw the boundary around the area of analysis in terms of the water service area and the population served. Figure 2-7 provides an example of the level of detail available from the ABS.

Step 2 – page 20 Guide to Demand Management
Figure 2 - 7 Typical example of an ABS demographic map6
Once the service area and associated boundary is chosen, current and historical population and housing data should be obtained for that area. For example, for Bellarine – Inner SLA under Barwon – Greater Geelong City (part A) SSD you can download an MS Excel® workbook (Catalogue No. 2001.0) from the ‘Basic Community Profile’ section of the ABS website. In this workbook, there are a number of tables providing a range of statistical information. Two key tables will be of particular use, as shown in Figures 2-8 and 2-9.
6 Source – http://www.abs.gov.au/ accessed 30/03/06
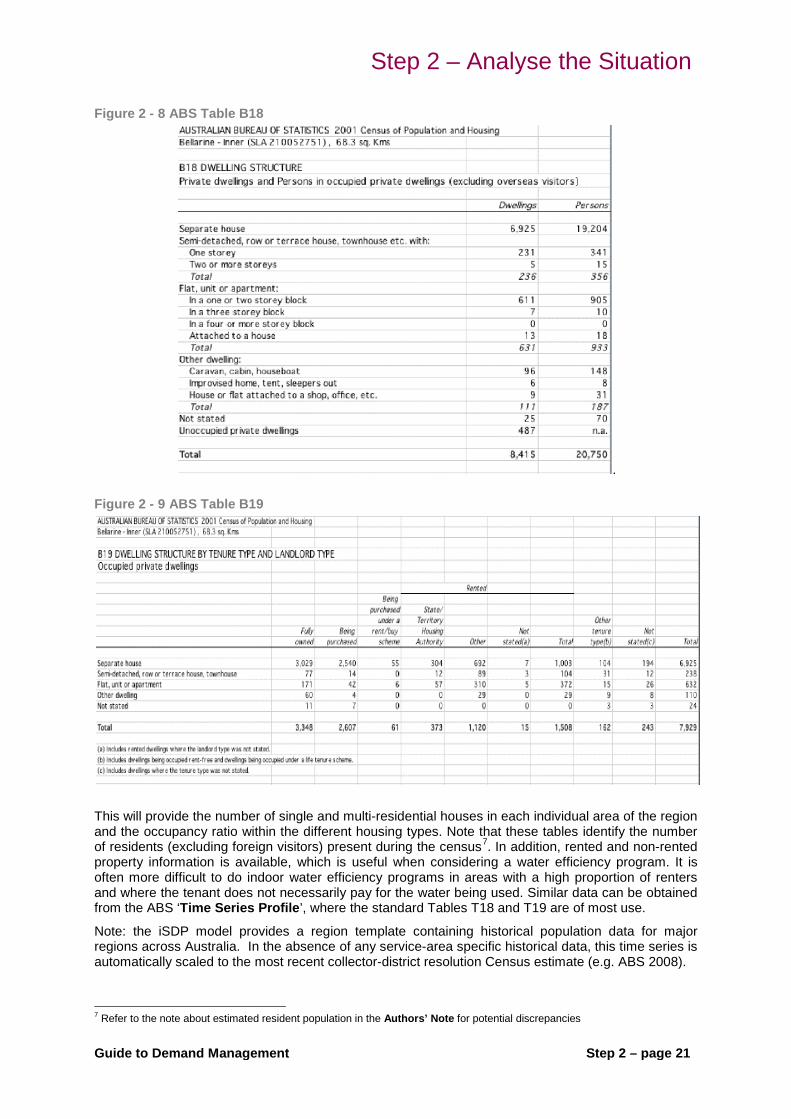
Step 2 – Analyse the Situation
Guide to Demand Management Step 2 – page 21
Figure 2 - 8 ABS Table B18
. Figure 2 - 9 ABS Table B19
This will provide the number of single and multi-residential houses in each individual area of the region and the occupancy ratio within the different housing types. Note that these tables identify the number of residents (excluding foreign visitors) present during the census7
Note: the iSDP model provides a region template containing historical population data for major regions across Australia. In the absence of any service-area specific historical data, this time series is automatically scaled to the most recent collector-district resolution Census estimate (e.g. ABS 2008).
. In addition, rented and non-rented property information is available, which is useful when considering a water efficiency program. It is often more difficult to do indoor water efficiency programs in areas with a high proportion of renters and where the tenant does not necessarily pay for the water being used. Similar data can be obtained from the ABS ‘Time Series Profile’, where the standard Tables T18 and T19 are of most use.
7 Refer to the note about estimated resident population in the Authors’ Note for potential discrepancies

Step 2 – page 22 Guide to Demand Management
The standard ABS ‘Regional Products’ section contains detailed demographic information for each state on ‘estimated resident population’ (ERP) (i.e. catalogue no. 1362.4 for Regional Statistics, SA) for 1991, 1996, 2001 and 2006 etc. census years. For some information the ABS website may direct you to a specific regional demographer to assist with the provision of the latest information.
Projec tions The ABS website also provides projections of population and dwellings together with useful links to regional departments and agencies. Specifically, two ABS catalogues provide projected data for Australia, its states and capital cities:
• Australian Bureau of Statistics (ABS) 2008, Population Projections, Australia, 2006 to 2101, Cat. no. 3222.0, ABS, Canberra.
• Australian Bureau of Statistics (ABS) 2008, Household and Family Projections, Australia, 2006 to 2031, Cat. no. 3236.0, ABS, Canberra.
Three projection series are provided for each region, each subject to different assumptions on fertility, mortality, migration etc. The projections are based on standard statistical boundaries and, as such, will typically not align with service area boundaries.
Note: the iSDP model provides a region template containing the ABS projections for states and capital cities across Australia. In the absence of any service-area specific projection data, these time-series can be utilised within the model.
More detailed information can be obtained from the various state government departments. Most state planning departments are able to provide population and dwelling projections to a spatial resolution of at least one statistical local area. State departments should also be consulted to assess how infill and land releases will affect both the split of single and multi-residential households and the mean lot size of properties.
Authors’ Note: Estimated residential population
It is important to note that the estimated resident population (ERP) of an area is the estimate of the number of persons who usually reside in that area irrespective of whether they were there on the date of the estimate. The ERP is the official ABS population figure and is based on adjusting the results of the latest Population Census. Hence, in many cases, there may be minor discrepancies between the Basic Community Profile tables and the ERP figures that will need to be resolved.
The analysis of the data collated depends on the level of detail and if various sources are being used (e.g. for projections), which one should be used. In many cases, discrepancies between the ERP and census night figures need to be resolved. Other issues to consider are unoccupied households that may affect average per household demand and tourist populations that should be considered in the commercial sector as the demand should be associated with hotels and serviced apartments etc.
Another potential issue is that the historical and/or current number of units of occupancy for both single residential and multi-residential properties may differ from that identified in the water service provider customer meter database. This issue may arise because ABS is considering the number of households and the water service provider database is considering the number of connections, and complications arise when one duplex has a single meter for two houses. Such limitations in the customer database need to be investigated and reconciled with the ABS data as in some cases they can have a significant impact on the per household and per person water demand calculated.
Further Reading
Examples of how such data has been collated and analysed for three locations that consider some of these issues are:
Snelling, C., Mitchell, M., Campbell, S., & Beatty K., 2005, Melbourne End Use and Options Model, Volumes 4: End use Sub-model, prepared by the Institute for Sustainable Futures for CSIRO, City West Water, South East Water, Yarra Valley Water and Melbourne Water.

Step 2 – Analyse the Situation
Guide to Demand Management Step 2 – page 23
Turner, A., Campbell, S., White, S., & Milne, G., 2003, ‘Alice Springs Water Efficiency Study Stages I & II–Final Report–Volume I’ Report prepared by the Institute for Sustainable Futures for NT Government, Australia.
Turner, A. & White, S., 2003, ACT Water Strategy: Preliminary demand management and least cost planning assessment, October 2003.

Step 2 – page 24 Guide to Demand Management
2B (vi) Collec t u tility-s ide da ta Having obtained and analysed the basic demographic data, the utility side of the system should be analysed to determine how much water has been used over the period being assessed on a per day, month, quarter and annum basis:
• in total
• per person
• per household for both single and multi-residential households
• per non-residential property.
The following sections deal with the information required about bulk water followed by collection and analysis of customer-metered data.
Bulk wa te r
Data/information you will need:
Daily reservoir corrected bulk water production for the area being analysed preferably for the most recent 10 years
Climate data from the bureau of meteorology (maximum daily temperature, rainfall, evaporation) for the same period
Demographic data for the same period
Historical, daily reservoir-corrected bulk water production over at least the most recent 10-year period should be used to understand how both total and per capita demand has changed. The daily data should be summarised into average monthly, quarterly and annual data sets to determine the peak, average and lowest demand in days, months, quarters and years in terms of total demand and per capita demand to correct for population rise.
This analysed data should then be used to:
• determine the water balance and associated non revenue water component of the water supplied, that is, the difference between the bulk water supplied and customer-metered demand (refer to section on non revenue water)
• identify (in conjunction with regression modelling) average demand years that are not affected by extremes of climate
• check whether the historical demand has been affected by any other factors other than climate variables.
The second and third activities are important when determining which period of the analysed data should be used to calibrate an iSDP model. For example, a drought restricted period should be avoided and a more average year in terms of climate used. Regression analysis is also important when determining how previous interventions may have affected demand (e.g. user pays pricing, restrictions, a water efficiency program, replacement and calibration of bulk water meters).
The factors that may have affected demand in a specific region should be identified to help assess the bulk water demand. The factors, the point in time they commenced and their duration should be plotted against the bulk water demand together with population growth and climate information to identify what might be happening to demand due to these factors. Visual inspection of such graphs is extremely useful for preliminary assessment of what may be affecting demand in a specific region and where more refined statistical analysis and regression analysis can clarify which factors are affecting demand; refer to Fyfe et al. 2010b for further details on complementary techniques. Example 2–3 provides an example of such analysis used in Alice Springs.
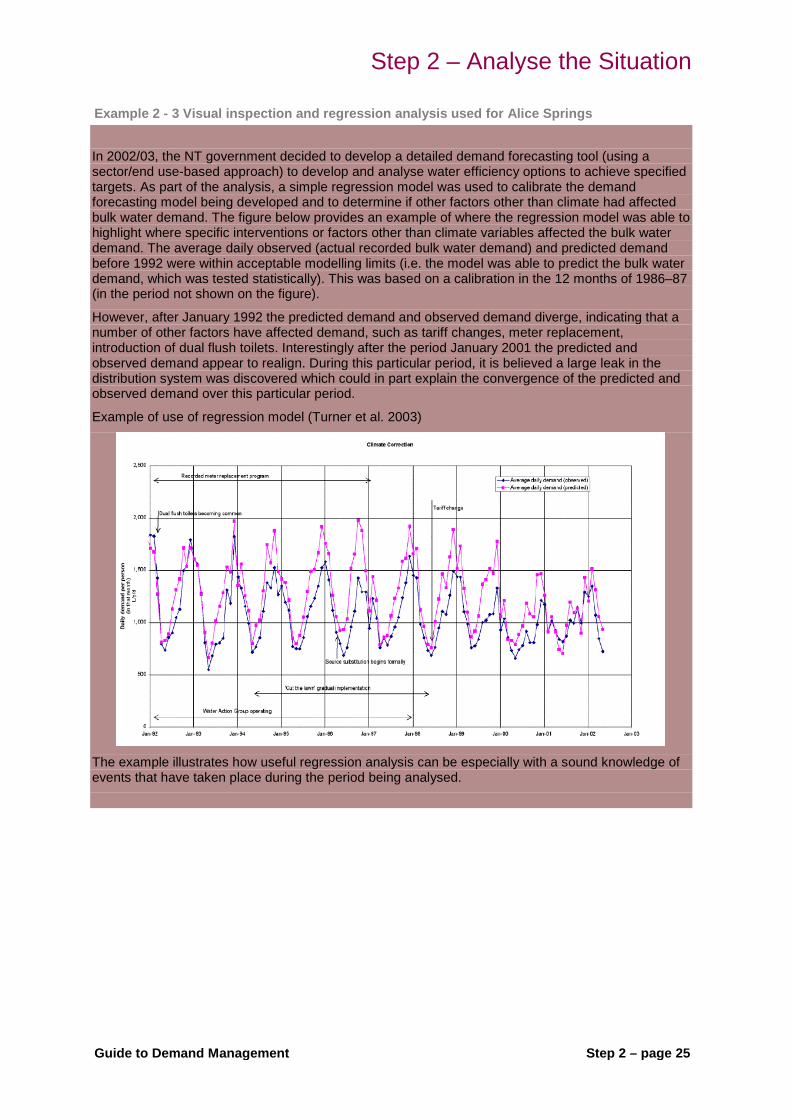
Step 2 – Analyse the Situation
Guide to Demand Management Step 2 – page 25
Example 2 - 3 Visual inspection and regression analysis used for Alice Springs
In 2002/03, the NT government decided to develop a detailed demand forecasting tool (using a sector/end use-based approach) to develop and analyse water efficiency options to achieve specified targets. As part of the analysis, a simple regression model was used to calibrate the demand forecasting model being developed and to determine if other factors other than climate had affected bulk water demand. The figure below provides an example of where the regression model was able to highlight where specific interventions or factors other than climate variables affected the bulk water demand. The average daily observed (actual recorded bulk water demand) and predicted demand before 1992 were within acceptable modelling limits (i.e. the model was able to predict the bulk water demand, which was tested statistically). This was based on a calibration in the 12 months of 1986–87 (in the period not shown on the figure).
However, after January 1992 the predicted demand and observed demand diverge, indicating that a number of other factors have affected demand, such as tariff changes, meter replacement, introduction of dual flush toilets. Interestingly after the period January 2001 the predicted and observed demand appear to realign. During this particular period, it is believed a large leak in the distribution system was discovered which could in part explain the convergence of the predicted and observed demand over this particular period.
Example of use of regression model (Turner et al. 2003)
The example illustrates how useful regression analysis can be especially with a sound knowledge of events that have taken place during the period being analysed.

Step 2 – page 26 Guide to Demand Management
Cus tomer-mete red da ta The ability to disaggregate customer-metered data depends on the classification of customers in the water service provider’s customer database and the ease of extraction of the data required. This varies significantly across Australia and even amongst water retailers within a specific region, because the customer classifications used have been developed over time by each water service provider independently. The customer classifications have been developed for customer charging purposes rather than disaggregating of demand for demand forecasting.
Ideally, the customer water meter data would be disaggregated into the following sectors: • single residential
• multi-residential
• commercial
• industrial
• institutional
Using these sectors, the historical customer water demand can be aligned with:
• other data sources (e.g. the ABS housing and occupancy information which identifies information for single residential dwellings)
• how the end uses are considered (e.g. single residential households have larger outdoor demand due to gardens than multi-residential households and as such need to be considered separately)
• how the options could be considered (e.g. water efficiency options targeting single residential houses and the institutional sector where a strategy of ‘government leading by example’ can be implemented in terms of best practice water efficiency in a region).
When extracting data from a water service provider database a number of fields need to be obtained to assist in the analysis.
Data/information you need:
The water demand per meter reading associated with a particular property identification number that is unique to a plot of land.
If there is more than one meter associated with a particular property and whether there are main meters and sub-meters that may lead to double counting of water demand for a specific property.
Other information for that property such as lot number, lot size, address and current customer category and sub-category (e.g. single residential, institutional, hotel, school) and where possible, the ANZSIC code.
Dates of water meter readings and any special reads that need to be considered to minimise the risk of duplicating the volume of water for a read.
The number of units of occupancy associated with a specific property and/or meter (e.g. duplex with a shared meter or large block of flats with one meter servicing 80 units).
Authors’ Note: Data extraction
Extracting this information from a customer meter database can vary in difficulty. Both the extraction of the data and how the data needs to be manipulated and analysed need to be carefully considered, before starting the exercise. Considering exactly how this work will be carried out and how it will feed into a demand forecasting model such as the iSDP model will help minimise staffing resources and the analysis period.

Step 2 – Analyse the Situation
Guide to Demand Management Step 2 – page 27
Once the data/information has been successfully extracted, the data needs to be manipulated to give the following information:
• the monthly, quarterly and annual demand per unit of occupancy for both single and multi-residential properties (kL/household/a) over time
• the monthly, quarterly and annual demand per property in each of the non-residential sectors and sub-sectors being considered (kL/property/a) over time
• the number of single residential, multi-residential properties over time
• the number of non-residential properties in the non-residential sector and sub-sectors considered over time
• unoccupied properties over time.
In some instances, a monthly and quarterly picture of each sector can be gained by querying the water service provider database. However, where this is not possible, a form of data manipulation known as “binning” may be used to obtain consumption data at a particular temporal scale. This essentially involves apportioning relatively infrequent consumption data into more frequent time intervals, as defined in Appendix B.
Authors’ Note: Apportioning metered demand into the correct month
Care must be taken to ensure that the volume of water identified by a customer meter reading is apportioned into the correct months. This is because an individual meter reading represents the demand for that customer for the preceding meter-reading period, the dates for which will differ between customers. An example of how customer meter readings in Melbourne were apportioned into comparable ‘monthly bins’ is available (Snelling et al. 2005).
It is important to gain a picture of the demand by sector and sub-sector where possible, or necessary depending on the level of analysis being undertaken, in monthly, quarterly and annual time slots over time to be able to see the seasonal demand of each, as indicated in Example 2-4).
The demand profile of the different sectors and sub-sectors over time will show the demand in each sector for the lowest months. This can provide a ‘first cut’ assessment of the indoor component of demand. However, care must be taken in using such an assumption in all locations. In many locations some outdoor water is likely to still occur even during the winter months thereby resulting in an overestimation of indoor demand.
When looking at customer water meters, check whether a proportion of total demand is actually being provided by a non-potable source such as rainwater tanks, greywater systems, scheme lower grade bore water, scheme reuse and/or independent groundwater bores. This ‘hidden’ component of demand can be large as in Perth where over 30% of all single residential households have bores for outdoor water demand.
‘All’ water demand should be taken into consideration when reviewing both historical demand and projecting future demand. This will ensure that the total demand per household or property is known, avoid mistakes in interpreting per property demand, make the water saving potential clear and enable the total water resources to be managed (i.e. both the potable, groundwater and other resources).
In the case of bores, the volume of water actually being used may be difficult to determine because bore water use is rarely metered. In such cases an initial estimate based on potable water households could be used or metering the bores of a representative sample of households. In locations such as Alice Springs where both potable and a lower grade non-potable water supply are provided the customer meters of both schemes need to be analysed to provide the full picture of customer water demand (Turner et al. 2003, Section 6).

Step 2 – page 28 Guide to Demand Management
Example 2 - 4 Assessment of Seasonality for Alice Springs
In the development of the Alice Springs sector/end use-based demand forecasting model it was important to find the quarterly demand in specific quarterly time slots. This assisted in determining the seasonal profile and ultimately in defining the indoor and outdoor components of demand for calibration of the demand forecasting model.
The figure below shows the significant seasonal variation in demand of the customers in Alice Springs for each of the main sectors considered over time. This figure also helps to illustrate the rise in non revenue water/unaccounted for water in 2001/02 when a large leak was discovered (see Example 2–3) and a significant drop in the overall demand of the institutional sector due to an alternative non-potable demand supply becoming available that enabled substitution of potable water.
Seasonal demand analysis results from customer-metered data (Turner et al. 2005)
Further Reading
Further information is available on how metered demand can show customer water demand changes over time, seasonality and potential interpretation for Alice Springs (Turner et al. 2003, Section 6)
Authors’ Note
For large utilities, (more than 50,000 customers) it is often useful to use a random sample of residential customer data for analysis purposes and ease of data manipulation. In the case of Sydney Water, for example, a dataset of 50,000 single residential customers was used for analysis in a recent recalibration of the end use model.
Complementary an a lytica l techn iques re s ource paper; See Fyfe et al. 2010b for more information on analysing seasonal split in demand for indoor and outdoor water use.

Step 2 – Analyse the Situation
Guide to Demand Management Step 2 – page 29
Water los s es and ca lcu la ting non revenue wa te r The components of non revenue water (NRW) can be determined by conducting a water balance. A new standard method for determining NRW has been created by a task force of the International Water Association (IWA) (Farley 2005). The following description is based upon the international best practice definitions and approaches suggested by this group.
A water balance is the measurement or estimation of water produced, imported, exported, consumed or lost. The water balance calculation determines how much water is lost as leakage from the network (‘real’ losses), and how much is due to ‘apparent’ or ‘non-physical losses’. ‘Apparent’ losses relate to unauthorised consumption and metering inaccuracies. The terms ‘water loss’ and 'non revenue water' are today used instead of ‘unaccounted-for-water’ (UFW). Figure 2-10 clarifies these definitions.
Figure 2 - 10 Standard IWA definitions of terms relating to non revenue water (Source: IWA 2000)
System Input Revenue
Authorised Consumption
Billed Authorised Consumption
Billed Metered Consumption
Revenue water Billed Unmetered Consumption
Unbilled Authorised Consumption
Unbilled Metered Consumption
Non revenue Water (also UFW)
Unbilled Unmetered Consumption
Water Losses
Apparent Losses
Unauthorised Consumption
Metering Inaccuracies
Real Losses
Leakage on Transmission and/or Distribution Mains
Leakage and Overflows at Storage Tanks
Leakage on Service Connections up to point of Customer Metering
The water balance involves asking the questions: 'how much water is being lost' and 'where is it being lost from?’ A ‘network audit’ is advised as a means to answer to these questions. Such an audit might need to include measurement (Farley 2005):
• from existing production meters (calibrated or checked)
• from existing bulk meters
• from reservoir drop tests which can assist in quantifying real losses
• by checking pump curves or unmeasured production with insertion meters
• by checking metered consumption (sample of customer meters checked for accuracy/under-registration at low flows)
• by checking operational use and unmeasured supplies (including main’s flushing, fire system testing, reservoir cleaning)
z

Step 2 – page 30 Guide to Demand Management
Further Reading
Farley, M., 2005, Non revenue Water – International Best Practice for Assessment, Monitoring and Control, White Paper (see http://www.idswater.com/water/us/WhitePaper_non-_revenue_water/55/paper_information.html
WBWC, 2004, managing and reducing water losses from water distribution systems, Manuals 1 – 10. Wide Bay Water Corporation and Qld. Govt. Environmental Protection Agency.
IWA, The Blue Pages: Losses from Water Supply Systems – Standard Terminology and Recommended Performance Measures, Oct 2000
2B (vii) Conduc t s ec tor-bas ed demand forecas t A sector-based demand forecast can be done using the demographic and utility-side data collected as described in the preceding sections (Steps 2B (v) and (vi)). As previously discussed, a sector-based approach is a discrete method of demand forecasting and also a foundation step before proceeding to a more detailed sector-based/end use-based demand forecasting approach. In some cases, a sector-based demand forecast will be sufficient depending on resource and time constraints.
Example 2–5 demonstrates the details of the sector-based analysis conducted as part of the ACT Water Resources Strategy. Due to time constraints in the planning process this example uses a snap shot year for demand in each sector rather than a time series assessment of historical demand. It uses assumed indoor and outdoor demand derived by the ACT government and hasn’t used regression analysis to assess historical demand. This analysis is considered the minimum appropriate for demand forecasting in the context of IRP. When time permitted, this analysis for the ACT was later refined using a sector/end use based approach.
Once the sector-based demand forecast is determined this can be combined with the yield calculation. Within the iSDP model and other similar models once this data is input to the model, then the gap between supply and demand can be identified for each year over a specified timeframe. If assumptions for example in the yield or population change, or if a sensitivity analysis is required for any such parameters, then these details can be readily updated in the model to provide a revised supply-demand balance.
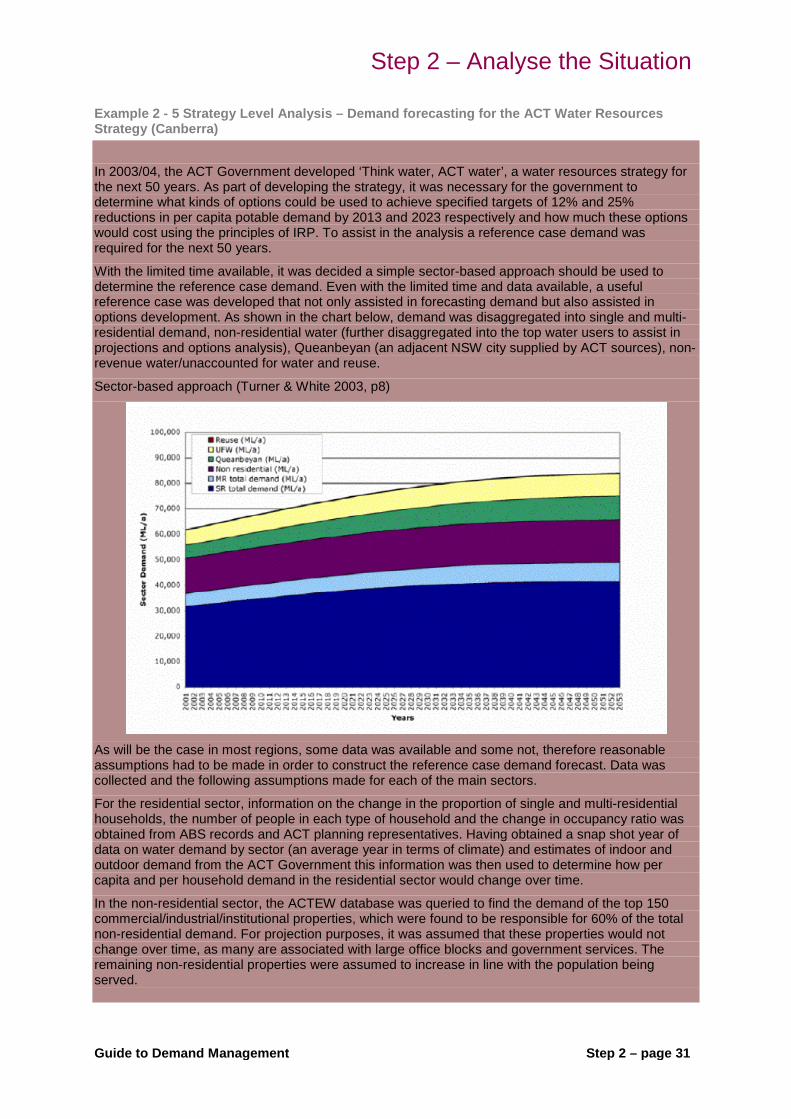
Step 2 – Analyse the Situation
Guide to Demand Management Step 2 – page 31
Example 2 - 5 Strategy Level Analysis – Demand forecasting for the ACT Water Resources Strategy (Canberra)
In 2003/04, the ACT Government developed ‘Think water, ACT water’, a water resources strategy for the next 50 years. As part of developing the strategy, it was necessary for the government to determine what kinds of options could be used to achieve specified targets of 12% and 25% reductions in per capita potable demand by 2013 and 2023 respectively and how much these options would cost using the principles of IRP. To assist in the analysis a reference case demand was required for the next 50 years.
With the limited time available, it was decided a simple sector-based approach should be used to determine the reference case demand. Even with the limited time and data available, a useful reference case was developed that not only assisted in forecasting demand but also assisted in options development. As shown in the chart below, demand was disaggregated into single and multi-residential demand, non-residential water (further disaggregated into the top water users to assist in projections and options analysis), Queanbeyan (an adjacent NSW city supplied by ACT sources), non- revenue water/unaccounted for water and reuse.
Sector-based approach (Turner & White 2003, p8)
As will be the case in most regions, some data was available and some not, therefore reasonable assumptions had to be made in order to construct the reference case demand forecast. Data was collected and the following assumptions made for each of the main sectors.
For the residential sector, information on the change in the proportion of single and multi-residential households, the number of people in each type of household and the change in occupancy ratio was obtained from ABS records and ACT planning representatives. Having obtained a snap shot year of data on water demand by sector (an average year in terms of climate) and estimates of indoor and outdoor demand from the ACT Government this information was then used to determine how per capita and per household demand in the residential sector would change over time.
In the non-residential sector, the ACTEW database was queried to find the demand of the top 150 commercial/industrial/institutional properties, which were found to be responsible for 60% of the total non-residential demand. For projection purposes, it was assumed that these properties would not change over time, as many are associated with large office blocks and government services. The remaining non-residential properties were assumed to increase in line with the population being served.

Step 2 – page 32 Guide to Demand Management
Non revenue water was assessed on a per connection basis in line with IWA and WSAA requirements and projected on this basis.
Having completed the Strategy in 2003/04, and implemented a demand management program since 2004/05, the ACT government refined their reference case during 2006/07 by using a sector/end use based approach and the iSDP model.
Further Reading
Further details of the sector-based approach used for the ACT can be found in the Think water, ACT water supporting documents (Turner, A. & White, S., 2003). It provides a useful summary of the method used, the kinds of assumptions made and the limitations of the analysis undertaken.
2B (viii) Collec t cus tomer-s ide da ta for s ec tor/end us e demand forecas ting This section and those that follow are applicable to those embarking on the more detailed sector-based or end use-based demand forecasting approach. To create this more detailed forecast requires data on the customer-side as well as the utility-side. This section describes what data will be required.
The historical demand collected per property and per person each year for the bulk and customer-metered data can be used as the top-down information for the iSDP model. Next it will be necessary to look at the ‘customer side’ bottom-up information, which will need to be calibrated against the analysed customer-metered data.
On the customer side of the meter (in the single and multi-residential sector) we can apportion demand into ‘indoor’ and ‘outdoor’ end uses. You will need to collate information on the major end uses in your area to undertake the ‘bottom-up’ approach. The characteristics of your area will determine which end uses you need to consider.
Data/information you will need:
Indoor end uses Outdoor end uses
Toilet Pool/spa
Bath Irrigation systems
Shower Evaporative air conditioners (if used in your area)
Wash basin Lawn/garden
Clotheswasher Car washing
Laundry tap
Kitchen tap
Dishwasher
Indoor end uses are generally classified as indoor water demand and generally pass to sewer. Any reduction in indoor demand therefore reduces flows to the sewerage system. Evaporative air conditioners, although actually an indoor end use are put into the outdoor classification because the bleed off, required to reduce calcium build up on the evaporation pads, is not permitted to pass to sewer in most locations where they are used. For modelling purposes it is easier to account for this as an outdoor end use along with garden watering and other such uses that do not pass to the sewerage system.
Although the core end uses will be the same across the country a number of locations have special end uses to consider. For example, evaporative air conditioners are common in dryer climates such as Alice Springs, Adelaide and Western NSW. Investigation could uncover that they are a major end use of water and thus a major opportunity for saving water.

Step 2 – Analyse the Situation
Guide to Demand Management Step 2 – page 33
It is necessary to collect data on the customer side of the meter relating to stock data and end use data for each specific location to determine how water has, is and will be used under a reference case scenario.
The basic questions being asked are:
• What appliances and fixtures do householders have (stock of appliances)?
• How much water is used each time (end use data – technology efficiency/flow rates)?
• How often do they use them (end use data – frequency of usage)?
By asking these questions it is possible to find out how much water is used by a specific end use per person and/or per household and ultimately for a region. For shower usage, demand would be calculated on a per person basis and then multiplied by the occupancy ratio in a household to obtain the per household demand for a single residential and a multi-residential household. The stock is the proportion of efficient and inefficient appliances, the technology is the flow rate of an efficient versus an inefficient appliance and the usage is the frequency and duration of use of that appliance. This is illustrated in Figure 2–11.
Figure 2 - 11 Demand for showers – example
In the case of a garden watering irrigation system, this is calculated on a per household basis, as it is independent of the occupancy of the household.
Authors’ Note: iSDP model consideration
When developing an iSDP model, care needs to be taken to consider whether each end use is related to a per person or per household demand and whether the demand in a single residential household may differ from that of a multi-residential household. For instance, outdoor watering is generally higher in single residential households compared with multi-residential, because multi-residential households have little or no garden. Hence, in modelling whilst the indoor end uses will be similar for single and multi-residential households and primarily correlated with the occupancy ratio, the outdoor component won’t be and should be modelled separately for single and multi-residential households.
Stock da ta The stock of a particular appliance is likely to be different for each location and is likely to change over time (historically, now and when being projected). Example 2–6 explains how trends in the changeover of stock have affected demand in Sydney and the importance of incorporating this change in stock into demand forecasting models. The rest of the section provides details of how information on various types of stock data in Australian households can be found and some of the difficulties in using such data.
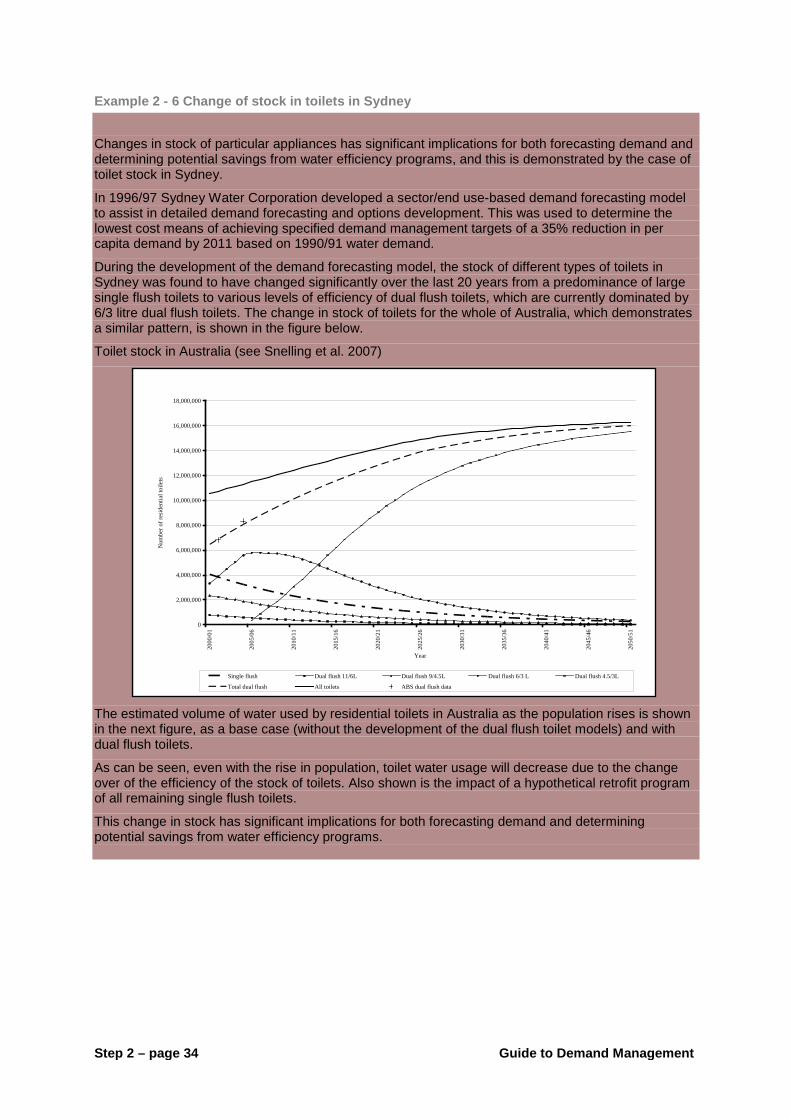
Step 2 – page 34 Guide to Demand Management
Example 2 - 6 Change of stock in toilets in Sydney
Changes in stock of particular appliances has significant implications for both forecasting demand and determining potential savings from water efficiency programs, and this is demonstrated by the case of toilet stock in Sydney.
In 1996/97 Sydney Water Corporation developed a sector/end use-based demand forecasting model to assist in detailed demand forecasting and options development. This was used to determine the lowest cost means of achieving specified demand management targets of a 35% reduction in per capita demand by 2011 based on 1990/91 water demand.
During the development of the demand forecasting model, the stock of different types of toilets in Sydney was found to have changed significantly over the last 20 years from a predominance of large single flush toilets to various levels of efficiency of dual flush toilets, which are currently dominated by 6/3 litre dual flush toilets. The change in stock of toilets for the whole of Australia, which demonstrates a similar pattern, is shown in the figure below.
Toilet stock in Australia (see Snelling et al. 2007)
The estimated volume of water used by residential toilets in Australia as the population rises is shown in the next figure, as a base case (without the development of the dual flush toilet models) and with dual flush toilets.
As can be seen, even with the rise in population, toilet water usage will decrease due to the change over of the efficiency of the stock of toilets. Also shown is the impact of a hypothetical retrofit program of all remaining single flush toilets.
This change in stock has significant implications for both forecasting demand and determining potential savings from water efficiency programs.
0
2,000,000
4,000,000
6,000,000
8,000,000
10,000,000
12,000,000
14,000,000
16,000,000
18,000,000
2000
/01
2005
/06
2010
/11
2015
/16
2020
/21
2025
/26
2030
/31
2035
/36
2040
/41
2045
/46
2050
/51
Year
Num
ber o
f res
iden
tial t
oile
ts
Single flush Dual flush 11/6L Dual flush 9/4.5L Dual flush 6/3 L Dual flush 4.5/3L
Total dual flush All toilets ABS dual flush data

Step 2 – Analyse the Situation
Guide to Demand Management Step 2 – page 35
Toilet water usage in Australia (Snelling et al. 2007)
Basic information characterising appliance ownership is collated by the ABS on a regular basis for each of the states across Australia in:
• Catalogue 4602.0 – Environmental Issues: People’s Views and Practices
This ABS survey provides information on installed appliances within Australian households and rotates annually around three themes: water use and conservation, energy use and conservation and waste management and transport use. Data is collected from households and individuals via the ABS labour survey.
The 2007 edition focuses on ‘Water use and conservation’ and details end uses such as toilets, showers, gardens and pools together with information on water sourcing (e.g. rainwater tanks, bores etc) and covers the periods 1994, 1998, 2001 and 2004.
Some areas have more detailed regional ABS reports available. For example:
• Catalogue No. 4616.5.55.001 ‘Domestic Water Use, Western Australia’.
• Catalogue No. 4616.1 ‘Domestic Water Use, NSW’.
• Catalogue No. 4618.4 ‘Domestic Use of Water and Energy, SA’.
The 2008 edition (4602.0.55.001) of Environmental Issues focuses on ‘Energy use and conservation’ and details end uses such as dishwashers, clothes washers and evaporative air conditioners for the years 1994, 1999, 2002, 2005 and 2008.
These studies will typically cover a different population than the service area of concern and the responses are typically unverified. As such this data should be reviewed where possible using other data sources such as household surveys of a representative sample of households. This form of cross checking data is extremely important and is discussed further in Data Collection Methods, Step 2B (ix).
Furthermore the installed stock of appliances such as showers, clothes washers and toilets may be relied on to change as appliances are replaced in the future owing to shifting water efficiency standards and purchasing preferences. Forecasting the impact of these changes requires information characterising existing installed appliance stock and sales of new appliances for each specific location over time.
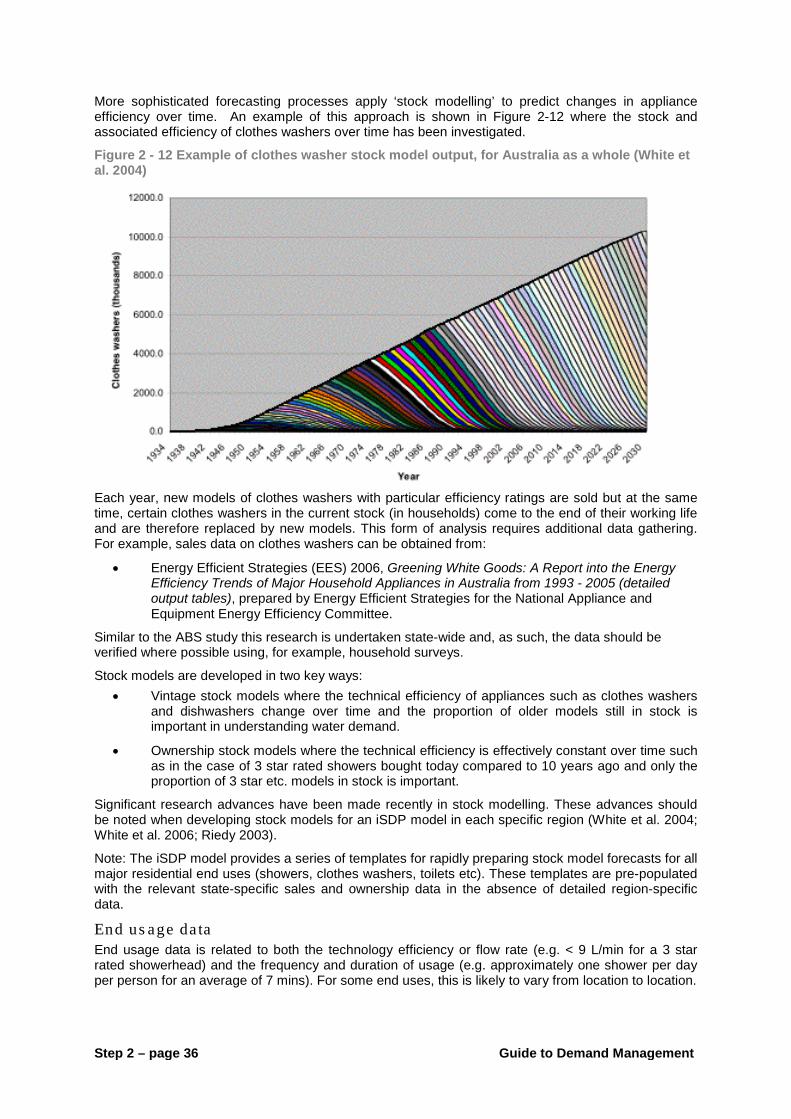
Step 2 – page 36 Guide to Demand Management
More sophisticated forecasting processes apply ‘stock modelling’ to predict changes in appliance efficiency over time. An example of this approach is shown in Figure 2-12 where the stock and associated efficiency of clothes washers over time has been investigated.
Figure 2 - 12 Example of clothes washer stock model output, for Australia as a whole (White et al. 2004)
Each year, new models of clothes washers with particular efficiency ratings are sold but at the same time, certain clothes washers in the current stock (in households) come to the end of their working life and are therefore replaced by new models. This form of analysis requires additional data gathering. For example, sales data on clothes washers can be obtained from:
• Energy Efficient Strategies (EES) 2006, Greening White Goods: A Report into the Energy Efficiency Trends of Major Household Appliances in Australia from 1993 - 2005 (detailed output tables), prepared by Energy Efficient Strategies for the National Appliance and Equipment Energy Efficiency Committee.
Similar to the ABS study this research is undertaken state-wide and, as such, the data should be verified where possible using, for example, household surveys.
Stock models are developed in two key ways: • Vintage stock models where the technical efficiency of appliances such as clothes washers
and dishwashers change over time and the proportion of older models still in stock is important in understanding water demand.
• Ownership stock models where the technical efficiency is effectively constant over time such as in the case of 3 star rated showers bought today compared to 10 years ago and only the proportion of 3 star etc. models in stock is important.
Significant research advances have been made recently in stock modelling. These advances should be noted when developing stock models for an iSDP model in each specific region (White et al. 2004; White et al. 2006; Riedy 2003).
Note: The iSDP model provides a series of templates for rapidly preparing stock model forecasts for all major residential end uses (showers, clothes washers, toilets etc). These templates are pre-populated with the relevant state-specific sales and ownership data in the absence of detailed region-specific data.
End us age da ta End usage data is related to both the technology efficiency or flow rate (e.g. < 9 L/min for a 3 star rated showerhead) and the frequency and duration of usage (e.g. approximately one shower per day per person for an average of 7 mins). For some end uses, this is likely to vary from location to location.
Step 2 – Analyse the Situation
Guide to Demand Management Step 2 – page 37
For end uses such as toilets, the number of times the toilet is flushed per person per day at home is unlikely to alter significantly across Australia unless in a specific region the demographic profile is such that more people are at home through the day rather than at work. For showers the usage pattern may vary due to seasonal variation. For example, in hot weather people may have two showers per day with minimum hot water being used and in cold weather they may have longer showers with a high proportion of hot water.
For showers and other flow related end uses, water pressure needs to be considered, as this will impact on how much water is used. For example, the volume of water used in areas of high water pressure is likely to be significantly higher than those with the minimum pressure requirement even when people ‘throttle back’ the flow rate for comfort level, such as when using showers.
For end uses like evaporative air conditioners, the evaporation and bleed off rate and frequency and duration of use are likely to be significantly different from location to location and therefore need to be investigated further.
Authors’ Note
It will take time and resources to fully understand the end usage data for your specific region. Hence as a first pass it might be necessary to use information from other areas as an interim step. However, care must be taken to use this information wisely and to have an appreciation of which end uses are likely to be different in your region and why. These end uses will require further investigation and the ‘borrowed information’ will need to be verified.
Care must also be taken when choosing which method to use as data collection methods and the associated analysis required can vary in cost significantly.
Further Reading
The latest end use reports can be found in the iSDP model as at June 2010, these included:
Report: Roberts, P., 2004, Appliance Stock and Usage Patterns Survey 2003, Yarra Valley Water, Melbourne, November.
George Wilkenfeld and Associates Pty Ltd et al., 2003, A Mandatory Water Efficiency Labelling Scheme for Australia, Final Report prepared for Environment Australia, Sydney, June.
George Wilkenfeld and Associates Pty Ltd, 2005, The Scope for Minimum Water Efficiency Standards for Labelled Products, prepared for the Department of Energy, Utilities and Sustainability, NSW, September.
Harrington, L., & Kleverlann, P., 2003, A Third Report into the Energy Efficiency Trends of Major Household Appliances in Australia from 1993 to 2001, Report no 2003/05 prepared by Energy Efficient Strategies and EnergyConsul for Australian Greenhouse Office, Canberra, February.
Loh, M., & Coghlan, P., 2003, Domestic Water Use Study In Perth, Western Australia 1998–2001, Report prepared for Water Corporation, Perth, Western Australia, March.
Enhance Management, 2004, Attitudes Towards Water Consumption and Water Saving Devices, Report prepared for Gold Coast Water, Gold Coast, Australia, September.
ABS, 2003, Catalogue # 4616.5.55.001: Domestic Water Use for Western Australia.
ABS, 2002, Catalogue # 4616.1: Domestic Water Use for New South Wales, Canberra.
ABS, 2007, Environmental Issues: People’s Views and Practices, Catalogue #4602.0, States in Australia.
Roberts, P., 2005, Residential End Use Measurement Study 2004, prepared for Yarra Valley Water.
Cordell, D., Day, D., Milne, G., Robinson, J., Sarac, K., White, S., Shipton, B., Maheepala, S., & Mitchell, G., 2002, Melbourne End Use and Water Consumption Influences Study – Volume 1 – prepared by the Institute for Sustainable Futures and CSIRO for the Water Resources Strategy Committee for the Greater Melbourne Area.

Step 2 – page 38 Guide to Demand Management
2B (ix) Cons ide r da ta co llec tion methods As indicated in Step 2B (ii) secondary data collection can be a very useful and low cost way to obtain information on the stock of appliances and end uses. However, primary data collection is likely to be required at some point to improve the accuracy of the demand forecasting model. A wide range of primary data collection methods are available that can verify how much water is being used in your specific area by each of the key end uses. The cost and accuracy of methods can vary significantly so care must be taken when considering which methods to use and why. Table 2-2 summarises some of the typical methods available. Example 2-7 provides an illustration of where some of these methods have been used.
When deciding on which of these methods to use it is important to consider specific issues:
• the objectives of the data collection
• the types of data best suited to the purpose of the study • ways to add value to the study (e.g. asking questions that may be useful for the development
of options)
• consideration of the most appropriate data collection techniques including the advantages and limitations of each
• the most appropriate communication strategies to be used for customers participating to gain maximum participation
• the most appropriate training for those undertaking the survey to ensure maximum accuracy and confidence in the findings of the data collection
• care not to bias the sample through the Hawthorne Effect if the household is likely to be observed after the initial data collection process
• ensuring samples are large enough, representative and stratified • collection of data for a sufficient period and taking into consideration seasonal variations • considering issues around collecting data on all participants in the household and potential
gender and/or ethics (e.g. seeking permission to combine the data with customer meter readings to triangulate the results).
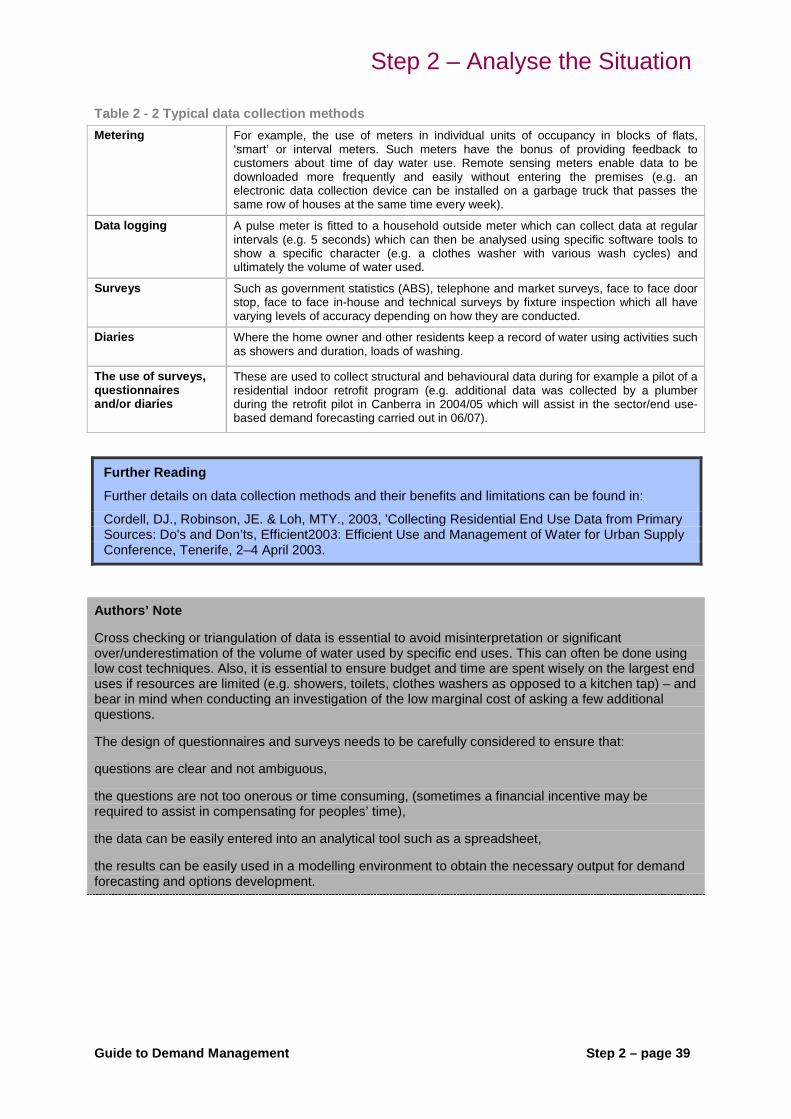
Step 2 – Analyse the Situation
Guide to Demand Management Step 2 – page 39
Table 2 - 2 Typical data collection methods Metering For example, the use of meters in individual units of occupancy in blocks of flats,
‘smart’ or interval meters. Such meters have the bonus of providing feedback to customers about time of day water use. Remote sensing meters enable data to be downloaded more frequently and easily without entering the premises (e.g. an electronic data collection device can be installed on a garbage truck that passes the same row of houses at the same time every week).
Data logging
A pulse meter is fitted to a household outside meter which can collect data at regular intervals (e.g. 5 seconds) which can then be analysed using specific software tools to show a specific character (e.g. a clothes washer with various wash cycles) and ultimately the volume of water used.
Surveys Such as government statistics (ABS), telephone and market surveys, face to face door stop, face to face in-house and technical surveys by fixture inspection which all have varying levels of accuracy depending on how they are conducted.
Diaries
Where the home owner and other residents keep a record of water using activities such as showers and duration, loads of washing.
The use of surveys, questionnaires and/or diaries
These are used to collect structural and behavioural data during for example a pilot of a residential indoor retrofit program (e.g. additional data was collected by a plumber during the retrofit pilot in Canberra in 2004/05 which will assist in the sector/end use-based demand forecasting carried out in 06/07).
Further Reading
Further details on data collection methods and their benefits and limitations can be found in:
Cordell, DJ., Robinson, JE. & Loh, MTY., 2003, 'Collecting Residential End Use Data from Primary Sources: Do's and Don’ts, Efficient2003: Efficient Use and Management of Water for Urban Supply Conference, Tenerife, 2–4 April 2003.
Authors’ Note
Cross checking or triangulation of data is essential to avoid misinterpretation or significant over/underestimation of the volume of water used by specific end uses. This can often be done using low cost techniques. Also, it is essential to ensure budget and time are spent wisely on the largest end uses if resources are limited (e.g. showers, toilets, clothes washers as opposed to a kitchen tap) – and bear in mind when conducting an investigation of the low marginal cost of asking a few additional questions.
The design of questionnaires and surveys needs to be carefully considered to ensure that:
questions are clear and not ambiguous,
the questions are not too onerous or time consuming, (sometimes a financial incentive may be required to assist in compensating for peoples’ time),
the data can be easily entered into an analytical tool such as a spreadsheet,
the results can be easily used in a modelling environment to obtain the necessary output for demand forecasting and options development.

Step 2 – page 40 Guide to Demand Management
Example 2 - 7 Methods used to collect data on end uses in Alice Springs
As indicated in Examples 2-3 and 2-4, in 2002/03 the NT Government decided to develop a detailed sector/end use-based demand forecasting model for Alice Springs. When developing the model a number of data sources were used to assist in understanding both the indoor and outdoor historical demand. The chart below illustrates the modelled results of the data collection and analysis methods used for a typical single residential household.
Modelled single residential demand
A range of data sources and collection methods were used including existing ABS statistics, bulk and metered demand analysis, and previous studies undertaken in the area. Three key methods were used to collect, check and triangulate data:
A residential survey
A survey carried out at the annual Alice Springs Show, which was used was undertaken to triangulate information on household indoor and outdoor water use. The sample obtained represented more than 5% of all households and as indicated in the next figure was a remarkably close fit to the demand profile of all single residential households in Alice Springs. The results were used to assist in verifying ABS etc. data collected. For example, the survey assisted in showing that approximately 90% of single residential households have evaporative air conditioners in Alice Springs. This is significantly higher than the ABS NT regional data (Catalogue No. 4602.0, March 2002) which on a regional scale is biased by results from Darwin meaning care needs to be taken when using this regional scale information.
Experiments
Experiments to investigate evaporative air conditioner water usage were undertaken on a small sample of households. Although only a small sample the experiment found that: due to the high water usage (in terms of evaporation for cooling and bleed off), usage over many hours each day, and several hot months of the year, the estimated demand was approximately 50 kL/hh/a (Turner et al, 2004). A further investigation with a bigger sample size is required to confirm these results.
Face to face and telephone interviews
Interviews with key customer types (i.e. the public housing department that maintains end used equipment in a large proportion of households), and specialists in specific end uses (i.e. plumbing equipment, evaporative air conditioners, swimming pools and garden equipment specialists), gave insight into the kinds of equipment in stock, how people use the equipment, maintenance issues and potential ways to save water etc.

Step 2 – Analyse the Situation
Guide to Demand Management Step 2 – page 41
Further Reading
Details on the data collection methods used and subsequent analysis are available (Turner et al. 2004; Turner et al. 2003a).
2B (x) Conduc t s ec tor-bas ed or end us e -bas ed demand forecas ting When the end use data identified in Step 2B (viii) has been collected – being cognisant of the limitations of secondary data availability and difficulties of collecting primary data as identified in Step 2B (ix) – it is time to develop the end use component of the iSDP model.
You will have already obtained a sector-based demand forecast as part of Step 2B (vii) disaggregated (depending on your database) into single residential, multi-residential, commercial, industrial, institutional, top users and non revenue water.
When undertaking the sector/end use-based approach you will conduct if possible further analysis of your customer meter database to refine the non-residential sectors into sub-sectors. Such sub-sectors may include average usage per school, hotel/motel, hospital and will be important for options design and analysis as part of Step 3. You will be predominantly refining the demand forecast specifically for the residential sector, which will assist in finding the residential conservation potential also as part of options design in Step 3.
You will have calculated the seasonal demand of single and multi-residential households which will give you a first approximation of the indoor component of demand from examination of the winter months. This top-down indoor component of demand per household will be used to calibrate the bottom-up demand calculated by adding each component end use of the indoor demand (i.e. shower, toilet, clothes washer, dishwasher demand). This will require adjustment of assumptions and checking of the impact of those assumptions in terms of sensitivity.
In some cases you may have attempted to calculate specific outdoor demand components such as evaporative air conditioner use or the demand associated with swimming pools if they are of particular interest to your region. However, as part of a first cut sector/end use-based demand forecast you may wish to leave this as a block of demand for future investigation and analysis.
Further Reading
For further reading on examples of how others have developed demand forecasting models refer to:
Snelling, C., Mitchell, C., Campbell, S., & Beatty, K., 2005, Melbourne End Use and Options Model, Volume 4: End use Sub-model, prepared by the Institute for Sustainable Futures for CSIRO, City West Water, South East Water, Yarra Valley Water and Melbourne Water.
Turner, A., Campbell, S., White, S. & Milne, G., 2003a, ‘Alice Springs Water Efficiency Study Stages I & II–Final Report–Volume I’ Report prepared by the Institute for Sustainable Futures for NT Government, Australia.
These examples provide details such as the data collected, the assumed values for technology efficiency levels and flow rates, the number of times such devices are used etc. They also provide details of the bottom-up approach used in end use compared to the top-down approach of sector-based analysis and how this is used to calibrate the end use component of the model.
As identified in Step 2B (vii) as part of the sector-based approach the yield of the system will have already been imported to the iSDP or equivalent model. With the new end use component within the model the revised supply-demand balance can be reassessed to inform Step 2C.
Refer to Complementary analytical techniques resource paper (Fyfe et al. 2010b) for support with analysing seasonal demand, and forecasting peak demand. See in particular Section 5.

Step 2 – page 42 Guide to Demand Management
Step 2C Re-as s es s is s ues , ris ks and opportun ities The analysis of the supply-demand balance in the region will have provided new insight to the important issues at hand. Step 2C incorporates this new knowledge into the decision-making process. Stakeholders can now have a highly focussed discussion about the supply-demand balance and the regional issues including average and peak water demand and wastewater constraints.
This step is a conscious re-assessment of the issues risks and opportunities in the region based on the improved information available through the analysis of the supply-demand balance. Overall, it means communication and interpretation of the results of demand and supply forecasts with the relevant stakeholders, followed by reassessment of the priorities in the region.
2C (i) Communica te and in te rpre t the s upply-demand ba lance The reference case demand forecast and further analysis of the supply-side needs to be considered by appropriate stakeholders. The approximations and assumptions made in demand and supply forecasts must be communicated along with the results of these analyses, to maintain transparency of the process.
It will be important to include an assessment of an appropriate level of contingency (headroom) in the supply-demand balance, by considering various risk scenarios (such as those discussed in Step 1). This step should also use the supply and demand models to consider the effects on supply and demand of each of these risks. If a detailed analysis is being undertaken, then it will also be worth conducting a sensitivity analysis on both the supply and demand.
2C (ii) Re-as s es s the prioritie s of the reg ion The re-assessment of priorities based on the new understanding of issues, risks and opportunities is an essential step towards setting appropriate and justifiable planning goals in the subsequent Step 2D. Based on the supply-demand balance and other contextual factors such as politics, the most pressing issues requiring attention need agreement from relevant stakeholders through a facilitated decision-making process. If a detailed IRP is being conducted, then it will be important to include a large group of stakeholders in this process using a well-defined process of engagement.

Step 2 – Analyse the Situation
Guide to Demand Management Step 2 – page 43
Step 2D Se t p lanning objec tives A participatory process with appropriate stakeholders should be used for setting the planning objectives, as these will dictate largely the direction of the remainder of this iteration of the IRP process (i.e. stakeholders will need to work through the IRP process at various levels over many years as part of an adaptive management planning process).
The planning objectives need to be clear, and should be well aligned with the agreed priorities and needs of the region. It is also be important to align the plan with other relevant regional or national planning objectives (including the National Urban Water Planning principles, which are provided in Appendix A).
In a given region the specific planning objectives set may be narrow and specific to the situation or broad and similar to the generalised component objectives depending on the local context. The objectives might be specific targets, or other kinds of goals. Table 2-3 shows the breadth of different types of planning objectives that could be set. The example is taken from an IRP process in the electricity sector. Two additional considerations are important. Firstly, to set objectives against which it will be possible to measure progress. Secondly, to avoid excessive conflict between different objectives, although some level of conflict will likely be inevitable as the objectives cross multiple and interacting dimensions.
Climate change and p lanning objec tives for urban wa te r The Climate Change resource paper (Fane et al. 2010b) argues that the primary objectives for supply-demand planning before climate change could be characterised as:
I. Ensuring that the community has a safe and reliable water supply.
II. Providing water services cost-effectively.
III. Full account for all sustainability impacts.
However, with the state of current knowledge climate change now impacts each of these objectives. This means that a further primary objective now exist for all regions, which is:
IV. Incorporating the implications of climate change into supply-demand planning.
In fact, in many regions securing water supplies in the face of climate change may be seen as the principle objectives for urban water planning. The paper Fane et al. (2010b) further advises that each of the primary objectives has component objectives and under each of these component objectives will be specific planning objectives for each region. The objective of ‘incorporating the implications of climate change’ will have at least two component objectives. These being to:
i. Mitigate the impacts of climate change through reducing the greenhouse gas emissions associated with the provision of urban water services. While also,
ii. Adapting urban water systems to the expected impacts of climate change.
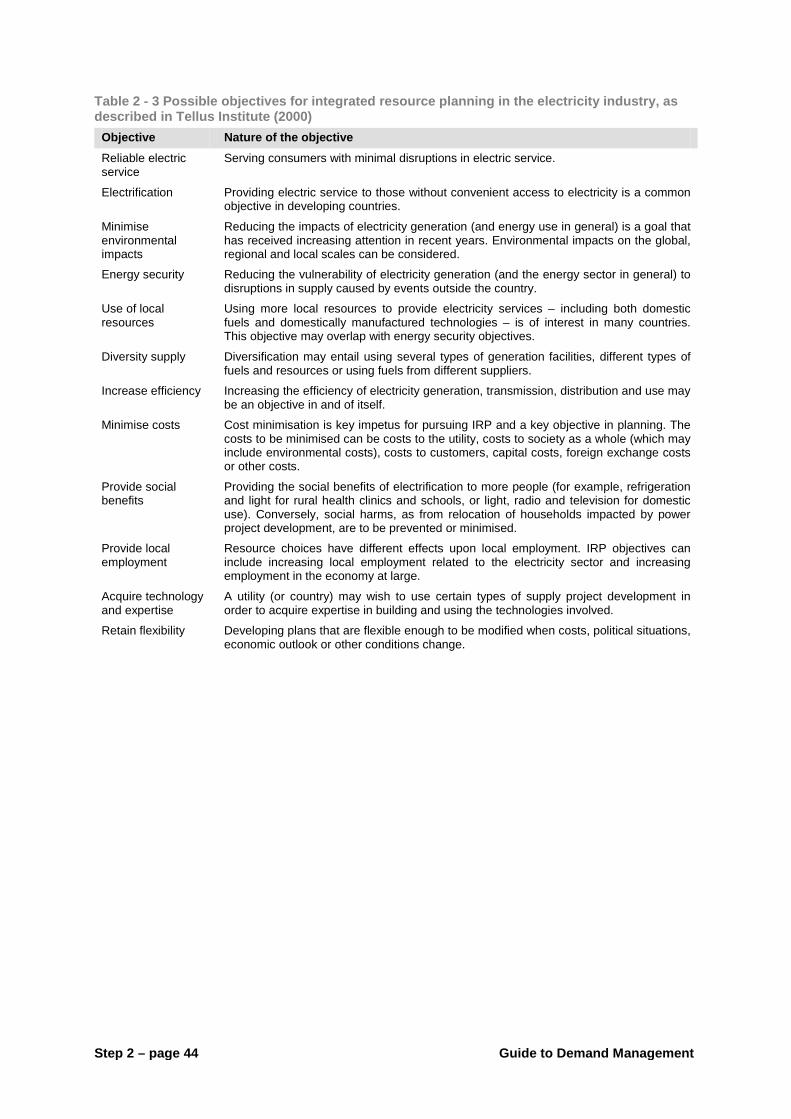
Step 2 – page 44 Guide to Demand Management
Table 2 - 3 Possible objectives for integrated resource planning in the electricity industry, as described in Tellus Institute (2000)
Objective Nature of the objective
Reliable electric service
Serving consumers with minimal disruptions in electric service.
Electrification Providing electric service to those without convenient access to electricity is a common objective in developing countries.
Minimise environmental impacts
Reducing the impacts of electricity generation (and energy use in general) is a goal that has received increasing attention in recent years. Environmental impacts on the global, regional and local scales can be considered.
Energy security Reducing the vulnerability of electricity generation (and the energy sector in general) to disruptions in supply caused by events outside the country.
Use of local resources
Using more local resources to provide electricity services – including both domestic fuels and domestically manufactured technologies – is of interest in many countries. This objective may overlap with energy security objectives.
Diversity supply Diversification may entail using several types of generation facilities, different types of fuels and resources or using fuels from different suppliers.
Increase efficiency Increasing the efficiency of electricity generation, transmission, distribution and use may be an objective in and of itself.
Minimise costs Cost minimisation is key impetus for pursuing IRP and a key objective in planning. The costs to be minimised can be costs to the utility, costs to society as a whole (which may include environmental costs), costs to customers, capital costs, foreign exchange costs or other costs.
Provide social benefits
Providing the social benefits of electrification to more people (for example, refrigeration and light for rural health clinics and schools, or light, radio and television for domestic use). Conversely, social harms, as from relocation of households impacted by power project development, are to be prevented or minimised.
Provide local employment
Resource choices have different effects upon local employment. IRP objectives can include increasing local employment related to the electricity sector and increasing employment in the economy at large.
Acquire technology and expertise
A utility (or country) may wish to use certain types of supply project development in order to acquire expertise in building and using the technologies involved.
Retain flexibility Developing plans that are flexible enough to be modified when costs, political situations, economic outlook or other conditions change.

Guide to Demand Management Step 3 – page 1
STEP 3 - DEVELOP THE RESPONSE
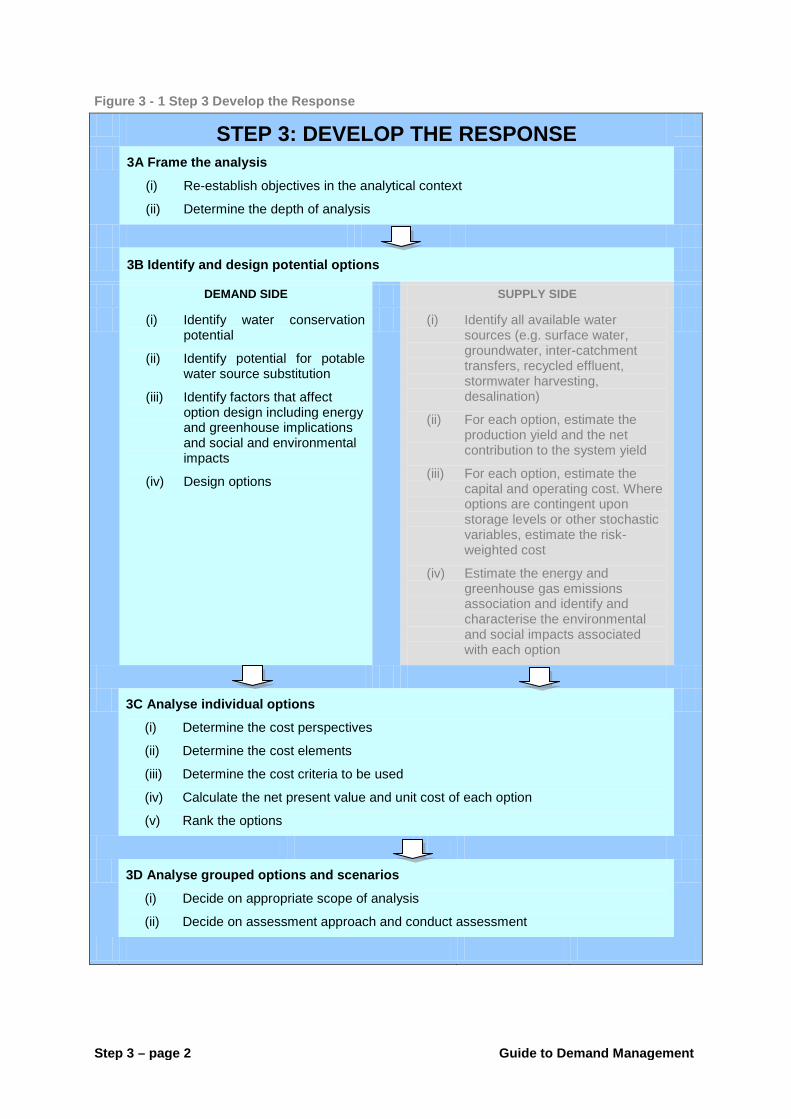
Step 3 – page 2 Guide to Demand Management
Figure 3 - 1 Step 3 Develop the Response
STEP 3: DEVELOP THE RESPONSE
3A Frame the analysis
(i) Re-establish objectives in the analytical context
(ii) Determine the depth of analysis
3B Identify and design potential options
DEMAND SIDE SUPPLY SIDE
(i) Identify water conservation potential
(ii) Identify potential for potable water source substitution
(iii) Identify factors that affect option design including energy and greenhouse implications and social and environmental impacts
(iv) Design options
(i) Identify all available water sources (e.g. surface water, groundwater, inter-catchment transfers, recycled effluent, stormwater harvesting, desalination)
(ii) For each option, estimate the production yield and the net contribution to the system yield
(iii) For each option, estimate the capital and operating cost. Where options are contingent upon storage levels or other stochastic variables, estimate the risk-weighted cost
(iv) Estimate the energy and greenhouse gas emissions association and identify and characterise the environmental and social impacts associated with each option
3C Analyse individual options
(i) Determine the cost perspectives
(ii) Determine the cost elements
(iii) Determine the cost criteria to be used
(iv) Calculate the net present value and unit cost of each option
(v) Rank the options
3D Analyse grouped options and scenarios
(i) Decide on appropriate scope of analysis
(ii) Decide on assessment approach and conduct assessment
Step 3 – Develop the Response
Guide to Demand Management Step 3 – page 3
Step 3 Summary Step 3 describes how to identify, design and compare options and how to develop a portfolio of options, to meet the planning objectives established in Step 2.
This section provides detailed information on how to choose appropriate demand-side options and how to estimate their water conservation potential (Step 3B). While the design of supply-side options is outside the scope of this guide, the method here can be used to compare demand-side and supply-side options and to develop portfolios that include both types of options.
Step 3 will be conducted at different depths of analysis depending on the need discussed in Step 3A. It might be used to guide a rough scoping study to investigate the cost effectiveness of a proposed set of demand management initiatives (see Step 3C). Equally, the process might be used to develop suites of demand and supply options (a portfolio) to meet the supply-demand balance over a period. In this instance, significant analysis will be required to deal with the complexities involved in managing risks, uncertainties and externalities. Approaches that can be used to guide such analysis are presented in Step 3D.

Step 3 – page 4 Guide to Demand Management
Step 3A Frame the ana lys is Developing options requires an analysis that is framed clearly. The framing should:
• re-establish the goals identified in Step 2D from the perspective of the possible responses
• decide on the depth of analysis.
These aspects are described in more detail below.
3A (i) Re-es tab lis h the objec tives in the ana lytica l context Step 2 investigated the specific issues, risks and opportunities that apply in the region, and planning objectives were identified in Step 2D. In Step 3, these objectives need to be refined while considering how to analyse options and develop an appropriate response.
Some planning objectives will be prescriptive, while others will have a broader focus. The choice of planning objectives affects the development and analysis of options in a number of ways and may:
• limit the type of options considered
• guide the selection and development of options
• provide the rationale for comparison between options.
The team undertaking the analysis must keep these planning goals in mind when designing options, to ensure the appropriate breadth of options are considered and that the options provide the desired outcome. Table 3-1 shows how different types of planning objectives affect option choice and assessment.
Table 3 - 1 Objective, choice and assessment Type of planning objective Options to be considered
To meet a demand reduction target Combination of water efficiency, source substitution and reuse options
To overcome a constraint of peak water demand associated with seasonal demand
Options that will reduce the peak water demand (e.g. outdoor water saving options, cooling tower efficiency, roof water storage) and potentially options that reduce water demand by a specific customer type (e.g. improving water efficiency in hotels in an area where peak tourism demand coincides with high outdoor water use)
To overcome a dry weather sewage treatment and/or sewer network constraint
Options that focus on indoor water demand should be given primary consideration
To reduce the supply–demand gap over time Full suite of water efficiency, potable source substitution, reuse and supply options needs to be explored including the timing of option implementation
3A (ii) De te rmine the depth of ana lys is The analysis of options, and costs and benefits can be undertaken at varying levels of detail, depending on the needs. This has been discussed as part of Steps 1 and 2 but must be clear to those undertaking the options analysis and the stakeholders involved in the decision-making process during Step 3.
At a strategic level, the kinds of questions that the IRP framework might need to address are:
• What suite of demand-reducing options can meet a demand management target, how much will this cost the community as a whole and what level of investment in demand management is cost effective in a specific region?
• What mix of options will best meet the long-term requirement for balancing supply and demand in this region at lowest cost to the community?
When undertaking a detailed analysis the team will also need to consider the associated benefits and externalities of individual options and combinations of options, in conjunction with these questions.
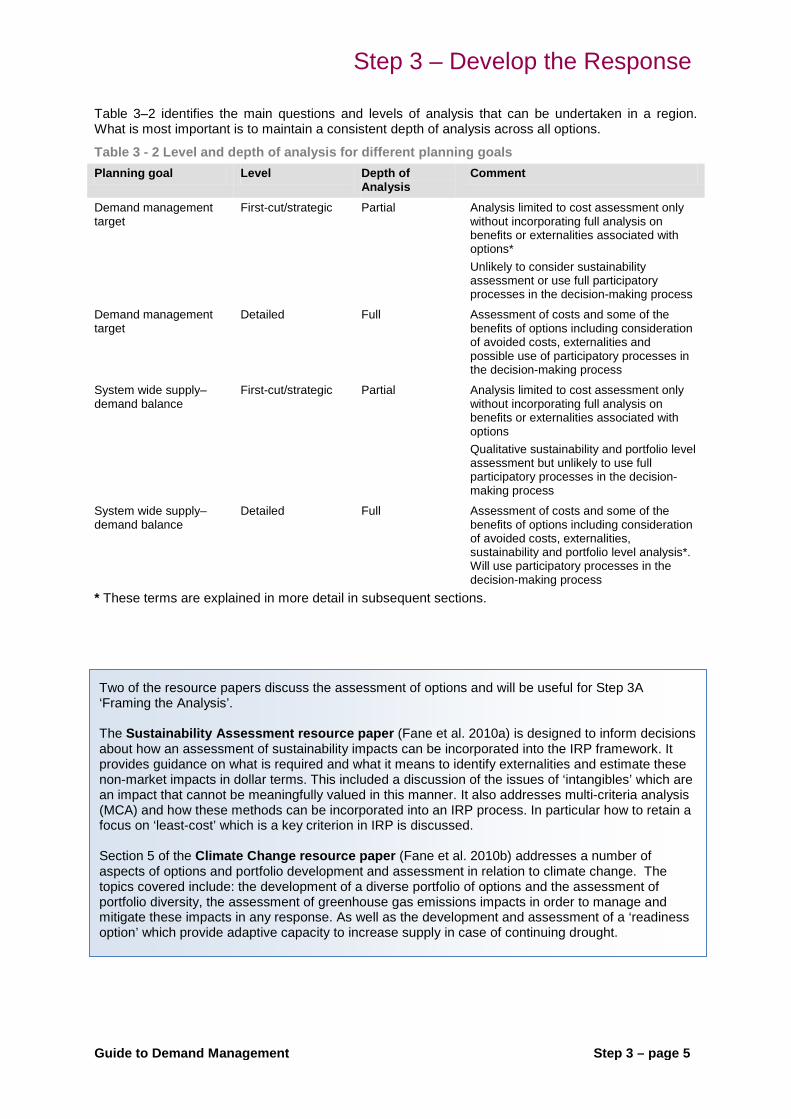
Step 3 – Develop the Response
Guide to Demand Management Step 3 – page 5
Table 3–2 identifies the main questions and levels of analysis that can be undertaken in a region. What is most important is to maintain a consistent depth of analysis across all options.
Table 3 - 2 Level and depth of analysis for different planning goals Planning goal Level Depth of
Analysis Comment
Demand management target
First-cut/strategic Partial Analysis limited to cost assessment only without incorporating full analysis on benefits or externalities associated with options* Unlikely to consider sustainability assessment or use full participatory processes in the decision-making process
Demand management target
Detailed Full Assessment of costs and some of the benefits of options including consideration of avoided costs, externalities and possible use of participatory processes in the decision-making process
System wide supply–demand balance
First-cut/strategic Partial Analysis limited to cost assessment only without incorporating full analysis on benefits or externalities associated with options Qualitative sustainability and portfolio level assessment but unlikely to use full participatory processes in the decision-making process
System wide supply–demand balance
Detailed Full Assessment of costs and some of the benefits of options including consideration of avoided costs, externalities, sustainability and portfolio level analysis*. Will use participatory processes in the decision-making process
* These terms are explained in more detail in subsequent sections.
Two of the resource papers discuss the assessment of options and will be useful for Step 3A ‘Framing the Analysis’. The Sustainability Assessment resource paper (Fane et al. 2010a) is designed to inform decisions about how an assessment of sustainability impacts can be incorporated into the IRP framework. It provides guidance on what is required and what it means to identify externalities and estimate these non-market impacts in dollar terms. This included a discussion of the issues of ‘intangibles’ which are an impact that cannot be meaningfully valued in this manner. It also addresses multi-criteria analysis (MCA) and how these methods can be incorporated into an IRP process. In particular how to retain a focus on ‘least-cost’ which is a key criterion in IRP is discussed. Section 5 of the Climate Change resource paper (Fane et al. 2010b) addresses a number of aspects of options and portfolio development and assessment in relation to climate change. The topics covered include: the development of a diverse portfolio of options and the assessment of portfolio diversity, the assessment of greenhouse gas emissions impacts in order to manage and mitigate these impacts in any response. As well as the development and assessment of a ‘readiness option’ which provide adaptive capacity to increase supply in case of continuing drought.

Step 3 – page 6 Guide to Demand Management
Step 3B Identify and des ign potentia l op tions The instructions below focus on demand-side options. It is expected that, as appropriate, supply-side options such as those shown in Table 3-3 will be developed and analysed with the demand-side options so that all options may be compared with one another in Step 3C. Table 3-3 shows the kinds of factors and policy actions which influence supply availability by increasing or decreasing system yield (supply-side options), compared with others that decrease demand (demand-side options) (White et al. 2006)
Table 3 - 3 Factors or policy actions that influence yield or demand Supply-side options (influences yield) Demand-side (influences demand) New dams, pipelines,
groundwater, desalination
Changed environmental flow regime
Reuse schemes for environmental flows
Indirect potable reuse into storages or ground water
Changed drought response strategies8
- restrictions regime,
:
- readiness options,
- emergency supplies,
- drought pricing
Improve system efficiency (leakage, pressure management)
Improve water-use market
- metering, billing and pricing
- education and advisory services
Improve residential water use efficiency (incentives, retrofit, regulation)
- appliances and fixtures
- landscapes and irrigation
Improve business water use efficiency (incentives, retrofit, regulation)
Substitute potable use (on-site or larger scale)
- rain tanks and stormwater
- grey water and effluent reuse
- private groundwater bores
Supply-side options are usually analysed for their impact on long-term system yields through hydrological modelling of headworks. Models such as REALM or WATHNET must be used. For example, groundwater reserves, when employed as an emergency drought supply, can have an annual yield impact that is much greater than the average volume that they supply each year. The choice of restrictions regime will also have a major impact on yield.
Design of water efficiency and small-scale source substitution options requires consideration of:
• water conservation potential of individual sectors and end uses
• opportunities for source substitution
• use of measures and instruments, and the importance of both structural and behavioural factors
• participation rates
• foundation options
• capital and operating costs
• benefits, including avoided capital and operating costs, peak and average, wastewater, energy and other avoided costs
8 Note that water restrictions are classified as a ‘supply-side option’. The role of water restrictions, and the fact they are different to demand management measures is often misunderstood. Water restrictions increase the yield of the supply system because they act as a feedback process, reducing demand as dam levels drop, slowing the rate of decline and increasing the likelihood that new rains will replenish the system before dams reach dangerously low levels. Demand management options aim to reduce the demand for water permanently whilst providing the same level of service in terms of customer satisfaction.

Step 3 – Develop the Response
Guide to Demand Management Step 3 – page 7
• populating and developing an options model (e.g. the iSDP Model).
These elements are discussed in the following steps.
3B (i) Identify wa ter cons e rva tion poten tia l
Dis aggrega te demand in to s ec tors and s ub-s ec tors When developing options for any area, an essential first step is to disaggregate current water demand into sectors and sub-sectors, being cognisant of the specific issues important to a specific region (e.g. tourism, growth, high non-residential component of demand) and homogeneous customer types that could be targeted and might have responsibility for managing water use. Typical disaggregation includes:
• Residential sector
single residential and multi-residential public housing single residential and multi-residential
• Non-residential
top commercial, industrial and institutional water users commercial (e.g. hotels, office blocks) industrial (e.g. large individual manufacturers) institutional (e.g. hospitals, schools, council recreational facilities and outdoor areas)
• Non revenue water
unavoidable annual real losses (UARL) and current annual real losses (CARL) etc. according to the IWA terminology.
The level of disaggregation feasible for residential and non-residential sectors will depend on the customer water meter database and data entry fields used by a particular water service provider. For example, for the non-residential sector, some water service providers use the Australian New Zealand Standard Industry Classification (ANZSIC) to identify individual customers. Using ANZSIC codes or similar customer-type identification codes makes it easier to obtain a detailed disaggregation of customers. However, in other locations the non-residential sector is not coded by customer type because a standard tariff rate is used for all non-residential customers. In these areas, disaggregation will be more difficult but is still generally possible.
The disaggregation of water demand and the number of customers within each sector and sub-sector required will be available if a sector-based approach has been used for the demand forecasting under Step 2B.
Dis aggrega te in to end us es and de te rmine cons e rva tion poten tia l With demand expressed in sectors and sub-sectors, the next step is to disaggregate the residential demand into end uses for both the indoor and outdoor components of demand, as illustrated in Figure 3-2.
Res idential Disaggregate the demand further, into the water efficiency levels of the stock of appliances (e.g. percentage of 3-star rated showerheads, 6/3 dual flush toilets and front loading or 4-star rated clothes washers in households), as well as the associated flow rate or volume of usage of that stock (e.g. 3-star rated showerheads of < 9 L/min). By disaggregating demand in this way, a water service provider can better determine how efficient the stock of appliances is in a specific region and where potential exists to maximise water conservation potential by converting inefficient appliances to efficient ones. Example 3–1 illustrates the kind of information collated to determine conservation potential as part of options analysis.
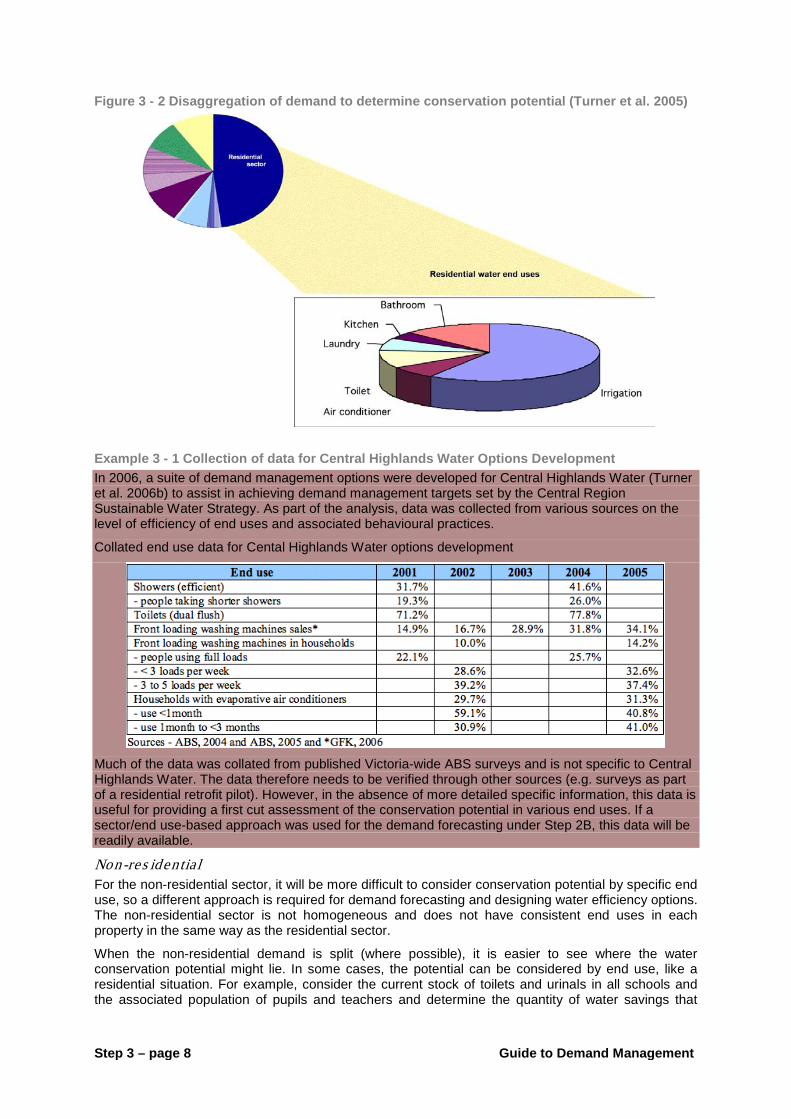
Step 3 – page 8 Guide to Demand Management
Figure 3 - 2 Disaggregation of demand to determine conservation potential (Turner et al. 2005)
Example 3 - 1 Collection of data for Central Highlands Water Options Development In 2006, a suite of demand management options were developed for Central Highlands Water (Turner et al. 2006b) to assist in achieving demand management targets set by the Central Region Sustainable Water Strategy. As part of the analysis, data was collected from various sources on the level of efficiency of end uses and associated behavioural practices.
Collated end use data for Cental Highlands Water options development
Much of the data was collated from published Victoria-wide ABS surveys and is not specific to Central Highlands Water. The data therefore needs to be verified through other sources (e.g. surveys as part of a residential retrofit pilot). However, in the absence of more detailed specific information, this data is useful for providing a first cut assessment of the conservation potential in various end uses. If a sector/end use-based approach was used for the demand forecasting under Step 2B, this data will be readily available.
Non-res idential For the non-residential sector, it will be more difficult to consider conservation potential by specific end use, so a different approach is required for demand forecasting and designing water efficiency options. The non-residential sector is not homogeneous and does not have consistent end uses in each property in the same way as the residential sector.
When the non-residential demand is split (where possible), it is easier to see where the water conservation potential might lie. In some cases, the potential can be considered by end use, like a residential situation. For example, consider the current stock of toilets and urinals in all schools and the associated population of pupils and teachers and determine the quantity of water savings that

Step 3 – Develop the Response
Guide to Demand Management Step 3 – page 9
could be achieved if all remaining inefficient appliances were converted to 4/3.5 L dual flush toilets and waterless urinals.
Similar estimates can be made for end uses in hotels and office blocks and for additional end uses such as cooling towers and trigger spray rinse devices for restaurants, if some detail is known about the end uses in a specific region. In locations where a water service provider is not familiar with the end uses in the non-residential sector, it will take some time to understand the full conservation potential. Hence, as a first cut, considering the percentage reduction in demand will be more appropriate than considering absolute savings values. For example, where water efficiency programs have not been implemented in a significant way, research indicates that typical savings of 20% to 40% can be obtained in indoor and outdoor demand through a well-designed program (White 1998).
In addition, conservation potential can be considered for non revenue water in terms of how the managed system relates to the International Water Association infrastructure leakage index (ILI), now also promoted through the Australian water industry by WSAA. In this benchmark, identifying UARL and CARL can help reductions through pressure management and leakage reduction programs. Having the standard details required to calculate the IWA ILI, such as length of the reticulation system, number of connections and pressure, will assist in determining the conservation potential and type of leakage management and pressure reduction programs available to a specific region (WBW 2004).
Authors’ Note
When reducing water pressure in a region, this reduces the losses associated with the non revenue water component of demand and affects the water pressure within the household. This will affect flow related appliances such as taps, showers and outdoor irrigation systems. Hence, if a water pressure program has been implemented in the past, the conservation potential of appliances such as showers may be less than anticipated. If a pressure reduction program is planned together with a program that will affect showers and/or taps (e.g. a residential retrofit program) then again, a reduction in the estimate of potential savings may be required.
Currently, very little information exists on the interaction between pressure reduction and indoor appliance-flow-related water efficiency programs. A study to investigate the actual water savings attributable to a pressure reduction program was undertaken for the Gold Coast Water region in 2007.
3B (ii) Identify po ten tia l for po tab le wate r s ource s ubs titu tion Having a picture of the conservation potential of a region by sector, sub-sector, customer type and end use enables a good understanding of the potential for potable water source substitution. This means substituting for potable water with treated effluent (as in dual reticulation); with water from private groundwater sources (bores); and rainwater or stormwater. There are many options available for utilising these sources at a building, subdivision or city scale. All of these options need to be considered in the context of the local health regulations and an appropriate economic evaluation as outlined in Step 3C.
3B (iii) Identify fac tors tha t a ffec t op tion des ign Having determined the level of conservation potential available in a region a number of issues or factors must also be considered before designing options. These factors/issues are detailed below.
Take advantage of bo th s truc tura l and behavioura l opportunitie s Structural changes are those that influence the efficiency of water use in fixtures and appliances, such as changing a top-loading clothes washer for front-loading one that use half the water per load. The conservation potential of the stock of appliances and their technology flow rates/usage (e.g. 3-star rated showerhead of < 9 L/min and 4-star clothes washer of <51.5 L/load for a typical 5 kg machine) represents the potential to make a structural change in a household.
Behavioural changes rely on influencing the way people use water through their actions and practices, such as the length of shower or using full loads in a clothes washer. The water service provider also needs to consider the behaviour patterns of the community and what potential there is to change the community’s attitudes and behaviour patterns to increase water efficiency. For example, customers may on average have a shower for 7 mins per day and use 5 loads of washing a week. Hence, there may be an opportunity for the community to reduce their average shower duration (e.g.
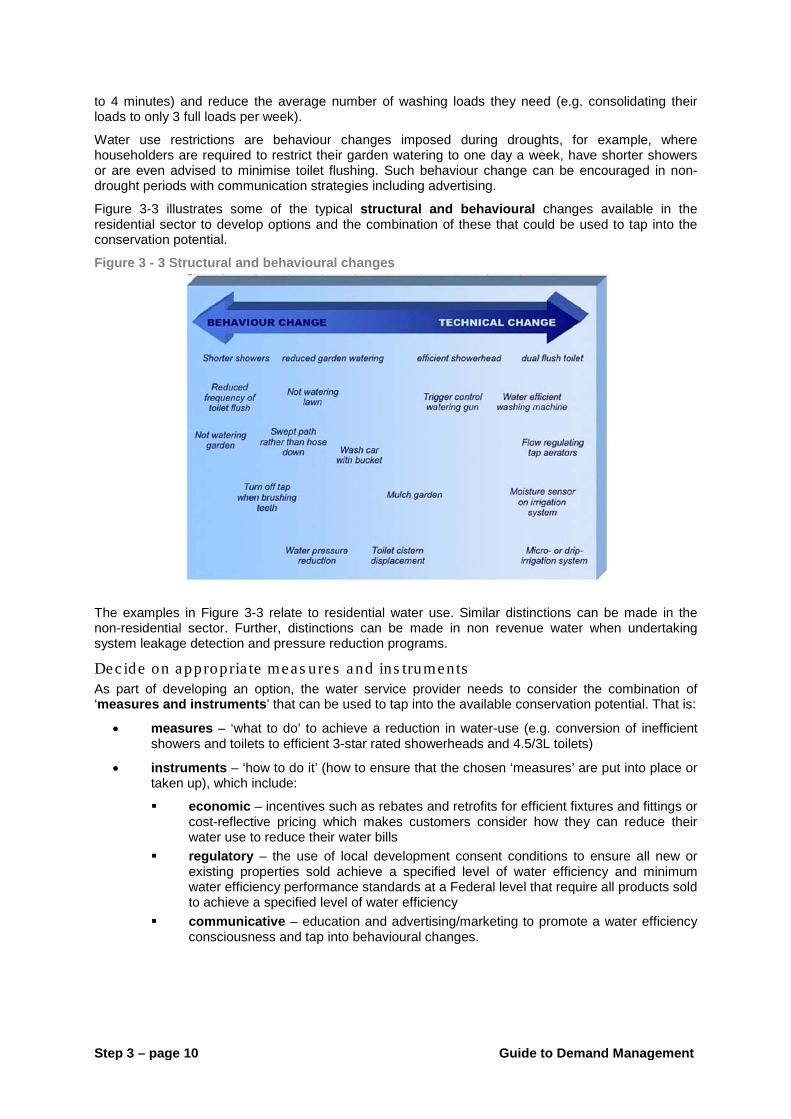
Step 3 – page 10 Guide to Demand Management
to 4 minutes) and reduce the average number of washing loads they need (e.g. consolidating their loads to only 3 full loads per week).
Water use restrictions are behaviour changes imposed during droughts, for example, where householders are required to restrict their garden watering to one day a week, have shorter showers or are even advised to minimise toilet flushing. Such behaviour change can be encouraged in non-drought periods with communication strategies including advertising.
Figure 3-3 illustrates some of the typical structural and behavioural changes available in the residential sector to develop options and the combination of these that could be used to tap into the conservation potential.
Figure 3 - 3 Structural and behavioural changes
The examples in Figure 3-3 relate to residential water use. Similar distinctions can be made in the non-residential sector. Further, distinctions can be made in non revenue water when undertaking system leakage detection and pressure reduction programs.
Decide on appropria te meas ures and ins truments As part of developing an option, the water service provider needs to consider the combination of ‘measures and instruments’ that can be used to tap into the available conservation potential. That is:
• measures – ‘what to do’ to achieve a reduction in water-use (e.g. conversion of inefficient showers and toilets to efficient 3-star rated showerheads and 4.5/3L toilets)
• instruments – ‘how to do it’ (how to ensure that the chosen ‘measures’ are put into place or taken up), which include:
economic – incentives such as rebates and retrofits for efficient fixtures and fittings or cost-reflective pricing which makes customers consider how they can reduce their water use to reduce their water bills
regulatory – the use of local development consent conditions to ensure all new or existing properties sold achieve a specified level of water efficiency and minimum water efficiency performance standards at a Federal level that require all products sold to achieve a specified level of water efficiency
communicative – education and advertising/marketing to promote a water efficiency consciousness and tap into behavioural changes.
Step 3 – Develop the Response
Guide to Demand Management Step 3 – page 11
Authors’ Note
Many examples exist, both nationally and internationally, of water efficiency programs that have relied on behavioural change using public awareness campaigns (a communicative instrument) in isolation. Experience has shown that while they are low cost and essential as a foundation option to any water efficiency program, they rarely produce significant or long-lasting savings.
Therefore, both structural and behavioural changes should be designed into each individual program and more than one instrument used. A combination of at least two instruments is generally most effective. For example, an economic incentive for an indoor retrofit, plus communicative and educative material about water saving tips and tricks around the home, have the potential to tap into both structural and behavioural conservation.
Similarly, whenever considering changing a single measure such as a clothes washer, at least two instruments are recommended to maximise effectiveness. For example, an economic incentive and communication/education that recognises both structural and behavioural changes can take place (e.g. a more efficient machine and the participant being informed that they can save both water and energy if they wait to use a full load when washing clothes, which will save them money).
Utilis e both contro l and influence When developing water efficiency options, the water service provider should not constrain themselves to their sphere of control (i.e. the water system or retrofits/rebates for their customers) but should also expand the options to their sphere of influence. Clearly identifying how different instruments combined with measures can affect the conservation potential and cost of each option makes a compelling argument to government, regulators and other stakeholders to play their part.
For example, state-based schemes such as the NSW BASIX9
Cons ide r timing
, a regulation that ensures each new and renovated house must achieve a minimum specified level of water efficiency, can lock in conservation potential. Similarly, water efficiency labelling and the move towards minimum water efficiency performance standards (MWEPS) for appliances such as showerheads, clothes washers and evaporative air conditioners (at Commonwealth government level) will reduce water use for these end uses at very low cost. These regulatory instruments are key to achieving and locking in water savings and maintaining the savings of retrofits/rebates as appliances are replaced gradually in the longer term. If water efficient appliances are the only models that can be purchased in the future then there will be minimal risk that the savings cannot be maintained unless participants’ water using practices change significantly.
Timing is critical for the roll-out of water efficiency options and the control and influence of implementing such options. For example, in a city only 20% of households might have efficient front-loading clothes washers. This means that the remaining 80% of existing households could be converted providing significant potential water savings. However, how and when the conservation potential is best achieved needs careful consideration for each specific region in terms of the target to be achieved and/or supply–demand gap to be filled.
If the target is close and or the supply-demand balance needs filling quickly, then providing rebates for front-loading clothes washers would make sense. However, if the targets or forecast need is 20 years or so away then a regulatory instrument such as MWEPS, (which is under active consideration by the Australian Commonwealth and State Governments) will make more sense because it is a much lower unit cost option. With a regulatory instrument such as MWEPS, only the most efficient clothes washers could potentially be available. In this case virtually all machines in stock are likely to be efficient in the plan’s time frame, as the average life of a clothes washer is approximately fourteen years.
For timing, it is also important to consider the conservation of both the ‘existing’ stock of households and their appliances and ‘new’ households and appliances. In areas where there is little or no growth and, for example, a new requirement means that the supply–demand balance will become critical within a specified period of time then only the conservation potential of the existing housing stock can be tapped into. However, where there is significant growth, which is also one of the primary reasons
9 See http://www.basix.nsw.gov.au [Accessed 22 June 2006].

Step 3 – page 12 Guide to Demand Management
for the supply–demand gap increasing then options for both existing households (retrofits and rebates) and new households (regulation) can be implemented.
3B (iv) Des ign options Factors and issues raised in Steps 3B (i) to (iii) will be extremely useful when actually designing options so that the full conservation potential is recognised in a region and as a list of considerations for the water service provider when systematically working through the design of each option.
There is a large and growing suite of demand management and source substitution option examples available to consider for each location. With demand management having been done in Australia since the late 1980s and earlier in many international locations such as California, there are numerous real examples of options and their level of success.
Des ign founda tion options Fundamental to any effective suite of demand management options, a ‘water efficiency program’, it is important to identify foundation options. Whilst it may sometimes be difficult to assess the actual costs of setting up and the savings attributable to such options, they have often been shown to be critical elements to the success of an entire program.
Such options include:
• An effective ongoing education and public awareness campaign that ensures the community understand how they use water and how they may be able to save water.
• A customer advisory service which assists in communicating to the public how to save water and participate in water efficiency programs. For example, with telephone advisory hot lines, a user friendly and informative website and the provision of useful and accurate information such as using fact sheets relevant to the region.
• Permanent outdoor water use regulations to ensure sensible watering practices such as:
no watering of hard surfaces, such as paved areas not watering during peak evaporation periods limiting watering to specific days for specific customers (e.g. odds and evens
households on alternate days) • Universal customer metering including where possible regulations to ensure all individual
units of occupancy (i.e. in both single and multi-residential properties) have individual meters to facilitate user-pays pricing and the use of smart meters to assist in peak, drought and scarcity pricing.
• The use of regular billing cycles including customer feedback on bills to advise on how the customer is tracking with respect to previous billing cycles and typical household water consumption.
• Effective user-pays cost-reflective pricing including consideration of inclining block tariffs water and wastewater tariffs and peak, drought and scarcity pricing.
• Basic system management including systematic replacement of customer water meters and calibration of bulk water meters to ensure a high level of water accounting accuracy. This includes the systematic use of the IWA Infrastructure Leakage Index benchmarking reporting procedures to identify where improvements in system management are needed/possible in terms of both leakage and pressure management. It is essential for a water service provider to lead by example in contributing to saving water (i.e. having a well-managed system and saving water in the system by responding quickly to reported leaks). This will be essential if the community is to be expected to contribute to water efficiency in the region.
Des ign a s u ite of op tions As previously indicated, in addition to the foundation options there is a large and growing suite of water efficiency and potable source substitution options from which to choose. Some of these programs are very successful in terms of participation rates, achieving savings and keeping program costs to a minimum. However, many programs are not as effective as they could be due to design faults, lack of sufficient funding or evaluation of the programs after the first phase of implementation.

Step 3 – Develop the Response
Guide to Demand Management Step 3 – page 13
The lack of evaluation means the water service provider has little room for improving individual programs over time and determining what issues mean that a program is more or less effective in a particular region compared to a similar program used in another location. Refer to Step 5 for further details of the evaluation of programs in the IRP process.
Table 3-4 provides a list of typical option characteristics for a selection of customer based programs together with some potential issues and ways to improve the design of particular options to maximise their effectiveness. Example 3–2 identifies a suite of options considered for the ACT.
Example 3 - 2 Options considered for the ACT Water Resources Strategy As detailed in Example 2-5, in 2003/04, the ACT Government developed ‘Think water, ACT water’, a water resources strategy for the next 50 years. A suite of options was designed using the IRP process to determine the lowest cost means of achieving the demand management targets of a 12% and 25% reduction in per capita potable demand by 2013 and 2023 respectively.
A broad spectrum of options was developed, which considered water efficiency options in all sectors (including both existing and new properties), source substitution and reuse options.
Broad spectrum of options considered in the ACT (Turner & White 2003)
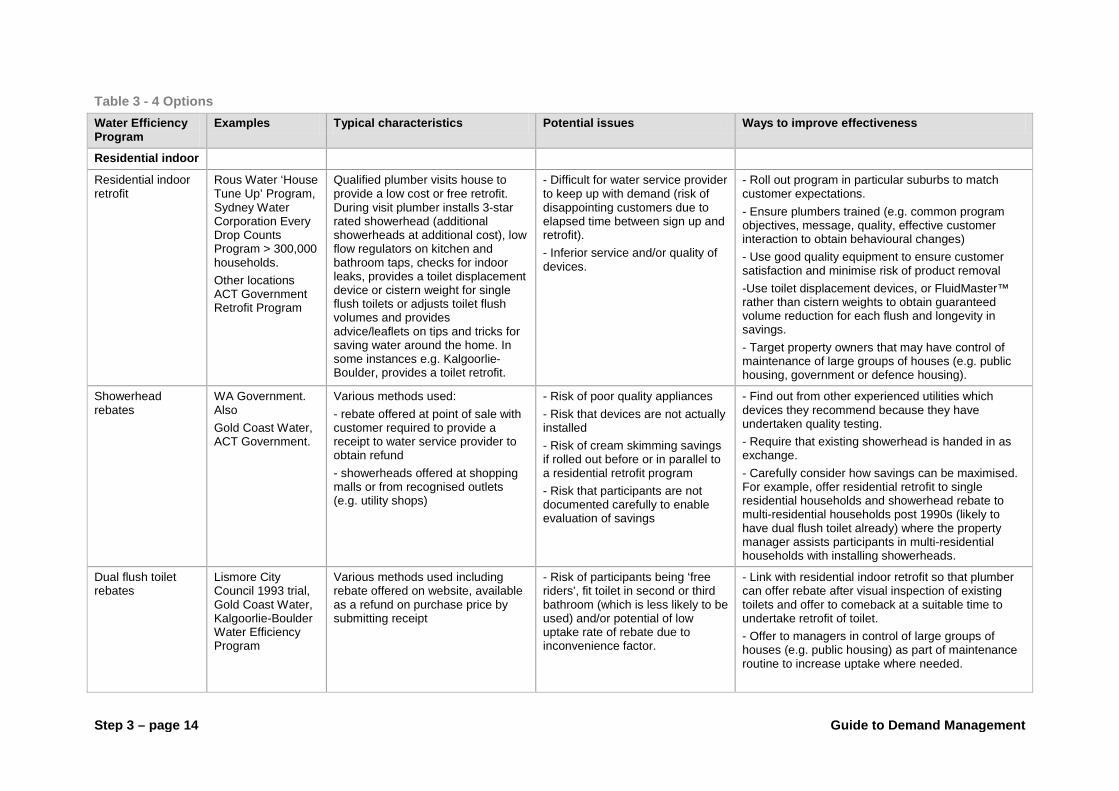
Step 3 – page 14 Guide to Demand Management
Table 3 - 4 Options Water Efficiency Program
Examples Typical characteristics Potential issues Ways to improve effectiveness
Residential indoor
Residential indoor retrofit
Rous Water ‘House Tune Up’ Program, Sydney Water Corporation Every Drop Counts Program > 300,000 households. Other locations ACT Government Retrofit Program
Qualified plumber visits house to provide a low cost or free retrofit. During visit plumber installs 3-star rated showerhead (additional showerheads at additional cost), low flow regulators on kitchen and bathroom taps, checks for indoor leaks, provides a toilet displacement device or cistern weight for single flush toilets or adjusts toilet flush volumes and provides advice/leaflets on tips and tricks for saving water around the home. In some instances e.g. Kalgoorlie-Boulder, provides a toilet retrofit.
- Difficult for water service provider to keep up with demand (risk of disappointing customers due to elapsed time between sign up and retrofit). - Inferior service and/or quality of devices.
- Roll out program in particular suburbs to match customer expectations. - Ensure plumbers trained (e.g. common program objectives, message, quality, effective customer interaction to obtain behavioural changes) - Use good quality equipment to ensure customer satisfaction and minimise risk of product removal -Use toilet displacement devices, or FluidMaster™ rather than cistern weights to obtain guaranteed volume reduction for each flush and longevity in savings. - Target property owners that may have control of maintenance of large groups of houses (e.g. public housing, government or defence housing).
Showerhead rebates
WA Government. Also Gold Coast Water, ACT Government.
Various methods used: - rebate offered at point of sale with customer required to provide a receipt to water service provider to obtain refund - showerheads offered at shopping malls or from recognised outlets (e.g. utility shops)
- Risk of poor quality appliances - Risk that devices are not actually installed - Risk of cream skimming savings if rolled out before or in parallel to a residential retrofit program - Risk that participants are not documented carefully to enable evaluation of savings
- Find out from other experienced utilities which devices they recommend because they have undertaken quality testing. - Require that existing showerhead is handed in as exchange. - Carefully consider how savings can be maximised. For example, offer residential retrofit to single residential households and showerhead rebate to multi-residential households post 1990s (likely to have dual flush toilet already) where the property manager assists participants in multi-residential households with installing showerheads.
Dual flush toilet rebates
Lismore City Council 1993 trial, Gold Coast Water, Kalgoorlie-Boulder Water Efficiency Program
Various methods used including rebate offered on website, available as a refund on purchase price by submitting receipt
- Risk of participants being ‘free riders’, fit toilet in second or third bathroom (which is less likely to be used) and/or potential of low uptake rate of rebate due to inconvenience factor.
- Link with residential indoor retrofit so that plumber can offer rebate after visual inspection of existing toilets and offer to comeback at a suitable time to undertake retrofit of toilet. - Offer to managers in control of large groups of houses (e.g. public housing) as part of maintenance routine to increase uptake where needed.

Guide to Demand Management Step 3 – page 15
Water Efficiency Program
Examples Typical characteristics Potential issues Ways to improve effectiveness
Do it yourself indoor tune-up
Sydney Water Corporation
Various including pack and instructions for participants to change tap aerators for bathroom hand basin and kitchen taps and flow regulator for showerheads themselves with kit provided.
- Participants do not actually install devices due to inconvenience factor. - Dissatisfaction in performance of showerhead due to existing showerhead not being designed to cater for lower flow rate.
- Offer residential retrofit instead. - Offer well designed 3-star rated showerhead instead of flow regulator for showerhead.
Clothes washer rebates
WA Government > 80,000 in Perth metropolitan region. Also Sydney Water Corporation, Victorian Government.
Provision of rebate at point of sale - Risk of ‘free riders’. - Risk of 4 star top loading machines not providing anticipated savings due to ‘suds saver’ button on particular makes not being used. - Risk of removal of unit to another location.
- Require original clothes washer exchange at suitable location to remove non-efficient machine from stock. - Only provide rebates for specific 4 star rated machines that do not have this issue or 5-star rated machines. Also, provide a notice/instructions to those with machines at risk, on how to reduce water usage with those particular machines. - Require evidence of ownership of house or similar to prove long term residency in region.
Residential outdoor
Outdoor water use advisory service
Related examples from ACT Government, Water Corporation
Personalised service (visit by trained and knowledgeable staff) to provide advice and support, and discounted products to improve outdoor water use through improved irrigation controllers, maintenance of irrigation system, landscaping and plant selection advice and advice regarding irrigation depth and frequency.
- Risk of lack of integration between hardware aspect of service and advisory aspect - Risk of lack of appropriate expertise of staff - Risk of ‘free riders’ if program is self selecting - Risk of savings decay as households move or information is forgotten
- Target high water users from database - Ensure that staff are trained and suitable – that is, knowledgeable on garden and irrigation issues - Ensure that program combines hardware and behaviour change dimensions - Ensure that there is adequate follow-up after several months and then annually – even by mail or phone, including monitoring of water use
Lawn buy back Water Corporation (Kalgoorlie-Boulder and Kambalda)
These schemes were based on examples from South-West USA. Householders are offered rebates on water efficient landscaping goods and services, or cash, in exchange for reducing their lawn area.
- Requires detailed follow-up and monitoring - Should only apply to existing premises, not reducing the potential size of future lawn - Decay of savings due to increases in garden interest
- Provide direct support to remove lawn eg backhoe - Target high outdoor water users - Provide ongoing support and advice, including linkage with other programs
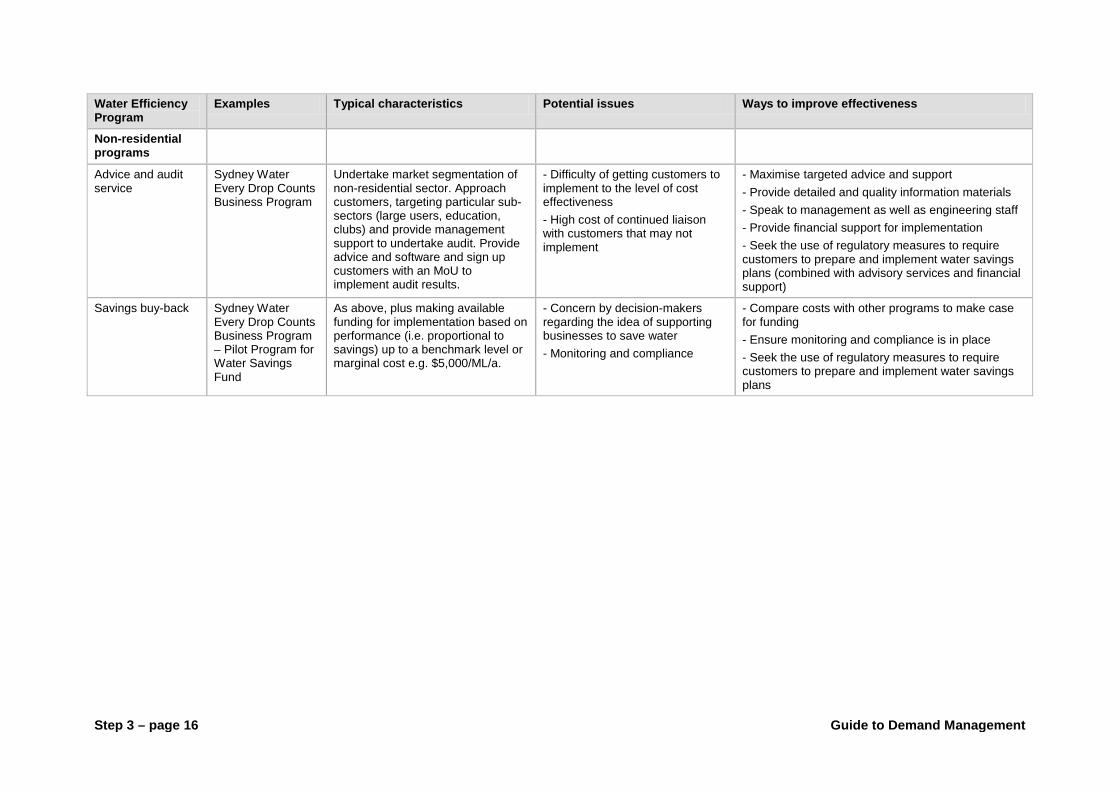
Step 3 – page 16 Guide to Demand Management
Water Efficiency Program
Examples Typical characteristics Potential issues Ways to improve effectiveness
Non-residential programs
Advice and audit service
Sydney Water Every Drop Counts Business Program
Undertake market segmentation of non-residential sector. Approach customers, targeting particular sub-sectors (large users, education, clubs) and provide management support to undertake audit. Provide advice and software and sign up customers with an MoU to implement audit results.
- Difficulty of getting customers to implement to the level of cost effectiveness - High cost of continued liaison with customers that may not implement
- Maximise targeted advice and support - Provide detailed and quality information materials - Speak to management as well as engineering staff - Provide financial support for implementation - Seek the use of regulatory measures to require customers to prepare and implement water savings plans (combined with advisory services and financial support)
Savings buy-back Sydney Water Every Drop Counts Business Program – Pilot Program for Water Savings Fund
As above, plus making available funding for implementation based on performance (i.e. proportional to savings) up to a benchmark level or marginal cost e.g. $5,000/ML/a.
- Concern by decision-makers regarding the idea of supporting businesses to save water - Monitoring and compliance
- Compare costs with other programs to make case for funding - Ensure monitoring and compliance is in place - Seek the use of regulatory measures to require customers to prepare and implement water savings plans
Step 3 – Develop the Response
Guide to Demand Management Step 3 – page 17
Es timate s avings Information on estimated savings for a proposed program can be obtained in two key ways as indicated in the following sections. The use of each will depend on the availability of data and opportunities for empirical measurement.
Theore tica l s avings This can be used as an approximation but care needs to be taken not to over-estimate savings using this method. For example, in early showerhead programs it was estimated that savings could be in excess of 35 kL/household per annum, based on reducing flow from theoretical maximum flow of 20 L/min for a non-efficient device to 9 L/min for a 3-star rated showerhead. It has since been found that for devices such as showerheads, people normally throttle back the flow for comfort, meaning that flows are considerably less than 20 L/min under normal operation. This has implications for both normal usage and anticipated savings (Cordell et al. 2003). Only in areas of high water pressure are these higher flow rates more likely to occur and with greater water savings potentially available. It is recommended only to use theoretical savings if no other information is available and to be cautious in doing so.
Meas ured s avings Measured savings of a similar program from another area can be used to provide a more accurate approximation of the savings that might be obtained from implementing a program in a new area. For example, for an indoor program such as the Sydney Water Corporation Every Drop Counts Residential Retrofit Program the savings were found to be 21 kL/household/annum for a single residential household (Turner et al. 2005a). The savings can be approximated by translating this figure to a per person saving using the occupancy ratio of the single residential households in a particular location.
For best results, it is always recommended to use actual measured water savings from the area where the program is taking place. This can be done using a pilot study where the savings can be measured within approximately six months of the pilot being implemented depending on the meter reading cycle. Alternatively, savings of a program that may have been in place for some time but never evaluated could be measured.
Unfortunately, few water efficiency programs have actually been evaluated (i.e. measurement of water savings) but the number is growing for different types of residential and non-residential programs. Refer to Step 5 for current available literature on measured savings for programs to assist in savings estimates.
Savings life and/or decay When estimating savings, the life and/or decay of those savings need to be considered. For example, in the case of a retrofit program the savings of the 3-star rated showerhead and tap aerators may decay after say, fourteen years when the devices are replaced at the end of their useful life. The devices could potentially be replaced with non-efficient devices, which would mean that the savings are lost after year 14. However, it is possible that minimum water efficiency performance standards (MWEPS) will come into force in the near future. If this were to happen by say 2010, the retrofitted showerhead and tap savings will effectively be locked in place by MWEPS, no savings decay will take place, and the savings attributable to the retrofit can be maintained. Care needs to be taken to only attribute these savings to the retrofit or MWEPS to ensure double counting of savings does not take place in the options analysis.
In the case of an outdoor program, either decay needs to be considered or the program maintained into the future to reduce the risk of future decay. For example, where soil wetting agent crystals are provided, the life of those savings is likely to be only approximately five years. So the program manager has the choice of calculating a proportion of the outdoor program to decay after five years or, for example, to cost into the program the need to give soil wetting agent to the customers every five years to maintain those savings.
Natura l a ttrition of s avings Another level of complexity in estimating savings for a program is the fact that there will be an underlying changeover from inefficient to efficient fixtures and fittings. For example, in the case of showerheads, toilets and clothes washers the proportion of efficient appliances has increased across Australia. As with all innovations this increase in the proportion of efficient appliances is expected to

Step 3 – page 18 Guide to Demand Management
continue, and the adoption rate can be modelled using innovation theory and simulated using mathematical modelling where growth is slowest at the start and end of the time period considered10
When doing high-level estimates, without using an end use model, the natural attrition of savings cannot easily be taken into consideration and thus a slight over estimation of savings is likely to occur. If analysis is just for a strategy level, for example, this should be qualified in the associated documentation. Where analysis that is more detailed is being used and an end use model is available, stock models (refer to Section 2B) will have been developed and thus the natural attrition of savings can be taken into consideration.
. Hence when estimating the savings attributable to the implementation of (say) a retrofit program, the savings relative to a base case will gradually be reduced as these devices are naturally replaced by more efficient fixtures and fittings.
Es timate cos ts and benefits to enable furthe r ana lys is Estimating cost and benefits is complex. It is dealt with in detail as part of Step 3C. To assist users to follow Step 3C and the more detailed analysis part of Step 3D, a hypothetical example (Example 3–3) has been created, which considers a comprehensive list of options to enable detailed cost, benefit and sustainability analysis.
Example 3 - 3 Set of supply and demand-side options This case study provides a comprehensive list of options that can increase supply or decrease demand. The case study is hypothetical, but based on real options for Australian cities.
The supply-side options include both rain-fed and non rain-fed supplies, and options of all sizes and types, no matter how small. Risk management and adaptive management both show smaller options to be valuable in a diverse portfolio.
For the demand reduction options, the most useful means of ensuring comprehensiveness is to check that every water-using customer sector is considered and that options are developed that can tap into the conservation potential in all these sectors and end uses. For example, the water supply system itself, single residential dwellings, multi-unit residential dwellings, industrial and commercial customers, and water end uses (e.g. toilet, shower, clothes washer, kitchen, taps, outdoor water use). It is also important to remember that the water services can be provided with differing levels of water use intensity (efficiency). They can also be provided with different levels of water quality (such as less than potable grade water for toilet flushing and clothes washing) and in some cases no water at all (as in the case of waterless urinals, or in-ground heat pump cooling systems).
In this case study, a range of options has been developed for illustrative purposes. In some cases options have been clumped together for simplicity, for example, the indoor residential option would combine the following two sub-options:
- a residential retrofit program, in which householders are offered a heavily discounted service for a plumber to visit the house to install a water efficient shower head, tap flow regulators, toilet cistern flush arrestors and to repair any miscellaneous leaks;
- a cash rebate at point of sale to encourage the purchase of a more efficient clothes washer.
In both cases, these options are designed to rapidly increase the proportion of water efficient appliances in households, pending the implementation of minimum water efficiency performance standards. In the modelling of the savings from these programs, the potential for double counting the savings needs to be addressed by ensuring that the savings from a particular end use (e.g. water efficient showerheads) derived from one option are removed from the savings from each subsequently implemented option. The table describes the options considered in this hypothetical case study.
10 The type of function with an appropriate shape to reflect this behaviour is the Gompertz curve.

Step 3 – Develop the Response
Guide to Demand Management Step 3 – page 19
Options Descriptions

Step 3 – page 20 Guide to Demand Management
Step 3C Analys e individua l options Having designed the individual options as part of Step 3B, it is now necessary to conduct analysis of the costs and cost-effectiveness of individual options, in terms of meeting the pre-determined and accepted overall objective of ensuring the supply-demand balance (see below for brief overview of why cost-effectiveness is the decision framework recommended for IRP). The analysis and ranking of individual options will enable the determination of the portfolio of options that meets this objective at least cost (detailed in step 3D).
It is important to note the difference between:
• A general economic appraisal of an individual option (or number of options) via cost benefit analysis; and
• An appraisal of cost-effectiveness of an option at meeting a pre-determined objective or set of objectives.
Cost-effectiveness analysis is the method used for ranking options within IRP because the decision needs to meet pre-determined objectives. These objectives established in Step 3A will be for example, reaching a particular demand reduction target or balance supply-demand over a given planning period.
The key components of Step 3C (analysing individual options) are
1. Decide on the overall cost perspective(s), which will underpin the analysis. Cost perspective’ refers to which stakeholders will be included in the analysis. In integrated resource planning, two cost tests that include a comprehensive range of stakeholders are the total resource cost perspective and the societal cost perspective (see 3C (i) for a detailed discussion).
Note that supplementary analysis can also be undertaken from the cost perspective of an individual stakeholder group, such as the water utility or customers. A water utility, for example, will undertake this level of analysis because its decision makers have a duty of care concerning the financial viability of their decisions.
2. Select the cost elements that will be included in the analysis. Under both total resource cost and societal cost perspectives, there are various types of direct costs and avoided costs that could be included in the analysis. Under the societal cost perspective, different types of externalities could also be included in the analysis. (See 3C (ii))
3. Determine the cost criteria (measurement methods) which will be used to analyse:
a) The costs of individual options, in a way that takes into account the ‘time value of money’.
b) The cost-effectiveness of individual options (referred to as ‘unit cost’), in terms of cost per unit contribution to a volumetric measurement of contribution to supply-demand balance, for example the cost per kL contribution to yield. Ideally, the unit measures of “effectiveness” should, at least in part, take into account the stochastic nature of weather variables and hence water availability. (See 3C (iii)).
4. Calculate the costs (taking into account the time value of money) and unit cost of each option. (See 3C (iv)).
5. Rank the options according to unit cost. (See 3C (v)).

Step 3 – Develop the Response
Guide to Demand Management Step 3 – page 21
Cos t e ffec tivenes s vs cos t benefit a s a decis ion framework Cost-benefit is generally the preferred economic appraisal method recommended in Australian and State government guidelines for regulation, policy, program and project appraisal (see for example Queensland Treasury (2002), Australian Government (2007)). It provides a decision framework that aims to maximise the net benefit to society of a decision (across all community sectors) by quantifying the total expected costs and the total expected benefits of an action program or project in monetary terms. This type of analysis, theoretically at least, points to the most economically efficient outcomes because it includes an evaluation of all the costs and all the benefits in monetary terms.
In practice however, it is commonly the case that not all costs and benefits can be quantified in monetary terms. This can be due to a lack of available data or because it is not possible to meaningfully represents society’s values in terms of dollars. See ‘Sustainability assessment’ resource paper (Fane et al 2010a) for a discussion of the issue of ‘intangibles’ in economic appraisal.
Cost-effectiveness analysis is also an accepted economic evaluation technique (Queensland Treasury 2002, NSW Treasury 2007, Government of Victoria, 2007). It provides a decision framework for identifying the least-cost means of meeting pre-determined objectives. In IRP, cost-effectiveness analysis is used because the objectives, whether these are ensuring that the supply and demand are balanced over a certain timeframe or a demand reduction target is meet, are determined outside the economic appraisal process.
Cost-effectiveness analysis cannot help with decisions about whether or not the underlying objective is itself worth public investment. It is however well suited to situations such as urban water planning where provision of water services to a community is an accepted public good. In supply–demand planning it is also accepted that the details of this ‘level of service’ will be set either through a process of community consultation or by reference to a predefined regulated standard (Erlanger and Neal 2005). Delivering urban water supplies in accordance with agreed levels of services is the first National Urban water Planning principle (COAG 2009). Cost-effectiveness analysis is therefore an appropriate decision framework for selecting options that meet the forecast water demand with a defined level of service.
Where cost-benefit analysis can have a role in IRP is in the appraisal of single projects. In this situation the ‘benefit’ of the water supplied or saved as a result of the project can be valued at either the marginal cost of water supply or the price of water in the region. Analytically such a cost-benefit analysis is the same as a cost-effectiveness analysis in which the threshold for cost-effectiveness is set at either the marginal cost of supply or the price of water. For the appraisal of single projects then either decision framework can be appropriate. Significantly a similar approach cannot be used in supply-demand planning when selecting options to balance supply-demand over a period. This is because both the marginal cost of supply and the price of water will be determined in part through the decisions that are made as an outcome of the analysis.
Step 3C details a minimum level of analysis of the cost-effectiveness of an option as one that involves estimating the net cost of each option to all stakeholders (i.e. government, utility and customer), taking into account the time value of money - and then ranking individual options based on their unit cost.
The analysis and ranking at this step is limited to considering those cost elements, which can be meaningfully “monetised” using available quantitative techniques and data. Various other environmental, risk and social factors are taken into account in the analysis covered by Step 3D, where options are grouped into portfolios and sustainability assessment considered.
3C (i) De te rmine the cos t pe rs pec tives In terms of which costs and avoided cost are to be included in a cost effectiveness analysis this requires consideration of cost perspectives. Cost perspectives’ differ from one another in terms of which stakeholders are included in the analysis. Various cost perspectives can be used in IRP, and it is important to make explicit which perspectives (stakeholders) have been included. The choice of cost perspectives influences the scope of costs (direct and avoided) which are analysed – and hence also influences the outcome and conclusions of the analysis.
In this Guide, the stakeholders are categorised as the utility, government, customers and other. In some regions, the mix of stakeholders can be more complex, for example, when the state government
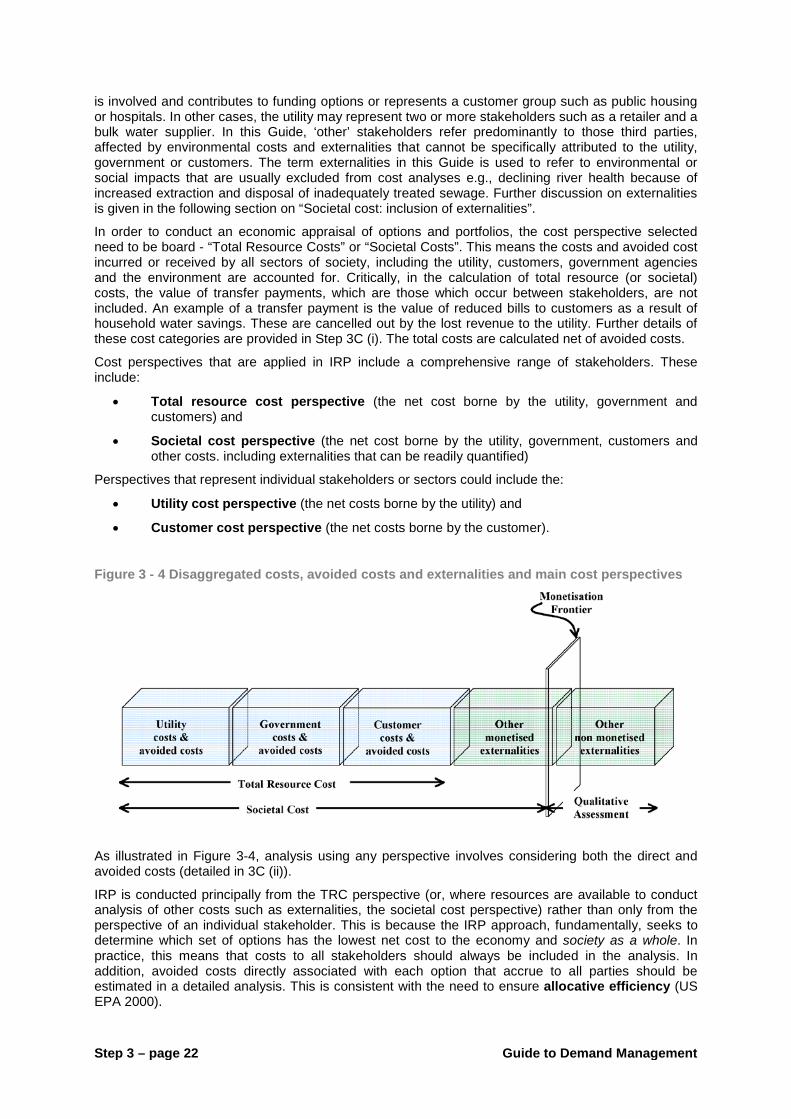
Step 3 – page 22 Guide to Demand Management
is involved and contributes to funding options or represents a customer group such as public housing or hospitals. In other cases, the utility may represent two or more stakeholders such as a retailer and a bulk water supplier. In this Guide, ‘other’ stakeholders refer predominantly to those third parties, affected by environmental costs and externalities that cannot be specifically attributed to the utility, government or customers. The term externalities in this Guide is used to refer to environmental or social impacts that are usually excluded from cost analyses e.g., declining river health because of increased extraction and disposal of inadequately treated sewage. Further discussion on externalities is given in the following section on “Societal cost: inclusion of externalities”.
In order to conduct an economic appraisal of options and portfolios, the cost perspective selected need to be board - “Total Resource Costs” or “Societal Costs”. This means the costs and avoided cost incurred or received by all sectors of society, including the utility, customers, government agencies and the environment are accounted for. Critically, in the calculation of total resource (or societal) costs, the value of transfer payments, which are those which occur between stakeholders, are not included. An example of a transfer payment is the value of reduced bills to customers as a result of household water savings. These are cancelled out by the lost revenue to the utility. Further details of these cost categories are provided in Step 3C (i). The total costs are calculated net of avoided costs.
Cost perspectives that are applied in IRP include a comprehensive range of stakeholders. These include:
• Total resource cost perspective (the net cost borne by the utility, government and customers) and
• Societal cost perspective (the net cost borne by the utility, government, customers and other costs. including externalities that can be readily quantified)
Perspectives that represent individual stakeholders or sectors could include the:
• Utility cost perspective (the net costs borne by the utility) and
• Customer cost perspective (the net costs borne by the customer).
Figure 3 - 4 Disaggregated costs, avoided costs and externalities and main cost perspectives
As illustrated in Figure 3-4, analysis using any perspective involves considering both the direct and avoided costs (detailed in 3C (ii)).
IRP is conducted principally from the TRC perspective (or, where resources are available to conduct analysis of other costs such as externalities, the societal cost perspective) rather than only from the perspective of an individual stakeholder. This is because the IRP approach, fundamentally, seeks to determine which set of options has the lowest net cost to the economy and society as a whole. In practice, this means that costs to all stakeholders should always be included in the analysis. In addition, avoided costs directly associated with each option that accrue to all parties should be estimated in a detailed analysis. This is consistent with the need to ensure allocative efficiency (US EPA 2000).

Step 3 – Develop the Response
Guide to Demand Management Step 3 – page 23
The utility cost perspective is used in IRP as a supplementary step alongside the TRC or societal perspective. Utility and customer perspective assesses ‘who pays’ for each element of the options developed and how the costs and benefits of options are shared between the stakeholders involved (e.g. the utility, government and customers). The identity and grouping of the stakeholders involved will vary depending on the region-specific context. Analysis of costs from these perspectives is important to provide an analysis of cash flow for the utility, and to ensure that costs can be recovered in the price setting process. This kind of analysis also enables portfolios of options to be designed in a way that reflects equity, fairness or distributive efficiency goals (US EPA 2000; CPUC 2001); for example, by allowing the sectors that ‘win’ (such as customers) to compensate the ‘losers’ such as the utility itself. Similar redistributions can occur between utilities and governments in the price setting process, the payment of dividends and community service obligation payments.
The TRC (or societal) and utility perspectives must be used in parallel when analysing and ranking individual (and grouped) options. The utility perspective, for example, will include foregone revenue, however the TRC perspective analysis will not. In general, analysis from both perspectives is required: TRC for determining the priority for investment in options, and the utility perspective to enable cash flow analysis for operational planning.

Step 3 – page 24 Guide to Demand Management
Accounting for foregone revenue
The issue of foregone revenue to the utility is sometimes raised in relation to the analysis of demand management options. The foregone revenue is the volume of water multiplied by the retail price of water. As described previously, the IRP process requires assessment of options from the perspective of the whole of society. Foregone revenue therefore represents a transfer payment between customers and the water utility and is not included in the calculation of costs from the TRC perspective.
A simplified model of the flows of costs and benefits in TRC is provided in the table below. This shows how the ‘cost’ of foregone revenue is cancelled by the ‘benefit’ to customers of reduced water bills.
Parameter Utility Customers Total Resource Cost test
Costs program costs (PC) foregone revenue (FR)
customer costs (CC) PC +FR+CC
Benefits avoided cost (AC) reduced bills (FR) AC+FR
Net cost PC+FR-AC CC-FR PC+FR-AC+CC-FR
As the table indicates, the utility cost of foregone revenue and the benefit to the customer of reduced bills from a water saving option are equal and thus cancel each other out when using a whole-of-society (multi-stakeholder) perspective, such as for the TRC test. The question of foregone revenue is of importance when calculating cash flow, to enable the utility to plan revenue needs and to recover lost revenue through the water price or fixed charge, or through other mechanisms such as direct funding from government. For example, Sydney Water now receives funding from the NSW Government from the non-contestable component of the Water Savings Fund ($30M per year for four years) for the implementation of its water efficiency programs. These funds are themselves accumulated through a levy on all water use.
3C (ii) De te rmine the cos t e lements The costs of each individual option, to each type of stakeholder, can be disaggregated into various elements: direct, avoided and externality.
The timeframe for analysis should be equal for all options. In addition, to the extent that it is feasible, the boundary of the analysis for all options should be consistent across stakeholders.
Example of demand-s ide option cos ts incurred by d iffe ren t s takeholders For demand-side options, costs can typically be split into the categories shown in Table 3-5. A rainwater tank rebate program example has been provided to illustrate how the costs might be distributed across the different stakeholders over time.
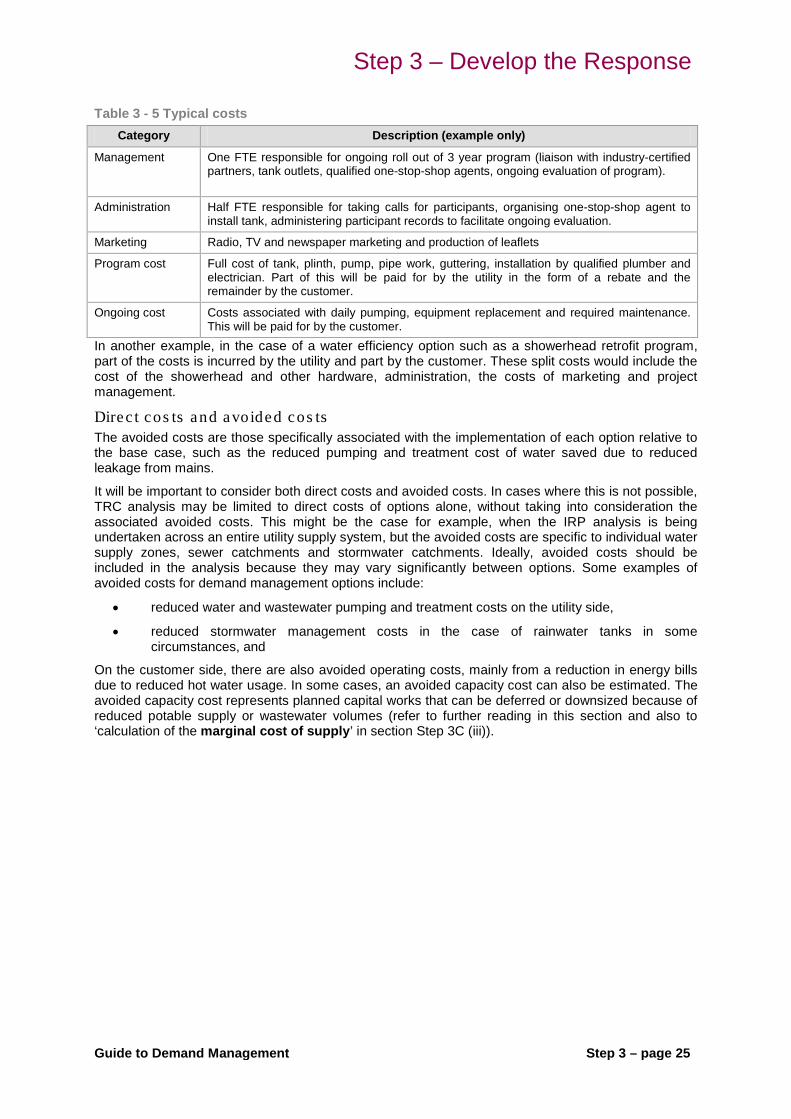
Step 3 – Develop the Response
Guide to Demand Management Step 3 – page 25
Table 3 - 5 Typical costs Category Description (example only)
Management One FTE responsible for ongoing roll out of 3 year program (liaison with industry-certified partners, tank outlets, qualified one-stop-shop agents, ongoing evaluation of program).
Administration Half FTE responsible for taking calls for participants, organising one-stop-shop agent to install tank, administering participant records to facilitate ongoing evaluation.
Marketing Radio, TV and newspaper marketing and production of leaflets
Program cost Full cost of tank, plinth, pump, pipe work, guttering, installation by qualified plumber and electrician. Part of this will be paid for by the utility in the form of a rebate and the remainder by the customer.
Ongoing cost Costs associated with daily pumping, equipment replacement and required maintenance. This will be paid for by the customer.
In another example, in the case of a water efficiency option such as a showerhead retrofit program, part of the costs is incurred by the utility and part by the customer. These split costs would include the cost of the showerhead and other hardware, administration, the costs of marketing and project management.
Direc t cos ts and avoided cos ts The avoided costs are those specifically associated with the implementation of each option relative to the base case, such as the reduced pumping and treatment cost of water saved due to reduced leakage from mains.
It will be important to consider both direct costs and avoided costs. In cases where this is not possible, TRC analysis may be limited to direct costs of options alone, without taking into consideration the associated avoided costs. This might be the case for example, when the IRP analysis is being undertaken across an entire utility supply system, but the avoided costs are specific to individual water supply zones, sewer catchments and stormwater catchments. Ideally, avoided costs should be included in the analysis because they may vary significantly between options. Some examples of avoided costs for demand management options include:
• reduced water and wastewater pumping and treatment costs on the utility side,
• reduced stormwater management costs in the case of rainwater tanks in some circumstances, and
On the customer side, there are also avoided operating costs, mainly from a reduction in energy bills due to reduced hot water usage. In some cases, an avoided capacity cost can also be estimated. The avoided capacity cost represents planned capital works that can be deferred or downsized because of reduced potable supply or wastewater volumes (refer to further reading in this section and also to ‘calculation of the marginal cost of supply’ in section Step 3C (iii)).

Step 3 – page 26 Guide to Demand Management
Authors’ Note
The full cost of some options is difficult to calculate, particularly the allocation of costs. For example, in the case of non-residential options, where audits are undertaken by utilities, the utility cost is straightforward to determine, as it represents the known costs to the utility of staff, water audits, contractors and metering.
However, the customer costs associated with retrofitting equipment or improving procedures (implementation of water audit recommendations) are often difficult to measure owing to both over and under estimates. A ‘free rider’ problem can occur, in which some costs would have been incurred by the customer regardless of the option being implemented e.g. the installation of an item of equipment for operational reasons that is more efficient than the equipment it replaces. Alternatively, customers’ costs due to demand management may be difficult to disentangle from general operational costs.
This uncertainty also exists in terms of the avoided costs of options. For example, the reduced water and wastewater costs may be clearly apparent to the utility but less so to customers. In such cases, estimates of avoided costs, such as energy and chemical reduction should be made but care taken to avoid overestimation.
If analysis is limited to direct costs and therefore only a partial view of TRC is being provided, this should be clearly indicated. Whatever the case, the categories of costs and avoided costs chosen for inclusion should be consistent across both demand-side and supply-side options.
Soc ie ta l cos t: inc lus ion of exte rna litie s The societal cost perspective provides a more complete approximation of the whole-of-society costs than TRC because it also includes externalities – these are costs which result from the implementation of options, but would not be directly borne by customers, utilities or the government. The societal cost is, however, substantially more difficult to estimate.
How to deal with monetis ation or va lua tion of externa lities For some types of sustainability impacts – such as greenhouse gas emissions – there are a range of possible approaches that could be used to assess monetary values. For example it is possible to place a dollar value on greenhouse emissions through reference to existing markets or studies of the expected ‘damage costs’ of climate change. However, monetary valuations of some other impacts (e.g. river health, intrinsic value of wilderness or threatened species) are more difficult. Techniques exist that can ascribe a monetary value to these externalities, however, these estimates may not fully represent society’s values today, nor reflect the value that future generations may place on these externalities. Further, it can be difficult to make a robust linkage from physical impact to externality in many cases. Nevertheless, these impacts, including environmental and social considerations, are often critical to the final decision about what combination of options to implement. Where sustainability impacts are difficult to meaningfully monetise, either due to lack of data or where there is a concern that the impacts are intangibles, multi-criteria approaches and qualitative assessments may be useful. This idea is illustrated in Figure 3-4 as the monetisation frontier.
The Sustainability Assessment resource paper (Fane et al. 2010a) highlights the fact that some impacts may be considered ‘intangibles’ in the economic sense and therefore not meaningfully valued in dollar terms. Also treating sustainability impacts as ‘externalities’ can be constrained by the available data for measuring and valuing these externalities or by the resources available to generate this data. The paper recommends that in such situations that some form of MCA be used for including sustainability impacts and discusses how least-cost analysis might be integrated with MCA.

Step 3 – Develop the Response
Guide to Demand Management Step 3 – page 27
Quantifying cos ts of greenhous e gas emis s ions Contributions to greenhouse gas emissions arise from increased energy intensity of water production. Supply options such as desalination, advanced wastewater treatment, recycling and additional pumping from new dams which are generally a greater distance from the demand centres all involve a net increase in greenhouse emissions relative to a base case. Reductions in greenhouse gas emissions from the demand-side options arise from avoided water pumping and treatment as well as avoided emissions associated with reduced hot water use, which are significant in the case of water efficiency programs involving showers, taps, clothes washers and some industrial processes. Greenhouse gas emissions should always be expressed in net terms, that is some options will increase emissions through increased pumping and treatment costs, others will reduce emissions through reduced water production or water heating, and others will increase and decrease emission such as inter-catchment transfers with a hydro-electricity generation element. The emissions should be expressed relative to the base case. These values for greenhouse gas emissions can then be used to calculate a revised figure for social cost, based on estimates of the cost of carbon.
Anthropogenic greenhouse gas emissions lead to a ‘global’ externality, in that its impacts, and costs, are experienced globally. However, in the absence of a fully functioning and effective international emissions trading scheme, which would (in theory) set a corresponding global price for carbon reflective of these external costs, there is no single measure of the costs of greenhouse gas emissions which is necessarily more accepted – or representative of the externality costs – than another. Various estimates could be used, including those which reflect:
• The cost of carbon as indicated by prices from existing state or overseas emissions trading schemes – such as the NSW Greenhouse Gas Abatement Scheme (price of NGACS – Greenhouse Abatement Certificates) or the European Union Emissions Trading Scheme.
• Reflect the cost associated with greenhouse gas abatement measures11
• A monetary value on the direct impacts of greenhouse gas emissions in the form of the expected damage from climate change – although this method is contentious.
– such as that indicated by the value of Renewable Energy Certificates (RECs) under the Australian Government’s Mandatory Renewable Energy Target
Example 3 - 4 Calculation of greenhouse gas emissions for supply and demand-side options
A cost of carbon of $30/tonne (a figure derived from the European Trading Scheme) would add approximately $7m/a to the operating cost of a typical 100 ML/d desalination plant if this option has a 5,000 kg/ML net greenhouse gas intensity. This would add approximately $200/ML to the $1,300/ML unit cost of such a desalination process.
A typical indoor residential efficiency program, where hot water savings reduce the greenhouse gas emissions relative to the base case, the addition of the (avoided) cost of carbon at this value reduces the unit cost of water saved from $500/ML to minus $125/ML, that is, it becomes a net benefit.
11 The monetary costs associated with carbon sequestration are also widely available, however over-reliance on these figures is not recommended due to the uncertainties surrounding the effectiveness of sequestration activities such as forest planting and geosequestration.
See the Climate Change resource paper (Fane et al. 2010b), section 5.1, on accounting for greenhouse gas emissions. It includes data average energy use for demand and supply-side options. Further box 5 in that section of the paper discusses the Commonwealth Government’s proposed Carbon Pollution Reduction Scheme.
Step 3 – page 28 Guide to Demand Management
Further Reading
Beecher (1996) considers the concept of avoided costs as central to IRP. Avoided costs are those costs that would be incurred due to the increased supply of water that can be saved if water was conserved. These benefits include the direct operating cost of water supply and wastewater treatment as well as the costs of future capital works that are downsized or deferred. Avoided capacity cost can be pursued across the entire water supply and wastewater system and depending on the demand management implemented may include capacity upgrades driven by increases in both peak and average volumes.
Beecher, J., 1996, Avoided Cost: An Essential Concept for Integrated Resource Planning Water Resources Update.
CUWCC, 2000, BMP Costs and Savings Study: A Guide to the Data and Methods for Cost Effectiveness Analysis of Urban Water Conservation Best Management Practices, The California Urban Water Conservation Council, USA.
Maddaus,1999, Realizing the Benefits from Water Conservation Water Resources Update.
Feldman, 2003, Calculating Avoided Costs Attributable to Urban Water Use Efficiency Measures: A Literature Review, report to California Urban Water Conservation Council.
3C (iii) De te rmine the cos t c rite ria to be us ed Once the cost perspective and cost elements have been selected, it is necessary to use the appropriate cost criteria (measurement methods) to evaluate the costs, and cost-effectiveness of various options (or combinations of options, as in Step 3D). There is substantial debate over which criteria should be used, and under what circumstances. This section recommends:
• net present value to analyse net costs; and
• average incremental cost (net present value divided by the discounted yield) as the unit cost measure to analyse cost-effectiveness.
Net pres ent va lue Net present value (NPV) is the preferred method for comparing alternative portfolios. NPV is also a key component of assessing the average incremental cost (the unit cost) of individual options for ranking. This is the case regardless of whether the objective is to meet a demand reduction target or to balance supply and demand over a given period.
NPV is the traditional method for investment analysis and is also the standard methodology used by many governments and organisations to evaluate, compare and prioritise projects. Net present value accounts for the ‘time value of money’ via discounting. The NPV of an alternative is the value of the stream of costs and benefits (or avoided costs) associated with that alternative into the future, discounted back to the present based on a predetermined discount rate (Hanley & Spash 1993; Guj and Werner 1990).
Discounting is introduced to take account of a number of the characteristics of monetary value over time. These include: the social time preference for consumption and the preference for incurring costs later rather than sooner, the opportunity cost of capital which exists because money invested today can be expected to grow and the real cost of funds or interest on borrowings and includes the risk associated with the option(s).
An appropriate discount rate can be debated on theoretical grounds, however Government agencies and Government owned corporations commonly stipulate a discount rate to be used in project assessments. The NSW Treasury (2007) for example, recommends the application of a range of discount rates, with calculations made at 4%, 7%, and 10%. The Commonwealth Government office of best practice regulation likewise suggests an annual real discount rate of 7 per cent but with sensitivity analysis at 3 per cent and 11 per cent (Australian Government 2007).

Step 3 – Develop the Response
Guide to Demand Management Step 3 – page 29
The present value (PV) of a cost incurred t years into the future is estimated as:
PV(Xt )=t=1
N
∑ Xt
(1+r)t
where
PV = present value Xt = the cost incurred in year t r = the annual discount rate N = the period in years over which the analysis is undertaken A simple extension of this formula gives the NPV (where Xt = the net cost or benefit of a project in year t), that is we redefine Xt as the net cost incurred in year t, such that: Xt = Ct - Bt where
Ct = the costs incurred in year t Bt = the benefits (or avoided costs) that result in year t Note that in applying NPV within the cost-effectiveness framework, the present value of costs – net of avoided costs of each portfolio is assessed. As described at the start of section 3 (c), the underlying “benefit” of all portfolios – that of reducing the supply-demand deficit over time – is taken as a given objective.
Average inc rementa l cos t NPV can be used to assess the net cost of individual options, and thus also the total net cost of a combination of options. However, a unit
Different methods for calculating unit costs exist. It is critical that the unit cost method used allows comparison on an equivalent basis between water efficiency, source substitution, reuse and large scale supply options. The average incremental cost (AIC) (also known as levelised cost) is the recommended method in the Guide, when used appropriately.
cost measure (cost per unit of water saved or supplied) is required to analyse the cost-effectiveness of individual options – so that planners can rank these options, and then select the combination (portfolio) with the lowest total NPV.
In IRP literature, a variety of metrics have been used that provide either a unit cost or a cost benefit ratio. These include the following, which are described in the cited literature:
• average incremental cost (AIC), also called levelised cost (Herrington 1987; White 1998; Mitchell et al. 2007)
• annualised unit cost (Menke & Woodwell 1990)
• the NPV of costs divided by the total volume of water saved or supplied (Dziegielewski 1993)
• net benefit or cost benefit ratio (Macy & Maddaus 1987).
The average incremental cost (AIC), or levelised cost is calculated as the present value of the stream of costs for an option, divided by the present value of the net volume of water supplied or saved though the implementation of that option.
It is worth noting several important qualifications regarding the use of the AIC method - which will enable the analysis of unit cost to move away from a wholly deterministic (or averaged) approach and take into account the relationship between cost-effectiveness and stochastic variables.
The costs and their timing should be reflected only when incurred, for example, operating costs included only when the option is actually operated. This is a particularly important consideration in the case of options that are deployed intermittently, such as a reverse osmosis plant or inter-catchment transfers, or are constructed or operated only in emergency situations (‘readiness’ options). In this case, the costs are not known with certainty, but are probabilistic, depending on hydrology or markets. The costs will therefore need to be risk weighted to allow a fair comparison with other options that are

Step 3 – page 30 Guide to Demand Management
‘always on’. This applies, for example, in the case of operating costs for inter-catchment transfers that are triggered at low storage levels, or for the capital and operating costs of ‘readiness options’ where options are planned for, but not built until storages fall to very low levels12
For supply-side options, the unit cost should be calculated using the net contribution to meeting the supply-demand balance which the option provides. This is usually not the same as the yield of the option, for two reasons. Firstly, the yield of a supply option assessed in isolation is often not the same as its contribution to the overall system yield. This can occur, for example, in the case of inter-catchment transfers that are triggered at high dam levels, where the average annual volume of water pumped can be higher than the net contribution to yield because some of the water is spilled from the system due to rainfall. Secondly, while a supply option may have the potential to increase the net yield of the system by a large amount in a short time, if there is a supply-demand surplus, this may seldom or never be necessary – therefore the unit cost should be based on the proportion of that increased system yield that is actually required in practice, which may be less than the total available yield.
. Maintenance costs are also likely to be lower during periods where the option is not actually being operated.
For demand-side options, a similar issue arises for the two reasons cited above, except that it relates to the demand reduction rather than the increase in system yield. A large demand-side option, implemented when there is a supply-demand surplus, will result in a higher unit cost than if it was implemented when needed to meet a supply-demand deficit. The AIC of a demand-side option should be assessed based on the demand-side option being introduced when needed to address a supply-demand deficit, and not earlier.
If the volume of water (supplied or saved) is treated in the manner described above, then the use of AIC will appropriately treat options that deliver water at different times. Options that are implemented prematurely, that is, they have a high upfront cost and where the water is not needed for many years, will have a higher unit cost than those options which deliver water when it is needed, regardless of whether they are demand- or supply-side options.
With these qualifications, the AIC has a number of advantages as a criterion. It can be used to determine an order of merit for options to meet a planning need, such as maintaining the supply-demand balance. Selection of the lowest unit cost options will result in a portfolio of options that has the lowest net present value.
3C (iv) Ca lcu la te the ne t pres ent va lue and unit cos t o f each option A calculation of the net present value combines the costs and the avoided costs associated with an option. The elements included in the calculation of net cost will be dictated by the cost perspective and the detail of the cost elements. As mentioned previously the cost, avoided costs and monetisable externalities (such as greenhouse gases) should all be included in the calculation of the net cost where possible.
All options are compared based on present value net cost for annual average potable demand reduction or the increase in the water supply system yield. As discussed earlier, for unit cost criteria, only that part of the demand reduction or yield increase that actually goes to meeting the supply-demand gap should be counted in the unit cost. In other words, the ‘yield’ of an option should not be its capacity (that is, the potential it has to supply water or reduce demand) but the actual contribution to the demand on the system in a given year. For example, a new supply option such as an inter-catchment transfer pipeline may result in a net increase in the yield of the supply system by 20 GL/a, but if this potential is not used for ten years, then the actual contribution is lower, as shown in Figure 3–5. Note also, as described earlier in this section, that the net contribution to yield is often different to the production capacity of an option, particularly when the option operates intermittently as a result of a storage level trigger.
12 For more details of ‘readiness strategies’ in practice see White et al. (2006). For the associated theory or ‘real options analysis’, see McDonald & Siegel (1982). For more details see Fane et al (2010b), the Climate Change resource paper.

Step 3 – Develop the Response
Guide to Demand Management Step 3 – page 31
Figure 3 - 5 Potential and actual contributions to yield
3C (v) Rank the options In this step, options are ranked on unit cost (AIC). At this stage, all options under consideration are included in the ranking, and a supply curve can be prepared which maps unit cost ($/ML or $/kL) against the cumulative contribution to yield (demand reduction or supply in a specific year) for each option. This is illustrated in Example 3-5.

Step 3 – page 32 Guide to Demand Management
Example 3 - 5 Ranking options according to unit cost for supply-demand balance analysis
The example case study (Example 3–3), described a set of supply and demand-side options. Here, the details of the unit costs for individual options are provided. The costs and yield estimates shown in the table below (deficit reduction potential) are based on real examples, although in some cases, particularly the supply options, they will vary significantly with location.
Details of ranked options (White et al. 2007)
Based on the unit costs in the table, a supply curve can be prepared. The supply curve shows the unit cost of supply-side and demand-side options ranked relative to the cumulative reduction in the supply-demand gap (the deficit reduction) that would be expected from those options in 2015. This kind of representation can be used as a heuristic device to determine the investment required (vertical axis) to ensure supply and demand are in balance (horizontal axis).
For example, in this case, by 2015, it is expected that base case demand and yield will differ by 240,000 ML/a (240 GL/a). In other words, a combination of supply and demand-side options totalling 240,000 ML/a would need to be implemented before 2015 to ensure the supply demand balance. To achieve this a range of options will be needed including those with a unit cost in excess of $700/ML (i.e. weir raising).

Step 3 – Develop the Response
Guide to Demand Management Step 3 – page 33
Supply curve for example options

Step 3 – page 34 Guide to Demand Management
Step 3D Analys e grouped options and s cenarios Once a list of the various options ranked on relative cost and with their associated savings estimates has been established, the next step in the IRP process is the analysis of grouped options and scenarios (White et al. 2007). Analysis of grouped options (or a ‘suite of options’) involves:
• developing a robust least-cost response,
• testing the response in the face of potential future scenarios such as high population growth or climate change, and then
• optimising the response to create the preferred “suite of options” or “response”.
Fundamental to IRP is the goal of achieving the water related needs of a region or city at least cost to society and with minimal social and environmental impact. The analysis of individual options in Step 3C, and the selection of a portfolio of options with the lowest NPV (including quantifiable avoided costs) is core. Further to this, depending on the scope, analysis of options to identify a “preferred response” should also aim to consider:
• costs that cannot be readily monetised; and
• value judgements and trade-offs
A number of approaches are now being tested to attempt to consider these non quantifiable parameters. This Guide does not provide details of a single prescriptive approach to sustainability assessment but identifies where further details on where some of these approaches can be found.
3D (i) Dec ide on appropria te s cope of analys is Dependent on the scope of the analysis, a list of options ranked on unit cost may be sufficient to meet the objectives previously established in Step 2D and revisited in Step 3A (i), thus rendering Step 3D unnecessary.
Authors’ Note: Demand management feasibility study
A demand management feasibility study requires only a ranked list of demand-side options. This indicates the potential for cost effective demand management within the region. Such a list points to which options are ‘dead-set winners’ and which options call for a closer look. In this case, Step 3D the analysis of grouped options, is not justified.
In other cases, where a specific and detailed response to a long-term planning goal is needed, a more substantial level of analysis will be warranted where both supply and demand-side options need to be investigated and compared.
In most cases, a quantitative analysis of scenarios and uncertainties will be a feature of the development of a preferred set of options. However, assessment of options grouped as programs or portfolios will inevitably go beyond the scope of quantifiable parameters and qualitative assessment of some factors will require some form of informed deliberation, using a diverse stakeholder group.
The approach taken in a given assessment will depend on various factors such as:
• agreed scope, which will dictate the depth of analysis
• the policy context and favoured assessment practices of the utility or agency conducting the work
• the context and nature of the planning objectives set
3D (ii) Dec ide on as s es s ment approach and conduc t a s s es s ment Taking into consideration the agreed scope, context and planning objectives of any given region it will be necessary to agree on the sustainability assessment approach used. As previously indicated a number of approaches are emerging and have been tested to a limited extent. Some of these approaches are focussed on individual options and some on grouped options. A WSAA Occasional Paper which provides a framework for sustainability assessment in urban water was released in 2008 (Lundie et al. 2008).
Step 3 – Develop the Response
Guide to Demand Management Step 3 – page 35
Having decided on the sustainability assessment approach best suited to your situation the assessment needs to be conducted by appropriate stakeholders and the agreed suite of options taken forward for implementation as part of Step 4.
Further Reading: Sustainability Assessment for Australian Water Utilities
Lundie, S., Ashbolt, N., Livingston, D., Lai, E., Karrman, E., Blaikie, J., 2005b, Sustainability framework - methodology for evaluating the overall sustainability of urban water systems: UNSW for WSAA.
White, S., Fane, S., Giurco, D., & Turner, A., 2007, ‘Putting the economics in its place: decision making in an uncertain environment’, in Christos Zografos and Richard B. Howarth (Eds) Deliberative Ecological Economics, Oxford University Press (forthcoming).
Mitchell, C., Fane, S.,Willetts, J., Plant, R., & Kazaglis, A., 2007, Costing for Sustainable Outcomes in Urban Water Systems: A Guidebook, CRC for Water Quality and Treatment Research Report No. 35.
Ashley, RM., Blackwood, DJ., Butler, D., & Jowitt, P., 2004, Sustainable Water Services - A Procedural Guide, IWA Publishing.
Mitchell, VG., 2004, Integrated Urban Water Management: A review of current Australian practice. CSIRO Urban Water.
Taylor, A., 2004, Draft Guidelines for Evaluating the Financial, Ecological and Social Performance of Urban Stormwater Management Measures to Improve Waterway Health. Cooperative Research Centre for Catchment Hydrology.
Also of interest in relation to community engagement and deliberative processes:
Carson, L. & Hart, P, 2005 What Randomness and Deliberation can do for Community Engagement International Conference on Engaging Communities, Brisbane, Australia, 14-17 August [http://www.activedemocracy.net/ accessed 29 Oct 2006].
Carson, L & Hartz-Karp, J., 2005 Adapting and Combining Deliberative Designs
Juries, Polls, and Forums in J. Gastil, and P. Levine (Eds.) The Deliberative
Democracy Handbook: Strategies for Effective Civic Engagement in the Twenty-First
The Sustainability Assessment resource paper (Fane et al. 2010a) draws heavily on the WSAA Sustainability Framework (Lundie et al. 2008) in relation to the guidance it provides on multi-criteria decision processes. The WSAA Sustainability Framework lays out a step-by-step procedure for multi criteria assessment at various project scales with a focus on stakeholder involvement. The resource paper contrasts this approach to an approach based on the economic evaluation of externalities. Sub-section 5.3, also describes how multi-criteria decision processes might be utilised within the existing IRP framework.

Guide to Demand Management Step 4 – page 1
STEP 4 - IMPLEMENT THE RESPONSE

Step 4 – page 2 Guide to Demand Management
Figure 4 - 1 Step 4 - Implement the response
STEP 4: IMPLEMENT THE RESPONSE
4A Plan demand-side implementation
(i) Form stakeholder reference group
(ii) Identify demand management team
(iii) Develop budget plans
(iv) Develop a communication strategy
(v) Consider contractual arrangements
(vi) Identify training needs
(vii) Identify data gaps
(viii) Schedule monitoring and evaluation
(ix) Coordinate with other agencies
(x) Document implementation plan
Supply-side planning and implementation
(i) Feasibility study
(ii) Detailed design
(iii) Develop budget plans
(iv) Establish and implement community consultation strategy
(v) Environmental approvals
(vi) Calling tenders
(vii) Contract management
(viii) Commissioning
4B Undertake pilot program
(i) Determine implementation issues
(ii) Determine how to fill data gaps
(iii) Determine how to analyse and use new data
4C Implement full program
(i) Adjust implementation plan based on pilot findings
(ii) Conduct implementation activities

Step 4 – Implement the Response
Guide to Demand Management Step 4 – page 3
Step 4 Summary This chapter describes Step 4 in the IRP process, implementing the chosen response. The preferred response may include supply-side infrastructure development as well as a number of individual demand management programs. The Guide describes planning and implementation of the demand management component of the response.
Demand management is a complex process involving many actors. Most options will need to involve people from various organisations as well as technical elements. The effort required to prepare an effective demand-side implementation should not be underestimated. Figure 4-1 shows three main activities for this step. Step 4A describes ten activities to undertake, which together will form the implementation plan.
In the majority of cases, a plan will include a pilot program. The benefits of running a pilot are outlined in Step 4B, with information about how to undertake the pilot and aspects on which to focus. With results from the pilot, the team will be able to move to Step 4C, full-scale implementation.

Step 4 – page 4 Guide to Demand Management
Step 4A P lan demand-s ide implementa tion As with any major investment, sound planning is essential. Like supply-side projects, demand management program implementation involves a range of expertise from highly technical tasks through to consultation with the public or customer groups, and coordination of multiple stakeholders. Demand management programs may be needed to achieve a significant reduction target or fill a supply-demand gap over the next 5, 10 or 20 years. This means that they involve a number of stakeholders over a long implementation period. Hence it is critical to involve these stakeholders from a very early stage, plan all the aspects, document them and in most cases run a pilot before full implementation.
4A (i) Form s takeholder re fe rence group In planning for implementation the first step is to form a reference group that involves a broader group of stakeholders. The purpose is to:
• gain wider input to the process, beyond those stakeholders on the IRP steering committee if it has been limited for example to only water service provider staff
• gain experience and/or active participation from those external stakeholders who are likely to determine the success or failure of the whole program such as local plumbers and garden specialists.
The kinds of stakeholders involved will vary depending on the complexity of the suite of options forming the response, the roles and responsibilities of various agencies in the specific region and who is likely to pay or contribute funds for the various components of the proposed response.
Example 4 - 1 Kalgoorlie–Boulder Water Efficiency Program In 1995, a stakeholder group was formed for consultation purposes in Kalgoorlie-Boulder as part of the water efficiency program. It included representatives of the major trade allies (landscape, horticulture, plumbing, urban irrigation) and City Council, State agency, LandCare, public housing and Chamber of Commerce in addition to Water Corporation staff and contractors.
Similar reference groups involving a diverse group of stakeholders have since been set up for a number of years in locations such as Alice Springs to gain input from various parts of the community.
The importance of involving multip le s takeholders in p lanning the implementa tion phas e Firstly, the aim of the reference group is to ensure the various components of the preferred response are delivered as planned by those with the appropriate skills and authority. Secondly, the preferred response is likely to require new or modified regulations and/or legislation at national, state or local levels. Relevant stakeholders will need to be involved in this. Early involvement will be critical for gaining support from institutions and to clearly define roles and responsibilities. For demand management programs, the institutional arrangements will differ significantly to those already in place for the supply-side.
Thirdly, if the individual stakeholders are adequately informed and engaged in the development of the preferred response they can contribute to making it happen during the planning phase. For example, schools can request allocated funds from their respective government departments so they do not have to pay for water efficiency initiatives from their existing budgets. In this way, representatives are less likely to resist or put up barriers to the implementation of the preferred response.
Once new stakeholders are approached and have agreed to take part they should be briefed on the overarching IRP process, what is planned and their roles and responsibilities within it. As a minimum the reference group will meet on a regular basis throughout the implementation process to check the status of implementation against the agreed activities, timeframe and budget.
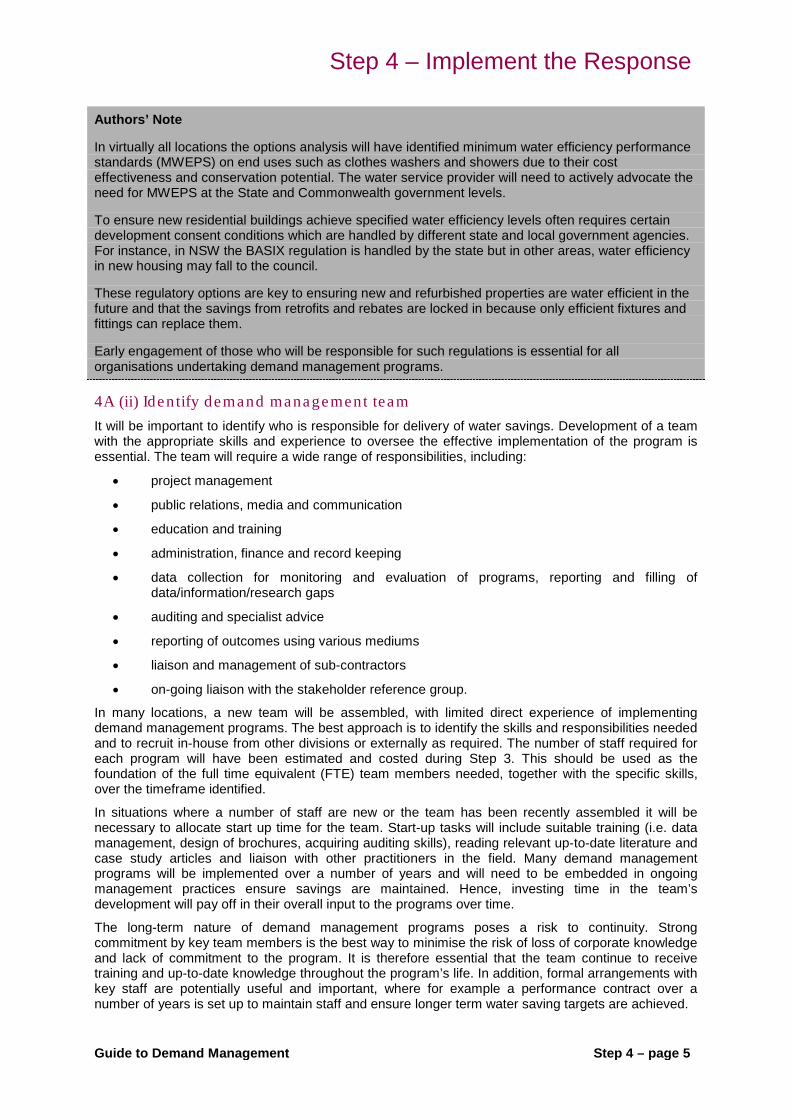
Step 4 – Implement the Response
Guide to Demand Management Step 4 – page 5
Authors’ Note
In virtually all locations the options analysis will have identified minimum water efficiency performance standards (MWEPS) on end uses such as clothes washers and showers due to their cost effectiveness and conservation potential. The water service provider will need to actively advocate the need for MWEPS at the State and Commonwealth government levels.
To ensure new residential buildings achieve specified water efficiency levels often requires certain development consent conditions which are handled by different state and local government agencies. For instance, in NSW the BASIX regulation is handled by the state but in other areas, water efficiency in new housing may fall to the council.
These regulatory options are key to ensuring new and refurbished properties are water efficient in the future and that the savings from retrofits and rebates are locked in because only efficient fixtures and fittings can replace them.
Early engagement of those who will be responsible for such regulations is essential for all organisations undertaking demand management programs.
4A (ii) Identify demand management team It will be important to identify who is responsible for delivery of water savings. Development of a team with the appropriate skills and experience to oversee the effective implementation of the program is essential. The team will require a wide range of responsibilities, including:
• project management
• public relations, media and communication
• education and training
• administration, finance and record keeping
• data collection for monitoring and evaluation of programs, reporting and filling of data/information/research gaps
• auditing and specialist advice
• reporting of outcomes using various mediums
• liaison and management of sub-contractors
• on-going liaison with the stakeholder reference group.
In many locations, a new team will be assembled, with limited direct experience of implementing demand management programs. The best approach is to identify the skills and responsibilities needed and to recruit in-house from other divisions or externally as required. The number of staff required for each program will have been estimated and costed during Step 3. This should be used as the foundation of the full time equivalent (FTE) team members needed, together with the specific skills, over the timeframe identified.
In situations where a number of staff are new or the team has been recently assembled it will be necessary to allocate start up time for the team. Start-up tasks will include suitable training (i.e. data management, design of brochures, acquiring auditing skills), reading relevant up-to-date literature and case study articles and liaison with other practitioners in the field. Many demand management programs will be implemented over a number of years and will need to be embedded in ongoing management practices ensure savings are maintained. Hence, investing time in the team’s development will pay off in their overall input to the programs over time.
The long-term nature of demand management programs poses a risk to continuity. Strong commitment by key team members is the best way to minimise the risk of loss of corporate knowledge and lack of commitment to the program. It is therefore essential that the team continue to receive training and up-to-date knowledge throughout the program’s life. In addition, formal arrangements with key staff are potentially useful and important, where for example a performance contract over a number of years is set up to maintain staff and ensure longer term water saving targets are achieved.

Step 4 – page 6 Guide to Demand Management
Authors’ Note
Historically, in many locations across Australia, a limited number of staff have been expected to plan and implement demand management programs in their area and in some cases continue part time to maintain their current position (e.g. as a supply-side options planner). Hence, realistic estimation of the staff requirements (FTE) during the development of options is essential as it not only provides an estimate of how many FTE are required, when and with what skills but it also allocates the necessary budget for people for adequate full time resourcing. Adequate staff together with appropriate training will be essential for the program to be successfully implemented on time, within budget and to achieve the desired planning objectives.
Key tasks of the team will include:
Program management • manage and control the overall program and individual programs including budget, timing,
synergies between programs, regular reporting of outcomes
• review, monitoring and evaluation of individual programs to assess effectiveness and the need for modification to increase savings, participation and/or customer satisfaction
• review overall program to assess achievement of planning objectives/goals
• document all actions undertaken and regular reporting
• identify, document and manage continuing information and research needs
• co-ordinate actions and results with supply-side management.
Communica tion , educa tion and lia is on • develop and co-ordinate the communication strategy, education material, distribution
channels
• liaise regularly with stakeholders and trade allies
• handle customer issues such as customer callbacks and complaints and set up the processes needed to manage these.
• validate training courses and accreditation so that contact with the public has a consistent approach and common voice.
Logis tic s and monitoring • set up liaison and contracts with suppliers to ensure sufficient appliances are available and
can be obtained at a reasonable cost
• recruit specialist staff/advice, release of tenders and set up of contractual arrangements with plumbers and other specialists
• implement individual programs carefully in line with the original design to prevent ‘cream-skimming’ of savings13
• control customer water efficiency action plans (e.g. hotels, institutional properties) associated with specific programs, sign off upon completion and provision of ongoing advice
.
• arrange retrofits/audits/rebates with customers and logging and data entry of retrofits information, including fixtures and fittings modified, to enable evaluation
• set up pilot programs including subsequent evaluation.
4A (iii) De ve lop budge t p lans As part of the options development in Step 3B, each individual program will have costs allocated for management, administration, marketing, direct program costs and ongoing costs. This breakdown
13 Cream-skimming is a common issue where the option design team is separated from those implementing the program. It is where, for example, the roll out of a showerhead program before an indoor retrofit, reduces the potential savings of a retrofit program.

Step 4 – Implement the Response
Guide to Demand Management Step 4 – page 7
gives a useful estimate of how much needs to be allocated to different areas of the program. The issue of ‘who pays’ will also have been considered as part of the options development.
Example 4 - 2 Public housing budget planning In the case of an indoor retrofit program specifically tailored for public housing, an arrangement could be set up that the housing department provide for the labour cost component of the program as it would need to cover a proportion of these costs under its normal maintenance program anyway. The rest of the program costs would need to be covered by the water service provider (e.g. funds for a project manager to liaise with the public housing team and to provide the costs for retrofitted items).
The plan for who pays and over what time period is needed to develop short and long-term budgets and to clearly show the cash flow implications for the stakeholders involved. For this purpose, it is useful to set up a one year, five year and overall program budget so short term funds can be released whilst providing an estimate of what will be required longer term by each stakeholder for each year and overall. The estimates developed in Step 3, in many cases will be limited to an estimate for the region in question, unless the team has implemented a demand management program in the past. These budgets will need to be refined over time in line with real costs and real participation rates. For example, if participation rates are found to be low, costs will likely increase due to the need to provide higher levels of incentives that may need to be borne by the water service provider.
To undertake full cash flow analysis, the water service provider will require this information together with the estimates of foregone revenue and avoided costs associated with reduced demand as discussed in Step 3A. From a Total Resource Cost perspective the preferred response may represent a sensible investment. However, when considering the cash flow incurred by the water service provider in isolation, the cash flow may be negative over much of the period considered. In such circumstances, the water service provider may need to be compensated by changes in the price of water or fixed charge to ensure revenue neutrality. The detailed modelling undertaken as part of Step 3B, budget plans and cash flow analysis conducted as a part of this step provides the evidence required to justify price pass through to a price setting regulatory authority.
4A (iv) De ve lop a communica tion s tra tegy Many national and international demand management programs have relied primarily on a communication strategy to obtain water savings through behaviour change. For measurable results a well designed, carefully planned and professionally implemented communication and education strategy can form a major part of a comprehensive demand management program. In isolation a communication strategy will achieve only limited savings and when the communication campaign stops there is risk that the savings will decay. Well-designed education programs as part of a comprehensive demand management program have the potential to influence community attitudes and behaviour in the long-term.
Techniques from the field of community-based social marketing can apply to water demand management strategies and it is these techniques that provide the basis for the methods described below. Equally, many other communication and education approaches exist that have had success in the environmental and sustainability fields, such as peer-based group learning.
Developing a communication strategy involves:
• understand your target audiences
• decide what changes you are encouraging – structural, technical or behavioural
• consider the barriers and benefits of the changes you are encouraging and use these to inform your design
• decide on the key messages
• choose the appropriate combination of materials or tools (flier, web content, media statements, prompts, training)
Step 4 – page 8 Guide to Demand Management
• seek exposure, including face-to-face opportunities (e.g. radio, television, internet, stalls at markets/festivals/shopping centres)
• timing
• costing and budget implications.
Further Reading
Doug Mackenzie Mohr – Community based social marketing http://www.cbsm.com
Social Change Media: Seven Doors Social Marketing Approach www.media.socialchange.net.au/strategy
The communication strategy will need to be carefully designed and targeted. When building upon an existing communication strategy and associated demand management programs, care should be taken to utilise the successes of the previous communication strategy and add momentum with a fresh identity but without giving mixed messages.
It will be essential that the program team, trade allies and various stakeholders involved in the overall program provide a consistent message, use a uniform and easily recognisable brand name and that the communication and education materials used are well presented, easy to understand, informative, practical and up-to-date.
With a demand management target, the communication strategy is likely to focus on:
• why there is a need for a demand management program, what the demand management target is, what will happen if it is not achieved and how this will affect the community as a whole
• what is being done to achieve the target in both the short and long term by the water service provider and other government authorities
• what the various sectors of the community can do to help in structural, technical and behavioural terms
• what programs are being offered to the community to assist them to help and how they can participate or find out more.
Unders tanding your ta rge t audiences The program will benefit from finding out what works best to get community participation in specific programs. This may require formal research using customer surveys/questionnaires or trial and error of a pilot program. When doing the preliminary research, it is useful to consider:
• the size of the region in question
• the specific program and sector being targeted
• whether demand management initiatives have already been implemented
• the speed at which participation is required
• the budget available
• how receptive the community is to the messages being provided.
Research tells us high participation rates could be achieved in the major centres across Australia with the right communication strategy and incentives. We have good numbers and receptiveness of people participating in saving water if assisted financially. Recent research by the CRC for Water Quality (2006) indicates that in most of the main cities across Australia, the level of awareness to issues around the need for demand management is relatively high. In other areas where restrictions have been in place even longer and at a lower level, participation rates could be equally high.
Educa tion and s chools Another aspect of the communication strategy can be through school-based education. Working directly with the education sector can be a long-term strategy in any region. All school curricula include some environmental education in the syllabus. This is an avenue for water efficiency messages to reach students of all ages, teachers and parents, if educators can match the content of their material

Step 4 – Implement the Response
Guide to Demand Management Step 4 – page 9
to curriculum learning outcomes. Water service providers working with their local schools can potentially achieve significant water savings in structural/technical changes, behavioural savings within the school, widespread and ongoing savings through education of the students, staff and parents in one program. School-based education will need specialist resources and time allocated.
Table 4-1 describes some of the communication and education tools that can be used.
Table 4 - 1 Communicative and educative tools Tool Description
Advertising campaign Uses various media such as radio, newspapers and television (when required).
Regular media releases Ensures up-to-date information by the demand management team reaches the media and public so data is accurately reported.
Print information For example, booklets/pamphlets/stickers covering the specific programs being offered.
Detailed informative material
Fact sheets on general subjects or specific program initiatives, for example: appropriate garden watering and plants for your area best practice guidelines for efficiency in hotels how to manage cooling tower water usage more effectively
Face to face communications
For example, public presentations, seminars and stalls at local events where the programs on offer can be advertised and easily offered to the public.
Workshops and training For example, gardening workshops for the public or training sessions for managers of hotels at a site that illustrates the costs and benefits of best practice water efficiency.
Publications For example, regular magazines or links to magazines produced by other areas that illustrate best practice water efficiency such as Sydney Water in NSW and Water Corporation in WA on the non-residential sector.
Competitions and awards Can target the both the residential and non-residential sectors.
Direct marketing Mail out and point-of-sale vouchers and information for general and target groups.
Billing information A redesign of bills can show how a customer is tracking compared to a standard house in each season.
Phone hotline A general enquiry telephone number for information on promotions, booking audits and where to get further advice.
Training materials To provide to trade allies, auditors and specialists.
Web site Can be a clearinghouse for all the information produced for various sectors of the community. It needs to be informative, easy to navigate and up-to-date.
4A (v) Cons ide r contrac tua l a rrangements As part of the implementation planning and detailed refinement of the options, it will be necessary to consider the contractual arrangements for individual programs. This will be dependent on the local context, the management style of the team and their skills. These aspects may have already been considered in the options design phase when establishing costs. If the implementation team differs from the design team, it will be important to facilitate communication to make sure work is not unnecessarily repeated or design ideas lost.
In many cases it will be appropriate to put parts of programs to tender and contract out the work involved. For any tender or contract, the team needs to ensure:
• clear terms of reference for the service
• understanding of the service and expectation by the whole contracted group
• clear equipment specifications
• occupational health and safety measures are undertaken
• an allowance for auditing by the demand management team.

Step 4 – page 10 Guide to Demand Management
When contracting, it is worth considering what role the demand management team will play in terms of how hands-on or active they will be. Options include:
• contracting an entire project to an external party for a unit price
• tendering to a local organisation
• tendering to an interstate organisation if the expertise is not available locally
• putting out calls for interest for individual contractors to form a local team
• team members conducting work themselves (e.g. for audits)
• secondment of expertise into the water service provider.
The water service provider is more likely to take an active role in the process in the non-residential sector, which requires ongoing liaison with businesses. Different approaches to contracting in the residential sector are illustrated in the following example.
Example 4 - 3 Contracting for an indoor residential retrofit An indoor residential retrofit program is likely to form part of the overall demand management program. Typically, the work would be contracted out to a national or local team of plumbers that give a unit price for a visit to a customer and unit costs for individual items installed. In this kind of contractual arrangement, it is essential to ensure that:
- the plumbing team undertaking the retrofits receive training on what is expected during a household visit so there is a level of consistency in the team and a shared understanding of what is expected of them and what is not acceptable;
- the equipment being installed is well specified in the contract to ensure only those products deemed acceptable by the demand management team are installed;
- an allowance is made by the demand management team to audit a proportion of the households visited to act as quality control on a variety of aspects of the retrofits (e.g. customer satisfaction of the products installed and plumber providing the service, to check that the specified equipment is being installed, that the equipment that is logged as installed is actually installed and that the plumber records are accurate).
This arrangement works well for large-scale programs such as the original Every Drop Counts Residential Retrofit Program that has been implemented on over 300,000 households since 2000.
Rather than tendering the program to a particular company, the team may release an expression of interest for local plumbers to participate in the program on behalf of the water service provider. In this case the plumbers could undergo training leading to accreditation which would enable them to trade under the local brand name of the demand management program. The water service provider could then arrange retrofits with the pool of accredited plumbers as required.
This form of arrangement works well in smaller urban centres where capacity building in the local community is considered important.
Another example of how a water service provider can be more actively involved in an indoor residential program is when negotiating a bulk purchase. For example, in the case of retrofitting dual flush toilets, the cost of the program could be significantly reduced if toilets could be bulk purchased by the water service provider rather than relying on individual local plumbers to purchase them.
Step 4 – Implement the Response
Guide to Demand Management Step 4 – page 11
4A (vi) Identify tra in ing needs Several forms of training may be required before and during the implementation of the program. It is likely to split into three main categories:
• the demand management team (e.g. in non-residential auditing, in new database software to collect and analyse data)
• external collaborators/trade allies (e.g. plumbers to effectively undertake residential retrofit programs, garden specialists for residential garden advisory visits and public workshops)
• individual customer types as part of the individual programs (e.g. training of hotel staff in best practice management to save water and garden workshops for saving water in residential and non-residential gardens).
The formats used for such training could range from a single workshop to a guided certification program with associated printed training materials where training occurs over a series of sessions.
In each case, some form of budget allowance should have been made in Step 3B. It is essential to identify the logistics of providing this training (e.g. who will provide the training, what material will be used, when and where) at the earliest point in the planning.
4A (vii) Identify da ta gaps Steps 2 and 3 are likely to have raised issues that might affect the accuracy of the analysis undertaken and/or affect implementation of the individual programs. For example, there may be uncertainty about how hard water deposits in an area may affect the performance of 3 star rated showerheads. In this step, the knowledge gaps are identified and collated so that actions can be considered and where appropriate those gaps filled as accurately and cost-effectively as possible.
The knowledge gaps should be prioritised in line with any sensitivity analysis that has been undertaken. In the case of demand forecasting, it is often useful to identify the proportion of water associated with a particular end use or sector. This can help to focus further data collection/research in those areas that use the greatest volume of water and have the largest potential errors. It also minimises the risk of water service providers concentrating limited resources in less important areas.
The demand management team should map the data/information required at this step. This will identify opportunities for collecting data/information that can be built into pilots as part of the implementation schedule. Pilots can provide a very low cost means of filling gaps as well as testing the implementation of individual programs. Refer to Step 4B for further details.
4A (viii) Schedule monitoring and eva lua tion To ensure the individual programs are going according to plan, a schedule for monitoring and evaluation of each of the individual programs should be identified. The implementation plan should include:
• timing of evaluations
• what needs to be evaluated
• the methods that will be used
• the data that will need to be collected and the method of storage.
As part of the costing of options, under Step 3B, resources in terms of staff costs should have already been allocated as part of the project budget. Monitoring and evaluation is an essential step of the IRP process, which is currently overlooked by many demand management teams. Ensuring resources are made available (as part of Step 3B) and scheduling identified (as part of Step 4A) will assist in making sure this vital step is undertaken. Further details of evaluation and monitoring are provided under Step 5.
4A (ix) Coordina te with o the r agenc ies Depending on the region, the implementation plan may overlap with the work of other agencies implementing water saving initiatives. In such cases, it will be essential to develop a mechanism for

Step 4 – page 12 Guide to Demand Management
keeping track of water savings achieved from other agencies’ programs, as this will affect the overall supply–demand balance.
Consequently, it will be necessary to contact agencies up-front and discuss an agreed approach for collecting and sharing information. The aim will be to make data formats as compatible as possible in order to minimise the time and potential errors involved in transferring data between agencies. Privacy laws and ethical corporate behaviour relating to the sharing of customer information and data must also be considered.
Example 4 - 4 Metropolitan Water Directorate for the Greater Sydney Region A diverse group of authorities can be associated with water planning as shown in the greater Sydney region. Implementing the city's water plan for the future is overseen by the Metropolitan Water Directorate of the Cabinet Office. It publishes the Metropolitan Water Plan (www.waterforlife.nsw.gov.au) and works with agencies to ensure delivery on each associated component. The Metropolitan Water Plan 2006 embraces the principles of adaptive management (the regular updating of the plan to reflect new information). The complex group of agencies involved in contributing to the Metropolitan Water Plan at that time is listed below, with their roles and responsibilities.
Agency Responsibility Sydney Catchment Authority Supplies bulk water on a day-to-day basis, protects raw water
quality through the management of the drinking water inner catchments and protection actions in the wider catchments
Sydney Water Corporation Treats the bulk water in its filtration plants and delivers it through the distribution network, manages wastewater, implements a wide range of programs to increase water efficiency and recycling
Dept of Energy, Utilities and Sustainability
Administers the Water Savings Fund, Water Savings Action Plans, develops guidelines on recycling
Dept of Planning Implements BASIX to reduce water use in dwellings
Dept of Environment Licenses wastewater treatment plants and develops policy and conservation settings to protect river health
Dept of Natural Resources Allocates water for urban consumption, irrigation and environmental water (through water sharing plans and licensing)
Dept of Health Protects public health through appropriate water quality standards
Dept of Primary Industries Promotes water efficiency in the agricultural sector
Independent Pricing & Regulatory Tribunal
Determines prices for water and wastewater, responsible for Sydney Water Corporation’s operating licence and annual audits of compliance with targets including demand management
The Cabinet Office Central coordination across agencies of water planning for the Metropolitan Water Directorate greater Sydney metropolitan region
4A (x) Document implementa tion p lan The implementation plan is the key document describing who, what, where, when and how the preferred response will be implemented. When documented, Steps 4A (i) to (ix) will be a focal point during implementation and evaluation.
Implementation will often have two levels depending on the complexity of the overall program being delivered and the stakeholders involved:
• an overarching plan across all programs where a water service provider takes the responsibility to undertake and implement the majority of individual programs
• individual action plans for particular programs or sectors (i.e. in Sydney, where the funding level is high and funding arrangements, agencies involved and tasks needed to achieve the required target are complicated (NSW Government 2006)).
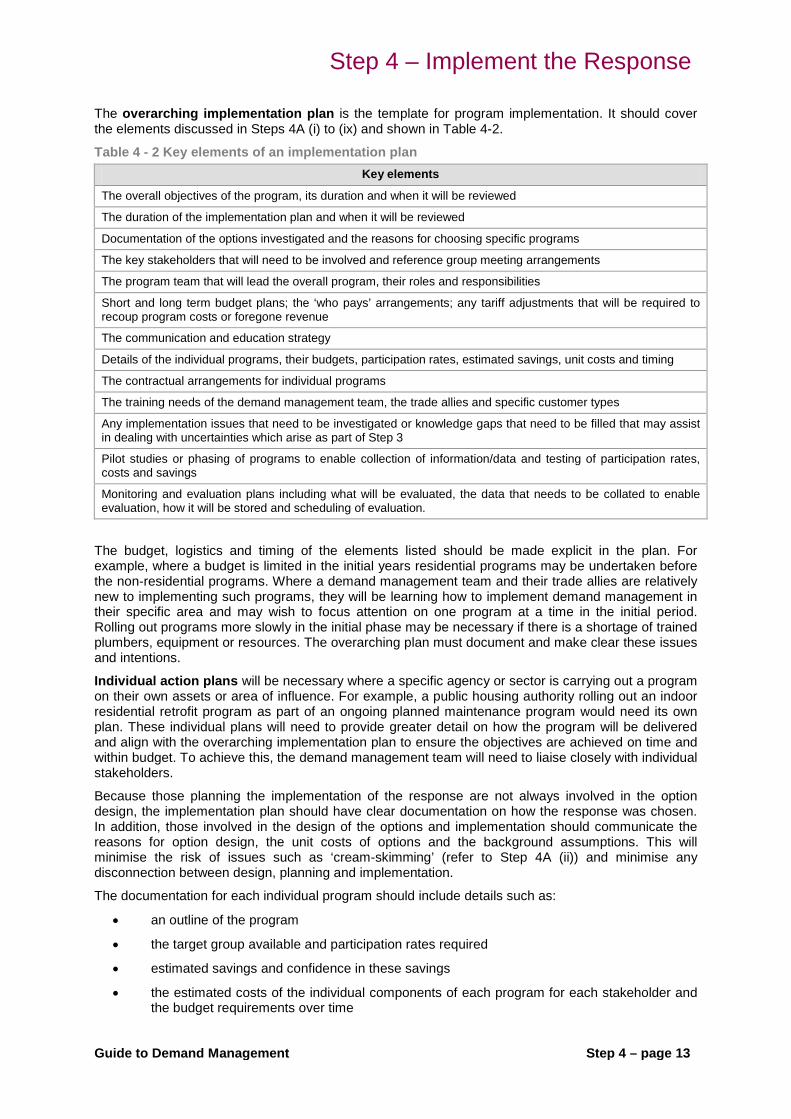
Step 4 – Implement the Response
Guide to Demand Management Step 4 – page 13
The overarching implementation plan is the template for program implementation. It should cover the elements discussed in Steps 4A (i) to (ix) and shown in Table 4-2.
Table 4 - 2 Key elements of an implementation plan Key elements
The overall objectives of the program, its duration and when it will be reviewed
The duration of the implementation plan and when it will be reviewed
Documentation of the options investigated and the reasons for choosing specific programs
The key stakeholders that will need to be involved and reference group meeting arrangements
The program team that will lead the overall program, their roles and responsibilities
Short and long term budget plans; the ‘who pays’ arrangements; any tariff adjustments that will be required to recoup program costs or foregone revenue
The communication and education strategy
Details of the individual programs, their budgets, participation rates, estimated savings, unit costs and timing
The contractual arrangements for individual programs
The training needs of the demand management team, the trade allies and specific customer types
Any implementation issues that need to be investigated or knowledge gaps that need to be filled that may assist in dealing with uncertainties which arise as part of Step 3
Pilot studies or phasing of programs to enable collection of information/data and testing of participation rates, costs and savings
Monitoring and evaluation plans including what will be evaluated, the data that needs to be collated to enable evaluation, how it will be stored and scheduling of evaluation.
The budget, logistics and timing of the elements listed should be made explicit in the plan. For example, where a budget is limited in the initial years residential programs may be undertaken before the non-residential programs. Where a demand management team and their trade allies are relatively new to implementing such programs, they will be learning how to implement demand management in their specific area and may wish to focus attention on one program at a time in the initial period. Rolling out programs more slowly in the initial phase may be necessary if there is a shortage of trained plumbers, equipment or resources. The overarching plan must document and make clear these issues and intentions.
Individual action plans will be necessary where a specific agency or sector is carrying out a program on their own assets or area of influence. For example, a public housing authority rolling out an indoor residential retrofit program as part of an ongoing planned maintenance program would need its own plan. These individual plans will need to provide greater detail on how the program will be delivered and align with the overarching implementation plan to ensure the objectives are achieved on time and within budget. To achieve this, the demand management team will need to liaise closely with individual stakeholders.
Because those planning the implementation of the response are not always involved in the option design, the implementation plan should have clear documentation on how the response was chosen. In addition, those involved in the design of the options and implementation should communicate the reasons for option design, the unit costs of options and the background assumptions. This will minimise the risk of issues such as ‘cream-skimming’ (refer to Step 4A (ii)) and minimise any disconnection between design, planning and implementation.
The documentation for each individual program should include details such as:
• an outline of the program
• the target group available and participation rates required
• estimated savings and confidence in these savings
• the estimated costs of the individual components of each program for each stakeholder and the budget requirements over time

Step 4 – page 14 Guide to Demand Management
• the timing of each program, lead in time and duration of program
• the stakeholders and trade allies that need to be involved.
Much of this will have been considered in detail in Step 3 and will have been documented in an options design report and associated modelling tool such as the iSDP model (i.e. assumptions, participation rates, unit costs, who pays etc.). However, documentation in the implementation plan ensures that this level of detail has been considered adequately, refinement of the options is undertaken and checking that all necessary details are available.

Step 4 – Implement the Response
Guide to Demand Management Step 4 – page 15
Step 4B Undertake p ilo t program Undertaking a pilot for each individual program before full-scale implementation is an extremely useful way of testing various components of the program. Even with an experienced team, it is often worthwhile ironing out any implementation issues and checking whether the program provides the desired outcomes before committing to the full program.
Step 4A (vii) will have identified which data/information gaps need to be filled, what sample size might therefore be needed and how the information can be best collected and stored. In addition, a pilot program design will include:
• what other information is to be collected
• how information will be analysed and where and by whom it will be used
• which evaluation method will be used and when.
Piloting enables the demand management team to decide whether a full-scale program will work and achieve the necessary outcomes required in the specific area in question. With testing and preliminary evaluation, the demand management team can modify or improve the implementation of the individual programs to get the best outcomes. Without piloting, there is a risk that significant investment could be wasted in an ineffective program.
4B (i) De te rmine implementa tion is s ues Before conducting a pilot, it is essential to identify exactly what needs to be tested and evaluated and how the pilot information will be collected and documented. In many cases, demand management teams are so focused on implementing the programs that documentation of ‘what works’ and ‘what doesn’t’ is not adequately captured. As team members subsequently move to other divisions in the organisation, this essential knowledge is often lost.
Implementation issues that would be worthwhile investigating include:
• project management and contractual arrangements
• staff and materials used for training
• the effectiveness of the communication strategy (e.g. is the strategy using the most appropriate medium, providing sufficient information, attracting the target group desired?)
• the characteristics of the equipment being installed (e.g. quality, ease of installation, customer perceptions)
• the method and logistics of program delivery (e.g. in the case of a showerhead rebate program should the rebates be offered at point of sale, or tied to installation?)
• the team implementing the individual program (e.g. a contractor)
• the uptake rate or participation rate associated with a specific incentive (e.g. is the incentive provided enough to gain the participation rates expected or required?).
Piloting is extremely useful for providing preliminary evaluation and monitoring information to check whether the desired outcomes are being obtained. These include:
• customer satisfaction
• participation rates
• costs
• water savings.
See Step 5A for further details on monitoring and evaluation.

Step 4 – page 16 Guide to Demand Management
4B (ii) De te rmine how to fill da ta gaps Pilots and phasing are an extremely useful and often low cost method of collecting data/information that is required for demand forecasting and options development as indicated in 4A (vii). At the same time as assessing implementation issues listed in 4B (i), the pilot can:
• provide ‘ground truthing’ of assumptions used in the demand forecasting and options analysis
• help to refine demand forecasting
• refine the options analysis based on real data from the region in question and not data from other areas
• use a variety of methods to get information including questionnaires
• capture behavioural information with greater accuracy.
Example 4 - 5 Collecting data from residential dwellings during a pilot program Various sources (i.e. ABS) can be used to provide information such as the proportion of efficient and non-efficient fixtures and fittings in households. This can be verified when undertaking a residential retrofit program.
This was done for the ACT water efficiency program in 2004/05. During the visits the plumber collected data on:
the fixtures and fittings in the household before and after the retrofit
additional measurements (e.g. leaks in toilets, the flow rate of the original and new 3 star rated showerheads including allowance for ‘throttle back’).
The information gathered was used to inform the implementation of the residential retrofit program. It was also used in 2006/07 to develop the sector/end use-based demand forecast and revised options within the iSDP model.
The data collected has been useful in terms of knowing for example:
1) the actual proportion of inefficient showerheads in households to confirm the conservation potential and potential participants that can be targeted
2) the flow rate of appliances to assist in determining the flow rate of efficient and non-efficient appliances in the demand forecast and how much the flow rate can be reduced (e.g. high pressure zones can provide higher levels of savings).
Building in extra time for a plumber to collect this data was a very cost effective way of improving the program outcomes and collecting data for the sector/end use-based demand forecasting model.

Step 4 – Implement the Response
Guide to Demand Management Step 4 – page 17
Example 4 - 6 Understanding regional behavioural differences through a pilot program Behavioural patterns can differ between regions. Hence, although data sources such as ABS can provide this information, it needs to be verified if possible through primary data collection. Those designing and implementing demand management programs will need to obtain information for example on the number of loads of washing done per week or the number and duration of showers per person per week.
In many cases, asking direct behavioural questions has risks because people’s reported activity is often different to their actual behaviour. Well-designed supporting information provided during a pilot study can reduce the potential of participants guessing. For example, water resistant logbooks placed next to the clothes washer, similar logbooks and stop watches placed in the shower unit have been used in a number of pilot studies. Care still needs to be taken with the results, as the Hawthorne Effect could potentially affect the participant14
When collecting data and information, care needs to be taken in collection and storage to facilitate subsequent analysis. It is important to assist those collecting the data to do so in the quickest and most efficient means possible. This will make the task of collecting additional data easier and less expensive, increase the accuracy and reduce the potential for human error in collection and analysis. For example, cases exist where data has been collected using laptop computers (i.e. in the Yarra Valley Water region) that use drop down lists to enter details of specific appliance models rather than handwriting. It may take more effort to set up the survey or questionnaire in an electronic format and it will cost extra for plumbers to have such equipment with them during the pilot/first phase of the program but if designed well, will ultimately save in data transfer, manipulation and analysis time. It will reduce the risk of human error during each of these steps.
. More methods to collect data/ information are provided in Step 2B (ix).
The sample size required will be dependent on the focus of the data/information being collected, the number of properties in the region and the specific program in question. For example in the case of collecting data/information for single residential households on both structural/technical water using equipment and behavioural water using practices whilst undertaking a residential indoor retrofit, it is common to use a sample size of approximately 400 randomly selected properties.
Authors’ Note
Care must be taken to ensure the plumbers or those requested to collect the information are fully informed as to why the data is being collected and the importance of accuracy in documentation. Poor data collection can result in low confidence in the information collected, which may result in the data needing to be collected again, thus wasting time and resources.
When collecting data to inform a sector-based or end use-based demand forecasting model the customers should be asked for permission for their water meter readings to be used. A combination of inspections in the home of the structural/technical equipment, carefully structured behavioural questions and the analysis of water meter readings is an extremely useful and low cost method to verify data from other sources. Better data will increase the accuracy of modelling.
4B (iii) De te rmine how to ana lys e and us e new da ta Data analysis, use and storage will be dependent on what data is collected and for what purpose.
When testing aspects of the program implementation, data collection and analysis should be straightforward. The information can be used to directly inform decisions on how to improve the program.
When collecting data/information to fill knowledge gaps in the demand forecasting model (e.g. an iSDP model) the team should carefully consider what data to collect and how it will be put into the model to minimise the risk of obtaining unnecessary information that cannot be used. The analysis of this data will take time and likely require the use of pivot tables if using a spreadsheet environment.
14 The Hawthorne Effect describes a phenomenon that occurs when people change their behaviour due to awareness of that behaviour being studied; for example, they save more water than usual while their water use is being monitored.

Step 4 – page 18 Guide to Demand Management
When collecting data to analyse the effectiveness of a program (i.e. customer satisfaction, participation rates, costs, water savings) this requires a number of different techniques to both collect the data and analyse it. Step 5 provides details on these issues.
Tips on evaluating and monitoring the effectiveness of pilots and the first phase of a program include:
• carry out evaluation/monitoring as soon as meter readings are available. Within the first year of the intervention, potentially three full quarters of data will be available for quantitative analysis of savings.
• the reliability of the information for savings will be dependent on sample size (refer to Step 5).
• other information on customer satisfaction, participation rates and costs can be collected relatively quickly after the pilot/first phase of the program has been conducted and should be used to inform how the full program is implemented and the options design and modelling refined.

Step 4 – Implement the Response
Guide to Demand Management Step 4 – page 19
Step 4C Implement fu ll p rogram 4C (i) Ad jus t implementa tion p lan bas ed on p ilo t find ings The pilot or first phase of individual programs will provide new insight into how to improve the full-scale implementation process. It is therefore important to return to the documented implementation plan and update it based on the findings from the pilot program and taking into account any external factors that may have changed (for instance program drivers or regulatory environment) since the pilot began. This re-assessment could take the form of a pre-implementation meeting.
4C (ii) Conduc t implementa tion ac tivitie s The following points provide a guide to conducting the implementation of the full program:
• carry out the implementation plan according to agreed time-line
• continue to coordinate activities and individual programs with relevant stakeholders
• have regular meetings of the demand management team
• have scheduled interaction with stakeholder reference group
• conduct necessary monitoring processes to allow evaluation as scheduled
• monitor budget and cash flow.
As the implementation phase of the demand management program may last several years it will be important to communicate with the public what is intended in the implementation phase and how it is tracking. This reporting to the community and other stakeholders may be a regulatory requirement or a proactive action taken on the part of the water service provider. The Water Conservation and Recycling Implementation Report (Sydney Water Corporation 2009)15
, which is updated each year, provides a good example of what can be included in such a document.
15http://www.sydneywater.com.au/Water4Life/WhatSydneyWaterIsDoing/Initiatives.cfm
Guide to Demand Management Step 5 – page 1
STEP 5 - MONITOR, EVALUATE & REVIEW

Step 5 – page 2 Guide to Demand Management
Figure 5 - 1 Step 5 Monitor, evaluate and review
STEP 5: MONITOR, EVALUATE AND REVIEW 5A Monitor and evaluate individual programs
DEMAND SIDE SUPPLY SIDE
Pilot and full-scale implementation
(i) Monitor and evaluate outcomes and processes in residential sector
(ii) Monitor and evaluate outcomes and processes in non-residential sector
(i) Monitor performance and yield of options
(ii) Review options as part of the portfolio, including operating rules
5B Monitor and evaluate full suite of programs
(i) Compare advantages and disadvantages of programs
(ii) Analyse how programs collectively meet planning objectives
5C Review of IRP process
(i) Decide focus and scope of the review
(ii) Collate relevant information documented during the IRP process
(iii) Talk to people involved in IRP process
(iv) Analyse and reflect on the information collected
(v) Disseminate the results of the review

Step 5 – Monitor, Evaluate & Review
Guide to Demand Management Step 5 – page 3
Step 5 Summary Step 5 considers monitoring, evaluation and review, key steps within IRP. Repeated review and adjustment allows adaptive management, a central principle of the IRP process. IRP processes take place within a changing landscape of interaction between policy and politics. This results in changes in priorities, as well as constraints in timing, budgets and resources. Although monitoring and evaluation requires significant resources, its value and importance cannot be understated. The reason monitoring and evaluation of demand management programs is so important are that they provide vital feedback on which investments are yielding the greatest returns in terms of water savings, and which are not. By better understanding what works and what doesn’t, programs may be modified resulting in strong financial and investment advantages.
As indicated in Figure 5-1, assessment is needed at three levels:
• an individual program (option) level (Step 5A) including:
outcomes (i.e. water savings, total costs, unit costs, participation rates, customer satisfaction)
processes (i.e. ease of implementation, program design etc.) • overall response level to determine the extent to which planning objectives or specific targets
are being achieved (Step 5B)
• the IRP process as a whole (Step 5C).
The monitoring, evaluation and review associated with Steps 5A to 5C must be embedded at the appropriate place within the IRP process. In Step 1 consideration of review of the overall IRP process will have been discussed and appropriate documentation to facilitate this set up. In Step 4A, review of individual pilots and programs (including identification of the metrics or performance indicators for program effectiveness), the overall response and the IRP process as a whole was discussed and appropriate actions and documentation set up as part of the implementation plan to enable this to happen at agreed points in time.
During Step 5, it will be helpful to consult with the following Resource Papers: Techniques for estimating water saved through demand management and restrictions (Fyfe et al. 2010a). Water practitioners are provided a broader understanding of the various analytical techniques that can be used depending on data availability. This resource paper specifically deals with quantifying the water savings achieved in demand management programs, similarly assisting water service providers to improve programs, but also enabling them to determine whether they have achieved their desired goal or target in reducing water demand and inform cost effectiveness analysis.
Incorporating climate change into Urban Water Integrated Resource Planning (Fane et al. 2010b). Specifically Section 6 which considers how climate change and climate uncertainty increase both the range of parameters that water utilities and water planners need to monitor and evaluate, as well as the frequency of review.
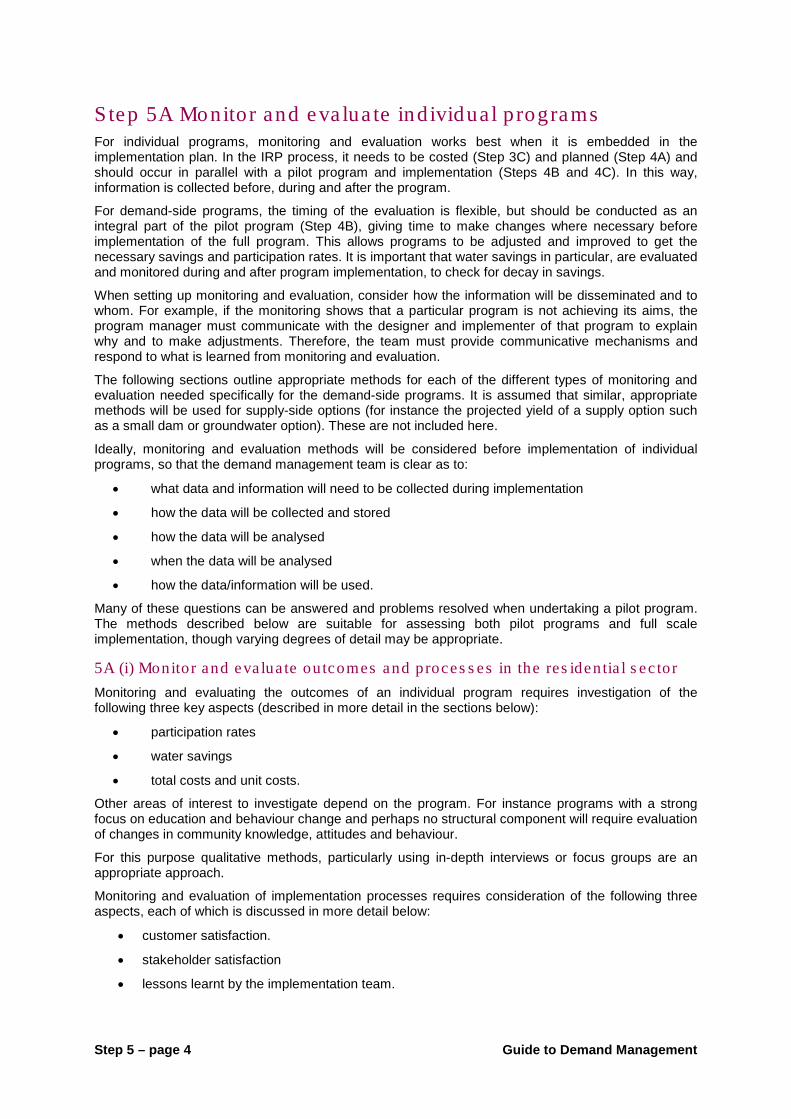
Step 5 – page 4 Guide to Demand Management
Step 5A Monitor and e va lua te individua l programs For individual programs, monitoring and evaluation works best when it is embedded in the implementation plan. In the IRP process, it needs to be costed (Step 3C) and planned (Step 4A) and should occur in parallel with a pilot program and implementation (Steps 4B and 4C). In this way, information is collected before, during and after the program.
For demand-side programs, the timing of the evaluation is flexible, but should be conducted as an integral part of the pilot program (Step 4B), giving time to make changes where necessary before implementation of the full program. This allows programs to be adjusted and improved to get the necessary savings and participation rates. It is important that water savings in particular, are evaluated and monitored during and after program implementation, to check for decay in savings.
When setting up monitoring and evaluation, consider how the information will be disseminated and to whom. For example, if the monitoring shows that a particular program is not achieving its aims, the program manager must communicate with the designer and implementer of that program to explain why and to make adjustments. Therefore, the team must provide communicative mechanisms and respond to what is learned from monitoring and evaluation.
The following sections outline appropriate methods for each of the different types of monitoring and evaluation needed specifically for the demand-side programs. It is assumed that similar, appropriate methods will be used for supply-side options (for instance the projected yield of a supply option such as a small dam or groundwater option). These are not included here.
Ideally, monitoring and evaluation methods will be considered before implementation of individual programs, so that the demand management team is clear as to:
• what data and information will need to be collected during implementation
• how the data will be collected and stored
• how the data will be analysed
• when the data will be analysed
• how the data/information will be used.
Many of these questions can be answered and problems resolved when undertaking a pilot program. The methods described below are suitable for assessing both pilot programs and full scale implementation, though varying degrees of detail may be appropriate.
5A (i) Monitor and eva lua te outcomes and proces s es in the res identia l s ec tor Monitoring and evaluating the outcomes of an individual program requires investigation of the following three key aspects (described in more detail in the sections below):
• participation rates
• water savings
• total costs and unit costs.
Other areas of interest to investigate depend on the program. For instance programs with a strong focus on education and behaviour change and perhaps no structural component will require evaluation of changes in community knowledge, attitudes and behaviour.
For this purpose qualitative methods, particularly using in-depth interviews or focus groups are an appropriate approach.
Monitoring and evaluation of implementation processes requires consideration of the following three aspects, each of which is discussed in more detail below:
• customer satisfaction.
• stakeholder satisfaction
• lessons learnt by the implementation team.

Step 5 – Monitor, Evaluate & Review
Guide to Demand Management Step 5 – page 5
Meas ure pa rtic ipa tion ra tes The measurement of participation rates is important to determine:
• how the program is tracking against its required up-take rate over the specified period
• if participation rates are lower than required, to prompt the program manager to find out why and decide (a) if it is appropriate to attempt to increase the up-take rate and (b) what needs to happen in order to increase uptake rate. For example, to modify the advertising campaign, to increase the incentives provided to the customer or to modify the program in ways such as providing an out-of-hours service.
It may be useful to define a critical threshold above which further investment or effort is unlikely to yield marginal returns or water savings in terms of uptake. A plot of investment versus uptake often demonstrates a response curve that tapers off and suggests that further investment might not be worthwhile.
Measuring participation rates in the pilot or first phase of a program can iron out some of the issues that might be behind low participation rates. In some cases, a pilot might be used to decide not to proceed with a program. Following participation rates over the course of a program indicates what level of saturation might be achieved. For example, in the Sydney Water Corporation ‘Every Drop Counts Residential Retrofit Program’ (now called Waterfix), over 500,000 households have been retrofitted. SWC decided to modify the program at one point slightly to include modified slightly to include a premium range of showerhead products to attract a slightly different market segment to maximise the up-take of the program as a whole.
Collecting participation rates can be as simple as tracking the details of retrofits in the customer water meter database or a linked database. To measure the water savings of specific measures, a range of details will be required.
Data/information you will need:
A unique water service provider property identifier.
Street address.
Customer identifier.
Occupancy rate at time of retrofit.
Types of major water-using appliances in the home (i.e. front- or top-loader, rainwater tank).
The details of what was modified, (e.g. leaks in toilet, toilet displacement device, showerhead in one or more bathrooms, tap regulators in kitchen and bathroom taps etc.).
A range of participation details can be recorded and presented using GIS, as shown in Example 5-1.

Step 5 – page 6 Guide to Demand Management
Example 5 - 1 Gold Coast Rain Tanks
Participation rates for rainwater tank rebates were assessed to evaluate what savings were attributable to a range of programs in the Gold Coast region. The information was linked with GIS data to develop a graphic representation of the range of up-take rates across the Gold Coast Water service area (Snelling et al. 2006).
This kind of visual representation can inform the demand management team of up-take rate, where up-take rate may be high or low due to demographic characteristics (highlighting where a slightly different marketing and/or communication strategy may be required), the level of savings being achieved and whether they are statistically significant.
In cases where, for example, showerhead rebates or exchange programs are provided participants must be recorded. In these cases, it will be necessary to check if participants have actually installed the devices. A risk with rebates is that while the participant had the intention to fit the new water efficient fixture or fitting, some barrier has prevented them from actually installing the device. In these circumstances, the conservation potential has been lost whilst the costs of the program have still been accrued, thereby increasing the unit cost of the program through reduced savings.
Exchange programs are a means of forcing customers to actually install the device. Another means of ensuring installation and to reduce barriers is to implement a retrofit program where the plumber provides the showerhead and installs it.
Where possible, a random sample of participants in a rebate or exchange program should be contacted (e.g. by phone or other survey/audit method) to check whether they have actually installed

Step 5 – Monitor, Evaluate & Review
Guide to Demand Management Step 5 – page 7
the device and if not, what the barriers are and what might be done to overcome them. This is necessary for programs such as the Sydney Water Corporation DIY program that provides a kit for householders to install showerhead and tap regulators themselves.
To analyse the water savings from programs, it is important to know both the participation rate in terms of obtaining particular devices or claiming rebates etc. and the actual participation rate where the devices are installed, as these may be very different and thus provide very different results for the calculated level of savings achieved. For example if 100% of participants install a 3 star rated showerhead then savings are likely to be approximately 15 kL/household/annum. However, if only 50% of households actually install the appliances the savings would halve in terms of per household savings for the overall program. In some schemes, there is an energy and associated greenhouse gas reduction being credited (e.g. as part of the NSW/ ACT Greenhouse Gas Abatement Scheme16
Contacting a proportion of participants to check whether they have installed particular devices is a good opportunity to collect further information on the customer perspective, which is discussed further below in the section on measuring customer satisfaction.
); this will affect the economics of the activity.
Meas ure wa te r s avings Measuring water savings post implementation is vital. It not only ensures that the actual savings from each program implemented are as or better than estimated but also facilitates evaluation of the cost effectiveness of each program implemented as discussed later in this section. By measuring the actual water savings and unit costs water service providers are in a more informed position to learn from, improve or if necessary cut individual demand management programs or elements thereof that are not performing.
Significant investment has been directed to demand management over recent years especially during recent droughts where water service providers have found that they can gain major long and short term savings. However, despite high levels of investment there is little evidence of evaluation of the actual water savings being achieved.
Several evaluation techniques are available including: basic before-after tests, various participant-control means comparison methods and regression analysis. An example of one of these is briefly identified in Example 5.2. Each technique, which use customer metered data, have varying advantages, disadvantages and specific data, scale and/or time requirements. These need to be considered carefully before embarking on data gathering and analysis.
The temporal scale of the customer metered data is an important aspect of studies evaluating water savings post implementation of a conservation program. For example, monthly demand data may be required when attempting to quantify seasonality in water savings from outdoor programs. However, the obtainment of such data is often made difficult by the fact that customer meter reads are infrequent (i.e. quarterly) and by the fact that customer meters are unlikely to be all read at the same time. Such limitations have necessitated the use of “data binning”, a technique whereby relatively infrequent meter reads are apportioned into more regular intervals. For a more thorough explanation of the data binning process, see Appendix B.
A selection of monitoring and evaluation case studies is presented in Example 5-2 and Table 5-1.
16 http://www.sydneywater.com.au/Publications/_download.cfm?DownloadFile=FactSheets/NGAC.pdf [accessed 07/07/06]
The Techniques resource paper (Fyfe et al. 2010a) has been created as part of the NWC IRP for Urban Water project to aid water service providers in this aspect of monitoring and evaluating.
The paper provides details of various techniques available, examples of their application and common pitfalls and limitations. A case study example from the ACT of two of the main techniques is presented together with a selection of key references for further reading.
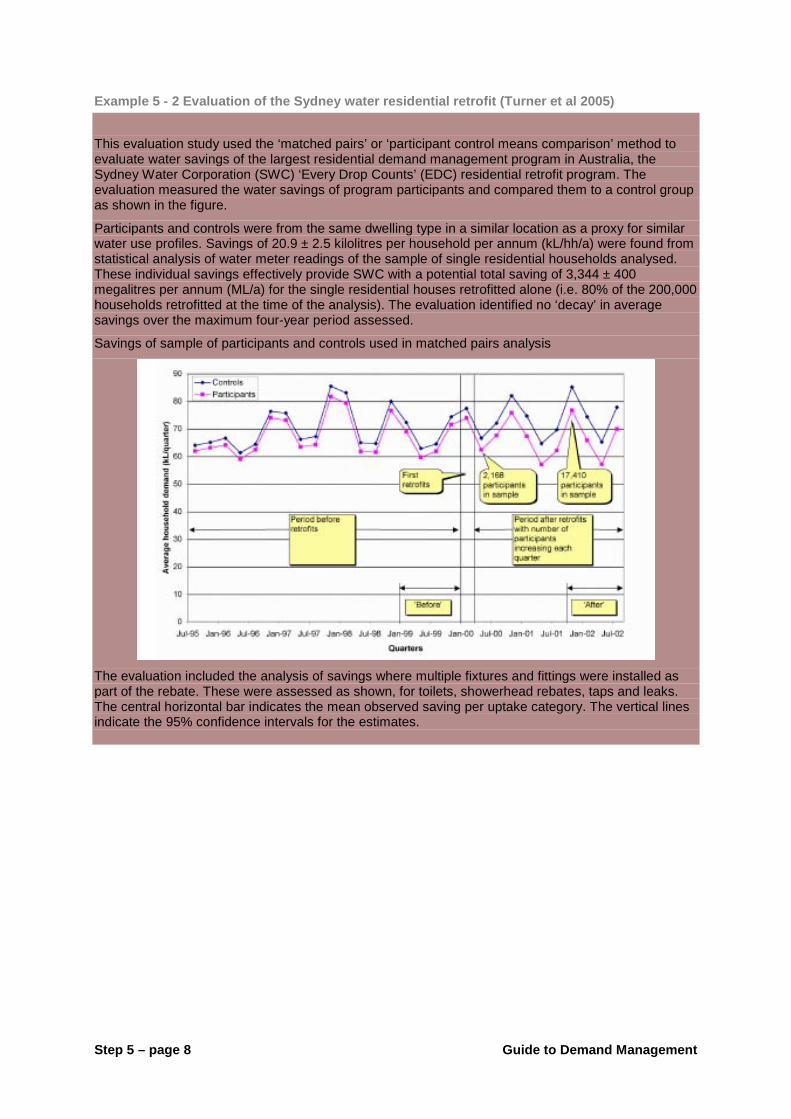
Step 5 – page 8 Guide to Demand Management
Example 5 - 2 Evaluation of the Sydney water residential retrofit (Turner et al 2005)
This evaluation study used the ‘matched pairs’ or ‘participant control means comparison’ method to evaluate water savings of the largest residential demand management program in Australia, the Sydney Water Corporation (SWC) ‘Every Drop Counts’ (EDC) residential retrofit program. The evaluation measured the water savings of program participants and compared them to a control group as shown in the figure.
Participants and controls were from the same dwelling type in a similar location as a proxy for similar water use profiles. Savings of 20.9 ± 2.5 kilolitres per household per annum (kL/hh/a) were found from statistical analysis of water meter readings of the sample of single residential households analysed. These individual savings effectively provide SWC with a potential total saving of 3,344 ± 400 megalitres per annum (ML/a) for the single residential houses retrofitted alone (i.e. 80% of the 200,000 households retrofitted at the time of the analysis). The evaluation identified no ‘decay’ in average savings over the maximum four-year period assessed.
Savings of sample of participants and controls used in matched pairs analysis
The evaluation included the analysis of savings where multiple fixtures and fittings were installed as part of the rebate. These were assessed as shown, for toilets, showerhead rebates, taps and leaks. The central horizontal bar indicates the mean observed saving per uptake category. The vertical lines indicate the 95% confidence intervals for the estimates.

Step 5 – Monitor, Evaluate & Review
Guide to Demand Management Step 5 – page 9
Average savings achieved for different combinations of measures

Step 5 – page 10 Guide to Demand Management
Table 5 - 1 A selection of evaluation literature Authority Program Title / Paper Title Author / Year Comment
Water Corp. (WA) Review of water efficiency programs in WA: towards a strategy for best practice
Turner 2005 Overview of approaches to economic assessment, options assessment and program evaluation
North East Victoria The impact of water restrictions on regional urban demand in the 2006/07 drought
Neal et al. 2010 Analysis to gauge the effect of water restrictions on three towns in North East Victoria
Sydney Water Evaluation of water saving options: examples from Sydney Water's demand management programs
Kidson et al. 2006
Analysis of resident response to water restrictions in the Rouse Hill development in north- western Sydney
ACT Territory and Municipal Services
Think Water, Act Water: evaluation of ACT Government’s water demand management program.
Lee et al. 2008 An independent statistical evaluation of the water savings achieved through four TAMS water efficiency programs.
City West
South East Yarra Valley
Evaluation of Water Savings from the City West Water Showerhead Exchange Program (SEP). “ “ The South East Water SEP “ “ Yarra Valley Water SEP
Fyfe et al. 2009a Fyfe et al. 2009 b Fyfe et al. 2009c
Statistical evaluation of the water savings from a Showerhead Exchange Program (SEP) which is run by the three Melbourne metropolitan water retailers that offers householders free water-efficient showerheads in exchange for their old showerheads
Yarra Valley Water Monitoring Trends in Water Demand in Metropolitan Melbourne – An Essential Component in the Demand Management Effort
Beatty et al. 2008 Applied climate correction to reveal noticeable downward trends in production associated first with water pricing reforms and then with the introduction of water restrictions.
Sydney Water Corporation
Analysis of water savings in ‘Every Drop Counts’ Residential Retrofits
Turner et al. 2004
Analysis of water savings for geographical areas serviced by Sydney Water. Sample of 18,000 drawn from 200,000 participants used
Sydney Water Corporation
Results of the Largest Demand Management Program in Australia
Turner 2005a Paper on results of ‘Every Drop Counts’ program presented at Efficient2005, Chile
Sydney Water Corporation
Water Conservation & Recycling Implementation Report Summary 2003–2004
SWC 2004 Summary of costs and water saved for each program and program-specific measures of performance (e.g. km of mains inspected)
Sydney Water Corporation
EDC Business Program Water Savings and Costs: independent verification of savings calculation methods
Plant et al. 2006 Assesses costs and savings of non-residential program
Sydney Water Corporation
Estimating the savings from water restrictions in Sydney
Spaninks 2010 Analysis of water restrictions impacts on demand in greater Sydney (e.g. regressing temperature, rainfall and evaporation)
Maroochy Water Services (QLD)
Rainwater tank rebate scheme John Wilson & Partners 2004
Compares tank presence and size with metered consumption, as well as water quality and owner perception issues with tanks
Gold Coast Water and Qld EPA
Gold Coast Water: Evaluation of the Water Demand Management Program
Snelling et al. 2006
Assesses savings of residential rebate program (i.e. showers, pool covers, clothes washers, rainwater tanks etc)
Gold Coast Water and GC Council
Showerhead retrofit schemes: a social marketing perspective
Stinchcombe et al. 2005
Assesses customer sentiments, barriers to implementation associated with showerhead retrofits (process evaluation)

Step 5 – Monitor, Evaluate & Review
Guide to Demand Management Step 5 – page 11
Meas ure cos ts Monitoring and evaluating costs to establish the actual unit cost ($/kL) of each program implemented are critical for ensuring that the estimated unit costs established during Step 3C are accurate. Aspects of costs to monitor and evaluate are:
• management (e.g. the cost of the project managers in the demand management team that are organising a particular program, liaising with industry partners and evaluating the program)
• administration (e.g. the cost of recording participants, the call centre etc.)
• marketing (e.g. the costs of television and newspaper advertising, pamphlets)
• program costs (e.g. the actual cost of undertaking a program such as a residential retrofit which would involve the plumbers’ time and the cost of individual fixtures and fittings provided)
• ongoing costs (e.g. for example the cost of providing additional vouchers to household residents participating in an outdoor garden tune-up to minimise decay of savings).
For each cost, it is important to capture to whom these costs are incurred, for instance whether the cost is to the utility, program proponent or customers.
More detailed examples of these costs are provided in Step 3B.
In addition to the costs borne by the water service provider, it is important to monitor the costs borne by other stakeholders. For example, for a rainwater tank program you would check how much the customers have to pay to install and operate the rainwater tank because estimates may not have included all costs or the costs may have dropped with market demand in the area.
The demand management team will need to check the total costs of the water savings against the estimated costs for all stakeholders determined in Step 3B and refined in Step 4A. The comparison will identify the actual unit cost of the individual program (from the combined perspective of the water service provider, government and customers) for checking against the estimated unit cost.
If the unit cost is higher than anticipated the team will need to take steps to reduce costs, increase savings or make a decision on whether to continue implementation of the individual program. In these circumstances, the original boundary of the analysis and other decision factors will need to be considered. For example, even if water savings are not as high as estimated there may still be equity reasons to continue the program (when every effort has been made to improve it) or the associated energy and greenhouse gas benefits mean it is still worth pursuing.
The program savings, costs and unit costs of programs should not be considered in isolation but as part of Step 5B – Monitor and evaluate the full program.
Meas ure cus tomer s a tis fac tion and inves tiga te poten tia l ba rrie rs Customer satisfaction surveys or interviews are useful to determine which components of a program have worked well and which could be improved. This in turn can be used to feed back into how the program is designed and implemented. For example, in the case of a residential retrofit program, customers might say that the plumber did not provide sufficient written material or verbal advice or that the written material was too complicated. With this insight, the demand management team in future can train plumbers more effectively and modify the written material. In a showerhead rebate scheme, the participant may advise that the number of outlets providing the showerhead rebate was too restrictive or the way of getting the refund was too complicated. In this case, the demand management team might expand the number of outlets and simplify the refund by making payment part of a discount on the water bill. In some cases, findings from a survey or interviews might mean excluding particular brands of water-efficient devices due to low levels of satisfaction.
This form of investigation can be combined with research into the motivation and the barriers to uptake by potential participants. This information is useful at the pilot stage to inform which style of program might work best and why (e.g. residential retrofit, showerhead exchange, showerhead rebate). Diverse techniques can be used to gather information, such as phone surveys, face-to-face questionnaires and focus groups. An example using community based social marketing was undertaken by Gold
Step 5 – page 12 Guide to Demand Management
Coast Water (Stinchcombe et al. 2005) to inform the design of the Gold Coast region demand management program.
Further Reading
This reference provides further details on the statistical analysis methods that can be used to measure the savings of implemented programs:
Dziegielewski, B., Opitz, EM., Kiefer, JC., & Baumann, DD., 1993, Evaluating Urban Water Conservation Programs: a procedures manual, American Water Works Association.
This reference provides a list of potential survey topics and details advantages and disadvantages of different survey approaches:
Cordell, D., Robinson, J., & Loh, M., 2003, Collecting residential end use data from primary sources: Do’s and Don’ts. Efficient 2003: Efficient Use and Management of Water for Urban Supply Conference, Tenerife, 2–4 April.
This reference provides information on how community-based social marketing was used to identify the key barriers and motivation of installing a water-efficient showerhead in the Gold Coast region and how this information could be used to inform the design of a water efficiency program:
Stinchcombe, K., Wildman, K., & Wiltshire, M., 2005 Showerhead Retrofit Schemes: A Social Marketing Perspective. AWA Water, March 2005, p74 to 81.
The following is from environmental education, but can be applied across a range of strategies: Dept. of Environment and Conservation, NSW, 2004 “Does your project make a difference?”. http://www.environment.nsw.gov.au/community/projecteval.htm
Meas ure s takeholder s a tis fac tion Customers or participants are often only one stakeholder in the implementation of a demand management program. Seeking the perspective of other stakeholders through formal or less formal interviews will provide an important source of information to inform future programs, or direct existing program. This may include for example public housing representatives who have provided assistance in a program designed to increase the savings in the public housing sector. Discussions with these representatives may uncover their level of satisfaction with the quality or difficulty of installing particular fixtures and fittings installed. It will be critical to obtain this kind of information at an early point in the program to ensure the stakeholders’ views are heard and actions can be taken.
Capture le s s ons lea rned Implementation processes inevitably hit challenges and change their form from the initial plans. Capturing, documenting and presenting the lessons learned is an investment in organisational learning and reduces knowledge loss if staff changes take place. In long term programs of three years or more staff changes will be inevitable. Hence early consideration of capturing and documenting lessons learnt is essential.
5A (ii) Monitor and e va lua te outcomes and proces s es in the non-res identia l s ec tor While many of the basic evaluation principles are similar to residential, there are some fundamental differences in the non-residential sector to be taken into account with evaluation.
The non-residential sectors include the commercial, industrial and institutional sectors so we cannot make general assumptions about the quantities of water used or saved through demand management programs. In the non-residential sector, ways of measuring water use may differ substantially, from accurate sub-metering at some sites to measuring water use as a function of production unit at others.
Less literature and experience exists to draw on for the non-residential sector than the residential sector. This may be because a lot more resources are required to do a meaningful in-depth analysis on a complex, heterogenous sector and the data is difficult to obtain and standardise.
Dziegielewski et al. (1993) defines two components of ‘water savings program evaluation’: evaluation of implementation and evaluation of savings. Evaluation of implementation refers to the mechanisms that ensure the customer has carried out the recommended water savings actions effectively. An example is installing water recycling equipment and carrying out adequate operation and

Step 5 – Monitor, Evaluate & Review
Guide to Demand Management Step 5 – page 13
maintenance. Evaluation of savings refers to ensuring that the actual water use decreases as expected from the recommended action. Metering consumption before and after implementation might do this, however other factors that may have changed the water use will need to be taken into consideration.
The components of a comprehensive evaluation of demand management programs in the non-residential sector should include:
• Water savings attributable to the actions taken associated with the program.
• Costs of saving water in terms of both capital and operating expenditure including overheads, disbursements and on-costs17
• From the perspective of the customer, the return on investment and payback period, since businesses normally have shorter expected payback periods than government utilities.
, costs to the utility and to the commercial/industrial/institutional customer.
• An assessment of the coverage of the program, for example, percentage of non-residential sector participating.
• The level of partnership between the project administrators and customers. Programs with strong partnerships may increase the awareness of the customer’s own water cycle through the organisation and therefore increase the ability to identify where savings may occur.
Best practice literature on the subject of calculating energy savings in the non-residential sector suggests that a reliable savings calculation requires a consistent process for selecting periods before and after the water savings work (AusIndustry 2004). The AusIndustry approach recommends the following equation for energy savings in a building retrofitted with new energy saving equipment:
Energy savings = BaseYear energy use – Post-Retrofit energy use ± Adjustments
Owing to the complexity of the factors that influence water usage (e.g. pricing, awareness, behaviour, production processes and weather), water savings calculations carry inherent uncertainty. Whether the benefits of increased accuracy justify further investments in detailed modelling and analysis depends on the likely savings to result from the program.
Example 5-3 provides details of an evaluation recently undertaken for Sydney Water Corporation.
17 On-costs : Costs associated with administering a program for example imputed rent.
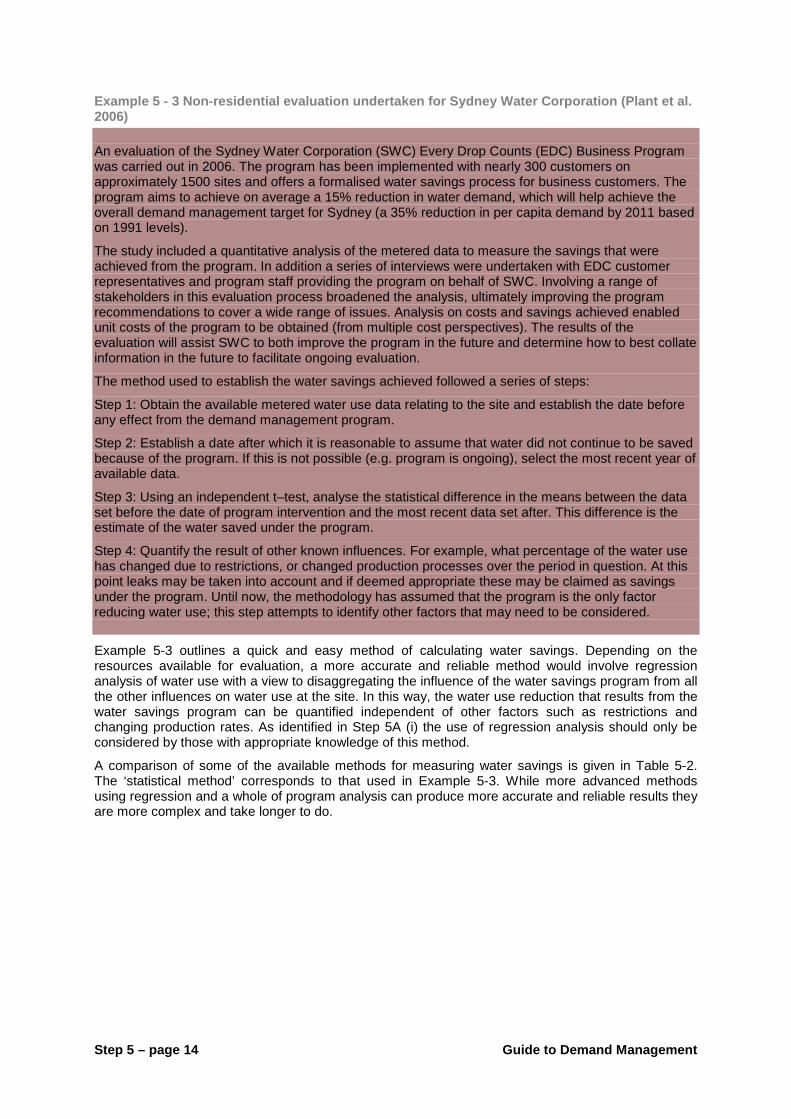
Step 5 – page 14 Guide to Demand Management
Example 5 - 3 Non-residential evaluation undertaken for Sydney Water Corporation (Plant et al. 2006) An evaluation of the Sydney Water Corporation (SWC) Every Drop Counts (EDC) Business Program was carried out in 2006. The program has been implemented with nearly 300 customers on approximately 1500 sites and offers a formalised water savings process for business customers. The program aims to achieve on average a 15% reduction in water demand, which will help achieve the overall demand management target for Sydney (a 35% reduction in per capita demand by 2011 based on 1991 levels).
The study included a quantitative analysis of the metered data to measure the savings that were achieved from the program. In addition a series of interviews were undertaken with EDC customer representatives and program staff providing the program on behalf of SWC. Involving a range of stakeholders in this evaluation process broadened the analysis, ultimately improving the program recommendations to cover a wide range of issues. Analysis on costs and savings achieved enabled unit costs of the program to be obtained (from multiple cost perspectives). The results of the evaluation will assist SWC to both improve the program in the future and determine how to best collate information in the future to facilitate ongoing evaluation.
The method used to establish the water savings achieved followed a series of steps:
Step 1: Obtain the available metered water use data relating to the site and establish the date before any effect from the demand management program.
Step 2: Establish a date after which it is reasonable to assume that water did not continue to be saved because of the program. If this is not possible (e.g. program is ongoing), select the most recent year of available data.
Step 3: Using an independent t–test, analyse the statistical difference in the means between the data set before the date of program intervention and the most recent data set after. This difference is the estimate of the water saved under the program.
Step 4: Quantify the result of other known influences. For example, what percentage of the water use has changed due to restrictions, or changed production processes over the period in question. At this point leaks may be taken into account and if deemed appropriate these may be claimed as savings under the program. Until now, the methodology has assumed that the program is the only factor reducing water use; this step attempts to identify other factors that may need to be considered.
Example 5-3 outlines a quick and easy method of calculating water savings. Depending on the resources available for evaluation, a more accurate and reliable method would involve regression analysis of water use with a view to disaggregating the influence of the water savings program from all the other influences on water use at the site. In this way, the water use reduction that results from the water savings program can be quantified independent of other factors such as restrictions and changing production rates. As identified in Step 5A (i) the use of regression analysis should only be considered by those with appropriate knowledge of this method.
A comparison of some of the available methods for measuring water savings is given in Table 5-2. The ‘statistical method’ corresponds to that used in Example 5-3. While more advanced methods using regression and a whole of program analysis can produce more accurate and reliable results they are more complex and take longer to do.

Step 5 – Monitor, Evaluate & Review
Guide to Demand Management Step 5 – page 15
Table 5 - 2 Comparison of some common methods to evaluate water savings Method Description Resources Reliability Accuracy
Statistical Method
Based on water consumption samples before and after MoU. The difference of means corresponds to the water savings. The 95% confidence interval can be used to assess the validity of SWC water savings estimates. May include SAITE (specific information at end) as adjustments.
Low High Medium
Linear Multiple regressions
Quantify trends to predict future water use and compare against savings.
Medium –High
Medium High
Whole of program analysis
Include all sites in the program and report a whole-of-program savings figure.
Medium High High
Further Reading
AEPCA, 2004, A Best Practice Guide to Measurement and Verification of Energy Savings. A companion document to ‘A Best Practice Guide to Energy Performance Contracts’. Australasian Energy Performance Contracting Association.
AWWA, 1993, Evaluating Urban Water Conservation Programs: A Procedures Manual.
AWWA, 2006, Water Conservation Programs – A Planning Manual. AWWA Manual M52.
California Urban Water Conservation Council, 2000, BMP Costs & Savings Study: A Guide to the Data and Methods for Cost Effectiveness Analysis of Urban Water Conservation Best Management Practices, The California Urban Water Conservation Council, USA.
California Urban Water Conservation Council, 2001, BMP 9 A Guide to Implementing Commercial Industrial Institutional Conservation Programs.
Dziegielewski, B., Kiefer, JC., Opitz, EM., Porter, GA., Lantz, GL., DeOro, WB., Mayer, PW., & Nelson, JO., 2000, Commercial and Institutional End Uses of Water. AWWA Research Foundation.
Dziegielewski, B., Opitz, EM., Kiefer, JC., & Baumann, DD., 1993, Evaluating Urban Water Conservation Programs: a procedures manual, American Water Works Association.
IPMVP Committee, 2002, International Performance Measurement & Verification Protocol (IPMVP). Concepts and Options for Determining Energy and Water Savings. Volume I. DOE/GO-102002-1554. Office of Energy Efficiency and Renewable Energy, US Department of Energy.
US Department of Energy, March 2002, International Performance Measurement and Verification Protocol: Concepts and Options for Determining Energy and Water Savings, Volume 1, US Department of Energy, USA.
Vickers A., 2001, Handbook of Water Use and Conservation: Homes, Landscapes, Businesses, Industries, Farms, WaterPlow Press, Amherst, USA.
White, S. (ed), 1998, Wise Water Management: A Demand Management Manual For Water Utilities, Water Services Association of Australia Research Report No. 86, NSW Department of Land and Water Conservation, Australia.
Whitcomb, J., Hoffman, B. & Ploeser, J., 2001, BMP 9 Handbook: A guide to implementing commercial, industrial and institutional water conservations programs. California Urban Water Conservation Council, Sacramento.
Step 5 – page 16 Guide to Demand Management
Step 5B Monitor and e va lua te fu ll s u ite of programs The monitoring and evaluation across the full suite of programs has a greater focus on:
• the comparative advantages and disadvantages of programs relative to one another
• how the programs contribute to meeting the overall demand management target or supply–demand objective. That is, how the goals set in Step 2D have been met.
The aim of monitoring and evaluation at this level is to provide advice to managers, policy-makers and decision-makers on if and how the full suite of programs can be modified.
5B (i) Compara tive advantages and d is advan tages of programs By drawing together the evaluation of each program individually, the team can assess which programs offer the greatest reward for effort. The reward for effort may be greatest water savings with least cost whilst achieving customer satisfaction.
If specific programs are not meeting desired outcomes in terms of savings, participation rates, customer satisfaction or are less cost effective than anticipated then consideration of removing them from the overall program may be necessary. Other consideration of customer equity and broader environmental and social benefits will need to be considered before they are removed and after effort to improve each program has been made.
The decision to remove programs and replace them with others will need to be made collectively with the group of stakeholders involved in the IRP process. Clear articulation and justification of the reasons for doing so will be necessary. Documentation of the evaluation carried out will assist in this discussion. In particular, evaluation of pilot programs should be taken only as an indicator, not a guarantee, of future performance, and it will be important to exercise discretion in evaluating a program’s ‘potential’ based on the pilot performance only.
5B (ii) Ana lys e how programs collec tive ly mee t p lanning objec tives The total water savings from all programs can be assessed by combining analysis of water saved across each program. Determining whether these programs collectively meet the demand management target or supply-demand objective requires a closer examination of each demand and supply-side option implemented. Example 5-4 provides an example of what Sydney Water report.
In addition to looking at individual programs, regression analysis on bulk water demand can be used to obtain an overall picture of how demand-side options are assisting in reducing demand towards a demand management target or filling the supply-demand gap. Again this needs to be undertaken by specialists or trained staff.
Regular review of the overall demand versus yield will be important to assist in tracking the supply-demand gap and how the portfolio of options is achieving its objectives identified and agreed in Step 2D. In some jurisdictions, a central office of government (e.g. MetroWater Directorate), or a government regulator (e.g. IPART) takes the lead role in evaluating compliance against the overall supply-demand balance rather than the water utility.

Step 5 – Monitor, Evaluate & Review
Guide to Demand Management Step 5 – page 17
Example 5 - 4 Sydney Water Corporation reporting on cost and savings Sydney Water Corporation reports on both planned and actual water savings, expenditure and participation rates for all demand management programs. This is part of its annual Water Conservation and Recycling Implementation Report. An example of the reporting is given below (Sydney Water Corporation 2005)
The evaluation of programs is presented from Sydney Water’s financial perspective. This reflects the fact that Sydney Water are reporting against water conservation and recycling targets. If these evaluations are used in future supply-demand planning, stakeholder costs should also be included (as described in Step 3B and 3C).
Step 5 – page 18 Guide to Demand Management
Step 5C Review of the IRP process This final step in the IRP process is really a new beginning for the subsequent cycle through the IRP planning process. It is intended to provide insight and promote adaptive management of the entire process. Conducting a thorough review and taking the time to reflect on the process will help the team respond to any new developments in the region’s situation and take new actions based on lessons learned.
In essence, this review stage is about analysing the whole IRP process from different angles. The angles we recommend are informed by systems theory (Checkland 2001: 78). For a complete picture, it is important to examine the efficiency with which the IRP process has been carried out, the efficacy in terms of how well the planning goals set were satisfied and its effectiveness in providing an appropriate process for tackling the needs of the region. These are described in more detail below.
The difference between Step 5C and Step 5B is that 5B has a narrower focus and only involves monitoring and evaluating the actual implementation of the response. Here, we are interested in learning from what took place moving through the entire IRP process, including all its decision-making processes and all the supporting analysis and modelling. In addition, Step 5C is a moment when the group can step back from the process and assess any changes in the regional context such as in climate or population.
5C (i) Dec ide focus and s cope of the review The investment made in this step of the IRP process will depend on the local context. In some instances, such a review will be important for providing transparency to regulators and other bodies and these organisations may have their own specific requirements. In other instances there may be no such requirement and the decision may be to focus more narrowly and simply to extract learning for subsequent applications of the process. It is likely that in many cases resource availability will constrain the possible scope of the review.
Here, we provide a range of possible areas of focus that we recommend for the review:
• Efficiency of the IRP process
Answering questions such as: What resources were consumed in carrying out the process? How cost-effective was the process? How did the benefits compare with the costs? Could the process have been managed more efficiently? How? Which steps were particularly resource intensive and were such investments justified?
• Efficacy of the IRP process
Answering questions such as: To what extent were the planning goals in the IRP process met? To what extent did the IRP process meet other aims like maximising inclusiveness in decision-making, or enabling equivalent treatment of demand and supply options?
• Effectiveness of the IRP process
Answering questions such as: To what extent was the IRP process an appropriate overall process for solving the demand and supply issues in the region in the long-term? To what extent was the IRP process a worthwhile process to satisfy the needs? To what extent did the process help solve the water resource issues and needs of the region?
• Reflecting on what worked and what did not for each step of the IRP process. What aspects might you do differently in future iterations? What were the most important lessons learnt?
It will be important to make decisions about the scope of the review while completing Step 1, so that relevant information can be collected and documented during the IRP process. Collecting the information retrospectively will be much more difficult.
Step 5 – Monitor, Evaluate & Review
Guide to Demand Management Step 5 – page 19
5C (ii) Colla te re levant in formation documented during the IRP proces s Since the IRP process is likely to take place over an extended period, it will be important to bring together the relevant documentation to enable the review of the process.
5C (iii) Ta lk to people involve d in IRP proces s Two sets of people are worth talking to for their views about the IRP process. Firstly, those involved at a decision-making level and secondly, those involved in conducting various parts of the analysis, modelling, implementation and evaluation.
Many parts of the IRP process require participatory decision-making that balances multiple risks, costs and viewpoints. Interviewing the key people who participated in the process will be important to highlight the lessons learnt, check whether stakeholders felt their views were taken into account and provide insight to better facilitate the decision-making processes.
Equally, individuals working on the analysis, modelling, implementation and evaluation will have gained considerable knowledge and experience. It is worth recording their experience to develop and improve performance in these tasks.
5C (iv) Ana lys e and re flec t on the information co llec ted The documented information and qualitative data from interviews will need to be analysed and organised into a form that makes it useful for its audience(s). It will be useful therefore, to think firstly about the audience(s) for the different types of information collected and to synthesise the information to an appropriate level of detail.
5C (v) Dis s emina te res u lts of the review The results of the review are important both internally and externally. A review is only worth conducting if its insights are shared. It is acknowledged that political or other reasons may cause delays or restrictions in disseminating results to external stakeholders, but if the process has been undertaken collaboratively and transparently, these effects should be minimised.
A workshop might be appropriate for this purpose, or circulation of written documentation containing the findings so that implications for future iterations of the IRP process and the participation of the various stakeholders in that process can be discussed.
Further Reading
Checkland, P., 2001, Soft Systems Methodology Rational Analysis for a Problematic World Revisited J. Rosenhead and J. Mingers. Brisbane. John Wiley and Sons Ltd.
Guide to Demand Management Appendix A – page 1
Appendix A. National Urban Water Planning Principles National principles for urban water planning developed under COAG should be universally applicable when developing plans to manage the supply/demand balance of a reticulated supply for an urban population.
Key principles to achieve optimal urban water planning outcomes are:
1. Deliver urban water supplies in accordance with agreed levels of service.
The service level for each water supply system should specify the minimum service in terms of water quantity, water quality and service provision (such as reliability and safety).
Levels of service should not apply uniformly, but rather should be set for each supply system and potentially for different parts of an individual supply system. Agreement on levels of service will allow the community to understand how seasonal variability and climate change will impact on supply into the future and how different levels of service relate to costs. Measures undertaken to minimise risk and maximise efficiency in supplying water should be in accordance with agreed levels of service.
2. Base urban water planning on the best information available at the time and invest in acquiring information on an ongoing basis to continually improve the knowledge base.
Up-to-date information on current and future water resources, water supplies and water demand is critical for effective urban water planning. Information on possible future changes, such as population growth and climate change, is also important in understanding the ongoing water supply/demand balance and to determine an acceptable level of risk due to uncertainty.
Knowledge of existing customers (including who is using water, how much and for what end uses and an understanding of the differences between customers and geographic locations) is important when forecasting future water demands by end users in a particular category of use and the impact of possible demand management measures under consideration.
Urban water planning should be based on scenario planning, incorporating uncertainty in supply and demand, as well as integrated with future economic development and land use planning to ensure full knowledge of the availability of water supplies and water savings opportunities.
Where possible, information should be gathered in such a way that it enables improved information-sharing and research coordination between jurisdictions.
3. Adopt a partnership approach so that stakeholders are able to make an informed contribution to urban water planning, including consideration of the appropriate supply/demand balance.
Stakeholder input is essential to ensure that the proposed levels of service and the supply and demand management options required to deliver that level of service are considered in terms of consumers' attitudes, including willingness and ability to pay.
Community information and education programs should be an integrated part of urban water planning and should be designed appropriately, based on community input, to increase knowledge, understanding and informed participation in urban water planning, as well as increase water efficient behaviours. Urban water planning should be based on a process that is transparent and inclusive, recognising different consultation approaches are appropriate in different circumstances.
4. Manage water in the urban context on a whole-of-water-cycle basis.
The management of potable water supplies should be integrated with other aspects of the urban water cycle, including stormwater management, wastewater treatment and re-use, groundwater management and the protection of public and waterway health.
The risks associated with different parts of the urban water cycle (such as trade waste, stormwater, etc) should be considered and managed. Water quality of potable supplies should be protected through appropriate catchment management practices and management of wastewater. This will involve a range of activities, from land use planning and management that protects the quality of natural water resources, through to addressing the disposal, treatment and reuse phases of the water cycle.

Appendix A – page 2 Guide to Demand Management
Such an approach should result in delivery of diverse water supplies which are fit-for-purpose and optimise the use of water at different stages of the urban water cycle.
5. Consider the full portfolio of water supply and demand options.
Selection of options for the portfolio should be made through a robust and transparent comparison of all demand and supply options, examining the social, environmental and economic costs and benefits and taking into account the specific water system characteristics. The aim is to optimise the economic, social and environmental outcomes and reduce system reliability risks, recognising that in most cases there is no one option that will provide a total solution. Readiness options should also be identified as part of contingency planning.
Options considered could include the following:
• optimising the use of existing infrastructure through efficiency measures
• residential, commercial and industrial demand management initiatives
• purchasing or trading water entitlements from other sectors, and
• development of additional centralised and/or decentralised water supply options, including manufactured water sources (such as recycling and /or desalination), where appropriate.
By considering the full range of options, access to a range of sources should be able to be optimised dynamically (even on a short term basis) through the availability of diverse infrastructures that may include both centralised and decentralised water supply schemes. These sources would be drawn upon in differing combinations depending on the local and regional climatic conditions and the mix of sources selected would be those resulting in the lowest environmental, social and economic costs over the long term.
6. Develop and manage urban water supplies within sustainable limits.
Ensuring the ongoing protection of the environment and waterway health is an integral part of urban water planning. Natural water sources for all water supplies, such as surface and groundwater supplies, should only be developed within the limits of sustainable levels of extraction for watercourses and aquifers.
Sustainable levels of extraction should be established through publicly available water plans prepared at a catchment and / or basin scale for all water use, including environmental requirements. In determining the sustainable extraction levels, regard should be had to the inter-relationships of different water sources. To ensure sustainability, extraction levels should also be monitored over time and periodically re-assessed to reflect changes in scientific knowledge and climate variability.
7. Use pricing and markets, where efficient and feasible, to help achieve planned urban water supply/demand balance.
Tariff structures for water supplies should be designed to signal the full value of finite water resources to end users to encourage efficient water use. The price charged for urban water services should be transparent and linked to the level of service provided.
Rights to urban water supply should be clearly defined to the extent that it is economically efficient, cost-effective and feasible to do so, at the various levels of the supply chain. This in turn will facilitate the use of markets and trading where appropriate. This could include developing bulk water and wastewater markets, removing barriers to competition and institutional, structural and governance reforms.
8. Periodically review urban water plans.
Recognise that there is a need for periodic review of urban water plans and their underpinning assumptions. All parties involved in the development of an urban water plan should be committed to ensuring that the plan can adapt as necessary to reflect additional information/knowledge and changing circumstances.
Planning should recognise that some demand/supply responses are short-term and are required to be adaptive, while other responses such as water infrastructure planning and investment have a longer planning horizon because the assets have a considerable lifespan.

Guide to Demand Management Appendix B – page 1
Appendix B. Data binning Data binning Individual customer demand data is typically only available at relatively infrequent intervals. Furthermore, customer meter data is typically recorded on different days in different districts. These potential limitations have given rise to the need for data “binning”. Binning involves apportioning periodically-recorded demand into shorter, consistent time periods, which aids in the direct comparison of usage profiles of individual customers and in data aggregation. Generally, quarterly demand data is converted to monthly demands, as shown in the figure below. Average daily demands are first derived for each quarter, by dividing total quarterly demand by the number of days in the quarter:
1,,
,,
−−=
iqiq
iqid dd
CC
where, Cd,i = the average daily consumption for the ith quarter (kL/d), Cq,i = the total consumption for the ith quarter (kL), and dq,i = the last day of the ith quarter (expressed as a Julian day), dq,i-1 = the last day of the (i-1)th quarter (expressed as a Julian day). Two equations are then used to calculate monthly demand from quarterly meter reads, depending upon where the particular month lies with respect to the quarterly meter reads. If all days for a given month occur in a single quarterly interval the following equation is used:
( ) idjmjmjm CddC ,1,,, ⋅−= − Where Cm,j = the binned monthly consumption for the jth month (kL), dm,j = the last day of the jth month (expressed as a Julian day), dm,j-1 = the last day of the (j-1)th month (expressed as a Julian day). Alternatively, if days for a given month occur in two quarterly intervals, the daily demand from both quarters is used:
( ) ( ) i,dj,mi,q1i,di,q1j,m1j,m CddCddC ⋅−+⋅−= +++
Where Cm,j+1 = the binned monthly consumption for the (j+1)th month (kL), dm,j+1 = the last day of the (j+1)th month (expressed as a Julian day), and Cd,i+1 = the average daily consumption for the (i+1)th quarter (kL/d). There are a number of limitations associated with the data binning process. The technique assumes that daily demand is constant over the given meter read period, which is often not the case (Moglia, Grant & Inman 2009). Furthermore, while binning actually helps to improve the seasonality profile of customer metered demand (more so after aggregation) there is a ‘smearing’ effect (an artefact of subdividing quarterly data) whereby demand for any given month is in part determine by demand in the previous and following months. When using binned data in a time series regression it may be necessary to use (demand) lag and/or lead terms as explanatory variables to account for this.
Aug-04 Oct-04 Dec-04 Feb-05 Apr-05 Jun-05 Aug-05
0102030405060708090
100110120130140
Con
sum
ptio
n (k
L)
0.2
0.4
0.6
0.8
1.0
1.2
1.4
1.6
1.8
2.0
Con
sum
ptio
n (k
L/d)
Quarterly consumption (kL)Binned monthly consumption (kL)Quarterly consumption (kL/d)Binned monthly consumption (kL/d)
Cq,i Cq,i+1
dq,i+1dq,idq,i-1
dm,j-1 dm,j dm,j+1
Cm,j Cm,j+1

Guide to Demand Management Glossary – page 1
Glossary $/kL dollars per kilolitre
ABS Australian Bureau of Statistics
ACT Australian Capital Territory
AIC Average incremental cost, also called levelised cost
Annualised Cost (AC)
The annualised cost is the annualised capital cost combined with the annual operating cost. This method calculates a future cost, by spreading the initial cost over the lifetime of that option while accounting for the time value of money.
ANZSIC Code Australian New Zealand Standard Industry Classification Code (for categorising industry sectors and types)
Avoidable or avoided cost
Those costs that would not be incurred if an option were implemented. Estimating avoided costs requires a robust understanding of the base case, i.e. the business as usual, or ‘do-nothing’ alternative that would have occurred without the proposal.
AWWA American Water Works Association
Base case or reference case
Means describing the situation that would occur if a ‘do nothing’ or ‘do nothing differently’ approach was taken i.e., specifying the system configuration that a conventional approach would take to study objectives. In most cases, the base case will correspond to providing centralised water supply, sewerage and/or stormwater. You then use the water balance model to model the base case. As alternatives need to be compared against a common reference point, a well-defined base case is essential for a consistent cost analysis.
BASIX Building and Sustainability Index (NSW)
Benefits transfer A method for estimating the value of particular externalities based on the published economic evaluation literature.
Best Practice Practice that experience and research have shown will reliably lead to the desired result.
C/I Commercial/Industrial
CAPEX (Capital Expenditures) Refers to the cost of developing or providing non-consumable parts for the product or system. For example, the purchase of a photo copier is the CAPEX, and the annual paper and toner cost is the OPEX. For larger systems like businesses, OPEX may also include the cost of workers and facility expenses such as rent and utilities.
CARL Current annual real losses
CBA Cost benefit analysis
CoAG Council of Australian Governments
Cost benefit analysis An economic evaluation technique for quantifying the total expected costs and the total expected benefits of a decision, action or project in monetary terms in order to determine whether it would result in a net benefit to society. The technique can also be used to compare alternatives in terms of which one would be the more economically beneficial.
Cost effectiveness analysis
An economic evaluation technique for comparing alternatives that can meet the same objective(s). Like cost benefit analysis it involves quantifying the benefits and costs of alternatives in monetary terms. It is however concerned with the relative costs or benefits of meeting the given objectives rather than whether an alternative can be judged as being economically beneficial in its own right. No attempt is made to value the objectives themselves in dollar

Glossary – page 2 Guide to Demand Management
terms. In cost effectiveness analysis, the viability of a particular alternative can only be determined by reference to the range of possible alternatives.
Cost perspective The accounting stance which defines the cost and benefits that are included in an analysis. Cost perspectives are either economic, indicating overall whether society will be better or worse off as a result of an action, or financial, indicating commercial viability for a particular commercial entry or defined group.
CPUC California Public Utilities Commission
CUWCC California Urban Water Conservation Council
EDC Every Drop Counts, the SWC water efficiency program which includes residential and business programs
End use analysis The disaggregation of water demand into customer sectors (e.g. single & multi-residential dwellings, commercial/industrial properties, institutional properties and unaccounted for water/leakage), then divided into individual end uses – e.g. toilets, showers, baths, taps, clothes washers which constitute indoor demand (going to sewer) and garden irrigation and swimming pools which constitute the outdoor component of demand.
End uses Refers to where the water is used (e.g., residential or commercial sector) and what it is used for (e.g., showering, cooling tower, etc.). Taking an end use approach opens up different ways of providing the same service, e.g., with a different quality or quantity of water.
Toilets, showers, taps, swimming pools, cooling towers, urinals are examples of end uses.
ERP Estimated residential population
ESC Essential Services Commission (VIC)
Externalities Externalities refer to all environmental or social impacts that are usually excluded from cost analyses e.g. declining river health because of increased extraction and disposal of inadequately treated sewage.
Financial analysis
Is conducted from the commercial perspective of a single party, and includes only those costs directly attributable to the commercial entity in question. It has many roles other than identifying the most sustainable solution for an urban water servicing question. This guidebook describes only the simplest form of financial analysis for a project: a cost breakdown from the various stakeholder cost perspectives.
FTE Full time equivalent
GHG Greenhouse gas
GIS Geographic Information Systems allow users to capture, manipulate, analyse and display all forms of geographically referenced information.
Greywater A combination of wastewater from the laundry, bathroom and kitchen.
hh Household/s
ILI Infrastructure leakage index
Instruments The means by which ‘measures’ are implemented. They can be regulatory, economic and communicative. For example, the measure of installing a water efficient showerhead may be achieved by mandating the sale or use of water efficient showerheads (regulatory instrument), or by providing rebates to customers on the purchase of water efficient showerheads (economic instrument), or by creating awareness of the significance of water savings made through installing water efficient showerheads by using a mass media education campaign (communicative). It is important to make such distinctions because the uptake and participation rate of a measure will vary significantly with the type of instrument(s) employed for its implementation

Guide to Demand Management Glossary – page 3
and therefore the total savings achieved from the measure will vary.
Intangible costs The impacts that are difficult to assess or place a monetary value on with any certainty.
Integrated Supply Demand Planning (iSDP) model
A generic model that assists water authorities to develop their own specific model to forecast water demand more accurately, develop demand-side options and compare them to supply-side options using consistent economic and sustainability assessment methods.
Internal Rate of Return (IRR)
Formally defined as the discount rate that would make the PV of a project’s benefits equal the PV of its costs. Mathematically, this is the rate r at which NPV = 0.
IPART Independent Pricing and Regulatory Tribunal (NSW)
IRP Integrated Resource Planning
iSDP model (Integrated supply demand planning model) A generic supply-demand model that can assist water authorities to develop their own specific model to forecast water demand more accurately, develop demand-side options and compare them to supply-side options using consistent economic and sustainability assessment methods. Available to Australian water utilities at: urbanwaterirp.net
ISF Institute for Sustainable Futures
IWA International Water Association
kL Kilolitres
kL/hh/a kilolitres per household per annum
L/min litres per minute
LCD litres per capita per day
LCP Least Cost Planning
Least Cost Planning Refers to the use of cost-benefit analysis across supply-side and demand-side options.
Is a term that was developed in the application of these ides in the electricity industry in the United States in the 1970’s to refer to the use of cost-benefit analysis across supply- and demand-side options. In this Manual, the broader term, Integrated Resource Planning is used to encompass the process described in each of the Chapters, which is larger than the cost-benefit analysis alone.
Levelised cost Levelised cost is used as a measure of the present value unit cost of water saved or supplied. It is defined as the present value of the stream of costs over a set period divided by the present value of the stream of water demand reduced or supplied over the same period.
LGA Local government area
M Million
Marginal cost The net additional cost corresponding to an option.
Marginal cost of supply
The net additional cost corresponding to an addition unit of output.
Measures Changed practices or technologies that result in reduced mains water consumption, e.g. installing water efficient showerheads.
ML Mega litres
ML/a Mega litres per annum

Glossary – page 4 Guide to Demand Management
MR multi-residential
Multi-criteria analysis (MCA)
Describes a range of analytical techniques that can support stakeholders making decisions in situations where there are numerous options on the table and varied preferences. The principal objective of a multi-criteria analysis is to support decision-making with regard to identifying the most preferred option. MCA supports the decision making process by structuring the preferences of the decision makers and ranking the possible options according to these preferences.
MWEPS Minimum water efficiency performance standards
NCERS North Canberra Effluent Reuse Scheme
Net present value (NPV)
The difference between the present value of the benefits of a project or option, and the present value of the costs.
NGACs Greenhouse Abatement Certificates
Non-monetised impact
An impact that is significant enough to be considered in decision-making but for which no monetary value has determined.
NRW non revenue water
NSW New South Wales
NT Northern Territory
NWC National Water Commission
NWI National Water Initiative
OFWAT Office of Water Services (UK)
OPEX Operational Expenditures - the on-going costs for running a product, business, or system. Its counterpart, Capital Expenditures (CAPEX), refers to the cost of developing or providing non-consumable parts for the product or system. For example, the purchase of a photocopier is the CAPEX, and the annual paper and toner cost is the OPEX. OPEX also include the cost of labour and facility expenses such as rent.
Option A discrete behavioural measure, infrastructure, or system alternative that is considered within a study. An option exists with a range of other options that meet the study objectives by a variety of means.
Options are assessed on incremental cost wherein a base case is specified (‘business as usual’ or ‘without project’ outcome) and both costs and avoided costs (or benefits) relative to the base case are accounted for. This includes avoidable operating costs and capital augmentations that could be delayed or become unnecessary within existing urban water systems. Options based on different scales of infrastructure, different water volumes, and different water qualities can have significantly different asset lifetimes, different breakdowns of capital and operating cost, and staging. It is necessary to account for these temporal differences.
Outcome rather than capacity or volume of water i.e. most urban water services can be delivered with less water volume. Taking an outcome or end use approach to building up demand projections means that demand side options that take the potential of efficient fixtures and appliances into account can be considered alongside supply options.
PH Public housing
Guide to Demand Management Glossary – page 5
Present value The value of the stream of future costs and benefits associated with that option, discounted back to current monetary values based on a predetermined discount rate
QLD Queensland
Recycled water Treated stormwater, greywater or black water suitable for a range of uses eg. Toilet flushing, irrigation, industrial processing or other suitable applications.
SA South Australia
SD Statistical division
Sensitivity analysis Sets out to determine the sensitivity of an outcome to changes in its determining parameters. If small changes in parameters result in large changes in outcomes (e.g., a small shift in population projection results in a large shift in the cost of sewage infrastructure), then the outcome is said to be ‘highly sensitive’. To manage this sensitivity, we can attempt to either determine the key parameter with a high degree of accuracy, or devise other means of reaching the outcome, i.e. Alternative options, that reduce the sensitivity
SLA Statistical local area
Source substitution Where mains water is substituted by an alternative source of water supply, such as from a rainwater tank or appropriately treated stormwater, greywater, blackwater or wastewater.
SR Single residential (detached dwelling)
SSD Statistical subdivision
Sunk costs A cost that has been incurred and cannot be recovered.
Sustainable development
Development that uses, conserves, and enhances the community’s resources so that ecological processes are maintained or enhanced and the total quality of life now and in the future can be improved.
Sustainable outcome Outcomes that contribute to ecological sustainable development.
SWC Sydney Water Corporation
System A system is a set or assemblage of ‘things’ connected, associated, or interdependent, so as to form a single unity. A system is any set (group) of interdependent or temporally interacting parts. Parts are generally systems themselves and are composed of other parts, just as systems are generally parts or components of other systems.
Tangible costs Direct outlays and directly avoided outlays. Actual capital and operating costs incurred or avoided.
Third pipe reuse An option for reuse of treated effluent by providing a reticulated supply of effluent to households for outdoor use and toilets (as it done in the Rouse Hill area in western Sydney) or outdoor use, toilets and clothes washers (as in Newington in Sydney). This is known as the "third pipe supply", as reticulated drinking water is the first pipe, the sewers are the second pipe and the treated effluent becomes the third pipe connected to each household. Rather than being counted as a "new supply", reuse alternatives are considered as part of the "reduction in water demand"
Time value Time value of money is a key concept in cost analysis because it addresses the fact that the value of money is not constant over time: costs or benefits expected to arise in the future have a lower worth in ‘present value’ terms than costs and benefits that arise today. This is why dollar values must always be reported with a year attached. Time value of money is often misunderstood and sometimes misrepresented. It is to include it coherently and transparently because discounting has a significant impact on the results of cost analyses. Costs should only be directly compared if they represent
Glossary – page 6 Guide to Demand Management
values in the same year (including the present).
UARL Unavoidable annual real losses
UFW Comprises: (1) current annual real losses (CARL), which are those losses associated with joint weeps, breaks and apparent water losses averaged over the total number of service connections, (2) unavoidable annual real losses (UARL), which are those losses that are unavoidable considering the network, supply pressures and the number of connections.
Also known as Non revenue Water.
UKEA UK Environment Agency
Urban water system - The system that provides water supply, wastewater and stormwater services to a city or town or a predominantly residential part thereof.
VIC Victoria
WA Western Australia
Water conservation; demand management
Any activity that reduces consumption of mains water supplied by water utilities. Three major types of activity can be identified: water efficiency (including addressing leakage), source substitution.
Water cycle Technically known as the hydrologic cycle — is the continuous circulation of water within the Earth's hydrosphere, and is driven by solar radiation. This includes the atmosphere, land, surface water and groundwater. As water moves through the cycle, it changes state between liquid, solid, and gas phases. Water moves from compartment to compartment, such as from river to ocean, by the physical processes of evaporation, precipitation, infiltration, runoff, and subsurface flow. Movement of water within the water cycle is the subject of the field of hydrology.
Water sensitive urban design
Seeks to minimise the extent of impervious surfaces and to mitigate changes to the natural water balance, through on-site reuse of the water as well as through temporary storage. Its objectives are to protect natural systems, integrate stormwater treatment into the landscape, protect water quality, and reduce run-off and peak flows and to add value while minimising development costs.
(CSIRO urban stormwater, www.publish.csiro.au/samples/urbanstorm.pdf).
Water use efficiency Using water efficient fixtures and/or adopting water use practices or behaviour patterns that produce the same water service but use a smaller quantity of water.
WATHNET A program for simulating water supply headworks systems. It uses network linear programming to allocate water from multiple sources to competing demands making allowance for capacity and operational constraints.
WELS The Water Efficiency Labelling and Standards (WELS) Scheme commenced on 1 July 2006. It is a joint initiative of the Australian, State, and Territory governments.
Whole-of-society costs
Include all capital and operating costs and in the case of demand management options, include those costs associated with marketing, project management and evaluation of individual options.
WSAA Water Services Association of Australia

Guide to Demand Management References – page 1
References Australian Bureau of Statistics, 2008, Australian historical population statistics, Cat.no. 3105.0.65.001, ABS, Canberra.
Australian Bureau of Statistics, 2006, Census of Population and Housing, ABS, Canberra.
Australian Bureau of Statistics, 2006, Census of Population and Housing – Basic Community Profiles, ABS, Canberra.
Australian Bureau of Statistics, 2002, Domestic Water Use, New South Wales, Cat. no. 4616.1, ABS, Canberra.
Australian Bureau of Statistics, 2003, Domestic Water Use for Western Australia, Cat. no. 4616.5.55.001, ABS, Canberra.
Australian Bureau of Statistics, 2004, Domestic Water Use and Energy, South Australia, Cat. no. 4618.4, ABS, Canberra.
Australian Bureau of Statistics, 2007, Environmental Issues: people’s views and practices, Cat. No. 4602.0, ABS, Canberra.
Australian Bureau of Statistics, 2008, Environmental issues: energy use and conservation, Cat. No. 4602.0, ABS, Canberra.
Australian Bureau of Statistics, 2008, Household and Family Projections, Australia, 2006 to 2031, Cat. no. 3236.0, ABS, Canberra.
Australian Bureau of Statistics, 2008, Population Projections, Australia, 2006 to 2101, Cat. no. 3222.0, ABS, Canberra.
Australian Bureau of Statistics, 2002, Regional Data for Northern Territory, Cat No. 4602.0, ABS, Canberra.
Australian Bureau of Statistics, 1991, 1996, & 2001, Regional Data for South Australia, Cat No. 1362.4, ABS, Canberra.
Australian Bureau of Statistics, Website. http://www.abs.gov.au/
ACT Government http://www.thinkwater.act.gov.au/.
Australian Government 2007, Best Practice Regulation Handbook, Canberra.
AEPCA, 2004, A Best Practice Guide to Measurement and Verification of Energy Savings. A companion document to A Best Practice Guide to Energy Performance Contracts. Australasian Energy Performance Contracting Association.
Alcamo, J., Ribeiro, T., 2001, Scenarios as tools for international assessments. Environmental Issue Report, No. 24, Experts' corner report: Prospects and Scenarios No. 5. Report prepared for the European Environment Agency.
American Water Works Association, 1994, Integrated Resource Planning: A Balanced Approach to Water Resources Decision-Making, Prepared for American Water Works Association (AWWA) Research Foundation by Barakat and Chamberlin, American Water Works Association, Denver, Colorado, USA.
American Water Works Association, 2001, Water Resources Planning Manual, American Water Works Association, Denver, Colorado, USA.
Ashley, RM., Blackwood, DJ., Butler, D., & Jowitt, P., 2004, Sustainable Water Services: A Procedural Guide, IWA Publishing.
Australian Greenhouse Office, 2003, Renewable Opportunities: A Review of the Operation of the Renewable Energy (Electricity) Act 2000, Canberra.
Australian Water Technologies Pty Ltd, 2001, Evaluation of Shellharbour Residential Retrofit Program 1 and 2. Report prepared for Sydney Water Corporation.
AWWA, 2006, Water Conservation Programs: A Planning Manual. AWWA Manual.
References – page 2 Guide to Demand Management
Beatty, R., O'Brien, S., and Beatty, K., 2006, Fifteen Years of Drought, Demand Management and Pricing Reform in Urban Water. What's Gone Right, What's Gone Wrong and What's Needed for the Future? Enviro 06 Conference, Melbourne, May.
Beatty, R., Chapman, S., & Maddaus, W., 2002, Benefit Cost Analysis with an End Use Model, Proceedings AWWA Water Sources Conference, Las Vegas, Jan.
Beatty, K., Roberts, P., et al., 2008, Monitoring Trends in Water Demand in Metropolitan Melbourne – An Essential Component in the Demand Management Effort. 3rd National Water Efficiency Conference. Gold Coast, Australia, Australian Water Association.
Beecher J., 1995, Integrated Resource Planning Fundamentals, Journal American Water Works Association 87(6) 34-48.
Beecher J., 1996, Integrated resource planning for water utilities. Water Resources Update, No. 104, Summer.
Billings, RB. & Vaughan , JC., 1996, Forecasting Urban Water Demand, American Water Works Association, Denver, Colorado.
Birrell, B., Rapson, V., & Smith, T., 2005, 'Impact of demographic change and urban consolidation on domestic water use. WSAA Occasional Paper No 15.
Botica, R. & White, S., 1996, Kalgoorlie–Boulder: The Water Efficient City, Water. The Journal of the Australian Water and Wastewater Association, 23(5) 14–17.
California Public Utilities Commission, 2001, California Standard Practice Manual: economic analysis of demand-side programs and projects.
California Urban Water Conservation Council, 2000, BMP Costs and Savings Study: A Guide to the Data and Methods for Cost Effectiveness Analysis of Urban Water Conservation Best Management Practices, The California Urban Water Conservation Council, USA.
Carson L. & Gelber, K., 2001, Ideas for Community Consultation: A report prepared for the NSW Department of Urban Affairs and Planning, February 2001.
Carson, L. & Hart, P., 2005, ‘What Randomness and Deliberation can do for Community Engagement’ International Conference on Engaging Communities, Brisbane, Australia, 14–17 August [http://www.activedemocracy.net/ accessed 29 Oct 2006].
Carson, L. & Hartz–Karp, J., 2005, Adapting and Combining Deliberative Designs: Juries, Polls, and Forums’ in J. Gastil, and P. Levine (Eds.) The Deliberative Democracy Handbook: Strategies for Effective Civic Engagement in the Twenty–First Century, San Francisco: Jossey–Bass, pp.120–138.
Checkland, P., 2001, Soft Systems Methodology in Rational Analysis for a Problematic World Revisited J. Rosenhead and J. Mingers (Eds.). Brisbane. John Wiley and Sons Ltd.
Commonwealth of Australia, Greening Whitegoods http://www.energyrating.gov.au/library/index.html
Cordell, D., Day, D., Milne, G., Robinson, J., Sarac, K., White, S., Shipton, B., Maheepala, S., & Mitchell, G., 2002, Melbourne End Use and Water Consumption Influences Study – Volume 1. Prepared by the Institute for Sustainable Futures and CSIRO for the Water Resources Strategy Committee for the Greater Melbourne Area.
Cordell, D., Robinson, J., & Loh, M., 2003, Collecting Residential End Use Data from Primary Sources: Do's and Don’ts, Efficient 2003: Efficient Use and Management of Water for Urban Supply Conference, Tenerife, 2–4 April 2003.
CRC for Water Quality and Treatment, 2006, Community Views on Water Shortages and Conservation, Research Report 28.
CSIRO Urban Water Program, 2000, Valuing externalities: a methodology for urban water use.
CSIRO Urban Water Program, 2003, Recommendations for developing a framework for assessing sustainability of urban water systems.
Cubillo, F., 2003, Drought, Risk Management and Reliability, Efficient2003, Tenerife, Spain.

References
Guide to Demand Management References – page 3
Day, D. & White, S., 2000, Evaluation of the Smart Showerhead Program. Institute for Sustainable Futures, University of Technology, Sydney, Report prepared for the Sustainable Energy Development Authority and Sydney Water Corporation.
Day, D., Sarac, K., Carew, A., & White, S. 2000, Evaluation of the Rous Regional Demand Management Strategy, Report prepared for Rous County Council, Lismore, NSW.
Day, D. & Campbell, S., 2002, Evaluation of the Demand Reduction for the 'Every Drop Counts' Residential Retrofit Program. Institute for Sustainable Futures, University of Technology, Sydney, Report prepared for Sydney Water Corporation.
De Marchi, B., Funtowicz, S., Lo Cascio, S,. & Munda, G., 2000, Combining participative and institutional approaches with multi–criteria evaluation. An empirical study for water issues in Toina, Sicily, Ecological Economics. 34(2) 267–282.
Department of Energy, Utilities and Sustainability, 2007, NSW Water and Energy Savings Funds Fact Sheet, February.
Department of Environment and Conservation, NSW, 2004 Does your project make a difference? http://www.environment.nsw.gov.au/community/projecteval.htm
Dziegielewski, B., Kiefer, JC., Opitz, EM., Porter, GA., Lantz, GL., DeOro, WB., Mayer, PW., & Nelson, JO., 2000, Commercial and Institutional End Uses of Water. AWWA Research Foundation.
Dziegielewski, B., Opitz, EM., Kiefer, JC., and Baumann, DD., 1992, Evaluating Urban Water Conservation Programs: a procedures manual, AWWA.
Enhance Management, 2004, Attitudes Towards Water Consumption and Water Saving Devices, Report prepared for Gold Coast Water, Gold Coast, Australia, September.
Erlanger P. & Neal B., 2005, Framework for Urban Water Resource Planning, WSAA Occasional Paper No. 14, June 2005, WSAA.
Fane, SA., Blackburn, N., & Chong, J., 2010a, Sustainability Assessment in Urban Water Integrated Resource Planning, Prepared by the Institute for Sustainable Futures, University of Technology Sydney for the National Water Commission.
Fane, SA., Patterson, J., Maheepala, S., & Kirono, D., 2010b, Incorporating climate change into Urban Water Integrated Resource Planning, Prepared by the Institute for Sustainable Futures, University of Technology Sydney and CSIRO for the National Water Commission.
Fane, SA., Robinson, D., & White, SB., 2003, The Use of Levelised Cost in Comparing Supply and Demand Side Options for Water Supply and Wastewater Treatment, Water Supply 3(3) 185-192, IWA Publishing.
Farley, M., 2005, Non–Revenue Water: International Best Practice for Assessment, Monitoring and Control, White Paper
Feldman, M., 2003, Calculating Avoided Costs Attributable to Urban Water Use Efficiency Measures: A Literature Review, Report to California Urban Water Conservation Council
Feldman, M., Maddaus, W., & Loomis, J., 2003, Calculating avoided costs attributable to urban water use efficiency measures: A literature review, California Urban Water Conservation Council, Sacramento, California.
Fyfe, J., May, D., Glassmire, J., McEwan, T., & Plant, R., 2009a, Evaluation of Water Savings from the City West Water Showerhead Exchange Program, Prepared by the Institute for Sustainable Futures, University of Technology, Sydney for City West Water, Ltd.
Fyfe, J., May, D., Glassmire, J., McEwan, T., & Plant, R., 2009b, Evaluation of Water Savings From The South East Water Showerhead Exchange Program, Prepared by the Institute for Sustainable Futures, University of Technology, Sydney for South East Water, Ltd.
Fyfe, J., May, D., Glassmire, J., McEwan, T. & Plant, R., 2009c, Evaluation of Water Savings from the Yarra Valley Water Showerhead Exchange Program, Prepared by the Institute for Sustainable Futures, University of Technology, Sydney for Yarra Valley Water, Ltd.
References – page 4 Guide to Demand Management
Fyfe, J., May, D., & Turner, A., 2010a, Techniques for estimating water saved through demand management and restrictions, Prepared by the Institute for Sustainable Futures, University of Technology, Sydney for the National Water Commission.
Fyfe, J., May, D., Turner, A., & White, S., 2010b, Complementary analytical techniques for urban water forecasting in IRP, Prepared by the Institute for Sustainable Futures, University of Technology, Sydney for the National Water Commission.
George Wilkenfeld and Associates Pty Ltd., 2003, A Mandatory Water Efficiency Labelling Scheme for Australia, Final Report prepared for Environment Australia, Sydney.
George Wilkenfeld and Associates Pty Ltd., 2005, The Scope for Minimum Water Efficiency Standards for Labelled Products, prepared for the Department of Energy, Utilities and Sustainability, NSW
Government of Victoria, 2007, Victorian Guide to Regulation, Melbourne, Department of Treasury and Finance.
Gleick, PJ., Haasz, D., Henge–Jeck, C., Srinivasan, V., Wolff, G., Kao Cushing, K., & Mann, A., 2003, Waste not, Want not: the potential for urban water conservation in California. Oakland, California, Pacific Institute for Studies in Development, Environment and Security.
Guj, P. & Werner, L., 1990, Project Evaluation Manual: A Training Aid in the Preliminary Evaluation of Water-related Investment, Australian Water Resources Council, Water Management Series No.19.
Hanke, S., 1981, The marginal cost of water supply, Water Engineering and Management Vol. 120.
Hanley, N. & Spash, S., 1993, Cost-benefit Analysis and the Environment, Edward Elgar Publishing, Cornwall.
Harberg, RJ., 1997, Planning and Managing Reliable Urban Water Systems. Denver, Colorado, American Water Works Association.
Harrington, L., & Kleverlann, P., 2003, A Third Report into the Energy Efficiency Trends of Major Household Appliances in Australia from 1993 to 2001, Report No 2003/05 prepared by Energy Efficient Strategies and Energy Consul for Australian Greenhouse Office, February, Canberra.
Herriman, J., Plant R., & Chong J., 2007, Yarra River Values: a Citizens’ Forum, held in Melbourne, 1-3 December 2006. Report prepared for the Victorian Smart Water Fund.
Herrington, P., 1987, Pricing of Water Services. OECD, Paris.
Herrington, P., 2005, The Economics of Water Demand-Management, in Water Demand Management, D. Butler and F. Memon (Eds.). International Water Association.
Howe, C. & White, S., 1999, ‘Integrated Resource Planning for Water and Wastewater: Sydney Case Studies’, Water International, 24 (4) 356–362.
Hunter Water, 2005, Integrated Water Resource Plan: Annual Report 2004-05, August 2005
Institute for Sustainable Futures, 1999a, Reducing Wastewater in the Upper Blue Mountains: A Least Cost Planning Study for the Upper Blue Mountains Wastewater Strategy, for Sydney Water Corporation, Sydney, Australia.
Institute for Sustainable Futures, 1999b, Sydney Water Illawarra Least Cost Planning Study, Draft Report for Sydney Water Corporation, Sydney, Australia.
Institute for Sustainable Futures & CIE, 2004, Framework for the evaluation of options for the Metropolitan Water Strategy, Report Prepared for the NSW Dept of Infrastructure, Planning and Natural Resources, Sydney.
IPMVP Committee, 2002, International Performance Measurement and Verification Protocol IPMVP. Concepts and Options for Determining Energy and Water Savings – Volume I. DOE/GO–102002–1554, Office of Energy Efficiency and Renewable Energy, US Department of Energy.
International Water Association, 2000, The Blue Pages: Losses from Water Supply Systems – Standard Terminology and Recommended Performance Measures, Oct.
John Wilson and Partners Pty Ltd, 2004, Maroochy Water Services: Rainwater tank rebate scheme, March 2004, Revision 3.
References
Guide to Demand Management References – page 5
Joubert, A., Stewart, TJ., & Eberhard, R., 2003, 'Evaluation of Water Supply Augmentation and Water Demand Management Options for the City of CapeTown', Journal of Multi-Criteria Decision Analysis, vol. 12, pp. 17-25.
Karamouz, M., Szidarovszky, F., & Zahraie, B., 2003, Water Resources Systems Analysis, Lewis Publishers, Boca Raton.
Keeney, R., 1982, Decision Analysis: An Overview, Operations Research, 30(5) 803–838.
Kindler, J. & Russell, CS. (eds.), 1984, Modeling Water Demands. Academic Press, London.
Kidson, R., Spaninks, F., et al., 2006, Evaluation of water saving options: examples from Sydney Water's demand management programs. Water Efficiency 2006. Ballarat.
Lee, L., Plant, R., & White S., 2008, Think Water, Act Water: evaluation of ACT Government’s water demand management program. [prepared for Territory and Municipal Services (TAMS)], Institute for Sustainable Futures, UTS, Sydney.
Levin, E., Carlin, M., Maddaus, W., 2005, 'Defining the conservation potential for San Francisco’s 28 wholesale customers', Efficient2005, Santiago, Chile.
Loh, M., & Coghlan, P., March 2003, Domestic Water Use Study in Perth, Western Australia 1998–2001. Report prepared for Water Corporation, Perth, Western Australia.
Lundie S., Peters G., & Beavis, P., 2004, Life Cycle Assessment for Sustainable Metropolitan Water Systems Planning, Environmental Science and Technology 38(13) 3465–3473.
Lundie, S., Ashbolt, N., Livingston, D., Lai, E., Kärrman, E., Blaikie, J., & Anderson, J., 2005, Sustainability Framework: Methodology for Evaluating the Overall Sustainability of Urban Water Systems, Centre for Water and Waste Technology, School of Civil Engineering, University of New South Wales, Kensington, NSW.
Mackenzie Mohr, Doug, Community based social marketing http://www.cbsm.com
Macy P., & Maddaus W., 1989, Cost benefit analysis of conservation programs, AWWA Journal, 81(3) 43–47, March.
Maddaus, W., 1999, ‘Realizing the Benefits from Water Conservation’ Water Resources Update, 114, Winter.
Maddaus, W., Gleason, G., & Darmody, J., 1996 Integrating Conservation into Water Supply Planning, Journal American Water Works Association, 88(11) 57–67, AWWA, Denver, Colorado, USA.
Mayer, PW., Deoreo, WB., Towler, E. and Lewis, DM., 2003, Residential Indoor Water Conservation Study: evaluation of high efficiency indoor plumbing fixture retrofits in single-family homes in the East Bay Municipal Utility District service area, Prepared for East Bay Municipal Utility District and The United States Environmental Protection Agency.
Menke, K. and Woodwell, J., 1990, Water Productivity and Development: Strategies for More Efficient Use, Rocky Mountain Institute, Colorado.
Metropolitan Water Directorate of the Cabinet Office. The Metropolitan Water Plan, http://www.waterforlife.nsw.gov.au
Mitchell, C., Fane, S., Willetts, J., Plant, R., & Kazaglis, A., 2007, Costing for Sustainable Outcomes in Urban Water Systems: A Guidebook, CRC for Water Quality and Treatment Research Report No. 35, ISBN 1876616601
Mitchell, C. & White, S., 2003, Forecasting and backcasting for sustainable urban water futures, Water 30(5), August.
Mitchell, C., Turner, A., Cordell, D., Fane, S., & White S., 2004, Water conservation is dead: long live water conservation, 2nd IWA Leading Edge Conference on Sustainability in Water Limited Environments, Sydney 8–10 Nov. 2004.
Mitchell, VG., 2004, Integrated Urban Water Management: A review of current Australian practice. CSIRO Urban Water.

References – page 6 Guide to Demand Management
Montgomery Watson, 2000, Improving Water Use Efficiency in Queensland’s Urban Communities, report prepared for the Queensland Department of Natural Resources, Nov. 2000.
Neal, B., Meneses, C., et al., 2010, The impact of water restrictions on regional urban demand in the 2006/07 drought. OzWater 2010. Brisbane, AWA: 8.
New South Wales Treasury, 1997, Economic Appraisal of Capital Works: Principles and Procedures Simplified Sydney, NSW Government, March.
NSW Government 2006, Metropolitan Water Plan 2006, http://www.waterforlife.nsw.gov.au/about_water_for_life/metropolitan_water_plan.
NSW Government, 2004, Metropolitan Water Plan 2004.
NSW Government, 2009, NSW Water Supply and Sewerage: Benchmarking Report. NSW Department of Water and Energy. Sydney, NSW
NSW Government, Independent Expert Panel on Environmental Flows in the Hawkesbury–Nepean http://www.dnr.nsw.gov.au/water/pdf/h-n_forum2004water_sydney.pdf.
NSW Government, BASIX http://www.basix.nsw.gov.au.
NSW Treasury, 2007, NSW Government guidelines for economic appraisal, Government of NSW. Plant R., Kazaglis A., & Simard, S., 2006, Every Drop Counts Business Program Water Savings and Costs: Independent Verification of Savings Calculation Methods. Report prepared for Sydney Water Corporation.
Queensland Department of Natural Resources, 2000, Improving Water Use Efficiency in Queensland’s Urban Communities. Prepared by Bill Maddaus, Brett Stewart, Jack Weber, Shane O’Brien, Montgomery and Watson for QDNR, November.
Queensland Treasury, 2002, Guidelines for financial and economic evaluation of new water infrastructure in Queensland, Queensland Government.
Renn, O., 1999, A Model for an Analytic–Deliberative Process in Risk Management, Environmental Science and Technology, vol. 33, no. 18, pp. 3049–3055.
Riedy, C., 2003, ‘Vintage stock modelling of domestic appliances: dealing with uncertainties’, paper presented to the 3rd International Conference on Energy Efficiency of Domestic Appliances and Lighting, Turin, Italy, 1-3 October.
Roberts P., 2004, 2003, Appliance Stock and Usage Patterns Survey, Yarra Valley Water, Melbourne, November.
Roberts, P., 2005, 2004, Residential End Use Measurement Study, Yarra Valley Water, Melbourne.
Robinson, J., 1982, 'Energy Backcasting' Energy Policy, 10(4) 337–344.
Roy, B., 1990, Decision-aid and decision making, in Readings in multiple-criteria decision aid. C. A. Bana e Costa. Springger-Verlag, Berlin-Heidelberg pp17–35.
Roy, B., 1991, The Outranking Approach and the Foundations of ELECTRE Methods. Theory and Decision, 31 pp49-73.
Saaty, TL., 1980, The Analytic Hierarchy Process: Planning, Priority Setting, Resource Allocation. McGraw-Hill, New York.
Sarac, K., Day, D., & White, S., 2000, Evaluation of the Shellharbour Residential Retrofit Program, Report for Sydney Water Corporation.
Snelling, C., Mitchell, C., Campbell, S., & Beatty, K., 2005, Melbourne End Use and Options Model, Volume 4: End use Sub–model, prepared by the Institute for Sustainable Futures for CSIRO, City West Water, South East Water, Yarra Valley Water and Melbourne Water.
Snelling, C. & White, S., 2006, Gold Coast Water: Evaluation of the Water Demand Management Programs, Institute for Sustainable Futures, Sydney.
Snelling, C., Simard, S., White, S., & Turner, A., 2006, Evaluation of the water demand management program. Report prepared for Gold Coast Water and Qld EPA.

References
Guide to Demand Management References – page 7
Snelling, C., Turner, A., Riedy, C., White, S., & Cummings, S., 2007, Where does the water go? Best practice stock modelling for water using appliances, Proceedings of Efficient2007, 21-23 May, Korea, Vol I., pp307–314.
Social Change Media: Seven Doors Social Marketing Approach http://www.media.socialchange.net.au/strategy/
Spaninks, F., 2010, Estimating the savings from water restrictions in Sydney. OzWater 2010. Brisbane, AWA: 7.
Stinchcombe, K., Wildman, K., & Wiltshire, M., 2005, Showerhead Retrofit Schemes: A Social Marketing Perspective, Water, March, 32(2) 74–81.
Stockholm Environment Institute, 2007, Water evaluation and planning system user guide, Boston Tellus Institute, Stockholm Environment Institute, Boston, USA.
Swart, RJ., Raskin, P., & Robinson, J., 2004, The Problem of the Future: Sustainability Science and Scenario Analysis, Global Environmental Change Part A, 14(2) 137–146.
Swisher, JN., Jannuzzi, G de M., & Redlinger, RY., 1997, Tools and Methods for Integrated Resources Planning: improving energy efficiency and protecting the environment. Working Paper no. 7, UNEP Collaborating Centre on Energy and Environment, Riso National Laboratory, Roskilde, Denmark.
Sydney Water Corporation, http://www.greenhousegas.nsw.gov.au/
Sydney Water Corporation, http://www.waterforlife.nsw.gov.au/about/metropolitan_water_plan
Sydney Water Corporation, Water Conservation and Recycling Implementation Report Summary 2003–2004. Sydney Water Corporation, 2005, The Implementation Report: Sydney Water Corporation, http://www.sydneywater.com.au/Publications/Reports/WaterConservationAnnualReport2005.pdf#Page=1
Sydney Water Corporation, Water Conservation and Recycling Implementation Report 2005–2006. Taverner Research Co., 2000, Mt Victoria Retrofit Program: Follow up study. Report prepared for Australian Water Technologies Pty Ltd.
Sydney Water Corporation, 2009, Water Conservation and Recycling Implementation Report 2008-09.
Taylor, A., 2005, Guidelines for Evaluating the Financial, Ecological and Social Aspects of Urban Stormwater Management Measures to Improve Waterway Health. CRC for Catchment Hydrology, Melbourne.
Tellus Institute, 2000, ‘Best Practices Guide: Integrated Resource Planning for Electricity, The Energy Group, Institute of International Education, Washington DC.
Turner, A., 2003, The Role of Effluent Reuse in Sustainable Urban Water Systems: Untapped Opportunities. National Recycling in Australia Conference, Brisbane, 2003.
Turner, A. & White, S., 2003, ACT Water Strategy: Preliminary demand management and least cost planning assessment, Institute for Sustainable Futures, University of Technology, Sydney, Report prepared for ACTEW Corporation, Canberra, October.
Turner, A., Campbell, S., White, S. & Milne, G., 2003a, Alice Springs Water Efficiency Study Stages I and II–Final Report–Volume I Report prepared by the Institute for Sustainable Futures for NT Government, Australia July 2003.
Turner, A., Campbell, S., & White, S., 2003b, End Use Modelling and Water Efficiency Program for Arid Zones: The Alice Springs Experience. Efficient 2003: Efficient Use and Management of Water for Urban Supply Conference, Tenerife, 2-4 April 2003.
Turner, A., Campbell, S., & White, S., 2004, Methods Used to Develop an End Use Model and Demand Management Program for an Arid Zone. Biennial World Water Congress, Marrakech, Morocco 19–24 September 2004.
Turner, A., Willetts, J., & White, S., 2006a, ‘The International Demand Management Framework – Stage 1 – Final Report’, report prepared by the Institute for Sustainable Futures for Canal de Isabel II, Spain
References – page 8 Guide to Demand Management
Turner, A., Giurco, D., & White, S., 2006b, The Central Highlands Water Demand Management Implementation Planning Study. Report prepared for Central Highlands Water, Institute for Sustainable Futures, Sydney.
Turner, A., White, S., Beatty, K., & Gregory, A., 2005a, Results of the Largest Residential Demand Management Program in Australia, International Conference on the Efficient Use and Management of Urban Water, Santiago, Chile, 15–17 March.
Turner, A., White, S., & Bickford, G. 2005b, The Canberra Least Cost Planning Case Study, International Conference on the Efficient Use and Management of Urban Water, Santiago, Chile, 15–17 March 2005.
Turner, A., Willetts, J., Fane, S., Giurco, D., Kazaglis, A., and White, S. 2008, Guide to Demand Management, Prepared by the Institute for Sustainable Futures, University of Technology Sydney for Water Services Association of Australia, Inc.
UK Environment Agency, 2003, Water Resources Planning Guideline. Version 3.3. UK Environment Agency, 2008, Water Resources Planning Guideline. UK Water Industry Research, An Improved Methodology for Assessing Headroom UKWIR Report, 02/WR/13/2.
United Nations, 2003, Guide to preparing urban water efficiency plans, W. Maddaus (Ed.), Water Resources Series. Vol.83, Economic and Social Commission for Asia and the Pacific (ESCAP).
United States Environmental Protection Agency (US EPA), 2000, IWR-MAIN Model and Knowledge Base, US Army Corps of Engineers http://www.iwrmain.com.
US Department of Energy, 2002, International Performance Measurement and Verification Protocol: Concepts and Options for Determining Energy and Water Savings, Volume 1, March, US Department of Energy, USA.
Van de Kerkhof M., Hisschemoller M., & Spanjersberg M., 2002, 'Shaping Diversity in Participatory Foresight Studies: Experiences with Interactive Backcasting in a Stakeholder Assessment on Long–Term Climate Policy in The Netherlands. Greener Management International 37, Spring, 85–99.
Vanclay, F., 2004, Impact assessment and the triple bottom line: competing pathways to sustainability? In Cheney, H., Katz, E. and Solomon, F. (Eds) Sustainability and Social Science Round Table Proceedings, Institute for Sustainable Futures, Sydney and CSIRO Minerals, Melbourne, July 2004.
Vickers, A., 2001, Handbook of Water Use and Conservation: Homes, Landscapes, Businesses, Industries, Farms, WaterPlow Press, Amherst, USA.
Viswanathan, MN., 1991, Forecasting Water Demand Using Weather Data, UWRAA Research Report 30.
WBWC, 2004, managing and reducing water losses from water distribution systems, Manuals 1 – 10. Wide Bay Water Corporation and Qld. Govt. Environmental Protection Agency. Westcott, R., 2003, A Scenario Approach to Demand Forecasting, Efficient2003 2nd International Conference in Efficient Use and Management of Water for Urban Supply, Tenerife, Spain, April 2003
Whitcomb, J., Hoffman, B., & Ploeser, J., 2001, BMP 9 Handbook: A guide to implementing commercial, industrial and institutional water conservations programs. California Urban Water Conservation Council, Sacramento.
White, S. & Howe, C., 1998, Water Efficiency and Reuse: a Least Cost Planning Approach, proceedings of the 6th NSW Recycled Water Seminar Australian Water and Wastewater Association, Sydney Australia
White, S. (ed), 1998, Wise Water Management: A Demand Management Manual For Water Utilities, Water Services Association of Australia Research Report No. 86, NSW Department of Land and Water Conservation, Australia.
White, S., 1994, Blueprint for a Water Efficient City – Report of the Kalgoorlie–Boulder Water Efficiency Study, report prepared for the Water Authority of W.A., Preferred Options Asia–Pacific Pty Ltd, Lismore NSW, December.

References
Guide to Demand Management References – page 9
White, S., 1997, The Rous Regional Water Efficiency Program: Final Report of the Rous Regional Demand Management Strategy. Report prepared for Rous County Council, Preferred Options Asia–Pacific Pty Ltd, Lismore NSW, March,
White, S., 1999, Integrated resource planning in the Australian water industry, Proceedings of CONSERV99, American Water Works Association, Monterey, California, February.
White, S., Campbell, D., Giurco, D., Snelling, C., Kazaglis, A., Fane, S., with A. Deen & J. Martin, 2006, Review of the Metropolitan Water Plan: Final Report, [prepared for the NSW Cabinet Office], Institute for Sustainable Futures, UTS, Sydney.
White, S., Fane, S., Giurco, D., & Turner, A., 2007, ‘Putting the economics in its place: decision making in an uncertain environment’, in Christos Zografos and Richard B. Howarth (eds) Deliberative Ecological Economics, Oxford University
White, S., et al., 2006, ‘Review of the Metropolitan Water Plan: Final Report’, report prepared for NSW Cabinet Office, Sydney, April. http://www.waterforlife.nsw.gov.au/about/metropolitan_water_plan
White, S & Fane, S., 2002, Designing Cost Effective Water Demand Management Programs in Australia, Water Science and Technology, 46(6–7) 225-232, IWA Publishing.
White, S., Milne, G., & Riedy, C., 2004, 'End Use Analysis: Issues and Lessons' Science and Technology: Water Supply, 4(3) 57–65.
White, S., Robinson, J., Cordell, D.J., Jha, M., Milne, G., 2003, Urban Water Demand Forecasting and Demand Management: Research Needs Review and Recommendations, Occasional Paper No. 9, Water Services Association of Australia.
Zhou, SL., McMahon, T., Walton, A., & Lewis, J., 2000, ‘Forecasting daily urban water demand: a case study of Melbourne’. Journal of Hydrology 236(3–4) 153–164.