Embed Size (px)
Citation preview

GUIDE TO NAVAGATING THIS DOCUMENT
Key words in this document are linked to other pages, tables, figures,
or plates. Clicking on blue highlighted words in the body of the document
with the mouse cursor will cause the screen to automatically go to a linked
page. For example, if you click on the word CONTENTS the screen will go to
the start of the table of contents of this document. To get back to where you
started, click on the right mouse button and then click on “Go Back” (try it).
Alternately, clicking on any heading in the body of the document will bring you
back to the place in the table of contents were the heading is listed. Clicking
on red text in the body of the document will take you to a related table, figure,
or plate. For example, clicking on Figure 1 will take you to Figure 1. Clicking
on the right button and then clicking on “Go Back” will take you back.
Use the “Help” menu of Acrobat Reader for more information, such as
searching for specific words in the text or changing the scale of the figures and
plates.
Good Luck.

GENESIS OF CAVE OF THE WINDS,
MANITOU SPRINGS, COLORADO
By
Fredrick George Luiszer
B.A., University of Colorado, 1987
A thesis submitted to the
Faculty of the Graduate School of the
University of Colorado in partial fulfillment
of the requirements for the degree of
Doctor of Philosophy
Department of Geological Sciences
1997
This Thesis entitled:Genesis of Cave of the Winds, Manitou Springs, Colorado
written byFredrick George Luiszer
has been approved for the Department of Geological Sciences
_____________________________
Chair of Committee
______________________________
Committee member
Date________________
The final copy of this thesis has been examined by thesignators, and we find that both content and the form
meet acceptable presentation standards of scholarly work inthe above mentioned discipline.

ABSTRACT
Luiszer, Fredrick George (Ph.D., Geology)
Genesis of Cave of the Winds, Manitou Springs, Colorado
Thesis directed by Professor Edwin E. Larson
Cave of the Winds is located 1.5 km north of Manitou Springs,
Colorado. The cave is a phreatic feature that has developed along joints
associated with the Laramide Orogeny and bedding planes of the Manitou,
Williams Canyon, and Leadville Formations. Aminostratigraphy and
magnetostratigraphy, along with geomorphologic features, were used to
determine that cave dissolution and sedimentation started ~4.5 Ma. At that
time, springs similar to those in present-day Manitou Springs were located
just south of and above the Cave of the Winds. Beneath these springs,
ascending deep-seated water, mixing with southward flowing dilute near-
surface water, formed a corrosive mixture that dissolved limestone, thus
producing cave passages up to 20-m high and 10-m wide. Other chemical
changes taking place in the zone where these two waters were mixing
resulted in the precipitation of manganese and iron oxides. In the northern
part of the mixing zone streams transported detrital sediments into the mixing
zone. With subsequent regional uplift and stream downcutting, the springs
and the underlying mixing zone moved down and to the south. Because
different parts of the mixing zone were associated with different types of
sedimentation, the movement of the mixing zone is recorded in the cave
sediments as a distinct sequence. From the oldest to the youngest, the
sediment sequence include: solution debris, iron oxide, manganese oxide,
clay, silty sand, and gravel.

A paleoclimate history of the Manitou Springs area was constructed
from environmental information associated with both the clay mineralogy of
cave sediments and mollusks collected from local alluvia. In general, the
climate before 2 Ma was wetter than present. A more detailed climate record
that spans the interval from ~1.9 to 1.7 Ma is preserved as variations in the
magnetic susceptibility of the cave sediments. These variations may record
local glaciation.

ACKNOWLEDGMENTS
I express gratitude to John Drexler for the use of his laboratory and his
feedback on the waters of Manitou Springs and related cave sediments. I
thank Peter Birkeland for the use of his laboratory and his input on the cave
clays and soils. I am grateful to Gifford Miller and his staff for determining
amino acid ratios, to Lang Farmer for the strontium isotope analysis and to
James White for the carbon and oxygen analyses. I would especially like to
thank Ed Larson, not only for the use of his laboratory, but also for editing this
manuscript and for the many years of encouragement and prodding. Grant
Carey and his employees must also be recognized for graciously giving me
access to Cave of the Winds throughout the study. I also appreciate the
access giving to me by all of the owners of the springs in Manitou Springs.
The employees of the city of Manitou Springs should also be complimented
for happily answering many questions related to this study. The assistance of
many cavers is gratefully acknowledged, especially Donald G. Davis and
Mark Maslyn, for their thought-provoking discussions and Randy Reck for his
field assistance. Without the help of the graduate students, professors, and
the staff at the Department of Geological Sciences this study would not have
been possible. A few of the many that helped are Eric Hiatt, Paul Boni, and
Emmett Evanoff. I am particularly thankful to my family and friends who gave
me the encouragement needed to accomplish this seemingly endless
endeavor.

CONTENTS
ABSTRACT
ACKNOWLEDGMENT
LIST OF TABLES
LIST OF FIGURES
LIST OF PLATES
INTRODUCTION
History Of Manitou Springs And Previous Work
History Of Cave Of The Winds And Previous Work
Purpose Of Present Study
Geology Of Manitou Springs Region
Climate And Vegetation
FIELD AND LABORATORY PROCEDURES
Water Analysis In The Field
Water Analysis In The Laboratory

Isotope Study
Clay Mineralogy
Amino Acid Dating
Paleomagnetism
Magnetic Susceptibility
Other Analysis
RESULTS AND DISCUSSION
Water Chemistry
Correlation Of Modern And Ancient Processes
Source Of The H2O
Source Of The CO2
Spring And Stream Chemistry
Genesis Of Spring End Members
Genesis Of Williams Canyon Creek Water
Genesis Of Iron Geyser Water
Genesis Of The 7-minute East Water
Genesis Of The Cave Of The Winds Water

Four Source Mixing Model
The Mixing Zone
Chemistry Of Water In The Mixing Zone
Position And Geometry Of Mixing Zone
Movement Of The Mixing Zone
Cave Sedimentation Model
Correlation of Cave-Of-The-Winds Sediments With Spring Sediments
Source Of Cave Infill
Importance Of Provenance
Red Clay
Detrital Sediments And Speleothems
Chronology Of Speleogenesis
Age Of Cave Passages
Age Of Cave Fill
Aminostratigraphy
Mollusks
Discussion Of A-I Ratios

Age Of The Alluvia
Parabolic Curve Fitting
Magnetostratigraphy
Paleomagnetic Results
Criteria For Reversal Assignment
Effects Of Post-Depositional Remanent Magnetization On Sediments
Paleomagnetic Correlation
PLIOCENE-PLEISTOCENE CLIMATE
Climate Record In Cave Sediments
Large-Scale Sediment Changes As Climate Indicators
Magnetic Susceptibility
Periodicity Of Susceptibility
Potential of Correlating Susceptibility with Climate
Pliocene-Pleistocene Mollusk Record
CONCLUSIONS
REFERENCES
APPENDIX

Location And Description Of Springs And Other Sampling Sites

TABLES
Table
1. Analytical uncertainty of selected ions in water samples
2. Isotopic data
3. Analytical data of springs and related waters
4. Oxide and elemental composition of rocks in contact with spring water
5A. Analyses of sediments being deposited by modern springs
5B. Analyses of stratigraphic column at south end of Thieves Canyon
6. Mollusk species identified, their location, and amount of shells counted
7A. Alloisoleucine and isoleucine ratios (A/I) of snails
7B. Average values and standard deviation of A/I of snails
8. Uranium-thorium and 14C dates
9. Complete paleomagnetic results of Hole 6, Grand Concert Hall
10. Chemical analysis of the magnetic grains from cave sediments and rock
samples

FIGURES
Figure
1. Location map of study area
2. Location map of springs, wells, streams, and other sampling sites
3. Schematic cross-section of Manitou Springs system
4. Piper diagram of spring and related waters
5. Plot of sodium versus chloride of selected springs and related waters
6. Plot of calcium carbonate versus the PCO2 of surface and mineral
waters
7. Plot of PCO2 and SIs for calcite and ferrihydrite versus pH of the Iron
Geyser water
8. Schematic cross section of mixing zone
9. Plot of potassium versus relative distance between springs
10. Photograph of outcrop at south end of Thieves Canyon
11. Photomicrographs of fossilized bacteria at south end of Thieves Canyon
12A. Plot of calcite, clay, silt, and sand content of limestone
12B. Plot of mineralogy of clay in limestone
12C. Plot of sand, silt, and clay content of cave sediment
12D. Plot of mineralogy of cave clay
12E. Plot of sand, silt, and clay content of surface soils and sediment from
the Nussbaum Alluvium
12F. Plot of mineralogy of surface soil clays and clay from the Nussbaum
Alluvium

13. Plot of D-alloisoleucine/L-isoleucine from snails versus age
14. Paleomagnetic correlation with stratigraphy of Grand Concert Hall
Hole 5
15. Drawing of postulated geomophological changes at Cave of the Winds
over the last 2 Ma
16. Plot of magnetic susceptibility of samples from Holes 1 and 5
17. Chart comparing insolation, magnetic susceptibility, and ocean record
versus time
18. Partial record of the Pliocene-Pleistocene climate of the Manitou
Springs area

PLATES
Plate
1. Geology map of Cave of the Winds, Manitou Springs, and vicinity
2. Map of Cave of the Winds showing sampling locations
3. Geology map of Colorado Springs and Manitou Springs area with
locations of snail and clay study collection sites
4. Stratigraphic descriptions of alluvial sites
5. Mass balance spreadsheet
6. Paleomagnetic cross-section of sampled pits and cored holes from
Grand Concert Hall and Heavenly Hall

INTRODUCTION
History Of Manitou Springs And Previous Work
Manitou Springs, which is located 10 km west of Colorado Springs
(Figure 1), is well known for the mineral springs that issue from several
locations within the city (Figure 2). Before Europeans came to Colorado,
members of several different Indian tribes revered the springs and used the
water for medicinal purposes (Daniels and McConnell, 1964). Dr. Edwin
James, a member of Major Long's expedition, examined the springs in 1820
(James, 1823). He noted that one spring was highly carbonated, had a high
calcium content and discharged ~50 gallons per minute. When John C.
Fremont visited the springs in 1843, he studied some of the calcite deposited
by the springs and measured a water temperature of ~15° C (Fremont, 1845).
Beginning almost 25 years later, the springs were studied in some detail by
members of the Hayden expeditions (Hayden, 1869, 1872, 1873, 1874). The
glowing reports generated by these expeditions, which favorably compared
the springs to the great spas of Europe, helped attract thousands of people to
the area in just a few years.
In 1872 the city of Manitou Springs was born when entrepreneurs
developed the mineral springs into Colorado's first health resort, which by
1874, had become as famous as the spas of Europe (Daniels and
McConnell, 1964). Oscar Loew of the Wheeler Expedition was the first to
accurately analyze the chemistry of the springs (Wheeler, 1875). His
analyses were quoted by many doctors, who prescribed the waters for
hydrotherapy, thus guaranteeing the continuing growth of the town as a
health resort (Solly, 1875; Denison, 1880; Peale, 1886; Crook, 1899). In the

early part of this century, because of the notion that radioactivity could cure
various diseases, interest in the springs was revitalized when it was
discovered that several of the springs were slightly radioactive (George,
1920; Shedd, 1912; Schlundt, 1914). By 1920, as hydrotherapy fell into
disuse, the springs became not much more then a curious tourist attraction.
In the last 20 years, because of the fashionable use of mineral water, the
bottling of mineral water at Manitou Springs has been somewhat successful.
In the last ten years, the citizens of Manitou Springs have recognized the
need to preserve their colorful past and have begun to restore and rebuild the
springhouses and fountains (Judith L. Hamilton, per. comm., 1993).
History Of Cave Of The Winds And Previous Work
Cave of the Winds, which is 1.5 km north of Manitou Springs, was first
discovered by Arthur B. Love in the early 1870’s (Snider, 1916). He reported
that there was no trail to the cave and there was no evidence that anyone
had ever been to the cave before he found it. This report makes Charles
Cross’s claim of discovering the cave in 1874 somewhat dubious (Snider,
1916). To further complicate the story, the Pickett brothers claimed to have
discovered the cave in 1880 (Snider, 1916), in spite of the fact that the cave
was pictured and labeled as Cave of the Winds in an 1875 issue of Harper's
Weekly (Randolph, 1875). In 1880 and 1881 large portions of the cave
became known from efforts of George W. Snider, who dug open many of the
sediment-filled passages; soon thereafter the cave was commercialized
(Davis, 1985). Geologist H. C. Hovey visited the cave in 1881. His
subsequent report throws little light on the genesis of the cave. In his report
of 1887, however, he proposed that decomposed Pikes Peak Granite was the

source for the red clay present in the cave and that it was brought into the
cave by streams (Hovey, 1887).
Strieby (1893) was the first to suggest that Cave of the Winds and the
springs of Manitou Springs were genetically related. He correlated red clay
found in limestone cavities near the springs to the red clay in Cave of the
Winds. He also presented hypotheses regarding the origin of the CO2 and
mineral water that were remarkably sound considering the paucity of
available data. Finlay (1906) put forth the hypothesis that Cave of the Winds
was dissolved by meteoric water and soil-derived CO2. He proposed that the
clay in the cave was mostly a residue from dissolved limestone. He
concluded that the cave was a vadose feature and gave a partially correct
explanation for stalagmite, stalactite, and flowstone deposition.
In his famous paper, "Features of Limestone Caverns", Bretz (1942)
states that Cave of the Winds is phreatic with no evidence of vadose activity.
Morgan (1950) suggested that the Cave of the Winds was associated with the
Laramide Orogeny and was dissolved by CO2-rich groundwater. Bianchi
(1967) indicated that the Cave of the Winds was exposed during an erosional
event related to oscillating climatic conditions during the Pleistocene.
Purpose Of Present Study
The purpose of this study is to investigate the genesis of the Cave of
the Winds. Pertinent questions concerning the formation of the cave include:
What is the chemical process responsible for the dissolution of limestone?,
What is the composition of the sediments in the cave?, How were cave
sediments transported into the cave?, What is the timing of cave formation
and sedimentation?, and Can paleoclimate be gleaned from the cave-
sediment record?.

The chemistry of cave dissolution was evaluated by analysis of
hydrogeologic and geochemical data from springs, streams, and other
associated water sources as well as analysis of sediments found at the
springs and similar sediments at Cave of the Winds. The results of these
analyses in conjunction with local geology can be used to elucidate the
process of dissolution taking place at the springs today as well as the
formation of Cave of the Winds millions of years ago. Cave sediments and
possible sediment sources were analyzed to determine the source of cave
sediments. Paleomagnetism of cave sediments and amino-acid ratios of
snails in alluvium correlated with the cave sediments were studied and used
to ascertain the timing of cave sediment deposition. Finally, the magnetic
and amino-acid investigations led to the construction of a hypothesized
climate record of the Manitou Springs area during the last ~3.7 my.
Geology Of Manitou Springs Region
A large block of Paleozoic sediments (Plate 1) hosts the springs of
Manitou and the Cave of the Winds. The Ute Pass Fault, a reverse fault that
is the southwest boundary of the block, places Precambrian crystalline rocks
against Paleozoic sediments. The northwest boundary between the
Precambrian crystalline rocks and Paleozoic sediments is an erosional
surface. The eastern boundary is the Rampart Range Fault. The Paleozoic
sediments in the block generally dip gently to the southeast (Bianchi, 1967).
The Pikes Peak Granite and migmatites crop out to the south, west, and
north of the block and underlie the block. The sediments in the Paleozoic
block consist of limestone, siltstone, sandstone, conglomerate, and shale
(Plate 1).

The geology in the Manitou Springs area has been studied in detail by
various authors. Selected publications that have extensive references to
early works are listed here. Morgan (1950) described in detail the
stratigraphy of Williams Canyon. Bianchi's (1967) thesis covered a larger
area and included a geologic map with detailed structure of the Manitou
Springs area and an extensive bibliography. A petrographic study of the
Manitou Formation by Dinkmeyer (1977) is comprehensive and also includes
an extensive reference list.
Climate And Vegetation
The climate in the Manitou Springs area is semiarid (Bianchi, 1967).
The mean annual temperature of nearby Colorado Springs is 9.3° C. The
mean annual temperature of Manitou Springs is probably slightly lower
because it is ~100 m higher in elevation and has lower insolation because of
its location in a deep valley. The mean annual precipitation at Colorado
Springs is 40.0 cm, most of which falls between April and September in the
form of rain (Blair, 1975). At higher elevations, especially on the Pike Peak
Massif, temperatures are lower and precipitation is greater.
The vegetation in the study area is highly variable, comprising several
vegetation zones. The following descriptions are adapted from Netoff (1977).
The eastern part of the study area can be classified as mostly grasslands.
However, urban development, which started in the 1870’s and continues
unabated to this day, has covered most of the area with housing
developments and industrial parks. Manitou Springs and Cave of the Winds
are in the lower montane forest zone. Upper montane forest and subalpine
forest zones can be found ~10 km west of Manitou Springs at higher
elevations. The summit of Pikes Pike, which is ~12 km west of Manitou

Springs, is in the alpine tundra zone.

FIELD AND LABORATORY PROCEDURES
Water Analysis In The Field
Figure 2 shows the general locations of the sampling sites. Detailed
descriptions and specific locations of the springs and samplings sites are
compiled in the appendix. Immediately after collection, the samples were
vacuum-filtered by means of 0.45 µm membrane filters. The filtered water
samples were placed into two 500-ml polyethylene bottles. Those analyzed
for anions were stored in bottles cleaned in RBS-PF, a phosphate-free
cleanser. These samples, which were transported to the lab in an ice-filled
cooler, were transferred to a refrigerator that was maintained at ~4.5° C.
Anion analysis was performed within two days following collection. The
samples analyzed for cations were stored in bottles that were previously
soaked overnight in 2% nitric acid to remove any possible metal
contamination. The cation samples were acidified with 4 ml of 8 M double-
distilled nitric acid. Cations were determined within 2 months of collection.
The spring waters were collected as close to their sources as possible
to preclude the possibility of contamination from spring basins, piping, or
surface waters. At springs where the water was flowing into the bottom of
basins, conductivity, temperature, pH and Eh were measured in the basin. In
these springs the ampules used to measure dissolved oxygen (DOX) were
filled well below the water surface to prevent contamination from atmospheric
oxygen. In the springs where the water fell from pipes into basins, a flexible
Nalgene™ hose was attached to the piping. The hose was used to fill a
clean glass beaker, in which conductivity, temperature, pH and Eh were

measured. At these springs the water was allowed to flow into the bottom of
the beaker for several minutes before sampling the bottom of the beaker for
DOX measurement. This procedure helped prevent contamination from
atmospheric oxygen.
Water collected for the measurement of dissolved CO2 (DCO2) and
alkalinity was collected in the same manner as the DOX samples. This
helped prevent the outgassing of CO2 . The alkalinity was measured within
minutes of collection. CO2 was measured within seconds of collection to
minimize CO2 loss.
An Orion 290A temperature-compensated pH/voltmeter was used to
determine pH, Eh, and CO2 in the field. To maintain an accuracy of ± 0.05
pH units, the pH probe was calibrated at the beginning of each day with pH
4.00 and pH 7.00 buffers. The thermocouple on the pH meter was used to
record the temperature of the spring waters. This thermocouple was checked
for accuracy in an ice bath (0.0° C) and was found to be within ± 0.1° C. A
platinum-strip electrode and Corning calomel electrode were used to
measure the Eh. The conductivity was measured in the field with a
temperature-compensated Hach Conductivity/Total Dissolved Solids (TDS)
meter. To maintain an accuracy of ± 1%, a 1000-ppm NaCl solution was
used at the beginning of each day to calibrate the conductivity meter. CO2
was measured with a Fisher ion-selective probe. Laboratory calibration of the
CO2 probe indicated that it had an accuracy of ~10%. However, because the
spring waters are outgassing CO2, the measured DCO2 of the springs may
be much lower than the actual value. Total alkalinity was determined by
titration with sulfuric acid. DOX was measured with a Hach DR-100
colorimeter. Both the total alkalinity and DOX measurements have a ± 5%
accuracy.

Water Analysis In The Laboratory
The anion contents–fluoride (F-), chloride (Cl-), bromide (Br-), nitrite
(NO2-), nitrate (NO3
-), phosphate (PO43-), and sulfate (SO4
2-)–were
determined by means of a 4500i ion chromatograph with an AS-9 column
(see Table 1 for error). The cation contents–lithium (Li+), sodium (Na+),
potassium (K+), magnesium (Mg++), and calcium (Ca++)–were determined
on the same chromatograph equipped with a Dionex CS-3 column (see Table
1 for error). A set of standards was run before and after each batch of
unknowns for the purpose of calibration and quality control. The silica (SiO2),
total iron (Fe3+), manganese (Mn2+), and boron (B) contents were analyzed
by means of a Hach DR-3000 Spectrophotometer (see Table 1 for error).
Isotope Study
Water for strontium-isotope analysis was collected in two-liter
polyethylene bottles from the Ute Magnetic Spring, Cheyenne Spring,
Western 7-Minute Spring, Iron Geyser (see Figure 2 for spring locations) and
the J. A. McCullough Water tunnel (see Appendix for Pikes Peak Granite
water sample location). Additionally, for Sr-, C-, and O-isotope analysis,
fresh limestone of the Manitou Formation was collected from Ordovician
Avenue in Cave of the Winds (see Plate 2 for location of sampling site).
Gases for carbon- and oxygen-isotope analyses were collected in evacuated,
one-liter steel tanks from the Ute Magnetic, Cheyenne, Iron Geyser, and
Eastern 7-Minute Springs. 87Sr/86Sr was determined on a Finnigan-MAT6-
collector solid-source mass spectrometer utilizing the four-collector static
mode. δ13C and δ18O were determined on a SIRA Series II mass
spectrometer.

Clay Mineralogy
To ascertain the mineralogy of the clay in cave sediments, eight
samples were collected at one-meter intervals from Core #5 in the Grand
Concert Hall (Plate 2). To help identify the source of the cave clay, five
unweathered samples of the Manitou Formation were collected at 15-m
intervals from the stratigraphic section near the entrance of Hucacove Cave
(Figure 2). These bulk samples were washed with a 1 M HCl solution to
remove any soil or other clay contamination. Additionally, three soils were
sampled: a mixed A and B horizon from above the cave, a B horizon from the
Nussbaum Alluvium, and a B horizon from the Rocky Flats Alluvium (Plate 3).
The Cave of the Winds soil sample was collected from the top of the
ridge above the cave. The ~15-cm-thick soil at this sampling site mantled a
slightly weathered fractured bedrock, which was either the Leadville or
Williams Canyon Formation. The ~5-cm-thick, brownish-black A horizon was
mostly composed of pine needles in various stages of decomposition. The
~10-cm-thick, brown B horizon was a pebbly loam. Because of the poorly
defined contact between the two horizons, both were sampled together as a
combined sample. This site was devoid of granite and metamorphic clasts,
which were abundant at the alluvial sites. Microscopic examination of this
sample revealed that the sand and silt sized fractions consist of ~80% quartz,
~10% biotite, and ~10% feldspar. This mineral assemblage, which is similar
to the main components of the Pikes Peak Granite, indicate that the soil at
this site is mainly developed from weathered Pikes Peak Granite that has
been transported to the site by wind.
A soil sample was collected from a ~46-cm pit at a site that has been
mapped as Nussbaum Alluvium (Trimble and Machette, 1979). The ~15-cm-

thick A horizon consisted of a dark brown, sandy-gravely loam. The >30-cm-
thick B horizon consisted of reddish-brown, sandy-gravely clay. The gravel in
the A and B horizon consisted of lithic clasts of granite and metamorphic
rocks. At the site that has been mapped as Rocky Flats Alluvium (Trimble
and Machette, 1979), a soil sample was collected from a reddish brown B
horizon that was overlain by a ~15-cm-thick, brown A horizon. In addition to
the soil samples, a silt sample, which was assumed to contain clays similar to
those that could have been carried into Cave of the Winds by streams, was
collected from the Nussbaum Alluvium at the Black Canyon site (Plate 3).
The silt sample was collected from a snail-rich bed located ~2.5 m below the
top of the outcrop (Plate 4). The snail shells in this bed are very well
preserved, as evidenced by their aragonite tests, which would have been
dissolved or altered to calcite if there had been any significant diagenesis.
The shells and silt in this bed are probably unaltered because of the
overlying, nonporous calcrete, which would have prevented any appreciable
water/rock interaction.
Prior to grain-size and powder X-ray diffraction analysis of the
sediments the >2-mm fraction was removed from the soil samples by means
of a 2-mm sieve. Hydrogen peroxide was used to remove organic material
according to Jackson (1973). A pH 5 buffered acetic acid-sodium acetate
solution was used to remove the carbonate from the cave and soil samples
(Jackson, 1973). A rapid carbonate-removal method using a similar solution
adjusted to pH 2.5 was used on the limestone samples to prevent the
alteration of the clays and to reduce extraction time (Rabenhorst and Wilding,
1984). Samples were centrifuged and decanted followed by the addition of
distilled water, centrifuging, and decanting to remove the dissolved carbonate
and acetic acid-sodium acetate solution. The calcite content of the limestone

samples was determined by weighing the dried residue remaining after the
dissolution of the limestone and subtracting that from the starting weight. All
samples were then treated with hydrogen peroxide heated to 70° C to remove
organic material. The samples were then wet sieved to remove and measure
the >53 µm sand fraction.
The silt and clay size fractions were measured by applying Stokes Law
(Jackson, 1973). This was achieved by suspending the samples in water, in
which sodium pyrophosphate was added to prevent flocculation, and allowing
the sediment to settle. Then a pipette was used to remove aliquots of the
water and sediment from specified depths at specified times according to the
temperature of the sediment-water mixture (Jackson, 1973).
The clay fraction from the grain-size analysis was deposited on
ceramic tiles (Jackson, 1973) and analyzed on a Scintag PAD 5, automated
diffractometer equipped with Cu Kα radiation (1.54059 Å) and a single
crystal, graphite monochromator. Clay minerals were identified according to
Moore and Reynolds (1989). Semi-quantification of the clay types was
adapted from Netoff (1977). Because of the inherent difficulties in quantifying
clay species (Moore and Reynolds, 1989), the reported values in this study
are only relative amounts. These values are used for the comparison of
samples within this study and for making generalizations.
Amino Acid Dating
Snails were collected from outcrops of the Nussbaum Alluvium, and
from younger radiometrically dated alluvia (Plate 3), for the purpose of dating
the Nussbaum Alluvium by means of amino-acid racemization. Stratigraphic
descriptions of the six older alluvial sites are on Plate 4. The modern
floodplain site is ~20 m north of the Louviers site and is ~1 m above and 10

m south of the nearby stream. The snails were collected from newly
deposited flood debris that was less than a month old and from the top few
centimeters of soil. The vegetation at this site consists of thick grass and
weeds along with sparse prickly pear and yucca.
Approximately 50 kg of sandy silt was collected at each site. To
minimize sample contamination, washed plastic buckets and fresh plastic
bags were used. The samples were loaded into containers with a clean
metal shovel and with minimal hand contact. In the lab, the samples were
disaggregated by putting them in buckets filled with tap water and letting
them soak overnight.
The samples were then washed with tap water through 0.5-mm mesh
screen. Following air drying, the mollusks were hand picked from the
remaining matrix by means of a small paintbrush dipped in tap water. The
mollusks were then identified. Only shells that were free of sediment and
discoloration were selected for further processing. These shells were
washed at least five times in distilled water while being sonically agitated.
The amino-acid ratios were determined on a high-performance liquid
chromatograph (HPLC) at the Institute of Arctic and Alpine Research
(University of Colorado, Boulder).
Paleomagnetism
A coring device was used to sample the cave sediments at six cored
holes in the Grand Concert Hall (Plate 2). The core samples were obtained
by means of a coring device in which a hand-powered hydraulic cylinder
drives a stainless steel, knife-edged barrel down into the sediments. Up to 40
cm of sediment could be cored each trip into the hole without sediment
distortion. Samples were also collected from hand-dug pits at Mummys

Alcove and Sniders Hall (Plate 2). Additionally, samples were collected from
a vertical outcrop in Heavenly Hall (Plate 2). The pits and outcrops were
sampled for paleomagnetic study by carving flat vertical surfaces and pushing
plastic sampling cubes into the sediment at stratigraphic intervals ranging
from 3.0 to 10.0 cm. The samples were oriented by means of a Brunton
compass.
The core barrel and all pieces of drill rod that attached to the barrel
were engraved with a vertical line so that the orientation of the core barrel
could be measured with a Brunton compass within ± 2°. A hand-operated
hydraulic device was used to extract the sediment core from the barrels. As
the core was extruded, a fixed thin wire sliced it in half, lengthwise. Plastic
sampling cubes were then pushed into the soft sediment along the center line
of the flat surface of the core half at regular intervals (generally ~5.0 cm).
The samples at Sniders Hall, Mummys Alcove, and Hole 1 were taken with
3.2 cm3 sampling cubes; all other samples were taken with 13.5 cm3 cubes.
In the lab, the NRM (Natural Remanent Magnetization) of all samples
was initially measured. Subsequently, the samples were subjected to
alternating-field (A. F.) demagnetization and remeasured. All samples were
first demagnetized at 10, and then at 15 millitesla (mT). Some samples at
the bottom of Hole 5 that displayed aberrant inclinations and declinations
were additionally demagnetized at fields up to 30 mT. All remanence
measurements were made on a Schonstedt SSM 1A spinner magnetometer
with a sensitivity of 1X10⁻⁴ A/m. Repeat measurements indicate an angular
reproducibility of ~2° at an intensity of 1X10⁻⁶ A/m2.

Magnetic Susceptibility
After the samples taken from the cores were measured for NRM, their
low-field bulk volume susceptibility was measured on a Sapphire Model 1A
susceptibility meter. Two measurements were made of each sample. Noise
levels for all measurements were less than ± 1%. All measurements were
significant to at least three figures.
Other Analysis
Two charcoal samples were collected and sent to Krueger Enterprises,
Inc. for radiocarbon age determination. One sample was a composite
sample collected from the walls and ceilings of Manitou Cave (Figure 2). The
source of charcoal sample appears to be wood charcoal brought into the
cave by a flood. Another sample was a composite sample collected from the
Centennial site (location on Plate 3 and description on Plate 4). This sample
also appears to be wood charcoal. Both samples appear to have been
deposited by streams. These samples were collected with a stainless-steel
teaspoon and then put into plastic bags. Extreme care was taken to eliminate
any possible contamination from extraneous carbon sources, such as bare
hands or modern organic matter.
To establish the relationship between spring waters and cave
sediments, Mn- and Fe-rich sediments were collected from the south end of
Thieves Canyon (Plate 2), and from the Ouray, Little Chief, and Iron Geyser
Springs (Figure 2). These samples were dried, ground to a fine powder and
analyzed for Mn, Fe, Co, Ni, As, Sb, Ba, W, and Pb on a Kevex 0700 X-ray
fluorescence unit (EDSXRF).
Rock and sediment samples were collected for the purpose of
determining the mineralogy and provenance of the magnetic minerals in the
cave sediments. A sample of red clay was collected 50 m inside Narrows
Cave, which is located ~150 m west of Huccacove Cave (Figure 2). The
Cave-of-the-Winds sample, a clayey silt, was collected in Silent Splendor
(Plate 2). A sample of the Pikes Pike granite was taken from an outcrop and
a migmatite stream cobble was collected along Williams Canyon Creek ~ 0.5
km upstream from Cave Of The Winds. Both samples appeared to be
unweathered. About 250 g of each sediment sample was disaggregated in a
mixture of 500 ml water and 10 ml Joy® soap. About 250 g of each rock
sample was crushed and pulverized. A strong magnet was used to carefully
extract the magnetic particles from each sample. Four polished grain mounts
were made of these magnetic particles. The polished grain mounts were
analyzed by means of both a petrographic microscope by the author and a
JOEL microprobe by John Drexler.
To ascertain the elemental composition of the limestone, five
unweathered samples of the Manitou Formation were collected at 15-m
intervals from the stratigraphic section near the entrance of Hucacove Cave
(Figure 2). These samples were collected from essentially the same location
as the samples that were used for clay analysis. Two additional samples
were collected for limestone analysis. The base of the Leadville Formation
was sampled near Hucacove Cave. The Williams Canyon Formation was
sampled ~50 m south of the entrance to Cave of the Winds. Most of the
outer weathered portions of the samples were chipped off by means of a rock
hammer. The samples were then cleaned in a 2% nitric bath with a plastic
brush. After drying, the samples were crushed and then pulverized. Iron
particles that were introduced into the sample during crushing and pulverizing
were removed by means of a strong magnet. The pulverized samples were
then ground to a very fine powder by means of a motorized agate mortar and

pestle. Four grams of each powdered sample was mixed with 1 gram of
Argo cornstarch. The mixture was pressed into 32 mm diameter pucks,
which were analyzed with a Phillups PW 1400 wavelength XRF.

RESULTS AND DISCUSSION
Water Chemistry
Correlation Of Modern And Ancient Processes
The water that dissolved limestone and deposited sediments at the
Cave of the Winds has long since disappeared. However, by comparing
sediments being deposited at the springs of Manitou Springs with those that
were deposited at the Cave of the Wind, and by studying the water chemistry
of the modern springs, it can be shown that limestone dissolution and
sediment deposition that is taking place under the modern springs are similar
to processes that occurred at the Cave of the Winds. Because the
composition of ascending deep-seated and near-surface waters control the
dissolution of limestone and precipitation of minerals, the sources of the
water and their dissolved solids and gasses require discussion.
Source Of The H 2O
Evans and others (1986) determined that the δ18O and δD of the H2O
of the Iron Geyser is -12.11‰ and -84.5 ‰, respectively, and that of the 7-
Minute Spring is -11.91‰ and -84.6 ‰, respectively, indicating that the H2O
of these two springs is of meteoric origin. This suggests that the H2O of the
other mineral springs is also of meteoric origin. The northeastern flanks of
the Pikes Peak massif, which is located southwest of Manitou Springs, and
the southern end of the Rampart Range, which is located northwest of
Manitou Springs, are the probable recharge areas for the springs (Figure 3).

Source Of The CO 2
The Manitou waters contain large amounts of dissolved CO2. Some
springs emit large volumes of CO2 gas (Evans and others, 1986). The
carbon dioxide has several possible sources: atmospheric, metamorphic,
biogenic, and outgassing from the mantle. The high concentration of CO2 in
the springs, about 1000 times that of water in equilibrium with atmospheric
CO2, precludes atmospheric CO2 as a primary source. An alternate
interpretation is that the CO2 is produced from contact metamorphism by
local plutons (Evans and others, 1986). Because there is no evidence of
modern plutonism in the area, this hypothesis is unsupported. The δ13C of
biogenic CO2 is between -25 ‰ and -15‰ (Perrodon, 1983); therefore, a
biogenic source for the CO2 must also be excluded because the δ13C of free
CO2 from representative springs at Manitou ranges from -5.05 ‰ to -4.03 ‰
(Table 2). Several studies have shown that CO2 issuing from springs along
deep-seated faults have δ13C values (-10‰ to -2 ‰, Batard and others,
1982; -4‰ to -8 ‰, Blavoux and others, 1982) comparable to those at
Manitou Springs (Table 2). These studies suggest that outgassed CO2 from
the upper mantle ascends along major faults and mixes with meteoric water.
This appears to be the same process taking place at Manitou Springs (Figure
3).
Spring And Stream Chemistry
The waters that are part of the Manitou Springs system can be
grouped into five categories according to their location and general chemistry
(Figure 2 and Figure 4). The 7-minute East, and West Springs, which have
the highest chloride, sulfate and TDS content of any of the springs in
Manitou, are located east of the downtown area. They are grouped together

as the Eastern Springs (Figure 2 and Figure 4). The Iron Geyser, Ouray, and
Chief Springs are located southwest of the downtown area along Ruxton
Creek (Figure 2). Because of their very high iron content, these springs are
grouped together as the Iron Springs. Additionally, the Iron Springs contain
higher concentrations of arsenic, lead, sodium and potassium than any of the
other springs in Manitou.
The Shoshone, Cheyenne, Soda, Navajo, Wheeler, and Stratton
Springs are located in the downtown area and therefore are grouped as the
Downtown Springs (Figure 2). They are similar to the Eastern Springs,
except they have lower chloride and sulfate concentrations (Figure 4). The
Ute Magnetic, Twin, Ute Chief, Gusher, and Creighton Springs are northwest
of the downtown area and, even though they are not as far west as the Iron
Springs, they are grouped as the Western Springs for simplicity (Figure 2 and
Figure 4). In general, these springs have the lowest chloride, sulfate, and
TDS contents and the highest nitrate concentrations of any of the springs in
Manitou. The exception to the correlation of location and chemistry is Twin
Spring, which is located between the Downtown and Iron Springs, but is
grouped with the Western Springs (Figure 2 and Figure 4). This anomaly will
be discussed later.
The Cave of the Winds spring is grouped by itself (Figure 4). It is
located ~0.4 km west of Cave of the Winds (Figure 2). The chemistry of this
spring is similar to many of the other springs, however, its TDS content is
much lower (Table 3). This spring is the water supply for the tourist facilities
at Cave of the Winds. The samples collected along Williams Canyon Creek
and the Blue Ice Spring, which flows into Williams Canyon Creek, are
grouped together (Figure 4). This creek is located north of Manitou Springs

(Figure 2). The Downstream sample and the Blue Ice Spring contain more
nitrate than any of the other surface waters analyzed in this study (Table 3).
A careful attempt was made during spring and site selection, sampling,
and analyses to obtain data that were indicative of the source conditions. For
this reason the partial results from the two springs, Little Chief and Hiawatha
(see appendix for descriptions), were not included in Table 3. Their
conductivity or temperature indicated that they had been altered by soil
conditions or were mixed with very near-surface sources.
Genesis Of Spring End Members
Subsequent discussion will show that four different water sources
consisting of the Williams Canyon Creek downstream water and waters with
compositions very similar to the Iron Geyser, 7-minute East Spring, and Cave
of the Winds Spring are mixing beneath Manitou Springs to form the variable
water compositions of the Downtown Springs, Western Springs, and 7-minute
West Spring (Figure 5). The chemistry of the Iron Geyser appears to be
controlled by rock-water interaction with the Pikes Peak Granite. The
chemistry of the 7-minute East Spring is similar to the Iron Geyser water, but
appears to have been modified by rock-water interaction with marine
sediments. The Williams Canyon Creek downstream water is a low-TDS
near-surface water that has been modified by input from the Blue Ice Spring.
The Cave of the Winds Spring is somewhat similar to many of the other
springs, but has a much lower TDS content. The genesis of these waters will
be discussed in detail, because the compositional differences of these waters
will be important in understanding the chemical reactions taking place
beneath Manitou Springs.

Genesis Of Williams Canyon Creek Water
Figure 5 indicates that downstream Williams Canyon Creek, which is
high in nitrate (Table 3), is one of the end members of the Manitou Springs
waters. Because I use the nitrate content of the springs to show that waters
of different composition are mixing beneath Manitou Springs, I will discuss
the source of the nitrate in some detail. Nitrate is normally associated with
anthropogenic sources such as sewage treatment facilities or ammonium
nitrate from fertilizers and explosives. Because there is no farming in the
Manitou Springs area, nitrate input from fertilizers can be discounted.
Another possible source of nitrate is from the Castle Concrete limestone
quarry, which is located about 1 km east of Cave of the Winds. At the quarry
a mixture of ammonium nitrate and diesel fuel was used as an explosive to
break up the limestone. Because about 10% of the ammonium nitrate (Walt
Rubeck, 1995, per. comm.) remains after the explosion, it is possible that
residue from the explosive could be carried by runoff into the quarry pit
(which is located in the Manitou Formation) and eventually emerge at the
springs in Manitou. The quarry-nitrate input, however, must be very small,
because even though the quarry was permanently shut down about the same
time the springs were originally sampled by me, subsequent periodic spot
checks of the high-nitrate springs indicated no change in their nitrate content.
The most probable nitrate source is from the breakdown of human
waste. Subsurface nitrate input from septic systems can be excluded
because Manitou Springs is connected to a sewer system (Johnny Price, per.
comm. 1995). Ruxton and Fountain Creeks have slightly elevated nitrate
concentrations (Table 3), which are probably associated with upstream
human activity. These two streams, however, can also be excluded as

principal nitrate sources, because some of the springs, especially the Gusher
Spring, contain more nitrate than either of the two creeks.
The high nitrate content of the downstream Williams Canyon Creek,
which infiltrates into the limestone in lower Williams Canyon, indicates that it
is probably the major nitrate source for the springs. Furthermore, the nitrate
must originate on the Cave of the Winds property, because both the Cave of
the Winds Spring, which is the water supply for the facilities at the cave, and
upstream Williams Canyon Creek have low nitrate contents. The Blue Ice
Spring, which drains into the creek, however, has a very high nitrate
concentration. The most likely source of the nitrate in the Blue Ice Spring is
the break down of human waste in the Cave of the Winds’ septic field, which
is located about 100 m uphill from the spring. The Blue Ice Spring is so
named because in the wintertime, as the water freezes, it excludes many of
the ions present in the water. The remaining water, which starts out fairly
concentrated to begin with (Table 3), increases in concentration until the
solubility of the contained dissolved solids is exceeded, at which time,
minerals precipitate. The resultant microscopic mineral crystals, which are
suspended in the ice, scatter light, giving the ice a light-blue hue. The Blue
Ice Spring along with many smaller seeps located near it, are the most
obvious point source of the nitrate present in downstream Williams Canyon
Creek.
Except for the nitrate, most of the dissolved content of downstream
Williams Canyon Creek water is from rock-water interaction with the Pikes
Peak Granite, which crops out in the head waters of Williams Canyon Creek
and to a lesser extent limestone, which rims Williams Canyon. The water is
much more dilute than the Iron Geyser water, because the rock-water
reaction takes place at much lower temperatures and during a much shorter

time interval. The nitrate content of downstream Williams Canyon Creek
identifies it as one of the low TDS source that is mixing with other waters
beneath Manitou Springs.
Genesis Of Iron Geyser Water
There are several lines of evidence that indicate that the Iron Geyser
represents water that has been modified solely by contact with the Pikes
Peak Granite. The elements that are relatively abundant in the granite are
sodium (Na), potassium (K), lithium (Li), iron (Fe), and silicon (Si) (Table 4).
Accordingly, the water of the Iron Geyser contains elevated amounts of all of
these elements (Table 3). The high concentrations are probably related to
the elevated temperature at which the water-rock interaction took place and
the extended period of time that the water was in contact with the rock. The
quartz-with-no-steam-loss geothermometer (temperature in °C=[1309/[5.19-
log SiO2 ]]-273.15 where SiO2 = mg/kg, Henley and others, 1984) indicates a
temperature of 126° C. Assuming an average geothermal gradient of 30°
C/km (Leet, Judson, and Kauffman, 1982), the calculated temperature is
equivalent to a depth of ~4 km. Several of the spring waters in Manitou
Springs have been C14 dated (Maslyn and Blomquist, 1985). The dates
indicate that the water issuing from the springs can be up to ~30 Ka. The
Iron Geyser may be much older, because the springs are actually a mixture
of near-surface modern water and water similar to the Iron Geyser.
Apparently, the solubility of certain minerals in the Pikes Peak Granite
controls the composition of the Iron Geyser. Major minerals that occur in the
Pikes Peaks Granite include quartz, biotite, potassium felspar, and sodic
feldspar (Hawley and Wobus, 1977). Accessory minerals include fluorite,
zircon, magnetite, apatite, and topaz (Hawley and Wobus, 1977). The

saturation index (SI) of albite indicates that it is a likely source of the sodium
in the Iron Geyser (Table 3). The very low SI of anorthite suggests that it is
the source of calcium (Table 3). The potassium most likely comes from the
K-feldspar and biotite. The abundance of K-feldspar in the Pikes Peak
Granite alone would suggest that it is the source for the potassium.
Additionally, the calculated SI of K-feldspar (microcline, SI = -0.69) in the Iron
Geyser water also suggests that it controls the potassium content of the
water (Table 3).
The near-equilibrium SI (-0.26) of biotite indicates another potential
source of silica, potassium, and iron to the Iron Geyser water. Certainly the
high SI (13.09) of magnetite excludes it as a control on the iron content
(Table 3). Additionally, the manganese and lithium content of the Iron
Geyser is probably controlled by biotite, which contains appreciable amounts
of manganese and lithium (Table 4).
Given the high fluorine content of biotite in the Pikes Peak Granite
(Table 4), it is probably also the source of the fluoride in the Iron Geyser.
The SI (1.25) of fluorite is slightly supersaturated, which suggests that it does
not control the fluoride or calcium content of the water (Table 3). Other
possible sources of fluoride are apatite (Ca5(PO4) 3(F,Cl,OH)) and topaz
(Al2SiO4(F,OH)2). The low phosphate content of the Iron Springs would
negate the possibility that the dissolution of apatite contributes to its fluoride
content (Table 3). The insolubility of topaz (Hurlbut and Klein, 1977) would
exclude it as a source of fluoride.
The 87Sr/86Sr of minerals in the Pikes Peak Granite can also be used
to shed some light on the source of the elements in the Iron Geyser water.
The low 87Sr/86Sr of the Iron Geyser relative to that of K-feldspar and biotite
suggests that plagioclase has a larger influence on the 87Sr/86Sr of the spring

water than does K-feldspar (Table 2). The strontium is probably in the
anorthite component of the plagioclase, where it replaces calcium. Although
biotite has a high 87Sr/86Sr and a low SI, the small amount of strontium
contained in the biotite probably limits its affect on the 87Sr/86Sr of the Iron
Geyser (Table 4). Some of the strontium in the springs that are a mixture of
Iron-Geyser-type water and low TDS water (such as the Ute Magnetic and
Cheyenne springs) apparently comes from the dissolution of limestone. This
is evidenced by the Ute Magnetic and Cheyenne Spring 87Sr/86Sr values,
which are between those of the Manitou Limestone and Iron Geyser (Table
2). The 87Sr/86Sr values of these springs are related to the amount of
dissolved limestone contained in each. The high TDS Cheyenne Spring,
which is a mixture of mostly Iron-Geyser-like water and a small amount of a
low-TDS water, does not contain as much dissolved limestone as the Ute
Magnetic Spring, which contains larger amounts of a low TDS water. The
dissolution of limestone will be discussed in detail later in this study.
Identifying the source of the sulfate and chloride in the Iron Geyser
water is problematic. Although analysis of the spring for H2S was negative,
the spring has a very slight H2S smell. This coupled with the high iron
content of the spring suggests that pyrite (FeS2) could be the source of
sulfate in the water. Pyrite, however, has not been identified as a mineral
present in the Pikes Peak Granite (Hawley and Wobus, 1977). Chloride is
probably from the alteration of biotite, although the high fluorine/chlorine ratio
of the biotite (Table 4) does not agree with the high fluorine/chlorine ratio of
the Iron Geyser water (Table 3). This suggests that either there are other
sources for the chloride or the fluoride is being taken out of solution by
precipitation of a mineral (such as fluorite). Further study is necessary to
clear up the problem associated with sulfate and chloride.

Genesis Of The 7-minute East Water
One of the four mixing end members appears to have a composition
similar to the 7-minute East Spring. The elevated amounts of sulfate,
chloride, and boron (Table 3), suggest that the 7-minute East Spring has a
different hydrochemical evolution than the other end members. Sulfate,
chloride and boron are anions that are commonly associated with marine
sediments, suggesting that the Eastern Springs may have been modified by
rock-water interaction with marine sediments. The low sulfur and chlorine
content of the marine limestone of the Manitou and Leadville Formations
(Table 4) removes these formations from consideration. Another rock with
which water could be interacting is the Gleneyrie Member of the Fountain
Formation (Plate 1), a marine shale that overlays the limestone beds.
Another possibility is the Pierre Formation, a marine shale that abuts the
Rampart Range Fault east of Manitou Springs (Plate 3). More study would
be needed to enable the assignment of the marine influence to either of
these marine shales or other marine sediments.
Genesis Of The Cave Of The Winds Water
One of the four mixing end members appears to have a composition
similar to the Cave of the Winds Spring water. Because this spring issues
from the Pikes Peak Granite, the water probably has a genesis very similar to
the Iron Geyser. The main difference between the two waters is that the
Cave of the Winds water has a lower TDS content. The quartz-with-no-
steam-loss geothermometer (Henley and others, 1984) indicates that the
Cave of the Winds Spring water obtained a temperature of 77° C. The
temperature at which the rock-water interaction took place is much lower for
the Cave of the Winds Spring water than the Iron Geyser water (126°). The

lower temperature indicates that the Cave of the Winds water has not
reached the same depth as the Iron Geyser. This would suggest that the
Cave of the Winds Spring water has been in contact with the granite for a
shorter period of time. The lower rock-water interaction temperature and the
shorter interaction time are the most probable reasons why the Cave of the
Winds Spring has a much lower TDS content than the Iron Geyser.
The low-TDS near surface water, which is modeled as being similar to
the Cave of the Winds Spring water, is apparently entering the mixing zone
beneath Manitou Springs along a fault that is sub-parallel to the Ute Pass
Fault (Plate 1). This fault, which lines up with and ends not far from the Cave
of the Winds Spring, can be traced back under Manitou Springs (Plate 1),
suggesting that water similar to the Cave of the Winds Spring could also be
ascending this fault and entering the mixing zone. The low TDS and fairly
low nitrate content of the Creighton Spring (Table 3) and the spring’s location
near the fault suggests that that the low-TDS near-surface end member may
be entering the mixing zone from a point source along the fault southeast of
the Creighton Spring.
Four Source Mixing Model
The Williams Canyon Creek downstream water has been
identified as one of the sources entering the mixing zone beneath Manitou
Springs. The Iron Geyser, 7-minute East Spring, and Cave of the Winds
Spring are assumed to closely approximate the water chemistry of the other
three sources. To support this interpretation, mass balance calculations were
made by equating the potassium, sodium, sulfate, chloride and fluoride
output of the Downtown Springs and the Western Springs to the known and
modeled inputs. These five ions were chosen because they were assumed

to be very conservative in the water beneath Manitou Springs. Once in the
mixing zone (Plate 1), these ions should not increase in concentration,
because the rock-water interaction that is taking place in the mixing zone is
the dissolution of limestone, which has very low concentrations of potassium,
sodium, sulfur, and chlorine (Table 4). Fluoride was also included, because
the fluorine content of most limestone is very low (Hem, 1992). Moveover,
these five ions are not lost in the mixing zone from the precipitation of
minerals containing these ions. This is born out in subsequent sections of
this study that show that the sediments in Cave of the Winds, which were
deposited a mixing zone thought to be very similar to the one present
beneath Manitou Springs, do not contain sodium-, sulfur-, fluorine-, or
chlorine-bearing phreatically formed authigenic minerals. Only potassium is
present in minor amounts in a rare manganese-oxide mineral in the
sediments at Cave of the Winds. Subsequent mass balance calculations
indicate that the potassium loss from the precipitation of this mineral is
vanishingly small.
Mass balance was achieved by equating the ion input of the spring
system to the ion output. The flow rates and ion content of the Downtown
and Western springs were used to calculate the ion output of the spring
system (Plate 5, A). The flow rate and ion content of the Williams Canyon
Creek downstream water was used to calculate part of the ion input (Plate 5,
A). The ion contents of the Iron Geyser, 7-minute East Spring, and the Cave
of the Winds Spring were used as models for the sources that enter the
spring system at depth (Plate 5, A). The unknown flow rates of the three
modeled sources could then be calculated by constructing at least three
independent equations and solving for the unknowns (Plate 5, B).

Five unique mass balance equations were constructed for each of the
selected ions (Plate 5, C). Only three equations were necessary to solve for
the three unknowns. However, in an attempt to ameliorate some of the
problems associated with modeling and analytical error, ten matrices
containing ten unique combinations of the five equations were solved (Plate
5, D). Summing of the resultant flow rates showed that eight of the ten
results agreed fairly well with the measured output of the springs (Plate 5, E).
The two results that were anomalous were excluded from further
consideration. The eight remaining results were averaged.
The calculated total input to the spring system was ~10% greater than
the measured total discharge. To compensate for this, the calculated input
flow rates were normalized to equal the total discharge (Plate 5, F). These
flow rates were then added back into the mass balance equation (Plate5, F).
The average relative percent difference (RPD) between the spring system
input and discharge for the conservative ions was 8.5% (Plate 5, G), which,
considering the use of the modeled inputs and the analytical uncertainty
(Table 1), is acceptable. The mass balances of the ions, lithium, bromide
and nitrate were also calculated as a check to see if the ion content of the
modeled inputs and calculated input flow rates were reasonable.
Lithium was not included in the equations for determining the input
flow rates because the lithium content of the limestone was not measured.
Carbonates in general, however, contain very little lithium (~5 ppm, Hem,
1992). The biotite of the Pikes Peak Granite, however, contains a fairly large
amount of lithium (Table 4) and is the most likely source of the lithium in the
spring waters. Therefore, lithium should also be conservative in the mixing
zone. Bromide was not included in the equations for determining the input
flow rates because the bromide content of the limestone was not measured.
Carbonates, however, normally contain very little bromide (~7 ppm, Hem,
1992). The bromide content of the deep-seated source (Iron Geyser) is fairly
high at 1.0 mg/L. The bromide is probably from the breakdown of biotite,
which has a high halogen content (Table 4). A main contributor of bromide to
the spring system is most likely the marine modified source (7-minute East),
which contains 2.1 mg/L bromide (Table 3). This suggests that the bromide
is unrelated to the dissolution of limestone. It should be another conservative
ion in the mixing zone.
The nitrogen content of the limestone was also not analyzed.
Carbonates, however, normally contain no nitrogen (Hem, 1992). Nitrogen,
which would more than likely be leached out as nitrate, is, however, normally
present in shale (Hem, 1992). This could explain the slightly elevated nitrate
content of the Marine Modified source (7-minute East, Table 3). Williams
Canyon Creek with its very high nitrate content has already been shown to be
the main source of the nitrate in the mixing zone. Nitrate, therefore, also
appears to be a conservative ion in the mixing zone. The low RPD’s (~9%,
Plate 5, G) between the lithium, bromide and nitrate input and output
suggests that the composition of the modeled sources and their calculated
input flow rates are appropriate. The high RPD’s of calcium, magnesium,
iron, and manganese suggest that they are not conserved in the mixing zone
(Plate 5, H).
The Mixing Zone
Chemistry Of Water In The Mixing Zone
The large differences between the input and discharge of the non-
conservation ions (calcium, magnesium, iron, and manganese) at the

Manitou Springs system indicate that chemical reactions are taking place
beneath Manitou Springs. The increase in the calcium and magnesium
strongly suggests that the dolomitic limestone, which is present beneath
Manitou Springs, is dissolving. The decrease in the iron and manganese
suggests that these ions are lost by precipitation. I propose that the
dissolution of dolomitic limestone and the precipitation of iron and
manganese are from the mixing of two general types of water in a mixing
zone located beneath Manitou Springs. One type is a deep-seated water
moving upward and mixing with a near-surface water (Figure 3).
The reactions, dissolution and precipitation, which are taking place in
the mixing zone, are a function of the chemical composition of these two
water types and the host rock of the mixing zone. The relatively high iron and
manganese contents and very high CO2 content are the reactants that the
deep-seated water delivers to the mixing zone. Dissolved oxygen is the
reactant that the low-TDS source delivers to the mixing zone. Calcite and
dolomite, contained in the dolomitic limestone, which hosts the mixing zone,
are also reactants.
From a speleological point of view the most important reaction taking
place in the mixing zone is the dissolution of the limestone. Bögli (1964)
pointed out that this reaction, which he named “Mischugskorrosion” (mixing
corrosion), occurs by mixing two different waters in the presence of
limestone. One of these waters contains relatively small amounts of
dissolved CaCO3 and CO2 and the other, relatively large amounts. Both
waters, however, may be saturated with respect to calcite. Because the
solubility of calcite in a CO2 system is not linear (Figure 6), the mixing of
these two waters forms a corrosive mixture, or, as the proposed case in the

Manitou Springs system, a mixture that can dissolve more limestone than
either of the end members.
The Manitou Springs system is somewhat more complex in that it has
at least four distinct waters that feed into the mixing zone. These waters,
however, can be combined into the two main water types, which are normally
present in a corrosive mixing system. The modeled low-TDS sources (Cave
of the Winds spring) and downstream Williams Canyon Creek can be
combined to form the low-content dissolved-CaCO3-CO2 mixing end member
(Figure 6). The modeled marine modified source (7-minute East Spring) and
the deep-seated source (Iron Geyser) can be combined to form the high-
content dissolved-CaCO3-CO2 mixing end member (Figure 6). The shaded
polygon drawn on Figure 6, which has these end members as its vertices,
should contain all of the compositions of the springs that issue from the
mixing zone. Water in the shaded area is undersaturated with calcite and
therefore would dissolve the limestone. Many of the measured values,
however, do not coincide with the shaded area. This apparent anomaly will
be discussed in more detail.
PHREEQC (Parkhurst, 1995) was used to calculate saturation indices
and determine speciation of the spring waters. It was useful in determining
the saturation indices for silicates and rough values for carbonate and oxide
saturation indices and species (Table 3). PHREEQC, however, cannot be
used to accurately calculate carbonate and oxide chemistry, because the
Manitou Springs system is not in equilibrium. Additionally, obtaining accurate
pH and meaningful DCO2 measurements necessary for calculating aqueous
speciation was difficult, because these parameters change rapidly as the
water nears the surface and as it issues from the springs. The biologically
mediated precipitation of iron and probably manganese oxides is another

factor that negates some of the usefulness of PHREEQC in predicting the
geochemistry of the Manitou Springs system.
The relatively high degree of undersaturation of the Creighton, Gusher,
and Twin Springs suggests that these waters are not in equilibrium with
respect to calcite (Table 3). The calculated saturation indices for these
springs indicate that the springs are also not in equilibrium with dolomite
(Table 3). This suggests the water ascends to the surface fairly quickly,
before it has a chance to dissolve sufficient calcite or dolomite to be in
equilibrium with either of these minerals. The geometry of the conduits that
feed the springs plays a role in this. Many of the springs are actually drilled
wells, which probably have small diameters (~10 cm); thus, even at low flow
rates the water will ascend to the surface at a relatively high velocity. Other
springs that drain the mixing zone are natural and most likely issue from
fractures in the Fountain Formation (Plate 1). Similar to the drilled wells,
these fractures will have small cross sectional areas and the water will
ascend along them at fairly high velocities.
The lack of meaningful DCO2 measurements adversely affects
speciation calculations. The DCO2 measurements of the springs at Manitou
do not take into account the large amounts of emitted CO2 gas, which is
probably in solution at depth. For example, at a depth of only ~30 m the
hydrostatic head would be sufficient to permit a PCO2 of ~3.0, which is higher
than any of the springs in Manitou (Figure 6). At this pressure all of the CO2
would be in solution. As the water nears the surface and the hydrostatic
pressure is decreased, the CO2 begins to outgas from the water. The DCO2
content and pH of the water at depth could be calculated if the CO2 emitted
from the springs could be measured. The physical layout and plumbing of
most of the springs prevents accurate measurement of the amount of emitted

CO2 gas, except for the Iron Geyser, for which it was estimated that the CO2
gas emitted was at least equal in volume to the water flow. Knowing that the
measured DCO2 of the springs is a minimum and that it is likely greater at
depth, the true DCO2 contents of the springs in the shaded area on Figure 6
were estimated using the difference between the measured (1.43) and the at-
depth calculated PCO2 (~2.5) of the Iron Geyser.
Other adjustments of the estimated PCO2 and calcium values were
made according to the flow rate and PCO2 magnitude of each spring. The
difference between the estimated and measured PCO2 of springs such as the
Creighton and Gusher was expected to be less (Figure 6). The smaller
difference is because they are roughly 50/50 mixtures of the two main end
members, so that their initial PCO2 should be about half of the more
concentrated end members and, accordingly, they are plotted as having half
as much difference between the measured and estimated PCO2.
Additionally, springs with a high flow rate, like the Creighton and Gusher,
were expected to have even smaller differences, because their waters
ascend at higher velocities, giving the water less time to outgas CO2. This
approach was applied in estimating the PCO2 of the more concentrated, low
flow rate springs, like the Cheyenne and Shoshone. The calcium content of
all of the spring waters, except the Iron Geyser and 7-minute East, which are
fixed as end members, was estimated to be slightly lower in the mixing zone,
because these reactive waters probably pass through and dissolve some
limestone as they ascend to the surface.
Another parameter that is essential for calculating SI’s and speciation
is pH, which is directly related to PCO2 (Figure 7). Outgassing CO2 makes
the accurate measurement of the pH of the springs very difficult. The data
from the Iron Geyser can be used to show this problem (Figure 7). The

measured pH of the Iron Geyser (6.27) can not be the actual pH because the
calculated SI’s of ferrihydrite and calcite suggest that they would precipitate
(Table 3). Both of these minerals, however, do not precipitate until after the
water issues from the spring, where continued CO2 outgassing increases the
pH. The minimum pH of the spring water has to be less than ~6.12 for these
minerals to stay in solution (Figure 7). It should be noted that, as the water
flows away from the Iron Geyser, ferrihydrite precipitates first and then
calcite, as indicated in Figure 7. The measured PCO2 correlates with a pH of
~5.88 (Figure 7). If the outgassed CO2 is added back into the water as
DCO2, the pH at depth would have to be ~5.62 (Figure 7).
The difference between the measured pH and the pH calculated from
the measured DCO2 is probably related to the differences in analytical
techniques. The pH was measured directly from water flowing from the
springs. Bubbles of CO2 were seen effervescing from the probe tip and sides
of the beaker that contained the pH probe, suggesting that the pH of the
water was increasing even as it was being measured. The CO2 was
measured with a CO2 probe. The CO2 content of the water was much greater
than the CO2 probe was designed to measure. To compensate for this, the
spring waters were diluted to a 10% concentration with deionized water. The
deionized water was gently poured into the spring water and mixed by lightly
swirling to further minimize the loss of CO2. The diluted mixture effervesced
very little CO2 during the DCO2 measurement. As shown in Figure 7, the
true pH of the water, as it issues from the ground, can be more accurately
determined by calculating it from the DCO2. Moreover, the outgassed CO2 of
each spring would also have to be accounted for before the true pH of the
water at depth in the mixing zone could be calculated. To circumvent this
problem, future study of the springs should include opening some of the

springs, which in many cases are drilled and cased wells, and performing
down-hole measurements.
Other limitations associated with using programs like PHREEQC to
calculate SI’s and speciation accurately are that thermodynamic data is
lacking for some minerals and biologically mediated precipitation is not
addressed. The inability of PHREEQC to properly predict the precipitation of
iron and manganese oxides in the Manitou Springs system is a good example
of these problems. The ionic mass balance of the spring system shows that
iron and manganese are lost in the mixing zone. The SI’s, however, of
almost all of the springs indicate that ferrihydrite, the most likely iron mineral
to precipitate first, is not supersaturated (Table 3). Subsequent discussion
will show that iron oxide in Cave of the Winds was probably precipitated by
bacteria. The precipitation of iron oxide in the mixing zone is probably also
being mediated by bacteria, thus the calculation of the SI’s is not an
appropriate method to access hydrochemical evolution or mineral
paragenesis of these minerals. The SI’s of the springs also show that the
manganese oxide, manganite, which is the most likely mineral to precipitate
in the mixing zone, should be in solution (Table 3). Subsequent discussion
will show that hollandite, which is present in nearby Cave of the Winds, is
probably the manganese oxide mineral that is precipitating in the mixing
zone. Unfortunately, there are no thermodynamic data available for
hollandite.
Position And Geometry Of Mixing Zone
Factors that control the position of the mixing zone are the high
permeability and solubility of the limestone, the position of Fountain Creek,
and the structure of the limestone beds. The high permeability of the

limestone-bearing rocks in the Manitou Springs area is directly related to the
rock’s cavernous porosity, which has had a complex history. The earliest
permeability and porosity enhancement is associated with development of
paleokarst features that are present in the Leadville, Williams Canyon, and
Manitou Formations (Forster, 1977). These features, which consist mostly of
paleo-caves and -fissures, were filled with detrital sediments soon after the
limestone was deposited in the Late Paleozoic. Subsequent dissolution of
passages along paleo-caves and -fissures is probably related to the slightly
higher permeability of the detrital sediments than the surrounding limestone.
Passages developed along paleokarst features, however, make up only a
small portion (5%-10%) of the total cave volume in the study area.
Most cave passages are developed along fractures that were formed
during Larimide faulting and folding (Blanton, 1973). Incipient Cenozoic
dissolution along the paleokarst features and Larimide fractures produced
extensive secondary permeability, which made the limestones much more
permeable than either the overlying Fountain Formation or the underlying
Sawatch Formation and Pikes Peak Granite. Thus, the Paleozoic carbonates
became major aquifers for conducting water.
The geometry of the limestone beds also controls the location of the
mixing zone. The southern, down-dip end of the limestone beds abuts the
Ute Pass Fault, where ascending CO2-rich mineral water preferentially enters
the highly permeable limestone. The eastern, down-dip end of the limestone
beds abuts the Rampart Range Fault, where additional CO2-rich mineral
water may be ascending and entering the limestone. As discussed earlier,
this water may have been modified by contact with marine shale, such as the
Pierre Formation. The up-dip side of the limestone crops out on the
southeastern flank of the Rampart Range where dilute meteoric water enters

the limestone. The position of Fountain Creek also controls the location of
the mixing zone, because the springs, which are a drainage focal point for
both the deep-seated waters and the near-surface waters, are located near
the creek where the hydraulic head is the highest. If Fountain Creek were to
erode down to a lower level, the increased head at the lower level would soon
force the spring water to utilize fractures and conduits nearer the new, lower
creek level. Thus, the springs and the mixing zone will continue to maintain
their general positions relative to Fountain Creek.
The approximate areal extent of the mixing zone (~1.2 km2) is shown
on Plate 1. The boundaries on the west and north correspond to the
approximated intersection of the limestone beds and the water table. The
boundary on the south is coincides with the Ute Pass Fault. The boundary on
the east extents the Eastern Springs, because the high TDS of these springs
suggest that very little mixing with low TDS water is occurring east of these
springs.
The mixing zone can be modeled as a large underground tank that is
~1 km in diameter and ~107 m thick (Figure 8). It is confined by impermeable
rocks (Glen Eyrie Member of the Fountain Formation on the top and Sawatch
Formation on the bottom, Figure 8) and is tilted ~12° to the southeast. The
ceiling (upper impermeable bed) of this tank is held up by pillars (cave walls)
that probably occupy 90 to 95% of the tank volume. Water enters the mixing
zone at several points (Figure 8). Deep-seated and marine-modified water
enters at the bottom of the mixing zone on the southeast end (Figure 8). The
low TDS waters enter at the top on the northwest end (Figure 8). The density
contrast between the two waters is large enough that the water in the mixing
zone is vertically stratified (Figure 9). This stratification explains several
phenomena.

To construct a stratification model, three assumptions are made. The
first assumption is that each spring taps one specific level in the mixing zone
and is not a mixture of two levels. The second assumption is that the
potassium content of each spring is proportional to the spring’s depth (Figure
9). Potassium was chosen because it is conservative in the mixing zone,
relatively concentrated in the deep-seated water (~94 mg/L), and virtually
absent from the low-TDS waters (~1 mg/L). A third assumption is that the
potassium concentration increases linearly with increasing depth (Figure 9).
The relationship of a spring’s location to its chemistry can now be easily
explained. The chemistry of the each spring is determined not only by its
location but also by its depth. For example, the Twin Spring, which is located
near the Downtown Springs, has the chemistry of the Western Springs
because it taps a higher level of the mixing zone (Figure 9). Conversely, the
Ute Magnetic Spring, which is located with the Western Springs, has a
chemistry somewhat similar to the Downtown Springs, because it taps a level
intermediate between the Downtown and Western Springs (Figure 9).
The phenomenon of the relatively higher manganese content of the
Downtown Springs as compared to either of the inputs–the modeled deep-
seated input (Iron Geyser, Table 3) or the modeled marine modified input (7-
minute East, Table 3)–can also be explained by a vertically stratified mixing
zone. Unlike the potassium content, the manganese content does not vary
linearly with depth (Figure 9). This is apparently related to the dissolution and
precipitation dynamics of a manganese-bearing solid phase (hollandite?),
which is partially removing manganese from solution as indicated from the
mass balance calculations (Plate 5, I). As shown at Lake Biwa, Japan
(Kawashima and others, 1988) manganese released from the reaction of
anoxic bottom waters with lake sediments precipitates as it ascends into the

more oxygenated lower epilimnion. The precipitated manganese particles
drop back in the anoxic hypolimnion where they re-dissolve, thus maintaining
an equilibrium that preserves a ~0.5-m-thick manganese-rich layer at the
thermocline.
The manganese peak in the Manitou Springs mixing zone (Figure 9) is
probably related to precipitation of a manganese oxide resulting from an
increase either in DOX or pH. As the manganese precipitates some of the
particles are able to drift downward in open cave passage where they re-
dissolve at lower levels. The only time that manganese is retained in the
system is when the falling particles land on horizontal surfaces in the upper
part of the manganese zone, where the solution chemistry prevents the
manganese particles from re-dissolving. Earthy, horizontal layers of
hollandite in Cave of the Winds support this hypothesis (Figure 10). The
dissolved manganese content of the manganese zone is controlled not only
by the concentration of the input waters, but also by the placement and flow
rates of the springs and the presence of horizontal sediment traps. The
location of the springs is probably the most important control. If the
Downtown Springs did not exist, all of the manganese would probably
precipitate in the mixing zone long before reaching the oxygenated waters of
the Western Springs. Also, if the Downtown Springs had higher flow rates,
much more of the dissolved manganese would be drawn out of the system
and there would be less available for precipitation. Horizontal sediment traps
are also important. Manganese would not be lost as a solid if the manganese
zone, which is estimated to be ~24 m thick, was hosted in a cave passage of
larger dimensions. In this case, precipitated manganese would not reach the
bottom of the cave passage. A spring tapping such a passage would be able
to draw off most of the manganese in the dissolved form.

The above examples also show the importance of the plumbing
configuration of the mixing zone on controlling mineral dissolution and
precipitation. Mass-balance calculations on the present system indicate that
the manganese-oxide beds should be only ~1/16 as thick as the iron-oxide
beds (Plate 5, J). The equally thick beds of iron and manganese deposits in
Cave of the Winds (Figure 10), therefore, suggest that the plumbing of the
system may have been different in the past. The thicker manganese beds at
Cave of the Winds imply that the plumbing was such that all of the available
manganese was precipitated and deposited in the cave. Alternately, in the
past the chemistry of the water feeding the mixing zone may have been
different than today.
Evidence at Cave of the Winds also suggests that in the past, unlike
the present system, the low-TDS near-surface input and deep-seated input
mixed at depth. This is evidenced by the large subaqueous calcite crystals (1
to 5 cm in length) at the south end of Thieves Canyon (calcite nodule, Figure
10) and the Guides Rest (Plate 2). These large crystals are associated with
iron- and manganese-oxides, suggesting that the deep-seated and low TDS
waters mixed at a sufficient depth to permit all of the CO2 to stay in solution,
thus creating a very corrosive mixture capable of dissolving large amounts of
limestone. Then, as this mixture ascended to shallower depths, the pressure
would have decreased, allowing CO2 to outgas and pH to increase. This
would have allowed the precipitation of manganese-oxides, iron-oxides, and
calcite. The outgassing of CO2 is evidenced by the bubble trails present at
the Guides Rest and the southern end of Cave of the Winds (Plate 2).
Apparently, bubble trails are formed when ascending CO2-rich water reaches
a shallow-enough depth that the CO2 outgasses and bubbles up against
overhanging features, where it etches vertically oriented channels.

Movement Of The Mixing Zone
The mixing zone, which in the past was located near Cave of the
Winds, has steadily moved laterally and down to its present position beneath
Manitou Springs. The cave itself is probably the best evidence that a mixing
zone existed at Cave of the Winds. Other evidence includes an alluvium-
filled sinkhole above the cave and an alluvium capped ridge ~0.5 km east of
the cave (Plate 3)–both deposits apparently associated with ancient Fountain
Creek that flowed just above the Cave of the Winds. Additionally, a ridge
~1.0 km southeast of the cave is capped by a 20-meter-thick strath deposit
that is perpendicular to Williams Canyon. This indicates not only that ancient
Fountain Creek was located above the cave, but also that it flowed to the
east, perpendicular to the present canyon.
Much like the present situation at Manitou Springs, the intersection of
the stream valley and the limestone would have been the site where water
rose to form paleosprings on the surface. Evidence confirming this is the
solution breccia located just south of the cave. The breccia consists of
corroded blocks of limestone, chert, and clays in a matrix of earthy dolomite,
which in many places still exhibits the original bedding of the Manitou
Formation. This is strong evidence that the calcite in the dolomitic Manitou
Formation was dissolved by aggressive water in a mixing zone that would
have been located below the paleosprings.
If it is assumed that the water chemistry, flow rates, down-cutting rates,
and the amount of rock involved at the modern mixing zone is similar to the
paleo-mixing zone, the mass-balance calculations can be used to show that
extensive solution breccia should be associated with the paleo-mixing zone.
Evidence at the modern mixing zone indicates that all of the limestone

present beneath Manitou Springs would be dissolved as the mixing zone
moves through the limestone with time (Plate 5, K). This suggests that the
central portion of the paleo-mixing zone should consist entirely of solution
breccia. Large areas of solution breccia occur south of Cave of the Winds
and west of Manitou Springs.
During subsequent erosion, Fountain Creek cut downward as it
migrated to the south. The springs, always rising near the point where the
creek intersected the Paleozoic carbonates, also moved to the south. The
mixing zone, maintaining its position below the springs, moved with the
springs. The movement of the mixing zone through the cave system as the
creek moved laterally can be deciphered by the superposition of distinctive
cave sediments.
Cave Sedimentation Model
As already shown, the present mixing zone beneath Manitou Springs
can be divided into different sub-zones. Minerals precipitating in these sub-
zones along with sediments in active caves in lower Williams Canyon, can be
used to develop a cave sedimentation model. The mass-balance
calculations have already shown that iron-oxide precipitates in the mixing
zone. The low iron content of the downtown springs is indicative that iron-
oxide is precipitating in a sub-zone in the southeastern part of the mixing
zone. As discussed earlier, manganese oxide is probably also being
deposited beneath the Downtown Springs in a manganese-oxide sub-zone.
The separation of iron and manganese oxides into two distinctive sub-
zones is a consequence of differential oxidation and solubility (Krauskopf,
1967). Iron, which reacts with oxygen more readily than does manganese,
precipitates in the oxygen-poor southern region of the mixing zone. Further

to the north, the water has a higher oxygen content from the increasing
admixture of oxygenated near-surface water. This results in the precipitation
of manganese oxide. When the iron oxide precipitates, it is capable of
adsorbing large amounts of heavy metals such as arsenic, lead, antimony,
and tungsten (Drever, 1988). Sediments at the Iron Springs contain up to
4200 ppm arsenic and 225 ppm lead (Table 5A). The low arsenic and lead
content of the iron-poor springs suggests that phreatic iron precipitation has
removed most of the arsenic and lead from these springs (Table 3).
The northern boundary of the mixing zone lies between the western
springs and Williams Canyon (Plate 1). In the northern area of the mixing
zone, the detrital load brought into the system by Williams Canyon Creek is
being deposited. The sediment-free nature of the Western Springs indicates
that all of the sediment load brought into this area of the system is deposited
in water-filled caves.
Continuous southward and downward movement of the mixing zone
through the limestone will therefore result in the superposition of cave
sediments. Because dissolution of limestone takes place throughout the
mixing zone, the residue remaining from the partial dissolution of limestone
will be deposited on the cave floors throughout the mixing zone. However,
only in the southernmost part of the mixing zone would solution debris be
preserved in discrete beds. In the central and northern portions of the mixing
zone, the large volume of other sediments being deposited would dilute and
mask the solution debris.
With continued movement of the mixing zone to the south, iron oxide
would eventually be deposited on the solution debris; subsequently,
manganese oxide would be precipitated and deposited on the iron oxide.
Continued southward movement of the mixing zone would be recorded in the

northern part of the mixing zone by a coarsening-upward detrital sequence.
Williams Canyon Creek, which already has been shown to be the major
meteoric-water input for the springs, also transports detrital sediments into
the mixing zone. This process is evident in the vadose portion of Manitou
Cave, which is located just below the area where Williams Canyon Creek
normally infiltrates into its streambed (Figure 2). In Manitou Cave, stream
erosion not only prevents sedimentation, but cuts into sediments that were
deposited earlier when the cave was water filled.
Introduction of new sediment and the erosion of existing sediment
apparently occur only when Williams Canyon Creek is swollen from spring
runoff or floods. Active streams in Manitou Cave have been observed during
spring runoff. In 1921 a large flood roared down Williams Canyon flooding
Manitou Cave, blocking some of the lower passages with sediment
(Rhinehart, 1996). Charcoal and snails preserved on many of the ceilings in
the upper passageways indicate the occurrence of even older floods, which
will be discussed later in more detail. When the stream enters water-filled
passages further to the south, the water velocity is greatly reduced, so that
within a very short distance (~100 m) cobbles, gravel, sand, and silt are
deposited in that order (Bögli, 1980). Clay, because of its ability to stay in
suspension longer, is carried greater distances into the cave system.
However, because of the long travel time to the springs (estimated to be 2-4
weeks) and the low water velocity, even the finest clay particles settle out of
the water before reaching the springs.
Taking all of the above sedimentation regimes into account, the
migrating mixing zone, as it moves down and to the south through the
limestone, should result in the deposition of the following generalized
sediment column from bottom to top: solution debris, iron oxide, manganese

oxide, clay, silt, sand, and gravel. If the sediments at Cave of the Winds
were a product of this type of migrating mixing zone, then the average cave
sediment column should be very similar to the hypothesized column.
Correlation of Cave-Of-The-Winds Sediments With Spring Sediments
According to the cave sedimentation model, the three lowest
stratigraphic units, from base upward, would consist of solution debris, iron
oxide and manganese oxide. These beds are normally found throughout the
cave in a sequence usually not more than 5-cm thick, making detailed
chemical and petrographic analysis very difficult. In the south end of Thieves
Canyon (Plate 2), however, a 30-cm-thick sequence of these beds facilitates
detailed analysis (Figure 10, Table 5B). The basal bed consists
predominantly of rounded, frosted quartz grains with smaller amounts of
feldspar, illite, and silicified fossil fragments. The insoluble residue from the
Manitou Formation has a composition very similar to the basal bed (Morgan,
1950). Overlying this bed are two iron-oxide-rich beds (Figure 10, Table 5B)
that contain variable amounts of hematite and goethite. The micro-
morphology of the iron oxide suggests that it was deposited by bacteria
(Figure 11). The rod shaped iron oxide has a morphology that is very similar
to the sheathed bacteria Leptothrix (Peck, 1986). Apparently, this bacteria
precipitates a ferrihydrite-like compound, which, with time, recrystallizes into
goethite and hematite (Figure 11D). These iron-oxide deposits have very
high concentrations of arsenic and lead (Table 5B, As = 8900 ppm, Pb =
6200 ppm) and are similar to modern iron-oxide deposits precipitating from
the waters of the Iron Springs (Table 5A, As = 4200 ppm, Pb = 225 ppm).
Overlying the iron-oxide layer is a manganese-oxide layer, which
consists mostly of the mineral hollandite (Figure 10). Clay, which in some

parts of the cave can be up to 8-m thick, overlies the manganese-oxide, in
agreement with the sedimentation model. The model also predicts that a
coarsening-upward sequence of silt, sand, gravel, and cobbles should overlie
the clay. This sequence, which is up to 2-m thick, is found throughout the
cave.
Source Of Cave Infill
Importance Of Provenance
Proving the provenance of the detrital sediments present at Cave of
the Winds is important because it shows that the detrital sediments present in
the cave are indeed allochthonous and that the sediment column present at
the cave is the result of a sedimentation process similar to the one taking
place in the mixing zone beneath Manitou Springs today. The provenance of
the clay will be discussed first and in much more detail than the coarser
sediments present at Cave of the Winds because of the controversies over
the origin of the clay and because of the importance of the origin of the clay
for climate modeling.
Red Clay
Bretz (1942) suggested that the red clay commonly present in caves is
derived from soil that overlies the surface above the caves. Some authors
believed that this clay was derived from the in situ dissolution of limestone
(Davis, 1930, Warwick, 1953). Modern studies have shown that cave clays
are derived from local regoliths and transported into caves by streams
(Reams, 1968; Frank, 1965; Milske, 1982; White, 1988). These two schools
of thought suggest that the clay at Cave of the Winds can come from either of

two sources; residue from the dissolution of limestone or allochthonous
sediment washed into the cave.
The large difference between the amounts of clay minerals present in
the red clay and the clay present in the limestone is evidence that the
limestone-derived clay contributes little to the total clay fill in the cave. The
cave clay contains ~13% smectite (Figures 12C and 12D), whereas the
limestone contains only ~1.0% of that type of clay (Figure 12B). Additionally,
by looking at the volume of clay-filled passages as compared to the available
limestone-derived clay it can be shown that limestone-derived clay can not be
a major source of the red clay. The passages at Cave of the Winds are
~50% clay filled, a conservative estimate, in as much as many of the
passages have thick clay remnants up to the ceiling. The average clay
content of the limestone is ~2% (Figure 12A). Accordingly, if all of the clay
released during the dissolution of the limestone was deposited in the same
passage where dissolution took place, and the passage is ~50% filled with
clay, then only a maximum of ~4% of the clay filling the passage could be
from the limestone.
As discussed in the sedimentation model, stream transport of surface-
derived sediment is the most likely process for introducing most of the clay
into the cave. The two likely sources for these transported clays are clays in
weathered Pikes Peak Granite or clays in soils developed from the Pikes
Peak Granite. Weathered Pikes Peak Granite contains very little clay (Blair,
1975). However, soils, which develop from grus, loess, and alluvium derived
from the granite, do contain abundant clay (Blair, 1975). Comparing the clay
content and mineralogy of a clay-rich alluvium and clay-rich B horizons of
three local soils (Figures 12E and 12F) with the cave clay (Figures 12C and
12D) indicates that the soil-derived clays contain the same types and

proportions of these clays. Eroded soil, especially the B horizon, therefore,
appears to be the main source for the clay transported into the cave.
Detrital Sediments And Speleothems
The top of the coarsening-upward sequence at Cave of the Winds is
capped by an up-to-2-m-thick graded bed of silt, sand, and gravel. The silt
and sand contain feldspars, quartz, and biotite, which are the main mineral
components of the Pikes Peak Granite. Furthermore, some of the gravel
clasts are rounded, lithic fragments of the Pikes Peak Granite. This indicates
that the coarse, upper sediments in the cave were deposited by surface
streams, in agreement with the sedimentation model.
According to the previously presented sedimentation model, coarse
sediments are being deposited near the phreatic-vadose interface, which is
~0.5 km north of Manitou Springs. This suggests that when the coarse
sediments were being deposited at Cave of the Winds the springs were south
of the cave. At this time Fountain Creek was just beginning to erode the
Nussbaum Alluvium.
After deposition of the coarse detrital sediments at Cave of the Winds,
there has been continued minor deposition. For example, at Holes 3 and 4 in
the Grand Concert Hall (Plate 2) there are four distinct layers of calcite
travertine (flowstone), which is banded and can be up to 5 cm thick. The
NRM of the uppermost calcite layer has reversed polarity, suggesting that the
calcite is at least 780 ka. Throughout the cave, there are other calcite and
aragonite deposits (speleothems) in the form of stalactites, stalagmites, and
flowstone that post-date stream sedimentation (Modreski, 1987). Also, in
cave passages that intersect the surface (entrances), the floors are
commonly covered with small angular rock fragments (breakdown). This type

of breakdown is normally the result of frost splitting (congelifraction) of the
ceiling and walls. Additionally, detritus washed into the cave by hillside
flooding and organic debris brought into the cave by animals is present near
the cave entrances.
Chronology Of Speleogenesis
Age Of Cave Passages
Because Cave of the Winds is an erosional feature, its exact age
cannot be determined. However, geologic and geomorphic features related
to the cave can be used to bracket the age of incipient and major cave
development. Solution breccia in the Manitou Formation indicate that there
may have been some Middle Ordovician to Devonian cave development
(Forster, 1977). Sediment-filled paleo-caves and -sinkholes at Cave of the
Winds indicate Devonian to Late Mississippian karst development (Hose and
Esch, 1992). Subsequent Cenozoic dissolution along some of these
paleokarst features has resulted in the formation of cave passages (Fish,
1988). Between the Pennsylvanian and Late Cretaceous, about 3000 m of
sediments, which contain abundant shale beds, were deposited on top of the
initial cave. Very little, if any, cave development could take place during this
period of deep burial under the thick blanket of the nearly impervious
sediments and rock.
The Laramide Orogeny, beginning in the Late Cretaceous (~75 Ma,
Mutschler and others, 1987), was associated with the uplift of the Rocky
Mountains. The uplift, which included the Rampart Range and Pikes Peak,
caused the activation of the Ute Pass and Rampart Range Faults (Morgan,
1950; Bianchi, 1967). In the Manitou Springs area, movement on the Ute

Pass Fault resulted in the folding, jointing and minor faulting of the rocks
(Hamil, 1965; Blanton, 1973). The subsequent flow of corrosive water along
the fractures related to the folding and faulting would produce most of the
passages in Cave of the Winds and nearby caves. Uplift during the early
Laramide Orogeny increased the topographic relief in the Manitou Springs
area, resulting in the initiation of erosion of the overlying sediments and also
increased the local hydraulic head. The erosion of some of the impervious
shale along with the increased hydraulic head may have initiated some minor
water flow through the joints and faults, causing incipient dissolution.
However, in the first 25 m. y. of the Laramide Orogeny, erosional stripping
almost equaled uplift (Tweto, 1975) resulting in a subdued topography with a
maximum elevation of about 1000 m (Epis and Chapin, 1975). It was
unlikely, therefore, that a large hydraulic head existed. A large hydraulic
head is necessary to force large volumes of water through the rock needed
for development of a large cave system.
A Late Miocene-Early Pliocene alluvial deposit on the Rampart Range,
18 km northwest of Manitou Springs, indicates renewed Miocene-Pliocene
uplift, which in some places was up to 3000 m (Epis and Chapin, 1975). At
the same time, movement along the Ute Pass Fault caused redirection of
Fountain Creek from its former position near the above-mentioned alluvial
deposit to its present position (Scott, 1975). Valley entrenchment along the
Ute Pass Fault by Fountain Creek, in conjunction with uplift, created the
hydraulic head needed to drive the mineral springs and the mixing zone. It is
likely, therefore, that the age for the onset of major dissolution at Cave of the
Winds is probably Late Miocene-Early Pliocene (7 Ma to 4 Ma).

Age Of Cave Fill
Sedimentation in the cave appears to have been contemporaneous
with passage development. There are a few problems in proving this
chronology. One is the lack of datable materials in the sediments, such as
fossils or volcanic ashes. Preliminary study of the sediments indicated that
magnetic reversal stratigraphy (magnetostratigraphy) might be useful in
dating the sediments. The use of this method, however, presents another
problem: it requires that the polarity sequence be constrained by at least one
independent date.
The Nussbaum Alluvium, which crops out east of the cave and is ~20
m higher in elevation, is apparently related to coarse sediments present at
the top of sediment sequences in Cave of the Winds. If an age is assigned to
the Nussbaum Alluvium and the relationship of the Nussbaum Alluvium to the
coarse sediments in the cave deciphered, then an independent date can be
assigned to at least one polarity reversal in the cave. The age of the
Nussbaum Alluvium will be dealt with first, because the age of the Nussbaum
Alluvium is poorly constrained. Various authors have assigned that range
from Late Pliocene to early Pleistocene (Scott, 1963; Soister, 1967; Scott,
1975). For the purpose of correlating the Nussbaum Alluvium with a
paleomagnetic reversal, a more accurate date for the Nussbaum Alluvium
was needed. This problem was solved by aminostratigraphy.
Aminostratigraphy
Most amino acids exist as two forms: L- and D-isomers (Miller and
Brigham-Grette, 1989). In a living organism, the amino acids are L-isomers.
After the death of an organism, the amino acids racemize, which is the
natural conversion of the L-isomers into D-isomers. Eventually the amino

acids in the dead organism equilibrate to a 50/50 mixture of L- and D-
isomers. The amino acids used in the present study are D-alloisoleucine and
L-isoleucine (A/I). These amino acids are somewhat more complex, because
L-isoleucine actually changes to a different molecule, D-alloisoleucine. This
reaction, similar to racemization, is called epimerization (Miller and Brigham-
Grette, 1989).
The rate at which this reaction takes place is a function of
temperature. For example, if the burial-temperature history for a group of
mollusks of different ages has been the same, the ratio of the two amino
acids – alloisoleucine and isoleucine (A/I) – in the mollusk shells can be used
for relative dating and in some cases, absolute dating (Miller and Brigham-
Grette, 1989). Because temperature controls the rate of racemization, the
temperature history of buried fossils must be considered before using A/I to
derive ages.
Solar insolation, fire, altitude, and climate can effect the burial
temperature of fossils. Diurnal or seasonal solar heating of fossils buried at
shallow depths may accelerate racemization and increase the apparent age
of the samples (Goodfriend, 1987; Miller and Brigham-Grette, 1989).
Therefore, samples should be obtained from depths that exceed 2 m (Miller
and Brigham-Grette, 1989). During the intense heat associated with a fire,
racemization can also be greatly accelerated. For example, charcoal, which
has a 14C age of ~1500 years, found with snails at Manitou Cave suggests
that the snails were exposed to a forest fire before being transported into the
cave. If so, the A/I of the snails may be anomalously high for their age.
The altitude of the collection site can also affect racemization rates.
For example, snails in this study were collected at altitudes between 1890
and 2195 m above sea level. Because of the normal adiabatic effect, the

highest site averages about 1.7° C less than the lowest site. Another
temperature variable is long-term climate change. For example, the
Nussbaum Alluvium has probably been exposed to episodes of higher or
lower temperatures for much longer periods of time than the younger alluvia.
Because post-depositional thermal histories are impossible to ascertain, the
burial temperature for all alluvia in this study are assumed to be the same.
Mollusks
In all, over 10,000 mollusks, which included one species of slug, one
species of clam, and 24 species of snail, were identified and counted. The
tabulated number for each species is the number of shells that could be
identified. For example, the Chesnut site had ~3,000 snails that could not be
identified because they were too small (juvenile) or broken. Because of the
small weight of the individual snails (0.3 to 5.0 mg) in relation to the 30 mg
necessary for testing, only abundant species could be used for the amino-
acid study. The most abundant species from the Black Canyon site were
Vallonia cyclophorella and Pupilla muscorum and from the Fillmore, Starlight,
and Colorado City sites, Vallonia cyclophorella and Gastrocopta armifera
(Table 6). All of the alloisoleucine and isoleucine (A/I) ratios of the snails
along with laboratory identification numbers are tabulated in Table 7A. Table
7B contains the average and standard deviation of the A/I of selected snails
from each site.
Discussion Of A-I Ratios
The epimerization rates of the four species used in this study are very
similar. This is indicated in Table 7A by the comparable A/I values of
different snail species at the same sample location. Moreover, shell size did

not appear to greatly effect the A/I. For example, the average Gastrocopta
Armifera shell weighs 5 mg; the Vallonia cyclophorella 1 mg; yet, the A/I for
these shells from Manitou Cave are similar (Table 7A).
The snails from the Verdos Alluvium, which include the Starlight,
Fillmore, and Colorado City sites (locations on Plate 3), were used to test the
A/I reproducibility of samples from one site and to compare the A/I from the
different sites. Extra effort was put into assuring that the amino acid ratios of
snails from Verdos Alluvium were as reliable as possible, because any errors
in their A/I determination would greatly amplify the inaccuracies of the
extrapolated age of the Nussbaum Alluvium (Figure 13). Therefore, the
Starlight site was sampled three times and the Fillmore site, twice. Although
each of the two sub-sites at Colorado City were sampled twice, the scarcity of
Vallonia cyclophorella and Gastrocopta armifera necessitated combining all
snail shells of similar species from the entire site and from both sampling
trips. One Starlight-site sample (Table 7A, Lab # AAL-5768) was excluded
from the final curve fitting because it had an anomalously high ratio as
compared to the others from that site. The snails that made up this sample
(AAL-5768) may have been from an older reworked alluvium or there may
have been a problem with their preparation or analysis.
The data from the Colorado City site were also excluded from the final
curve fitting, primarily because the A/I’s of the two species were very different
from each other and both A/I’s were much lower than those from the Starlight
and Fillmore sites. Their low A/I’s would indicate that the Colorado City site
may actually be either the Slocum or Louviers Alluvium. The anomalously
low ratios could also be the result of contamination from modern shells or
organic material.

Determination of anomalously high or low ratios would be impossible
without multiple sampling. Taking one sample per site would have been
insufficient. Two samples per site were acceptable when the A/I ratios were
about the same for both species. With 12 samples from the Verdos Alluvium,
it was quite appropriate to discard the highest and lowest ratios.
The A/I ratios of land snails determined from this study and other
studies of nearby areas (Dethier and Harrington, 1987; Allen Nelson, 1989,
oral and written commun.) indicate that racemization rates are slow. The
slow epimerization rate may not make this technique useful for dating
Holocene deposits. The technique, however, should be very useful for dating
Pleistocene and Pliocene deposits, and may even be useful for relative dating
of Late Miocene deposits.
Age Of The Alluvia
The higher A/I of the snails from Black Canyon site, which is mapped
as Nussbaum Alluvium, indicates that it is older than the other alluvia (Table
7A). Furthermore, by ascertaining the ages of the younger alluvia, plotting
those against their relative A/I ratio, and fitting a curve to the resultant plot, a
equation can be derived that can be used to calculate the approximate age of
the Nussbaum Alluvium.
Snails from the modern flood plain (Plate 3) were used to ascertain the
A/I ratio of modern snails. About 50% of the snails at this site were alive
when collected. The live snails were not analyzed because the flesh, which
may have different amino-acid ratios than the shells, might have
contaminated the shell A/I ratios. Empty shells were used for analysis and
assumed to be about one year old. There is a possibility that the modern
shells were reworked from older sediments such as the Piney Creek

Alluvium. However, the abundant live snails mixed with the dead snails of the
same species suggests that all snail specimens were contemporaneous.
The Centennial site (Plate 3) has been mapped as Piney
Creek and Post-Piney Creek (Trimble and Machette, 1979). Charcoal
collected from the Centennial site (location on Plate 3 and description on
Plate 4) was 14C dated at 1542 ± 130 years old (Table 8) indicating that the
site should be mapped as Post-Piney Creek Alluvium. The snails collected at
Manitou Cave, which have relatively high A/I ratios, were initially thought to be
about the same age as dated deposits at Narrows Cave. Narrows Cave is
located ~0.4 km north of Manitou Cave and contains flood deposits
intercalated with flowstone that has been dated and found to have a
maximum uranium-thorium age of 32 ± 2 Ka (Table 8). They are thought to
be the same age because the snails at Manitou Cave and the deposits at
were both deposited by paleo-floods and both had similar heights above
Williams Canyon Creek. However, charcoal associated with the snails in
Manitou Cave was 14C dated with an age of 1552 ± 75 years (Table 8).
Apparently, either young charcoal mixed with old snails during the paleo-flood
or the snails were affected by a forest fire that induced anomalously high A/I
ratios. This conflicting evidence made it necessary to exclude the Manitou
Cave data from the curve fitting.
The Chesnut site was mapped by Trimble and Machette (1979).
Elsewhere in Colorado the Louviers has been dated at 115 Ka by Machette
(1975). Szabo (1980) gave a minimum age of 102 Ka and inferred that the
maximum age was ~150 Ka. The Fillmore, Colorado City, and Starlight sites
are all mapped as Verdos Alluvium (Trimble and Machette, 1979), which, in
the Denver area, contains the 640-Ka Lava Creek B ash near its base
(Sawyer and others, 1995; Izett and others, 1989; Machette, 1975). Because

the Lava Creek B ash gives the maximum age for the Verdos Alluvium, the
inferred maximum age of ~150 Ka was assigned to the Louviers Alluvium.
The interpolated age of the Nussbaum Alluvium, therefore, represents its
maximum age.
Parabolic Curve Fitting
Ages and A/I data (Table 7B) from four of the younger alluvia, together
with A/I data from the Nussbaum, were used to extrapolate the age of the
Nussbaum. Various authors have applied linear and parabolic curve fitting to
amino acid data for both interpolation and extrapolation of age (Miller and
Brigham-Grette, 1989). Mitterer and Kriausakul (1989) have employed the
parabolic function (y=x2) with good results. Applying the generalized
parabolic equation (y=A+Bx+Cx2) to my data resulted in a better curve fit than
the specialized parabolic function (y=x2). Use of the specialized parabolic
function assumes that the A/I ratio starts at 0.0 and that at an initial age near
zero, the racemization rate is infinitely large. The data from my study area
suggest that both of these assumptions are invalid (Table 7B and Figure 13).
Ignoring the A+Bx terms appears to have little effect on curve fitting of
relatively young snails (<100 Ka). The generalized parabolic function,
however, was used in this study because the age of the Nussbaum Alluvium
is extrapolated 3 to 4 times beyond the oldest calibration point. Parabolic-
curve fits for the average ratio with error bars of one standard deviation
indicate an extrapolated age for the Nussbaum Alluvium of 1.9 +0.4/-0.2 Ma
(Figure 13).
Extrapolating a date that is 3 to 4 times more than the maximum
calibration date is a practice generally frowned upon. I believe that by
carefully collecting and handling samples, obtaining precise analysis of the

amino acids, acquiring the best age determinations of the younger deposits,
and curve fitting with the generalized parabolic function, I have minimized
problems usually associated with such extrapolation. The 1.9-Ma date for the
Nussbaum Alluvium is appropriate only for the unit mapped in the Manitou
Springs area; it may not be correlative with the type section in Pueblo,
Colorado. The date, 1.9 +0.4/-0.2 Ma, which is the most accurate date
available for the Nussbaum Alluvium, was used to calibrate the
magnetostratigraphy of the sediments in Cave of the Winds.
Magnetostratigraphy
Unconsolidated sediments can be magnetized by the magnetic field of
the earth (Tarling 1983), acquiring natural remanent magnetization (NRM). A
type of NRM in sediments is detrital remanent magnetization (DRM), which is
formed when the magnetic grains of a sediment, such as magnetite or
hematite, are aligned with the earth’s magnetic field during or soon after
deposition (Verosub, 1977). The DRM of a sediment has the same
orientation the earth’s magnetic field (Verosub, 1977).
The magnetic field of the earth has reversed many times in the past at
an average rate of ~1 reversal/0.5 m.y. (Tarling, 1983). Polarity time scales
have been constructed by compiling a succession of the reversals from
radiometrically dated rocks (generally volcanic) and the established marine
linear magnetic anomaly pattern (Mankinen and Dalrymple, 1979; Harland
and others, 1982; Hailwood, 1989; Cande and Kent, 1992).
There are several ways to use this time scale to date sediments. By
assuming that the top of a sediment section starts at the present and
sedimentation has been uninterrupted, such as in deep ocean basins, it is a
simple matter of counting the reversals and correlating them with the polarity

time scale. Normally, because of erosion or a hiatus in deposition, however,
the top of a sediment section will have a non-zero age that must be
ascertained by some other technique before reversals in the section can be
correlated with the polarity time scale.
Another way of dating sediments is by pattern matching. If the
sedimentation rate of an undated section can be assumed to be constant or
is known and there are sufficient reversals (5-10), the polarity record can be
matched to the pattern of the polarity time scale to provide dating. This is
possible because the timing of reversals is apparently random (Tarling,
1983), therefore, a sequence of reversals is seldom repeated. Both of these
techniques were used to refine the age of the sediments at Cave of the
Winds.
Paleomagnetic Results
All the paleomagnetic data from Hole 6 are presented to provide a
typical example of NRM results and how the samples responded to
demagnetization (Table 9). The complete data set of sites included in this
study are available from the author on computer storage disks. Sample
depth and magnetic declination after 15-mT AF demagnetization from each
site were used to correlate the magnetic polarity sequence within and
between the Grand Concert Hall and nearby Heavenly Hall (Plate 6). An
exception to the use of this demagnetization level is Hole 5, from which
samples from 6.5 to 10.0 m in depth were subjected to step wise 20-, 25-,
and 30-mT-AF demagnetization. The higher fields were applied in an attempt
to remove secondary overprints. Even with the increasing demagnetization,

however, the declination of the deeper samples at Hole 5 have greater
variability than those from shallower depths (Figure 14). Additionally, the
polarity results from Hole 5 are shown in Figure 14, which also shows the
correlation with the known polarity record and stratigraphy of the cave
sediments.
Criteria For Reversal Assignment
Sequences of samples that had an average declination of ~0.0° and
an average inclination of ~35.0° were assigned to normal polarity. The ideal
inclination for DRM in the Manitou Springs area (latitude ~N39°) should be
~60°. The low values recorded at Cave of the Winds are considered to be
the result of inclination error resulting from sediment compaction (Verosub,
1977), a common occurrence among clay-rich sediments. Sequences of
samples that had an average declination of ~180° were assigned a reversed
polarity (Plate 6). In most cases, inclinations of these samples were variable,
ranging mostly between -35° and +10°. Some of the low, upward inclinations
can also be attributed to inclination error; some, however, appear to be
related to post-depositional acquisition of remanent magnetization.
Effects Of Post-Depositional Remanent Magnetization On Sediments
Most post-depositional remanent magnetization (PDRM) is the result
of realignment of the magnetic particles during compaction and especially
dewatering, both of which can take place thousands to millions of years after
deposition (Verosub, 1977). A possible explanation of the variability of the
inclination of the reversed samples is that these samples were compacted
and dewatered during a normal polarity interval, overprinting a normal
component. The dewatering and compaction may have occurred rather

quickly following rapid draining of the water in the cave passages related to
downcutting by Fountain Creek. Mud cracks present in the top two meters of
the sediments at the Grand Concert Hall combined with their mostly normal
polarity (Figure 14) indicate that this is a plausible explanation. Further
micro-sampling and precision analysis would be necessary to ascertain the
mechanism responsible for the difference in the inclinations.
Chemical remanent magnetization (CRM) may also be a contributing
factor to anomalous inclination. Alteration and oxidation of iron-bearing
minerals in the sediments after deposition could conceivably contribute to
CRM. This could only be a factor in the top two meters of coarse sediments
(Figure 14), which contain unaltered minerals. The general oxidizing
conditions and neutral to slightly alkaline pH of waters percolating through
these sediments, however, would preclude mobilization or precipitation of iron
oxides. The underlying soil-derived clays, which have already undergone
prolonged oxidation before being deposited in the cave, are chemically stable
and would not be vulnerable to CRM.
Other evidence that suggests that there is little to no effect from CRM
is the presence of magnetite in the sediments at Cave of the Winds.
Chemical analysis indicates that the magnetite in the cave sediments is
derived from the Pikes Peak Granite and is not authigenic (Table 10).
Petrographic examination verified that all samples, rock and cave sediments,
contained grains of magnetite that have partially altered to hematite. This
indicates that much of the hematite present in the cave sediment is allogenic.
Petrographic examination of the cave sediments also confirmed the presence
of blood-red beads of microcrystalline hematite. This evidence suggests that
some of the hematite was formed after the sediments were deposited in the

cave. However, a ~40% decrease of the NRM intensity with 10-mT-AF
demagnetization (Table 9) indicates that the main carrier of the NRM in the
cave sediments is magnetite. If the main carrier of the NRM was hematite, a
much higher field (>1000 mT) would have been necessary to achieve a
similar decrease in NRM (Tarling, 1983). Magnetite, being >100 times more
magnetic than hematite, overwhelms any CRM from the formation of
authigenic hematite.
Paleomagnetic Correlation
Because there are no independent dates on the cave sediments,
correlation of the magnetic polarity record of the Cave of the Winds
sediments with the accepted polarity time scale poses a difficult problem.
The solution requires matching a part of the sequence of known polarity
events with the Cave of the Winds record. The age of the Nussbaum
Alluvium, which is apparently related in time to the uppermost coarse cave
sediments, however, can be used to help constrain the paleomagnetic
correlation.
As discussed previously, clay is deposited in the cave below the
phreatic-vadose interface where sediment-laden streams enter water-filled
passages. The Nussbaum Alluvium was being deposited on a stream-cut
surface at the same time that clay was being deposited in the Grand Concert
Hall the (Figure 15A). As Fountain Creek downcut and moved to the south,
the water table dropped (Figure 15B). The drop in the water table coincided
with drop in the water depth in rooms like the Grand Concert. As the water
depth dropped, the velocity of the water passing through the room increased.
The increased stream energy changed the sedimentation regime from clay
deposition, in time, to silt, sand, and gravel deposition (Figure 15B). Fluvial

sedimentation at Cave of the Winds stopped as Fountain Creek moved
further to the south and downcut further (Figure 15C). The relationship
between the Nussbaum Alluvium and the sediments in the cave indicates that
in the Grand Concert Hall the change from silt to clay deposition took place
after the Nussbaum was deposited. More specifically, the clay-to-silt
interface should be the same age as the Nussbaum Alluvium, minus the time
it took for Fountain Creek to cut down and drop the water table to the level of
the Grand Concert Hall (Figure 15B).
The sediment floor of the Grand Concert Hall, where the
paleomagnetic data was obtained, is about 20 m below the Nussbaum
Alluvium. The age of the Nussbaum Alluvium (~1.9 Ma) and its height above
modern streams (200 m) provides an estimate of the average down-cutting
rate of 10.5 cm/1000 years. Accordingly, accumulation of coarse sediments
in the cave 20 m below the Nussbaum Alluvium probably would have begun
~1.7 Ma.
The estimated 1.7 Ma age of the clay-coarse sediment interface
correlates well with the onset of the Olduvai Subchron at 1.9 Ma (~2.2 m
depth, Figure 14). This is the most probable correlation. Alternatively, one
could match the normal-polarity sequence (1.0 to 2.2 m depth, Figure 14)
with the Jaramillo Subchron (Harland and others, 1982) or the Gauss Chron
(Figure 14). These correlations, however, would result in an age of ~1.0 Ma
and ~ 2.6 Ma, respectively, for the clay-coarse-sediment interface–much too
young or too old, respectively, for its estimated age.
The complete paleomagnetic correlation shown on Figure 14 follows
from correlation of the normal-polarity interval between 1.0 and 2.2 m in
depth with the Olduvai Subchron. According to the correlation suggested
here, the oldest cave sediment was deposited about 4.3 Ma, a date that

agrees quite well with the previously discussed probable age of the major
onset of cave formation (7 Ma to 4 Ma).
PLIOCENE-PLEISTOCENE CLIMATE
Climate Record In Cave Sediments
Studies have shown that the clay mineralogy of soils is related to both
the parent material and the climate in which the soils formed (Singer, 1978;
Eberl, 1984; Birkeland, 1989). If the soil clays are pedogenic and not
inherited from parent material, then soils rich in kaolinite are generally related
to moist climates and those rich in smectite, dry climates (Singer, 1978;
Eberl, 1984; Birkeland, 1989). For example, along the Front Range of
Colorado, smectite is three times more abundant in the dry soils of the plains
than in the wetter soils of the mountains (Netoff, 1977). When these soils are
eroded they can be transported to, and deposited in caves, such as Cave of
the Winds. These deposits, which are protected in the cave from further soil-
forming processes or chemical transformations, can be used for interpretation
of the climate that existed at the time of soil formation (Frank, 1965; Bögli,
1980). At Cave of the Winds, the oldest clay deposits have relatively less
kaolinite and more smectite than the younger clay deposits (Figure 12D).
This suggests that when clay deposition started the climate was drier and by
the time clay deposition ceased, the climate had become wetter. This
apparent climate change, however, also could have been related to uplift. As
the elevation of the region increased there may have been an increase in
precipitation, which would not be related to a global climate change.

Another possible problem with clay/climate correlation is the timing of
clay formation and clay deposition. This can been seen in the silty cave
deposits, which have a relatively higher smectite content than the underlying
clays and about the same amount of kaolinite as the underlying clays (Figure
12D, Samples 1 and 2). The high smectite content suggests a dry climate,
whereas, the kaolinite content suggests a wet climate. The chemical
properties of the two clays can be used to explain this apparent anomaly.
Smectite can transform to kaolinite, but the kaolinite to smectite
transformation is much less likely (Singer, 1978). Therefore, kaolinite, which
was formed in the soils during a wetter climate, would be stable during a
subsequent drier climate, during which time smectite would be forming.
Clays eroded from these soils and deposited in the cave would contain
kaolinite formed during an earlier, wetter time and smectite forming
contemporaneously with soil erosion and cave deposition. The smectite
content, therefore, would more accurately record the climate that prevailed at
the time of soil erosion and cave deposition.
Large-Scale Sediment Changes As Climate Indicators
Two large-scale sediment changes in the stratigraphic column at Cave
of the Winds can be correlated with large-scale climate changes. Morrison
has suggested that the Verdos, Rocky Flats, and Nussbaum alluvia were
deposited during megacycles (Osterkamp, 1987). He suggests that these
megacycles are 400 to 500 k. y. in duration and are associated with large
climate changes. The Nussbaum Alluvium, which was deposited during the
oldest of these megacycles, is preserved on the ridge above the cave and on
the ridge east of the cave. The coarse-grained cave deposit, which can be
up to 2-m thick and overlays clay (Figure 14), has been correlated with the

Nussbaum Alluvium. The onset of silt deposition (Figure 14, 2.7 m) suggests
that the megacycle associated with the Nussbaum Alluvium started ~2.1 Ma.
The cut-off of major sedimentation at Cave of the Winds at ~1.6 Ma has been
correlated with the downcutting of the Nussbaum Alluvium as discussed
earlier. This downcutting may be associated with the onset of the next
megacycle, which Morrison correlates with the Rocky Flats Alluvium.
Magnetic Susceptibility
Magnetic susceptibility is a measure of the ease with which a material
becomes magnetized in an applied low-intensity magnetic field (generally,
~0.1 mT). The magnetic susceptibility of a sediment is the combined result of
grain size, mineralogy, and amount of magnetic particles in the sediment.
Larger particles of the same magnetic mineral display greater magnetic
susceptibilities than do smaller ones. In Cave of the Winds sediments, the
upper silty and sandy beds have much higher susceptibilities than the lower
red-clay beds. The upper beds have a higher susceptibility, because they
contain a greater number of larger magnetic particles than the lower clay
beds. This was evidenced while attempting to remove magnetic particles
from these sediments for mineral identification and elemental determination.
Only the upper silty sediments contained enough of the larger magnetic
particles for analysis. The lower beds contained only a few small grains (< 1
µm). The minerals magnetite and hematite are the most common magnetic
minerals in sediments at Cave of the Winds. Magnetite, however, has a
higher susceptibility, so that with other parameters being equal, only a small
amount of it relative to hematite can dominate the susceptibility of a sample.
The rapid decrease in remanence intensity of samples during A. F.
demagnetization, and the identification of abundant magnetite in polished

sections indicate that magnetite is the major carrier of magnetic susceptibility
in Cave of the Winds sediments.
Periodicity Of Susceptibility
The plot of magnetic susceptibility of sediments from Holes 1 and 5
versus depth exhibits cyclical patterns of highs and lows (Figure 16). These
patterns are especially noticeable in the upper ~3.5 m of Hole 1 (Figure 16),
which is a function of higher susceptibility and higher sedimentation rate of
these upper beds. The higher susceptibility of these beds has previously
been discussed. The higher sedimentation rate of these beds is indicated on
Figure 14, which shows that the rate was about twice as great during the
Olduvai Polarity Subchron (correlated with the silty-sandy beds) than during
the underlying subchrons (correlated with clay beds). Because the samples
were collected at regular intervals, more samples were collected per geologic
time in the silty-sandy beds than in the clay beds. This results in better
resolution of the susceptibility record in the silty-sandy beds. Because of the
pronounced susceptibility and better resolution, only the upper beds of Hole 1
will be used in the following climate-susceptibility discussion.
Many studies have shown (Peck and others, 1994; Bloemendal and
others 1995) that the cyclical fluctuations in susceptibility can be correlated
with climate changes. Bloemendal and others (1995) suggest that variations
in susceptibility of Chinese loess reflects episodes of loess dilution, carbonate
leaching, and pedogenesis, all of which are related to variations in climate.
Peck and others (1994) attribute fluctuating susceptibility of sediments at
Lake Baikal, Russia to complex interactions of climate controlled parameters.
I propose that the cyclical susceptibility pattern at the Cave of the Winds

records the climate-controlled fluctuation of sediment transport energy of
streams that brought sediment into the cave.
Magnetite, the main carrier of susceptibility in the cave sediments, was
transported into the cave by surface streams. The size and amount of
magnetite grains in the cave sediment is a function of stream transport
energy. Because of the high density of magnetite (~5.18 g/cm3), it is
transported more readily by high-energy streams; therefore, it should be more
common in cave sediments that were transported to the cave by high-energy
streams. Two major controls of stream transport energy are the stream
gradient and discharge.
During the deposition of sediments in Cave of the Winds, the stream
gradient in the Manitou Springs area was mainly controlled by epirogenic
uplift. The periodicity in the susceptibility record might be explained as the
result of periodic rapid uplift along local faults, (such as the Rampart Range
and Ute Pass Faults). After uplift local stream gradients would be increased,
stream energy would increase and the amount of magnetic particles
deposited in the cave would increase. Subsequently, erosion would reduce
the stream gradient, stream energy, and the amount of deposition of
magnetic particles in the cave. This possibility, however, does not seem
plausible because there is no evidence that major earthquakes along the
local faults were either common or periodic.
The other possibility is that the cyclic nature of the susceptibility record
is the result of climatically induced variation in stream discharge. During
episodes of greater precipitation and increased runoff, streams could
transport more grains of magnetite of greater size. Sediments, which were
transported into and deposited in caves during these episodes of increased

run off, should exhibit higher magnetic susceptibility than those deposited
during periods of low runoff.
Potential of Correlating Susceptibility with Climate
The oceanic oxygen-isotope history (ODP 677, Shackleton and others,
1990) records glaciation as variations in the δ18O record. If the susceptibility
of cave sediments records variations in precipitation related to glaciation
there should be a correlation of δ18O values in the ocean record with the
susceptibility in the cave record. Comparing the cave susceptibility record
with δ18O record and predicted insolation for the time interval between about
1.7 Ma and 1.9 Ma shows some similarity (Figure 17). Especially noticeable
is the cyclic pattern of these three curves. Visual inspection of the insolation
curve indicates a periodicity of ~20 k.y, whereas the δ18O record has a strong
41 k.y. periodicity with weaker periodicities of 23 k.y. and 19 k.y. (Shackleton
and others, 1990). Visual inspection of the magnetic susceptibility record
shows a periodicity of ~20 k.y., which agrees with the insolation curve and to
a lesser extent with the δ18O record. For a more rigorous correlation of the
ocean record with the cave-sediment susceptibility record, the cave
sediments would have to be dated much more precisely and many more
samples would have to be collected.
Pliocene-Pleistocene Mollusk Record
During the course of this study it became apparent that the Pliocene-
Pleistocene mollusks used for amino-acid dating and the Pliocene sediments
from the Cave of the Winds might be used to reconstruct a partial climate
record of the Manitou Springs area. Because different mollusks lived in
different environments, the climate that prevailed during mollusk deposition

can be inferred. Most of the species collected during this study were not
analyzed for amino acids because they either were not abundant or only
occurred at a few sites. All species, however, were identified and counted
(Table 6). Because of the large number of species and specimens collected
during this study, some level of interpretation of paleo-environment and
paleo-climate is possible.
The occurrence of Oxyloma, Derocerus, and Fossaria parva indicates
that the Starlight site was moist and at times aquatic (Evanoff, 1983 and
1987). The occurrence of Pupoides inornata and Vallonia cyclophorella
indicate that the environment of the Fillmore site was dry, although the
presence of Succinea indicates that a water body was nearby (Evanoff, 1983
and 1987). The fossil assemblages from the Starlight and Fillmore sites
suggest the presence of perennial streams within a relatively dry
environment. The occurrence of Fossaria parva, Oxyloma, and Vertigo at the
Louviers site indicates a moist environment near water. Vallonia
cyclophorella and Pupilla muscorum indicate that the Nussbaum site, the
modern flood plain, and the Piney Creek site were dry habitats with
ephemeral streams. Figure 18 was constructed from a combination of snail-
environment-inferred climate (0-2 Ma) and clay-mineralogy-inferred climate
(2-4 Ma).

CONCLUSIONS
Cave of the Winds is a phreatic cave dissolved from the calcite-rich
Manitou, Williams Canyon, and Leadville Formations. Dissolution occurred
along joints associated with Laramide faulting and folding. Paleokarst
features, such as sediment-filled fissures and caves, indicate that some of
the passages at Cave of the Winds are related to cave-forming episodes that
started soon after the deposition of the Ordovician Manitou Formation and
continued to the beginning of the Cretaceous Laramide Orogeny. Most
speleogenesis, however, occurred in the last ~5.0 Ma. Iron and manganese
oxide deposits at the cave and at springs in Manitou Springs indicate that the
process of limestone dissolution that is taking place today beneath Manitou
Springs is the same process that dissolved the Cave of the Winds in the past.
Chemical and isotopic analyses of the spring, well, and surface waters
indicate that two principal types of water are mixing below Manitou Springs.
One, which is from a deep-seated source and has a high TDS and carbon
dioxide content, is ascending along the Ute Pass Fault. The other, which has
a low-TDS and carbon dioxide content, is from near-surface sources. Both of
these waters are either saturated with respect to calcite or have the capacity
to dissolve small amounts of calcite. When mixed, however, mass balance
calculations show that these waters are dissolving ~71 tonnes of limestone
per year. Mass balance calculations also show that iron and manganese
oxides are precipitating in the mixing zone. Iron and manganese oxide
bearing sediments preserved in Cave of the Winds show that a mixing zone
similar to the one beneath Manitou Springs existed at the cave.

The Nussbaum Alluvium was assigned an age of ~1.9 Ma by means of
aminostratigraphy. The age of the Nussbaum Alluvium and its relation to
coarse-grained sediments at Cave of the Winds were used to fix an age of
~1.7 Ma for the onset of coarse grained sedimentation in the cave. This
enabled the identification of the Olduvai Polarity Subchron in the coarse
grained sediments. Correlation of the magnetostratigraphy of cave
sediments with the accepted polarity time scale indicates that the mixing zone
existed at the cave ~4.2 Ma. The sequence of sediments at the cave and
associated model developed from spring and nearby cave sediments indicate
that Fountain Creek was flowing over Cave of the Winds until ~2.0 Ma.
Subsequently, the creek simultaneously downcut and continually shifted
south to its present position in Manitou Springs.
Studies of the clay mineralogy and magnetic susceptibility of
sediments at Cave of the Winds indicate that with more work, the information
gleaned from the cave sediments could be useful for determining the
paleoclimate of the Manitou Springs area. During the aminostratigraphy
study, a large assemblage of mollusks were collected and identified.
Because many of these mollusks thrive in specific environments, the paleo-
environment surrounding each of the alluvial terraces could be determined
with some degree of certainty.

REFERENCES
Adams, C. S., and Swinnerton, A. C., 1937, Solubility of limestone;Transactions, American Geophysical Union, 1937, part 2, p. 504-507
Batard, F., Baubron, J. C., Bosch, B., Marce, A. and Risler, J. J., 1982,Isotopic identification of gases of a deep origin in Frenchthermomineral waters: Journal of Hydrology, v. 56, p. 1-21.
Berger, A., and Loutre, M. F., 1991, Insolation values for the climate of thelast 10 million years: Quaternary Science Reviews, v. 10, n. 4, p. 297-317
Bianchi, L., 1967, Geology of the Manitou-Cascade Area, El Paso County,Colorado with a study of the permeability of Its crystalline rocks [M.S.Thesis]: Golden, Colorado School of Mines.
Birkeland, P. W., 1984, Soils and geomorphology: New York, OxfordUniversity Press, 372 p.
Blair, R. W., 1975, Weathering and geomorphology of the Pikes Peak Granitein the southern Rampart Range, El Paso County, Colorado [Ph.D.thesis]: Golden, Colorado School of Mines, 115 p.
Blanton, T. L., 1973, The Cavern Gulch Faults and the Fountain CreekFlexure, Manitou Spur, Colorado [M.S. thesis]: Syracuse University,New York, 90 p.
Blavoux, B., Dazy, L. and Sarrot-Reynauld, J., 1982, Information about theorigin of thermomineral waters and gas by means of environmentalisotopes in eastern Azerbaijan, Iran, and southeast France: Journal ofHydrology, v. 56, p. 23-38.
Bloemendal, J., Liu, X. M., and Rolph, T. C., 1995, Correlation of themagnetic susceptibility stratigraphy of Chinese loess and the marineoxygen isotope record; Chronological and palaeoclimatic implications:Earth and Planetary Science Letters, v. 131, p. 371-380.
Bögli, A., 1964, Mischungskorrosion, - ein Beitrag zum Verkarstungsproblem:Erdkunde 18, 83-92.
Bögli, A., 1980, Karst hydrology and physical speleology: New York, Springer-Verlag, 284 p.
Bretz, J. H., 1942, Vadose and phreatic features of limestone Caverns:Journal Geology, v. 50, no. 6, part 2, p. 675-811.
Cande, S. C., and Kent, D. V., 1992, A new geomagnetic polarity time scalefor the Late Cretaceous and Cenozoic: Journal of GeophysicalResearch, b, v. 97, n. 10, p. 13,917.

Crook, J. K., 1899, The mineral waters of the United States and theirtherapeutic Uses: New York and Philadelphia, Lea Brothers and Co.,p. 185-187.
Daniels, B. M. and McConnell, V., 1964, The Springs of Manitou: Denver,Sage Books.
Davis, D. G., 1985, Cave of the Winds history; New light from forgottensources: Rocky Mountain Caving, v. 2, no. 1, p. 23-26.
Davis, W. M., 1930, Origin of limestone caverns: Geological Society ofAmerica Bulletin, v. 41, p. 475-628.
Denison, C., 1880, Rocky Mountain health resorts: Boston, Houghton,Osgood and Company, p. 29, 31, 33, 39-40.
Dethier, D. P., and Harrington, C. D., 1987, Geologic dating of Late Cenozoicerosion surfaces near Espanola, New Mexico: Friends of thePleistocene-Rocky Mountain Cell, 1987 Field Trip Guidebook, p. 111-131.
Dinkmeyer, P. R., 1977, Stratigraphy of Upper Cambrian and LowerOrdovician rocks in the Manitou Park-Manitou Springs-DeadmanCanyon Area, Douglas and El Paso Counties, Colorado [M. S. thesis):Golden, Colorado School of Mines, 218 p.
Drever, J. I., 1988, The geochemistry of natural waters: Englewood Cliffs,New Jersey, Prentice Hall, p. 342-343.
Eberl, D. D., 1984, Clay mineral formation and transformation in rocks andsoils: Philosophical Transactions Royal Society London, series A, v.311, p. 241-257.
Epis, R. C., and Chapin, C. E., 1975, Geomorphic and tectonic implications ofthe Post-Laramide, Late Eocene Erosion surface in the SouthernRocky Mountains, in Curtis, B.F., ed., Cenozoic History of theSouthern Rocky Mountains: Geological Society of America Memoir144, p. 45-74.
Evanoff, E., 1983, Pleistocene nonmarine mollusks and sediment facies ofthe Meeker Area, Rio Blanco County, Colorado; University of Coloradomaster thesis.
Evanoff, E., 1987, Fossil nonmarine snails from the Horner Site in TheHorner Site: The Type Site of the Cody Cultural Complex: AcademicPress, Inc. p.443-450.
Evans, W. C., Presser, T. S., and Barnes, I., 1986, Selected soda springs ofColorado and their origins: U.S.G.S. Water-Supply Paper 2310, p.45-52.

Finlay, G. I., 1906, Colorado springs, A guide book describing the rockformations in the vicinity of Colorado Springs: Colorado Springs, TheOut West Company, p. 28-32.
Fish, L., 1988, The real story of how Cave of the Winds Formed: RockyMountain Caving, v. 5, no. 2, p. 16-19.
Forster, J. R., 1977, Middle Ordovician subaerial exposure and deepweathering of the Lower Ordovician Manitou Formation along the UtePass Fault zone: Geological Society of America Abstracts withPrograms, v. 9, p. 722.
Frank, R. M., 1965, Petrologic study of sediments from selected CentralTexas caves, [M.A. thesis]: University of Texas, 117 p.
Fremont, J. C., 1845, Report of the exploring expedition to the RockyMountains in the year 1842, and to Oregon and North California in theyears 1843-1844: Washington, Gales and Seaton, p. 115-118.
George, R. D. and others, 1920, Mineral waters of Colorado: ColoradoGeological Survey Bulletin, v. 11, p 105-106, 219-222, 353-367.
Goodfriend, G. A., 1987, Evaluation of amino-acid racemization/epimerizationdating using radiocarbon-dated fossil land snails: Geology, v. 15, p.698-700.
Hailwood, E. A., 1989, The role of magnetostratigraphy in the development ofgeological time scales; Paleoceanography, v. 4, no. 1, p. 1-18.
Hamil, M. M., 1965, Breccias of the Manitou Springs area, Colorado [M.S.thesis]: Louisiana State University, 43 p.
Harland, W. B., and others, 1982, A geologic time scale: Cambridge, GreatBritain, Cambridge University Press, p. 66.
Hawley, C. C., and Wobus, R. A., 1977, General geology and petrology of thePrecambrian crystalline rocks, Park and Jefferson Counties, Colorado:Geological Survey Professional Paper 608-B, 77 p.
Hayden, F. V., 1869, Preliminary field report of the United States GeologicalSurvey of Colorado and New Mexico: Washington, GovernmentPrinting Office, p. 45-46, 118-120.
Hayden, F. V., 1872, Preliminary report of the United States GeologicalSurvey of Montana and portions of adjacent territories: Washington,Government Printing Office, p. 159-161.
Hayden, F. V., 1873, Sixth Annual Report of the United State GeologicalSurvey of the Territories: Washington, Government Printing Office, p.102-103.
Hayden, F. V., 1874, Seventh Annual Report of the United States Geologicaland Geographical Survey of the Territories: Washington, GovernmentPrinting Office, p. 205-206.

Hem, J. D., 1992, Study and interpretation of the chemical characteristics ofnatural water: United States Geological Survey Water-Supply Paper,No. 2254.
Henley, R. W., Truesdell, A. H., Barton, P. B, and Whitney, J. A., 1984, Fluid-mineral equilibria in hydrothermal systems; Reviews In EconomicGeology, Society Of Economic Geologists, v. 1, p. 33.
Hose, L. D., and Esch, C. J., 1992, Paleo-cavity fills formed by upwardinjection of clastic sediments to lithostatic load: exposures in Cave ofthe Winds, Colorado [abs.]: National Speleological Society ConventionProgram, Salem, Indiana, p.50
Hovey, H. C., 1881, Pickett's Cave; Scientific American, April 23, 1881, p.257.
Hovey, H. C., 1887, Caverns near Manitou, Colorado: Scientific AmericanSupplement, no. 608, p. 9710-9711.
Hurlbut, C. S., and Klein, C., 1977, Manual of mineralogy (after James D.Dana) 19th edition, John Wiley & Sons, New York,
Izett, G. A., Obradovich, J. D., and Mehnert, H.H., 1989, The Bishop Ash Bed(Middle Pleistocene) and some older (Pliocene and Pleistocene)chemically and mineralogically similar ash beds in California, Nevada,and Utah: U. S. Geological Survey Bulletin, 1675, 37 p.
Jackson, M. L., 1973, Soil chemical analysis-advanced course: Published bythe Author, Soil Science Department University of Wisconsin,Madison.
James, E., 1823, Account of an Expedition from Pittsburgh to the RockyMountains, in Thwaites, R. G., ed., 1905, Early Western Travels 1748-1846: Cleveland, Ohio, The Arthur H. Clark Company, v. 16, p. 11-13.
Kawashima, M., Takamatsu, T., and Koyama, M, 1988, Mechanisms ofprecipitation of manganese(II) in Lake Biwa, a fresh water lake: WaterResources, v. 22, no. 5, pp. 613-618.
Krauskopf, K. B., 1967, Introduction to geochemistry: McGraw-Hill, New York,p. 266-268.
Leet, L. D., Judson, S., and Kauffman, M. E., 1982, Physical geology,Prentice-Hall, Inc., Englewood Cliffs, N.J. p. 52.
Luna, R. L., 1971, Forgotten Springs of Manitou: Colorado Springs, JuelArneson Printing Co., 25 p.
Machette, M. M., 1975, The Quaternary geology of the Lafayette Quadrangle,Colorado, [M. S. thesis]: Boulder, University of Colorado, 83 p.
Mankinen, E. A., and Dalrymple, G. B., 1979, Revised geomagnetic polaritytime scale for the interval 0-5 m. y. B. P.; Journal of GeophysicalResearch, v. 84, no. B2, p. 615-626.

Maslyn, M., and Blomquist, P. K., 1985, Hydrogeology of the mineral springsat Manitou Springs, Colorado [abs.]: Geological Society of America 98th Annual Convention, GSA Abstracts with program, v. 17, # 7, p. 654.
Milske, J. A., 1982, Stratigraphy and petrology of clastic sediments in MysteryCave, Fillmore County, Minnesota [M. S. thesis]: University ofMinnesota, 111 p.
Miller, G. H., and Brigham-Grette, J., 1989, Amino acid geochronology:Resolution and precision in carbonate fossils in INQUA Quat. DatingMethods, Rutter and Brigham-Grette Eds. Pergamon Press.
Mitterer, R. M., and Kriausakul, N., 1989, Calculation of amino acidracemization ages based on apparent parabolic kinetics: QuaternaryScience Reviews, v. 8, 353-357.
Modreski, P. J., 1987, Mineralogy of Cave of the Winds, Manitou Springs,Colorado: Geological Society of America Abstracts with Programs, v.19, no. 5, p. 322.
Moore, D. M., and Reynolds, R. C., 1989, X-ray diffraction and theidentification and analysis of clay minerals: New York, OxfordUniversity Press, 332 p.
Morgan, G. B., 1950, Geology of Williams Canyon area, north of ManitouSprings, El Paso County, Colorado (Masters thesis): Golden, ColoradoSchool of Mines, 80 p.
Mutschler, F. E., Larson, E. E., and Bruce, R. M., 1987, Laramide andyounger magmatism in Colorado—New petrologic and tectonicvariations on old themes: Colorado School of Mines Quarterly, v. 82,no. 4, p. 1-47.
Netoff, D. I., 1977, Soil clay mineralogy of Quaternary deposits in two FrontRange-Piedmont transects, Colorado [Ph. D. thesis]: Boulder,University of Colorado, 169 p.
Osterkamp, W. R. and others, 1987, Great Plains, in Graf, W.L., ed.,Geomorphic systems of North America: Boulder, Colorado, GeologicalSociety of America, Centennial Special Volume 2.
Parkhurst, D. L., 1995, User’s guide to Phreeqc—A computer program forspeciation, reaction-path, advective-transport, and inversegeochemical Calculations: U. S. Geological Survey, Water-ResourcesInvestigations Report 95-4227.
Peale, A. C., 1886, Lists and analyses of the mineral springs of the UnitedStates: U. S. Geological Survey Bulletin no. 32, p. 188, 189, 192.
Peck, S. B., 1986, Bacterial deposition of iron and manganese oxides inNorth American caves: National Speleological Society Bulletin, v.48,no. 1, p.26-30.
Peck, J. A., King, J. W., Colman, S. M., and Kravchinsky, V. A., 1994, A rock-magnetic record from Lake Baikal, Siberia: Evidence for LateQuaternary climate change: Earth and Planetary Science Letters, v.122, p. 221-238.
Perrodon, A., 1983, Dynamics of oil and gas accumulations: Bulletin desCentres de Recherches Exploration-Production Elf-Aquitaine, Men. 5,p. 57
Rabenhorst, M. C., and Wilding, L. P., 1984, Rapid method to obtaincarbonate free residues from limestone and petrocalcic materials: SoilScience Society of America Journal, v. 48, p. 216-219.
Randolph, J. A., 1875, Scenes in Colorado-Manitou Springs and Vicinity:Harper's Weekly, October 2, 1875, p. 797-798.
Reams, M. W., 1968, Cave Sediments and the geomorphic history of theOzarks, [Ph. D. thesis]: Saint Louis, Missouri, Washington University,167 p.
Rhinehart, R., 1996, Manitou Cave in The caves and karst of Colorado,guidebook for the 1996 convention of the National SpeleologicalSociety, Edited by Rob Kolstad, 214 p.
Sawyer, D. A. and others, 1995, New chemical criteria for QuaternaryYellowstone tephra layers in central and western North America:Geological Society of America Abstracts with Programs, v. 27, n. 6, p.109.
Schlundt, H., 1914, The radioactivity of some Colorado springs: The Journalof Physical Chemistry, v. 18, no. 7, p. 662-666.
Scott, G. R., 1963, Nussbaum Alluvium of Pleistocene(?) age at Pueblo,Colorado. U. S. Geological Survey Professional Paper, 475-C, p. C49-C52
Scott, G. R., 1975, Cenozoic surfaces and deposits in Curtis, B. F., ed.,Cenozoic History of the Southern Rocky Mountains: GeologicalSociety of America Memoir 144, p. 227-248.
Shackleton, N. J., Berger, A., and W. R. Peltier, 1990, An alternativeastronomical calibration of the lower Pleistocene time scale based onODP Site 677: Transactions of the Royal Society of Edinburgh: EarthSciences, v.81, p.251-261.
Shedd, J. C., 1912, Radioactivity of the Mineral Springs of Manitou, Colorado:The Proceedings of the Colorado Scientific Society, v. 10, p. 233-263.
Singer, A., 1978, Clay minerals in sediments as paleoclimatic indicators[abs.]: Abstracts of lectures presented at the Tenth InternationalCongress On Sedimentology, Jerusalem, v. 2, p. 614.
Snider, G. W., 1916, How I found the Cave of the Winds: Denver, Colorado,Carson-Harper.

Soister, P. E., 1967, Relation of Nussbaum Alluvium (Pleistocene) to theOgallala Formation (Pliocene) and to the Platte-Arkansas divide,Southern Denver Basin, Colorado. U. S. Geological SurveyProfessional Paper 575-D, p.D39-D46.
Solly, S. E., 1875, Manitou, Colorado, U. S. A., Its mineral water and climate:Saint Louis, Jno. McKittrick and Co.
Strieby, W., 1893, The origin and use of the natural gas at Manitou,Colorado: Colorado College Studies, v. 4, p. 14-36.
Szabo, B. J., 1980, Results and assessment of uranium-series dating ofvertebrate fossils from Quaternary alluviums in Colorado: Arctic andAlpine Research, v. 12, p. 95-100.
Tarling, D. H., 1983, Palaeomagnetism; principles and applications ingeology, geophysics and archaeology: Chapman and Hall Ltd.,London, 379 p.
Trimble, D. E., and Machette, M. M., 1979, Geologic map of the ColoradoSprings-Castle Rock Area, Front Range Urban Corridor, Colorado; U.S. Geological Survey, 1:100,000, Map I-857-F
Tweto, O., 1975, Laramide (Late Cretaceous-Early Tertiary) Orogeny in theSouthern Rocky Mountains in Curtis, B.F., ed., Cenozoic History of theSouthern Rocky Mountains: Geological Society of America Memoir144, p. 1-44.
Verosub, K. L., 1977, Depositional and post-depositional processes in themagnetization of sediments: Reviews of Geophysics and SpacePhysics, v. 15, p. 129-143.
Warwick, G. T., 1953, Cave formations and deposits, in Cullingford, C. H. D.,ed., British Caving; an introduction to speleology: London, Routledge &Kegan Paul Limited, p. 77.
Wheeler, G. M., 1875, Report upon Geographical and GeologicalExplorations and Surveys West of the One Hundredth Meridian, v. 3,Geology: Washington, Government Printing Office, p. 486-487, 618-619.
White, W. B, 1988, Geomorphology and hydrology of karst terrains: NewYork, Oxford University Press, New, 464 p.

APPENDIX
Location And Description Of Springs And Other Sampling Sites
Below is a detailed description of the springs and their exact locations
(See Figure 2 for general locations). When the initial samples were collected
the Seven Minute Spring was actually two springs: the eastern spring was
next to the road and the other one was ~15 meters to the west. The western
spring issued from alluvium into the bottom of a broken cement basin (~80
cm diameter by ~30 cm high). The eastern spring issued from the bottom of
a small, natural basin (~20 cm diameter by 10 cm deep) on top of a poorly
developed travertine mound. Both of the springs were sampled near their
centers where CO2 was bubbling up, ensuring that the water was not
contaminated by air. Since the first sampling, the springs were plugged and
a new deeper well was drilled. Partial chemical analysis of the new spring
(well) indicates that it is very similar to the old springs.
The Shoshone Spring issues inside of a small circular building. It then
drains to the north through an underground plastic pipe into a small basin
located on a retaining wall of the parking lot of the General Motors Test
Garage parking lot. The Shoshone Spring was sampled at the basin in the
parking lot.
The Navajo Spring is located under a small shop on Manitou Avenue
and is no longer visible. The spring is piped to a small fountain from which
the spring now flows. During the winter the fountain is shut off and the water
is diverted into Fountain Creek. The spring drains from a plastic pipe onto a
large travertine mound that is located under a bridge. The spring was
sampled from the pipe under the bridge.

The Cheyenne Spring is inside of a building similar to the Shoshone.
Water and CO2 issues from the bottom of a circular cement pool. In the
center of the pool is a 1.5-m diameter by 2-m high inverted copper cone,
which was used to collect CO2 for bottling. The water then drains to the north
through an underground plastic pipe into Fountain Creek. The spring was
sampled from the pool inside of the building.
The Manitou Spa building covers the Manitou Soda Spring, which is
piped to a fountain inside of the building. Water and CO2 issue from a plastic
pipe on top of a travertine-covered fountain. The spring was sampled from
the plastic pipe.
The Wheeler Spring, a drilled spring, is just south of the post office. It
issues from piping that is a combination of brass and iron into a ceramic wall-
mounted basin that faces Park Avenue. The spring is not a large spring and
has been known to run dry in the fall and winter. The spring was sampled
directly from the pipe.
The Stratton Spring, a drilled spring, is located in a building about 30
m southeast of the fountain from which it issues. The fountain is on the
corner of Ruxton Avenue and Manitou Avenue. The water flows from a pipe
(stainless steel or chrome-plated brass?) into a basin, which has a noticeable
iron stain. The flow is spasmodic alternating between water and large
emissions of CO2. During the winter the flow is diverted into a nearby storm
sewer. The spring was sampled from the pipe.
The Big Indian Spring is 100 m southwest of the cog railway bridge.
The spring consists of a group of springs. The main flow issues from a steel
standpipe (~25 cm diameter by ~80 cm high) in Ruxton Creek with lesser
flows from a large seep next to the pipe and from several nearby small seeps.
The water was taken from the large seep to prevent possible iron

contamination from the steel pipe. The standpipe is lined with and the seeps
coated with thick iron-oxide deposits.
Ruxton Creek was sampled 5 m upstream from the Big Indian Spring
to exclude possible contamination from seeps associated with the spring.
The Ouray Spring is across the creek from the steam engine that is on
display in the lower, cog railway parking lot. The spring is under a sealed
cement cistern on the east bank of Ruxton Creek. The water flows from a
very corroded iron pipe into the creek. Several hundred kilograms of gravel,
rocks and debris had to be removed so that the spring could be sampled.
The spring was sampled from the pipe. This spring also has associated thick
iron-oxide deposits.
The Iron Geyser, a drilled spring, issues from a plastic pipe into a
cement and stone fountain, which is under a small pavilion next to Ruxton
Avenue. The wetted portions of this fountain are covered with thick iron-
oxide deposits. The water sample was collected from a plastic overflow pipe,
which is located in the basin about one meter from the spring outlet.
The Twin Springs are two drilled wells that are piped together into one.
The spring issues from a galvanized iron pipe into a basin on the front of a
building on Ruxton Avenue. The spring was sampled from the galvanized
pipe.
The Ute Chief Gusher, a drilled spring, is located on the west side of
Manitou Avenue and piped to the east side of the street. The Gusher drains
from a 10-cm diameter plastic pipe into Fountain Creek. This spring was
sampled from the plastic pipe.
The Ute Chief Spring is on the east side of the street and issues from
a copper pipe, which is hidden inside of a jug that is a part of a large Indian

statue. The copper pipe is free of any scale or mineral build up and appears
to be dissolving. This spring was sampled from the copper pipe.
The Ute Chief Magnetic Spring is located in a small room under the
bottling plant. The spring issues into the bottom of a stainless steel basin
that is about 1 m in diameter. A cement basin surrounds the steel basin.
This spring emits about 1 m3 of CO2 every 90 minutes in a very impressive
geyser-like eruption. The spring was sampled from the stainless steel basin.
The Creighton Spring is located between two wings of the Shady Del
Motel. The spring issues from a cast iron pipe into a cement basin. The
spring water is actively corroding iron, steel, and cement.
Fountain Creek was sampled 50 m upstream from the Ute Chief
Spring. The creek was turbid and was high because of recent snow and
rainfall.
The Williams Canyon upstream sample was collected 30 meters north
of the hairpin turn. It had snowed the night before and there was a little snow
on the ground. A small leaf-free pool was used for sampling because most of
the stream was full of dead leaves.The Blue Ice Spring is located about 150 m downstream from the
hairpin turn. The water issues from a small sediment filled grotto located in
red sandstone (Sawatch Formation) on the west wall of the canyon. The
water drips over a series of small sandstone ledges and disappears into
sediment next to the road. The drips were used for sampling. This spring is
called the Blue Ice Spring, because in the winter the water from the spring
freezes into a large, light blue mass of ice.
The Williams Canyon downstream sample was taken 10 m south of
the Narrows. The sample was taken from a small leaf-free pool 2 m

downstream from a galvanized steel culvert. There was a light rain the night
before and conditions were very similar to the week before when the upper
stream was sampled. Similar to the upstream sample, the stream at this
location also had a large amount of dead leaves in the water.
The entrance to Hucacove Cave is 100 meters above and east of the
Narrows. The water was collected from three different pools along a stream
at the north end of a large room called God's Country, which is several
hundred meters north of the entrance. The water was combined into one
sample because of the low volume of the pools. The remote location
precluded Eh, DOX, and DCO2 tests.
The Cave of the Winds water supply are two springs covered by small
buildings located on the west side of Cavern Gulch. The upper spring
consists of many smaller springs, which run into a trench, then into a plastic
collection pipe. The trench was used for sampling. The springs issue from
granite. The waterways of this spring contained gelatinous iron oxide
coatings up to 1 cm thick.
Two other springs were looked at: the Little Chief and Hiawatha. The
Little Chief is supposed to be between Ruxton Creek and the train garage of
the cog railway (Luna, 1971). In this area there are actually two springs. One
issues from soil and was choked with dead leaves, iron-oxide scum and
algae. The other issues from an iron pipe that drains into the creek. The soil
spring was not sampled because of its thoroughly disgusting condition and
low flow. The iron pipe also was not sampled because its conductivity was

only a bit higher than the creek water. The low conductivity combined with
the layout of the cog railway yard suggested that the iron pipe drained
surface runoff from the railway yard.
The Hiawatha Spring, which is located in two-meter-deep pit just south
of the bottling plant, was only tested from conductivity. The conductivity was
only a little greater than Fountain Creek, which is about 5 m west of the pit.
The spring appears to be nothing more than ground water with a little mineral
water mixed in. This spring was not sampled because of possible ground
water dilution and because the spring was stagnant and very polluted with
algae, trash, and other unidentifiable objects. Soon after inspecting the
Hiawatha Spring a wooden platform was placed over the pit that contains the
spring.
The Pikes Peak water sample was collected from a tunnel that was
being bored into granite west of the Air Force Academy. This sample was
collected 2.6 km inside a tunnel being bored for the J. A. McCullough Water
Treatment Center, which is 13 km north of Manitou Springs. The tunnel,
which trends due west, is in the Pikes Peak Granite and at the point where
the sample was taken is overlain by ~500 m of the same granite. The sample
was taken from water that was squirting from a fracture in the rock. This
sample was used as an example of relatively young, near-surface
groundwater that had only been in contact with Pikes Peak Granite.


.

% error (+/-)Fluoride (F) 8Chloride (Cl) 5Bromide (Br) 10Nitrate (NO3) 8Sulfate (SO4) 4Phosphate (PO4) 20Boron (B) 10Iron (Fe total) 5Manganese (Mn) 5Lithium (Li) 9Sodium (Na) 6Potassium (K) 6Magnesium (Mg) 6Calcium (Ca) 10SiO2 5
Table 1. Analytical uncertainty of selected ions
in water samples

7200
6800
6400OmMl
Om
OmMl
A
A'
Section A-A'
PgPf
Pf
pCgpCg
pCg pCm
Cs
Cs
Om
Ml
OmMl Pg
PfPgPf
PfpCg
pCg
Cs6800
B'
6400
B
Section B-B'
?
Pg
By Fred Luiszer, 1996 (Adapted from Luiz Bianchi, 1967)
0.5 mi0.250.0
0.0 0.5 1.0 km
Scale
Contour interval = 200 feet
7200
U
U
D
D
D
U
6400
DowntownSprings Eastern
Springs
D
U
DU
Om
Ml
Ml
Om
Ml
D U
Ml
Om
Om
Om
Ml
Om
Cs
Om
Ml
Ml
Om
Cave of the Winds
WesternSprings N
U
D
Faults-
Anticline-
Syncline-
Pg
Pf
pCg Cs
pCg
pCg
pCg
pCg
Pf
Pf
Pf
Pf
pCg
pCg
pCg
pCg
Cs
Cs
Cs
Cs
Cs
Pg
Pg
Pg
Pf
pCm
Pf
Cs
Pf
Fountain Formation
Pg
Glen Eyrie Member ofFountain Formation
Ml
Leadville Formationand Williams Canyon
Om
Manitou Formation
Cs
Sawatch Formation
pCg
Pikes Peak Granite
pCm
Biotite migmatite
Manitou
Springs
Plate 1. Geology map of immediate vicinity of Cave of the Winds and Manitou Springs.
58-meter-thick marine dolomitic-limestone with abundant beddingplanes and joints. Cavernousporosity. An aquifer with very highpermeability.
17 meter thick marine sandstone. Apoor aquifer.
This quartz-plagioclase-biotite granite is thebasement rock under most of the ManitouSpring area, except in Williams Canyon wherea migmatite outcrops. Generally has poorpermeability, however it can be verypermeable along fractures and faults.
Up to 305 meters of conglomerate andsandstone with thin shale beds. This isan aquiclude.
40-meter-thick marine shale whichcontains pyrite and gypsum. This is anaquiclude.
42-meter-thick marine limestone withmassive bedding and poor jointing. Apoor aquifer.
7-meter-thick marine limestone withthin bedding. Limited cavernousporosity. An aquifer.
TwinSpring
N38°52'
W 104°55'
Cave of theWinds Spring
Areal extent ofmixing zone
Faults
Anticline
Syncline
Plunge
Plunge
Ascending LowTDS input

Qlo
Qes
Qp
Qb
Kpl
Qv
Qs
Tn
Qrf
KPr
Pf
Ypp
MCr
Xgnb
PINEY CREEK ALLUVIUM(UPPER HOLOCENE)
EOLIAN SAND(HOLOCENE)
BROADWAY ALLUVIUM (LATEPLEISTOCENE)
LOUVIERS ALLUVIUM(LATE PLEISTOCENE)
SLOCUM ALLUVIUM(LATE PLEISTOCENE)
VERDOS ALLUVIUM(LATE PLEISTOCENE)
ROCKY FLATS ALLUVIUM(EARLY PLEISTOCENE)
NUSSBAUM ALLUVIUM(LATE PLIOCENE)
LARAMIE, FOX HILLS, and PIERREFORMATIONS (CRETACEOUS)
CRETACEOUS, JURASSIC, TRIASSIC,and PERMIAN ROCKS
FOUNTAIN FORMATION(PENNSYLVANIAN)
MISSISSIPPIAN, ORDOVICIAN,AND CAMBRIAN ROCKS
PIKES PEAK GRANITE(PRECAMBIAN)
BIOTITE GNEISS(PRECAMBIAN)
Collection sites for clay study
Collection sites for amino acidracemization study
4 3
3 2
2 1
1
0
0 4 MILES
KILOMETERS
Qlo
Qlo
Qlo
Qlo
Qlo
Qlo
Qes
Kpl
Kpl
Qp
Qrf
Qrf
QvYpp
Xgnb
Xgnb
Ypp
Qv
Qv
Qv
Qs
Qv
Qs
Kpl
Qv
Qv
Qp
Qv
Kpl
Qs
Qv
Kpl QpKpl
Qv
Qv
QbQes
Qb
Qp
Qb
Qb
Qp
Qes
Kpl
Kpl
Tn
MCr
Tn
Ypp
Qrf
Qp
Ypp
Pf
I25 Garden of the Gods Road
I25
U D
Manitou Springs
Ypp
KPr
KPr
KPr
STARLIGHT ACRES
FILLMORE
CENTENNIAL
CHESNUT
COLORADOCITY
(snails and silt)
ROCKY FLATS SOIL
NUSSBAUM SOIL
CAVE OF THEWINDS SOIL
HUCCACOVE CAVE
N
PLATE 3. GEOLOGY MAP OF COLORADO SPRINGS AND MANITOU SPRINGS AREAwith locations of snail and clay study collection sites.Geology adapted from Trimble and Machette, (1979).
U D
U D U D
U D U
D
(limestone samples)
BLACK CANYON
MCr
MCr
MCr
Pf
Pf
Pf
Pf
Pf
Pf
N38°50'
N38°54'
W 104°55' W 104°53' W 104°51' W 104°49'
MODERN FLOOD PLAIN

Pikes Peak
Rampart Range
Southwest Northwest
Bend in cross section
Ute Pass Fault
Fountain Creek atManitou Springs
Ascending CO2
Cave of the Winds
Pikes Peak Granite
Sawatch Formation
Leadville, WilliamsCanyon, and ManitouFormations
Fountain Formation
Deep-seated water(high TDS, low DOX)
Near surface water(low TDS and DCO2, high DOX)
Figure 3. Schematic cross section showing conceptual model of the Manitou Springs system.
Mixing Zone

Cations
80
60
40
20
<-- Ca --- --- Cl -->
20
40
60
80
Anions
US
US
US
BIS BIS
BIS
DS
DS
DS
COW
COW
Iron SpringsDowntown Springs
Western Springs
Williams Canyon Creek
Iron SpringsDowntown andWestern Springs
Williams Canyon Creek
Eastern Springs
Iron Springs
Downtown Springs
Western Springs
Williams Canyon Creek
ShoshoneCheyenneSodaNavajo WheelerStratton
Downtown Springs
Ute MagneticTwinUte ChiefGusherCreighton
Western Springs
7-minute East7-minute West
Eastern Springs
US (Upstream)BIS (Blue Ice Spring)DS (Downstream)
Williams Canyon Creek
Iron GeyserOurayChief
Iron Springs
COW (Cave of the Winds Spring)Miscellaneous
LEGEND
Figure 4. Piper diagram ofselected springs and streams. COW
Eastern Springs
Eastern Springs

Table 2. Isotopic Data87Sr/86Sr ∂13C PDB ∂18O PDB
UTE MAGNETIC* 0.7196 -5.05 -9.12CHEYENNE* 0.7210 -4.64 -10.537 MIN. EAST (WEST*) 0.7211 -4.39 -8.96IRON GEYSER* 0.7229 -4.03 -8.94
MANITOU LIMESTONE 0.7099 -2.29 -6.06
PIKES PEAK H2O 0.7132
PIKES PEAK GRANITEWHOLE ROCK 0.8769PLAGIOCLASE 0.7189K-FELDSPAR 0.8767BIOTITE 11.3660Pikes Peak Granite data from Dan Unruh, U.S.G.S.* = ∂13C and ∂18O of CO2 gas

Table 3. Water Data *Downtown Springs Eastern Springs Iron Springs Western Springs Creeks Williams Canyon Creek Huccacove Pikes Cave of
Shoshone Cheyenne Soda Navajo Wheeler Stratton Twin 7 min. East
7 min. West
Iron Geyser
Ouray Chief Magnetic Ute Chief Gusher Creighton Fountain Ruxton Up Stream
Blue Ice Spring
Down Stream
Cave Peak Granite
the Winds Spring
Bicarbonate (HCO3) 2681 2562 2495 2508 2439 2236 1581 Bicarbonate (HCO3) 2538 2373 1726 1601 1345 Bicarbonate (HCO3) 2237 1362 1281 1004 104 60 Bicarbonate (HCO3) 233 269 232 188 198 225
Fluoride (F) 7.7 7.0 6.8 6.6 6.3 5.5 3.9 Fluoride (F) 4.8 4.8 6.6 6.2 6.5 Fluoride (F) 5.0 4.0 4.0 3.9 2.1 4.0 Fluoride (F) 1.5 2.0 1.5 1.0 4.6 3.6
Chloride (Cl) 242 229 220 211 208 171 80 Chloride (Cl) 547 310 195 184 167 Chloride (Cl) 155 88 87 69 16 3.1 Chloride (Cl) 5.9 103 8.9 8.6 2.6 31
Bromide (Br) 1.03 0.92 1.10 0.88 0.88 0.78 0.36 Bromide (Br) 2.10 1.30 0.96 0.80 0.85 Bromide (Br) 0.70 0.38 0.39 0.27 0.06 0.02 Bromide (Br) 0.03 0.61 0.05 0.14 0.05 0.18
Nitrate (NO3) 0.08 0.90 0.53 0.62 0.86 0.98 1.00 Nitrate (NO3) 1.14 2.90 0.14 0.10 0.13 Nitrate (NO3) 2.40 2.69 6.17 1.45 3.60 1.25 Nitrate (NO3) 0.14 315.0 15.80 26.20 0.05 0.41
Sulfate (SO4) 212 197 196 187 185 158 73 Sulfate (SO4) 366 231 227 219 202 Sulfate (SO4) 132 77 84 106 11 8.6 Sulfate (SO4) 42 413 56 126 21 52
Nitrite (NO2) N.D. N.D. N.D. N.D. N.D. N.D. N.D. Nitrite (NO2) N.D. N.D. N.D. N.D. N.D. Nitrite (NO2) N.D. N.D. N.D. N.D. N.D. N.D. Nitrite (NO2) N.D. N.D. N.D. 0.01 N.D. N.D.
Phosphate (PO4) N.D. N.D. N.D. N.D. N.D. N.D. N.D. Phosphate (PO4) N.D. N.D. N.D. N.D. N.D. Phosphate (PO4) N.D. N.D. N.D. N.D. N.D. N.D. Phosphate (PO4) N.D. N.D. 0.04 0.31 N.D. N.D.
Boron (B) 1.0 0.8 0.9 0.9 1.4 0.7 2.0 Boron (B) 2.1 1.9 1.0 1.1 1.1 Boron (B) 0.8 1.0 1.0 N.M. 0.4 0.3 Boron (B) 0.1 1.6 0.2 0.6 N.M. N.D.
Iron (Fe total) 0.04 0.05 0.23 0.02 0.10 1.07 0.08 Iron (Fe total) 0.08 0.05 11.40 23.20 7.20 Iron (Fe total) 0.08 0.04 0.05 0.02 0.10 0.04 Iron (Fe total) 0.02 0.02 0.01 0.03 0.27 0.09
Manganese (Mn) 3.80 2.50 2.40 2.80 2.70 0.44 0.22 Manganese (Mn) 1.60 1.10 1.20 1.30 0.54 Manganese (Mn) 0.32 0.12 0.13 0.08 0.03 0.01 Manganese (Mn) 0.02 0.06 0.03 0.03 0.04 0.07
Lithium (Li) 0.76 0.88 0.66 0.71 0.65 0.56 0.23 Lithium (Li) 0.77 0.81 0.98 1.11 0.85 Lithium (Li) 0.42 0.24 0.24 0.16 0.01 0.02 Lithium (Li) 0.01 0.05 0.02 0.01 0.04 0.06
Sodium (Na) 491 529 459 475 451 345 147 Sodium (Na) 531 503 618 549 558 Sodium (Na) 295 146 136 118 18 10 Sodium (Na) 9.0 106 14 5.5 34 39
Potassium (K) 75 79 68 71 65 50 20 Potassium (K) 42 53 94 80 82 Potassium (K) 38 22 19 15 1.6 1.9 Potassium (K) 0.5 15 2.0 3.3 1.3 1.1
Magnesium (Mg) 81 94 85 90 86 73 92 Magnesium (Mg) 135 136 35 43 20 Magnesium (Mg) 89 54 52 47 6.6 3.4 Magnesium (Mg) 17 114 24 43 3.4 9.1
Calcium (Ca) 501 527 474 519 467 385 319 Calcium (Ca) 559 516 355 250 196 Calcium (Ca) 535 349 296 187 41 18 Calcium (Ca) 68 174 67 47 25 48
Lead (Pb) 0.015 <.001 <.01 N.M. N.M. N.M. N.M. Lead (Pb) 0.006 0.006 0.006 0.015 0.005 Lead (Pb) N.M. <.01 <.001 <.001 N.M. N.M. Lead (Pb) N.M. N.M. N.M. N.M. 0.006 N.M.
Arsenic (As) 0.006 0.021 0.005 N.M. N.M. N.M. N.M. Arsenic (As) 0.022 0.022 0.122 0.114 0.019 Arsenic (As) N.M. <.001 0.023 N.M. N.M. N.M. Arsenic (As) N.M. N.M. N.M. N.M. N.M. N.M.
TDS 4297 4230 4010 4073 3914 3428 2320 TDS 4729 4135 3272 2961 2587 TDS 3490 2107 1967 1550 205 111 TDS 377 1511 422 451 290 410
Cond. (mS/cm) 4.38 4.00 4.29 4.16 4.12 3.50 2.49 Cond. (mS/cm) 5.42 4.40 3.61 3.35 3.01 Cond. (mS/cm) 3.58 2.25 2.08 1.68 0.28 0.16 Cond. (mS/cm) 0.46 1.92 0.54 0.60 0.31 0.61
Temp. °C 14.0 14.2 15.3 15.3 15.1 11.5 10.8 Temp. °C 11.6 11.1 7.8 9.2 9.8 Temp. °C 11.7 11.2 12.4 11.1 7.0 4.8 Temp. °C 5.4 2.1 5.6 10.3 13.2 11.4
pH 6.50 6.18 6.32 6.30 6.35 6.20 6.19 pH 6.44 6.53 6.27 5.97 6.20 pH 6.29 6.12 6.13 5.97 8.54 7.10 pH 8.05 8.59 8.25 8.43 7.33 7.64
Eh (volts) 0.543 0.515 0.481 0.503 0.513 0.443 0.566 Eh (volts) 0.520 0.532 0.317 0.294 0.337 Eh (volts) 0.542 0.553 0.559 0.571 0.506 0.583 Eh (volts) 0.496 0.491 0.495 N.M. N.M. 0.501
DOX 0.50 0.20 N.D. 0.30 0.20 0.10 0.10 DOX 3.40 3.30 0.30 0.20 0.40 DOX 0.10 0.35 1.20 2.00 9.50 8.25 DOX 7.5 10.0 9.0 N.M. 2.3 0.1
DCO2-gr/l 2.20 2.38 2.43 N.M. 2.13 3.93 2.50 DCO2-gr/l 2.68 1.77 2.82 3.02 2.67 DCO2-gr/l N.M. 2.83 2.56 1.30 N.M. N.M. DCO2-gr/l N.M. N.M. N.M. N.M. N.M. N.M.
SiO2 51 47 48 47 44 37 18 SiO2 18 24 82 78 78 SiO2 22 20 21 18 13 18 SiO2 21 18 19 11 31 28
Total alk. 2198 2100 2045 2056 1999 1833 1296 Total alk. 2080 1945 1415 1313 1103 Total alk. 1834 1117 1050 823 85 49 Total alk. 191 220 191 155 162 185
Sample Date 4/15/87 4/2/87 4/2/87 4/15/87 4/15/87 4/22/87 4/15/87 Sample Date 4/2/87 4/2/87 4/6/87 4/6/87 4/6/87 Sample Date 4/27/87 4/22/87 4/22/87 9/17/87 4/22/87 4/6/87 Sample Date 4/27/87 4/27/87 5/3/87 4/26/87 9/17/87 4/26/87
Flow l/min 1.5 1.4 2.0 8.6 2.4 2.0 6.7 Flow l/min 0.3 0.5 0.3 3.0 0.5 Flow l/min 1.0 6.7 40 270 30000 100 Flow l/min 40 0.2 40 0.2 >500 15
Type Spring Spring Spring Spring Well Well Well Type Well Well Well Spring Well Type Well Spring Well Well Creek Creek Type Creek Spring Creek Stream Spring Spring
Milliequivalents per liter error (%) 0.4 5.7 1.0 4.3 1.8 4.0 0.9 Milliequivalents per liter error (%) 1.3 6.7 12.9 8.4 9.9 Milliequivalents per liter error (%) 4.1 3.8 0.1 5.5 14.8 6.2 Milliequivalents per liter error (%) 2.3 4.4 3.6 1.6 0.4 9.3
* Concentrations in mg/L except where noted. N.D. = Not Detectable (<0.01 mg/L) N.M. = Not Measured ------------------------------------------Iron-Geyser * Concentrations in mg/L except where noted. N.D. = Not Detectable (<0.01 mg/L) N.M. = Not Measured
Saturation Index (SI)** undersaturated<0 equilibrium=0 saturated>0 Saturation Index (SI)** undersaturated<0 equilibrium=0 saturated>0 Saturation Index (SI)** undersaturated<0 equilibrium=0 saturated>0 Saturation Index (SI)** undersaturated<0 equilibrium=0 saturated>0Albite(low) NaAlSi3O8 -1.53 -2.72 -2.13 -2.18 -2.04 -2.98 -3.91 Albite(low) NaAlSi3O8 -2.51 -1.82 -1.84 -3.03 -2.18 Albite(low) NaAlSi3O8 -3.2 -4.11 -4.01 -4.95 -0.18 -2.08 Albite(low) NaAlSi3O8 -0.33 0.95 -0.08 -0.97 0.07 0.51
Annite (biotite) KFe3AlSi3O10(OH) -5.16 -7.98 -4.40 -7.76 -5.24 -4.38 -8.76 Annite (biotite) KFe3AlSi3O10(OH) -6.26 -5.54 -0.26 -2.11 -1.27 Annite (biotite) KFe3AlSi3O10(OH) -7.5 -10.17 -9.56 -12.8 0.01 -2.52 Annite (biotite) KFe3AlSi3O10(OH) -0.56 -1.47 -1.52 -0.92 3.43 2.83
Anorthite CaAl2Si2O8 -10.01 -12.26 -10.95 -11.03 -10.62 -12.38 -12.38 Anorthite CaAl2Si2O8 -10.44 -9.58 -12.41 -14.60 -12.95 Anorthite CaAl2Si2O8 -11.64 -12.84 -12.64 -14.43 -3.65 -8.08 Anorthite CaAl2Si2O8 -4.16 -4.30 -3.86 -3.55 -4.83 -3.82
Calcite CaCO3 0.54 0.10 0.27 0.50 0.29 -0.05 0.02 Calcite CaCO3 0.60 0.64 0.08 -0.36 -0.28 Calcite CaCO3 0.43 -0.39 -0.12 -0.99 0.47 -1.53 Calcite CaCO3 0.49 -0.81 0.63 0.64 -0.89 0.00
CO2(g) CO2 -0.41 -0.24 -0.31 -0.05 -0.34 -0.32 -0.17 CO2(g) CO2 -0.23 -0.35 -0.25 0.04 -0.25 CO2(g) CO2 -0.12 -0.49 -0.17 -0.56 -3.71 -2.5 CO2(g) CO2 -2.88 -4.84 -3.12 -3.33 -2.46 -2.42
Dolomite CaMg(CO3)2 0.43 -0.40 -0.05 0.40 0.01 -0.73 -0.42 Dolomite CaMg(CO3)2 0.69 0.79 -0.81 -1.43 -1.49 Dolomite CaMg(CO3)2 0.19 -1.48 -0.88 -2.47 0.19 -3.81 Dolomite CaMg(CO3)2 0.37 -1.90 0.82 1.32 -2.51 -0.62
Fluorite CaF2 1.38 1.30 1.23 1.22 1.17 1.08 0.74 Fluorite CaF2 0.98 0.98 1.25 1.05 1.01 Fluorite CaF2 1.08 0.83 0.75 0.62 -0.27 0.03 Fluorite CaF2 -0.38 -4.70 -0.41 -1.02 0.12 0.15
Ferrihydrite Fe(OH)3 -1.21 -2.08 -0.95 -2.08 -1.23 -0.72 -1.86 Ferrihydrite Fe(OH)3 -1.18 -1.11 0.4 -0.14 0.07 Ferrihydrite Fe(OH)3 -1.58 -2.36 -2.18 -3.07 2.26 -14.11 Ferrihydrite Fe(OH)3 1.76 1.49 1.42 1.80 2.16 2.20
Goethite FeOOH 2.77 1.92 3.08 1.96 2.80 3.17 2.00 Goethite FeOOH 2.71 2.76 4.14 3.66 3.90 Goethite FeOOH 2.31 1.52 1.74 0.8 5.97 4.19 Goethite FeOOH 5.40 5.00 5.07 5.65 6.11 6.08
Magnetite Fe3O4 8.69 6.45 9.79 6.44 8.92 10.21 6.72 Magnetite Fe3O4 8.60 8.65 13.09 11.92 12.40 Magnetite Fe3O4 7.55 5.34 5.98 3.33 16.32 12.43 Magnetite Fe3O4 15.11 13.38 13.91 15.41 17.90 17.50
Microcline KAlSi3O8 -0.46 -1.66 -1.10 -1.14 -1.02 -1.90 -2.85 Microcline KAlSi3O8 -1.69 -0.88 -0.69 -1.92 -1.07 Microcline KAlSi3O8 -2.18 -3.01 -2.96 -3.93 0.85 -0.78 Microcline KAlSi3O8 0.42 2.16 1.08 0.75 0.55 0.88
Quartz SiO2 0.92 0.88 0.87 0.86 0.83 0.82 0.51 Quartz SiO2 0.50 0.64 1.23 1.18 1.17 Quartz SiO2 0.59 0.55 0.55 0.51 0.42 0.61 Quartz SiO2 0.67 0.66 0.62 0.30 0.70 0.69
Manganite MnOOH -5.65 -6.80 -6.47 -6.49 -6.31 -7.26 -7.52 Manganite MnOOH -6.08 -5.92 -6.39 -7.33 -7.05 Manganite MnOOH -7.19 -7.99 -8.01 -8.56 -0.83 -5.43 Manganite MnOOH -2.40 -0.20 -1.65 -1.45 -4.77 -3.51
** Saturation index calculated by means of PHREEQC (Parkhurst, 1995)

Figure 5. Plot of sodium versus chloride content of the springs ofManitou and low TDS waters. The polygon drawn on the plot containsalmost all of the springs and streams in the Manitou Springs area. Thissuggests that the Western and Downtown Springs are a mixture ofdownstream Williams Canyon Creek and waters that have chemistrysimilar to the Iron Geyser, 7-minute East Spring, and Cave of the WindsSprings.
0
100
200
300
400
500
600
0 200 400 600 800
7-minute East Spring
Iron Geyser
DowntownSprings
WesternSprings
Cave ofthe
WindsSpring
EasternSprings
Iron Springs
Downstream Williams Canyon Creek
7-minute West Spring

Table 4. Composition of the predominate rock types that react with the spring water at Manitou Springs.
Pike Peak Granite*
Pike Peak Granite biotite*
Manitou Formation #1 (Base)
Manitou Formation
#2
Manitou Formation
#3
Manitou Formation
#4
Manitou Formation #5 (Top)
Williams Canyon
Formation
Leadville Formation
(Base)SiO2 73.00** 34.70 5.09 13.59 19.20 7.10 1.87 8.74 11.49Al2O3 13.37 18.34 0.63 2.01 0.95 0.42 0.20 0.82 1.98Fe2O3 0.55 3.27 0.29*** 0.56 1.16 0.56 0.09 0.39 1.67FeO 1.71 25.68 NM NM NM NM NM NM NMMgO 0.09 0.97 4.13 5.21 17.54 7.36 0.53 0.72 19.74CaO 1.05 0.46 48.63 39.62 24.58 44.06 54.86 51.55 24.89Na2O 3.41 0.68 0.13 0.04 0.09 0.01 0.20 0.15 0.06K2O 5.58 9.26 0.89 0.86 1.58 0.55 0.26 0.38 0.58TiO2 0.22 2.15 0.01 0.04 0.07 0.02 0.01 0.04 0.06P2O5 0.02 0.03 0.29 0.38 0.21 0.29 0.36 0.27 0.20MnO 0.05 0.55 0.02 0.06 0.09 0.10 0.02 0.02 0.05F 0.46 2.75 NM NM NM NM NM NM NMCO2 **** NL NL 42.67 36.77 38.44 42.62 43.63 41.24 41.09Cl (ppm) 400 1700 147 198 454 339 130 45 332S (ppm) NL NL 211 42 29 51 128 1016 588Li (ppm) 48 2200 NM NM NM NM NM NM NMPb (ppm) 49 30 NM NM NM NM NM NM NMSr (ppm) 108 10 211 98 65 82 123 92 81Total 99.53 99.06 102.76 99.12 103.91 103.09 102.02 104.32 101.81*Averge composition of the Pikes Peak Granite wholerock and biotite from Hawley and Wobus (1977).**Values in Wt% except were noted. *** Total iron in the limestones is reported as Fe2O3.
NM = Not Measured NL = Not Listed **** Calculated by assuming that all the MgO and CaO are in dolomite and calcite.

600 Creighton 225Gusher 252
Table of Ion Concentrations of Springs, Modeled Inputs, and Downstream Input (units=mg/L) 123DISCHARGE INPUT 182.88
MEASURED (Taken from Table 3) MODELED 1700000 49Shoshone Cheyenne Soda Navajo Wheeler Stratton Magnetic Twin Ute Chief Gusher Creighton Downstream 1000 1200
0.00011 Creighton 15 69Potassium (K) 75 79 68 71 65 50 38 20 22 19 15 2 94 42 1 Gusher 19.2 77Sodium (Na) 491 529 459 475 451 345 295 147 146 136 118 14 618 531 39 1.28E+08 172 Cheyenne 79 172Sulfate (SO4) 212 197 196 187 185 158 132 73 77 84 106 56 227 400 52Chloride (Cl) 242 229 220 211 208 171 155 80 88 87 69 9 195 547 31 Leadville 42Fluoride (F) 7.7 7.0 6.8 6.6 6.3 5.5 5.0 3.9 4.0 4.0 3.9 1.5 6.6 4.8 3.6 Williams Canyon 7Calcium (Ca) 501 527 474 519 467 385 535 319 349 296 187 67 355 559 47.9 Manitou 58Magnesium (Mg) 81 94 85 90 86 73 89 92 54 52 47 24 34.5 134.8 3.447Iron (Fe total) 0.04 0.05 0.23 0.02 0.10 1.07 0.08 0.08 0.04 0.05 0.02 0.01 11.4 0.1 0.092 107Manganese (Mn) 3.80 2.50 2.40 2.80 2.70 0.44 0.32 0.22 0.12 0.13 0.08 0.03 1.2 1.6 0.072Nitrate (NO3) 0.08 0.90 0.53 0.62 0.86 0.98 2.40 1.00 2.69 6.17 1.45 15.80 0.1 1.1 0.41Bromide (Br) 1.03 0.92 1.10 0.88 0.88 0.78 0.70 0.36 0.38 0.39 0.27 0.05 1.0 2.1 0.18Lithium (Li) 0.76 0.88 0.66 0.71 0.65 0.56 0.42 0.23 0.24 0.24 0.16 0.02 0.98 0.77 0.06Flow Rate (L/min) 1.5 1.4 2.0 8.6 2.4 2.0 1.0 6.7 6.7 40 270 40 52 11 239 342.2 302.2 196
Table of Ion Flow Rates of Springs, Modeled Inputs, and Downstream Input (Concentrations multiplied by Flow Rate, units=mg/min) 1825711DISCHARGE INPUT
MEASURED MODELEDShoshone Cheyenne Soda Navajo Wheeler Stratton Magnetic Twin Ute Chief Gusher Creighton Downstream
Potassium (K) 113 110 136 607 157 99 38 134 149 768 3958 81 4910 481 258 6269 6188 5730 9Sodium (Na) 736 741 919 4085 1083 691 295 979 970 5452 31801 552 32229 6083 9186 47751 47199 48050 1Sulfate (SO4) 318 276 392 1608 444 316 132 486 515 3372 28593 2240 11844 4584 12430 36452 34212 31098 16Chloride (Cl) 363 321 440 1815 499 342 155 533 587 3460 18592 356 10174 6268 7396 27106 26750 24194 11Fluoride (F) 12 10 14 57 15 11 5 26 27 158 1058 60 342 55 859 1392 1331 1317 6Calcium (Ca) 751 738 949 4460 1121 770 535 2126 2322 11832 50382 2684 18507 6404 11428 75985 39023 64 37.0 92.4 134.4 71 1.29E+08 100Magnesium (Mg) 122 132 170 770 205 146 89 613 362 2064 12571 956 1800 1545 822 17243 5123 108 12.1 42.0Iron (Fe total) 0.06 0.07 0.47 0.18 0.23 2.14 0.08 0.50 0.26 1.84 6.21 0.52 595 0.9 22 12 618 192 -0.606 1.0 0.528 134Manganese (Mn) 5.7 3.5 4.8 24.1 6.5 0.9 0.3 1.5 0.8 5 22 1.2 63 18 17 75 99 28 -0.025 0.1 0.032 2188 0.061Nitrate (NO3) 0.1 1.3 1.1 5.3 2.1 2.0 2.4 6.7 17.9 247 392 632 7 13 98 677 750 10 *(Mn oxide convertion estimated from Mn content of Mn-oxide deposit from Thieves Canyon in Cave of the Winds.)Bromide (Br) 1.5 1.3 2.2 7.6 2.1 1.6 0.7 2.4 2.5 16 72 2 50 24 43 110 119 8Lithium (Li) 1.1 1.2 1.3 6.1 1.6 1.1 0.4 1.5 1.6 10 43 0.8 51 9 14 69 75 9
8.58.9
**Key for computing unknown inputsSet # Set 1 Set 2 Set 3 Set 4 Set 5 Set 6
Deep (X) Marine Mod.(Y) Low TDS (Z) Deep Marine Mod. Low TDS Deep Marine Mod. Low TDS Deep Marine Mod. Low TDS Deep Marine Mod. Low TDS Deep Marine Mod. Low TDS Deep Marine Mod. Low TDS# 1 ion used. Chloride (Cl) 195 547 31 Chloride (Cl) 195 547 31 Chloride (Cl) 195 547 31 Chloride (Cl) 195 547 31 Chloride (Cl) 195 547 31 Sulfate (SO4) 227 400 52# 2 ion used. Sulfate (SO4) 227 400 52 Sulfate (SO4) 227 400 52 Sulfate (SO4) 227 400 52 Sodium (Na) 618 531 39 Sodium (Na) 618 531 39 Sodium (Na) 618 531 39# 3 ion used. Sodium (Na) 618 531 39 Potassium (K) 94 42 1 Fluoride (F) 7 5 4 Fluoride (F) 7 5 4 Potassium (K) 94 42 1 Potassium (K) 94 42 1
# 1 ion used. 26750 547 31 26750 547 31 26750 547 31 26750 547 31 26750 547 31 34212 400 52# 2 ion used. 34212 400 52 34212 400 52 34212 400 52 47199 531 39 47199 531 39 47199 531 39# 3 ion used. 47199 531 39 6188 42 1 1331 5 4 1331 5 4 6188 42 1 6188 42 1# 1 ion used. 195 26750 31 195 26750 31 195 26750 31 195 26750 31 195 26750 31 227 34212 52# 2 ion used. 227 34212 52 227 34212 52 227 34212 52 618 47199 39 618 47199 39 618 47199 39# 3 ion used. 618 47199 39 94 6188 1 7 1331 4 7 1331 4 94 6188 1 94 6188 1# 1 ion used. 195 547 26750 195 547 26750 195 547 26750 195 547 26750 195 547 26750 227 400 34212# 2 ion used. 227 400 34212 227 400 34212 227 400 34212 618 531 47199 618 531 47199 618 531 47199# 3 ion used. 618 531 47199 94 42 6188 7 5 1331 7 5 1331 94 42 6188 94 42 6188
Calculated Calculated Calculated Calculated Calculated Calculated CalculatedInput (L/min) Ratio Input (L/min) Ratio Input (L/min) Ratio Input (L/min) Ratio Input (L/min) Ratio Input (L/min) Ratio Input (L/min) Ratio
Deep Deep 42 0.098 Deep 58 0.145 Deep 119 0.437 Deep 44 0.136 Deep 51 5.151 Deep 94 0.102Marine Mod. Marine Mod. 13 0.029 Marine Mod. 9 0.024 Marine Mod. -2 -0.009 Marine Mod. 18 0.055 Marine Mod. 35 3.532 Marine Mod. -87 -0.094Low TDS Low TDS 377 0.873 Low TDS 332 0.832 Low TDS 156 0.571 Low TDS 265 0.809 Low TDS -76 -7.683 Low TDS 914 0.992Total Total 432 Total 399 Total 273 Total 327 Total 10 Total 921
Set 7 Set 8 Set 9 Set 10Deep Marine Mod. Low TDS Deep Marine Mod. Low TDS Deep Marine Mod. Low TDS Deep Marine Mod. Low TDS
Sulfate (SO4) 227 400 52 Sodium (Na) 618 531 39 Chloride (Cl) 195 547 31 Sodium (Na) 618 531 39Fluoride (F) 7 5 4 Fluoride (F) 7 5 4 Fluoride (F) 7 5 4 Fluoride (F) 7 5 4Potassium (K) 94 42 1 Potassium (K) 94 42 1 Potassium (K) 94 42 1 Sulfate (SO4) 227 400 52
Deep Source 58.7 0.173 52.2Marine Modified 12.9 0.038 11.5 34212 400 52 47199 531 39 26750 547 31 47199 531 39Low TDS Source 268.3 0.789 238.6 1331 5 4 1331 5 4 1331 5 4 1331 5 4
Total calculated input = 339.9 6188 42 1 6188 42 1 6188 42 1 34212 400 52302.2 227 34212 52 618 47199 39 195 26750 31 618 47199 39
7 1331 4 7 1331 4 7 1331 4 7 1331 4* Set 5 and 6 excluded from calculation because of their extreme and unrealistic total calculated input values. 94 6188 1 94 6188 1 94 6188 1 227 34212 52
227 400 34212 618 531 47199 195 547 26750 618 531 471997 5 1331 7 5 1331 7 5 1331 7 5 133194 42 6188 94 42 6188 94 42 6188 227 400 34212
Calculated Calculated Calculated CalculatedInput (L/min) Ratio Input (L/min) Ratio Input (L/min) Ratio Input (L/min) Ratio
Deep 52 0.164 Deep 66 0.206 Deep 56 0.177 Deep 32 0.095Marine Mod. 24 0.076 Marine Mod. -6 -0.020 Marine Mod. 15 0.046 Marine Mod. 33 0.098Low TDS 242 0.760 Low TDS 259 0.813 Low TDS 247 0.777 Low TDS 269 0.807Total 319 Total 318 Total 319 Total 333
Depth vs Potassium Concentration.
y = 1.6033x + 45.533
R2 = 0.9999(Equation used to calculate depth of springs in
Manitou Springs area.) 0
20
40
60
80
100
120
140
160
180
200
0 20 40 60 80 100
Potassium Concentration of Spring (mg/L)
Dep
th o
f Spr
ing
(m)
Determinant of system (sys. det.), contains modeled concentrations (mg/L) of ions used in set.
Determinant for Deep source (Deep det.), same as determinant of system except Deep column (X) is replaced by adjusted ion discharges of ions used in set.
Determinant for Marine Modified source (Marine det.), same as determinant of system except Marine Modified column (Y) is replaced by adjusted ion discharge of ions used in setDeterminant for Low TDS source (LowTDS det.), same as determinant of system except Low TDS column (Z) is replaced by adjusted ion discharge of ions used in set.
Deep det./sys. det.
Marine det./sys. det.
LowTDS det./sys. det.
Deep input/total
Marine input/total
LowTDS input/total
Deep+Marine+LowTDS
Adjusted Ion Discharge (Total measured discharge minus Downstream input, these values are used to compute unknown inputs.)
Difference (Total Measured Discharge minus Total Ion Input, units=g/min)
Difference (Converted to mineral equivalent, units=g/min)
Limestone Dissolved (calcite+magnesite equivalent, g/min)
Tonnes of Limestone dissolved during presence of effective mixing zone. (Length of Time multiplied by Limestone Dissolved)
Limestone Dissolved (tonnes/yr)
Estimated Percent of available limestone dissolved (Limestone dissolved divided by available limestone then multiplied by 100.)
Average Calculated Input *(units=L/min)
Ratio (Each input divided by total input)
Normalized Calculated Input (Ratio multiplied by Adjusted Discharge, units=L/min)
Total Discharge(Sum of the discharges of the Downtown and Western Springs, units=L/min)
Adjusted Discharge(Total discharge minus Downstream discharge, This value used to calculate input (see below), units=L/min)
Adjusted Discharge (see above)
Used for mass balance calculation.
Marine Modified
(7-minute East)
Low TDS (Cave of the
Winds Spring)
Deep Source (Iron
Geyser)
Approximate Height of Youngest Sediments at Cave of the Winds that were deposited at the watertable-air interface above present watertable. (Plate 1, units=feet) Converted to meters
Approximate Age of Youngest Sediments at Cave of the Winds that were deposited at the watertable-air interface, units=years (From Figure 14).
Downcutting Rate (Height of youngest sediments at Cave of the Winds that were deposited at the watertable-air interface divided by their age, units=m/yr)
Thickness of soluable formations beneath Manitou Springs area (Plate 1, units=m)
Total Thickness of Soluable Formations (Sum of formation thicknesses = block height, units=m)
Width of Mixing Zone (estimated from cross section B-B', Plate 1, units=m)
Length of Mixing Zone (Estimated as distance from Western Springs to furthest eastern downtown spring, Figure 2, unit=m)
Mixing Zone Volume (Total amount of limestone available for dissolution in the mixing zone = length of mixing zone multiplied by width multiplied by thickness,
units=m3)
(See Note) Depth of the Creighton Spring (Shady Del Well) and Gusher Spring (Ute Chief Gusher Well) from Colorado Division of Water Resources, 1979, Well completion and pump installation report, Permit Number 24415-RF, units=feet
Marine Modified (7-minute East)
Low TDS (Cave of the Winds Spring)
Deep Source (Iron Geyser)
Total Measured Ion Discharge (Sum of Downtown and Western Springs)
Total Ion Input (Sum of measured and calculated)
Relative Percent Difference (RPD) between ion input and ion discharge.
Converted to metersApproximate Depth of top of Leadville at Cheyenne Spring (From Plate 1, units=m)
Thickness of Leadville and Williams Canyon (Plate 1, units=m)
Depth of Top of Manitou Formation at Cheyenne Spring (Depth of top of Leadville plus thickness of Leadville and Williams Canyon equals estimated depth of Cheyenne, units=m).
Spring Depth
PotassiumContent of Springunits=mg/l
Converted to calcite equivalent
Converted to hematite Converted to magnesite
Converted to manganese oxide Mn-oxide precipitated, ton/yr
Hematite precipitated, ton/yr Limestone to iron-oxide ratio.Limestone to manganese-oxide
Mn-oxide to Fe-oxide to Ratio. (Mn-oxide precipitation/iron-
oxide precipitation)
Note: The top of the Manitou Formation was choosen for the the approximate depth of wells and springs in the Manitou Springs area because the well log of the Gusher Spring (Ute Chief Gusher Well, P.N. 24425-RF) indicated that at least 50 meters of limestone was penetrated before hitting the production zone (two cavities between 245 and 252 feet).
Calculated Thickness of Mixing Zone (Assuming that the potassium content of the Iron Springs (94 mg/L) represents the deepest part of the mixing zone, the depth (mixing zone thickness) is then calculated from the derived equation. The mixing zone is assumed to extent to the water table. units=m)
Length of Time that the mixing zone effects any single point in the limestone formations below Manitou Springs (example: dissolution of a cave passage). This value is calculated by dividing the thickness of the mixing zone by the downcutting rate. The rate at which the mixing zone moves downward is assumed to be equal to the downcutting rate. Units=years.
**Equations used to construct matrices:Potassium 94.1*X+42.0*Y+1.1*Z=6188Sodium 617.7*X+530.9*Y+38.5*Z=47199 Sulfate 227.0*X+400.0*Y+52.1*Z=34212Chloride 195.0*X+547.0*Y+31.0*Z=26750Fluoride 6.6*X+4.8*Y+3.6*Z=1331Where, X = Deep seated flow rate, Y = Marine modified flow rate, Z = Low TDS flow rate, and the equation format is (Concentration of ion in row heading of deep seated source)*X+(Concentration of ion in row heading of marine modified source)*Y+(Concentration of ion in row heading of low TDS source)*Z=(Adjusted ion discharge of ion in row heading), [Flow rate units = L/min, concentration units = mg/L, ion discharge units = mg/min].
Average RPD between ion input and ion discharge (K, Na, SO4, Cl, and F)
Plate 5. Mass Balance Spreadsheet.
A
B
C
D
E
F
GAverage RPD between ion input and ion discharge (NO3, Br, and Li)
H
IJ
K

Table 5A. Analyses of sediments being deposited by modern springs.As
ppmPb
ppmMn
Wt%Fe
Wt% Sediment TypeOuray Spring 4200 181 0.12 58.02 Fe-oxideChief Spring 3200 225 N.M. N.M. Fe-oxideIron Geyser 3400 170 N.M. N.M. Fe-oxide
Table 5B. Analyses of stratigraphic column at south end of Thieves Canyon.Depth (cm)
As ppm
Pb ppm
Mn Wt%
Fe Wt%
Ni ppm
Zn ppm
Sr ppm
Sb ppm
Ba ppm
Sediment Type
0.00 734 456 0.94 6.97 57 378 223 53 2100 Clay + Silt2.38 694 497 0.93 7.29 44 348 214 54 2000 Clay + Silt4.38 240 133 1.06 7.82 67 385 228 49 1900 Clay + Silt6.75 611 397 5.31 6.34 93 628 494 45 5900 Clay + Silt8.75 544 338 0.44 3.82 40 367 180 14 1700 Clay + Silt
10.50 593 430 1.26 5.51 62 376 328 40 3100 Clay + Silt12.50 614 433 2.59 6.07 84 460 636 44 5600 Clay + Silt14.25 520 411 5.54 5.16 124 628 1600 52 11200 Clay + Silt16.50 781 70 34.92 1.32 375 1300 6500 31 57000 Hollandite19.00 39 22 39.01 0.80 294 1500 2300 32 63500 Hollandite21.50 806 37 38.33 1.09 450 1400 5400 29 57200 Hollandite24.00 825 237 0.05 6.72 47 290 136 58 252 Clay + Silt26.50 2200 748 0.13 22.59 108 504 137 131 133 Goe*+Hem27.00 5800 3600 0.87 42.87 278 679 79 353 1400 Goe+Hem27.50 7400 3300 0.96 48.87 194 834 73 454 1100 Goe+Hem29.38 5200 2700 0.72 63.45 146 722 58 618 465 Goe+Hem31.50 7400 3900 1.14 72.87 247 806 87 547 558 Goe+Hem32.50 1500 497 0.09 7.62 78 392 159 102 171 Goe+Hem35.00 21 835 0.18 11.53 65 486 131 176 365 Res.**+Silt36.50 8900 4500 1.56 56.88 248 1657 127 543 1700 Goe+Hem39.00 8800 6200 1.50 73.23 197 1472 120 499 777 Goe+Hem41.00 627 177 0.06 2.33 30 187 64 17 411 Res.**44.50 438 83 0.06 2.22 39 185 76 7 360 Res.46.50 596 163 0.05 2.40 37 180 64 13 346 Res.
BedrockN.M.=Not Measured * Goe = Goethite Hem = Hematite ** Residual remaining after limestone dissolution.

Iron Geyser
TwinGusher
Creighton
Shoshone
StrattonWheeler
Soda
Cheyenne
7-minute East
0
100
200
300
400
500
600
0.00 0.50 1.00 1.50 2.00
Cave of the Winds
Downstream Williams Canyon Creek
2.50
Oversaturated (calciteprecipitates)
Figure 6. Dissolved calcite (plotted as equilivant mg/L Ca) vs the partialpressure of CO2 (PCO2) of selected surface and spring waters plotted withthe calcite equilibrium line (modified from Adams, 1937). The under-saturated springs are plotted in the shaded area. Open circles are the estimatedvalues of the spring waters at depth in the mixing zone. Solid diamonds are the measuredvalues. Shaded area represents the possible compositions of water in themixing zone.
Undersaturated (calcitedissolves)
PCO2
Ute Chief

-2
-1.5
-1
-0.5
0
0.5
1
1.5
2
2.5
3
5.60 5.70 5.80 5.90 6.00 6.10 6.20 6.30
Estimated PCO2 at a depth sufficient to put all CO2 in solution
Measured PCO2
Estimated PCO2 from measured pH
Figure 7. Plot of PCO2 and calculated saturation indices for calciteand ferrihydrite versus pH of the Iron Geyser water.
Minimum PCO2 (pH 6.12) to keepcalcite and ferrihydrite in solution.
pH

Combination of modeled deep seated source(Iron Geyser) and modeled marine modifiedsource (7-minute East Spring)
Figure 8. Schematic cross section of mixing zone. See Figure 9 for explanationof spring depth and placement. Grey shaded areas represents Manitou,Leadville, and Williams Canyon Formations.
SE NW~1 km
modeled low-TDSsource (Cave of theWinds Spring).
~107 m
Ute Pass Fault
OutputOutput
Input
Input
Input

Input from a combination of modeled deepseated source (Iron Geyser) and modeledmarine modified source (7-minute East)
0
10
20
30
40
50
60
70
80
90
100Figure 9. Plot of potassium content (relative depth of springs) versus relativedistance between springs along a NW-SE trend. Shaded area represents themixing zone (Manitou, Leadville, and Williams Canyon Formations).
SE NW
.08
.32
.12.13.22
.44
2.702.40
2.502.80
3.80The depth of springs (length of bars) drawn ondiagram are proportional to the potassiumcontent. Number at bottom of springs (bars) ismanganese content (mg/L).
Manganese (mg/L)0.00 2.00 4.00
~1 km
Input from the mod-eled low TDS source(Cave of the Windsspring).
Plot showing relationshipbetween manganesecontent and potassiumcontent (relative springdepth).

Limestone bedrock crops outa few centimeters below thebottom of this photograph.
Solution debris
Iron oxide(goethite and
hematite)Interlayered solutiondebris and detritalclay
Detrital clay
Manganese oxide(hollandite)
Interlayered solutiondebris, detrital clay,and manganese oxide.
Detrital clay
0.0 cm 50.0 cm25.0 cm
Figure 10. Photograph of outcrop at Electric Coolaid Acid TestAlcove, which is located at south end of Thieves Canyon (Plate 2).Dashed lines are drawn on contacts of sediment units.
Calcite nodule
Iron oxide(goethite and
hematite)
.

A B
C D
Figure 11. Photomicrographs of hematite in the iron oxide beds at south endof Thieves Canyon. All photomicrographs show rods that may be fossilizedbacteria. Photomicrograph D shows blades of hematite crystals that makeup rods.
Scale for A, B, and C 10 µm Scale for D 1 µm
.

Clay
Silt
Sand
Calcite
0
20
50
100
10
30
40
60
70
80
90
%
Fig. 12A-Calcite, clay, silt, and sandcontent of limestone.
Average clay content = 2%
Meters above base of Manitou Limestone
0
20
50
100
10
30
40
60
70
80
90
%
SmectiteAvg. =
1%
KaoliniteAvg. =20%
IlliteAvg. =79%
Meters above base of Manitou Limestone
Fig. 12B-Mineralogy of clay inlimestone.
1 2 3 4 5 6 7 80
20
50
100
10
30
40
60
70
80
90
%
Meters below cave floor Meters below cave floor
Fig. 12C-Sand, silt, and claycontent of cave sediment.
Average clay content = 71%Fig. 12D-Mineralogy of cave clay.
1 2 3 4 5 6 7 80
20
50
100
10
30
40
60
70
80
90
%
0
20
50
100
10
30
40
60
70
80
90
%
0
20
50
100
10
30
40
60
70
80
90
%
Fig. 12F-Mineralogy of soil andsediment clay.
Fig. 12E-Sand, silt, and clay contentof soils and sediment.
Average clay content = 34%
SmectiteAvg. =18%
KaoliniteAvg. =24%
IlliteAvg. =58%
SmectiteAvg. =11%
KaoliniteAvg. =33%
IlliteAvg. =56%
Clay
Silt
Sand
Clay
Silt
Sand
Figure 12. Grain size distribution and clay mineralogy.
.
0 15 30 45 60 0 15 30 45 60
NussabaumSoil Rocky Flats
Soil
Cave Of TheWinds Soil
Black CanyonAlluvium
NussabaumSoil Rocky Flats
Soil
Cave Of TheWinds Soil
Black CanyonAlluvium

TABLE 6 Species identified, their location, and amount of shells counted.Modern Centennial Manitou Chesnut Filmore Starlight Colorado City BlackFlood Cave East West CanyonPlain
Carychium exiguum (Say) 8 3 105 35 18 5 Cionella lubrica (Muller) 20 3 1 0 2 1 Columella alticola (ingersoll) 4 0 1 0 Derocerus spp. 1 0 4 1 Discus whitneyi 4 1 4 0 Euconulus fulvus (Muller) 16 2 20 2 2 1 Fossaria parva (Lea) 19 2 3 1 8 3 10 3 Gastrocopta armifera (Say) 1 0 1 0 47 7 5 1 38 6 17 7 5 2 Gastrocopta cristata Pilsbry 1 0 1 0 15 6 19 6 10 3 Gastrocopta holzingeri (Sterki) 6 2 6 1 96 39 37 12 3 1 Gastrocopta pellucida (Pfeiffer) 1 0 193 27 3 1 6 2 3 1 136 28Gastrocopta procera (Gould) 6 2 5 1 35 6 5 2 14 5 3 1 Gyraulus parvus (Say) 2 1 53 13 Hawaiia minuscula (Binney) 23 6 43 5 82 12 134 14 84 14 12 5 20 7 12 3 26 5Oreohelix spp. 28 4 Oxyloma spp. 20 2 6 2 5 2 Physa spp. 1 0 10 3 Pisidium casertanum (Poli) 13 4 200 50 Pupilla muscorum (Linne) 70 18 174 22 20 3 4 0 2 0 9 4 12 4 2 1 52 11Pupoides albilabris (C.B. Adams) 7 1 4 2 8 3 Pupoides hordaceous (Gabb) 133 28Pupoides inornata Vanatta 35 9 7 1 1 0 130 22 3 1 6 2 9 2 7 1Stagnicola spp. 10 3 Succinea spp. 4 0 45 8 3 1 Vallonia cyclophorella (Sterki) 250 63 579 72 197 28 381 39 240 41 60 24 20 7 32 8 123 25Vertigo gouldi and ovata 1 0 4 1 390 39 Zonitoides arboreus (Say) 1 0 96 13 1 0 7 3 20 7 15 4 6 1TOTAL 394 100 809 100 713 100 989 100 585 100 248 100 304 100 397 100 483 100Numbers in green are the count of idendified species. Numbers in red are the percentage of total.

Table 7A Alloisoleucine and isoleucine (A/I) ratios of snails. Sample Location
Species Lab Number
Results Average Standard Deviation
Modern P AAL-5990 0.020 0.022 0.021 0.0010Modern V AAL-5989 0.021 0.020 0.021 0.0005Centennial P AAL-5970 0.023 0.021 0.022 0.0010Centennial V AAL-5969 0.024 0.032 0.028 0.0040Manitou Cave G AAL-5993 0.042 0.056 0.051 0.050 0.0058Manitou Cave P AAL-5992 0.039 0.044 0.041 0.041 0.0021Manitou Cave V AAL-5991 0.043 0.069 0.056 0.0130Chesnut GO AAL-5972 0.106 0.124 0.115 0.0090Chesnut V AAL-5971 0.106 0.103 0.105 0.0015Colorado City G AAL-5986 0.154 0.210 0.163 0.176 0.0246Colorado City V AAL-5985 0.076 0.083 0.080 0.0035Fillmore 1 G AAL-5976 0.279 0.274 0.277 0.0025Fillmore 1 V AAL-5975 0.298 0.275 0.287 0.0115Fillmore 2 G AAL-5988 0.239 0.233 0.236 0.0030Fillmore 2 V AAL-5987 0.283 0.270 0.277 0.0065Starlight P AAL-5768 0.423 0.414 0.420 0.419 0.0037Starlight V AAL-5767 0.276 0.317 0.296 0.296 0.0167Starlight 1 G AAL-5974 0.302 0.322 0.312 0.0100Starlight 1 V AAL-5973 0.307 0.231 0.224 0.254 0.0376Starlight 2 G AAL-5978 0.292 0.298 0.295 0.0030Starlight 2 V AAL-5977 0.246 0.244 0.245 0.0010Black Canyon P AAL-5766 0.502 0.531 0.543
0.529 0.526 0.0150Black Canyon V AAL-5765 0.545 0.545 0.546
0.544 0.515 0.576 0.545 0.0176V = Vallonia cyclophorella P = Pupilla muscorum G = Gastrocopta armifera GO = Vertigo gouldii and Vertigo ovata

Table 7B. Average values and standard deviation of A/I ratios of selected snails from each site.
Average - standard deviation
AverageAverage + standard deviation
Modern Flood Plain 0.020 0.021 0.022Centennial 0.021 0.025 0.029Chesnut 0.103 0.110 0.117Filmore and Starlight 0.249 0.275 0.301Black Canyon 0.523 0.536 0.549

AGE (ka)
LOW A/I CURVE FITAge = 2002.4y2 + 782.0y - 4.2
AVERAGE A/I CURVE FITAge = 1268.6y2 + 863.8y - 10.0
ModernCentennial
Chesnut
Starlightand
Filmore
Black Canyon
230019001700
Figure 13. The A/I of snails from the Starlight and Filmore (VerdosAlluvium), Chesnut (Louviers Alluvium), Centennial (Piney Creek), andModern Flood Plain sites are used for curve fitting. The diamondsrepresent the curve fit of the average A/I. The circles and squaresrepresent the curve fits of +/- one standard deviation of the A/I. The A/I ofthe snails from the Black Canyon site with the appropriate equations areused to extrapolate the age of the Nussbaum Alluvium (1.9+0.4/-0.2 Ma).
HIGH A/I CURVE FITAge = 1064.2y2 + 782.3y - 11.2
XX
X
1.0
0.9
0.8
0.7
0.6
0.5
0.4
0.3
0.2
0.1
0.00 500 1000 1500 2000 2500

Table 8. Uranium-thorium and 14C dates.14C Age (years B.P.) Lab. Number*
Centennial site 1495 ± 130 GX-15992Manitou Cave 1505 ± 75 GX-15993*Krueger Enterprises Inc.
Uranium-thorium Age** (years B.P.)Narrows Cave 32,000 ± 2,000 **Dan Muhs, U.S.G.S., 1990, per. comm.

Table 9. Complete Paleomagnetic results of Hole 6, Grand Concert Hall
Sample Depth Natural 10 mT 15 mTNumber cm Dec. Inc. Int. Dec. Inc. Int. Dec. Inc. Int.
11 80 -9 62 1.2E-04 -21 55 5.4E-05 -13 57 4.7E-0512 93 -30 45 1.5E-04 -7 54 6.8E-05 -16 52 5.0E-0513 105 -11 52 2.0E-04 -4 52 1.2E-04 -9 60 1.1E-0414 118 -23 27 1.5E-04 -23 26 1.1E-04 -24 24 9.7E-0521 121 -14 44 1.8E-04 -21 40 1.2E-04 -20 39 9.6E-0522 131 -11 46 2.7E-04 -7 39 1.7E-04 -6 40 1.5E-0423 141 0 41 1.4E-04 -13 34 7.2E-05 -7 37 6.6E-0524 151 4 42 3.2E-04 3 38 2.1E-04 2 38 1.8E-0431 154 -11 40 3.8E-04 -15 31 2.1E-04 -14 34 1.9E-0432 163 -27 40 2.2E-04 -21 38 1.4E-04 -24 36 1.3E-0433 172 -24 41 2.6E-04 -29 36 1.8E-04 -30 35 1.6E-0434 182 -17 40 2.5E-04 -19 38 1.7E-04 -20 37 1.6E-0441 184 -18 38 4.4E-04 -17 40 3.1E-04 -18 39 2.9E-0442 194 -15 41 1.8E-04 -24 42 1.1E-04 -20 36 9.6E-0543 204 -17 58 1.4E-04 -45 62 4.7E-05 -50 64 3.4E-0544 213 164 -32 1.1E-04 162 -27 9.9E-05 162 -29 9.1E-0551 216 115 11 7.0E-05 149 -9 6.1E-05 155 -11 5.7E-0552 226 155 -29 9.5E-05 165 -36 1.0E-04 168 -35 9.2E-0553 236 -14 52 7.4E-05 144 75 1.4E-05 149 59 1.1E-0554 246 30 50 1.3E-04 54 30 5.5E-05 62 30 5.0E-0561 249 81 47 6.7E-05 114 13 4.6E-05 119 3 3.7E-0562 257 -2 51 1.2E-04 34 41 2.3E-05 35 16 1.0E-0563 264 176 58 2.7E-05 164 -7 2.3E-05 170 -16 2.3E-0564 271 177 -17 5.0E-05 184 3 6.4E-05 183 3 6.2E-0571 273 -12 88 6.7E-04 169 -9 4.7E-05 172 -8 4.5E-0572 281 202 14 3.9E-05 142 12 7.4E-05 144 8 7.0E-0581 283 127 -11 1.2E-04 131 -19 9.6E-05 131 -18 8.6E-0582 294 150 -17 6.4E-05 156 -21 6.2E-05 158 -24 5.2E-0583 305 93 16 5.4E-05 130 -16 5.2E-05 128 -17 4.5E-0584 316 59 30 2.2E-05 140 -34 2.2E-05 142 -38 2.0E-0591 319 28 62 7.2E-05 82 47 2.2E-05 100 29 1.7E-0592 329 85 67 4.5E-05 148 5 3.8E-05 154 -2 3.5E-0593 339 -2 53 5.5E-05 41 61 1.4E-05 41 56 1.3E-0594 349 17 75 6.3E-05 140 34 2.5E-05 162 26 2.2E-05101 352 101 -26 5.4E-05 159 15 4.5E-05 153 3 4.1E-05102 362 81 76 5.2E-05 131 33 2.0E-05 150 17 1.5E-05103 372 67 79 7.7E-05 139 0 2.6E-05 137 -6 3.2E-05104 382 178 11 4.7E-05 179 -16 4.7E-05 186 -21 4.7E-05111 385 170 24 5.5E-05 165 -3 4.9E-05 165 -2 4.5E-05112 396 159 -12 3.7E-05 156 -30 3.5E-05 157 -29 3.3E-05113 407 184 -10 3.9E-05 174 -32 4.8E-05 172 -32 4.5E-05114 418 186 9 3.4E-05 145 -47 5.2E-05 148 -50 4.5E-05121 420 -37 -30 2.4E-05 -70 -57 1.2E-05 -49 -54 1.0E-05122 431 228 52 2.5E-05 214 25 1.4E-05 208 18 1.1E-05123 439 -44 55 3.1E-05 249 16 1.1E-05 266 16 1.1E-05124 451 126 3 2.1E-05 145 -32 2.2E-05 142 -36 1.9E-05131 453 211 7 1.6E-05 136 -38 9.8E-06 164 -55 9.8E-06132 463 172 37 1.5E-05 144 -43 2.4E-05 147 -40 1.9E-05133 472 69 -21 9.3E-06 149 -46 1.6E-05 152 -50 1.6E-05134 481 263 19 5.4E-06 167 -32 1.3E-05 176 -28 1.2E-05141 484 115 8 1.9E-05 183 -35 1.4E-05 174 -40 1.1E-05142 493 189 -6 7.2E-05 188 -19 5.8E-05 192 -22 5.1E-05143 502 176 62 2.1E-05 157 23 9.6E-06 163 20 8.2E-06144 512 68 35 1.3E-05 186 -36 6.3E-06 175 -36 6.6E-06151 514 -19 40 3.4E-05 -39 15 8.3E-06 -15 15 5.9E-06152 525 41 70 4.7E-05 139 66 1.8E-05 146 60 1.6E-05153 535 -6 46 8.1E-05 -4 33 3.3E-05 -7 36 2.6E-05154 545 189 33 1.2E-04 185 21 1.1E-04 182 21 1.0E-04161 547 173 57 2.8E-05 186 2 2.4E-05 187 0 2.4E-05162 558 208 7 2.6E-05 200 -28 3.8E-05 201 -28 3.2E-05163 568 10 68 1.7E-05 206 -25 9.1E-06 211 -33 1.1E-05171 570 146 73 4.4E-05 175 27 2.9E-05 173 31 2.7E-05172 580 255 54 1.0E-05 190 -46 1.5E-05 176 -43 1.6E-05173 591 131 63 4.3E-05 161 14 2.1E-05 160 10 2.2E-05174 601 39 67 2.2E-05 148 14 6.4E-06 150 2 7.4E-06181 603 92 52 7.9E-06 163 -18 6.4E-06 135 -31 4.9E-06182 613 2 69 2.6E-05 152 87 1.2E-05 113 78 8.2E-06183 624 -44 19 2.1E-05 -69 -45 1.7E-05 -67 -53 1.4E-05184 634 -16 5 1.6E-05 267 -55 1.1E-05 -86 -59 8.6E-06191 636 106 60 2.0E-06 112 -37 3.0E-06 160 1 1.4E-06192 646 -38 7 2.3E-05 -54 -26 1.8E-05 -55 -40 1.2E-05193 657 2 47 2.6E-05 -4 19 5.7E-06 -26 -27 3.0E-06194 667 14 64 4.3E-05 42 63 1.6E-05 45 61 1.0E-05201 669 8 45 4.5E-05 25 43 2.5E-05 24 45 1.6E-05202 677 22 84 5.0E-05 183 84 2.6E-05 192 79 1.8E-05203 685 48 52 3.3E-05 74 50 1.7E-05 78 44 1.2E-05204 692 25 48 1.9E-05 56 25 6.3E-06 78 -17 1.6E-06

Sniders Hall
100
200
300
400
500
600
700
800
900
1000
0
Hole 1Hole 5
100
200
300
400
500
600
700
800
900
1000
0
100
200
300
400
500
600
700
800
900
1000
0
Kaena
Olduvai
Mummys Alcove
100
200
300
400
500
600
700
800
900
1000
0
Hole 3
100
200
300
400
500
600
700
800
900
1000
0
Heavenly Hall
100
200
300
400
500
600
700
800
900
1000
0
100
200
300
400
500
600
700
800
900
1000
0
100
200
300
400
500
600
700
800
900
1000
0
100
200
300
400
500
600
700
800
900
1000
0
Plate 6. Cross-section and correlation of the magnetic declination of sampled pits and cored holes from the Grand Concert Hall and Heavenly Hall.
A A'(See Plate 2 for locations of pits and holes.)
Hole 4 Hole 2Hole 6

1.5
2.0
2.5
3.0
3.5
4.0
4.5
Mammoth
Kaena
Reunion
Olduvai
Cochiti
Nunivak
0
2
3
4
5
6
7
8
9
10
Declination
Angular limestone clastsup to 50 cm contains silt,clay, small (bat) and largebones near base.Appears to be artificial fill.
Floor
Flowstone
Brown, laminated,micaceous silt containsclay intraclasts.
Brown, laminated,micaceous silt interbeddedwith mottled red clay.Mostly silt near top andclay near bottom. Bedsdip 20 degress east.
GreenClay
RedSandstone
Limestone
Chert
ClayIntraclast
White clay
Reddish brown claycontains red, brown,purple, green and bluemottles.
Reddish brown claycontains yellow and purplemottles. Containslimestone and purplesandstone clasts.
Bedrock
Figure 14. Paleomagnetic correlation and stratigraphy of Grand Concert HallHole 5. Paleomagnetic time scale adapted from Harland and others (1982).
1
Thin bed (5 cm) of Mn-Fe-oxides and solutionresidue.
NormalPolarity
ReversedPolarity
.

Table 10. Chemical analysis of the magnetic grains from cave sediments and rock samples.
NAME MgO Al2O3 SiO2 TiO2 MnO FeOTotal
cations
Pikes Peak Migmatite 0.00 0.65 0.18 0.20 0.34 91.89 93.26Pikes Peak Granite 0.00 2.33 0.39 0.22 0.36 90.20 93.49Narrows Cave 0.00 0.45 0.55 0.18 0.29 91.84 93.30Cave of the Winds 0.32 1.99 1.79 0.22 0.82 88.63 93.77comparison) 93.09 93.09


= Nussbaum Alluvium
Fountain Creek
Water table
Williams Canyon Creek
GravelSand
Silt
ClayMn-oxide
Fe-oxideSolution debris
GravelSandSilt
Clay
Mn-oxide
GravelSand
SiltClay
Mixing Zone
A. ~2 Ma
= Grand Concert Hall, Cave Of The Winds
South North
Fountain Creek
Water table
B. ~1.8 MaSouth North
C. Present
Water table
Manitou Cave
FountainCreek
Williams Canyon Creek
Figure 15. Schematic cross sections showing the sequence of changes inthe water table, topographic setting, and depositional phases over the last~2 Ma.
South North
Text in green are sediments that are beingdeposited in the cave.
= outline of cavernWater ascendingfrom Ute PassFault

0
2
4
6
8
10
κ κ
Figure 16. Volume magnetic susceptibility (κ) of samples from Holes1 and 5, Grand Concert Hall.
Hole 1 Hole 5
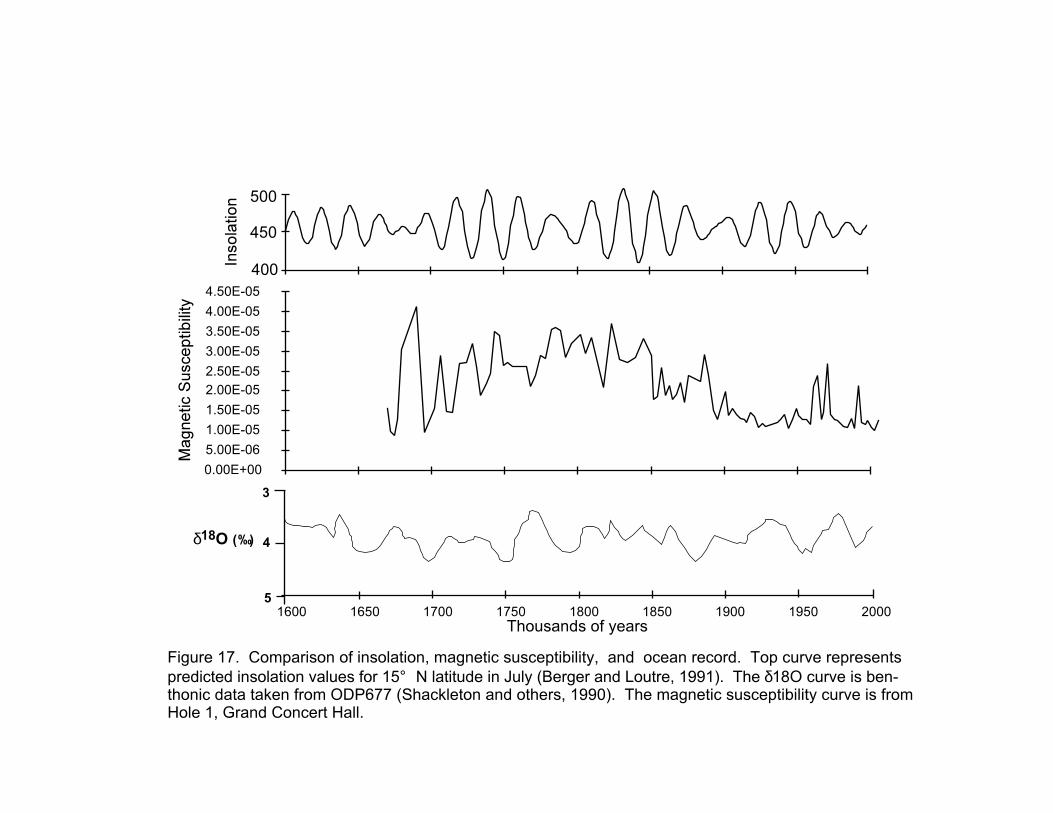
0.00E+00
5.00E-06
1.00E-05
1.50E-05
2.00E-05
2.50E-05
3.00E-05
3.50E-05
4.00E-05
4.50E-05
1600 1650 1700 1750 1800 1850 1900 1950 2000
δ18O (�)
3
5
4
Figure 17. Comparison of insolation, magnetic susceptibility, and ocean record. Top curve representspredicted insolation values for 15° N latitude in July (Berger and Loutre, 1991). The δ18O curve is ben-thonic data taken from ODP677 (Shackleton and others, 1990). The magnetic susceptibility curve is fromHole 1, Grand Concert Hall.
500
450
400
Thousands of years

0.0
0.5
1.0
1.5
2.0
2.5
3.0
3.5
4.0
DRIER WETTER
NO RECORD
NO RECORD
Ma
Figure 18. Hypothesized par-tial climate record of the Mani-tou Springs area.
snail record
snail record
snail record
sedimentrecord