Embed Size (px)
Citation preview
Guide to
Performance Management for Community LiteraCy CoaLitions

Guide to
Performance Management for Community LiteraCy CoaLitions
oCtober 2008
Harry Hatry & Elaine MorleyUrban Institute
This report was produced under National Institute for Literacy Contract No. ED-04-CO-0051/0002. It was written by Harry Hatry, Director, Public Management Program, and Elaine Morley, Senior Research Associate, both at the Urban Institute. Tanya Shuy served as the contracting officer’s representative. The views expressed herein do not necessarily represent the positions or policies of the National Institute for Literacy. No official endorsement by the National Institute for Literacy of any product, commodity, or enterprise in this publication is intended or should be inferred.
the national institute for Literacy, a Federal government agency, is a catalyst for advancing a comprehensive literacy agenda. The Institute bridges policy, research and practice to prompt action and deepen public understanding of literacy as a national asset.
sandra baxter, Director
Lynn reddy, Deputy Director
September 2008
The citation for this report should be: National Institute for Literacy, Guide to Performance Management for Community Literacy Coalitions, Washington, DC 20008
To order additional copies of this report, contact the National Institute for Literacy at EDPubs, PO Box 1398, Jessup, Maryland 20794-1398 or call 1-800-228-8813 or email [email protected] The report may be downloaded in PDR or HTML versions at www.nifl.gov

Table of Contents
SECTION ONE – Introduction and Scope 1Contents of Guide 2Note to Readers 3
SECTION TWO – Selecting the Outcomes that your Community Should Track 5Outcome Sequence Charts 6
SECTION THREE – EXAMINING OVERALL COMMUNITY LITERACY 9Overall Community Literacy 9The Importance of Breaking Out Outcome Indicator Data by At-Risk Groups 13
SECTION FOUR – PERFORMANCE MEASUREMENT FOR DIRECT SERVICE LITERACY PROGRAMS 17Adult Literacy Programs 20Preschool Programs 23Programs for School-age Youth 25Workforce/Workplace Literacy Programs 27
SECTION FIVE – OUTCOME MEASUREMENT FOR OTHER LITERACY COALITION ACTIVIITES 29Providing Information on Literacy Learning Opportunities 30Professional Development 31Recruiting Volunteers 32Disseminating Information on Best/Successful Practices 32Coordinating Literacy Activities among Funders, Sponsors, and Service Providers 32Tracking Progress in Improving Literacy in the Community 32
SECTION SIX – ISSUES IN USING SURVEYS 35Mode of Administration 35Cost 35Questionnaire Content 36Questionnaire Accuracy 36Special Survey Problems 37
SECTION SEVEN – ANALYZING THE PERFORMANCE INFORMATION 39Basic Data Analysis 39Startup Steps 39Delving Deeper 39Summarizing and Highlighting the Information 41Seeking Explanations for Outcomes 42
SECTION EIGHT – USING THE OUTCOME INFORMATION 45Identify Needed Improvements 45Motivate and Help Staff and Volunteers 48Identify What Works 49Demonstrate Accountability to the Board, Funders, and the Public 52
SECTION NINE – POTENTIAL KEY OUTCOMES MANAGEMENT ROLES FOR LITERACY COALITIONS 55
SECTION TEN – FREQUENTLY ASKED QUESTIONS 57
APPENDIX A – CHECKLIST OF CANDIDATE OUTCOME INDICATORS FOR COMMUNITY LITERACY 59
APPENDIX B – EXAMPLES OF QUESTIONS FOR A SURVEY OF ORGANIZATIONS ON THE QUALITY OF LITERACY COALITION ACTIVITIES 63
APPENDIX C – SAMPLE SURVEY QUESTIONNAIRE FOR ADULT LITERACY PROGRAM PARTICIPANTS FROM THE DIVISION OF ADULT EDUCATION AND LITERACY, OFFICE OF VOCATIONAL AND ADULT EDUCATION, U S DEPARTMENT OF EDUCATION 67
GUIDE TO PERFORMANCE MANAGEMENT FOR COMMUNITy LITERACy COALITIONS
1
What is the condition of literacy in your community? Is it improving or worsening? How well are adult, school-age, and preschool literacy programs doing? Which literacy programs need assistance? How well are literacy coalitions’ own activities helping literacy programs in the community?
This guide addresses how community literacy coalitions and their partner organizations can track the progress they are making to improve literacy in their communities, then use this information to improve their activities and, therefore, the effective-ness of their work.
Estimates suggest there are approximately 80 active literacy coalitions working in communities through-out the country. Typically composed of a variety of stakeholder organizations, literacy coalitions under-take varying activities. Some coalitions provide some direct services; others do not. Some recruit volun-teers for direct service organizations; others do not. A basic assumption of this guide is that coalitions, nevertheless, have key roles in helping their commu-nities accomplish the following:
Track the level of literacy in the community; •
Use that information to help identify what, and •how much, literacy assistance is needed;
Assess the extent to which community literacy •programs are meeting the need, including how well existing literacy programs are doing;
Coordinate the use of the outcome information to •help identify successful (“best”) practices; and
Provide assistance to literacy programs to help •them both track and improve their effectiveness.
Having a strong community literacy outcome mea-surement process will help considerably in perform-ing these roles. Outcome information is useful both to coalitions and to the organizations or programs that provide literacy services. Outcome information can be used in many important ways (discussed in Section Eight). Outcome information should help programs identify where improvements are needed and help them assess whether changes that have been made have been successful. Information on outcomes can also encourage potential funders to provide support.
Performance measurement is a term that covers several types of performance, including the measure-ment of financial performance, outputs, efficiency, and outcomes. (Definitions for these terms are pro-vided in Exhibit 2-1.) This guide focuses on the measurement of outcomes, which has been the focus of much of the performance measurement work in the past few years at all levels of government and for all public services.
This guide provides suggestions for a community literacy outcome measurement process, a process that covers both individual literacy assistance programs and the community Literacy Coalition. While this guide focuses more on performance measurement and performance management from the perspec-tive of community Literacy Coalitions, many of its recommendations are also intended to be helpful to individual literacy service providers.
Not covered are the following:
Success in fund raising. (Note that having a good •outcome measurement process, the key focus of this guide, can help raise funds.) Similarly, other
SECTION ONEIntroduction and Scope
NATIONAL INSTITUTE FOR LITERACy
2
“internal” coalition activities, such as marketing and coalition building, are not explicitly addressed.
Success in advocacy. However, coalitions that want •to track advocacy might look http://www.urban.org/center/met/projects/upload/Advocacy.pdf, which suggests a number of indicators.
Procedures for undertaking more in-depth evalua-•tions of service effectiveness, including cost-benefit analyses. Individual program evaluations and cost-benefit analyses are beyond the scope of this guide. They can be quite complex and usually require special in-depth, ad hoc work. However, the out-come data obtainable through outcome measure-ment procedures such as those described here pro-vide some of the basic data needed for program evaluations and cost-benefit analyses. The outcome data alone, even if not converted to monetary units as called for in cost-benefit analyses, can often pro-vide strong evidence of a program’s value to the community.
Computer literacy. However, most outcome indi-•cators identified here apply to a Coalition’s work on computer literacy. The primary difference would be the “tests” used to determine progress toward computer literacy.
Measurement of program “outputs” such as num-•ber of reports issued. Such indicators can be use-ful for internal coalition use. However, the focus of this guide is on the outcomes—the results—of literacy improvement activities.
Measurement of program effects on community •economic conditions. Some coalitions explicitly include reducing unemployment and poverty among their objectives. Indeed, these are implicit, long-term outcomes for literacy improvement. However, linking community-level economic changes to coalition efforts can be extremely difficult and is better done through in-depth studies.
CONTENTS OF GUIDESection Two provides suggestions for a process for selecting and implementing a community literacy outcome measurement process.
Sections Three, Four, and Five suggest candidate outcome indicators and data collection sources for ten major community literacy activities.
Section Three suggests ways to estimate overall, communitywide literacy.
Section Four focuses on ways to track the outcomes of specific direct service literacy programs. Suggestions are provided for outcome measurement approaches for the following four direct literacy services:
Adult literacy programs1.
Preschool programs2.
Programs for school-age youth3.
Workforce literacy programs4.
Section Five provides outcome measurement sug-gestions for six common coalition activities that sup-port direct service providers:
Providing information to the public on learning 1. opportunities
Professional development activities2.
Recruiting teachers/volunteers3.
Disseminating information on best/successful 4. practices
Coordinating literacy activities among funders, 5. sponsors, and service providers
Tracking and reporting progress in improving 6. literacy throughout the community
Section Six provides suggestions to coalitions and direct service providers for making surveys of cus-tomers practical. Customer surveys are valuable tools
GUIDE TO PERFORMANCE MANAGEMENT FOR COMMUNITy LITERACy COALITIONS
3
for obtaining feedback on outcomes for many of the outcome indicators suggested in this guide.
Section Seven identifies a number of basic analysis steps that can help you get maximum use from the outcome information.
Section Eight suggests a number of ways coali-tions and other direct service providers can use the outcome information. The use of outcome mea-surement information to improve programs trans-forms performance measurement into performance management.
Section Nine suggests a number of key roles that literacy coalitions can play in producing a highly use-ful community performance management process.
Section Ten addresses a number of frequently asked questions about the performance measurement process.
Appendix A provides a stand-alone list of the per-formance indicators presented in the guide. Appendix B provides examples of questions that might be included in a survey of literacy organizations in your community in order to obtain data for some of the indicators. Appendix C provides an example of a questionnaire that can be used to obtain data from learners. (This questionnaire is from the Office of
Vocational and Adult Education, U.S. Department of Education.1)
NOTE TO READERSThis guide identifies a number of candidate outcome indicators. Most, if not all, communities will already have in place some literacy measurement procedures (if only those required by a variety of literacy program funders). Each community should choose those indicators rel-evant to its own situation and perhaps add indicators not included here. Each community will want to tailor its per-formance measurement efforts to its unique situation.
The literacy coalition should work with its part-ners to select the most important performance infor-mation gaps on which to focus. The community as well as the literacy coalition may want to go slowly in introducing new performance measurement pro-cedures. Resource availability, of course, should also be considered when deciding what improvements to seek, and at what pace.
As the old saying goes, “Learn to walk before you run.” It is okay to introduce parts of a performance measurement process, find it useful, and feel comfort-able with it before expanding the process.
1. Implementation Guidelines: Measures and Methods for the National Reporting System for Adult Education, Division of Adult Education and Literacy, Office of Vocational and Adult Education, U.S. Department of Education, Contract No. ED-01-CO-0026, June 2007.


GUIDE TO PERFORMANCE MANAGEMENT FOR COMMUNITy LITERACy COALITIONS
5
What specific outcomes and outcome indicators should your community track and how? Here are some steps to consider:
Convene your literacy-building partners to par-1. ticipate in the selection process. Include represen-tatives of potential donors and direct service pro-viders. (The latter are likely to perform much of the data collection work.) This will help ensure that the outcome measurement process is practi-cal. Participation is also likely to considerably increase the acceptability of the process, making it more likely that your partners will provide the needed data and then use the information gener-ated to improve their services. A community has many different ways to try to meet its literacy needs. Support may come from the school system, government, community non-government organizations, other citizen groups, and parents. Ideally, representatives from all such groups will participate in selecting outcomes to be tracked.
Start by obtaining agreement on an overall mis-2. sion (vision/objective) statement for literacy in the community. This statement should focus on results and identify the customers in the com-munity.
Form a working group to draft the set of out-3. comes, outcome indicators, and data sources for each indicator. Include both “intermediate” and “end” outcomes. (See Exhibit 2-1 for defini-tions.) Subgroups are likely to be needed, with each subgroup focusing on a major program cat-
egory (such as preschool, school-age, adult, and workforce literacy).
Obtain consensus from your literacy partners on 4. the outcomes and outcome indicators needed. You don’t need to start from scratch. For example:
Consider indicators already being collected in •the community, including those collected by individual literacy programs.
Consider the suggested indicators identified in •this guide (Appendix A).
Check the Internet to identify what has been •done in other communities or research efforts. Adapt these ideas to your community’s needs.
Use outcome sequence charts (also called “logic •models” or “results chains”) to help identify out-comes and outcome indicators. They can be very useful for identifying needed indicators and also for training staff in outcome management. These charts are discussed below in more detail.
Select the draft set of outcome indicators only 5. after a reasonably practical data collection proce-dure has been identified.
Disseminate the draft plan to all partners for their 6. comments and suggestions. Make appropriate changes based on those comments and suggestions.
Seek agreement among the literacy partners on 7. what core performance tracking should be done and the respective roles of each partner. The liter-acy coalition should seek to put together a com-prehensive picture of literacy in the community.
SECTION TWOSelecting the Outcomes that Your Community Should Track
NATIONAL INSTITUTE FOR LITERACy
6
Note: These agreements need to identify only the 8. core outcome indicators to be collected. The agree-ments should encourage each program to also track any other indicators each program believes would be useful for managing its program.
Provide assistance to those responsible for data 9. collection and use of the data.
Look for successful (“best”) practices from 10. those programs with unusually high outcomes. Disseminate the information to other programs.
Use the outcome information to identify weak 11. performers to which the Coalition would offer technical assistance and training.
Note: Comparative information can be threaten-12. ing to individual programs, which may fear that it might negatively affect future funding. However,
the reason for weak performance may be lack of resources. Performance data may help weak per-formers make their case for more funding.
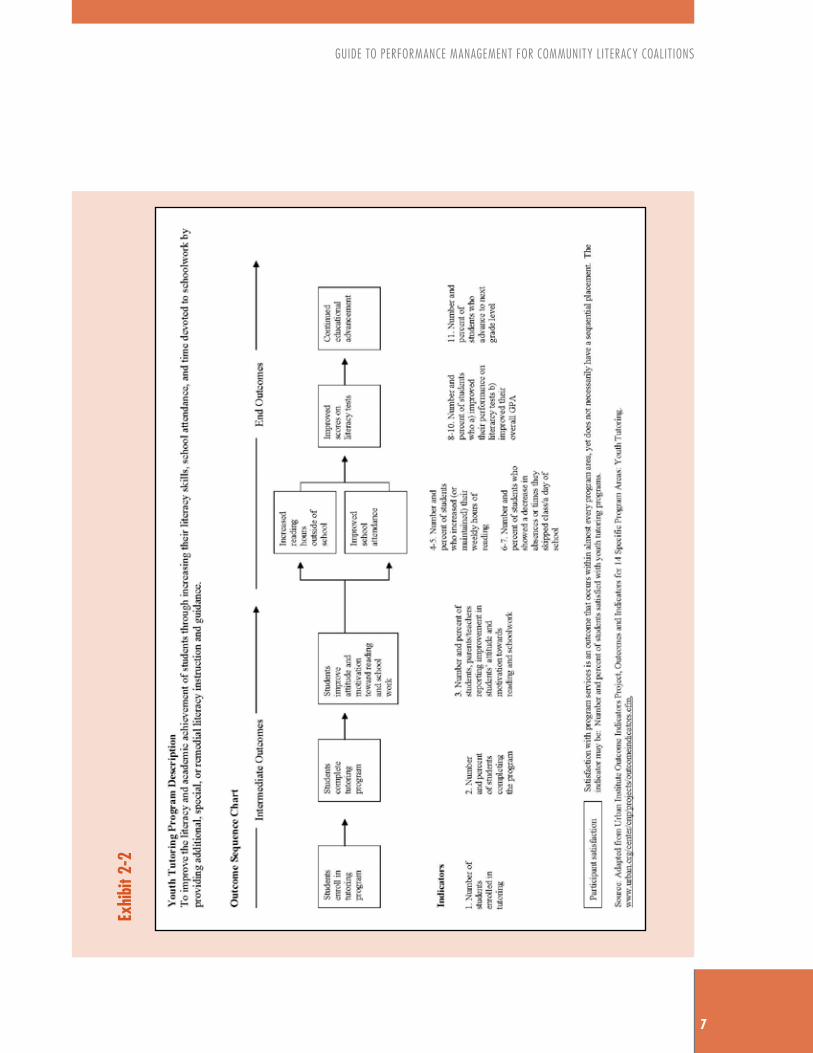
OUTCOME SEQUENCE CHARTSOutcome sequence charts (or logic models) are use-ful tools to help identify outcomes to be tracked. They typically diagram the steps from “inputs”—of dollars and staff—that lead to “activities” that lead to “outputs.” Outputs lead to “intermediate outcomes” that are expected to result in “end outcomes”—the ultimate goal of the program. Exhibit 2-2 is an outcome sequence chart for an adult education and family literacy program. Note that this chart does not include long-term outcomes of improved lit-eracy, such as improved employment, earnings, and quality of life.
exhibit 2-1some basic Performance indicator definitions
Inputs: Inputs indicate the amount of resources applied—that is, the amount of funds or number of employ-ees. When related to output or outcome information, the combined information can provide indicators of efficiency/productivity.
Outputs: Outputs measure the quantity of work activity completed. Outputs are expected to lead to desired outcomes but by themselves do not tell anything about the outcomes.
Intermediate Outcomes: Intermediate outcomes measure changes in client attitudes, behavior, condition, etc., that literacy programs seek to improve and that are expected to lead to the end outcomes; they are not themselves “ends.” Examples are the extent to which parents provided learning help to their children and the extent to which adults are aware of, and enroll in, the literacy assistance programs in the community. Also included here are characteristics relating to the quality of the service provided to clients, such as the service’s accessibility and timeliness.
End Outcomes: End outcomes measure the results ultimately sought, particularly improved literacy and improved earnings.
GUIDE TO PERFORMANCE MANAGEMENT FOR COMMUNITy LITERACy COALITIONS
7
exhi
bit 2
-2

GUIDE TO PERFORMANCE MANAGEMENT FOR COMMUNITy LITERACy COALITIONS
9
A primary task for literacy coalitions is to track improvements in literacy in their community as a whole. Information on the overall level of literacy in the coverage area helps identify the need for literacy efforts and provides a way to track the success of the community’s literacy efforts.
This section first addresses the problem of iden-tifying the community’s current overall level of lit-eracy—considering all age groups together. It then addresses the problem of assessing the overall literacy for each of four age groups: preschool, school-age children, adults, and, as a special subset of adults, workforce literacy.
OVERALL COMMUNITY LITERACYThe easiest approach for a literacy coalition has
been to use data from the last national decennial census to assess community literacy, both overall and for various segments of the community. These data age quickly. The information comes out about two years after the census, meaning that the data can be between two to ten years old. Considerably better, if the coalition has resources, is to assemble a variety of local data to provide a reasonably comprehensive picture.
Fortunately, the U.S. Bureau of the Census is now beginning to conduct annually what is called the American Community Survey. The survey covers the same literacy-related items as the decennial census. The sample is very large. About 3 million households are sampled each year. Data will be available annually for communities with 65,000 people or more.
However, like the decennial census, these surveys do not directly ask most respondents about their liter-acy levels. They provide the following information:
Number of years of schooling (somewhat useful as •a proxy for literacy),
The number of persons who speak a language •other than English at home and do not speak English well or at all, and
Whether the person was born in the United States, •and, if not, what year they came to live in the United States (another proxy for literacy).
These data can be used to generate the following overall community (OC) indicators, which can be considered proxies for persons with significant lit-eracy problems:
OC 1: Number and percentage of adults who have completed fewer than “X” years of school. (“X” would be the number of years chosen by the com-munity. The indicator would be calculated from the census data so that only adults are included in the calculations.)
OC 2: Number and percentage of persons who speak a language other than English at home and do not speak English well or at all.
OC 3: Number and percentage of persons who are recent immigrants to the United States. (The com-munity should select the definition of “recent.” For example, the definition might be those who im-migrated in the last five years.)
OC 3 will likely overstate the extent of low literacy, since some immigrants will come from English-speaking countries or will have learned English in their native country.
SECTION THREEExamining Overall Community Literacy
NATIONAL INSTITUTE FOR LITERACy
10
A preferable, but more difficult, option is for the community to conduct its own household survey or to add questions to an existing community survey. A com-munity literacy survey could obtain considerably more detailed data on literacy and the need for literacy assis-tance. Such surveys, however, can be expensive, prob-ably costing at least $50,000 for a sample of about 1,000 households. These household surveys would likely need to be done only every other year, as the findings would not likely change appreciably each year. (The samples can be designed so that the bulk of the sample is drawn from neighborhoods likely to have substantial numbers of persons with literacy problems.)
If the community already conducts household sur-veys, the literacy coalition could ask the organization sponsoring the survey to add questions on literacy. This would save considerable money. It would not, however, provide as much detail as a special literacy community survey. Section Six suggests a number of ways literacy coalitions can make surveys more affordable.
Respondents would be asked such questions as “How many of the adults in your household have considerable difficulty reading or writing English? Do not count persons whose problem is due to poor eyesight or similar conditions.”
This would enable the coalition to develop and use an indicator such as this:
OC 4: Number and percentage of adults in the community who have considerable literacy prob-lems. To estimate the total number of persons in the
whole community, the percentage obtained from the survey data needs to be multiplied by the estimated total number of adults/persons in the community.2 That estimate would likely come from city or county planning departments.
If the sample is drawn so as to be reasonably represen-tative of the community’s population, the findings should provide reasonable estimates of the number of persons in the community with literacy problems. And these data can be broken out by various demographic groups.
An additional source of data is the National Center for Education Statistics’ National Assessment of Education Progress (NAEP). It conducts tests in grades 4, 8, and 12, with reading and writing covered at two-year intervals. Unfortunately, while it provides results for each state, it does not provide results for individual communities.
Preschool Literacy. If available, use the findings from your school system’s preschool school readiness assessment. School systems are increasingly conduct-ing such assessments. For example, the Buffalo (New York) School District uses the Brigance Assessment tool. The school district and the Buffalo Reads Coalition use that information to assess literacy both at entry into prekindergarten in the fall and when those children complete the school year.
The primary purpose of these measurements is to help evaluate the level of need for additional instruc-tion in literacy for children entering kindergarten. The performance indicator obtained from readiness-for-school measurements is a version of the following:
OC 5: Number and percentage of preschool chil-dren screened whose measured literacy level indi-cated that (a) they were in need of additional help; and (b) they required intensive assistance.
Unfortunately, many communities will not have the data on school readiness. However, if the Coalition is able to add questions to an existing community survey, or to sponsor its own, questions can be asked of house-holds that provide data for the following indicator:
2. If the sample was drawn in a way that overrepresented neighborhoods likely to have larger proportions of residents with literacy prob-lems, weighting procedures will need to be used to estimate the community population with literacy problems.

GUIDE TO PERFORMANCE MANAGEMENT FOR COMMUNITy LITERACy COALITIONS
11
OC 6: Number and percentage of preschool chil-dren in need of literacy assistance, as perceived by their parents.
To assess progress in providing assistance to pre-school children who need it, an intermediate out-come indicator such as the following is useful:
OC 7: Number and percentage of preschool chil-dren in need of literacy assistance currently receiv-ing literacy assistance.
The number of preschool children who have been assisted in, say, the past 12 months will need to be obtained from as many community literacy programs and schools as possible.
The percentage is calculated by dividing the number currently being assisted by the estimated total number of preschool children thought to be in need of assistance. The denominator of the percent-age would be based on either readiness-for-school measurements, the findings from a community-level literacy survey, or some other source.
School-age Literacy. The local school system, of course, has primary responsibility (along with par-ents) for the literacy of school-age children. However, the literacy coalition and community organizations can play an important role in helping children who are severely below expected grade levels, such as by providing tutors. Many coalitions can likely use data from their state’s or school system’s standardized tests to estimate the need for such assistance. The cover-age in this case depends on how many, and which, grades the school system and state are testing. Federal law (No Child Left Behind) currently requires state assessments annually in grades 3 through 8 and once in high school. For grades not covered by existing tests, the school system should have its own counts of the number of students needing literacy assistance.
The findings can be compared from one year to the next to provide a reasonable perspective on prog-ress in improving literacy and the number of school-age children in the community needing tutoring. The performance indicator would be some version of the following:
OC 8: Number and percentage of tested school-children whose measured literacy level indicated that they (a) were at or above grade level; (b) were in need of some additional help; or (c) required intensive instruction.
The Coalition may also want to present data on other educational indicators such as graduation rates and attendance rates for each year. The literacy coali-tion can probably obtain counts of dropouts each year from the local school system as a proxy for persons needing literacy help. These are certainly important indicators for the community, although they measure more than literacy.
If the coalition is able to add questions to an exist-ing community survey or to sponsor its own, ques-tions can be asked of households that provide data for each of the above two indicators.
Adult Literacy. The latest census data, such as those obtained from the annual American Community Survey, provide a perspective on the number and percentage of adults with low levels of schooling and those for whom English is a second language and who do not speak it well or at all. This would lead to a performance indicator such as OC 1, repeated here.
OC 1: Number and percentage of adults who have completed fewer than “ X” years of school. (“X” would be the number of years chosen by the com-munity. The indicator would be calculated from the census data so that only adults are included in the calculations.)
NATIONAL INSTITUTE FOR LITERACy
12
Also, a version of OC 2 that includes only adults would be helpful:
OC 9: Number and percentage of adults who speak a language other than English at home and do not speak English well or at all.
A more comprehensive source of literacy lev-els used by some literacy coalitions is the National Assessment of Adult Literacy (NAAL) sponsored by the National Center for Educational Statistics. It pro-vides information on the percentage of adults in each of four literacy levels (below basic, basic, intermediate, and proficient).
Unfortunately, the survey only provides national, not local, results and is conducted only sporadically, the last being in 2003. The next one appears not to be scheduled until 2014. (Six states—Kentucky, Maryland, Massachusetts, Missouri, New York, and Oklahoma—funded coverage of a larger number of their citizens. They provided state-level assessments of adult literacy as part of the 2003 national assessment. Thus, other than using NAAL’s 2003 limited state-level data, this source is not likely to be useful for timely tracking of community literacy levels over time.)
The preferable option is to participate in a commu-nity household survey, as discussed above. An indicator such as OC 4, repeated here, could then be used.
OC 4: Number and percentage of adults in the com-munity who have considerable literacy problems.
Finally, the literacy coalition should consider col-lecting data on the extent to which current commu-nity literacy programs are meeting the need.
An overall indictor of the extent to which the literacy need is being met in the community is to either (a) use questions in a community household survey (asking those in need whether they have been receiving help); or (b) seek data from as many adult literacy providers as possible on how many persons
they helped in the past 12 months and divide that by the estimated number of total adults needing lit-eracy help (obtainable through the annual American Community Survey). These would provide data for an indicator such as the following:
OC 10: Number and percentage of adults in need of literacy assistance who are currently receiving literacy assistance.
The size of waiting lists for adult literacy programs in the community also provides an indication of the extent to which the demand for adult literacy help exceeds the supply. The Coalition would then seek such an indicator as this:
OC 11: Total number of adults on waiting lists for adult literacy programs.
This requires the literacy coalition to ask all adult education programs in the community to provide a count of the size of their waiting lists, say, at the end of each year. This procedure would provide only a rough count of waiting list size. It would overstate the count by the number of adults on more than one waiting list. It would understate the need by the number who do not sign up to be on waiting lists and by the inabil-ity to obtain responses from all programs. However, the tabulation will at least provide some information and, when tracked over time, should give a reasonable perspective on the trend.
Workforce Literacy. A community’s workforce is a subset of its adults. Some literacy coalitions (such as the Literacy Network of Greater Los Angeles) offer programs that provide literacy services to interested businesses. Estimates of the need for literacy ser-vices for persons currently in the workforce can be obtained by the survey of households, if one of the survey questions asks about employment status.
Another important perspective can be obtained by working with the business community to survey sam-
GUIDE TO PERFORMANCE MANAGEMENT FOR COMMUNITy LITERACy COALITIONS
13
ples of employers every year or two. Such surveys may already be periodically undertaken to identify shortages of particular skills. If so, employers can be asked about their perception of the adequacy of literacy levels of their workers. This question can be used to provide informa-tion for an outcome indicator such as the following:
OC 12: Percentage of employers reporting that low literacy among their employees is a substantial problem. (This indicator might weight employers by their size when calculating the overall percentage.)
The survey could ask separately about the adequacy of literacy levels of job applicants, new employees, and/or their entire workforce. (The literacy coali-tion can use this information in marketing literacy improvement services to businesses.)
The Buffalo Literacy Campaign Needs Assessment used information from a Western New York Skills Survey to report on the extent of current openings and vacancies difficult to fill.3 (The assessment was done for Buffalo’s “Good Schools for All” Coalition.) However, the survey did not ask for the businesses’ ratings of literacy problems in their workforce.
For this particular effort, the literacy coalition can, of course, seek funds from its business community.
The same survey can also be used to obtain data for the following workforce outcome indicator. OC 12 focuses on measuring the number of employers that indicate their need for employee literacy improvement. OC 13 focuses on the number of employers that are making an effort to improve the literacy of their employees.
OC 13: Number of businesses that support employee literacy programs, including providing incentives to workers or sponsoring workplace literacy programs.
THE IMPORTANCE OF BREAKING OUT OUTCOME INDICATOR DATA BY AT-RISK GROUPSThe indicators noted above, and all those identified in later sections of this guide, will become much more useful to the coalition and to literacy service programs if the information is also broken out by important customer segments. Most literacy coalitions are likely to want information on specific client or population groups, such as groups categorized as follows:
By age,•
By race/ethnicity, •
By gender,•
By whether the learner is English proficient or has •limited English proficiency,
By economic status (disadvantaged or not), •
By physical or learning disabilities, and •
By employment status.•
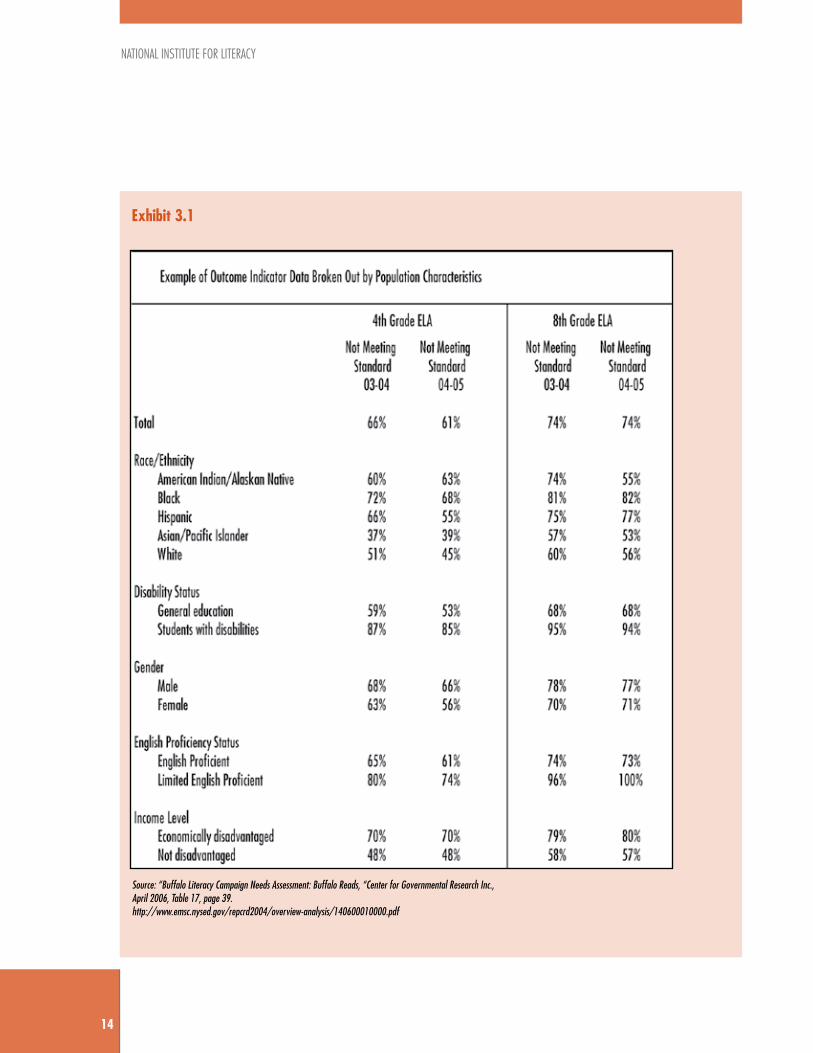
Exhibit 3-1, from “Buffalo Reads,” illustrates such a breakout.4 It presents data obtained from the school district for both fourth-grade and eighth-grade test scores. It shows the percentage not meeting standards on state English Language Arts tests. Thus, the perfor-mance indicators would be the percentage of fourth-grade or eighth-grade students not meeting standards for each of these demographic subgroups.
Breakout information should help coalitions tar-get their limited resources. Some literacy coalitions, such as Buffalo’s Good Schools for All Coalition and The Literacy Cooperative in Greater Cleveland, have used statistical techniques to estimate from aggregate data (such as those from the 2000 cen-sus) to provide a variety of breakout data, such as
3. Buffalo Literacy Campaign Needs Assessment: Buffalo Reads, Center for Governmental Research Inc., April 2006, page 56. 4. Ibid., Table 17, page 39.
NATIONAL INSTITUTE FOR LITERACy
14
exhibit 3.1
Source: “Buffalo Literacy Campaign Needs Assessment: Buffalo Reads, “Center for Governmental Research Inc.,April 2006, Table 17, page 39.http://www.emsc.nysed.gov/repcrd2004/overview-analysis/140600010000.pdf
GUIDE TO PERFORMANCE MANAGEMENT FOR COMMUNITy LITERACy COALITIONS
15
reading levels for various community demographic groups.
Obtaining the outcome information by geographi-cal area within the community is likely to be of con-siderable importance to literacy coalitions and their partners. For indicators using data from the school sys-tem, such as test scores, the school would be the proxy for the geographical area. For adult literacy indicators, such as those obtained from a household survey, the sample should be selected so as to provide data on each separate “planning area” or neighborhood.
For example, if a sample of 500 households is used, the sample might be selected so as to seek approxi-mately 100 household interviews in each of five geo-graphical areas. The coalition and its partners, includ-ing the local government planning commission, could choose the boundaries for the five 100-unit samples to cover areas expected to contain different demographic groupings.
A special strategy that might be used in such sam-pling is to focus on areas known to have high levels of at-risk adults. For example, high-income and non-minority locations might be grouped into one seg-ment, while the remainder of the 400 in the sample would be split among four geographical areas con-taining the more at-risk populations.
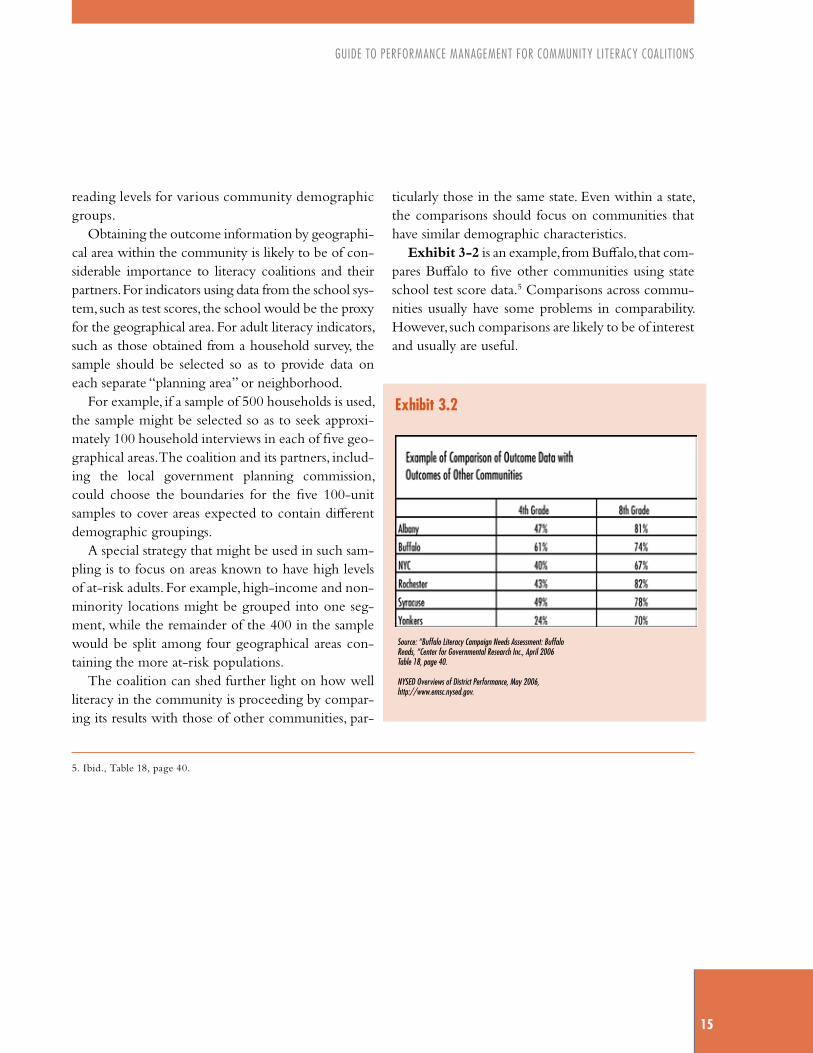
The coalition can shed further light on how well literacy in the community is proceeding by compar-ing its results with those of other communities, par-
ticularly those in the same state. Even within a state, the comparisons should focus on communities that have similar demographic characteristics.
Exhibit 3-2 is an example, from Buffalo, that com-pares Buffalo to five other communities using state school test score data.5 Comparisons across commu-nities usually have some problems in comparability. However, such comparisons are likely to be of interest and usually are useful.
exhibit 3.2
5. Ibid., Table 18, page 40.
Source: “Buffalo Literacy Campaign Needs Assessment: Buffalo Reads, “Center for Governmental Research Inc., April 2006Table 18, page 40.
NYSED Overviews of District Performance, May 2006,http://www.emsc.nysed.gov.


GUIDE TO PERFORMANCE MANAGEMENT FOR COMMUNITy LITERACy COALITIONS
17
Section Three focused on aggregate indicators for the whole community. Literacy coalitions can also be very helpful in tracking the outcomes of individual direct service literacy programs in the community. These programs include any direct services to learners that may be provided by the coalition itself. Coalitions also can help literacy service providers implement their own internal performance measurement and performance management programs.
In this and the following section, we provide sug-gestions for outcome indicators for the following ten activities:
Adult literacy programs1.
Preschool programs2.
Programs for school-age youth3.
Workforce literacy programs4.
Providing information on literacy learning 5. opportunities
Professional development6.
Recruiting volunteers7.
Disseminating information on best/successful 8. practices
Coordinating literacy activities among funders, 9. sponsors, and service providers
Tracking literacy levels and progress in improv-10. ing literacy in the community
Outcome indicators for the first four activities focus on the outcomes of direct service programs. They are discussed in this section. Outcome measure-ment for the next six activities, commonly under-taken by community literacy coalitions, is discussed in Section Five.
The outcome information for the four direct ser-vices should be useful to both the individual direct service programs and the Literacy Coalition. The information can be highly useful to the Coalition for the following purposes:
(a) Identifying training, technical assistance, and resource needs of individual programs;
(b) Obtaining similar information for each of these four categories of direct service programs; and
(c) Helping the individual programs to collect and use the outcome information internally to help them manage and improve their own programs.
The coalition should support and encourage col-lection of outcome information by all literacy pro-grams in the community.
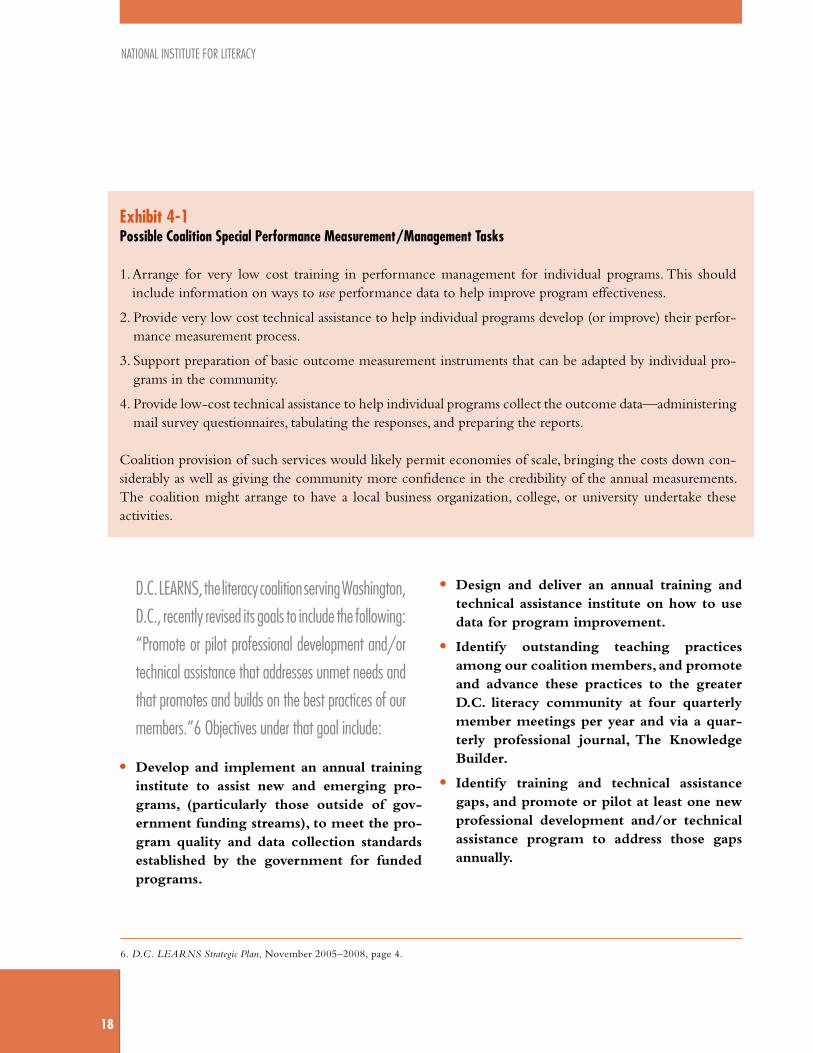
Exhibit 4-1 suggests tasks that literacy coalitions should consider to promote performance measure-ment and performance management of direct literacy services.
A few coalitions appear to be moving in the direc-tion of addressing performance measurement, as indi-cated in documents such as strategic plans.
SECTION FOURPerformance Measurement for Direct Service Literacy Programs
NATIONAL INSTITUTE FOR LITERACy
18
D.C. LEARNS, the literacy coalition serving Washington,
D.C., recently revised its goals to include the following:
“Promote or pilot professional development and/or
technical assistance that addresses unmet needs and
that promotes and builds on the best practices of our
members.”6 Objectives under that goal include:
Develop and implement an annual training •institute to assist new and emerging pro-grams, (particularly those outside of gov-ernment funding streams), to meet the pro-gram quality and data collection standards established by the government for funded programs.
Design and deliver an annual training and •technical assistance institute on how to use data for program improvement.
Identify outstanding teaching practices •among our coalition members, and promote and advance these practices to the greater D.C. literacy community at four quarterly member meetings per year and via a quar-terly professional journal, The Knowledge Builder.
Identify training and technical assistance •gaps, and promote or pilot at least one new professional development and/or technical assistance program to address those gaps annually.
exhibit 4-1Possible Coalition special Performance measurement/management tasks
1. Arrange for very low cost training in performance management for individual programs. This should include information on ways to use performance data to help improve program effectiveness.
2. Provide very low cost technical assistance to help individual programs develop (or improve) their perfor-mance measurement process.
3. Support preparation of basic outcome measurement instruments that can be adapted by individual pro-grams in the community.
4. Provide low-cost technical assistance to help individual programs collect the outcome data—administering mail survey questionnaires, tabulating the responses, and preparing the reports.
Coalition provision of such services would likely permit economies of scale, bringing the costs down con-siderably as well as giving the community more confidence in the credibility of the annual measurements. The coalition might arrange to have a local business organization, college, or university undertake these activities.
6. D.C. LEARNS Strategic Plan, November 2005–2008, page 4.
GUIDE TO PERFORMANCE MANAGEMENT FOR COMMUNITy LITERACy COALITIONS
19
The Greater Baton Rouge Literacy Coalition included
the following in the “Quality and Accountability”
area of its recent strategic plan:7
Establish a centralized accountability system •to track the success of placement efforts, provider performance and learner achieve-ment by the use of system-wide standards and measures.
Identify and measure the performance of the •coalition in regard to its ability to support program improvements, meet its objectives and adopt best practices as defined by non-profits and literacy organizations.
A strategic plan developed for the Literacy Alliance
of Greater New Orleans identified “building capac-
ity” as one of its three key responsibilities. The
report identified both “technical assistance” and
“standards of program excellence” as aspects of
capacity building and included the following recom-
mended activities:8
Offer training and ongoing assistance for •data collection and analysis to users.
Improve outcome measures of literacy pro-•grams to show direct, measurable impact.
Gather data to assess results of increased •program intensity.
Provide LiteracyPro and other relevant data •collection software and hardware required to support their use to providers.
Collect and evaluate data regularly and pro-•vide reports back to user.
Provide relevant, accessible feedback reports •to adult learners on their progress.
Provide an annual report on the status of •literacy in the region to the community.
The remainder of this section suggests outcome indicators for the four types of direct service pro-grams.
As discussed at the end of Section Three, a peren-nial concern in literacy programs is the need to consider differences in learner characteristics when examining outcomes. The proportion of learners with substantially more disadvantages than others (such as those with limited past education or with limited English speaking skills) can vary over time. And different programs providing the same service may have served clients with substantially different levels of disadvantages. Programs that are serving per-sons with greater disadvantages may have consider-ably less success in achieving literacy improvement than other programs.
This is one of the reasons that service providers should track the outcomes of each at-risk group, as well as calculate overall outcome information for their program participants, as discussed in Section Three. Exhibit 3-1 illustrates, for school-age par-ticipants, how such data might be presented. In that example, eighth-grade students with disabilities, lim-ited English proficiency, or from economically dis-advantaged households were considerably less likely
7. Greater Baton Rouge Literacy Coalition, A Vision of Literacy in Greater Baton Rouge, July 2007, page 22, www.gbrliteracy.org. 8. Literacy Alliance of Greater New Orleans, untitled, no date, pages 41–42, www.literacyalliancegno.org.

NATIONAL INSTITUTE FOR LITERACy
20
to meet standards than other population groups. The need to calculate separate outcome information for different risk groups applies to all types of literacy improvement activities, not just school-age children.
ADULT LITERACY PROGRAMSHere, the community literacy coalition has respon-sibilities such as (1) to track the overall need in the community; (2) to encourage and help community adult education/literacy programs meet the need as effectively as possible; and (3) to track the results of these programs.
For the first responsibility, outcome indicator OC 3 discussed in Section Three can be used to track the need in the community.
The second and third responsibilities are shared to some extent by the state (using federal funds to help). The state, working under federal requirements, is already requiring those community adult educa-tion programs to which it provides funds to collect and regularly report a number of adult literacy (AL) performance indicators, including the following:9
AL 1a: Number and percentage of learners who complete or advance one or more educational func-tioning levels from the starting level measured on entry into the program.
The federal guidelines identify specific literacy tests for local use, such as Test of Adult Basic Education (TABE), Comprehensive Adult Student Assessment System (CASAS), and Adult Basic Learning Examination (ABLE). For each of these tests, the guidelines provide scoring ranges for reading, writ-ing, and math for each of six levels. For students with English as a Second Language (ESL), tests and scoring ranges for each of six levels are also provided.
Indicator AL 1a, however, does not fully identify how much progress individual students achieved. For example, under the current federal system, if some students started near the top of a grade, it would be very easy for them to move into the next higher grade. Students who started near the bottom of a grade would need to improve much more to reach the next grade level. Students who had improved from near the bottom of a grade to near the top of a grade but did not reach the next grade level would not be counted in the measurement of success.
It is likely to be more useful, and fairer, to calculate the actual amount of improvement achieved by each student—as reflected in suggested outcome indicator AL 1b:
AL 1b: Number and percentage of learners whose scores improved by “X” amount from the starting level measured on entry into the program (where “” is chosen by the adult education programs in the community and is related to the particular test used by the adult education programs to measure progress).
Such outcomes are becoming known in the edu-cation community as “gain scores.” Given that test scores are already being collected, calculating outcome indicator AL 1b should require little extra cost.
As with most of these literacy outcome measure-ments, the coalition should encourage providers to break out the outcomes for their clients by key student demographic characteristics, such as amount of past education, age group, gender, income, employment status, and native language. The coalition may need to provide resources (such as technical assistance) to some direct service providers to enable them to rou-tinely report such information.
9. For a full description of the federal guidelines, see Implementation Guidelines: Measures and Methods for the National Reporting System for Adult Education, Division of Adult Education and Literacy, Office of Vocational and Adult Education, U.S. Department of Education, June 2007 (available on the Internet).
GUIDE TO PERFORMANCE MANAGEMENT FOR COMMUNITy LITERACy COALITIONS
21
AL 2: Number and percentage of adults who obtain their GED or graduate from high school within, say, 12 months after completing the adult education program.
One way to obtain this information is to survey the customers of adult education at a specified period of time after they completed the program, such as 12 months after completion. Adult education programs will likely have, or can readily obtain, contact information on their students near the time of program completion. However, programs will likely lose contact with some students if students are followed up12 months later.
Another possible source of data for indicator AL 2 is state data on GED completions. Each state government has a GED administrator. The extent to which local adult education programs can access this information will probably vary from state to state. Your state may require permission from students to let the state notify the local program whether particular students have passed the GED during the relevant time period—or even how many students from the program have passed. However, your coalition (or a group of coali-tions in your state) and your adult education partners might want to see if a process can be established for obtaining this important information from the state.
The Literacy Assistance Center of New york City col-
lects and reports data relating to AL 1a and AL 2
for the State Department of Education on programs
that receive funds from the state under the National
Reporting System for Adult Education. It can provide
reports to individual counties on educational gain for
each instructional level based on data received from
the individual local programs. It also provides data
on the percentage—of students for whom this was
a stated goal—who obtained a GED or secondary
school diploma. It also can provide the percentage—
of learners who had these outcomes as a goal—
who entered employment, retained employment,
and entered postsecondary education or training.
The GED percentages come from either local program
postservice survey data or from the State Department
of Education, which can also provide this information
directly to individual communities.
Surveying adult students about the quality and helpfulness of their experience and asking for their recommendations for improving the process can be very useful to adult education programs and the com-munity in assessing what needs to be done further.
AL 3: Number and percentage of participants in the adult education program who reported that the service provided to them was either excellent or good (not fair or poor) as to its (a) convenience of location and time; (b) quality of the instruction (considering both the teacher and teaching mate-rials); and (c) helpfulness in improving literacy.
The easy way to obtain data for AL 3 is to survey students at or near their time of program completion, enabling the program to survey most of its clients. If the coalition is surveying former students to obtain data on their success in GED completion several months after students have completed the program, the data for AL 3 can be obtained at that time. The added time will enable the former student to better assess the helpfulness of the program.
10. Ibid., Appendix A.
NATIONAL INSTITUTE FOR LITERACy
22
The coalition should encourage adult education programs to survey their students at the end of the pro-gram or sometime later and, perhaps, assist the programs in those surveys. The coalition might provide support in the form of both advice on questionnaire development, mailing (and remailing to nonrespondents) of the ques-tionnaires, analysis, and reporting of the findings. The cost of questionnaire administration should be small, especially once the questionnaire has been designed and the procedure worked out for administering it, whether by mail or phone, or both. Appendix C reproduces a sample questionnaire provided by the U.S. Department of Education in its 2007 guidelines to states and local programs.10 Coalitions or programs might consider using similar questions in their own surveys.
Representatives from many coalitions and adult education programs might develop a core question-naire that could be adapted by a number of programs and coalitions throughout the country. This would save effort by individual coalitions and enable subse-quent comparative benchmark data across coalitions and adult education programs.
A very useful survey practice is to ask respondents to provide suggestions for improving the program. This is typically asked toward the end of the ques-tionnaire. This type of open-ended question will add some extra work for whoever is analyzing the sur-vey findings; however, such information can be quite helpful to program managers.
The Palm Beach County Literacy Coalition admin-
isters a client evaluation survey to students in its
family literacy and adult education classes. The
questionnaire is administered in the classes near
the end of the program and includes two questions
that address overall client satisfaction:
Are you happy with how much you are learning? Yes/No
Would you tell a friend or relative to come to this class? Yes/No
The questionnaire also seeks suggestions for
improvement, asking “How can we make this
class better?” The response options are (a) have
the class at a different time (please list times); (b)
more computers; (c) more worksheets; (d) have a
babysitter; and (e) other (please explain).
The survey includes questions asking what the stu-
dents liked and disliked about the class. The same
response options are used for both questions: (a) the
teacher; (b) speaking in class; (c) the other people;
(d) learning to read; (e) time spent reading; (f) using
computers; (g) materials or books; and (h) other
(please explain).
Finally, programs are likely to find it useful to track these intermediate outcome indicators:
AL 4: Number of persons on the program’s wait-ing lists.
AL 5: Number and percentage of enrolled adults who completed the program.
The data for both of these indicators should be available from the program’s own records.
GUIDE TO PERFORMANCE MANAGEMENT FOR COMMUNITy LITERACy COALITIONS
23
PRESCHOOL PROGRAMSPreschool literacy services typically include parental “training” programs that help parents teach their chil-dren and support family literacy programs (which also provide literacy education to the parents). Increasingly, school systems are using measurements of the extent of school readiness on entry into kindergarten. If the school system does not already undertake and provide relevant testing, literacy programs outside the school can undertake such assessments at the beginning and end of the program.
These can be used to produce such key preschool (PS) outcome indicators as these:
PS 1: Number and percentage of preschool children served by the program who subsequently entered kindergarten ready to learn on the literacy compo-nents of tests or of observation-based measurements. (The literacy coalition and its partners would need to select what “scores” would be needed to reach ready-to-learn status for the preschooler.) orPS 2: Number and percentage of preschool chil-dren served by the program whose ready-to-learn scores on the literacy components of the tests, or observations, improved significantly by the end of the program. (The literacy coalition and its partners would need to define “improved significantly.”)
A number of measurement instruments are avail-able to preschool programs. Some use tests. Others use structured observations, usually by teachers who rate various pupil skill levels based on prescribed criteria for each skill. For example, the Brigance Assessment tool has been used in Buffalo. The various Peabody and Woodstock-Johnson tests have been widely used else-
where.11 These are usually standardized tests that enable the ratings to be related to students in other locations.
“Homegrown” rating instruments (that is, instru-ments developed by or for the organization using them) can be used instead of standardized tests. For example, a specially constructed Kindergarten Observation Form was used by the Santa Clara County Partnership for School Readiness.12 In such observation procedures, trained observers, typically teachers, assess each child on a number of observ-able skills related to school readiness, including lit-eracy proficiency. However, unlike standardized tests, homegrown procedures do not permit comparisons with children elsewhere in the nation, and they are likely to be less reliable than standardized tests.
Many of the standardized, and even some home-grown, instruments are fairly sophisticated, use special scoring procedures to provide an overall rating of lit-eracy status, and require the cooperation of the school system and its teachers.
Only part of the information on school readiness collected by most of these instruments relates directly to literacy. For example, the Santa Clara data collec-tion form calls for rating 32 skills for each child. Of these, about seven relate directly to literacy. (Other ratings relate to such school readiness skills as motor and social development.)
These instruments typically cover a wide range of skills, and administering them can require con-siderable effort, training, and cost. For communi-ties, literacy coalitions, and preschool programs with more limited resources, some steps can be taken to reduce costs, such as using tests or observations that cover only literacy skills and using homegrown tests or observations that at least have face validity. These shortcuts come with some sacrifices, such as less rich-
11. For a variety of age-specific measurement tools, see Verizon Life Span Literacy Matrix: Relevant Outcomes, Measures and Research-based Practices and Strategies, National Center for Family Literacy, October 2006. 12. School Readiness in Santa Clara County: Result of the 2006 Assessment and a Summary of Three-Year Trends, Santa Clara County Partnership for School Readiness and Applied Survey Research, 2007.

NATIONAL INSTITUTE FOR LITERACy
24
ness of information and reduced reliability (and, per-haps, outside credibility).
For outcome indicator PS 1, the data might be avail-able from the school system. The preschool program would then need to obtain the test scores on its clients, with the permission of the children’s parents, from the school system. Otherwise, the program would need to test children after they complete the program.
Outcome indicator PS 2 requires that the program participants be assessed both at intake and at exit in order to calculate the amount of improvement.
The choice of data collection instruments should be determined jointly by coalition partners, including the service providers.
As noted above, many different preschool literacy measurement instruments are available. It would be very helpful if some national organization pulled together information on them to identify the condi-tions under which each would be useful.
PS 1 and PS 2 can be considered end outcomes. In addition, literacy coalition members and direct service providers will likely find useful intermediate outcome indicators such as the following:
PS 3: Number of preschool children who enrolled in the literacy program.
PS 4: Number and percentage of enrolled pre-school children who completed the program.
PS 5: Number and percentage of enrolled parents who completed the program.
PS 6: Number and percentage of parents who, after program completion, reported spending substantial-ly more time with their children in literacy-related activities, such as reading to and with their children, visiting the library with their children, having more reading materials in the home, or helping school-age children with their homework.
PS 7: Percentage of participating parents who re-
ported that the service provided to them and their children was either excellent or good (not fair or poor) as to its (a) convenience of location and time; (b) quality of the instruction (considering both the tutor and tutoring methods or materials); and (c) helpfulness in improving literacy.
PS 8: Number of preschool children/parents on wait-ing lists for preschool or family literacy programs.
The data for PS 3, PS 4, PS 5, and PS 8 should be available from program records. Programs that do not keep such records should be encouraged by the literacy coalition to at least keep tabulations for these basic indicators.
PS 6 provides information on changes in parenting literacy behavior. The data will need to come from a survey of parents of children in the program. The literacy coalition and programs can design their own survey questionnaire or use an existing one.
The District of Columbia’s William F. Goodling Even
Start Family Literacy program has designed its own
questionnaire to track progress. It addresses such
topics as parents’ reading to/with children. Similarly,
the survey of adult literacy program students devel-
oped by the U.S. Department of Education’s Office
of Vocational and Adult Education includes questions
about parenting literacy behavior. (See questions F-1
through F-6 in Appendix C.) For example, questions
address the amount of time parents spend reading
with children and helping children with homework.
Such questionnaires can provide not only data for the outcome indicator but also parent feedback on service quality for PS 7 and other specific program
GUIDE TO PERFORMANCE MANAGEMENT FOR COMMUNITy LITERACy COALITIONS
25
characteristics, such as the adequacy of teacher home visits, convenience of sessions, and teacher helpful-ness. The questionnaire can also be used to determine the parents’ perception of their child’s literacy prog-ress since the beginning of the program. As noted in the previous section, it is useful to include a question asking parents for their suggestions for improving the program. Section Six provides additional suggestions on implementing client surveys.
PROGRAMS FOR SCHOOL-AGE YOUTHThe community Literacy Coalition again has two poten-tial responsibilities here: (1) to track the overall need in the community and (2) to encourage and help programs serving school-age children in the community to meet this need as effectively as possible and assist with efforts outside the school system, such as tutoring.
For the first responsibility, overall community out-come indicator OC 2 discussed in Section Three can be used to track the need in the community.
School-age literacy programs of special interest to literacy coalitions include such programs as tutoring and family literacy. For family literacy programs that seek to improve parent literacy, the indicators of adult literacy improvement were suggested earlier (under “Adult Literacy Programs”).
The primary school-age (SA) end outcome indi-cators are likely to be ones such as the following:
SA 1: Number and percentage of school-age chil-dren served by the program whose scores on the literacy components of tests had improved signifi-cantly at the end of the program. (The literacy coalition and its partners would need to define “improved significantly.”)
SA 2: Number and percentage of school-age chil-dren served by the program whose scores on the literacy components of tests at the end of the pro-gram placed them at least at the appropriate grade level for their age.
SA 3: Number and percentage of school-age chil-dren served by the program whose teachers, or perhaps parents, or even the students themselves re-ported the participants had improved significantly in their literacy skills after receiving the program’s service—and that the program’s service had been an important factor in that improvement.
The data for SA 1 and SA 2 preferably would come from test scores from the school system. The informa-tion could be based on standardized test scores, supple-mented by also measuring the number and percentage of participants who advanced to the next grade.
A key issue here the ability to access school data without violating confidentiality requirements and without excessive work. Obtaining the data will gen-erally be a matter of building relationships with school district personnel and filling out school district forms.
A major performance indicator for such programs as tutoring will be SA 1, the extent to which scores on literacy tests improved. The typical outcome indicator here usually expressed as the percentage of children whose literacy level was raised by one grade/age level. However, literacy coalitions and, particularly, individual service programs are likely to want to see more detail, such as the amount of improvement in the child’s per-centile and in the parts of the test in which values indicate weaknesses in particular literacy areas.
The program and coalition will need to decide what size numerical increase is needed for the child to count as an assisted/tutored student whose lit-eracy improved significantly (where “significantly” is defined specifically, such as how many percentiles, or other units, of improvement occurred).
The major source of information for SA 3 is feed-back from key participants such as teachers, parents, or the students themselves. This requires surveys of these stakeholders. As with adult education, the Coalition should encourage programs to survey their students at the end of the program or, preferably, sometime

NATIONAL INSTITUTE FOR LITERACy
26
later and, perhaps, assist programs in those surveys. The coalition might provide support in the form of both advice on questionnaire development, mailing (and remailing to nonrespondents) of the question-naires, analysis, and reporting of the findings. The cost of questionnaire administration should be small once the questionnaire has been designed and the proce-dure worked out for administering it, such as whether by mail or phone, or both.
Representatives from a number of coalitions and adult education programs might develop a core ques-tionnaire that could be adapted by many programs and coalitions throughout the country. This would save effort by individual coalitions and enable subse-quent comparative benchmark data across coalitions and adult education programs.
In addition to such end outcome indicators as these, a number of intermediate outcomes will help to interpret what is being accomplished. These include the following indicators:
SA 4: Number of school-age children who en-rolled in the literacy program.
SA 5: Number and percentage of enrolled school-age children who completed the program. SA 6: For family literacy programs, number and percentage of enrolled parents who completed the program.
SA 7: For family literacy programs, number and per-centage of parents who, say, three months after pro-gram completion, reported spending substantially more time with their children in literacy-related activities, such as reading to and with their chil-dren, visiting the library with their children, having more reading materials in the home, and helping school-age children with their homework. SA 8: Percentage of participating students who reported that the service provided to them was either excellent or good (not fair or poor) as to its
(a) convenience of location and time; (b) quality of the tutoring (considering both the tutor and tutoring methods or materials); and (c) helpfulness in improving literacy.
SA 9: Percentage of participating parents who re-ported that the service provided to them and their children was either excellent or good (not fair or poor) as to its (a) convenience of location and time; (b) quality of the instruction (considering both the tutor and tutoring methods or materials); and (c) helpfulness in improving literacy.
SA 10: Total number of (a) school-age children and (b) parents on waiting lists for literacy pro-grams, such as tutoring and family literacy.
Information for SA 4, SA 5, SA 6, and SA 10 should be obtainable from program records. If individual pro-grams are not currently tracking this information, they should be encouraged to do so. For tutoring programs (and indicators such as SA 5), if the program is planned to provide multiyear tutoring to individual students, the measurements can be based on school-year increments.
The information for SA 7, SA 8, and SA 9 can be obtained from the same kind of surveys as used to obtain data for SA 3. These surveys can also provide considerable additional useful information for man-aging these programs.
For example, for a tutoring program, teachers, par-ents, and/or the students can be asked about other characteristics of the help, such as their perceptions of the accessibility of the assistance, the quality of the tutors, the adequacy of the amount of tutoring time provided, and the overall effectiveness of the tutoring.
Similar questions can be asked of parents who have completed family literacy programs, such as about the quality of the assistance they and their children received and about changes in their parenting literacy behavior, such as reading with their children. (For examples, see questions F-1 through F-6 in Appendix C.)

GUIDE TO PERFORMANCE MANAGEMENT FOR COMMUNITy LITERACy COALITIONS
27
In addition, respondents can be asked to identify any problems with the service and to provide sugges-tions for improving the program.
Such surveys do not need to be expensive. For example, contact information should be readily avail-able for students, teachers, or parents. This makes it relatively easy to access respondents. And the ques-tionnaires can be short, taking, say, only five to ten minutes to complete. Section Six provides additional suggestions on implementing client surveys.
WORKFORCE/WORKPLACE LITERACY PROGRAMSBusinesses in the community may have problems finding employees who are sufficiently literate. Workforce pro-grams, including workplace literacy programs, attempt to meet this need. These programs may be funded by individual businesses or coalitions of businesses. For pro-grams operated in a specific workplace, employers are likely to require that employee progress be measured.
The following workforce (WF) outcome indica-tors are relevant to literacy programs that provide workplace services. For workforce programs that draw from employers across the community and those that service persons looking for employment, the outcome indicators listed under “Adult Literacy Programs” should also apply.
WF 1: Number and percentage of employees whose scores improved by “X” amount from the starting level measured on entry into the program (where “X” is chosen by the program).Workplace literacy programs and businesses may also want to use such additional outcome indica-tors as the following:
WF 2: Number and percentage of program par-ticipants who were still employed in their jobs “X” months after completing the program.
WF 3: Number and percentage of program par-ticipants who were promoted to positions requir-
ing greater literacy skills, or took other jobs in the business requiring greater literacy skills, within “X” months after completing the program.
WF 4: Reduction in workplace errors or accidents associated with employee inability to understand signs or written instructions.
The data needed to calculate the above three indi-cators would, of course, need to come from the busi-nesses being served by the program.
As with other types of programs, coalitions and their programs should consider obtaining learners’ views as to the helpfulness of the programs and to provide suggestions for improving the training pro-cess. The following indicators can be used, using sur-veys of the learners after program completion:
WF 5: Number and percentage of (a) program participants and (b) employers of participants who feel the program helped improve employees’ abil-ity to do their job to a large or moderate extent.
WF 6: Number and percentage of employees in the program who reported that the help provid-ed to them was either excellent or good (not fair or poor) as to its (a) convenience of location and time; (b) quality of the instruction (considering both the teacher and teaching materials); and (c) helpfulness in improving literacy.
For workplace literacy programs, administrating a follow-up questionnaire about six months after com-pletion is likely to require less effort than follow-ups in other adult education programs, assuming the busi-ness sponsoring the literacy training wants the infor-mation. The workers participating in the program will likely still be at the workplace, and the questionnaire can be given to them there. The participants would be asked to send the completed form to the office where the responses are to be analyzed.

GUIDE TO PERFORMANCE MANAGEMENT FOR COMMUNITy LITERACy COALITIONS
29
This section suggests outcome indicator and data sources for six common literacy coalition activities:
Providing information on literacy learning oppor-•tunities (programs or services)
Conducting professional development•
Recruiting volunteers•
Disseminating information on best/successful •practices
Coordinating literacy activities among funders, •sponsors, and service providers
Tracking progress in improving literacy in the •community
PROVIDING INFORMATION ON LITERACY LEARNING OPPORTUNITIESMost, if not all, community literacy coalitions have activities aimed at helping people find programs to help them improve their literacy. Such activities include the preparation of directories, telephone referral systems, advertisements in various media such as newspapers and radio, in-person presentations, etc.
How can a literacy coalition assess the extent to which such information services have been useful? For these activities to be successful, first, learners need to become aware of the information. Then they need to enroll in a literacy program. But was the referral a good, helpful referral? This leads to the following learning opportunity (LO) performance indicators:
LO 1: Number and percentage of those needing literacy help who saw or heard about learning op-
portunities through Coalition-sponsored infor-mation activities.
LO 2: Number and percentage of persons who received referrals who contacted at least one of the referrals.
LO 3: Number and percentage of persons seeking information on literacy services who used the infor-mation to enroll in a literacy improvement program.
LO 4: Number and percentage of persons who found the program in which they enrolled had substantially improved their literacy.
How can the coalition obtain data for these indi-cators?
For the first indicator, LO 1, obtaining the infor-mation probably requires participation in a commu-nitywide survey. If the coalition participates in such a survey, additional questions could be included. (Such surveys are desirable for undertaking periodic community literacy needs assessments, as discussed in Section Three.) Respondents would be asked whether they had seen or heard any of the materials generated by the coalition. Some respondents will have trouble remembering the source of the infor-mation they received. However, it is helpful to seek this even if the information is only “roughly right.”
Respondents can also be asked whether they had contacted any of the referrals, enrolled in any of the programs, and, if so, had their literacy substantially improved because of the program. These questions would provide information for performance indica-tors LO 2, LO 3, and LO 4.
SECTION FIVEOutcome Measurement for Other Literacy Coalition Activities

NATIONAL INSTITUTE FOR LITERACy
30
Another procedure for LO 3 is to arrange with programs to ask and record information on where their enrollees had heard of the program and to pro-vide this information to the coalition. This informa-tion can be of considerable help to both the programs and the coalition, not only for tracking success, but also for gaining an understanding of how literacy programs can best reach learners. It is probably best to obtain this information along with other student information collected at enrollment, since students are most likely to remember how they heard of it at that time.
Another procedure for obtaining information for LO 2 and LO 3 applies to coalitions that provide individual referrals to callers and obtain follow-up caller contact information. The coalition would then recontact the caller, say, two weeks later to ask whether the caller had contacted (LO 2) and enrolled (LO 3) in any of the referred programs.
If your coalition makes the initial appointment with the caller but does not track actual enrollment, these counts can be used as a proxy for actual enroll-ment but provide weaker evidence of success.
To obtain information on whether callers had actually been helped to improve their literacy (LO 4), the coalition needs to wait several weeks before contacting callers for that information.
The coalition might call back all, or a random sample of, callers. This would depend on the number of persons to be called and the amount of coalition resources (staff or volunteers) available to make calls.
The follow-up interview can also be used to ask the learners about other aspects of the information and referral service, such as whether they found the information clear and easy to use; whether the infor-mation provided to them was accurate; whether suffi-cient information was provided about programs (such as their location, times services are provided, costs, and for whom the service is targeted); how they would prefer to obtain information about literacy programs; and other suggestions for improving the referral ser-
vice. Such additional information can be a major side benefit of the follow-up effort.
CONDUCTING PROFESSIONAL DEVELOPMENT Professional development is a key activity of use to strengthen capacity of literacy service providers. Professional development attempts to improve the skills of current personnel, such as teachers (whether staff teachers or volunteers), tutors, or other person-nel. Professional development for non-teaching per-sonnel might address such areas as grant writing or marketing.
Many literacy coalitions have programs aimed at improving the capabilities of program personnel and volunteers, and perhaps board members. A basic and relatively simple professional development (PD) per-formance indicator for these activities is:
PD 1: Number and percentage of programs or in-dividuals who received the professional develop-ment who report that the Coalition’s professional development opportunities led them to make changes in their practices.
The word practices should be replaced with wording reflecting the focus of the training in order to tailor the indicator to the particular focus of the training.
The coalition will need to decide whether to obtain feedback from the individuals receiving the professional development service, from a program official, or both. This will depend on the nature of the development program. (If, for example, individu-als scattered across a number of programs attended the training, the feedback would probably best be obtained from those individuals.)
Obtaining information for this and a number of the other indicators should be inexpensive if the Coalition has access to staff or volunteers with com-puter know-how. Depending on the Web-based/e-mail access of respondents, a Web-based/e-mail ques-tionnaire could be sent to all relevant programs and
GUIDE TO PERFORMANCE MANAGEMENT FOR COMMUNITy LITERACy COALITIONS
31
individuals. It is becoming easier to undertake such surveys and even to have the results tabulated and analyzed (such as by using “SurveyMonkey” to help design, collect responses, and tabulate the results). The questionnaire can be mailed to those who do not have ready access to the Internet or who prefer mail.
If the feedback is sought from individuals receiving the training, the follow-up is best done some time (such as three months) after completion of the train-ing to enable the individual to obtain a better per-spective as to the helpfulness of the training.
Feedback from program officials could be requested in the same survey of programs used to obtain data for a number of other coalition outcome indicators. For example, the illustrative questionnaire in Appendix B would provide the needed information for this and other outcome indicators suggested in this section.
In addition to obtaining data for indicator PD 1, the survey questionnaire could ask program offi-cials about their remaining professional development needs and for suggestions for improving the specific type of training provided or coalition professional development services.
Questionnaires for individuals who received train-ing also might ask them to rate specific aspects of training, such as the skills of the trainer, length of training, and adequacy of the facility in which train-ing was provided.
A key question for professional development is “Does the development lead to better outcomes for learners?” Some of this information can come from examining the outcomes of students of those teachers who had received the training, using such outcome indicators as those discussed in Section Four.
The outcomes of students taught by the teacher before the teacher participated in the professional development activity would be compared to the out-comes for students the teacher taught before receiv-ing the development activity. (For this comparison to be reasonably valid, both sets of students should
have approximately the same demographic charac-teristics)
However, this analysis process is probably not fea-sible for coalitions to do on a regular basis, which is needed for a useful performance measurement pro-cess. The analysis would better be done by a special in-depth study.
RECRUITING VOLUNTEERSMany literacy coalitions help recruit volunteers for literacy programs, usually to serve as teachers or tutors. Here are two basic and relatively simple performance indicators for recruiting volunteers (RV):
RV 1: Number of volunteers that the coalition re-cruited who are known to have performed volun-teer work for one or more literacy programs.
RV 2: Number and percentage of programs that report that the coalition’s recruitment efforts had helped them to a substantial extent.
Obtaining information for these indicators should be inexpensive.
For indicator, RV 1, the data would come from the coalition’s own records. However, the coalition needs to have in place a process for following up to ascertain whether the recruited volunteers actually did work for a literacy program.
For indicator RV 2, the same annual survey used for professional development, PD 1, can be used. Depending on the electronic capabilities of the pro-grams, a Web-based/e-mail questionnaire could be sent to all programs. The questionnaire would be mailed to programs that do not have easy access to the Internet or that prefer mail. A potential problem with this indicator is that the programs may not be aware that the volunteer was recruited through the coali-tion, so the findings could understate the amount of the coalition’s recruitment help.
NATIONAL INSTITUTE FOR LITERACy
32
DISSEMINATING INFORMATION ON BEST/SUCCESSFUL PRACTICESAn important function for literacy coalitions is to obtain and disseminate the latest information on successful practices for the program areas it supports (such as adult, preschool, school-age, or workforce programs). This activity may be especially useful for small programs unable to keep up with the latest information coming from such sources as national professional literacy associations, the U.S. Department of Education, and the National Institute for Literacy.
This is another activity for which it is likely to be practical to track only intermediate outcomes. The following best practices (BP) intermediate outcome indicator is likely to be appropriate:
BP 1: Number and percentage of programs to which best/successful practice information was provided that report having used the information to change their procedures.
COORDINATING LITERACY ACTIVITIES AMONG FUNDERS, SPONSORS, AND SERVICE PROVIDERSCoordinating the work in the community for such activities as fund raising, advocacy, recruitment of vol-unteers, and program development is a very impor-tant part of the work of literacy coalitions. Assessing the outcomes can be particularly difficult because of the nebulous meaning of “coordination.”
However, the following indicators would provide at least a rough perspective on the coalition’s perfor-mance on coordination (CO):
CO 1: Number and percentage of coalition mem-bers who reported that the coalition activities had been of substantial help to them.
CO 2: Number and percentage of coalition mem-bers who reported that they found the coalition had helped them substantially improve their ser-vices to persons needing literacy assistance.
CO 3: Number and percentage of coalition mem-bers who reported that the coalition activities had contributed substantially to increasing the amount of resources for improving literacy in the commu-nity in the past year.
The last indicator can also be used for the advocacy function of literacy coalitions.
In addition to the three outcomes above, each coalition can identify other important outcomes that should be measured. Identifying such other out-comes should be one of the purposes of the process described in Section Two (selecting the outcomes to be tracked).
The information for all these indicators can be obtained from a survey of coalition members. The survey procedure discussed above for professional development and teacher/volunteer recruitment can be used. The major difference here is that the uni-verse of coalition partners will likely include other types of organizations (such as governments, local foundations, and other interest groups), not just pro-grams proving direct services to learners. The version of the questionnaire sent to non-service provider organizations should include only those questions applicable to them.
Note that these surveys can provide information beyond that needed to calculate these indicators. The coalition and its partners may want to include other, perhaps more detailed, questions about spe-cific coalition activities in order to obtain opinions as to the best way to communicate among the partners and on the quality of specific materials provided by the coalition.
TRACKING PROGRESS IN IMPROVING LITERACY IN THE COMMUNITYAll literacy coalitions should probably track prog-ress. This work can include both tracking commu-nitywide progress (addressed in Section Three) and
GUIDE TO PERFORMANCE MANAGEMENT FOR COMMUNITy LITERACy COALITIONS
33
the coalition’s work in helping to track outcomes of specific literacy programs (addressed in Section Four). The success of this activity itself should be tracked. It might be measured in part by intermedi-ate outcomes for tracking literacy (TL), such as the following:
TL 1: Number and percentage of programs that report that the coalition’s assistance on tracking literacy progress has been useful to them in im-proving their literacy services.
TL 2: Number and percentage of programs that report that the coalition’s assistance with tracking literacy progress has helped them obtain resources for their work.
The information for these indicators can be obtained from the same survey of programs used for a number of previous outcome indicators. Obtaining this information should add little cost and effort (pri-marily for the small amount of time needed for the additional analysis).


GUIDE TO PERFORMANCE MANAGEMENT FOR COMMUNITy LITERACy COALITIONS
35
Many outcome indicators require a survey of “cus-tomers” to obtain the necessary information for the indicator. Here we discuss some of the special issues involved in such survey work. Regular annual surveys are likely to be an unfamiliar task for many coalitions.
MODE OF ADMINISTRATION The questionnaire can be administered by telephone, mail, Internet/e-mail, or a combination of these options. Responding to mail and Internet question-naires requires at least some literacy. The persons pre-paring the questionnaire must, of course, make sure that the wording is likely to be understandable to most of the potential respondents. This is primarily a consideration for questionnaires directed to recipi-ents of literacy services.
For programs (such as adult education) where sub-stantial numbers of clients have English as a second language, questionnaires for service recipients may need to be translated into their language. The ques-tionnaire should be translated into any language spo-ken by a significant number of respondents who are expected to have problems with the English version.
To obtain a credible response rate, one sending, one mailing, or one telephone call will seldom be sufficient. It is recommended that a response rate of at least 50 percent be the target.
COSTThe cost of surveys of organizations, such as programs providing direct services to learners or other part-ner organizations, should be small, especially if the Internet can be used to transmit the questionnaire and then tabulate the responses. Additional distribu-
tion of the questionnaire (by mail, phone, or e-mail) to obtain an adequate response rate will add to the cost of surveys.
The main problem for the coalition and for the service programs is the cost of surveys of learners and parents (or teachers).
Here are a number of ways to reduce the costs of surveys and simultaneously maximize the response rate:
Use the Internet whenever possible to administer •surveys to organizations.
Use a mail questionnaire when feasible, rather than •telephone or in-person interviews.
If the outcome information can be obtained at the •time that the learner completes the service, the written questionnaire can be administered directly to the learner at that time. However, the ques-tionnaire should be filled out by the respondent so that the responses are completely anonymous. (For example, have the respondent place the ques-tionnaire into a sealed box so that the respondent does not need to be concerned about a particular service provider knowing who gave the informa-tion.)
Keep the questionnaire short. In most cases, a one-•page, two-sided questionnaire should be sufficient. (But avoid overcrowding the questionnaire.) The questionnaire preferably should be of a length to be completed within ten minutes. This will save preparation cost and analysis time as well as encourage completion.
For mail surveys, include a self-addressed, stamped •return envelope. Note, however, that more than
SECTION SIXIssues In Using Surveys
NATIONAL INSTITUTE FOR LITERACy
36
one mailing will be needed to obtain adequate response rates. Plan for at least two and preferably three mailings.
Make the questionnaire as easy to complete and as •attractive as possible.
Use community volunteers where possible to •help with the survey process. Retirees might be interested in helping. Volunteers from a college or university might help design the questionnaire to ensure that it is properly worded and unbiased. Volunteers can help in preparing the mailings and in analyzing and preparing a report on the find-ings. Volunteers can sometimes also administer the questionnaire by phone or in person. However, interviewers will need to be given adequate train-ing in proper interviewing techniques so respon-dents are not encouraged to answer in a particular way or are not put off by the interviewer.
For example, the Washington (D.C.) Literacy
Council, an adult literacy program, has used pro-
gram students who are members of its Student
Advisory Board to administer an annual telephone
survey of program participants near the end of the
year. The survey includes a question, “How is it
going with your tutor?” that seeks information on
participant satisfaction with their tutors. The survey
also asks for comments or suggestions about the
program. (Section Eight provides examples of how
the council has used survey information.)
Attach a short transmittal letter from someone •likely to be known to and respected by respon-dents. Emphasize that the findings will be used to help improve future services to future learners.
Notify learners • while in the program that they will later be asked to complete a short question-naire on their experience in the program. Then encourage them to complete the questionnaire. This will help decrease the number of follow-up administrations needed to get an acceptable response rate.
Solicit donations from local businesses to provide •incentives to respondents to complete and return the questionnaire. (The incentives should be in the form of goods or services rather than money.)
For the outcome indicators in Section Three, if •the community already has a regular survey of its citizens, seek to add questions to that survey. (More and more local governments are beginning to sur-vey their citizens on a regular basis.)
QUESTIONNAIRE CONTENTMost questions on these surveys should be “closed-ended.” That is, each question includes a set of two to five specific response category options, from which the respondent selects one. Such questions are sim-pler, take less time to answer, and are easier to ana-lyze than “open-ended” questions. However, consider asking respondents at the end of the questionnaire to provide suggestions for improving the program. Analyzing the responses will add work, but the infor-mation can often be quite helpful in identifying pro-gram improvements.
QUESTIONNAIRE ACCURACYSelf-reports on literacy from survey respondents, whether obtained from the federal American Community Survey or a local household survey, will not be as accurate as data from tests. However, rather than having no recent estimates, use respondent perceptions of their own literacy level (and that of their family members). Remember, “It is better to be roughly right than precisely ignorant.”
GUIDE TO PERFORMANCE MANAGEMENT FOR COMMUNITy LITERACy COALITIONS
37
SPECIAL SURVEY PROBLEMSThree special problems arise with customer surveys:
When should the follow-up questionnaire be •administered? It is tempting to administer the questionnaire at the last session of the program service. This timing, however, may not provide enough time for students to assess the extent to which they have actually been helped and to have a better perspective on the good (and not so good) aspects of their learning experience. Therefore, it is better to survey students several weeks after completion of the program, such as one to three months afterwards. A problem here is that some students will have moved, leading to a reduced response rate.
A single attempt to get respondents to complete •the questionnaire is not likely to yield sufficiently high response rates (such as 50 percent) for the information to be fully credible or sufficiently
valid. It will almost certainly be necessary to follow up the initial survey request with at least one or two additional requests. This adds to the effort and cost but is be essential for credibility and validity.
Note, however, that the surveys or program cus-tomers suggested in this guide have the advantage that the persons surveyed will usually know and likely trust the organization sponsoring the survey and, thus, are more likely to respond.
Finding staff time to administer and re-administer •the questionnaire may be difficult for individual programs. An option, as noted earlier, is to seek help from community volunteers to help with these tasks. Local universities and colleges might help as well.
Another option, as noted in Exhibit 4-1, is for the coalition itself, if it has sufficient resources, to support some of this work for the programs. The economies of scale realized should considerably reduce the cost per program.

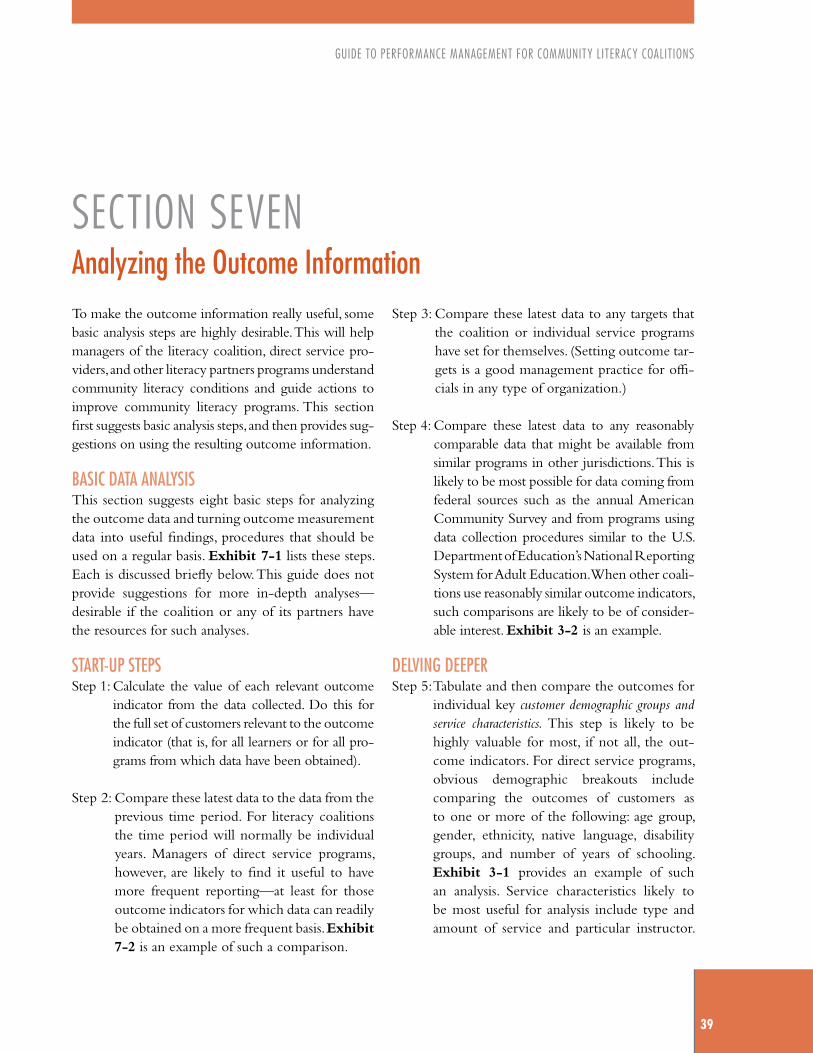
GUIDE TO PERFORMANCE MANAGEMENT FOR COMMUNITy LITERACy COALITIONS
39
To make the outcome information really useful, some basic analysis steps are highly desirable. This will help managers of the literacy coalition, direct service pro-viders, and other literacy partners programs understand community literacy conditions and guide actions to improve community literacy programs. This section first suggests basic analysis steps, and then provides sug-gestions on using the resulting outcome information.
BASIC DATA ANALYSISThis section suggests eight basic steps for analyzing the outcome data and turning outcome measurement data into useful findings, procedures that should be used on a regular basis. Exhibit 7-1 lists these steps. Each is discussed briefly below. This guide does not provide suggestions for more in-depth analyses—desirable if the coalition or any of its partners have the resources for such analyses.
START-UP STEPSStep 1: Calculate the value of each relevant outcome
indicator from the data collected. Do this for the full set of customers relevant to the outcome indicator (that is, for all learners or for all pro-grams from which data have been obtained).
Step 2: Compare these latest data to the data from the previous time period. For literacy coalitions the time period will normally be individual years. Managers of direct service programs, however, are likely to find it useful to have more frequent reporting—at least for those outcome indicators for which data can readily be obtained on a more frequent basis. Exhibit 7-2 is an example of such a comparison.
Step 3: Compare these latest data to any targets that the coalition or individual service programs have set for themselves. (Setting outcome tar-gets is a good management practice for offi-cials in any type of organization.)
Step 4: Compare these latest data to any reasonably comparable data that might be available from similar programs in other jurisdictions. This is likely to be most possible for data coming from federal sources such as the annual American Community Survey and from programs using data collection procedures similar to the U.S. Department of Education’s National Reporting System for Adult Education. When other coali-tions use reasonably similar outcome indicators, such comparisons are likely to be of consider-able interest. Exhibit 3-2 is an example.
DELVING DEEPERStep 5: Tabulate and then compare the outcomes for
individual key customer demographic groups and service characteristics. This step is likely to be highly valuable for most, if not all, the out-come indicators. For direct service programs, obvious demographic breakouts include comparing the outcomes of customers as to one or more of the following: age group, gender, ethnicity, native language, disability groups, and number of years of schooling. Exhibit 3-1 provides an example of such an analysis. Service characteristics likely to be most useful for analysis include type and amount of service and particular instructor.
SECTION SEVENAnalyzing the Outcome Information
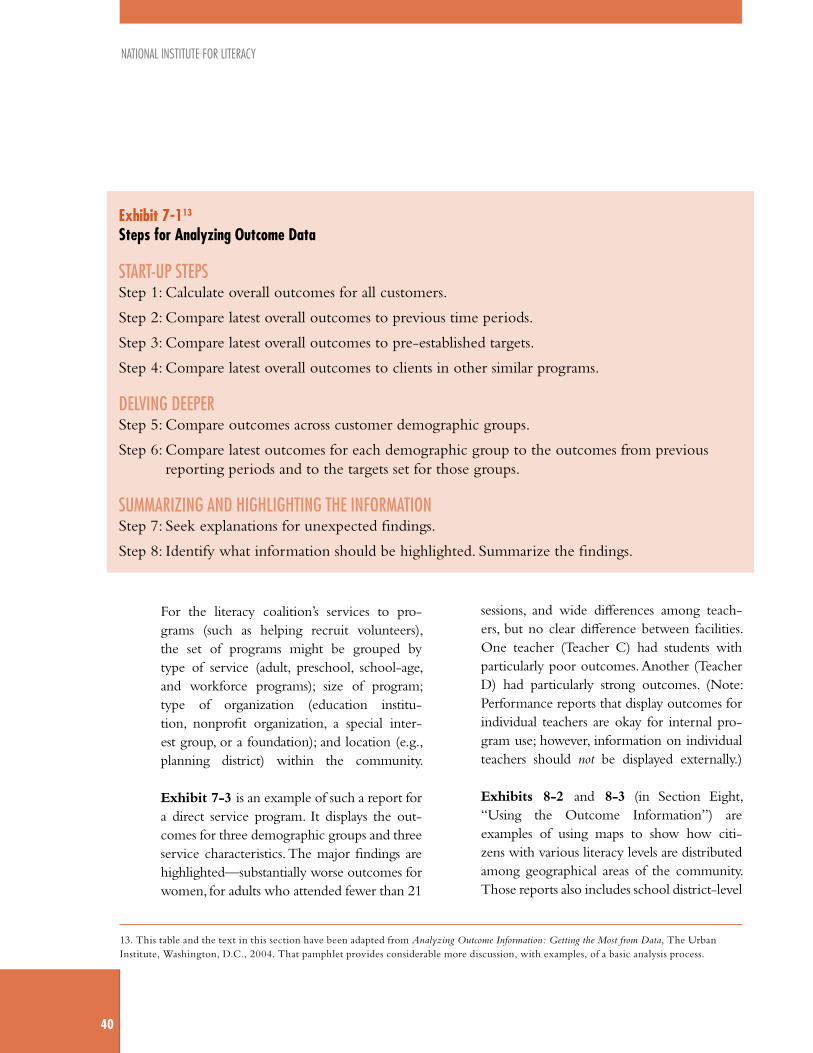
NATIONAL INSTITUTE FOR LITERACy
40
For the literacy coalition’s services to pro-grams (such as helping recruit volunteers), the set of programs might be grouped by type of service (adult, preschool, school-age, and workforce programs); size of program; type of organization (education institu-tion, nonprofit organization, a special inter-est group, or a foundation); and location (e.g., planning district) within the community. Exhibit 7-3 is an example of such a report for a direct service program. It displays the out-comes for three demographic groups and three service characteristics. The major findings are highlighted—substantially worse outcomes for women, for adults who attended fewer than 21
sessions, and wide differences among teach-ers, but no clear difference between facilities. One teacher (Teacher C) had students with particularly poor outcomes. Another (Teacher D) had particularly strong outcomes. (Note: Performance reports that display outcomes for individual teachers are okay for internal pro-gram use; however, information on individual teachers should not be displayed externally.) Exhibits 8-2 and 8-3 (in Section Eight, “Using the Outcome Information”) are examples of using maps to show how citi-zens with various literacy levels are distributed among geographical areas of the community. Those reports also includes school district-level
exhibit 7-113 steps for analyzing outcome data
START-UP STEPSStep 1: Calculate overall outcomes for all customers.
Step 2: Compare latest overall outcomes to previous time periods.
Step 3: Compare latest overall outcomes to pre-established targets.
Step 4: Compare latest overall outcomes to clients in other similar programs.
DELVING DEEPERStep 5: Compare outcomes across customer demographic groups.
Step 6: Compare latest outcomes for each demographic group to the outcomes from previous reporting periods and to the targets set for those groups.
SUMMARIZING AND HIGHLIGHTING THE INFORMATION Step 7: Seek explanations for unexpected findings.
Step 8: Identify what information should be highlighted. Summarize the findings.
13. This table and the text in this section have been adapted from Analyzing Outcome Information: Getting the Most from Data, The Urban Institute, Washington, D.C., 2004. That pamphlet provides considerable more discussion, with examples, of a basic analysis process.
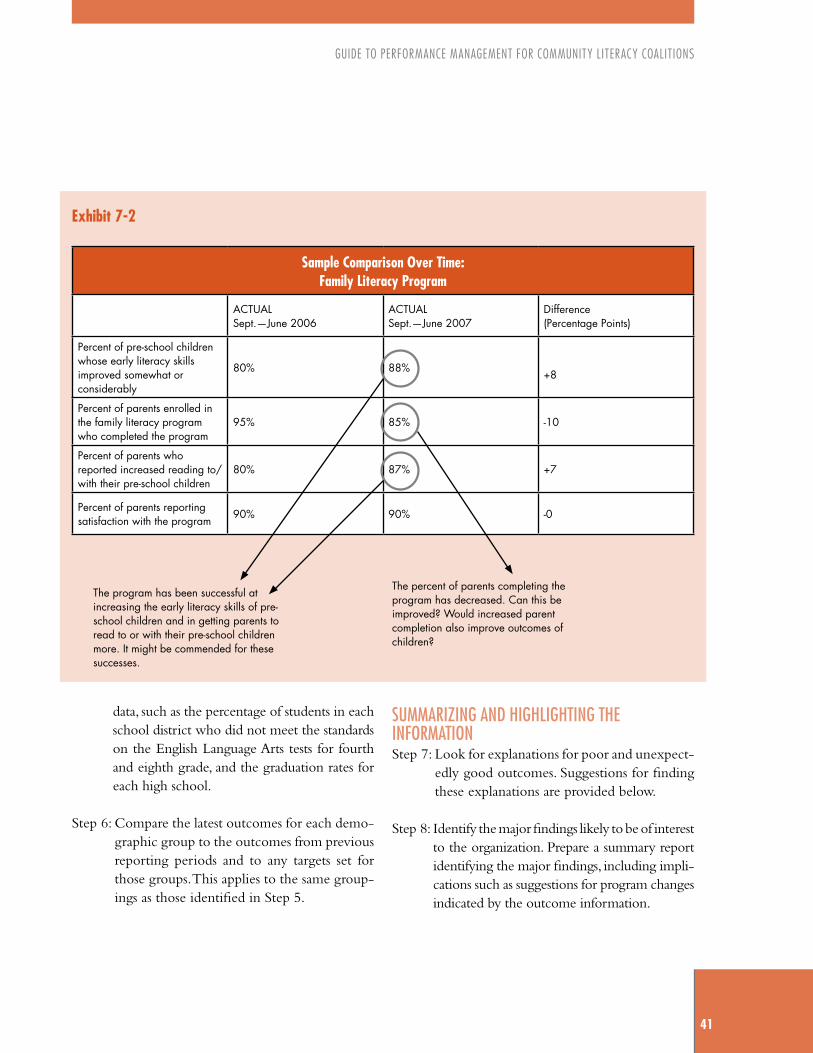
GUIDE TO PERFORMANCE MANAGEMENT FOR COMMUNITy LITERACy COALITIONS
41
data, such as the percentage of students in each school district who did not meet the standards on the English Language Arts tests for fourth and eighth grade, and the graduation rates for each high school.
Step 6: Compare the latest outcomes for each demo-graphic group to the outcomes from previous reporting periods and to any targets set for those groups. This applies to the same group-ings as those identified in Step 5.
SUMMARIZING AND HIGHLIGHTING THE INFORMATION Step 7: Look for explanations for poor and unexpect-
edly good outcomes. Suggestions for finding these explanations are provided below.
Step 8: Identify the major findings likely to be of interest to the organization. Prepare a summary report identifying the major findings, including impli-cations such as suggestions for program changes indicated by the outcome information.
exhibit 7-2
sample Comparison over time: family Literacy Program
ACTUAL Sept —June 2006
ACTUAL Sept —June 2007
Difference (Percentage Points)
Percent of pre-school children whose early literacy skills improved somewhat or considerably
80% 88%+8
Percent of parents enrolled in the family literacy program who completed the program
95% 85% -10
Percent of parents who reported increased reading to/with their pre-school children
80% 87% +7
Percent of parents reporting satisfaction with the program
90% 90% -0
The program has been successful at increasing the early literacy skills of pre-school children and in getting parents to read to or with their pre-school children more It might be commended for these successes
The percent of parents completing the program has decreased Can this be improved? Would increased parent completion also improve outcomes of children?

NATIONAL INSTITUTE FOR LITERACy
42
The literacy coalition would likely prepare such a report annually. (It could be used as the basis for an annual “State of Literacy in Our Community” report.)
Individual service programs would provide such a report after each outcome report it produces, whether yearly, semiannually, quarterly, etc. This report would likely be for use internally by the staff and board. The program might also choose to prepare a version of the report for its funders and one for the public on the results of its work.
SEEKING EXPLANATIONS FOR OUTCOMESA key purpose of outcome information is to raise questions. Reviewing the outcome data report should lead to discussions of what is happening and why. Coalitions and direct service programs should seek explanations for either unexpectedly good or poor outcomes before taking any actions. Explanations can provide important insights to help guide what needs to be done to improve future literacy outcomes.
The causes of unexpected outcomes can be both external and internal factors. For example, exter-nal changes in local economic conditions can affect employment opportunities for graduates of adult or workforce literacy programs. A substantial increase in recent immigrants who speak little English will likely decrease the literacy level in the areas in which they live, and likely in the community as a whole. Internal factors include unexpected personnel illnesses or turnover and changes in funding.
Following are ways that coalitions or the direct service programs might obtain explanations.
Hold “How Are We Doing?” meetings (group •discussions) with staff to discuss reasons for the outcomes.
Form a working group to examine the issue. For ser-•vice programs, the working groups might be drawn from staff and volunteers. For coalitions, working group members could be drawn from coalition partner organizations and other literacy programs.
Consider including others with expertise in the particular aspect of literacy or type of programming being examined, such as school readiness or adult basic education for English language learners.
Working groups would be used if more time is needed •to explore the reasons for particular outcomes. For example, if literacy outcomes are particularly poor in specific areas of the community, a working group might explore factors affecting literacy in that area, such as whether literacy services are provided in that area, availability of public transportation, or use of advertising and outreach in the languages spoken by the population needing literacy services.
Hold focus groups to obtain insights from custom-•ers. Typically, a small number (about six to twelve) of current and/or former customers are invited to a 90- to 120-minute session to discuss the issue at a time and place convenient for them.
Consider holding separate groups of samples of service providing staff, literacy volunteers, literacy program clients, and those in need of literacy services who are not currently receiving them.
Review responses to open-ended questions in •community surveys that ask respondents for rea-sons for any poor ratings they gave or for sugges-tions for improvements.
If customers are asked to rate specific service char-•acteristics (such as waiting times, helpfulness of staff, adequacy of information on the program, and loca-tion/accessibility of the facility), their answers may provide clues to why outcomes are not as expected.
Consider sponsoring an in-depth evaluation if the •above steps are not sufficient to identify explana-tions, if findings are particularly important, and if resources are available. An outside, in-depth evalua-tion will likely take considerable effort and require special funding unless volunteers or free help from a local college are available.
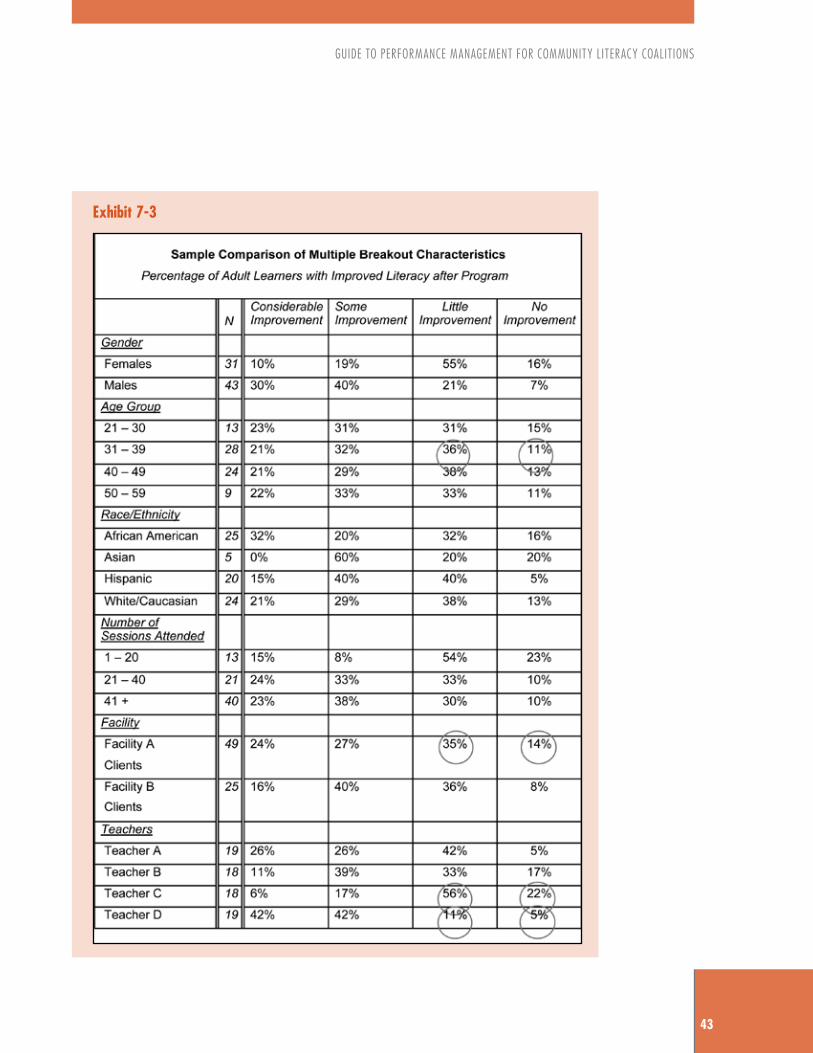
GUIDE TO PERFORMANCE MANAGEMENT FOR COMMUNITy LITERACy COALITIONS
43
exhibit 7-3

GUIDE TO PERFORMANCE MANAGEMENT FOR COMMUNITy LITERACy COALITIONS
45
Outcome measurement by itself accomplishes little. It comes alive when the information is used—especially to help improve literacy in the community services, and not only for satisfying funders. If the outcome information is not useful or used, the data collection effort will have been wasted.
Exhibit 8-1 identifies major basic uses for out-come information. Each type of use is discussed in this section. Most of these uses appear to be applicable to both the Literacy Coalition and to individual lit-eracy direct service programs.
IDENTIFY NEEDED IMPROVEMENTSUse 1. Identify overall community literacy level/needs for literacy services
An important role for literacy coalitions is to track community literacy levels. This task also contributes to identifying the level of need for literacy services in the community. (Specific suggestions on obtaining this information are presented in Section Three.)
This information has the important role of help-ing the coalition and its partners identify what services are most needed, where, and for whom. A number of
SECTION EIGHTUsing the Outcome Information
exhibit 8-1uses for outcome information IDENTIFY NEEDED IMPROVEMENTS Use 1. Identify overall community literacy level/needs for literacy services. Use 2. Identify progress being made by individual literacy programs. Use 3. Identify service procedures or policies that need improvement.
MOTIVATE AND HELP STAFF AND VOLUNTEERS Use 4. Provide a basis for regular staff program reviews. Use 5. Identify training and technical assistance needs. Use 6. Provide recognition to programs, staff, and volunteers for good outcomes.
IDENTIFY WHAT WORKS Use 7. Identify and disseminate successful practices (best practices). Use 8. Test program changes or new programs.
DEMONSTRATE ACCOUNTABILITY TO THE BOARD, FUNDERS, AND THE PUBLIC Use 9. Inform board members.Use 10. Inform current and potential funders. Use 11. Report to the community.
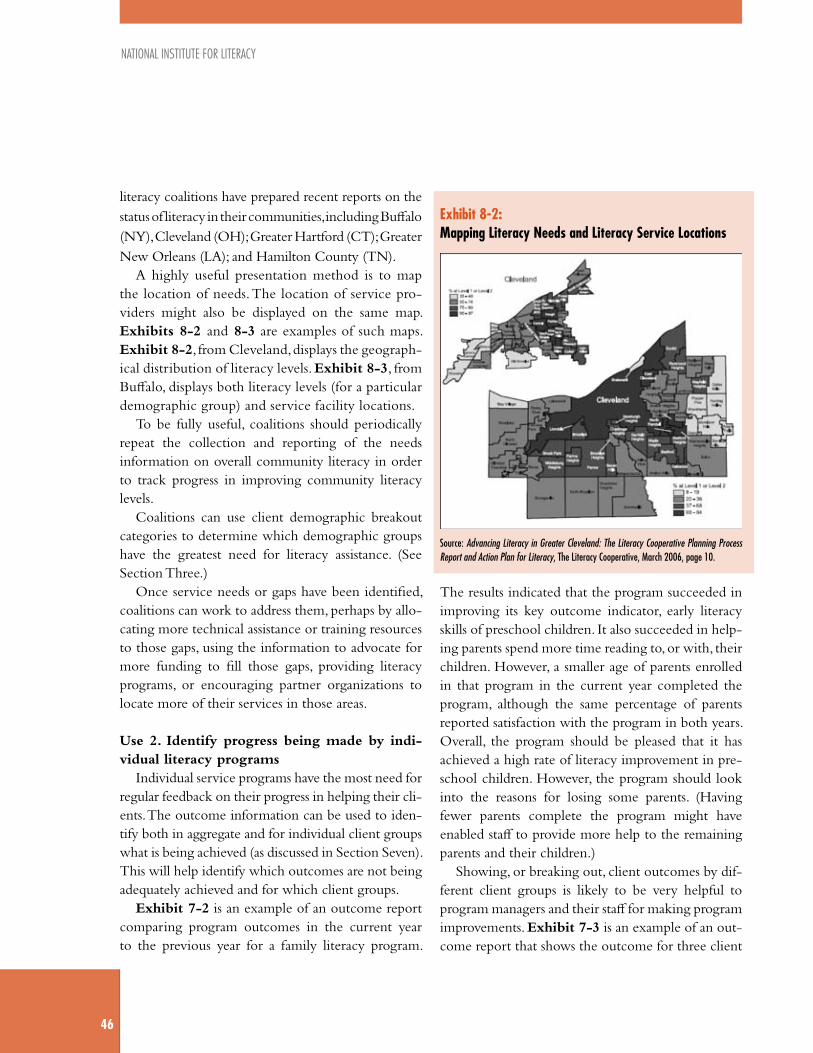
NATIONAL INSTITUTE FOR LITERACy
46
literacy coalitions have prepared recent reports on the status of literacy in their communities, including Buffalo (NY), Cleveland (OH); Greater Hartford (CT); Greater New Orleans (LA); and Hamilton County (TN).
A highly useful presentation method is to map the location of needs. The location of service pro-viders might also be displayed on the same map. Exhibits 8-2 and 8-3 are examples of such maps. Exhibit 8-2, from Cleveland, displays the geograph-ical distribution of literacy levels. Exhibit 8-3, from Buffalo, displays both literacy levels (for a particular demographic group) and service facility locations.
To be fully useful, coalitions should periodically repeat the collection and reporting of the needs information on overall community literacy in order to track progress in improving community literacy levels.
Coalitions can use client demographic breakout categories to determine which demographic groups have the greatest need for literacy assistance. (See Section Three.)
Once service needs or gaps have been identified, coalitions can work to address them, perhaps by allo-cating more technical assistance or training resources to those gaps, using the information to advocate for more funding to fill those gaps, providing literacy programs, or encouraging partner organizations to locate more of their services in those areas.
Use 2. Identify progress being made by indi-vidual literacy programs
Individual service programs have the most need for regular feedback on their progress in helping their cli-ents. The outcome information can be used to iden-tify both in aggregate and for individual client groups what is being achieved (as discussed in Section Seven). This will help identify which outcomes are not being adequately achieved and for which client groups.
Exhibit 7-2 is an example of an outcome report comparing program outcomes in the current year to the previous year for a family literacy program.
The results indicated that the program succeeded in improving its key outcome indicator, early literacy skills of preschool children. It also succeeded in help-ing parents spend more time reading to, or with, their children. However, a smaller age of parents enrolled in that program in the current year completed the program, although the same percentage of parents reported satisfaction with the program in both years. Overall, the program should be pleased that it has achieved a high rate of literacy improvement in pre-school children. However, the program should look into the reasons for losing some parents. (Having fewer parents complete the program might have enabled staff to provide more help to the remaining parents and their children.)
Showing, or breaking out, client outcomes by dif-ferent client groups is likely to be very helpful to program managers and their staff for making program improvements. Exhibit 7-3 is an example of an out-come report that shows the outcome for three client
Source: Advancing Literacy in Greater Cleveland: The Literacy Cooperative Planning Process Report and Action Plan for Literacy, The Literacy Cooperative, March 2006, page 10
exhibit 8-2: mapping Literacy needs and Literacy service Locations

GUIDE TO PERFORMANCE MANAGEMENT FOR COMMUNITy LITERACy COALITIONS
47
demographic groupings—gender, age, and race/eth-nicity. As discussed earlier, the difference between genders is major. It indicates the need for the program manager and staff to examine why this is occurring and determine what, if any, actions are needed.
After actions have been taken and performance reports are available, the program can then check to determine the extent to which the actions have improved the results.
Coalitions can use outcome information from individual service programs to identify programs that need help in achieving outcomes, including, for example, offering training and technical assistance and volunteer recruitment help.
If the coalition obtains outcome reports from direct service providers, it can use the information to identify patterns of success and weaknesses. The reports from the service providers might, for example, indicate difficulties in helping certain race/ethnicity groups, age groups, or income groups.
Finally, the coalition might use the information as a basis for community recognition awards (discussed further below).
Use 3. Identify service procedures or policies that need improvement
At the program level, outcome information can be used to help identify service procedures or policies that need improvement, such as need for additional training. The program should record data on the out-comes for each individual and on the particular ser-vice characteristics applicable to that client. Then a computer can be used to tabulate the outcomes by service characteristic. For example, the service pro-gram can then examine such elements as these:
The success of each particular office or facility;•
The amount of service (such as number and length •of sessions) that is associated with successful out-comes for different categories of clients;
The particular service delivery practice/procedure •(such as group classes compared to individual tutor-ing sessions, use of computer learning modules, type of instructional materials used) that is associated with successful outcomes for different categories of cli-ents; and
The success of individual staff members or volun-•teers providing the service in producing successful outcomes for different categories of clients.
Exhibit 7-3 displays outcomes by a number of service, as well as client, characteristics. The exhibit highlights major findings on service characteristics—
Source: Buffalo Literacy Campaign Needs Assessment: Buffalo Reads, Center for Governmental Research Inc , April 2006, Map 6
exhibit 8-3: mapping Literacy needs and Literacy service Locations
NATIONAL INSTITUTE FOR LITERACy
48
substantially worse outcomes for those who attended fewer sessions.
Outcome reports identify important issues to be addressed by program staff. In this example, why did some clients attend fewer sessions, why were the results of the one teacher so poor and another so good, and why did females fare so much worse than males? (It could, for example, have been that Teacher C was assigned primarily to females, for whom this program is not well designed.)
MOTIVATE AND HELP STAFF AND VOLUNTEERSCoalitions can use community-level outcome
information to motivate and help partners and indi-vidual programs that provide services.
For services the coalition provides, such as referral services or professional development services, the coali-tion can use outcome information to motivate and help those directly engaged in providing the service.
Individual programs can use the information to encourage staff members and volunteers on the front line to strive for continuous service improvement.
Use 4. Provide a basis for regular staff program reviews
Perhaps no other procedure is as important or effective in involving program staff and volunteers in seeking service improvements as regular program reviews, or “How Are We Doing?” meetings.
Such meetings are held soon after preparing the peri-odic outcome report. Provide the latest outcome data to participants in advance of the meeting. Highlight potential problems and successes—perhaps using circles or color highlighting on the reports to help start the discussion (as done in Exhibits 7-2 and 7-3).
Managers and staff should review where outcomes have been especially good and where they have fallen short. If results have been very good, the group should discuss why this occurred and if particular service procedures are believed to have been responsible for
the outcomes. The group can discuss expanding these practices to other programs, facilities, or staff.
Program managers of the Washington (D.C.) Literacy
Council (a direct service provider) meet to review
the responses to the program’s annual survey of
its adult basic education learners. Several changes
emerged from these reviews in recent years. For
example, significant numbers of tutored students
reported they were not getting enough learning
time. Program staff brainstormed ways to increase
opportunities and decided to offer basic and inter-
mediate “classes” led by volunteers in addition to
the tutoring sessions.
Because many respondents reported they needed
help pronouncing words, the program began placing
more emphasis on pronunciation.
Because many students reported they wanted to
find jobs, or better jobs, the program begin provid-
ing individual assistance with resume-writing and
job search skills.
Program reviews are also an opportunity for rec-ognizing the staff members and volunteers who con-tributed to successes.
After subsequent performance reports become avail-able, the group should assess whether previous actions rec-ommended by the group actually improved outcomes.
GUIDE TO PERFORMANCE MANAGEMENT FOR COMMUNITy LITERACy COALITIONS
49
Use 5. Identify training and technical assistance needs
Coalitions can use community-level outcome infor-mation to identify areas in which partner programs need training or technical assistance. Coalitions may be able to provide that training or assistance or identify other sources programs can access to obtain help.
Individual programs can use outcome information to identify training and technical assistance needs of individual staff members or groups of staff—such as all program staff at a facility with the poorest outcomes.
The Washington (D.C.) Literacy Council has used
learner survey responses to identify needs for train-
ing and technical assistance. The program manager
has provided individual technical assistance in some
cases to help tutors improve their tutoring methods.
Use 6. Provide recognition to programs, staff, and volunteers for good outcomes
Celebrate good outcomes! When outcome information identifies high performance or major improvements in achieving outcomes, coalitions and programs should consider recognizing those who contributed. Recognition itself is a type of reward and can motivate program staff and volunteers. Outcome information serves as an unbiased way to determine who should receive the recognition.
The Literacy Council of Bonita Springs, Florida (a
direct service provider), recognizes achievements of
students in its adult literacy program in its newslet-
ter. The names of students who have advanced a
reading level, and those who have graduated from a
particular class level, are listed in a column headed
“Congratulations, Successful Students.” The names
of their tutors or teachers are listed along with stu-
dents. The program also provides certificates to stu-
dents who advance a reading level. The program
director feels such recognition helps motivate stu-
dents and tutors by demonstrating that the program
is proud of their accomplishments.14
Coalitions might recognize partner programs with high levels of outcomes.
Individual literacy programs should consider rec-ognizing groups or individual staff members or vol-unteers. In either case, recognition should be based on sustained high level of outcomes, not those achieved in one reporting period. Organizations should be recognized for achieving substantial improvements in outcomes, not only high levels of outcomes.
IDENTIFY WHAT WORKSUse 7. Identify and disseminate successful prac-tices (best practices)
Outcome information is vital for identifying suc-cessful service practices.
The coalition can work with programs that have been achieving high levels of outcomes to identify the practices that explain the success. The coalition should then disseminate information on these prac-tices to other programs through training sessions or other means, such as newsletter articles. Coalitions also can have a major role in using some of their resources to identify successful practices elsewhere in
14. The Lamplighter, quarterly newsletter of the Literacy Council of Bonita Springs (April, May, June 2006) www.bonitaliteracy.org; and telephone interview with Susan Acuna, executive director of the Literacy Council of Bonita Springs, November 2, 2007.
NATIONAL INSTITUTE FOR LITERACy
50
the country, identifying practices that appear appli-cable to the community’s own situation.
Caution: Before deciding that particular practices have been highly successful, check for factors that might have influenced the findings. For example, some programs might have been serving learners who are relatively easy to help. Thus, the practices found in those programs may not be helpful for programs with a different mix of clients. This is another reason for examining outcomes broken out by client demographic characteristics.
A similar approach can be used within individual programs. When the outcome data indicate that par-ticular service procedures are associated with espe-cially high outcome levels, program managers should attempt to identify what those staff were doing that would explain their high success rates and then deter-mine whether those practices can be replicated by other staff. Managers might ask staff members with better outcomes to make a presentation at a staff meet-ing. Program managers also might notify the coalition of practices they feel are successful for possible dis-semination to other programs in the community.
The program manager of the Even Start Family
Literacy Program operated by the District of Columbia
Public Schools used outcome information identifying
one site as having better outcomes than the other to
designate that site as a “model” program. That pro-
gram provides training and technical assistance to new
programs. Other programs are encouraged to contact
this program for ideas on improving their programs.
Exhibit 8-4 is an example of using outcome data on student gain scores to compare the effects of the program’s short and long program variations for learn-ers with two different educational levels at program entry. As indicated in the exhibit, the data provide strong evidence that (a) learners with less education should be given the long program; and (b) if it would save significant amounts of the program’s resources, learners with more education should be encouraged to use the short program (which is expected to have about the same success rate).
Use 8. Test program changes or new programsA Coalition or program that regularly collects
outcome information can test the effectiveness of program changes before full implementation. One important role for coalitions to take on is to help coalition partners “pilot test” new programs.
The Greater Hartford Literacy Council tested a
pilot workforce literacy project that integrated
basic education and job-related skills with case
management for people with low literacy skills
who were receiving Temporary Family Assistance.
The pilot program was implemented at two sites
operated by different organizations. The Coalition
used a consultant to develop the program and
provide technical assistance to the two organi-
zations that implemented the pilot program.
Outcome information was collected on partici-
pants at each site before and after participation
in the program. A participant survey asked which
program features were most helpful, and if the

GUIDE TO PERFORMANCE MANAGEMENT FOR COMMUNITy LITERACy COALITIONS
51
program helped increase participants’ job skills.
The Coalition used the results to develop a series
of recommendations related to workforce literacy
programming.15
Individual literacy programs also can test the effects of, for example, different operating procedures, staff-ing arrangements, instructional content, amounts of service provided to individual clients, and ways to present information. Such testing can encourage staff
creativity and innovation. Two types of testing proce-dures can be used:
Replace the old practice with the new one for a period •of time. The outcome data can be used to evaluate the effect of the change—whether outcomes were improved and, thus, whether the change should be made permanent. To use this procedure, data on outcomes are needed for periods of time both before and after the change.
Implement the new service practice for some clients •but not for others. This approach is less commonly
15. This example is drawn from Take Action for Literacy: The TANF Workforce Literacy Pilot Project, The Greater Hartford Literacy Council, Hartford, CT,undated, www.greaterhartfordreads.org.
exhibit 8-4: example of an outcome analysisFor the Outcome “Clients Achieving One Grade Level Improvement”

NATIONAL INSTITUTE FOR LITERACy
52
used, but it can provide considerably stronger evi-dence. When this approach is used, the clients in both groups must be similar in important char-acteristics that might affect their outcomes. This is to maximize the likelihood that differences in outcomes occur because of the change and not because of client characteristics. If clients can be randomly assigned to the new procedure, the two client groups are much more likely to be similar. To do this, a systematic way of assigning a client to each group needs to be used, such as flipping a coin or assigning every other new client to the new procedure. The program will need to record which clients are assigned to which procedure and tabulate the values on each outcome for clients in each group.
Whatever testing approach is used, it may take some time for the new procedure to show results. Differences in some outcomes, such as client sat-isfaction, might appear soon, while others, such as improved test scores with a new tutoring approach, might take several months or more to appear.
DEMONSTRATE ACCOUNTABILITY TO THE BOARD, FUNDERS, AND THE PUBLICOutcome information is also likely to be of con-siderable interest to others: board members, funders (such as foundations, individual donors, corporations, and governments), volunteers, other members of the community, and the media.
It is generally preferable to create reports for exter-nal use in summary form and in less detail than ones for internal use.
For the inevitable times when the outcomes are not as good as hoped, it is helpful to identify action steps that are planned or being taken to address problems.
Use 9. Inform board membersProviding outcome information to board mem-
bers is a key means of accountability to the board.
Outcome information also can be used to support recommendations to the board for resources or pro-gram changes.
While boards in some organizations may actually be the driving force in setting up outcome measure-ment systems and using the information, in others board members are relatively passive recipients of the information. Here are some suggestions to increase the interest and involvement of board members:
Provide opportunities for board members, especially new •members, to be briefed on the outcome measurement pro-cess. Explain how the staff uses that information and how board members might use it.
Summarize and highlight the findings.• Don’t over-whelm them with all the data collected. Provide reasons for the results, particularly for any disap-pointing or particularly good ones. Include plans for correcting any problems identified by the data.
Make the reports user-friendly.• Make sure the reports are clear and concise. Add explanations of terms, where necessary.
Ask the board to consider ways to recognize and reward •programs, staff, and volunteers for excellent, or consider-ably improved, outcomes.
Suggest that a board committee periodically review out-•comes, if appropriate. Some members could become actively involved in workgroups to identify prob-lems and seek improvements.
Use 10. Inform current and potential fundersResponding to funder requirements is, of course, a
major use of outcome information. Nonprofit orga-nizations that receive funds from government agen-cies, the local United Way, or foundations are likely to be required to submit reports on outcomes. Even if not required, outcome information can be used to address the question that most funders ask: “Is the
GUIDE TO PERFORMANCE MANAGEMENT FOR COMMUNITy LITERACy COALITIONS
53
funded program achieving its goals and making a dif-ference?”
Reports to funders, whether in new applica-tions for funds or to satisfy existing funder reporting requirements, should include such outcome-related elements as these:
A brief description of the outcome measurement •process;
Outcome highlights, both successes and disap-•pointments;
Explanations of both successes and disappoint-•ments; and
Identification of actions the organization is taking •or planning to take to address problems.
Some external stakeholders are likely to be inter-ested in how the coalition is doing relative to other coalitions. Such comparisons become possible if at least some coalitions use the same outcome indicators.
Sometimes, it will be better to report more out-come information than is required—for example, variations in outcomes attained by different client groups—if such information would help funders better understand the achievements reported. Such information can considerably enrich the understand-ing of program results.
A key use of outcome information is to support requests for new funding. Coalitions and individual direct
service literacy programs should consider highlight-ing key outcome information in applications, prog-ress reports, mailings, brochures, advertisements, or newsletters as a part of effective fundraising. This can be useful in seeking support both from organizations and individuals.
Use 11. Report to the communityLiteracy coalitions can use the outcome information
to provide reports, perhaps annually, to the commu-nity, such as a “State of Literacy in Our Community” report. These reports could provide the latest available data on literacy levels (see Section Three) and progress reports (see Sections Four and Five).
Individual literacy programs also should consider providing reports on outcomes of their programs to the community, past and potential volunteers, and past and future service users, as well as funders. Such reports can do the following:
Increase visibility, support, and goodwill for the organiza-•tion throughout the community.
Help recruit volunteers.• Outcome information will indicate to volunteers that the time they donate is likely to be in effective programs and is worth-while.
Encourage program use by other customers.• If previous clients have had demonstrated success, the service should appeal to potential new clients with similar needs.

GUIDE TO PERFORMANCE MANAGEMENT FOR COMMUNITy LITERACy COALITIONS
55
Following is a suggested set of roles for a community literacy coalition in performance measurement and performance management.
Encourage and help community literacy pro-1. grams to track their own outcomes and use that information to improve their services.
Provide training and technical assistance in per-2. formance measurement and performance man-agement to service programs.
Sponsor the selection by the literacy coalition’s 3. partners of a core set of community outcome indicators. Encourage the inclusion of indicators that are similar to those used elsewhere (so that comparisons can be made and successful practices can be identified).
Provide support for outcome data collection—4. for example, for the administration of question-naires by mail, phone, or in person. Another example is to arrange with your state govern-ment to regularly provide each of your commu-nity’s adult education programs with a tabulation of the number of students who received their GED (for students for whom obtaining a GED was a goal). This would be an easy way for indi-vidual programs to obtain GED feedback and, if the counts are aggregated across programs, will
also provide the Coalition with valuable infor-mation on community progress.
If possible, provide support for analysis of the 5. outcome information, such as arranging for the receipt of questionnaires, their tabulation and basic analysis, and, perhaps, help in preparing user-friendly reports on the findings.
Use the findings to help attract funding for lit-6. eracy improvement.
Use the findings to identify community literacy 7. program needs, such as for training (professional development) and technical assistance.
Use the findings to help identify and disseminate 8. successful (“best”) practices in the community (as well as identifying such practices nationwide and disseminating them to your literacy programs).
Use the findings to celebrate good literacy out-9. comes by providing annual recognition awards to programs that had achieved high levels of outcomes that year, or whose outcomes had improved substantially.
Prepare regular annual reports to the com-10. munity on the community’s literacy condi-tion (such as annual “State of Literacy in Our Community” or “How Are We Doing: Literacy in Our Community” reports).
SECTION NINEPotential Key Outcomes Management Roles for Literacy Coalitions

GUIDE TO PERFORMANCE MANAGEMENT FOR COMMUNITy LITERACy COALITIONS
57
How often should measurements be made?
Community coalitions probably should track and report community progress annually. Individual pro-grams, however, should be encouraged to track their own outcomes more frequently, such as quarterly, so they can respond quickly to problems identified by the outcome information.
does the literacy coalition need to seek data on all these outcome indicators?
No. It is likely to be wise to improve the outcome information in pieces and not all at once. Start with the outcome measurement information already being collected in the community and identify the major gaps that should be the initial focus.
In any case, as suggested in Section Two, seek con-sensus from the literacy community as to the pace of improvement and which measurement improvements are most important and should be addressed first.
does the community coverage need to be universal?
No. It is impractical, and probably impossible, to obtain the desired information from all literacy pro-viders in the community for any of the program cat-egories (such as the preschool, school-age, or adult
education service providers). For example, many very small providers, such as church-based programs, may not be able or willing to participate in the outcome measurement effort.
What can we do obtain comparisons with other coalitions?
If the outcome indicators used by your coalition have been selected to be similar to those of other coalitions, you should be able to obtain reasonably comparable data from those other coalitions. At present, such comparabil-ity is likely to be severely limited. (Current exceptions are the end outcome indicators for adult education if the adult education programs in your community collect information compatible with that called for by the fed-eral National Reporting System for Adult Education.)
How accurate does the outcome information have to be?
Attempting to achieve measurement perfection is a losing endeavor. It will also be tempting to ask indi-vidual programs for lots of supplemental information that, while of considerable use for research, is likely to deter programs from providing any information. Such expectations will only lead to frustration and added time, effort, and cost.
Follow the principle that “It is better to be roughly right than to precisely ignorant.”
SECTION TENFrequently Asked Questions

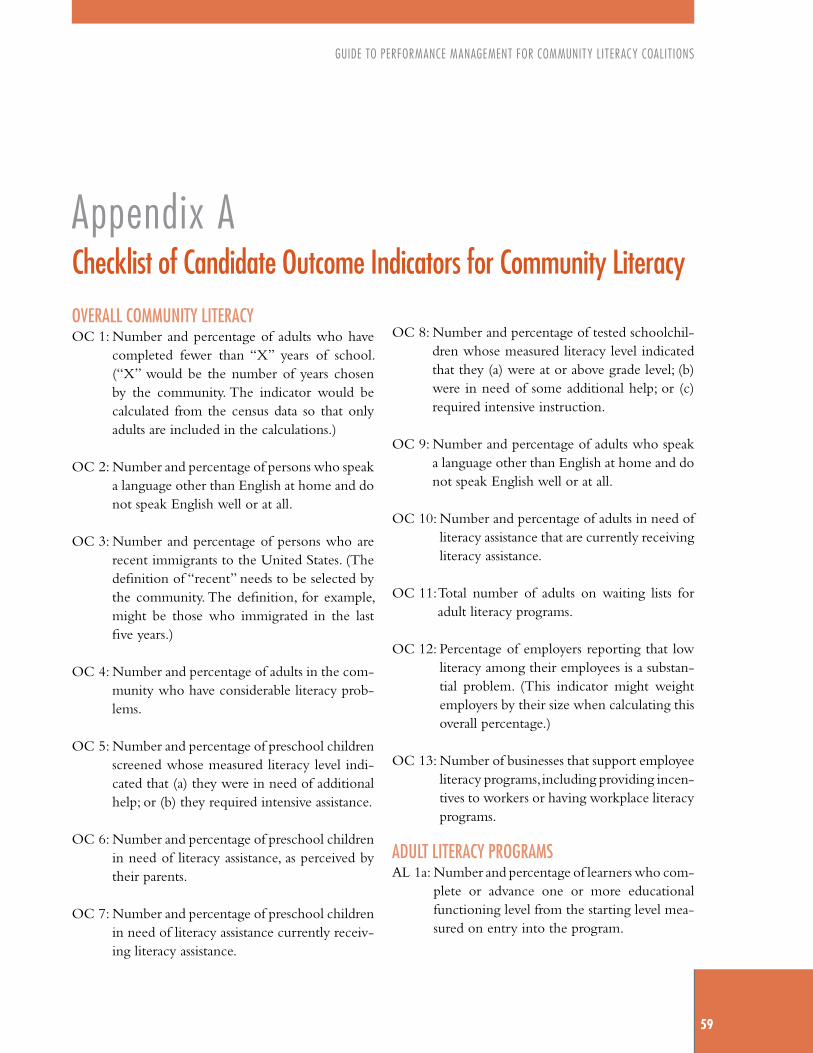
GUIDE TO PERFORMANCE MANAGEMENT FOR COMMUNITy LITERACy COALITIONS
59
OVERALL COMMUNITY LITERACYOC 1: Number and percentage of adults who have
completed fewer than “X” years of school. (“X” would be the number of years chosen by the community. The indicator would be calculated from the census data so that only adults are included in the calculations.)
OC 2: Number and percentage of persons who speak a language other than English at home and do not speak English well or at all.
OC 3: Number and percentage of persons who are recent immigrants to the United States. (The definition of “recent” needs to be selected by the community. The definition, for example, might be those who immigrated in the last five years.)
OC 4: Number and percentage of adults in the com-munity who have considerable literacy prob-lems.
OC 5: Number and percentage of preschool children screened whose measured literacy level indi-cated that (a) they were in need of additional help; or (b) they required intensive assistance.
OC 6: Number and percentage of preschool children in need of literacy assistance, as perceived by their parents.
OC 7: Number and percentage of preschool children in need of literacy assistance currently receiv-ing literacy assistance.
OC 8: Number and percentage of tested schoolchil-dren whose measured literacy level indicated that they (a) were at or above grade level; (b) were in need of some additional help; or (c) required intensive instruction.
OC 9: Number and percentage of adults who speak a language other than English at home and do not speak English well or at all.
OC 10: Number and percentage of adults in need of literacy assistance that are currently receiving literacy assistance.
OC 11: Total number of adults on waiting lists for adult literacy programs.
OC 12: Percentage of employers reporting that low literacy among their employees is a substan-tial problem. (This indicator might weight employers by their size when calculating this overall percentage.)
OC 13: Number of businesses that support employee literacy programs, including providing incen-tives to workers or having workplace literacy programs.
ADULT LITERACY PROGRAMSAL 1a: Number and percentage of learners who com-
plete or advance one or more educational functioning level from the starting level mea-sured on entry into the program.
Appendix AChecklist of Candidate Outcome Indicators for Community Literacy
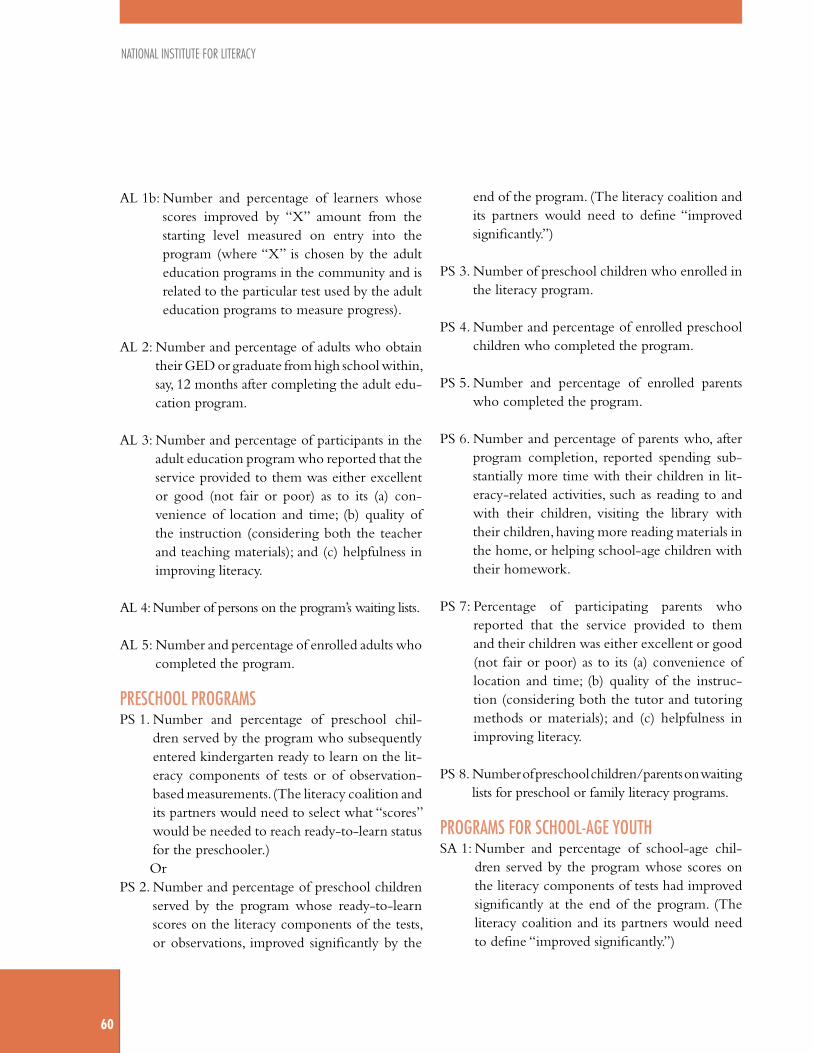
NATIONAL INSTITUTE FOR LITERACy
60
AL 1b: Number and percentage of learners whose scores improved by “X” amount from the starting level measured on entry into the program (where “X” is chosen by the adult education programs in the community and is related to the particular test used by the adult education programs to measure progress).
AL 2: Number and percentage of adults who obtain their GED or graduate from high school within, say, 12 months after completing the adult edu-cation program.
AL 3: Number and percentage of participants in the adult education program who reported that the service provided to them was either excellent or good (not fair or poor) as to its (a) con-venience of location and time; (b) quality of the instruction (considering both the teacher and teaching materials); and (c) helpfulness in improving literacy.
AL 4: Number of persons on the program’s waiting lists.
AL 5: Number and percentage of enrolled adults who completed the program.
PRESCHOOL PROGRAMSPS 1. Number and percentage of preschool chil-
dren served by the program who subsequently entered kindergarten ready to learn on the lit-eracy components of tests or of observation-based measurements. (The literacy coalition and its partners would need to select what “scores” would be needed to reach ready-to-learn status for the preschooler.) Or
PS 2. Number and percentage of preschool children served by the program whose ready-to-learn scores on the literacy components of the tests, or observations, improved significantly by the
end of the program. (The literacy coalition and its partners would need to define “improved significantly.”)
PS 3. Number of preschool children who enrolled in the literacy program.
PS 4. Number and percentage of enrolled preschool children who completed the program.
PS 5. Number and percentage of enrolled parents who completed the program.
PS 6. Number and percentage of parents who, after program completion, reported spending sub-stantially more time with their children in lit-eracy-related activities, such as reading to and with their children, visiting the library with their children, having more reading materials in the home, or helping school-age children with their homework.
PS 7: Percentage of participating parents who reported that the service provided to them and their children was either excellent or good (not fair or poor) as to its (a) convenience of location and time; (b) quality of the instruc-tion (considering both the tutor and tutoring methods or materials); and (c) helpfulness in improving literacy.
PS 8. Number of preschool children/parents on waiting lists for preschool or family literacy programs.
PROGRAMS FOR SCHOOL-AGE YOUTHSA 1: Number and percentage of school-age chil-
dren served by the program whose scores on the literacy components of tests had improved significantly at the end of the program. (The literacy coalition and its partners would need to define “improved significantly.”)
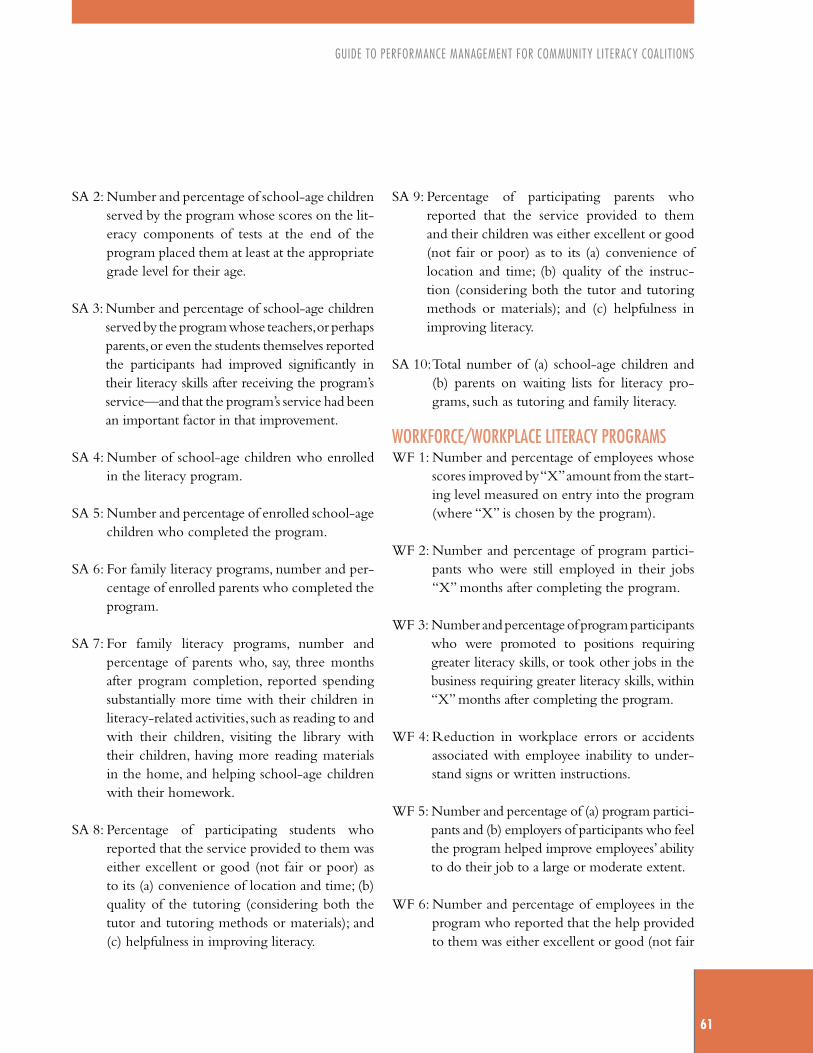
GUIDE TO PERFORMANCE MANAGEMENT FOR COMMUNITy LITERACy COALITIONS
61
SA 2: Number and percentage of school-age children served by the program whose scores on the lit-eracy components of tests at the end of the program placed them at least at the appropriate grade level for their age.
SA 3: Number and percentage of school-age children served by the program whose teachers, or perhaps parents, or even the students themselves reported the participants had improved significantly in their literacy skills after receiving the program’s service—and that the program’s service had been an important factor in that improvement.
SA 4: Number of school-age children who enrolled in the literacy program.
SA 5: Number and percentage of enrolled school-age children who completed the program.
SA 6: For family literacy programs, number and per-centage of enrolled parents who completed the program.
SA 7: For family literacy programs, number and percentage of parents who, say, three months after program completion, reported spending substantially more time with their children in literacy-related activities, such as reading to and with their children, visiting the library with their children, having more reading materials in the home, and helping school-age children with their homework.
SA 8: Percentage of participating students who reported that the service provided to them was either excellent or good (not fair or poor) as to its (a) convenience of location and time; (b) quality of the tutoring (considering both the tutor and tutoring methods or materials); and (c) helpfulness in improving literacy.
SA 9: Percentage of participating parents who reported that the service provided to them and their children was either excellent or good (not fair or poor) as to its (a) convenience of location and time; (b) quality of the instruc-tion (considering both the tutor and tutoring methods or materials); and (c) helpfulness in improving literacy.
SA 10: Total number of (a) school-age children and (b) parents on waiting lists for literacy pro-grams, such as tutoring and family literacy.
WORKFORCE/WORKPLACE LITERACY PROGRAMSWF 1: Number and percentage of employees whose
scores improved by “X” amount from the start-ing level measured on entry into the program (where “X” is chosen by the program).
WF 2: Number and percentage of program partici-pants who were still employed in their jobs “X” months after completing the program.
WF 3: Number and percentage of program participants who were promoted to positions requiring greater literacy skills, or took other jobs in the business requiring greater literacy skills, within “X” months after completing the program.
WF 4: Reduction in workplace errors or accidents associated with employee inability to under-stand signs or written instructions.
WF 5: Number and percentage of (a) program partici-pants and (b) employers of participants who feel the program helped improve employees’ ability to do their job to a large or moderate extent.
WF 6: Number and percentage of employees in the program who reported that the help provided to them was either excellent or good (not fair
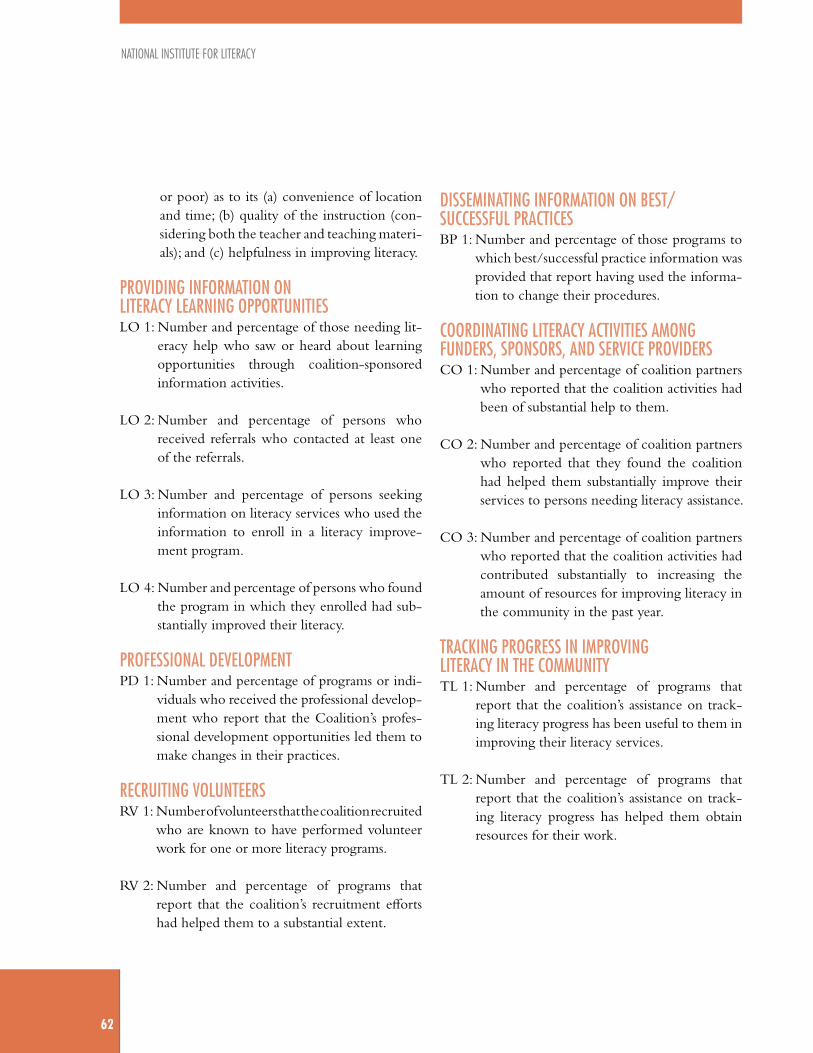
NATIONAL INSTITUTE FOR LITERACy
62
or poor) as to its (a) convenience of location and time; (b) quality of the instruction (con-sidering both the teacher and teaching materi-als); and (c) helpfulness in improving literacy.
PROVIDING INFORMATION ON LITERACY LEARNING OPPORTUNITIESLO 1: Number and percentage of those needing lit-
eracy help who saw or heard about learning opportunities through coalition-sponsored information activities.
LO 2: Number and percentage of persons who received referrals who contacted at least one of the referrals.
LO 3: Number and percentage of persons seeking information on literacy services who used the information to enroll in a literacy improve-ment program.
LO 4: Number and percentage of persons who found the program in which they enrolled had sub-stantially improved their literacy.
PROFESSIONAL DEVELOPMENTPD 1: Number and percentage of programs or indi-
viduals who received the professional develop-ment who report that the Coalition’s profes-sional development opportunities led them to make changes in their practices.
RECRUITING VOLUNTEERSRV 1: Number of volunteers that the coalition recruited
who are known to have performed volunteer work for one or more literacy programs.
RV 2: Number and percentage of programs that report that the coalition’s recruitment efforts had helped them to a substantial extent.
DISSEMINATING INFORMATION ON BEST/SUCCESSFUL PRACTICESBP 1: Number and percentage of those programs to
which best/successful practice information was provided that report having used the informa-tion to change their procedures.
COORDINATING LITERACY ACTIVITIES AMONG FUNDERS, SPONSORS, AND SERVICE PROVIDERS CO 1: Number and percentage of coalition partners
who reported that the coalition activities had been of substantial help to them.
CO 2: Number and percentage of coalition partners who reported that they found the coalition had helped them substantially improve their services to persons needing literacy assistance.
CO 3: Number and percentage of coalition partners who reported that the coalition activities had contributed substantially to increasing the amount of resources for improving literacy in the community in the past year.
TRACKING PROGRESS IN IMPROVING LITERACY IN THE COMMUNITY TL 1: Number and percentage of programs that
report that the coalition’s assistance on track-ing literacy progress has been useful to them in improving their literacy services.
TL 2: Number and percentage of programs that report that the coalition’s assistance on track-ing literacy progress has helped them obtain resources for their work.
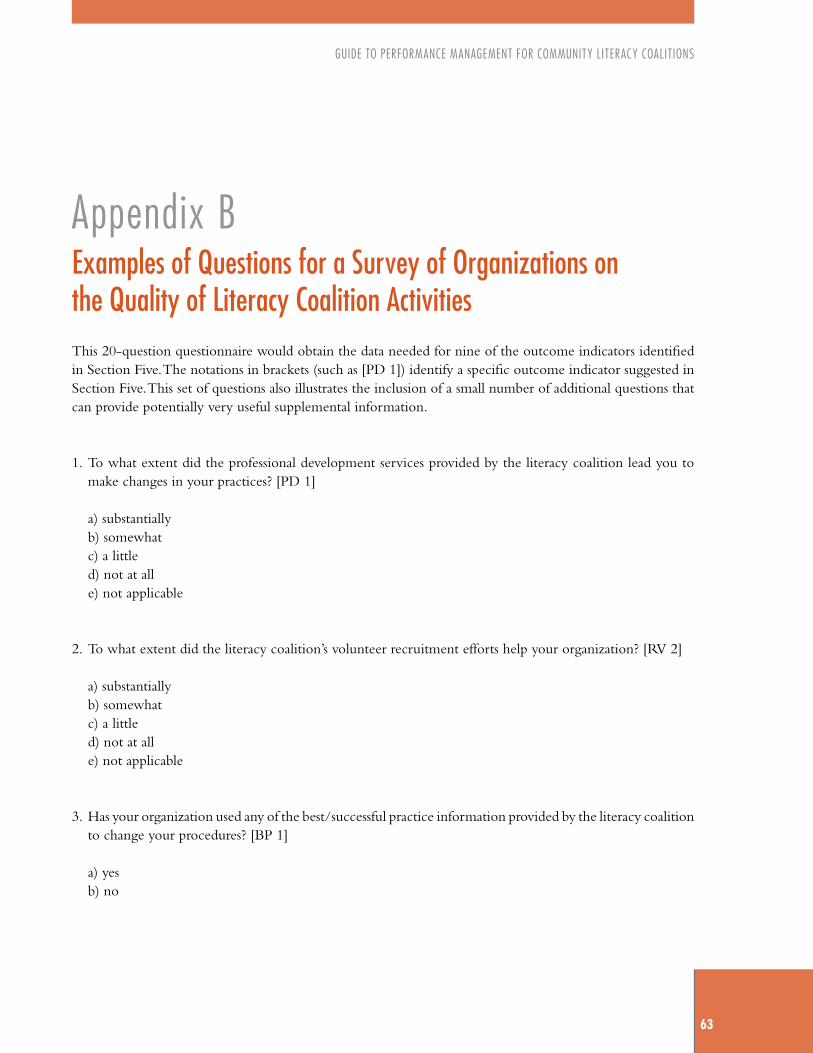
GUIDE TO PERFORMANCE MANAGEMENT FOR COMMUNITy LITERACy COALITIONS
63
Appendix BExamples of Questions for a Survey of Organizations onthe Quality of Literacy Coalition ActivitiesThis 20-question questionnaire would obtain the data needed for nine of the outcome indicators identified in Section Five. The notations in brackets (such as [PD 1]) identify a specific outcome indicator suggested in Section Five. This set of questions also illustrates the inclusion of a small number of additional questions that can provide potentially very useful supplemental information.
1. To what extent did the professional development services provided by the literacy coalition lead you to make changes in your practices? [PD 1]
a) substantially b) somewhat c) a little d) not at all e) not applicable
2. To what extent did the literacy coalition’s volunteer recruitment efforts help your organization? [RV 2]
a) substantially b) somewhat c) a little d) not at all e) not applicable
3. Has your organization used any of the best/successful practice information provided by the literacy coalition to change your procedures? [BP 1]
a) yes b) no

NATIONAL INSTITUTE FOR LITERACy
64
4. If response to #3 is yes: To what extent did use of the best/successful practice information help your organization?
a) substantially b) somewhat c) a little d) not at all
5. If response to #3 is yes: What practice or practices did you adopt?
6. To what extent have the literacy coalition’s activities, such as fund raising, advocacy, recruitment of volunteers, information and referral, and program development, helped your organization? [CO 1]
a) substantially b) somewhat c) a little d) not at all
7. If response to #6 is (a), (b), or (c): What activities or services did you find helpful?
8. If response to #6 is (d) (not at all): Why do you say that?
9. To what extent have the literacy coalition’s activities helped your organization improve its services to those needing literacy assistance? [CO 2]
a) substantially b) somewhat c) a little d) not at all
10. If response to #9 is (a), (b), or (c): In what way has it helped your organization improve its services? (Please provide an example or examples.)

GUIDE TO PERFORMANCE MANAGEMENT FOR COMMUNITy LITERACy COALITIONS
65
11. If response to #9 is (d) (not at all): Why do you say that?
12. In the last year, to what extent have the literacy coalition’s activities contributed to increasing the amount of resources in the community for improving literacy? [CO 3]
a) substantially b) somewhat c) a little d) not at all
13. In the last year, to what extent has the literacy coalition’s assistance in tracking literacy progress helped your organization obtain resources? [TL 2]
a) substantially b) somewhat c) a little d) not at alle) not applicable
14. In the last year, to what extent has the literacy coalition’s assistance in tracking literacy progress been useful in helping your organization improve literacy services to customers in ways other than obtaining resources? [TL 1]
a) substantially b) somewhat c) a little d) not at alle) not applicable
15. If response to #14 is (a), (b), or (c): In what way has it helped your organization improve its services? (Please provide an example or examples.)
16. If response to #14 is (d) (not at all): Why do you say that?
17. Please provide your suggestions for ways the literacy coalition can improve its services:

GUIDE TO PERFORMANCE MANAGEMENT FOR COMMUNITy LITERACy COALITIONS
67
Appendix CSample Survey Questionnaire for Adult Literacy Program Participants from the Division of Adult Education and Literacy, Office of Vocational and Adult Education, U S Department of Education
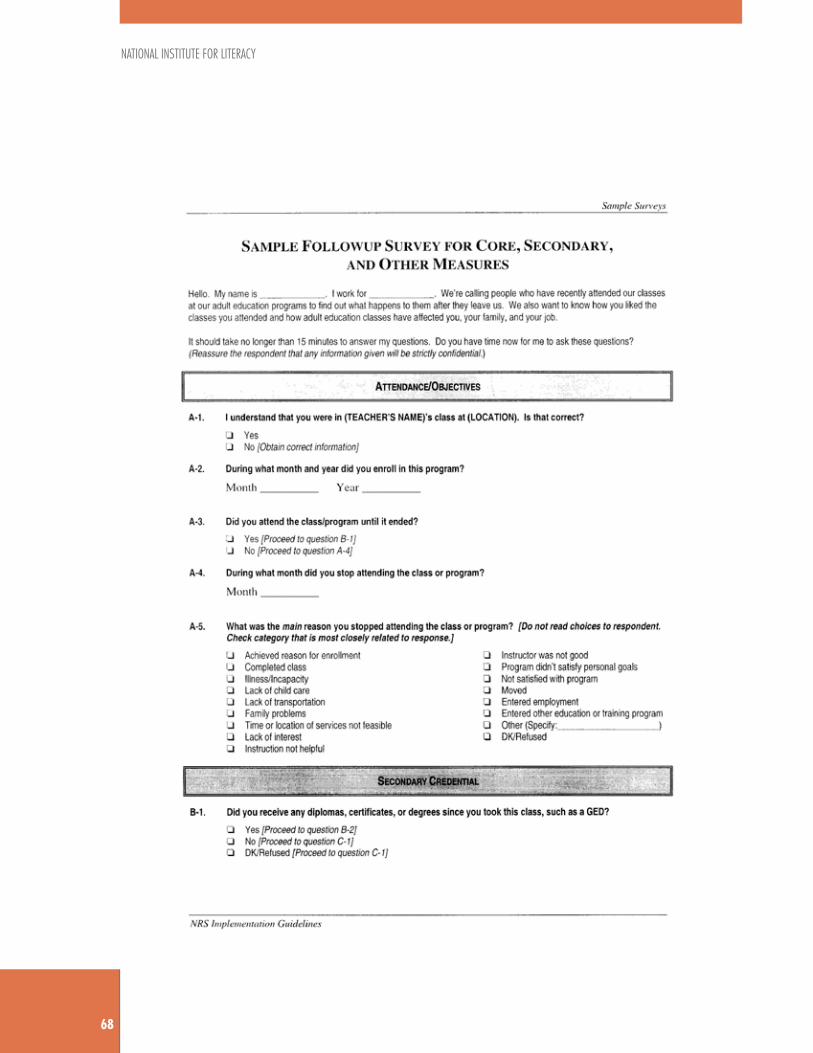
NATIONAL INSTITUTE FOR LITERACy
68
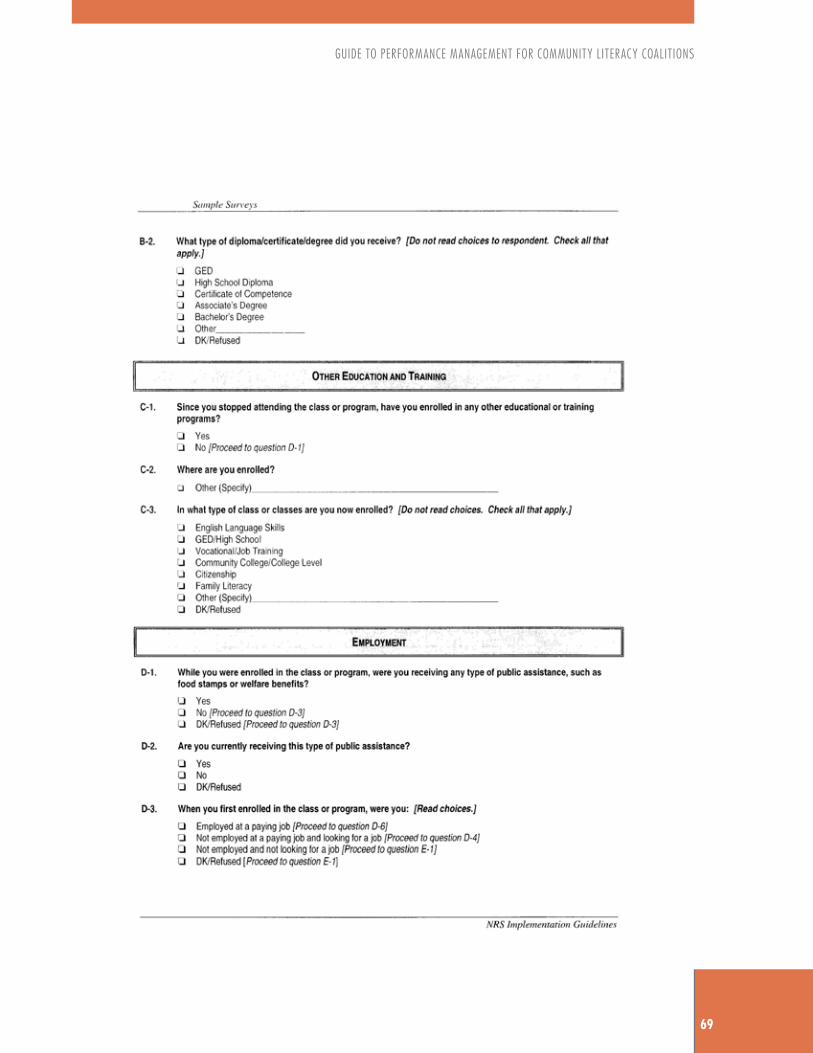
GUIDE TO PERFORMANCE MANAGEMENT FOR COMMUNITy LITERACy COALITIONS
69
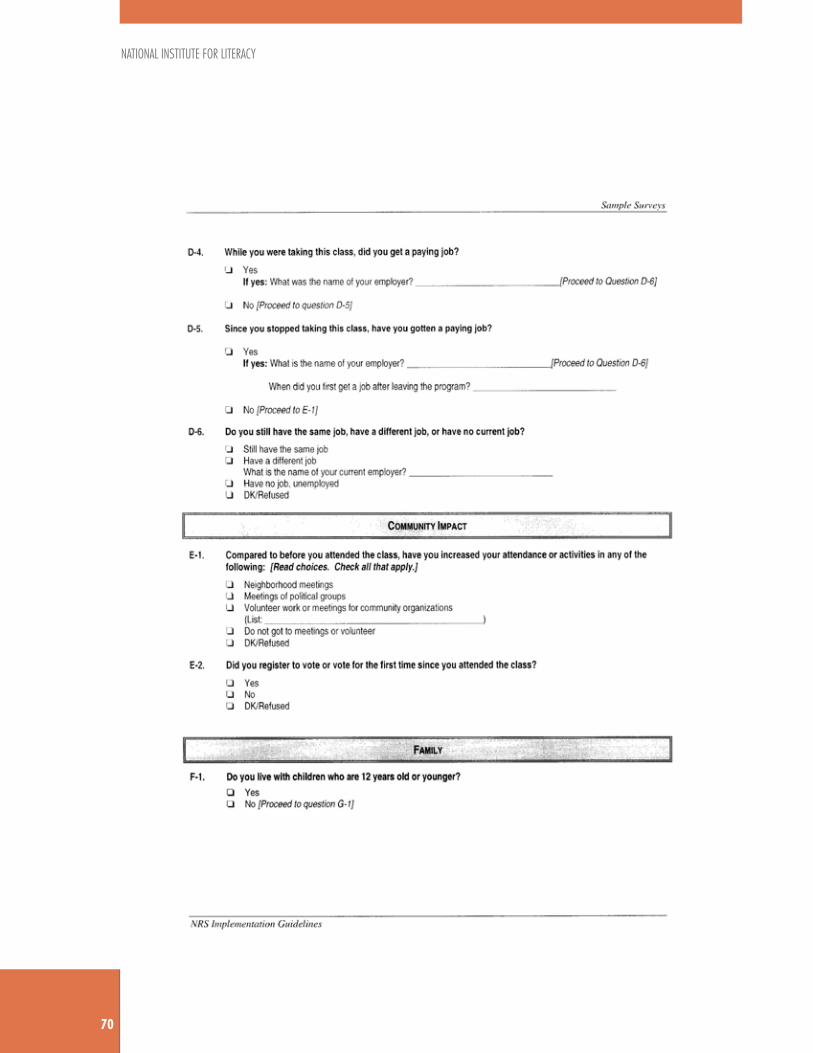
NATIONAL INSTITUTE FOR LITERACy
70

GUIDE TO PERFORMANCE MANAGEMENT FOR COMMUNITy LITERACy COALITIONS
71
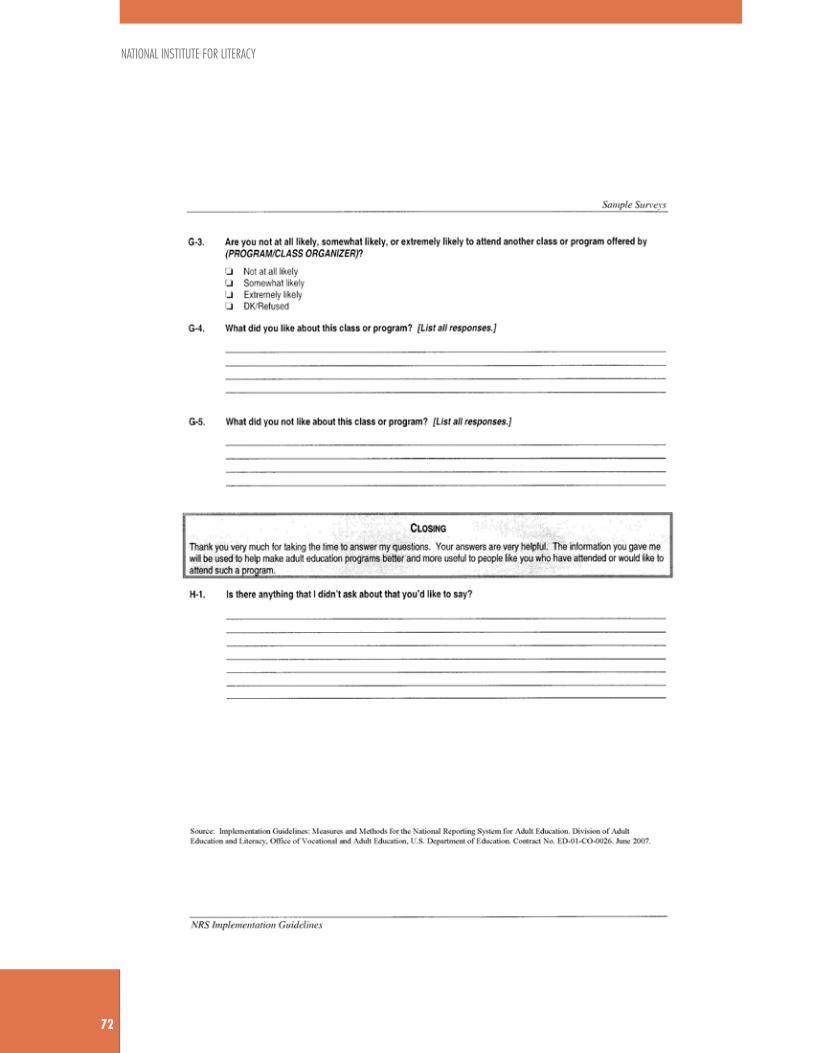
NATIONAL INSTITUTE FOR LITERACy
72


1775 I Street, NW; Suite 730Washington, DC 20006-2401Phone: 202/233-2025Fax: 202/233-2050