Embed Size (px)
Citation preview

Guide to the Assessment of Socio ‑Environmental Impact for Use in Impact ‑Oriented Projects and Investments

2 | Insper Metricis Guide to the Assessment of Socio‑Environmental Impact for Use in Impact‑Oriented Projects and Investments
GENERAL GUIDE FOCUSED ON VERIFICATION
OF ADDITIONALITY
ABOUT INSPER
Insper is an independent, nonprofit institution dedicated to education and research in the fields of Business Administration, Economics, Law and Engineering. Its mission is to be a leading center and to explore the complementarities of these fields of knowledge. Insper’s teaching activities offer programs for various stages of a career: Undergraduate (Business Administration, Economics and Engineering), Graduate and Research Degree (Certificates, MBAs, Law, Professional Masters and Doctoral) and Executive Education (Open ‑Enrollment programs and Custom programs for companies). In knowledge generation, Insper works through endowed chairs and research centers, which bring together researchers to work on studies and projects focusing on public policy, finance, and management. Insper also has centers to foster entrepreneurship (CEMP) and education (Education Center). Insper’s academic quality is certified by AACSB, AMBA and Anamba. Insper Metricis is part of the Center for Public Policy and Administration.
ABOUT INSPER METRICIS
Insper Metricis is a research center focused on studies of organizational strategies and management practices for projects with the potential to generate high socio ‑environmental impact. Special emphasis is given to the development of tools for planning, executing and evaluating impact projects performed by companies, nonprofit organizations and governments. With management and assessment procedures on the potential contribution of socio ‑environmental projects, it is possible not only to expand the reach of impact‑‑oriented investments, but also to develop new ways to fund and assess those projects. Furthermore, the lessons learned from these experiences enable the continuous documentation and dissemination of best practices through academic research, policy reports, case studies and management guides related to high ‑impact projects.
GUIDE TO THE ASSESSMENT OF SOCIO ‑ENVIRONMENTAL IMPACT FOR USE IN IMPACT ‑ORIENTED PROJECTS AND INVESTMENTS An early version of this document was written by Sergio G. Lazzarini, Leandro S. Pongeluppe, Pui Shen Yoong, and Nobuiuki Costa Ito. This new version received additional input from Lígia Vasconcellos, Sergio Lazzarini, Carolina Pedrosa Gomes de Melo, Pedro Godoy, José Geraldo Setter Filho, Amanda Arabage, Sergio Firpo, and Marina Ribeiro. Previous revisions benefitted from the contributions of Mariana Suplicy, Rafael Vivolo, Guilherme Lichand, Amanda Arabage, Carlos Kazunari Takahashi, Sandro Cabral, and José Geraldo Setter Filho, as well as suggestions by Fernando Carnaúba, Ben Carpenter, Amanda Feldman, Sergio Firpo, Luis Fernando Guedes Pinto, Naercio Menezes Filho, Ricardo Paes de Barros, Brian Trelstad, and Maurício Voivodic. Initial discussions to develop these guidelines evolved from the work of a discussion group including Angélica Rontondaro, Célia Cruz, Franco Veludo, Frederik Kuonen, Simon Locher, Tatiana Fonseca, Rafaella Ziegert, and Raquel Costa, with financial support of the Latin America Economy Impact Innovations Fund (Rockefeller Foundation, Avina, and Omidyar) in the proposal coordinated by ICE (Célia Cruz and Maria Amélia Sampaio).
São PauloFourth edition,January 2020

3 | Insper Metricis Guide to the Assessment of Socio‑Environmental Impact for Use in Impact‑Oriented Projects and Investments
There is still controversy about how to monitor activities and measure the impact of organizations and projects devoted to social and environmental goals. The challenge is to go beyond monitoring a set of diverse indicators to assess the real improvements caused by the project.
One way to assess those project ‑specific outcomes is to answer to the following question: “What would have happened to the targeted communities or individuals had they not been exposed to the project?” This question is important because there may have been simultaneous, external improvements affecting the target population that are independent of the project. For instance, in an initiative to provide public schools with technological learning tools, the project manager may incorrectly conclude that the tools have improved student learning, when, in reality, the improvement may have been caused by changes in the public school system’s pedagogical practices as a whole.
The so ‑called verification of additionality in social projects tries to avoid precisely this kind of erroneous judgment. In this approach, impact is defined as the difference between what happened to the individuals affected by the project compared to what would have happened
without the intervention. Ideally, we would need to compare the same person or group receiving a certain intervention. In some cases, this is possible. For instance, the effect of wearing eyeglasses on the reading capacity of visually impaired people can be instantaneously gauged, based on a simple comparison of how much the person can see with and without eyeglasses.
In most cases, however, the intervention outcomes occur over an extended period of time and can be affected by several factors that are not directly related to the focal project. In those cases, the question “What would have happened to the targeted communities or individuals, had they not been exposed to the project?” can be answered based on information from people who, simultaneously with the project beneficiaries, have not received the intervention.
The idea is similar to an experimental design. For example, in the medical field, the treated group receives a drug or medical treatment, while the control group does not receive the treatment. This allows for measuring how the medical intervention affected the population by accounting for natural changes that might have otherwise occurred. This alternative scenario — what would have happened to
IINTRODUCTION TO THE GUIDELINES
In the additionality approach, impact
is defined as the difference
between what has happened to the beneficiaries
of a project to what would have
happened the intervention.

4 | Insper Metricis Guide to the Assessment of Socio‑Environmental Impact for Use in Impact‑Oriented Projects and Investments
the beneficiaries without the treatment — is referred to as counterfactual.
Figure 1 exemplifies this type of measurement approach based on additionality. Imagine that a company wants to invest in the development of several communities and to assess the impact of those investments. As such, the company defines communities who will be affected by the project (the treated group) and communities who will not receive the interventions (the control group). Before starting the project, those two groups exhibit distinct income levels, but they have similar growth patterns with respect to this indicator.
At the project’s start, the company measures the income level of individuals in the control group and the treated group. At this time, the average income of the control group is $90, while the average income of the treated group (which will receive the investment) is $100.
After making these measurements, the company then begins the project with the community. After one year, it measures again the average income of the treated and control groups. An inexperienced analyst might conclude that the impact
of the project is $30, since the average income of the treated group increased from $100 to $130. However, using verification of additionality, the treated group’s evolution is compared to what would probably have happened without the project. This counterfactual scenario, in this case, is indicated by what did happen in the control group. Due to other factors that may have affected the community (such as a natural evolution in living standards or government cash transfers), the group that did not receive the investment also experienced an income increase, of $10 per individual. Measuring the program’s real impact is possible if we do not limit the analysis to changes over time in the treated group, but also account for other natural trends that might occur (as evidenced by the control group).
In this case, it is clear that the program increased the average per capita income of individuals in the treated community by $20. This additional gain is simply the difference between the verified change in the treated community ($30) and the verified change in the control community ($10), which serves as an estimate of the counterfactual scenario (what would have happened to the target population without the project).
Figure 1: Impact Assessment through Verification of Additionality
Before
“Treated” group
Cho
sen
indi
cato
rex
: Ave
rage
per
cap
ita in
com
e
“Control” group
AfterStart of the project
80
90
100
110
120
130
IMPACT

5 | Insper Metricis Guide to the Assessment of Socio‑Environmental Impact for Use in Impact‑Oriented Projects and Investments
Notice that monitoring project ‑specific indicators is not the same as evaluating a project’s impact, when impact is defined in terms of additionality. Project managers usually collect indicators of the treated group and observe those indicators over time (item 1 of the above definition). This is certainly a good practice to follow the evolution and performance of beneficiaries. In the previous example of a project to develop local communities, project managers can follow indicators of income, education, health, and several others. However, to effectively assess whether the project caused those changes, it would be necessary to assess the counterfactual scenario involving what would have happened to the communities without the project (item 2 of the above definition). In this context, the Guide to Assessment of Socio ‑Environmental Impact for Use in Impact Investments and Social Enterprises provides a practical tool for enabling impact investors, nonprofit organizations, companies, and governments to assess the impact that they potentially generate through their sponsored projects. The Guide is also a tool for the project managers themselves, whether they
work for private, public or third sector organizations, as project results are also essential information for management and planning decisions.
The Guide proposes a sequence of steps, beginning from the definition of the project objectives and its target population, and moving ahead with the selection of metrics and alternative ways to measure additionality. In this sense, the Guide is a useful tool for the practice of impact management. For instance, following the approach proposed by the Impact Management Project (IMP)1, the Guide provides a focused discussion on the dimension contribution, that is, the extent to which outcomes were distinct from what would have happened without the project. However, aligned with the general IMP framework, the Guide also makes a discussion of who are the potential beneficiaries (definition of the target population), what are the most relevant outcomes (definition of the theory of change and selection of metrics), and how much the project can improve the wellbeing of the target population (based on results from previous studies and the expected outcomes of the planned interventions).
1. Highly relevant indicators for assessing the improvements potentially caused by the project (i.e., the positive change expected for the target population);
2. Assessment of what would have happened to the target population without the investment (e.g., through comparisons with similar control groups not included in the project);
1. See https://impactmanagementproject.com/ (accessed on July 3, 2019).
Following this approach of verification of additionality, these guidelines are based on two essential pillars:

6 | Insper Metricis Guide to the Assessment of Socio‑Environmental Impact for Use in Impact‑Oriented Projects and Investments
PREPARING A MEASUREMENT PLAN Preparing a measurement plan is an essential step in properly setting up, operating, implementing and controlling the measurement. To implement robust and accurate data measurements, the following steps should be considered:
1. Description of the project and its broader objectives
2. Defining the target population
3. Benchmarking
4. Defining the theory of change
5. Definition of metrics
6. Definition of the method for verifying additionality
7. Sampling plan 8. Measurement timeline

7 | Insper Metricis Guide to the Assessment of Socio‑Environmental Impact for Use in Impact‑Oriented Projects and Investments
The strategy to define how to estimate the impact of an intervention begins with a description of the intervention itself. At this step, the organization’s mission, its objectives, and all the planned actions should be known, as well as if they were implemented and in what context.
In impact management, it has been customary to link the project’s overall objectives to the United Nations’ Sustainable Development Goals (SDGs), which are increasingly being adopted as key fundamental issues that must be addressed to improve the wellbeing of populations worldwide2. It is possible that the same project may be related to several SDGs. For instance, consider a project to increase the access of poor communities to clean water and sanitation infrastructure. This project
is closely related to SDG 6: “Ensure availability and sustainable management of water and sanitation for all.” However, at the same time, the project can positively affect the target population’s health condition and promote sustainable local infrastructure, thus creating additional links to SDG 3 (good health and well ‑being) and 11 (sustainable cities and communities), respectively.
Often, even when actions are very well defined by their managers, the objectives are poorly discussed and detailed. Deepening the discussion of project objectives can also help managers understand which of those objectives are directly influenced by the program, and which, although desirable and related to the implemented actions, are outside the program’s scope.
Targeting is also an opportunity
to focus on who really needs help,
or to emphasize subgroups
for which the intervention can
be most effective.
1. Description of the project and its broader objectives
A key step in defining a measurement plan is to determine the target population of the project. In order to objectively demarcate the target population, it is necessary to start by identifying all relevant actors that can be affected by the project or influence its results (the so ‑called stakeholders). These actors can include project sponsors, service providers, support organizations and especially the final beneficiaries of the project. At this step, it is crucial to assess if their priorities and objectives are in line with the project’s planned actions.
As organizations have limited resources, targeting is also an opportunity to focus on who really needs help, or to emphasize subgroups for which the intervention can be most effective.
For example, a project may seek to improve the health conditions of vulnerable populations by increasing their access to medicine and effective
methods for treating chronic diseases at a lower cost. A critical question, then, is: Who are those vulnerable populations and which individuals should be given priority, especially in a condition involving scarce resources?
Factors that can be considered when defining the target population include3:
■ Geography: the project’s regional boundaries.
■ Demographic characteristics: age, sex, gender, and others.
■ Socioeconomic characteristics: income, schooling, occupation, and others.
■ Special needs: physical and cognitive disabilities and other relevant vulnerabilities.
■ Susceptibility to environmental factors: climate, potential disasters, etc.
■ Initial conditions: the current status of the focused group in terms of key variables of interest.
2. Defining the target population
2. UNITED NATIONS. Sustainable develop‑ment goals. 2019. Retrieved from http://www.un.org/sustainabledevelopment/sustainable ‑development ‑goals/ (ac‑cessed on June 30, 2019).
3. For more details, see https://im‑pactmanagementproject.com/impact‑‑management/what ‑is ‑impact/who/ (accessed on July 3, 2019).

8 | Insper Metricis Guide to the Assessment of Socio‑Environmental Impact for Use in Impact‑Oriented Projects and Investments
BOX 1. presents an example of target population definition considering some of the dimensions above.
BOX 1. Example of definition of the target population in the context of a prenatal program for pregnant women
A government program in partnership with a nonprofit organization seeks to promote prenatal consultations with the objective of increasing maternal and newborn health indicators. The government defined a set of municipalities totaling 6,024 pregnant women.
Previous studies indicated that the efficacy of those programs increase in the case of vulnerable women aged between 14 and 35 years (demographic characteristic), with up to 7 years of schooling (socioeconomic characteristic), and in their first pregnancy (initial condition).
The Venn Diagram in this box shows the number of women with each of these characteristics and the total of cases at their intersection: 732 women. These pregnant women could be considered as a priority group in the proposed interventions, even though other segments could also be included in the program if there are sufficient resources.
Total of pregnant women in the municipalities of the program: 6,024
14 ‑35 years
low schooling
first pregnancy
Focus
5,508 women
2,796 women 2,424 women
732 women
The expansion of impact ‑oriented projects depends on continuous learning based on the mistakes and successes of similar projects, as well as on drawing on prior measurements generated by previous research. Therefore, benchmarking is an essential step to identify what has been done or studied before in the domain of the project’s target activities and populations.
Information sources include academic studies, publications by international organizations, reports from other sponsors who made investments in the same activity, and several other sources. There are also different internet platforms that consolidate research and evaluation studies in several areas, with detailed information on the potential interventions and their
effectiveness 4. In impact assessment studies, it is becoming increasingly common to examine the results of meta‑‑analyses: studies that seek to compile the results of various previous assessments focused on a given topic.
As an example, imagine a manager interested in helping unemployed people to find job opportunities (thus, connecting with SDG 8, emphasizing decent work and economic growth). A meta ‑analysis published in 2008 analyzed 207 studies of active labor market programs, including training and job intermediation, as well as subsidies for companies5. The study concludes that the results observed after one year of intervention are higher than programs focused on the short run (up to one year). Comparing the types of
3. Benchmarking4. For instance, the library of evaluation studies compiled by J ‑PAL (Abdul Latif Jameel Poverty Action Lab https://www.povertyactionlab.org/evaluations); the education studies toolkit developed by the Education Endowment Foundation (https://educationendowmentfoundation.org.uk/resources/teaching ‑learning‑‑toolkit); and the health studies reviewed by Cochrane (http://www.cochrane.org/evidence) (all accessed on July 4, 2019).
5. CARD, D.; KLUVE, J.; WEBER, A. What works? A meta analysis of recent active labor market program evaluations. Journal of the European Economic Association,
16(3): 894–931, 2018.

9 | Insper Metricis Guide to the Assessment of Socio‑Environmental Impact for Use in Impact‑Oriented Projects and Investments
intervention, programs with an emphasis on training seem to be more effective than programs focused only on job search.
The benchmarking step also allows for a quantification of the expected effect size of the project. For instance, in the previously cited meta ‑analysis, the authors conclude that training programs tend to increase the likelihood of employment up to 8.7 percentage points in the long run. This effect is higher than what is observed after one year (1.6 percentage point), which is in itself an indication that it is desirable to assess the program’s impact over a longer period
of time. If the analysis of previous programs suggests that the effects are negligible, then project managers can also try to change or complement the proposed interventions.
It is also possible that the effect of the project will be higher or lower depending on heterogeneous traits of the population, as discussed in Step 2. Still using the example of job market interventions, project managers may try to focus on low ‑income young adults who recently graduated from high schools. The benchmarking should then search for studies that specifically focus on this target population.
Source: Adapted from McLaughlin & Jordan (2004)6
INSUMOS
Human, physical, and financial
resources
ATIVIDADES
Action steps, intervention
programs
PRODUTOS
Products and services offered
to the target population
Tangible changes in key variables related to the focal activity and valued by the target populations
Broader societal transformations
caused by the intervention
Figure 2: Theory of Change Applied to Impact Investments
Before delving into the issue of how to measure the project’s impact, it is first necessary to define what to measure. At this stage, the project/program/company under evaluation should submit their theory of change, i.e., a clear and logical manner of articulating the connection between the activities and the desired socio ‑environmental outcomes.
Figure 2 shows the five stages of a theory of change, whose mapping is essential for any measurement plan: inputs and activities,
which generate certain immediate outputs offered to the target population, which, in turn, trigger relevant outcomes, linked either with the project’s main activities or with broader societal transformations. This step can greatly benefit from the previous steps of the measurement plan: the definition of project objectives and the target population guide the identification of the specific results to be pursued, whereas the benchmarking step helps identify what potential inputs and activities can be more effective in promoting these results.
4. Defining the theory of change
The expansion of impact ‑oriented
projects depends on continuous
learning based on the mistakes and
successes of similar projects, as well as on
drawing on analyses carried out by
previous research.
6. MCLAUGHLIN, J. A.; JORDAN, G. B. Using logic models. In NEWCOMER, K. E.; HATRY, H. P.; WHOLEY, J. S. (Eds.). Handbook of practical program evaluation, 2013, pp. 7 ‑32. Also see EHENBERGER, L.; HARLING, A. M.; SCHOLTEN, P. A Practical Guide to Measuring and Managing Impact. Euro‑pean Venture Philanthropy Association, 2013, p. 9.
INPUTS ACTIVITIES OUTPUTS ACTIVITY OUTCOMES
SOCIETAL OUTCOMES

10 | Insper Metricis Guide to the Assessment of Socio‑Environmental Impact for Use in Impact‑Oriented Projects and Investments
Project managers usually report outputs instead of outcomes. To illustrate, consider a company whose main activity is to provide technological tools that improve the academic performance of public school students, using various inputs like the online platforms and support teams coordinating the interventions. The outputs of this activity are the number of students who accessed those tools or the number of interactive sessions with students. Notice, however, that these outputs do not necessarily indicate if students really have improved as a result of the intervention. We thus need to examine outcomes, i.e., relevant changes that improved the lives of the target populations or the broader society.
In this case, an expected activity outcome is the improvement in students’ grades on a particular standardized test. The societal outcome of the project, in turn, would be the future wellbeing and even future income gain that students will be able to reap as a result of their added skills. In this process, it is important to describe the causal mechanism that will influence the desired change. For instance, the technological tools could include games and videos potentially increasing students’ motivation to learn and promoting their ability to understand and absorb new knowledge.
The theory of change also allows for the creation of a scorecard of relevant indicators to be monitored based on data from the project’s beneficiaries. In the above example, the company can follow the total hours spent by the support team (inputs), the actions that they perform with these students (activities), the number of students who accessed the learning tool (outputs) and their assessed learning (results), among other indicators. However, from an additionality perspective, the theory of change is not, in itself, a method for assessing impact. The project’s impact, as discussed before and detailed in Stage 5, involves changes
that were caused by the project, rather than other external factors affecting the target population. Monitoring a scorecard of indicators from the beneficiaries is important, but not enough to assess impact.
BOX 2 presents another example of theory of change in the educational field that includes a more complex set of inputs and interventions and more detailed specifications of the cause‑‑and ‑effect links among the building blocks of the theory. In the example below, an impact investor has acquired a group of private schools targeting low ‑income families and has pursued a set of pedagogical and managerial practices to improve learning and reduce dropouts. Observe, in particular, how the components of the theory of change are written. Activities identify actions that managers carry out (notice the verbs “implement,” “adopt,” and others). Outputs involve, in general, changes in numbers and quantities. Outcomes, in turn, identify how the target population improves as a function of the proposed interventions (“students learn the curricular topics”).
When defining the theory of change, it is important to take into account all possible outcomes, both positive and negative. Neglecting negative outcomes increases the risk of generating unintended results. For instance, a project to increase the income in rural communities may stimulate new agricultural activities that revamp farmers’ income, but at the same time cause negative spillovers to the natural environment. Certain activities may also create a risk of violating basic human rights, for instance, in cases of gender discrimination or precarious working conditions. A suggestion is to consider interrelations between the general objectives of the project (as discussed in Step 1), in order to provide a broader view of all possible results that may be caused by the intervention.
The theory of change also allows
for the creation of a scorecard of
relevant indicators to be monitored
based on data from the project’s
beneficiaries. However, the
theory of change is not in itself a form of impact
assessment.

11 | Insper Metricis Guide to the Assessment of Socio‑Environmental Impact for Use in Impact‑Oriented Projects and Investments
After completing the previous steps, it is now possible to choose the metrics for the project. Although indicators can be chosen for all stages of the theory of change, including for the purposes of monitoring activities and outputs, the analysis of impact emphasizes outcome indicators. For the sake of focus and simplicity, we recommend a few highly relevant outcome indicators for assessing the project’s impact. Those indicators should be closely linked with the outcomes outlined in the theory of change (Step 4).
Good metrics have the following attributes7:
■ They are highly relevant in terms of impact generation. In other words, they must represent outcomes that are highly desirable for the target populations. If the metric follows the theory of change described in Step 4 and if the theory correctly identifies key desirable outcomes, then the metrics should be relevant.
■ They must be reasonably affected by the action of the project executors. One should avoid, for instance, indicators that are too aggregated and broad and whose result is affected by a myriad of factors beyond the direct control of the executors. In general, metrics linked with activity outcomes tend
BOX 2. Example of theory of change for a chain of secondary schools targeting low‑‑income students.
5. Definition of metrics (impact indicators)
7. These characteristics are particularly relevant since impact evaluation can also be used to set management goals; see: ROBERTS, J. Designing Incentives in Organi‑zations. Journal of Institutional Economics, 6 (1): 125 ‑132, 2010. Characteristics of good metrics are also discussed in: KUSEK, J.; RIST, R. C. Ten Steps to a Results ‑Based Monitoring and Evaluation System. Wash‑ington: World Bank, 2004.02 dez. 2019.
Skilled managers
Trained teachers
Information technology
Management practices
Former students go to college and develop professional capabilities
Former students are employed and increase their income
INPUTS ACTIVITIES OUTPUTS ACTIVITY OUTCOMES
SOCIETAL OUTCOMES
Implement modern, cost‑
‑effective teaching
technologies
Stimulate innovative
classes and activities
Adopt improved
management practices
Organize regular
meetings with parents
Student learn the curricular
topics
Students are motivated to complete the
program (lower dropout rate)
Students develop
enhanced socio‑‑emotional skills
Higher num‑ber of slots in schools deliv‑
ering affordable, quality education
More students engaged in
curricular and extracurricular
activities
More parents involved in school meetings
Communities where the
schools are located increase their income and
wellbeing

12 | Insper Metricis Guide to the Assessment of Socio‑Environmental Impact for Use in Impact‑Oriented Projects and Investments
to be more actionable by project managers than metrics related to broader, societal transformations.
■ They must be measured and verified with sufficient precision. In general, indicators based on objective information (“hard data”) are preferable to subjective indicators with high potential for measurement error. Furthermore, the data should not be susceptible to “gaming” (manipulation) by managers, investors and other parties interested in reporting positive results. In this sense, data collected by third parties (such as independent institutes) and widely used by actors in the project’s sector tend to be preferable with respect to the precision criterion.
■ They must be measured at low cost, including the cost of gathering data from populations used as a comparison (i.e. subjects in the control group). Measurement cost tends to drop with the use of publicly available (secondary) data, compared to customized (primary) data gathered specifically for the project.
As a suggestion, when considering alternative metrics, each one should be assessed based on the above criteria, selecting the one best aligned with the most attributes. Unfortunately, in most cases, it is not possible to meet all of those criteria; managers should then select metrics that best reflect the project’s objectives, as well as metrics broadly used and validated in the project’s activity. The theory of change will help identify the most relevant outcomes to be assessed, and it will be up to the evaluator to choose the most appropriate set of indicators.
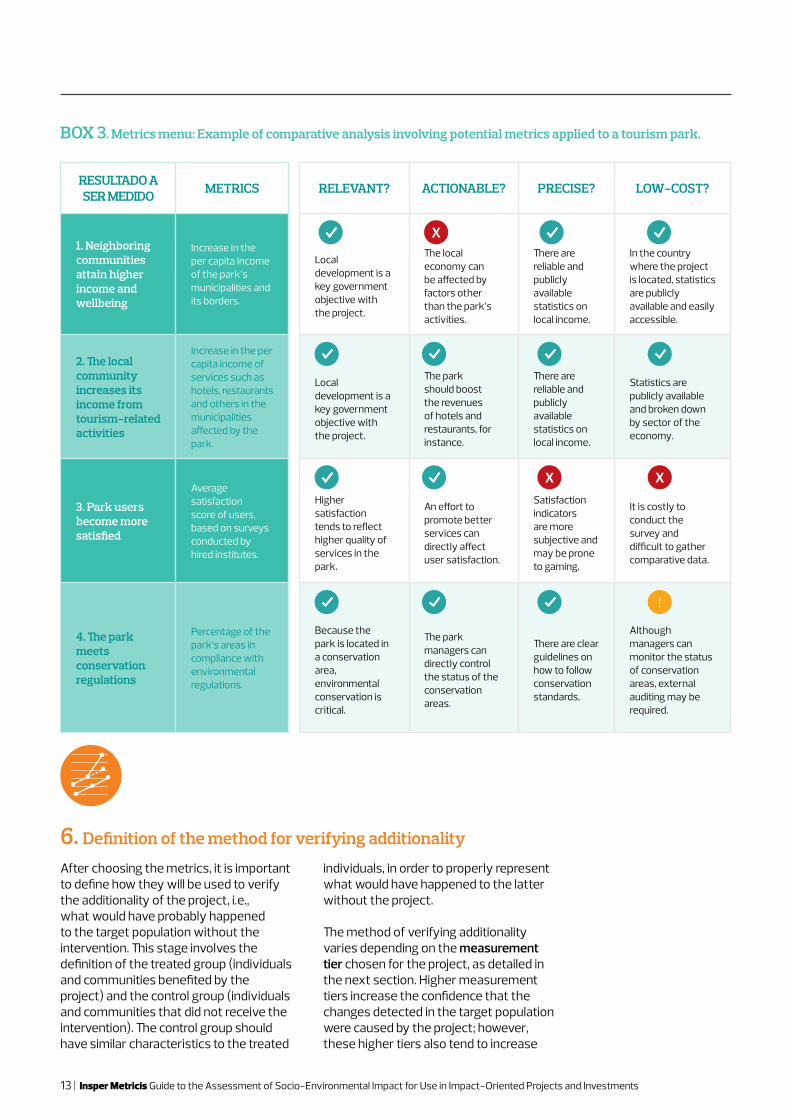
Considering the attributes discussed above, BOX 3 presents the metrics menu tool: a way to compare alternative metrics,
visually identifying their advantages and limitations. We recommend proceeding to the next steps involving impact evaluation after choosing one or more metrics whose attributes are generally favorable, even though all indicators can be followed for the purposes of monitoring the project.
The following example illustrates the choice of potential metrics for a park in a forest conservation area and with tourist attractions. The government is interested in establishing contractual targets of impact to guide the action of a private company selected to manage the park. There is a particular concern of developing the municipalities around the park, as well as assuring that the company will pursue environmental preservation. In the analysis shown in BOX 3, income‑‑related metrics are relevant, precise and low ‑cost; however, the metrics gauging income gains of tourism ‑related activities is more amenable to be affected by the private company, which can hire local people to work in the park or stimulate entrepreneurs to offer complementary services (such as hotels and restaurants). The indicator of user satisfaction, although relevant and actionable, is costly and less precise – it is based on users’ perceptions and subject to gaming (for instance, managers can influence data gathering to occur in moments of low visitation, thus reducing the incidence of complaints). The indicator with the percentage of areas following environmental regulations, if informed by the managing company, may require the government to hire external technical auditing, which tends to increase costs. We conclude that the second outcome indicator (income from tourism‑‑related activities) is a potential candidate for the next steps involving impact evaluation based on additionality, even though the other indicators can also be followed to monitor the project’s evolution.
It is recommended to choose a few
relevant outcome indicators for
assessing the project’s impact. Those indicators
should be closely linked with the
outcomes outlined in the theory of
change.
13 | Insper Metricis Guide to the Assessment of Socio‑Environmental Impact for Use in Impact‑Oriented Projects and Investments
RESULTADO A SER MEDIDO METRICS RELEVANT? ACTIONABLE? PRECISE? LOW ‑COST?
1. Neighboring communities attain higher income and wellbeing
Increase in the per capita income of the park’s municipalities and its borders.
Local development is a key government objective with the project.
The local economy can be affected by factors other than the park’s activities.
There are reliable and publicly available statistics on local income.
In the country where the project is located, statistics are publicly available and easily accessible.
2. The local community increases its income from tourism ‑related activities
Increase in the per capita income of services such as hotels, restaurants and others in the municipalities affected by the park.
Local development is a key government objective with the project.
The park should boost the revenues of hotels and restaurants, for instance.
There are reliable and publicly available statistics on local income.
Statistics are publicly available and broken down by sector of the economy.
3. Park users become more satisfied
Average satisfaction score of users, based on surveys conducted by hired institutes.
Higher satisfaction tends to reflect higher quality of services in the park.
An effort to promote better services can directly affect user satisfaction.
Satisfaction indicators are more subjective and may be prone to gaming.
It is costly to conduct the survey and difficult to gather comparative data.
4. The park meets conservation regulations
Percentage of the park’s areas in compliance with environmental regulations.
Because the park is located in a conservation area, environmental conservation is critical.
The park managers can directly control the status of the conservation areas.
There are clear guidelines on how to follow conservation standards.
Although managers can monitor the status of conservation areas, external auditing may be required.
BOX 3. Metrics menu: Example of comparative analysis involving potential metrics applied to a tourism park.
X
!
X X
After choosing the metrics, it is important to define how they will be used to verify the additionality of the project, i.e., what would have probably happened to the target population without the intervention. This stage involves the definition of the treated group (individuals and communities benefited by the project) and the control group (individuals and communities that did not receive the intervention). The control group should have similar characteristics to the treated
individuals, in order to properly represent what would have happened to the latter without the project.
The method of verifying additionality varies depending on the measurement tier chosen for the project, as detailed in the next section. Higher measurement tiers increase the confidence that the changes detected in the target population were caused by the project; however, these higher tiers also tend to increase
6. Definition of the method for verifying additionality

14 | Insper Metricis Guide to the Assessment of Socio‑Environmental Impact for Use in Impact‑Oriented Projects and Investments
At this stage, it is important to define the period of data collection, clearly indicating, if applicable, measurements that will occur before and after the intervention (see Figure 1). Project managers can also define intermediate measurements as a way to follow the project’s evolution. As discussed before, project managers should be aware that, in most cases, the verification of impact requires a reasonable timeframe after the expected interventions. For example, in education ‑related projects, where students’
learning requires a continuous and long ‑term effort, the time horizon tends to be long, especially if there is an interest in measuring the completion of an educational cycle or its impact on students’ future earnings.
The decision about the ideal temporal window to follow and measure the project’s outcomes can be informed by previous studies that evaluated the impact of similar interventions over time (as discussed in Stage 3, involving benchmarking).
8. Measurement timeline
7. Sampling planDefining the sample size (the number of people or groups that will participate in the project) is another crucial step in the measurement plan. This step, which is particularly important if higher measurement tiers are adopted, uses techniques that try to measure with precision the causal effect of the intervention on the target population. With an adequate sample size, the difference between the results measured before and after the project and the difference between the treated and control groups can be measured with greater statistical precision.
Essentially, a larger sample reduces the risk that the analyses will not verify a positive impact of the project, supposing that this positive effect really exists. In general, the recommended sample size depends on the expected size of the impact; all else being constant, the lower the expected impact, the larger the sample size required for statistical purposes. However, the costs of implementing the treatment and collecting the relevant data must also be taken into account8.
8. Uma discussão técnica sobre como definir o tamanho da amostra pode ser vis‑ta no texto de DUFLO, E.; GLENNERSTER, R.; KREMER, M. Using randomization in de‑velopment economics research: A toolkit, In T. P. Schultz, & J. Strauss (Eds.), Handbook of Development Economics: p. 3895‑‑3957. Amsterdam: Elsevier, 2008. Uma ferramenta prática para cálculo de tamanho amostral pode ser obtida em: Optimal De‑sign Software. Disponível em: https://sites.google.com/site/optimaldesignsoftware/home. Acesso em: 6 mai. 2019.
analytical complexity and costs. At this stage, especially if higher measurement tiers are adopted, we recommend the support of professionals to help identify the most appropriate techniques as well as their potential limitations.
After choosing the method to verify additionality, and based on the selected indicators, it is then important to define precisely how to measure the impact. In the example in Figure 1, impact is measured as the difference in the variation in income between the treated and control communities, considering the two pre‑‑defined periods. This measurement allows us to gauge the total impact size,
defined as the average gain per individual times the total number of individuals included in the treated group.
This step also involves a definition of the required time horizon to measure the impact. Several impact projects mandate an extended time horizon, due to inherent characteristics of the activity and the need to implement a complex set of complementary actions. Step 3, involving benchmarking, can also allow for an assessment of previous studies examining not only the size of the expected impact, but also how long it takes for the interventions to improve the desirable outcomes.

15 | Insper Metricis Guide to the Assessment of Socio‑Environmental Impact for Use in Impact‑Oriented Projects and Investments
Measurement tiers essentially define alternative ways to correct for external factors arising from pre ‑existing differences between the treated and control groups. For instance, suppose that a sponsor of educational projects wants to assess the effects of a new teaching method and the sponsor then offers this method to various schools. It is possible that the schools that will adhere to the program are precisely those schools whose managers are more motivated to pursue improvements in learning. If this variable affecting choice (“managerial motivation”) is not observed by the evaluator, then they will erroneously conclude that the improvements detected in the schools that voluntarily adhered to the program came from the interventions of the program itself, instead of the natural propensity of the chosen schools to improve their teaching.
To mitigate this error, specialists of impact evaluation with verification of additionality stress that, ideally, the treated and control groups should be chosen at random. However, randomizing individuals or groups is a particularly complex process, and in many cases even unfeasible. Regardless of whether the sponsors are funds, individuals, companies or
governments, the decision to invest or not in a particular project often follows a pre‑‑specified plan. Therefore, in most cases, sponsors and project managers have to adopt methods that try to correct for the pre ‑existing differences between the treated and control groups.
Whatever the verification method, it is important to strive for total transparency regarding the method’s likely limitations. Specifically, we propose below alternative measurement tiers that vary in accordance with the desired robustness of the assessment, especially in terms of the rigor with which the causal effect of the project is assessed. As seen in Figure 3, we begin with a type of measurement referred to as basic, which does not involve assessment of additionality, as a way to show how each additional level allows for more rigor in the estimation of the project’s impact. Because project managers usually adopt more than one metric, it is possible that the various selected indicators will be evaluated following distinct measurement tiers. Thus, it is likely that most indicators will be measured in the basic approach, whereas some selected indicators will be measured using the more robust measurement tiers.
MEASUREMENT TIERS
TIER 3
TIER 2
TIER 1
The treated group is randomly chosen (Randomized Controlled Trial, RCT)
Comparison of the treated group to subjects with similar characteristics
Comparison of the treated group to local or regional aggregated data
BASIC: Without verification of additionality; only the treated group’s evolution is assessed over time
Figure 3: Measurement Tiers for Verification of Additionality

16 | Insper Metricis Guide to the Assessment of Socio‑Environmental Impact for Use in Impact‑Oriented Projects and Investments
This approach does not involve verification of additionality and should not be considered a measurement tier, given that it does not adopt counterfactual analysis (i.e., what probably would have happened to the target population with the project). However, for a broad range of metrics, it is the most feasible method, given that it is easier to collect data from individuals and groups subject to the intervention. In this case, we simply observe how certain metrics varied over time, before and after the starting date of the project. This
practice is also widely used to monitor a scorecard of project ‑specific performance indicators for the treated populations, as discussed in Step 4. Despite its simplicity and practicality, managers should avoid inferring that any positive variation in the indicators was caused by the project. The target population itself may already have an improvement trend even before the interventions began. In addition, the project may have benefitted from external changes that positively affected the target population.
BOX 4. Example of verification of additionality at Tier 1
A food processing company decides to acquire agricultural products from small family farmers in certain low ‑income municipalities, while at the same time providing these farmers with technical and managerial support. The definition of the target communities is deliberately chosen by the project manager. Using the farmers’ income as an outcome metrics, the assessment of impact is done by comparing the income of families supported by the project to the aggregated income of families in rural areas in the municipality or locality where the investment was made, before and after the intervention. Additionality at Tier 1 is verified if the variation in the income of the supported families is higher than the variation in the aggregated income of families in the same regions.
At this tier, we use aggregated data as a form of comparison to what would have happened without the intervention. Prior to measurement, a deliberate choice is made of where the project will occur and who will benefit from it. In addition, for comparison purposes, we use aggregated data that are already available for the region or location where the investment is being made. It is important to obtain data about what happened to the target versus variations in the
aggregated indicators before and after the intervention (BOX 4).
In this case, we must take into account the size of the intervention. If the project affects a large number of individuals in a given region, the aggregate data will be significantly affected by the intervention, and the comparison will not be appropriate. A possibility in this case is to compare the treated group to individuals in other proximate and similar locations.
BASIC: Measurement of how the treated group evolved
Tier 1: Measurement comparing the treated group to local or regional aggregated data
Tier 2: Measurement using a control group with similar characteristics to the treated group
At this level, although randomization has not been carried out, we seek to create a control group with individuals or communities comparable to the treated cases. For this reason, verification of additionality at Tier 2 involves
techniques that are referred to as non ‑experimental. Similarly to Tier 1, whoever will benefit from the project is already predetermined. Moreover, in the evaluation process, techniques are implemented to construct a control

17 | Insper Metricis Guide to the Assessment of Socio‑Environmental Impact for Use in Impact‑Oriented Projects and Investments
BOX 5. Examples of verification of additionality at Tier 2
Example 5.1: In a project where the indicator to be assessed is household income (see Box 3), we compare the income levels of the treated households to those in the control group. The project manager deliberately defines who will benefit from the intervention. Households in the control group are then selected based on certain observable characteristics that are similar to those in the treated group. For example, a control group could consist of a handpicked set of households with initial levels of income and schooling and number of children that are similar to the levels observed in the treated group.
Example 5.2: An organization wants to implement a microfinance project. Managers can invite small entrepreneurs to participate in the program and then rank these entrepreneurs based on credit risk indicators (income, track record, etc.). If there is limited money to be disbursed as microloans, only the most highly ranked will be selected, based on a cutoff criterion defining a minimal acceptable credit risk. At the discontinuity of this particular cutoff, we can suppose that individuals are more or less similar to each other, since they have similar assessments of credit risk. We thus can compare the group of entrepreneurs selected just above the cutoff to those who were not selected, but were just below the selection cutoff in the ranking.
group of individuals who are similar to those in the treated group. In other words, instead of using aggregated data from a particular location, we seek to track groups or individuals that are similar to the treated individuals, but that did not receive the investment.
A common way to assess impact at Tier 2 is to employ the method of differences‑‑in ‑differences, exemplified in Figure 1. Following this method, the impact of the project is measured as the difference between the evolution of the outcome indicators of the treated group and the evolution of the outcome indicators of the control group. The evolution of the control group essentially serves as a counterfactual estimate: what would have happened to the target population without the intervention.
Notice that Tier 2 requires that the treated and control groups are truly comparable in terms of their underlying traits and the past evolution of their outcome indicators. Thus, in the differences‑‑in ‑differences method, the outcome metrics of the treated and control groups should exhibit a similar trend before the intervention. In Figure 1, the treated and control communities evolved “in parallel” before the project’s start, thus suggesting that they were affected by similar factors. Divergent trends would suggest that groups were evolving in distinct ways due to various factors unrelated to the project.
Another common way of choosing individuals with similar characteristics between the control and treated groups involves a technique called matching. In this technique, based on observable characteristics that are relevant to influencing the participation of individuals in the program (such as age, gender, income, etc.), we try to find one or more subjects that are as similar as possible to each subject treated (see example 5.1. in BOX 5). Matching techniques are also commonly used in combination with the differences ‑in ‑differences technique.
In cases where there is competition to participate in the project and a particular selection criterion, another possibility is to consider groups at the discontinuity between those who were almost rejected (treated) and those who were almost accepted for the project but were below the selection cutoff (control) (see example 5.2 in BOX 5).
Still in other situations where only a particular case is assessed (e.g., a single organization or municipality), there is the possibility of creating a synthetic control from the combination of other cases that collectively approximate the treated case. This technique requires the availability of data of the treated case and other potential cases before starting the project, as a way to create a synthetic control that can adequately replicate the evolution of the case that received the intervention9.
9. As an example of matching technique see ABADIE, A.; DRUKKER, D.; HERR, J. L.; IMBENS, G. W. Implementing matching estimators for average treatment effects. The Stata Journal, 4(3): 290–311, 2004. For a general discussion involving various methods, see ANGRIST, J.; PISCHKE, J. ‑S. Mostly Harmless Econometrics, Princeton: Princeton University Press, 2009 and MENEZES FILHO, N. A. (ed.). Avaliação Econômica de Projetos Sociais. São Paulo: Dinâmica Gráfica e Editora, 2012.The synthetic control technique can be seen in ABADIE, A.; DIAMOND, A.; HANMUELLER, J. Synthetic control methods for comparative case studies: Estimating the effect of Cal‑ifornia’s tobacco control program. Journal of the American Statistical Association, 105(490): 493 ‑505, 2010.

18 | Insper Metricis Guide to the Assessment of Socio‑Environmental Impact for Use in Impact‑Oriented Projects and Investments
Tier 3, which involves experimental techniques, allows for maximum confidence in the impact estimation. At this tier, the decision of which individuals or groups will be subject to the intervention is made at random, thereby reducing potential biases in the selection of the project’s beneficiaries. In cases where it is neither possible nor desirable to exclude certain groups, an alternative is to implement an experimental design where the randomly selected group is encouraged to adopt what is proposed by the intervention (BOX 6).
If performed correctly, random selection will guarantee there are no differences between the treated and control groups. For this reason, Tier 3 methods in general do not require to measure outcomes prior to the intervention, as indicated in Figure 1. Following adequate randomization procedures, impact
evaluators can assess the comparative performance of the treated and control groups after the project was implemented.
At this tier, it is particularly important to pay attention to the correct computations of minimal sample size, as discussed in Step 7 of the previous section. It is also important to distinguish between random sampling and randomly assigned selection of treated groups. For instance, suppose that a given education project targeted 30 schools in such a way that the choice of schools was arbitrary, without randomization. Tier 3 would not be met in this particular case even if managers randomly chose another 30 schools. That is because the selection of those who received the intervention was not based on random assignment, thereby creating the risk that other unobservable factors will bias the impact assessment of the treated group.
BOX 6. Examples of verification of additionality at Tier 3
Example 6.1: A company offers a microcredit program in a location where there is no possibility of funding the community as a whole. Managers can invite potential recipients and then randomly choose who will receive credit. Alternatively, the company can lend to the best ranked entrepreneurs in terms of their credit risk, and then randomize among the set of individuals that were almost selected, that is, who were just below the minimal credit risk adopted as a cutoff criterion. Taking this set of entrepreneurs, the company can randomly pick a group of treated individuals who will receive credit; the group of non ‑selected individuals according to this randomization procedure will then comprise the control group.
Example 6.2: Students in a broad set of public schools are granted access to an online learning technological platform. Even though all students have access to the platform, a group of students is randomly selected to receive messages stimulating its use. Considering that only a fraction of the students who received the messages will in fact use the platform (i.e., only those students will be effectively treated), it is possible to compare the performance of those students to the performance of the control group of students who did not receive the messages. This analysis, however, requires statistical adjustments, since we should assess the performance of those who effectively used the platform, not necessarily those who received or not the stimulus10.
Tier 3: Measurement with randomization (RTC)
10. To assess the effect of the interven‑tion in this case, one option is to use the estimator known as LATE (Local Aver‑age Treatment Effect). See ANGRIST, J; PISCHKE, J. ‑S., op. cit.

19 | Insper Metricis Guide to the Assessment of Socio‑Environmental Impact for Use in Impact‑Oriented Projects and Investments
Table 1 presents a comparative assessment of the benefits and limitations of each measurement tier. In general, the assessment of impact becomes more robust as we move towards Tier 3, since we can better guarantee that the
project did cause the observed changes in the target population. However, at the same time, the complexity of the design and analyses increases, requiring more financial and technical resources to carry out the evaluation.
COMPARING THE MEASUREMENT TIERS
ADVANTAGES LIMITATIONS
Basic
■ Data are more easily collected from the project itself and its target population.
■ Higher analytical simplicity (simple comparison of what happened to the target population before and after the project starts).
■ Because there is no counterfactual assessment (what would have happened to the target population without the project), there is no verification of additionality.
Tier 1
■ In most cases, managers have access only to aggregated data (for instance, municipal income instead of household income).
■ Compared to other methods for verifying additionality, the analysis is simpler (project outcomes versus aggregated outcomes).
■ The characteristics of the broader population can be very distinct from the target population, even in the same geographical area.
■ The comparison does not allow for a causal assessment of the project, since there is no use of techniques to control for potential differences across groups.
Tier 2
■ In most cases, the target population is already defined, thus rendering randomization unfeasible.
■ By creating control groups with similar characteristics to the target population, Tier 2 methods avoid bias generated by marked differences between groups.
■ The various techniques at Tier 2 allow for statistical inference on the impact observed in the treated group in comparison to the control group.
■ Tier 2 techniques only allow for a causal effect of the intervention if we assume that there is no critical influence of factors that are not observed and measured, which is difficult to verify in practice.
■ It is necessary to gather information on the characteristics of individuals included in the treated and control groups.
■ Tier 2 techniques require the existence of cases in the control group that are proximate, in their underlying traits, to the cases in the control group. Otherwise, comparison is unfeasible.
Tier 3
■ Through randomization, it is possible to guarantee with higher confidence that the measured effect was effectively caused by the project.
■ In general, randomization does not require the measurement of outcomes prior to the project’s start; subjects can be compared after the implementation of interventions.
■ Tier 3 techniques require special attention to sample size. Their use can be unfeasible in cases where there are few cases receiving the intervention.
■ Experimental designs at Tier 3 are highly subject to spillover effects, attrition, and other problems discussed in the next section of the Guidelines.
■ Randomization can create ethical dilemmas in cases where it is problematic to exclude individuals from a certain intervention.
Table 1 – Advantages and limitations of measurement tiers

20 | Insper Metricis Guide to the Assessment of Socio‑Environmental Impact for Use in Impact‑Oriented Projects and Investments
Externalities or “spillovers” between individuals from different groups should be minimized as much as possible. Consider, for instance, that we want to assess the impact of a company’s initiative to increase the overall income of a community in a given location. To do so, before the project begins, we collect data on this community and on the neighboring community, which does not benefit from the project. Externalities occur if the treated community, which receives higher income as a result of the investment, can spend part of its resources on either buying products from or transferring income to the other
community. If this occurs, the program’s additional impact will be underestimated.
These externalities are problematic for impact assessments, since they can distort the result by “contaminating” the control group with the intervention in the treated group. To circumvent this problem, it is important to ensure there is no communication, information exchange or physical exchange of goods and services between the different groups. One way to proceed is to make sure the treated and control groups are geographically distant or isolated, thus diminishing the risk of spillovers.
MEASUREMENT PRECAUTIONS Some extremely important precautions should be taken into account when performing a satisfactory impact assessment. Below, we describe some critical issues that the project manager should consider when measuring impact11.
EXTERNALITIES
ATTRITION
Given the time between the intervention and the subsequent evaluation, it is possible to expect a mismatch between individuals who were initially observed and those monitored at the final round of measurement in both the control and treated groups. For instance, some individuals who were observed at the baseline may no longer reside in the same location during the final round of measurement. It is worth noting that despite the importance of randomization in this methodology, randomization does not completely prevent non ‑random attrition at the end. Moreover, attrition problems reinforce the need to define a sufficiently large sample size before performing the measurement.
A practical example of this problem can be seen when assessing projects aimed
at increasing income in rural communities. Even though the groups initially may have been selected in a random manner, the exit of individuals who did not receive the income transfer versus the continuity of individuals who received the transfer could cause non ‑random attrition. In this case, attrition induces biases because we lose a large and non ‑random amount of data on individuals in the control group.
It is always important to be transparent about the level of attrition in both the treated and control groups. In other words, it is necessary to state how many individuals in the treated and control groups were initially monitored, but were not found in the subsequent rounds of measurement, as well as compare the average characteristics of treated and control groups before and after attrition.
Externalities can distort the impact
measurement by causing a
“contamination” of the control
group with the intervention made
in the treated group.
11. This section is heavily based on DUFLO et al., op. cit.

21 | Insper Metricis Guide to the Assessment of Socio‑Environmental Impact for Use in Impact‑Oriented Projects and Investments
Finally, another major limitation in measuring impact is the behavioral change of individuals in the treated group as well as in the control group. The so‑‑called Hawthorne effect may occur when the individuals in the treated group perceive that they are under some form of intervention and consequently change their behavior accordingly. In education projects, for example, professors or students may increase their efforts as a result of their awareness that the group is being benefitted by the intervention.
The John Henry effect, in turn, may occur when professors in the control group feel challenged and start to compete with their counterparts in the treated group to show that they also would be eligible to benefit from the same program. Conversely, if professors become less motivated because they are not receiving the benefits of the treated group, the program’s impact will be overestimated. In both cases, the program’s real effect can be distorted.
Although behavioral responses are always complex, there are ways to design the measurement to minimize the Hawthorne and John Henry effects. For example, three groups can be used: treatment, control and placebo. The latter is a group that is observed or maintains a relationship with the project managers, but without actually benefiting from the project.
Consider, for example, a project in which a large firm wants to improve the income of certain communities by procuring local inputs from them. Then the firm should consider not only a community of actual suppliers (treatment) and a comparable community of non ‑suppliers (control), but also monitor a placebo community of non‑‑suppliers with which the firm has some form of relationship (e.g., the firm could send procurement managers to contact communities without actually establishing procurement contracts). Impact should occur in the treated group above and beyond the control and placebo groups.
HAWTHORNE 12 AND JOHN HENRY EFFECTS13
12. The Hawthorne effect was named after an experience in 1927 at the factory of the West Electric Company (Chicago, USA), where it was found that individuals changed their behavior according to per‑ceived changes in the work environment.
13. The John Henry effect is based on a tale of a worker in a location where a new tool to increase productivity was introduced, still in the testing phase. On this occasion, the person felt challenged to work harder in order to show that he could outperform the new technology.

22 | Insper Metricis Guide to the Assessment of Socio‑Environmental Impact for Use in Impact‑Oriented Projects and Investments
This Guide emphasizes procedures to estimate the impact of a project based on certain objectives and outcomes outlined by the proposed theory of change. Therefore, it is not the purpose of the Guide to discuss how to compute the economic return of the socio‑‑environmental intervention, as a function of how much it was spent to promote it, compared to the benefits generated to treated individuals.
There is no single way to compute the economic return of a social project, especially when the benefit is measured in terms of non ‑monetary indicators. Yet, it is good managerial practice to ask whether, with the amount invested, we could possibly obtain superior outcomes, or, viewed from a different angle, if the same outcomes could have been obtained with fewer resources.
A possibility, along these lines, is to construct plausible scenarios of how the outcome indicators will result in monetary gains – that is, the cost‑‑benefit ratio of the project. In some cases, one can compare the social or environmental indicators of two distinct projects, but whose objectives and amount of spent resources are the same.
For instance, a study in education showed that increasing school hours from 4 to 5 hours or reducing class sizes from 38 to 30 students had similar impacts on student grades. Yet, when their costs were considered, the project involving increased school hours had the largest cost ‑benefit ratio14.
In cases where results differ across projects, it is necessary to attach monetary values to a given amount of impact that was estimated. For instance, an educational project in high schools can enhance student learning and increase the likelihood that students will go to a good university, with positive impact on their future income gains. These gains can be compared to the cost of the project.
Another possibility is to estimate beneficiaries’ willingness to pay. The methodology involves asking directly to the public of interest how much they would be willing to pay for a particular good or service. It is sometimes used to value cultural projects or initiatives designed to increase satisfaction from a certain activity (such as visits to parks or museums). The “price” reported by the service users can then be compared to its cost.
ASSESSING THE ECONOMIC RETURN OF THE PROJECT
14. OLIVEIRA, J. M. Custo ‑efetividade de políticas de redução do tamanho da classe e de ampliação da jornada escolar: uma aplicação de estimadores de matching. Relatório de pesquisa, 11° Prêmio BNDES de Economia, 2010.

Insper Metricis
Guide to the assessment of socio ‑environmental impact for
use in impact ‑oriented projects and investments: general guide focused
on verification of additionality. – 4th. ed. ‑ São Paulo: Insper, 2020.
24 p. ill.: col. 29,7cm
1. Impact investing 2. Impact evaluation 3. Additionality
4. Socio ‑environmental 5. Project Management
I. Insper Metricis II. Title
CDU 504
Cataloging: Ricardo Rodrigues Ramos CRB 8/9309
I59g
Cataloging ‑in ‑Publication Data (CIP)