Embed Size (px)
Citation preview

Guide to the Markets
MARKET INSIGHTS
Europe | |1Q 2020 As of 31 December 2019

2
Global Market Insights Strategy Team
Vincent JuvynsLuxembourg
Tilmann Galler, CFAFrankfurt
Maria Paola ToschiMilan
Shogo MaekawaTokyo
Lucia Gutierrez MelladoMadrid
Tai HuiHong Kong
Marcella ChowHong Kong
Ian HuiHong Kong
Yoshinori ShigemiTokyo
Kerry Craig, CFAMelbourne
Dr. Jasslyn Yeo, CFASingapore
Karen WardLondon
Ambrose Crofton, CFALondon
Chaoping Zhu, CFAShanghai
Jai Malhi, CFALondon
Manuel Arroyo Ozores, CFAMadrid
Agnes LinTaipei
Michael Bell, CFALondon
Alex Dryden, CFANew York
Samantha AzzarelloNew York
Dr. David Kelly, CFANew York
Dr. Cecelia MundtNew York
Meera Pandit, CFANew York
John ManleyNew York
Tyler Voigt, CFANew York
Gabriela SantosNew York
David LebovitzNew York
Jordan JacksonNew York
Jennie LiNew York
Hannah AndersonHong Kong
Hugh Gimber, CFALondon
3
Page reference Global economy
4. Global growth5. Global Purchasing Managers’ Index (PMI) for manufacturing6. Global unemployment7. Global inflation8. Global core inflation and inflation expectations9. Global central bank policy10. Global currencies11. Global trade12. Productivity and population growth13. US GDP14. US economic health monitor15. US business surveys16. US business investment17. US consumer18. US labour market19. US non-farm payrolls and initial jobless claims20. US Conference Board indicators21. US household and corporate finances22. US inflation23. US Federal Reserve policy rate24. US politics25. US focus: Labour market and confidence26. Eurozone GDP27. Eurozone business investment28. Eurozone consumer29. Eurozone labour market30. Eurozone unemployment31. Eurozone inflation32. European Central Bank policy rate33. Eurozone debt34. Eurozone government debt and bond spreads35. Eurozone focus: Trade and the manufacturing sector36. UK GDP37. UK consumer38. UK inflation39. UK focus: Business investment and fiscal spending40. Japan GDP41. China GDP42. China debt43. China inflation and policy rates44. Emerging market currencies and current account45. Emerging market structural dynamics46. Emerging market focus: China trade and relative EM equity
performance
Equities
47. Global earnings expectations and equity valuations48. Global income49. Global equity sector weights50. Equity issuance and buybacks51. US earnings52. US equity valuations53. US valuations and subsequent returns54. Equities and interest rates55. US bull and bear markets56. Europe earnings57. Europe equity valuations58. Europe equity market and currency59. Europe large, mid and small capitalisation equities60. UK earnings61. UK equity market and currency62. Japan earnings63. Japan equity market and currency64. Emerging market equity drivers65. Emerging market equity valuations and subsequent returns66. Equity focus: Margin pressures67. World stock market returns
Fixed income
68. Fixed income yields and interest rate risk69. Global government bond yields70. US yield curve71. US investment-grade bonds72. US high yield bonds73. Europe and UK investment-grade bonds74. Europe high yield bonds75. Emerging market bonds76. Fixed income focus: Negative-yielding debt and bond market
returns77. Global fixed income spreads and returns
Other assets
78. Commodities79. Gold80. Stock-bond correlation and downside protection81. Alternative investments82. Sustainable investment strategies83. Sustainable investment policy interventions and market size84. Asset return expectations85. The cost of hedging
Investing principles
86. Life expectancy87. The effect of compounding88. Cash investments89. Long-term asset returns90. Annual returns and intra-year declines91. Asset class risk-return trade-off92. S&P 500 and fund flows93. US asset returns by holding period94. Asset class returns (EUR)
4
|GTM – Europe
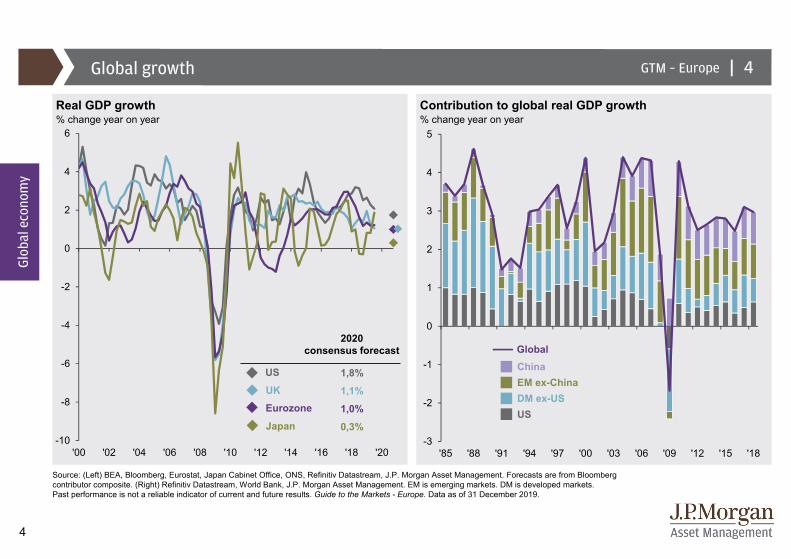
2020consensus forecast
1,8%
1,1%
1,0%
0,3%
Global growth
Real GDP growth Contribution to global real GDP growth% change year on year % change year on year
Source: (Left) BEA, Bloomberg, Eurostat, Japan Cabinet Office, ONS, Refinitiv Datastream, J.P. Morgan Asset Management. Forecasts are from Bloomberg contributor composite. (Right) Refinitiv Datastream, World Bank, J.P. Morgan Asset Management. EM is emerging markets. DM is developed markets. Past performance is not a reliable indicator of current and future results. Guide to the Markets - Europe. Data as of 31 December 2019.
4
Glob
al e
cono
my
UK
US
Eurozone
Japan
China EM ex-ChinaDM ex-USUS
Global
-3
-2
-1
0
1
2
3
4
5
'85 '88 '91 '94 '97 '00 '03 '06 '09 '12 '15 '18-10
-8
-6
-4
-2
0
2
4
6
'00 '02 '04 '06 '08 '10 '12 '14 '16 '18 '20
5
50,3 50,1
49,5 49,1
51,0 51,0
46,9 46,3
51,7 50,4
44,1 43,7
47,6 46,2
47,5 47,4
54,1 53,9
49,7 49,5
45,7 47,1
48,8 50,2
48,9 47,5
52,6 52,4
48,9 48,4
51,8 51,5
48,2 49,5
49,4 50,1
49,8 50,8
51,2 52,7
52,9 50,2
48,0 47,1
45,6 47,5
2011 20122008 2009 20102019
2013 2014 2015 2016 2017 2018 2019
India
Indonesia
Greece
Germany
China
USUK
EurozoneFrance
ItalySpain
Ireland
Japan
Korea
Global
Developed
Emerging
Taiwan
MexicoBrazil
Russia
SwitzerlandSweden
Euro
zone
Dev
elop
edEm
ergi
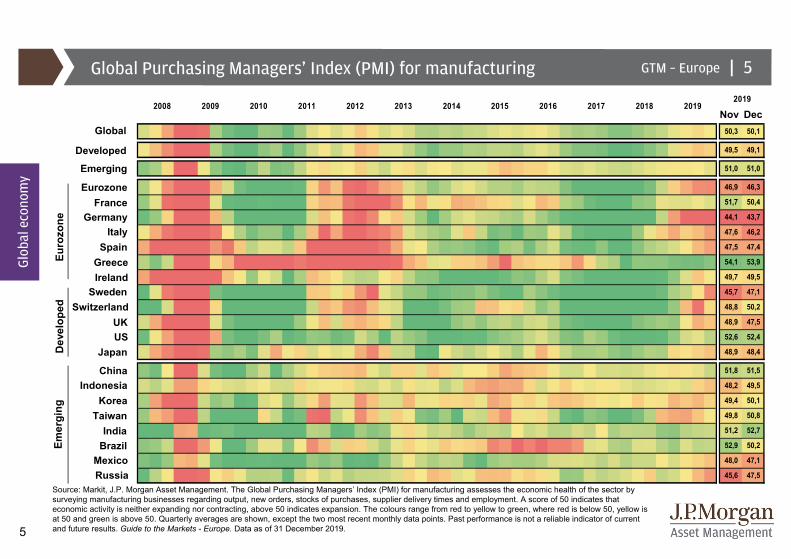
ngGlobal Purchasing Managers’ Index (PMI) for manufacturing
Source: Markit, J.P. Morgan Asset Management. The Global Purchasing Managers’ Index (PMI) for manufacturing assesses the economic health of the sector by surveying manufacturing businesses regarding output, new orders, stocks of purchases, supplier delivery times and employment. A score of 50 indicates that economic activity is neither expanding nor contracting, above 50 indicates expansion. The colours range from red to yellow to green, where red is below 50, yellow is at 50 and green is above 50. Quarterly averages are shown, except the two most recent monthly data points. Past performance is not a reliable indicator of current and future results. Guide to the Markets - Europe. Data as of 31 December 2019.
GTM – Europe |
Glob
al e
cono
my
5
Nov Dec
6
|GTM – Europe
0
2
4
6
8
10
12
14
'00 '02 '04 '06 '08 '10 '12 '14 '16 '18 '20
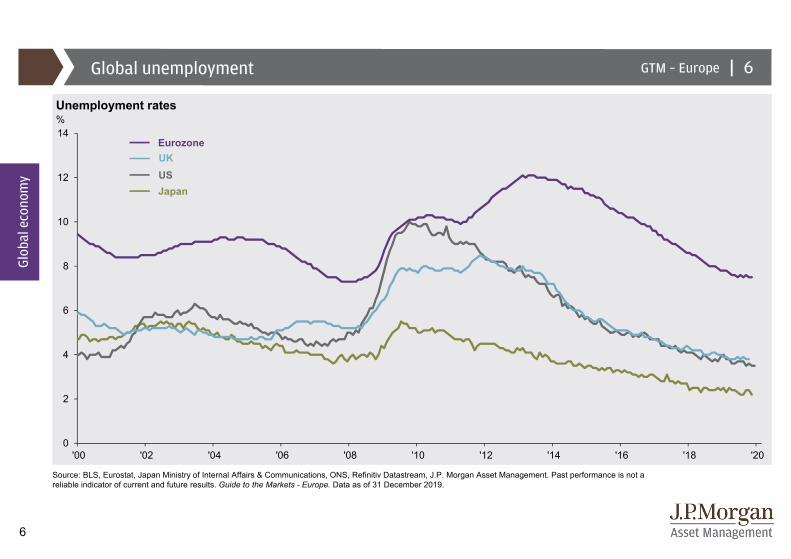
Global unemployment
Unemployment rates%
Source: BLS, Eurostat, Japan Ministry of Internal Affairs & Communications, ONS, Refinitiv Datastream, J.P. Morgan Asset Management. Past performance is not a reliable indicator of current and future results. Guide to the Markets - Europe. Data as of 31 December 2019.
Glob
al e
cono
my
6
US
Eurozone
Japan
UK
7
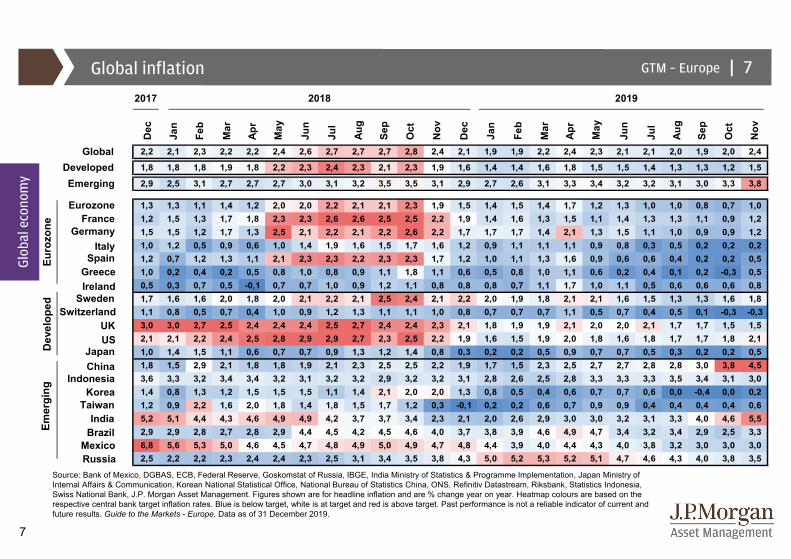
Global inflation
Source: Bank of Mexico, DGBAS, ECB, Federal Reserve, Goskomstat of Russia, IBGE, India Ministry of Statistics & Programme Implementation, Japan Ministry of Internal Affairs & Communication, Korean National Statistical Office, National Bureau of Statistics China, ONS, Refinitiv Datastream, Riksbank, Statistics Indonesia, Swiss National Bank, J.P. Morgan Asset Management. Figures shown are for headline inflation and are % change year on year. Heatmap colours are based on the respective central bank target inflation rates. Blue is below target, white is at target and red is above target. Past performance is not a reliable indicator of current and future results. Guide to the Markets - Europe. Data as of 31 December 2019.
Glob
al e
cono
my
GTM – Europe | 7
India
Indonesia
Greece
Germany
USUK
EurozoneFrance
ItalySpain
Ireland
JapanChina
Korea
GlobalDevelopedEmerging
Taiwan
MexicoBrazil
Russia
SwitzerlandSweden
Euro
zone
Dev
elop
edEm
ergi
ng
2,2 2,1 2,3 2,2 2,2 2,4 2,6 2,7 2,7 2,7 2,8 2,4 2,1 1,9 1,9 2,2 2,4 2,3 2,1 2,1 2,0 1,9 2,0 2,4
1,8 1,8 1,8 1,9 1,8 2,2 2,3 2,4 2,3 2,1 2,3 1,9 1,6 1,4 1,4 1,6 1,8 1,5 1,5 1,4 1,3 1,3 1,2 1,5
2,9 2,5 3,1 2,7 2,7 2,7 3,0 3,1 3,2 3,5 3,5 3,1 2,9 2,7 2,6 3,1 3,3 3,4 3,2 3,2 3,1 3,0 3,3 3,8
1,3 1,3 1,1 1,4 1,2 2,0 2,0 2,2 2,1 2,1 2,3 1,9 1,5 1,4 1,5 1,4 1,7 1,2 1,3 1,0 1,0 0,8 0,7 1,01,2 1,5 1,3 1,7 1,8 2,3 2,3 2,6 2,6 2,5 2,5 2,2 1,9 1,4 1,6 1,3 1,5 1,1 1,4 1,3 1,3 1,1 0,9 1,21,5 1,5 1,2 1,7 1,3 2,5 2,1 2,2 2,1 2,2 2,6 2,2 1,7 1,7 1,7 1,4 2,1 1,3 1,5 1,1 1,0 0,9 0,9 1,21,0 1,2 0,5 0,9 0,6 1,0 1,4 1,9 1,6 1,5 1,7 1,6 1,2 0,9 1,1 1,1 1,1 0,9 0,8 0,3 0,5 0,2 0,2 0,21,2 0,7 1,2 1,3 1,1 2,1 2,3 2,3 2,2 2,3 2,3 1,7 1,2 1,0 1,1 1,3 1,6 0,9 0,6 0,6 0,4 0,2 0,2 0,51,0 0,2 0,4 0,2 0,5 0,8 1,0 0,8 0,9 1,1 1,8 1,1 0,6 0,5 0,8 1,0 1,1 0,6 0,2 0,4 0,1 0,2 -0,3 0,50,5 0,3 0,7 0,5 -0,1 0,7 0,7 1,0 0,9 1,2 1,1 0,8 0,8 0,8 0,7 1,1 1,7 1,0 1,1 0,5 0,6 0,6 0,6 0,81,7 1,6 1,6 2,0 1,8 2,0 2,1 2,2 2,1 2,5 2,4 2,1 2,2 2,0 1,9 1,8 2,1 2,1 1,6 1,5 1,3 1,3 1,6 1,81,1 0,8 0,5 0,7 0,4 1,0 0,9 1,2 1,3 1,1 1,1 1,0 0,8 0,7 0,7 0,7 1,1 0,5 0,7 0,4 0,5 0,1 -0,3 -0,33,0 3,0 2,7 2,5 2,4 2,4 2,4 2,5 2,7 2,4 2,4 2,3 2,1 1,8 1,9 1,9 2,1 2,0 2,0 2,1 1,7 1,7 1,5 1,52,1 2,1 2,2 2,4 2,5 2,8 2,9 2,9 2,7 2,3 2,5 2,2 1,9 1,6 1,5 1,9 2,0 1,8 1,6 1,8 1,7 1,7 1,8 2,11,0 1,4 1,5 1,1 0,6 0,7 0,7 0,9 1,3 1,2 1,4 0,8 0,3 0,2 0,2 0,5 0,9 0,7 0,7 0,5 0,3 0,2 0,2 0,51,8 1,5 2,9 2,1 1,8 1,8 1,9 2,1 2,3 2,5 2,5 2,2 1,9 1,7 1,5 2,3 2,5 2,7 2,7 2,8 2,8 3,0 3,8 4,53,6 3,3 3,2 3,4 3,4 3,2 3,1 3,2 3,2 2,9 3,2 3,2 3,1 2,8 2,6 2,5 2,8 3,3 3,3 3,3 3,5 3,4 3,1 3,01,4 0,8 1,3 1,2 1,5 1,5 1,5 1,1 1,4 2,1 2,0 2,0 1,3 0,8 0,5 0,4 0,6 0,7 0,7 0,6 0,0 -0,4 0,0 0,21,2 0,9 2,2 1,6 2,0 1,8 1,4 1,8 1,5 1,7 1,2 0,3 -0,1 0,2 0,2 0,6 0,7 0,9 0,9 0,4 0,4 0,4 0,4 0,65,2 5,1 4,4 4,3 4,6 4,9 4,9 4,2 3,7 3,7 3,4 2,3 2,1 2,0 2,6 2,9 3,0 3,0 3,2 3,1 3,3 4,0 4,6 5,52,9 2,9 2,8 2,7 2,8 2,9 4,4 4,5 4,2 4,5 4,6 4,0 3,7 3,8 3,9 4,6 4,9 4,7 3,4 3,2 3,4 2,9 2,5 3,36,8 5,6 5,3 5,0 4,6 4,5 4,7 4,8 4,9 5,0 4,9 4,7 4,8 4,4 3,9 4,0 4,4 4,3 4,0 3,8 3,2 3,0 3,0 3,02,5 2,2 2,2 2,3 2,4 2,4 2,3 2,5 3,1 3,4 3,5 3,8 4,3 5,0 5,2 5,3 5,2 5,1 4,7 4,6 4,3 4,0 3,8 3,5
Apr
Mar
2017
Dec
Jan
Feb
2018
Mar
May
Jun
Jul
Aug
Nov
Sep
Oct
Dec Jan
2019
Feb
May
Apr
Jul
Jun
Aug
Sep
Oct
Nov
8
|GTM – Europe
-2
-1
0
1
2
3
4
5
'07 '09 '11 '13 '15 '17 '19
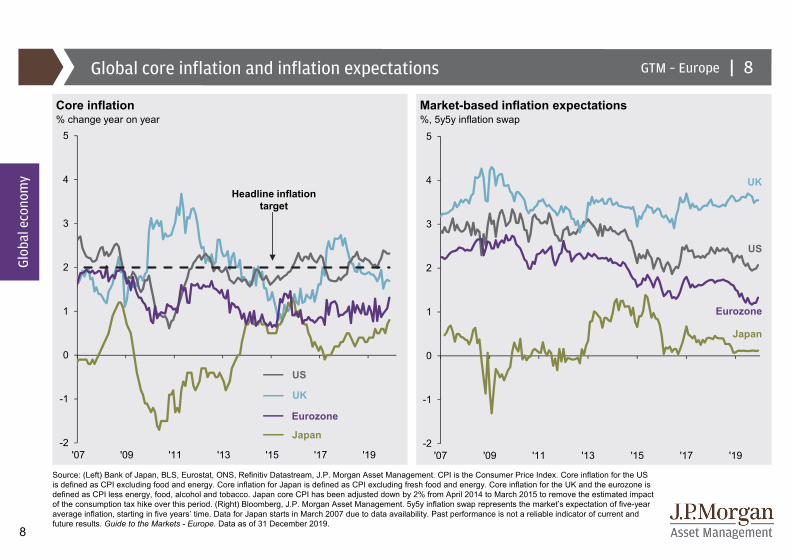
Global core inflation and inflation expectations
Core inflation Market-based inflation expectations% change year on year %, 5y5y inflation swap
Source: (Left) Bank of Japan, BLS, Eurostat, ONS, Refinitiv Datastream, J.P. Morgan Asset Management. CPI is the Consumer Price Index. Core inflation for the US is defined as CPI excluding food and energy. Core inflation for Japan is defined as CPI excluding fresh food and energy. Core inflation for the UK and the eurozone is defined as CPI less energy, food, alcohol and tobacco. Japan core CPI has been adjusted down by 2% from April 2014 to March 2015 to remove the estimated impact of the consumption tax hike over this period. (Right) Bloomberg, J.P. Morgan Asset Management. 5y5y inflation swap represents the market’s expectation of five-year average inflation, starting in five years’ time. Data for Japan starts in March 2007 due to data availability. Past performance is not a reliable indicator of current and future results. Guide to the Markets - Europe. Data as of 31 December 2019.
Headline inflation target
-2
-1
0
1
2
3
4
5
'07 '09 '11 '13 '15 '17 '19
Japan
UK
US
Eurozone
8
Glob
al e
cono
my
US
Eurozone
Japan
UK
9
|GTM – Europe
0
2
4
6
8
10
12
14
16
18
-1.0
-0.5
0.0
0.5
1.0
1.5
2.0
2.5
3.0
'07 '08 '09 '10 '11 '12 '13 '14 '15 '16 '17 '18 '19 '20
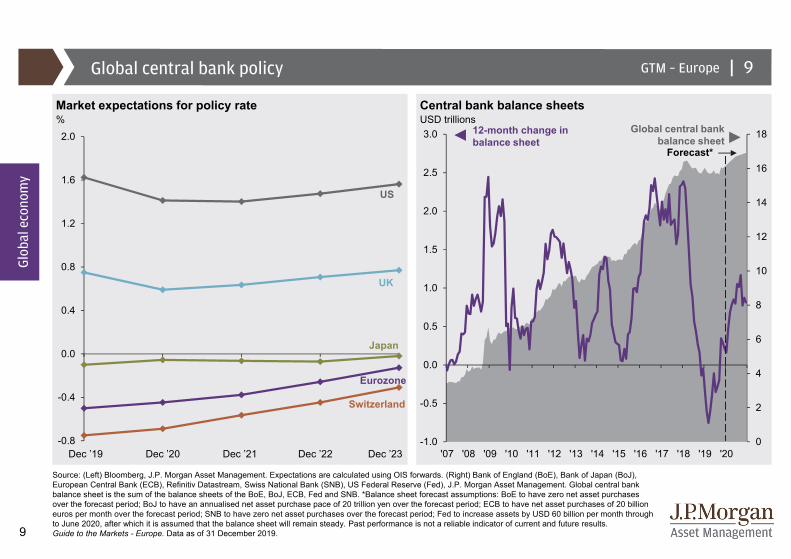
Global central bank balance sheet
Global central bank policy
Market expectations for policy rate Central bank balance sheets% USD trillions
Source: (Left) Bloomberg, J.P. Morgan Asset Management. Expectations are calculated using OIS forwards. (Right) Bank of England (BoE), Bank of Japan (BoJ), European Central Bank (ECB), Refinitiv Datastream, Swiss National Bank (SNB), US Federal Reserve (Fed), J.P. Morgan Asset Management. Global central bank balance sheet is the sum of the balance sheets of the BoE, BoJ, ECB, Fed and SNB. *Balance sheet forecast assumptions: BoE to have zero net asset purchases over the forecast period; BoJ to have an annualised net asset purchase pace of 20 trillion yen over the forecast period; ECB to have net asset purchases of 20 billion euros per month over the forecast period; SNB to have zero net asset purchases over the forecast period; Fed to increase assets by USD 60 billion per month through to June 2020, after which it is assumed that the balance sheet will remain steady. Past performance is not a reliable indicator of current and future results. Guide to the Markets - Europe. Data as of 31 December 2019.
Glob
al e
cono
my
9
-0.8
-0.4
0.0
0.4
0.8
1.2
1.6
2.0
US
Eurozone
Japan
UK
Switzerland
Dec ’19 Dec ’20 Dec ’22Dec ’21 Dec ’23
Forecast*
12-month change in balance sheet
10
|GTM – Europe
60
70
80
90
100
110
120
130
140
150
160
'75 '77 '79 '81 '83 '85 '87 '89 '91 '93 '95 '97 '99 '01 '03 '05 '07 '09 '11 '13 '15 '17 '19
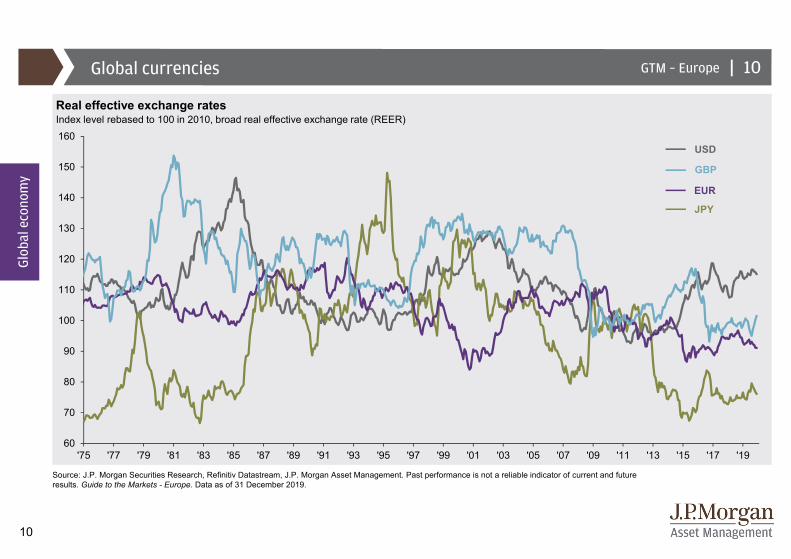
Global currencies
Real effective exchange ratesIndex level rebased to 100 in 2010, broad real effective exchange rate (REER)
Source: J.P. Morgan Securities Research, Refinitiv Datastream, J.P. Morgan Asset Management. Past performance is not a reliable indicator of current and future results. Guide to the Markets - Europe. Data as of 31 December 2019.
Glob
al e
cono
my
10
USD
EUR
JPY
GBP

11
|GTM – Europe
0 5 10 15 20 25 30 35 40 45-4
-2
0
2
4
6
8
'12 '13 '14 '15 '16 '17 '18 '19
Global trade
Exports of goods Global export volumes% of nominal GDP, 2018 % change year on year, three-month moving average
Source: (Left) IMF Direction of Trade, IMF World Economic Outlook, J.P. Morgan Asset Management. (Right) CPB Netherlands, Refinitiv Datastream, J.P. Morgan Asset Management. Past performance is not a reliable indicator of current and future results. Guide to the Markets - Europe.Data as of 31 December 2019.
Glob
al e
cono
my
11
Brazil
US
Eurozone
Canada
India
China
Russia
Mexico
Japan
Korea
UK
EMGlobalDM
ChinaEM ex-China
US
EurozoneOther
12
|GTM – Europe
-1.0
-0.8
-0.6
-0.4
-0.2
0.0
0.2
0.4
0.6
0.8
1.0
1.2
0.0
0.5
1.0
1.5
2.0
2.5
3.0
3.5
4.0
4.5
5.0
'58 - '67 '68 - '77 '78 - '87 '88 - '97 '98 - '07 '08 - '18
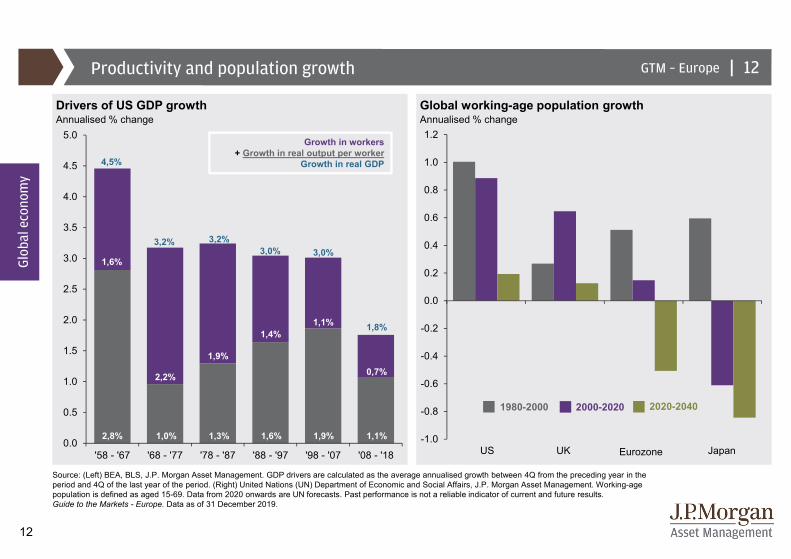
Productivity and population growth
Drivers of US GDP growth Global working-age population growthAnnualised % change Annualised % change
Source: (Left) BEA, BLS, J.P. Morgan Asset Management. GDP drivers are calculated as the average annualised growth between 4Q from the preceding year in the period and 4Q of the last year of the period. (Right) United Nations (UN) Department of Economic and Social Affairs, J.P. Morgan Asset Management. Working-age population is defined as aged 15-69. Data from 2020 onwards are UN forecasts. Past performance is not a reliable indicator of current and future results. Guide to the Markets - Europe. Data as of 31 December 2019.
Glob
al e
cono
my
2000-2020 2020-20401980-2000
Growth in workers + Growth in real output per worker
Growth in real GDP
12
US UK Eurozone Japan
1,6%
2,2%
1,9%
1,4%1,1%
0,7%
2,8% 1,0% 1,3% 1,6% 1,9% 1,1%
4,5%
3,2% 3,2%3,0% 3,0%
1,8%

13
|GTM – Europe
30
35
40
45
50
55
60
65
-8
-6
-4
-2
0
2
4
6
'00 '01 '02 '03 '04 '05 '06 '07 '08 '09 '10 '11 '12 '13 '14 '15 '16 '17 '18 '19
US GDP
Contribution to US real GDP growth and ISM composite% change year on year (LHS); index level (RHS)
Source: BEA, Bloomberg, ISM, Refinitiv Datastream, J.P. Morgan Asset Management. The Institute for Supply Management (ISM) composite is an economy-weighted average of the manufacturing and non-manufacturing surveys. A score of 50 indicates that economic activity is neither expanding nor contracting, above 50 indicates expansion. ISM data is shown with quarterly frequency. Past performance is not a reliable indicator of current and future results. Guide to the Markets - Europe. Data as of 31 December 2019.
Glob
al e
cono
my
Average since 2000 3Q19
2,1% 2,1%
13
Change in inventories
Net exports
Investment
Consumption
Government
ISM composite (RHS)

14
|GTM – Europe
0
10
20
30
40
50
60
70
80
90
100
US economic health monitor
US economic indicatorsPercentile rank relative to historic data since 1990
Source: BLS, Conference Board, ISM, Refinitiv Datastream, J.P. Morgan Asset Management. Elevated recession risk flags are shown when the underlying indicator is at a level consistent with the onset of any of the past three US recessions, as determined by NBER. Transformations used for each of the indicators are: % change year on year for the Leading Economic Index and consumer confidence present situation, index level for Leading Credit Index, ISM non-manufacturing and ISM manufacturing new orders and three-month moving average of monthly absolute change for non-farm payrolls. Past performance is not a reliable indicator of current and future results. Guide to the Markets - Europe. Data as of 31 December 2019.
Glob
al e
cono
my
Broad indicators
Latest
Higher recession risk
Consumer and services Manufacturing Labour marketElevated
recession risk
Lower recession risk
Key:
14
ConferenceBoard Leading
Economic Index
ConferenceBoard Leading Credit Index
Consumer confidence:
Present situation
ISM non-manufacturing
ISMmanufacturing:
New orders
Non-farm payrolls
15
|GTM – Europe
25
30
35
40
45
50
55
60
65
70
75
'90 '92 '94 '96 '98 '00 '02 '04 '06 '08 '10 '12 '14 '16 '18 '2035
40
45
50
55
60
65
'98 '00 '02 '04 '06 '08 '10 '12 '14 '16 '18 '20
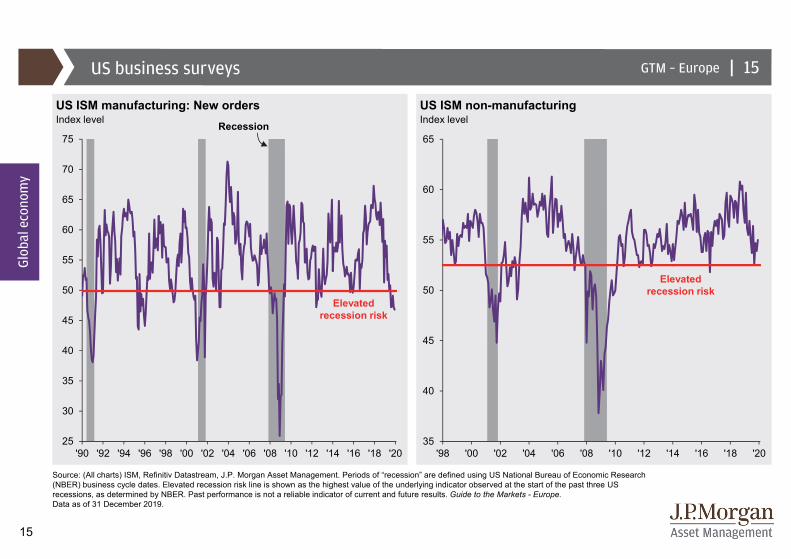
US business surveys
US ISM manufacturing: New orders US ISM non-manufacturingIndex level Index level
Source: (All charts) ISM, Refinitiv Datastream, J.P. Morgan Asset Management. Periods of “recession” are defined using US National Bureau of Economic Research (NBER) business cycle dates. Elevated recession risk line is shown as the highest value of the underlying indicator observed at the start of the past three US recessions, as determined by NBER. Past performance is not a reliable indicator of current and future results. Guide to the Markets - Europe. Data as of 31 December 2019.
Glob
al e
cono
my
Recession
15
Elevated recession risk
Elevated recession risk
16
|GTM – Europe
-20
-10
0
10
20
30
40
-20
-15
-10
-5
0
5
10
15
20
'00 '01 '02 '03 '04 '05 '06 '07 '08 '09 '10 '11 '12 '13 '14 '15 '16 '17 '18 '19 '20
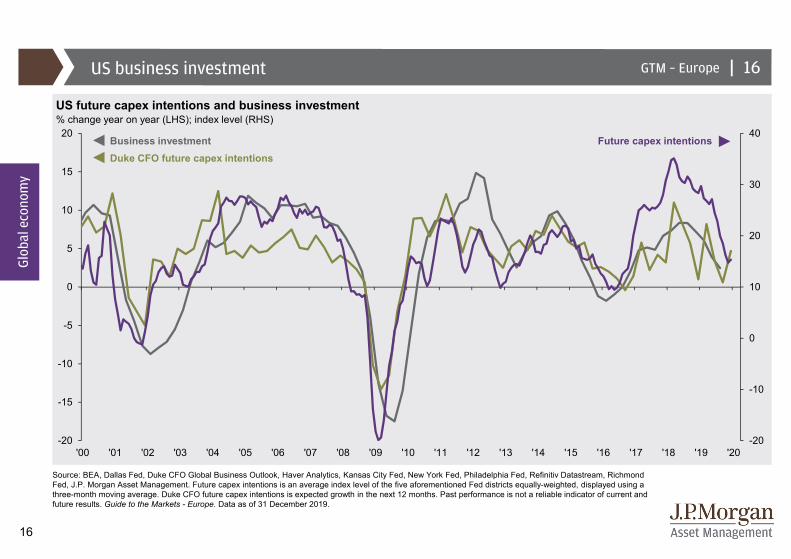
US business investment
US future capex intentions and business investment% change year on year (LHS); index level (RHS)
Source: BEA, Dallas Fed, Duke CFO Global Business Outlook, Haver Analytics, Kansas City Fed, New York Fed, Philadelphia Fed, Refinitiv Datastream, Richmond Fed, J.P. Morgan Asset Management. Future capex intentions is an average index level of the five aforementioned Fed districts equally-weighted, displayed using a three-month moving average. Duke CFO future capex intentions is expected growth in the next 12 months. Past performance is not a reliable indicator of current and future results. Guide to the Markets - Europe. Data as of 31 December 2019.
Future capex intentionsBusiness investment
Glob
al e
cono
my
16
Duke CFO future capex intentions

17
|GTM – Europe
-100
-75
-50
-25
0
25
50
75
100
125
'90 '92 '94 '96 '98 '00 '02 '04 '06 '08 '10 '12 '14 '16 '18 '20
US consumer
US consumer confidence: Present situation US house prices relative to income% change year on year Index level
Source: (Left) Conference Board, Refinitiv Datastream, J.P. Morgan Asset Management. (Right) OECD, Refinitiv Datastream, J.P. Morgan Asset Management. Periods of “recession” are defined using US National Bureau of Economic Research (NBER) business cycle dates. Elevated recession risk line is shown as the highest value of the underlying indicator observed at the start of the past three US recessions, as determined by NBER. Past performance is not a reliable indicator of current and future results. Guide to the Markets - Europe. Data as of 31 December 2019.
Glob
al e
cono
my
Recession
17
80
90
100
110
120
130
140
'79 '84 '89 '94 '99 '04 '09 '14 '19
Elevated recession risk
18
|GTM – Europe
0
2
4
6
8
10
12
'67 '72 '77 '82 '87 '92 '97 '02 '07 '12 '17
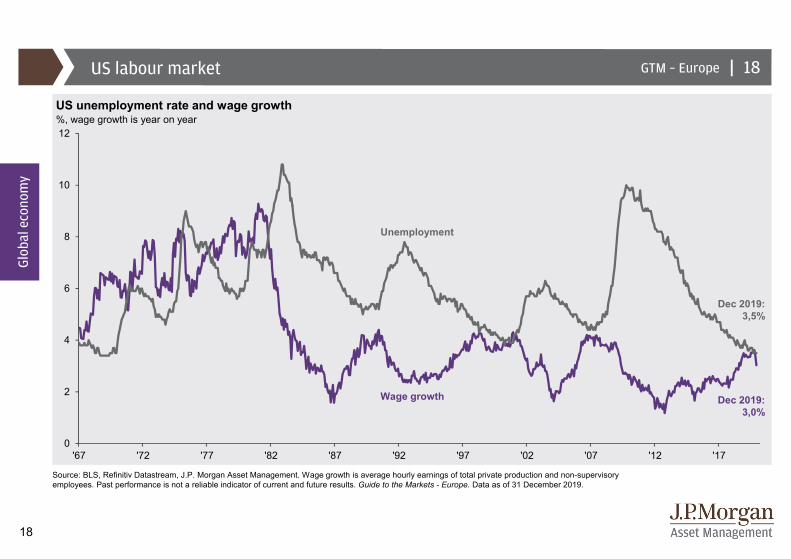
US labour market
US unemployment rate and wage growth%, wage growth is year on year
Source: BLS, Refinitiv Datastream, J.P. Morgan Asset Management. Wage growth is average hourly earnings of total private production and non-supervisory employees. Past performance is not a reliable indicator of current and future results. Guide to the Markets - Europe. Data as of 31 December 2019.
Glob
al e
cono
my
Unemployment
Wage growth
18
Dec 2019: 3,5%
Dec 2019:3,0%
19
|GTM – Europe
-500
-400
-300
-200
-100
0
100
200
300
400
'90 '92 '94 '96 '98 '00 '02 '04 '06 '08 '10 '12 '14 '16 '18 '20
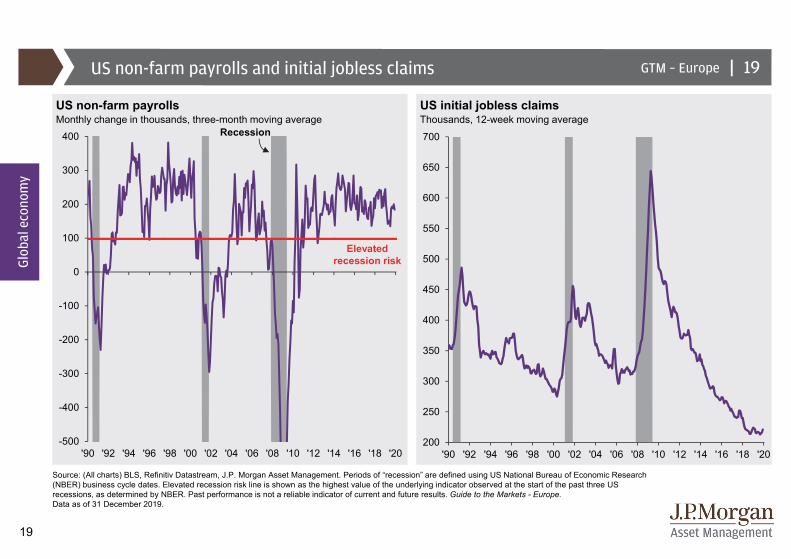
US non-farm payrolls and initial jobless claims
US non-farm payrolls US initial jobless claimsMonthly change in thousands, three-month moving average Thousands, 12-week moving average
Source: (All charts) BLS, Refinitiv Datastream, J.P. Morgan Asset Management. Periods of “recession” are defined using US National Bureau of Economic Research (NBER) business cycle dates. Elevated recession risk line is shown as the highest value of the underlying indicator observed at the start of the past three US recessions, as determined by NBER. Past performance is not a reliable indicator of current and future results. Guide to the Markets - Europe. Data as of 31 December 2019.
Glob
al e
cono
my
19
Recession
Elevated recession risk
200
250
300
350
400
450
500
550
600
650
700
'90 '92 '94 '96 '98 '00 '02 '04 '06 '08 '10 '12 '14 '16 '18 '20
20
|GTM – Europe
-15
-10
-5
0
5
10
15
'90 '92 '94 '96 '98 '00 '02 '04 '06 '08 '10 '12 '14 '16 '18-4
-2
0
2
4
6
8
'90 '92 '94 '96 '98 '00 '02 '04 '06 '08 '10 '12 '14 '16 '18 '20
Recession
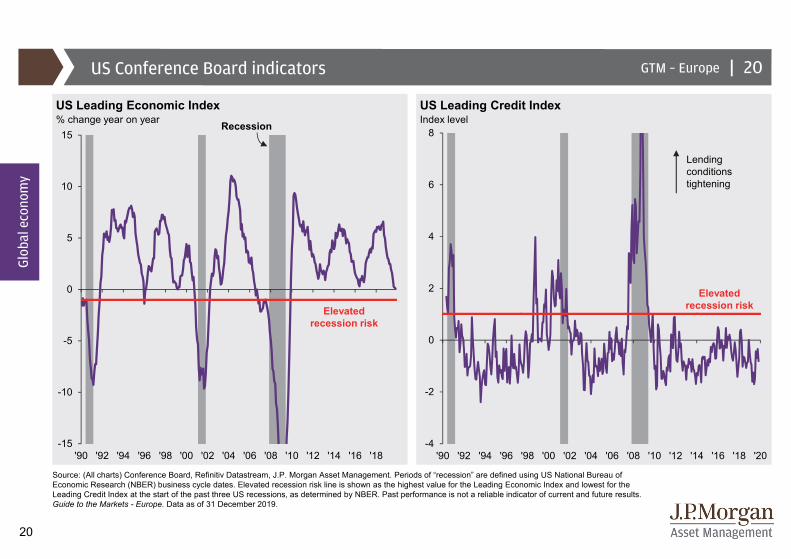
US Conference Board indicators
US Leading Economic Index US Leading Credit Index% change year on year
Source: (All charts) Conference Board, Refinitiv Datastream, J.P. Morgan Asset Management. Periods of “recession” are defined using US National Bureau of Economic Research (NBER) business cycle dates. Elevated recession risk line is shown as the highest value for the Leading Economic Index and lowest for the Leading Credit Index at the start of the past three US recessions, as determined by NBER. Past performance is not a reliable indicator of current and future results. Guide to the Markets - Europe. Data as of 31 December 2019.
Elevated recession risk
Index level
Elevated recession risk
Lending conditions tightening
Glob
al e
cono
my
20
21
|GTM – Europe
-6
-4
-2
0
2
4
6
50
55
60
65
70
75
80
'90 '94 '98 '02 '06 '10 '14 '180
1
2
3
4
5
6
7
8
9
50
60
70
80
90
100
110
'90 '94 '98 '02 '06 '10 '14 '18
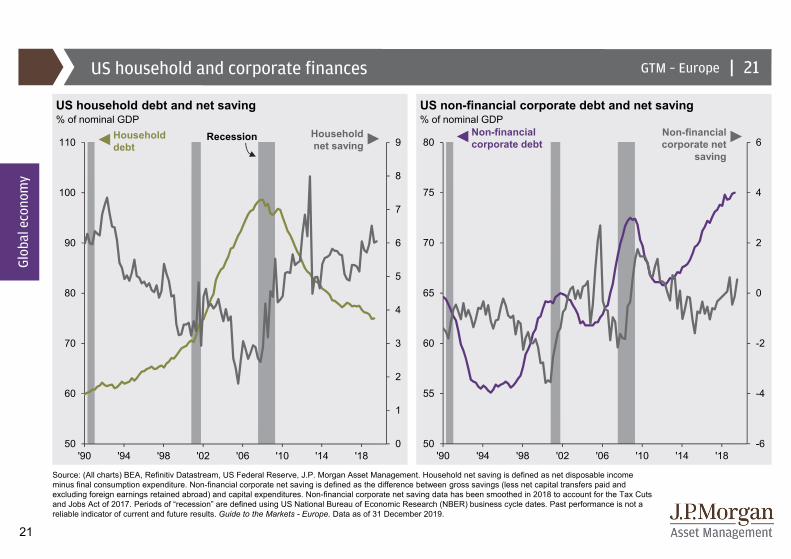
US household debt and net saving US non-financial corporate debt and net saving% of nominal GDP % of nominal GDP
Source: (All charts) BEA, Refinitiv Datastream, US Federal Reserve, J.P. Morgan Asset Management. Household net saving is defined as net disposable income minus final consumption expenditure. Non-financial corporate net saving is defined as the difference between gross savings (less net capital transfers paid and excluding foreign earnings retained abroad) and capital expenditures. Non-financial corporate net saving data has been smoothed in 2018 to account for the Tax Cuts and Jobs Act of 2017. Periods of “recession” are defined using US National Bureau of Economic Research (NBER) business cycle dates. Past performance is not a reliable indicator of current and future results. Guide to the Markets - Europe. Data as of 31 December 2019.
Recession
US household and corporate finances
Non-financial corporate debt
Non-financial corporate net
saving
Householddebt
Household net saving
Glob
al e
cono
my
21
22
|GTM – Europe
-3
-2
-1
0
1
2
3
4
5
6
'00 '02 '04 '06 '08 '10 '12 '14 '16 '18-2
-1
0
1
2
3
4
5
6
'00 '02 '04 '06 '08 '10 '12 '14 '16 '18
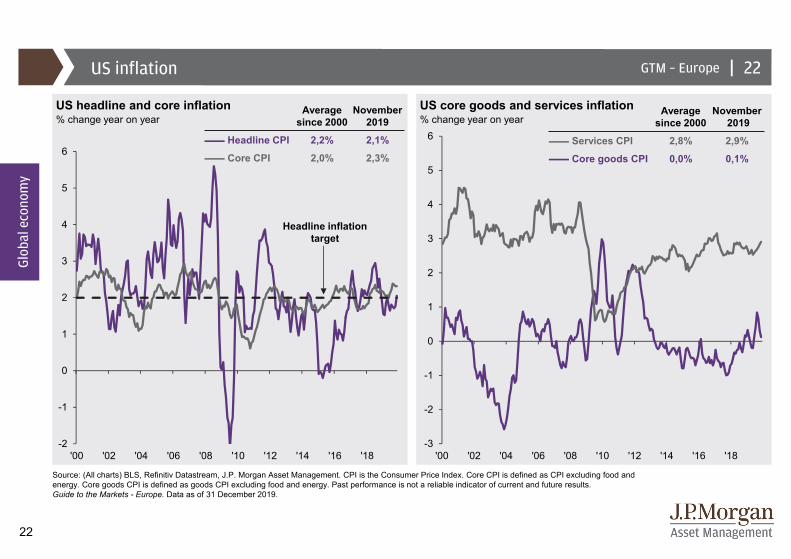
Average since 2000
November2019
Headline CPI 2,2% 2,1%
Core CPI 2,0% 2,3%
US inflation
US headline and core inflation US core goods and services inflation% change year on year % change year on year
Source: (All charts) BLS, Refinitiv Datastream, J.P. Morgan Asset Management. CPI is the Consumer Price Index. Core CPI is defined as CPI excluding food and energy. Core goods CPI is defined as goods CPI excluding food and energy. Past performance is not a reliable indicator of current and future results. Guide to the Markets - Europe. Data as of 31 December 2019.
Glob
al e
cono
my
22
Average since 2000
November2019
Services CPI 2,8% 2,9%
Core goods CPI 0,0% 0,1%
Headline inflation target
23
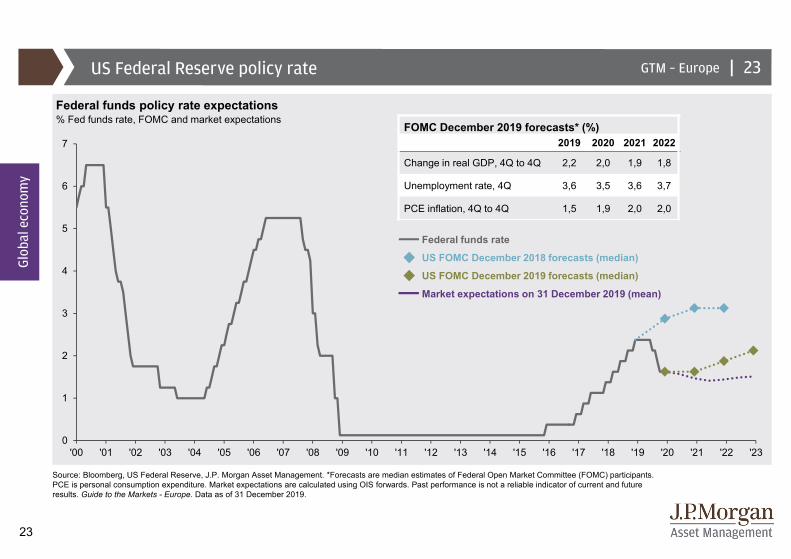
|GTM – EuropeUS Federal Reserve policy rate
Federal funds policy rate expectations% Fed funds rate, FOMC and market expectations
Source: Bloomberg, US Federal Reserve, J.P. Morgan Asset Management. *Forecasts are median estimates of Federal Open Market Committee (FOMC) participants. PCE is personal consumption expenditure. Market expectations are calculated using OIS forwards. Past performance is not a reliable indicator of current and future results. Guide to the Markets - Europe. Data as of 31 December 2019.
Glob
al e
cono
my
23
FOMC December 2019 forecasts* (%) 2019 2020 2021 2022
Change in real GDP, 4Q to 4Q 2,2 2,0 1,9 1,8
Unemployment rate, 4Q 3,6 3,5 3,6 3,7
PCE inflation, 4Q to 4Q 1,5 1,9 2,0 2,0
Federal funds rate
Market expectations on 31 December 2019 (mean)
US FOMC December 2019 forecasts (median)
US FOMC December 2018 forecasts (median)
0
1
2
3
4
5
6
7
'00 '01 '02 '03 '04 '05 '06 '07 '08 '09 '10 '11 '12 '13 '14 '15 '16 '17 '18 '19 '20 '21 '22 '23
24
|GTM – Europe
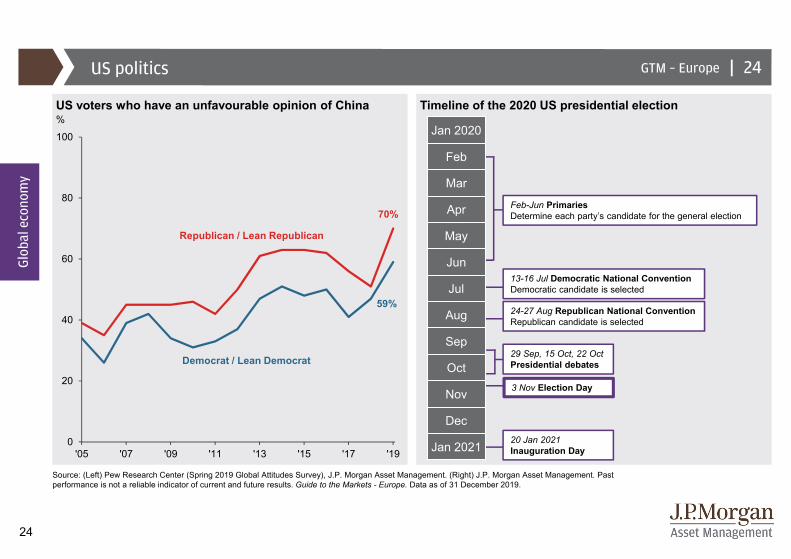
Timeline of the 2020 US presidential election
Jan 2020
Feb
Mar
Apr
May
Jun
Jul
Aug
Sep
Oct
Nov
Dec
Jan 2021
Feb-Jun PrimariesDetermine each party’s candidate for the general election
13-16 Jul Democratic National ConventionDemocratic candidate is selected
24-27 Aug Republican National ConventionRepublican candidate is selected
3 Nov Election Day
20 Jan 2021Inauguration Day
29 Sep, 15 Oct, 22 OctPresidential debates
US politics
US voters who have an unfavourable opinion of China%
Source: (Left) Pew Research Center (Spring 2019 Global Attitudes Survey), J.P. Morgan Asset Management. (Right) J.P. Morgan Asset Management. Past performance is not a reliable indicator of current and future results. Guide to the Markets - Europe. Data as of 31 December 2019.
0
20
40
60
80
100
'05 '07 '09 '11 '13 '15 '17 '19
70%
59%
Republican / Lean Republican
Democrat / Lean Democrat
Glob
al e
cono
my
24
25
|GTM – Europe
1
2
3
4
5
6
7
8
9
'01 '03 '05 '07 '09 '11 '13 '15 '17 '19
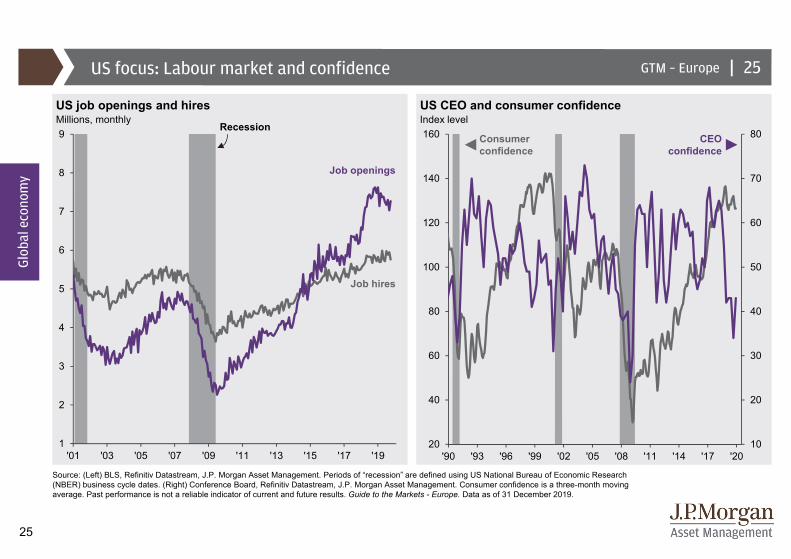
US focus: Labour market and confidence
US job openings and hires US CEO and consumer confidenceMillions, monthly Index level
Source: (Left) BLS, Refinitiv Datastream, J.P. Morgan Asset Management. Periods of “recession” are defined using US National Bureau of Economic Research (NBER) business cycle dates. (Right) Conference Board, Refinitiv Datastream, J.P. Morgan Asset Management. Consumer confidence is a three-month moving average. Past performance is not a reliable indicator of current and future results. Guide to the Markets - Europe. Data as of 31 December 2019.
Glob
al e
cono
my
Job openings
Job hires
10
20
30
40
50
60
70
80
20
40
60
80
100
120
140
160
'90 '93 '96 '99 '02 '05 '08 '11 '14 '17 '20
Consumer confidence
CEO confidence
Recession
25
26
|GTM – Europe
30
35
40
45
50
55
60
65
-8
-6
-4
-2
0
2
4
6
'00 '01 '02 '03 '04 '05 '06 '07 '08 '09 '10 '11 '12 '13 '14 '15 '16 '17 '18 '19
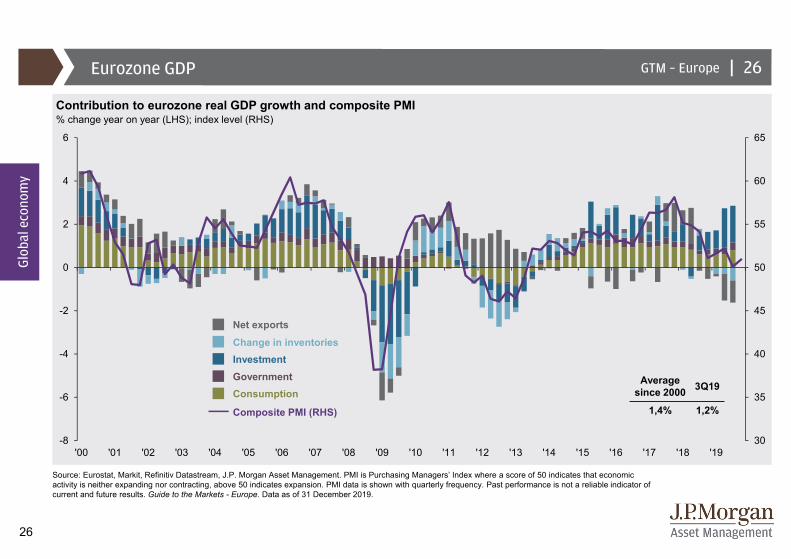
Eurozone GDP
Contribution to eurozone real GDP growth and composite PMI% change year on year (LHS); index level (RHS)
Source: Eurostat, Markit, Refinitiv Datastream, J.P. Morgan Asset Management. PMI is Purchasing Managers’ Index where a score of 50 indicates that economic activity is neither expanding nor contracting, above 50 indicates expansion. PMI data is shown with quarterly frequency. Past performance is not a reliable indicator of current and future results. Guide to the Markets - Europe. Data as of 31 December 2019.
Glob
al e
cono
my
Average since 2000 3Q19
1,4% 1,2%
26
Change in inventoriesNet exports
Investment
ConsumptionGovernment
Composite PMI (RHS)
27
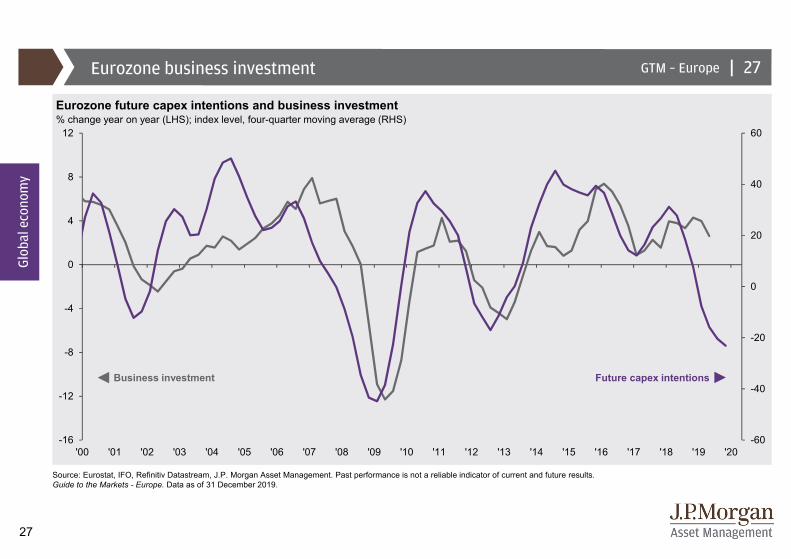
|GTM – EuropeEurozone business investment
Eurozone future capex intentions and business investment% change year on year (LHS); index level, four-quarter moving average (RHS)
Source: Eurostat, IFO, Refinitiv Datastream, J.P. Morgan Asset Management. Past performance is not a reliable indicator of current and future results. Guide to the Markets - Europe. Data as of 31 December 2019.
Glob
al e
cono
my
27
-60
-40
-20
0
20
40
60
-16
-12
-8
-4
0
4
8
12
'00 '01 '02 '03 '04 '05 '06 '07 '08 '09 '10 '11 '12 '13 '14 '15 '16 '17 '18 '19 '20
Future capex intentionsBusiness investment
28
|GTM – Europe
0
50
100
150
200
250
'80 '84 '88 '92 '96 '00 '04 '08 '12 '16 '20-25
-20
-15
-10
-5
0
'00 '02 '04 '06 '08 '10 '12 '14 '16 '18 '20
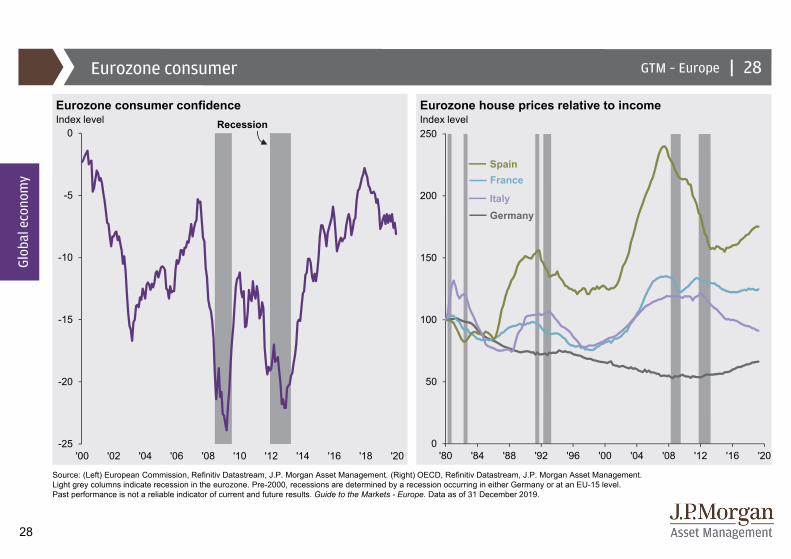
Eurozone consumer
Eurozone consumer confidence Eurozone house prices relative to incomeIndex level Index level
Source: (Left) European Commission, Refinitiv Datastream, J.P. Morgan Asset Management. (Right) OECD, Refinitiv Datastream, J.P. Morgan Asset Management. Light grey columns indicate recession in the eurozone. Pre-2000, recessions are determined by a recession occurring in either Germany or at an EU-15 level. Past performance is not a reliable indicator of current and future results. Guide to the Markets - Europe. Data as of 31 December 2019.
Glob
al e
cono
my
28
Germany
SpainFrance
Italy
Recession
29
|GTM – Europe
0.5
1.0
1.5
2.0
2.5
3.0
3.5
4.0
4.5
5.0
4
5
6
7
8
9
10
11
12
13
'98 '99 '00 '01 '02 '03 '04 '05 '06 '07 '08 '09 '10 '11 '12 '13 '14 '15 '16 '17 '18 '19 '20
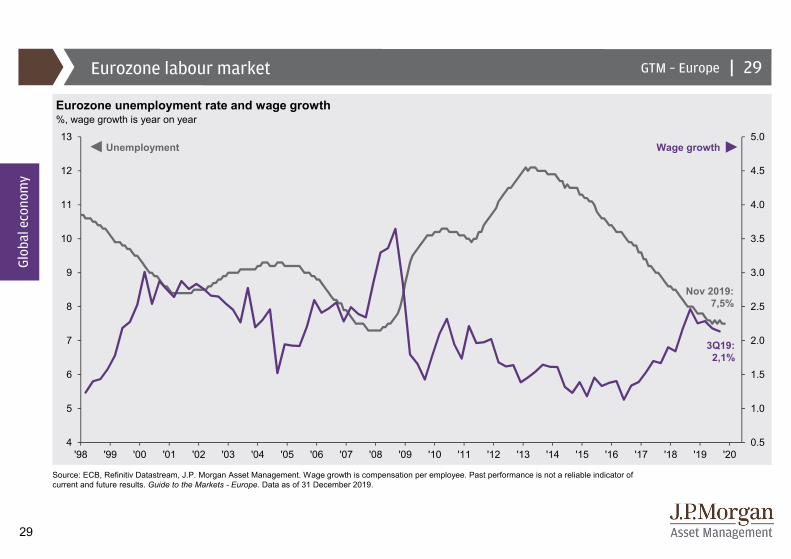
Eurozone labour market
Eurozone unemployment rate and wage growth%, wage growth is year on year
Source: ECB, Refinitiv Datastream, J.P. Morgan Asset Management. Wage growth is compensation per employee. Past performance is not a reliable indicator of current and future results. Guide to the Markets - Europe. Data as of 31 December 2019.
Glob
al e
cono
my
29
Wage growthUnemployment
Nov 2019:7,5%
3Q19:2,1%
30
|GTM – Europe
0
4
8
12
16
20
24
28
'00 '01 '02 '03 '04 '05 '06 '07 '08 '09 '10 '11 '12 '13 '14 '15 '16 '17 '18 '19 '20
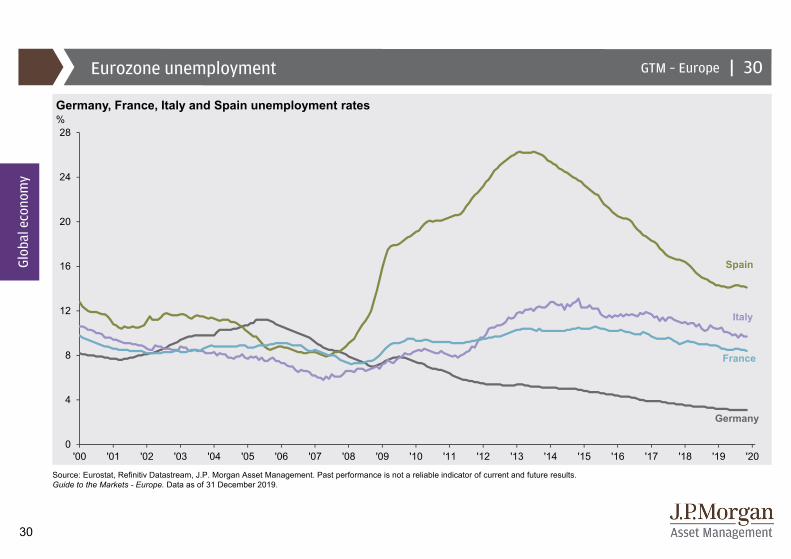
Eurozone unemployment
Germany, France, Italy and Spain unemployment rates%
Source: Eurostat, Refinitiv Datastream, J.P. Morgan Asset Management. Past performance is not a reliable indicator of current and future results. Guide to the Markets - Europe. Data as of 31 December 2019.
30
Spain
Germany
France
Italy
Glob
al e
cono
my
31
|GTM – Europe
-0.5
0.0
0.5
1.0
1.5
2.0
2.5
3.0
3.5
'00 '02 '04 '06 '08 '10 '12 '14 '16 '18 '20-1
0
1
2
3
4
5
'00 '02 '04 '06 '08 '10 '12 '14 '16 '18 '20
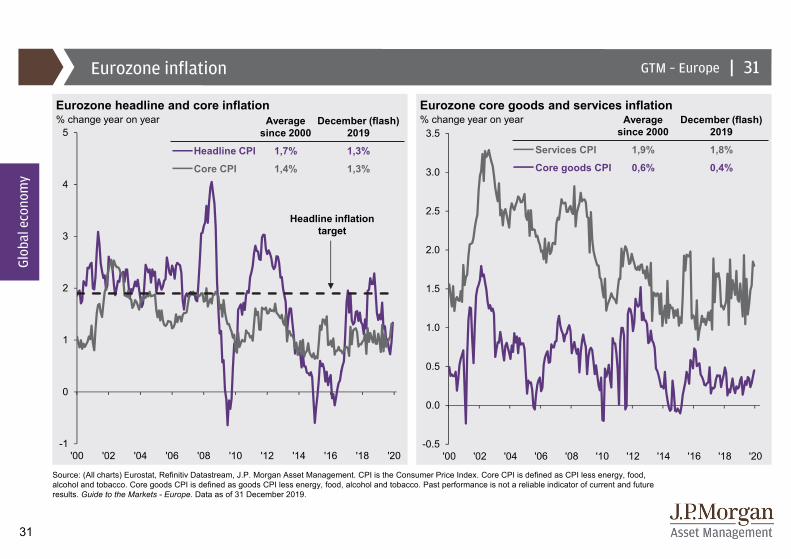
Average since 2000
December (flash)2019
Services CPI 1,9% 1,8%
Core goods CPI 0,6% 0,4%
Eurozone inflation
Eurozone headline and core inflation Eurozone core goods and services inflation% change year on year % change year on year
Source: (All charts) Eurostat, Refinitiv Datastream, J.P. Morgan Asset Management. CPI is the Consumer Price Index. Core CPI is defined as CPI less energy, food, alcohol and tobacco. Core goods CPI is defined as goods CPI less energy, food, alcohol and tobacco. Past performance is not a reliable indicator of current and future results. Guide to the Markets - Europe. Data as of 31 December 2019.
Glob
al e
cono
my
31
Headline inflation target
Average since 2000
December (flash)2019
Headline CPI 1,7% 1,3%
Core CPI 1,4% 1,3%

32
|GTM – Europe
-1.0
-0.5
0.0
0.5
1.0
1.5
2.0
2.5
3.0
3.5
4.0
'00 '01 '02 '03 '04 '05 '06 '07 '08 '09 '10 '11 '12 '13 '14 '15 '16 '17 '18 '19 '20 '21 '22 '23
European Central Bank policy rate
European Central Bank policy rate expectations% deposit rate, market expectations
Source: Bloomberg, European Central Bank, J.P. Morgan Asset Management. *Forecasts are made by ECB staff. HICP is the Harmonised Index of Consumer Prices. Market expectations are calculated using OIS forwards. Past performance is not a reliable indicator of current and future results. Guide to the Markets - Europe. Data as of 31 December 2019.
Glob
al e
cono
my
ECB deposit rateMarket expectations on 31 December 2019 (mean)
32
ECB staff December 2019 forecasts* (%)2019 2020 2021 2022
Real GDP growth (y/y) 1,2 1,1 1,4 1,4
Unemployment rate 7,6 7,4 7,2 7,1
HICP inflation (y/y) 1,2 1,1 1,4 1,6
33
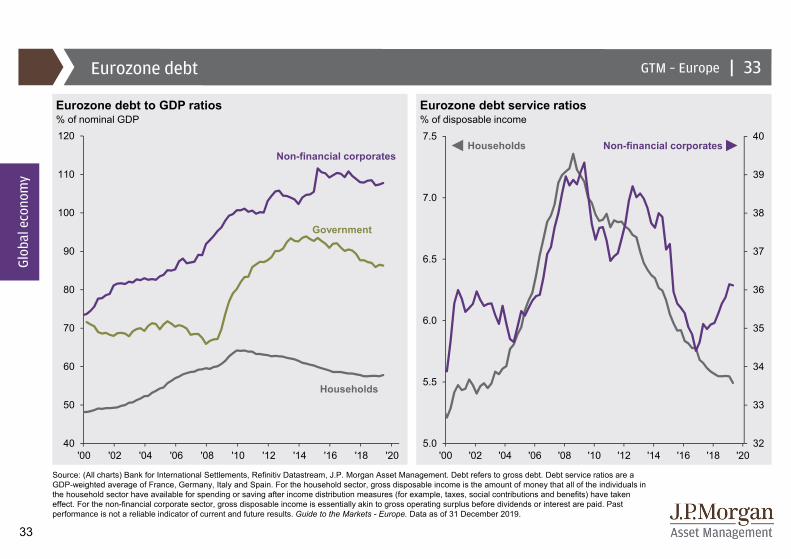
|GTM – EuropeEurozone debt
Eurozone debt to GDP ratios Eurozone debt service ratios% of nominal GDP % of disposable income
Source: (All charts) Bank for International Settlements, Refinitiv Datastream, J.P. Morgan Asset Management. Debt refers to gross debt. Debt service ratios are a GDP-weighted average of France, Germany, Italy and Spain. For the household sector, gross disposable income is the amount of money that all of the individuals in the household sector have available for spending or saving after income distribution measures (for example, taxes, social contributions and benefits) have taken effect. For the non-financial corporate sector, gross disposable income is essentially akin to gross operating surplus before dividends or interest are paid. Past performance is not a reliable indicator of current and future results. Guide to the Markets - Europe. Data as of 31 December 2019.
Glob
al e
cono
my
Non-financial corporatesHouseholds
33
32
33
34
35
36
37
38
39
40
5.0
5.5
6.0
6.5
7.0
7.5
'00 '02 '04 '06 '08 '10 '12 '14 '16 '18 '2040
50
60
70
80
90
100
110
120
'00 '02 '04 '06 '08 '10 '12 '14 '16 '18 '20
Households
Non-financial corporates
Government
34
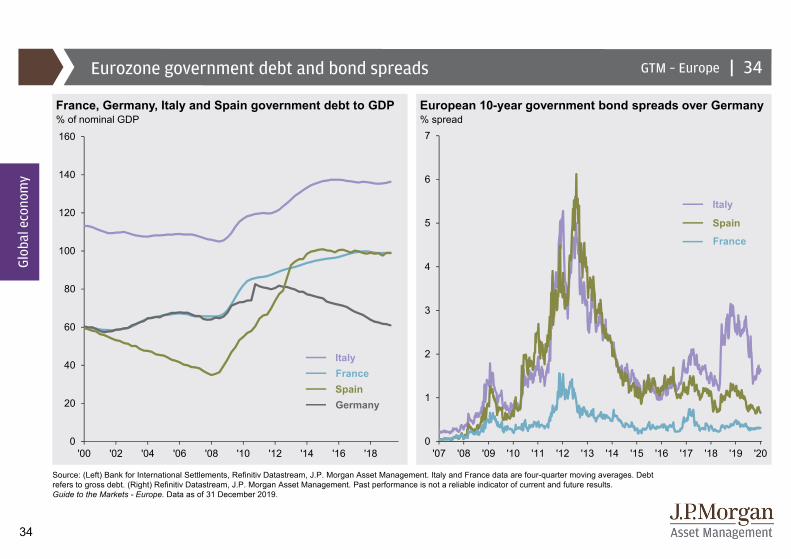
|GTM – EuropeEurozone government debt and bond spreads
France, Germany, Italy and Spain government debt to GDP European 10-year government bond spreads over Germany% of nominal GDP % spread
Source: (Left) Bank for International Settlements, Refinitiv Datastream, J.P. Morgan Asset Management. Italy and France data are four-quarter moving averages. Debt refers to gross debt. (Right) Refinitiv Datastream, J.P. Morgan Asset Management. Past performance is not a reliable indicator of current and future results.Guide to the Markets - Europe. Data as of 31 December 2019.
GermanySpainFranceItaly
Glob
al e
cono
my
Spain
France
Italy
34
0
1
2
3
4
5
6
7
'07 '08 '09 '10 '11 '12 '13 '14 '15 '16 '17 '18 '19 '200
20
40
60
80
100
120
140
160
'00 '02 '04 '06 '08 '10 '12 '14 '16 '18

35
|GTM – EuropeEurozone focus: Trade and the manufacturing sector
Eurozone exports to countries outside the eurozone Manufacturing employment by country% change quarter on quarter, annualised % of total employment
Source: (Left) Eurostat, Refinitiv Datastream, J.P. Morgan Asset Management. Data is using a 12-month rolling sum of the real index value of extra-eurozone exports. (Right) OECD, Refinitiv Datastream, J.P. Morgan Asset Management. Past performance is not a reliable indicator of current and future results. Guide to the Markets - Europe. Data as of 31 December 2019.
Glob
al e
cono
my
35
-3
-2
-1
0
1
2
3
4
5
6
7
'16 '17 '18 '19
Emerging markets
Total
UK
Rest of world
US
Germany Italy Spain France US0
2
4
6
8
10
12
14
16
18
20
36
|GTM – Europe
30
35
40
45
50
55
60
65
-8
-6
-4
-2
0
2
4
6
'00 '01 '02 '03 '04 '05 '06 '07 '08 '09 '10 '11 '12 '13 '14 '15 '16 '17 '18 '19
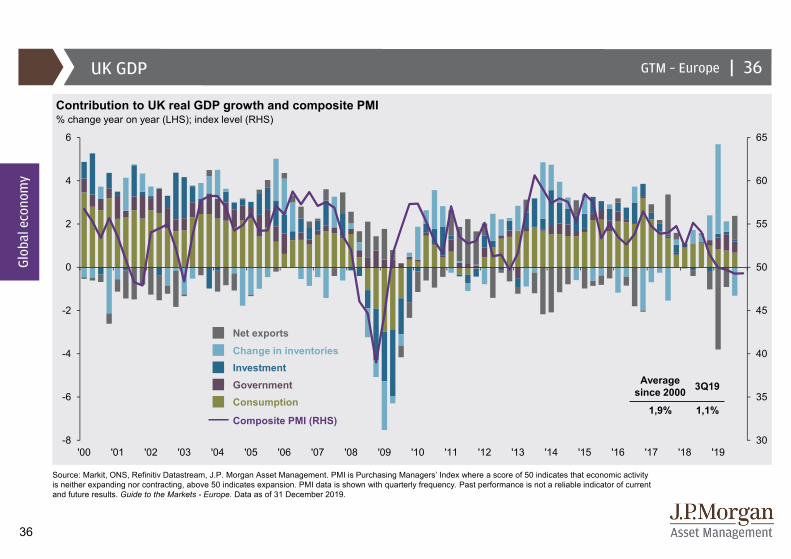
UK GDP
Contribution to UK real GDP growth and composite PMI% change year on year (LHS); index level (RHS)
Source: Markit, ONS, Refinitiv Datastream, J.P. Morgan Asset Management. PMI is Purchasing Managers’ Index where a score of 50 indicates that economic activity is neither expanding nor contracting, above 50 indicates expansion. PMI data is shown with quarterly frequency. Past performance is not a reliable indicator of current and future results. Guide to the Markets - Europe. Data as of 31 December 2019.
Average since 2000 3Q19
1,9% 1,1%
36
Glob
al e
cono
my
Change in inventoriesNet exports
Investment
ConsumptionGovernment
Composite PMI (RHS)
37
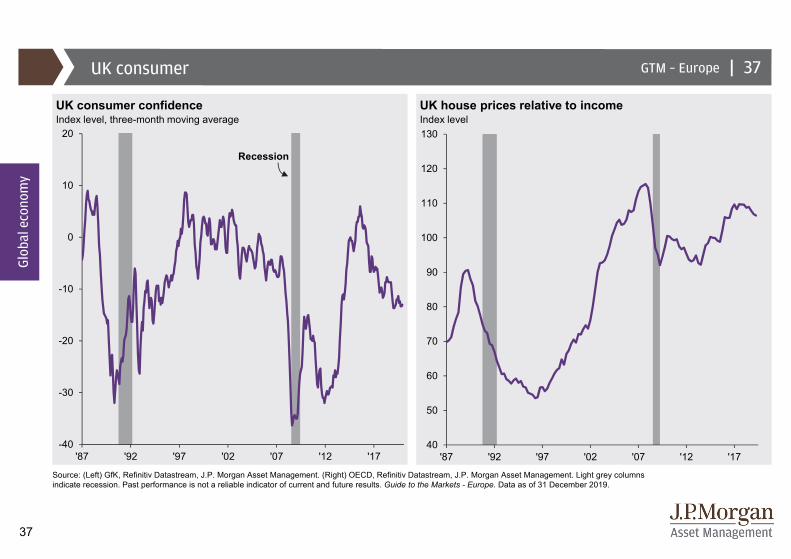
|GTM – EuropeUK consumer
UK consumer confidence UK house prices relative to incomeIndex level, three-month moving average Index level
Source: (Left) GfK, Refinitiv Datastream, J.P. Morgan Asset Management. (Right) OECD, Refinitiv Datastream, J.P. Morgan Asset Management. Light grey columns indicate recession. Past performance is not a reliable indicator of current and future results. Guide to the Markets - Europe. Data as of 31 December 2019.
Recession
37
Glob
al e
cono
my
-40
-30
-20
-10
0
10
20
'87 '92 '97 '02 '07 '12 '1740
50
60
70
80
90
100
110
120
130
'87 '92 '97 '02 '07 '12 '17
38
|GTM – Europe
-6
-4
-2
0
2
4
6
'00 '02 '04 '06 '08 '10 '12 '14 '16 '18 '20-1
0
1
2
3
4
5
6
'00 '02 '04 '06 '08 '10 '12 '14 '16 '18 '20
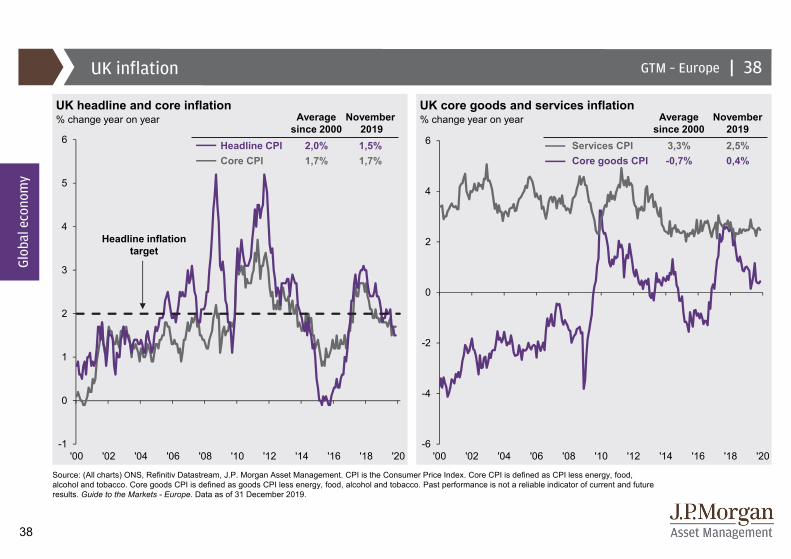
UK inflation
UK headline and core inflation UK core goods and services inflation% change year on year % change year on year
Source: (All charts) ONS, Refinitiv Datastream, J.P. Morgan Asset Management. CPI is the Consumer Price Index. Core CPI is defined as CPI less energy, food, alcohol and tobacco. Core goods CPI is defined as goods CPI less energy, food, alcohol and tobacco. Past performance is not a reliable indicator of current and future results. Guide to the Markets - Europe. Data as of 31 December 2019.
Average since 2000
November2019
Headline CPI 2,0% 1,5%Core CPI 1,7% 1,7%
Average since 2000
November 2019
Services CPI 3,3% 2,5%Core goods CPI -0,7% 0,4%
38
Glob
al e
cono
my
Headline inflation target
39
|GTM – Europe
-10
-9
-8
-7
-6
-5
-4
-3
-2
-1
0
1
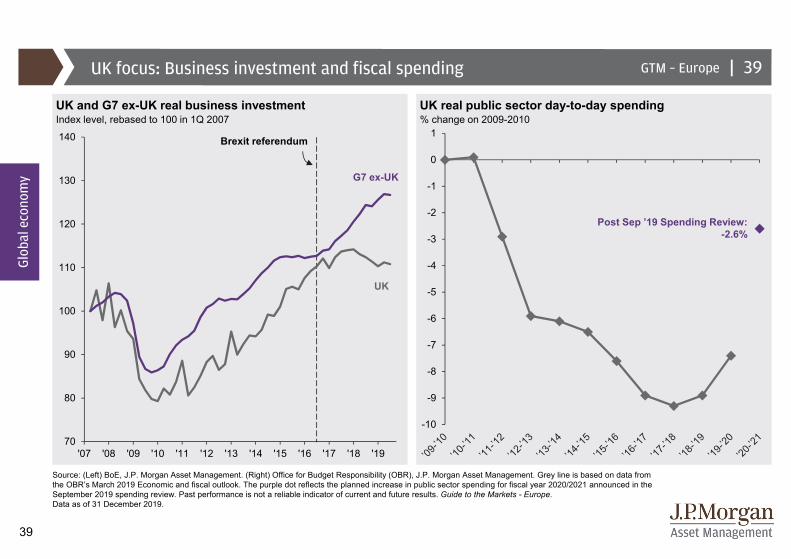
UK focus: Business investment and fiscal spending
UK and G7 ex-UK real business investment UK real public sector day-to-day spendingIndex level, rebased to 100 in 1Q 2007 % change on 2009-2010
Source: (Left) BoE, J.P. Morgan Asset Management. (Right) Office for Budget Responsibility (OBR), J.P. Morgan Asset Management. Grey line is based on data from the OBR’s March 2019 Economic and fiscal outlook. The purple dot reflects the planned increase in public sector spending for fiscal year 2020/2021 announced in the September 2019 spending review. Past performance is not a reliable indicator of current and future results. Guide to the Markets - Europe. Data as of 31 December 2019.
Brexit referendum
G7 ex-UK
UK
Glob
al e
cono
my
70
80
90
100
110
120
130
140
'07 '08 '09 '10 '11 '12 '13 '14 '15 '16 '17 '18 '19
39
Post Sep ’19 Spending Review: -2.6%
40
|GTM – Europe
30
34
38
42
46
50
54
58
62
-10
-8
-6
-4
-2
0
2
4
6
'00 '01 '02 '03 '04 '05 '06 '07 '08 '09 '10 '11 '12 '13 '14 '15 '16 '17 '18 '19
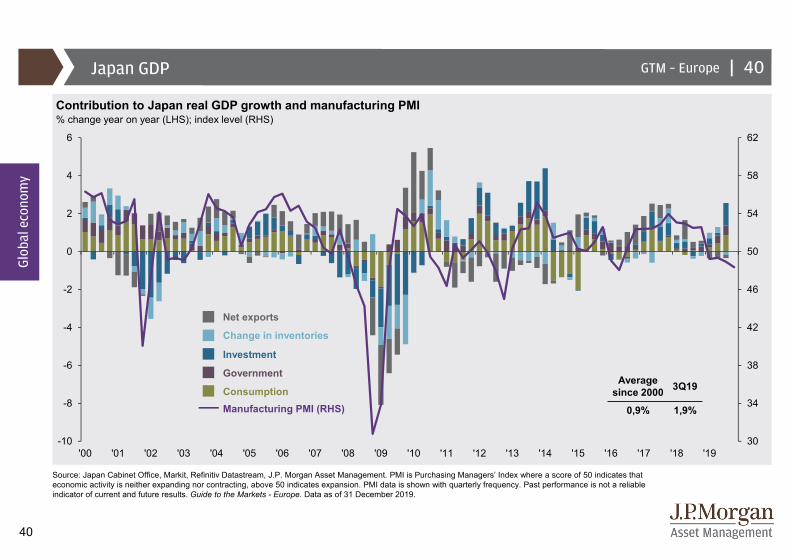
Japan GDP
Contribution to Japan real GDP growth and manufacturing PMI% change year on year (LHS); index level (RHS)
Source: Japan Cabinet Office, Markit, Refinitiv Datastream, J.P. Morgan Asset Management. PMI is Purchasing Managers’ Index where a score of 50 indicates that economic activity is neither expanding nor contracting, above 50 indicates expansion. PMI data is shown with quarterly frequency. Past performance is not a reliable indicator of current and future results. Guide to the Markets - Europe. Data as of 31 December 2019.
Average since 2000 3Q19
0,9% 1,9%
40
Glob
al e
cono
my
Change in inventories
Net exports
Investment
Consumption
Government
Manufacturing PMI (RHS)
41
|GTM – Europe
-5
0
5
10
15
20
'90 '92 '94 '96 '98 '00 '02 '04 '06 '08 '10 '12 '14 '16 '180
5
10
15
20
25
'96 '98 '00 '02 '04 '06 '08 '10 '12 '14 '16 '18 '20
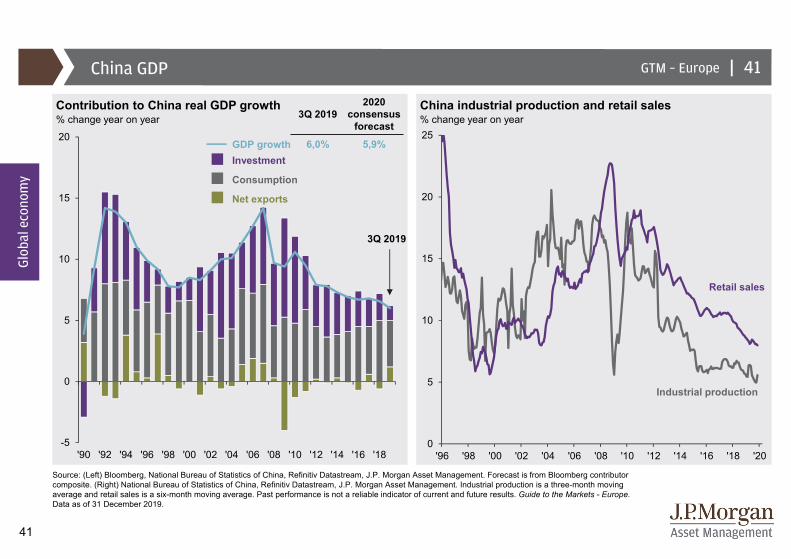
China GDP
Contribution to China real GDP growth China industrial production and retail sales% change year on year % change year on year
Source: (Left) Bloomberg, National Bureau of Statistics of China, Refinitiv Datastream, J.P. Morgan Asset Management. Forecast is from Bloomberg contributor composite. (Right) National Bureau of Statistics of China, Refinitiv Datastream, J.P. Morgan Asset Management. Industrial production is a three-month moving average and retail sales is a six-month moving average. Past performance is not a reliable indicator of current and future results. Guide to the Markets - Europe. Data as of 31 December 2019.
Glob
al e
cono
my
41
Industrial production
Consumption
GDP growthInvestment
Net exports
3Q 20192020
consensus forecast
6,0% 5,9%
Retail sales
3Q 2019
42
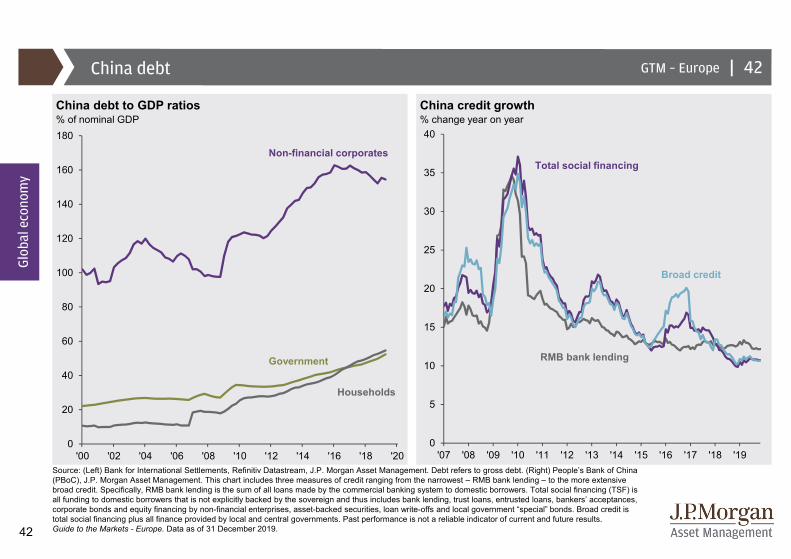
|GTM – EuropeChina debt
China debt to GDP ratios China credit growth% of nominal GDP % change year on year
Source: (Left) Bank for International Settlements, Refinitiv Datastream, J.P. Morgan Asset Management. Debt refers to gross debt. (Right) People’s Bank of China (PBoC), J.P. Morgan Asset Management. This chart includes three measures of credit ranging from the narrowest – RMB bank lending – to the more extensive broad credit. Specifically, RMB bank lending is the sum of all loans made by the commercial banking system to domestic borrowers. Total social financing (TSF) is all funding to domestic borrowers that is not explicitly backed by the sovereign and thus includes bank lending, trust loans, entrusted loans, bankers’ acceptances, corporate bonds and equity financing by non-financial enterprises, asset-backed securities, loan write-offs and local government “special” bonds. Broad credit is total social financing plus all finance provided by local and central governments. Past performance is not a reliable indicator of current and future results. Guide to the Markets - Europe. Data as of 31 December 2019.
Households
Government
Glob
al e
cono
my
Non-financial corporates
42
Total social financing
Broad credit
RMB bank lending
0
5
10
15
20
25
30
35
40
'07 '08 '09 '10 '11 '12 '13 '14 '15 '16 '17 '18 '190
20
40
60
80
100
120
140
160
180
'00 '02 '04 '06 '08 '10 '12 '14 '16 '18 '20
43
|GTM – Europe
5
10
15
20
25
30
0
1
2
3
4
5
6
7
'07 '08 '09 '10 '11 '12 '13 '14 '15 '16 '17 '18 '19 '20-10
-5
0
5
10
15
'07 '08 '09 '10 '11 '12 '13 '14 '15 '16 '17 '18 '19 '20
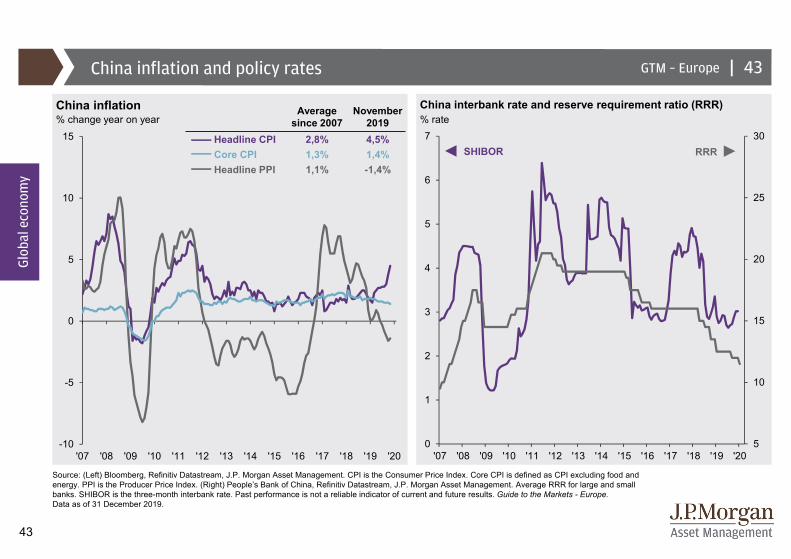
China inflation and policy rates
China inflation China interbank rate and reserve requirement ratio (RRR)% change year on year % rate
Source: (Left) Bloomberg, Refinitiv Datastream, J.P. Morgan Asset Management. CPI is the Consumer Price Index. Core CPI is defined as CPI excluding food and energy. PPI is the Producer Price Index. (Right) People’s Bank of China, Refinitiv Datastream, J.P. Morgan Asset Management. Average RRR for large and small banks. SHIBOR is the three-month interbank rate. Past performance is not a reliable indicator of current and future results. Guide to the Markets - Europe. Data as of 31 December 2019.
Average since 2007
November2019
Headline CPI 2,8% 4,5%Core CPI 1,3% 1,4%Headline PPI 1,1% -1,4%
RRRSHIBOR
Glob
al e
cono
my
43
44
|GTM – Europe
-30
-20
-10
0
10
20
30
'92 '96 '00 '04 '08 '12 '16 '20-2.4
-2.0
-1.6
-1.2
-0.8
-0.4
0.0
0.4
0.8
1.2
1.6
'06 '07 '08 '09 '10 '11 '12 '13 '14 '15 '16 '17 '18 '19
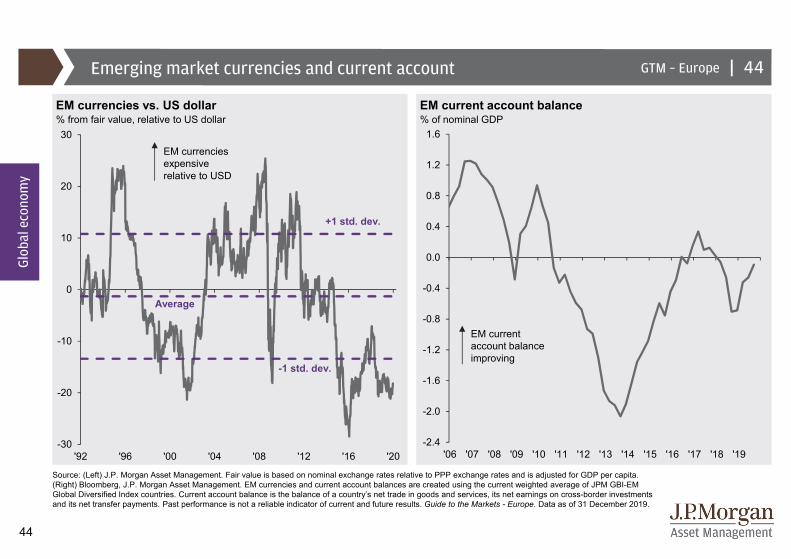
Emerging market currencies and current account
EM currencies vs. US dollar EM current account balance% from fair value, relative to US dollar % of nominal GDP
Source: (Left) J.P. Morgan Asset Management. Fair value is based on nominal exchange rates relative to PPP exchange rates and is adjusted for GDP per capita. (Right) Bloomberg, J.P. Morgan Asset Management. EM currencies and current account balances are created using the current weighted average of JPM GBI-EM Global Diversified Index countries. Current account balance is the balance of a country’s net trade in goods and services, its net earnings on cross-border investments and its net transfer payments. Past performance is not a reliable indicator of current and future results. Guide to the Markets - Europe. Data as of 31 December 2019.
Glob
al e
cono
my
44
EM currencies expensive relative to USD
EM current account balance improving
+1 std. dev.
-1 std. dev.
Average
45
|GTM – Europe
USA
JPNDEU
GBRFRA
CAN
ITAESP
AUSNLD
CHN
IND
BRAMEX
TUR
KOR
RUS
IDN
ARG
SAU
THA
HKG
ZAF
-10,000
0
10,000
20,000
30,000
40,000
50,000
60,000
0 20 40 60 80 100
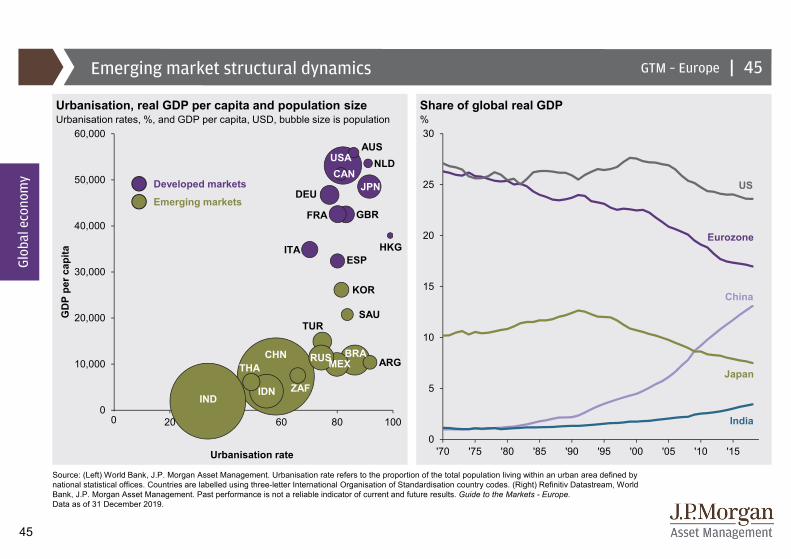
Emerging market structural dynamics
Urbanisation, real GDP per capita and population size Share of global real GDPUrbanisation rates, %, and GDP per capita, USD, bubble size is population %
Source: (Left) World Bank, J.P. Morgan Asset Management. Urbanisation rate refers to the proportion of the total population living within an urban area defined by national statistical offices. Countries are labelled using three-letter International Organisation of Standardisation country codes. (Right) Refinitiv Datastream, World Bank, J.P. Morgan Asset Management. Past performance is not a reliable indicator of current and future results. Guide to the Markets - Europe.Data as of 31 December 2019.
GD
P pe
r cap
ita
Urbanisation rate
Glob
al e
cono
my
45
Emerging markets
Developed markets
0
0
5
10
15
20
25
30
'70 '75 '80 '85 '90 '95 '00 '05 '10 '15
US
Eurozone
China
Japan
India
46
|GTM – Europe
35
40
45
50
55
60
65
-50
-40
-30
-20
-10
0
10
20
30
40
50
'00 '02 '04 '06 '08 '10 '12 '14 '16 '18 '20
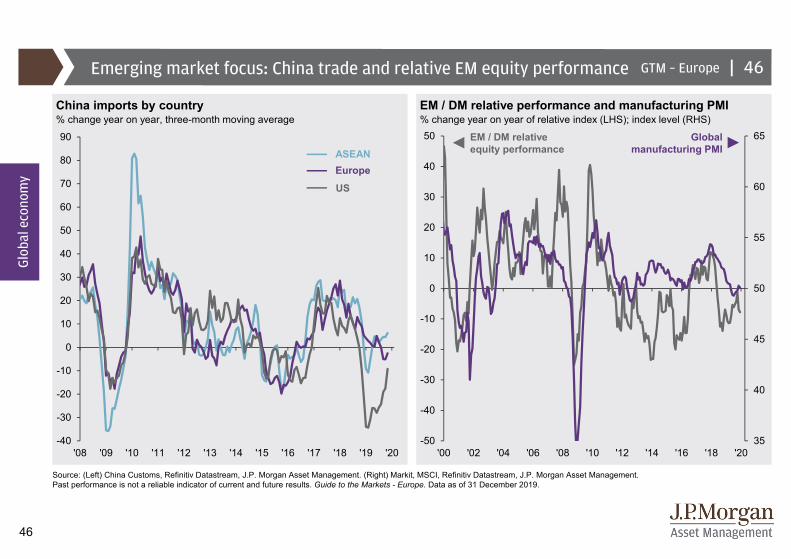
Emerging market focus: China trade and relative EM equity performance
EM / DM relative performance and manufacturing PMI% change year on year of relative index (LHS); index level (RHS)
Source: (Left) China Customs, Refinitiv Datastream, J.P. Morgan Asset Management. (Right) Markit, MSCI, Refinitiv Datastream, J.P. Morgan Asset Management. Past performance is not a reliable indicator of current and future results. Guide to the Markets - Europe. Data as of 31 December 2019.
Glob
al e
cono
my
Europe
US
ASEAN
46
China imports by country% change year on year, three-month moving average
Global manufacturing PMI
EM / DM relative equity performance
-40
-30
-20
-10
0
10
20
30
40
50
60
70
80
90
'08 '09 '10 '11 '12 '13 '14 '15 '16 '17 '18 '19 '20
47
|GTM – Europe
0x
5x
10x
15x
20x
25x
30x
35x
40x
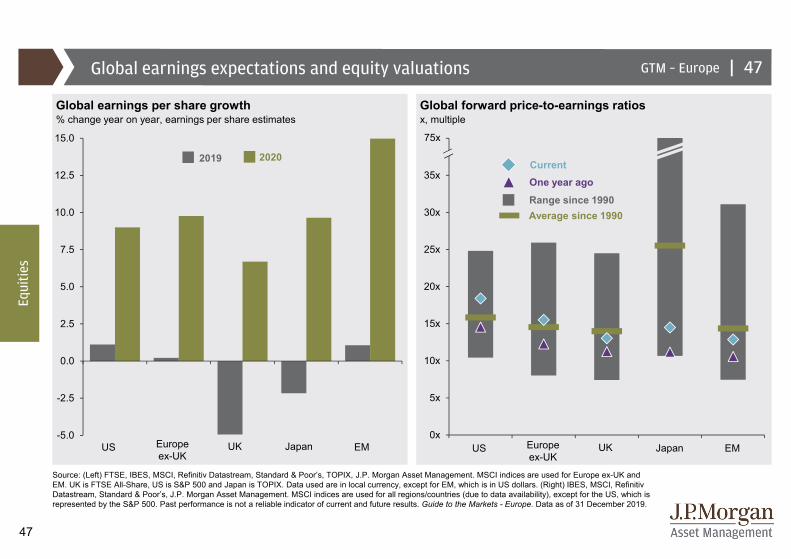
Global earnings expectations and equity valuations
Global earnings per share growth Global forward price-to-earnings ratios % change year on year, earnings per share estimates x, multiple
Source: (Left) FTSE, IBES, MSCI, Refinitiv Datastream, Standard & Poor’s, TOPIX, J.P. Morgan Asset Management. MSCI indices are used for Europe ex-UK and EM. UK is FTSE All-Share, US is S&P 500 and Japan is TOPIX. Data used are in local currency, except for EM, which is in US dollars. (Right) IBES, MSCI, RefinitivDatastream, Standard & Poor’s, J.P. Morgan Asset Management. MSCI indices are used for all regions/countries (due to data availability), except for the US, which is represented by the S&P 500. Past performance is not a reliable indicator of current and future results. Guide to the Markets - Europe. Data as of 31 December 2019.
47
Equi
ties
US UKEuropeex-UK
Japan EM
75x
2019 2020
US UKEuropeex-UK
EM
Range since 1990Average since 1990
CurrentOne year ago
Japan-5.0
-2.5
0.0
2.5
5.0
7.5
10.0
12.5
15.0
48
|GTM – Europe
0
1
2
3
4
5
6
S&P 500FTSE All-Share MSCI JapanMSCI Europe ex-UK MSCI EMMSCI World
-0.2
0.0 0.5
2.3 2.63.4 4.1 4.2 4.8 4.8 5.5
9.4
-2
0
2
4
6
8
10
MSCI Europe
Cash Global convertibles
EM equity Global REITsGermanBunds
DM high yieldEM debt Global transport
Global infrastructure
Euro IG DM equity
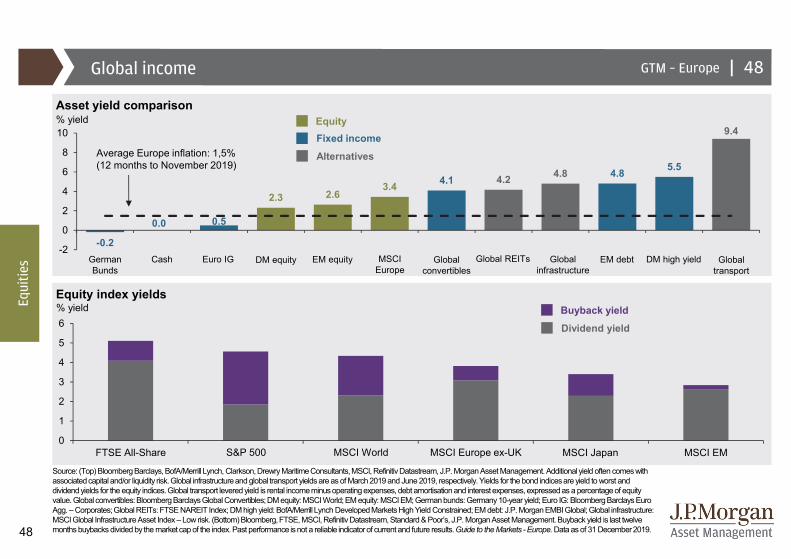
Global income
Equity index yields% yield
Source: (Top) Bloomberg Barclays, BofA/Merrill Lynch, Clarkson, DrewryMaritime Consultants, MSCI, RefinitivDatastream, J.P. Morgan Asset Management.Additional yield often comes with associated capital and/or liquidity risk. Global infrastructure and global transport yields are as of March 2019 and June 2019, respectively. Yields for the bond indices are yield to worst and dividend yields for the equity indices. Global transport levered yield is rental income minus operating expenses, debt amortisation and interest expenses, expressed as a percentage of equity value. Global convertibles: Bloomberg Barclays Global Convertibles; DM equity: MSCI World; EM equity: MSCI EM; German bunds: Germany 10-year yield; Euro IG: Bloomberg Barclays Euro Agg. – Corporates; Global REITs: FTSE NAREIT Index; DM high yield: BofA/Merrill Lynch Developed Markets High Yield Constrained; EM debt: J.P. Morgan EMBI Global; Global infrastructure: MSCI Global Infrastructure Asset Index – Low risk. (Bottom) Bloomberg, FTSE, MSCI, RefinitivDatastream, Standard & Poor’s, J.P. Morgan Asset Management. Buyback yield is last twelve months buybacks divided by the market cap of the index. Past performance is not a reliable indicator of current and future results. Guide to the Markets - Europe. Data as of 31 December 2019.
Equi
ties
48
Average Europe inflation: 1,5%(12 months to November 2019)
Fixed incomeEquity
Alternatives
% yieldAsset yield comparison
Buyback yield
Dividend yield
49
|GTM – Europe
0
5
10
15
20
25
30
IndustrialsHealth Care Cons. StaplesCons. Discr. EnergyIT MaterialsUtilitiesFinancials Comm. Serv.
0
5
10
15
20
25
IndustrialsHealth Care Cons. StaplesCons. Discr. EnergyIT MaterialsUtilitiesFinancials Comm. Serv.
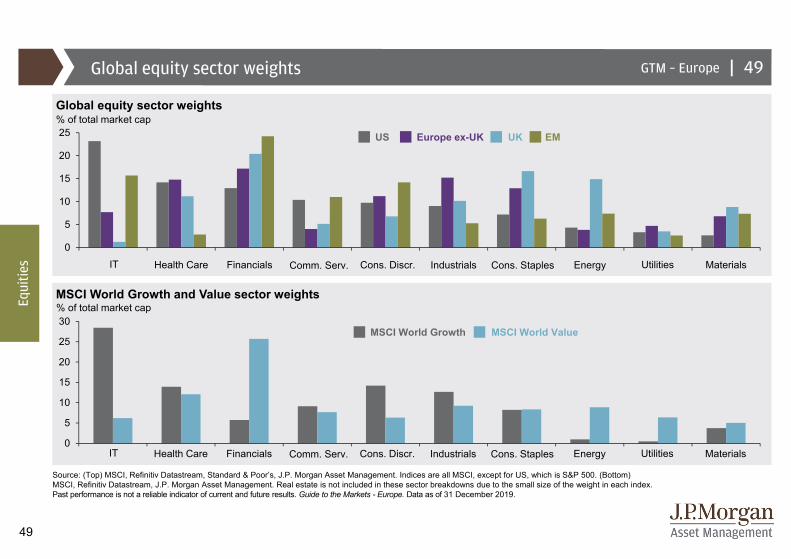
Global equity sector weights
Global equity sector weights
MSCI World Growth and Value sector weights
% of total market cap
% of total market cap
Source: (Top) MSCI, Refinitiv Datastream, Standard & Poor’s, J.P. Morgan Asset Management. Indices are all MSCI, except for US, which is S&P 500. (Bottom) MSCI, Refinitiv Datastream, J.P. Morgan Asset Management. Real estate is not included in these sector breakdowns due to the small size of the weight in each index. Past performance is not a reliable indicator of current and future results. Guide to the Markets - Europe. Data as of 31 December 2019.
Equi
ties
49
Europe ex-UK EMUS UK
MSCI World Growth MSCI World Value
50
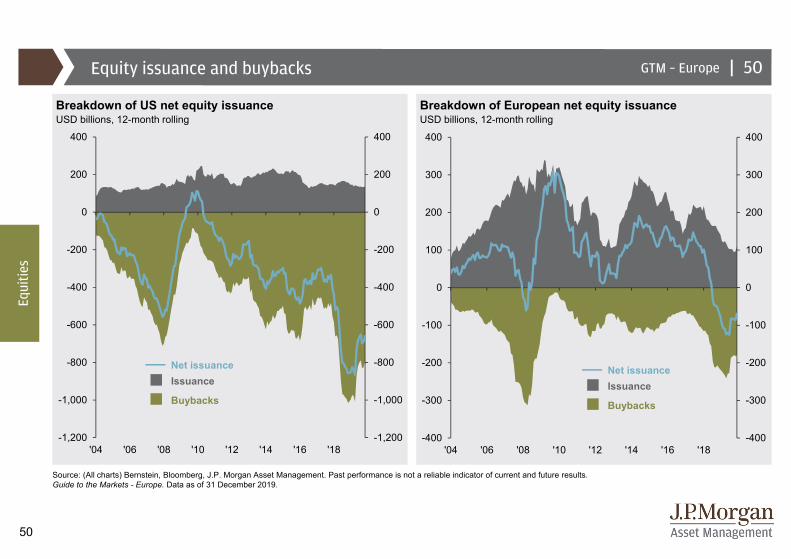
|GTM – EuropeEquity issuance and buybacks
Breakdown of US net equity issuance Breakdown of European net equity issuanceUSD billions, 12-month rolling USD billions, 12-month rolling
Source: (All charts) Bernstein, Bloomberg, J.P. Morgan Asset Management. Past performance is not a reliable indicator of current and future results. Guide to the Markets - Europe. Data as of 31 December 2019.
Buybacks
Net issuanceIssuance
Buybacks
Net issuanceIssuance
Equi
ties
50
-1,200
-1,000
-800
-600
-400
-200
0
200
400
-1,200
-1,000
-800
-600
-400
-200
0
200
400
'04 '06 '08 '10 '12 '14 '16 '18-400
-300
-200
-100
0
100
200
300
400
-400
-300
-200
-100
0
100
200
300
400
'04 '06 '08 '10 '12 '14 '16 '18
51
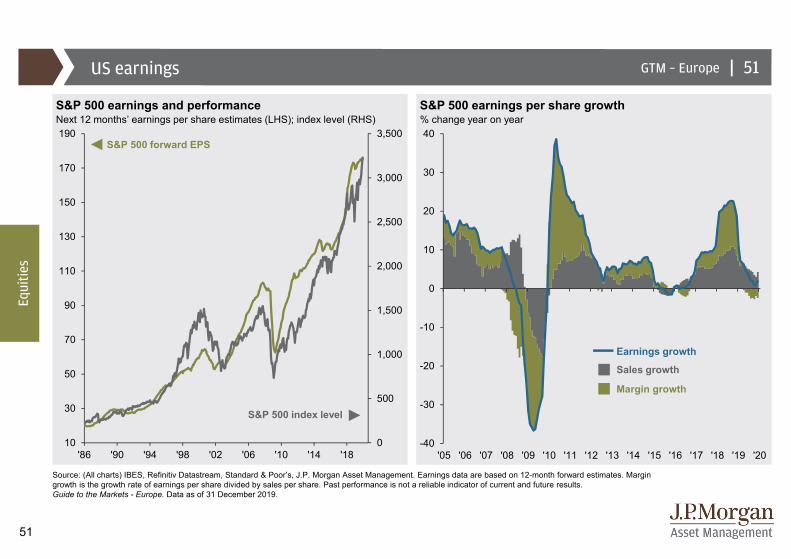
|GTM – EuropeUS earnings
S&P 500 earnings and performance S&P 500 earnings per share growthNext 12 months’ earnings per share estimates (LHS); index level (RHS) % change year on year
Source: (All charts) IBES, Refinitiv Datastream, Standard & Poor’s, J.P. Morgan Asset Management. Earnings data are based on 12-month forward estimates. Margin growth is the growth rate of earnings per share divided by sales per share. Past performance is not a reliable indicator of current and future results. Guide to the Markets - Europe. Data as of 31 December 2019.
Equi
ties
51
S&P 500 index level
S&P 500 forward EPS
Margin growth
Sales growth
Earnings growth
0
500
1,000
1,500
2,000
2,500
3,000
3,500
10
30
50
70
90
110
130
150
170
190
'86 '90 '94 '98 '02 '06 '10 '14 '18-40
-30
-20
-10
0
10
20
30
40
'05 '06 '07 '08 '09 '10 '11 '12 '13 '14 '15 '16 '17 '18 '19 '20

52
|GTM – Europe
-2
-1
0
1
2
3
4
5
6
10
12
14
16
18
20
22
24
26
'90 '92 '94 '96 '98 '00 '02 '04 '06 '08 '10 '12 '14 '16 '18 '20H
ealth
Car
e
Ene
rgy
Fina
ncia
ls
Indu
stria
ls IT
Con
s. S
tapl
es
S&
P 5
00
Com
m. S
erv.
Mat
eria
ls
Con
s. D
iscr
.
Util
ities
US equity valuations
S&P 500 forward P/E ratio S&P 500 forward P/E ratio sector breakdownx, multiple Difference between current P/E multiple and average P/E since 1990
Source: (Left) FactSet, IBES, Refinitiv Datastream, Robert Shiller, Standard & Poor’s, J.P. Morgan Asset Management. P/E ratio calculated using IBES earnings estimates for next 12 months. P/E data may differ from Guide to the Markets - US, which uses FactSet earnings estimates. Shiller cyclically-adjusted P/E (CAPE) is price-to-earnings ratio adjusted using trailing 10-year average inflation-adjusted earnings. P/B ratio is trailing price-to-book ratio. (Right) IBES, Refinitiv Datastream, Standard & Poor’s, J.P. Morgan Asset Management. Past performance is not a reliable indicator of current and future results. Guide to the Markets - Europe. Data as of 31 December 2019.
Valuation measureAverage
since 1990
Latest
Shiller CAPE ratio 25,8x 30,0xP/B ratio 2,9x 3,5x
Equi
ties
52
16,2 17,3 13,3 17,0 21,7 20,2 18,4 18,8 18,3 22,1 19,8Current forward P/E ratio
Average: 15,9x
31 Dec 2019:18,4x
Expensive relative to history
53
|GTM – Europe
-20
-15
-10
-5
0
5
10
15
20
25
30
8.0x 11.0x 14.0x 17.0x 20.0x 23.0x-60
-40
-20
0
20
40
60
8.0x 11.0x 14.0x 17.0x 20.0x 23.0x
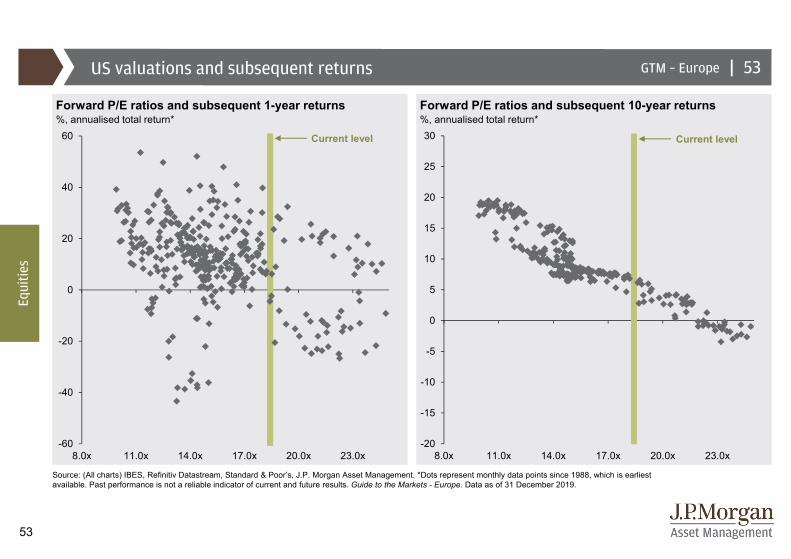
US valuations and subsequent returns
Forward P/E ratios and subsequent 1-year returns Forward P/E ratios and subsequent 10-year returns%, annualised total return* %, annualised total return*
Source: (All charts) IBES, Refinitiv Datastream, Standard & Poor’s, J.P. Morgan Asset Management. *Dots represent monthly data points since 1988, which is earliest available. Past performance is not a reliable indicator of current and future results. Guide to the Markets - Europe. Data as of 31 December 2019.
Equi
ties
53
Current levelCurrent level
54
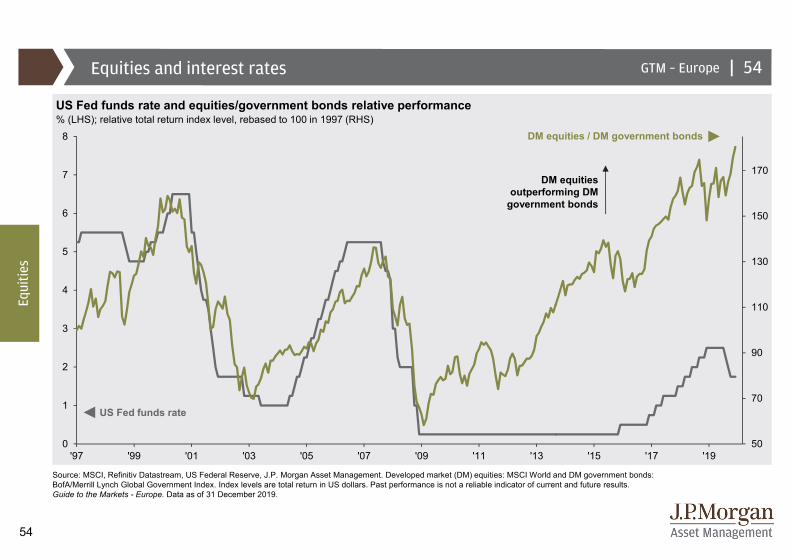
|GTM – EuropeEquities and interest rates
US Fed funds rate and equities/government bonds relative performance% (LHS); relative total return index level, rebased to 100 in 1997 (RHS)
Source: MSCI, Refinitiv Datastream, US Federal Reserve, J.P. Morgan Asset Management. Developed market (DM) equities: MSCI World and DM government bonds: BofA/Merrill Lynch Global Government Index. Index levels are total return in US dollars. Past performance is not a reliable indicator of current and future results. Guide to the Markets - Europe. Data as of 31 December 2019.
US Fed funds rate
54
Equi
ties
DM equities outperforming DM
government bonds
DM equities / DM government bonds
50
70
90
110
130
150
170
0
1
2
3
4
5
6
7
8
'97 '99 '01 '03 '05 '07 '09 '11 '13 '15 '17 '19

55
|GTM – Europe
-60
-50
-40
-30
-20
-10
0
'58 '60 '62 '64 '66 '68 '70 '72 '74 '76 '78 '80 '82 '84 '86 '88 '90 '92 '94 '96 '98 '00 '02 '04 '06 '08 '10 '12 '14 '16 '18 '20
US bull and bear markets
S&P 500 bull markets, %
S&P 500 bear markets, %
Source: Bloomberg, Standard & Poor’s, J.P. Morgan Asset Management. A bear market represents a 20% or more decline from the previous market high using a monthly frequency; a bull market represents a 20% increase from a market trough. Chart and labels refer to price return. Median values are calculated excluding data from current cycle. Past performance is not a reliable indicator of current and future results. Guide to the Markets - Europe. Data as of 31 December 2019.
60 months101%
Duration: 129 monthsPrice return: 378%
147 months582%
32 months74%
50 months86%
74 months126%
60 months229%
43 months80% 26 months
48%
Duration: 17 monthsPrice return: -57%
30 months-49%
3 months-34%
20 months-27%
21 months-48%
18 months-36%
8 months-22%6 months
-28%
Median return in final stages of bull market
12 months: 17% 24 months: 33%
55
Equi
ties 0
100
200
300
400
500
600
'58 '60 '62 '64 '66 '68 '70 '72 '74 '76 '78 '80 '82 '84 '86 '88 '90 '92 '94 '96 '98 '00 '02 '04 '06 '08 '10 '12 '14 '16 '18 '20
56
|GTM – Europe
-50
-40
-30
-20
-10
0
10
20
30
40
50
'05 '06 '07 '08 '09 '10 '11 '12 '13 '14 '15 '16 '17 '18 '19 '20
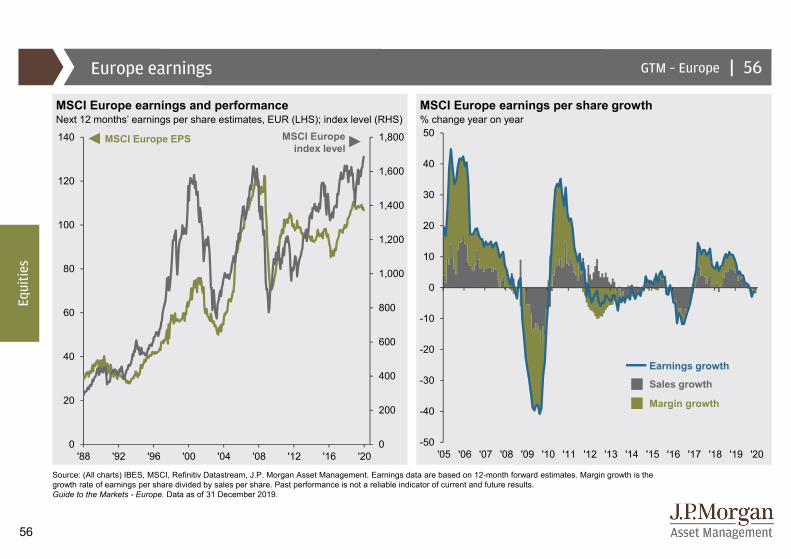
MSCI Europe earnings per share growth
Europe earnings
MSCI Europe earnings and performanceNext 12 months’ earnings per share estimates, EUR (LHS); index level (RHS) % change year on year
Source: (All charts) IBES, MSCI, Refinitiv Datastream, J.P. Morgan Asset Management. Earnings data are based on 12-month forward estimates. Margin growth is the growth rate of earnings per share divided by sales per share. Past performance is not a reliable indicator of current and future results. Guide to the Markets - Europe. Data as of 31 December 2019.
Equi
ties
56
MSCI Europe index level
MSCI Europe EPS
Margin growth
Sales growth
Earnings growth
0
200
400
600
800
1,000
1,200
1,400
1,600
1,800
0
20
40
60
80
100
120
140
'88 '92 '96 '00 '04 '08 '12 '16 '20
57
|GTM – Europe
-4
-3
-2
-1
0
1
2
3
4
7
9
11
13
15
17
19
21
23
25
27
'90 '94 '98 '02 '06 '10 '14 '18
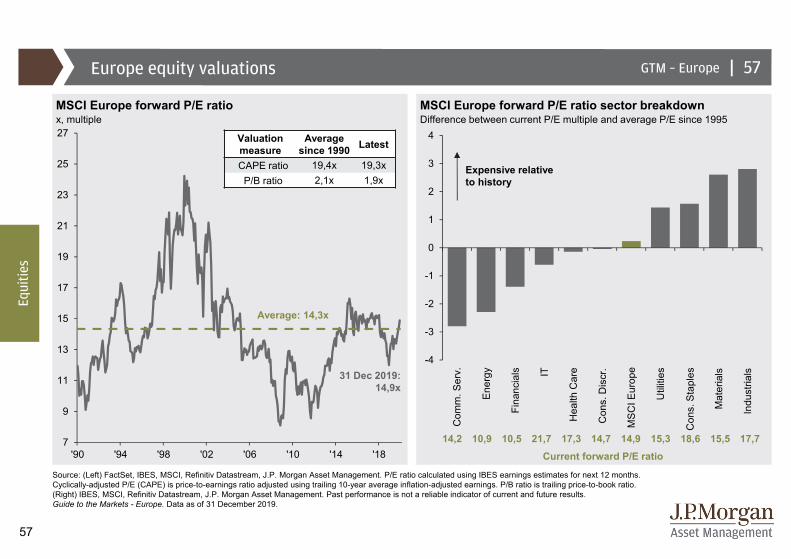
Europe equity valuations
MSCI Europe forward P/E ratio MSCI Europe forward P/E ratio sector breakdownx, multiple Difference between current P/E multiple and average P/E since 1995
Source: (Left) FactSet, IBES, MSCI, Refinitiv Datastream, J.P. Morgan Asset Management. P/E ratio calculated using IBES earnings estimates for next 12 months. Cyclically-adjusted P/E (CAPE) is price-to-earnings ratio adjusted using trailing 10-year average inflation-adjusted earnings. P/B ratio is trailing price-to-book ratio. (Right) IBES, MSCI, Refinitiv Datastream, J.P. Morgan Asset Management. Past performance is not a reliable indicator of current and future results. Guide to the Markets - Europe. Data as of 31 December 2019.
31 Dec 2019:14,9x
Average: 14,3x
Valuation measure
Average since 1990 Latest
CAPE ratio 19,4x 19,3xP/B ratio 2,1x 1,9x
57
Equi
ties
14,2 10,9 10,5 21,7 17,3 14,7 14,9 15,3 18,6 15,5 17,7Current forward P/E ratio
Com
m. S
erv.
Ene
rgy IT
Fina
ncia
ls
Indu
stria
ls
MS
CI E
urop
e
Mat
eria
ls
Con
s. S
tapl
es
Con
s. D
iscr
.
Util
ities
Hea
lth C
are
Expensive relative to history
58
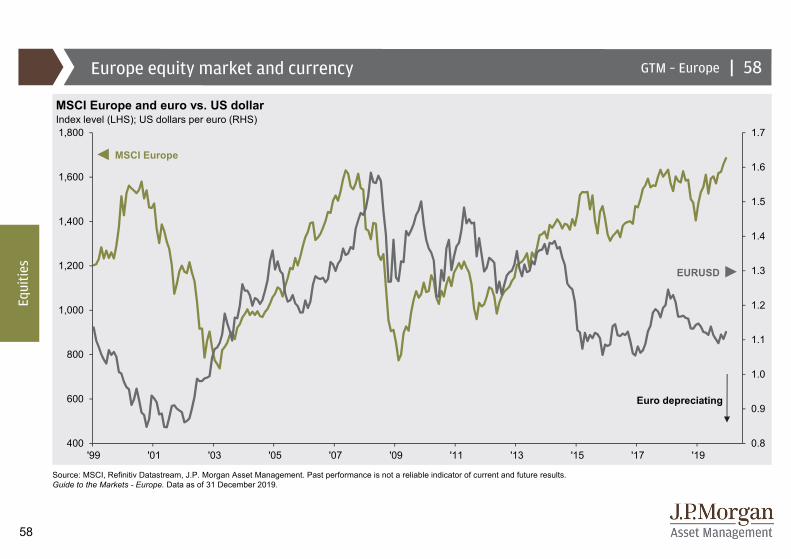
|GTM – EuropeEurope equity market and currency
MSCI Europe and euro vs. US dollarIndex level (LHS); US dollars per euro (RHS)
Source: MSCI, Refinitiv Datastream, J.P. Morgan Asset Management. Past performance is not a reliable indicator of current and future results. Guide to the Markets - Europe. Data as of 31 December 2019.
EURUSD
MSCI Europe
Equi
ties
58
Euro depreciating
0.8
0.9
1.0
1.1
1.2
1.3
1.4
1.5
1.6
1.7
400
600
800
1,000
1,200
1,400
1,600
1,800
'99 '01 '03 '05 '07 '09 '11 '13 '15 '17 '19
59
|GTM – Europe
50
100
150
200
250
300
350
400
450
500
'95 '97 '99 '01 '03 '05 '07 '09 '11 '13 '15 '17 '19
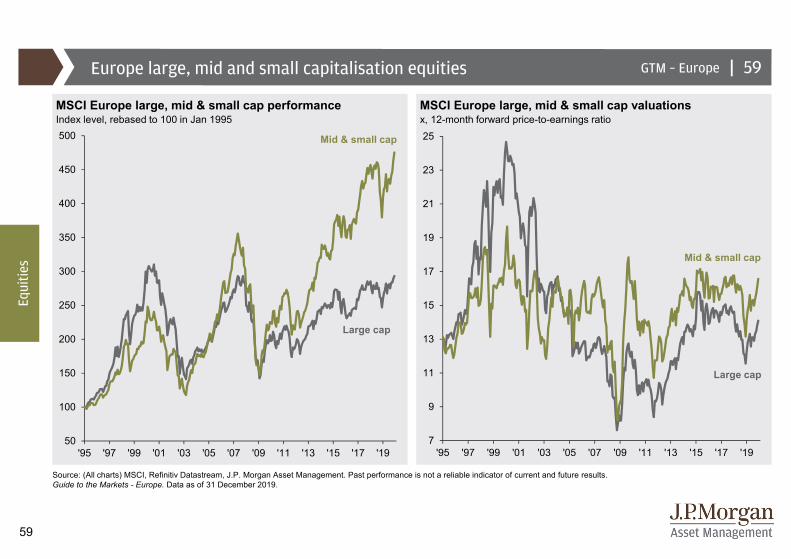
Europe large, mid and small capitalisation equities
MSCI Europe large, mid & small cap performance MSCI Europe large, mid & small cap valuationsIndex level, rebased to 100 in Jan 1995 x, 12-month forward price-to-earnings ratio
Source: (All charts) MSCI, Refinitiv Datastream, J.P. Morgan Asset Management. Past performance is not a reliable indicator of current and future results. Guide to the Markets - Europe. Data as of 31 December 2019.
Mid & small cap
Large cap
Mid & small cap
Large cap
59
Equi
ties
7
9
11
13
15
17
19
21
23
25
'95 '97 '99 '01 '03 '05 '07 '09 '11 '13 '15 '17 '19

60
|GTM – EuropeUK earnings
FTSE All-Share earnings and performance FTSE All-Share earnings per share growthNext 12 months’ earnings per share estimates, GBP (LHS); index level (RHS) % change year on year
Source: (All charts) FTSE, IBES, Refinitiv Datastream, J.P. Morgan Asset Management. Earnings data are based on 12-month forward estimates. Margin growth is the growth rate of earnings per share divided by sales per share. Past performance is not a reliable indicator of current and future results. Guide to the Markets - Europe. Data as of 31 December 2019.
Equi
ties
60
FTSE All-Share index levelFTSE All-Share EPS
Margin growth
Sales growth
Earnings growth
-40
-30
-20
-10
0
10
20
30
40
50
60
'05 '06 '07 '08 '09 '10 '11 '12 '13 '14 '15 '16 '17 '18 '19 '201,500
2,000
2,500
3,000
3,500
4,000
4,500
100
150
200
250
300
350
'99 '01 '03 '05 '07 '09 '11 '13 '15 '17 '19
61
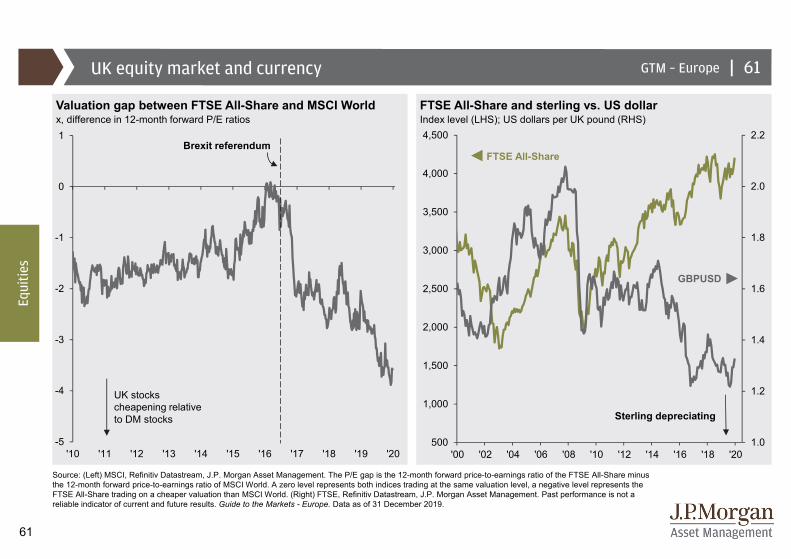
|GTM – EuropeUK equity market and currency
Index level (LHS); US dollars per UK pound (RHS)
Source: (Left) MSCI, Refinitiv Datastream, J.P. Morgan Asset Management. The P/E gap is the 12-month forward price-to-earnings ratio of the FTSE All-Share minus the 12-month forward price-to-earnings ratio of MSCI World. A zero level represents both indices trading at the same valuation level, a negative level represents the FTSE All-Share trading on a cheaper valuation than MSCI World. (Right) FTSE, Refinitiv Datastream, J.P. Morgan Asset Management. Past performance is not a reliable indicator of current and future results. Guide to the Markets - Europe. Data as of 31 December 2019.
Equi
ties
61
UK stocks cheapening relative to DM stocks
Valuation gap between FTSE All-Share and MSCI Worldx, difference in 12-month forward P/E ratios
FTSE All-Share and sterling vs. US dollar
1.0
1.2
1.4
1.6
1.8
2.0
2.2
500
1,000
1,500
2,000
2,500
3,000
3,500
4,000
4,500
'00 '02 '04 '06 '08 '10 '12 '14 '16 '18 '20
GBPUSD
FTSE All-Share
Sterling depreciating
-5
-4
-3
-2
-1
0
1
'10 '11 '12 '13 '14 '15 '16 '17 '18 '19 '20
Brexit referendum
62
|GTM – Europe
0
500
1,000
1,500
2,000
2,500
3,000
0
20
40
60
80
100
120
140
160
180
'88 '92 '96 '00 '04 '08 '12 '16 '20
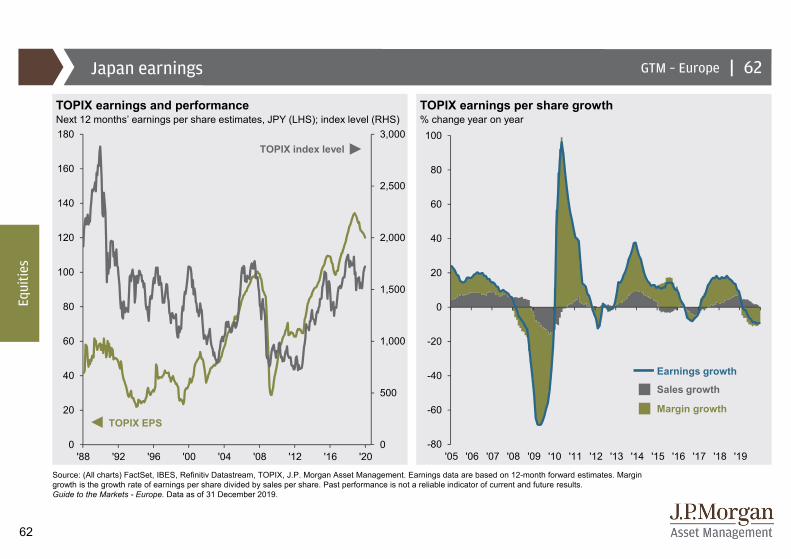
Japan earnings
TOPIX earnings and performance TOPIX earnings per share growthNext 12 months’ earnings per share estimates, JPY (LHS); index level (RHS)
Source: (All charts) FactSet, IBES, Refinitiv Datastream, TOPIX, J.P. Morgan Asset Management. Earnings data are based on 12-month forward estimates. Margin growth is the growth rate of earnings per share divided by sales per share. Past performance is not a reliable indicator of current and future results. Guide to the Markets - Europe. Data as of 31 December 2019.
Equi
ties
62
% change year on year
TOPIX index level
TOPIX EPSMargin growth
Sales growth
Earnings growth
-80
-60
-40
-20
0
20
40
60
80
100
'05 '06 '07 '08 '09 '10 '11 '12 '13 '14 '15 '16 '17 '18 '19
63
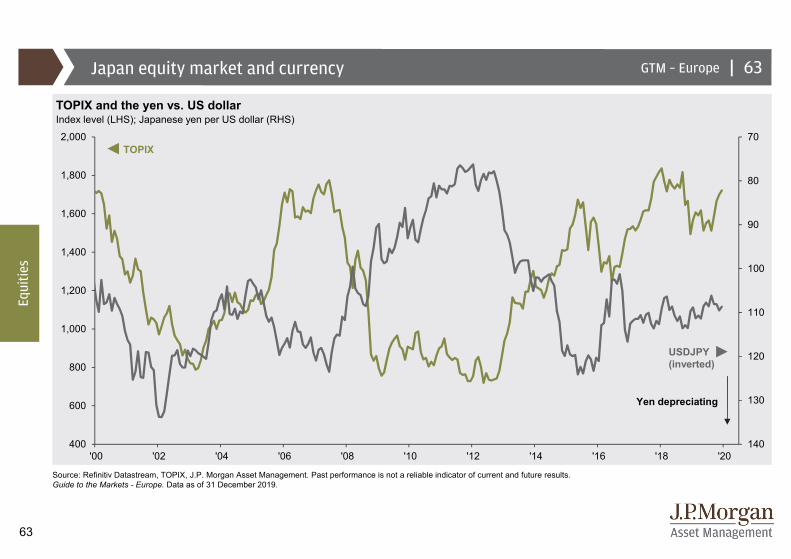
|GTM – EuropeJapan equity market and currency
TOPIX and the yen vs. US dollarIndex level (LHS); Japanese yen per US dollar (RHS)
Source: Refinitiv Datastream, TOPIX, J.P. Morgan Asset Management. Past performance is not a reliable indicator of current and future results. Guide to the Markets - Europe. Data as of 31 December 2019.
USDJPY (inverted)
TOPIX
Equi
ties
Yen depreciating
63
70
80
90
100
110
120
130
140400
600
800
1,000
1,200
1,400
1,600
1,800
2,000
'00 '02 '04 '06 '08 '10 '12 '14 '16 '18 '20
64
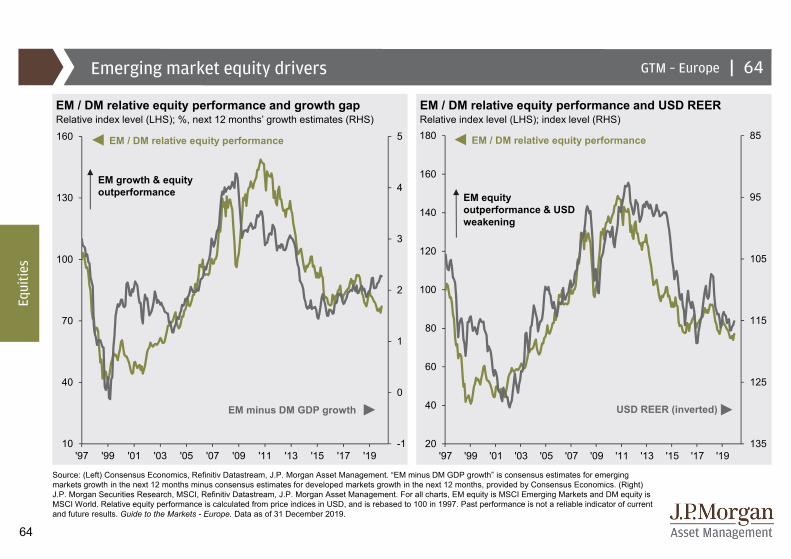
|GTM – EuropeEmerging market equity drivers
EM / DM relative equity performance and growth gap EM / DM relative equity performance and USD REERRelative index level (LHS); %, next 12 months’ growth estimates (RHS) Relative index level (LHS); index level (RHS)
Source: (Left) Consensus Economics, Refinitiv Datastream, J.P. Morgan Asset Management. “EM minus DM GDP growth” is consensus estimates for emerging markets growth in the next 12 months minus consensus estimates for developed markets growth in the next 12 months, provided by Consensus Economics. (Right) J.P. Morgan Securities Research, MSCI, Refinitiv Datastream, J.P. Morgan Asset Management. For all charts, EM equity is MSCI Emerging Markets and DM equity is MSCI World. Relative equity performance is calculated from price indices in USD, and is rebased to 100 in 1997. Past performance is not a reliable indicator of current and future results. Guide to the Markets - Europe. Data as of 31 December 2019.
Equi
ties
64
EM equity outperformance & USD weakening
EM growth & equity outperformance
EM minus DM GDP growth
EM / DM relative equity performance
USD REER (inverted)
EM / DM relative equity performance
-1
0
1
2
3
4
5
10
40
70
100
130
160
'97 '99 '01 '03 '05 '07 '09 '11 '13 '15 '17 '19
85
95
105
115
125
13520
40
60
80
100
120
140
160
180
'97 '99 '01 '03 '05 '07 '09 '11 '13 '15 '17 '19
65
|GTM – Europe
-20
-10
0
10
20
30
0.8x 1.3x 1.8x 2.3x 2.8x 3.3x0.8
1.0
1.2
1.4
1.6
1.8
2.0
2.2
2.4
2.6
2.8
3.0
'96 '98 '00 '02 '04 '06 '08 '10 '12 '14 '16 '18 '20
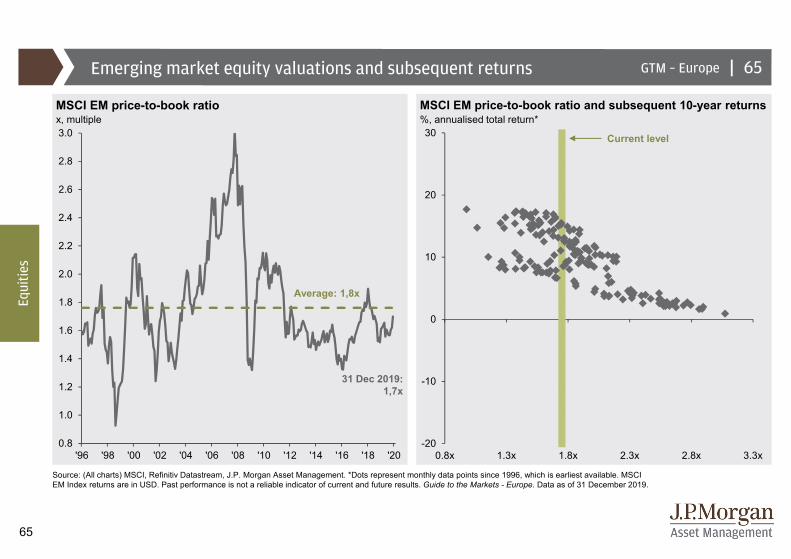
Emerging market equity valuations and subsequent returns
MSCI EM price-to-book ratio MSCI EM price-to-book ratio and subsequent 10-year returnsx, multiple %, annualised total return*
Source: (All charts) MSCI, Refinitiv Datastream, J.P. Morgan Asset Management. *Dots represent monthly data points since 1996, which is earliest available. MSCI EM Index returns are in USD. Past performance is not a reliable indicator of current and future results. Guide to the Markets - Europe. Data as of 31 December 2019.
Average: 1,8x
Equi
ties
65
31 Dec 2019:1,7x
Current level

66
|GTM – Europe
0
4
8
12
16
20
24
28
32
36
'86 '90 '94 '98 '02 '06 '10 '14 '186
8
10
12
14
16
18
20
22
24
'86 '90 '94 '98 '02 '06 '10 '14 '18
Equity focus: Margin pressures
US National Federation of Independent Business survey US corporate profit margins% of surveyed companies, three-month moving average %, corporate profits as % of gross value added of corporate business
Source: (Left) NFIB, Refinitiv Datastream, J.P. Morgan Asset Management. Net % of companies planning to raise prices is % of companies planning to increase prices less those planning to reduce prices. (Right) BEA, Refinitiv Datastream, J.P. Morgan Asset Management. Periods of “recession” are defined using US National Bureau of Economic Research (NBER) business cycle dates. Past performance is not a reliable indicator of current and future results. Guide to the Markets - Europe. Data as of 31 December 2019.
Equi
ties
Net % companies planning to raise prices
% companies planning to raise wages
After tax
Before tax
Recession
66
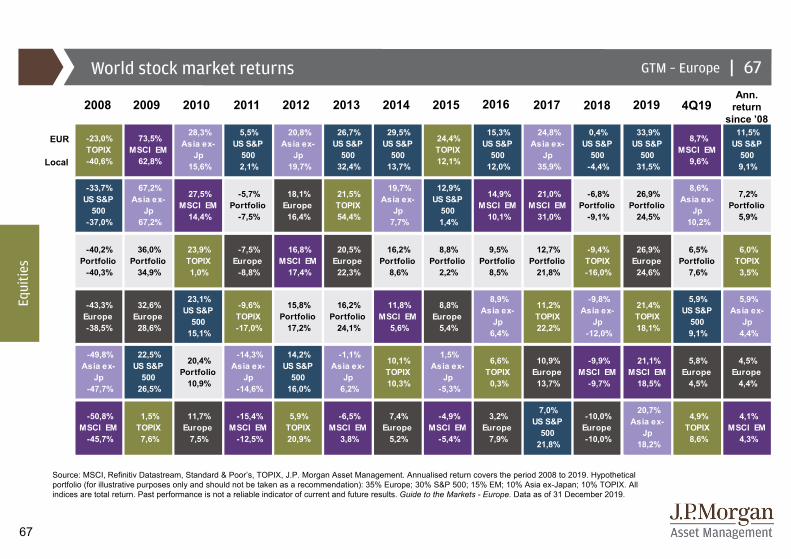
67
-23,0% TOPIX -40,6%
73,5% MSCI EM
62,8%
28,3% Asia ex-
Jp 15,6%
5,5% US S&P
500 2,1%
20,8% Asia ex-
Jp 19,7%
26,7% US S&P
500 32,4%
29,5% US S&P
500 13,7%
24,4% TOPIX 12,1%
15,3% US S&P
500 12,0%
24,8% Asia ex-
Jp 35,9%
0,4% US S&P
500 -4,4%
33,9% US S&P
500 31,5%
8,7% MSCI EM
9,6%
11,5% US S&P
500 9,1%
-33,7% US S&P
500 -37,0%
67,2% Asia ex-
Jp 67,2%
27,5% MSCI EM
14,4%
-5,7% Portfolio
-7,5%
18,1% Europe 16,4%
21,5% TOPIX 54,4%
19,7% Asia ex-
Jp 7,7%
12,9% US S&P
500 1,4%
14,9% MSCI EM
10,1%
21,0% MSCI EM
31,0%
-6,8% Portfolio
-9,1%
26,9% Portfolio
24,5%
8,6% Asia ex-
Jp 10,2%
7,2% Portfolio
5,9%
-40,2% Portfolio -40,3%
36,0% Portfolio
34,9%
23,9% TOPIX 1,0%
-7,5% Europe -8,8%
16,8% MSCI EM
17,4%
20,5% Europe 22,3%
16,2% Portfolio
8,6%
8,8% Portfolio
2,2%
9,5% Portfolio
8,5%
12,7% Portfolio
21,8%
-9,4% TOPIX -16,0%
26,9% Europe 24,6%
6,5% Portfolio
7,6%
6,0% TOPIX 3,5%
-43,3% Europe -38,5%
32,6% Europe 28,6%
23,1% US S&P
500 15,1%
-9,6% TOPIX -17,0%
15,8% Portfolio
17,2%
16,2% Portfolio
24,1%
11,8% MSCI EM
5,6%
8,8% Europe 5,4%
8,9% Asia ex-
Jp 6,4%
11,2% TOPIX 22,2%
-9,8% Asia ex-
Jp -12,0%
21,4% TOPIX 18,1%
5,9% US S&P
500 9,1%
5,9% Asia ex-
Jp 4,4%
-49,8% Asia ex-
Jp -47,7%
22,5% US S&P
500 26,5%
20,4% Portfolio
10,9%
-14,3% Asia ex-
Jp -14,6%
14,2% US S&P
500 16,0%
-1,1% Asia ex-
Jp 6,2%
10,1% TOPIX 10,3%
1,5% Asia ex-
Jp -5,3%
6,6% TOPIX 0,3%
10,9% Europe 13,7%
-9,9% MSCI EM
-9,7%
21,1% MSCI EM
18,5%
5,8% Europe 4,5%
4,5% Europe 4,4%
-50,8% MSCI EM
-45,7%
1,5% TOPIX 7,6%
11,7% Europe 7,5%
-15,4% MSCI EM
-12,5%
5,9% TOPIX 20,9%
-6,5% MSCI EM
3,8%
7,4% Europe 5,2%
-4,9% MSCI EM
-5,4%
3,2% Europe 7,9%
7,0% US S&P
500 21,8%
-10,0% Europe -10,0%
20,7% Asia ex-
Jp 18,2%
4,9% TOPIX 8,6%
4,1% MSCI EM
4,3%
World stock market returns
Source: MSCI, Refinitiv Datastream, Standard & Poor’s, TOPIX, J.P. Morgan Asset Management. Annualised return covers the period 2008 to 2019. Hypothetical portfolio (for illustrative purposes only and should not be taken as a recommendation): 35% Europe; 30% S&P 500; 15% EM; 10% Asia ex-Japan; 10% TOPIX. All indices are total return. Past performance is not a reliable indicator of current and future results. Guide to the Markets - Europe. Data as of 31 December 2019.
GTM – Europe |
Equi
ties
67
EUR
Local
2010 201620122008 2011 20192009 2013 2014 2015 2017 4Q192018Ann.
return since ’08
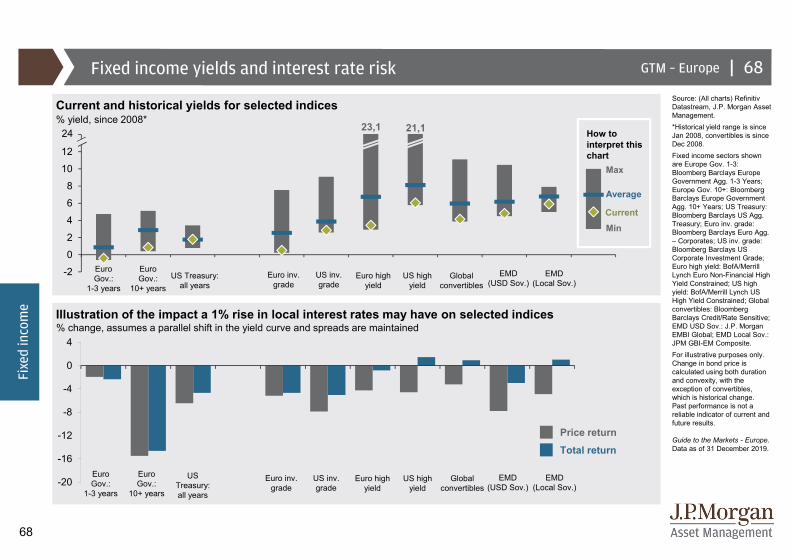
68
|GTM – Europe
-20
-16
-12
-8
-4
0
4
-2
0
2
4
6
8
10
12
14
Fixed income yields and interest rate risk
Current and historical yields for selected indices
Illustration of the impact a 1% rise in local interest rates may have on selected indices% change, assumes a parallel shift in the yield curve and spreads are maintained
Source: (All charts) RefinitivDatastream, J.P. Morgan Asset Management.*Historical yield range is since Jan 2008, convertibles is since Dec 2008.Fixed income sectors shown are Europe Gov. 1-3: Bloomberg Barclays Europe Government Agg. 1-3 Years; Europe Gov. 10+: Bloomberg Barclays Europe Government Agg. 10+ Years; US Treasury: Bloomberg Barclays US Agg. Treasury; Euro inv. grade: Bloomberg Barclays Euro Agg. – Corporates; US inv. grade: Bloomberg Barclays US Corporate Investment Grade; Euro high yield: BofA/Merrill Lynch Euro Non-Financial High Yield Constrained; US high yield: BofA/Merrill Lynch US High Yield Constrained; Global convertibles: Bloomberg Barclays Credit/Rate Sensitive; EMD USD Sov.: J.P. Morgan EMBI Global; EMD Local Sov.: JPM GBI-EM Composite. For illustrative purposes only. Change in bond price is calculated using both duration and convexity, with the exception of convertibles, which is historical change.Past performance is not a reliable indicator of current and future results.
Guide to the Markets - Europe.Data as of 31 December 2019.
Euro Gov.:
1-3 years
Euro Gov.:
10+ yearsUS Treasury:
all yearsEuro inv.
gradeUS inv. grade
Euro high yield
US high yield
Global convertibles
EMD (USD Sov.)
EMD (Local Sov.)
How to interpret this chart
Average
Current
Max
Min
Fixe
d in
com
e
68
Euro Gov.:
1-3 years
Euro Gov.:
10+ years
US Treasury: all years
Euro inv. grade
US inv. grade
Euro high yield
US high yield
Global convertibles
EMD (USD Sov.)
EMD (Local Sov.)
Price return
Total return
24 23,1 21,1% yield, since 2008*
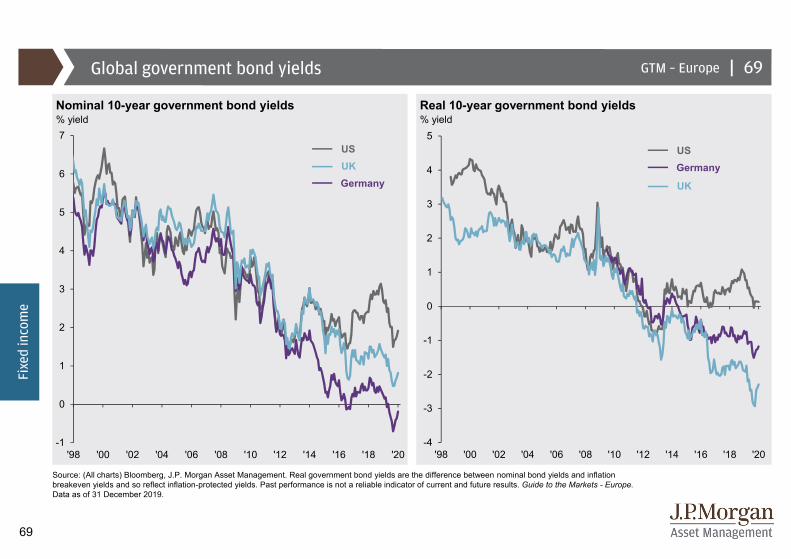
69
|GTM – EuropeGlobal government bond yields
Nominal 10-year government bond yields Real 10-year government bond yields% yield % yield
Source: (All charts) Bloomberg, J.P. Morgan Asset Management. Real government bond yields are the difference between nominal bond yields and inflation breakeven yields and so reflect inflation-protected yields. Past performance is not a reliable indicator of current and future results. Guide to the Markets - Europe. Data as of 31 December 2019.
69
USGermany
UK
Fixe
d in
com
e
US
GermanyUK
-1
0
1
2
3
4
5
6
7
'98 '00 '02 '04 '06 '08 '10 '12 '14 '16 '18 '20-4
-3
-2
-1
0
1
2
3
4
5
'98 '00 '02 '04 '06 '08 '10 '12 '14 '16 '18 '20
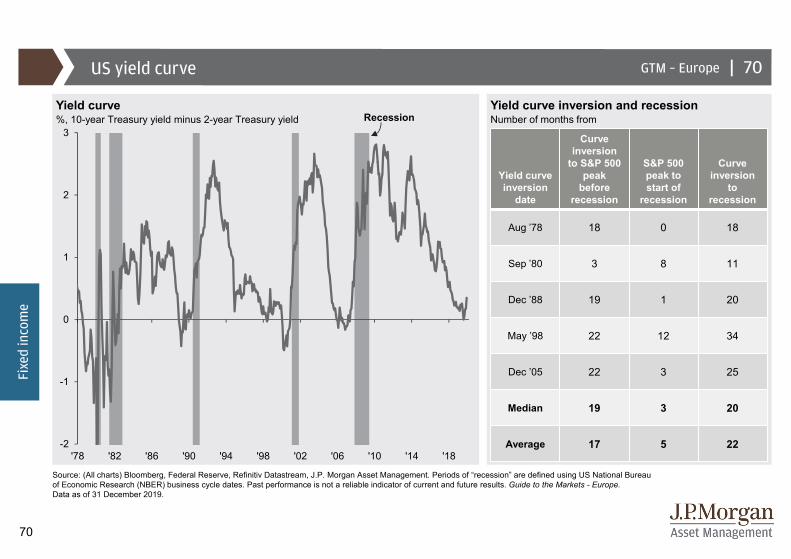
70
|GTM – Europe
-2
-1
0
1
2
3
'78 '82 '86 '90 '94 '98 '02 '06 '10 '14 '18
US yield curve
Yield curve Yield curve inversion and recession%, 10-year Treasury yield minus 2-year Treasury yield Number of months from
Source: (All charts) Bloomberg, Federal Reserve, Refinitiv Datastream, J.P. Morgan Asset Management. Periods of “recession” are defined using US National Bureau of Economic Research (NBER) business cycle dates. Past performance is not a reliable indicator of current and future results. Guide to the Markets - Europe. Data as of 31 December 2019.
Yield curve inversion
date
Curve inversion
to S&P 500 peak
before recession
S&P 500 peak to start of
recession
Curve inversion
to recession
Aug ’78 18 0 18
Sep ’80 3 8 11
Dec ’88 19 1 20
May ’98 22 12 34
Dec ’05 22 3 25
Median 19 3 20
Average 17 5 22
Recession
Fixe
d in
com
e
70
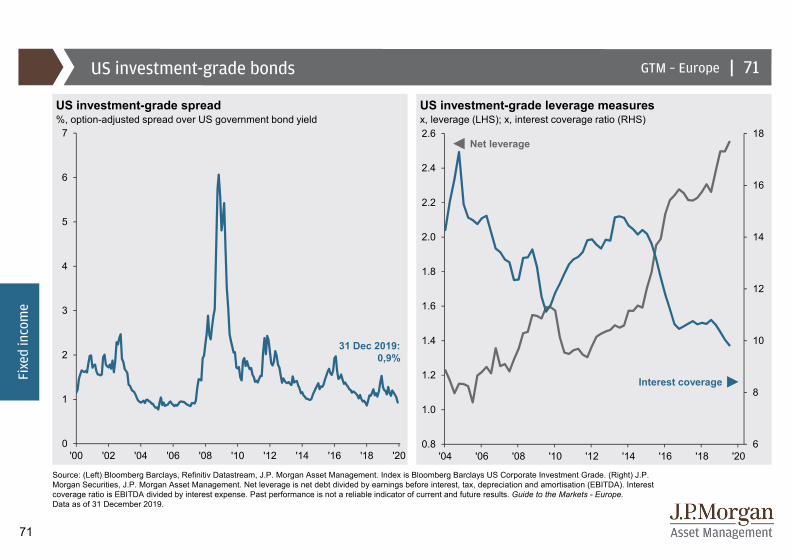
71
|GTM – Europe
6
8
10
12
14
16
18
0.8
1.0
1.2
1.4
1.6
1.8
2.0
2.2
2.4
2.6
'04 '06 '08 '10 '12 '14 '16 '18 '20
US investment-grade bonds
US investment-grade spread US investment-grade leverage measures%, option-adjusted spread over US government bond yield x, leverage (LHS); x, interest coverage ratio (RHS)
Source: (Left) Bloomberg Barclays, Refinitiv Datastream, J.P. Morgan Asset Management. Index is Bloomberg Barclays US Corporate Investment Grade. (Right) J.P. Morgan Securities, J.P. Morgan Asset Management. Net leverage is net debt divided by earnings before interest, tax, depreciation and amortisation (EBITDA). Interest coverage ratio is EBITDA divided by interest expense. Past performance is not a reliable indicator of current and future results. Guide to the Markets - Europe. Data as of 31 December 2019.
Fixe
d in
com
e
71
0
1
2
3
4
5
6
7
'00 '02 '04 '06 '08 '10 '12 '14 '16 '18 '20
31 Dec 2019:0,9%
Interest coverage
Net leverage
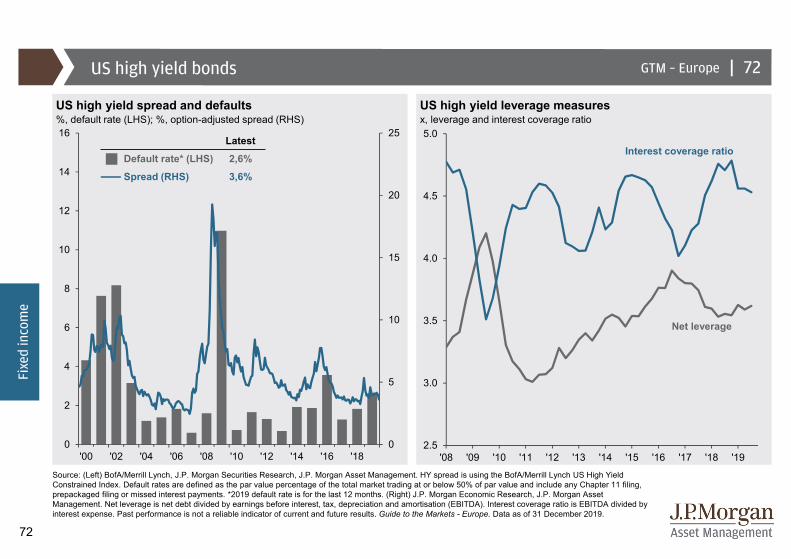
72
|GTM – Europe
2.5
3.0
3.5
4.0
4.5
5.0
'08 '09 '10 '11 '12 '13 '14 '15 '16 '17 '18 '190
5
10
15
20
25
0
2
4
6
8
10
12
14
16
'00 '02 '04 '06 '08 '10 '12 '14 '16 '18
US high yield bonds
US high yield spread and defaults US high yield leverage measures%, default rate (LHS); %, option-adjusted spread (RHS) x, leverage and interest coverage ratio
Source: (Left) BofA/Merrill Lynch, J.P. Morgan Securities Research, J.P. Morgan Asset Management. HY spread is using the BofA/Merrill Lynch US High Yield Constrained Index. Default rates are defined as the par value percentage of the total market trading at or below 50% of par value and include any Chapter 11 filing, prepackaged filing or missed interest payments. *2019 default rate is for the last 12 months. (Right) J.P. Morgan Economic Research, J.P. Morgan Asset Management. Net leverage is net debt divided by earnings before interest, tax, depreciation and amortisation (EBITDA). Interest coverage ratio is EBITDA divided by interest expense. Past performance is not a reliable indicator of current and future results. Guide to the Markets - Europe. Data as of 31 December 2019.
Fixe
d in
com
e
72
Interest coverage ratioLatest
Default rate* (LHS) 2,6%
Spread (RHS) 3,6%
Net leverage
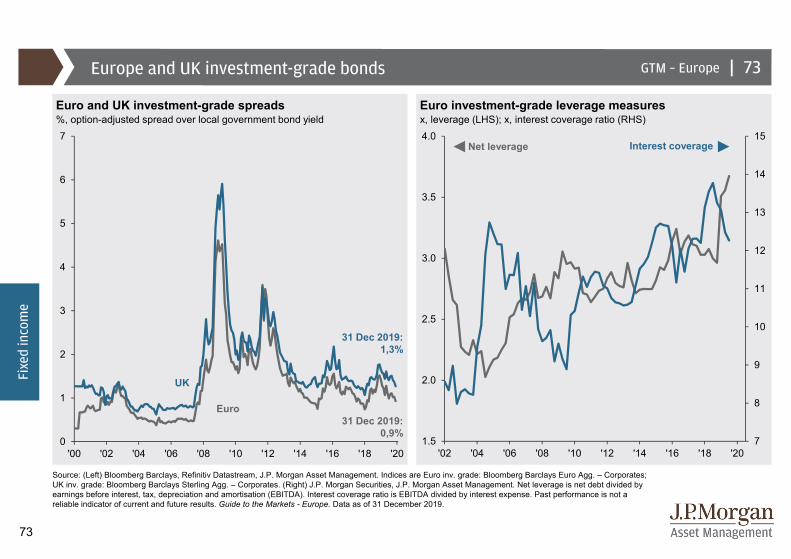
73
|GTM – Europe
7
8
9
10
11
12
13
14
15
1.5
2.0
2.5
3.0
3.5
4.0
'02 '04 '06 '08 '10 '12 '14 '16 '18 '20
Europe and UK investment-grade bonds
Euro and UK investment-grade spreads Euro investment-grade leverage measures%, option-adjusted spread over local government bond yield x, leverage (LHS); x, interest coverage ratio (RHS)
Source: (Left) Bloomberg Barclays, Refinitiv Datastream, J.P. Morgan Asset Management. Indices are Euro inv. grade: Bloomberg Barclays Euro Agg. – Corporates; UK inv. grade: Bloomberg Barclays Sterling Agg. – Corporates. (Right) J.P. Morgan Securities, J.P. Morgan Asset Management. Net leverage is net debt divided by earnings before interest, tax, depreciation and amortisation (EBITDA). Interest coverage ratio is EBITDA divided by interest expense. Past performance is not a reliable indicator of current and future results. Guide to the Markets - Europe. Data as of 31 December 2019.
Net leverage Interest coverage
Fixe
d in
com
e
73
Euro
UK
0
1
2
3
4
5
6
7
'00 '02 '04 '06 '08 '10 '12 '14 '16 '18 '20
31 Dec 2019:1,3%
31 Dec 2019:0,9%
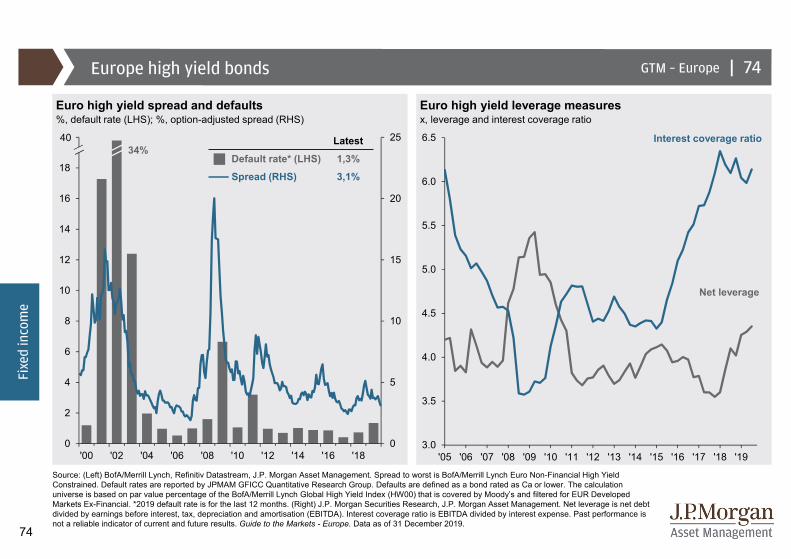
74
|GTM – Europe
0
5
10
15
20
25
0
2
4
6
8
10
12
14
16
18
20
'00 '02 '04 '06 '08 '10 '12 '14 '16 '183.0
3.5
4.0
4.5
5.0
5.5
6.0
6.5
'05 '06 '07 '08 '09 '10 '11 '12 '13 '14 '15 '16 '17 '18 '19
Europe high yield bonds
Euro high yield spread and defaults Euro high yield leverage measures%, default rate (LHS); %, option-adjusted spread (RHS) x, leverage and interest coverage ratio
Source: (Left) BofA/Merrill Lynch, Refinitiv Datastream, J.P. Morgan Asset Management. Spread to worst is BofA/Merrill Lynch Euro Non-Financial High Yield Constrained. Default rates are reported by JPMAM GFICC Quantitative Research Group. Defaults are defined as a bond rated as Ca or lower. The calculation universe is based on par value percentage of the BofA/Merrill Lynch Global High Yield Index (HW00) that is covered by Moody’s and filtered for EUR Developed Markets Ex-Financial. *2019 default rate is for the last 12 months. (Right) J.P. Morgan Securities Research, J.P. Morgan Asset Management. Net leverage is net debt divided by earnings before interest, tax, depreciation and amortisation (EBITDA). Interest coverage ratio is EBITDA divided by interest expense. Past performance is not a reliable indicator of current and future results. Guide to the Markets - Europe. Data as of 31 December 2019.
34%
Fixe
d in
com
e
74
40 Latest
Default rate* (LHS) 1,3%
Spread (RHS) 3,1%
Interest coverage ratio
Net leverage
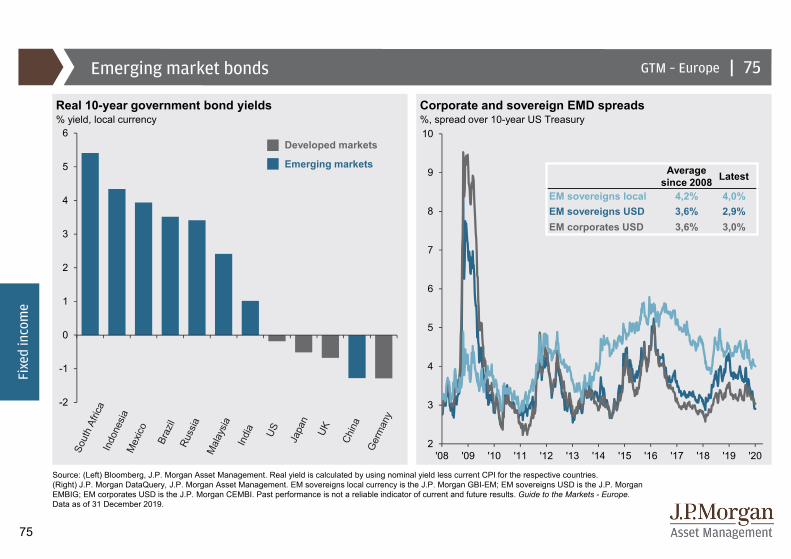
75
|GTM – Europe
2
3
4
5
6
7
8
9
10
'08 '09 '10 '11 '12 '13 '14 '15 '16 '17 '18 '19 '20
Emerging market bonds
Real 10-year government bond yields% yield, local currency
Source: (Left) Bloomberg, J.P. Morgan Asset Management. Real yield is calculated by using nominal yield less current CPI for the respective countries. (Right) J.P. Morgan DataQuery, J.P. Morgan Asset Management. EM sovereigns local currency is the J.P. Morgan GBI-EM; EM sovereigns USD is the J.P. Morgan EMBIG; EM corporates USD is the J.P. Morgan CEMBI. Past performance is not a reliable indicator of current and future results. Guide to the Markets - Europe. Data as of 31 December 2019.
Fixe
d in
com
e
75
Developed markets
Emerging markets
Corporate and sovereign EMD spreads %, spread over 10-year US Treasury
Average since 2008 Latest
EM sovereigns local 4,2% 4,0%EM sovereigns USD 3,6% 2,9%EM corporates USD 3,6% 3,0%
-2
-1
0
1
2
3
4
5
6
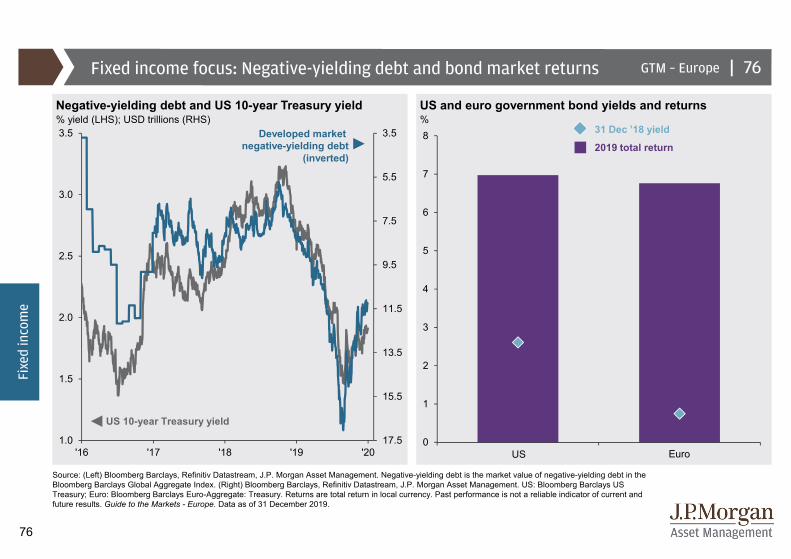
76
|GTM – Europe
0
1
2
3
4
5
6
7
8
Fixed income focus: Negative-yielding debt and bond market returns
Negative-yielding debt and US 10-year Treasury yield US and euro government bond yields and returns% yield (LHS); USD trillions (RHS) %
Source: (Left) Bloomberg Barclays, Refinitiv Datastream, J.P. Morgan Asset Management. Negative-yielding debt is the market value of negative-yielding debt in the Bloomberg Barclays Global Aggregate Index. (Right) Bloomberg Barclays, Refinitiv Datastream, J.P. Morgan Asset Management. US: Bloomberg Barclays US Treasury; Euro: Bloomberg Barclays Euro-Aggregate: Treasury. Returns are total return in local currency. Past performance is not a reliable indicator of current and future results. Guide to the Markets - Europe. Data as of 31 December 2019.
US 10-year Treasury yield
Developed market negative-yielding debt
(inverted)
Fixe
d in
com
e
76
2019 total return
31 Dec ’18 yield
US Euro
3.5
5.5
7.5
9.5
11.5
13.5
15.5
17.51.0
1.5
2.0
2.5
3.0
3.5
'16 '17 '18 '19 '20
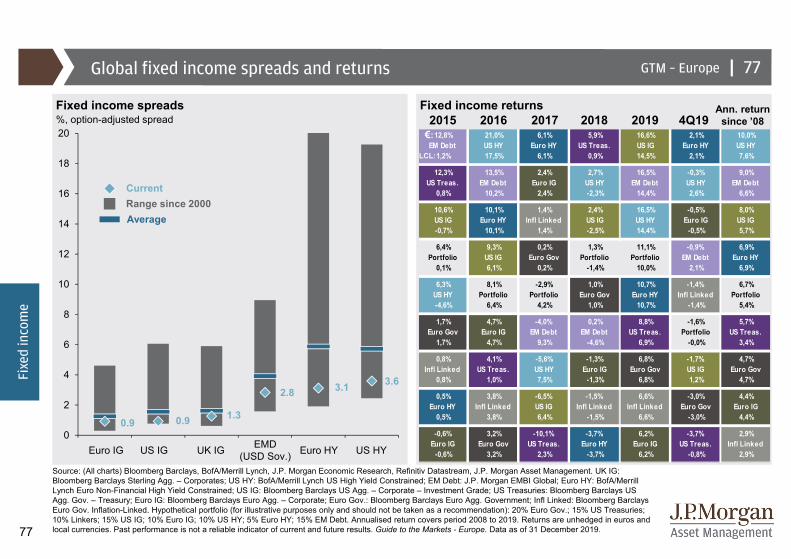
77
|GTM – Europe
12,8% EM Debt
1,2%
21,0% US HY 17,5%
6,1% Euro HY
6,1%
5,9% US Treas.
0,9%
16,6% US IG
14,5%
2,1% Euro HY
2,1%
10,0% US HY 7,6%
12,3% US Treas.
0,8%
13,5% EM Debt 10,2%
2,4% Euro IG 2,4%
2,7% US HY -2,3%
16,5% EM Debt 14,4%
-0,3% US HY 2,6%
9,0% EM Debt
6,6%
10,6% US IG -0,7%
10,1% Euro HY 10,1%
1,4% Infl Linked
1,4%
2,4% US IG -2,5%
16,5% US HY 14,4%
-0,5% Euro IG -0,5%
8,0% US IG 5,7%
6,4% Portfolio
0,1%
9,3% US IG 6,1%
0,2% Euro Gov
0,2%
1,3% Portfolio
-1,4%
11,1% Portfolio
10,0%
-0,9% EM Debt
2,1%
6,9% Euro HY
6,9%
6,3% US HY -4,6%
8,1% Portfolio
6,4%
-2,9% Portfolio
4,2%
1,0% Euro Gov
1,0%
10,7% Euro HY 10,7%
-1,4% Infl Linked
-1,4%
6,7% Portfolio
5,4%
1,7% Euro Gov
1,7%
4,7% Euro IG 4,7%
-4,0% EM Debt
9,3%
0,2% EM Debt
-4,6%
8,8% US Treas.
6,9%
-1,6% Portfolio
-0,0%
5,7% US Treas.
3,4%
0,8% Infl Linked
0,8%
4,1% US Treas.
1,0%
-5,6% US HY 7,5%
-1,3% Euro IG -1,3%
6,8% Euro Gov
6,8%
-1,7% US IG 1,2%
4,7% Euro Gov
4,7%
0,5% Euro HY
0,5%
3,8% Infl Linked
3,8%
-6,5% US IG 6,4%
-1,5% Infl Linked
-1,5%
6,6% Infl Linked
6,6%
-3,0% Euro Gov
-3,0%
4,4% Euro IG 4,4%
-0,6% Euro IG -0,6%
3,2% Euro Gov
3,2%
-10,1% US Treas.
2,3%
-3,7% Euro HY -3,7%
6,2% Euro IG 6,2%
-3,7% US Treas.
-0,8%
2,9% Infl Linked
2,9%
0.9 0.9 1.3
2.8 3.1 3.6
0
2
4
6
8
10
12
14
16
18
20
Global fixed income spreads and returns
Fixed income spreads Fixed income returns%, option-adjusted spread
Source: (All charts) Bloomberg Barclays, BofA/Merrill Lynch, J.P. Morgan Economic Research, Refinitiv Datastream, J.P. Morgan Asset Management. UK IG: Bloomberg Barclays Sterling Agg. – Corporates; US HY: BofA/Merrill Lynch US High Yield Constrained; EM Debt: J.P. Morgan EMBI Global; Euro HY: BofA/Merrill Lynch Euro Non-Financial High Yield Constrained; US IG: Bloomberg Barclays US Agg. – Corporate – Investment Grade; US Treasuries: Bloomberg Barclays US Agg. Gov. – Treasury; Euro IG: Bloomberg Barclays Euro Agg. – Corporate; Euro Gov.: Bloomberg Barclays Euro Agg. Government; Infl Linked: Bloomberg Barclays Euro Gov. Inflation-Linked. Hypothetical portfolio (for illustrative purposes only and should not be taken as a recommendation): 20% Euro Gov.; 15% US Treasuries; 10% Linkers; 15% US IG; 10% Euro IG; 10% US HY; 5% Euro HY; 15% EM Debt. Annualised return covers period 2008 to 2019. Returns are unhedged in euros and local currencies. Past performance is not a reliable indicator of current and future results. Guide to the Markets - Europe. Data as of 31 December 2019.
|
Fixe
d in
com
e
77
€:
LCL:
Range since 2000Average
Current
US IGEuro IG UK IG US HYEuro HYEMD (USD Sov.)
20162015 2017 2018 4Q192019Ann. return
since ’08
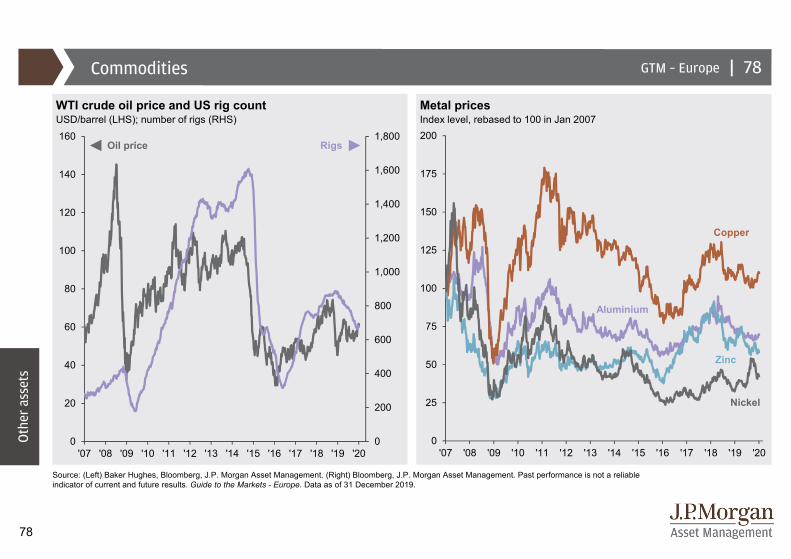
78
|GTM – Europe
0
25
50
75
100
125
150
175
200
'07 '08 '09 '10 '11 '12 '13 '14 '15 '16 '17 '18 '19 '20
Commodities
Metal pricesIndex level, rebased to 100 in Jan 2007
Source: (Left) Baker Hughes, Bloomberg, J.P. Morgan Asset Management. (Right) Bloomberg, J.P. Morgan Asset Management. Past performance is not a reliable indicator of current and future results. Guide to the Markets - Europe. Data as of 31 December 2019.
Oth
er a
sset
s
78
WTI crude oil price and US rig countUSD/barrel (LHS); number of rigs (RHS)
RigsOil price
Nickel
Copper
Zinc
Aluminium
0
200
400
600
800
1,000
1,200
1,400
1,600
1,800
0
20
40
60
80
100
120
140
160
'07 '08 '09 '10 '11 '12 '13 '14 '15 '16 '17 '18 '19 '20
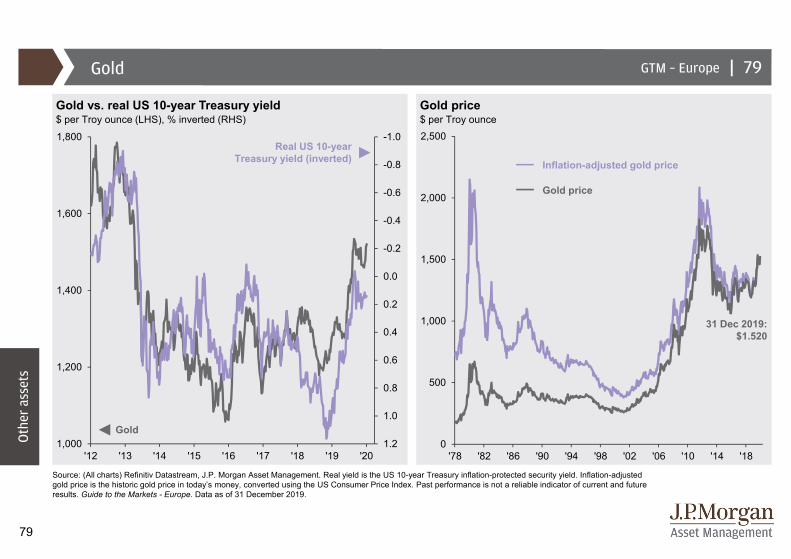
79
|GTM – Europe
-1.0
-0.8
-0.6
-0.4
-0.2
0.0
0.2
0.4
0.6
0.8
1.0
1.21,000
1,200
1,400
1,600
1,800
'12 '13 '14 '15 '16 '17 '18 '19 '200
500
1,000
1,500
2,000
2,500
'78 '82 '86 '90 '94 '98 '02 '06 '10 '14 '18
Gold
Gold vs. real US 10-year Treasury yield Gold price$ per Troy ounce (LHS), % inverted (RHS) $ per Troy ounce
Source: (All charts) Refinitiv Datastream, J.P. Morgan Asset Management. Real yield is the US 10-year Treasury inflation-protected security yield. Inflation-adjusted gold price is the historic gold price in today’s money, converted using the US Consumer Price Index. Past performance is not a reliable indicator of current and future results. Guide to the Markets - Europe. Data as of 31 December 2019.
Oth
er a
sset
s
Gold
79
Inflation-adjusted gold price
Gold price
31 Dec 2019: $1.520
Real US 10-yearTreasury yield (inverted)
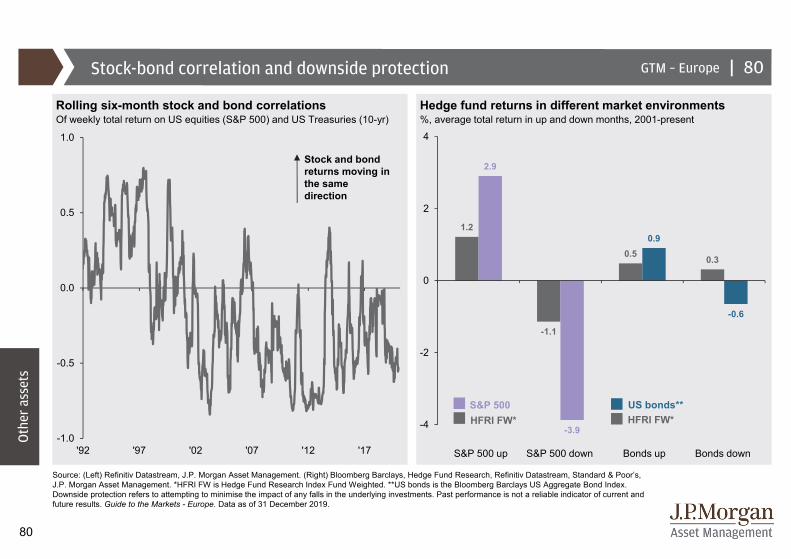
80
|GTM – EuropeStock-bond correlation and downside protection
Rolling six-month stock and bond correlations Hedge fund returns in different market environmentsOf weekly total return on US equities (S&P 500) and US Treasuries (10-yr) %, average total return in up and down months, 2001-present
Source: (Left) Refinitiv Datastream, J.P. Morgan Asset Management. (Right) Bloomberg Barclays, Hedge Fund Research, Refinitiv Datastream, Standard & Poor’s, J.P. Morgan Asset Management. *HFRI FW is Hedge Fund Research Index Fund Weighted. **US bonds is the Bloomberg Barclays US Aggregate Bond Index.Downside protection refers to attempting to minimise the impact of any falls in the underlying investments. Past performance is not a reliable indicator of current and future results. Guide to the Markets - Europe. Data as of 31 December 2019.
HFRI FW*US bonds**
HFRI FW*S&P 500
S&P 500 up S&P 500 down Bonds downBonds up
Oth
er a
sset
s
80
Stock and bond returns moving in the same direction
1.2
-1.1
0.5 0.3
2.9
-3.9
0.9
-0.6
-4
-2
0
2
4
-1.0
-0.5
0.0
0.5
1.0
'92 '97 '02 '07 '12 '17
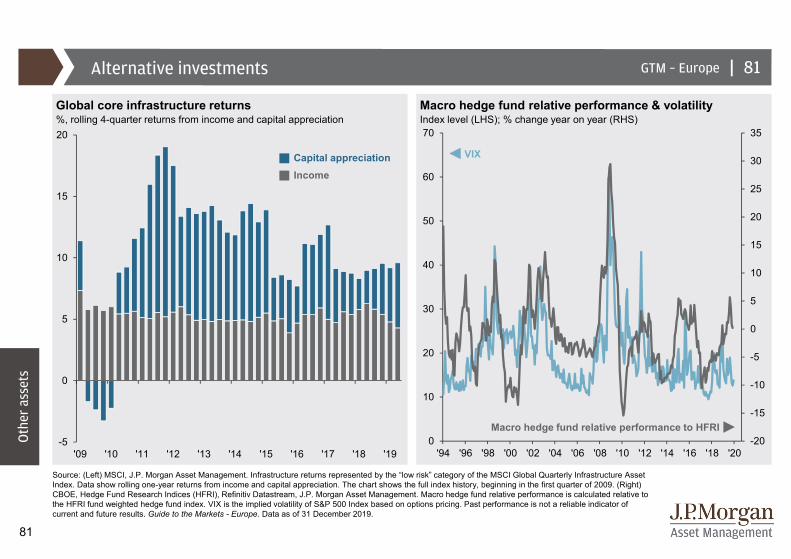
81
|GTM – EuropeAlternative investments
Macro hedge fund relative performance & volatilityIndex level (LHS); % change year on year (RHS)
Source: (Left) MSCI, J.P. Morgan Asset Management. Infrastructure returns represented by the “low risk” category of the MSCI Global Quarterly Infrastructure Asset Index. Data show rolling one-year returns from income and capital appreciation. The chart shows the full index history, beginning in the first quarter of 2009. (Right) CBOE, Hedge Fund Research Indices (HFRI), Refinitiv Datastream, J.P. Morgan Asset Management. Macro hedge fund relative performance is calculated relative to the HFRI fund weighted hedge fund index. VIX is the implied volatility of S&P 500 Index based on options pricing. Past performance is not a reliable indicator of current and future results. Guide to the Markets - Europe. Data as of 31 December 2019.
Oth
er a
sset
s
81
VIX
Macro hedge fund relative performance to HFRI
Global core infrastructure returns%, rolling 4-quarter returns from income and capital appreciation
-20
-15
-10
-5
0
5
10
15
20
25
30
35
0
10
20
30
40
50
60
70
'94 '96 '98 '00 '02 '04 '06 '08 '10 '12 '14 '16 '18 '20
IncomeCapital appreciation
-5
0
5
10
15
20
'09 '10 '11 '12 '13 '14 '15 '16 '17 '18 '19
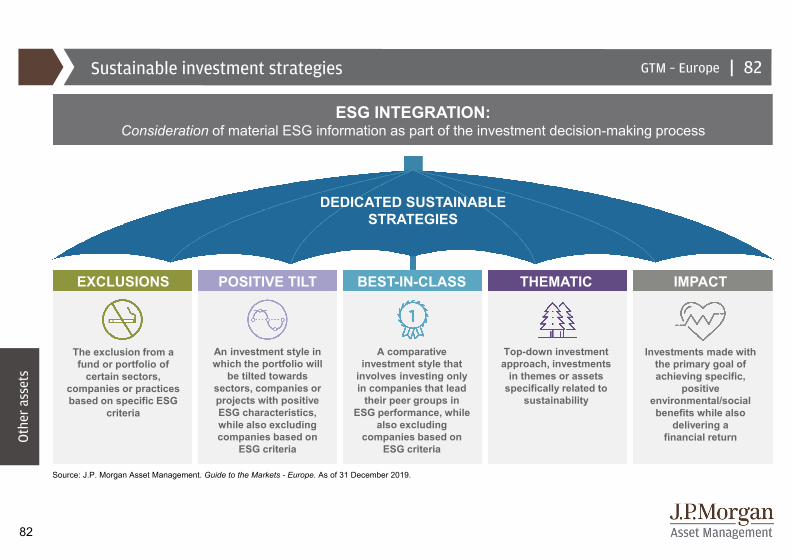
82
Sustainable investment strategies
Source: J.P. Morgan Asset Management. Guide to the Markets - Europe. As of 31 December 2019.
| 82
ESG INTEGRATION: Consideration of material ESG information as part of the investment decision-making process
DEDICATED SUSTAINABLE STRATEGIES
EXCLUSIONS POSITIVE TILT BEST-IN-CLASS THEMATIC IMPACT
The exclusion from a fund or portfolio of
certain sectors, companies or practices based on specific ESG
criteria
An investment style in which the portfolio will
be tilted towards sectors, companies or projects with positive ESG characteristics, while also excluding companies based on
ESG criteria
A comparative investment style that
involves investing only in companies that lead
their peer groups in ESG performance, while
also excluding companies based on
ESG criteria
Top-down investment approach, investments
in themes or assets specifically related to
sustainability
Investments made with the primary goal of achieving specific,
positive environmental/social benefits while also
delivering a financial returnO
ther
ass
ets
GTM – Europe
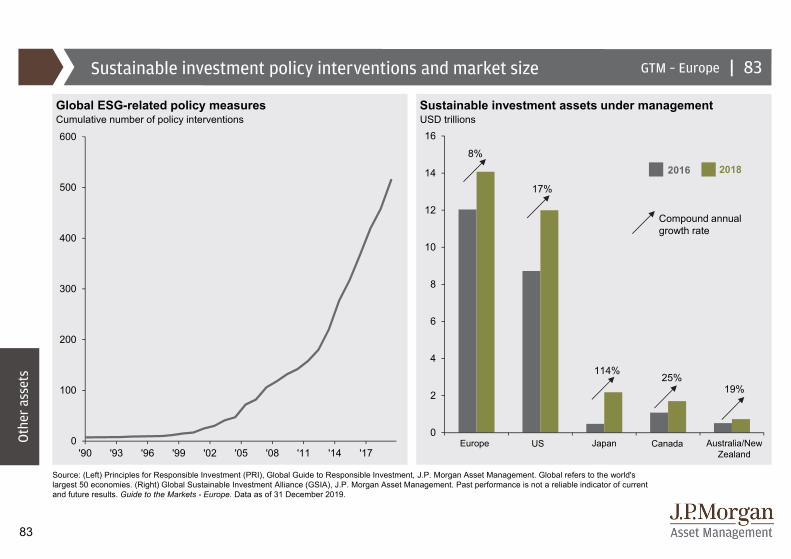
83
|GTM – Europe
0
2
4
6
8
10
12
14
16
Sustainable investment policy interventions and market size
Global ESG-related policy measures Sustainable investment assets under managementUSD trillions
Source: (Left) Principles for Responsible Investment (PRI), Global Guide to Responsible Investment, J.P. Morgan Asset Management. Global refers to the world's largest 50 economies. (Right) Global Sustainable Investment Alliance (GSIA), J.P. Morgan Asset Management. Past performance is not a reliable indicator of current and future results. Guide to the Markets - Europe. Data as of 31 December 2019.
17%
114%25%
19%
8%2016
Compound annual growth rate
2018
Oth
er a
sset
s
83
Europe US Japan Canada Australia/New Zealand
Cumulative number of policy interventions
0
100
200
300
400
500
600
'90 '93 '96 '99 '02 '05 '08 '11 '14 '17
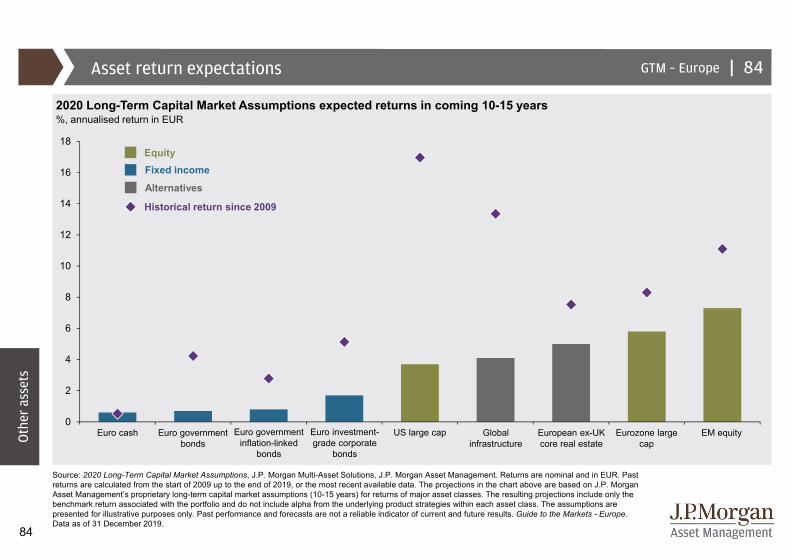
84
|GTM – Europe
0
2
4
6
8
10
12
14
16
18
Asset return expectations
2020 Long-Term Capital Market Assumptions expected returns in coming 10-15 years%, annualised return in EUR
Source: 2020 Long-Term Capital Market Assumptions, J.P. Morgan Multi-Asset Solutions, J.P. Morgan Asset Management. Returns are nominal and in EUR. Past returns are calculated from the start of 2009 up to the end of 2019, or the most recent available data. The projections in the chart above are based on J.P. Morgan Asset Management’s proprietary long-term capital market assumptions (10-15 years) for returns of major asset classes. The resulting projections include only the benchmark return associated with the portfolio and do not include alpha from the underlying product strategies within each asset class. The assumptions are presented for illustrative purposes only. Past performance and forecasts are not a reliable indicator of current and future results. Guide to the Markets - Europe. Data as of 31 December 2019.
Oth
er a
sset
s
84
Fixed incomeEquity
Alternatives
Historical return since 2009
Euro cash Euro government bonds
Euro government inflation-linked
bonds
Euro investment-grade corporate
bonds
US large cap Global infrastructure
European ex-UK core real estate
Eurozone large cap
EM equity

85
|GTM – EuropeThe cost of hedging
Hedging cost heatmap Rolling hedging costsCurrent annualised hedging cost based on 3-month FX forwards %, annualised hedging cost based on 3-month FX forwards
Source: (All charts) Bloomberg, J.P. Morgan Asset Management. A positive number implies that an investor gains a yield pickup when hedging currency risk, and a negative number implies that an investor is charged to hedge currency risk, based on 3-month FX forward rates. Past performance is not a reliable indicator of current and future results. Guide to the Markets - Europe. Data as of 31 December 2019.
…and hedged into home currency
USD EUR GBP JPY
Foreign asset in…
USD - - 2,3% - 1,0% - 2,1%
EUR + 2,3% - + 1,3% + 0,2%
GBP + 1,0% - 1,3% - - 1,1%
JPY + 2,1% - 0,2% + 1,1% -
Hedging getting more expensive
USD asset to EUR
Positive = yield pickup to hedgeNegative = cost to hedge
85
Oth
er a
sset
s
-4.0
-3.5
-3.0
-2.5
-2.0
-1.5
-1.0
-0.5
0.0
'16 '17 '18 '19 '20
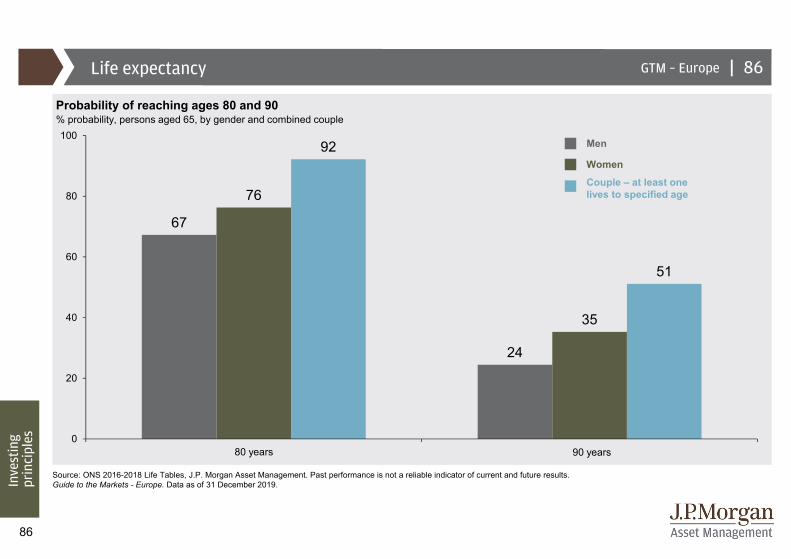
86
|GTM – EuropeLife expectancy
Probability of reaching ages 80 and 90% probability, persons aged 65, by gender and combined couple
Source: ONS 2016-2018 Life Tables, J.P. Morgan Asset Management. Past performance is not a reliable indicator of current and future results.Guide to the Markets - Europe. Data as of 31 December 2019.
Men
Women
Couple – at least one lives to specified age
Inve
stin
g pr
inci
ples
86
67
24
76
35
92
51
0
20
40
60
80
100
80 years 90 years
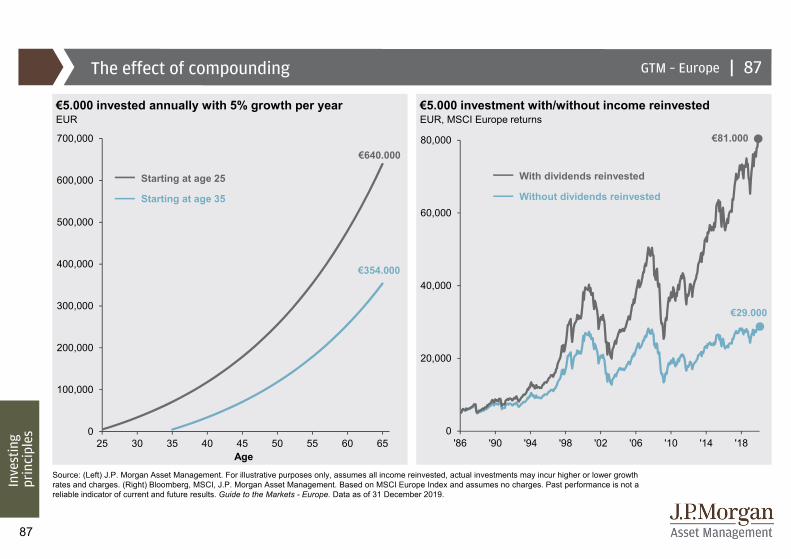
87
|GTM – Europe
0
100,000
200,000
300,000
400,000
500,000
600,000
700,000
25 30 35 40 45 50 55 60 650
20,000
40,000
60,000
80,000
'86 '90 '94 '98 '02 '06 '10 '14 '18
The effect of compounding
€5.000 invested annually with 5% growth per year €5.000 investment with/without income reinvestedEUR EUR, MSCI Europe returns
Source: (Left) J.P. Morgan Asset Management. For illustrative purposes only, assumes all income reinvested, actual investments may incur higher or lower growth rates and charges. (Right) Bloomberg, MSCI, J.P. Morgan Asset Management. Based on MSCI Europe Index and assumes no charges. Past performance is not a reliable indicator of current and future results. Guide to the Markets - Europe. Data as of 31 December 2019.
Inve
stin
g pr
inci
ples
Starting at age 35
Starting at age 25
Without dividends reinvested
With dividends reinvested
Age
€354.000
€640.000
87
€81.000
€29.000
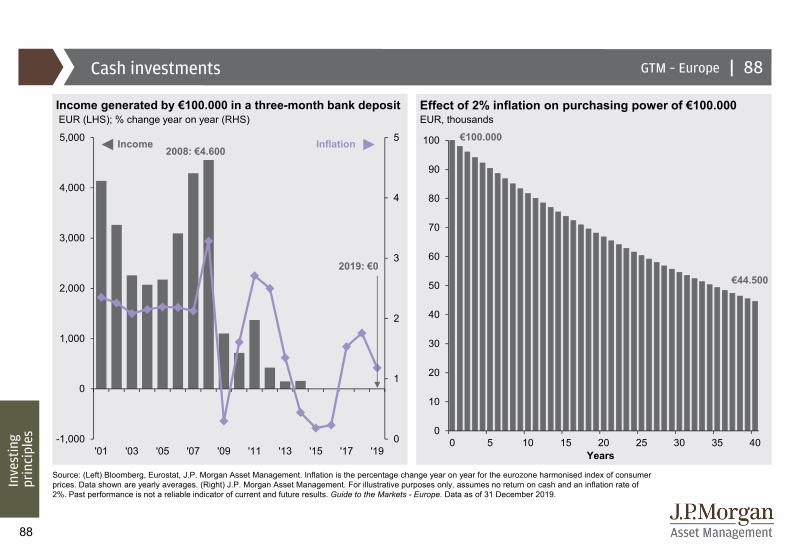
88
|GTM – Europe
0
1
2
3
4
5
-1,000
0
1,000
2,000
3,000
4,000
5,000
'01 '03 '05 '07 '09 '11 '13 '15 '17 '19
0
10
20
30
40
50
60
70
80
90
100
0 5 10 15 20 25 30 35 40
Cash investments
Income generated by €100.000 in a three-month bank depositEUR (LHS); % change year on year (RHS)
Source: (Left) Bloomberg, Eurostat, J.P. Morgan Asset Management. Inflation is the percentage change year on year for the eurozone harmonised index of consumer prices. Data shown are yearly averages. (Right) J.P. Morgan Asset Management. For illustrative purposes only, assumes no return on cash and an inflation rate of 2%. Past performance is not a reliable indicator of current and future results. Guide to the Markets - Europe. Data as of 31 December 2019.
Inve
stin
g pr
inci
ples
88
Income Inflation
EUR, thousandsEffect of 2% inflation on purchasing power of €100.000
Years
€100.000
€44.5002019: €0
2008: €4.600
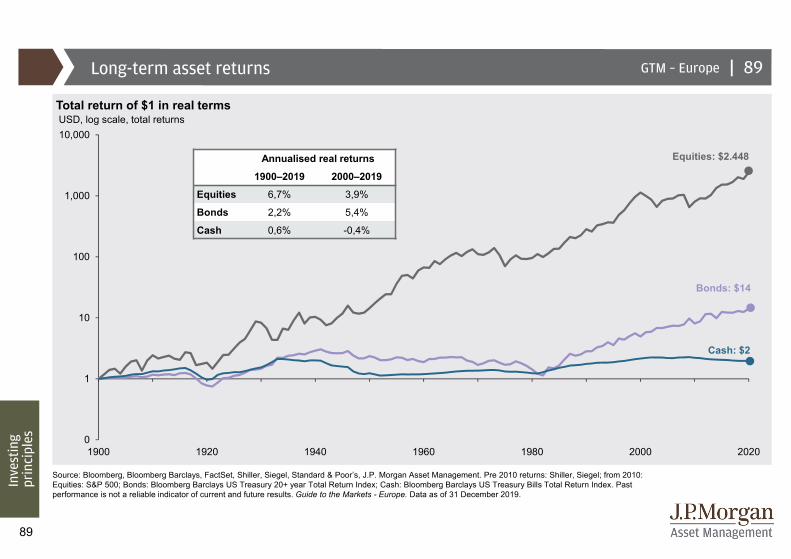
89
|GTM – Europe
0
1
10
100
1,000
10,000
1900 1920 1940 1960 1980 2000 2020
Long-term asset returns
Total return of $1 in real termsUSD, log scale, total returns
Source: Bloomberg, Bloomberg Barclays, FactSet, Shiller, Siegel, Standard & Poor’s, J.P. Morgan Asset Management. Pre 2010 returns: Shiller, Siegel; from 2010: Equities: S&P 500; Bonds: Bloomberg Barclays US Treasury 20+ year Total Return Index; Cash: Bloomberg Barclays US Treasury Bills Total Return Index. Past performance is not a reliable indicator of current and future results. Guide to the Markets - Europe. Data as of 31 December 2019.
Inve
stin
g pr
inci
ples
89
Equities: $2.448
Bonds: $14
Cash: $2
Annualised real returns
1900–2019 2000–2019
Equities 6,7% 3,9%
Bonds 2,2% 5,4%
Cash 0,6% -0,4%
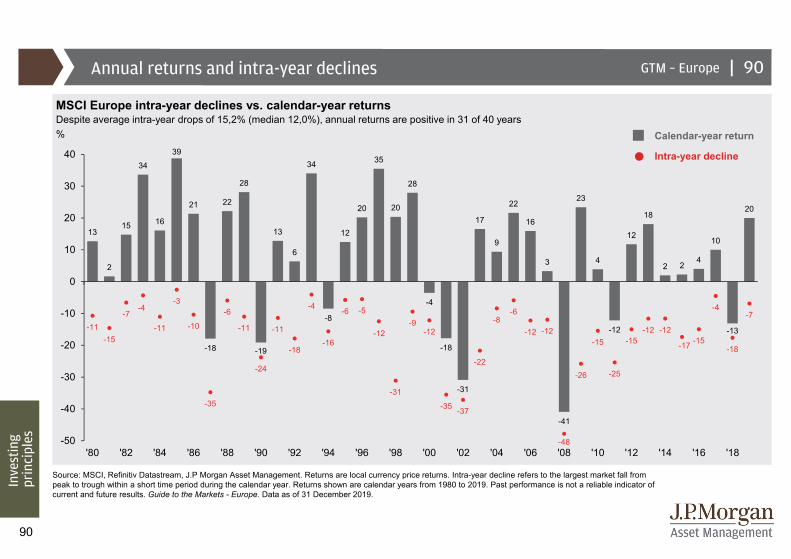
90
|GTM – EuropeAnnual returns and intra-year declines
MSCI Europe intra-year declines vs. calendar-year returnsDespite average intra-year drops of 15,2% (median 12,0%), annual returns are positive in 31 of 40 years%
Source: MSCI, Refinitiv Datastream, J.P Morgan Asset Management. Returns are local currency price returns. Intra-year decline refers to the largest market fall from peak to trough within a short time period during the calendar year. Returns shown are calendar years from 1980 to 2019. Past performance is not a reliable indicator of current and future results. Guide to the Markets - Europe. Data as of 31 December 2019.
Intra-year decline
Calendar-year return
Inve
stin
g pr
inci
ples
90
13
2
15
34
16
39
21
-18
22
28
-19
13
6
34
-8
12
20
35
20
28
-4
-18
-31
17
9
22
16
3
-41
23
4
-12
12
18
2 24
10
-13
20
-11-15
-7-4
-11
-3
-10
-35
-6
-11
-24
-11
-18
-4
-16
-6 -5
-12
-31
-9-12
-35 -37
-22
-8-6
-12 -12
-48
-26
-15
-25
-15-12 -12
-17 -15
-4
-18
-7
-50
-40
-30
-20
-10
0
10
20
30
40
'80 '82 '84 '86 '88 '90 '92 '94 '96 '98 '00 '02 '04 '06 '08 '10 '12 '14 '16 '18
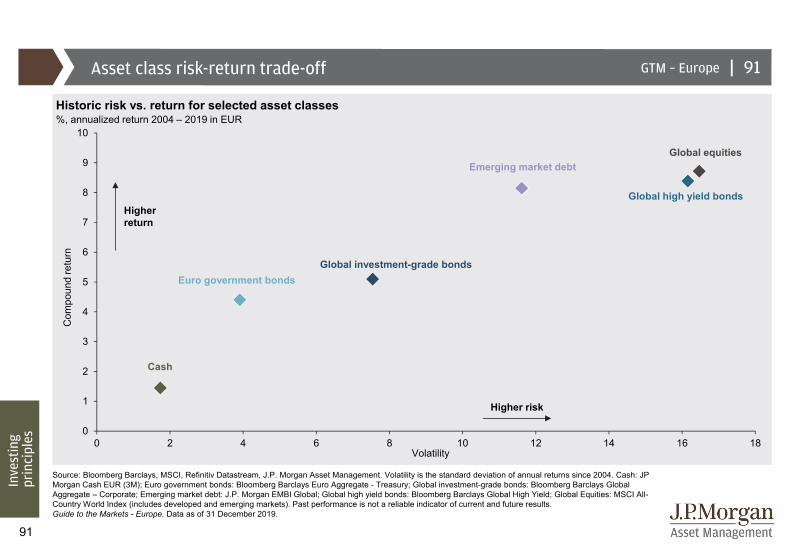
91
|GTM – Europe
0
1
2
3
4
5
6
7
8
9
10
0 2 4 6 8 10 12 14 16 18
Asset class risk-return trade-off
Historic risk vs. return for selected asset classes%, annualized return 2004 – 2019 in EUR
Source: Bloomberg Barclays, MSCI, Refinitiv Datastream, J.P. Morgan Asset Management. Volatility is the standard deviation of annual returns since 2004. Cash: JP Morgan Cash EUR (3M); Euro government bonds: Bloomberg Barclays Euro Aggregate - Treasury; Global investment-grade bonds: Bloomberg Barclays Global Aggregate – Corporate; Emerging market debt: J.P. Morgan EMBI Global; Global high yield bonds: Bloomberg Barclays Global High Yield; Global Equities: MSCI All-Country World Index (includes developed and emerging markets). Past performance is not a reliable indicator of current and future results. Guide to the Markets - Europe. Data as of 31 December 2019.
Inve
stin
g pr
inci
ples
Volatility
Com
poun
d re
turn
91
Higher return
Higher risk
Cash
Euro government bondsGlobal investment-grade bonds
Emerging market debtGlobal equities
Global high yield bonds
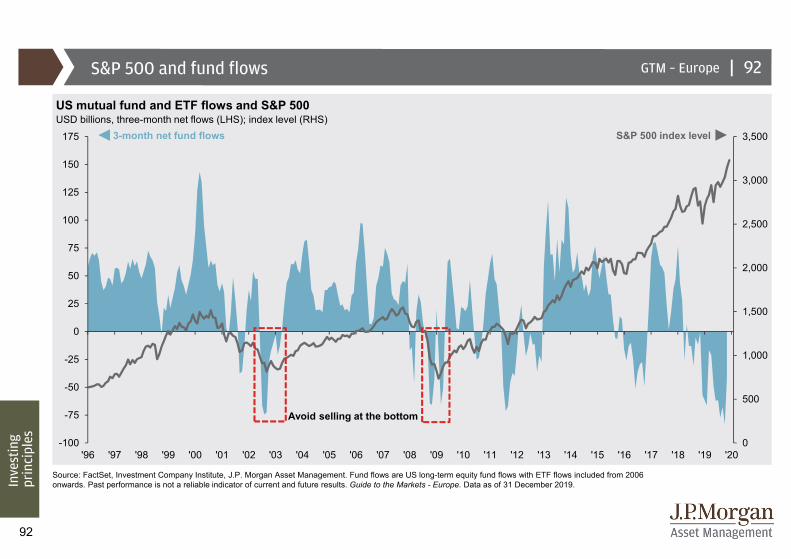
92
|GTM – Europe
0
500
1,000
1,500
2,000
2,500
3,000
3,500
-100
-75
-50
-25
0
25
50
75
100
125
150
175
'96 '97 '98 '99 '00 '01 '02 '03 '04 '05 '06 '07 '08 '09 '10 '11 '12 '13 '14 '15 '16 '17 '18 '19 '20
S&P 500 and fund flows
US mutual fund and ETF flows and S&P 500USD billions, three-month net flows (LHS); index level (RHS)
Source: FactSet, Investment Company Institute, J.P. Morgan Asset Management. Fund flows are US long-term equity fund flows with ETF flows included from 2006 onwards. Past performance is not a reliable indicator of current and future results. Guide to the Markets - Europe. Data as of 31 December 2019.In
vest
ing
prin
cipl
es
92
Avoid selling at the bottom
3-month net fund flows S&P 500 index level
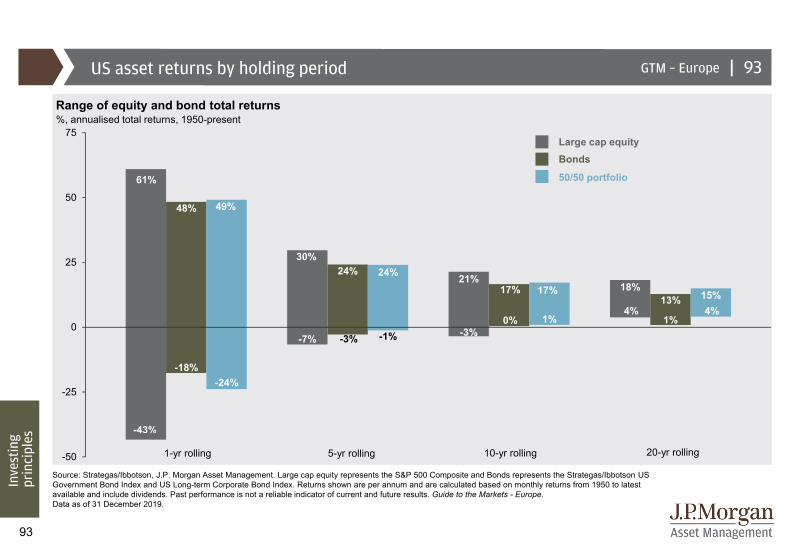
93
|GTM – Europe
48% 49%
30%24% 24% 21%
17% 17% 18%13% 15%
-18%-24%
-7% -3% -1% -3%0% 1%
4%1%
4%
-50
-25
0
25
50
75
61%
-43%
US asset returns by holding period
Range of equity and bond total returns%, annualised total returns, 1950-present
Source: Strategas/Ibbotson, J.P. Morgan Asset Management. Large cap equity represents the S&P 500 Composite and Bonds represents the Strategas/Ibbotson US Government Bond Index and US Long-term Corporate Bond Index. Returns shown are per annum and are calculated based on monthly returns from 1950 to latest available and include dividends. Past performance is not a reliable indicator of current and future results. Guide to the Markets - Europe. Data as of 31 December 2019.
Inve
stin
g pr
inci
ples
Large cap equityBonds
50/50 portfolio
93
1-yr rolling 5-yr rolling 10-yr rolling 20-yr rolling
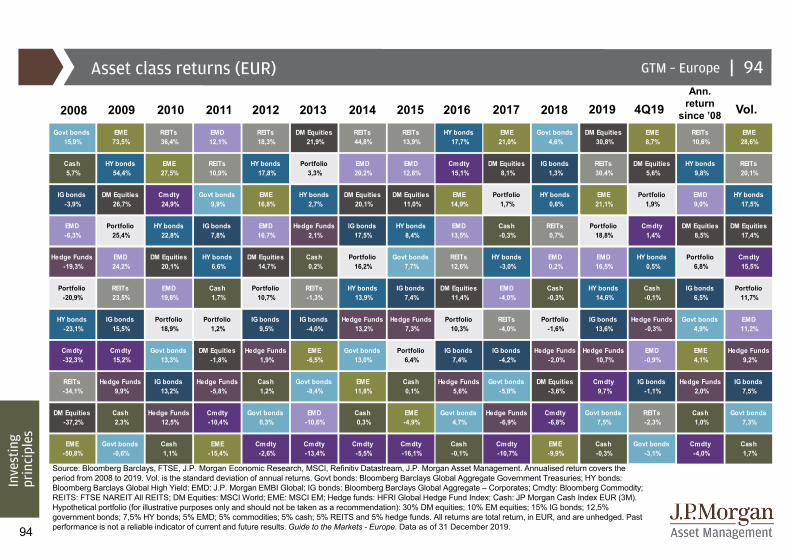
94
Asset class returns (EUR)
Source: Bloomberg Barclays, FTSE, J.P. Morgan Economic Research, MSCI, Refinitiv Datastream, J.P. Morgan Asset Management. Annualised return covers the period from 2008 to 2019. Vol. is the standard deviation of annual returns. Govt bonds: Bloomberg Barclays Global Aggregate Government Treasuries; HY bonds: Bloomberg Barclays Global High Yield; EMD: J.P. Morgan EMBI Global; IG bonds: Bloomberg Barclays Global Aggregate – Corporates; Cmdty: Bloomberg Commodity; REITS: FTSE NAREIT All REITS; DM Equities: MSCI World; EME: MSCI EM; Hedge funds: HFRI Global Hedge Fund Index; Cash: JP Morgan Cash Index EUR (3M). Hypothetical portfolio (for illustrative purposes only and should not be taken as a recommendation): 30% DM equities; 10% EM equities; 15% IG bonds; 12,5% government bonds; 7,5% HY bonds; 5% EMD; 5% commodities; 5% cash; 5% REITS and 5% hedge funds. All returns are total return, in EUR, and are unhedged. Past performance is not a reliable indicator of current and future results. Guide to the Markets - Europe. Data as of 31 December 2019.
GTM – Europe |
Inve
stin
g pr
inci
ples
94
2010 20122011 20162009 2013 2014 2015 Vol.20182017 20192008 4Q19Ann.
return since ’08
Govt bonds 15,9%
EME 73,5%
REITs 36,4%
EMD 12,1%
REITs 18,3%
DM Equities 21,9%
REITs 44,8%
REITs 13,9%
HY bonds 17,7%
EME 21,0%
Govt bonds 4,6%
DM Equities 30,8%
EME 8,7%
REITs 10,6%
EME 28,6%
Cash 5,7%
HY bonds 54,4%
EME 27,5%
REITs 10,9%
HY bonds 17,8%
Portfolio 3,3%
EMD 20,2%
EMD 12,8%
Cmdty 15,1%
DM Equities 8,1%
IG bonds 1,3%
REITs 30,4%
DM Equities 5,6%
HY bonds 9,8%
REITs 20,1%
IG bonds -3,9%
DM Equities 26,7%
Cmdty 24,9%
Govt bonds 9,9%
EME 16,8%
HY bonds 2,7%
DM Equities 20,1%
DM Equities 11,0%
EME 14,9%
Portfolio 1,7%
HY bonds 0,8%
EME 21,1%
Portfolio 1,9%
EMD 9,0%
HY bonds 17,5%
EMD -6,3%
Portfolio 25,4%
HY bonds 22,8%
IG bonds 7,8%
EMD 16,7%
Hedge Funds 2,1%
IG bonds 17,5%
HY bonds 8,4%
EMD 13,5%
Cash -0,3%
REITs 0,7%
Portfolio 18,8%
Cmdty 1,4%
DM Equities 8,5%
DM Equities 17,4%
Hedge Funds -19,3%
EMD 24,2%
DM Equities 20,1%
HY bonds 6,6%
DM Equities 14,7%
Cash 0,2%
Portfolio 16,2%
Govt bonds 7,7%
REITs 12,6%
HY bonds -3,0%
EMD 0,2%
EMD 16,5%
HY bonds 0,5%
Portfolio 6,8%
Cmdty 15,5%
Portfolio -20,9%
REITs 23,5%
EMD 19,8%
Cash 1,7%
Portfolio 10,7%
REITs -1,3%
HY bonds 13,9%
IG bonds 7,4%
DM Equities 11,4%
EMD -4,0%
Cash -0,3%
HY bonds 14,6%
Cash -0,1%
IG bonds 6,5%
Portfolio 11,7%
HY bonds -23,1%
IG bonds 15,5%
Portfolio 18,9%
Portfolio 1,2%
IG bonds 9,5%
IG bonds -4,0%
Hedge Funds 13,2%
Hedge Funds 7,3%
Portfolio 10,3%
REITs -4,0%
Portfolio -1,6%
IG bonds 13,6%
Hedge Funds -0,3%
Govt bonds 4,9%
EMD 11,2%
Cmdty -32,3%
Cmdty 15,2%
Govt bonds 13,3%
DM Equities -1,8%
Hedge Funds 1,9%
EME -6,5%
Govt bonds 13,0%
Portfolio 6,4%
IG bonds 7,4%
IG bonds -4,2%
Hedge Funds -2,0%
Hedge Funds 10,7%
EMD -0,9%
EME 4,1%
Hedge Funds 9,2%
REITs -34,1%
Hedge Funds 9,9%
IG bonds 13,2%
Hedge Funds -5,8%
Cash 1,2%
Govt bonds -8,4%
EME 11,8%
Cash 0,1%
Hedge Funds 5,6%
Govt bonds -5,8%
DM Equities -3,6%
Cmdty 9,7%
IG bonds -1,1%
Hedge Funds 2,0%
IG bonds 7,5%
DM Equities -37,2%
Cash 2,3%
Hedge Funds 12,5%
Cmdty -10,4%
Govt bonds 0,3%
EMD -10,6%
Cash 0,3%
EME -4,9%
Govt bonds 4,7%
Hedge Funds -6,9%
Cmdty -6,8%
Govt bonds 7,5%
REITs -2,3%
Cash 1,0%
Govt bonds 7,3%
EME -50,8%
Govt bonds -0,6%
Cash 1,1%
EME -15,4%
Cmdty -2,6%
Cmdty -13,4%
Cmdty -5,5%
Cmdty -16,1%
Cash -0,1%
Cmdty -10,7%
EME -9,9%
Cash -0,3%
Govt bonds -3,1%
Cmdty -4,0%
Cash 1,7%
J.P. Morgan Asset Management: Index definitionsAll indexes are unmanaged and an individual cannot invest directly in an index. Index returns do not include fees or expenses. The S&P 500 Index is widely regarded as the best single gauge of the U.S. equities market. This world-renowned index includes a representative sample of 500 leading companies in leading industries of the U.S. economy. Although the S&P 500 Index focuses on the large-cap segment of the market, with approximately 75% coverage of U.S. equities, it is also an ideal proxy for the total market. An investor cannot invest directly in an index. The Russell 1000 Index ® measures the performance of the 1,000 largest companies in the Russell 3000. The Russell 1000 Growth Index ® measures the performance of those Russell 1000 companies with higher price-to-book ratios and higher forecasted growth values. The Russell 1000 Value Index ® measures the performance of those Russell 1000 companies with lower price-to-book ratios and lower forecasted growth values. The MSCI Emerging Markets IndexSM is a free float-adjusted market capitalization index that is designed to measure equity market performance in the global emerging markets. As of June 2007, the MSCI Emerging Markets Index consisted of the following 25 emerging market country indices: Argentina, Brazil, Chile, China, Colombia, Czech Republic, Egypt, Hungary, India, Indonesia, Israel, Jordan, Korea, Malaysia, Mexico, Morocco, Pakistan, Peru, Philippines, Poland, Russia, South Africa, Taiwan, Thailand, and Turkey.The MSCI ACWI (All Country World Index) Index is a free float-adjusted market capitalization weighted index that is designed to measure the equity market performance of developed and emerging markets. As of June 2009 the MSCI ACWIconsisted of 45 country indices comprising 23 developed and 22 emerging market country indices. The Tokyo Price Index (TOPIX) is a capitalization-weighted index lists all firms that are considered to be under the 'first section' on the TSE, which groups all of the large firms on the exchange into one pool. The second section groups all of the remaining smaller firms.The FTSE 100 Index is an index of the 100 largest companies (by market capitalization) in the United Kingdom.The FTSE All Share Index is an index of the 630 largest companies (by market capitalization) in the United Kingdom.The MSCI Value and Growth IndicesSM cover the full range of developed, emerging and All Country MSCI Equity indexes. As of the close of May 30, 2003, MSCI implemented an enhanced methodology for the MSCI Global Value and Growth Indices, adopting a two dimensional framework for style segmentation in which value and growth securities are categorized using different attributes - three for value and five for growth including forward-looking variables. The objective of the indexdesign is to divide constituents of an underlying MSCI Standard Country Index into a value index and a growth index, each targeting 50% of the free float adjusted market capitalization of the underlying country index. Country Value/Growth indices are then aggregated into regional Value/Growth indices. Prior to May 30, 2003, the indices used Price/Book Value (P/BV) ratios to divide the standard MSCI country indices into value and growth indices. All securities were classified as either "value" securities (low P/BV securities) or "growth" securities (high P/BV securities), relative to each MSCI country index.The following MSCI Total Return IndicesSM are calculated with gross dividends:This series approximates the maximum possible dividend reinvestment. The amount reinvested is the dividend distributed to individuals resident in the country of the company, but does not include tax credits.The MSCI Europe IndexSM is a free float-adjusted market capitalization index that is designed to measure developed market equity performance in Europe. As of June 2007, the MSCI Europe Index consisted of the following 16 developed market country indices: Austria, Belgium, Denmark, Finland, France, Germany, Greece, Ireland, Italy, the Netherlands, Norway, Portugal, Spain, Sweden, Switzerland and the United Kingdom. West Texas Intermediate (WTI) is underlying commodity in the New York Mercantile Exchange's oil futures contracts. The Bloomberg Barclays U.S. Aggregate Index represents securities that are SEC-registered, taxable, and dollar denominated. The index covers the U.S. investment grade fixed rate bond market, with index components for government and corporate securities, mortgage pass-through securities, and asset-backed securities. This U.S. Treasury Index is a component of the U.S. Government index. The Bloomberg Barclays High Yield Index covers the universe of fixed rate, non-investment grade debt. Pay-in-kind (PIK) bonds, Eurobonds, and debt issues from countries designated as emerging markets (e.g., Argentina, Brazil, Venezuela, etc.) are excluded, but Canadian and global bonds (SEC registered) of issuers in non-EMG countries are included. The Bloomberg Barclays Euro-Aggregate Index consists of bond issued in the euro or the legacy currencies of the sovereign countries participating the European Monetary Union (EMU).The Global Bond Index Emerging Market Broad Diversified Index (GBI-EM) is a comprehensive global local emerging markets index, and consists of liquid, fixed-rate, domestic currency government bonds.
The Bloomberg Barclays Global Aggregate Corporate Index consists of corporate issues in Europe, the US and Asia-pacific regions. The J.P. Morgan EMBI Global Index includes U.S. dollar denominated Brady bonds, Eurobonds, traded loans and local market debt instruments issued by sovereign and quasi-sovereign entities.The JPMorgan Corporate Emerging Markets Bond Index (CEMBI): The CEMBI tracks total returns of US dollar-denominated debt instruments issued by corporate entities in Emerging Markets countries, and consists of an investable universe of corporate bonds. Both indices are also available in Diversified version. The MSCI World High Dividend Yield Index is composed of those securities that have higher-than-average dividend yield within its parent index, a track record of consistent dividend payments and the capacity to sustain future dividend payments.

J.P. Morgan Asset Management: Risks and disclosures
The Market Insights program provides comprehensive data and commentary on global markets without reference to products. Designed as a tool to help clients understand the markets and support investment decision-making, the program explores the implications of current economic data and changing market conditions. For the purposes of MiFID II, the JPM Market Insights and Portfolio Insights programs are marketing communications and are not in scope for any MiFID II / MiFIR requirements specifically related to investment research. Furthermore, the J.P. Morgan Asset Management Market Insights and Portfolio Insights programs, as non-independent research, have not been prepared in accordance with legal requirements designed to promote the independence of investment research, nor are they subject to any prohibition on dealing ahead of the dissemination of investment research.
This document is a general communication being provided for informational purposes only. It is educational in nature and not designed to be taken as advice or a recommendation for any specific investment product, strategy, plan feature or other purpose in any jurisdiction, nor is it a commitment from J.P. Morgan Asset Management or any of its subsidiaries to participate in any of the transactions mentioned herein. Any examples used are generic, hypothetical and for illustration purposes only. This material does not contain sufficient information to support an investment decision and it should not be relied upon by you in evaluating the merits of investing in any securities or products. In addition, users should make an independent assessment of the legal, regulatory, tax, credit, and accounting implications and determine, together with their own professional advisers, if any investment mentioned herein is believed to be suitable to their personal goals. Investors should ensure that they obtain all available relevant information before making any investment. Any forecasts, figures, opinions or investment techniques and strategies set out are for information purposes only, based on certain assumptions and current market conditions and are subject to change without prior notice. All information presented herein is considered to be accurate at the time of production, but no warranty of accuracy is given and no liability in respect of any error or omission is accepted. It should be noted that investment involves risks, the value of investments and the income from them may fluctuate in accordance with market conditions and taxation agreements and investors may not get back the full amount invested. Both past performance and yields are not a reliable indicator of current and future results. J.P. Morgan Asset Management is the brand for the asset management business of JPMorgan Chase & Co. and its affiliates worldwide. To the extent permitted by applicable law, we may record telephone calls and monitor electronic communications to comply with our legal and regulatory obligations and internal policies. Personal data will be collected, stored and processed by J.P. Morgan Asset Management in accordance with our Company’s Privacy Policy (www.jpmorgan.com/global/privacy). For further information regarding our local privacy policies, please follow the respective links: Australia (www.jpmorganam.com.au/wps/portal/auec/PrivacyPolicy), EMEA (www.jpmorgan.com/emea-privacy-policy), Japan (www.jpmorganasset.co.jp/wps/portal/Policy/Privacy), Hong Kong (https://am.jpmorgan.com/hk/en/asset-management/per/privacy-statement/), Singapore (www.jpmorganam.com.sg/privacy) and Taiwan (www.jpmorgan.com/country/GB/en/privacy/taiwan).
This communication is issued by the following entities: in the United Kingdom by JPMorgan Asset Management (UK) Limited, which is authorized and regulated by the Financial Conduct Authority; in other European jurisdictions by JPMorgan Asset Management (Europe) S.à r.l.; in Hong Kong by JPMorgan Asset Management (Asia Pacific) Limited, or JPMorgan Funds (Asia) Limited, or JPMorgan Asset Management Real Assets (Asia) Limited; in Singapore by JPMorgan Asset Management (Singapore) Limited (Co. Reg. No. 197601586K), or JPMorgan Asset Management Real Assets (Singapore) Pte Ltd (Co. Reg. No. 201120355E), this advertisement or publication has not been reviewed by the Monetary Authority of Singapore; in Taiwan by JPMorgan Asset Management (Taiwan) Limited; in Japan by JPMorgan Asset Management (Japan) Limited which is a member of the Investment Trusts Association, Japan, the Japan Investment Advisers Association, Type II Financial Instruments Firms Association and the Japan Securities Dealers Association and is regulated by the Financial Services Agency (registration number “Kanto Local Finance Bureau (Financial Instruments Firm) No. 330”); in Australia to wholesale clients only as defined in section 761A and 761G of the Corporations Act 2001 (Cth) by JPMorgan Asset Management (Australia) Limited (ABN 55143832080) (AFSL 376919); in Brazil by Banco J.P. Morgan S.A.; in Canada for institutional clients’ use only by JPMorgan Asset Management (Canada) Inc., and in the United States by J.P. Morgan Institutional Investments, Inc., member of FINRA; J.P. Morgan Investment Management Inc. or J.P. Morgan Alternative Asset Management, Inc.
In APAC, distribution is for Hong Kong, Taiwan, Japan and Singapore. For all other countries in APAC, to intended recipients only.
Copyright 2020 JPMorgan Chase & Co. All rights reserved.
Prepared by: Karen Ward, Tilmann Galler, Vincent Juvyns, Maria Paola Toschi, Michael Bell, Hugh Gimber, Jai Malhi and Ambrose Crofton.
Unless otherwise stated, all data as of 31 December 2019 or most recently available.
Guide to the Markets - Europe
JP-LITTLEBOOK
0903c02a8279d3db