Embed Size (px)
Citation preview
DEPARTMENT OF ENERGY RENEWABLE ENERGY MANAGEMENT BUREAU
GUIDELINE
for
Application
of
Photovoltaic Power Generation System
June 2009
PV – 3
This guideline was developed by the Department of Energy (DOE) through the technical assistance under the Project on “Sustainability Improvement of Renewable Energy Development for Village Electrification in the Philippines” which was provided by the Japan International Cooperation Agency (JICA).
i
TABLE OF CONTENTS
1 GENERAL ............................................................................................. 1
1.1 Fundamental Performance of PV system...........................................................1
1.2 Features of the PV System .................................................................................1
1.3 Type of PV Systems............................................................................................1
1.4 Favorable Conditions for a Photovoltaic Power Generation System .................4
2 SYSTEM DESIGN PROCEDURE........................................................ 5
2.1 General ................................................................................................................5
2.2 Design Procedure................................................................................................5
3 COLLECTION OF RELATED DATA .................................................... 6
3.1 Demand ...............................................................................................................6
3.2 Meteorological Data ............................................................................................7
4 SYSTEM DESIGN................................................................................. 8
4.1 Decision of the System Type ..............................................................................9
4.2 Estimation of the Power Demand .......................................................................9
4.3 Analysis of Meteorological Data..........................................................................9
4.4 Estimation of the Power Generation by PV System.........................................10
4.5 Selection of Components ..................................................................................14
5 INSTALLATION...................................................................................16
5.1 Preparation of Procurement Specifications ......................................................17
5.2 Selection of Contractor......................................................................................18
5.3 Coordination Prior to Installation .......................................................................19
5.4 Execution of the installation work......................................................................19
6 6 OPERATION AND MAINTENANCE ...............................................21
6.1 Inspection Method .............................................................................................22
6.2 Manual ...............................................................................................................24
6.3 Operation and Maintenance Records ...............................................................25
6.4 Replacement of Equipment and Materials........................................................25
6.5 User Training .....................................................................................................26
7 AMMENDMENT OF THE MANUAL...................................................27

ii
LIST OF ANNEXES
ANNEX 1 : Solar Radiation
1
1 GENERAL
In this guideline, the practical design, installation, inspection, and the management methods of photovoltaic power generation systems, “hereafter call PV system”, will be introduced.
1.1 Fundamental Performance of PV system
- No energy supply (fuel) is required after system installation. - The user can design the required size of the PV system.
(Suitable system size should be discussed from various points of view.) - PV system can be installed any place that receives a suitable amount of
sunlight. - The installed PV system cannot control the energy supply. The energy source
of the system depends on the weather. 1.2 Features of the PV System
Merit Demerit (Weak point)
- Free energy source
- Short work period
- Any size of system is applicable and can
be set-up anyplace where there is ample
sunlight.
- Use of conventional electric appliances.
- Easy maintenance
- Power supply depends on the weather
- High initial cost (at present)
- Limitation of supply power
- Limitation of useable electric appliances
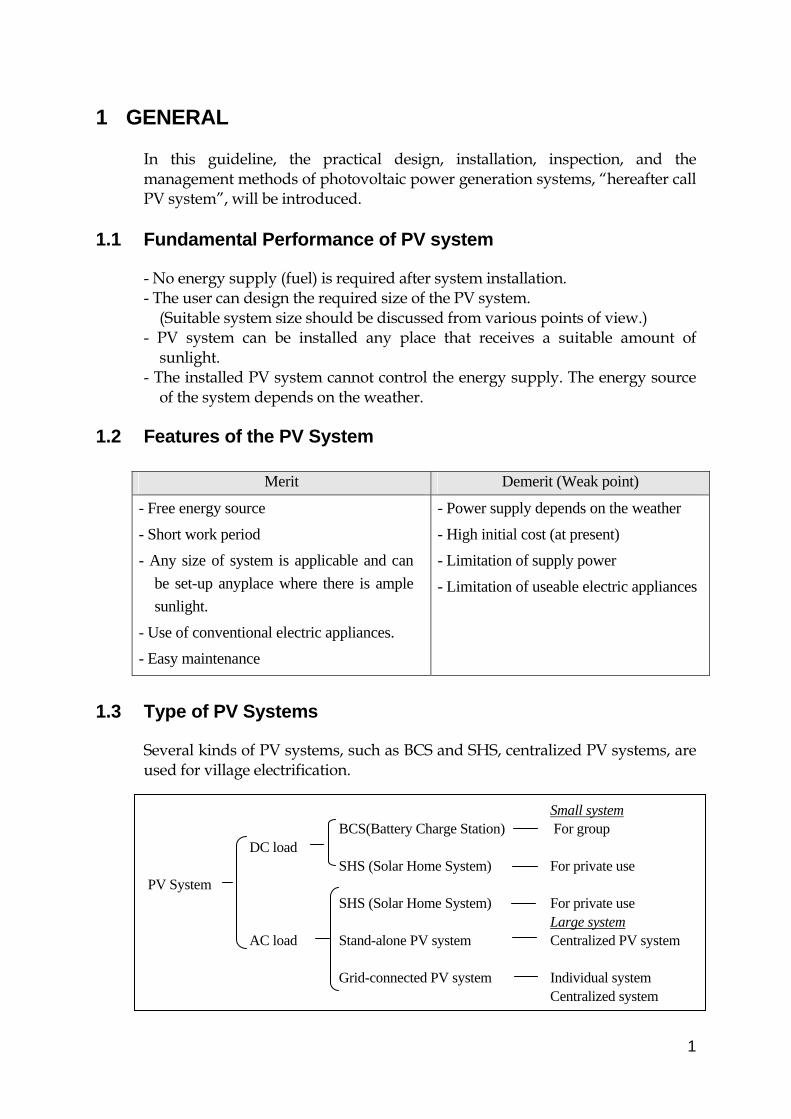
1.3 Type of PV Systems
Several kinds of PV systems, such as BCS and SHS, centralized PV systems, are used for village electrification.
PV System
DC load
BCS(Battery Charge Station) SHS (Solar Home System)
Small system For group For private use
SHS (Solar Home System) For private use
Stand-alone PV system Large system Centralized PV system
AC load
Grid-connected PV system
Individual system Centralized system
2
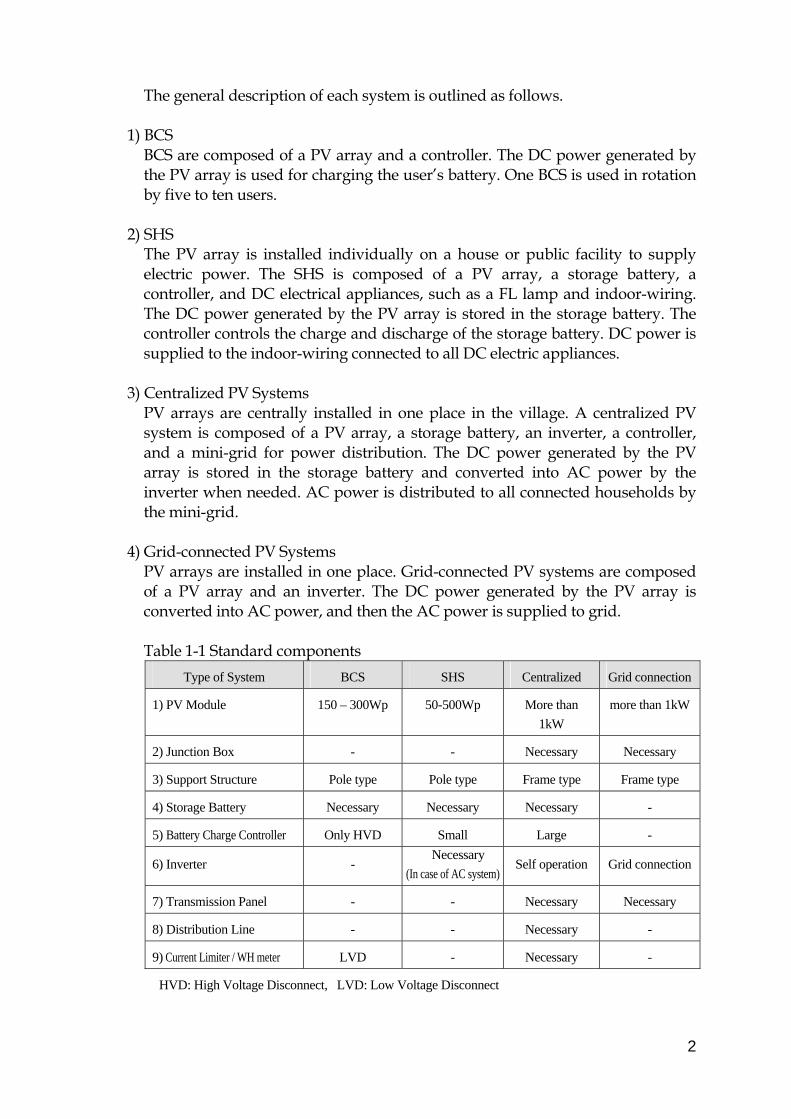
The general description of each system is outlined as follows.
1) BCS BCS are composed of a PV array and a controller. The DC power generated by the PV array is used for charging the user’s battery. One BCS is used in rotation by five to ten users.
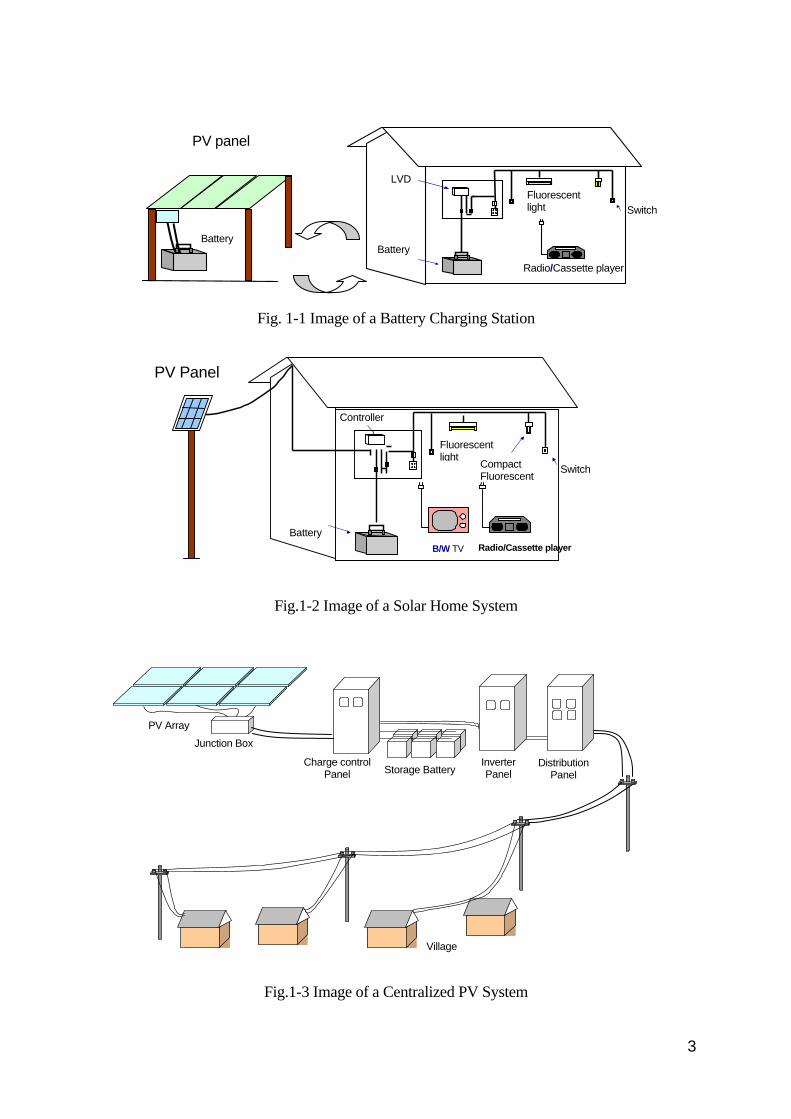
2) SHS The PV array is installed individually on a house or public facility to supply electric power. The SHS is composed of a PV array, a storage battery, a controller, and DC electrical appliances, such as a FL lamp and indoor-wiring. The DC power generated by the PV array is stored in the storage battery. The controller controls the charge and discharge of the storage battery. DC power is supplied to the indoor-wiring connected to all DC electric appliances.
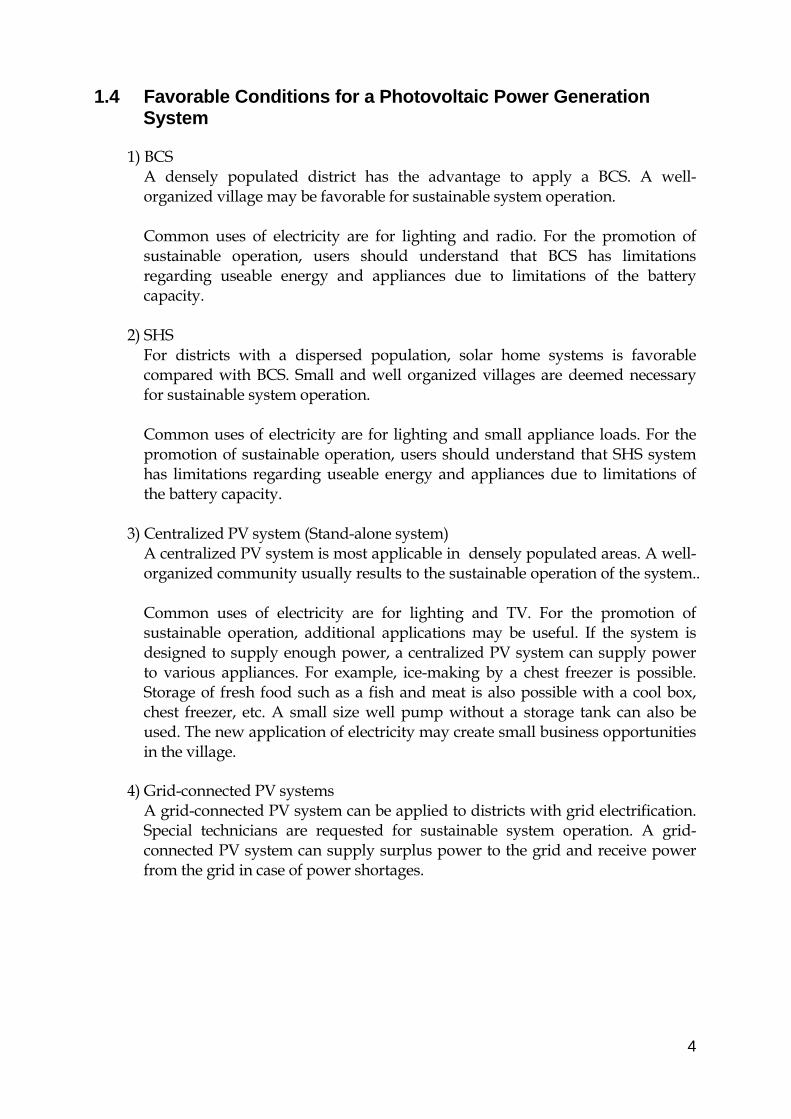
3) Centralized PV Systems PV arrays are centrally installed in one place in the village. A centralized PV system is composed of a PV array, a storage battery, an inverter, a controller, and a mini-grid for power distribution. The DC power generated by the PV array is stored in the storage battery and converted into AC power by the inverter when needed. AC power is distributed to all connected households by the mini-grid.
4) Grid-connected PV Systems PV arrays are installed in one place. Grid-connected PV systems are composed of a PV array and an inverter. The DC power generated by the PV array is converted into AC power, and then the AC power is supplied to grid. Table 1-1 Standard components
Type of System BCS SHS Centralized Grid connection
1) PV Module 150 – 300Wp 50-500Wp More than
1kW
more than 1kW
2) Junction Box - - Necessary Necessary
3) Support Structure Pole type Pole type Frame type Frame type
4) Storage Battery Necessary Necessary Necessary -
5) Battery Charge Controller Only HVD Small Large -
6) Inverter - Necessary
(In case of AC system)Self operation Grid connection
7) Transmission Panel - - Necessary Necessary
8) Distribution Line - - Necessary -
9) Current Limiter / WH meter LVD - Necessary -
HVD: High Voltage Disconnect, LVD: Low Voltage Disconnect
3
Fig. 1-1 Image of a Battery Charging Station
Fig.1-2 Image of a Solar Home System
Fig.1-3 Image of a Centralized PV System
PV Panel
B/W TV Radio/Cassette player Battery
Switch
Fluorescent light
Compact Fluorescent
Controller
PV Array Junction Box
Charge controlPanel
Storage BatteryInverterPanel
Distribution Panel
Village
Radio/Cassette player Battery
Switch
Fluorescent light
LVD
PV panel
Battery
4
1.4 Favorable Conditions for a Photovoltaic Power Generation System
1) BCS
A densely populated district has the advantage to apply a BCS. A well-organized village may be favorable for sustainable system operation. Common uses of electricity are for lighting and radio. For the promotion of sustainable operation, users should understand that BCS has limitations regarding useable energy and appliances due to limitations of the battery capacity.
2) SHS For districts with a dispersed population, solar home systems is favorable compared with BCS. Small and well organized villages are deemed necessary for sustainable system operation. Common uses of electricity are for lighting and small appliance loads. For the promotion of sustainable operation, users should understand that SHS system has limitations regarding useable energy and appliances due to limitations of the battery capacity.
3) Centralized PV system (Stand-alone system) A centralized PV system is most applicable in densely populated areas. A well-organized community usually results to the sustainable operation of the system.. Common uses of electricity are for lighting and TV. For the promotion of sustainable operation, additional applications may be useful. If the system is designed to supply enough power, a centralized PV system can supply power to various appliances. For example, ice-making by a chest freezer is possible. Storage of fresh food such as a fish and meat is also possible with a cool box, chest freezer, etc. A small size well pump without a storage tank can also be used. The new application of electricity may create small business opportunities in the village.
4) Grid-connected PV systems A grid-connected PV system can be applied to districts with grid electrification. Special technicians are requested for sustainable system operation. A grid-connected PV system can supply surplus power to the grid and receive power from the grid in case of power shortages.
5
2 SYSTEM DESIGN PROCEDURE 2.1 General
Two methods are used to make village electrification plans. One is a demand-side method, the others is a supply-side method. Design of a power generation system is generally based on demand. Design of a PV system is similar. However, PV system design it is not always suitable. Supply-side design may be useful for the design of a small PV system such as BCS and SHS. The standardization of small PV systems is possible in this way. Otherwise, demand-side design is proper for the design of a large PV system.
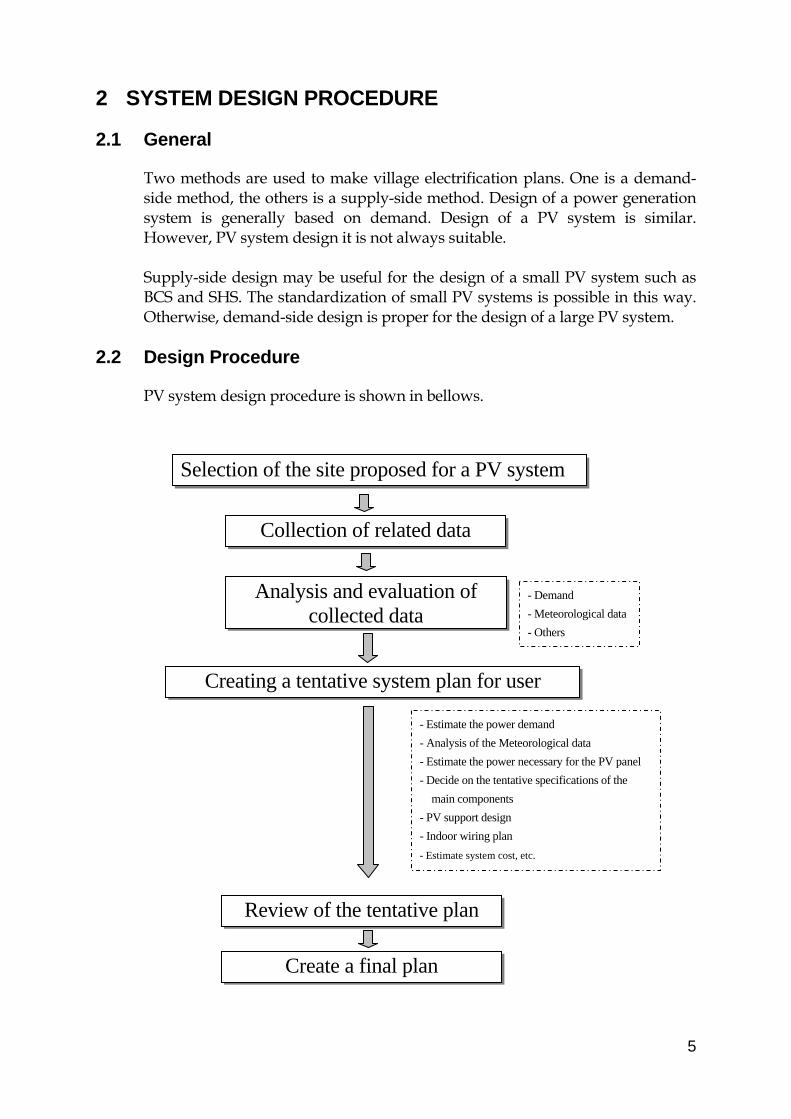
2.2 Design Procedure
PV system design procedure is shown in bellows.
Selection of the site proposed for a PV system
Collection of related data
Analysis and evaluation of collected data
Creating a tentative system plan for user
Review of the tentative plan
Create a final plan
- Estimate the power demand
- Analysis of the Meteorological data
- Estimate the power necessary for the PV panel
- Decide on the tentative specifications of the
main components
- PV support design
- Indoor wiring plan
- Estimate system cost, etc.
- Demand
- Meteorological data
- Others
6
3 COLLECTION OF RELATED DATA
Key Points for Collecting Data
1) Collection of appropriate data As the design of PV system is carried out based on the collected data, it is important that the appropriate and relevant data be sourced. This information and data can generally be collected from the relevant authorities and agencies within a country or region, however more site specific and demographic information may require surveys and potential consumer group interviews and questionnaire-style surveys.
2) Data Collection Period At least five (5) years of meteorological data is required for the design process.
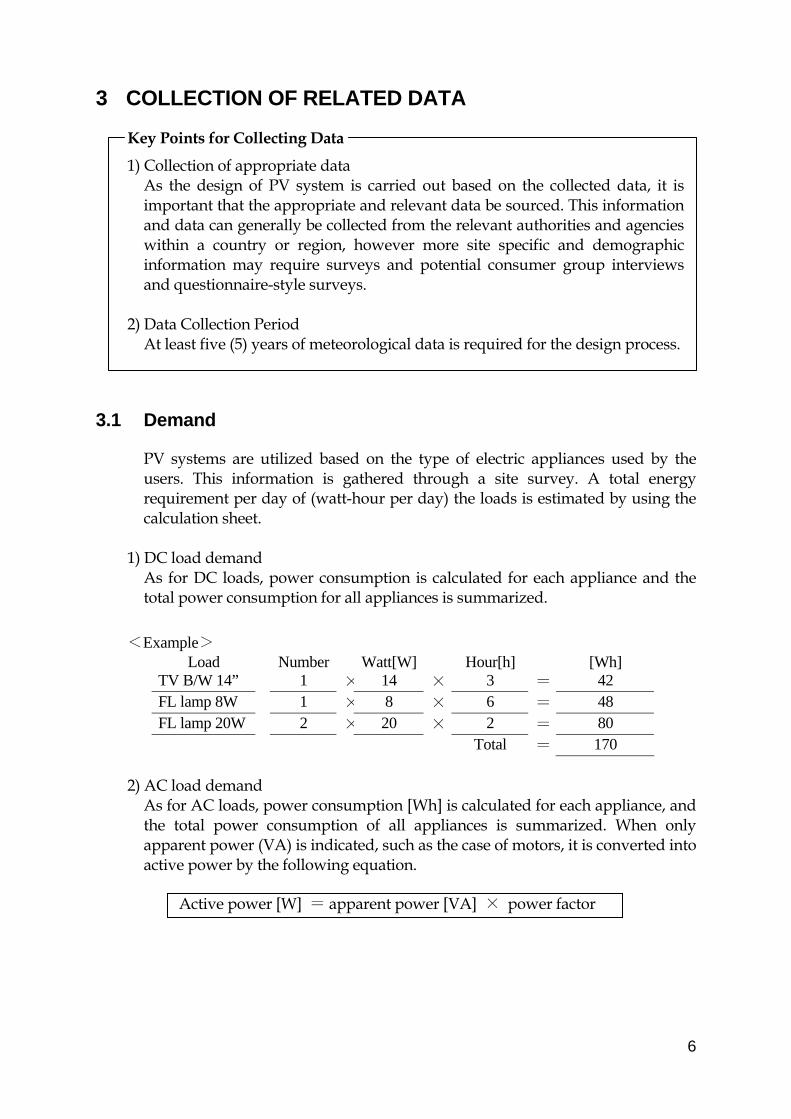
3.1 Demand
PV systems are utilized based on the type of electric appliances used by the users. This information is gathered through a site survey. A total energy requirement per day of (watt-hour per day) the loads is estimated by using the calculation sheet.
1) DC load demand As for DC loads, power consumption is calculated for each appliance and the total power consumption for all appliances is summarized.
<Example>
Load Number Watt[W] Hour[h] [Wh] TV B/W 14” 1 × 14 × 3 = 42 FL lamp 8W 1 × 8 × 6 = 48 FL lamp 20W 2 × 20 × 2 = 80 Total = 170
2) AC load demand
As for AC loads, power consumption [Wh] is calculated for each appliance, and the total power consumption of all appliances is summarized. When only apparent power (VA) is indicated, such as the case of motors, it is converted into active power by the following equation. Active power [W] = apparent power [VA] × power factor
7
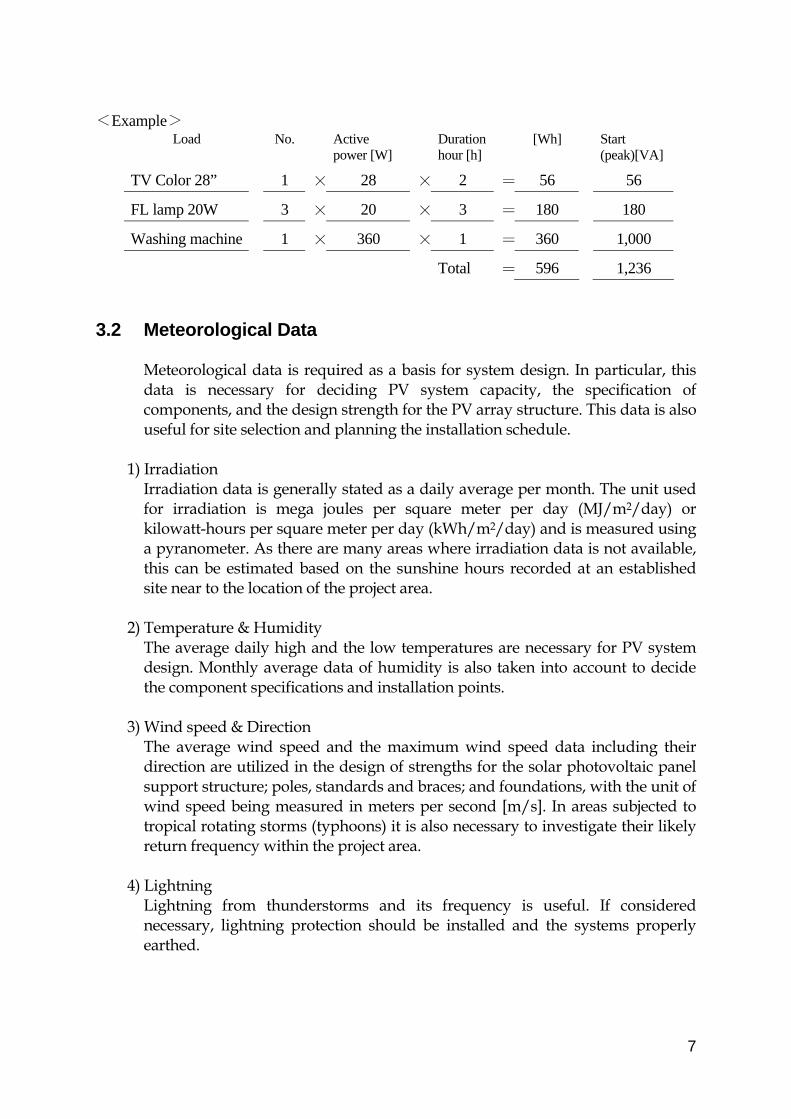
<Example>
Load No. Active power [W]
Duration hour [h]
[Wh] Start (peak)[VA]
TV Color 28” 1 × 28 × 2 = 56 56
FL lamp 20W 3 × 20 × 3 = 180 180
Washing machine 1 × 360 × 1 = 360 1,000
Total = 596 1,236
3.2 Meteorological Data Meteorological data is required as a basis for system design. In particular, this data is necessary for deciding PV system capacity, the specification of components, and the design strength for the PV array structure. This data is also useful for site selection and planning the installation schedule.
1) Irradiation Irradiation data is generally stated as a daily average per month. The unit used for irradiation is mega joules per square meter per day (MJ/m2/day) or kilowatt-hours per square meter per day (kWh/m2/day) and is measured using a pyranometer. As there are many areas where irradiation data is not available, this can be estimated based on the sunshine hours recorded at an established site near to the location of the project area.
2) Temperature & Humidity The average daily high and the low temperatures are necessary for PV system design. Monthly average data of humidity is also taken into account to decide the component specifications and installation points.
3) Wind speed & Direction The average wind speed and the maximum wind speed data including their direction are utilized in the design of strengths for the solar photovoltaic panel support structure; poles, standards and braces; and foundations, with the unit of wind speed being measured in meters per second [m/s]. In areas subjected to tropical rotating storms (typhoons) it is also necessary to investigate their likely return frequency within the project area.
4) Lightning Lightning from thunderstorms and its frequency is useful. If considered necessary, lightning protection should be installed and the systems properly earthed.

8
4 SYSTEM DESIGN
System design determines the appropriate PV system to introduce to the project being implemented based on the collected data.
Key Points for System Design
1) Standardization of the PV system Standardization of the PV system for the project is important. Standardization can reduce design costs and simplify procurement of system components, materials, and replacement parts. In addition, the method for maintenance management, the management system, and engineer training programs can be unified as well.
2) Simple system Configuration For PV system design, considerations such as user convenience and system protection tend to increase the number of components, such as protective devices and switches. However, increasing the number of connected components increases the number of potential problems due to the slackness in terminals and voltage drop. As a result, the number of inspection points increase along with the complexity and cost of the inspection and maintenance work.. Some controllers available in the market have necessary protective functions. It is important to adopt controllers that have necessary protective functions so as to reduce the number of components as much as possible and create a simple system.
3) Clarification of Design Conditions It is important to sort out and clarify all the design conditions used in system design, such as load estimation and irradiation data. These conditions will be used for the evaluation of operating conditions and for the review of the system design. Moreover, these conditions are important for explaining system characteristics to the users.
4) Selection of Appropriate Components and Materials Components and materials that are used for PV system should be reliable and economical. However, high reliability and economy has contrary characteristics practically. Therefore, the reliability aspect will be covered through software measures such as maintenance management and optimal points for both aspects will be found for material selection. If local meteorological conditions, transportation of components and materials, the installation site, etc. are restricted, it is necessary to pay attention to the workability, material specifications, and installation.
9
4.1 Decision of the System Type
As for system selection, the type of system can be roughly selected according to the load demand and affordable fees of the users. Choosing between a centralized type and an individual type can be decided by the location of houses and the choice of either an individual type or a BCS is made by considering factors such as the economy and the state of organizations in the village.
4.2 Estimation of the Power Demand
Demand assumption is to assume the type of loads to be used such as lights and electric appliances to be used, the duration of use, and the patterns of use. Based on this assumption, power consumption per day or peak load current is calculated. This data is basic for determining the system capacity and system operation.
1) Total Power Consumption (Ep) Estimation of the total power consumption is used as basic data to decide system capacity and system operation. The total power consumption [Wh] is calculated from the calculation sheet used in the site survey.
2) Peak load current (Ilp) Estimation of the peak load current is used as basic data to decide system capacity. A rush current that is several times as large as the rating will flow into a rotating machine, such as motor, at the start of operation. Therefore, assumption of the rush current for a rotating machine is necessary to consider the specification of the inverter, etc.
4.3 Analysis of Meteorological Data
Meteorological data is used to design PV systems and to consider the installation method.
1) Irradiation (HA) The unit of irradiation data used for PV system design should be converted to kWh/m2/day. Generally the minimum irradiation data is used to conservatively estimate the available energy from the sun. The minimum monthly mean irradiation is used to calculate the capacity of PV arrays and batteries to ensure a stable power supply throughout the year. However, in areas where the monthly mean irradiation varies substantially during a year, a PV system designed on the minimum irradiation data may not be economical in some cases. For such cases, it is necessary to select irradiation for design by considering characteristics of loads, the needs of users, and the economy. Generally, in areas of low latitude, the monthly mean insolation does not vary largely during the year. Therefore, if the global insolation is used to design a PV system, it does not result in large errors.
10
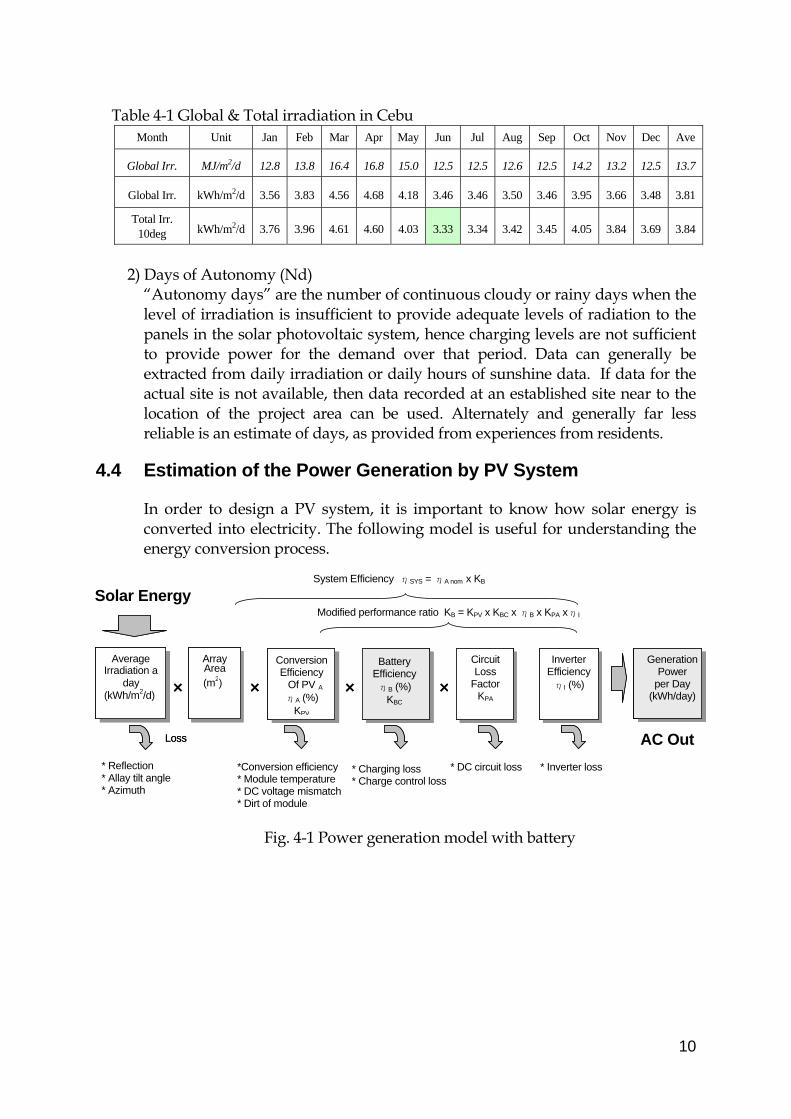
Table 4-1 Global & Total irradiation in Cebu
Month Unit Jan Feb Mar Apr May Jun Jul Aug Sep Oct Nov Dec Ave
Global Irr. MJ/m2/d 12.8 13.8 16.4 16.8 15.0 12.5 12.5 12.6 12.5 14.2 13.2 12.5 13.7
Global Irr. kWh/m2/d 3.56 3.83 4.56 4.68 4.18 3.46 3.46 3.50 3.46 3.95 3.66 3.48 3.81
Total Irr. 10deg kWh/m2/d 3.76 3.96 4.61 4.60 4.03 3.33 3.34 3.42 3.45 4.05 3.84 3.69 3.84
2) Days of Autonomy (Nd)
“Autonomy days” are the number of continuous cloudy or rainy days when the level of irradiation is insufficient to provide adequate levels of radiation to the panels in the solar photovoltaic system, hence charging levels are not sufficient to provide power for the demand over that period. Data can generally be extracted from daily irradiation or daily hours of sunshine data. If data for the actual site is not available, then data recorded at an established site near to the location of the project area can be used. Alternately and generally far less reliable is an estimate of days, as provided from experiences from residents.
4.4 Estimation of the Power Generation by PV System
In order to design a PV system, it is important to know how solar energy is converted into electricity. The following model is useful for understanding the energy conversion process.
Fig. 4-1 Power generation model with battery
Generation Power
per Day
(kWh/day)
Average Irradiation a
day (kWh/m2/d)
Array Area (m2) ×
System Efficiency ηSYS = ηA nom x KB
Modified performance ratio KB = KPV x KBC x ηB x KPA xηI Solar Energy
Loss
Circuit Loss
Factor KPA
Inverter Efficiency
η I ( % ) ××
AC Out
Conversion Efficiency of PV η A
( % )
Battery Efficiency ηB (%)
KBC
×
Generation Power
GenerationPower
per Day (kWh/day)
Average Irradiation a
day (kWh/m2/d)
Average Irradiation a
day (kWh/m2/d)
Array Area (m2) Array Area (m2) ×
* Reflection * Allay tilt angle * Azimuth
Loss
Circuit Loss CircuitLoss
FactorKPA
Inverter Efficiency Inverter
Efficiency ηI (%) ××
Conversion Efficiency of PV η A
( % ) A Battery
Efficiency Battery
EfficiencyηB (%)
KBC ×
*Conversion efficiency * Module temperature * DC voltage mismatch * Dirt of module
* Charging loss * Charge control loss
* DC circuit loss * Inverter loss
ConversionEfficiency
Of PV ηA (%)
KPV

11
Table 4-2 Power generation model with battery Efficiency or Factor BCS SHS Centralized Grid
ηA Conversion efficiency of PV (dirt, temperature etc.) 0.12-0.14 0.12-0.14 0.12-0.14 0.12-0.14
ηB Battery charging efficiency 0.80-0.90 0.80-0.90 0.80-0.90 1
ηI Inverter efficiency 1 1 0.85-0.95 0.85-0.95
KPV PV array loss factor 0.7-0.9 0.7-0.9 0.7-0.9 0.7-0.9
KBC Control factor in battery charging 0.9 0.9 0.9 1
KPA Circuit loss factor 0.90-0.95 0.90-0.95 0.90-0.95 0.90-0.95
K Performance ratio 0.60-0.70 0.60-0.70 0.60-0.70 0.65-0.80
…………………………(1)
where: Ep :generated electric power during a specific period [kWh/period] PS :rated output of the PV array [kW] HA :irradiation on the array surface during a specific period [kWh/m2/period]
(=1.0[kW/m2]) Gs :irradiance at standard condition = 1 [kW/m2] KB :Modified performance ratio (KB = K * ηB * KBC) Performance ratio K is defined as a ratio of the actual generated electric power during a specific period and the calculated power (Rated output of the PV array * same energy irradiated on the array surface). The K includes all loss factors from the array surface to the output terminal of the inverter or controller. Theoretically, it is difficult to account for these loss factors, however the overall loss factor can be known empirically as “Performance ratio K”. This is a practical way to introduce the factor K for system planning. The average value of K for a grid-connected system with power maximum control is approximately 0.75 (0.65 – 0.8, mainly affected by module temperature and inverter loss). If the system without maximum power control and/or the quality is poor, the value of K will show lower value (0.6 – 0.7).
ηsys = ηAnom * K ………………………………..…(2)
where ηAnom : Rated conversion efficiency of PV array
In general, the system efficiency (ηsys) of a grid-connected PV system with maximum power control is approximately 0.098 or less. This shows that available solar energy is approximately 10% of the irradiated energy on the array area.
GS Ps = Ep ・ ─── ・ KS
HA
12
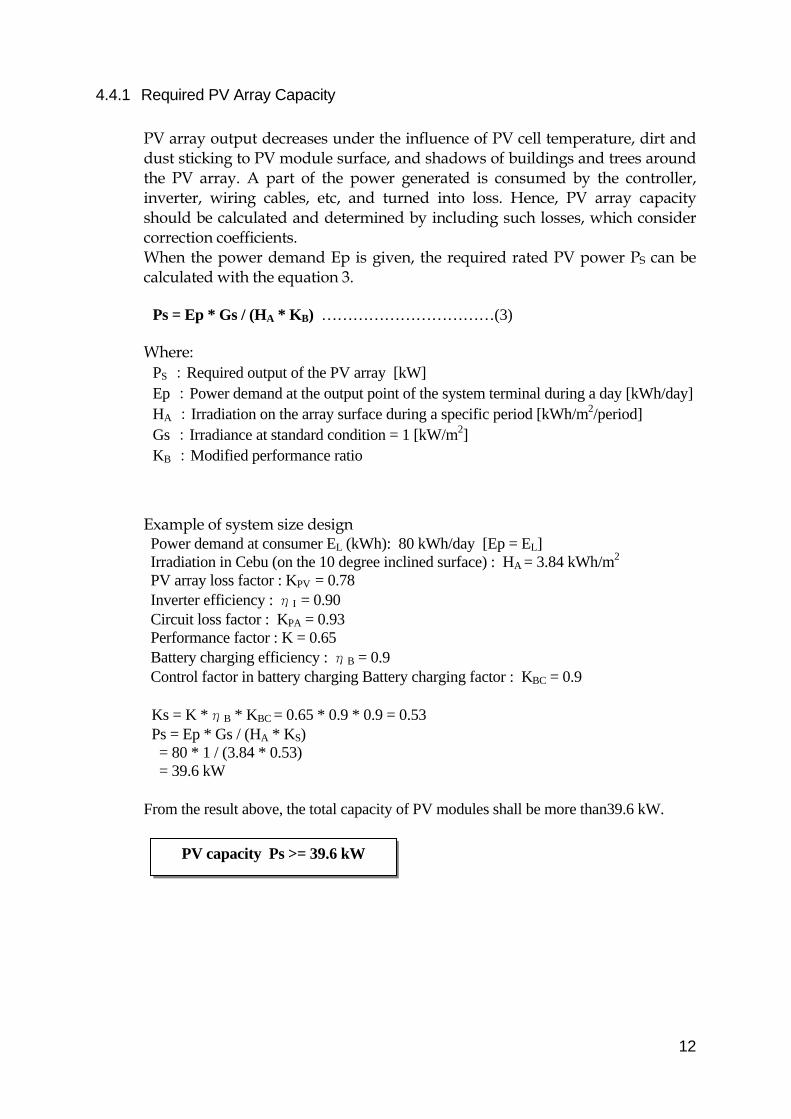
4.4.1 Required PV Array Capacity
PV array output decreases under the influence of PV cell temperature, dirt and dust sticking to PV module surface, and shadows of buildings and trees around the PV array. A part of the power generated is consumed by the controller, inverter, wiring cables, etc, and turned into loss. Hence, PV array capacity should be calculated and determined by including such losses, which consider correction coefficients. When the power demand Ep is given, the required rated PV power PS can be calculated with the equation 3.
Ps = Ep * Gs / (HA * KB) ……………………………(3)
Where:
PS :Required output of the PV array [kW] Ep :Power demand at the output point of the system terminal during a day [kWh/day] HA :Irradiation on the array surface during a specific period [kWh/m2/period] Gs :Irradiance at standard condition = 1 [kW/m2] KB :Modified performance ratio
Example of system size design Power demand at consumer EL (kWh): 80 kWh/day [Ep = EL] Irradiation in Cebu (on the 10 degree inclined surface) : HA = 3.84 kWh/m2 PV array loss factor : KPV = 0.78 Inverter efficiency : ηI = 0.90 Circuit loss factor : KPA = 0.93 Performance factor : K = 0.65 Battery charging efficiency : ηB = 0.9 Control factor in battery charging Battery charging factor : KBC = 0.9
Ks = K *ηB * KBC = 0.65 * 0.9 * 0.9 = 0.53 Ps = Ep * Gs / (HA * KS) = 80 * 1 / (3.84 * 0.53) = 39.6 kW
From the result above, the total capacity of PV modules shall be more than39.6 kW.
PV capacity Ps >= 39.6 kW
13
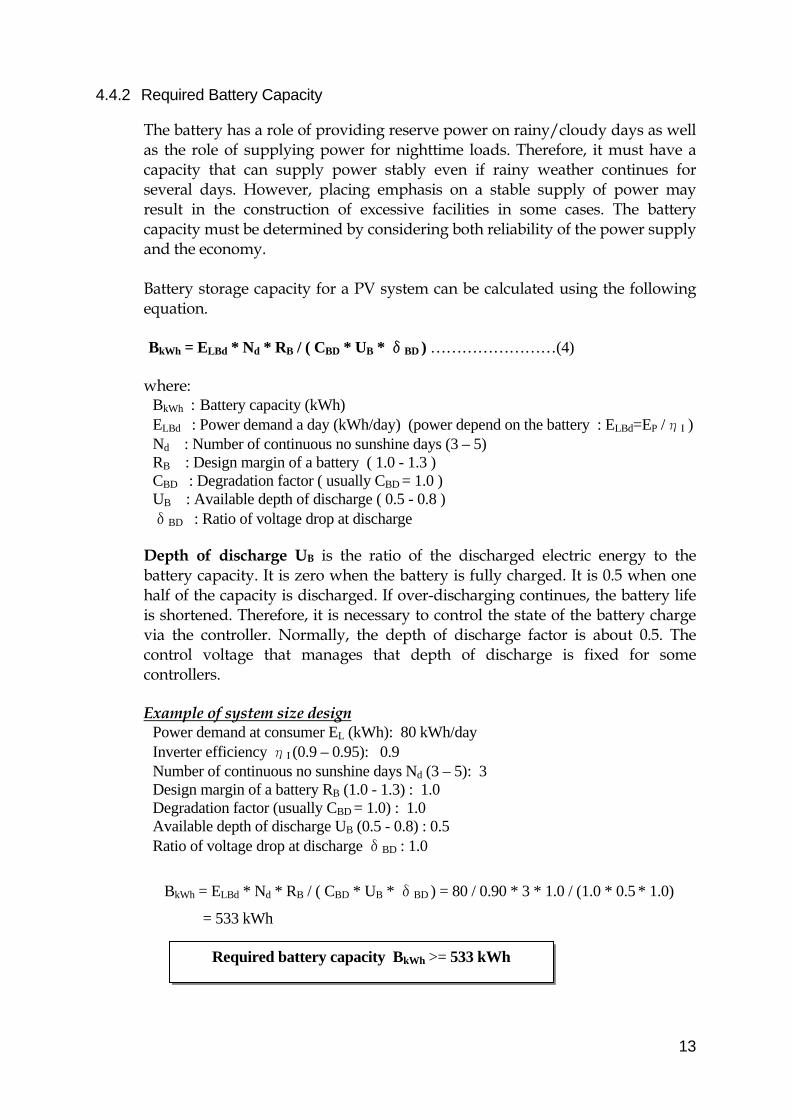
4.4.2 Required Battery Capacity
The battery has a role of providing reserve power on rainy/cloudy days as well as the role of supplying power for nighttime loads. Therefore, it must have a capacity that can supply power stably even if rainy weather continues for several days. However, placing emphasis on a stable supply of power may result in the construction of excessive facilities in some cases. The battery capacity must be determined by considering both reliability of the power supply and the economy. Battery storage capacity for a PV system can be calculated using the following equation. BkWh = ELBd * Nd * RB / ( CBD * UB * δBD ) ……………………(4)
where:
BkWh : Battery capacity (kWh) ELBd : Power demand a day (kWh/day) (power depend on the battery : ELBd=EP /ηI ) Nd : Number of continuous no sunshine days (3 – 5) RB : Design margin of a battery ( 1.0 - 1.3 ) CBD : Degradation factor ( usually CBD = 1.0 ) UB : Available depth of discharge ( 0.5 - 0.8 ) δBD : Ratio of voltage drop at discharge
Depth of discharge UB is the ratio of the discharged electric energy to the battery capacity. It is zero when the battery is fully charged. It is 0.5 when one half of the capacity is discharged. If over-discharging continues, the battery life is shortened. Therefore, it is necessary to control the state of the battery charge via the controller. Normally, the depth of discharge factor is about 0.5. The control voltage that manages that depth of discharge is fixed for some controllers. Example of system size design
Power demand at consumer EL (kWh): 80 kWh/day Inverter efficiency ηI (0.9 – 0.95): 0.9 Number of continuous no sunshine days Nd (3 – 5): 3 Design margin of a battery RB (1.0 - 1.3) : 1.0 Degradation factor (usually CBD = 1.0) : 1.0 Available depth of discharge UB (0.5 - 0.8) : 0.5 Ratio of voltage drop at discharge δBD : 1.0
BkWh = ELBd * Nd * RB / ( CBD * UB * δBD ) = 80 / 0.90 * 3 * 1.0 / (1.0 * 0.5 * 1.0)
= 533 kWh
Required battery capacity BkWh >= 533 kWh
14
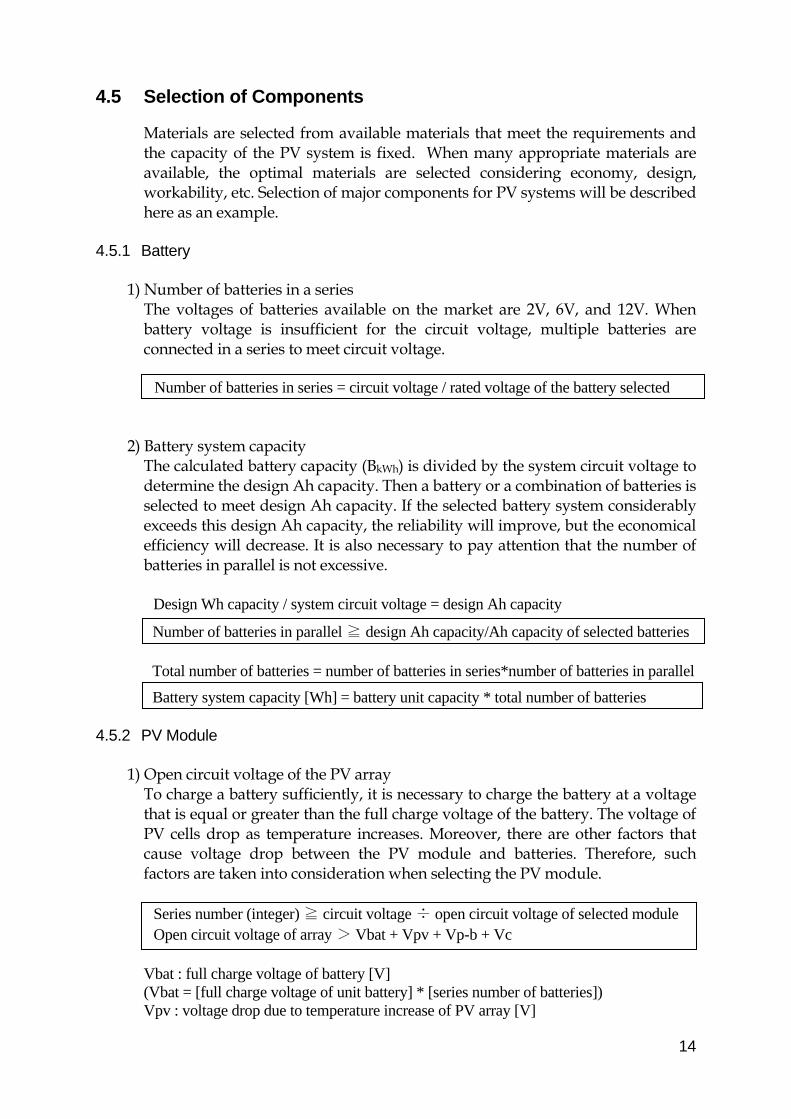
4.5 Selection of Components
Materials are selected from available materials that meet the requirements and the capacity of the PV system is fixed. When many appropriate materials are available, the optimal materials are selected considering economy, design, workability, etc. Selection of major components for PV systems will be described here as an example.
4.5.1 Battery
1) Number of batteries in a series The voltages of batteries available on the market are 2V, 6V, and 12V. When battery voltage is insufficient for the circuit voltage, multiple batteries are connected in a series to meet circuit voltage.
Number of batteries in series = circuit voltage / rated voltage of the battery selected
2) Battery system capacity
The calculated battery capacity (BkWh) is divided by the system circuit voltage to determine the design Ah capacity. Then a battery or a combination of batteries is selected to meet design Ah capacity. If the selected battery system considerably exceeds this design Ah capacity, the reliability will improve, but the economical efficiency will decrease. It is also necessary to pay attention that the number of batteries in parallel is not excessive.
Design Wh capacity / system circuit voltage = design Ah capacity
Number of batteries in parallel ≧ design Ah capacity/Ah capacity of selected batteries
Total number of batteries = number of batteries in series*number of batteries in parallel
Battery system capacity [Wh] = battery unit capacity * total number of batteries
4.5.2 PV Module
1) Open circuit voltage of the PV array To charge a battery sufficiently, it is necessary to charge the battery at a voltage that is equal or greater than the full charge voltage of the battery. The voltage of PV cells drop as temperature increases. Moreover, there are other factors that cause voltage drop between the PV module and batteries. Therefore, such factors are taken into consideration when selecting the PV module.
Series number (integer) ≧ circuit voltage ÷ open circuit voltage of selected module Open circuit voltage of array > Vbat + Vpv + Vp-b + Vc
Vbat : full charge voltage of battery [V] (Vbat = [full charge voltage of unit battery] * [series number of batteries]) Vpv : voltage drop due to temperature increase of PV array [V]
15
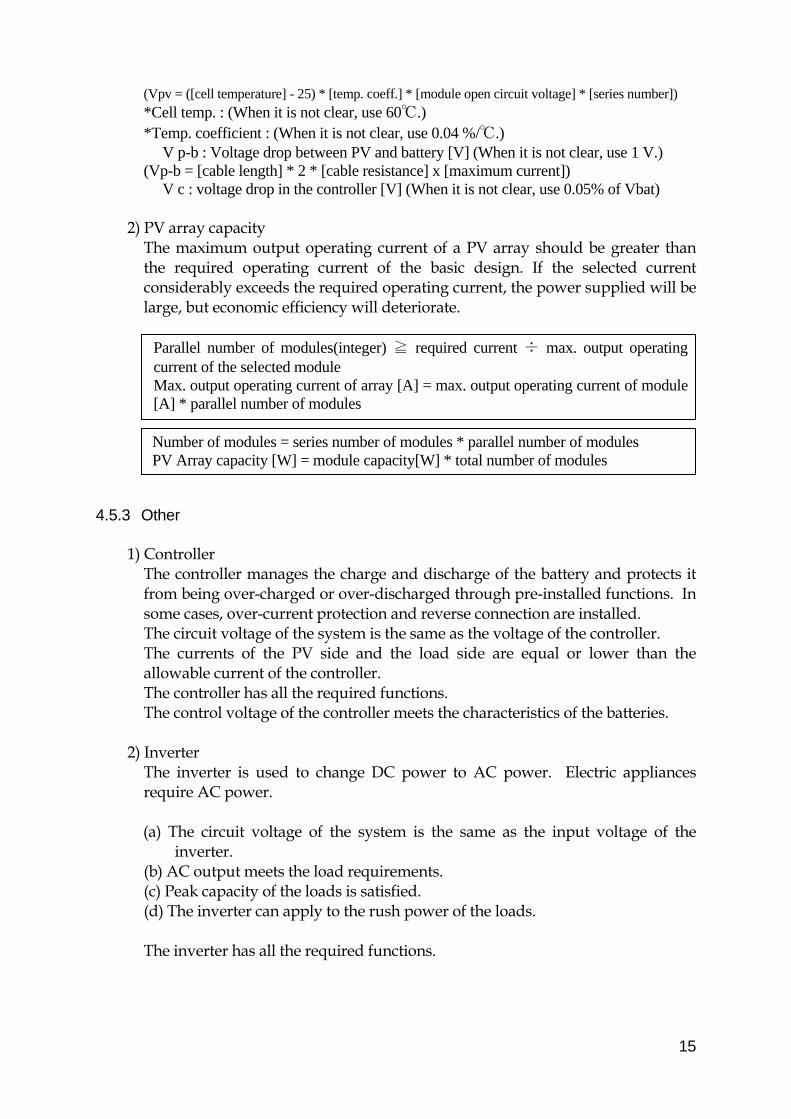
(Vpv = ([cell temperature] - 25) * [temp. coeff.] * [module open circuit voltage] * [series number]) *Cell temp. : (When it is not clear, use 60℃.) *Temp. coefficient : (When it is not clear, use 0.04 %/℃.) V p-b : Voltage drop between PV and battery [V] (When it is not clear, use 1 V.) (Vp-b = [cable length] * 2 * [cable resistance] x [maximum current]) V c : voltage drop in the controller [V] (When it is not clear, use 0.05% of Vbat)
2) PV array capacity The maximum output operating current of a PV array should be greater than the required operating current of the basic design. If the selected current considerably exceeds the required operating current, the power supplied will be large, but economic efficiency will deteriorate.
Parallel number of modules(integer) ≧ required current ÷ max. output operating current of the selected module Max. output operating current of array [A] = max. output operating current of module [A] * parallel number of modules
Number of modules = series number of modules * parallel number of modules PV Array capacity [W] = module capacity[W] * total number of modules
4.5.3 Other 1) Controller
The controller manages the charge and discharge of the battery and protects it from being over-charged or over-discharged through pre-installed functions. In some cases, over-current protection and reverse connection are installed. The circuit voltage of the system is the same as the voltage of the controller. The currents of the PV side and the load side are equal or lower than the allowable current of the controller. The controller has all the required functions. The control voltage of the controller meets the characteristics of the batteries.
2) Inverter The inverter is used to change DC power to AC power. Electric appliances require AC power. (a) The circuit voltage of the system is the same as the input voltage of the
inverter. (b) AC output meets the load requirements. (c) Peak capacity of the loads is satisfied. (d) The inverter can apply to the rush power of the loads. The inverter has all the required functions.
16
5 INSTALLATION
Installation is the actual work done to carry out the installation of the PV system. In this document, installation is assumed to be executed by the consignment contractor. The related processes are described in the following order: preparation of procurement specifications, selection of the contractor, coordination before installation, and execution of installation.
Key Points for Installation
1) Selection of an appropriate contractor The installation of PV systems can be done by contractors who are not specializing in installation of PV systems. However, if the quality of the installation is inferior, it may result in service interruption or failure. Thus, high quality installation work is required. On the selection of a contractor, it is extremely necessary that a knowledgeable contractor is selected based on previous experiences on PV system installations, the level learning on PV Technology of the engineers/technicians, and presentation of an installation management system by the prospective contractor.
2) Announcement of installation procedure to the related parties To ensure smooth execution of installation, it is important to carry out careful preliminary coordination with the parties concerned and make the installation procedure known to all parties concerned. A manual of the installation procedures must be developed and distributed to the concerned parties, in particular, the parties concerned with fieldwork.
3) Give full attention to installation management As for the installation work, it is necessary to ensure that high quality work be required and the installation schedule be kept on track. Lack of components or materials will delay installation work in rural areas. Therefore, due attention should be paid for transportation and management of equipment and materials at the site.
4) User Participation Regarding installation work, it is important to seek cooperation from the users by asking them to participate in the installation work. Through participation, such as transportation and management of the materials, users will be able to feel that the project is their own. Users can learn how to handle equipment and materials through transportation and installation. Thus, such participation serves as instruction and training for the users.
17
5.1 Preparation of Procurement Specifications On the basis of the PV system design, system design drawings, equipment specifications, and installation specifications equipment and materials are procured and the contract for installation work is made.
5.1.1 System Design Drawings
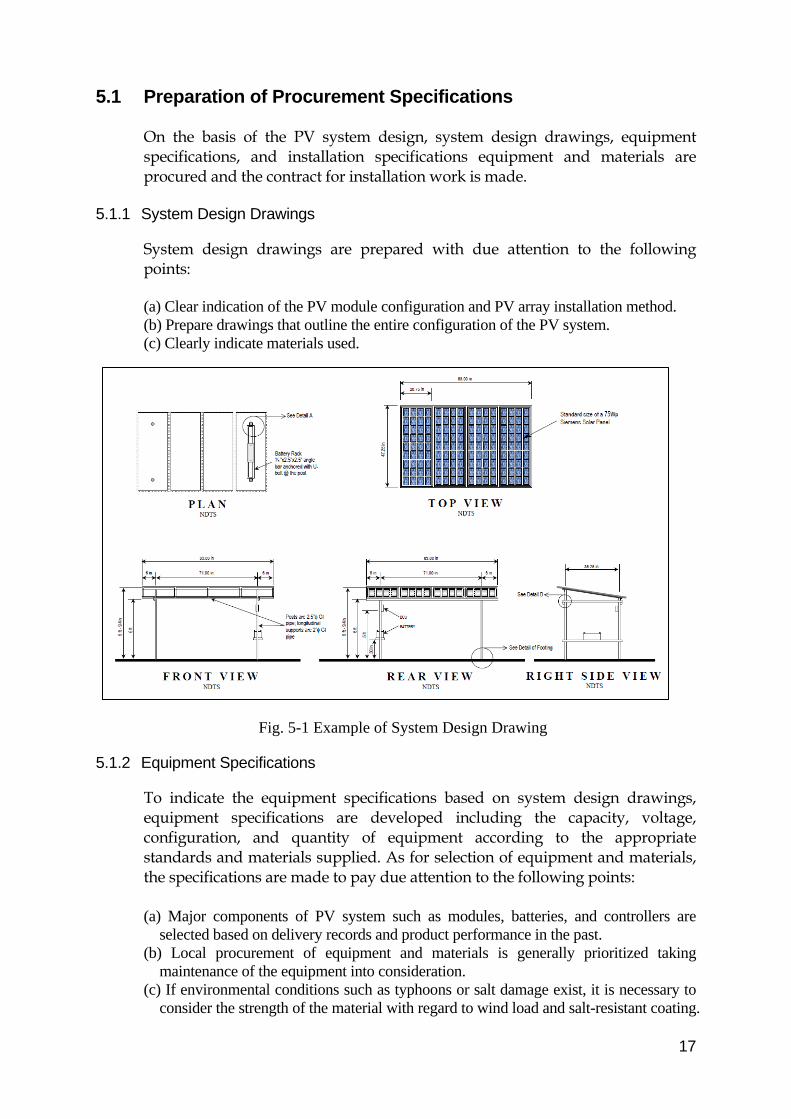
System design drawings are prepared with due attention to the following points: (a) Clear indication of the PV module configuration and PV array installation method. (b) Prepare drawings that outline the entire configuration of the PV system. (c) Clearly indicate materials used.
Fig. 5-1 Example of System Design Drawing
5.1.2 Equipment Specifications
To indicate the equipment specifications based on system design drawings, equipment specifications are developed including the capacity, voltage, configuration, and quantity of equipment according to the appropriate standards and materials supplied. As for selection of equipment and materials, the specifications are made to pay due attention to the following points: (a) Major components of PV system such as modules, batteries, and controllers are
selected based on delivery records and product performance in the past. (b) Local procurement of equipment and materials is generally prioritized taking
maintenance of the equipment into consideration. (c) If environmental conditions such as typhoons or salt damage exist, it is necessary to
consider the strength of the material with regard to wind load and salt-resistant coating.
18
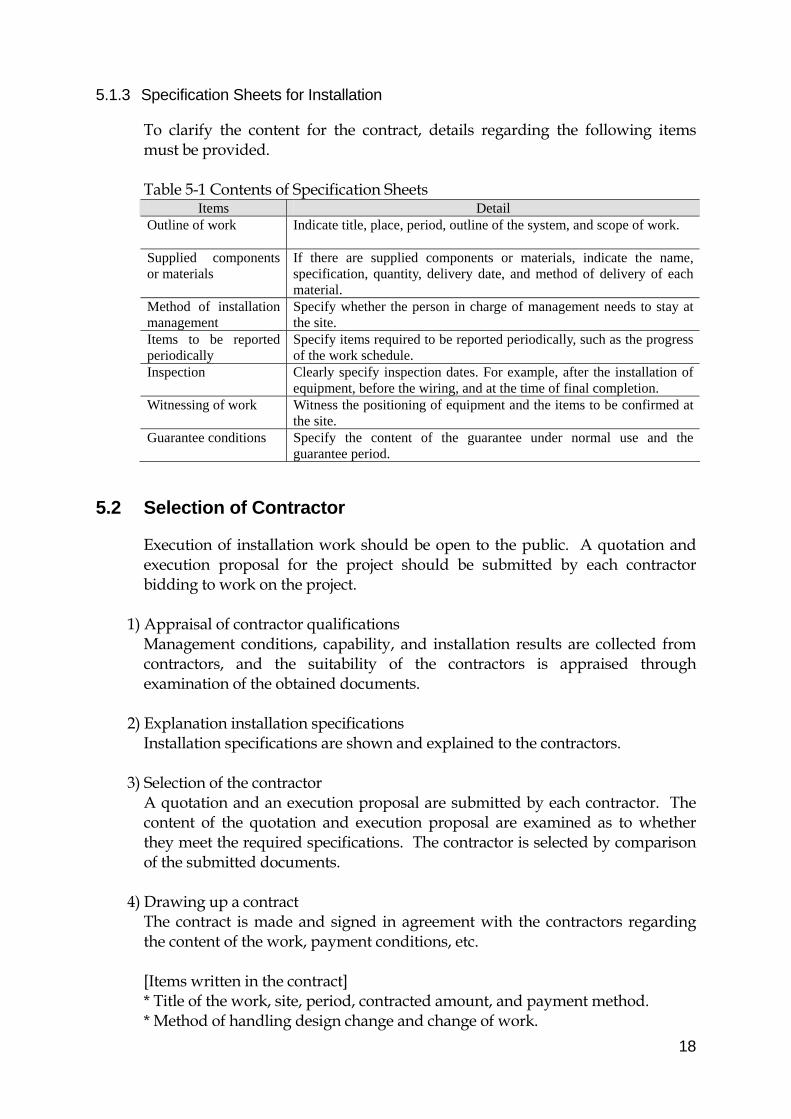
5.1.3 Specification Sheets for Installation
To clarify the content for the contract, details regarding the following items must be provided. Table 5-1 Contents of Specification Sheets
Items Detail Outline of work Indicate title, place, period, outline of the system, and scope of work.
Supplied components or materials
If there are supplied components or materials, indicate the name, specification, quantity, delivery date, and method of delivery of each material.
Method of installation management
Specify whether the person in charge of management needs to stay at the site.
Items to be reported periodically
Specify items required to be reported periodically, such as the progress of the work schedule.
Inspection Clearly specify inspection dates. For example, after the installation of equipment, before the wiring, and at the time of final completion.
Witnessing of work Witness the positioning of equipment and the items to be confirmed at the site.
Guarantee conditions Specify the content of the guarantee under normal use and the guarantee period.
5.2 Selection of Contractor
Execution of installation work should be open to the public. A quotation and execution proposal for the project should be submitted by each contractor bidding to work on the project.
1) Appraisal of contractor qualifications Management conditions, capability, and installation results are collected from contractors, and the suitability of the contractors is appraised through examination of the obtained documents.
2) Explanation installation specifications Installation specifications are shown and explained to the contractors.
3) Selection of the contractor A quotation and an execution proposal are submitted by each contractor. The content of the quotation and execution proposal are examined as to whether they meet the required specifications. The contractor is selected by comparison of the submitted documents.
4) Drawing up a contract The contract is made and signed in agreement with the contractors regarding the content of the work, payment conditions, etc. [Items written in the contract] * Title of the work, site, period, contracted amount, and payment method. * Method of handling design change and change of work.
19
* Method of extending the schedule in case of a natural disaster or irresistible force.
* Method of handling a case when a third party suffers damage, etc.
5.3 Coordination Prior to Installation
Before installation work commences, the content of the installation work is explained to the residents of the area and coordinated with the parties concerned.
1) Explanation to the local residents and request for cooperation Prior to the execution of installation work, the content of the work is explained to the local residents. Agreement of local residents is needed to start installation. A cooperative relationship must be established.
2) Coordination among the parties concerned for installation For installation efficiency and to maintain safety, it is necessary to gather the administrator, equipment and material suppliers and the contractor to gain a common understanding of the installation plan. Moreover, mutual confirmation of essential items is necessary to the execution of the work, such as the schedule, the delivery of equipment and materials, and the division of responsibility.
5.4 Execution of the installation work
The responsibilities of the administrator during the execution of installation work are outlined as follows.
1) Document verification and approval The necessary documents are submitted by the contractor and the content is verified. Inappropriate points or content must be corrected by the contractor. After this, the revised documents are resubmitted for verification and approval.
(a) Execution drawings according to the system design drawings are checked so that the installation can be executed correctly.
(b) Delivery specifications are confirmed to be sure that they meet equipment specifications.
(c) Implementation of installation work is being carried out according to schedule or will not be completed within the work period.
(d) The contractor must periodically submit reports on the state of conditions in the field. Inspection results and tests in the field are reported to make sure the work meets the rules and regulations.
(e) Completion drawings are kept to carry out maintenance smoothly after the installation of the facilities.
20
2) Installation management in the field To carry out installation management in the field, it is necessary to visit the site periodically and at the appropriate time.
(a) Witness inspection such as positioning of the system, assembling of array structures, etc. is executed together with the field engineer at the appropriate time.
(b) Progress, work safety, and storage of equipment and materials are checked by visiting the site periodically. Instruction is given if inappropriate practices are observed.
(c) If any uncertainty or design changes arise in the field, the superiors give consultation and instruction.
(d) Establishment of an information network system in the case of an emergency.
3) Completion inspection of installation work
At the time of completion, final inspection is carried out with the contractor to verify that the work meets all the requirements.
21
6 OPERATION AND MAINTENANCE PV systems are generally said to be maintenance-free. However, for rural electrification projects, installation sites for such systems tend to be in remote areas in many cases, and it may be difficult to respond quickly in the case of an emergency. Therefore, it is important to inspect and maintain the systems periodically, to detect faults earlier, and to improve operation methods. To enhance operation and maintenance of the systems, it is effective to develop manuals and keep records of operation by the technician. Moreover, it is important to increase system reliability and to establish a system for the storage and supply of equipment and materials, such as replacement parts.
Key Points for Operation and Maintenance
1) Execution of periodical inspection and maintenance To operate PV system as long as possible, periodic inspection and maintenance is executed. Faults and troubles should be detected as earlier as possible. Early detection of faults and troubles helps improve operation methods. This experience can also be applied to the introduction of other systems.
2) Preparation of manuals PV operation and maintenance systems are compiled in a manual. The maintenance level of each system is equalized. This manual helps minimize differences in engineering skills and enhances the operation and maintenance efficiency of the systems.
3) Preparation of operation and maintenance records It is necessary to keep track of inspection and maintenance records and problems encountered with the PV systems. Based on these records, the recurrence of previous problems and the occurrence of new problems can be prevented. Moreover, the findings are reflected in the manuals and engineer trainings. Technology is improved to execute operation and maintenance much efficiently.
4) Replacement of materials The use of materials that can be procured from the local market is important. However from an economic or reliability viewpoint, if it is difficult to obtain imports or materials from the local market, a supply system must be established that can deliver such items in a timely fashion.
5) Education of the users The users are involved in operation and maintenance of PV systems directly or indirectly. Therefore, education of the users is important. If an electrical appliance is used incorrectly, it may cause an accident or degrade the battery.
22
6.1 Inspection Method PV system inspection items are classified into items for visual inspection and items for measurement. Inspections can be carried out on a daily and periodic basis.
6.1.1 Inspection Items
Inspection items vary depending on the particulars of system configuration. It is necessary to select essential items according to the system configuration.
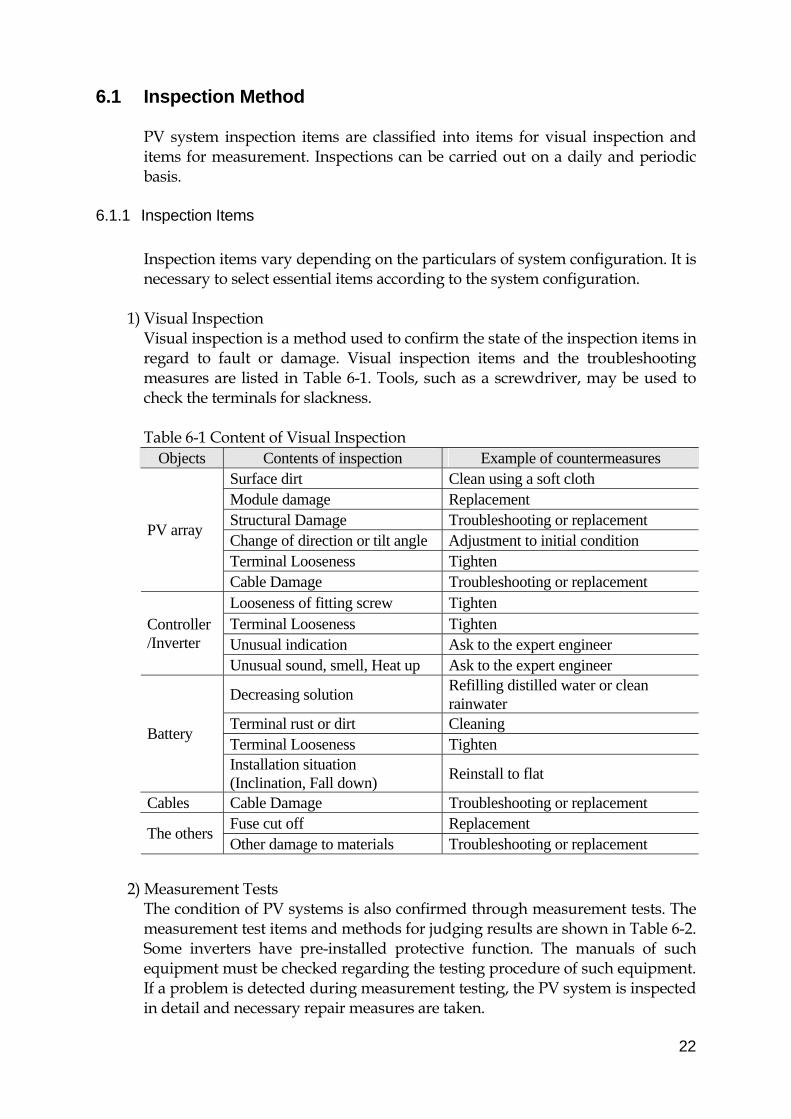
1) Visual Inspection Visual inspection is a method used to confirm the state of the inspection items in regard to fault or damage. Visual inspection items and the troubleshooting measures are listed in Table 6-1. Tools, such as a screwdriver, may be used to check the terminals for slackness. Table 6-1 Content of Visual Inspection
Objects Contents of inspection Example of countermeasures Surface dirt Clean using a soft cloth Module damage Replacement Structural Damage Troubleshooting or replacement Change of direction or tilt angle Adjustment to initial condition Terminal Looseness Tighten
PV array
Cable Damage Troubleshooting or replacement Looseness of fitting screw Tighten Terminal Looseness Tighten Unusual indication Ask to the expert engineer
Controller /Inverter
Unusual sound, smell, Heat up Ask to the expert engineer
Decreasing solution Refilling distilled water or clean rainwater
Terminal rust or dirt Cleaning Terminal Looseness Tighten
Battery
Installation situation (Inclination, Fall down)
Reinstall to flat
Cables Cable Damage Troubleshooting or replacement Fuse cut off Replacement
The others Other damage to materials Troubleshooting or replacement
2) Measurement Tests
The condition of PV systems is also confirmed through measurement tests. The measurement test items and methods for judging results are shown in Table 6-2. Some inverters have pre-installed protective function. The manuals of such equipment must be checked regarding the testing procedure of such equipment. If a problem is detected during measurement testing, the PV system is inspected in detail and necessary repair measures are taken.
23
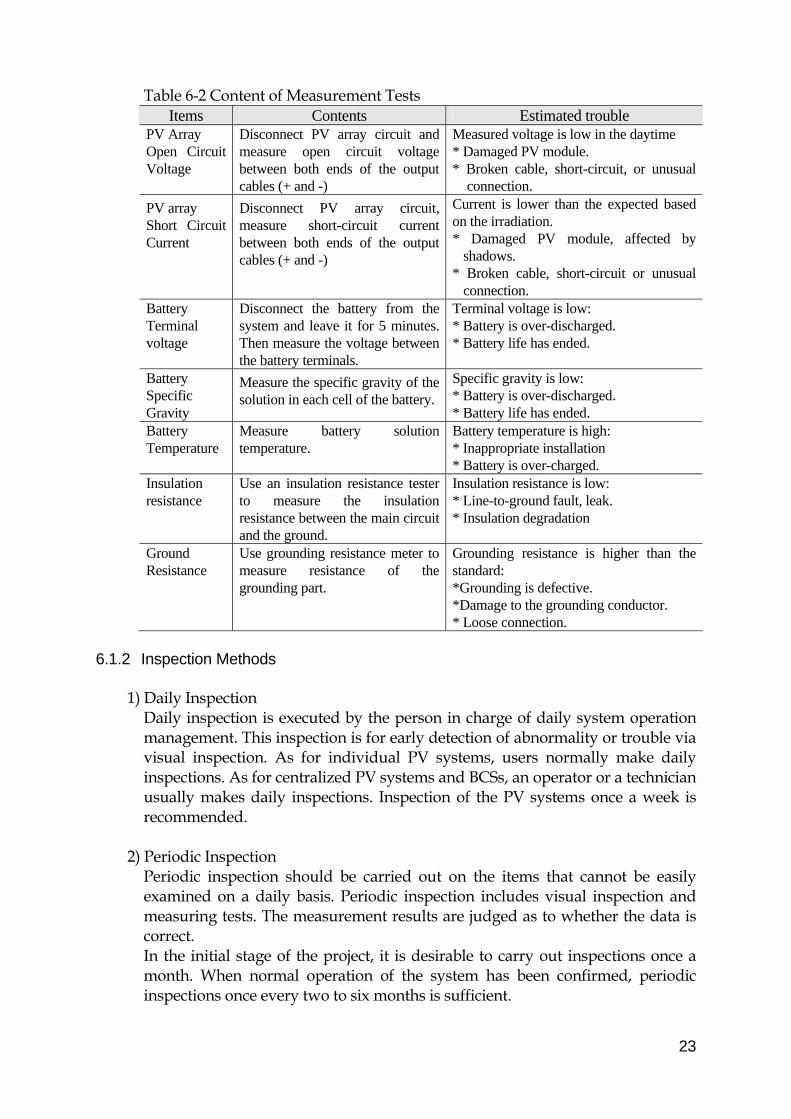
Table 6-2 Content of Measurement Tests Items Contents Estimated trouble
PV Array Open Circuit Voltage
Disconnect PV array circuit and measure open circuit voltage between both ends of the output cables (+ and -)
Measured voltage is low in the daytime * Damaged PV module. * Broken cable, short-circuit, or unusual
connection.
PV array Short Circuit Current
Disconnect PV array circuit, measure short-circuit current between both ends of the output cables (+ and -)
Current is lower than the expected based on the irradiation. * Damaged PV module, affected by
shadows. * Broken cable, short-circuit or unusual
connection. Battery Terminal voltage
Disconnect the battery from the system and leave it for 5 minutes. Then measure the voltage between the battery terminals.
Terminal voltage is low: * Battery is over-discharged. * Battery life has ended.
Battery Specific Gravity
Measure the specific gravity of the solution in each cell of the battery.
Specific gravity is low: * Battery is over-discharged. * Battery life has ended.
Battery Temperature
Measure battery solution temperature.
Battery temperature is high: * Inappropriate installation * Battery is over-charged.
Insulation resistance
Use an insulation resistance tester to measure the insulation resistance between the main circuit and the ground.
Insulation resistance is low: * Line-to-ground fault, leak. * Insulation degradation
Ground Resistance
Use grounding resistance meter to measure resistance of the grounding part.
Grounding resistance is higher than the standard: *Grounding is defective. *Damage to the grounding conductor. * Loose connection.
6.1.2 Inspection Methods
1) Daily Inspection
Daily inspection is executed by the person in charge of daily system operation management. This inspection is for early detection of abnormality or trouble via visual inspection. As for individual PV systems, users normally make daily inspections. As for centralized PV systems and BCSs, an operator or a technician usually makes daily inspections. Inspection of the PV systems once a week is recommended.
2) Periodic Inspection Periodic inspection should be carried out on the items that cannot be easily examined on a daily basis. Periodic inspection includes visual inspection and measuring tests. The measurement results are judged as to whether the data is correct. In the initial stage of the project, it is desirable to carry out inspections once a month. When normal operation of the system has been confirmed, periodic inspections once every two to six months is sufficient.
24
6.2 Manual The content of the manuals differ depending on the system and the role of the person who uses the manual. The content of the manuals for technicians in charge of periodic inspection and the content of the manuals for the users will be described separately as follows. For manual preparation, proper introduction of the system is necessary. Manuals used for similar projects or manuals provided by manufacturers serve as appropriate references for the manual. Trouble experienced during operation of the system and countermeasures should be included in the manual.
6.2.1 Manuals for Engineers Manuals for engineers include the system installation methods, inspection and maintenance, and troubleshooting.
1) Installation Methods This manual includes the system configuration, lists of equipment and materials, drawings and procedures, etc. Installation of the system can be executed according to the manual. This manual can be utilized for new installations of similar systems, for the removal or transfer of an existing system, and for PV array repair.
2) Inspection and Maintenance Methods This manual includes procedures for visual inspections and measurement tests to be carried out by the engineer during the periodic inspection and countermeasures to be implemented in the case of trouble or failure. Inspection and maintenance can carried out according to the manual. Other engineers in charge of the project or system can also use this manual.
3) Troubleshooting summarized Regarding trouble that may occur during system operation, instances of trouble from similar projects or anticipated problems are summarized and included in the manual with the causes and countermeasures. Therefore, effective countermeasures should be employed when trouble occurs. This manual provides guidance in considering such countermeasures.
6.2.2 Manual for the Users The items of the manual for users include the method of operation, method of using electric appliances, and inspection and maintenance. It is important that users who have little knowledge of electricity can easily understand the manual with illustrations etc.
25
6.3 Operation and Maintenance Records By keeping system operation and maintenance records, such as results of the daily and periodic inspection, and the replacement condition of parts, early detection of problems is facilitated, causes of the problems can be determined, and countermeasures can be considered. Thus, operation records are important documents for ensuring stable use of the system over the long-term. It is important to understand the significance all the recorded operation and maintenance data, and to keep records for system operation and management.
1) Daily and Periodic Inspection Records Tables are prepared to record the result and judgment of the daily and periodic inspection, respectively. Inspection records clearly indicate items to be checked by the engineer at the time of inspection and also enable provision of standard inspection and maintenance services. The inspection records are utilized to prevent trouble and to discover repeated problems.
2) Replacement Part Records For replacement part records, the part name, date and time, reason for replacement, person replaced the part, cost, etc are described. These records can be used for judging the effective life of each part, discovering problematic parts, and for replenishing equipment and materials.
3) Trouble Records The date and time of occurrence, kind of trouble, countermeasures etc. are described in trouble records. Trouble is mainly caused by failures or degradation of the systems themselves. Human errors such as improper operation, negligent implementation of inspection and maintenance, etc are also factors. Trouble records in relation to system operation can be used to investigate the causes of trouble, consider preventive measures, and judge whether a countermeasure is appropriate or not.
4) Electric Appliance Usage Records The kinds of electric appliances owned, their capacities, mean durations of use, etc are investigated and recorded. In case of frequent recurrence of stoppage or trouble, such records can be used to judge whether trouble is caused by the system itself or by the method of electricity use. If the method of electricity use is inappropriate, countermeasures will be provided to the users through technical instruction or by the application of countermeasures on the system-side. Such records are also useful in considering the expansion of system capacity in response to demand growth.
6.4 Replacement of Equipment and Materials The expected life of a PV module is twenty years or more. The effective life of other PV system components is shorter. Therefore, timely replacement of such components is important for long-term stable operation of the system. The
26
replacement of major components and inspection particulars will be introduced as follows. The method of storing spare parts will be described as well.
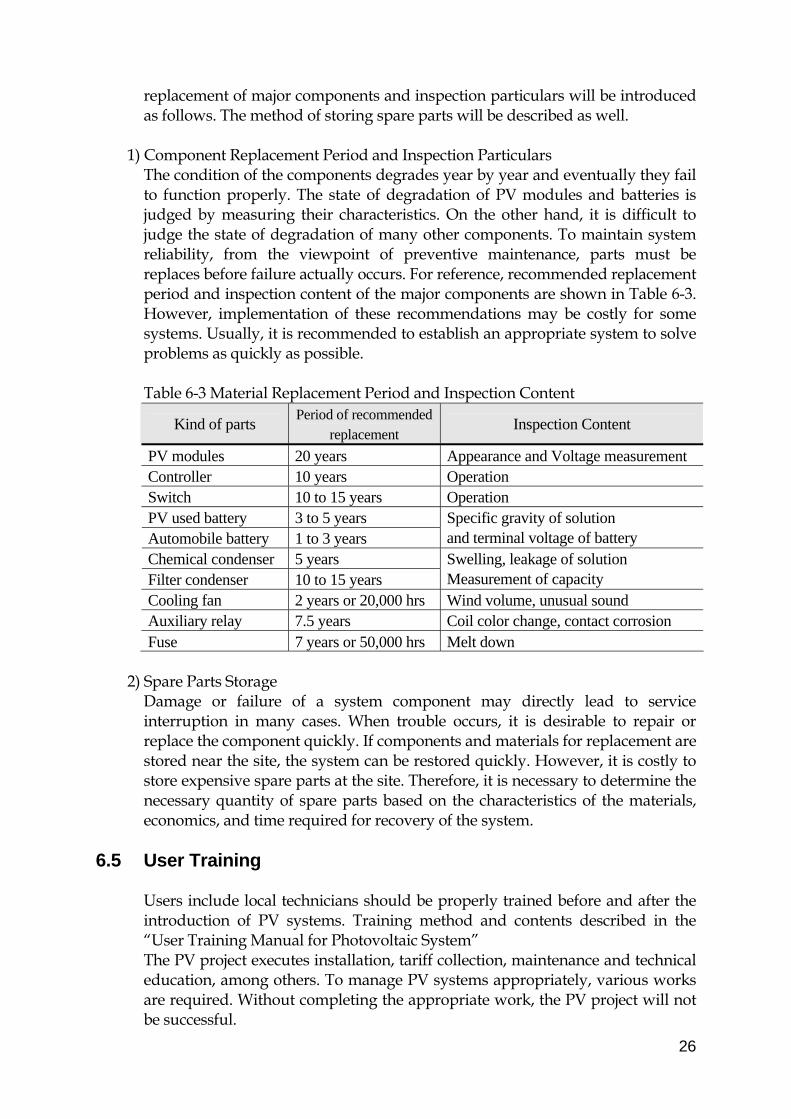
1) Component Replacement Period and Inspection Particulars The condition of the components degrades year by year and eventually they fail to function properly. The state of degradation of PV modules and batteries is judged by measuring their characteristics. On the other hand, it is difficult to judge the state of degradation of many other components. To maintain system reliability, from the viewpoint of preventive maintenance, parts must be replaces before failure actually occurs. For reference, recommended replacement period and inspection content of the major components are shown in Table 6-3. However, implementation of these recommendations may be costly for some systems. Usually, it is recommended to establish an appropriate system to solve problems as quickly as possible. Table 6-3 Material Replacement Period and Inspection Content
Kind of parts Period of recommended
replacement Inspection Content
PV modules 20 years Appearance and Voltage measurement Controller 10 years Operation Switch 10 to 15 years Operation PV used battery 3 to 5 years Automobile battery 1 to 3 years
Specific gravity of solution and terminal voltage of battery
Chemical condenser 5 years Filter condenser 10 to 15 years
Swelling, leakage of solution Measurement of capacity
Cooling fan 2 years or 20,000 hrs Wind volume, unusual sound Auxiliary relay 7.5 years Coil color change, contact corrosion Fuse 7 years or 50,000 hrs Melt down
2) Spare Parts Storage
Damage or failure of a system component may directly lead to service interruption in many cases. When trouble occurs, it is desirable to repair or replace the component quickly. If components and materials for replacement are stored near the site, the system can be restored quickly. However, it is costly to store expensive spare parts at the site. Therefore, it is necessary to determine the necessary quantity of spare parts based on the characteristics of the materials, economics, and time required for recovery of the system.
6.5 User Training Users include local technicians should be properly trained before and after the introduction of PV systems. Training method and contents described in the “User Training Manual for Photovoltaic System” The PV project executes installation, tariff collection, maintenance and technical education, among others. To manage PV systems appropriately, various works are required. Without completing the appropriate work, the PV project will not be successful.
27
Project evaluation will study whether a project is planned and implemented properly according to its objectives, how the project affects the surrounding environment, and judges whether a project is successful or not based on the results of the study. It is important to evaluate the project during implementation and reconsider the implementation plan accordingly. Evaluated items are technology, management, the social environment and economics. This guideline explains the content of the evaluation items and methods.
7 AMENDMENT OF THE MANUAL
The DOE shall review this guideline annually, and amend it, if necessary, according to the surrounding circumstances in rural electrification of the country. The amended manual shall be fully authorized among the DOE and approved by Director of Renewable Energy Management Bureau of the DOE.

ANNEX 1
1
Solar radiation
1) The location of the points of the solar radiation data
2
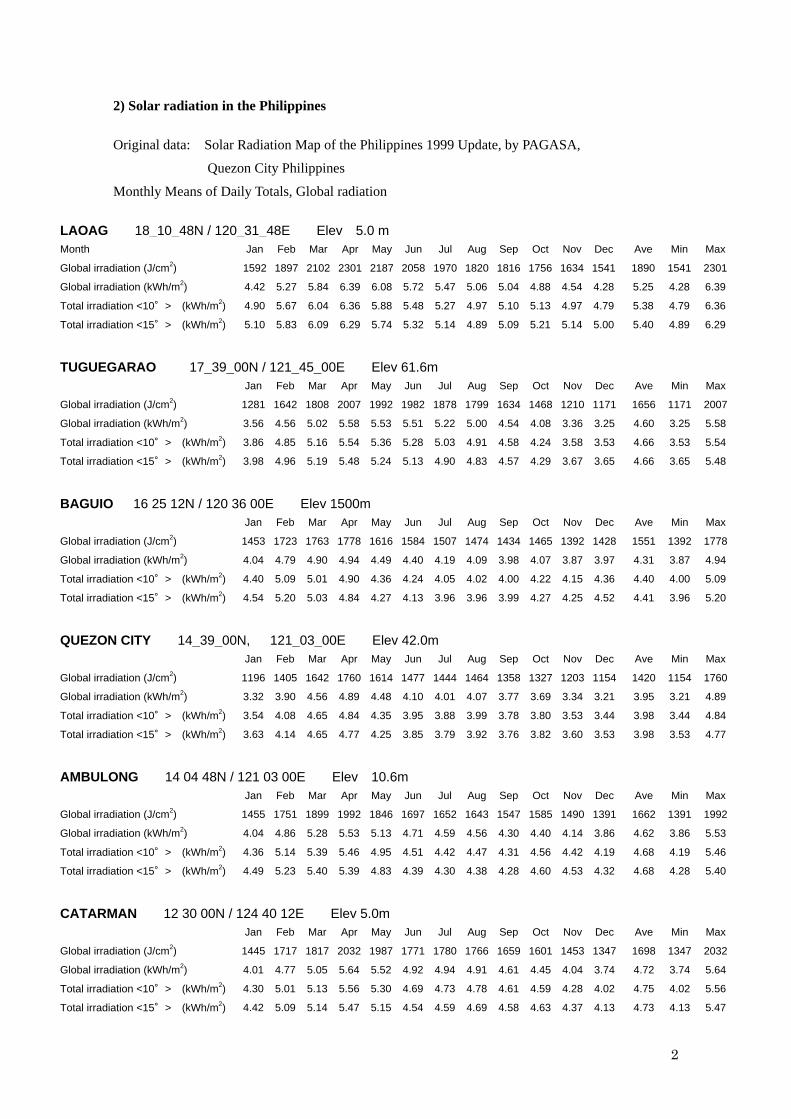
2) Solar radiation in the Philippines Original data: Solar Radiation Map of the Philippines 1999 Update, by PAGASA,
Quezon City Philippines
Monthly Means of Daily Totals, Global radiation
LAOAG 18_10_48N / 120_31_48E Elev 5.0 mMonth Jan Feb Mar Apr May Jun Jul Aug Sep Oct Nov Dec Ave Min Max
Global irradiation (J/cm2) 1592 1897 2102 2301 2187 2058 1970 1820 1816 1756 1634 1541 1890 1541 2301
Global irradiation (kWh/m2) 4.42 5.27 5.84 6.39 6.08 5.72 5.47 5.06 5.04 4.88 4.54 4.28 5.25 4.28 6.39
Total irradiation <10°> (kWh/m2) 4.90 5.67 6.04 6.36 5.88 5.48 5.27 4.97 5.10 5.13 4.97 4.79 5.38 4.79 6.36
Total irradiation <15°> (kWh/m2) 5.10 5.83 6.09 6.29 5.74 5.32 5.14 4.89 5.09 5.21 5.14 5.00 5.40 4.89 6.29
TUGUEGARAO 17_39_00N / 121_45_00E Elev 61.6m
Jan Feb Mar Apr May Jun Jul Aug Sep Oct Nov Dec Ave Min Max
Global irradiation (J/cm2) 1281 1642 1808 2007 1992 1982 1878 1799 1634 1468 1210 1171 1656 1171 2007
Global irradiation (kWh/m2) 3.56 4.56 5.02 5.58 5.53 5.51 5.22 5.00 4.54 4.08 3.36 3.25 4.60 3.25 5.58
Total irradiation <10°> (kWh/m2) 3.86 4.85 5.16 5.54 5.36 5.28 5.03 4.91 4.58 4.24 3.58 3.53 4.66 3.53 5.54
Total irradiation <15°> (kWh/m2) 3.98 4.96 5.19 5.48 5.24 5.13 4.90 4.83 4.57 4.29 3.67 3.65 4.66 3.65 5.48
BAGUIO 16 25 12N / 120 36 00E Elev 1500m
Jan Feb Mar Apr May Jun Jul Aug Sep Oct Nov Dec Ave Min Max
Global irradiation (J/cm2) 1453 1723 1763 1778 1616 1584 1507 1474 1434 1465 1392 1428 1551 1392 1778
Global irradiation (kWh/m2) 4.04 4.79 4.90 4.94 4.49 4.40 4.19 4.09 3.98 4.07 3.87 3.97 4.31 3.87 4.94
Total irradiation <10°> (kWh/m2) 4.40 5.09 5.01 4.90 4.36 4.24 4.05 4.02 4.00 4.22 4.15 4.36 4.40 4.00 5.09
Total irradiation <15°> (kWh/m2) 4.54 5.20 5.03 4.84 4.27 4.13 3.96 3.96 3.99 4.27 4.25 4.52 4.41 3.96 5.20
QUEZON CITY 14_39_00N, 121_03_00E Elev 42.0m
Jan Feb Mar Apr May Jun Jul Aug Sep Oct Nov Dec Ave Min Max
Global irradiation (J/cm2) 1196 1405 1642 1760 1614 1477 1444 1464 1358 1327 1203 1154 1420 1154 1760
Global irradiation (kWh/m2) 3.32 3.90 4.56 4.89 4.48 4.10 4.01 4.07 3.77 3.69 3.34 3.21 3.95 3.21 4.89
Total irradiation <10°> (kWh/m2) 3.54 4.08 4.65 4.84 4.35 3.95 3.88 3.99 3.78 3.80 3.53 3.44 3.98 3.44 4.84
Total irradiation <15°> (kWh/m2) 3.63 4.14 4.65 4.77 4.25 3.85 3.79 3.92 3.76 3.82 3.60 3.53 3.98 3.53 4.77
AMBULONG 14 04 48N / 121 03 00E Elev 10.6m
Jan Feb Mar Apr May Jun Jul Aug Sep Oct Nov Dec Ave Min Max
Global irradiation (J/cm2) 1455 1751 1899 1992 1846 1697 1652 1643 1547 1585 1490 1391 1662 1391 1992
Global irradiation (kWh/m2) 4.04 4.86 5.28 5.53 5.13 4.71 4.59 4.56 4.30 4.40 4.14 3.86 4.62 3.86 5.53
Total irradiation <10°> (kWh/m2) 4.36 5.14 5.39 5.46 4.95 4.51 4.42 4.47 4.31 4.56 4.42 4.19 4.68 4.19 5.46
Total irradiation <15°> (kWh/m2) 4.49 5.23 5.40 5.39 4.83 4.39 4.30 4.38 4.28 4.60 4.53 4.32 4.68 4.28 5.40
CATARMAN 12 30 00N / 124 40 12E Elev 5.0m
Jan Feb Mar Apr May Jun Jul Aug Sep Oct Nov Dec Ave Min Max
Global irradiation (J/cm2) 1445 1717 1817 2032 1987 1771 1780 1766 1659 1601 1453 1347 1698 1347 2032
Global irradiation (kWh/m2) 4.01 4.77 5.05 5.64 5.52 4.92 4.94 4.91 4.61 4.45 4.04 3.74 4.72 3.74 5.64
Total irradiation <10°> (kWh/m2) 4.30 5.01 5.13 5.56 5.30 4.69 4.73 4.78 4.61 4.59 4.28 4.02 4.75 4.02 5.56
Total irradiation <15°> (kWh/m2) 4.42 5.09 5.14 5.47 5.15 4.54 4.59 4.69 4.58 4.63 4.37 4.13 4.73 4.13 5.47

3
TACLOBAN 11 13 48N / 125 01 48E Elev 2.2m
Jan Feb Mar Apr May Jun Jul Aug Sep Oct Nov Dec Ave Min Max
Global irradiation (J/cm2) 1339 1529 1657 1748 1626 1481 1509 1518 1433 1407 1288 1228 1480 1228 1748
Global irradiation (kWh/m2) 3.72 4.25 4.60 4.86 4.52 4.11 4.19 4.22 3.98 3.91 3.58 3.41 4.11 3.41 4.86
Total irradiation <10°> (kWh/m2) 3.95 4.42 4.66 4.78 4.35 3.94 4.03 4.11 3.97 4.01 3.76 3.63 4.13 3.63 4.78
Total irradiation <15°> (kWh/m2) 4.04 4.47 4.66 4.70 4.24 3.83 3.92 4.03 3.94 4.03 3.82 3.71 4.12 3.71 4.70
VICTORIAS MILLING CO. 10 52 48N / 123 42 00E Elev 18.0m
Jan Feb Mar Apr May Jun Jul Aug Sep Oct Nov Dec Ave Min Max
Global irradiation (J/cm2) 1389 1544 1693 1820 1702 1492 1489 1485 1447 1450 1379 1299 1516 1299 1820
Global irradiation (kWh/m2) 3.86 4.29 4.70 5.06 4.73 4.14 4.14 4.13 4.02 4.03 3.83 3.61 4.21 3.61 5.06
Total irradiation <10°> (kWh/m2) 4.10 4.46 4.76 4.97 4.55 3.97 3.97 4.02 4.01 4.13 4.03 3.85 4.24 3.85 4.97
Total irradiation <15°> (kWh/m2) 4.20 4.52 4.76 4.89 4.43 3.85 3.87 3.95 3.98 4.15 4.11 3.94 4.22 3.85 4.89
PUERTO PRINCESA 9 45 00N / 118 43 48E Elev 14.9m
Jan Feb Mar Apr May Jun Jul Aug Sep Oct Nov Dec Ave Min Max
Global irradiation (J/cm2) 1524 1710 1885 1957 1687 1543 1494 1548 1521 1489 1481 1423 1605 1423 1957
Global irradiation (kWh/m2) 4.23 4.75 5.24 5.44 4.69 4.29 4.15 4.30 4.23 4.14 4.11 3.95 4.46 3.95 5.44
Total irradiation <10°> (kWh/m2) 4.51 4.95 5.30 5.33 4.50 4.09 3.98 4.18 4.21 4.24 4.34 4.23 4.49 3.98 5.33
Total irradiation <15°> (kWh/m2) 4.62 5.01 5.29 5.23 4.38 3.96 3.87 4.10 4.17 4.26 4.41 4.33 4.47 3.87 5.29
CAGAYAN DE ORO 8 25 48N / 124 37 12E Elev 182m
Jan Feb Mar Apr May Jun Jul Aug Sep Oct Nov Dec Ave Min Max
Global irradiation (J/cm2) 1509 1729 1803 1958 1847 1435 1532 1593 1630 1565 1525 1458 1632 1435 1958
Global irradiation (kWh/m2) 4.19 4.80 5.01 5.44 5.13 3.99 4.26 4.43 4.53 4.35 4.24 4.05 4.53 3.99 5.44
Total irradiation <10°> (kWh/m2) 4.45 4.99 5.06 5.32 4.90 3.80 4.06 4.29 4.50 4.45 4.46 4.32 4.55 3.80 5.32
Total irradiation <15°> (kWh/m2) 4.54 5.05 5.04 5.22 4.75 3.69 3.94 4.20 4.46 4.47 4.53 4.42 4.53 3.69 5.22
DAVAO 7 07 12N / 125 39 00E Elev 18.0m
Jan Feb Mar Apr May Jun Jul Aug Sep Oct Nov Dec Ave Min Max
Global irradiation (J/cm2) 1583 1715 1769 1972 1842 1490 1573 1651 1705 1668 1619 1646 1686 1490 1972
Global irradiation (kWh/m2) 4.40 4.76 4.91 5.48 5.12 4.14 4.37 4.59 4.74 4.63 4.50 4.57 4.68 4.14 5.48
Total irradiation <10°> (kWh/m2) 4.66 4.94 4.95 5.34 4.87 3.93 4.16 4.44 4.70 4.74 4.73 4.90 4.70 3.93 5.34
Total irradiation <15°> (kWh/m2) 4.76 4.99 4.93 5.24 4.72 3.81 4.03 4.33 4.65 4.76 4.81 5.02 4.67 3.81 5.24
ZAMBOANGA 6 54 00N / 122 04 12E Elev 6.9m
Jan Feb Mar Apr May Jun Jul Aug Sep Oct Nov Dec Ave Min Max
Global irradiation (J/cm2) 1681 1786 1757 1834 1738 1600 1673 1705 1653 1659 1664 1655 1700 1600 1834
Global irradiation (kWh/m2) 4.67 4.96 4.88 5.09 4.83 4.44 4.65 4.74 4.59 4.61 4.62 4.60 4.72 4.44 5.09
Total irradiation <10°> (kWh/m2) 4.97 5.15 4.91 4.97 4.61 4.21 4.41 4.58 4.56 4.71 4.87 4.92 4.74 4.21 5.15
Total irradiation <15°> (kWh/m2) 5.08 5.20 4.89 4.88 4.46 4.06 4.26 4.46 4.51 4.73 4.95 5.04 4.71 4.06 5.20
The source; Solar Radiation Map of the Philippines 1999 Update The publisher; Philippine Atmospheric, Geophysical and Astronomical Services Administration
(PAGASA) Quezon City
4
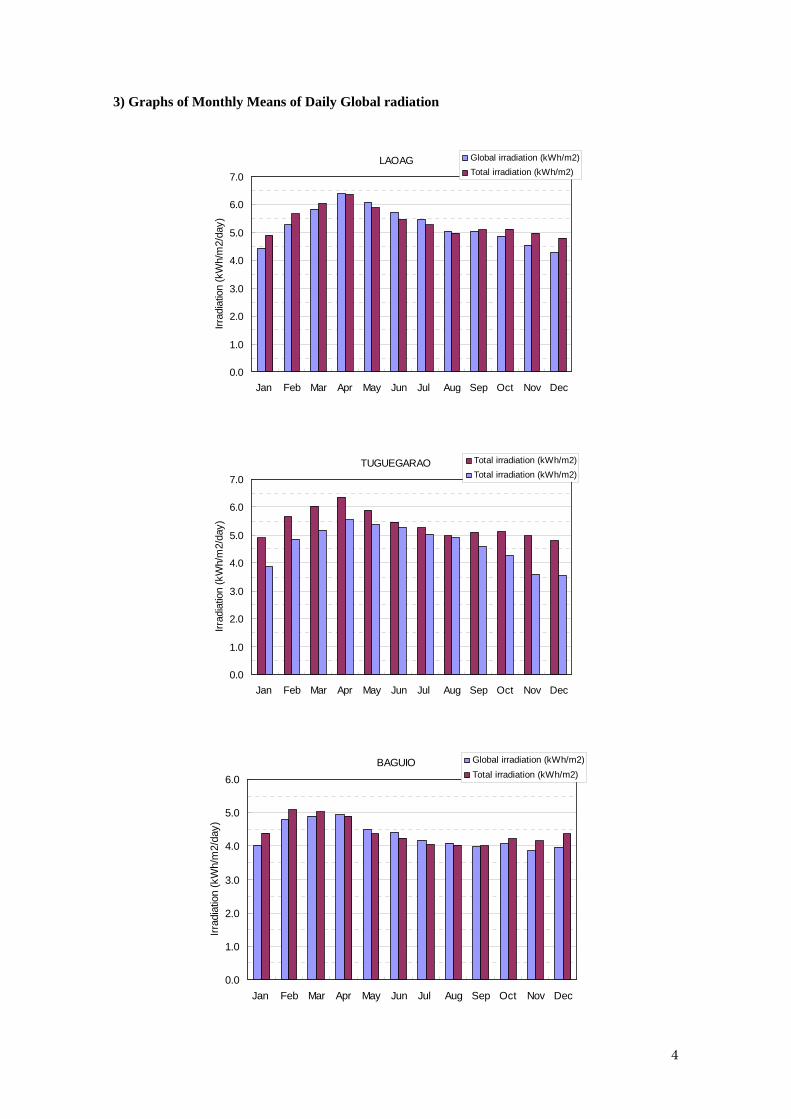
3) Graphs of Monthly Means of Daily Global radiation
LAOAG
0.0
1.0
2.0
3.0
4.0
5.0
6.0
7.0
Jan Feb Mar Apr May Jun Jul Aug Sep Oct Nov Dec
Irra
diat
ion
(kW
h/m
2/da
y)
Global irradiation (kWh/m2)
Total irradiation (kWh/m2)
TUGUEGARAO
0.0
1.0
2.0
3.0
4.0
5.0
6.0
7.0
Jan Feb Mar Apr May Jun Jul Aug Sep Oct Nov Dec
Irra
diat
ion
(kW
h/m
2/da
y)
Total irradiation (kWh/m2)
Total irradiation (kWh/m2)
BAGUIO
0.0
1.0
2.0
3.0
4.0
5.0
6.0
Jan Feb Mar Apr May Jun Jul Aug Sep Oct Nov Dec
Irra
diat
ion
(kW
h/m
2/da
y)
Global irradiation (kWh/m2)
Total irradiation (kWh/m2)
5
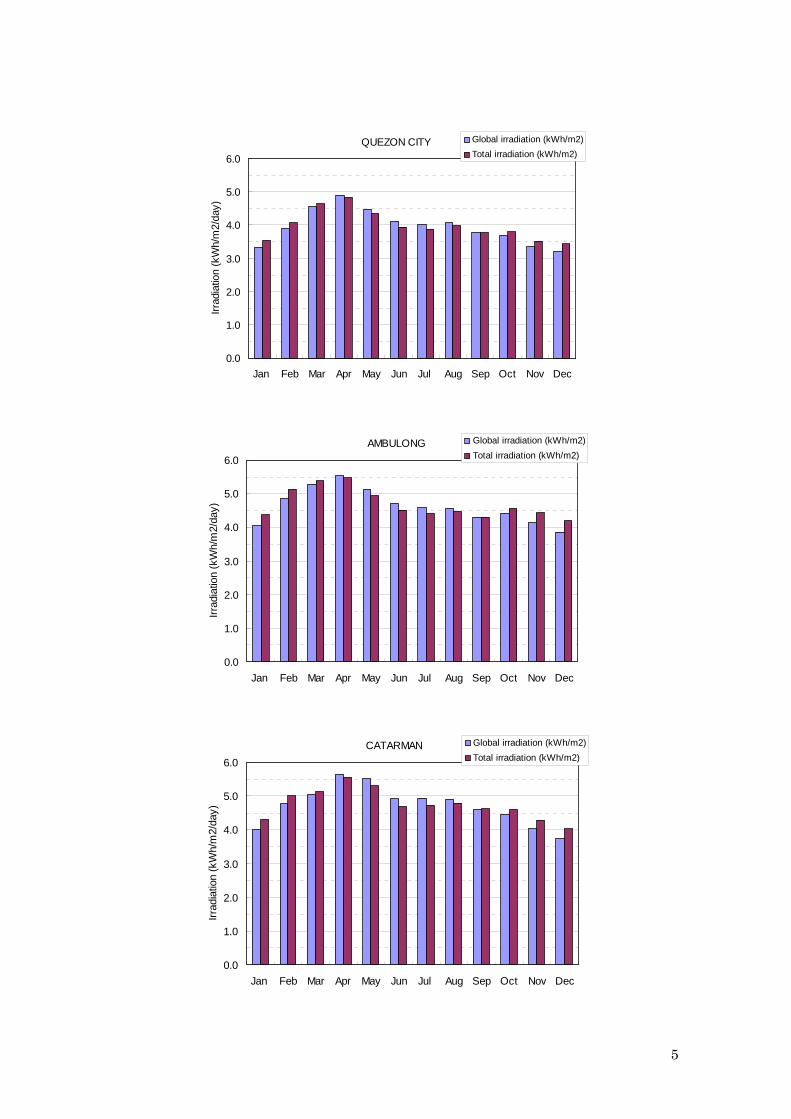
QUEZON CITY
0.0
1.0
2.0
3.0
4.0
5.0
6.0
Jan Feb Mar Apr May Jun Jul Aug Sep Oct Nov Dec
Irra
diat
ion
(kW
h/m
2/da
y)
Global irradiation (kWh/m2)
Total irradiation (kWh/m2)
AMBULONG
0.0
1.0
2.0
3.0
4.0
5.0
6.0
Jan Feb Mar Apr May Jun Jul Aug Sep Oct Nov Dec
Irra
diat
ion
(kW
h/m
2/da
y)
Global irradiation (kWh/m2)
Total irradiation (kWh/m2)
CATARMAN
0.0
1.0
2.0
3.0
4.0
5.0
6.0
Jan Feb Mar Apr May Jun Jul Aug Sep Oct Nov Dec
Irra
diat
ion
(kW
h/m
2/da
y)
Global irradiation (kWh/m2)
Total irradiation (kWh/m2)
6
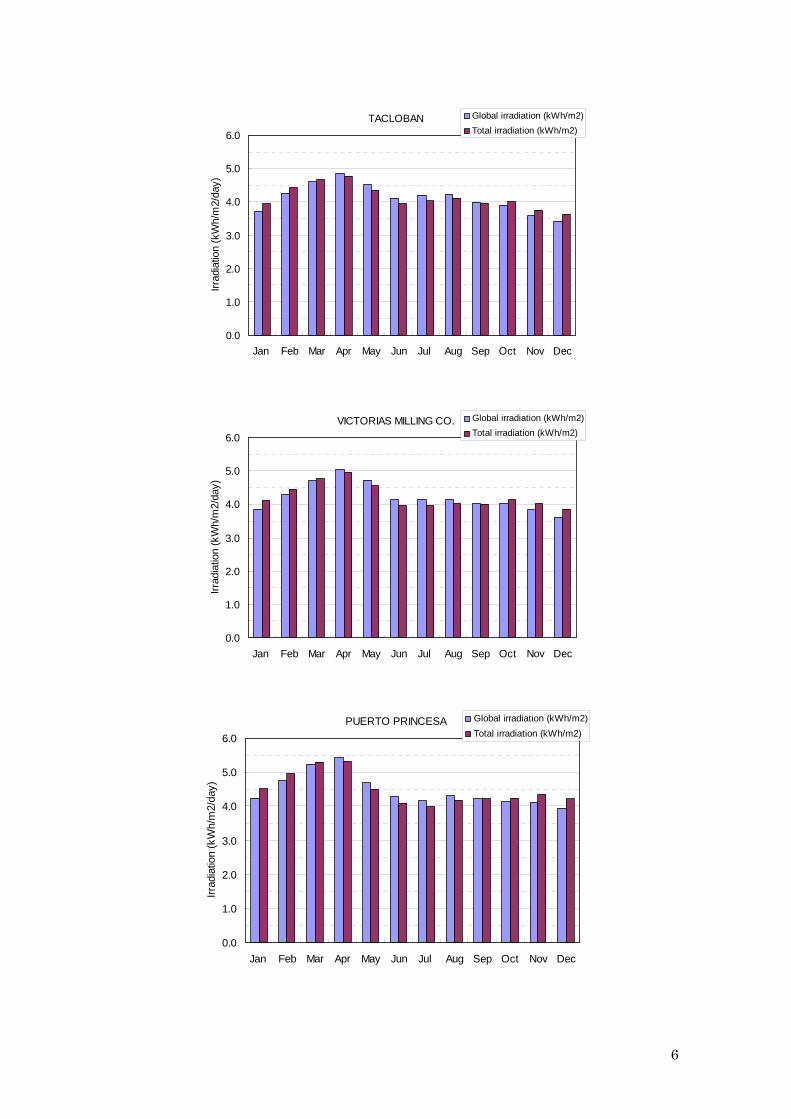
TACLOBAN
0.0
1.0
2.0
3.0
4.0
5.0
6.0
Jan Feb Mar Apr May Jun Jul Aug Sep Oct Nov Dec
Irra
diat
ion
(kW
h/m
2/da
y)
Global irradiation (kWh/m2)
Total irradiation (kWh/m2)
VICTORIAS MILLING CO.
0.0
1.0
2.0
3.0
4.0
5.0
6.0
Jan Feb Mar Apr May Jun Jul Aug Sep Oct Nov Dec
Irra
diat
ion
(kW
h/m
2/da
y)
Global irradiation (kWh/m2)
Total irradiation (kWh/m2)
PUERTO PRINCESA
0.0
1.0
2.0
3.0
4.0
5.0
6.0
Jan Feb Mar Apr May Jun Jul Aug Sep Oct Nov Dec
Irra
diat
ion
(kW
h/m
2/da
y)
Global irradiation (kWh/m2)
Total irradiation (kWh/m2)

7
CAGAYAN DE ORO
0.0
1.0
2.0
3.0
4.0
5.0
6.0
Jan Feb Mar Apr May Jun Jul Aug Sep Oct Nov Dec
Irra
diat
ion
(kW
h/m
2/da
y)
Global irradiation (kWh/m2)
Total irradiation (kWh/m2)
DAVAO
0.0
1.0
2.0
3.0
4.0
5.0
6.0
Jan Feb Mar Apr May Jun Jul Aug Sep Oct Nov Dec
Irra
diat
ion
(kW
h/m
2/da
y)
Global irradiation (kWh/m2)
Total irradiation (kWh/m2)
ZAMBOANGA
0.0
1.0
2.0
3.0
4.0
5.0
6.0
Jan Feb Mar Apr May Jun Jul Aug Sep Oct Nov Dec
Irra
diat
ion
(kW
h/m
2/da
y)
Global irradiation (kWh/m2)
Total irradiation (kWh/m2)

1
Department of Energy
Energy Complex Merritt Road, Fort Bonifacio, Taguig City, Metro Manila
TEL: 479-2900 FAX: 840-1817