Embed Size (px)
Citation preview

2014PRODUCTION OF SMALL GRAINS IN THE SUMMER RAINFALL AREAARC-Small Grain Institute
GUIDELINEGUIDELINE


1
GUIDELINES FOR THE PRODUCTION OF SMALL GRAINS
IN THE SUMMER RAINFALL REGION
2014
Compiled by:
ARC-Small Grain Institute
University of the Free State
SAB Maltings (Pty) Ltd
The information in this booklet is the result of scientifi c research and is supplied in good faith.
The institutions involved therein disclaim any legal liability as a result of the implementation of
recommendations in the booklet.
© Copyright: Agricultural Research Council
ISBN 978-1-86949-628-9
Coordinated and edited by:
Elri Burger
Data Editing
Willlem Kilian
Design, Layout and printing:
Shereno Printers
Tel: (011) 894 4150
ARC-Small Grain Institute would like to thank the Winter Cereal Trust
for the fi nancial support from which the research results were determined.

2
INDEX
Foreword 4
Acknowledgements 5
General Crop Management 6
Crop rotation management 7
Long-term rotations require planning 7
Management of Wheat Production 9
What determines wheat yield? 9
Growth stages 11
Factors infl uencing yield components 16
Establish target yields 16
Achieving target yields 17
Soil tillage guidelines 20
Conventional tillage 20
Conservation tillage 21
No-till (Direct seeding) 22
Guidelines for Small Grain Cultivar Choice 26
Plant Breeders’ Rights (Act 15 of 1976) 26
Seed certifi cation and Table 8, as described in the Plant Improvement Act 26
Factors determining cultivar choice 27
Recommendations and Summary of Results – 2013 32
Characteristics 33
Planting dates and seeding rates 36
Summary of results obtained during 2013 40
Fertilisation guidelines for wheat production 110
Soil sampling for analysis 110
Soil acidity 111
Nitrogen fertilisation 114
Phosphorus fertilisation 118
Potassium fertilisation 119
Micro nutrients 120

3
Adjuvants and Herbicides 122
Insect control 127
Diseases of Small Grains 134
Guidelines for the production of malting barley under
irrigation 148
Soil preparation 148
Cultivars 149
Agronomic characteristics 149
Planting practices 150
Fertilisation 153
Post seeding practices 154
Harvesting 156
Quality 157
Oat production in the summer rainfall region 162
Grazing, silage and hay production 162
Grain production 162
Grain quality 162
Seed size 163
Problems in oat production 168
ARC-Small Grain Institute Services 171
Information 174
4
FOREWORD
That the wheat and barley industries in South Africa are under signifi cant pressure to become
more competitive and profi table for the producers, is probably the understatement of the year.
As a result, the hectares under wheat production reached an all-time low the previous season.
Reasons behind this phenomenon are many fold, amongst others are that we do not realise
the high intrinsic quality value of our wheat crop in monetary terms, that the cultivars at our
disposal are lacking in competitive yields and that the varying climate also play a signifi cant
role.
Then came the 2012/2013 harvesting season and on the back of a similar 2011/2012 season
(excluding the Free State) proved beyond any doubt that our recommended dryland and
irrigation wheat cultivars have the genetic potential to yield up to four tons and nine tons to
the hectare respectively. For the fi rst time in many years this was backed-up by a signifi cantly
higher and more competitive wheat price. As a result, the wheat production regained its
competitiveness to some extend in the Western and Southern Cape, both the warmer and
cooler irrigation areas as well as certain parts of the Eastern and North-Western Free State.
Wheat production needs to increase this level of competitiveness even in relation to maize,
soybeans and canola production. In addition we realised that the genetic potential to achieve
this is available in the cultivars available to us, but then we need to use them wisely.
In achieving this, the 2014 Guidelines for the Production of Small Grains by the Small
Grain Institute as proven by its many annual predecessors, is a most important decision-
making database. The information, which is based on sound objective and scientifi cally proven
replicated trials (2-4 years data) is representative of all major production areas and will assist
you to make the correct cultivar choice for your specifi c production area.
Performance data of each cultivar is supported by disease, insect and weed control information
as well as related crop production practices, soil, water and fertilisation management
recommendations. This publication will certainly lower your risks and increase your productivity
and cost efficiency.
Most importantly, do remember that productivity and profi tability are not measured in tons/
ha, but in profi t/ha. Only the latter will ensure our competitiveness.

5
ACKNOWLEDGEMENTS
Specialist contributions to this publication were prepared by the following professional officers:
Gawie Kotzé Barley SAB Maltings (Pty) Ltd
Dr Justin Hatting Programme Manager Crop Protection
Dr Goddy Prinsloo Entomologist Crop Protection
Dr Vicki Tolmay Entomologist Crop Protection
Dr Astrid Jankielsohn Entomologist Crop Protection
Prof Sakkie Pretorius Head of Dept University of the Free State
Willem Kilian Programme Manager Production Practices
Dr André Malan Programme Manager Plant Improvement
Cathy de Villiers Plant Pathologist Crop Protection
Dr Annelie Barnard Plant Physiologist Production Practices
Dr Sandra Lamprecht Plant Pathologist ARC-Plant Protection Inst.
Gert van Coller Plant Pathologist Dept. of Agric, Elsenburg
Hestia Nienaber Weed Scientist Crop Protection

6
GENERAL CROP MANAGEMENT
The aim of this publication is to highlight the management of the wheat crop in a sustainable
crop rotation system to increase the competitiveness of the crop. Although there is not one
single best management practice for all situations, this publication will discuss the principles
of the growth and management of the wheat crop, so that applicable management decisions
can be made as the specifi c situation arises.
The major consideration in dryland wheat production is profi tability. The traditional wheat-
fallow-wheat system that had been followed for many years had become unprofi table, mainly
due to soil water availability restrictions and increased disease occurrence. This system has also
led to degradation of soils via decreased organic carbon (humus), and increased soil acidity
and soil erosion. Increased profi tability can only be achieved by maximising the yield potential
of the crop/soil/climate combination, while input costs are also strictly managed.
In striving to achieve greater productivity with the available resources invested in crop
production, and not necessarily higher total production, it is important to consider a few basic
principles of crop management.
• Soil selection is critical, requiring each land to be reviewed individually to realise its
potential;
• Analyse soil samples to evaluate the fertility status of the soil;
• Follow an eff ective liming program;
• Do fertilisation planning including all important plant mineral elements;
• Apply appropriate soil cultivation methods. These include: alleviation of compaction
layers, crop residue management, weed control and seedbed preparation, with the main
aim of maximising soil water conservation in the soil profi le. Each soil cultivation input
must have a specifi c objective;
• Plant a number of cultivars with a high yield potential and relevant disease and insect
resistance;
• Calibrate planters to ensure the correct seeding density, fertiliser application and
planting depth for seed germination;
• Select the optimal planting time for a particular cultivar, and plant at the recommended
seeding density to ensure optimal emergence and seedling establishment;
• Follow an eff ective spraying programme for control of weeds, insects and diseases
during the growing season;
• Timely harvest of the crop and post-harvest storage can impact on optimal yield and
grain quality;
• Eff ective marketing of the grain for successful fi nancial management.

7
Crop Rotation Management
From an economical and agronomical viewpoint it is benefi cial to cultivate wheat in a suitable
crop rotation system. Grain yields are increased, while weed, insect and disease problems are
reduced.
Yield limiting factors
The major factors that limit crop yields are:
• Unsuitable soil selection;
• Restricted soil water availability and climatic stresses;
• Low soil fertility and nutritional defi ciencies;
• Plant diseases;
• Weed competition;
• Insects;
• Sub-optimal planting dates and cultivar choices;
• Poor seed germination and crop establishment.
These factors arise because of poor cultivation methods, inappropriate soil selection and low
water retention practices, soil water accumulation, and crop rotation.
Long-term rotations require planning
Good crop rotation planning is the single most important management practice determining
yields and profi tability. It is an investment in risk aversion. A well planned and managed crop
rotation system decreases input costs, increases yields and spreads production risks.
What is the best crop rotation system?
There is not one single crop rotation system that will be suitable for all production regions.
Every farmer must plan and develop a long-term system that is adaptable and sustainable,
incorporating the principles of agronomic management and farm planning. The choice of
crop for each fi eld must be based on an objective determination of gross income, input costs,
fi eld, and crop rotation history.
A crop rotation system for any given situation will be determined by:
• The objectives and attitude of the farmer;
• The diff erent enterprises on the farm and relevant commodity prices;
• The cash fl ow and economics of the cultivated crops;
• Agronomic management principles;
• Soil depth, structure and texture;

8
• Soil fertility status and acidity;
• Total rainfall and distribution in the growing season;
• Spectrum of weeds occurring in the fi elds;
• The rotation of nitrogen fi xing and nitrogen dependent crops;
• Occurrence of plant diseases;
• The prevention in the build-up of soilborne diseases;
• Available machinery and equipment;
• Livestock needs and fodder fl ow requirements.
Benefi ts of a sustainable crop rotation system
Reduced diseases
A factor emerging as a major threat to wheat yields and thus income in recent years, is the
increasing incidence of root diseases. The only practical control strategy is a well planned and
managed crop rotation system, which is aimed at eliminating annual grasses and volunteer
wheat, which may serve as a source of inoculum for these diseases at least 12 months prior to
crop establishment.
Decrease weed burden
Weeds compete with crops for water, nutrients, sunlight, and fi eld space and can signifi cantly
reduce yields. Weeds limit grain yields by approximately 20% annually. By alternating crops
and rotating herbicides, it is possible to control a wider spectrum of weeds. Eff ective weed
control in one crop often means that the following crop can be grown without the need
for expensive selective herbicides. Rotating crops and herbicides reduces the potential for
herbicide resistance to develop in target species, for example wild oats. This can also reduce
the potential for herbicide residue accumulation in the soil.
Increased soil fertility
The aim of a suitable crop rotation is to include a nitrogen-fi xing crop (legumes) that replenishes
the nitrogen exploited by the grain cropping phases. Yield and grain protein increases in
wheat, following legume crops have been widely demonstrated. The accumulation of soil
organic material and residual nitrogen in the soil, is linked to the recovery of soil structure and
increased soil water accumulation capability, which in turn favours improved yields.
Increased profi ts
The inclusion of a legume in the crop rotation system generally increases profi tability by
increasing grain yields. Economic sustainability is also ensured, because production risks are
spread over different crops and growing seasons.

9
MANAGEMENT OF WHEAT PRODUCTION
Good yields and profi tability can only be achieved through careful planning and management.
Higher yields imply higher profi ts, since production costs per ton of grain declines relatively
as yields increase.
Avoid having an infl exible approach to crop management. Learn to adapt and revise
management strategies as the cropping environment, yield potential, commodity prices and
input costs changes.
What determines wheat yield?
Total grain yield per hectare is the result of:
• The number of plants per hectare;
• The number of ears per plant;
• The number of grains per ear;
• Individual grain weight.
Above-mentioned yield components and eventually grain yield is determined during the three
main development phases and relevant growth stages. It is possible that a yield component
that kicks in at a later growth phase, partially compensate for reductions in a yield component
determined at an earlier development stage. The development stages for the diff erent yield
components overlap to some degree in their respective eff ect on potential grain yield, and
they are determined in a defi nite sequence, as indicated in the following schematic representation
(Figure 1).

10
Figu
re
1.
Gro
wth
an
d de
velo
pmen
t st
ages
of
w
heat
dur
ing
the
grow
ing
seas
on
*Ad
ap
ted
fro
m:
• O
hio
Ag
ron
om
y g
uid
e 14
th
edit
ion
.
Bu
lleti
n 4
72-0
5.
• Sl
afe
r & R
aw
son
, 199
4
• W
hea
t gro
wth
an
d
ph
ysio
log
y.A
.Ace
ved
o, P
.Silv
a
& H
.Silv
a, 2
002.
FA
O C
orp
ora
te
do
cum
ent r
esp
osi
tory
(ww
w.fa
o.o
rg).
• B
rea
d w
hea
t, 20
02 (B
.C.
Cu
rtis
, S. R
aja
ram
& H
.Go
mez
Ma
cPh
erso
n, e
ds.
) FA
O P
lan
t
Pro
du
ctio
ns
an
d P
rote
ctio
n
Seri
es, n
o 3
0, R
om
e, 2
002.

11
Growth stages (sketches according to dr Gideon Joubert)
GS1 GS2 GS3 GS4
GS5 GS6 GS7 GS8
GS9 GS10 GS11 GS12

12
Growth stages (continued)
GS13 GS14 GS15 GS16
GS17 GS18 GS19 GS20

13
Growth Stages (continued)
Gs 21 Gs 22
Gs 23
Gs 24 Gs 25
GS21GS22
GS23
GS24
GS25

14
Growth stages (photos by Robbie Lindeque)
Gs 2
Gs 3 Gs 4
Gs 5 Gs 6 Gs 7
Gs 8 Gs 9 Gs 10
Gs 11 Gs 12 Gs 13
GS2
GS5
GS8
GS11
GS3
GS6
GS9
GS12
GS4
GS7
GS10
GS13

15
Growth stages (continues)
Gs 14
Gs 18Gs 17
Gs 15 Gs 16
Gs 19
Gs 20 Gs 21 Gs 22
Gs 23 Gs 25Gs 24
GS14
GS17
GS20
GS23
GS15
GS18
GS21
GS24
GS16
GS19
GS22
GS25

16
Factors infl uencing yield components
Management phase Factors Yield components
Planting Seed density (kg/ha)
Thousand kernel mass
Seed germination percentage
Seed vigour
Coleoptile length
Soil structure and texture
Seedbed preparation
Soil water content at planting
Planting method / depth
Fertiliser application at planting
Seed treatment
Number of plants
established per
hectare
Vegetative and
reproduction phase
Cultivar
Planting date
Soil fertility (N, P, K, pH)
Soil water availability
Temperature (minimum and maximum)
Insects / weeds / diseases
Number of tillers/
ears per hectare
Grain fi lling Cultivar
Nitrogen availability
Soil water availability
Temperature (maximum and /or cold damage)
Diseases/insects
Grains per ear and
single grain mass
Establish target yields
Set a realistic target yield for your cropping programme, taking into consideration all the
available resources. Target yields form the foundation for crop management decisions.
Cultivar selection, fertiliser rates, herbicide and insecticide applications and especially the yield
planning and other management decisions can only be made with the aid of target fi nancial
objectives.
Various factors should be considered when setting a target yield:
• Experience: historical yield data of the past fi ve years;
• Plant available water: sum of stored soil water at planting plus average growing season
eff ective rainfall; and
• Use long-term climate projections.
The risk associated with your selected yield target should be carefully considered. Profi t is the
compensation for taking risks, but be realistic: certain management practices and target yield
goals have a higher risk component.

17
Achieving target yields
The key management decisions to achieve target yields and to maximise profi ts include the
following:
• Total farm planning including soil selection;
• A well planned crop rotation system;
• eff ective management of plant available soil water;
• soil analysis for a relevant fertilisation and liming programme;
• Setting realistic target yield;
• Application of eff ective soil cultivation practices;
• Informed cultivar selection;
• Use of high quality seed;
• correct planting dates and seedling densities of selected cultivars;
• Appropriate planter speed and planting depth;
• monitor the crop development and note observations;
• make timely decisions on weed, insect and disease control;
• timely harvest of grain crop ;
• Develop a fi nancially sound marketing strategy;
• Apply sound agronomic management principles.

18
• A leading provider of quality local and internationally formulated products distributed through the majority of agrochemical dealers.
• Multi-million rand investment annually in research and development.
• More than 200 registered products,
circumstances.• For two decades your partner in
successful crop production.
fungicides • plant growth regulatorsinsecticides • herbicides adjuvants • foliar feeds
Cost Effective, Comprehensive Crop Protection
59
09
Villa Crop Protection (Pty) Ltd | Reg No 1992/002474/07Head office: 65 Botes Road, Glen Marais, Kempton Park, South Africa | Tel: (+27 11) 396 2233Tel: (+27 87) 740 3490 | Fax: (+27 86) 677 3175Kempton Park depot: 69 Fried Road, Glen Marais, 1619 | Tel: (+27 11) 396 2233Tel: (+27 87) 740 34090 | Fax: (+27 11) 396 1943Cape depot: 3 Marchand Street, Wellington, 7655 | Tel: (+27 21) 873 6892 | Fax: (+27 21) 873 6173
www.villacrop.co.za

19

20
SOIL TILLAGE GUIDELINES
Soil is cultivated to produce favourable conditions for establishment of the wheat crop. Such
conditions include soil in which sufficient water is stored for germination and early plant
development. This is achieved by maximising the amount of water that infi ltrates the soil and
by reducing weeds and volunteer plants growing during the water-harvesting season. Tillage
is also used to eliminate compaction and manage excess stubble.
Traditionally, weeds were controlled by means of mechanical cultivation such as ploughing
with a mouldboard plough (conventional tillage) or by means of shallow cultivation with the
aim to kill weeds while retaining stubble on the surface (conservation tillage). Another planting
method, namely minimum-till (also called no-till) in which the seed is directly sown in untilled
soil, has become available due to cost eff ective means of killing weeds with broad spectrum
herbicides (chemical cultivation) and the availability of planting machines that can be used in
high stubble conditions. Whichever system the producer chooses, good crop establishment
and economical factors remain the main issues that need to be considered.
Conventional tillage
Conventional tillage is recommended for a wheat-on-wheat cropping system in which the risk
of root disease is high and the risk of wind and water erosion minimal. The use of a mouldboard
plough causes the top soil layer to be inverted and leaves virtually no stubble on the soil
surface. It eff ectively kills germinated weeds but brings weed seeds from deeper layers to
the soil surface where it germinates. Mouldboard ploughing should always be followed with
secondary cultivation to get rid of clods and new weed infestations.
Conventional tillage is usually carried out in the following manner: Step 1: Harvest (December
- January)
Step 2: Disc as soon as soil conditions allow. If a lot of residue is left on the surface, repeat. In
years of exceptional straw (> 3,0 ton/ha grain yield), burning of the residue can be considered.
Step 3: Plough between end of January and end of February in the drier areas and between
mid February and the end of March in the wetter areas. The timing of the cultivation depends
on the soil water situation. Ploughing must be done so that there is a good chance to still
receive substantial rain after the cultivation to replace water lost during the operation. On
the other hand, ploughing must be left as late as possible so that the minimum subsequent
cultivations will be needed for weed control. If possible, the plough must be fi tted with a row
of small tines at the rear, or a harrow must be attached in order to seal the surface layer and
break clods behind the plough.
Step 4: A sweep or harrow should be used directly behind the plough, or as soon as possible
after ploughing, to break clods and to seal the surface layer to prevent evaporation.
Step 5: Shallow sweep cultivations may be used to prepare the seedbed and to control weeds,
when necessary

21
Step 6: Plant according to guidelines. If possible, use a planter fi tted with tines for the following
reasons: eff ective band placing of fertiliser in wet soil to enhance uptake by the roots and
breaking of shallow compacted soil layers caused by tillage after ploughing.
It is important to adjust the press-wheel according to the moisture situation in the soil. The
drier the soil, the greater the pressure that must be applied.
Conservation tillage
Conservation tillage is highly recommended in all areas where the risk of wind and/ or water
erosion is high, because of the low clay content of these soils. These areas are usually less prone
to the root disease, “Take-all”, as the rainfall is lower and the soils are well drained. Conservation
tillage can also give good results in high rainfall areas if used in a crop rotation system where
wheat is alternated with diff erent crops. Wheat should never be planted in half incorporated
wheat straw in high rainfall areas and under irrigation. Under dryland conditions farmers in the
North Western Free State producing on deep sandy soils on a shallow water table, have been
implementing reduced tillage successfully for many years. A dry climate, high yield potential
and resulting high residue levels are ideally suited to reduced tillage systems. Conservation
tillage may be carried out in the following manner:
Step 1: Harvest (November - December)
Step 2: Weed control (if soil moisture permits) with a harrow, sweep or V-blade depending
on the amount of residue required on the soil surface. Chemical weed control may be used
instead of cultivations.
Step 3: Deep tillage in March or April with a tine implement (ripper/chisel plough) to break
compacted layers, if needed. Timing is essential in order to reduce the number of secondary
cultivations, as all further cultivation will re-compact the soil. If possible a roller should be fi tted
to the implement in order to seal the soil surface after the operation.
Step 4: Seal the soil surface directly after or as soon as possible after deep tillage with a sweep,
harrow or V-blade (if roller is not fi tted to tine implement).
Step 5: Control weeds and prepare the seedbed with a shallow tillage just before planting, if
necessary.
Step 6: Plant according to guidelines. If possible use a planter fi tted with tines for the already
mentioned reasons.
The amount of straw left on the surface at planting should be determined by the risk for water
and wind erosion. In high risk areas, as much as possible must be left on the surface in order
to break wind speed and limit run off water. However, excessive straw will cause problems at
planting as it will pack between the planter units.

22
No-till (Direct seeding)
The increasing use of crop rotation systems and the development of new technology has
created new opportunities to implement direct seeding systems successfully. The current high
cost of diesel and the reduction in the price of glyphosate based herbicides, makes reduced
tillage methods even more attractive to producers.
No-till has been established successfully in many areas in South Africa, including some parts
of the Winter Rainfall Region and some irrigation schemes, especially in KwaZulu-Natal. In the
Eastern Free State the use of these systems is more problematic due to high disease pressure,
but with good management these problems can be overcome.
One of the main aims of direct seeding is to minimise disturbance of the soil surface in order
to prevent surfacing and germination of new weed seeds and to maximise covering of the
surface by residue. This further suppresses the germination of weeds and enhances the uptake
of water by the soil. A properly functioning no- till planter is then used to open a narrow slot
by pushing away crop residues from the plant row. Ideally a tine is used for proper fertiliser
placement and breaking of surface and sub-soil compaction.
What are the secrets for successful implementation?
Crop rotation
Direct seeding can only be established within crop rotation systems, whether in double
cropping under irrigation or in multi-year rotations as found under dryland production in the
Summer Rainfall Area. Monoculture quickly leads to the build-up of diseases, pests and weeds.
The abundance of suitable substrate in the form of crop residue, will increase the risk of these
problems even further.
Residue cover
Sufficient residue cover is a prerequisite for any direct seeding system to function properly.
Without sufficient residue cover of at least 30%, none of the advantages of the system, except
maybe fuel saving, can be achieved while most of the disadvantages are still likely to occur.
Research has clearly shown that residue partially mixed into the soil has a negative impact on
production and that for success to be achieved the residue must remain on the surface and be
as evenly spread as possible. To achieve this goal the use of residue spreaders on the combine
harvester is of utmost importance. In marginal areas where insufficient residue is produced by
the crop itself, cover crops can be used as a possible solution to the problem.
Micro-organisms and roots
The work of the plough in direct seeding systems is replaced by the activity of earthworms,
micro-organisms and degeneration of plant roots. The activities of these organisms create
channels in the soil through which the soil is aerated and through which water can penetrate
the soil. The accumulation of organic material that also takes place, increases soil fertility and
improves the physical structure of the soil. Unfortunately it takes a long time for populations of
these organisms to build up to levels at which this work is done eff ectively - a time during which

23
the crop may look worse than usual and yields may drop. Producers who have persevered
using direct seeding, affirm that a turning point is achieved when soil conditions improve and
yield increases accordingly.
What problems can be expected?
Pests and diseases
Some pests and diseases fl ourish when high residue cover is present and monitoring, planning
and management has to be at much higher levels than for conventional methods. As an
example the weed spectrum can change, pests that were not serious in the past can become
important and diseases like take-all and Septoria can suddenly appear. As already mentioned,
crop rotation is one of the most important factors in the control of pests and diseases and
must always be an integral part of any direct seeding system.
The use of agro-chemicals can be expected to increase due to the foreseeable increase in pests
and diseases. One of the cornerstones of direct seeding is the use of broad spectrum herbicides
such as glyphosate to replace shallow tine cultivations. As always, all agro-chemicals should be
used according to the instructions on the label and producers must be aware of the increased
risks associated with their use.
Nutrient disorders
Thick residue covers can induce the accumulation of nutrients to toxic levels in the topsoil.
These relationships have not been fully investigated and more research is needed to establish
the relationship between the uptake of calcium, magnesium, potassium and other nutrients,
especially under irrigation.
Reduction of seedling vigour
It is well known that seedling vigour decreases under direct seeding conditions. This is
associated with the lower soil temperatures experienced by the plant due to the residue cover.
Using slightly higher seeding rates that will result in a marginal cost increase, can compensate
for this. Improved planting methods, especially when suitable seeding equipment is used
instead of broadcasting, can dramatically reduce the seeding rate.
Increase in nitrogen fertilisation
The risk of a nitrogen negative period is increased due to the residue on the surface and lower
levels of nitrogen recycling in the system as a result of less cultivation. Application of nitrogen
during planting must be sufficient to ensure that the young plant has access to sufficient levels
of the nutrient. This implies that slightly higher levels of nitrogen will be used in comparison
to conventional tillage. Once again, nitrogen levels can be lowered if fertiliser application is
switched to more accurate band placing and if nitrogen applications are split.

24
Yield reduction
Most producers experience an initial reduction in yield when making the change to direct
seeding. However, when the saving on input costs is taken into account, direct seeding
remains profi table in most cases. These yield reductions can usually be linked to problems
with compaction and/or diseases. Once the presence of compacted layers are established,
these layers will have to be broken by using a suitable tine implement. After that, the producer
can continue with direct seeding.
One of the factors that the farmer must take into account is that his fi elds may not seem
as homogeneous as they did before direct seeding, especially with regards to plant height
and colour. This can be limited to the minimum by addressing all abovementioned problems
and by creating optimum growing conditions for the plant. Application of precision farming
principles to address problem areas will be particularly helpful.
What are the pitfalls?
Acidity
One of the main problems farmers practising direct seeding have to deal with, is soil acidity.
Once in a direct seeding system, it is difficult for the farmer to make a decision on the need to
cultivate the land in order to incorporate lime. It is therefore of utmost importance to correct
the soil pH to optimal levels before changing over to the direct seeding system. Afterwards
re-acidifi cation needs to be managed and checked on a regular basis to prevent the situation
deteriorating to dangerous levels. This principle also applies to phosphate and potassium.
Compaction
Direct seeding does not imply no-traffic - as a matter of fact, no-till fi elds still carry quite regular
traffic in the form of heavy combine harvesters, planters, fertiliser applicators and spraying
equipment. The inclusion of controlled traffic will therefore be advantageous. Compaction
can further be minimised by carefully regulating tyre size and pressure and by making use of
aerial applications where possible. Attention to creating optimum circumstances for biological
activity, optimal root development as well as good crop rotation (crops with diff erent types of
root systems) will help to reduce the rate of compaction. When compaction however becomes
a limiting factor, it must be alleviated by deep tillage with tines.
The animal factor
Due to the need for residue cover, direct seeding systems do not usually integrate well with
the animal factor. Fields used for direct seeding should not be grazed due to the loss of residue
cover that will occur and the compacting eff ect of the animals. The exception to this is the
grazing of clover in the winter rainfall region due to practical considerations. Changing to
direct seeding infl uences the whole farming system and not just the fi elds that are included.
Incorporating cover crops, which can be harvested , can be used to supplement fodder,
particularly if they are planted after the summer crop.

25
Where does one start?
It makes a lot more sense to ‘’grow into” direct seeding system rather than to try and change
the whole farming system at once. As there are currently still many unanswered questions,
producers are encouraged to identify a particular fi eld, preferably one close to the house,
which can be monitored daily. Problems should be discussed with other producers and
agriculturists and the producers should adopt a “learn as you go ” approach. Remember there
are currently no real “experts” to consult or any fi xed recipes to follow. In many cases, common
sense will provide the best route to follow.
What are the responsibilities?
• As stated earlier, the following conditions are extremely important before you start
implementing a direct seeding system:
• All limiting soil factors must be eliminated beforehand, especially soil acidity.
• No compaction must be presented in any soil layer.
• A well worked out crop rotation system must be available to ensure crop establishment,
• Fencing must be in place to prevent animals from grazing in the no-till fi elds.
• The producers must have access to a crop sprayer in order to replace cultivations for
weeds control (sweep, shallow tine) with a herbicide application.
Cover crops
In cases where there is not enough residues available the use of cover crops to produce enough
material can be considered. This may be especially relevant for dryland conditions where long
fallow periods occur and crop residue disappears quickly during the summer months. These
cover crops can, if harvested, also contribute towards the fodder fl ow programme.
Summary
Soil tillage is one of the important production practices over which the farmer has full control.
The eff ect of tillage cannot be predicted for a season. Therefore the farmer has to plan his
actions to solve specifi c problems. Unnecessary cultivations cost money, time and eff ort, while
valuable soil water is lost in the process. Such cultivations also cause recompaction, that has
to be addressed later.

26
GUIDELINES FOR SMALL GRAIN CULTIVAR CHOICE
Cultivar choice is an important production decision and if planned correctly, could contribute
greatly to reducing risk and optimising yields. The decision is complicated by all the diff erent
factors that contribute to the adaptability, yield potential, agronomic characteristics and disease
risks of the current commercially available cultivars. The correct cultivar choices contribute to
management of risk and achieving optimal grain yield in a given situation.
To fully utilise this cultivar diversity and to make an informed decision, it is important that
the producer know the benefi cial and limiting characteristics of each cultivar. For this reason,
additional information regarding cultivar characteristics, long-term yield data and relative
yields are made available to the producer.
There are a few important guidelines that the producer must consider when deciding on
cultivar choice:
• Plant a range of cultivars to spread production risks, especially in terms of drought and
disease occurrence;
• Utilise the optimum planting spectrum of the cultivars in an area;
• Do not, within one season, replace a well-known cultivar with a new and unknown
cultivar. Rather plant the new cultivar alongside the stalwart for at least one season to
compare them and to get to know the new cultivar;
• Cultivars that are able to adapt to specifi c yield potential conditions should be chosen;
• Revise cultivar choice annually to adapt to changing circumstances, as well as to
consider new cultivars; and
• Take the disease/insect resistance levels as well as the quality characteristics of each
recommended cultivar into consideration when fi nalizing your cultivar choice annualy.
Plant Breeders’ Rights (Act 15 of 1976)
This act renders legal protection to breeders and owners of cultivars. The awarding of rights
procedure stipulate that cultivars must be new, distinguishable, uniform and stable, and
protection is granted for a 20 year period. The rights of the owner/breeder entail that no party
may multiply propagating material (seed), process it for planting, sell it, import it, export it and
keep it in stock without the necessary authorization or license of the holders of right. The act
makes provision for the court to grant compensation of R10 000-00 to the holder of the Plant
Breeders’ Rights in cases of breaching of rights.
Seed certifi cation and Table 8, as described in the Plant Improvement
Act
The main aim of certifi cation of seed is to ensure the proper maintenance of cultivars. Seed
laws and regulations prescribe the minimum physical requirements, while certifi cation of
seed strives to achieve high standards of genetic purity and other quality requirements. Seed
certifi cation is a voluntary action that is managed by SANSOR on behalf of the Minister of

27
Agriculture. However, if a cultivar is listed in Table 8, it is subject to compulsory certifi cation. This
scheme specifi cally guarantees cultivar purity, as well as good seed quality, renders protection
and peace of mind to the buyer (producer), as well as an improved control system for acting
on complaints and claims. The costs involved are a minimal price to pay for peace of mind to
both buyer and seller of certifi ed seed.
Remember that all retained seed looses the accountability of owner of the cultivar in relation
to seed quality and performance of the cultivar.
Factors determining cultivar choice
Cultivar choice is an economic decision by which the producer aims to achieve the highest
return with the lowest risk. Factors determining cultivar choice are thus fundamental to this
decision. The most important factors are briefl y discussed and for this reason a table is included
that characterise the released cultivars.
Yield potential
The genetic yield potential of the available cultivars is higher than the yields currently realised
under commercial conditions. These diff erences in yields are mainly due to environmental
conditions (climatic and production conditions), crop management decisions, disease, insect
and weed pressures.
Cultivars diff er in their yield reaction to changing yield potential conditions. Some cultivars
perform better at a lower yield potential, while others utilise higher potential conditions better.
The ideal cultivar would yield the highest at all yield potential conditions. This would indicate
excellent adaptability, but usually high yield is negatively related to other economically
important factors, such as protein content, baking quality and hectolitre mass. It is especially
important that under dryland conditions the producer should know the yield potential of his
farm and fi elds according to soil, climate and managerial ability. Thereby a realistic target yield
can be determined, that will aid cultivar choice and also other production options like fertiliser
planning.
Grading and quality
According to the grading system promulgated under the Act on Agricultural Products, only
one bread wheat class exists with four grades, namely B1, B2, B3 and B4, that are determined
according to the protein content of the grain, the hectolitre mass and the falling number (Table
1). Hectolitre mass and especially protein content are largely determined by the environment
during the grain fi lling period to maturity, and also by management practices including soil
water and fertiliser management.

28
Table 1. Classes and grades of bread wheat
Grading regulation for Bread wheat - Class B
GradeMinimum protein
(12% moisture)Minimum hectolitre
mass (kg/hl)
Minimum fallingNumber (seconds)
B1 12 77 220
B2 11 76 220
B3 10 74 220
B4 9 72 200
Utility 8 70 150
Class othersDo not comply to the above-mentioned or any other grading
regulations
All bread wheat cultivars mentioned in these guidelines qualify for all grades depending on the protein content, hectolitre mass
and falling number.
Hectolitre mass
Hectolitre mass is a density parameter, and gives a direct indication of the potential fl our
extraction of the grain sample. Flour extraction is a critical parameter to the miller as it largely
infl uences profi tability.
Hectolitre mass is therefore part of the grading regulations that determines the grade of the
grain delivered. Although this characteristic is genetically associated with a particular cultivar,
it is aff ected by environmental conditions during the grain fi lling period. In particular in regions
where extreme soil water and heat stresses occur during this critical period, when continuous
rain events happen during harvest, and when diseases like rust and head blight infect the
crop, losses can be suff ered due to the downgrading of the grain, because of low hectolitre
mass values. The large price diff erences between the B-grades and Utility grade can therefore
infl uence cultivar choice if these conditions occur regularly in a specifi c region. Optimum soil
water and temperature conditions during grain fi lling also favour the development of high
hectolitre mass values.
Grain protein content
A high protein content (>11%) is necessary to ensure that the commercial bakery can produce
a loaf of bread that will meet consumer requirement. Therefore grain protein is part of the
grading regulations of harvested grain. The cultivars available for commercial production have
acceptable genetic grain protein composition, but grain protein content is determined by the
relationship between nitrogen availability and grain yield, which is aff ected by management
practices, in particular fertilisation.

29
Falling number
Falling number is an indication of the alpha-amylase enzyme activity in the grain. High alpha-
amylase activity (low falling number) is an indication that the starch molecules have to a large
extent been broken down to sugars (maltose especially) and that such grain is unacceptable
for commercial milling and baking purposes.
Preharvest sprouting tolerance
This refers to the tolerance a cultivar has against germination in the ear during physiological
maturity prior to harvesting. Genetic variation exists between cultivars for preharvest sprouting
resistance. It is important to note that none of the available cultivars will sprout in the ear
under normal conditions. Certain cultivars are, however, more prone to preharvest sprouting
than others under continuous rain and high humidity conditions during the harvest period.
Diseases and insects
The occurrence of diseases and insects in a region and the susceptibility of cultivars to
these diseases and damage by insects must be considered in cultivar planning. In this way,
risk and input costs (chemical spraying costs) can be reduced (see the Diseases and Insect
Control Section). Keep in mind that the intensity can change from year to year and in certain
exceptional situations also the susceptability.
Seed quality
Buy high quality seed (without shriveled and broken seeds) with a germination percentage of
90% or higher. When the producer buys more expensive hybrid seed, the additional seed costs
must be recovered through higher yields. Hybrid cultivars are especially suited for high yielding
conditions, which these cultivars can utilise with the correct management practices. Under the
generally lower yield potential dry land conditions, it will probably benefi t the producer to
plant seed of the cheaper pure line cultivars. Plant the chosen cultivar at the recommended
seeding density and also be aware of the coleoptiles length of a cultivar when planting deeper
into a dry seedbed.
Straw strength
The lodging of spring wheat cultivars often leads to yield losses. It is usually a problem when
high yield potential conditions occurs, but factors such as wind and storm occurrence, high
seeding densities, row widths and excessive nitrogen fertilisation also play a role. In areas and
situations where lodging is widespread, cultivars prone to lodging must be managed carefully.
Chemical growth regulators are available on the market that can limit lodging signifi cantly by
limiting plant height. These products can be considered for cultivars with high yield potential
prone to lodging in high yielding conditions. There are also cultivars available with genetic
resistance to lodging.

30
Aluminium tolerance
In acidic soils [pH (KCl) <4,5 and acid saturation >8%] in certain wheat producing areas, the
Al³+-concentration levels in the soil reach levels toxic to the root growth and development of
certain wheat cultivars. Cultivars diff er in their tolerance to these harmful levels of aluminium.
If these acidic soils are to be planted, it would aid the producer to adapt his cultivar choice to
manage this production risk (see table for aluminium tolerant cultivars). Although a corrective
liming program is the only sustainable long-term solution, tolerant cultivars can be considered
as an interim measure (see Fertilisation Guidelines).
Photoperiod and vernalisation
Photoperiod and vernalisation control the growth period and are important factors determining
cultivar adaptation. Cultivars must be chosen that are adapted to climatic conditions such
as growing season length, planting spectrum, rainfall pattern during the growing season,
soil water availability at planting, temperature during the growing season and the fi rst and
last frost dates. In this regard, the cultivars have been evaluated and this is refl ected in the
recommended optimum planting spectrum for each cultivar. Ideally, the choice of cultivars
to be planted must cover the available planting spectrum of the specifi c region, so that the
period from maturity to harvesting is increased to some extent. The growth period of a cultivar
also gives an indication when the cultivar will be in the anthesis and grain fi lling growth stages.
Shatterproof
This factor refers to the measure of how well the ripe kernel is attached to the ear, as well as to
what extent the chaff of the spikelet covers and protects the kernel. Certain cultivars are more
susceptible to bird damage and losses due to shattering before and during harvesting. These
cultivars must be carefully evaluated in regions where bird damage to the crop is a major
concern, as well as areas where strong winds occur during maturity and harvest.
The Chamber of Milling preferred list
The National Chamber of Milling annually publishes a list of cultivars that are acceptable for
commercial purposes, and this list must be considered in cultivar choice. The Chamber of
Milling does, however, point out that individual miller’s choices are not restricted to the list.
The list of preferred cultivars is divided into three categories: cultivars for dry land production
in the north, cultivars for the southern production area and the irrigation cultivars.

31
Table 2. Miller’s preference list of preferred bread wheat
Northern dryland production areas
Miller’s preference
SST 3137 Kouga SST 1327
SST 316 PAN 3111 PAN 3364
Selati SST 356 SST 972
Senqu SST 954 SST 964
Hartbees PAN 3144 SST 367
Koonap SST 935 SST 363
PAN 3198 SST 347 PAN 3349
PAN 3195 Matlabas SST 936
SST 398 Nossob SST 966
SST 374 PAN 3120 Belinda
SST 387 PAN 3122 Betta DN
PAN 3172 SST 322 Carina
PAN 3379 SST 334 Carol
PAN 3161 PAN 3118 Gariep
PAN 3368 Tarka Hugenoot
SST 963 Komati Limpopo
SST 366 SST 399 SST 107
SST 308 Elands SST 124
SST 319 PAN 3377 SST 333
PAN 3355 SST 983 SST 317
SST 946 Caledon
Northern irrigation areas
Miller’s preference
PAN 3623 SST 8134 SST 8135
PAN 3515 SST 8126 SST 8136
Timbavati SST 815 SST 8125
Tamboti SST 816 PAN 3400
SST 805 SST 877 SST 802
Uhmlazi SST 875 Steenbras
PAN 3497 Buff els SST 885
PAN 3489 SST 867 SST 886
SST 895 PAN 3434 SST 876
SST 896 Duzi Inia
Sabie Krokodil Kariega
Afgri 75-3 SST 835 Marico
SST 884 CRN 826 SST 822
PAN 3471 Olifants SST 825
PAN 3478 Baviaans SST 802

32
RECOMMENDATION AND SUMMARY OF RESULTS – 2013
The most promising cultivars of all institutions involved in the small grain industry are included
annually in the National Small Grain Cultivar Evaluation Programme of the ARC-Small Grain
Institute. The results are evaluated and the guidelines for cultivar choice revised annually by
a committee consisting of officials from the ARC- Small Grain Institute, various Departments
of Agriculture, Sensako, Pannar, SANSOR, SAB Maltings (Pty) Ltd and the Universities of the
Free State and Stellenbosch. The following guidelines for cultivar choice are a summary of the
results per region and only cultivars of which at least two year’s data are available are included.
The guidelines act as reference within which more specifi c recommendations should fall. With
the compilation of the guidelines, the following factors were considered:
• Grain yield
• Adaptability and yield stability
• Grain quality
• Disease resistance
• Agronomic characteristics such as lodging, threshability, preharvest sprouting, etc.
The following tables were drawn up after considering the above-mentioned factors and
include the following:
• Cultivar and class division
• Optimum planting date of each cultivar.
• Optimum planting density for the optimum planting date. Planting density in kilogram
per hectare is also infl uenced by thousand kernel mass and planting date.
• Only applicable to grain production
• Cultivars are not listed according to yield potential
The afore-mentioned committee revises the guidelines annually for the next season. The
characteristics of cultivars and production guidelines for dryland and irrigation conditions in
the summer rainfall region for 2012 are summarised below.
Characteristics of cultivars
In selecting the correct cultivar to produce in a specifi c region, it is important to take into
account certain characteristics other than the yield performance. These characteristics include
agronomic characteristics of the cultivars recommended in the area (Table 1), data on the
disease susceptibility of the cultivars (Table 2) and information on the Russian wheat aphid
resistance of cultivars (Table 3).

33
Ta
ble
1. A
gro
no
mic
ch
ara
cte
rist
ics
of
wh
ea
t cu
ltiv
ars
th
at
are
re
com
me
nd
ed
fo
r cu
ltiv
ati
on
un
de
r d
ryla
nd
con
dit
ion
s in
th
e s
um
me
r ra
infa
ll r
eg
ion
Cu
ltiv
ar
Yie
ld p
ote
nti
al
Gro
wth
le
ng
thS
tra
w S
tre
ng
thP
reh
arv
est
sp
rou
tin
g
tole
ran
ce
Alu
min
ium
to
lera
nce
He
cto
litr
e m
ass
Ela
nd
s (P
BR
)M
ed
ium
to
hig
hM
ed
ium
****
*#
***
Ga
rie
pLo
w t
o h
igh
Me
diu
m**
***
***
Ko
on
ap
(PB
R)
Me
diu
m t
o h
igh
Me
diu
m**
**
***
***
Ma
tla
ba
s (P
BR
)M
ed
ium
to
hig
hLo
ng
***
***
****
Se
nq
u (P
BR
)M
ed
ium
to
hig
hM
ed
ium
***
***
***
PA
N 3
11
8 (P
BR
)Lo
w t
o h
igh
Lon
g**
****
***
*
PA
N 3
12
0 (P
BR
)M
ed
ium
to
hig
hLo
ng
***
***
***
***
PA
N 3
16
1 (P
BR
)Lo
w t
o h
igh
Lon
g**
*#
***
**
PA
N 3
19
5 (P
BR
)M
ed
ium
to
hig
hLo
ng
***
#**
***
PA
N 3
36
8 (P
BR
)M
ed
ium
to
hig
hM
ed
ium
***
***
#**
*
PA
N 3
37
9 (P
BR
)M
ed
ium
to
hig
hSh
ort
***
****
***
*
SS
T 3
16
(PB
R)
Me
diu
m t
o h
igh
Me
diu
m**
***
?**
SS
T 3
17
(PB
R)
Me
diu
m t
o h
igh
Lon
g**
***
*?
***
SS
T 3
47
(PB
R)
Me
diu
m t
o h
igh
Lon
g**
***
*?
***
SS
T 3
56
(PB
R)
Me
diu
m t
o h
igh
Me
diu
m**
***
?**
SS
T 3
74
(PB
R)
Me
diu
mSh
ort
to
Me
diu
m**
**?
**
SS
T 3
87
(PB
R)
Me
diu
m t
o h
igh
Lon
g**
***
?**
* M
od
era
te
** G
oo
d
**
*Exc
elle
nt
# Po
or
R
Res
ista
nt`
S
Su
scep
tib
le
?
Un
kno
wn
PBR
Cu
ltiv
ars
pro
tect
ed b
y Pl
an
t Bre
eder
s’ R
igh
ts

34
Table 2. Disease resistance or susceptibility of wheat cultivars that
are recommended for cultivation under dryland conditions in the
summer rainfall region.
Cultivar Stem rust Leaf rust Stripe rust
Elands (PBR) MR MSS MS
Gariep R S S
Koonap (PBR) R R R
Matlabas (PBR) S MR S
Senqu (PBR) R R R
PAN 3118 (PBR) R MS S
PAN 3120 (PBR) R MS MS
PAN 3161 (PBR) R MS R
PAN 3195 (PBR) R R R
PAN 3368 (PBR) R MS MR
PAN 3379 (PBR) MS MS MS
SST 316 (PBR) ? S R
SST 317 (PBR) ? S R
SST 347 (PBR) MRMS MS MS
SST 356 (PBR) MRMS R R
SST 374 (PBR) MS S MRMS
SST 387 (PBR) R S R
S = Susceptible MS = Moderately susceptible R = Resistant
MR = Moderately resistant ? = unknown
PBR Cultivars protected by Plant Breeders’ Rights
Variation in rust races may aff ect cultivars diff erently. Reactions given here are based on existing data for the most virulent rust
races occurring in South Africa. Distribution of races may vary between production regions.

35
Table 3. Russian wheat aphid resistance or susceptibility of wheat
cultivars that are recommended for cultivation under dryland
conditions in the summer rainfall region.
Cultivar RWASA1 RWASA2 RWASA3 RWASA4
Elands (PBR) MR S S S
Gariep R S S S
Koonap (PBR) MR S S S
Matlabas (PBR) R S S S
Senqu (PBR) R S S R
PAN 3118 (PBR) S S S S
PAN 3120 (PBR) S S S S
PAN 3161 (PBR) R R R S
PAN 3195 (PBR) R S S S
PAN 3368 (PBR) MR MR R R
PAN 3379 (PBR) R R R R
SST 316 (PBR) MR S S S
SST 317 (PBR) MR S S S
SST 347 (PBR) R S S S
SST 356 (PBR) MR S S S
SST 374 (PBR) R S S S
SST 387 (PBR) R S S S
R= Resistant MR= Moderately resistant S= Susceptible
Resistance against RWASA1 and RWASA4 was tested in glasshouse only
Resistance against RWASA2 and RWASA3 was tested in both glasshouse and fi eld
PBR Cultivars protected by Plant Breeders’ Rights
The information in Table 3 must be interpreted using the map in the chapter “Insect control” indicating the
distribution of Russian wheat aphid biotypes in South Africa

36
Planting dates and seeding rates
The recommended planting dates and seeding rates for wheat cultivars, as decided upon at
the meeting of the National Cultivar Evaluation Workgroup, are given in the following fi gures:
Optimum planting date and planting densities for wheat in the South
Western Free State
Cultivar
Planting date (weeks) Plant density(kg/ha)
April May June July
1 2 3 4 1 2 3 4 1 2 3 4 1 2 3 4
Elands (PBR) 15-20
Gariep 15-20
Koonap (PBR) 15-30
Matlabas (PBR) 15-30
Senqu (PBR) 15-30
PAN 3118 (PBR) 15-20
PAN 3120 (PBR) 15-20
PAN 3161 (PBR) 20-25
PAN 3195 (PBR) 15-20
PAN 3368 (PBR) 20-30
PAN 3379 (PBR) 20-25
SST316 (PBR) 20-30
SST317 (PBR) 20-25
SST 347 (PBR) 20-25
SST 356 (PBR) 20-30
SST 374 (PBR) 30-40
SST 387 (PBR) 20-25
All the abovementioned cultivars qualify for all the grades of the bread class.
PBR Cultivars protected by Plant Breeders’ Rights
Producers are solely responsible for the marketing of grain of cultivars planted by them. See Bakers and Millers annual press
release regarding cultivar requirements and consult with local co-operative and marketing agents prior to planting.

37
Optimum planting date and planting densities for wheat in the North
Western Free State
Cultivar
Planting date (weeks)Plant density
(kg/ha)April May June July
1 2 3 4 1 2 3 4 1 2 3 4 1 2 3 4
Elands (PBR) 20-30
Gariep 20-30
Koonap (PBR) 20-30
Matlabas (PBR) 20-30
Senqu (PBR) 20-30
PAN 3118 (PBR) 15-20
PAN 3120 (PBR) 15-20
PAN 3161 (PBR) 20-25
PAN 3195 (PBR) 15-20
PAN 3368 (PBR) 20-30
PAN 3379 (PBR) 20-30
SST316 (PBR) 20-30
SST317 (PBR) 20-25
SST 347 (PBR) 20-25
SST 356 (PBR) 20-30
SST 374 (PBR) 30-40
SST 387 (PBR) 20-25
All the abovementioned cultivars qualify for all the grades of the bread class.
PBR Cultivars protected by Plant Breeders’ Rights
Producers are solely responsible for the marketing of grain of cultivars planted by them. See Bakers and Millers annual press
release regarding cultivar requirements and consult with local co-operative and marketing agents prior to planting.

38
Optimum planting date and planting densities for wheat in the
Central Free State
Cultivar
Planting date (weeks) Plant density(kg/ha)
April May June July
1 2 3 4 1 2 3 4 1 2 3 4 1 2 3 4
Elands (PBR) 15-20
Gariep 15–30
Koonap (PBR) 15-30
Matlabas (PBR) 15-30
Senqu (PBR) 15-30
PAN 3118 (PBR) 15-20
PAN 3120 (PBR) 15-20
PAN 3161 (PBR) 20-25
PAN 3195 (PBR) 15-20
PAN 3368 (PBR) 25-30
PAN 3379 (PBR) 25-40
SST316 (PBR) 20-30
SST317 (PBR) 20-25
SST 347 (PBR) 20-25
SST 356 (PBR) 20-30
SST 374 (PBR) 30-40
SST 387 (PBR) 20-25
All the abovementioned cultivars qualify for all the grades of the bread class.
PBR Cultivars protected by Plant Breeders’ Rights
Producers are solely responsible for the marketing of grain of cultivars planted by them. See Bakers and Millers annual press
release regarding cultivar requirements and consult with local co-operative and marketing agents prior to planting.

39
Optimum planting date and planting densities for wheat in the
Eastern Free State
Cultivar
Planting date (weeks) Plant density(kg/ha)
May June July August
1 2 3 4 1 2 3 4 1 2 3 4 1 2 3 4
Elands (PBR) 15-30
Gariep 15-30
Koonap (PBR) 15-30
Matlabas (PBR) 15-30
Senqu (PBR) 15-30
PAN 3118 (PBR) 15-30
PAN 3120 (PBR) 15-30
PAN 3161 (PBR) 20-25
PAN 3195 (PBR) 20-25
PAN 3368(PBR) 25-40
PAN 3379(PBR) 25-40
SST316 (PBR) 20-30
SST317 (PBR) 20-25
SST 347(PBR) 20-25
SST 356(PBR) 20-30
SST 374(PBR) 30-40
SST 387(PBR) 20-25
All the abovementioned cultivars qualify for all the grades of the bread class.
PBR Cultivars protected by Plant Breeders’ Rights
Producers are solely responsible for the marketing of grain of cultivars planted by them. See Bakers and Millers annual press
release regarding cultivar requirements and consult with local co-operative and marketing agents prior to planting.

40
Optimum planting date and planting densities for wheat in
Mpumalanga
Cultivar
Planting date (weeks) Plant density(kg/ha)
May June July
1 2 3 4 1 2 3 4 1 2 3 4
Elands(PBR) 20-30
Gariep 20-30
Koonap (PBR) 20-30
PAN 3118(PBR) 20-30
PAN 3161(PBR) 20-30
PAN 3195 (PBR) 20-30
PAN 3368(PBR) 25-40
PAN 3379(PBR) 25-40
SST316 (PBR) 20-30
SST317 (PBR) 20-30
SST 347(PBR) 20-30
SST 356(PBR) 20-30
SST 374(PBR) 30-40
SST 387(PBR) 20-30
All the abovementioned cultivars qualify for all the grades of the bread class.
PBR Cultivars protected by Plant Breeders’ Rights
Producers are solely responsible for the marketing of grain of cultivars planted by them. See Bakers and Millers annual press
release regarding cultivar requirements and consult with local co-operative and marketing agents prior to planting.
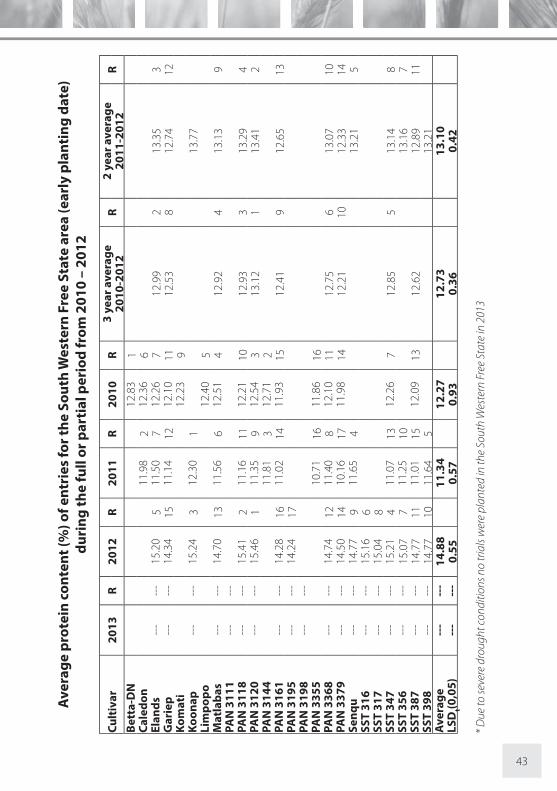
SUMMARY OF RESULTS OBTAINED DURING 2013
The results obtained in the cultivar evaluation programme in the summer rainfall area over the
last seasons (2010 to 2013) are summarised in the following tables.
The value of this information is that cultivar performance can be evaluated for a specifi c
season, as well as over the medium term. The variation in climatic conditions between seasons,
and the unpredictability thereof, necessitates cultivar choices that will decrease the risk as far
as possible.
If this information is interpreted with other cultivar characteristics, discussed earlier, more
informed decisions can be made on the group of cultivars that will perform the best.

41
Av
era
ge
yie
ld (
ton
/ha
) o
f e
ntr
ies
for
the
So
uth
We
ste
rn F
ree
Sta
te a
rea
(e
arl
y p
lan
tin
g d
ate
)
du
rin
g t
he
fu
ll o
r p
art
ial
pe
rio
d f
rom
20
10
– 2
01
2
Cu
ltiv
ar
20
13
R2
01
2R
20
11
R2
01
0R
3 y
ea
r a
ve
rag
eR
2 y
ea
r a
ve
rag
eR
20
10
-20
12
20
11
-20
12
Be
tta
-DN
1.6
41
2C
ale
do
n1
.97
11
1.6
81
0E
lan
ds
---
---
1.7
21
11
.98
10
1.6
81
11
.79
91
.85
8G
ari
ep
---
---
1.9
32
1.9
61
21
.60
14
1.8
36
1.9
55
Ko
ma
ti1
.70
8K
oo
na
p--
---
-1
.73
91
.62
17
1.6
7L
imp
op
o1
.53
16
Ma
tla
ba
s--
---
-2
.05
12
.03
81
.77
61
.95
32
.04
1P
AN
31
11
---
---
PA
N 3
11
8--
---
-1
.80
62
.20
21
.88
21
.96
22
.00
2P
AN
31
20
---
---
1.6
01
42
.37
11
.92
11
.96
11
.99
3P
AN
31
44
1.7
11
51
.59
15
PA
N 3
16
1--
---
-1
.55
15
1.9
99
1.7
95
1.7
81
01
.77
11
PA
N 3
19
5--
---
-1
.64
13
PA
N 3
19
8--
---
-P
AN
33
55
2.1
14
1.6
31
3P
AN
33
68
---
---
1.7
57
2.0
47
1.6
99
1.8
37
1.9
07
PA
N 3
37
9--
---
-1
.89
42
.07
61
.84
31
.93
41
.98
4S
en
qu
---
---
1.7
21
01
.71
14
1.7
21
2S
ST
31
6--
---
-1
.80
5S
ST
31
7--
---
-1
.92
3S
ST
34
7--
---
-1
.45
17
2.1
93
1.8
34
1.8
28
1.8
29
SS
T 3
56
---
---
1.6
91
21
.95
13
1.8
21
0S
ST
38
7--
---
-1
.75
82
.10
51
.73
71
.86
1.9
36
SS
T 3
98
---
---
1.5
11
61
.67
16
1.5
9A
ve
rag
e--
---
-1
.73
1.9
81
.72
1.8
71
.86
LS
Dt(0
,05
)--
---
-0
.22
0.2
20
.24
0.1
40
.16
* D
ue
to s
ever
e d
rou
gh
t co
nd
itio
ns
no
tria
ls w
ere
pla
nte
d in
the
Sou
th W
este
rn F
ree
Sta
te in
201
3

42
Av
era
ge
he
cto
litr
e m
ass
(k
g/h
l) o
f e
ntr
ies
for
the
So
uth
We
ste
rn F
ree
Sta
te a
rea
(e
arl
y p
lan
tin
g d
ate
)
du
rin
g t
he
fu
ll o
r p
art
ial
pe
rio
d f
rom
20
10
– 2
01
2
Cu
ltiv
ar
20
13
R2
01
2R
20
11
R2
01
0R
3 y
ea
r a
ve
rag
eR
2 y
ea
r a
ve
rag
eR
20
10
-20
12
20
11
-20
12
Be
tta
-DN
77
.40
10
Ca
led
on
78
.58
12
77
.50
7E
lan
ds
---
---
80
.95
88
0.6
23
77
.30
11
79
.62
58
0.7
94
Ga
rie
p--
---
-8
0.2
11
37
9.3
58
77
.10
12
78
.89
67
9.7
87
Ko
ma
ti7
6.9
01
3K
oo
na
p--
---
-8
0.6
81
08
0.0
75
80
.37
Lim
po
po
76
.40
14
Ma
tla
ba
s--
---
-8
0.5
61
17
5.8
21
67
7.6
06
77
.99
10
78
.19
14
PA
N 3
11
1--
---
-P
AN
31
18
---
---
82
.30
37
9.7
77
78
.30
48
0.1
22
81
.04
3P
AN
31
20
---
---
83
.05
18
0.3
84
79
.40
18
0.9
41
81
.72
1P
AN
31
44
78
.71
11
76
.20
16
PA
N 3
16
1--
---
-8
1.1
17
77
.59
15
77
.50
77
8.7
37
79
.35
10
PA
N 3
19
5--
---
-8
1.3
05
PA
N 3
19
8--
---
-P
AN
33
55
80
.65
27
7.9
05
PA
N 3
36
8--
---
-7
9.4
01
57
9.8
76
76
.40
14
78
.56
97
9.6
48
PA
N 3
37
9--
---
-8
0.5
41
28
1.9
31
77
.50
77
9.9
93
81
.23
2S
en
qu
---
---
79
.90
14
79
.27
97
9.5
99
SS
T 3
16
---
---
78
.84
17
SS
T 3
17
---
---
81
.20
6S
ST
34
7--
---
-8
2.3
62
78
.23
12
78
.90
27
9.8
34
80
.30
6S
ST
35
6--
---
-7
9.0
91
67
7.9
61
37
8.5
21
2S
ST
38
7--
---
-8
2.1
04
75
.24
17
78
.60
37
8.6
57
8.6
71
1S
ST
39
8--
---
-8
0.9
58
75
.70
16
78
.33
Av
era
ge
---
---
80
.86
78
.81
77
.56
79
.33
79
.82
LS
Dt(0
,05
)--
---
-0
.73
0.5
00
.96
0.4
20
.42
* D
ue
to s
ever
e d
rou
gh
t co
nd
itio
ns
no
tria
ls w
ere
pla
nte
d in
the
Sou
th W
este
rn F
ree
Sta
te in
201
3
43
Av
era
ge
pro
tein
co
nte
nt
(%)
of
en
trie
s fo
r th
e S
ou
th W
est
ern
Fre
e S
tate
are
a (
ea
rly
pla
nti
ng
da
te)
du
rin
g t
he
fu
ll o
r p
art
ial
pe
rio
d f
rom
20
10
– 2
01
2
Cu
ltiv
ar
20
13
R2
01
2R
20
11
R2
01
0R
3 y
ea
r a
ve
rag
eR
2 y
ea
r a
ve
rag
eR
20
10
-20
12
20
11
-20
12
Be
tta
-DN
12
.83
1
C
ale
do
n
1
1.9
82
12
.36
6
E
lan
ds
---
---
15
.20
51
1.5
07
12
.26
71
2.9
92
13
.35
3G
ari
ep
---
---
14
.34
15
11
.14
12
12
.10
11
12
.53
81
2.7
41
2K
om
ati
12
.23
9
K
oo
na
p--
---
-1
5.2
43
12
.30
1
13
.77
L
imp
op
o
1
2.4
05
Ma
tla
ba
s--
---
-1
4.7
01
31
1.5
66
12
.51
41
2.9
24
13
.13
9P
AN
31
11
---
---
PA
N 3
11
8--
---
-1
5.4
12
11
.16
11
12
.21
10
12
.93
31
3.2
94
PA
N 3
12
0--
---
-1
5.4
61
11
.35
91
2.5
43
13
.12
11
3.4
12
PA
N 3
14
4
1
1.8
13
12
.71
2
P
AN
31
61
---
---
14
.28
16
11
.02
14
11
.93
15
12
.41
91
2.6
51
3P
AN
31
95
---
---
14
.24
17
PA
N 3
19
8--
---
-P
AN
33
55
10
.71
16
11
.86
16
PA
N 3
36
8--
---
-1
4.7
41
21
1.4
08
12
.10
11
12
.75
61
3.0
71
0P
AN
33
79
---
---
14
.50
14
10
.16
17
11
.98
14
12
.21
10
12
.33
14
Se
nq
u--
---
-1
4.7
79
11
.65
4
13
.21
5S
ST
31
6--
---
-1
5.1
66
SS
T 3
17
---
---
15
.04
8
S
ST
34
7--
---
-1
5.2
14
11
.07
13
12
.26
71
2.8
55
13
.14
8S
ST
35
6--
---
-1
5.0
77
11
.25
10
13
.16
7S
ST
38
7--
---
-1
4.7
71
11
1.0
11
51
2.0
91
31
2.6
2
12
.89
11
SS
T 3
98
---
---
14
.77
10
11
.64
5
1
3.2
1
Av
era
ge
---
---
14
.88
1
1.3
4
12
.27
1
2.7
3
13
.10
L
SD
t(0,0
5)
---
---
0.5
5
0.5
7
0.9
3
0.3
6
0.4
2
* D
ue
to s
ever
e d
rou
gh
t co
nd
itio
ns
no
tria
ls w
ere
pla
nte
d in
the
Sou
th W
este
rn F
ree
Sta
te in
201
3

44
Av
era
ge
fa
llin
g n
um
be
r (s
) o
f e
ntr
ies
for
the
So
uth
We
ste
rn F
ree
Sta
te (
ea
rly
pla
nti
ng
da
te)
du
rin
g t
he
fu
ll o
r p
art
ial
pe
rio
d f
rom
20
10
– 2
01
2
Cu
ltiv
ar
20
13
R2
01
2R
20
11
R2
01
0R
3 y
ea
r a
ve
rag
eR
2 y
ea
r a
ve
rag
eR
20
10
-20
12
20
11
-20
12
Be
tta
-DN
29
34
Ca
led
on
28
81
22
96
3E
lan
ds
---
---
37
26
28
51
32
88
63
15
33
28
8G
ari
ep
---
---
36
78
29
11
12
48
14
30
27
32
97
Ko
ma
ti3
02
1K
oo
na
p--
---
-3
83
42
93
10
33
8L
imp
op
o2
65
11
Ma
tla
ba
s--
---
-3
47
14
29
99
28
58
31
05
32
31
0P
AN
31
11
---
---
PA
N 3
11
8--
---
-3
47
14
30
58
24
81
33
00
83
26
9P
AN
31
20
---
---
35
51
13
07
62
77
93
13
43
31
5P
AN
31
44
32
13
27
61
0P
AN
31
61
---
---
40
12
32
14
30
22
34
11
36
11
PA
N 3
19
5--
---
-4
03
1P
AN
31
98
---
---
PA
N 3
35
53
28
22
86
7P
AN
33
68
---
---
33
21
72
83
14
25
21
22
89
93
08
13
PA
N 3
37
9--
---
-3
87
33
35
12
47
15
32
32
36
12
Se
nq
u--
---
-3
80
53
07
53
43
3S
ST
31
6--
---
-3
72
7S
ST
31
7--
---
-3
40
16
SS
T 3
47
---
---
36
29
25
91
62
90
53
04
63
11
12
SS
T 3
56
---
---
35
11
23
06
73
29
6S
ST
38
7--
---
-3
49
13
23
81
72
39
16
27
52
93
14
SS
T 3
98
---
---
36
01
02
68
15
31
4A
ve
rag
e--
---
-3
65
29
62
75
30
73
28
LS
Dt(0
,05
)--
---
-2
1.5
83
4.5
93
2.8
11
9.4
52
2.7
1
* D
ue
to s
ever
e d
rou
gh
t co
nd
itio
ns
no
tria
ls w
ere
pla
nte
d in
the
Sou
th W
este
rn F
ree
Sta
te in
201
3
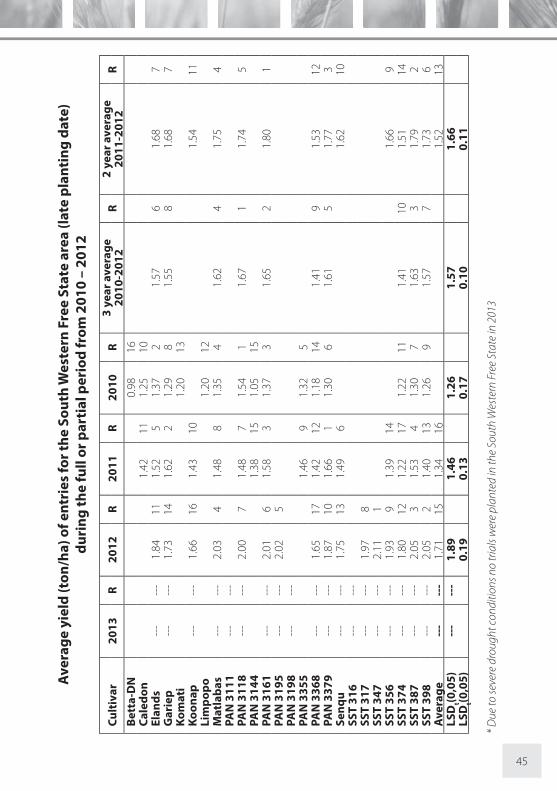
45
Av
era
ge
yie
ld (
ton
/ha
) o
f e
ntr
ies
for
the
So
uth
We
ste
rn F
ree
Sta
te a
rea
(la
te p
lan
tin
g d
ate
)
du
rin
g t
he
fu
ll o
r p
art
ial
pe
rio
d f
rom
20
10
– 2
01
2
Cu
ltiv
ar
20
13
R2
01
2R
20
11
R2
01
0R
3 y
ea
r a
ve
rag
eR
2 y
ea
r a
ve
rag
eR
20
10
-20
12
20
11
-20
12
Be
tta
-DN
0.9
81
6C
ale
do
n1
.42
11
1.2
51
0E
lan
ds
---
---
1.8
41
11
.52
51
.37
21
.57
61
.68
7G
ari
ep
---
---
1.7
31
41
.62
21
.29
81
.55
81
.68
7K
om
ati
1.2
01
3K
oo
na
p--
---
-1
.66
16
1.4
31
01
.54
11
Lim
po
po
1.2
01
2M
atl
ab
as
---
---
2.0
34
1.4
88
1.3
54
1.6
24
1.7
54
PA
N 3
11
1--
---
-P
AN
31
18
---
---
2.0
07
1.4
87
1.5
41
1.6
71
1.7
45
PA
N 3
14
41
.38
15
1.0
51
5P
AN
31
61
---
---
2.0
16
1.5
83
1.3
73
1.6
52
1.8
01
PA
N 3
19
5--
---
-2
.02
5P
AN
31
98
---
---
PA
N 3
35
51
.46
91
.32
5P
AN
33
68
---
---
1.6
51
71
.42
12
1.1
81
41
.41
91
.53
12
PA
N 3
37
9--
---
-1
.87
10
1.6
61
1.3
06
1.6
15
1.7
73
Se
nq
u--
---
-1
.75
13
1.4
96
1.6
21
0S
ST
31
6--
---
-S
ST
31
7--
---
-1
.97
8S
ST
34
7--
---
-2
.11
1S
ST
35
6--
---
-1
.93
91
.39
14
1.6
69
SS
T 3
74
---
---
1.8
01
21
.22
17
1.2
21
11
.41
10
1.5
11
4S
ST
38
7--
---
-2
.05
31
.53
41
.30
71
.63
31
.79
2S
ST
39
8--
---
-2
.05
21
.40
13
1.2
69
1.5
77
1.7
36
Av
era
ge
---
---
1.7
11
51
.34
16
1.5
21
3L
SD
t(0,0
5)
---
---
1.8
91
.46
1.2
61
.57
1.6
6L
SD
t(0,0
5)
0.1
90
.13
0.1
70
.10
0.1
1
* D
ue
to s
ever
e d
rou
gh
t co
nd
itio
ns
no
tria
ls w
ere
pla
nte
d in
the
Sou
th W
este
rn F
ree
Sta
te in
201
3

46
Av
era
ge
he
cto
litr
e m
ass
(k
g/h
l) o
f e
ntr
ies
for
the
So
uth
We
ste
rn F
ree
Sta
te a
rea
(la
te p
lan
tin
g d
ate
)
du
rin
g t
he
fu
ll o
r p
art
ial
pe
rio
d f
rom
20
10
– 2
01
2
Cu
ltiv
ar
20
13
R2
01
2R
20
11
R2
01
0R
3 y
ea
r a
ve
rag
eR
2 y
ea
r a
ve
rag
eR
20
10
-20
12
20
11
-20
12
Be
tta
-DN
78
.50
9C
ale
do
n7
6.9
97
78
.90
6E
lan
ds
---
---
80
.17
47
7.9
63
79
.60
47
9.2
43
79
.07
3G
ari
ep
---
---
80
.70
27
7.2
66
79
.80
37
9.2
52
78
.98
4K
om
ati
78
.20
10
Ko
on
ap
---
---
80
.23
37
8.5
32
79
.38
2L
imp
op
o7
8.7
07
Ma
tla
ba
s--
---
-7
7.0
31
67
5.7
81
47
3.9
01
67
5.5
71
07
6.4
11
1P
AN
31
11
---
---
PA
N 3
11
8--
---
-7
9.4
76
77
.35
57
9.9
01
78
.91
47
8.4
15
PA
N 3
14
47
6.1
71
17
7.6
01
2P
AN
31
61
---
---
78
.83
87
5.9
71
37
8.7
07
77
.83
57
7.4
09
PA
N 3
19
5--
---
-7
8.3
31
0P
AN
31
98
---
---
PA
N 3
35
57
7.8
84
79
.10
5P
AN
33
68
---
---
78
.92
77
6.1
41
27
8.1
01
17
7.7
26
77
.53
7P
AN
33
79
---
---
80
.89
17
9.0
31
79
.90
17
9.9
41
79
.96
1S
en
qu
---
---
79
.55
57
6.6
48
78
.10
6S
ST
31
6--
---
-7
7.4
31
5S
ST
31
7--
---
-7
7.9
01
1S
ST
34
7--
---
-7
7.8
11
47
6.4
99
77
.15
10
SS
T 3
56
---
---
76
.62
17
74
.17
17
76
.80
15
75
.86
97
5.4
01
4S
ST
37
4--
---
-7
8.6
69
76
.28
10
77
.20
13
77
.38
77
7.4
78
SS
T 3
87
---
---
77
.90
11
74
.23
16
77
.20
13
76
.44
87
6.0
71
3S
ST
39
8--
---
-7
7.8
91
37
4.7
31
57
6.3
11
2A
ve
rag
e--
---
-7
8.7
37
6.5
67
8.2
67
7.8
27
7.6
9L
SD
t(0,0
5)
---
---
0.7
60
.60
0.6
20
.44
0.4
9
* D
ue
to s
ever
e d
rou
gh
t co
nd
itio
ns
no
tria
ls w
ere
pla
nte
d in
the
Sou
th W
este
rn F
ree
Sta
te in
201
3

47
Av
era
ge
pro
tein
co
nte
nt
(%)
of
en
trie
s fo
r th
e S
ou
th W
est
ern
Fre
e S
tate
are
a (
late
pla
nti
ng
da
te)
du
rin
g t
he
fu
ll o
r p
art
ial
pe
rio
d f
rom
20
10
– 2
01
2
Cu
ltiv
ar
20
13
R2
01
2R
20
11
R2
01
0R
3 y
ea
r a
ve
rag
eR
2 y
ea
r a
ve
rag
eR
20
10
-20
12
20
11
-20
12
Be
tta
-DN
15
.21
1C
ale
do
n1
2.8
83
14
.77
6E
lan
ds
---
---
13
.96
13
12
.20
12
14
.22
91
3.4
66
13
.08
11
Ga
rie
p--
---
-1
4.5
16
12
.21
11
14
.53
71
3.7
55
13
.36
7K
om
ati
15
.11
2K
oo
na
p--
---
-1
4.4
58
13
.09
11
3.7
73
Lim
po
po
14
.02
12
Ma
tla
ba
s--
---
-1
4.4
97
12
.65
71
4.9
83
14
.04
21
3.5
75
PA
N 3
11
1--
---
-P
AN
31
18
---
---
14
.86
11
2.4
68
14
.42
81
3.9
13
13
.66
4P
AN
31
44
12
.80
51
4.8
85
PA
N 3
16
1--
---
-1
3.9
11
41
2.2
41
01
4.0
61
11
3.4
08
13
.08
12
PA
N 3
19
5--
---
-1
3.6
61
6P
AN
31
98
---
---
PA
N 3
35
51
2.1
31
41
4.0
11
3P
AN
33
68
---
---
14
.86
11
2.7
86
14
.94
41
4.1
91
13
.82
1P
AN
33
79
---
---
13
.82
15
11
.39
17
13
.72
15
12
.98
91
2.6
11
3S
en
qu
---
---
14
.52
51
2.1
11
51
3.3
28
SS
T 3
16
---
---
14
.05
11
SS
T 3
17
---
---
14
.70
4S
ST
34
7--
---
-1
4.0
31
21
2.4
68
13
.25
9S
ST
35
6--
---
-1
4.2
29
12
.92
21
4.1
21
01
3.7
54
13
.57
5S
ST
37
4--
---
-1
3.4
01
71
1.5
41
61
3.5
11
61
2.8
21
01
2.4
71
4S
ST
38
7--
---
-1
4.0
91
01
2.1
71
31
4.0
01
41
3.4
27
13
.13
10
SS
T 3
98
---
---
14
.76
31
2.8
24
13
.79
2A
ve
rag
e--
---
-1
4.2
51
2.4
01
4.4
11
3.5
71
3.3
2L
SD
t(0,0
5)
---
---
0.4
80
.49
0.6
30
.30
0.3
4
* D
ue
to s
ever
e d
rou
gh
t co
nd
itio
ns
no
tria
ls w
ere
pla
nte
d in
the
Sou
th W
este
rn F
ree
Sta
te in
201
3

48
Av
era
ge
fa
llin
g n
um
be
r (s
) o
f e
ntr
ies
for
the
So
uth
We
ste
rn F
ree
Sta
te a
rea
(la
te p
lan
tin
g d
ate
)
du
rin
g t
he
fu
ll o
r p
art
ial
pe
rio
d f
rom
20
10
– 2
01
2
Cu
ltiv
ar
20
13
R2
01
2R
20
11
R2
01
0R
3 y
ea
r a
ve
rag
eR
2 y
ea
r a
ve
rag
eR
20
10
-20
12
20
11
-20
12
Be
tta
-DN
27
92
Ca
led
on
32
05
27
35
Ela
nd
s--
---
-3
44
23
04
82
71
73
07
13
24
2G
ari
ep
---
---
28
21
43
02
92
72
62
85
52
92
11
Ko
ma
ti
2
76
3
K
oo
na
p--
---
-3
18
73
05
7
3
12
5L
imp
op
o
2
71
8
M
atl
ab
as
---
---
32
93
28
91
32
28
16
28
27
30
96
PA
N 3
11
1--
---
-P
AN
31
18
---
---
30
01
03
01
10
27
44
29
14
30
09
PA
N 3
14
4
3
21
42
98
1
P
AN
31
61
---
---
31
95
31
86
26
61
13
01
23
19
3P
AN
31
95
---
---
27
31
5
P
AN
31
98
---
---
PA
N 3
35
5
3
45
12
68
9
P
AN
33
68
---
---
28
81
32
75
16
25
51
32
73
92
81
13
PA
N 3
37
9--
---
-2
97
11
33
12
25
81
22
95
33
14
4S
en
qu
---
---
34
61
32
93
33
71
SS
T 3
16
---
---
29
11
2
S
ST
31
7--
---
-3
19
6
S
ST
34
7--
---
-3
11
82
82
15
29
71
0S
ST
35
6--
---
-3
09
93
00
12
24
71
42
85
63
04
8S
ST
37
4--
---
-2
69
16
30
01
12
67
10
27
98
28
51
2S
ST
38
7--
---
-2
56
17
27
41
72
43
15
25
81
02
65
14
SS
T 3
98
---
---
32
24
28
71
4
3
05
7A
ve
rag
e--
---
-3
04
3
05
2
65
2
86
3
03
L
SD
t(0,0
5)
---
---
19
.08
2
6.3
4
43
.73
1
6.1
7
15
.89
* D
ue
to s
ever
e d
rou
gh
t co
nd
itio
ns
no
tria
ls w
ere
pla
nte
d in
the
Sou
th W
este
rn F
ree
Sta
te in
201
3

49
Av
era
ge
yie
ld (
ton
/ha
) o
f e
ntr
ies
for
the
No
rth
We
ste
rn F
ree
Sta
te a
rea
(e
arl
y p
lan
tin
g d
ate
)
du
rin
g t
he
fu
ll o
r p
art
ial
pe
rio
d f
rom
20
10
– 2
01
3
Cu
ltiv
ar
20
13
R2
01
2R
20
11
R2
01
0R
4 y
ea
r a
ve
rag
eR
3 y
ea
r a
ve
rag
eR
2 y
ea
r a
ve
rag
eR
20
10
-20
13
20
11
-20
13
20
12
-20
13
Be
tta
–D
N1
.72
16
Ca
led
on
3.9
81
41
.82
14
Ela
nd
s2
.67
18
4.1
41
44
.13
11
2.0
81
03
.25
10
3.6
51
13
.40
15
Ga
rie
p3
.16
12
4.5
51
14
.45
61
.80
15
3.4
98
4.0
58
3.8
61
1K
om
ati
2.1
28
Ko
on
ap
3.2
21
03
.55
17
3.4
71
73
.41
14
3.3
91
6L
imp
op
o1
.55
17
Ma
tla
ba
s4
.22
24
.69
94
.41
72
.57
53
.97
44
.44
44
.46
5P
AN
31
11
3.9
55
PA
N 3
11
84
.20
34
.94
54
.32
82
.57
34
.01
34
.49
34
.57
3P
AN
31
20
4.3
31
5.1
74
4.7
53
2.6
41
4.2
21
4.7
51
4.7
51
PA
N 3
14
43
.88
15
2.0
81
0P
AN
31
61
3.5
67
4.8
56
4.6
84
2.5
56
3.9
15
4.3
65
4.2
07
PA
N 3
19
53
.18
11
5.4
41
4.3
16
PA
N 3
19
82
.83
16
PA
N 3
35
54
.47
52
.00
12
PA
N 3
36
82
.81
17
3.7
61
64
.15
10
1.9
21
33
.16
11
3.5
81
23
.29
17
PA
N 3
37
93
.26
94
.60
10
5.1
31
2.4
47
3.8
66
4.3
36
3.9
39
Se
nq
u2
.87
15
4.1
41
34
.01
13
3.6
71
03
.51
14
SS
T 3
16
2.9
91
34
.76
73
.87
10
SS
T 3
17
4.0
04
5.2
63
4.6
32
SS
T 3
47
3.4
98
4.7
67
4.3
19
2.5
73
3.7
87
4.1
87
4.1
28
SS
T 3
56
2.6
01
94
.42
12
4.0
71
22
.11
93
.30
93
.70
93
.51
12
SS
T 3
87
3.7
06
5.3
22
4.9
62
2.6
32
4.1
52
4.6
62
4.5
14
SS
T 3
98
2.9
71
44
.06
15
3.5
71
63
.53
13
3.5
11
3A
ve
rag
e3
.37
4.6
14
.28
2.1
93
.74
4.0
63
.99
LS
Dt(0
.05
)0
.42
0.3
90
.43
0.2
90
.20
0.2
40
.29

50
Av
era
ge
he
cto
litr
e m
ass
(k
g/h
l) o
f e
ntr
ies
for
the
No
rth
We
ste
rn F
ree
Sta
te a
rea
(e
arl
y p
lan
tin
g d
ate
)
du
rin
g t
he
fu
ll o
r p
art
ial
pe
rio
d f
rom
20
10
– 2
01
3
Cu
ltiv
ar
20
13
R2
01
2R
20
11
R2
01
0R
4 y
ea
r a
ve
rag
eR
3 y
ea
r a
ve
rag
eR
2 y
ea
r a
ve
rag
eR
20
10
-20
13
20
11
-20
13
20
12
-20
13
Be
tta
–D
N7
8.0
01
0C
ale
do
n7
8.2
91
27
7.9
71
1E
lan
ds
76
.58
14
77
.03
27
9.5
94
78
.52
77
7.9
36
77
.73
77
6.8
19
Ga
rie
p7
7.6
91
17
7.0
03
80
.07
27
8.5
86
78
.34
57
8.2
55
77
.35
7K
om
ati
77
.43
15
Ko
on
ap
79
.05
67
6.2
36
79
.24
57
8.1
76
77
.64
4L
imp
op
o7
7.7
91
3M
atl
ab
as
78
.93
77
5.0
91
07
8.6
41
07
8.7
75
77
.86
77
7.5
58
77
.01
8P
AN
31
11
79
.78
4P
AN
31
18
79
.58
57
6.0
87
79
.13
77
8.8
74
78
.42
47
8.2
64
77
.83
3P
AN
31
20
81
.36
17
6.9
14
80
.71
18
0.3
62
79
.83
17
9.6
61
79
.13
1P
AN
31
44
77
.99
13
77
.75
14
PA
N 3
16
17
6.6
21
37
4.9
81
17
8.4
01
17
7.8
31
27
6.9
69
76
.67
11
75
.80
14
PA
N 3
19
57
5.7
61
77
4.8
91
37
5.3
21
5P
AN
31
98
77
.72
10
PA
N 3
35
57
8.9
88
78
.12
8P
AN
33
68
76
.52
16
75
.32
97
7.8
31
47
6.8
21
67
6.6
21
07
6.5
61
27
5.9
21
3P
AN
33
79
78
.64
87
6.4
45
79
.95
37
9.1
73
78
.55
37
8.3
43
77
.54
6S
en
qu
76
.54
15
75
.92
87
8.7
59
77
.07
97
6.2
31
1S
ST
31
67
4.8
61
97
4.5
81
67
4.7
21
6S
ST
31
77
8.4
99
74
.67
15
76
.58
10
SS
T 3
47
80
.39
27
7.4
01
79
.23
68
0.4
21
79
.36
27
9.0
12
78
.89
2S
ST
35
67
5.0
01
87
4.2
61
77
6.8
41
67
6.0
91
77
5.5
51
17
5.3
71
47
4.6
31
7S
ST
38
78
0.2
33
74
.97
12
75
.04
17
78
.05
97
7.0
78
76
.75
10
77
.60
5S
ST
39
87
7.4
01
27
4.8
91
37
7.0
01
57
6.4
31
37
6.1
41
2A
ve
rag
e7
7.9
57
5.6
97
8.5
77
8.2
77
7.8
67
7.5
67
6.7
7L
SD
t(0.0
5)
1.0
30
.56
1.3
00
.66
0.5
20
.64
0.5
5

51
Av
era
ge
pro
tein
co
nte
nt
(%)
of
en
trie
s fo
r th
e N
ort
h W
est
ern
Fre
e S
tate
are
a (
ea
rly
pla
nti
ng
da
te)
du
rin
g t
he
fu
ll o
r p
art
ial
pe
rio
d f
rom
20
10
– 2
01
3
Cu
ltiv
ar
20
13
R2
01
2R
20
11
R2
01
0R
4 y
ea
r a
ve
rag
eR
3 y
ea
r a
ve
rag
eR
2 y
ea
r a
ve
rag
eR
20
10
-20
13
20
11
-20
13
20
12
-20
13
Be
tta
–D
N1
2.6
71
Ca
led
on
12
.49
91
2.1
95
Ela
nd
s1
4.2
76
12
.60
41
2.5
17
11
.61
10
12
.75
31
3.1
35
13
.44
5G
ari
ep
14
.12
91
1.6
51
21
2.1
31
51
1.1
61
31
2.2
67
12
.63
91
2.8
81
0K
om
ati
12
.14
7K
oo
na
p1
4.6
92
13
.41
11
2.8
91
13
.66
11
4.0
51
Lim
po
po
12
.22
4M
atl
ab
as
14
.75
11
2.3
66
12
.39
11
12
.19
51
2.9
22
13
.17
41
3.5
54
PA
N 3
11
11
3.3
61
8P
AN
31
18
13
.70
14
11
.48
15
12
.60
41
1.9
59
12
.43
61
2.5
91
11
2.5
91
5P
AN
31
20
14
.06
10
11
.93
91
2.3
61
21
2.4
22
12
.69
51
2.7
88
13
.00
9P
AN
31
44
12
.48
10
12
.42
2P
AN
31
61
13
.52
17
12
.15
81
2.1
41
41
1.1
11
61
2.2
38
12
.60
10
12
.83
11
PA
N 3
19
51
3.7
21
31
0.9
91
61
2.3
51
6P
AN
31
98
13
.92
11
PA
N 3
35
51
1.9
61
71
1.1
61
3P
AN
33
68
14
.30
51
3.2
12
12
.81
21
1.9
88
13
.07
11
3.4
42
13
.75
2P
AN
33
79
13
.53
16
11
.91
10
11
.98
16
10
.34
17
11
.94
10
12
.47
13
12
.72
12
Se
nq
u1
4.1
48
12
.40
51
2.5
36
13
.02
71
3.2
77
SS
T 3
16
14
.46
41
1.8
31
11
3.1
58
SS
T 3
17
13
.61
15
11
.61
13
12
.61
14
SS
T 3
47
13
.76
12
11
.56
14
12
.27
13
11
.16
13
12
.19
91
2.5
31
21
2.6
61
3S
ST
35
61
4.6
53
12
.20
71
2.5
17
11
.59
11
12
.74
41
3.1
26
13
.42
6S
ST
38
71
3.2
51
91
0.5
71
71
2.5
45
11
.26
12
11
.91
11
12
.12
14
11
.91
17
SS
T 3
98
14
.17
71
3.0
23
12
.73
31
3.3
13
13
.60
3A
ve
rag
e1
4.0
01
2.0
51
2.4
31
1.7
41
2.4
71
2.9
01
3.0
5L
SD
t(0.0
5)
0.9
10
.59
0.6
50
.94
0.3
90
.42
0.5
1

52
Av
era
ge
fa
llin
g n
um
be
r (s
) o
f e
ntr
ies
for
the
No
rth
We
ste
rn F
ree
Sta
te a
rea
(e
arl
y p
lan
tin
g d
ate
)
du
rin
g t
he
fu
ll o
r p
art
ial
pe
rio
d f
rom
20
10
– 2
01
3
Cu
ltiv
ar
20
13
R2
01
2R
20
11
R2
01
0R
4 y
ea
r a
ve
rag
eR
3 y
ea
r a
ve
rag
eR
2 y
ea
r a
ve
rag
eR
20
10
-20
13
20
11
-20
13
20
12
-20
13
Be
tta
–D
N2
96
8C
ale
do
n3
32
62
96
7E
lan
ds
27
41
42
83
33
24
10
29
49
29
42
29
43
27
93
Ga
rie
p2
58
18
21
41
33
18
12
26
91
32
65
92
63
13
23
61
5K
om
ati
30
25
Ko
on
ap
29
82
23
31
03
34
42
88
52
66
8L
imp
op
o2
86
11
Ma
tla
ba
s2
94
62
55
53
24
11
29
96
29
34
29
14
27
46
PA
N 3
11
12
94
5P
AN
31
18
28
31
12
14
12
32
97
25
21
52
70
82
76
92
49
12
PA
N 3
12
02
76
12
23
88
31
21
52
29
16
26
41
02
76
92
57
9P
AN
31
44
34
12
30
93
PA
N 3
16
12
72
15
23
69
34
61
32
61
29
51
28
58
25
41
1P
AN
31
95
26
21
71
04
17
18
31
7P
AN
31
98
29
83
PA
N 3
35
53
36
32
79
12
PA
N 3
36
82
75
13
27
94
30
91
63
09
22
93
32
88
72
77
4P
AN
33
79
28
89
20
41
53
33
52
88
10
27
87
27
51
12
46
13
Se
nq
u2
92
82
98
13
29
83
06
12
95
1S
ST
31
62
84
10
22
71
12
56
10
SS
T 3
17
29
47
24
27
26
87
SS
T 3
47
29
64
25
46
31
51
42
56
14
28
05
28
86
27
55
SS
T 3
56
27
11
62
14
14
32
89
30
74
28
06
27
11
22
42
14
SS
T 3
87
22
11
91
57
16
29
91
72
09
17
22
21
12
26
14
18
91
6S
ST
39
82
99
12
86
23
15
13
30
02
29
22
Av
era
ge
28
02
32
32
52
83
27
62
80
25
5L
SD
t(0.0
5)
22
.83
27
.43
23
.92
25
.85
13
.45
15
.40
18
.88

53
Av
era
ge
yie
ld (
ton
/ha
) o
f e
ntr
ies
for
the
No
rth
We
ste
rn F
ree
Sta
te a
rea
(la
te p
lan
tin
g d
ate
)
du
rin
g t
he
fu
ll o
r p
art
ial
pe
rio
d f
rom
20
10
– 2
01
3
Cu
ltiv
ar
* 2
01
3R
20
12
R2
01
1R
20
10
R4
ye
ar
av
era
ge
R3
ye
ar
av
era
ge
R2
ye
ar
av
era
ge
R2
01
0-2
01
32
01
1-2
01
32
01
2-2
01
3B
ett
a–
DN
1.7
21
7C
ale
do
n3
.91
81
.97
8E
lan
ds
3.7
51
83
.74
16
3.5
91
51
.90
13
3.2
41
13
.69
14
3.7
41
7G
ari
ep
4.3
71
34
.38
93
.90
10
1.9
79
3.6
67
4.2
27
4.3
71
0K
om
ati
1.7
91
5K
oo
na
p4
.72
11
3.1
71
73
.48
16
3.7
91
23
.95
15
Lim
po
po
1.8
01
4M
atl
ab
as
5.5
45
4.4
08
3.7
71
12
.35
34
.01
54
.57
54
.97
6P
AN
31
11
5.4
47
PA
N 3
11
85
.99
14
.84
24
.08
52
.39
24
.33
14
.97
15
.42
1P
AN
31
44
3.4
61
71
.94
11
PA
N 3
16
15
.60
34
.74
44
.19
32
.30
44
.21
24
.84
25
.17
3P
AN
31
95
5.7
02
4.9
71
5.3
32
PA
N 3
19
84
.26
16
PA
N 3
35
54
.24
21
.77
16
PA
N 3
36
84
.18
17
3.7
41
53
.96
71
.90
12
3.4
51
03
.96
11
3.9
61
4P
AN
33
79
5.4
66
4.5
36
4.3
21
2.1
96
4.1
33
4.7
73
4.9
95
Se
nq
u4
.27
15
4.0
21
24
.19
44
.16
84
.15
13
SS
T 3
16
4.8
41
04
.52
74
.68
8S
ST
31
75
.58
44
.53
55
.05
4S
ST
34
75
.04
84
.31
10
3.7
31
32
.20
53
.82
64
.36
64
.67
9S
ST
35
64
.57
12
3.8
31
43
.77
12
1.9
61
03
.53
94
.06
10
4.2
01
2S
ST
37
44
.28
14
4.2
01
13
.91
82
.02
73
.60
84
.13
94
.24
11
SS
T 3
87
4.9
19
4.8
42
4.0
76
2.5
41
4.0
94
4.6
14
4.8
77
SS
T 3
98
3.6
81
93
.90
13
3.6
51
43
.74
13
3.7
91
6A
ve
rag
e4
.85
4.2
83
.89
2.0
43
.82
4.2
84
.56
LS
Dt(0
.05
)0
.77
0.3
60
.43
0.2
50
.20
0.2
60
.34

54
Av
era
ge
he
cto
litr
e m
ass
(k
g/h
l) o
f e
ntr
ies
for
the
No
rth
We
ste
rn F
ree
Sta
te a
rea
(la
te p
lan
tin
g d
ate
)
du
rin
g t
he
fu
ll o
r p
art
ial
pe
rio
d f
rom
20
10
– 2
01
3
Cu
ltiv
ar
* 2
01
3R
20
12
R2
01
1R
20
10
R4
ye
ar
av
era
ge
R3
ye
ar
av
era
ge
R2
ye
ar
av
era
ge
R
20
10
-20
13
20
11
-20
13
20
12
-20
13
Be
tta
–D
N7
9.5
63
Ca
led
on
78
.31
10
79
.29
5E
lan
ds
78
.78
87
6.8
24
79
.33
47
9.4
14
78
.59
57
8.3
16
77
.80
6G
ari
ep
80
.09
17
7.7
32
79
.19
77
9.7
41
79
.19
17
9.0
02
78
.91
1K
om
ati
79
.05
8K
oo
na
p7
9.6
64
76
.49
57
9.5
83
78
.58
37
8.0
85
Lim
po
po
78
.32
12
Ma
tla
ba
s7
7.6
91
77
5.7
18
77
.54
13
77
.32
16
77
.07
97
6.9
81
17
6.7
01
1P
AN
31
11
78
.11
13
PA
N 3
11
88
0.0
32
76
.35
67
9.2
35
79
.67
27
8.8
23
78
.54
47
8.1
93
PA
N 3
14
47
7.7
51
27
8.1
91
3P
AN
31
61
78
.93
77
5.0
11
17
8.2
61
17
9.2
16
77
.85
67
7.4
08
76
.97
9P
AN
31
95
78
.29
11
74
.31
15
76
.30
14
PA
N 3
19
87
8.5
79
PA
N 3
35
57
9.9
22
78
.65
10
PA
N 3
36
87
7.8
81
57
5.5
29
78
.72
97
7.9
51
47
7.5
27
77
.37
97
6.7
01
1P
AN
33
79
79
.95
37
7.2
63
80
.57
17
8.5
31
17
9.0
82
79
.26
17
8.6
12
Se
nq
u7
8.1
51
27
6.1
47
79
.00
87
7.7
67
77
.15
8S
ST
31
67
8.0
61
47
4.7
01
37
6.3
81
3S
ST
31
77
9.4
65
74
.93
12
77
.20
7S
ST
34
77
8.4
91
07
7.8
11
79
.22
67
9.1
47
78
.67
47
8.5
15
78
.15
4S
ST
35
67
7.8
01
67
3.9
01
77
6.4
81
57
6.8
61
77
6.2
61
17
6.0
61
27
5.8
51
5S
ST
37
47
8.9
56
74
.67
14
77
.52
14
77
.55
15
77
.17
87
7.0
51
07
6.8
11
0S
ST
38
77
7.2
21
87
4.0
21
67
5.4
91
77
8.7
69
76
.37
10
75
.58
14
75
.62
17
SS
T 3
98
76
.14
19
75
.38
10
76
.48
15
76
.00
13
75
.76
16
Av
era
ge
78
.54
75
.69
78
.39
78
.66
77
.87
77
.60
77
.13
LS
Dt(0
.05
)1
.94
0.5
01
.10
0.4
50
.48
0.6
20
.74

55
Av
era
ge
pro
tein
co
nte
nt
(%)
of
en
trie
s fo
r th
e N
ort
h W
est
ern
Fre
e S
tate
are
a (
late
pla
nti
ng
da
te)
du
rin
g t
he
fu
ll o
r p
art
ial
pe
rio
d f
rom
20
10
– 2
01
3
Cu
ltiv
ar
* 2
01
3R
20
12
R2
01
1R
20
10
R4
ye
ar
av
era
ge
R3
ye
ar
av
era
ge
R2
ye
ar
av
era
ge
R
20
10
-20
13
20
11
-20
13
20
12
-20
13
Be
tta
–D
N1
3.4
25
Ca
led
on
11
.56
51
3.5
43
Ela
nd
s1
5.0
57
12
.89
61
1.4
86
13
.33
71
3.1
93
13
.14
61
3.9
76
Ga
rie
p1
4.4
61
11
2.6
28
11
.07
11
12
.83
10
12
.74
51
2.7
28
13
.54
8K
om
ati
13
.36
6K
oo
na
p1
5.1
74
13
.76
21
1.7
91
13
.57
11
4.4
63
Lim
po
po
12
.94
8M
atl
ab
as
15
.71
11
3.3
63
11
.60
41
3.8
71
13
.64
11
3.5
62
14
.54
2P
AN
31
11
13
.82
15
PA
N 3
11
81
4.4
71
01
2.0
51
41
1.1
71
01
2.7
51
11
2.6
17
12
.56
11
13
.26
11
PA
N 3
14
41
1.7
52
13
.59
2P
AN
31
61
14
.82
91
2.1
61
31
0.8
01
51
2.6
41
31
2.6
18
12
.59
10
13
.49
10
PA
N 3
19
51
3.8
91
41
1.2
11
61
2.5
51
6P
AN
31
98
15
.13
6P
AN
33
55
10
.95
13
12
.61
14
PA
N 3
36
81
5.2
83
13
.88
11
1.2
07
13
.53
41
3.4
72
13
.45
41
4.5
81
PA
N 3
37
91
3.4
61
71
2.0
41
51
0.3
81
71
1.9
51
71
1.9
61
01
1.9
61
31
2.7
51
4S
en
qu
15
.16
51
3.2
74
11
.04
12
13
.16
51
4.2
15
SS
T 3
16
13
.03
18
12
.18
12
12
.60
15
SS
T 3
17
14
.13
13
12
.28
11
13
.21
12
SS
T 3
47
14
.97
81
2.3
71
01
1.1
99
12
.54
15
12
.77
41
2.8
47
13
.67
7S
ST
35
61
4.3
31
21
2.7
27
10
.87
14
12
.84
91
2.6
96
12
.64
91
3.5
29
SS
T 3
74
13
.47
16
12
.44
91
1.2
07
12
.74
12
12
.46
91
2.3
71
21
2.9
61
3S
ST
38
71
2.9
91
91
1.1
31
71
0.5
11
61
2.4
31
61
1.7
61
11
1.5
41
41
2.0
61
7S
ST
39
81
5.5
22
13
.22
51
1.6
23
13
.45
31
4.3
74
Av
era
ge
14
.46
12
.56
11
.19
12
.99
12
.72
12
.83
13
.51
LS
Dt(0
.05
)1
.07
0.7
00
.86
0.5
00
.36
0.4
80
.60

56
Av
era
ge
fa
llin
g n
um
be
r (s
) o
f e
ntr
ies
for
the
No
rth
We
ste
rn F
ree
Sta
te a
rea
(la
te p
lan
tin
g d
ate
)
du
rin
g t
he
fu
ll o
r p
art
ial
pe
rio
d f
rom
20
10
– 2
01
3
Cu
ltiv
ar
* 2
01
3R
20
12
R2
01
1R
20
10
R4
ye
ar
av
era
ge
R3
ye
ar
av
era
ge
R2
ye
ar
av
era
ge
R2
01
0-2
01
32
01
1-2
01
32
01
2-2
01
3B
ett
a–
DN
29
11
3C
ale
do
n2
82
83
23
3E
lan
ds
30
29
26
95
29
44
29
31
22
89
12
88
22
85
4G
ari
ep
29
51
32
19
11
25
21
33
06
52
68
62
55
10
25
71
1K
om
ati
30
17
Ko
on
ap
32
42
27
04
31
41
30
31
29
71
Lim
po
po
30
84
Ma
tla
ba
s2
45
19
29
91
29
72
28
31
42
81
22
80
62
72
7P
AN
31
11
27
81
6P
AN
31
18
29
61
21
92
14
25
91
22
48
15
24
91
02
49
13
24
41
4P
AN
31
44
28
36
29
88
PA
N 3
16
12
72
18
22
68
26
31
13
41
12
75
32
53
11
24
91
3P
AN
31
95
32
13
12
31
72
22
16
PA
N 3
19
83
05
7P
AN
33
55
28
37
33
12
PA
N 3
36
82
91
14
25
47
23
21
62
94
11
26
87
25
98
27
36
PA
N 3
37
93
27
12
17
12
24
71
42
97
92
72
42
63
72
72
8S
en
qu
30
01
02
76
32
73
92
83
42
88
3S
ST
31
63
02
82
16
13
25
91
0S
ST
31
73
10
62
24
92
67
9S
ST
34
72
99
11
25
66
29
25
23
31
62
70
52
82
52
77
5S
ST
35
62
89
15
22
21
02
43
15
30
26
26
49
25
11
22
55
12
SS
T 3
74
31
35
16
01
52
94
32
97
10
26
68
25
69
23
71
5S
ST
38
72
76
17
12
71
62
18
17
21
71
72
09
11
20
71
42
01
17
SS
T 3
98
31
54
27
62
26
81
02
86
32
96
2A
ve
rag
e2
98
22
52
70
29
22
65
26
52
62
LS
Dt(0
.05
)4
9.5
82
5.3
44
0.7
12
8.1
51
7.6
92
1.4
32
1.8
1

57
Av
era
ge
yie
ld (
ton
/ha
) o
f e
ntr
ies
for
the
Ce
ntr
al
Fre
e S
tate
are
a (
ea
rly
pla
nti
ng
da
te)
du
rin
g t
he
fu
ll o
r p
art
ial
pe
rio
d f
rom
20
10
– 2
01
3
Cu
ltiv
ar
20
13
R2
01
2R
20
11
R2
01
0 *
R4
ye
ar
av
era
ge
R3
ye
ar
av
era
ge
R2
ye
ar
av
era
ge
R
20
10
-20
13
20
11
-20
13
20
12
-20
13
Be
tta
–D
N1
.18
11
Ca
led
on
1.5
49
1.3
21
0E
lan
ds
1.5
71
82
.19
16
1.5
86
1.3
89
1.6
89
1.7
89
1.8
81
3G
ari
ep
1.4
11
92
.32
12
1.7
01
1.1
31
31
.64
11
1.7
11
32
.01
8K
om
ati
1.5
26
Ko
on
ap
1.5
71
62
.05
17
1.4
21
61
.73
11
1.7
31
7L
imp
op
o0
.90
16
Ma
tla
ba
s2
.07
42
.51
51
.70
22
.09
22
.09
22
.10
12
.10
4P
AN
31
11
2.4
02
PA
N 3
11
81
.77
10
2.4
28
1.5
85
1.4
18
1.8
05
1.8
17
2.0
09
PA
N 3
12
02
.01
72
.44
71
.55
82
.13
12
.03
32
.04
32
.00
10
PA
N 3
14
41
.47
13
1.4
27
PA
N 3
16
11
.82
82
.49
61
.65
41
.06
15
1.7
57
1.7
31
22
.07
5P
AN
31
95
2.0
75
2.6
22
2.6
21
PA
N 3
19
81
.80
9P
AN
33
55
1.5
87
0.8
51
7P
AN
33
64
PA
N 3
36
81
.65
14
2.4
01
01
.46
14
1.0
71
41
.64
10
1.6
41
41
.93
11
PA
N 3
37
91
.57
17
2.4
19
1.6
63
1.1
31
21
.69
81
.73
10
2.0
47
Se
nq
u1
.67
12
2.2
61
41
.44
15
1.8
56
1.8
51
5S
ST
31
61
.67
13
2.5
24
2.5
22
SS
T 3
17
2.0
56
2.3
91
12
.39
3S
ST
34
72
.41
12
.66
11
.48
12
2.0
83
2.1
61
2.0
72
2.0
76
SS
T 3
56
1.6
31
52
.27
13
1.4
81
01
.66
51
.76
61
.80
81
.88
14
SS
T 3
87
1.7
01
12
.20
15
1.4
81
01
.90
41
.82
41
.86
51
.84
16
SS
T 3
98
2.1
63
2.6
13
1.2
31
71
.92
41
.92
12
Av
era
ge
1.8
42
.40
1.5
31
.42
1.8
21
.90
2.1
0L
SD
t(0.0
5)
0.2
20
.24
0.1
50
.29
0.1
10
.12
0.1
6

58
Av
era
ge
he
cto
litr
e m
ass
(k
g/h
l) o
f e
ntr
ies
for
the
Ce
ntr
al
Fre
e S
tate
are
a (
ea
rly
pla
nti
ng
da
te)
du
rin
g t
he
fu
ll o
r p
art
ial
pe
rio
d f
rom
20
10
– 2
01
3
Cu
ltiv
ar
20
13
R2
01
2R
20
11
R2
01
0 *
R4
ye
ar
av
era
ge
R3
ye
ar
av
era
ge
R2
ye
ar
av
era
ge
R2
01
0-2
01
32
01
1-2
01
32
01
2-2
01
3B
ett
a–
DN
77
.40
4C
ale
do
n7
5.4
41
07
7.0
08
Ela
nd
s7
8.4
66
78
.67
57
6.0
67
77
.20
67
7.6
05
77
.73
57
8.5
74
Ga
rie
p7
8.7
45
78
.63
67
6.9
36
76
.80
97
7.7
74
77
.45
67
7.7
86
Ko
ma
ti7
6.5
01
0K
oo
na
p7
9.9
62
79
.52
47
7.5
83
78
.55
37
8.5
55
Lim
po
po
76
.00
12
Ma
tla
ba
s7
8.1
69
78
.26
77
5.7
79
77
.30
57
7.3
77
77
.11
87
7.0
29
PA
N 3
11
17
7.7
81
5P
AN
31
18
77
.71
16
77
.73
12
77
.39
47
7.2
06
77
.51
67
7.4
47
77
.56
8P
AN
31
20
78
.76
48
0.3
81
78
.66
17
9.2
01
79
.25
27
9.4
11
79
.52
1P
AN
31
44
74
.89
15
76
.00
12
PA
N 3
16
17
6.8
81
87
7.9
59
75
.97
87
2.1
01
77
5.7
21
07
5.3
41
37
6.9
61
0P
AN
31
95
77
.76
15
76
.48
14
76
.48
12
PA
N 3
19
87
7.9
51
2P
AN
33
55
75
.44
10
73
.60
15
PA
N 3
36
4P
AN
33
68
77
.80
13
77
.81
10
75
.03
14
73
.60
15
76
.06
97
5.4
81
27
6.4
21
4P
AN
33
79
79
.16
37
9.9
43
77
.39
47
6.1
01
17
8.1
53
77
.81
47
8.6
73
Se
nq
u7
8.3
37
78
.12
87
5.0
41
37
6.5
89
76
.58
11
SS
T 3
16
77
.08
17
75
.59
15
75
.59
15
SS
T 3
17
77
.98
11
77
.61
13
77
.61
7S
ST
34
78
0.9
91
80
.08
27
7.7
92
79
.20
17
9.5
11
79
.02
27
8.9
42
SS
T 3
56
76
.83
19
74
.32
17
72
.67
17
75
.90
14
74
.93
11
74
.30
14
73
.50
17
SS
T 3
87
78
.21
87
4.6
61
67
4.2
41
67
8.0
03
76
.28
87
5.6
31
17
4.4
51
6S
ST
39
87
8.1
01
07
7.7
91
17
5.0
91
27
6.4
41
07
6.4
41
3A
ve
rag
e7
8.2
47
7.8
67
5.9
67
6.4
27
7.2
97
7.5
67
8.0
7L
SD
t(0.0
5)
0.6
20
.56
0.7
32
.03
0.4
30
.40
0.4
1

59
Av
era
ge
pro
tein
co
nte
nt
(%)
of
en
trie
s fo
r th
e C
en
tra
l F
ree
Sta
te a
rea
(e
arl
y p
lan
tin
g d
ate
)
du
rin
g t
he
fu
ll o
r p
art
ial
pe
rio
d f
rom
20
10
– 2
01
3
Cu
ltiv
ar
20
13
R2
01
2R
20
11
R2
01
0 *
R4
ye
ar
av
era
ge
R3
ye
ar
av
era
ge
R2
ye
ar
av
era
ge
R
20
10
-20
13
20
11
-20
13
20
12
-20
13
Be
tta
–D
N1
6.1
44
Ca
led
on
14
.77
21
5.4
41
0E
lan
ds
14
.95
41
4.3
59
14
.34
10
15
.29
12
14
.73
51
4.5
58
14
.65
4G
ari
ep
15
.05
21
4.6
14
13
.97
13
16
.64
21
5.0
73
15
.07
31
4.2
91
0K
om
ati
15
.96
5K
oo
na
p1
4.4
68
15
.13
21
4.5
07
14
.82
61
4.8
22
Lim
po
po
15
.70
9M
atl
ab
as
13
.90
10
14
.99
31
4.3
69
15
.39
11
14
.66
61
4.9
15
14
.68
3P
AN
31
11
13
.50
15
PA
N 3
11
81
5.5
21
14
.52
61
4.2
11
11
6.8
41
15
.27
11
5.1
91
14
.37
9P
AN
31
20
14
.26
91
5.3
51
14
.72
31
4.7
91
61
4.7
84
14
.95
41
5.0
41
PA
N 3
14
41
4.6
16
15
.81
8P
AN
31
61
13
.86
11
13
.60
17
13
.44
17
15
.84
71
4.1
88
14
.29
10
13
.52
17
PA
N 3
19
51
3.7
01
21
3.6
61
61
3.6
61
6P
AN
31
98
14
.60
6P
AN
33
55
14
.12
12
15
.88
6P
AN
33
64
PA
N 3
36
81
4.9
73
14
.40
81
4.7
14
16
.40
31
5.1
22
15
.17
21
4.5
67
PA
N 3
37
91
4.5
67
13
.80
14
13
.74
14
15
.18
13
14
.32
71
4.2
41
21
3.7
71
4S
en
qu
14
.84
51
4.5
95
14
.43
81
4.5
19
14
.51
8S
ST
31
61
3.3
61
51
4.2
11
11
4.2
11
2S
ST
31
71
3.5
11
31
4.2
21
01
4.2
21
1S
ST
34
71
2.9
11
91
3.7
41
51
3.6
01
61
4.8
11
51
3.7
61
11
4.0
51
41
3.6
71
5S
ST
35
61
3.1
91
71
4.1
81
21
5.0
01
13
.48
17
13
.96
91
4.2
21
31
4.5
95
SS
T 3
87
13
.02
18
14
.03
13
13
.68
15
15
.04
14
13
.94
10
14
.25
11
13
.86
13
SS
T 3
98
13
.34
16
14
.50
71
4.6
25
14
.56
71
4.5
66
Av
era
ge
14
.08
14
.35
14
.28
15
.57
14
.53
14
.28
14
.21
LS
Dt(0
.05
)0
.85
0.5
10
.68
0.8
20
.38
0.3
90
.47
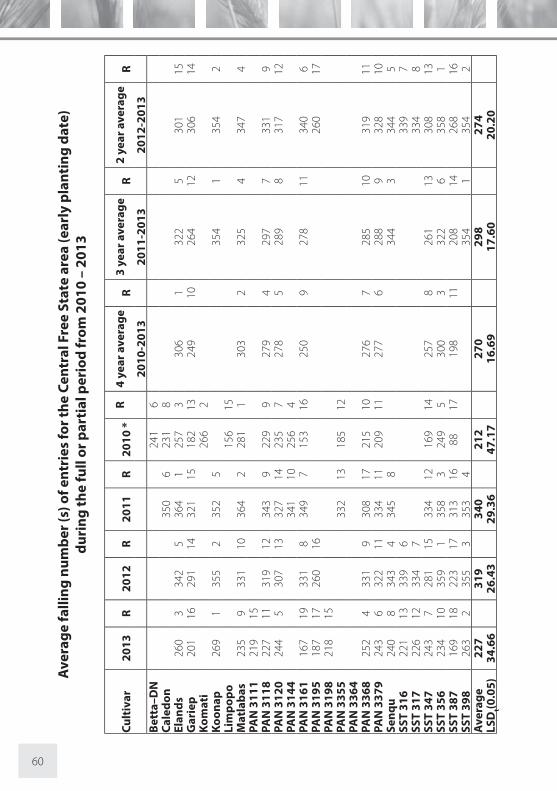
60
Av
era
ge
fa
llin
g n
um
be
r (s
) o
f e
ntr
ies
for
the
Ce
ntr
al
Fre
e S
tate
are
a (
ea
rly
pla
nti
ng
da
te)
du
rin
g t
he
fu
ll o
r p
art
ial
pe
rio
d f
rom
20
10
– 2
01
3
Cu
ltiv
ar
20
13
R2
01
2R
20
11
R2
01
0 *
R4
ye
ar
av
era
ge
R3
ye
ar
av
era
ge
R2
ye
ar
av
era
ge
R
20
10
-20
13
20
11
-20
13
20
12
-20
13
Be
tta
–D
N2
41
6C
ale
do
n3
50
62
31
8E
lan
ds
26
03
34
25
36
41
25
73
30
61
32
25
30
11
5G
ari
ep
20
11
62
91
14
32
11
51
82
13
24
91
02
64
12
30
61
4K
om
ati
26
62
Ko
on
ap
26
91
35
52
35
25
35
41
35
42
Lim
po
po
15
61
5M
atl
ab
as
23
59
33
11
03
64
22
81
13
03
23
25
43
47
4P
AN
31
11
21
91
5P
AN
31
18
22
71
13
19
12
34
39
22
99
27
94
29
77
33
19
PA
N 3
12
02
44
53
07
13
32
71
42
35
72
78
52
89
83
17
12
PA
N 3
14
43
41
10
25
64
PA
N 3
16
11
67
19
33
18
34
97
15
31
62
50
92
78
11
34
06
PA
N 3
19
51
87
17
26
01
62
60
17
PA
N 3
19
82
18
15
PA
N 3
35
53
32
13
18
51
2P
AN
33
64
PA
N 3
36
82
52
43
31
93
08
17
21
51
02
76
72
85
10
31
91
1P
AN
33
79
24
36
32
21
13
34
11
20
91
12
77
62
88
93
28
10
Se
nq
u2
40
83
43
43
45
83
44
33
44
5S
ST
31
62
21
13
33
96
33
97
SS
T 3
17
22
61
23
34
73
34
8S
ST
34
72
43
72
81
15
33
41
21
69
14
25
78
26
11
33
08
13
SS
T 3
56
23
41
03
59
13
58
32
49
53
00
33
22
63
58
1S
ST
38
71
69
18
22
31
73
13
16
88
17
19
81
12
08
14
26
81
6S
ST
39
82
63
23
55
33
53
43
54
13
54
2A
ve
rag
e2
27
31
93
40
21
22
70
29
82
74
LS
Dt(0
.05
)3
4.6
62
6.4
32
9.3
64
7.1
71
6.6
91
7.6
02
0.2
0
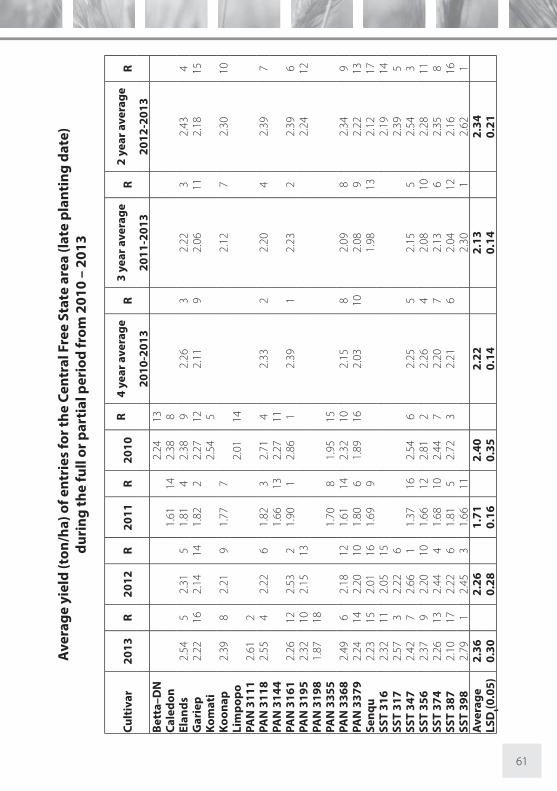
61
Av
era
ge
yie
ld (
ton
/ha
) o
f e
ntr
ies
for
the
Ce
ntr
al
Fre
e S
tate
are
a (
late
pla
nti
ng
da
te)
du
rin
g t
he
fu
ll o
r p
art
ial
pe
rio
d f
rom
20
10
– 2
01
3
Cu
ltiv
ar
20
13
R2
01
2R
20
11
R2
01
0
R4
ye
ar
av
era
ge
R3
ye
ar
av
era
ge
R2
ye
ar
av
era
ge
R
2
01
0-2
01
32
01
1-2
01
32
01
2-2
01
3B
ett
a–
DN
2.2
41
3
C
ale
do
n
1
.61
14
2.3
88
Ela
nd
s2
.54
52
.31
51
.81
42
.38
92
.26
32
.22
32
.43
4G
ari
ep
2.2
21
62
.14
14
1.8
22
2.2
71
22
.11
92
.06
11
2.1
81
5K
om
ati
2.5
45
Ko
on
ap
2.3
98
2.2
19
1.7
77
2.1
27
2.3
01
0L
imp
op
o
2
.01
14
PA
N 3
11
12
.61
2
P
AN
31
18
2.5
54
2.2
26
1.8
23
2.7
14
2.3
32
2.2
04
2.3
97
PA
N 3
14
4
1
.66
13
2.2
71
1
P
AN
31
61
2.2
61
22
.53
21
.90
12
.86
12
.39
12
.23
22
.39
6P
AN
31
95
2.3
21
02
.15
13
2.2
41
2P
AN
31
98
1.8
71
8
P
AN
33
55
1.7
08
1.9
51
5
P
AN
33
68
2.4
96
2.1
81
21
.61
14
2.3
21
02
.15
82
.09
82
.34
9P
AN
33
79
2.2
41
42
.20
10
1.8
06
1.8
91
62
.03
10
2.0
89
2.2
21
3S
en
qu
2.2
31
52
.01
16
1.6
99
1.9
81
32
.12
17
SS
T 3
16
2.3
21
12
.05
15
2.1
91
4S
ST
31
72
.57
32
.22
6
2
.39
5S
ST
34
72
.42
72
.66
11
.37
16
2.5
46
2.2
55
2.1
55
2.5
43
SS
T 3
56
2.3
79
2.2
01
01
.66
12
2.8
12
2.2
64
2.0
81
02
.28
11
SS
T 3
74
2.2
61
32
.44
41
.68
10
2.4
47
2.2
07
2.1
36
2.3
58
SS
T 3
87
2.1
01
72
.22
61
.81
52
.72
32
.21
62
.04
12
2.1
61
6S
ST
39
82
.79
12
.45
31
.66
11
2.3
01
2.6
21
Av
era
ge
2.3
6
2.2
6
1.7
1
2.4
0
2.2
2
2.1
32
.34
L
SD
t(0.0
5)
0.3
0
0.2
8
0.1
6
0.3
5
0.1
4
0.1
4
0.2
1

62
Av
era
ge
he
cto
litr
e m
ass
(k
g/h
l) o
f e
ntr
ies
for
the
Ce
ntr
al
Fre
e S
tate
are
a (
late
pla
nti
ng
da
te)
du
rin
g t
he
fu
ll o
r p
art
ial
pe
rio
d f
rom
20
10
– 2
01
3
Cu
ltiv
ar
20
13
R2
01
2R
20
11
R2
01
0
R4
ye
ar
av
era
ge
R3
ye
ar
av
era
ge
R2
ye
ar
av
era
ge
R
20
10
-20
13
20
11
-20
13
20
12
-20
13
Be
tta
–D
N
8
0.2
02
Ca
led
on
75
.02
10
79
.00
8
E
lan
ds
79
.71
27
7.5
07
75
.97
67
9.3
06
78
.12
37
7.7
35
78
.61
7G
ari
ep
78
.99
77
6.2
01
27
6.0
45
78
.90
97
7.5
35
77
.08
77
7.5
91
0K
om
ati
79
.50
4
K
oo
na
p8
0.6
91
79
.10
37
7.3
62
79
.05
17
9.8
92
Lim
po
po
78
.00
12
PA
N 3
11
17
7.7
91
1
P
AN
31
18
78
.94
87
9.4
02
77
.14
37
9.8
03
78
.82
27
8.4
93
79
.17
3P
AN
31
44
74
.60
12
79
.30
6
P
AN
31
61
77
.69
12
76
.90
97
5.9
76
78
.40
10
77
.24
67
6.8
58
77
.29
11
PA
N 3
19
57
6.8
11
67
5.5
01
3
7
6.1
61
3P
AN
31
98
77
.55
13
PA
N 3
35
5
7
4.0
31
47
6.3
01
5
P
AN
33
68
78
.71
10
76
.80
10
75
.04
97
8.0
01
27
7.1
47
76
.85
97
7.7
69
PA
N 3
37
97
9.0
96
78
.40
57
6.2
34
78
.10
11
77
.95
47
7.9
14
78
.74
5S
en
qu
79
.50
37
6.7
01
17
5.0
68
77
.09
67
8.1
08
SS
T 3
16
76
.43
17
74
.60
15
75
.51
15
SS
T 3
17
78
.76
97
8.7
04
78
.73
6S
ST
34
77
9.4
15
81
.50
17
4.8
51
18
1.6
01
79
.34
17
8.5
92
80
.46
1S
ST
35
67
6.3
51
87
3.8
01
67
8.0
61
77
.00
14
76
.30
97
6.0
71
17
5.0
81
6S
ST
37
47
6.8
61
57
7.1
08
72
.08
16
76
.10
16
75
.54
10
75
.35
13
76
.98
12
SS
T 3
87
77
.15
14
74
.70
14
74
.40
13
79
.40
57
6.4
18
75
.42
12
75
.93
14
SS
T 3
98
79
.50
37
8.4
05
72
.36
15
76
.75
10
78
.95
4A
ve
rag
e7
8.3
3
77
.21
7
5.2
6
78
.68
7
7.4
4
77
.17
7
7.8
1
LS
Dt(0
.05
)0
.84
0
.83
0
.86
0
.46
0
.49
0
.51
0
.59

63
Av
era
ge
pro
tein
co
nte
nt
(%)
of
en
trie
s fo
r th
e C
en
tra
l F
ree
Sta
te (
late
pla
nti
ng
da
te)
du
rin
g t
he
fu
ll o
r p
art
ial
pe
rio
d f
rom
20
10
– 2
01
3
Cu
ltiv
ar
20
13
R2
01
2R
20
11
R2
01
0
R4
ye
ar
av
era
ge
R3
ye
ar
av
era
ge
R2
ye
ar
av
era
ge
R
20
10
-20
13
20
11
-20
13
20
12
-20
13
Be
tta
–D
N
1
5.1
36
Ca
led
on
15
.96
41
5.4
42
Ela
nd
s1
3.7
76
15
.04
81
5.8
76
14
.43
12
14
.78
31
4.8
96
14
.41
6G
ari
ep
13
.59
71
4.7
91
11
5.1
91
41
4.9
89
14
.64
41
4.5
28
14
.19
9K
om
ati
15
.18
4
K
oo
na
p1
4.0
91
15
.11
71
6.2
71
1
5.1
62
14
.60
2L
imp
op
o
1
5.2
53
PA
N 3
11
11
2.5
71
7
PA
N 3
11
81
4.0
42
16
.04
11
6.1
52
14
.65
10
15
.22
11
5.4
11
15
.04
1P
AN
31
44
15
.54
10
15
.04
8
P
AN
31
61
13
.37
10
14
.31
41
5.0
81
51
3.6
61
31
4.1
09
14
.25
12
13
.83
13
PA
N 3
19
51
3.0
61
21
4.7
71
2
1
3.9
11
0P
AN
31
98
13
.89
4
P
AN
33
55
15
.83
71
5.1
55
PA
N 3
36
81
3.9
13
15
.04
81
5.8
08
15
.64
11
5.1
02
14
.92
51
4.4
74
PA
N 3
37
91
3.2
81
11
4.1
61
61
4.8
31
61
5.1
17
14
.35
71
4.0
91
31
3.7
21
5S
en
qu
13
.86
51
5.3
45
15
.66
9
14
.95
31
4.6
03
SS
T 3
16
13
.04
13
15
.51
3
14
.27
8S
ST
31
71
2.7
91
51
4.9
91
0
13
.89
11
SS
T 3
47
12
.65
16
14
.47
13
16
.06
31
3.6
11
41
4.2
08
14
.39
91
3.5
61
6S
ST
35
61
2.9
71
41
5.6
32
15
.35
12
13
.51
15
14
.36
61
4.6
57
14
.30
7S
ST
37
41
3.3
89
14
.27
15
15
.41
11
14
.65
11
14
.43
51
4.3
51
01
3.8
21
4S
ST
38
71
2.4
81
81
5.2
16
15
.31
13
13
.24
16
14
.06
10
14
.33
11
13
.85
12
SS
T 3
98
13
.48
81
5.4
64
15
.88
5
14
.94
41
4.4
75
Av
era
ge
13
.35
1
5.0
1
15
.64
1
4.6
7
14
.52
1
4.6
8
14
.18
LS
Dt(0
.05
)0
.71
0
.67
0
.84
0
.89
0
.43
0
.46
0
.49

64
Av
era
ge
fa
llin
g n
um
be
r (s
) o
f e
ntr
ies
for
the
Ce
ntr
al
Fre
e S
tate
(la
te p
lan
tin
g d
ate
)
du
rin
g t
he
fu
ll o
r p
art
ial
pe
rio
d f
rom
20
10
– 2
01
3
Cu
ltiv
ar
20
13
R2
01
2R
20
11
R2
01
0R
4 y
ea
r a
ve
rag
eR
3 y
ea
r a
ve
rag
eR
2 y
ea
r a
ve
rag
eR
20
10
-20
13
20
11
-20
13
20
12
-20
13
Be
tta
–D
N2
46
10
Ca
led
on
31
01
32
69
5E
lan
ds
28
61
73
93
43
73
12
73
33
31
23
51
23
40
7G
ari
ep
26
51
83
19
14
31
11
22
42
11
28
49
29
81
32
92
15
Ko
ma
ti2
60
8K
oo
na
p3
11
24
00
13
59
33
57
13
55
1L
imp
op
o2
18
14
PA
N 3
11
13
25
1P
AN
31
18
30
26
37
08
30
11
42
69
43
11
53
24
10
33
68
PA
N 3
14
43
34
10
30
31
PA
N 3
16
12
90
14
36
71
03
36
92
20
13
30
38
33
16
32
99
PA
N 3
19
53
10
33
16
15
31
31
4P
AN
31
98
30
45
PA
N 3
35
53
43
61
98
15
PA
N 3
36
82
96
83
90
62
97
15
26
46
31
24
32
77
34
35
PA
N 3
37
93
06
43
99
23
44
52
97
23
36
13
50
33
52
2S
en
qu
30
17
38
57
33
11
13
39
53
43
4S
ST
31
62
96
93
90
53
43
6S
ST
31
72
87
16
37
08
32
81
0S
ST
34
72
90
15
35
01
13
42
72
38
12
30
57
32
78
32
01
2S
ST
35
62
94
11
39
83
33
98
25
99
32
23
34
44
34
63
SS
T 3
74
29
11
33
38
13
34
94
26
17
31
06
32
69
31
41
3S
ST
38
72
92
12
27
71
63
63
21
29
16
26
51
03
11
11
28
41
6S
ST
39
82
95
10
34
51
22
75
16
30
51
23
20
11
Av
era
ge
29
73
63
33
22
47
30
83
30
32
9L
SD
t(0.0
5)
12
.89
41
.25
39
.41
52
.65
19
.80
21
.77
21
.65

65
Av
era
ge
yie
ld (
ton
/ha
) o
f e
ntr
ies
for
the
Ea
ste
rn F
ree
Sta
te a
rea
(e
arl
y p
lan
tin
g d
ate
)
du
rin
g t
he
fu
ll o
r p
art
ial
pe
rio
d f
rom
20
10
– 2
01
3
Cu
ltiv
ar
20
13
R2
01
2R
20
11
R2
01
0R
4 y
ea
r a
ve
rag
eR
3 y
ea
r a
ve
rag
eR
2 y
ea
r a
ve
rag
eR
20
10
-20
13
20
11
-20
13
20
12
-20
13
Be
tta
–D
N2
.19
14
Ca
led
on
2.2
61
22
.53
8E
lan
ds
2.2
41
64
.72
92
.37
72
.34
12
2.9
29
3.1
19
3.4
81
2G
ari
ep
1.8
41
74
.59
14
2.4
24
2.5
01
02
.84
10
2.9
51
23
.22
15
Ko
on
ap
1.7
01
94
.69
10
2.2
91
12
.89
14
3.2
01
7K
om
ati
2.5
39
Lim
po
po
2.1
01
6M
atl
ab
as
3.7
41
4.7
38
2.4
72
2.9
94
3.4
81
3.6
41
4.2
31
PA
N 3
11
13
.54
2P
AN
31
18
2.6
61
04
.27
16
2.4
05
2.6
27
2.9
98
3.1
11
03
.46
13
PA
N 3
12
02
.66
11
4.0
91
72
.49
13
.22
13
.11
63
.08
11
3.3
71
4P
AN
31
44
2.2
21
42
.17
15
PA
N 3
16
12
.57
12
5.2
01
2.4
43
2.9
95
3.3
04
3.4
03
3.8
87
PA
N 3
19
53
.00
94
.64
12
3.8
29
PA
N 3
19
82
.27
15
PA
N 3
35
52
.33
92
.07
17
PA
N 3
36
82
.51
13
5.1
42
2.2
91
02
.35
11
3.0
77
3.3
16
3.8
28
PA
N 3
37
91
.73
18
4.6
81
12
.33
82
.30
13
2.7
61
12
.92
13
3.2
11
6S
en
qu
2.3
01
44
.82
52
.21
15
3.1
18
3.5
61
1S
ST
31
63
.23
54
.97
44
.10
3S
ST
31
73
.28
44
.99
34
.14
2S
ST
34
73
.21
74
.74
72
.25
13
2.9
86
3.3
03
.40
43
.97
5S
ST
35
63
.33
34
.62
13
2.3
76
3.0
93
3.3
52
3.4
42
3.9
76
SS
T 3
87
3.2
26
4.7
56
2.1
81
63
.14
23
.32
33
.38
53
.98
4S
ST
39
83
.01
84
.52
15
2.1
51
73
.23
73
.77
10
Av
era
ge
2.7
44
.72
2.3
22
.59
3.1
33
.21
3.7
2L
SD
t(0.0
5)
0.3
50
.24
0.1
70
.22
0.1
10
.13
0.2
0

66
Av
era
ge
he
cto
litr
e m
ass
(k
g/h
l) o
f e
ntr
ies
for
the
Ea
ste
rn F
ree
Sta
te a
rea
(e
arl
y p
lan
tin
g d
ate
)
du
rin
g t
he
fu
ll o
r p
art
ial
pe
rio
d f
rom
20
10
– 2
01
3
Cu
ltiv
ar
20
13
R2
01
2R
20
11
R2
01
0R
4 y
ea
r a
ve
rag
eR
3 y
ea
r a
ve
rag
eR
2 y
ea
r a
ve
rag
eR
20
10
-20
13
20
11
-20
13
20
12
-20
13
Be
tta
–D
N7
9.6
34
Ca
led
on
76
.36
13
78
.81
9E
lan
ds
76
.34
13
80
.47
37
6.7
41
07
8.4
61
17
8.0
05
77
.85
77
8.4
18
Ga
rie
p7
7.0
78
79
.06
97
6.7
98
79
.69
37
8.1
54
77
.64
97
8.0
71
0K
oo
na
p7
7.9
52
81
.51
17
7.6
63
79
.04
27
9.7
32
Ko
ma
ti7
9.5
35
Lim
po
po
78
.47
10
Ma
tla
ba
s7
7.7
13
78
.97
10
77
.56
57
8.3
81
27
8.1
63
78
.08
47
8.3
49
PA
N 3
11
17
7.2
56
PA
N 3
11
87
6.6
31
27
7.1
71
57
7.6
04
79
.43
67
7.7
18
77
.13
11
76
.90
12
PA
N 3
12
07
6.9
89
79
.93
77
9.1
71
78
.85
87
8.7
32
78
.69
37
8.4
66
PA
N 3
14
47
6.3
41
47
8.0
61
4P
AN
31
61
74
.14
19
77
.48
13
76
.77
97
8.1
21
37
6.6
31
17
6.1
31
37
5.8
11
6P
AN
31
95
75
.97
14
76
.90
16
76
.44
14
PA
N 3
19
87
5.9
21
5P
AN
33
55
75
.78
17
75
.65
17
PA
N 3
36
87
7.2
27
80
.06
67
6.7
31
17
7.9
51
67
7.9
96
78
.00
57
8.6
44
PA
N 3
37
97
6.8
11
07
8.5
41
17
7.1
86
78
.88
77
7.8
57
77
.51
10
77
.68
11
Se
nq
u7
6.6
61
18
0.3
55
76
.44
12
77
.82
87
8.5
15
SS
T 3
16
75
.73
17
77
.67
12
76
.70
13
SS
T 3
17
77
.70
48
0.4
64
79
.08
3S
ST
34
78
0.0
61
81
.40
27
8.4
22
80
.94
18
0.2
17
9.9
61
80
.73
1S
ST
35
67
5.1
61
87
7.4
81
37
6.0
61
57
7.9
71
57
6.6
71
07
6.2
31
27
6.3
21
5S
ST
38
77
5.9
21
57
5.6
91
77
6.0
41
67
9.7
42
76
.85
97
5.8
81
47
5.8
11
7S
ST
39
87
7.2
85
79
.62
87
6.9
67
77
.95
67
8.4
57
Av
era
ge
76
.76
78
.99
76
.98
78
.74
77
.90
77
.71
77
.89
LS
Dt(0
.05
)0
.86
0.6
60
.76
0.6
40
.38
0.4
50
.53

67
Av
era
ge
pro
tein
co
nte
nt
(%)
of
en
trie
s fo
r th
e E
ast
ern
Fre
e S
tate
are
a (
ea
rly
pla
nti
ng
da
te)
du
rin
g t
he
fu
ll o
r p
art
ial
pe
rio
d f
rom
20
10
– 2
01
3
Cu
ltiv
ar
20
13
R2
01
2R
20
11
R2
01
0R
4 y
ea
r a
ve
rag
eR
3 y
ea
r a
ve
rag
eR
2 y
ea
r a
ve
rag
eR
20
10
-20
13
20
11
-20
13
20
12
-20
13
Be
tta
–D
N1
5.6
44
Ca
led
on
14
.89
12
15
.17
12
Ela
nd
s1
6.0
96
12
.84
91
4.9
69
15
.19
10
14
.77
51
4.6
38
14
.47
8G
ari
ep
16
.58
41
2.8
21
11
4.8
81
31
5.2
79
14
.89
41
4.7
66
14
.70
6K
oo
na
p1
6.7
42
14
.12
11
4.8
31
41
5.2
31
15
.43
1K
om
ati
15
.49
6L
imp
op
o1
5.3
67
Ma
tla
ba
s1
4.9
91
31
3.0
96
14
.96
91
5.8
52
14
.72
61
4.3
59
14
.04
10
PA
N 3
11
11
4.4
61
8P
AN
31
18
16
.62
31
2.9
58
14
.97
81
5.6
53
15
.05
21
4.8
55
14
.79
4P
AN
31
20
15
.76
10
13
.51
31
5.0
06
15
.31
81
4.9
03
14
.76
71
4.6
47
PA
N 3
14
41
5.5
11
15
.59
5P
AN
31
61
15
.17
12
12
.17
16
14
.70
15
14
.39
15
14
.11
91
4.0
11
11
3.6
71
4P
AN
31
95
15
.34
11
12
.46
13
13
.90
11
PA
N 3
19
81
5.8
77
PA
N 3
35
51
5.0
15
15
.19
10
PA
N 3
36
81
6.7
61
13
.09
61
5.0
84
15
.90
11
5.2
11
14
.98
21
4.9
32
PA
N 3
37
91
5.7
98
11
.87
17
14
.70
15
15
.11
13
14
.37
71
4.1
21
01
3.8
31
2S
en
qu
16
.39
51
3.4
24
15
.10
21
4.9
73
14
.91
3S
ST
31
61
4.6
31
61
2.2
71
51
3.4
51
6S
ST
31
71
4.8
91
41
3.2
95
14
.09
9S
ST
34
71
4.7
11
51
2.8
49
14
.49
17
14
.47
14
14
.13
14
.01
11
13
.78
13
SS
T 3
56
14
.30
19
12
.43
14
15
.00
61
3.7
81
71
3.8
81
11
3.9
11
41
3.3
71
7S
ST
38
71
4.5
41
71
2.5
21
21
4.9
11
11
4.0
81
61
4.0
11
01
3.9
91
31
3.5
31
5S
ST
39
81
5.7
89
13
.69
21
5.1
02
14
.86
41
4.7
45
Av
era
ge
15
.55
12
.90
14
.95
15
.14
14
.55
14
.53
14
.25
LS
Dt(0
.05
)0
.56
0.5
20
.39
0.3
90
.23
0.2
70
.39

68
Av
era
ge
fa
llin
g n
um
be
r (s
) o
f e
ntr
ies
for
the
Ea
ste
rn F
ree
Sta
te a
rea
(e
arl
y p
lan
tin
g d
ate
)
du
rin
g t
he
fu
ll o
r p
art
ial
pe
rio
d f
rom
20
10
– 2
01
3
Cu
ltiv
ar
20
13
R2
01
2R
20
11
R2
01
0R
4 y
ea
r a
ve
rag
eR
3 y
ea
r a
ve
rag
eR
2 y
ea
r a
ve
rag
eR
20
10
-20
13
20
11
-20
13
20
12
-20
13
Be
tta
–D
N2
74
4C
ale
do
n2
99
10
26
08
Ela
nd
s2
37
14
34
29
31
92
28
12
29
53
29
99
28
91
3G
ari
ep
22
91
53
42
92
99
92
48
92
80
82
90
11
28
61
4K
oo
na
p2
66
93
68
23
22
13
19
13
17
2K
om
ati
26
57
Lim
po
po
22
31
3M
atl
ab
as
29
01
34
75
28
71
42
44
11
29
24
30
84
31
91
PA
N 3
11
12
79
4P
AN
31
18
27
56
34
38
28
91
32
44
10
28
85
30
28
30
95
PA
N 3
12
02
89
33
22
17
29
71
12
26
12
28
37
30
37
30
51
0P
AN
31
44
30
17
27
45
PA
N 3
16
12
05
18
34
47
28
41
52
16
16
26
29
27
81
22
75
15
PA
N 3
19
52
46
13
37
01
30
87
PA
N 3
19
82
12
17
PA
N 3
35
53
09
62
20
14
PA
N 3
36
82
51
12
33
31
32
96
12
26
86
28
76
29
31
02
92
12
PA
N 3
37
92
61
10
36
73
31
04
28
61
30
61
31
32
31
43
Se
nq
u2
57
11
33
81
23
17
33
04
62
98
11
SS
T 3
16
27
27
34
56
30
86
SS
T 3
17
29
02
32
41
63
07
9S
ST
34
72
18
16
32
61
52
73
16
21
91
52
59
27
21
32
72
16
SS
T 3
56
27
18
34
94
30
95
27
63
30
12
30
93
31
04
SS
T 3
87
20
01
93
31
14
26
31
71
17
17
22
81
12
65
14
26
51
7S
ST
39
82
77
53
38
11
30
08
30
55
30
88
Av
era
ge
25
43
43
29
92
43
28
02
97
29
9L
SD
t(0.0
5)
30
.77
18
.11
17
.50
21
.20
9.8
01
1.9
71
6.2
4

69
Av
era
ge
yie
ld (
ton
/ha
) o
f e
ntr
ies
for
the
Ea
ste
rn F
ree
Sta
te a
rea
(la
te p
lan
tin
g d
ate
)
du
rin
g t
he
fu
ll o
r p
art
ial
pe
rio
d f
rom
20
10
– 2
01
3
Cu
ltiv
ar
20
13
R2
01
2R
20
11
R2
01
0R
4 y
ea
r a
ve
rag
eR
3 y
ea
r a
ve
rag
eR
2 y
ea
r a
ve
rag
eR
20
10
-20
13
20
11
-20
13
20
12
-20
13
Be
tta
–D
N2
.98
14
Ca
led
on
2.5
77
3.5
36
Ela
nd
s3
.35
13
4.1
91
42
.65
43
.40
10
3.4
07
3.4
07
3.7
71
2G
ari
ep
3.0
01
74
.40
92
.67
23
.48
83
.39
83
.36
10
3.7
01
5K
oo
na
p3
.21
15
4.4
57
2.4
49
3.3
78
3.8
31
1K
om
ati
3.5
07
Lim
po
po
3.1
51
3P
AN
31
11
4.0
31
PA
N 3
14
42
.38
12
3.1
91
2P
AN
31
61
3.5
37
4.8
51
2.6
06
4.1
41
3.7
81
3.6
62
4.1
92
PA
N 3
19
53
.45
94
.24
12
3.8
49
PA
N 3
19
83
.36
12
PA
N 3
35
52
.62
53
.25
11
PA
N 3
36
4P
AN
33
68
3.2
61
44
.77
22
.26
13
3.4
89
3.4
45
3.4
36
4.0
27
PA
N 3
37
93
.05
16
4.3
51
12
.67
33
.60
53
.42
63
.36
93
.70
14
Se
nq
u3
.38
11
4.5
74
2.4
58
3.4
65
3.9
78
SS
T 3
16
3.7
24
4.5
45
4.1
33
SS
T 3
17
3.6
95
4.3
71
04
.03
6S
ST
34
73
.45
10
4.2
11
32
.24
14
3.3
01
13
.83
10
SS
T 3
56
3.7
93
4.4
08
2.4
41
04
.07
23
.68
33
.55
44
.10
4S
ST
37
43
.62
64
.48
62
.70
13
.71
33
.63
43
.60
34
.05
5S
ST
38
73
.98
24
.70
32
.42
11
3.7
04
3.7
02
3.7
01
4.3
41
SS
T 3
98
3.5
18
3.9
11
52
.01
15
3.1
41
23
.71
13
Av
era
ge
3.4
94
.43
2.4
73
.51
3.5
53
.44
3.9
5L
SD
t(0.0
5)
0.2
50
.17
0.1
70
.20
0.1
00
.11
0.1
5

70
Av
era
ge
he
cto
litr
e m
ass
(k
g/h
l) o
f e
ntr
ies
for
the
Ea
ste
rn F
ree
Sta
te a
rea
(la
te p
lan
tin
g d
ate
)
du
rin
g t
he
fu
ll o
r p
art
ial
pe
rio
d f
rom
20
10
– 2
01
3
Cu
ltiv
ar
20
13
R2
01
2R
20
11
R2
01
0R
4 y
ea
r a
ve
rag
eR
3 y
ea
r a
ve
rag
eR
2 y
ea
r a
ve
rag
eR
20
10
-20
13
20
11
-20
13
20
12
-20
13
Be
tta
–D
N7
9.0
29
Ca
led
on
77
.92
11
81
.18
2E
lan
ds
79
.44
48
0.3
04
78
.62
68
0.4
75
79
.71
27
9.4
53
79
.87
3G
ari
ep
79
.17
57
9.8
97
79
.00
38
1.4
71
79
.88
17
9.3
54
79
.53
6K
oo
na
p8
1.1
62
81
.14
27
9.3
22
80
.54
28
1.1
52
Ko
ma
ti8
0.7
33
Lim
po
po
80
.29
6P
AN
31
11
78
.96
8P
AN
31
44
78
.28
87
8.2
91
2P
AN
31
61
77
.73
15
76
.91
14
77
.76
13
78
.67
11
77
.77
87
7.4
71
17
7.3
21
5P
AN
31
95
76
.80
17
77
.91
12
77
.36
14
PA
N 3
19
87
8.0
31
2P
AN
33
55
76
.57
15
78
.21
13
PA
N 3
36
4P
AN
33
68
78
.84
11
80
.19
57
7.9
71
07
9.5
67
79
.14
47
9.0
06
79
.52
7P
AN
33
79
79
.03
67
9.0
89
78
.67
58
0.7
04
79
.37
37
8.9
38
79
.06
9S
en
qu
79
.49
38
0.0
06
78
.43
77
9.3
15
79
.75
4S
ST
31
67
7.8
51
47
7.9
51
17
7.9
01
1S
ST
31
77
8.9
19
80
.41
37
9.6
65
SS
T 3
47
81
.44
18
1.8
41
79
.93
18
1.0
71
81
.64
1S
ST
35
67
7.4
91
67
7.7
51
37
6.6
01
47
9.2
78
77
.78
77
7.2
81
27
7.6
21
3S
ST
37
47
8.0
31
27
7.9
91
07
8.8
74
78
.94
10
78
.46
57
8.3
09
78
.01
10
SS
T 3
87
79
.03
67
6.7
71
57
7.8
51
27
7.8
81
47
7.8
86
77
.88
10
77
.90
11
SS
T 3
98
78
.90
10
79
.74
87
8.2
69
78
.97
77
9.3
28
Av
era
ge
78
.84
79
.19
78
.27
79
.62
78
.75
78
.96
79
.04
LS
Dt(0
.05
)0
.53
0.6
60
.47
0.5
30
.27
0.3
20
.44

71
Av
era
ge
pro
tein
co
nte
nt
(%)
of
en
trie
s fo
r th
e E
ast
ern
Fre
e S
tate
are
a (
late
pla
nti
ng
da
te)
du
rin
g t
he
fu
ll o
r p
art
ial
pe
rio
d f
rom
20
10
– 2
01
3
Cu
ltiv
ar
20
13
R2
01
2R
20
11
R2
01
0R
4 y
ea
r a
ve
rag
eR
3 y
ea
r a
ve
rag
eR
2 y
ea
r a
ve
rag
eR
20
10
-20
13
20
11
-20
13
20
12
-20
13
Be
tta
–D
N1
4.9
13
Ca
led
on
15
.02
51
4.7
95
Ela
nd
s1
4.5
47
13
.04
61
4.6
48
14
.85
41
4.2
72
14
.07
51
3.7
95
Ga
rie
p1
4.9
54
12
.58
91
4.3
81
11
4.5
08
14
.10
31
3.9
76
13
.77
6K
oo
na
p1
5.2
73
13
.85
21
5.0
63
14
.73
21
4.5
63
Ko
ma
ti1
4.7
17
Lim
po
po
14
.75
6P
AN
31
11
13
.64
14
PA
N 3
14
41
5.2
31
15
.10
2P
AN
31
61
14
.27
10
12
.11
14
14
.14
13
13
.88
12
13
.60
61
3.5
11
11
3.1
91
2P
AN
31
95
14
.62
61
2.3
91
21
3.5
17
PA
N 3
19
81
4.4
39
PA
N 3
35
51
4.5
09
14
.24
10
PA
N 3
36
4P
AN
33
68
15
.64
11
3.5
03
15
.00
61
5.1
41
14
.82
11
4.7
13
14
.57
2P
AN
33
79
14
.47
81
2.0
51
51
4.1
01
41
4.2
59
13
.72
41
3.5
49
13
.26
10
Se
nq
u1
4.7
25
13
.31
41
4.9
07
14
.31
41
4.0
24
SS
T 3
16
13
.34
16
12
.32
13
12
.83
14
SS
T 3
17
13
.83
12
13
.10
51
3.4
78
SS
T 3
47
13
.72
13
12
.95
71
4.3
51
21
3.6
77
13
.34
9S
ST
35
61
3.1
61
71
2.4
51
11
5.1
52
13
.13
14
13
.47
71
3.5
98
12
.81
15
SS
T 3
74
13
.96
11
12
.54
10
13
.96
15
14
.04
11
13
.63
51
3.4
91
21
3.2
51
1S
ST
38
71
3.4
61
51
2.6
18
14
.49
10
13
.31
13
13
.47
81
3.5
21
01
3.0
41
3S
ST
39
81
5.5
02
13
.92
11
5.0
44
14
.82
11
4.7
11
Av
era
ge
14
.32
12
.85
14
.66
14
.40
13
.88
13
.99
13
.61
LS
Dt(0
.05
)0
.45
0.4
00
.41
0.3
10
.19
0.2
40
.30

72
Av
era
ge
fa
llin
g n
um
be
r (s
) o
f e
ntr
ies
for
the
Ea
ste
rn F
ree
Sta
te a
rea
(la
te p
lan
tin
g d
ate
)
du
rin
g t
he
fu
ll o
r p
art
ial
pe
rio
d f
rom
20
10
– 2
01
3
Cu
ltiv
ar
20
13
R2
01
2R
20
11
R2
01
0R
4 y
ea
r a
ve
rag
eR
3 y
ea
r a
ve
rag
eR
2 y
ea
r a
ve
rag
eR
20
10
-20
13
20
11
-20
13
20
12
-20
13
Be
tta
–D
N2
53
10
Ca
led
on
34
15
26
83
Ela
nd
s2
79
11
30
01
23
54
12
61
62
99
23
11
42
90
9G
ari
ep
26
71
43
01
11
31
61
32
65
42
87
62
95
92
84
12
Ko
on
ap
31
81
35
51
33
76
33
71
33
61
Ko
ma
ti2
57
7L
imp
op
o2
41
12
PA
N 3
11
12
94
5P
AN
31
44
32
21
12
68
2P
AN
31
61
21
91
73
24
43
19
12
22
41
32
72
72
87
10
27
21
4P
AN
31
95
30
62
34
02
32
32
PA
N 3
19
82
90
6P
AN
33
55
34
24
27
21
PA
N 3
36
4P
AN
33
68
27
61
23
01
10
32
41
02
51
11
28
85
30
08
28
91
0P
AN
33
79
30
33
32
83
34
33
25
49
30
71
32
42
31
53
Se
nq
u2
88
73
15
73
45
23
16
33
02
5S
ST
31
62
99
43
19
53
09
4S
ST
31
72
81
10
29
61
32
88
11
SS
T 3
47
26
41
52
93
14
29
11
42
83
11
27
91
3S
ST
35
62
87
83
12
83
33
72
61
52
98
33
11
53
00
6S
ST
37
42
83
93
16
63
26
92
55
82
95
43
08
62
99
7S
ST
38
72
47
16
27
51
52
90
15
20
91
42
55
82
71
12
26
11
5S
ST
39
82
72
13
30
99
33
38
30
47
29
08
Av
era
ge
28
13
12
32
82
53
28
83
04
29
6L
SD
t(0.0
5)
17
.26
13
.26
24
.55
27
.70
11
.10
11
.28
10
.36

73
Table 4. Agronomic characteristics of wheat cultivars under irrigation
CultivarGrowth period
Hectolitre mass
Straw strength
Aluminum tolerance
Pre-harvest
sprouting
Baviaans (PBR) Long ** ** # ***
Buff els (PBR) Long ** ** # ***
Duzi (PBR) Medium ** ** # *
Kariega Long ** ** # ***
Krokodil (PBR) Medium * ** # *
Olifants (PBR) Long ** ** * #
PAN 3400 (PBR) Short-Medium ** ** ? *
PAN 3471 (PBR) Medium *** ** ? #
PAN 3478 (PBR) Medium-Long *** ** ? **
PAN 3497 (PBR) Long *** ** ? **
Sabie (PBR) Long ** ** ? **
SST 806 (PBR) Medium *** ** # #
SST 822 (PBR) Short ** *** * *
SST 835 (PBR) Medium ** ** ? #
SST 843 (PBR) Short *** *** ? #
SST 866 (PBR) Medium ** ** ? *
SST 867 (PBR) Long ** *** ? ***
SST 875 (PBR) Short-Medium *** ** ? *
SST 876 (PBR) Long *** *** # #
SST 877 (PBR) Long ** *** ? ***
SST 884 (PBR) Short ** *** ? #
SST 895 (PBR) Medium *** ** ? *
Steenbras (PBR) Short *** ** # #
* Average ** Good *** Excellent # Poor ?Unkwown
PBR Cultivars protected by Plant Breeders’ Rights

74
Table 5. Disease resistance or susceptibility of wheat cultivars
recommended for cultivation under irrigation.
Cultivar Stem Rust Leaf Rust Stripe Rust Head blight
Baviaans (PBR) S MS R MS
Buff els (PBR) S R/S R ?
Duzi (PBR) S S R MS
Kariega S MS R MS
Krokodil (PBR) MS S S S
Olifants (PBR) S S R MS
PAN 3400 (PBR) MSS S R ?
PAN 3471 (PBR) S MRMS R S
PAN 3478 (PBR) S MSS R MS
PAN 3497 (PBR) MSS S R ?
Sabie (PBR) S MS R ?
SST 806 (PBR) S MS R HS
SST 822 (PBR) MS MS R S
SST 835 (PBR) MS MS MR HS
SST 843 (PBR) MS MS R S
SST 866 (PBR) S MS R/MS ?
SST 867 (PBR) S MS MR ?
SST 875 (PBR) S MR R ?
SST 876 (PBR) S MS MR HS
SST 877 (PBR) S MS R/MS ?
SST 884 (PBR) MR S R ?
SST 895 (PBR) MRMS R R ?
Steenbras (PBR) R MR S S
S=Susceptible MS= Moderately susceptible HS=Highly susceptible APR=Adult plant resistance
R=Resistant MR=Moderately resistant ?=Unknown / = mixed for rust reaction
PBR Cultivars protected by Plant Breeders’ RightsVariation in rust races may aff ect cultivars diff erently. Reactions given here are based on existing data for the most virulent rust
races occurring in South Africa. Distribution of races may vary between production regions.

75
Seeding rate
Seeding rate is the most controllable factor that determines the number of ears/ m2. Seeding
rate must also compensate for low germination, poor emergence and seedling establishment.
Thousand kernel mass is an important characteristic that determines the number of kernels
per kilogram seed, and this value can vary from ± 25 – 52 g per 1000 kernels. This can have
a distinct eff ect on seeding rate (kg seed/ ha). Thousand kernel mass must be considered in
determining seeding rate:
Seeding rate (kg/ha) = plants/m2 x 1000 kernel mass (g) x 100
germination % / establishment %
These calculations have been included in the plants/m2 table (Table 5), where calculated
seeding rate (kg/ha) at the range of thousand kernel mass values and target plants/m2 at
a 90% establishment % were done. The optimum plants/m2 per cultivar for each region is
included in the planting spectrum tables. With the optimum plants/m2 and the 1000 kernel
mass of the seedlot, the applicable seeding rate (kg seed/ha) can be determined.
Table 5. Kilogram seed per hectare at diff erent plant populations at
90% establishment percentage
TKM
Seeds per square
meter
150 175 200 225 250 275 300 325 350 375 400
32 53 62 71 80 89 98 107 116 124 133 142
33 55 64 73 83 92 101 110 119 128 138 147
34 57 66 76 85 95 104 113 123 132 142 151
35 58 68 78 88 97 107 117 126 136 146 156
36 60 70 80 90 100 110 120 130 140 150 160
37 62 72 82 93 103 113 123 134 144 154 165
38 63 74 84 95 106 116 127 137 148 158 169
39 65 76 87 98 108 119 130 141 152 163 173
40 67 78 89 100 111 122 133 144 156 167 178
41 68 80 91 103 114 125 137 148 160 171 182
42 70 82 93 105 117 128 140 152 163 175 187
43 72 84 96 108 119 131 143 155 167 179 191
44 73 86 98 110 122 134 147 159 171 183 196
45 75 88 100 113 126 138 150 163 175 188 200
46 76 89 101 114 127 139 152 164 177 190 202
47 78 91 103 116 129 142 155 168 181 194 207
48 79 92 106 119 132 145 158 172 185 198 211
49 81 94 108 121 135 148 162 176 189 202 216
50 83 96 110 124 138 151 165 179 193 206 220

76
Op
tim
um
pla
nti
ng
da
te a
nd
pla
nti
ng
de
nsi
tie
s fo
r w
he
at
in t
he
Co
ole
r C
en
tra
l ir
rig
ati
on
are
as
Cu
ltiv
ar
Pe
tru
svil
le
Ho
pe
tow
n
Bo
tha
vil
le
We
sse
lsb
ron
B
ult
fon
tein
Do
ug
las
Pri
esk
aV
aa
lha
rts
Mo
dd
er
riv
er
Kim
be
rle
y
Ba
rkly
-We
st
Ve
nte
rsd
orp
K
lerk
sdo
rp
Lic
hte
nb
urg
Re
com
me
nd
ed
kg
se
ed
/ha
Pla
nts
/m2
Ba
via
an
s (P
BR
)1
/6-3
0/6
1/6
-20
/61
/6-2
5/6
1/6
-25
/61
/6-2
5/6
1/6
-30
/68
0-1
10
20
0-2
75
Bu
ff e
ls (P
BR
)1
/6-1
5/7
1/6
-15
/71
0/6
-20
/71
5/6
-10
/71
0/6
-20
/71
0/6
-15
/71
00
-13
01
75
-25
0
Du
zi (
PB
R)
1/6
-15
/71
/6-1
5/7
10
/6-2
0/7
15
/6-1
0/7
10
/6-2
0/7
10
/6-1
5/7
10
0-1
30
25
0-3
00
Ka
rie
ga
1/6
-30
/61
/6-2
0/6
1/6
-25
/62
5/5
-25
/61
/6-2
5/6
1/6
-30
/68
0-1
10
17
5-2
50
Kro
ko
dil
(P
BR
)1
/6-1
5/7
1/6
-15
/71
/6-1
5/7
1/6
-30
/61
/6-3
0/6
1/6
-10
/71
00
-13
02
75
-35
0
Oli
fan
ts (
PB
R)
1/6
-15
/71
/6-1
5/7
1/6
-10
/71
/6-3
0/6
1/6
-30
/61
/6-1
0/7
80
-13
02
50
-30
0
PA
N 3
40
0 (P
BR
)1
0/6
-25
/71
0/6
-20
/71
5/6
-25
/72
0/6
-15
/71
5/6
-25
/71
5/6
-20
/71
10
-13
02
75
-32
5
PA
N 3
47
1 (P
BR
)1
/6-1
5/7
1/6
-15
/71
0/6
-20
/71
5/6
-10
/71
0/6
-20
/71
0/6
-15
/71
00
-12
02
50
-32
5
PA
N 3
47
8 (P
BR
)1
/6-3
0/6
1/6
-20
/61
/6-2
5/6
1/6
-25
/61
/6-2
5-6
1/6
-30
/69
0-1
10
22
5-3
00
PA
N 3
49
7 (P
BR
)1
/6-3
0/6
1/6
-20
/61
/6-2
5/6
1/6
-25
/61
/6-2
5-6
1/6
-30
/69
0-1
10
22
5-2
75
Sa
bie
(P
BR
)1
/6-3
0/6
1/6
-20
/61
/6-2
5/6
25
/5-2
5/6
1/6
-25
/61
/6-3
0/6
80
-11
01
75
-25
0
SS
T 8
06
(P
BR
)1
/6-1
5/7
10
/6-3
1/7
1/6
-15
/71
5/6
-10
/71
/6-1
5/7
10
/6-1
5/7
10
0-1
20
27
5-3
25
SS
T 8
22
(P
BR
)1
5/6
-31
/71
/7-1
0/8
30
/6-3
1/7
20
/6-1
5/7
15
/6-2
5/7
1/7
-20
/71
60
-20
03
00
-37
5
SS
T 8
35
(P
BR
)1
5/6
-20
/71
0/6
-31
/71
5/6
-20
/71
5/6
-10
/71
0/6
-20
/71
0/6
-10
/71
10
-14
02
75
-32
5
SS
T 8
43
(P
BR
)1
5/6
-31
/71
/7-1
0/8
30
/6-3
1/7
20
/6-1
5/7
15
/6-2
5/7
1/7
-20
/71
10
-14
02
75
-32
5
SS
T 8
66
(P
BR
)1
/6-1
5/7
10
/6-3
1/7
1/6
-15
/71
5/6
-10
/71
/6-1
5/7
10
/6-1
5/7
10
0-1
20
27
5-3
50
SS
T 8
67
(PB
R)
1/6
-15
/71
/6-1
5/7
1/6
-10
/71
/6-3
0/6
1/6
-30
/61
/6-1
0/7
10
0-1
20
27
5-3
50
SS
T 8
75
(PB
R)
15
/6-2
0/7
10
/6-3
1/7
15
/6-2
0/7
15
/6-1
0/7
10
/6-2
0/7
10
/6-1
0/7
10
0-1
20
27
5-3
50
SS
T 8
76
(P
BR
)1
5/6
-15
/71
0/6
-31
/71
/6-1
5/7
15
/6-1
0/7
1/6
-15
/71
0/6
-10
/71
20
-14
03
00
-37
5
SS
T 8
77
(PB
R)
1/6
-15
/71
/6-1
5/7
1/6
-10
/71
/6-3
0/6
1/6
-30
/61
/6-1
0/7
10
0-1
20
27
5-3
50
SS
T 8
84
(P
BR
)1
5/6
-31
/71
/7-1
0/8
30
/6-3
1/7
20
/6-1
5/7
15
/6-2
5/7
1/7
-20
/71
10
-14
02
75
-32
5
SS
T 8
95
(P
BR
)1
5/6
-20
/71
0/6
-31
/71
5/6
-20
/71
5/6
-10
/71
0/6
-20
/71
0/6
-10
/71
10
-14
02
75
-32
5
Ste
en
bra
s (P
BR
)2
0/6
-31
/72
5/6
-31
/72
5/6
-31
/71
5/6
-15
/71
5/6
-25
/72
5/6
-25
/71
00
-12
02
75
-35
0
All
the
ab
ove
men
tio
ned
cu
ltiv
ars
qu
alif
y fo
r all
the
gra
des
of t
he
bre
ad
cla
ss.
PBR
Cu
ltiv
ars
pro
tect
ed b
y Pl
an
t Bre
eder
s’ R
igh
tsPr
od
uce
rs a
re s
ole
ly re
spo
nsi
ble
for t
he
ma
rket
ing
of g
rain
of c
ult
iva
rs p
lan
ted
by
them
. See
Ba
kers
an
d M
iller
s a
nn
ua
l pre
ss re
lea
se re
ga
rdin
g c
ult
iva
r req
uir
emen
ts a
nd
co
nsu
lt w
ith
loca
l co
-
op
era
tive
an
d m
ark
etin
g a
gen
ts p
rio
r to
pla
nti
ng
.

77
Op
tim
um
pla
nti
ng
da
te a
nd
pla
nti
ng
de
nsi
tie
s fo
r w
he
at
in t
he
Wa
rme
r ir
rig
ati
on
are
as
Cu
ltiv
ar
Bri
tsM
ari
ka
na
R
ust
en
bu
rg
Be
est
ek
raa
l M
ari
coK
oe
do
esk
op
M
ak
op
pa
Gro
ble
rsd
al
Ma
rble
Ha
llS
pri
ng
bo
k F
lats
Re
com
me
nd
ed
kg
se
ed
/ha
Pla
nts
/m2
Ba
via
an
s (P
BR
)2
0/5
-15
/62
5/5
-15
/62
5/5
-15
/61
0/5
-10
/61
0/5
-10
/69
0-1
20
22
5-3
00
Bu
ff e
ls (P
BR
)2
0/5
-30
/62
5/5
-30
/62
5/5
-30
/61
0/5
-30
/62
0/5
-15
/61
00
-13
02
25
-27
5
Du
zi (
PB
R)
20
/5-3
0/6
25
/5-3
0/6
25
/5-3
0/6
10
/5-3
0/6
20
/5-1
5/6
10
0-1
30
25
0-3
00
Ka
rie
ga
20
/5-1
5/6
25
/5-1
5/6
25
/5-1
5/6
10
/5-1
0/6
1/5
-25
/58
0-1
20
22
5-2
75
Kro
ko
dil
(P
BR
)2
0/5
-20
/62
5/5
-20
/62
5/5
-20
/61
0/5
-15
/61
0/5
-15
/61
30
-15
03
00
-37
5
Oli
fan
ts (
PB
R)
20
/5-2
0/6
25
/5-2
0/6
25
/5-2
0/6
10
/5-1
0/6
10
/5-2
5/6
10
0-1
30
27
5-3
00
PA
N 3
40
0 (P
BR
)2
5/5
-5/7
7/6
-5/7
1/6
-5/7
15
/5-3
0/6
25
/5-2
0/6
11
0-1
30
27
5-3
25
PA
N 3
47
1 (P
BR
)2
0/5
-30
/62
5/5
-30
/62
5/5
-30
/61
0/5
-30
/62
0/5
-15
/61
00
-12
02
50
-32
5
PA
N 3
47
8 (P
BR
)2
0/5
-15
/62
5/5
-15
/62
5/5
-15
/61
0/5
-10
/61
0/5
-10
/69
0-1
20
22
5-3
00
PA
N 3
49
7 (P
BR
)2
0/5
-15
/62
5/5
-15
/62
5/5
-15
/61
0/5
-10
/61
0/5
-10
/69
0-1
20
22
5-3
00
Sa
bie
(P
BR
)2
0/5
-15
/62
5/5
-15
/62
5/5
-15
/61
0/5
-10
/61
/5-2
5/5
80
-12
02
25
-27
5
SS
T 8
06
(P
BR
)2
0/5
-30
/62
0/5
-30
/62
0/5
-30
/62
0/5
-30
/62
0/5
-15
/61
10
-14
02
75
-35
0
SS
T 8
22
(P
BR
)1
/6-3
0/6
7/6
-7/7
1/6
-15
/72
5/5
-30
/62
5/5
-20
/61
60
-20
03
25
-40
0
SS
T 8
35
(P
BR
)2
0/5
-30
/61
/6-3
0/6
25
/5-3
0/6
15
/5-2
0/6
20
/5-1
5/6
11
0-1
40
27
5-3
50
SS
T 8
43
(P
BR
)1
/6-3
0/6
7/6
-7/7
1/6
-15
/72
5/5
-30
/62
5/5
-20
/61
10
-14
02
75
-35
0
SS
T 8
66
(P
BR
)2
0/5
-30
/62
0/5
-30
/62
0/5
-30
/62
0/5
-30
/62
0/5
-15
/61
10
-12
02
80
-32
5
SS
T 8
67
(PB
R)
20
/5-2
0/6
25
/5-2
0/6
25
/5-2
0/6
10
/5-1
0/6
10
/5-2
5/6
11
0-1
20
28
0-3
25
SS
T 8
75
(PB
R)
20
/5-3
0/6
1/6
-30
/62
5/5
-30
/61
5/5
-20
/62
0/5
-15
/61
10
-12
02
80
-32
5
SS
T 8
76
(P
BR
)2
0/5
-30
/61
/6-3
0/6
25
/5-3
0/6
15
/5-1
5/6
20
/5-1
5/6
12
0-1
40
30
0-3
75
SS
T 8
77
(PB
R)
20
/5-2
0/6
25
/5-2
0/6
25
/5-2
0/6
10
/5-1
0/6
10
/5-2
5/6
11
0-1
20
28
0-3
25
SS
T 8
84
(P
BR
)1
/6-3
0/6
7/6
-7/7
1/6
-15
/72
5/5
-30
/62
5/5
-20
/61
10
-14
02
75
-35
0
SS
T 8
95
(P
BR
)2
0/5
-30
/61
/6-3
0/6
25
/5-3
0/6
15
/5-2
0/6
20
/5-1
5/6
11
0-1
40
27
5-3
50
Ste
en
bra
s (P
BR
)1
/6-3
0/6
1/6
-7/7
1/6
-30
/62
0/5
-20
/62
5/5
-30
/61
20
-14
03
00
-37
5
All
the
ab
ove
men
tio
ned
cu
ltiv
ars
qu
alif
y fo
r all
the
gra
des
of t
he
bre
ad
cla
ss.
PBR
Cu
ltiv
ars
pro
tect
ed b
y Pl
an
t Bre
eder
s’ R
igh
ts
Pro
du
cers
are
so
lely
resp
on
sib
le fo
r th
e m
ark
etin
g o
f gra
in o
f cu
ltiv
ars
pla
nte
d b
y th
em. S
ee B
ake
rs a
nd
Mill
ers
an
nu
al p
ress
rele
ase
reg
ard
ing
cu
ltiv
ar r
equ
irem
ents
an
d c
on
sult
wit
h lo
cal c
o-
op
era
tive
an
d m
ark
etin
g a
gen
ts p
rio
r to
pla
nti
ng
.

78
Op
tim
um
pla
nti
ng
da
te a
nd
pla
nti
ng
de
nsi
tie
s fo
r w
he
at
in t
he
Wa
rme
r ir
rig
ati
on
are
as
(co
nti
nu
ed
)
Cu
ltiv
ar
Ta
rlto
n/
He
kp
oo
rt/
Ma
ga
lie
s b
urg
Ba
dp
laa
s/
Sto
fbe
rg
Oh
rig
sta
d/
Ste
el
po
ort
/ B
urg
ers
fo
rtL
imp
op
oW
ate
rbe
rgR
eco
mm
en
de
dk
g s
ee
d/h
aP
lan
ts/m
2
Ba
via
an
s (P
BR
)2
0/5
-20
/61
0/5
-20
/62
5/4
-25
/51
/5-2
5/5
15
/5-1
5/6
90
-12
02
25
-30
0
Bu
ff e
ls(P
BR
)2
0/5
-15
/71
5/5
-30
/61
/5-1
5/6
1/5
-10
/61
5/5
-20
/61
00
-13
02
25
-27
5
Du
zi (
PB
R)
20
/5-1
5/7
15
/5-3
0/6
1/5
-15
/61
/5-1
0/6
15
/5-2
0/6
10
0-1
30
25
0-3
00
Ka
rie
ga
20
/5-2
0/6
10
/5-2
0/6
25
/4-2
5/5
1/5
-25
/51
5/5
-15
/68
0-1
20
22
5-2
75
Kro
ko
dil
(P
BR
)2
0/5
-30
/62
0/5
-30
/61
/5-1
5/6
1/5
-31
/51
5/5
-20
/61
30
-15
03
00
-37
5
Oli
fan
ts (
PB
R)
20
/5-2
0/6
10
/5-2
0/6
25
/4-1
0/6
1/5
-25
/51
5/5
-15
/61
00
-13
02
75
-30
0
PA
N 3
40
0 (P
BR
)2
5/5
-15
/72
0/5
-15
/71
0/5
-25
/66
/5-1
0/6
20
/5-2
5/6
11
0-1
30
27
5-3
25
PA
N 3
47
1 (P
BR
)2
0/5
-15
/71
5/5
-30
/61
/5-1
5/6
1/5
-10
/61
5/5
-20
/61
00
-12
02
50
-32
5
PA
N 3
47
8 (P
BR
)2
0/5
-20
/61
0/5
-20
/62
5/4
-25
/51
/5-2
5/5
15
/5-1
5/6
90
-12
02
25
-30
0
PA
N 3
49
7 (P
BR
)2
0/5
-20
/61
0/5
-20
/62
5/4
-25
/51
/5-2
5/5
15
/5-1
5/6
90
-12
02
25
-30
0
Sa
bie
(P
BR
)2
0/5
-20
/61
0/5
-20
/62
5/4
-25
/51
/5-2
5/5
15
/5-1
5/6
80
-12
02
25
-27
5
SS
T 8
06
(P
BR
)2
0/5
-30
/61
5/5
-30
/61
/5-3
1/5
1/5
-31
/51
5/5
-20
/61
10
-14
02
75
-35
0
SS
T 8
22
(P
BR
)1
/6-3
0/6
30
/5-1
5/7
15
/5-3
0/6
6/5
-5/6
20
/5-2
0/6
16
0-2
00
32
5-4
00
SS
T 8
35
(P
BR
)1
0/6
-15
/71
5/5
-30
/61
/5-3
1/5
1/5
-7/6
15
/5-2
5/6
11
0-1
40
27
5-3
50
SS
T 8
43
(P
BR
)1
/6-3
0/6
30
/5-1
5/7
15
/5-3
0/6
6/5
-5/6
20
/5-2
0/6
11
0-1
40
27
5-3
50
SS
T 8
66
(P
BR
)2
0/5
-30
/61
5/5
-30
/61
/5-3
1/5
1/5
-31
/51
5/5
-20
/61
10
-12
02
80
-32
5
SS
T 8
67
(PB
R)
20
/5-2
0/6
10
/5-2
0/6
25
/4-1
0/6
1/5
-25
/51
5/5
-15
/61
10
-12
02
80
-32
5
SS
T 8
75
(PB
R)
10
/6-1
5/7
15
/5-3
0/6
1/5
-31
/51
/5-7
/61
5/5
-25
/61
10
-12
02
80
-32
5
SS
T 8
76
(P
BR
)1
0/6
-15
/71
5/5
-30
/61
/5-3
1/5
1/5
-31
/51
5/5
-20
/61
20
-14
03
00
-37
5
SS
T 8
77
(PB
R)
20
/5-2
0/6
10
/5-2
0/6
25
/4-1
0/6
1/5
-25
/51
5/5
-15
/61
10
-12
02
80
-32
5
SS
T 8
84
(P
BR
)1
/6-3
0/6
30
/5-1
5/7
15
/5-3
0/6
6/5
-5/6
20
/5-2
0/6
11
0-1
40
27
5-3
50
SS
T 8
95
(P
BR
)1
0/6
-15
/71
5/5
-30
/61
/5-3
1/5
1/5
-7/6
15
/5-2
5/6
11
0-1
40
27
5-3
50
Ste
en
bra
s (P
BR
)1
5/6
-15
/71
/6-1
5/7
20
/5-3
0/6
10
/5-1
0/6
20
/5-2
0/6
12
0-1
40
30
0-3
75
All
the
ab
ove
men
tio
ned
cu
ltiv
ars
qu
alif
y fo
r all
the
gra
des
of t
he
bre
ad
cla
ss.
PBR
Cu
ltiv
ars
pro
tect
ed b
y Pl
an
t Bre
eder
s’ R
igh
tsPr
od
uce
rs a
re s
ole
ly re
spo
nsi
ble
for t
he
ma
rket
ing
of g
rain
of c
ult
iva
rs p
lan
ted
by
them
. See
Ba
kers
an
d M
iller
s a
nn
ua
l pre
ss re
lea
se re
ga
rdin
g c
ult
iva
r req
uir
emen
ts a
nd
co
nsu
lt w
ith
loca
l co
-
op
era
tive
an
d m
ark
etin
g a
gen
ts p
rio
r to
pla
nti
ng
.

79
Op
tim
um
pla
nti
ng
da
te a
nd
pla
nti
ng
de
nsi
tie
s fo
r w
he
at
in t
he
Ea
ste
rn H
igh
ve
ld,
Fis
hri
ve
r a
nd
Lo
we
r
Ora
ng
e R
ive
r
Cu
ltiv
ar
Fis
h R
ive
r/E
llio
tL
ow
er
Ora
ng
e
Riv
er
Lo
uw
na
/To
sca
Re
com
me
nd
ed
k
g s
ee
d/h
aP
lan
ts/m
2A
liw
al-
No
rth
S
mit
hfi
eld
Ea
ste
rn
Hig
hv
eld
Re
com
me
nd
ed
kg
se
ed
/ha
Pla
nts
/m2
Ba
via
an
s (P
BR
)1
/6-2
5/6
1/6
-25
/61
00
-12
02
50
-32
51
0/6
-30
/62
5/6
-25
/78
0-1
10
20
0-2
75
Bu
ff e
ls (P
BR
)1
5/6
-15
/71
/6-1
5/7
11
0-1
30
27
5-3
25
10
/6-1
5/7
25
/6-2
5/7
10
0-1
30
17
5-2
50
Du
zi (
PB
R)
15
/6-1
5/7
1/6
-15
/71
10
-13
02
75
-32
51
0/6
-15
/72
5/6
-25
/71
00
-13
02
50
-30
0
Ka
rie
ga
1/6
-25
/61
/6-2
5/6
80
-13
02
50
-30
01
0/6
-30
/62
5/6
-25
/78
0-1
10
17
5-2
50
Kro
ko
dil
(P
BR
)1
5/6
-15
/71
/6-3
0/6
13
0-1
60
32
5-4
00
15
/6-1
0/7
--
-
Oli
fan
ts (
PB
R)
1/6
-30
/61
/6-3
0/6
11
0-1
30
30
0-3
25
10
/6-3
0/6
25
/6-3
1/7
80
-13
02
50
-30
0
PA
N 3
40
0 (P
BR
)2
0/6
-25
/71
0/6
-25
/71
20
-14
03
00
-35
02
0/6
-25
/73
0/6
-5/8
11
0-1
30
27
5-3
25
PA
N 3
47
1 (P
BR
)1
5/6
-15
/71
/6-1
5/7
11
0-1
30
27
5-3
25
10
/6-1
5/7
25
/6-2
5/7
10
0-1
20
25
0-3
25
PA
N 3
47
8 (P
BR
)1
/6-2
5/6
1/6
-25
/61
00
-12
02
50
-30
01
0/6
-30
/62
5/6
-25
/79
0-1
10
22
5-2
75
PA
N 3
49
7 (P
BR
)1
/6-2
5/6
1/6
-25
/61
00
-12
02
50
-30
01
0/6
-30
/62
5/6
-25
/79
0-1
10
22
5-2
75
Sa
bie
(P
BR
)1
/6-2
5/6
1/6
-25
/68
0-1
30
25
0-3
00
10
/6-3
0/6
25
/6-2
5/7
80
-11
01
75
-25
0
SS
T 8
06
(P
BR
)-
15
/6-1
5/7
12
0-1
40
30
0-3
50
15
/6-1
5/7
15
/6-1
0/7
12
0-1
40
27
5-3
25
SS
T 8
22
(P
BR
)1
/7-3
1/7
30
/6-3
0/7
16
0-2
00
35
0-4
00
30
/6-3
1/7
25
/6-1
5/8
18
0-2
00
30
0-3
75
SS
T 8
35
(P
BR
)1
5/6
-15
/71
5/6
-15
/71
20
-15
03
00
-35
01
5/6
-15
/72
5/6
-7/8
12
0-1
50
27
5-3
25
SS
T 8
43
(P
BR
)1
/7-3
1/7
30
/6-3
0/7
16
0-2
00
35
0-4
00
30
/6-3
1/7
25
/6-1
5/8
12
0-1
50
27
5-3
25
SS
T 8
66
(P
BR
)1
5/6
-15
/71
5/6
-15
/71
10
-12
02
60
-30
01
5/6
-15
/72
5/6
-7/8
11
0-1
20
28
0-3
25
SS
T 8
67
(PB
R)
1/6
-30
/61
/6-3
0/6
11
0-1
20
26
0-3
00
10
/6-3
0/6
15
/6-1
0/7
11
0-1
20
28
0-3
25
SS
T 8
75
(PB
R)
15
/6-1
5/7
15
/6-1
5/7
11
0-1
20
26
0-3
00
15
/6-1
5/7
25
/6-7
/81
10
-12
02
80
-32
5
SS
T 8
76
(P
BR
)1
5/6
-15
/71
5/6
-15
/71
30
-16
03
00
-37
51
5/6
-15
/72
5/6
-31
/71
20
-14
02
75
-32
5
SS
T 8
77
(PB
R)
1/6
-30
/61
/6-3
0/6
11
0-1
20
26
0-3
00
10
/6-3
0/6
15
/6-1
0/7
11
0-1
20
28
0-3
25
SS
T 8
84
(P
BR
)1
/7-3
1/7
30
/6-3
0/7
16
0-2
00
35
0-4
00
30
/6-3
1/7
25
/6-1
5/8
12
0-1
50
27
5-3
25
SS
T 8
95
(P
BR
)1
5/6
-15
/71
5/6
-15
/71
20
-15
03
00
-35
01
5/6
-15
/72
5/6
-7/8
12
0-1
50
27
5-3
25
Ste
en
bra
s (P
BR
)1
5/7
-30
/71
5/6
-30
/71
20
-14
03
25
-40
02
5/6
-25
/72
5/6
-31
/71
00
-12
02
75
-35
0
All
the
ab
ove
men
tio
ned
cu
ltiv
ars
qu
alif
y fo
r all
the
gra
des
of t
he
bre
ad
cla
ss.
PBR
Cu
ltiv
ars
pro
tect
ed b
y Pl
an
t Bre
eder
s’ R
igh
tsPr
od
uce
rs a
re s
ole
ly re
spo
nsi
ble
for t
he
ma
rket
ing
of g
rain
of c
ult
iva
rs p
lan
ted
by
them
. See
Ba
kers
an
d M
iller
s a
nn
ua
l pre
ss re
lea
se re
ga
rdin
g c
ult
iva
r req
uir
emen
ts a
nd
co
nsu
lt w
ith
loca
l co
-
op
era
tive
an
d m
ark
etin
g a
gen
ts p
rio
r to
pla
nti
ng
.

80
Op
tim
um
pla
nti
ng
da
te a
nd
pla
nti
ng
de
nsi
tie
s fo
r w
he
at
in t
he
Kw
aZ
ulu
-Na
tal
Cu
ltiv
ar
Na
tal
Re
com
me
nd
ed
kg
se
ed
/ha
Pla
nts
/m2
Ba
via
an
s (P
BR
)1
/6-3
0/6
10
0-1
20
25
0-3
00
Bu
ff e
ls (P
BR
)1
/6-3
0/6
80
-11
02
25
-27
5
Du
zi (
PB
R)
1/6
-30
/61
00
-13
02
50
-30
0
Ka
rie
ga
1/6
-30
/68
0-1
10
22
5-2
75
Oli
fan
ts (
PB
R)
1/6
-10
/71
00
-12
02
75
-30
0
PA
N 3
40
0 (P
BR
)1
0/6
-5/7
11
0-1
30
27
5-3
25
PA
N 3
47
1 (P
BR
)1
/6-3
0/6
10
0-1
30
27
5-3
25
PA
N 3
47
8 (P
BR
)1
/6-3
0/6
10
0-1
20
25
0-3
00
PA
N 3
49
7 (P
BR
)1
/6-3
0/6
10
0-1
20
25
0-3
00
Sa
bie
(P
BR
)1
/6-3
0/6
80
-11
02
25
-27
5
SS
T 8
06
(P
BR
)1
/6-3
0/6
12
0-1
40
27
5-3
50
SS
T 8
22
(P
BR
)2
5/6
-30
/71
60
-20
03
25
-40
0
SS
T 8
35
(P
BR
)1
/6-5
/71
20
-14
02
75
-35
0
SS
T 8
43
(P
BR
)2
5/6
-30
/71
20
-14
02
75
-35
0
SS
T 8
66
(P
BR
)1
/6-1
0/7
12
0-1
40
27
5-3
50
SS
T 8
67
(PB
R)
1/6
-30
/61
20
-14
02
75
-35
0
SS
T 8
75
(PB
R)
1/6
-5/7
12
0-1
40
27
5-3
50
SS
T 8
76
(P
BR
)1
/6-3
0/6
12
0-1
40
27
5-3
50
SS
T 8
77
(PB
R)
1/6
-30
/61
20
-14
02
75
-35
0
SS
T 8
84
(P
BR
)2
5/6
-30
/71
20
-14
02
75
-35
0
SS
T 8
95
(P
BR
)1
/6-5
/71
20
-14
02
75
-35
0
Ste
en
bra
s (P
BR
)2
5/6
-30
/71
20
-14
03
00
-37
5
All
the
ab
ove
men
tio
ned
cu
ltiv
ars
qu
alif
y fo
r all
the
gra
des
of t
he
bre
ad
cla
ss.
PBR
Cu
ltiv
ars
pro
tect
ed b
y Pl
an
t Bre
eder
s’ R
igh
tsPr
od
uce
rs a
re s
ole
ly re
spo
nsi
ble
for t
he
ma
rket
ing
of g
rain
of c
ult
iva
rs p
lan
ted
by
them
. See
Ba
kers
an
d M
iller
s a
nn
ua
l pre
ss re
lea
se re
ga
rdin
g c
ult
iva
r req
uir
emen
ts a
nd
co
nsu
lt w
ith
loca
l co
-o
per
ati
ve a
nd
ma
rket
ing
ag
ents
pri
or t
o p
lan
tin
g.

81
Av
era
ge
yie
ld (
ton
/ha
) o
f e
ntr
ies
for
the
Co
ole
r C
en
tra
l ir
rig
ati
on
are
a (
ea
rly
pla
nti
ng
da
te)
du
rin
g t
he
fu
ll o
r p
art
ial
pe
rio
d f
rom
20
10
– 2
01
3
Cu
ltiv
ar
20
13
R2
01
2R
20
11
R2
01
0R
4 y
ea
r a
ve
rag
eR
3 y
ea
r a
ve
rag
eR
2 y
ea
r a
ve
rag
eR
20
10
-20
13
20
11
-20
13
20
12
-20
13
Ba
via
an
s
9
.73
18
10
.31
25
7.9
21
9
B
uff
els
8.7
71
71
0.3
57
10
.52
20
7.5
12
19
.29
13
9.8
81
09
.56
10
CR
N 8
26
9.4
22
51
1.3
54
8.9
52
Du
zi8
.93
10
9.4
62
41
0.8
31
77
.98
17
9.3
01
29
.74
15
9.2
01
8K
ari
eg
a
8
.95
27
10
.36
24
7.9
41
8
K
rok
od
il8
.86
13
10
.01
15
10
.92
16
8.3
11
29
.52
99
.93
99
.43
13
Oli
fan
ts
9
.51
23
10
.71
18
8.2
91
4
P
AN
34
00
9.2
02
10
.18
11
9.6
95
PA
N 3
43
4
1
0.3
82
38
.29
13
PA
N 3
47
1
9.1
73
10
.59
31
1.1
51
08
.71
59
.90
31
0.3
03
9.8
82
PA
N 3
47
8
8.8
21
51
0.3
58
11
.19
78
.53
10
9.7
25
10
.12
69
.59
7P
AN
34
89
9.0
55
10
.67
1
9
.86
3P
AN
34
97
9.2
21
10
.67
1
9
.94
1S
ab
ie8
.79
16
10
.02
14
10
.49
21
8.0
21
69
.33
10
9.7
71
49
.41
14
SS
T 8
06
8.9
77
10
.34
91
1.6
61
9.0
61
10
.01
11
0.3
22
9.6
66
SS
T 8
15
10
.41
51
1.1
78
SS
T 8
16
9.9
61
71
1.2
26
SS
T 8
22
7.7
52
38
.95
28
10
.59
19
8.0
51
58
.83
14
9.0
91
98
.35
22
SS
T 8
35
9.0
74
10
.38
61
1.5
82
8.8
84
9.9
82
10
.34
19
.72
4S
ST
84
37
.70
24
8.7
93
09
.75
28
7.7
72
08
.50
15
8.7
52
08
.25
23
SS
T 8
66
8.9
01
11
0.1
31
21
0.9
81
38
.68
79
.67
61
0.0
07
9.5
11
1S
ST
86
78
.42
20
9.4
02
61
1.0
01
28
.40
11
9.3
11
19
.61
16
8.9
12
1S
ST
87
58
.99
61
0.1
81
01
1.3
35
8.9
33
9.8
64
10
.17
59
.58
8S
ST
87
68
.85
14
10
.07
13
10
.98
13
8.5
68
9.6
27
9.9
78
9.4
61
2S
ST
87
78
.43
19
10
.00
16
11
.17
88
.55
99
.54
89
.87
11
9.2
21
6S
ST
87
8
8.7
15
SS
T 8
84
8.6
61
81
0.5
04
11
.36
3
1
0.1
74
9.5
89
SS
T 8
95
8.8
81
29
.55
22
11
.11
11
9.8
51
29
.21
17
SS
T 8
96
8.9
68
Ste
en
bra
s
8
.84
29
10
.00
27
Ta
mb
oti
8.9
39
9.5
92
01
0.9
61
5
9
.83
13
9.2
61
5T
imb
av
ati
8.1
62
29
.73
19
10
.42
22
9.4
41
78
.94
19
Um
lazi
8.3
22
19
.57
21
10
.29
26
9.3
91
88
.94
20
Av
era
ge
8.7
4
9.8
8
10
.85
8
.38
9
.49
9
.83
9
.35
L
SD
t(0,0
5)
0.2
4
0.2
1
0.2
5
0.2
4
0.1
2
0.1
3
0.1
6

82
Av
era
ge
he
cto
litr
e m
ass
(k
g/h
l) o
f e
ntr
ies
for
the
Co
ole
r C
en
tra
l ir
rig
ati
on
are
a (
ea
rly
pla
nti
ng
da
te)
du
rin
g t
he
fu
ll o
r p
art
ial
pe
rio
d f
rom
20
10
– 2
01
3
Cu
ltiv
ar
20
13
R2
01
2R
20
11
R2
01
0R
4 y
ea
r a
ve
rag
eR
3 y
ea
r a
ve
rag
eR
2 y
ea
r a
ve
rag
eR
20
10
-20
13
20
11
-20
13
20
12
-20
13
Ba
via
an
s
82
.05
19
82
.65
17
80
.34
12
Bu
ff e
ls7
8.5
12
38
2.7
27
81
.77
28
79
.21
21
80
.55
15
81
.00
16
80
.62
16
CR
N 8
26
81
.34
27
83
.69
58
1.1
66
Du
zi7
9.3
22
28
1.5
02
48
2.1
62
57
9.8
41
58
0.7
11
48
0.9
91
78
0.4
12
0K
ari
eg
a
8
1.2
42
88
2.4
82
07
9.8
01
6
K
rok
od
il7
8.4
92
48
2.1
51
68
2.2
82
28
0.2
01
48
0.7
81
28
0.9
71
88
0.3
22
1O
lifa
nts
81
.70
22
81
.98
26
79
.63
19
PA
N 3
40
08
0.7
79
82
.77
6
8
1.7
79
PA
N 3
43
4
8
2.4
91
97
9.7
41
7
P
AN
34
71
8
1.2
55
82
.60
11
83
.66
88
1.3
33
82
.21
58
2.5
05
81
.93
7P
AN
34
78
8
1.3
33
82
.67
88
4.0
12
81
.77
18
2.4
52
82
.67
28
2.0
05
PA
N 3
48
98
1.7
31
82
.87
5
8
2.3
01
PA
N 3
49
78
1.0
97
83
.47
1
8
2.2
82
Sa
bie
79
.44
21
81
.67
23
82
.26
23
79
.71
18
80
.77
13
81
.12
15
80
.56
17
SS
T 8
06
81
.45
28
2.9
93
84
.09
18
1.3
24
82
.46
18
2.8
41
82
.22
3S
ST
81
5
8
3.3
92
83
.67
6
S
ST
81
6
8
2.6
01
18
3.5
21
0
S
ST
82
28
0.5
91
28
2.1
41
78
2.7
41
68
0.6
89
81
.54
10
81
.82
11
81
.37
12
SS
T 8
35
81
.29
48
2.6
21
08
3.6
76
81
.38
28
2.2
44
82
.53
48
1.9
66
SS
T 8
43
80
.96
88
2.6
59
83
.77
38
0.9
07
82
.07
68
2.4
66
81
.81
8S
ST
86
68
0.5
21
38
1.9
82
08
3.5
21
08
0.6
51
08
1.6
78
82
.01
98
1.2
51
3S
ST
86
78
0.1
71
48
2.0
81
88
3.6
39
80
.76
88
1.6
69
81
.96
10
81
.13
14
SS
T 8
75
80
.67
11
82
.19
15
83
.31
13
80
.64
11
81
.70
78
2.0
67
81
.43
11
SS
T 8
76
81
.15
68
2.8
94
83
.75
48
1.2
45
82
.26
38
2.6
03
82
.02
4S
ST
87
77
9.6
31
78
1.7
72
18
2.8
81
58
0.2
51
38
1.1
31
18
1.4
31
28
0.7
01
5S
ST
87
8
79
.55
20
SS
T 8
84
79
.64
16
81
.35
26
82
.55
18
81
.18
13
80
.50
18
SS
T 8
95
80
.71
10
82
.24
14
83
.19
14
82
.05
88
1.4
81
0S
ST
89
67
9.4
92
0
S
tee
nb
ras
82
.47
13
83
.38
12
Ta
mb
oti
79
.51
19
81
.46
25
82
.45
21
81
.14
14
80
.49
19
Tim
ba
va
ti7
9.5
81
88
0.6
93
08
2.2
32
4
8
0.8
32
08
0.1
42
3U
mla
zi7
9.7
31
58
0.8
52
98
1.9
82
6
8
0.8
51
98
0.2
92
2A
ve
rag
e8
0.2
9
82
.17
8
2.9
9
80
.48
8
1.6
1
81
.75
8
1.2
6
LS
Dt(0
,05
)0
.63
0
.46
0
.36
0
.37
0
.22
0
.29
0
.39

83
Av
era
ge
pro
tein
co
nte
nt
(%)
of
en
trie
s fo
r th
e C
oo
ler
Ce
ntr
al
irri
ga
tio
n a
rea
(e
arl
y p
lan
tin
g d
ate
)
du
rin
g t
he
fu
ll o
r p
art
ial
pe
rio
d f
rom
20
10
– 2
01
3
Cu
ltiv
ar
20
13
R2
01
2R
20
11
R2
01
0R
4 y
ea
r a
ve
rag
eR
3 y
ea
r a
ve
rag
eR
2 y
ea
r a
ve
rag
eR
20
10
-20
13
20
11
-20
13
20
12
-20
13
Ba
via
an
s
11
.40
29
11
.93
10
12
.32
5
B
uff
els
12
.24
81
1.5
61
91
1.8
61
21
2.4
62
12
.03
51
1.8
99
11
.90
12
CR
N 8
26
12
.32
41
1.7
31
91
2.2
09
Du
zi1
2.3
54
11
.71
91
2.3
34
12
.14
13
12
.13
31
2.1
33
12
.03
4K
ari
eg
a
1
1.7
19
11
.89
11
12
.20
9
K
rok
od
il1
1.3
72
41
1.2
43
01
1.3
02
81
2.2
09
11
.53
15
11
.30
20
11
.31
23
Oli
fan
ts
1
2.3
93
12
.66
31
2.5
01
PA
N 3
40
01
2.2
77
11
.73
7
1
2.0
05
PA
N 3
43
4
1
1.7
91
71
2.3
54
PA
N 3
47
1
11
.91
20
11
.41
27
11
.72
21
12
.14
13
11
.80
12
11
.68
18
11
.66
20
PA
N 3
47
8
12
.07
16
11
.65
13
11
.86
12
12
.07
17
11
.91
91
1.8
61
11
1.8
61
3P
AN
34
89
11
.73
22
11
.61
16
11
.67
19
PA
N 3
49
71
1.7
42
11
1.4
32
6
1
1.5
92
1S
ab
ie1
2.2
96
11
.70
11
12
.08
71
2.2
48
12
.08
41
2.0
26
12
.00
6S
ST
80
61
2.1
01
41
1.4
62
51
1.7
31
91
2.3
83
11
.92
81
1.7
61
51
1.7
81
6S
ST
81
5
1
1.5
71
81
1.6
22
3
S
ST
81
6
1
1.4
12
71
1.9
49
SS
T 8
22
12
.94
21
2.5
12
12
.83
21
2.2
86
12
.64
21
2.7
62
12
.73
2S
ST
83
51
2.0
61
71
1.6
31
41
1.7
02
21
1.9
22
01
1.8
31
01
1.8
01
41
1.8
51
4S
ST
84
31
3.7
61
13
.61
11
3.3
51
12
.26
71
3.2
51
13
.57
11
3.6
91
SS
T 8
66
11
.97
19
11
.50
21
11
.59
26
11
.85
21
11
.73
13
11
.69
17
11
.74
18
SS
T 8
67
12
.08
15
11
.48
22
11
.62
23
12
.11
16
11
.82
11
11
.73
16
11
.78
16
SS
T 8
75
11
.58
23
11
.47
23
11
.32
27
12
.00
19
11
.59
14
11
.46
19
11
.53
22
SS
T 8
76
12
.21
91
1.6
21
51
1.8
41
41
2.1
21
51
1.9
57
11
.89
81
1.9
29
SS
T 8
77
12
.19
10
11
.72
81
1.8
21
51
2.1
91
21
1.9
86
11
.91
71
1.9
67
SS
T 8
78
1
2.0
61
8
S
ST
88
41
2.0
11
81
1.8
16
11
.61
25
11
.81
12
11
.91
10
SS
T 8
95
12
.18
11
11
.92
51
2.2
05
12
.10
41
2.0
53
SS
T 8
96
12
.34
5
S
tee
nb
ras
11
.59
17
12
.07
8
T
am
bo
ti1
2.1
51
21
1.6
71
21
1.8
01
6
1
1.8
71
01
1.9
11
0T
imb
av
ati
12
.15
12
11
.47
23
11
.79
17
11
.80
13
11
.81
15
Um
lazi
12
.37
31
1.5
32
01
2.2
05
12
.03
51
1.9
58
Av
era
ge
12
.17
1
1.7
3
11
.94
1
2.1
9
12
.01
1
1.9
5
11
.94
L
SD
t(0,0
5)
0.3
6
0.2
6
0.2
8
0.3
0
0.1
5
0.1
7
0.2
1

84
Av
era
ge
fa
llin
g n
um
be
r (s
) o
f e
ntr
ies
for
the
Co
ole
r C
en
tra
l ir
rig
ati
on
are
a (
ea
rly
pla
nti
ng
da
te)
du
rin
g t
he
fu
ll o
r p
art
ial
pe
rio
d f
rom
20
10
– 2
01
3
Cu
ltiv
ar
20
13
R2
01
2R
20
11
R2
01
0R
4 y
ea
r a
ve
rag
eR
3 y
ea
r a
ve
rag
eR
2 y
ea
r a
ve
rag
eR
20
10
-20
13
20
11
-20
13
20
12
-20
13
Ba
via
an
s
36
12
73
71
12
32
91
5
B
uff
els
33
41
13
70
18
37
49
33
01
43
52
83
59
11
35
21
2C
RN
82
6
3
63
24
37
01
53
48
6
D
uzi
32
61
83
63
23
35
82
33
15
20
34
11
43
49
16
34
51
8K
ari
eg
a
3
65
21
36
32
03
12
21
Kro
ko
dil
30
32
43
42
30
32
72
83
25
18
32
41
53
24
20
32
22
3O
lifa
nts
38
17
38
14
32
61
6
P
AN
34
00
32
22
03
73
14
34
71
5P
AN
34
34
36
51
83
38
11
PA
N 3
47
1
33
01
33
54
29
36
61
73
43
10
34
81
03
50
15
34
22
0P
AN
34
78
3
29
16
36
22
63
80
53
37
13
35
27
35
71
23
46
17
PA
N 3
48
93
35
10
36
72
0
3
51
13
PA
N 3
49
73
26
19
37
11
5
3
48
14
Sa
bie
33
01
33
62
25
36
02
23
25
17
34
41
13
51
14
34
61
6S
ST
80
63
40
23
75
11
38
32
34
95
36
21
36
64
35
87
SS
T 8
15
37
01
73
77
8
S
ST
81
6
3
70
16
37
31
0
S
ST
82
23
08
22
35
62
83
54
25
34
59
34
11
33
39
19
33
22
2S
ST
83
53
32
12
38
33
37
96
33
81
23
58
43
64
53
57
8S
ST
84
33
39
53
82
43
81
33
24
19
35
76
36
73
36
03
SS
T 8
66
33
86
38
25
37
01
33
50
43
60
23
63
63
60
4S
ST
86
73
20
21
36
81
93
58
24
35
61
35
09
34
91
73
44
19
SS
T 8
75
33
77
37
31
33
71
11
35
03
35
83
36
08
35
51
0S
ST
87
63
30
15
38
32
36
81
63
47
73
57
53
60
93
56
9S
ST
87
73
08
23
36
42
23
52
27
35
22
34
41
13
42
18
33
62
1S
ST
87
8
34
58
SS
T 8
84
34
03
38
26
38
71
37
02
36
12
SS
T 8
95
34
41
39
11
37
97
37
11
36
71
SS
T 8
96
33
78
Ste
en
bra
s
3
75
12
35
32
6
T
am
bo
ti3
27
17
37
89
36
41
9
3
56
13
35
31
1T
imb
av
ati
33
69
38
08
37
01
4
3
62
73
58
6U
mla
zi3
40
43
78
93
60
21
35
91
03
59
5A
ve
rag
e3
30
3
71
3
68
3
37
3
50
3
56
3
50
L
SD
t(0,0
5)
8.2
2
7.2
9
10
.75
1
5.9
5
6.4
6
5.1
9
5.4
5

85
Av
era
ge
yie
ld (
ton
/ha
) o
f e
ntr
ies
for
the
Co
ole
r C
en
tra
l ir
rig
ati
on
are
a (
late
pla
nti
ng
da
te)
du
rin
g t
he
fu
ll o
r p
art
ial
pe
rio
d f
rom
20
10
– 2
01
3
Cu
ltiv
ar
20
13
R2
01
2R
20
11
R2
01
0R
4 y
ea
r a
ve
rag
eR
3 y
ea
r a
ve
rag
eR
2 y
ea
r a
ve
rag
eR
20
10
-20
13
20
11
-20
13
20
12
-20
13
Ba
via
an
s7
.41
27
7.8
32
36
.46
16
Bu
ff e
ls7
.39
24
8.2
17
7.8
42
25
.94
21
7.3
41
37
.81
15
7.8
01
6C
RN
82
67
.98
14
8.4
43
6.8
17
Du
zi7
.48
19
7.7
02
17
.91
19
6.3
81
87
.37
12
7.7
01
67
.59
21
Ka
rie
ga
7.1
62
97
.95
17
6.4
61
7K
rok
od
il8
.47
57
.98
16
8.1
51
26
.83
67
.86
58
.20
88
.22
7O
lifa
nts
7.4
82
46
.86
28
6.5
01
4P
AN
34
00
8.4
84
8.1
98
8.3
34
PA
N 3
43
4
7.9
21
86
.84
5P
AN
34
71
8
.15
11
8.7
31
8.0
71
47
.31
18
.06
18
.32
48
.44
2P
AN
34
78
7
.88
16
8.6
12
8.2
81
07
.20
27
.99
38
.25
58
.24
6P
AN
34
89
8.1
01
27
.99
12
8.0
41
2P
AN
34
97
7.4
62
28
.33
57
.90
14
Sa
bie
7.9
21
57
.46
25
7.6
42
46
.29
19
7.3
31
47
.67
17
7.6
91
9S
ST
80
68
.26
88
.60
38
.33
76
.98
38
.04
28
.40
38
.43
3S
ST
81
58
.42
47
.88
20
SS
T 8
16
8.0
21
18
.36
6S
ST
82
27
.47
21
7.9
81
58
.17
11
6.6
21
27
.56
10
7.8
71
37
.72
18
SS
T 8
35
8.0
61
38
.14
98
.55
26
.76
10
7.8
84
8.2
56
8.1
01
0S
ST
84
37
.70
18
7.1
63
07
.43
26
6.2
92
07
.14
15
7.4
32
07
.43
23
SS
T 8
66
8.1
51
07
.99
13
8.3
08
6.9
34
7.8
46
8.1
59
8.0
71
1S
ST
86
77
.86
17
7.8
41
97
.85
21
6.4
61
57
.50
11
7.8
51
47
.85
15
SS
T 8
75
8.2
87
7.9
31
78
.09
13
6.7
21
17
.76
88
.10
10
8.1
19
SS
T 8
76
8.2
49
7.6
12
28
.05
15
6.7
78
7.6
79
7.9
71
17
.92
13
SS
T 8
77
7.9
71
48
.24
68
.40
46
.59
13
7.8
07
8.2
07
8.1
18
SS
T 8
78
6.7
69
SS
T 8
84
8.8
11
8.1
01
08
.36
58
.42
18
.46
1S
ST
89
58
.65
27
.87
18
8.6
71
8.4
02
8.2
65
SS
T 8
96
8.6
43
Ste
en
bra
s7
.43
26
7.4
32
7T
am
bo
ti8
.30
67
.24
28
8.2
89
7.9
41
27
.77
17
Tim
ba
va
ti7
.46
23
7.7
22
07
.45
25
7.5
41
97
.59
20
Um
lazi
7.4
72
07
.50
23
7.9
51
67
.64
18
7.4
92
2A
ve
rag
e8
.03
7.9
08
.01
6.6
67
.68
8.0
17
.98
LS
Dt(0
,05
)0
.18
0.2
00
.26
0.2
50
.11
0.1
20
.13

86
Av
era
ge
he
cto
litr
e m
ass
(k
g/h
l) o
f e
ntr
ies
for
the
Co
ole
r C
en
tra
l ir
rig
ati
on
are
a (
late
pla
nti
ng
da
te)
du
rin
g t
he
fu
ll o
r p
art
ial
pe
rio
d f
rom
20
10
– 2
01
3
Cu
ltiv
ar
20
13
R2
01
2R
20
11
R2
01
0R
4 y
ea
r a
ve
rag
eR
3 y
ea
r a
ve
rag
eR
2 y
ea
r a
ve
rag
eR
20
10
-20
13
20
11
-20
13
20
12
-20
13
Ba
via
an
s7
7.4
32
38
2.2
52
27
8.9
11
7B
uff
els
77
.54
20
77
.57
20
82
.47
19
77
.95
21
78
.88
15
79
.19
16
77
.56
18
CR
N 8
26
77
.11
25
83
.31
58
0.0
48
Du
zi7
7.6
31
97
7.4
82
28
2.0
62
47
9.5
01
37
9.1
71
47
9.0
61
77
7.5
61
8K
ari
eg
a7
7.2
32
48
2.0
92
37
8.5
71
9K
rok
od
il7
8.2
41
07
7.1
02
68
2.6
31
77
9.8
31
07
9.4
51
17
9.3
21
47
7.6
71
7O
lifa
nts
76
.73
30
81
.41
27
78
.39
20
PA
N 3
40
07
8.7
46
78
.58
57
8.6
65
PA
N 3
43
4
82
.45
20
79
.03
16
PA
N 3
47
1
78
.97
27
8.8
72
83
.30
78
0.7
23
80
.47
28
0.3
81
78
.92
2P
AN
34
78
7
8.7
65
78
.43
88
3.6
81
81
.67
18
0.6
41
80
.29
27
8.6
07
PA
N 3
48
97
9.5
21
78
.02
15
78
.77
3P
AN
34
97
78
.74
67
9.5
91
79
.17
1S
ab
ie7
7.7
21
77
8.1
41
28
2.4
42
17
8.6
51
87
9.2
41
37
9.4
31
37
7.9
31
3S
ST
80
67
7.8
51
67
7.9
11
78
3.4
34
80
.24
57
9.8
66
79
.73
97
7.8
81
4S
ST
81
57
8.8
03
83
.22
8S
ST
81
67
8.3
31
08
3.5
93
SS
T 8
22
78
.17
11
78
.37
98
2.9
61
37
9.7
41
27
9.8
18
79
.83
67
8.2
79
SS
T 8
35
78
.44
87
8.6
14
82
.98
12
80
.05
68
0.0
25
80
.01
57
8.5
38
SS
T 8
43
78
.90
47
8.3
21
18
2.9
91
18
0.7
52
80
.24
48
0.0
74
78
.61
6S
ST
86
67
8.0
81
37
8.0
41
48
3.1
01
08
0.0
56
79
.82
77
9.7
48
78
.06
11
SS
T 8
67
77
.97
14
77
.61
18
83
.66
27
9.8
79
79
.78
97
9.7
57
77
.79
16
SS
T 8
75
77
.94
15
77
.99
16
82
.93
14
79
.81
11
79
.67
10
79
.62
11
77
.97
12
SS
T 8
76
78
.92
37
8.5
46
83
.31
58
0.4
84
80
.31
38
0.2
63
78
.73
4S
ST
87
77
7.6
91
87
7.0
42
78
3.1
89
79
.30
15
79
.30
12
79
.30
15
77
.37
21
SS
T 8
78
79
.33
14
SS
T 8
84
77
.43
22
76
.89
29
81
.19
28
78
.50
19
77
.16
22
SS
T 8
95
78
.12
12
77
.60
19
82
.69
16
79
.47
12
77
.86
15
SS
T 8
96
77
.34
23
Ste
en
bra
s7
8.4
47
82
.51
18
Ta
mb
oti
78
.33
97
8.0
61
38
2.7
41
57
9.7
11
07
8.2
01
0T
imb
av
ati
76
.84
24
77
.03
28
81
.54
26
78
.47
20
76
.94
23
Um
lazi
77
.46
21
77
.52
21
81
.78
25
78
.92
18
77
.49
20
Av
era
ge
78
.14
77
.91
82
.71
79
.66
79
.78
79
.55
78
.07
LS
Dt(0
,05
)0
.64
0.2
50
.39
0.4
60
.26
0.2
90
.38

87
Av
era
ge
pro
tein
co
nte
nt
(%)
of
en
trie
s fo
r th
e C
oo
ler
Ce
ntr
al
irri
ga
tio
n a
rea
(la
te p
lan
tin
g d
ate
)
du
rin
g t
he
fu
ll o
r p
art
ial
pe
rio
d f
rom
20
10
– 2
01
3
Cu
ltiv
ar
20
13
R2
01
2R
20
11
R2
01
0R
4 y
ea
r a
ve
rag
eR
3 y
ea
r a
ve
rag
eR
2 y
ea
r a
ve
rag
eR
20
10
-20
13
20
11
-20
13
20
12
-20
13
Ba
via
an
s1
2.8
35
11
.96
61
3.2
03
Bu
ff e
ls1
1.9
69
12
.47
17
11
.93
81
2.9
41
41
2.3
36
12
.12
81
2.2
27
CR
N 8
26
12
.95
31
1.4
32
01
3.2
03
Du
zi1
2.1
04
12
.58
12
12
.19
31
2.8
81
71
2.4
42
12
.29
21
2.3
45
Ka
rie
ga
12
.81
61
1.8
31
11
3.1
26
Kro
ko
dil
11
.38
24
11
.59
30
10
.93
28
13
.40
11
1.8
31
51
1.3
02
01
1.4
92
3O
lifa
nts
13
.33
21
2.5
52
13
.21
2P
AN
34
00
11
.89
11
12
.54
13
12
.22
7P
AN
34
34
1
1.8
79
13
.03
11
PA
N 3
47
1
11
.69
20
12
.32
27
11
.56
18
12
.78
20
12
.09
11
11
.86
15
12
.01
20
PA
N 3
47
8
12
.10
41
2.6
78
11
.76
13
13
.12
61
2.4
15
12
.18
51
2.3
93
PA
N 3
48
91
1.7
51
71
2.5
21
41
2.1
41
4P
AN
34
97
11
.78
15
12
.44
21
12
.11
15
Sa
bie
11
.81
14
12
.76
71
1.9
47
13
.17
51
2.4
24
12
.17
61
2.2
96
SS
T 8
06
11
.70
19
12
.46
19
11
.51
19
13
.12
61
2.2
08
11
.89
12
12
.08
17
SS
T 8
15
12
.65
10
11
.22
25
SS
T 8
16
12
.37
25
11
.58
17
SS
T 8
22
12
.25
21
2.8
74
11
.73
14
12
.84
19
12
.42
31
2.2
83
12
.56
2S
ST
83
51
1.5
82
31
2.4
71
71
1.6
01
61
2.9
81
21
2.1
69
11
.88
13
12
.03
19
SS
T 8
43
13
.44
11
4.2
81
13
.24
11
3.0
51
01
3.5
01
13
.65
11
3.8
61
SS
T 8
66
11
.69
20
12
.13
28
11
.22
25
12
.91
16
11
.99
14
11
.68
18
11
.91
21
SS
T 8
67
11
.84
13
12
.48
15
11
.24
24
12
.72
21
12
.07
12
11
.85
16
12
.16
12
SS
T 8
75
11
.64
22
12
.07
29
11
.31
23
13
.07
91
2.0
21
31
1.6
71
91
1.8
62
2S
ST
87
61
1.9
78
12
.43
22
11
.84
10
12
.97
13
12
.30
71
2.0
89
12
.20
11
SS
T 8
77
11
.75
17
12
.46
19
11
.37
22
12
.94
14
12
.13
10
11
.86
14
12
.11
16
SS
T 8
78
12
.85
18
SS
T 8
84
11
.77
16
12
.39
24
11
.22
25
11
.79
17
12
.08
17
SS
T 8
95
12
.07
71
2.6
69
12
.04
51
2.2
64
12
.37
4S
ST
89
61
2.1
43
Ste
en
bra
s1
2.6
11
11
1.4
02
1T
am
bo
ti1
1.9
31
01
2.4
81
51
1.6
91
51
2.0
31
01
2.2
11
0T
imb
av
ati
12
.09
61
2.3
42
61
2.0
64
12
.16
71
2.2
27
Um
lazi
11
.87
12
12
.41
23
11
.81
12
12
.03
11
12
.14
13
Av
era
ge
11
.92
12
.58
11
.72
13
.02
12
.29
12
.05
12
.21
LS
Dt(0
,05
)0
.30
0.4
50
.41
0.3
50
.19
0.2
20
.26

88
Av
era
ge
fa
llin
g n
um
be
r (s
) o
f e
ntr
ies
for
the
Co
ole
r C
en
tra
l ir
rig
ati
on
are
a (
late
pla
nti
ng
da
te)
du
rin
g t
he
fu
ll o
r p
art
ial
pe
rio
d f
rom
20
10
– 2
01
3
Cu
ltiv
ar
20
13
R2
01
2R
20
11
R2
01
0R
4 y
ea
r a
ve
rag
eR
3 y
ea
r a
ve
rag
eR
2 y
ea
r a
ve
rag
eR
20
10
-20
13
20
11
-20
13
20
12
-20
13
Ba
via
an
s3
91
23
94
19
34
77
Bu
ff e
ls3
72
14
37
21
93
89
23
34
96
37
09
37
81
43
72
11
CR
N 8
26
37
91
23
98
16
33
61
7D
uzi
36
81
63
81
93
91
21
34
31
03
71
83
80
10
37
59
Ka
rie
ga
39
31
40
18
34
01
5K
rok
od
il3
33
24
32
23
03
53
28
33
41
83
35
15
33
62
03
27
23
Oli
fan
ts3
69
21
40
61
33
61
6P
AN
34
00
37
49
38
48
37
95
PA
N 3
43
4
39
42
03
45
8P
AN
34
71
3
74
10
38
83
40
17
34
11
13
76
33
87
23
81
2P
AN
34
78
3
81
23
85
64
00
93
45
93
78
13
89
13
83
1P
AN
34
89
37
64
35
82
83
67
18
PA
N 3
49
73
62
20
36
22
63
62
20
Sa
bie
36
71
83
86
53
95
18
34
11
33
72
73
83
83
76
8S
ST
80
63
73
13
38
11
04
03
43
33
19
37
26
38
55
37
77
SS
T 8
15
38
57
40
43
SS
T 8
16
36
72
24
00
11
SS
T 8
22
34
72
33
63
25
37
72
73
40
14
35
71
43
62
19
35
52
2S
ST
83
53
74
83
58
27
39
91
23
31
20
36
61
33
77
15
36
61
9S
ST
84
33
75
73
67
23
40
09
32
72
13
67
12
38
19
37
11
2S
ST
86
63
73
11
37
31
84
05
23
57
33
77
23
84
63
73
10
SS
T 8
67
35
52
23
80
11
38
42
63
52
53
68
11
37
31
83
67
17
SS
T 8
75
37
01
53
71
20
39
51
73
58
13
74
53
79
12
37
01
4S
ST
87
63
80
33
78
13
40
16
34
11
13
75
43
86
43
79
6S
ST
87
73
59
21
37
81
43
87
24
35
44
36
91
03
74
16
36
81
6S
ST
87
83
58
2S
ST
88
43
76
43
49
29
39
81
43
74
17
36
22
1S
ST
89
53
83
13
76
15
40
25
38
73
37
94
SS
T 8
96
37
56
Ste
en
bra
s3
66
24
38
62
5T
am
bo
ti3
67
17
37
41
73
99
13
38
01
13
70
13
Tim
ba
va
ti3
63
19
37
51
63
98
15
37
91
23
69
15
Um
lazi
37
31
23
86
43
91
22
38
37
38
03
Av
era
ge
36
93
73
39
53
43
36
83
78
37
0L
SD
t(0,0
5)
9.1
81
0.6
08
.79
17
.89
6.2
95
.60
7.1
5

89
Av
era
ge
yie
ld (
ton
/ha
) o
f e
ntr
ies
for
the
Wa
rme
r N
ort
he
rn i
rrig
ati
on
are
a (
ea
rly
pla
nti
ng
da
te)
du
rin
g t
he
fu
ll o
r p
art
ial
pe
rio
d f
rom
20
10
– 2
01
3z
Cu
ltiv
ar
20
13
R2
01
2R
20
11
R2
01
0R
4 y
ea
r a
ve
rag
eR
3 y
ea
r a
ve
rag
eR
2 y
ea
r a
ve
rag
eR
20
10
-20
13
20
11
-20
13
20
12
-20
13
Ba
via
an
s7
.22
25
6.8
51
26
.69
15
Bu
ff e
ls6
.33
23
7.0
22
86
.18
26
6.5
01
86
.51
13
6.5
12
06
.68
21
CR
N 8
26
7.6
51
66
.71
18
7.2
05
Du
zi7
.01
12
7.7
61
36
.71
17
6.7
01
47
.05
97
.16
97
.38
10
Ka
rie
ga
7.0
52
76
.81
13
6.6
11
7K
rok
od
il6
.88
17
7.5
01
86
.63
19
7.7
92
7.2
04
7.0
01
47
.19
16
Oli
fan
ts7
.76
12
6.5
42
06
.90
10
PA
N 3
40
07
.87
17
.96
57
.92
1P
AN
34
34
6
.47
23
6.8
01
2P
AN
34
71
7
.09
10
8.1
61
6.9
78
7.8
21
7.5
11
7.4
14
7.6
36
PA
N 3
47
8
7.3
67
7.8
29
7.0
26
7.2
64
7.3
63
7.4
05
7.5
97
PA
N 3
48
97
.57
47
.98
47
.77
4P
AN
34
97
7.1
68
7.8
58
7.5
19
Sa
bie
6.9
61
47
.51
17
6.9
21
06
.66
16
7.0
11
07
.13
11
7.2
31
5S
ST
80
67
.55
58
.03
27
.28
16
.89
11
7.4
42
7.6
21
7.7
93
SS
T 8
15
7.6
61
56
.72
15
SS
T 8
16
8.0
23
6.9
87
SS
T 8
22
7.0
91
07
.47
20
5.9
62
86
.22
19
6.6
81
26
.84
15
7.2
81
4S
ST
83
57
.37
67
.68
14
6.4
62
47
.09
67
.15
67
.17
87
.53
8S
ST
84
36
.12
24
7.1
92
66
.49
22
5.9
72
16
.44
15
6.6
01
96
.66
23
SS
T 8
66
6.5
72
07
.40
21
7.0
84
6.9
09
6.9
91
17
.01
13
6.9
81
8S
ST
86
76
.57
20
7.3
02
26
.02
27
6.0
62
06
.49
14
6.6
31
86
.94
20
SS
T 8
75
6.9
51
57
.79
11
6.8
01
47
.07
77
.15
57
.18
77
.37
11
SS
T 8
76
7.0
11
27
.30
23
6.9
49
7.2
93
7.1
37
7.0
81
27
.15
17
SS
T 8
77
6.9
11
67
.80
10
6.7
21
66
.93
87
.09
87
.14
10
7.3
61
2S
ST
87
86
.79
13
SS
T 8
84
7.7
42
7.8
67
7.2
03
7.6
02
7.8
02
SS
T 8
95
7.5
93
7.8
86
7.2
32
7.5
73
7.7
35
SS
T 8
96
6.8
21
8S
tee
nb
ras
6.9
02
96
.38
25
Ta
mb
oti
6.7
11
97
.23
24
6.4
92
16
.81
16
6.9
71
9T
imb
av
ati
6.5
62
26
.77
30
6.9
01
16
.74
17
6.6
62
2U
mla
zi7
.12
97
.49
19
7.0
35
7.2
16
7.3
01
3A
ve
rag
e7
.04
7.5
76
.73
6.8
67
.01
7.0
97
.32
LS
Dt(0
,05
)0
.67
0.4
60
.29
0.4
50
.22
0.2
40
.40

90
Av
era
ge
he
cto
litr
e m
ass
(k
g/h
l) o
f e
ntr
ies
for
the
Wa
rme
r N
ort
he
rn i
rrig
ati
on
are
a (
ea
rly
pla
nti
ng
da
te)
du
rin
g t
he
fu
ll o
r p
art
ial
pe
rio
d f
rom
20
10
– 2
01
3
Cu
ltiv
ar
20
13
R2
01
2R
20
11
R2
01
0R
4 y
ea
r a
ve
rag
eR
3 y
ea
r a
ve
rag
eR
2 y
ea
r a
ve
rag
eR
20
10
-20
13
20
11
-20
13
20
12
-20
13
Ba
via
an
s8
1.3
31
98
2.0
51
87
8.9
52
0B
uff
els
79
.70
24
80
.85
28
81
.63
26
80
.02
18
80
.55
14
80
.73
20
80
.28
23
CR
N 8
26
82
.39
68
2.1
81
48
2.0
91
Du
zi8
0.4
01
58
0.6
93
08
1.7
42
38
0.6
21
68
0.8
61
38
0.9
41
58
0.5
52
0K
ari
eg
a8
0.8
82
78
1.7
82
28
0.7
21
3K
rok
od
il7
9.8
02
28
0.7
62
98
1.8
82
17
9.7
41
98
0.5
51
58
0.8
11
98
0.2
82
2O
lifa
nts
81
.10
23
81
.72
25
81
.13
12
PA
N 3
40
08
1.0
09
81
.52
18
81
.26
12
PA
N 3
43
4
82
.18
14
80
.68
15
PA
N 3
47
1
81
.70
28
2.2
19
82
.75
58
2.0
43
82
.18
18
2.2
22
81
.96
3P
AN
34
78
8
1.7
02
81
.99
11
82
.92
38
2.0
72
82
.17
28
2.2
03
81
.85
4P
AN
34
89
82
.40
18
2.8
12
82
.61
1P
AN
34
97
81
.20
68
2.4
55
81
.83
5S
ab
ie8
0.4
01
58
1.2
52
18
2.3
91
08
0.7
01
48
1.1
91
08
1.3
51
38
0.8
31
6S
ST
80
68
1.4
04
82
.62
38
2.8
74
81
.58
88
2.1
23
82
.30
18
2.0
12
SS
T 8
15
82
.88
18
2.6
56
SS
T 8
16
82
.28
88
3.1
51
SS
T 8
22
80
.30
18
81
.92
13
82
.06
17
81
.39
98
1.4
28
81
.43
11
81
.11
13
SS
T 8
35
81
.30
58
2.2
01
08
1.9
12
08
1.9
54
81
.84
68
1.8
07
81
.75
7S
ST
84
38
1.1
07
81
.90
14
83
.02
28
1.9
46
81
.99
58
2.0
15
81
.50
9S
ST
86
68
0.6
01
48
1.5
71
78
2.1
31
68
1.1
71
18
1.3
79
81
.43
10
81
.09
14
SS
T 8
67
80
.70
12
81
.31
20
82
.05
18
80
.30
17
81
.09
11
81
.35
12
81
.01
15
SS
T 8
75
80
.70
12
81
.94
12
82
.21
12
81
.95
48
1.7
07
81
.62
88
1.3
21
0S
ST
87
68
1.1
07
82
.46
48
2.5
37
81
.87
78
1.9
94
82
.03
48
1.7
86
SS
T 8
77
80
.40
15
80
.90
26
81
.20
28
81
.38
10
80
.97
12
80
.83
18
80
.65
18
SS
T 8
78
78
.09
21
SS
T 8
84
80
.10
20
81
.22
22
82
.25
11
81
.19
14
80
.66
17
SS
T 8
95
81
.00
98
2.3
87
82
.48
88
1.9
56
81
.69
8S
ST
89
68
0.1
02
0S
tee
nb
ras
81
.85
15
82
.45
9T
am
bo
ti8
0.9
01
18
1.6
91
68
2.2
01
38
1.6
09
81
.30
11
Tim
ba
va
ti8
0.3
01
88
0.9
12
58
1.4
52
78
0.8
91
68
0.6
11
9U
mla
zi7
9.8
02
28
1.0
62
48
1.7
32
48
0.8
61
78
0.4
32
1A
ve
rag
e8
0.7
58
1.7
18
2.2
08
0.9
78
1.4
68
1.4
88
1.2
3L
SD
t(0,0
5)
0.5
70
.76
0.5
60
.87
0.4
50
.39
0.5
2

91
Av
era
ge
pro
tein
co
nte
nt
(%)
of
en
trie
s fo
r th
e W
arm
er
No
rth
ern
irr
iga
tio
n a
rea
(e
arl
y p
lan
tin
g d
ate
)
du
rin
g t
he
fu
ll o
r p
art
ial
pe
rio
d f
rom
20
10
– 2
01
3
Cu
ltiv
ar
20
13
R2
01
2R
20
11
R2
01
0R
4 y
ea
r a
ve
rag
eR
3 y
ea
r a
ve
rag
eR
2 y
ea
r a
ve
rag
eR
20
10
-20
13
20
11
-20
13
20
12
-20
13
Ba
via
an
s1
1.2
58
10
.45
11
10
.71
12
Bu
ff e
ls1
0.2
14
10
.92
23
10
.77
51
0.9
65
10
.72
41
0.6
35
10
.57
8C
RN
82
61
1.0
61
51
0.3
61
51
0.8
99
Du
zi1
0.2
43
11
.26
71
0.7
66
11
.08
41
0.8
43
10
.75
31
0.7
53
Ka
rie
ga
11
.27
61
0.4
21
31
0.9
56
Kro
ko
dil
9.6
82
21
0.8
42
51
0.0
92
79
.82
20
10
.11
15
10
.20
19
10
.26
20
Oli
fan
ts1
1.5
94
10
.89
41
1.5
73
PA
N 3
40
01
0.1
95
10
.97
21
10
.58
6P
AN
34
34
1
0.4
31
21
0.9
28
PA
N 3
47
1
9.7
61
91
0.8
02
71
0.0
42
81
0.3
91
81
0.2
51
41
0.2
02
01
0.2
81
9P
AN
34
78
9
.61
23
11
.24
91
0.2
82
11
0.9
47
10
.52
81
0.3
81
31
0.4
31
5P
AN
34
89
9.8
11
41
1.1
41
21
0.4
81
2P
AN
34
97
9.7
81
81
0.7
22
91
0.2
52
1S
ab
ie9
.71
20
11
.33
51
0.4
61
01
0.8
11
01
0.5
87
10
.50
81
0.5
21
0S
ST
80
69
.79
16
10
.93
22
10
.35
17
10
.67
14
10
.44
91
0.3
61
51
0.3
61
8S
ST
81
51
1.0
01
71
0.1
92
6S
ST
81
61
1.0
41
61
0.2
02
5S
ST
82
21
1.1
42
12
.21
21
1.1
42
11
.67
21
1.5
42
11
.50
21
1.6
82
SS
T 8
35
9.9
91
11
0.9
81
91
0.3
12
01
0.3
81
91
0.4
21
11
0.4
31
11
0.4
91
1S
ST
84
31
1.8
01
12
.60
11
1.9
41
12
.83
11
2.2
91
12
.11
11
2.2
01
SS
T 8
66
9.6
92
11
0.6
83
01
0.3
21
81
0.6
21
51
0.3
31
31
0.2
31
81
0.1
92
3S
ST
86
71
0.1
26
11
.23
10
10
.63
71
0.7
01
31
0.6
75
10
.66
41
0.6
84
SS
T 8
75
9.9
41
31
0.8
52
41
0.2
42
31
0.5
81
61
0.4
01
21
0.3
41
61
0.4
01
6S
ST
87
69
.79
16
11
.16
11
10
.25
22
10
.50
17
10
.43
10
10
.40
12
10
.48
13
SS
T 8
77
10
.01
10
11
.14
12
10
.47
91
0.8
11
01
0.6
16
10
.54
61
0.5
87
SS
T 8
78
9.7
42
1S
ST
88
41
0.0
87
10
.99
18
10
.32
18
10
.46
10
10
.54
9S
ST
89
51
0.0
49
11
.14
12
10
.41
14
10
.53
71
0.5
95
SS
T 8
96
9.9
91
1S
tee
nb
ras
11
.94
31
0.9
63
Ta
mb
oti
9.8
11
41
0.9
81
91
0.6
18
10
.47
91
0.4
01
6T
imb
av
ati
9.6
12
31
0.8
02
71
0.3
61
51
0.2
61
71
0.2
12
2U
mla
zi1
0.0
87
10
.81
26
10
.21
24
10
.37
14
10
.45
14
Av
era
ge
10
.04
11
.16
10
.50
10
.84
10
.67
10
.57
10
.58
LS
Dt(0
,05
)0
.53
0.5
10
.36
0.5
30
.24
0.2
60
.39

92
Av
era
ge
fa
llin
g n
um
be
r (s
) o
f e
ntr
ies
for
the
Wa
rme
r N
ort
he
rn i
rrig
ati
on
are
a (
ea
rly
pla
nti
ng
da
te)
du
rin
g t
he
fu
ll o
r p
art
ial
pe
rio
d f
rom
20
10
– 2
01
3
Cu
ltiv
ar
20
13
R2
01
2R
20
11
R2
01
0R
4 y
ea
r a
ve
rag
eR
3 y
ea
r a
ve
rag
eR
2 y
ea
r a
ve
rag
eR
20
10
-20
13
20
11
-20
13
20
12
-20
13
Ba
via
an
s3
67
17
33
21
93
50
13
Bu
ff e
ls3
09
14
37
11
33
39
15
35
21
03
43
73
40
93
40
11
CR
N 8
26
37
47
34
21
23
65
5D
uzi
30
11
83
32
29
32
42
53
37
17
32
41
43
19
19
31
62
2K
ari
eg
a3
80
23
24
26
35
29
Kro
ko
dil
26
42
43
24
30
29
02
83
01
20
29
51
52
93
20
29
42
3O
lifa
nts
34
52
63
55
43
92
1P
AN
34
00
31
01
23
80
33
45
7P
AN
34
34
3
28
21
34
31
5P
AN
34
71
2
97
21
37
21
23
41
13
35
01
23
40
10
33
61
43
34
17
PA
N 3
47
8
31
77
36
91
63
33
17
35
58
34
36
33
91
03
43
9P
AN
34
89
29
62
23
43
27
32
02
1P
AN
34
97
29
92
03
71
13
33
51
6S
ab
ie3
13
11
36
51
93
33
16
35
11
13
40
93
37
13
33
91
3S
ST
80
63
53
13
76
53
54
53
66
23
63
13
61
13
65
1S
ST
81
53
55
23
35
08
SS
T 8
16
34
82
53
51
7S
ST
82
23
00
19
35
62
23
26
23
31
91
93
25
13
32
71
83
28
18
SS
T 8
35
32
44
37
11
33
45
10
34
91
43
47
43
46
43
47
5S
ST
84
32
77
23
36
42
03
57
13
65
43
41
83
33
17
32
12
0S
ST
86
63
26
33
81
13
54
63
66
33
57
23
54
33
54
2S
ST
86
73
10
13
37
38
33
31
83
38
16
33
81
13
39
12
34
11
0S
ST
87
53
08
15
36
51
83
44
11
36
07
34
45
33
91
13
36
15
SS
T 8
76
31
51
03
72
11
35
09
36
06
34
93
34
55
34
38
SS
T 8
77
30
51
63
72
10
32
62
43
29
18
33
31
23
34
16
33
81
4S
ST
87
82
88
21
SS
T 8
84
30
41
73
49
24
35
53
33
61
53
27
19
SS
T 8
95
33
42
37
39
35
72
35
52
35
33
SS
T 8
96
31
86
Ste
en
bra
s3
34
28
30
92
7T
am
bo
ti3
16
93
76
63
31
20
34
17
34
66
Tim
ba
va
ti3
20
53
78
43
27
22
34
26
34
94
Um
lazi
31
68
36
32
13
40
14
34
08
33
91
2A
ve
rag
e3
10
36
33
37
34
73
39
33
83
37
LS
Dt(0
,05
)1
2.9
36
.40
13
.69
12
.81
7.3
08
.44
11
.23

93
Av
era
ge
yie
ld (
ton
/ha
) o
f e
ntr
ies
for
the
Wa
rme
r N
ort
he
rn i
rrig
ati
on
are
a (
late
pla
nti
ng
da
te)
du
rin
g t
he
fu
ll o
r p
art
ial
pe
rio
d f
rom
20
10
– 2
01
3
Cu
ltiv
ar
20
13
R2
01
2R
20
11
R2
01
0R
4 y
ea
r a
ve
rag
eR
3 y
ea
r a
ve
rag
eR
2 y
ea
r a
ve
rag
eR
20
10
-20
13
20
11
-20
13
20
12
-20
13
Ba
via
an
s6
.36
21
6.6
11
37
.03
5B
uff
els
6.5
92
46
.38
19
6.3
42
66
.27
19
6.3
91
46
.44
19
6.4
92
1C
RN
82
66
.24
23
6.6
31
27
.01
6D
uzi
7.0
21
67
.35
16
.89
66
.53
15
6.9
55
7.0
93
7.1
93
Ka
rie
ga
6.1
92
66
.40
24
6.6
51
4K
rok
od
il7
.28
86
.53
16
6.3
52
56
.90
96
.77
96
.72
14
6.9
11
1O
lifa
nts
6.2
02
56
.48
21
6.4
71
7P
AN
34
00
7.0
61
56
.93
57
.00
9P
AN
34
34
6
.51
18
7.1
23
PA
N 3
47
1
7.2
29
6.8
28
6.8
77
7.2
51
7.0
43
6.9
76
7.0
26
PA
N 3
47
8
7.4
85
6.4
91
76
.75
10
7.0
16
6.9
36
6.9
18
6.9
91
0P
AN
34
89
7.4
76
6.5
51
57
.01
8P
AN
34
97
6.8
02
16
.33
22
6.5
72
0S
ab
ie6
.95
18
6.5
81
26
.51
19
6.5
01
66
.64
11
6.6
81
56
.77
15
SS
T 8
06
6.9
81
76
.75
96
.77
96
.94
86
.86
86
.83
11
6.8
71
2S
ST
81
57
.11
36
.49
20
SS
T 8
16
6.9
35
6.9
25
SS
T 8
22
6.7
02
36
.48
18
6.6
11
45
.79
21
6.4
01
36
.60
16
6.5
91
9S
ST
83
57
.49
46
.57
13
6.5
61
76
.89
10
6.8
87
6.8
71
07
.03
5S
ST
84
37
.10
13
6.0
92
86
.48
22
6.4
61
86
.53
12
6.5
61
76
.60
18
SS
T 8
66
7.5
33
7.0
04
7.0
04
6.8
41
17
.09
27
.18
17
.27
1S
ST
86
77
.16
11
5.6
73
06
.00
28
6.0
82
06
.23
15
6.2
82
06
.42
23
SS
T 8
75
6.9
01
97
.14
27
.29
27
.13
27
.12
17
.11
27
.02
6S
ST
87
67
.56
26
.90
76
.59
16
7.0
94
7.0
34
7.0
24
7.2
32
SS
T 8
77
7.1
71
06
.18
27
6.8
28
6.7
51
36
.73
10
6.7
21
36
.68
17
SS
T 8
78
6.8
31
2S
ST
88
46
.83
20
6.6
31
07
.18
36
.88
96
.73
16
SS
T 8
95
7.0
71
46
.56
14
7.3
71
7.0
05
6.8
21
4S
ST
89
66
.73
22
Ste
en
bra
s6
.24
23
6.2
82
7T
am
bo
ti7
.67
16
.61
11
6.5
91
56
.96
77
.14
4T
imb
av
ati
7.1
11
25
.75
29
6.4
62
36
.44
18
6.4
32
2U
mla
zi7
.30
76
.37
20
6.6
41
16
.77
12
6.8
41
3A
ve
rag
e7
.13
6.5
36
.66
6.7
46
.77
6.8
06
.85
LS
Dt(0
,05
)0
.52
0.6
20
.36
0.4
70
.24
0.2
70
.41

94
Av
era
ge
he
cto
litr
e m
ass
(k
g/h
l) o
f e
ntr
ies
for
the
Wa
rme
r N
ort
he
rn i
rrig
ati
on
are
a (
late
pla
nti
ng
da
te)
du
rin
g t
he
fu
ll o
r p
art
ial
pe
rio
d f
rom
20
10
– 2
01
3
Cu
ltiv
ar
20
13
R2
01
2R
20
11
R2
01
0R
4 y
ea
r a
ve
rag
eR
3 y
ea
r a
ve
rag
eR
2 y
ea
r a
ve
rag
eR
20
10
-20
13
20
11
-20
13
20
12
-20
13
Ba
via
an
s8
1.0
81
68
1.9
81
58
1.6
29
Bu
ff e
ls8
2.5
01
97
9.9
02
88
1.6
62
38
0.8
42
08
1.2
31
58
1.3
51
88
1.2
02
1C
RN
82
68
1.8
98
82
.61
78
2.1
54
Du
zi8
2.2
02
18
1.4
61
38
1.9
11
78
1.1
11
88
1.6
71
08
1.8
61
18
1.8
31
4K
ari
eg
a8
0.7
92
18
1.5
02
58
1.1
41
7K
rok
od
il8
2.7
01
48
0.4
02
68
1.7
02
28
1.6
78
81
.62
11
81
.60
16
81
.55
18
Oli
fan
ts8
0.4
42
58
1.8
91
88
1.3
11
4P
AN
34
00
83
.10
78
0.9
91
88
2.0
41
2P
AN
34
34
8
1.9
51
68
1.5
81
0P
AN
34
71
8
3.9
01
82
.60
48
2.0
11
38
2.5
32
82
.76
28
2.8
43
83
.25
2P
AN
34
78
8
3.9
01
82
.79
38
3.5
51
83
.14
18
3.3
41
83
.41
18
3.3
41
PA
N 3
48
98
3.4
04
83
.06
28
3.2
33
PA
N 3
49
78
3.7
03
81
.31
15
82
.51
5S
ab
ie8
2.2
02
18
0.8
62
08
1.7
91
98
1.0
71
98
1.4
81
38
1.6
21
58
1.5
31
9S
ST
80
68
2.9
01
08
1.8
09
82
.56
88
2.2
83
82
.39
58
2.4
26
82
.35
8S
ST
81
58
3.2
41
82
.08
12
SS
T 8
16
81
.73
10
82
.68
6S
ST
82
28
2.3
02
08
1.3
81
48
2.4
11
08
1.5
61
18
1.9
18
82
.03
98
1.8
41
3S
ST
83
58
2.8
01
38
1.6
11
18
2.7
85
81
.97
68
2.2
96
82
.40
78
2.2
11
0S
ST
84
38
3.0
08
81
.94
78
3.1
22
81
.98
58
2.5
14
82
.69
48
2.4
76
SS
T 8
66
82
.60
17
80
.74
22
81
.57
24
81
.52
13
81
.61
12
81
.64
14
81
.67
16
SS
T 8
67
83
.30
58
0.9
31
98
1.7
42
08
1.5
41
28
1.8
89
81
.99
10
82
.11
11
SS
T 8
75
82
.90
10
81
.55
12
82
.38
11
81
.21
15
82
.01
78
2.2
88
82
.23
9S
ST
87
68
3.3
05
82
.54
58
3.0
33
81
.84
78
2.6
83
82
.96
28
2.9
24
SS
T 8
77
82
.90
10
79
.88
29
81
.29
27
81
.19
16
81
.31
14
81
.36
17
81
.39
20
SS
T 8
78
80
.22
21
SS
T 8
84
81
.80
23
80
.39
27
81
.29
27
81
.16
20
81
.09
22
SS
T 8
95
82
.60
17
82
.23
68
2.9
64
82
.60
58
2.4
17
SS
T 8
96
81
.80
23
Ste
en
bra
s8
1.0
81
68
2.4
49
Ta
mb
oti
83
.00
88
0.4
92
48
1.9
91
48
1.8
31
28
1.7
41
5T
imb
av
ati
82
.70
14
79
.41
30
81
.44
26
81
.18
19
81
.06
23
Um
lazi
82
.70
14
80
.54
23
81
.73
21
81
.66
13
81
.62
17
Av
era
ge
82
.84
81
.30
82
.14
81
.59
82
.05
82
.04
82
.07
LS
Dt(0
,05
)0
.77
0.9
10
.89
0.5
80
.41
0.5
50
.61
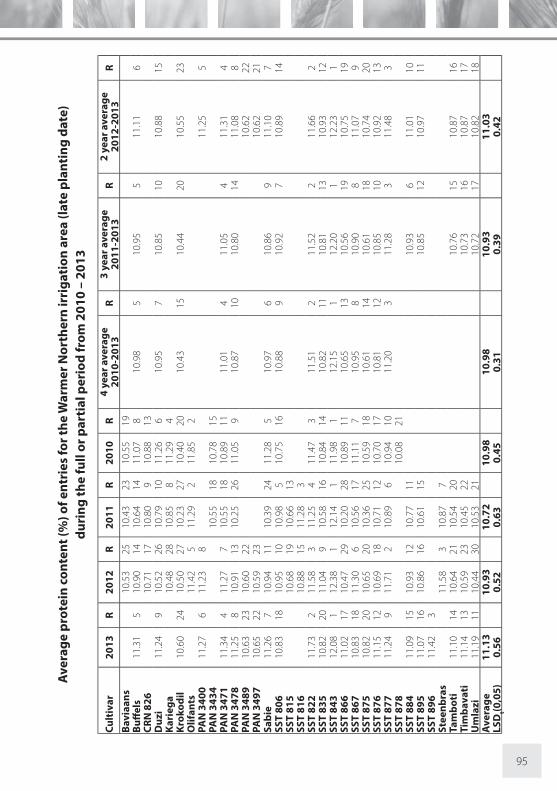
95
Av
era
ge
pro
tein
co
nte
nt
(%)
of
en
trie
s fo
r th
e W
arm
er
No
rth
ern
irr
iga
tio
n a
rea
(la
te p
lan
tin
g d
ate
)
du
rin
g t
he
fu
ll o
r p
art
ial
pe
rio
d f
rom
20
10
– 2
01
3
Cu
ltiv
ar
20
13
R2
01
2R
20
11
R2
01
0R
4 y
ea
r a
ve
rag
eR
3 y
ea
r a
ve
rag
eR
2 y
ea
r a
ve
rag
eR
20
10
-20
13
20
11
-20
13
20
12
-20
13
Ba
via
an
s1
0.5
32
51
0.4
32
31
0.5
51
9B
uff
els
11
.31
51
0.9
01
41
0.6
41
41
1.0
78
10
.98
51
0.9
55
11
.11
6C
RN
82
61
0.7
11
71
0.8
09
10
.88
13
Du
zi1
1.2
49
10
.52
26
10
.79
10
11
.26
61
0.9
57
10
.85
10
10
.88
15
Ka
rie
ga
10
.48
28
10
.85
81
1.2
94
Kro
ko
dil
10
.60
24
10
.50
27
10
.23
27
10
.40
20
10
.43
15
10
.44
20
10
.55
23
Oli
fan
ts1
1.4
25
11
.29
21
1.8
52
PA
N 3
40
01
1.2
76
11
.23
81
1.2
55
PA
N 3
43
4
10
.55
18
10
.78
15
PA
N 3
47
1
11
.34
41
1.2
77
10
.55
18
10
.89
11
11
.01
41
1.0
54
11
.31
4P
AN
34
78
1
1.2
58
10
.91
13
10
.25
26
11
.05
91
0.8
71
01
0.8
01
41
1.0
88
PA
N 3
48
91
0.6
32
31
0.6
02
21
0.6
22
2P
AN
34
97
10
.65
22
10
.59
23
10
.62
21
Sa
bie
11
.26
71
0.9
41
11
0.3
92
41
1.2
85
10
.97
61
0.8
69
11
.10
7S
ST
80
61
0.8
31
81
0.9
51
01
0.9
85
10
.75
16
10
.88
91
0.9
27
10
.89
14
SS
T 8
15
10
.68
19
10
.66
13
SS
T 8
16
10
.88
15
11
.28
3S
ST
82
21
1.7
32
11
.58
31
1.2
54
11
.47
31
1.5
12
11
.52
21
1.6
62
SS
T 8
35
10
.82
20
11
.04
91
0.5
81
61
0.8
41
41
0.8
21
11
0.8
11
31
0.9
31
2S
ST
84
31
2.0
81
12
.38
11
2.1
41
11
.98
11
2.1
51
12
.20
11
2.2
31
SS
T 8
66
11
.02
17
10
.47
29
10
.20
28
10
.89
11
10
.65
13
10
.56
19
10
.75
19
SS
T 8
67
10
.83
18
11
.30
61
0.5
61
71
1.1
17
10
.95
81
0.9
08
11
.07
9S
ST
87
51
0.8
22
01
0.6
52
01
0.3
62
51
0.5
91
81
0.6
11
41
0.6
11
81
0.7
42
0S
ST
87
61
1.1
51
21
0.6
91
81
0.7
11
21
0.7
01
71
0.8
11
21
0.8
51
01
0.9
21
3S
ST
87
71
1.2
49
11
.71
21
0.8
96
10
.94
10
11
.20
31
1.2
83
11
.48
3S
ST
87
81
0.0
82
1S
ST
88
41
1.0
91
51
0.9
31
21
0.7
71
11
0.9
36
11
.01
10
SS
T 8
95
11
.07
16
10
.86
16
10
.61
15
10
.85
12
10
.97
11
SS
T 8
96
11
.42
3S
tee
nb
ras
11
.58
31
0.8
77
Ta
mb
oti
11
.10
14
10
.64
21
10
.54
20
10
.76
15
10
.87
16
Tim
ba
va
ti1
1.1
41
31
0.5
92
31
0.4
52
21
0.7
31
61
0.8
71
7U
mla
zi1
1.1
91
11
0.4
43
01
0.5
32
11
0.7
21
71
0.8
21
8A
ve
rag
e1
1.1
31
0.9
31
0.7
21
0.9
81
0.9
81
0.9
31
1.0
3L
SD
t(0,0
5)
0.5
60
.52
0.6
30
.45
0.3
10
.39
0.4
2

96
Av
era
ge
fa
llin
g n
um
be
r (s
) o
f e
ntr
ies
for
the
Wa
rme
r N
ort
he
rn i
rrig
ati
on
are
a (
late
pla
nti
ng
da
te)
du
rin
g t
he
fu
ll o
r p
art
ial
pe
rio
d f
rom
20
10
– 2
01
3
Cu
ltiv
ar
20
13
R2
01
2R
20
11
R2
01
0R
4 y
ea
r a
ve
rag
eR
3 y
ea
r a
ve
rag
eR
2 y
ea
r a
ve
rag
eR
20
10
-20
13
20
11
-20
13
20
12
-20
13
Ba
via
an
s3
39
19
36
11
63
71
7B
uff
els
34
41
43
28
22
36
31
53
50
17
34
61
13
45
13
33
61
7C
RN
82
63
59
53
64
14
37
93
Du
zi3
44
16
31
32
83
52
23
34
71
83
39
12
33
61
73
28
20
Ka
rie
ga
33
92
03
57
21
37
45
Kro
ko
dil
31
42
43
02
30
32
42
83
28
21
31
71
53
14
20
30
82
3O
lifa
nts
38
11
38
71
38
12
PA
N 3
40
03
44
14
32
62
43
35
18
PA
N 3
43
4
35
81
93
56
15
PA
N 3
47
1
35
21
13
50
11
37
21
03
75
43
62
53
58
83
51
8P
AN
34
78
3
45
13
35
28
37
01
13
58
12
35
68
35
61
03
48
10
PA
N 3
48
93
58
53
55
63
56
6P
AN
34
97
33
91
93
28
22
33
31
9S
ab
ie3
47
12
32
52
53
57
20
35
61
43
46
10
34
31
63
36
16
SS
T 8
06
36
22
37
12
37
39
36
59
36
81
36
91
36
61
SS
T 8
15
34
21
43
76
7S
ST
81
63
49
12
38
12
SS
T 8
22
32
32
33
09
29
35
32
23
59
11
33
61
43
28
19
31
62
2S
ST
83
53
62
33
52
73
59
17
35
91
03
58
63
58
93
57
5S
ST
84
33
52
10
36
64
37
76
37
46
36
82
36
53
35
93
SS
T 8
66
36
71
35
01
03
80
43
67
83
66
33
66
23
59
4S
ST
86
73
44
17
34
01
73
51
24
35
21
63
47
93
45
12
34
21
2S
ST
87
53
60
43
41
15
37
38
35
71
33
58
73
58
73
51
9S
ST
87
63
56
63
41
16
37
95
38
31
36
54
35
96
34
81
0S
ST
87
73
29
22
32
12
63
51
25
34
51
93
37
13
33
41
83
25
21
SS
T 8
78
34
52
0S
ST
88
43
53
83
52
83
81
33
62
53
52
7S
ST
89
53
56
73
68
33
69
12
36
44
36
22
SS
T 8
96
35
29
Ste
en
bra
s3
17
27
34
72
7T
am
bo
ti3
35
20
34
71
33
51
26
34
41
43
41
13
Tim
ba
va
ti3
35
21
33
91
83
58
18
34
41
53
37
15
Um
lazi
34
21
83
34
21
36
71
33
48
11
33
81
4A
ve
rag
e3
46
34
13
64
36
13
51
35
03
43
LS
Dt(0
,05
)1
4.4
61
9.0
91
6.5
32
2.6
21
0.4
51
0.2
21
2.5
2

97
Av
era
ge
yie
ld (
ton
/ha
) o
f e
ntr
ies
for
the
Ea
ste
rn H
igh
ve
ld i
rrig
ati
on
are
a (
ea
rly
pla
nti
ng
da
te)
du
rin
g t
he
fu
ll o
r p
art
ial
pe
rio
d f
rom
20
10
– 2
01
2
Cu
ltiv
ar
20
13
*R
20
12
R2
01
1R
20
10
R3
ye
ar
av
era
ge
R2
ye
ar
av
era
ge
R2
01
0-2
01
22
01
1-2
01
2B
av
iaa
ns
7.8
72
07
.43
25
5.2
31
86
.84
15
7.6
52
0B
uff
els
---
---
7.7
22
27
.10
27
4.9
32
16
.58
19
7.4
12
5C
RN
82
68
.42
48
.73
75
.90
47
.69
48
.58
4D
uzi
---
---
8.5
92
7.9
41
55
.29
16
7.2
78
8.2
69
Ka
rie
ga
7.9
91
77
.22
26
5.2
41
76
.82
16
7.6
12
2K
rok
od
il--
---
-8
.27
97
.60
21
5.3
81
47
.08
13
7.9
31
7O
lifa
nts
8.0
21
66
.82
28
5.5
79
6.8
01
77
.42
24
PA
N 3
40
0--
---
-8
.32
8P
AN
34
34
7.7
91
75
.60
8P
AN
34
71
---
---
8.1
91
39
.24
16
.15
27
.86
18
.72
1P
AN
34
78
---
---
8.2
11
28
.52
96
.41
17
.71
38
.36
6P
AN
34
89
---
---
8.2
61
0P
AN
34
97
---
---
8.7
91
Sa
bie
---
---
7.9
21
97
.65
20
5.4
91
07
.02
14
7.7
81
9S
ST
80
6--
---
-8
.22
11
8.9
63
5.8
15
7.6
65
8.5
93
SS
T 8
15
8.3
47
8.1
81
38
.26
10
SS
T 8
16
8.3
56
8.3
61
28
.35
7S
ST
82
2--
---
-7
.25
27
8.7
46
5.3
11
57
.10
12
7.9
91
5S
ST
83
5--
---
-8
.46
38
.91
45
.97
37
.78
28
.68
2S
ST
84
3--
---
-7
.07
30
7.8
51
65
.14
20
6.6
91
87
.46
23
SS
T 8
66
---
---
7.7
02
38
.90
55
.47
12
7.3
66
8.3
08
SS
T 8
67
---
---
8.0
91
57
.73
19
5.7
96
7.2
01
17
.91
18
SS
T 8
75
---
---
8.4
05
8.4
71
05
.21
19
7.3
67
8.4
35
SS
T 8
76
---
---
7.9
81
88
.17
14
5.4
81
17
.21
98
.08
14
SS
T 8
77
---
---
7.8
72
18
.37
11
5.3
91
37
.21
10
8.1
21
3S
ST
87
85
.61
7S
ST
88
4--
---
-7
.63
25
8.7
08
8.1
71
1S
ST
89
5--
---
-7
.30
26
9.0
02
8.1
51
2S
ST
89
6--
---
-S
tee
nb
ras
7.1
82
97
.52
24
7.3
52
7T
am
bo
ti--
---
-7
.69
24
7.5
72
27
.63
21
Tim
ba
va
ti--
---
-7
.21
28
7.5
52
37
.38
26
Um
lazi
---
---
8.1
71
47
.78
18
7.9
81
6A
ve
rag
e--
---
-7
.98
8.1
05
.54
7.2
28
.02
LS
Dt(0
,05
)--
---
-0
.56
0.4
50
.37
0.2
20
.35
* D
ue
to u
nfo
rese
en c
ircu
mst
an
ces
no
tria
ls (2
013)
wer
e p
roce
ssed
for t
he
East
ern
Hig
hve
ld e
arl
y p
lan
tin
g d
ate
s

98
Av
era
ge
he
cto
litr
e m
ass
(k
g/h
l) o
f e
ntr
ies
for
the
Ea
ste
rn H
igh
ve
ld i
rrig
ati
on
are
a (
ea
rly
pla
nti
ng
da
te)
du
rin
g t
he
fu
ll o
r p
art
ial
pe
rio
d f
rom
20
10
– 2
01
2
Cu
ltiv
ar
20
13
*R
20
12
R2
01
1R
20
10
R3
ye
ar
av
era
ge
R2
ye
ar
av
era
ge
R2
01
0-2
01
22
01
1-2
01
2B
av
iaa
ns
80
.31
19
81
.59
14
76
.78
11
79
.56
11
80
.95
15
Bu
ff e
ls--
---
-7
9.3
52
98
1.2
41
97
6.1
31
47
8.9
11
48
0.3
02
4C
RN
82
68
1.8
94
82
.66
11
77
.27
98
0.6
18
82
.28
7D
uzi
---
---
80
.12
22
81
.04
22
75
.23
16
78
.80
15
80
.58
19
Ka
rie
ga
79
.76
24
80
.87
24
76
.62
12
79
.08
12
80
.32
23
Kro
ko
dil
---
---
81
.22
14
79
.78
28
75
.08
19
78
.69
17
80
.50
21
Oli
fan
ts7
9.6
22
68
1.5
81
57
4.9
62
07
8.7
21
68
0.6
01
8P
AN
34
00
---
---
80
.82
16
PA
N 3
43
48
1.4
31
77
7.6
66
PA
N 3
47
1--
---
-8
1.4
71
28
3.1
93
78
.11
28
0.9
24
82
.33
6P
AN
34
78
---
---
81
.73
78
3.4
12
78
.92
18
1.3
51
82
.57
2P
AN
34
89
---
---
82
.09
1P
AN
34
97
---
---
81
.58
9S
ab
ie--
---
-7
9.4
12
78
0.3
02
77
6.2
31
37
8.6
51
97
9.8
62
6S
ST
80
6--
---
-8
1.7
65
83
.67
17
7.8
33
81
.09
28
2.7
21
SS
T 8
15
81
.91
28
2.5
01
28
2.2
18
SS
T 8
16
81
.48
11
82
.79
88
2.1
49
SS
T 8
22
---
---
80
.19
21
82
.09
13
74
.92
21
79
.07
13
81
.14
13
SS
T 8
35
---
---
81
.65
88
3.1
84
77
.58
78
0.8
05
82
.42
4S
ST
84
3--
---
-8
1.9
12
83
.09
57
7.8
33
80
.94
38
2.5
03
SS
T 8
66
---
---
81
.23
13
82
.67
10
75
.87
15
79
.92
98
1.9
51
1S
ST
86
7--
---
-8
0.6
61
78
1.4
81
67
7.2
98
79
.81
10
81
.07
14
SS
T 8
75
---
---
81
.76
58
3.0
46
77
.12
10
80
.64
78
2.4
05
SS
T 8
76
---
---
81
.49
10
82
.74
97
7.8
05
80
.68
68
2.1
21
0S
ST
87
7--
---
-8
0.1
22
28
0.7
32
57
5.2
01
77
8.6
81
88
0.4
32
2S
ST
87
87
5.1
91
8S
ST
88
4--
---
-7
9.7
62
48
1.3
41
88
0.5
52
0S
ST
89
5--
---
-8
0.9
21
58
2.8
47
81
.88
12
SS
T 8
96
---
---
Ste
en
bra
s8
0.6
51
88
1.1
92
18
0.9
21
6T
am
bo
ti--
---
-8
0.2
42
08
1.2
32
08
0.7
41
7T
imb
av
ati
---
---
78
.56
30
80
.54
26
79
.55
27
Um
lazi
---
---
79
.39
28
80
.92
23
80
.16
25
Av
era
ge
---
---
80
.77
81
.90
76
.65
79
.84
81
.30
LS
Dt(0
,05
)--
---
-0
.73
0.6
80
.72
0.6
60
.50
* D
ue
to u
nfo
rese
en c
ircu
mst
an
ces
no
tria
ls (2
013)
wer
e p
roce
ssed
for t
he
East
ern
Hig
hve
ld e
arl
y p
lan
tin
g d
ate
s

99
Av
era
ge
pro
tein
co
nte
nt
(%)
of
en
trie
s fo
r th
e E
ast
ern
Hig
hv
eld
irr
iga
tio
n a
rea
(e
arl
y p
lan
tin
g d
ate
)
du
rin
g t
he
fu
ll o
r p
art
ial
pe
rio
d f
rom
20
10
– 2
01
2
Cu
ltiv
ar
20
13
*R
20
12
R2
01
1R
20
10
R3
ye
ar
av
era
ge
R2
ye
ar
av
era
ge
R2
01
0-2
01
22
01
1-2
01
2B
av
iaa
ns
11
.84
11
12
.99
17
13
.68
81
2.8
49
12
.42
15
Bu
ff e
ls--
---
-1
1.7
31
61
3.2
51
11
3.9
23
12
.97
71
2.4
91
1C
RN
82
61
1.7
11
81
2.9
02
11
3.6
61
01
2.7
61
11
2.3
12
0D
uzi
---
---
11
.59
26
13
.33
71
3.5
61
31
2.8
31
01
2.4
61
3K
ari
eg
a1
1.9
91
01
3.1
91
41
3.8
34
13
.00
61
2.5
99
Kro
ko
dil
---
---
10
.81
30
11
.97
28
13
.02
20
11
.93
19
11
.39
27
Oli
fan
ts1
2.4
43
14
.10
21
4.3
22
13
.62
21
3.2
72
PA
N 3
40
0--
---
-1
1.6
12
5P
AN
34
34
13
.31
81
3.5
71
1P
AN
34
71
---
---
11
.79
12
12
.73
26
13
.43
16
12
.65
17
12
.26
22
PA
N 3
47
8--
---
-1
1.6
22
41
3.4
96
13
.57
11
12
.89
81
2.5
61
0P
AN
34
89
---
---
11
.69
19
PA
N 3
49
7--
---
-1
1.7
31
6S
ab
ie--
---
-1
2.0
58
13
.62
41
3.7
76
13
.15
41
2.8
45
SS
T 8
06
---
---
11
.75
15
12
.92
19
13
.47
15
12
.71
12
12
.34
18
SS
T 8
15
11
.52
27
12
.82
23
12
.17
25
SS
T 8
16
11
.66
21
13
.04
15
12
.35
17
SS
T 8
22
---
---
12
.72
21
3.6
93
13
.80
51
3.4
03
13
.21
3S
ST
83
5--
---
-1
1.7
91
21
2.8
12
41
3.3
81
71
2.6
61
51
2.3
02
1S
ST
84
3--
---
-1
3.6
31
14
.76
11
4.8
11
14
.40
11
4.2
01
SS
T 8
66
---
---
12
.00
91
2.9
02
11
3.1
71
81
2.6
91
31
2.4
51
4S
ST
86
7--
---
-1
1.6
42
31
2.7
92
51
3.5
41
41
2.6
61
61
2.2
22
3S
ST
87
5--
---
-1
1.2
42
91
2.4
32
71
3.1
31
91
2.2
71
81
1.8
42
6S
ST
87
6--
---
-1
2.3
64
13
.28
10
13
.74
71
3.1
35
12
.82
6S
ST
87
7--
---
-1
1.4
32
81
2.9
21
91
3.6
79
12
.67
14
12
.18
24
SS
T 8
78
12
.64
21
SS
T 8
84
---
---
11
.66
21
12
.97
18
12
.32
19
SS
T 8
95
---
---
12
.22
61
3.2
51
11
2.7
47
SS
T 8
96
---
---
Ste
en
bra
s1
1.7
81
41
3.0
41
51
2.4
11
6T
am
bo
ti--
---
-1
1.6
91
91
3.2
41
31
2.4
71
2T
imb
av
ati
---
---
12
.28
51
3.5
95
12
.94
4U
mla
zi--
---
-1
2.0
87
13
.31
81
2.7
08
Av
era
ge
---
---
11
.87
13
.17
13
.60
12
.91
12
.53
LS
Dt(0
,05
)--
---
-0
.65
0.4
50
.43
0.2
70
.39
* D
ue
to u
nfo
rese
en c
ircu
mst
an
ces
no
tria
ls (2
013)
wer
e p
roce
ssed
for t
he
East
ern
Hig
hve
ld e
arl
y p
lan
tin
g d
ate
s

100
Av
era
ge
fa
llin
g n
um
be
r (s
) o
f e
ntr
ies
for
the
Ea
ste
rn H
igh
ve
ld i
rrig
ati
on
are
a (
ea
rly
pla
nti
ng
da
te)
du
rin
g t
he
fu
ll o
r p
art
ial
pe
rio
d f
rom
20
10
– 2
01
2
Cu
ltiv
ar
20
13
*R
20
12
R2
01
1R
20
10
R3
ye
ar
av
era
ge
R2
ye
ar
av
era
ge
R2
01
0-2
01
22
01
1-2
01
2B
av
iaa
ns
35
81
03
93
13
26
83
34
04
37
59
Bu
ff e
ls--
---
-3
58
93
84
19
28
11
34
13
37
11
6C
RN
82
63
55
13
39
59
21
61
13
22
11
37
51
0D
uzi
---
---
33
32
73
40
27
17
31
82
82
18
33
72
6K
ari
eg
a3
54
15
38
81
72
58
73
33
53
71
14
Kro
ko
dil
---
---
31
03
03
24
28
14
82
12
60
19
31
72
7O
lifa
nts
34
82
03
97
81
72
19
30
61
53
72
13
PA
N 3
40
0--
---
-3
52
16
PA
N 3
43
43
94
11
24
78
PA
N 3
47
1--
---
-3
31
28
39
41
21
77
17
30
01
73
62
21
PA
N 3
47
8--
---
-3
63
64
01
42
22
10
32
97
38
25
PA
N 3
48
9--
---
-3
29
29
PA
N 3
49
7--
---
-3
48
19
Sa
bie
---
---
35
21
73
82
21
21
51
23
17
14
36
71
9S
ST
80
6--
---
-3
55
14
40
05
21
51
33
23
10
37
77
SS
T 8
15
36
08
39
51
03
77
8S
ST
81
63
46
22
40
06
37
31
2S
ST
82
2--
---
-3
62
73
80
22
24
29
32
88
37
11
5S
ST
83
5--
---
-3
57
11
39
21
52
10
14
32
01
23
74
11
SS
T 8
43
---
---
37
42
40
23
25
96
34
52
38
82
SS
T 8
66
---
---
38
91
39
97
26
05
34
91
39
41
SS
T 8
67
---
---
34
22
53
71
24
26
04
32
59
35
72
3S
ST
87
5--
---
-3
34
26
38
41
81
93
16
30
41
63
59
22
SS
T 8
76
---
---
36
64
39
21
41
97
15
31
81
33
79
6S
ST
87
7--
---
-3
44
24
36
62
52
77
23
29
63
55
24
SS
T 8
78
15
82
0S
ST
88
4--
---
-3
56
12
40
81
38
24
SS
T 8
95
---
---
37
13
40
32
38
73
SS
T 8
96
---
---
Ste
en
bra
s3
46
23
36
12
63
53
25
Ta
mb
oti
---
---
34
72
13
91
16
36
91
7T
imb
av
ati
---
---
36
35
37
22
33
67
18
Um
lazi
---
---
35
01
83
83
20
36
62
0A
ve
rag
e--
---
-3
52
38
52
21
31
93
69
LS
Dt(0
,05
)--
---
-2
0.3
91
6.0
53
2.0
28
.49
12
.84
* D
ue
to u
nfo
rese
en c
ircu
mst
an
ces
no
tria
ls (2
013)
wer
e p
roce
ssed
for t
he
East
ern
Hig
hve
ld e
arl
y p
lan
tin
g d
ate
s
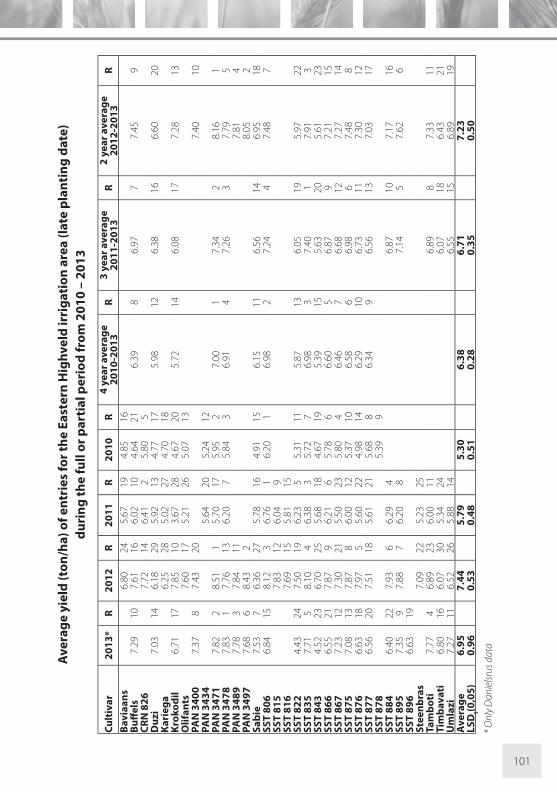
101
Av
era
ge
yie
ld (
ton
/ha
) o
f e
ntr
ies
for
the
Ea
ste
rn H
igh
ve
ld i
rrig
ati
on
are
a (
late
pla
nti
ng
da
te)
du
rin
g t
he
fu
ll o
r p
art
ial
pe
rio
d f
rom
20
10
– 2
01
3
Cu
ltiv
ar
20
13
*R
20
12
R2
01
1R
20
10
R4
ye
ar
av
era
ge
R3
ye
ar
av
era
ge
R2
ye
ar
av
era
ge
R2
01
0-2
01
32
01
1-2
01
32
01
2-2
01
3B
av
iaa
ns
6.8
02
45
.67
19
4.8
51
6B
uff
els
7.2
91
07
.61
16
6.0
21
04
.64
21
6.3
98
6.9
77
7.4
59
CR
N 8
26
7.7
21
46
.41
25
.80
5D
uzi
7.0
31
46
.18
29
5.9
21
34
.77
17
5.9
81
26
.38
16
6.6
02
0K
ari
eg
a6
.25
28
5.0
22
74
.70
18
Kro
ko
dil
6.7
11
77
.85
10
3.6
72
84
.67
20
5.7
21
46
.08
17
7.2
81
3O
lifa
nts
7.6
01
75
.21
26
5.0
71
3P
AN
34
00
7.3
78
7.4
32
07
.40
10
PA
N 3
43
4
5.6
42
05
.24
12
PA
N 3
47
1
7.8
22
8.5
11
5.7
01
75
.95
27
.00
17
.34
28
.16
1P
AN
34
78
7
.83
17
.76
13
6.2
07
5.8
43
6.9
14
7.2
63
7.7
95
PA
N 3
48
97
.78
37
.84
11
7.8
14
PA
N 3
49
77
.68
68
.43
28
.05
2S
ab
ie7
.53
76
.36
27
5.7
81
64
.91
15
6.1
51
16
.56
14
6.9
51
8S
ST
80
66
.84
15
8.1
23
6.7
61
6.2
01
6.9
82
7.2
44
7.4
87
SS
T 8
15
7.8
31
26
.04
9S
ST
81
67
.69
15
5.8
11
5S
ST
82
24
.43
24
7.5
01
96
.23
55
.31
11
5.8
71
36
.05
19
5.9
72
2S
ST
83
57
.71
58
.10
46
.38
35
.72
76
.98
37
.40
17
.91
3S
ST
84
34
.52
23
6.7
02
55
.68
18
4.6
71
95
.39
15
5.6
32
05
.61
23
SS
T 8
66
6.5
52
17
.87
96
.21
65
.78
66
.60
56
.87
97
.21
15
SS
T 8
67
7.2
31
27
.30
21
5.5
02
35
.80
46
.46
76
.68
12
7.2
71
4S
ST
87
57
.08
13
7.8
78
6.0
01
25
.37
10
6.5
86
6.9
86
7.4
88
SS
T 8
76
6.6
31
87
.97
55
.60
22
4.9
81
46
.29
10
6.7
31
17
.30
12
SS
T 8
77
6.5
62
07
.51
18
5.6
12
15
.68
86
.34
96
.56
13
7.0
31
7S
ST
87
85
.39
9S
ST
88
46
.40
22
7.9
36
6.2
94
6.8
71
07
.17
16
SS
T 8
95
7.3
59
7.8
87
6.2
08
7.1
45
7.6
26
SS
T 8
96
6.6
31
9S
tee
nb
ras
7.0
92
25
.23
25
Ta
mb
oti
7.7
74
6.8
92
36
.00
11
6.8
98
7.3
31
1T
imb
av
ati
6.8
01
66
.07
30
5.3
42
46
.07
18
6.4
32
1U
mla
zi7
.27
11
6.5
22
65
.88
14
6.5
51
56
.89
19
Av
era
ge
6.9
57
.44
5.7
95
.30
6.3
86
.71
7.2
3L
SD
t(0,0
5)
0.9
60
.53
0.4
80
.51
0.2
80
.35
0.5
0
* O
nly
Da
nie
lsru
s d
ata

102
Av
era
ge
he
cto
litr
e m
ass
(k
g/h
l) o
f e
ntr
ies
for
the
Ea
ste
rn H
igh
ve
ld i
rrig
ati
on
are
a (
late
pla
nti
ng
da
te)
du
rin
g t
he
fu
ll o
r p
art
ial
pe
rio
d f
rom
20
10
– 2
01
3
Cu
ltiv
ar
20
13
*R
20
12
R2
01
1R
20
10
R4
ye
ar
av
era
ge
R3
ye
ar
av
era
ge
R2
ye
ar
av
era
ge
R2
01
0-2
01
32
01
1-2
01
32
01
2-2
01
3B
av
iaa
ns
77
.79
19
80
.46
10
76
.80
14
Bu
ff e
ls7
9.4
01
27
7.8
11
77
7.4
82
67
6.9
01
37
7.9
01
17
8.2
31
47
8.6
11
4C
RN
82
67
7.3
42
48
0.5
49
77
.60
7D
uzi
78
.23
20
77
.76
20
78
.98
20
75
.90
18
77
.72
12
78
.32
13
77
.99
19
Ka
rie
ga
77
.15
26
78
.41
23
76
.60
15
Kro
ko
dil
79
.00
17
78
.26
12
75
.71
28
74
.00
21
76
.74
15
77
.66
19
78
.63
13
Oli
fan
ts7
7.5
42
27
7.4
52
77
6.6
01
5P
AN
34
00
79
.38
13
78
.13
14
78
.75
12
PA
N 3
43
4
80
.16
15
77
.60
7P
AN
34
71
8
0.0
86
78
.74
88
1.5
33
78
.30
37
9.6
62
80
.11
27
9.4
14
PA
N 3
47
8
80
.73
27
7.5
52
18
2.4
11
78
.70
17
9.8
51
80
.23
17
9.1
46
PA
N 3
48
98
1.9
01
78
.81
78
0.3
62
PA
N 3
49
78
0.4
83
80
.39
18
0.4
31
Sa
bie
78
.80
18
76
.85
29
78
.55
22
76
.00
17
77
.55
13
78
.07
17
77
.83
21
SS
T 8
06
79
.85
97
8.0
11
58
1.8
12
78
.60
27
9.5
73
79
.89
37
8.9
31
0S
ST
81
57
9.0
34
80
.15
16
SS
T 8
16
79
.45
28
0.8
38
SS
T 8
22
76
.50
24
77
.81
17
79
.18
19
74
.60
20
77
.02
14
77
.83
18
77
.16
22
SS
T 8
35
79
.93
87
8.1
41
38
1.1
14
77
.60
77
9.1
96
79
.72
67
9.0
39
SS
T 8
43
78
.05
21
78
.90
68
0.3
11
27
8.0
05
78
.82
87
9.0
91
17
8.4
81
6S
ST
86
67
9.6
31
07
8.9
65
81
.03
57
7.1
01
17
9.1
87
79
.87
47
9.2
95
SS
T 8
67
80
.30
57
7.4
52
38
0.2
61
47
7.1
01
17
8.7
89
79
.34
97
8.8
81
1S
ST
87
57
9.0
51
67
9.1
33
81
.03
57
7.9
06
79
.28
57
9.7
45
79
.09
7S
ST
87
67
9.6
01
17
8.5
69
81
.01
77
8.1
04
79
.32
47
9.7
26
79
.08
8S
ST
87
77
9.1
01
57
7.2
62
58
0.3
81
17
7.2
01
07
8.4
91
07
8.9
11
27
8.1
81
8S
ST
87
87
5.7
01
9S
ST
88
47
7.0
02
37
6.9
92
87
8.8
92
17
7.6
32
07
6.9
92
3S
ST
89
57
9.1
81
47
7.8
31
68
0.2
81
37
9.0
91
07
8.5
01
5S
ST
89
67
7.6
52
2S
tee
nb
ras
78
.45
11
79
.76
17
Ta
mb
oti
80
.43
47
8.5
31
07
9.4
41
87
9.4
68
79
.48
3T
imb
av
ati
79
.98
77
6.8
03
07
7.6
62
57
8.1
51
57
8.3
91
7U
mla
zi7
8.8
01
87
7.0
42
77
8.3
92
47
8.0
81
67
7.9
22
0A
ve
rag
e7
9.2
97
8.0
87
9.7
67
7.0
07
8.6
07
8.9
67
8.7
2L
SD
t(0,0
5)
1.0
50
.81
1.7
31
.04
0.4
80
.88
0.6
3
* O
nly
Da
nie
lsru
s d
ata

103
Av
era
ge
pro
tein
co
nte
nt
(%)
of
en
trie
s fo
r th
e E
ast
ern
Hig
hv
eld
irr
iga
tio
n a
rea
(la
te p
lan
tin
g d
ate
)
du
rin
g t
he
fu
ll o
r p
art
ial
pe
rio
d f
rom
20
10
– 2
01
3 (
Da
nie
lsru
s si
te o
nly
)
Cu
ltiv
ar
20
13
*R
20
12
R2
01
1R
20
10
R4
ye
ar
av
era
ge
R3
ye
ar
av
era
ge
R2
ye
ar
av
era
ge
R2
01
0-2
01
32
01
1-2
01
32
01
2-2
01
3B
av
iaa
ns
13
.71
16
13
.86
13
15
.04
8B
uff
els
12
.98
10
13
.69
17
13
.89
11
15
.43
41
4.0
07
13
.52
10
13
.34
11
CR
N 8
26
13
.33
27
13
.73
17
14
.61
15
Du
zi1
3.3
85
13
.93
10
14
.41
61
4.8
01
11
4.1
34
13
.91
31
3.6
55
Ka
rie
ga
14
.38
41
4.4
07
15
.43
4K
rok
od
il1
1.2
92
41
2.5
43
01
2.6
92
81
3.3
32
11
2.4
61
51
2.1
72
01
1.9
22
3O
lifa
nts
14
.44
21
4.6
63
15
.94
2P
AN
34
00
12
.72
17
13
.75
14
13
.24
15
PA
N 3
43
4
13
.47
23
14
.73
12
PA
N 3
47
1
12
.54
21
13
.50
24
13
.51
21
14
.46
17
13
.50
13
13
.18
17
13
.02
19
PA
N 3
47
8
12
.60
18
13
.66
19
14
.05
10
15
.12
71
3.8
61
01
3.4
41
31
3.1
31
8P
AN
34
89
12
.58
20
14
.13
71
3.3
51
0P
AN
34
97
12
.86
12
13
.53
23
13
.19
16
Sa
bie
12
.60
18
14
.24
61
4.5
34
15
.49
31
4.2
23
13
.79
61
3.4
29
SS
T 8
06
13
.80
41
3.8
51
31
3.7
51
61
4.6
51
41
4.0
16
13
.80
51
3.8
33
SS
T 8
15
13
.91
12
13
.81
15
SS
T 8
16
13
.38
26
13
.39
25
SS
T 8
22
14
.63
21
4.3
83
14
.81
21
4.9
89
14
.70
21
4.6
02
14
.50
2S
ST
83
51
2.2
52
31
3.6
42
01
3.7
21
81
4.5
01
61
3.5
31
21
3.2
01
61
2.9
42
2S
ST
84
31
6.1
91
15
.80
11
5.5
31
16
.47
11
6.0
01
15
.84
11
5.9
91
SS
T 8
66
12
.82
14
13
.72
15
13
.50
22
14
.33
18
13
.59
11
13
.35
15
13
.27
14
SS
T 8
67
12
.84
13
14
.32
51
3.1
22
61
5.2
46
13
.88
91
3.4
21
41
3.5
88
SS
T 8
75
12
.99
91
2.9
32
91
2.8
22
71
4.2
51
91
3.2
51
41
2.9
11
91
2.9
62
1S
ST
87
61
3.9
43
13
.56
22
13
.86
14
14
.90
10
14
.06
51
3.7
97
13
.75
4S
ST
87
71
2.7
31
51
3.9
21
11
4.2
08
14
.73
12
13
.90
81
3.6
29
13
.33
12
SS
T 8
78
13
.93
20
SS
T 8
84
12
.50
22
13
.49
25
13
.41
24
13
.13
18
13
.00
20
SS
T 8
95
13
.13
81
4.0
89
14
.45
51
3.8
84
13
.60
7S
ST
89
61
3.1
96
Ste
en
bra
s1
3.2
72
81
3.6
12
0T
am
bo
ti1
2.7
31
61
3.6
12
11
4.1
59
13
.50
11
13
.17
17
Tim
ba
va
ti1
3.1
57
14
.10
81
3.8
81
21
3.7
18
13
.62
6U
mla
zi1
2.9
31
11
3.6
91
81
3.7
21
91
3.4
51
21
3.3
11
3A
ve
rag
e1
3.0
61
3.8
21
3.8
91
4.8
71
3.9
41
3.6
11
3.4
4L
SD
t(0,0
5)
1.2
90
.56
0.5
90
.50
0.3
30
.43
0.5
8
* O
nly
Da
nie
lsru
s d
ata

104
Av
era
ge
fa
llin
g n
um
be
r (s
) o
f e
ntr
ies
for
the
Ea
ste
rn H
igh
ve
ld i
rrig
ati
on
are
a (
late
pla
nti
ng
da
te)
du
rin
g t
he
fu
ll o
r p
art
ial
pe
rio
d f
rom
20
10
– 2
01
3 (
Da
nie
lsru
s si
te o
nly
)
Cu
ltiv
ar
20
13
*R
20
12
R2
01
1R
20
10
R4
ye
ar
av
era
ge
R3
ye
ar
av
era
ge
R2
ye
ar
av
era
ge
R2
01
0-2
01
32
01
1-2
01
32
01
2-2
01
3B
av
iaa
ns
34
61
23
86
72
44
7B
uff
els
25
92
03
71
43
65
17
30
42
32
53
33
21
23
15
13
CR
N 8
26
27
53
03
78
11
19
41
3D
uzi
30
38
35
99
34
32
42
23
12
30
77
33
59
33
15
Ka
rie
ga
36
18
36
71
62
61
4K
rok
od
il2
10
24
34
51
33
02
28
13
32
12
47
15
28
62
02
77
22
Oli
fan
ts3
23
20
38
94
16
31
7P
AN
34
00
30
29
33
71
73
19
8P
AN
34
34
3
72
12
31
21
PA
N 3
47
1
26
91
73
14
22
34
12
51
60
19
27
11
43
08
17
29
11
8P
AN
34
78
2
74
15
36
85
38
75
25
56
32
14
34
37
32
17
PA
N 3
48
92
32
23
29
32
82
62
23
PA
N 3
49
72
84
13
35
11
03
18
11
Sa
bie
33
02
37
23
35
62
12
43
83
25
23
53
33
51
2S
ST
80
62
60
19
31
12
43
97
11
68
15
28
41
33
23
15
28
52
0S
ST
81
53
44
14
38
29
SS
T 8
16
30
12
73
71
13
SS
T 8
22
23
72
23
37
16
33
32
62
43
92
87
10
30
21
82
87
19
SS
T 8
35
31
93
30
22
63
79
10
16
81
62
92
93
33
10
31
11
4S
ST
84
32
79
14
33
51
83
63
19
30
23
32
05
32
61
43
07
15
SS
T 8
66
31
06
32
61
93
95
22
42
10
31
86
34
36
31
81
0S
ST
86
73
16
53
76
23
70
14
25
95
33
01
35
42
34
63
SS
T 8
75
30
47
31
02
53
85
81
41
20
28
51
23
33
11
30
71
6S
ST
87
62
73
16
32
12
13
58
20
19
11
42
86
11
31
71
62
97
17
SS
T 8
77
26
11
83
78
13
51
22
23
61
13
06
83
30
13
31
99
SS
T 8
78
16
11
8S
ST
88
42
42
21
31
32
33
44
23
30
01
92
78
21
SS
T 8
95
28
81
23
62
73
93
33
48
43
25
6S
ST
89
62
88
11
Ste
en
bra
s2
78
29
30
62
7T
am
bo
ti2
96
10
33
91
53
87
63
41
83
17
12
Tim
ba
va
ti3
46
13
66
63
65
18
35
91
35
61
Um
lazi
31
74
34
71
13
68
15
34
45
33
24
Av
era
ge
28
33
35
36
52
19
30
03
30
31
2L
SD
t(0,0
5)
71
.11
41
.53
31
.48
64
.02
24
.36
24
.56
35
.01
* O
nly
Da
nie
lsru
s d
ata
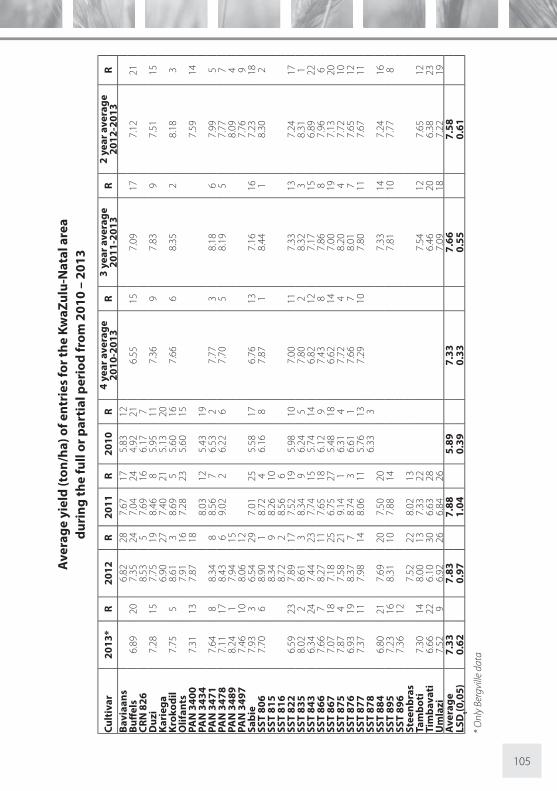
105
Av
era
ge
yie
ld (
ton
/ha
) o
f e
ntr
ies
for
the
Kw
aZ
ulu
-Na
tal
are
a
du
rin
g t
he
fu
ll o
r p
art
ial
pe
rio
d f
rom
20
10
– 2
01
3
Cu
ltiv
ar
20
13
*R
20
12
R2
01
1R
20
10
R4
ye
ar
av
era
ge
R3
ye
ar
av
era
ge
R2
ye
ar
av
era
ge
R2
01
0-2
01
32
01
1-2
01
32
01
2-2
01
3B
av
iaa
ns
6.8
22
87
.67
17
5.8
31
2B
uff
els
6.8
92
07
.35
24
7.0
42
44
.92
21
6.5
51
57
.09
17
7.1
22
1C
RN
82
68
.53
57
.69
16
6.1
77
Du
zi7
.28
15
7.7
51
98
.46
85
.95
11
7.3
69
7.8
39
7.5
11
5K
ari
eg
a6
.90
27
7.4
02
15
.13
20
Kro
ko
dil
7.7
55
8.6
13
8.6
95
5.6
01
67
.66
68
.35
28
.18
3O
lifa
nts
7.9
11
67
.28
23
5.6
01
5P
AN
34
00
7.3
11
37
.87
18
7.5
91
4P
AN
34
34
8
.03
12
5.4
31
9P
AN
34
71
7
.64
88
.34
88
.56
76
.53
27
.77
38
.18
67
.99
5P
AN
34
78
7
.11
17
8.4
36
9.0
22
6.2
26
7.7
05
8.1
95
7.7
77
PA
N 3
48
98
.24
17
.94
15
8.0
94
PA
N 3
49
77
.46
10
8.0
61
27
.76
9S
ab
ie7
.93
36
.54
29
7.0
12
55
.58
17
6.7
61
37
.16
16
7.2
31
8S
ST
80
67
.70
68
.90
18
.72
46
.16
87
.87
18
.44
18
.30
2S
ST
81
58
.34
98
.26
10
SS
T 8
16
8.7
22
8.5
66
SS
T 8
22
6.5
92
37
.89
17
7.5
21
95
.98
10
7.0
01
17
.33
13
7.2
41
7S
ST
83
58
.02
28
.61
38
.34
96
.24
57
.80
28
.32
38
.31
1S
ST
84
36
.34
24
7.4
42
37
.74
15
5.7
41
46
.82
12
7.1
71
56
.89
22
SS
T 8
66
7.6
67
8.2
71
17
.65
18
6.1
29
7.4
38
7.8
68
7.9
66
SS
T 8
67
7.0
71
87
.18
25
6.7
52
75
.48
18
6.6
21
47
.00
19
7.1
32
0S
ST
87
57
.87
47
.58
21
9.1
41
6.3
14
7.7
24
8.2
04
7.7
21
0S
ST
87
66
.93
19
8.3
77
8.7
43
6.6
11
7.6
67
8.0
17
7.6
51
2S
ST
87
77
.37
11
7.9
81
48
.06
11
5.7
61
37
.29
10
7.8
01
17
.67
11
SS
T 8
78
6.3
33
SS
T 8
84
6.8
02
17
.69
20
7.5
02
07
.33
14
7.2
41
6S
ST
89
57
.23
16
8.3
11
07
.88
14
7.8
11
07
.77
8S
ST
89
67
.36
12
Ste
en
bra
s7
.52
22
8.0
21
3T
am
bo
ti7
.30
14
8.0
01
37
.33
22
7.5
41
27
.65
12
Tim
ba
va
ti6
.66
22
6.1
03
06
.63
28
6.4
62
06
.38
23
Um
lazi
7.5
29
6.9
22
66
.84
26
7.0
91
87
.22
19
Av
era
ge
7.3
37
.83
7.8
85
.89
7.3
37
.66
7.5
8L
SD
t(0,0
5)
0.6
20
.97
1.0
40
.39
0.3
30
.55
0.6
1
* O
nly
Ber
gvi
lle d
ata

106
Av
era
ge
he
cto
litr
e m
ass
(k
g/h
l) o
f e
ntr
ies
for
the
Kw
aZ
ulu
-Na
tal
are
a
du
rin
g t
he
fu
ll o
r p
art
ial
pe
rio
d f
rom
20
10
– 2
01
3
Cu
ltiv
ar
20
13
*R
20
12
R2
01
1R
20
10
R4
ye
ar
av
era
ge
R3
ye
ar
av
era
ge
R2
ye
ar
av
era
ge
R2
01
0-2
01
32
01
1-2
01
32
01
2-2
01
3B
av
iaa
ns
83
.28
17
81
.53
19
78
.00
10
Bu
ff e
ls7
8.6
91
81
.22
26
80
.75
25
76
.50
19
79
.29
11
80
.22
14
79
.96
7C
RN
82
68
4.9
33
82
.10
15
78
.70
5D
uzi
78
.53
28
2.3
32
18
1.4
52
07
7.1
01
47
9.8
59
80
.77
78
0.4
35
Ka
rie
ga
80
.65
27
81
.08
24
77
.00
16
Kro
ko
dil
75
.52
12
83
.03
19
82
.70
12
75
.60
20
79
.21
12
80
.42
12
79
.28
12
Oli
fan
ts8
3.3
01
68
1.6
41
87
8.0
01
0P
AN
34
00
74
.44
18
83
.73
12
79
.09
16
PA
N 3
43
4
81
.15
23
76
.90
18
PA
N 3
47
1
76
.74
78
4.4
57
83
.70
77
9.7
01
81
.15
18
1.6
32
80
.60
3P
AN
34
78
7
6.2
68
81
.75
24
84
.80
17
9.6
02
80
.60
48
0.9
45
79
.01
17
PA
N 3
48
97
5.2
71
48
3.4
31
57
9.3
51
0P
AN
34
97
78
.00
58
4.2
89
81
.14
2S
ab
ie7
5.5
01
38
0.6
02
88
0.0
82
67
7.0
01
67
8.2
91
47
8.7
31
97
8.0
52
2S
ST
80
67
5.1
41
58
5.6
21
83
.78
67
8.7
05
80
.81
38
1.5
13
80
.38
6S
ST
81
58
4.5
36
82
.10
15
SS
T 8
16
85
.00
28
4.2
03
SS
T 8
22
74
.26
20
84
.40
88
2.4
51
37
8.1
08
79
.80
10
80
.37
13
79
.33
11
SS
T 8
35
74
.20
21
84
.68
58
3.2
51
07
8.2
07
80
.08
68
0.7
19
79
.44
9S
ST
84
37
4.0
72
28
3.9
01
18
3.3
39
79
.00
38
0.0
78
80
.43
11
78
.99
18
SS
T 8
66
78
.41
38
4.0
81
08
3.0
31
17
8.0
01
08
0.8
82
81
.84
18
1.2
51
SS
T 8
67
75
.76
11
82
.18
23
81
.25
22
77
.10
14
79
.07
13
79
.73
16
78
.97
19
SS
T 8
75
76
.16
10
82
.20
22
83
.85
57
8.1
08
80
.08
78
0.7
48
79
.18
15
SS
T 8
76
74
.79
17
83
.73
12
83
.88
47
8.9
04
80
.32
58
0.8
06
79
.26
14
SS
T 8
77
74
.89
16
81
.53
25
81
.30
21
74
.40
21
78
.03
15
79
.24
18
78
.21
21
SS
T 8
78
77
.40
13
SS
T 8
84
73
.89
23
83
.23
18
82
.18
14
79
.77
15
78
.56
20
SS
T 8
95
76
.23
98
4.8
04
83
.45
88
1.4
94
80
.52
4S
ST
89
67
4.4
11
9S
tee
nb
ras
83
.58
14
84
.28
2T
am
bo
ti7
7.1
76
82
.42
20
81
.75
17
80
.45
10
79
.80
8T
imb
av
ati
73
.73
24
79
.58
30
79
.73
28
77
.68
20
76
.66
23
Um
lazi
78
.22
48
0.3
32
98
0.0
82
67
9.5
41
77
9.2
81
2A
ve
rag
e7
5.8
58
3.0
98
2.3
17
7.7
17
9.8
48
0.3
57
9.4
2L
SD
t(0,0
5)
3.5
72
.36
1.3
41
.11
1.0
91
.75
2.4
3
* O
nly
Ber
gvi
lle d
ata

107
Av
era
ge
pro
tein
co
nte
nt
(%)
of
en
trie
s fo
r th
e K
wa
Zu
lu-N
ata
l a
rea
du
rin
g t
he
fu
ll o
r p
art
ial
pe
rio
d f
rom
20
10
– 2
01
3
Cu
ltiv
ar
20
13
*R
20
12
R2
01
1R
20
10
R4
ye
ar
av
era
ge
R3
ye
ar
av
era
ge
R2
ye
ar
av
era
ge
R2
01
0-2
01
32
01
1-2
01
32
01
2-2
01
3B
av
iaa
ns
13
.68
61
3.1
24
13
.21
18
Bu
ff e
ls1
4.1
07
13
.22
14
13
.07
61
3.5
98
13
.50
51
3.4
67
13
.66
9C
RN
82
61
3.1
61
81
2.8
51
31
3.4
91
1D
uzi
13
.63
18
13
.07
22
12
.76
16
13
.44
12
13
.22
10
13
.15
14
13
.35
18
Ka
rie
ga
14
.18
41
2.9
71
01
3.4
31
3K
rok
od
il1
2.9
62
41
2.3
03
01
1.9
52
71
2.1
82
01
2.3
51
51
2.4
02
01
2.6
32
3O
lifa
nts
14
.65
21
4.4
92
14
.98
2P
AN
34
00
13
.78
14
12
.82
28
13
.30
20
PA
N 3
43
4
12
.87
12
13
.70
6P
AN
34
71
1
3.5
82
01
3.0
42
31
2.1
62
51
3.3
81
61
3.0
41
21
2.9
31
71
3.3
11
9P
AN
34
78
1
3.7
61
51
3.1
81
61
2.4
32
31
3.7
64
13
.28
81
3.1
21
51
3.4
71
3P
AN
34
89
13
.64
17
13
.15
19
13
.39
17
PA
N 3
49
71
4.1
86
13
.07
21
13
.63
10
Sa
bie
13
.48
21
14
.43
31
3.1
15
13
.57
10
13
.65
41
3.6
75
13
.95
6S
ST
80
61
4.0
58
13
.37
12
12
.83
14
13
.58
91
3.4
57
13
.41
81
3.7
18
SS
T 8
15
12
.94
26
12
.61
19
SS
T 8
16
13
.17
17
12
.64
18
SS
T 8
22
14
.96
21
3.4
98
13
.44
31
3.9
43
13
.96
21
3.9
62
14
.22
2S
ST
83
51
3.5
91
91
3.4
31
11
2.4
42
21
3.4
11
51
3.2
21
11
3.1
51
31
3.5
11
2S
ST
84
31
6.0
61
14
.98
11
4.8
21
15
.35
11
5.3
01
15
.29
11
5.5
21
SS
T 8
66
13
.85
11
13
.02
24
11
.86
28
13
.23
17
12
.99
13
12
.91
18
13
.43
16
SS
T 8
67
14
.55
31
3.4
89
12
.99
81
3.6
67
13
.67
31
3.6
74
14
.01
5S
ST
87
51
3.3
22
31
2.8
02
91
2.0
22
61
3.1
71
91
2.8
31
41
2.7
11
91
3.0
62
2S
ST
87
61
3.8
21
31
3.2
11
51
2.5
32
11
3.4
31
31
3.2
59
13
.19
12
13
.51
11
SS
T 8
77
14
.01
91
3.4
51
01
2.7
41
71
3.7
64
13
.49
61
3.4
09
13
.73
7S
ST
87
81
2.1
52
1S
ST
88
41
3.6
71
61
3.2
31
31
3.0
27
13
.31
10
13
.45
14
SS
T 8
95
14
.42
41
3.6
47
12
.91
11
13
.66
61
4.0
34
SS
T 8
96
13
.84
12
Ste
en
bra
s1
2.8
62
71
2.3
52
4T
am
bo
ti1
3.9
41
01
2.9
52
51
2.7
91
51
3.2
31
11
3.4
41
5T
imb
av
ati
14
.28
51
3.9
35
12
.98
91
3.7
33
14
.10
3U
mla
zi1
3.3
82
21
3.1
42
01
2.6
02
01
3.0
41
61
3.2
62
1A
ve
rag
e1
3.9
51
3.3
71
2.8
31
3.5
41
3.4
11
3.3
71
3.6
4L
SD
t(0,0
5)
0.5
80
.66
0.5
40
.52
0.3
20
.35
0.4
5
* O
nly
Ber
gvi
lle d
ata
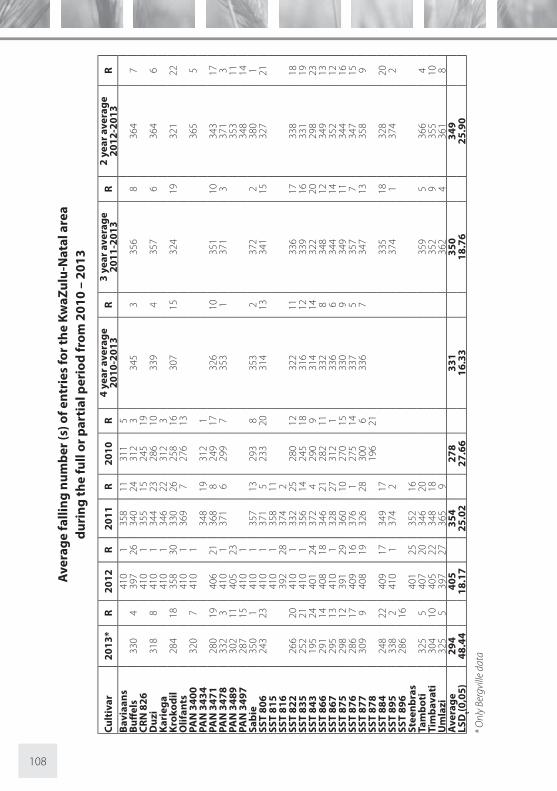
108
Av
era
ge
fa
llin
g n
um
be
r (s
) o
f e
ntr
ies
for
the
Kw
aZ
ulu
-Na
tal
are
a
du
rin
g t
he
fu
ll o
r p
art
ial
pe
rio
d f
rom
20
10
– 2
01
3
Cu
ltiv
ar
20
13
*R
20
12
R2
01
1R
20
10
R4
ye
ar
av
era
ge
R3
ye
ar
av
era
ge
R2
ye
ar
av
era
ge
R2
01
0-2
01
32
01
1-2
01
32
01
2-2
01
3B
av
iaa
ns
41
01
35
81
13
11
5B
uff
els
33
04
39
72
63
40
24
31
23
34
53
35
68
36
47
CR
N 8
26
41
01
35
51
52
45
19
Du
zi3
18
84
10
13
44
23
28
61
03
39
43
57
63
64
6K
ari
eg
a4
10
13
46
22
31
23
Kro
ko
dil
28
41
83
58
30
33
02
62
58
16
30
71
53
24
19
32
12
2O
lifa
nts
41
01
36
97
27
61
3P
AN
34
00
32
07
41
01
36
55
PA
N 3
43
4
34
81
93
12
1P
AN
34
71
2
80
19
40
62
13
68
82
49
17
32
61
03
51
10
34
31
7P
AN
34
78
3
32
34
10
13
71
62
99
73
53
13
71
33
71
3P
AN
34
89
30
21
14
05
23
35
31
1P
AN
34
97
28
71
54
10
13
48
14
Sa
bie
35
01
41
01
35
71
32
93
83
53
23
72
23
80
1S
ST
80
62
43
23
41
01
37
15
23
32
03
14
13
34
11
53
27
21
SS
T 8
15
41
01
35
81
1S
ST
81
63
92
28
37
42
SS
T 8
22
26
62
04
10
13
32
25
28
01
23
22
11
33
61
73
38
18
SS
T 8
35
25
22
14
10
13
56
14
24
51
83
16
12
33
91
63
31
19
SS
T 8
43
19
52
44
01
24
37
24
29
09
31
41
43
22
20
29
82
3S
ST
86
62
91
14
40
81
83
46
21
28
21
13
32
83
48
12
34
91
3S
ST
86
72
95
13
41
01
32
82
73
12
13
36
63
44
14
35
21
2S
ST
87
52
98
12
39
12
93
60
10
27
01
53
30
93
49
11
34
41
6S
ST
87
62
86
17
40
91
63
76
12
75
14
33
75
35
77
34
71
5S
ST
87
73
09
94
08
19
32
62
83
00
63
36
73
47
13
35
89
SS
T 8
78
19
62
1S
ST
88
42
48
22
40
91
73
49
17
33
51
83
28
20
SS
T 8
95
33
82
41
01
37
42
37
41
37
42
SS
T 8
96
28
61
6S
tee
nb
ras
40
12
53
52
16
Ta
mb
oti
32
55
40
72
03
46
20
35
95
36
64
Tim
ba
va
ti3
04
10
40
52
23
48
18
35
29
35
51
0U
mla
zi3
25
53
97
27
36
59
36
24
36
18
Av
era
ge
29
44
05
35
42
78
33
13
50
34
9L
SD
t(0,0
5)
48
.44
18
.17
25
.02
27
.66
16
.33
18
.76
25
.90
* O
nly
Ber
gvi
lle d
ata

109

110
FERTILISATION GUIDELINES FOR WHEAT PRODUCTION
The cost of fertiliser is a substantial proportion of the total production cost of wheat and the
optimisation of fertilising practices is therefore of the utmost importance.
The development of specifi cally adapted cultivars over the past few years has necessitated
the planning of a fertilisation programme by the producer on an annual basis. As with cultivar
choice, a fertilisation programme is planned on the basis of a specifi c yield potential or target
yield. The following guidelines can be used as a reference to plan such a programme for a
given situation.
Reliable soil analysis data is essential for planning an eff ective fertilisation programme. The
regular sampling of lands to timeously identify problems, such as soil acidifi cation, is absolutely
essential.
Soil sampling for analysis
Soil is analysed to determine its ability to supply the necessary plant nutrients to the crop
concerned. Soil analyses are related to potential nutrient uptake, supple- mentation of plant
nutrients through fertilisation and the target yield. From plant nutrient research programmes
that take these factors into account, guidelines that will be valid in a given situation, are laid
down.
Therefore, to make the best possible use of these guidelines, it is essential that the soil samples
that are interpreted are representative of the particular land. To achieve this, the following
standard procedures are required when handling soil samples:
• Homogeneous units that are also practical for crop production purposes must be
sampled. (Homogeneity is determined by previous crop performance, topography and
the soil depth, colour and texture);
• A soil sample must represent a homogeneous unit of not more that 50 ha;
• Homogeneous units must be numbered clearly and separately;
• Problem/poor patches must be indicated and sampled separately;
• When taking the sample, all foreign matter (grass, twigs, loose stones) must be removed
at the sampling point. In the case of very rocky soils an estimate must be made of the rock
percentage per volume;
• Twenty to 40 samples must be taken at random over the entire area of each homogeneous
unit of the land. Conspicuously poor patches, headlands, places where animals gather,
et cetera, must be avoided;
• The recommended depth for sampling the topsoil is about 200 mm, in other words the
0-200 mm portion of the topsoil is sampled;
• Subsoil samples must be taken from the 200-600 mm layer of the profi le for dryland
cultivation, and at 200-600 and from 600-1200 mm for irrigation;

111
• If the land has been ploughed, random samples must be taken from the entire
area. If the rows of the previous crop are still visible, the samples must be taken randomly
between and in the rows;
• To compare results, sampling should be done at more or less the same time of the year
every year, or during the same phase of the cultivation programme, but at least once every
three years;
• The 20-40 samples from which the fi nal sample is to be combined, must be collected
in a clean bag, (farmers are warned against using salt bags, fertiliser bags or other
contaminated containers). Clods must be crushed, foreign matter removed, and the soil
must be mixed thoroughly. After spreading the soil in a thin layer, small scoops are taken
evenly over the whole depth and area and placed in a clean plastic bag or carton. This
fi nal sample, representative of a homogeneous unit, must have a mass of 0.5-1.0 kg; and
• Additional information about the properties of the soil, climate, production and
fertilisation history should also be furnished, since recommendations cannot be based
on soil analysis alone.
Soil acidity
One of the major wheat production problems in the summer rainfall region is the increased
acidifi cation of soils, especially in the higher rainfall areas. The negative eff ect of acid soil lies
in the high level of free aluminium ions, when compared to other cation levels, in the soil. As a
result, high concentrations of toxic aluminium are taken up by the wheat plant.
Although germination and establishment are not infl uenced by high Al3+ - concentrations in
the soil, aluminium toxicity symptoms occur in the early plant development stages (usually
September when warmer temperatures promote active growth). When the root system
of the young plant is exposed to high aluminium levels, severe drought and nutrient stress
symptoms appear and plant mortality may eventually occur. The symptoms of aluminium
toxicity are clearly visible on the roots. The root tips become thickened, the lateral roots brittle
and a brown discoloration takes place. Inhibition of root growth limits the uptake of water and
plant nutrients.
Guidelines
The pH (KCl) and soil texture is used to determine the lime requirements for wheat.
Soil analysis for lime requirement purposes is essential when the soil pH (KCl) is below 4.5, pH
(CaCl2) below 5.0 or pH (H
2O) below 5.5. Table 1 shows the lime requirement (ton per hectare)
for diff erent pH values and clay percentages.
Because the ratio of aluminium to other cations in the soil is essential to the reaction of the
plant, it is important to emphasise that lime is recommended if the percentage acid saturation
is above 8% and/or if the pH (KCl) is below 4.5.

112
Table 1. Lime requirements (ton/ha) for diff erent acidity levels and
clay content.
% ClayΔ pH > 0.5Δ SV > 32
Δ pH : 0.5-0.4Δ SV : 32-25
Δ pH : 0.4-0.3Δ SV : 25-15
Δ pH : 0.3-0.2Δ SV : 15-10
Δ pH< 0,2-0,1Δ SV <10
5-1010-15
15-20
20-25
25-30
30-35
3.94.1
4.4
4.6
4.8
5.1
3.03.3
3.5
3.8
4.0
4.2
2.22.5
2.7
2.9
3.2
3.4
1.41.6
1.9
2.1
2.3
2.6
0.50.8
1.0
1.3
1.5
1.7
∆pH - Change in pH(KCl)
∆AS - Change in % acid saturation
Lime requirement = ∆pH*8.324+0.0459*Clay-1.037
If the lime requirement exceeds 4 ton/ha, lime must be applied over two cropping seasons
and not all at once. The equation from Table 1 can also be used to calculate lime requirement,
by inserting the desired change in pH and the clay content into the equation.
Lime requirement in Table 1 is based on a lime source with a CCE (Resin) of 75.3. If the lime
source has a CCE (Resin) value higher or lower than 75.3 the following adaptations must be
made for a soil, for example, with a lime requirement of 3.5 ton/ha.
Suppose a CCE (Resin) of 90%, then the actual lime requirement will be as follows:
75.3/90 = 0.84
3.5*0.84 = 2.93 ton lime/ha, thus ±3 ton/ha
Suppose a CCE (Resin) of 60%, then the actual lime requirement will be:
75.3/60 = 1.26
3.5*1.26 = 4.4 ton lime/ha thus ±4.5 ton/ha
Type of liming material
It is essential that the lime source (calcitic or dolomitic) be selected correctly. The type of lime
to be used is determined by the Ca:Mg ratio and the Mg content of the soil. If the Ca:Mg ratio is
higher than 10:1, dolomitic lime is recommended. When the Ca:Mg ratio is lower than 10:1 the
choice of lime source is determined by the Mg content of the soil. If it is higher than 40 mg/kg
(p.p.m.), calcitic lime is recommended, while dolomitic lime is used when the Mg content of
the soil is lower than 40 mg/kg.

113
The application of lime
Liming material must comply to certain specifi cations of fi neness and reactivity for the eff ective
neutralising of acid soils. Dolomitic agricultural lime must contain more than 20% magnesium
carbonate (MgCO3) and calcitic agricultural lime more than 70% calcium carbonate (CaCO
3).
Lime must have a fi neness of less than 250 micron.
It is essential that lime be applied three to four months before planting. When dry soils are
limed only a small change in the pH values will be obtained. Soil texture (which is the most
important factor), nitrogen fertilisation and the quantity and quality of lime applied, will
determine how often lime has to be re-applied. Acidifi cation is more rapid in light textured
soils than in the clay soils because of their diff erences in buff er capacity. Light textured soils
have lower lime requirements to attain certain soil pH levels.
It is essential to remember that a good reaction will only be obtained when the lime is well
mixed with the soil. The lime particles must come into close contact with the silt and clay
particles to displace the hydrogen and aluminium ions. Lime has to be mixed into the soil with
an off set or disc, and then ploughed in to a depth of 200 to 400 mm.
Cultivar choice as a remedy
In association with the liming programme, cultivars with good aluminium tolerance can also
be used to limit yield losses caused by acid soils. Considerable variation in genetic (cultivar)
tolerance to aluminium toxicity exists. Cultivars can be divided into three classes of aluminium
tolerance (Table 2):
• Good tolerance
• Reasonable tolerance
• Poor tolerance
Table 2. Cultivars in diff erent classes of aluminium tolerance
Excellent tolerance Moderate tolerance Poor tolerance Unknown tolerance
PAN 3118 (PBR)
Gariep Elands (PBR)
Matlabas (PBR)
PAN 3120 (PBR)
Komati (PBR)
SST 347 (PBR)
PAN 3161 (PBR)
PAN 3144 (PBR)
SST 356 (PBR)
PAN 3355 (PBR)
PAN 3368 (PBR)
SST 374 (PBR)
PAN 3379 (PBR)
SST 387 (PBR)
It is important to keep in mind that cultivar choice is not only made on the basis of aluminium
tolerance. Grain yield and quality still remains one of the most important focus points of
cultivar choice. Cultivar choice in terms of aluminium tolerance is only a short term solution
with a certain amount of risk attached. Cultivar choice could eff ectively be used to overcome
the acidity problem during the neutralisation period. Liming programmes will not only lower
the production risk, but also sustain the soil for future generations.

114
High yields and the accompanying high volumes of crop residues returned to the soil can
result in a large amount of undercomposed residue in the soil at planting. This scenario can
result from the late soil cultivation and/or wet soil conditions during this time, leading to
reduced N availability, depressing growth and yields and also decreasing grain quality. Where
these scenarios are expected or encountered, adaptation to the fertiliser strategy must
be made by increasing N fertiliser application at planting or adding N (15kg N/ha) and lime
(0,5 ton/ha) during late cultivation to increase decomposition of residue. The removal of crop
residue (baling, burning or grazing) also aff ect fertiliser planning due to removal of nutrients.
The advantages of eff ective crop rotation systems are obvious from the above discussion.
Sufficient time for soil cultivation and residue management and decomposition are available
in these systems. Compaction layers in soils that can negatively aff ect soil water availablility,
root development and nutrients used by the crop can also be successfully managed.
Nitrogen fertilisation
Nitrogen fertilisation under dryland conditions
Table 3 gives nitrogen fertilisation guidelines on a regional basis for the diff erent target yields.
When using the guidelines, the following aspects must be kept in mind:
• All guidelines are valid for the cultivation of wheat after wheat, and all crop residues is
timeously worked into the soil.
• All nitrogen fertiliser must have been applied at planting time and normally no nitrogen
topdressing is recommended.
• High nitrogen applications with the seed could adversely aff ect germination and
therefore the plant population. It is therefore recommended that not more than 20 kg N/
ha be placed with the seed.
• Applications of more than 20 kg N/ha should be applied shortly before planting or
be band placed away from the seed at planting. Because of stored soil water loss that
usually accompanies tillage practices, it is preferable to band place higher N application
at planting.
• The protein content of the grain can be increased by higher applications of nitrogen,
and because of the changed grading regulations, the guidelines have been adapted to
accommodate this.
• High yields and the accompanying high volumes of crop residues returned to the soil can
result in a large amount of undercomposed residue in the soil at planting. This scenario
can result from the late soil cultivation and/or wet soil conditions during this time, leading
to reduced N availability, depressing growth and yields and also decreasing grain quality.
Where these scenarios are expected or encountered, adaptation to the fertiliser strategy
must be made by increasing N fertiliser application at planting or adding N (15kg N/
ha) and lime (0,5 ton/ha) during late cultivation to increase decomposition of residue. The
removal of crop residue (baling, burning or grazing) also aff ects fertiliser planning due to
removal of nutrients.

115
• The advantages of eff ective crop rotation systems are obvious from the above discussion.
Sufficient time for soil cultivation and residue management and decomposition are
available in these systems. Compaction layers in soils that can negatively aff ect soil water
availablility, root development and nutrients used by the crop can also be successfully
managed.
Table 3. Nitrogen fertilisation according to production area and
target yield in the summer rainfall region.
Production areaTarget yield
(ton/ha)N fertilisation
(kg N/ha)
Southern Free State1.01.52.0
101525
North-Western Free State
1.01.52.0
2.5 *3.0 *
>3.5 *
1020304555
65+
Central Free State1.01.5
>2.0
1525
35+
Eastern Free State
1.01.52.02.5
>2.5
15304050
60+
North West Province1.01.52.0
51525
Mpumalanga
1.01.52.02.5
10203040
* Valid for the areas where a high water table and good moisture supply favour a higher target yield.

116
Nitrogen fertilisation under irrigation
Nitrogen fertilisation guidelines for irrigated wheat are given in Table 4(a).
Table 4(a). Nitrogen fertilisation (kg N/ha) according to target yield
under irrigation
Target yield (ton/ha) Nitrogen (kg N/ha)
4 – 55 – 66 - 77 – 88+
80 -130130-160160- 180180-200
200+
• The guidelines in Table 4(a) do not accommodate crop rotations with wheat following
N-fi xing crops. In these specifi c cases downward adaptations of N fertilisation guidelines
can be made based on the residual N in the soil. Contact relevant experts in these cases,
also in scenarios where large volumes of crop residues/manure are incorporated into the
soil, necessitating adaptation in nitrogen management.
• Split applications of N under irrigation has been of interest for some time. It has been
proved that eff ective N management during the growing season can result in high yields
with acceptable grain protein percentages. Changes in growing conditions aff ecting yield
potential, for instance cold winters resulting in increased tillering, can also be managed
timeously. The principle of split application of N is to increase the efficiency of use by the
plant by providing sufficient nutrients when needed for growth and yield development,
and also to optimise grain quality.
• A general split application schedule at diff erent yield potential levels for soils with a clay
content of 15-25% is presented in Table 4(b). On the lower clay soils the amount of N
applied at planting and at tillering can split into smaller applications according to the
practical situation (irrigation equipment), for the prevention of N losses from the soil
profi le. On the higher clay soils (>25% clay) the guidelines in Table 4(b) can be used. It
is important to concentrate the application and availability of N around the important
growth stages for yield and grain quality (protein content) development. Linked to this
is the importance of eff ective irrigation management on the eff ectivity of N use and split
applications of applied N.
• During the development stages such as tillering to fl agleaf stage, N management
combined with yield potential should be evaluated. Eff ective N management during the
season can fi x the yield potential of the crop, but also ensure acceptable protein content
of the grain. Research have shown that increased and split N applications can increase the
protein content of the grain, even in scenarios where N is the limiting factor.
• The application of N during the fl agleaf to anthesis growth stages of development can
ensure that sufficient N is available during grain development to increase grain protein.
Depending on the yield potential, between 0 and 60 kg N/ha must be applied during this
time to increase grain protein above 11%.

117
• Nitrogen and water management is important in irrigation farming. Adequate water is
needed to prevent water stresses, but also to aid nutrient uptake. Withdrawal of irrigation
at maturity must only be done when the stem below the ear has completely discoloured.
During this late stage of grain fi lling, nutrients are being transported to the grain and
water stresses can impact on grain growth and result in a low hectolitre mass.
Table 4(b). Split application of N during the growing season at
diff erent levels of yield potential
Yield(ton/ha)
Nitrogen split application (kg N/ha)
Plant to tilleringTillering to stem
elongation Flag leaf to anthesis
4-55-66-77-8>8
80-100100
100-130130-160
160
30303030
30-60
0303030
30-60
Phosphorus fertilisation
The phosphorus fertilisation guidelines are given in Tables 6 and 7 in terms of Bray 1 analysis
method (mass) for soil phosphorus.
Certain advisors however make recommendations in terms of other phosphorus analysis
methods and it is therefore necessary to compare the diff erent methods. Although the
diff erent methods do not maintain constant ratios to one another on clay soils (such as the
black turf soils) and strong acid or alkaline conditions, Table 5 gives approximated ratios that
will be valid for most soils.
Table 5. Approximate ratios (mg P/kg) determined according to
diff erent analyses methods
Ambic 1 Bray 1 Bray 2Citric acid
(1:20)Olsen
68
11131620232630
61014172024283134
91318222631364045
101520253035404550
468
101214161820

118
When interpreting the phosphorus fertilisation guidelines, the following must be kept in mind:
• When referring to phosphorus fertilisation, citric acid soluble or water soluble phosphorus
sources are intended.
• Economic principles were applied when guidelines were calculated and the quantity of
phosphorus fertiliser indicates the quantity where maximum gross profi t is obtained.
• The guidelines make provision for a gradual build-up of soil phosphorus status at low
levels of soil phosphorus, if crop residue is not removed from the fi eld. A gradual rather
than sudden build-up is preferred with banding of fertiliser at planting.
• The higher phosphorus quantities in the guidelines refer to the lower analysis fi gure,
and vice versa. For analysis values between these extremes, the correct phosphorus
fertilisation must be deduced within the given quantities.
• Under acidic soil conditions, plant response to applied fertiliser at high soil P levels can
occur, due to the relative lower availability of soil P.
Phosphorus fertilisation under dryland conditions
The phosphorus fertilisation guidelines for dryland conditions, according to target yield and
soil phosphorus status, are given in Table 6.
Table 6. Phosphorus fertilisation (kg P/ha) for dryland area according
to target yield and soil status according to the Bray 1 analysis method
Target yield (ton/ha)Soil phosphorus status (mg/kg)
<5* 5-18 19-30 >30
1.01.52.0
2.5+
69
1218
58
1215
468
12
457
10
* Minimum quantity that should be applied at the low phosphorous level.
Phosphorus fertilisation under irrigation
The phosphorus fertilisation guidelines for irrigated wheat are given in Table 7 in terms of the
target yield and soil phosphorus status (Bray 1).

119
Table 7. Phosphorus fertilisation (kgP/ha) for the irrigation area
target yield and soil status according to the Bray 1 analysis method
Target yield (ton/ha)Soil phosphorus status (mg/kg)
<5* 5-18 19-30 >30
4-55-66-77+
364452
>56
283440
>42
182226
>28
12151821
Potassium fertilisation
Potassium defi ciencies are rarely observed in the wheat production areas, as South African
soils are relatively rich in potassium. Increased wheat yields due to potassium fertilisation are
therefore seldomly recorded. Potassium defi ciencies may occur under the following conditions:
• Highly leached sandy soils with low levels of soil potassium
• Cold and/or wet and/or very dry soil conditions
• Very high magnesium and/or calcium content of soils.
Soil potassium levels determined according to the Ambic 1 and ammonium acetate methods
of analysis are overall similar. Therefore reference will only be made to soil potassium levels in
the tables.
Potassium fertilisation under dryland conditions
The soil potassium analysis value, the soil texture (clay percentage) and the target yield are
used in the recommendations in Table 8 to determine whether potassium fertilisation should
be applied or not.
Potassium can be bandplaced with nitrogen and phosphate as a compound fertiliser. If the
potassium requirement is too high to be bandplaced, the potassium must be broadcast and
incorporated into the soil before planting. Research results, however, have shown bandplacing
to be the most eff ective method of application.

120
Table 8. Guidelines for potassium fertilisation (kg K/ha) under dryland
conditions according to soil texture, soil potassium levels and target
yield
Target yield (ton/ha)Soil potassium status (mg/kg)
<60 61-80 81-120* >120
1-22-33+
203040
152025
152025
000
* Soil with >35% clay (Soil with <35% clay content, no potassium recommended, but potassium applications may be done for
maintenance of soil K values.)
Potassium fertilisation under irrigation conditions
Potassium fertilisation guidelines for wheat under irrigation, according to soil potassium levels
and target yield, are given in Table 9. Potassium can be broadcast and incorporated into the soil
before planting as a compound with nitrogen and phosphate.
Table 9. Guidelines for potassium fertilisation (kg K/ha) under
irrigation, ions according to soil texture, soil potassium levels and
target yield
Target yield (ton/ha)Soil potassium status (mg/kg)
<60 61-80 81-120* >120
4-55-66-77+
50607080
25303540
25303540
0000
* Soil with >35% clay (Soil with <35% clay content, no potassium recommended, but potassium applications may be done for
maintenance of soil K values.)
Micro nutrients
Although micro nutrients are needed in small amounts by plants, their importance in
providing a healthy and strong growing plant cannot be overlooked. Each micro nutrient plays
an important role in the physiology of plants. Iron, manganese, zinc, copper and boron are
essential for normal development and growth of wheat. If one or more of the micro nutrients
become defi cient, visual defi ciency symptoms will appear on the leaves. Defi ciency must be
corrected early in the growing season to prevent further yield losses.
At this stage micro nutrients are not generally recommended under dryland practices, because
of the risk involved to recover the additional input costs. Under specifi c conditions, where
micro nutrients are the yield limiting factor, plant analysis (Table 10) can be used to determine
which nutrient is causing the problem.
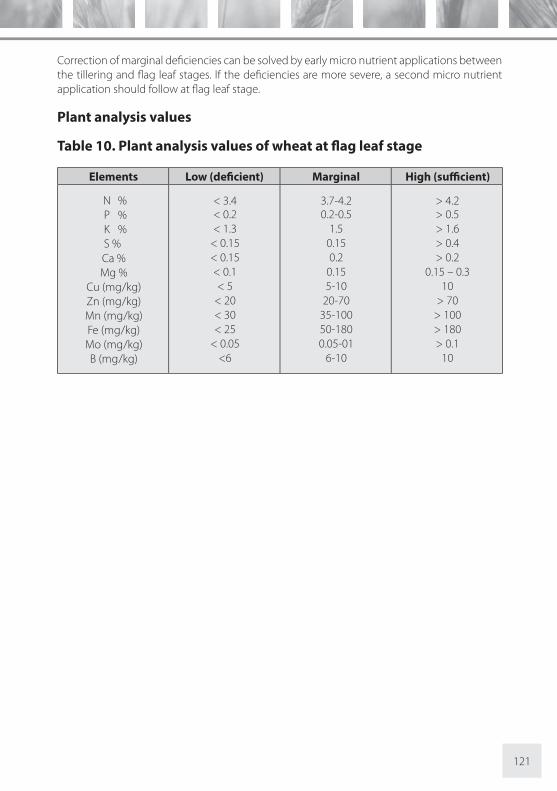
121
Correction of marginal defi ciencies can be solved by early micro nutrient applications between
the tillering and fl ag leaf stages. If the defi ciencies are more severe, a second micro nutrient
application should follow at fl ag leaf stage.
Plant analysis values
Table 10. Plant analysis values of wheat at fl ag leaf stage
Elements Low (defi cient) Marginal High (suffi cient)
N %
P %
K %
S %
Ca %
Mg %
Cu (mg/kg)
Zn (mg/kg)
Mn (mg/kg)
Fe (mg/kg)
Mo (mg/kg)
B (mg/kg)
< 3.4< 0.2
< 1.3
< 0.15
< 0.15
< 0.1
< 5
< 20
< 30
< 25
< 0.05
<6
3.7-4.20.2-0.5
1.5
0.15
0.2
0.15
5-10
20-70
35-100
50-180
0.05-01
6-10
> 4.2> 0.5
> 1.6
> 0.4
> 0.2
0.15 – 0.3
10
> 70
> 100
> 180
> 0.1
10

122
ADJUVANTS AND HERBICIDES
METHODS TO INCREASE HERBICIDE EFFICACY
There are various methods to increase herbicide efficacy.
Increase the herbicide rate
Herbicide efficacy usually increases with rate. Higher rates will often overcome poor
performance as a result of adverse environments. Increase in herbicide rate to overcome
environmental constraints has disadvantages and should not be regarded as the only option
to enhance herbicide efficacy. The disadvantages of high rates are discussed below.
Cost ineff ective
High herbicide use rates are costly and should only be used when other options are unavailable.
Environmental concern
Most herbicides are safe at recommended rates, but some may have soil residual or may leach.
High rates increase the potential of residual in the soil, surface water or ground water. Every
eff ort should be made to optimise herbicide efficacy with methods which do not involve
higher rates.
Unstable performance
Herbicide absorption is often very dependent on the climatic conditions during and just after
spraying. If the rate of a herbicide is increased to a level that acceptable control is obtained
under sub-optimal conditions, then probably too much herbicide is applied under optimal
conditions. The same argument applies to crop damage. A high herbicide rate, which causes
no damage under poor conditions, could injure a crop under optimal conditions.
Avoiding limiting factors
Another way of getting the most from a herbicide is to always spray under optimal climatic
conditions. This will ensure adequate absorption in most cases. The limiting factors which
should be avoided include the following:
• Low humidity
• Moisture stressed plants
• Wind
• Rain directly after application
• Water with high salt concentrations

123
Avoiding these limiting factors sounds good on paper, but is almost impossible in practice.
However, herbicides should be applied under favourable conditions whenever possible. The
variability, unpredictability and harshness of the South African climate is well known. Other
methods for optimising herbicide efficacy must be investigated.
Adjuvants
Adjuvants are substances which compensate, to a degree, for herbicide limiting environmental
factors. They stabilise herbicide efficacy under various conditions, increase efficacy under
harsh conditions and reduce potential of crop injury under optimal conditions compared to
the use of high rates. Most herbicides are used at lower rates when applied with adjuvants
accounting for the reduced crop injury under optimal environments. Adjuvants may not
be needed with a high rate of herbicide or when avoiding stress conditions. Higher rates
however, could be expensive and avoiding stress conditions is not always possible. Adjuvants
often are only eff ective with certain herbicides and may not totally overcome harsh conditions.
The important point is that herbicides often are specifi c and consideration must still be given
to stress conditions, specifi c herbicides, spray volume and spray carrier salts.
MISCONCEPTIONS REGARDING ADJUVANTS AND HERBICIDE
EFFICACY
There are many misconceptions about adjuvants.
Wetting/Spreading
The most common misconception is that adjuvants which wet the leaf eff ectively are always
the most eff ective. It is true that certain herbicides are more eff ective with “eff ective spreaders”,
but this is not a general rule with all herbicides.
Crop damage (phytotoxicity)
It is extremely convenient to blame crop damage of certain herbicides on the adjuvant applied
with the herbicide. Adjuvants are often characterised as “too hot” for certain herbicides.
One must however bear in mind that adjuvants only improve the activity of herbicides and
seldom have phytotoxic eff ects of their own. Crop damage results from too much herbicide
penetrating and damaging the crop. It is then ultimately an excess of herbicide which causes
the damage and not the adjuvant. Herbicides, at recommended lower rates applied with
adjuvants, normally result in more stable herbicides as far as efficacy and selectivity on the crop
is concerned. This is a result of similar amounts of herbicide penetrating the weeds and crop
under most climatic conditions. Adjuvants are therefore not the cause of herbicide damage on
crops. On the contrary, they may decrease crop damage by allowing for lower herbicide use
rates under various conditions.

124
Similar adjuvant enhancement of herbicide effi cacy
Another misconception is that adjuvants are all similar in action and that one adjuvant may be
substituted for another. This may be true if the rate of the herbicide is high enough to give total
weed control, but not when the herbicide is applied at low economical rates under adverse
climatic conditions. The sole purpose of adjuvants is to increase the efficacy of herbicides
when using low, economical rates.
Certain adjuvants are superior to others and may be used universallySince the fi rst adjuvants were applied it has always been the aim of adjuvant manufacturers
and scientists alike to create a “blockbuster” adjuvant which may be used universally with
all herbicides. Up to date there is no such miracle adjuvant and adjuvants are normally only
benefi cial to certain herbicides. Adjuvants have limitations just as any other agricultural
product. Both advantages and disadvantages of adjuvants need to be understood for correct
usage. Advantageous adjuvants could become disadvantageous if used incorrectly. Poor
efficacy or crop damage could result.
ACIDIFICATION
Some herbicides applied at low pH are more eff ective than at high pH for certain reasons.
Before herbicides are acidifi ed as a standard practice, it is important to understand the reasons
for acidifi cation and that acidifi cation is not always benefi cial. It is also necessary to understand
that there are, barring the acid products, also surfactants which without the addition of any acid
have the ability to acidify the spray solution. These surfactants include the phosphate esters
and have the dual purpose of acidifi cation and the other properties contained by surfactants.
When must spray solutions be acidifi ed?
Only when specifi ed on the label.
• Never omit the registered acidifi er or buff er.
• Do not acidify spray solutions as a standard practice when not recommended.
• Never substitute one buff er or acidifi er with another as the acids diff er in diff erent
products. If necessary only substitute products with the same acids.
Method of acidifi cation
Labels are very specifi c on the amount of acidifi er to be added and the sequence order of
addition. Buff ers and acidifi ers are normally added prior to the herbicide and the other
adjuvants. Excess acidifi cation may cause herbicide breakdown or interfere with uptake by the
plant. Label recommendations on amount of product and sequence of mixing are designed to
optimise compatibility over a wide range of conditions.
Acidifi cation is not always benefi cial
Although acidifi cation is sometimes advantageous, it may be disadvantageous with certain
herbicides. This once again proves that no adjuvant is universal in its use and that adjuvants
are herbicide specifi c.

125
CONDITIONS DURING AND JUST AFTER SPRAYING
Optimal conditions for herbicide application could allow for efficacy even when
recommendations are not followed. Improper applications however, will severely reduce
efficacy under adverse conditions such as low humidity. These improper applications could be
omission of or use of the wrong adjuvant or unregistered mixtures. The following conditions
may adversely aff ect herbicide absorption, especially when the right choice of adjuvant and
herbicide mixtures determine efficacy:
Low humidity and wind
Spray solution droplets on weed leaf surfaces under low humidity and windy conditions are
prone to rapid evaporation. Adjuvants which increase the rate of penetration or decrease the
rate of evaporation under these conditions will increase herbicide penetration and increase
herbicide efficacy. On the other hand, any factor which decreases rate of penetration will
decrease the amount of herbicide absorbed and the subsequent efficacy of the herbicide.
These factors include the omission of the registered adjuvant, the use of the wrong adjuvant
or the application of antagonistic mixtures of herbicides.
Sunlight (Ultraviolet light)
Certain herbicides are prone to breakdown by ultraviolet light on the leaf surface. Any factors
decreasing the rate of uptake of these herbicides will increase the chance of ultraviolet
breakdown and decrease herbicide efficacy. These factors could include wrong choice or
omission of the registered adjuvant, antagonistic mixtures or the time of day applied.
Rain
Herbicides are classifi ed as rainfast after a certain period of time. This means that rain after this
period of time will not decrease herbicide efficacy. Rainfastness in many instances just indicates
that the herbicide has been absorbed into the weed. Rate of penetration will decrease the
eff ect of wash-off from raindrops and will make the herbicide rainfast. Rapid penetration could
have additional advantages such as protecting the herbicide droplet against factors such as
low humidity, wind or ultraviolet light breakdown.
Moisture stress
Weeds under soil moisture stress do not grow actively and are not receptive to efficient
herbicide uptake. Any factor which decreases absorption or rate of absorption will devastate
herbicide efficacy on moisture stressed weeds. Even adjuvants cannot negate the negative
absorption response from moisture stressed plants.

126
Chemical factors
Adjuvants
Adjuvants partially overcome the infl uence of stress conditions on herbicides. The wrong
adjuvant choice can therefore decrease herbicide efficacy under stress conditions. A good
knowledge of adjuvants is therefore essential if replacing one adjuvant with another.
Mixtures
Antagonistic herbicide mixtures are a major source for decreased herbicide efficacy.
Antagonistic herbicides aff ect one another’s absorption and the resulting efficacy. These
mixtures are most pronounced under adverse climatic conditions.

127
INSECT CONTROL
During a season a number of diff erent insect pests can occur on wheat plants and not all these
pests are equally injurious. Therefore the decision to control should be made individually for
each pest using the guidelines provided and the particular control measure should be chosen
to give the best result in both economic and environmental terms. The correct identifi cation
of pests is of utmost importance to ensure that the appropriate control measure is followed.
A Field Guide for the Identifi cation of Insects in Wheat is available from ARC-Small Grain
Institute at a cost of R50 (+ R6 postage). This full colour guide contains a short description
and photograph of each insect and includes both pests and benefi cial insects. A pamphlet
containing information on the registered insecticides is also included. It is helpful to make
use of a magnifying glass when identifying wheat insects, as most of them are quite small. Dr.
Goddy Prinsloo, Dr. Justin Hatting, Dr. Vicki Tolmay and Dr. Astrid Jankielsohn can be contacted
for more information. Guidelines for the control of insect pests are discussed below.
Aphids
Five aphid species are commonly found on wheat in the summer rainfall production areas in
South Africa. The Russian wheat aphid (Diuraphis noxia) is the most important with outbreaks
occurring annually, while the other aphids namely greenbug (Schizaphis graminum), bird-
cherry oat aphid (Rhopalosiphum padi), brown ear aphid also called English grain aphid
(Sitobion avenae) and the rose grain aphid (Metopolophium dirhodum) occur sporadically.
Generally Russian wheat aphid and greenbug occur in dryer, low potential circumstances
while bird-cherry oat aphid, brown ear aphid and rose grain aphid occur in wetter, high
potential environments.
Russian wheat aphid
Russian wheat aphid is a small (<2.0 mm), spindle
shaped, pale yellow-green to grey-green aphid with
extremely short antennae and a “double tail”(Figure
1a).
Until 2005, only one biotype of the aphid was
prevalent in the Free State Province, namely RWASA1,
however a more damaging Russian wheat aphid biotype was recorded during the 2005 season
and cultivars resistant to the original RWASA1 (listed in Table 1) were severely damaged by
this Russian Wheat aphid biotype, RWASA2. Another new biotype RWASA3 was recorded in
2009. Since 2009 RWASA2 and RWASA3 were present every year in wheat production areas in
South Africa, but predominantly in the Eastern Free State. In 2011 the distribution of the RWA
biotypes was similar to the previous years, but a new biotype, RWASA4 was recorded in the
Eastern Free State (Fig: 1 b).
Figure 1a: Russian wheat aphid

128
Table 1. Russian wheat aphid resistance or susceptibility of wheat
cultivars that are recommended for cultivation under dryland
conditions in the summer rainfall region.
Cultivar RWASA1 RWASA2 RWASA3 RWASA4
Elands (PBR) MR S S S
Gariep R S S S
Koonap (PBR) MR S S S
Matlabas (PBR) R S S S
Senqu (PBR) R S S R
PAN 3118 (PBR) S S S S
PAN 3120 (PBR) S S S S
PAN 3161 (PBR) R R R S
PAN 3195 (PBR) R S S S
PAN 3368 (PBR) MR MR R R
PAN 3379 (PBR) R R R R
SST 316 (PBR) MR S S S
SST 317 (PBR) MR S S S
SST 347 (PBR) R S S S
SST 356 (PBR) MR S S S
SST 374 (PBR) R S S S
SST 387 (PBR) R S S S
R= Resistant MR= Moderately resistant S= Susceptible
Resistance against RWASA1 and RWASA4 was tested in glasshouse only
Resistance against RWASA2 and RWASA3 was tested in both glasshouse and fi eld
Host plant resistance has been the best control option for Russian wheat aphid for the past 12
years and it is recomended to still plant cultivars with resistance to RWASA1. It is not possible
to visually distinguish between the biotypes, however damage symptoms can easily be
recognized. Young plants showing a susceptible reaction become stunted and the leaves roll
tightly closed. On more mature plants susceptible symptoms include longitudinal, white or
pale yellow stripes, which can turn purple when cold conditions prevail, tightly rolled leaves
and trapped heads. In contrast only small white or yellow splotches and spots occur on the
leaves of plants showing resistance and the leaves do not roll tightly closed as in the case
of susceptible plants. Producers should monitor fi elds regularly and be aware that it may be
necessary to apply insecticides if aphid populations increase.
Wheat is most prone to damage by Russian wheat aphid during the period between the
emergence of the fl ag leaf (GS 14*) and the ear (GS 18*). Chemical treatment at GS 12* will
ensure that the upper two leaves are protected from aphid infestation and this will reduce
yield loss. Spraying before GS 12* is recommended only in cases of severe infestation >
30%, which may occur on wheat planted during spring in the Eastern Free State or under
very dry conditions in the Western Free State. Re- infestation of this wheat may occur during
the susceptible period necessitating an additional spray, though some damage may have

129
already occurred with spraying after GS 12*. Infestation levels at various yield potentials, which
necessitate spraying, are presented in Table 2. Seed treatments and soil systemic insecticides
are available for control of aphid populations and control for up to 100 days after planting is
possible. (*Growth stages by Joubert pg 10)
BloemfonteinDe BrugPetrusburg
Koffiefontein
Jacobsdal
Jan KempdorpWesselsbron
No RWA - 13.9%
RWASA1 - 17.8%
RWASA2 - 14.9%
RWASA3 - 10.6%
RWASA4 - 12.9%
Welkom
Bultfontein
Theunissen
Free State Winburg
Tweespruit
Maseru
Lesotho
Thaba-Tseka
Mokhotlong
Fouriesburg
Aberfeldy
Warden
Tweeling
Frankfort
Reitz
Paul Roux
Ladybrand
Senekal
Florisbad, Soutpan
2013
Fig 1b: Distribution of Russian wheat aphid biotypes in the Summer rainfall area in South Africa during in 2012
Table 2. The minimum infestation levels that necessitate spraying
against Russian wheat aphid at various yield potentials
Yield potential(ton ha-1)
Minimum % aphid infestation per fi eld at GS 12 (Joubert growth stages)
2.0 – 2.5 7
1.5 – 2.0 10
1.0 -1.5 14
Determining the percentage aphid infestation in a fi eld
By determining the percentage infestation in a fi eld a farmer will be able to decide whether
aphids should be controlled by chemical means. If the percentage infestation in a fi eld is
equal or higher than the recommendation for that specifi c fi eld, the eventual yield will, due to
Russian wheat aphid damage, not reach the optimum yield potential. Steps for determining
the percentage infestation in a fi eld are as follows:

130
• Decide beforehand how many steps will be used
as the standard and which foot will be the marker
foot.
• Walk into the fi eld for a short distance and then
start to count off the number of steps that was
decided on. On the specifi c number of steps
the plant closest to the front of the marker foot
is inspected for aphids. Plants are then ticked as
either with “aphids present” or “aphids absent”.
• This procedure is now repeated throughout the fi eld ten times or more. The scouting
route must represent the whole fi eld as aphid infestations usually occur in patches.
• The largest number of repetitions as possible should be scouted as this will increase the
accuracy of the percentage infestation.
• Example: Three infested plants out of a total of six repetitions will result in an infestation
percentage of 50% (3 divided by 6 x 100).
Other aphids
The oat aphid, English grain aphid and rose-grain aphid
are sporadic pests in the summer rainfall area. These
aphids prefer thick plant densities with damp conditions
like in irrigated fi elds, but will also be present in wet years
in dryland fi elds.
The oat aphid has a dark green pear shaped body with
a red coloured area between the siphunculi on the rear
end of the aphid (Fig 1c). A green and brown form of
the English grain aphid (Fig 1d) can be found. Long black
siphunculi on the rear end is the most outstanding
characteristic of this aphid. The rose-grain aphid is pale
yellow-green in colour with a dark green longitudinal
stripe on the back (Fig 1e). The siphunculi of this aphid
are the same colour as the body.
These aphids are less harmful than Russian wheat
aphid and all three of them can occur simultaneously.
Population increase occurs after fl ag leaf stage. Oat
aphids prefer to feed on stems of plants, while the
English grain aphid, migrates into the head for feeding.
Chemical control can be applied between fl ag leaf
appearance (GS14) and full ear emergence (GS17) when
20 to 30% of tillers are infested with 5-10 aphids per tiller. Be sure that chemical control is
applied correctly when necessary, read the label and do the application accordingly. Be
careful to ensure application of the correct dosage, a wrong dosage could necessitate another
application which has fi nancial implications and increases the risk of resistance development
in aphids. Unnecessary applications should be reduced to a minimum, because they also kill
Figure 1c: Oat aphid
Figure 1d: English grain aphid
Figure 1e: Rose grain aphid

131
the natural enemies, which are important in the control of aphids. When the environment
around the fi elds progress in ecological balance, an increase in natural enemies occurs, which
will control the aphids and reduce the control costs.
Other insect pests
Except for aphids Brown wheat mite (Petrobia latens), false wireworm (Somaticus spp.,
Gonocephalum sp.), Bollworm (Helicoverpa armigera), black maize beetle (Heteronychus arator)
and leafhoppers are considered sporadic, secondary pests of small grains in the summer rainfall
region. False army worm and leaf miners are becoming sporadic pests of irrigated wheat.
Brown wheat mite
These mites are small, dark brown with a slightly oval body; the fi rst pair of forelegs being
notably longer than the others. Scouting should be conducted beatween 9 and 11 in the
morning, because they hide beneath soil clots during warm and windy periods of the day.
White dormant eggs are laid in the soil, which will hatch after light rain in July/August. After
hatching, dry conditions will promote population increases with aff ected plants showing
white speckeled leaves due to sap-feeding activity. Under severe infestations, leaves may turn
yellow or bronze resulting in yellow or brown patches appearing in the fi eld. Chemical control
can be considered under such conditions. On the other hand, brown wheat mite damage is
more pronounced when plants are under stress and these conditions are generally inhibitive
for the up-take and translocation of systemic insecticides. Producers should also take note that
rain showers of 12mm or more can eff ectively reduce mite populations, thereby negating the
need for chemical intervention.
False wireworm
The false wireworm belongs to the family Tenebrionidae and is the larval stage of dark-colored
beetles, about 5 to 10 mm long. The larva is the most damaging stage feeding on seed, roots
and seedling stems at or just below the soil surface. Adult beetles may damage emerging
seedlings. The larvae can grow to 20mm in length and are smooth, hard-bodied and golden-
brown to dark brown with pointed, upturned tails. Rotten plant material in the soil may serve
as a food source for the beetles and when present during planting time, farmers should use
seed treatments to prevent damage.
Bollworm
The adult moths are light brown to grey with a wingspan of about 20mm. The moths fl y at
dawn and dusk laying their eggs directly on the plant. Young larvae of early season generations
initially feed on the chlorophyll of leaves, later migrating into the ear to feed on the developing
kernels. Moths of later generations deposit their eggs directly on the ear. Final instar larvae can
vary from bright green to brown and have a characteristic lateral white stripe on either side.
The larva can reach up to 40mm in length and can cause considerable damage, especially
in terms of quality loss and subsequent downgrading of the consignment. The presence of
bollworm is generally noticed only once the larvae have reached the mid-instar stage inside
the awns. Producers should scout their fi elds in order to detect the younger larvae, as the
older, more mature larvae, are generally less susceptible to insecticides and obviously cause

132
more damage compared to small larvae. Under dryland conditions, chemical intervention
can be considered when 3-4 larvae per meter row are present. A slightly higher threshold
of 6-7 larvae per meter is applicable under irrigated conditions with higher seeding density.
However, producers should take care in applying the correct dose of registered insecticide
under weather conditions conducive to insect control.
Black maize beetle
The adult beetle is black, about 12-15mm in length and capable of extended fl ight. Females lay
about 7-10 eggs in the soil and the larvae develop through three instars followed by a pupal
stage. The beetles are the most damaging stage while their larvae survive mostly on organic
material in the soil. Adults chew at the base of the seedling stem resulting in reduced stand.
Given the migrating nature of the adult stage, seed treatments are registered as pre-plant
approach toward control of adult beetles.
Leafhoppers and maize streak virus
The leafhopper Cicadulina mbila is recognized as a pest on wheat, since they can transmit Maize
streak virus from infected maize and grasses. Leafhoppers can easily migrate from maize fi elds
to adjacent early seeded wheat fi elds. Young infected wheat plants have a stunted appearance
with curled leaves showing thin white longitudinal stripes. No chemicals are registered for the
control of leafhoppers on wheat. Infestation can be prevented by later planting dates in areas
away from maize fi elds.
Leafminer
A small black leaf miner fl y Agromyza ocularis (Fig 2a) infests the wheat and barley crop under
irrigation in the Northern Cape, North West and the Western Free State. The female drills holes
in leaves with her ovipositor and eggs are laid in some, while the rest of the holes are used for
feeding. Larvae hatch and feed inside the leaf while they burrow through it, leaving only the
two epithelial cell layers as a safe environment for survival. The mined part of a leaf is dead and
turns brown with time (Fig 2b) and can’t be revived by spraying insecticides. The fully grown
larvae escape from the leaf and pupate in the soil (Fig 2c). The adult fl ies hatch from the pupae
at a later stage. The amount of yield loss caused by this insect is still uncertain.
Figure 2a. Adult leaf miner fl y Figure 2b. Mined portion of the
wheat leafs which turned brown
Figure 2c. Leaf miner pupae

133
False armyworm
False armyworm Leucania loreyi is present as a sporadic pest
in wheat and barley fi elds of the Northern Cape, North West
and the Western Free State. During grain fi lling, high larval
numbers can consume most leaves of the wheat crop while
the beard of some ears may be damaged. Extensive damage
could occur on barley when heads are cut-off during feeding
by these larvae. Crop damage normally occurs in the last
days before the grain is harvested. Both larvae and moths are
active during night and not very visible during day. Larvae
pupate in the soil. This sporadic pest occurs also in irrigated
maize. No insecticide is registered against this pest on wheat
or barley.
Figure 2d. False armyworm larve

134
DISEASES OF SMALL GRAINS
Diseases of small grains aff ect small grain production by reducing yield and impairing quality.
To maximize profi ts, producers need to understand the infl uences that diseases have on crop
potential. The purpose of this section is to assist with the identifi cation of small grain diseases
most commonly found in the summer rainfall areas of small grain production. The information
contained here is intended to increase the producer’s knowledge of small grain diseases and
so indirectly assist with the control of the plant diseases that they may encounter.
A single fungal pathogen may attack a range of small grains, while other small grain pathogens
may be confi ned only to infecting a specifi c host. Additionally, cultivars may vary in their
susceptibility to diff erent diseases. In this section, the most important diseases of small grains
in the summer rainfall area are discussed. After the scientifi c name of a certain disease, the
hosts that are attacked by the specifi c disease are listed. Advice is given on means of control.
In the case of chemical control, the active ingredients registered in South Africa against the
disease are listed in Tables 5 to 7.
Leaf and Stem diseases
Rusts
The rusts are widespread and important diseases of small grains, but they also infect many
other wild and cultivated grasses. In South Africa, urediniospores play a major role in the
development of rust epidemics. In the non-crop season, rust pathogens are able to survive
on volunteer plants. The wind dispersed urediniospores formed on these plants are a source
of inoculum for the disease. In the following season, small grain crops are infected by the
urediniospores and fi rst symptoms are typical urediniospore pustules. Later in the season, as
another kind of dark coloured spore, known as teliospores, develop within lesions, the lesions
start to appear black in colour. In other countries, teliospores produce basidiospores that infect
an alternate host and play an important role in the sexual disease cycle but the alternate host
plants, that these spores infect, do not occur within the small grain production areas in South
Africa and thus teliospores are not of importance in our cultivation systems.
All the rust diseases can aff ect grain yield and quality, although the extent to which a cultivar
will be aff ected will depend on the level of susceptibility of that cultivar, environmental
conditions that favour the proliferation of the disease and the levels of inoculum present.
In general, stem rust is more devastating than leaf rust or stripe rust, but as mentioned, the
cultivar and area under production should also be considered. Devastating crop losses and
even total crop losses have been experienced as a result of rust diseases and it remains one
of the biggest challenges to the successful cultivation of small grains. Breeding and planting
cultivars that are resistant to rust is one of the most important ways of controlling the disease.
Several research groups in South Africa are dedicated to the development of rust resistant
cultivars. However, the process of breeding resistant lines takes time and usually it takes a
number of years before a new resistant cultivar becomes commercially available. Moreover,
rust diseases may overcome the host resistance, so the use of fungicides forms an important
part of the control of these diseases on susceptible cultivars. In South Africa, the application
of fungicides for the control of rust is widely practiced. Foliar fungicides are generally applied
twice in a season.

135
Stem rust
Puccinia graminis f. sp. tritici – wheat, barley, triticale
Puccinia graminis f. sp. avenae – oats
Puccinia graminis f. sp. secalis – rye
Stem rust (photos 1, 2 and 3), also known as black rust, is a widespread and economically
important disease of a number of cereal grains. Disease symptoms occur on leaf sheaths,
leaf blades, stems and spikes. The epidermis is ruptured by elongated oval shaped pustules
(uredia), which contain masses of red-brown coloured urediniospores. These pustules may
converge so that big parts of the stem appear red-brown in colour.
Leaf rust
Puccinia triticina – wheat, triticale
Puccinia hordei – barley
Leaf rust (photo 4), also known as brown rust, occurs commonly in areas where wheat and
barley are grown. Orange brown elliptical pustules are found scattered at random on the
leaves. The pustules may be surrounded by a yellow halo. Under high disease pressure,
pustules appear on the ears of the grain.
Stripe rust
Puccinia striiformis f. sp.tritici – wheat, barley
Puccinia striiformis f. sp.hordei – barley
Stripe rust (photos 5, 6 and 7), also known as yellow rust, occurs throughout the small grain
production areas of South Africa, but is found more frequently in the Free State. Typical stripe
rust symptoms consist of yellow to orange coloured pustules that develop in narrow stripes on
the leaf sheaths and on the inner surfaces of glumes and lemmas of the heads.
Crown rust
Puccinia coronata f. sp. avenae – oats
Crown rust is a widespread and damaging disease of oats. On susceptible cultivars, bright
orange to yellow coloured elongated oval pustules occur mainly on leaves but can also occur
on the sheaths and fl oral structures. The yield and quality of the oats is aff ected by this disease
as the groat mass can be reduced. Planting resistant cultivars is the most eff ective manner
of controlling crown rust although there are currently no resistant cultivars commercially
available. Several of the breeders’ lines in the SGI oats breeding program show resistance
against crown rust and may potentially be released in future. Spraying foliar fungicides can be
highly eff ective for controlling crown rust, but it is often, especially when the oats is produced
as animal feed, not economically justifi ed.

136
Mildew
Powdery mildew
Erysiphe [Blumeria] graminis f. sp. tritici - wheat
Erysiphe [Blumeria] graminis f. sp. hordei - barley
Erysiphe [Blumeria] graminis f. sp. avenae - oats
Erysiphe [Blumeria] graminis f. sp. secalis - rye
Powdery mildew (photos 8 and 9) is a very common disease of cereals worldwide. Symptoms
are most often seen on leaves and include fl uff y white mycelium that become grey as they
age. These pustules can be scraped off the surface or the leaf, as the infection on the leaf
surface is very superfi cial. Later in the season, black dots may be found embedded in the white
mycelium. These dots are the fruiting bodies of the fungus. The fungus survives non-crop
seasons as dormant mycelium on host debris or in volunteer crops. Later spores called conidia,
which are mainly produced on volunteer plants, serve as a source of inoculum. The disease is
more prevalent in densely planted fi elds that are over-fertilized. In the United Kingdom, up
to 25% loss in yield has been recorded; however yield losses in South Africa have not been
measured. Small grain producers should take note that powdery mildew can cause losses
if not controlled. The foliar application of fungicides is a reliable method of controlling the
disease and it is widely practiced.
Virus diseases
Maize streak
Maize streak virus (MSV) - wheat, barley, oats
The Maize Streak Virus (MSV) causes a disease in maize, but a certain strain of the disease
also infects sugarcane, millet, oats, barley, wheat and some wild grasses. The causal organism
belongs to the Gemini virus group. In wheat, infection by this virus causes wheat streak or
wheat stunt. Symptoms include fi ne, linear, chlorotic leaf streaks, shortened tillers, leaves
and spikes and excessive tillering. Plants may also have leaves with bent and curled tips.
Symptoms of the disease can easily be confused with streaks caused by the Russian wheat
aphid. The disease is transmitted by leafhoppers from infected maize to healthy wheat.
Warmer temperatures support higher populations of the leafhoppers, which can translate into
higher infection rates. Maize streak is known to occur in the wheat production areas of the
Limpopo Province, KwaZulu-Natal and the Vaalharts-region. The disease can be avoided by
planting in areas where aff ected maize and grasses have been removed. However, planting
resistant cultivars remains the best option for controlling the disease. Yet, no such cultivars are
currently commercially available in South Africa. As the leafhoppers are vectors of the disease,
controlling the leafhopper populations will also assist in reducing infection levels.

137
Ear and grain diseases
Fusarium head blight (Gert van Coller, Dept. of Agriculture, Elsenburg) Fusarium
graminearum (previously known as F. graminearum Group 2)
- wheat, barley, triticale, oats
Fusarium head blight is one of the most important diseases of wheat, barley and triticale
in most grain producing regions of the country. It is especially important in regions where
small grains are produced under irrigation. Infection of fl orets takes place as result of spore
release and high humidity during fl owering. The disease is characterised by the discolouration
of infected fl orets about 2-3 weeks after fl owering. The fl orets become light-coloured and
appear blighted. Under high disease pressure the whole wheat head may become infected.
The symptoms become less visible as the heads ripen. Infected kernels become shrivelled
and contain much less starch and proteins than uninfected kernels. Fusarium head blight can
be distinguished from take-all (which also occurs under irrigation) where the entire tiller and
head dies and whitens, as opposed to Fusarium head blight where the tiller still remains green
and bands of blighted fl orets form on the wheat heads. The fungus survives primarily on crop
residues; therefore retention of stubble is needed for the fungus to survive. It is important to
note that the fungus can also infect maize, and production systems where barley and wheat
are produced in rotation with maize can lead to higher disease pressure in subsequent years.
Chemical applications with fungicides can help to manage the disease; however, there are
currently no fungicides registered against Fusarium head blight in South Africa. Research to
evaluate diff erent fungicides as well as methods of application is underway. Resistant cultivars
are currently not available in South Africa.
Bunts and smuts
Smuts and bunts infect small grain cereals and several species of grass. These fungi produce
masses of black spores that partially or completely replace the heads, spikelets and kernels.
In South Africa, these diseases are controlled by the routine application of seed treatments
by seed distributing companies. Farmers who retain seed to plant must use seed dressings
against bunts and smuts. Failure to treat seed, in order to save on input costs, leads to the
increased incidence of these diseases.
Loose smut
Ustilago tritici - wheat
Ustilago nuda - barley
Ustilago avenae - oats
Loose smut (photos 10 and 11) is a common small grain disease that occurs widely in areas
where wheat, oats and barley are grown. Symptoms are not apparent until ear emergence.
Infected ears emerge earlier, have a darker colour and are slightly longer than those of healthy
plants. Infected spikelets are transformed into powdery masses of dark brown teliospores.
Within a few days, the spores are blown away and only the rachis remains. When a spore
lands on a fl ower of a small grain plant in the surrounding area, it germinates and infects the
138
reproductive tissue of the grain so that the embryos of developing seeds are also infected. The
fungus then survives as dormant hyphae in infected seed. After seed germination, the fungus
forms a systemic infection in the plant and later, as the plant approaches heading, the fungus
penetrates the head tissues and converts it to a brown powdery mass of teliospores. Yield
losses are roughly equal to the percentage of infected ears. In contrast to stinking smut (Tilletia
spp.), the quality of the harvested grain is not aff ected. This disease is eff ectively managed by
the application of seed treatments (Table 7), although some seed treatments may impede seed
germination. The use of high quality, disease free seed is also an eff ective way of controlling
the disease, as the only source of inoculum is infected seed.
Covered smut
Ustilago hordei - barley, oats, rye
Covered smut is a common disease of mainly oats and barley, but it also infects rye and other
wild grasses. Symptoms are not obvious until after ear emergence. Smutted heads emerge
later than healthy heads and may become trapped in the fl ag leaf sheath and fail to emerge.
With severe infections plants become dwarfed. Parts of the infected ear or the whole ear are
transformed into powdery masses of dark brown teliospores, which are covered by a persistent
membrane from where they are released at harvest, when this membrane is disrupted. The
covered smut fungus survives in soil and on the surface of seed. The fungus infects the
germinating seed through the coleoptile. After seed germination, the fungus forms a systemic
infection in the plant and later, as the plant approaches heading, the fungus penetrates the
head tissue and converts it to the brown powdery masses of teliospores. The dark powder from
the teliospores discolours grain and aff ects grain quality and marketability. Covered smut is of
economical importance in areas where seed treatments are not routinely used. Several seed
treatments are registered for the control of covered smut in South Africa (Table 7).
Karnal Bunt
Tilletia indica - wheat, triticale
Historically, Karnal bunt did not occur in South Africa, it was identifi ed for the fi rst time in
December 2000 from the Douglas irrigation area. Currently, several measures are in place to
limit the spread of this disease throughout the country. These measures include testing of
registered seed units and commercial grains for the presence of teliospores and quarantine
regulations on the transport and entry of grains to mills and other delivery points. Since Karnal
bunt is regarded as a quarantine disease according to South African regulations, all occurrences
of this disease should be reported to the National Department of Agriculture (NDA). It is also
important to implement phytosanitary measures in quarantine areas to prevent movement of
the pathogen out of the infested area.
Karnal bunt infected kernels appear blackened, eroded and emit a foul ‘fi shy’ odour. In infected
spikes, the glumes may also appear fl ared and expose bunted kernels. Spikes of infected plants
are generally reduced in length and in number of spikelets. However, only a few fl orets per
spike might be aff ected and it may be difficult to identify the disease in the fi eld, as the whole
ear does not necessarily become infested. Microscopic examination of the seed to detect the
presence of the teliospores is a more reliable method of identifi cation.

139
The primary inoculum source is soil or seed contaminated with teliospores. These teliospores
germinate and generate another kind of spore, known as basidiospores. One teliospore can
produce up to 200 basidiospores that germinate and infect the head tissue of the plant. The
infection is localised and not systemic as with loose smut and covered smut. Individual fungal
cells within the kernel are converted to teliospores and parts of, or the whole of the diseased
kernel is completely displaced by masses of teliospores as the kernel matures. Karnal bunt is of
economical importance mainly due to the reduction in fl our quality of grain infected with the
disease. The fl our will have a disagreeable odour and depending on the percentage infection,
be darkened by the teliospores. This disease does not lead to yield losses as such. Karnal bunt is
difficult to control. A fi rst measure of protecting plants is preventing the entry of the pathogen
to a certain area. Therefore, it is of utmost importance to adhere to quarantine regulations
and to plant seed that has been certifi ed to be disease free. Some fungicides applied at ear
emergence may reduce the incidence of the disease but it is unlikely that they will prevent
infection.
Stem base and root diseases
Fusarium crown rot (Dr Sandra Lamprecht, ARC Plant Protection Research Institute)
Fusarium pseudograminearum (previously known as F. graminearum Group 1)
– wheat, barley, triticale
Fusarium crown rot is one of the most important soilborne diseases of wheat, barley and
triticale in the Western Cape, but it is also present in other small grain producing areas in the
country. The disease is especially important in areas where wheat is cultivated under dryland
conditions. Oats are susceptible, but is a symptomless host. The disease is characterized by the
honey-brown discolouration of the lower parts of the tillers and necrosis of the crown tissue
and subcrown internodes. A pink discolouration can sometimes be observed under the lower
leaf sheaths. The most characteristic symptom is, however, the formation of white heads, but
this depends on water stress during grain fi ll. The disease can be confused with take-all which
also causes white heads. The fungus requires moisture for infection, but subsequent disease
development is favoured by moisture stress. The fungus survives primarily on crop residues
between host crops and the retention of stubble therefore favours its survival, especially where
small grain crops are grown in monoculture. The disease is therefore favoured by conservation
tillage which is increasingly adopted by small grain farmers. Fusarium crown rot can be
reduced with an integrated disease management strategy which include practices such as
crop rotation with non-host crops (broadleaf crops such as canola, lupin, medic, lucerne
etc.), control of grass weeds (most grass weeds are hosts), alleviation of zinc defi ciency and
reduction of moisture stress by practices that conserve soil moisture such as conservation
tillage. Research conducted in the Western Cape showed that rotation systems where wheat
was planted after three years of broadleaf crops had the lowest incidence of this disease.
Resistant cultivars are not available, but tolerant cultivars with partial resistance have been
identifi ed in other countries such as Australia. South African wheat and barley cultivars will be
evaluated for resistance/tolerance in the near future.

140
Take-all
Gaeumannomyces graminis var. graminis – wheat, barley, rye, triticale
Gaeumannomyces graminis var. tritici – wheat, barley, rye
Gaeumannomyces graminis var. avenae – oats
Take-all (photo 12) occurs widely throughout the small grain producing areas in South Africa.
This disease aff ects the roots, crowns and basal stems of small grains, wheat in particular,
and wild grasses. It is an important disease in areas where wheat is cultured intensively, the
soil pH is neutral or alkaline, moisture is abundant and soils are defi cient in manganese and/
or nitrogen. Mildly infected plants appear to have no symptoms of the disease, while more
severely infected plants ripen prematurely and are stunted. Take-all symptoms are more
apparent during heading, as infected plants are uneven in height, die prematurely and whole
plants discolour to the colour of ripe plants. A typical take-all infestation is characterised by
the appearance of patches of white heads amongst areas with healthy green plants before
ripening. The heads that ripen prematurely tend to be sterile or contain shriveled grain.
Diseased plants pull up easily. Roots appear blackened and brittle and lower stems may take
on a black colour, which is indicative of the disease. The pathogen persists in infected host
residues from where the ascospores can act as sources of inoculum. Roots growing near
infected residues become infected and early infections may progress to the crown. The disease
is favoured by poorly drained soils, high seedling densities and high organic matter content
in the soil. As the pathogen is favoured by wet conditions, the disease is more prominent in
wet years or in irrigated fi elds. If conditions become dry, the pathogen becomes less active.
The best way to control take-all is by crop rotation. A one-year break from barley or wheat can
be sufficient to control the disease. Volunteer plants, grassy weeds and crop residues, that may
harbour the pathogen, should be destroyed. Take-all can also be controlled to a certain extent
by ensuring that the wheat plants have sufficient nutrients to promote healthy root growth.
A newly registered seed treatment Galmano Plus® can be applied to support root health and
help control take-all.

141
Symptoms of small grain diseases (photos by Dr Ida Paul)
1. Uredinia of stem
rust on a wheat
ear
2. Uredinia of stem
rust on a oat
stem
3. Uredinlospores
and teliospores
of stem rust on a
wheat stem
4. Uredinia of leaf
rust on wheat
leaves
5. Uredinia of
stripe rusts on a
wheat leaf
6. Uredinia of
stripe rust on
wheat spikelets
7. Stripe rust
infection
in the fi eld
causes a yellow
discolouration of
the ears
8. Cottony white
growth of
powdery mildew
on a barley leaf
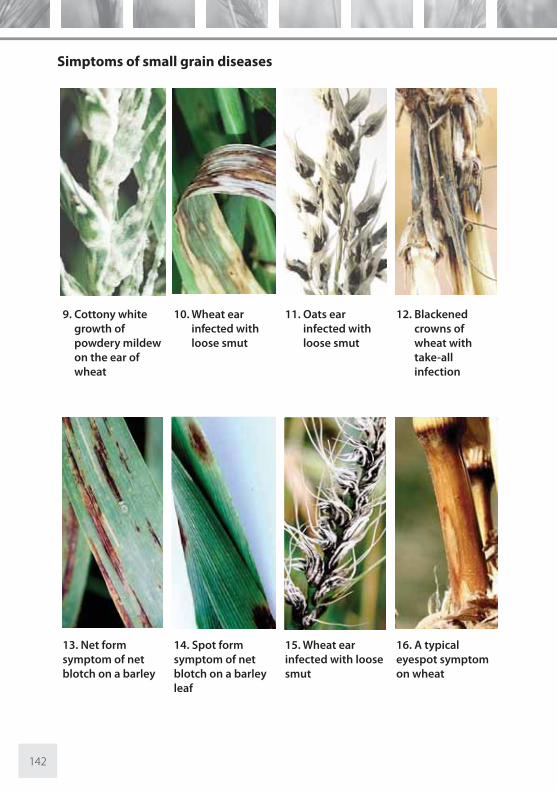
142
Simptoms of small grain diseases
9. Cottony white
growth of
powdery mildew
on the ear of
wheat
10. Wheat ear
infected with
loose smut
11. Oats ear
infected with
loose smut
12. Blackened
crowns of
wheat with
take-all
infection
13. Net form
symptom of net
blotch on a barley
14. Spot form
symptom of net
blotch on a barley
leaf
15. Wheat ear
infected with loose
smut
16. A typical
eyespot symptom
on wheat

143
Control of Fungal Diseases
Genetic control of fungal diseases
Breeding for resistance is an economically important and environmentally friendly way of
controlling fungal diseases of small grains. The objective of breeding programmes being the
incorporation of resistance genes into well adapted cultivars. The susceptibility or resistance of
some wheat cultivars to certain diseases are indicated in Tables 1 and 3. The risk of occurrence
of certain diseases occurring in a given area are indicated in Tables 2 and 4. However, no one
cultivar can be resistant to all the fungal diseases that might attack it. Therefore, fungicide
application remains of importance in the sustainable production of small grains in South Africa.
Table 1. Disease resistance or susceptibility of wheat cultivars that
are recommended for cultivation under dryland conditions in the
summer rainfall region.
Cultivar Stem rust Leaf rust Stripe rust
Elands (PBR) MR MSS MS
Gariep R S S
Koonap (PBR) R R R
Matlabas (PBR) S MR S
Senqu (PBR) R R R
PAN 3118 (PBR) R MS S
PAN 3120 (PBR) R MS MS
PAN 3161 (PBR) R MS R
PAN 3195 (PBR) R R R
PAN 3368 (PBR) R MS MR
PAN 3379 (PBR) MS MS MS
SST 316 (PBR) ? S R
SST 317 (PBR) ? S R
SST 347 (PBR) MRMS MS MS
SST 356 (PBR) MRMS R R
SST 374 (PBR) MS S MRMS
SST 387 (PBR) R S R
S = Susceptible MS = Moderately susceptible R = Resistant
MR = Moderately resistant ? = unknown
PBR Cultivars protected by Plant Breeders’ Rights
Variation in rust races may aff ect cultivars diff erently. Reactions given here are based on existing data for the most virulent rust
races occurring in South Africa. Distribution of races may vary between production regions.

144
Table 2. The risk of occurrence of rust diseases under dryland
conditions of the summer rainfall regions
Production Region Stem rust Leaf rust Stripe rust
Western Free State Central Free State Eastern Free State Mpumalanga GautengLimpopoNorthern Cape
L R L R L R L R L R L R LR
LR LR LR LR LR LR LR
LR LR HR LR LR LR LR
LR = low risk HR = high risk
Table 3. Disease resistance or susceptibility of wheat cultivars
recommended for cultivation under irrigation.
Cultivar Stem Rust Leaf Rust Stripe Rust Head blightBaviaans (PBR) S MS R MS
Buff els (PBR) S R/S R ?
Duzi (PBR) S S R MS
Kariega S MS R MS
Krokodil (PBR) MS S S S
Olifants (PBR) S S R MS
PAN 3400 (PBR) MSS S R ?
PAN 3471 (PBR) S MRMS R S
PAN 3478 (PBR) S MSS R MS
PAN 3497 (PBR) MSS S R ?
Sabie (PBR) S MS R ?
SST 806 (PBR) S MS R HS
SST 822 (PBR) MS MS R S
SST 835 (PBR) MS MS MR HS
SST 843 (PBR) MS MS R S
SST 866 (PBR) S MS R/MS ?
SST 867 (PBR) S MS MR ?
SST 875 (PBR) S MR R ?
SST 876 (PBR) S MS MR HS
SST 877 (PBR) S MS R/MS ?
SST 884 (PBR) MR S R ?
SST 895 (PBR) MRMS R R ?
Steenbras (PBR) R MR S S
S=Susceptible MS= Moderately susceptible HS=Highly susceptible APR=Adult plant resistance
R=Resistant MR=Moderately resistant ?=Unknown / = mixed for rust reaction
PBR Cultivars protected by Plant Breeders’ Rights
* SST 866: Subject to variety listing
Variation in rust races may aff ect cultivars diff erently. Reactions given here are based on existing data for the most virulent rust
races occurring in South Africa. Distribution of races may vary between production regions.

145
Table 4. The risk of wheat diseases in cultivation areas under irrigation
in the summer rainfall region
Production RegionStem
rust
Leaf
rust
Stripe
rust
Head
blight
Cooler central area a
Warmer northern area b
KwaZulu-Natal
Fish River
LR
LR
LR
HR
LR
HR
HR
HR
HR
LR
HR
HR
HR
HR
HR
HR
LR = low risk HR = high risk
a: Irrigation areas include areas around Vaalharts, Sandvet, the Riet River and the Orange River
b: Irrigation areas include areas in the Magaliesburg area, in Mpumalanga and Limpopo provinces and in the Lowveld
Chemical control of fungal diseases
Fungicides are routinely used for control of foliar ear, grain and stem diseases. In South Africa
various active ingredients are registered for the control of fungal diseases on small grains
(Tables 5 and 6). Several active ingredients are registered for the control of seed and/or soil
borne diseases (Table 7).
In order to be successful with the use of fungicides for disease control, the following aspects
must be taken into account:
• In order to choose the appropriate fungicide the disease and causal organism of the
disease should be identifi ed correctly.
• The efficacy of fungicides diff ers and a fungicide registered against the observed disease
should be chosen.
• The susceptibility of the particular cultivar to the disease should be considered.
• In most cases resistant cultivars will not need fungicide protection, unless new races of
the pathogen develop.
• Timing of application is critical. One application at the correct timing can give more
protection to the plants than three badly timed spray applications.
• Protection of the fl ag leaf is important, as this leaf greatly contributes to the productivity
of the plant.
• Some fungicides require intervals before harvest or consumption of produce and should
also be considered.
• Use the correct amount of water so as to ensure adequate coverage.
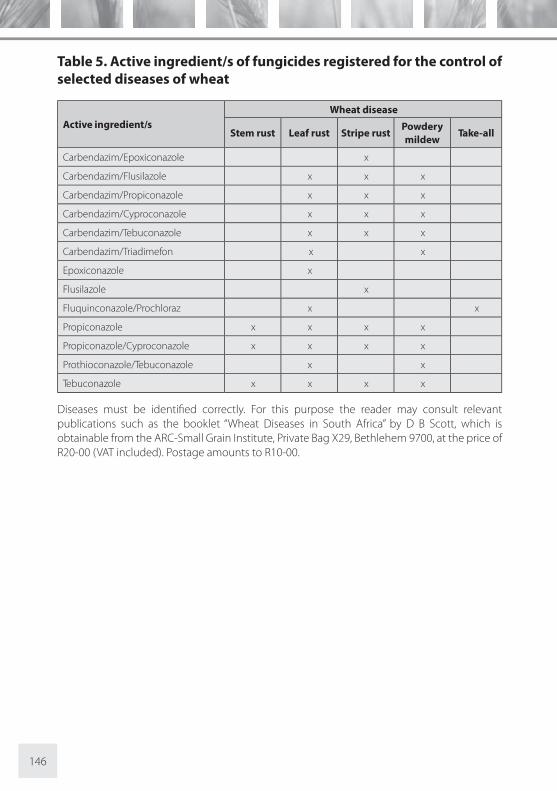
146
Table 5. Active ingredient/s of fungicides registered for the control of
selected diseases of wheat
Active ingredient/s
Wheat disease
Stem rust Leaf rust Stripe rustPowdery
mildewTake-all
Carbendazim/Epoxiconazole x
Carbendazim/Flusilazole x x x
Carbendazim/Propiconazole x x x
Carbendazim/Cyproconazole x x x
Carbendazim/Tebuconazole x x x
Carbendazim/Triadimefon x x
Epoxiconazole x
Flusilazole x
Fluquinconazole/Prochloraz x x
Propiconazole x x x x
Propiconazole/Cyproconazole x x x x
Prothioconazole/Tebuconazole x x
Tebuconazole x x x x
Diseases must be identifi ed correctly. For this purpose the reader may consult relevant
publications such as the booklet “Wheat Diseases in South Africa” by D B Scott, which is
obtainable from the ARC-Small Grain Institute, Private Bag X29, Bethlehem 9700, at the price of
R20-00 (VAT included). Postage amounts to R10-00.

147
Table 6. Active ingredient/s of available fungicides registered for the
control of selected diseases of barley*
Active ingredient/sBarley disease
Leaf rust Powdery mildew
Carbendazim/Flusilazole x x
Carbendazim/Propiconazole x x
Carbendazim/Tebuconazole x x
Carbendazim/Triadimefon x x
Cyproconazole/Propiconazole x x
Flusilazole x x
Picoxystrobin + Carbendazim/
Flusilazole (tank mixture)x x
Propiconazole x x
Prothioconazole/Tebuconazole x x
Tebuconazole x x
*The booklet can be obtained from http://www.croplife.co.za/docs/Fungicides.pdf and the webpage of the National Department
of Agriculture http://www.nda.agric.za/act36/AR/AR%20Lists.htm. Please note that although some formulations of fungicide
are registered against a wide range of diseases, some formulations may only be eff ective for the control of one disease. Always be
sure to consult the label for exact specifi cations.
Table 7. Active ingredient/s of fungicides registered for the control of
selected seed borne diseases of small grains*
Active
ingredient/s
Seed borne disease
Loose
smut wheat
Loose smut
barley
Loose smut
oats
Covered
smut barley
Covered
smut oats
Benomyl x
Carboxin/Thiram x x x
Difenoconazole x
Mancozeb x x
Prothioconazole x x x
Tebuconazole x x x
thiram x x x
Triticonazole x x x
*The booklet can be obtained from http://www.croplife.co.za/docs/Fungicides.pdf and the webpage of the National Department
of Agriculture http://www.nda.agric.za/act36/AR/AR%20Lists.htm. Please note that although some formulations of fungicide
are registered against a wide range of diseases, some formulations may only be eff ective for the control of one disease. Always be
sure to consult the label for exact specifi cations.

148
GUIDELINES FOR THE PRODUCTION OF MALTING BARLEY UNDER
IRRIGATION 2014
G J Kotzé
SAB Maltings (Pty) Ltd, P O Box 402 / Kimberley / 8300
Tel: 0861722525 / Cell: 082 921 7966
The eff ect of diff erent production factors, of which cultivar choice, planting date, planting
density, nitrogen fertilisation and irrigation are the most important, are refl ected in the yield
and the malt quality of the crop. The research programmes running in the irrigation areas
since 1991 were therefore aimed at identifying the most suitable cultivar with the optimum
planting date, planting density and a nitrogen fertilisation application level that will ensure an
economical optimum yield and grain conforming to quality specifi cations.
From the results obtained from the research programme as well as experience from some
commercial plantings in this area in the past, the following recommendations can serve as
guidelines for the production of malting barley.
Plant Breeders’ rights (Act 15 of 1976)
The act renders legal protection to the breeders and owners of cultivars. The awarding of rights
stipulates that cultivars must be new, distinguishable, uniform and stable, and protection is
granted for a 20 year period. The rights of the owner/ breeder entail that no party may multiply
propagating material (seed), process it for planting, sell it, import it, export it or keep it in stock
without the necessary authorization or licence of the holders of the rights. The act makes
provision for the court to grant compensation of R10 000.00 to the holder of Plant Breeder’s
Rights in cases of breaching of rights.
Seed certifi cation and Table 8, as described in the Plant Improvement
Act
The main aim of certifi cation of seed is to maintain cultivars. Seed laws and regulations
prescribe the minimum physical requirements, while certifi cation of seed strives to achieve
high standards of genetic purity and other quality requirements. Seed certifi cation is a voluntary
action that is administered by SANSOR on behalf of the Minister of Agriculture. However, if a
cultivar is listed in Table 8, it is subject to compulsory certifi cation. Hereby cultivator purity as
well as good seed quality is guaranteed, and renders protection and peace of mind to the
buyer (farmer), as well as an improved control system for acting on complaints and claims. The
costs involved are surely a minimal price to pay forthis peace of mind to both the buyer and
seller of certifi ed seed.
Soil Preparation
Soil preparation for the production of barley is the same as for wheat. It must, however, be
emphasised that a weed free, fi ne and very even seedbed is prepared. An uneven seedbed
causes uneven development of the crop and in the end also uneven ripening and quality.

149
Cultivars
The barley cultivars, Cocktail, Puma, Marthe and Cristalia are at this point in time the only
recommended cultivars for commercial production of malting barley under irrigation. The
ratio of production between these four cultivars is revised on an annual basis.
The malting characteristics of these cultivars diff er and for this reason the mixing of these
cultivars must be prohibited at all costs. It is thus imperative that the diff erent cultivars are
transported, handled and stored separately.
Seed of all four commercial cultivars will be available at the local co-operative and only at
the depots as communicated prior to the planting season. These cultivars are only allowed
to be delivered at the depots as stipulated in the contract or as communicated beforehand.
The seed will be treated with a fungicide as well as an insecticide. This is for the prevention of
powdery mildew during the development stages (approximately 10 weeks) of the seedlings
and also to prevent covered smut and loose smut, while the insecticide will protect the seed
against insect damage for a limited period before it is planted.
Agronomic characteristics
Cultivar choice is economically a very important decision to the producer as it is one of
the easiest ways to achieve higher and more stable income with the least risk. Factors that
determine cultivar choice are thus fundamental to this decision. Only the most important
factors are discussed briefl y and for this reason Table 1, which characterises cultivars in terms
of agronomic and quality characteristics, is included.
Growth period
Growth period refers to the average number of days that it takes from emergence to
physiological maturity. For this reason cultivars must be planted that are adapted to the
climatic conditions, such as growing season, rainfall pattern and temperature of the area.
Straw strength
Straw strength is the ability of a cultivar to remain standing (no lodging) under extreme
conditions and is largely determined by straw length and thickness. The lodging of barley
often results in considerable yield and grain quality losses, which can largely be attributed to
the resulting decrease in kernel plumpness. It is largely a problem where critical yield potential
conditions have been exceeded, but bad irrigation practices with a strong wind and excessive
nitrogen fertilisation and/or seeding density can also play a role.
Peduncle strength
This characteristic refers to the strength of the straw between the fl ag leaf and the head/ear,
and thus to the susceptibility of the cultivar to wind damage (Table 1). The greatest risk of the
latter is just prior to harvesting.

150
Kernel plumpness
The percentage plump kernels largely determine the grade of the grain. This characteristic is
strongly cultivar related (Table 1). Under conditions where soil water defi cits and heat stress
occur during the grain fi lling period and where lodging occurs, considerable losses could
occur with the downgrading of the crop due to a low kernel plumpness percentage.
Table 1. Agronomic and quality characteristics of barley cultivars
CultivarsGrowth
period
Straw
length
Straw
strength
Peduncle
strength
Kernel
Plumpness (%)
Puma
Cocktail
Marthe
Cristalia
ME
M
ME
ME
MS
MS
M
M
G
G
M
G
M
M
M
M
M
ML
G
G
Growth period: ME = Medium Early; M = Medium
Straw length: MS = Medium Short; M = Medium
Straw strength: G = Good; M = Medium
Peduncle strength: M = Medium
Kernel Plumpness (%) M = Medium; ML = Medium Low
Planting Practices
The planting equipment used for the planting of wheat is also suitable for the planting of
barley. It is very important that barley is not planted too deep, because this can be detrimental
to emergence of the seedlings and also tillering.
The optimum planting dates for the diff erent irrigation areas are as follows:
RegionJune July
1 2 3 4 1 2 3 4
Vaalharts / Taung
Riet River
Douglas
Luckhoff /Hopetown
Barkly-West
These are only optimum planting dates and do not mean that in certain micro-climates in the
mentioned areas, a later or an earlier planting date will not be successful.

151
The planting density can vary from 60 kg/ha to 100 kg/ha depending on the status of the
seedbed, the planting date, irrigation method and the planter used. The average recommended
planting density is 80 kg/ha if the seed have 100% germination capacity and a thousand kernel
mass of approximately 40 grams. There must be aimed at establishing 130 to 140 plants/m² at
harvesting. Due to this reason 60 to 80 kg seed per hectare ought to be suffi cient under centre
pivot conditions where seedbed preparation is optimum, it is important to note that seedbed
preparation plays a vital role where lower planting densities is used. It is essential not to use a
too high planting density for Marthe, as this will enhance the possibility of lodging. It can be
considered to increase the planting density of Cristalia in order to insure the optimum plant
population (80 – 100 kg/ha). It is important to note that seedbed preparation plays a critical role
where lower planting densities is used. Under fl ood irrigation conditions the planting density
should be adjusted upwards. The producer must be aware of the fact that the thousand kernel
mass and the germination capacity of the seed can vary from year to year and that he must
adjust his seeding density accordingly.
The following table indicates the planting density in kg/ha at the diff erent 1000 kernel masses
of the seed in order to realise the desired number of plants/m² at harvesting, with an expected
survival of 80%.
Planting density in Kg/ha 80 % Germination
1000
Kernel
Mass (g)
of Seed
Target number of plants/m2 at harvesting
100 110 120 130 140 150 160 170 180 190 200 210 220 230 240 250
35 44 48 53 57 61 66 70 74 79 83 88 92 96 101 105 109
36 45 50 54 59 63 68 72 77 81 86 90 95 99 104 108 113
37 46 51 56 60 65 69 74 79 83 88 93 97 102 106 111 116
38 48 52 57 62 67 71 76 81 86 90 95 100 105 109 114 119
39 49 54 59 63 68 73 78 83 88 93 98 102 107 112 117 122
40 50 55 60 65 70 75 80 85 90 95 100 105 110 115 120 125
41 51 56 62 67 72 77 82 87 92 97 103 108 113 118 123 128
42 53 58 63 68 74 79 84 89 95 100 105 110 116 121 126 131
43 54 59 65 70 75 81 86 91 97 102 108 113 118 124 129 134
44 55 61 66 72 77 83 88 94 99 105 110 116 121 127 132 138
45 56 62 68 73 79 84 90 96 101 107 113 118 124 129 135 141
46 58 63 69 75 81 86 92 98 104 109 115 121 127 132 138 144
47 59 65 71 76 82 88 94 100 106 112 118 123 129 135 141 147
The data of the previous four seasons are shown in the following three tables.

152
Table 2. Average yield (ton/ha) of barley cultivars in the irrigation
regions for the period 2009-2013
Cultivar 2009 2010 2011 2012 2013 Average
Puma
Cocktail
Marthe
Cristalia
6.70
6.99
7.02
7.21
6.52
7.61
6.61
6.98
9.56
10.57
9.76
9.69
8.38
9.24
8.54
8.65
8.15
8.78
7.96
8.19
7.86
8.64
7.98
8.14
Average 6.98 6.93 9.90 8.70 8.27 8.16
Table 3. Average kernel plumpness (%) of barley cultivars in the
irrigation regions for the period 2009-2013
Cultivar 2009 2010 2011 2012 2013 Average
Puma
Cocktail
Marthe
Cristalia
93.1
86.4
92.5
89.4
90.2
83.8
92.9
91.5
98.7
97.4
98.4
97.3
95.3
94.5
96.5
95.4
96.2
95.7
96.1
97.1
94.7
91.6
95.3
94.1
Average 90.4 89.6 98.0 95.4 96.3 93.9
Table 4. Average kernel nitrogen (%) of barley cultivars in the
irrigation regions for the period 2009-2013
Cultivar 2009 2010 2011 2012 2013 Average
Puma
Cocktail
Marthe
Cristalia
1.86
1.75
1.82
1.79
1.95
1.78
1.88
1.79
1.92
1.83
1.91
1.90
1.86
1.71
1.88
1.78
1.76
1.64
1.65
1.70
1.87
1.74
1.83
1.79
Average 1.81 1.85 1.89 1.81 1.69 1.81

153
FERTILISATION
Soil acidity requirements
The management of an eff ective fertilisation programme entails soil analyses just prior to the
season. As is the case with all crops, a fertilisation programme can only be successful if the
crop’s minimum acidity requirements are met. For barley this has been established at a pH of
5.5 (KCI medium) and the target for lime application to the soil should therefore be to create
a pH of 5.5 to 6.0. The pH of the soil can rather be higher than 6.0 than lower than 5.5. Yield
losses could be severe at lower pH values, but could also occur if the pH is injudiciously raised
by more than one pH unit. Unnecessary increases in pH could lead to zinc and manganese
defi ciencies, something to which barley is very sensitive.
Phosphorus
It is generally accepted that the phosphorus requirement of barley is higher than that of
wheat, and that soil analyses are essential for estimating the fertilisation requirement. The
objective should be to reach 30 mg/kg citric acid soluble phosphorus, or 20 mg/kg Bray 1
soluble phosphorus in the soil. To achieve this, 4 kg P/ha can be applied for each 1 mg/kg
which the analyses is below 30 mg/kg (citric acid), or 6 kg P/ha for each 1 mg/kg which the
analysis is below 20 mg/kg (Bray 1). For analyses higher than the above, 12 to 15 kg P/ha is
applied, which is adequate to maintain soil fertility.
Potassium
Potassium defi ciencies are possible in the lighter textured soils in the irrigation areas and
where defi ciencies do occur, the following guidelines apply:
Table 5. Potassium fertilisation according to soil analysis
Citric acid soluble or ammonium acetate
soluble Potassium (mg/kg)Potassium fertiliser (kg K/ha)
20 - 30
30 - 50
50 - 70
Bo 70
40 - 30
30 - 15
15 - 0
0
In soil analyses below 50 mg/kg an extra, 15 kg k/ha can be applied for each ton of hay baled
or removed. Experience had shown that a split application of potassium (with planting and at
8 weeks after planting) can decrease the risk of lodging.
Nitrogen
Nitrogen fertilisation can be applied at diff erent growth stages during the development of the
barley plant. Under dry land conditions, rainfall is regarded as the most important factor for
determining the nitrogen requirements of barley. Under irrigation this is, however, not such a

154
decisive factor and the production system and soil type play a more important role. The fi rst
nitrogen is applied just prior to or during the planting process. Top dressing of nitrogen is,
according to trial results, benefi cial to higher yields and more so for overhead irrigation than
fl ood irrigation. Split applications of nitrogen fertiliser are also more benefi cial on lighter sandy
soils than on heavier clay soils.
With the increase in yield over the last couple of years, mainly due to genetic improvement,
improved production practices and optimum irrigation scheduling, it appears that a total
nitrogen application of 140 kg/ha, depending on the soil texture and rotation system seems
to be suffi cient for optimum yield and quality. It must further be taken into account that the
Cocktail, has a genetically higher yield potential and lower kernel nitrogen content than the
other cultivars. Due to this Cocktail must be fertilised with approximately 20 to 30 kg N/ha
more in order to obtain its genetic potential to achieve the same kernel nitrogen levels than
the other cultivars.
On a cotton rotation system, and where a lot of maize harvest rests are present just prior to
planting, the nitrogen application rate can be higher (approximately 20 - 30 kg N/ha more,
depending on the soil texture) and must be applied as a split application to overcome the
nitrogen negative period. On very sandy soils, where leaching of nitrogen is a major problem,
an additional
20 kg N/ha is recommended. Although it is not recommended to plant barley directly
after Lucerne, this practice is widely used. It is important to note that under this condition,
N fertilisation needs to be decreased to 100 – 120 kg/ha and preferably all applied with
planting. Split application of nitrogen fertilisation is more important under overhead irrigation
(specifi cally centre pivot) and sandy soils than under fl ood irrigation and heavy clay soils. A
split of two thirds of the total nitrogen with planting and the rest 6 weeks after emergence,
seem to give the best results. On very sandy soils where leaching is a problem and a history
of low nitrogen content in the grain is experienced, the topdressing can be applied at a later
stage but not later than the soft dough stage. Experience in the practice has showed that
barley tends to dislike a small application of nitrogen with planting followed by the bulk of the
nitrogen in a couple of topdressings. The yield potential of barley is mainly been determined
during the fi rst six weeks after emergence, up to the appearance of the fi rst node. Limestone
ammonium nitrate (LAN) appeared to be the best source of nitrogen for topdressing and
where nitrogen topdressing is applied through the irrigation system, an ammonium nitrate
based fertiliser is recommended. It is also recommended that some part of the nitrogen that
is applied at planting, is ammonium nitrate based. Additional nitrogen topdressing after
exceptionally heavy rains could be economically benefi cial as late as the soft dough stage. On
the sandy, high potential soils of the Douglas area, additional topdressing of 20 kg of nitrogen
per hectare can be considered.
POST SEEDING PRACTICES
Weed control
Together with fertilisation, the control of weeds can be seen as most important. Barley is very
sensitive to competition of weeds and even more so in the early developmental stages of the
plants. Early control measures will therefore enhance the yield potential of barley and must

155
preferably be done as soon as possible after most weeds have germinated and infestation is
high enough to justify control measures. The same guidelines as for weed control in wheat
apply for barley. Weeds must be correctly identifi ed (broadleaf and grass weeds) because
diff erent herbicides are used for the control of broadleaf and grass weeds. The only herbicides
for the control of grass weeds in barley are Hoelon/Ravenger, Axial and Grasp. Under no
circumstances must herbicides like Topic and Puma be sprayed on barley. The correct amount
of herbicide, as recommended on the label, must be applied because too high dosages can
be detrimental to the barley plant and too low dosages will be ineff ective. Only herbicides
registered specifi cally on barley, according to the label, are allowed to be used.
Insect control
Barley is a natural host plant for the well-known Russian wheat aphid and some other plant
aphids. For early infestation by aphids, an insecticide can be applied with the herbicide. For
a late infestation an insecticide has to be applied on its own. The same guidelines apply as
for wheat. Barley is, as wheat, susceptible to bollworm damage and the same guidelines for
bollworm control apply as for wheat.
Currently leaf miners also seem to become an increasing problem in all production areas. For
the interim an emergency registration was obtained on the product Unimectin 18EC for the
control of leaf miners.
During the 2010 season the false armyworm caused huge damage to plantings, especially in
the Vaalharts area. It was, however was noticed throughout the entire production areas and
producers must be on the lookout for this insect. In Australia this is a sporadic plague and not
necessary a year to year phenomenon. The Small Grain Institute is currently hard at work to
determine a control strategy for this plague. Although no insecticide is specifi cally registered
for the control of false armyworm, the general feeling is that insecticides used for the control
of bollworm can also be successful for the control of false armyworm. The Small Grain Institute
also undertook to put out pheromone traps to monitor moth fl ights of the false armyworm. By
doing this agriculturalists can notify producers in advance of a possible infestation.
Growth regulation
Although the current cultivars are more resistant to lodging than the older generation cultivars,
it is also prone to lodging under very high potential conditions and more so under overhead
systems. This problem can be minimised if the crop is not over-irrigated during the early stages
of plant development. If the producer is of the opinion that his barley is too lush during the
early growth stages and feel that lodging may become a problem, he can stress his crop by
applying less water for the period 10 to 14 weeks after planting. At this specifi c stage, water
stress will have the least negative eff ect on yield.
Lower planting densities (<140 plants/m²) can also play a signifi cant role in the decrease of
lodging given that the seedbed preparation is optimal. Higher seeding densities (>140 plants/
m²) leads to longer plants with weak straw, which is caused by excessive competition for air
and light.
156
Lodging can also be limited by applying a growth regulator, but presently no growth regulator
is registered on barley in South Africa. Trials that were executed for registration purposes
showed that these growth regulators did more harm than good.
The only way therefore to minimise lodging is not to:
• apply too much nitrogen fertiliser,
• use a too high planting rate,
• over irrigate during the early growing stages of the crop,
• apply too heavy irrigation during the ripening stage of the barley and
• apply irrigation when strong winds prevail.
Fungal control
Fungal diseases do not seem to be a problem in barley under the dry and hot conditions in the
irrigation areas. If any diseases do appear in the barley, a representative of SAB Maltings must
be informed immediately for the necessary recommendations.
Fungal contamination of the barley grain in this area is, however, common. Some of these
fungi can produce toxic substances (DON) that can be detrimental to humans and livestock. It
is therefore essential that the crop must be harvested as soon as it is ready, in order to minimise
the risk of ripe barley being exposed to rain during harvesting.
Irrigation
Irrigation scheduling must be according to evaporation and needs, as per growth stage. This
information is available from your SAB Maltings representative. It is, however, very important
that irrigation is not stopped too early and the last irrigation must be applied when the total
plant is almost discoloured. This is to ensure an even ripening and to produce grain with a
high percentage kernel plumpness and acceptable nitrogen content. As mentioned, skilful
irrigation practices can minimise lodging and optimise yield and quality (Refer to section
under growth regulation).
SABM in cooperation with the University of the Free State are currently busy with intensive
research with regards to the water requirements of barley and consequently the optimisation
of irrigation scheduling for barley. This work is funded by the Winter Cereal Trust and the aim is
to launch a computerised irrigation scheduling program for the 2015 barley season after it will
be tested at a number of selected producers during the 2014 season.
HARVESTING
In the traditional barley producing area, barley is swathed and windrowed before it is threshed.
This is mainly done to reduce the risk of damage by strong winds. Barley ears bend downwards
when they mature and are prone to be blown off by strong winds and this can cause huge
yield losses. The producers in the irrigation areas, however, are not equipped for this practice. It
is therefore crucial that the barley must be harvested as soon as it reaches a moisture content

157
of 12.5% in order to minimise the risk of ripe barley being exposed to possible damage by wind
and hail for prolonged periods. Barley can be harvested with the same equipment as for wheat
with minor adjustments to the drum speed, concave setting and wind. Since the contracts
are for the supply of malting barley, it is essential that skinning of the grain be avoided during
harvesting. Skinning impairs germination and introduces problems during malting. Thus the
combine harvester operation should not be as aggressive as for wheat and care should be
taken to avoid an excessively fast drum speed and/or an excessively tight concave setting.
The barley must be harvested in bulk (except where other arrangements have been made)
and delivered at the depot as stipulated on the contract or as communicated during the
growing season, where it will be sampled, classifi ed and graded. The producer then gets paid
according to quantity and quality. Producers will get paid for quality on a sliding scale system
as stipulated in the contract.
QUALITY
As from the 2011 season the sliding scale and the consequent payment for quality of barley
was adjusted. Although the cut-off points for malting grade were not adjusted the diff erent
categories within each quality parameter were adjusted and also diff erentiate between Cocktail
and the other cultivars. It is therefore important that producers must verify these changes with
their nearest SABM agriculturalist, grain dealer or member of the Barley Industry Committee.
Maltsters require barley that malts homogenous and modifi es quickly, requires no or little
cleaning and that will deliver malt of an acceptable and consistent quality to brewers. For this
reason maltsters set certain quality standards for malting barley to ensure that the end product
is produced the most economical way possible.
Nine characteristics, viz. cultivar purity, germination, nitrogen content, kernel plumpness,
screenings, foreign matter, mechanical damage, fungal infestation and moisture content are of
critical importance in grading and are discussed briefl y.
Germination/cultivar purity
Malting barley diff ers from most cereals as it has to grow again during processing. Germination
refers to the percentage barley kernels that are viable within a specifi ed time. It is the most
important characteristic of malting barley and must be higher than 98% after the breaking of
the dormancy period. Diff erent cultivars have diff erent dormancy periods (rest periods) and
therefore it is important that cultivars are not mixed, but stored separately.
The viability or germination energy of barley can be aff ected by rain prior to harvesting. If
barley is subjected to rain when ripe, biochemical processes in the kernel are initiated that
precede germination. The result is uneven or poor germination of the barley during the
malting process and produces a poor end product.
Nitrogen content
Barley with extensively high or low nitrogen content cannot produce malt of the required
quality for brewing purposes. The sliding scale, according to which the price of barley is
determined, is based on a base price onto which premiums are added for certain nitrogen

158
levels in the grain. It is important to note that the cut-off and turning points will diff er for the
coming season and must be confi rmed with grain traders. It is important to note that the cut-
off and turning points for the diff erent cultivars must be confi rmed with grain traders before
the start of the season.
Nitrogen content of barley is a characteristic that is genetically, as well as environmentally,
infl uenced. Certain cultivars (Cocktail) produce lower nitrogen content despite higher nitrogen
fertilisation. Such a characteristic of a cultivar would be benefi cial as it is not only high nitrogen
fertilisation that increases the nitrogen levels in the grain, but also uncontrollable factors such
as drought and heat stress during the grain fi lling period and the nitrogen supply capacity of
the soil. The producer must at all times also consider the nitrogen supply capability of his soils.
Soil tillage and the preceding crop are some of the important factors to keep in mind.
Kernel plumpness
Kernel plumpness is important for homogeneity during the malting process. Thin kernels take
up water faster than plump kernels. Thin kernels also have a relatively higher percentage husk,
which can give beer a bitter taste. Therefore more uniform kernel plumpness will result in
better malt quality. The sliding scale for plump kernels is such that more is paid pro rata for
barley with a kernel plumpness that increases, measured above a 2.5 mm sieve. As in the case
of nitrogen content, the cut-off point that will be in place for the coming season must be
confi rmed with the grain handlers.
It is also important to note that plump kernels produce malt with a higher extract, which is
an important aspect in the brewing process. A low kernel plumpness percentage is the result
of unfavourable conditions during the grain fi lling period, as late ears ripen too fast or if the
initial yield potential exceeds the capacity of the environment at the grain-fi lling stage. Certain
cultivars however, also tend to constantly have a lower kernel plumpness and for this reason
breeders specifi cally select for lines with high kernel plumpness. The kernel plumpness of all
the present barley cultivars can be described as good to very good.
Screening, foreign matter and mechanical damage
Screenings is material that is so small that it falls through a 2.2 mm sieve. This material generally
consists of shrivelled kernels, broken kernels, small weed seeds, glumae, awns, dead insects and
dust. There is a base price for barley deliveries within certain specifi cations and an increasing
premium for deliveries with a less screenings. Again the cut-off points must be confi rmed with
the grain handlers. Thin kernels can be ascribed to factors noted, while broken kernels, glumae,
awns and dust generally refl ect on harvester adjustments. For this reason it is imperative that
the producer adjusts his harvester correctly to ensure good quality, a good grade and thus a
good price.
Dead weevils in the screenings are usually an indication of a possible infestation and this
would require further investigation. The presence of weevils can lead to downgrading of the
crop due to the live insects on the one hand or the presence of insect damaged kernels on
the other hand.

159
Foreign matter’s cut off point is 2%, while a price incentive applies for foreign matter under 1%.
A base price is applicable for barley with a foreign matter content between 1% and 2%, but a
feed grade price is applicable for barley with a foreign matter content >2%.
Mechanical damage by harvesters decreases the percentage of usable barley kernels. When
embryos are damaged or, husk over the embryo is removed, the kernels cause problems in
the malting process. A too high percentage of endosperm exposed kernels results in several
processing problems in the malting process (fungal growth, foam in steep tanks etc.).
Fungal infection
Malting barley infected with fungi is not considered fi t for human consumption and is
downgraded to under grade. Some fungi produce mycotoxins (DON) when under stress.
Fungal infection usually takes place when grain, that is ready for harvesting, is subjected
to continual moist conditions or when barley with too high moisture content is harvested
and stored on the farm under unfavourable conditions. Barley with a high moisture content
(>12.5%) should be dried according to specifi cations as soon as possible. Barley cultivars have
no genetic resistance to these fungi that occur on the grain.
Moisture Content
Malting barley that is delivered and stored with too high a moisture content can lead to fungal
development and also a decrease in germination capacity. Due to this reason no malting
barley with a moisture content of higher than 12.5% will be accepted and a pro rata premium
is paid for grain as the moisture content decreases from 12.5% to 9.5%.
As from the 2005 season a system was implemented by which the producer is obliged to
submit a passport before he can deliver his fi rst load of barley. This barley passport entails a
schedule that has to be completed by the producer in co-operation with his chemical agent
and must clearly stipulate which chemicals have been applied on the barley as well as when it
was applied, how it was applied and the dosage used. It is therefore of the utmost importance
that the passport has to be fully completed and handed in at the delivery depot before any
grain will be accepted.
Lastly it is also important to note that no grain will be accepted that was treated with an
unregistered chemical, unregistered dosage or unregistered application method. For more
information the local SAB Maltings representative can be contacted Germination/cultivar
purity
BARLEY PASSPORT
As from the 2005 season a system was implemented by which the producer is obliged to
submit a passport before he can deliver his fi rst load of barley. This barley passport entails a
schedule that has to be completed by the producer in co-operation with his chemical agent
and must clearly stipulate which chemicals have been applied on the barley as well as when it
was applied, how it was applied and the dosage used. It is therefore of the utmost importance
that the passport has to be fully completed and handed in at the delivery depot before any
grain will be accepted.

160
Lastly it is also important to note that no grain will be accepted that was treated with an
unregistered chemical, unregistered dosage or unregistered application method. For more
information the local SAB Maltings representative can be contacted Germination/cultivar
purity.
SUMMARY
The production of barley of good quality with an optimum yield, starts and ends at the
producer and the following points are of the utmost importance:
• pH of the soil must be higher than 5.5 (KCl) and preferably between 5.5 and 6.0 (KCl).
• Phosphate status of the soil must be suffi cient (30 mg/kg citric acid soluble P) or of such
a nature that it can be rectifi ed with a one-time application.
• Planting date is of the utmost importance and barley must be planted during the
optimum recommended planting date for the specifi c area.
• Planting density may vary between 60 and 100 kg/ha depending on the status of the
seedbed, irrigation method and the planting equipment that is used. Germination
capacity and thousand kernel mass must also be taken into account.
• A total nitrogen fertilisation of 140 kg/ha (depending on the soil type) is optimal in terms
of yield and quality. On a cotton rotation system and where a lot of maize stubble are
present on the land, as well as on very sandy soils, the nitrogen application rate can be
higher (+ 20-30 kg N/ha) and must be applied as a split application to overcome the
nitrogen negative period. Directly after Lucerne the N fertilisation needs to be decreased
to 100 kg/ha and preferably all needs to be applied with planting.
• Split application of nitrogen fertilisation is more important under overhead irrigation
(specifi cally centre pivot) than under fl ood irrigation and also on lighter sandy soils.
A split of two thirds of the total nitrogen with planting and the rest 6 weeks after
emergence, seem to give the best results. In the case of very sandy soils the topdressing
can be split into two applications. The last one must, however, not be applied later than
the fl ag leaf stage.
• Judicious planting, fertilisation and irrigation practices should be applied to minimize
the problem of lodging.
• Irrigation scheduling must be according to evaporation and needs as per growth stage.
Irrigation must not be withdrawn too early and the last irrigation must be applied when
the crop is almost completely discoloured.
• Harvesting must commence as soon as the crop is ready for threshing (12.5% moisture
content) in order to minimise possible damage by wind and hail, as well as weather
damage of grain (fungal contamination).
• The combine harvester operation should not be as aggressive as for wheat in order to
avoid skinning.
• Only use registered chemicals, at the registered dosage and according to the registered
application method.

161
Barley can compete very well with wheat in the central irrigation area with regard to quality
and yield, if above-mentioned criteria are adhered to and climatic conditions do not diff er
signifi cantly from the long-term average.
For any further information, you can contact one of the following SAB Maltings agricultural
advisors:
Burrie Erasmus (Hartswater) 082 921 7967
Johannes Kokome (Taung) 082 921 7981
Frikkie Lubbe (Kimberley) 082 921 7994

162
OAT PRODUCTION IN THE SUMMER RAINFALL REGION
Oats has been cultivated in the past mainly for grazing purposes and hay production. Grain
production of oats makes a limited contribution to the developing breakfast cereal market,
with the majority of grain produced ending up in the animal feed market. Human consumption
of oats is currently the only organized market, with competitive grain prices being paid for a
product with suitable grain quality.
There are however other attributes of oats that are of importance. The introduction and
expansion of no-till practices and reduced cultivation systems necessitates the use of suitable
cover crops to achieve signifi cant ground cover. Oats is suited to this scenario due to the
wide planting spectrum, wide adaptability and high biomass production, and can be planted
with available cultivation equipment. Furthermore, oats has a depressing eff ect on soil-borne
diseases, like take-all, in these crop rotation systems.
Grazing, silage and hay production
Oat grain is widely used by horse owners and other producers in feed mixtures. Well fertilized
oats produces high quality hay and grain with a high nutritional value. Oat grain that do not
qualify for suitable grades due to low hectolitre mass values, is also utilized in the animal feed
market.
Oats plays a signifi cant part in a balanced grazing availability program, with several cultivars
suited for this purpose. The wide adaptability, nutritional value and regrowth characteristics of
oats create the situation of available grazing over a long period. Planting for this purpose can
start in February and continue up to July. Contact experts for further information in this area.
For hay production under irrigation, the cultivars Maluti, Witteberg, Drakensberg and SWK001
can be planted from March to June at a seeding density of 40 - 50 kg seed/ha. Kompasberg,
SSH 421, SSH 405 and SSH 491 can be planted from May to June at a seeding density of 70 -
100 kg seed/ha.
Grain production
The local consumption of oats for processing in the cereal market is approximately 40 000 -
50 000 ton. Due to the low quality of oats grain produced (mainly of a low hectolitre mass),
a major part of this local grain production is not suited for commercial processing and the
requirement of the market is fi lled via imports. Local cultivars have the potential to produce
the required yield and quality oats.
Grain quality
The quality standards applied at present are directly related to the processing of the oats
seed. To develop an understanding of these standards it is necessary to briefl y note the most
important processes through which oats goes during processing. Firstly all impurities and
foreign material such as chaff , stones, weed seeds, wheat and barley are removed. The groats or
kernel is the economically valuable part of the grain, while the hulls have no commercial value.
The hulls are removed by two rotating milling stones that are set fractionally closer to one

163
another than the thickness of the grain, and literally rub off the hulls. It is thus understandable
that the hulls of twin oats cannot be removed and that naked oats will be damaged in this
process. After this process the oats undergoes specifi c processing for the purpose for which
it is needed.
Hectolitre mass
Large and well fi lled groats/kernels are in big demand by the processors and hectolitre mass
is an indication of this quality aspect. The minimum hectolitre mass depending on the grade
is shown in Table 1.
Just as in the case of wheat and barley, hectolitre mass of oats is determined during the grain
fi lling stage. Abnormal leaf senescence prior to or during fl owering and grain fi lling due to
malnutrition, diseases or stress, causes low hectolitre mass. The defi ciencies must be corrected
before the fl ag leaf stage to ensure a positive eff ect on hectolitre mass.
Table 1. Grading requirements for oats
Grade Minimum hectolitre mass (kg/hl)
Grade 1 53
Grade 2 48
Feed Grade 38
Groats:hull relation
The oats kernel is enclosed by two hulls that are worthless to the industry. Plenty of groats
and little hull are thus required and processors require no more than 30% hulls against 70%
or more groats. This characteristic is generally also refl ected in the hectolitre mass and is
environmentally, as well as genetically determined. In shrivelled oat grain the hulls make out a
greater percentage of the groats:hull relation and in this case is undesirable.
Seed size
During processing the oats grain is sieved into diff erent class sizes. This process is done very
accurately, as an important quality component of the end-product relies on the eff ectivity
of the sieving process. The largest seeds are more desirable, while the smallest grains are
generally worthless. Uniform seed size is thus ideal. As the largest seeds ripen fi rst and tend to
fall out fi rst, it is important not to delay harvesting.
Twin oat grain often occur. This characteristic is cultivar specifi c but can also be the result of
environmental conditions and the harvesting process. Twin oats are undesirable as they go
through the sieving process as large seeds and are later separated as two small oat grains that
later cannot be dehulled. The harvester must thus be set in such a way that a minimum of twin
oat grains are harvested.
Naked oat grains are grain of which the hulls have been removed in the harvesting process
and are totally undesirable as they are separated into the small and medium seed sizes in the
sieving process and are then ground, not dehulled in the dehulling process. The adjustment of
the harvester is thus critical and requires special and specifi c attention by the producer.

164
As with wheat, planting date, fertilisation, pest and weed control, timely harvesting and
correct adjustment of the harvester is of critical importance to produce grain of high quality.
Locally available oats cultivars do have the potential to produce suitable quality grain and this
potential must be utilized.
General production practices for oats in the summer rainfall area are similar to that for wheat
production.
Cultivation
Irrespective of the crop rotation system followed, the main aim is to accumulate the maximum
amount of soil water, alleviate compacted soil layers and prepare a seedbed that will ensure
good germination and seedling establishment. Planting activities of oats are similar to those of
wheat with regard to planting depth and row widths used.
Seed treatments for oats
The standard seed treatments against seed-borne diseases must be applied in grain
productions, while it is optional in grazing and hay productions.
Cultivar choice, planting spectrum and seeding density
The producer must decide on the end-market for the production, that being grain, grazing
or feed (Table 2). Cultivars more suited for grazing and hay production have diff erent
characteristics, and a cultivar for grain production must be chosen in correspondence with
the needs of the buyer and end-user of the product, but also fi ts into the production system
of the farmer. Once this decision has been made, plant the chosen cultivar and optimise all
production practices (Tables 3, 4 and 5). Use certifi ed seed to ensure that the correct cultivar
is planted according to the proposed end-user, and to ensure good germination and seedling
establishment.

165
Ta
ble
2. C
ha
ract
eri
stic
s o
f o
at
cult
iva
rs
Cu
ltiv
ars
Gra
in
yie
ldH
ect
oli
tre
m
ass
Lo
dg
ing
re
sist
an
ce
Pla
nt
he
igh
t (c
m)
Cro
wn
ru
st
resi
sta
nce
Ste
m r
ust
re
sist
an
ceM
ain
use
Sim
on
sbe
rgH
igh
Go
od
Go
od
85
MR
MR
Gra
in/
Gra
zin
g
Tow
erb
erg
Go
od
Hig
hG
oo
d8
5M
RM
RG
rain
/ G
razi
ng
Ov
erb
erg
Go
od
Go
od
Go
od
80
MS
MR
Gra
in/
Gra
zin
g
Se
de
rbe
rgA
veA
veR
eas
on
able
90
MS
MS
Gra
in/
Gra
zin
g
Ko
mp
asb
erg
Hig
hH
igh
Hig
h7
5M
RM
SG
rain
/ G
razi
ng
He
ros
Ave
Ave
Re
aso
nab
le8
5S
SG
rain
Wit
teb
erg
Go
od
Ave
Ave
10
0+
SS
Gra
zin
g
Pa
llin
up
Hig
hH
igh
Go
od
80
MS
MS
Gra
in
Po
toro
oG
oo
dH
igh
Go
od
80
MR
MR
Gra
in
SS
H 4
91
Ave
Hig
hG
oo
d9
0M
RS
Gra
in/H
ay
SS
H 4
05
Ave
Go
od
Re
aso
nab
le8
5S
SG
rain
SS
H 4
21
Go
od
Ave
Ave
90
+-
-G
razi
ng
Dra
ke
nsb
erg
Hig
hA
veR
eas
on
able
10
0+
RM
SG
razi
ng
/Sila
ge
Ma
luti
Ave
Ave
Ave
10
0+
MS
MS
Gra
zin
g
SS
H 3
9W
Ave
Ave
Ave
10
0+
--
Gra
zin
g
SW
K 0
01
Ave
Ave
Ave
10
0+
MR
MS
Gra
zin
g
Le
Tu
can
aH
igh
er
yie
ld a
nd
be
tte
r co
ld t
ole
ran
ce t
han
Dra
ken
sbe
rgG
razi
ng
MS
= M
od
era
tely
Su
scep
tib
le
MR
= M
od
era
tely
Res
ista
nt
S =
Su
scep
tib
le
R =
Res
ista
nt
?
= U
nkn
ow
n
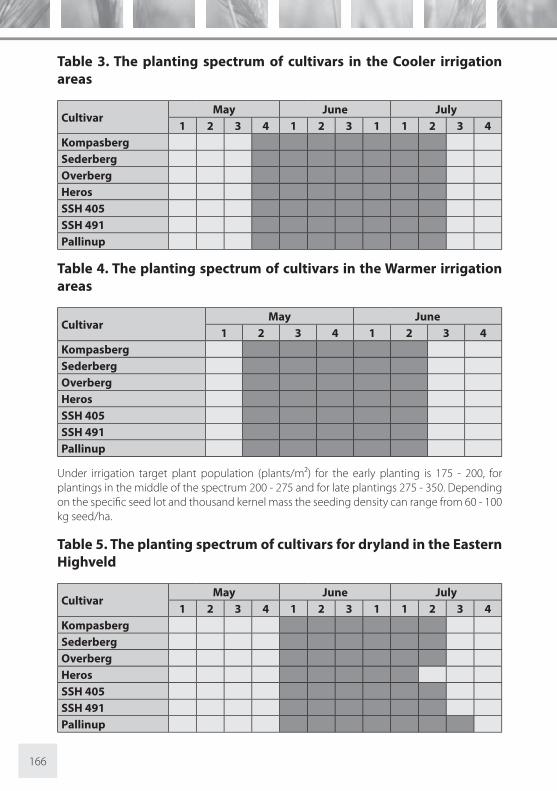
166
Table 3. The planting spectrum of cultivars in the Cooler irrigation
areas
CultivarMay June July
1 2 3 4 1 2 3 1 1 2 3 4
Kompasberg
Sederberg
Overberg
Heros
SSH 405
SSH 491
Pallinup
Table 4. The planting spectrum of cultivars in the Warmer irrigation
areas
CultivarMay June
1 2 3 4 1 2 3 4
Kompasberg
Sederberg
Overberg
Heros
SSH 405
SSH 491
Pallinup
Under irrigation target plant population (plants/m²) for the early planting is 175 - 200, for
plantings in the middle of the spectrum 200 - 275 and for late plantings 275 - 350. Depending
on the specifi c seed lot and thousand kernel mass the seeding density can range from 60 - 100
kg seed/ha.
Table 5. The planting spectrum of cultivars for dryland in the Eastern
Highveld
CultivarMay June July
1 2 3 4 1 2 3 1 1 2 3 4
Kompasberg
Sederberg
Overberg
Heros
SSH 405
SSH 491
Pallinup

167
The seeding density for dryland plantings is 20-25 kg seed/ha. The planting spectrum is based
on available data. Plantings outside this spectrum is at own risk after assessing the possible
production risks.
Fertiliser requirement
Oats generally has similar soil requirements as wheat with regards to the macro and micro
nutrients (Fe, Cu, Zn, Mn and Mo) that have major infl uence on production. Soil acidity levels
of (pH 4.8 to 5.5 (KCI)) are regarded as being optimal. Oats is more acid tolerant (up to 15% acid
saturation) than wheat, but less saline tolerant than wheat and barley.
Nitrogen management of the oats crop is determined by soil and nutrient management
strategies including the previous crop, soil water availability, soil nitrogen availability, yield
potential, risk of lodging, timing of nitrogen applications and nitrogen sources available for
use.
For hay production under irrigation 100 kg N/ha is recommended, with additional 25 - 50 kg N/
ha after each grazing and/or fodder harvest depending on level of production.
For grain production the general recommendation is 90 kg N/ha, 25 kg P/ha and 20 kg K/ha for
a grain yield potential of 4.5 ton/ha. The general guideline is 20 kg N/ton grain for soils with a
low organic carb content <3% and of high quality residue are available for utilisation, apply 30
kg N/ton grain yield potential. Phosphorus is important especially early in the growing season
for establishment, while suffi ciently available potassium can reduce lodging and ensure
uniform ripening.
Under dryland conditions in the high rainfall regions, a general recommendation of 40 kg N/
ha, 10 kg P/ha and 10 kg K/ha (optional) is used. A maximum of 20 kg N/ha or a total of 50 kg
N+K/ha can be seed placed safely, and higher applications must be banded away from the
seed. The phosphorus fertilizer recommendations (kg P/ha) at the yield potential levels and
soil analysis value (mg/kg P-Bray 1), as well as the potassium fertilizer recommendations (kg K/
ha) at the relevant yield potential levels and soil potassium analysis value (mg/kg K) currently
used for dryland wheat production can also be applied for oats production. Keep in mind that
the yield potential of oats is lower compared to that of wheat under both dryland and irrigated
conditions. The same fertilizer recommendations can be used for grazing plantings, with the
option of additional N applications after grazing events combined with rainfall occurrence.
Diseases and control
Oats is susceptible to crown and stem rust, and to “Barley yellow dwarf virus” which is spread by
aphid infestations. It is economically viable to control diseases at yield potential levels above
4 ton/ha. Diseases generally lower the kernel weight and hectolitre mass, and discolour the
grain, resulting in downgrading of the product resulting in a lower price per ton grain.

168
Irrigation requirements
Under movable irrigation systems and supplemental irrigation applications, the current
recommendation is fi ve irrigations during the growing season if production is started on a
full soil profi le. These irrigations are applied at 5-leaf, early stem elongation, fl ag leaf, fl owering
and during the grain fi lling stages. Under centre pivot irrigation systems, a similar irrigation
management program as for wheat is used. Irrigation during the later growth stages tends to
disrupt uniform ripening, thereby delaying harvesting. Similar to the other small grains, oats is
susceptible to high temperatures and water stress during grain fi lling, and these necessitates
well-timed and eff ective soil water management.
Harvesting, storage and marketing
Oats can be harvested at a grain moisture content below 20%, but can only be stored safely
at a grain moisture below 12.5%. Shattering in the fi eld can be a problem, and rain during
harvesting can discolour kernels, resulting in downgrading of the crop. There are various
options (including cleaning and sieving) to improve grain quality parameters, especially
hectolitre mass, to attain better prices per ton of grain.
Problems in oat production
Grasses in oats production can be a huge problem as it cannot be chemically controlled,
and these grasses and volunteer wheat must be controlled beforehand especially if take-all
depression is one of the production objectives. Lodging of the crop causes yield losses and
non-uniform ripening and hence diffi culties in timely harvesting, and can result in reduced
grain quality. Lodging can be managed by cultivar choice, seeding density and nutrient
management. In particular, seeding density is a major factor with regard to the incidence of
lodging. Because of the lower kernel weight of oats seed, lower seeding densities (kg seed/ha)
are needed to achieve target plant populations. Cultivars also diff er in tillering capacity that
can infl uence seeding density for a yield target. Bird damage is also a limiting factor in some
areas.
Oat fi eld trial results
The yield and hectolitre mass results obtained in the fi eld trials in the Northern Cape (Vaalharts
and Riet River) and the Free State (Bethlehem) over the past four years of testing are given in
the following tables.

169
Long-term yield data (ton/ha) for oat cultivar adaptation trials under
irrigation
Cultivar 2013 * R 2012 * R 2010 R 2009 R
H06/15 4.46 8 5.73 4 4.59 4
H06/19 4.19 11
H07/04 4.98 7 5.64 5 4.62 3
H07/05 4.43 8
Heros 3.91 12 3.09 6
Kompasberg 6.31 1 5.77 3 5.02 1 4.07 1
Overberg 5.08 6 5.32 7 4.21 10 3.03 8
Pallinup 5.70 3 5.90 2 4.57 5 3.72 2
Sederberg 3.42 14 3.12 5
Simonsberg 5.15 4 4.89 8 3.84 13
SSH 405 4.67 2 3.64 3
SSH 421 4.47 7 3.09 6
SSH 491 6.14 2 6.98 1 4.32 9 3.23 4
Towerberg 5.10 5 5.41 6 4.56 6
Average 5.37 5.71 4.34 3.37
LSDt(0,05) 0.32 0.65 0.41 0.50
* Only Vaalharts data
Long-term hectolitre mass data (kg/hl) for oat cultivar adaptation
trials under irrigation
Cultivar 2013 * R 2012 * R 2010 R 2009 R
H06/15 48.70 4 48.15 7 49.83 7
H06/19 50.16 4
H07/04 45.75 8 47.75 8 50.09 5
H07/05 49.15 11
Heros 48.35 13 50.99 6
Kompasberg 47.70 7 48.75 5 48.02 14 47.36 8
Overberg 48.10 6 50.45 2 50.68 1 51.03 5
Pallinup 49.75 2 50.40 3 49.79 8 51.74 4
Sederberg 48.98 12 50.38 7
Simonsberg 48.60 5 48.70 6 49.37 10
SSH 405 49.73 9 53.44 1
SSH 421 50.60 2 52.71 2
SSH 491 50.85 1 52.50 1 50.37 3 52.15 3
Towerberg 49.00 3 49.70 4 49.95 6
Average 48.56 49.55 49.65 51.23
LSDt(0,05) 0.86 1.50 1.05 1.87
* Only Vaalharts data
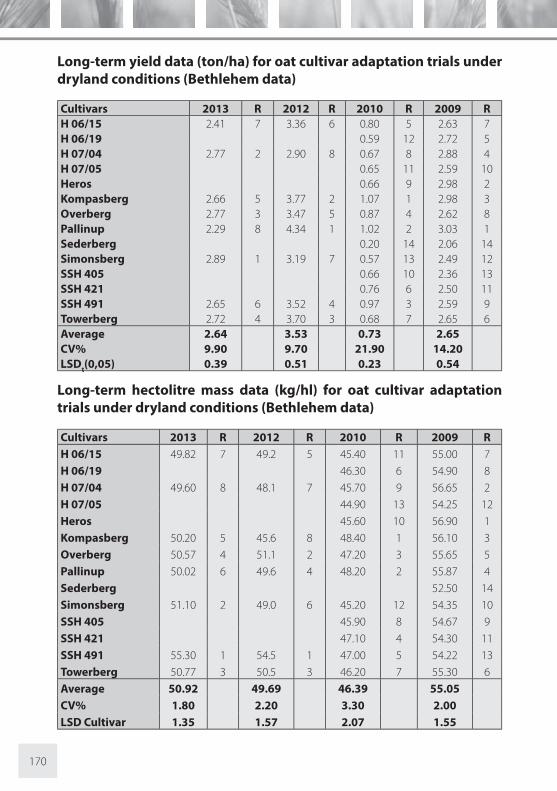
170
Long-term yield data (ton/ha) for oat cultivar adaptation trials under
dryland conditions (Bethlehem data)
Cultivars 2013 R 2012 R 2010 R 2009 R
H 06/15 2.41 7 3.36 6 0.80 5 2.63 7
H 06/19 0.59 12 2.72 5
H 07/04 2.77 2 2.90 8 0.67 8 2.88 4
H 07/05 0.65 11 2.59 10
Heros 0.66 9 2.98 2
Kompasberg 2.66 5 3.77 2 1.07 1 2.98 3
Overberg 2.77 3 3.47 5 0.87 4 2.62 8
Pallinup 2.29 8 4.34 1 1.02 2 3.03 1
Sederberg 0.20 14 2.06 14
Simonsberg 2.89 1 3.19 7 0.57 13 2.49 12
SSH 405 0.66 10 2.36 13
SSH 421 0.76 6 2.50 11
SSH 491 2.65 6 3.52 4 0.97 3 2.59 9
Towerberg 2.72 4 3.70 3 0.68 7 2.65 6
Average 2.64 3.53 0.73 2.65
CV% 9.90 9.70 21.90 14.20
LSDt(0,05) 0.39 0.51 0.23 0.54
Long-term hectolitre mass data (kg/hl) for oat cultivar adaptation
trials under dryland conditions (Bethlehem data)
Cultivars 2013 R 2012 R 2010 R 2009 R
H 06/15 49.82 7 49.2 5 45.40 11 55.00 7
H 06/19 46.30 6 54.90 8
H 07/04 49.60 8 48.1 7 45.70 9 56.65 2
H 07/05 44.90 13 54.25 12
Heros 45.60 10 56.90 1
Kompasberg 50.20 5 45.6 8 48.40 1 56.10 3
Overberg 50.57 4 51.1 2 47.20 3 55.65 5
Pallinup 50.02 6 49.6 4 48.20 2 55.87 4
Sederberg 52.50 14
Simonsberg 51.10 2 49.0 6 45.20 12 54.35 10
SSH 405 45.90 8 54.67 9
SSH 421 47.10 4 54.30 11
SSH 491 55.30 1 54.5 1 47.00 5 54.22 13
Towerberg 50.77 3 50.5 3 46.20 7 55.30 6
Average 50.92 49.69 46.39 55.05
CV% 1.80 2.20 3.30 2.00
LSD Cultivar 1.35 1.57 2.07 1.55

171
ARC-SMALL GRAIN INSTITUTE SERVICES
The laboratories of ARC-Small Grain Institute are well known for their fast, accurate and reliable
services to you as producer.
Seed Testing Laboratory
The Seed Testing Laboratory is registered with the Department of Agriculture and ISTA
(International Seed Testing Association)-rules are strictly applied to comply with international
standards in determining the quality characteristics of seed. Tests include the following:
Germination tests and physical purity analysis package
The germination test is an indication of the percentage seed that will, under favourable
conditions, produce normal seedlings. Together with the germination results, the percentage
of seed from other crops and weeds are determined. This is also subject to requirements set
by law. Each seedlot planted in the fi eld must be tested so that the producer is assured that
the seed planted has a germination percentage greater than 80%, which is the minimum for
making wheat production a viable proposition.
Coleoptile length
Coleoptile length is the length of the sheath that enfolds the fi rst leaf. The coleoptile provides
the force that carries the leaf to the soil surface. To prevent emergence problems under dryland
conditions, coleoptile length determinations are recommended. It is important to remember
that planting depth is critical where cultivars with short coleoptile lengths are planted.
Seed analyses testing chemical treatments
A seed treatment can be tested for its eff ect on South African small grain cultivars and even
its compatibility with other seed treatments. These services will be provided on contract basis
only.
Contact person: Hesta Hatting
Tel: (058) 307-3417
Fax: (058) 307-3519
E-mail: [email protected]

172
Wheat Quality Laboratory
The Wheat Quality Laboratory participates in two external quality control schemes. The Premier
Foods Ring test samples are analysed monthly and the Southern African Grain Laboratory
(SAGL)’s Ring test samples are analysed quarterly. The laboratory off ers the following analyses
on whole wheat kernels:
• Hectolitre mass / Test weight
• Single Kernel Characterisation System (SKCS) analyses, which includes thousand kernel
mass, kernel hardness index, kernel diameter and kernel moisture content
• Kernel colour
• Flour yield potential
Analyses that can be performed on fl our include:
• Flour colour
• Protein content
• Falling number
• Sodium Dodecyl Sulphate (SDS) sedimentation volume
• Wet gluten content
• Moisture content
Analyses indicative of dough properties and end-use quality include:
• Mixograph analyses
• Farinograph analyses
• Alveograph analyses
• Mixolab analyses
• Loaf volume
Contact person: Chrissie Miles
Tel: (058) 307-3414
Fax: (058) 307-3519
E-mail: [email protected]

173
Soil Analyses Laboratory
The Analyses Laboratory specializes in soil analyses and is an active member of the Agri-LASA
control scheme.
Soil analyses
pH (KCl)
Ca, Mg, Na, K (Ammonium Acetate)
Phosphate (Bray 1)
% Acid Saturation
Other analyses:
Lime requirement Zinc (HCl)
% Total Carbon (TOC)
Clay % (Hydrometer Method)
Particle size
Contact person: Lientjie Visser
Tel:(058) 307-3501
Fax:(058)307-3519
E-mail:[email protected]

174
INFORMATION
For more information you are advised to contact the following specialists:
Cultivar Choice
Willem Kilian
Seed Services
Hesta Hatting
Plant Diseases
Cathy de Villiers
Krishna Naicker
Dr Tarekegn Terefe
Insect Control
Dr Goddy Prinsloo
Dr Vicki Tolmay
Dr Justin Hatting
Dr Astrid Jankielsohn
Weed Control
Hestia Nienaber
Plant Breeding
Dr André Malan
Robbie Lindeque
Soil Analyses
Lientjie Visser
Plant Nutrition
Willem Kilian

175
Quality
Chrissie Miles
Developing Agriculture
Dr Eric Morojele
Dr Rorisang Patose
Soil Tillage
Willem Kilian
Address correspondence to:
ARC-Small Grain Institute
Private Bag X29
Bethlehem
9700
Tel: (058) 307-3400
Fax: (058) 307-3519
www.arc-sgi.agric.za

176
NOTES


ARC-Small Grain Institutewww.arc-sgi.agric.za