Embed Size (px)
Citation preview
March 2018 cps.sk.ca
College of Physicians and Surgeons of Saskatchewan
Laboratory Quality Assurance Program
LABORATORY GUIDELINES
2018 Edition
2
Laboratory Guidelines 2018 Edition cps.sk.ca March 2018
LABORATORY GUIDELINES – 2018 SUMMARY OF CHANGES
The following GUIDELINES have been revised, added, or deleted: REVISED: 2017 Differential Performance and Referral Practice Guideline 2016 Recommended Resources for Laboratories (previously “Reference Textbook List for Laboratories”) Retention Guideline 2015 Specimens Exempt From All Gross &/or Microscopic Pathology Laboratories 2014 Differential Performance and Referral Practice Guidelines 2013 Reference Textbook List for Laboratories
Urinalysis Retention Guideline eGFR Differential Quality Control Procedure for WBC Estimate
2012 Performance of Whole Blood Glucose Testing Urinalysis Retention Guideline Differential Performance & Referral Practice Guideline ADDED: 2016 Balances Centrifuge Operating Speeds Competency Documents Duties of Medical Laboratory Assistant Pipettes POCT HIV Quality Control Quality Control Temperature Monitoring Thermometers Visual Color Discrimination Manual ESR QC 2015 Fluid Review by Pathologist 2013 International Sensitivity Index (ISI) Verification Verifying or Establishing a Normal Reference Range for Routine Coagulation Testing 2012 Reference Textbook List Indirect Platelet Count Procedure for Platelet Estimate Establishing Conversion Factor for PLT Estimation Procedure for WBC Estimate Establishing Conversion Factor for WBC Estimation Protocol for Validation of Linearity on Automated Hematology Analyzers
3
Laboratory Guidelines 2018 Edition cps.sk.ca March 2018
DELETED: 2016 Retention of Transfusion Medicine Records Performance of Non-Gynecological Cytology Follow-up Reports for Gynecological Cytology Follow-up Program for Cytology Cholesterol/Triglyceride/Lipid Testing Reporting Sperm in Urine Quality Control Diagnosis and Monitoring of Thyroid Disease Presence of Small Amounts of Albumin Principles for Hematology Practice Hematology Films/Labeling of Slides Morphology of Lymphocytes Flow Cytometry for the Diagnosis of Lymphoma/Leukemia Malaria 3.2% Na Citrate Anticoagulant Recommended vs. 3.8% for Coagulation Studies Procedure/Method Statistical Validation/Work-up Guidelines 2015 Surgical Pathology Reports Urinalysis Bleeding Time 2014 Erythrocyte Sedimentation Rate (ESR) 2013 Performance of Whole Blood Glucose Testing D-dimer Semen/Sperm Analysis
4
Laboratory Guidelines 2018 Edition cps.sk.ca March 2018
Table of Contents
General Retention Guideline 5 Recommended Resources for Laboratories 8 Balances 10 Centrifuge Operating Speeds 11 Competency 12 Documents 13 Duties of Medical Laboratory Assistant 14 POCT HIV Quality Control 15 Pipettes 16 Quality Control 17 Temperature Monitoring 18 Thermometers 19 Visual Color Discrimination 20 Anatomic Pathology Specimens Exempt from all Gross &/or Microscopic Pathology Laboratories 22 Removal of Tissue, Blocks or Slides from the Original Hospital Site 24 Chemistry Estimated Glomerular Filtration Rate – eGFR 27 Crosscheck/Validation Guideline for Those Facilities with Multiple Chemistry Instruments 28 Procedure/Method Statistical Work-up/Validation Study Guidelines 29 Hematology Differential Performance and Referral Practice Guideline 32 Red Blood Cell Morphology Reporting Guideline 34 Differential Quality Control 35 Smudge Cells 38 Crosscheck Validation Guideline for Facilities with Multiple Hematology Instruments 39 Procedure/Method Statistical Work-up/Validation Study Guidelines 40 Protocol for Validation of Linearity on Automated Hematology Analyzers 42 Procedure for WBC Estimate 45 Establishing Conversion Factor for WBC Estimation 47 Procedure for Platelet Estimates 49 Establishing Conversion Factor for Platelet Estimation 51 Indirect Platelet Count 53 International Sensitivity Index (ISI) Verification 55 Verifying or Establishing a Normal Reference Range for Routine Coagulation Testing 56 Fluid Review by Pathologist 59 Manual ESR QC 60

5
Laboratory Guidelines 2018 Edition cps.sk.ca March 2018
GENERAL
6
Laboratory Guidelines 2018 Edition cps.sk.ca March 2018
RETENTION GUIDELINE Laboratories vary in size, facility and extent of services provided. Clinical laboratories must maintain thorough, accessible records that can demonstrate an acceptable standard of care and compliance with the accreditation requirements. The Laboratory Quality Assurance Program of the College of Physicians and Surgeons urges laboratories to retain records, materials, or both for a longer period of time than specified for educational and quality improvement needs. Laboratories must establish policies that meet or exceed the following minimum requirements for retention of documents and specimens as established by professional and/or regulatory organizations. References include: CSTM, CSCC, CAP, CSA, ISO, CPSS
7
Laboratory Guidelines 2018 Edition cps.sk.ca March 2018
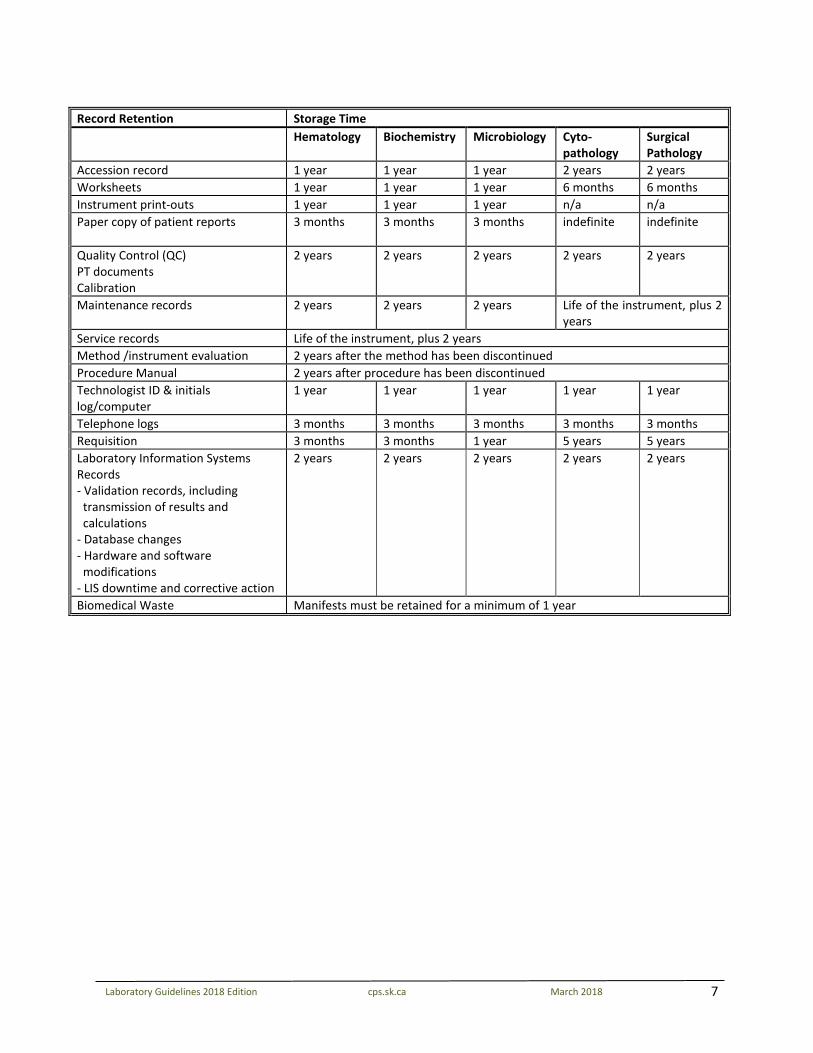
Record Retention Storage Time Hematology Biochemistry Microbiology Cyto-
pathology Surgical Pathology
Accession record 1 year 1 year 1 year 2 years 2 years Worksheets 1 year 1 year 1 year 6 months 6 months Instrument print-outs 1 year 1 year 1 year n/a n/a Paper copy of patient reports 3 months 3 months 3 months indefinite indefinite
Quality Control (QC) PT documents Calibration
2 years 2 years 2 years 2 years 2 years
Maintenance records 2 years 2 years 2 years Life of the instrument, plus 2 years
Service records Life of the instrument, plus 2 years Method /instrument evaluation 2 years after the method has been discontinued Procedure Manual 2 years after procedure has been discontinued Technologist ID & initials log/computer
1 year 1 year 1 year 1 year 1 year
Telephone logs 3 months 3 months 3 months 3 months 3 months Requisition 3 months 3 months 1 year 5 years 5 years Laboratory Information Systems Records - Validation records, including
transmission of results and calculations
- Database changes - Hardware and software
modifications - LIS downtime and corrective action
2 years 2 years 2 years 2 years 2 years
Biomedical Waste Manifests must be retained for a minimum of 1 year
8
Laboratory Guidelines 2018 Edition cps.sk.ca March 2018
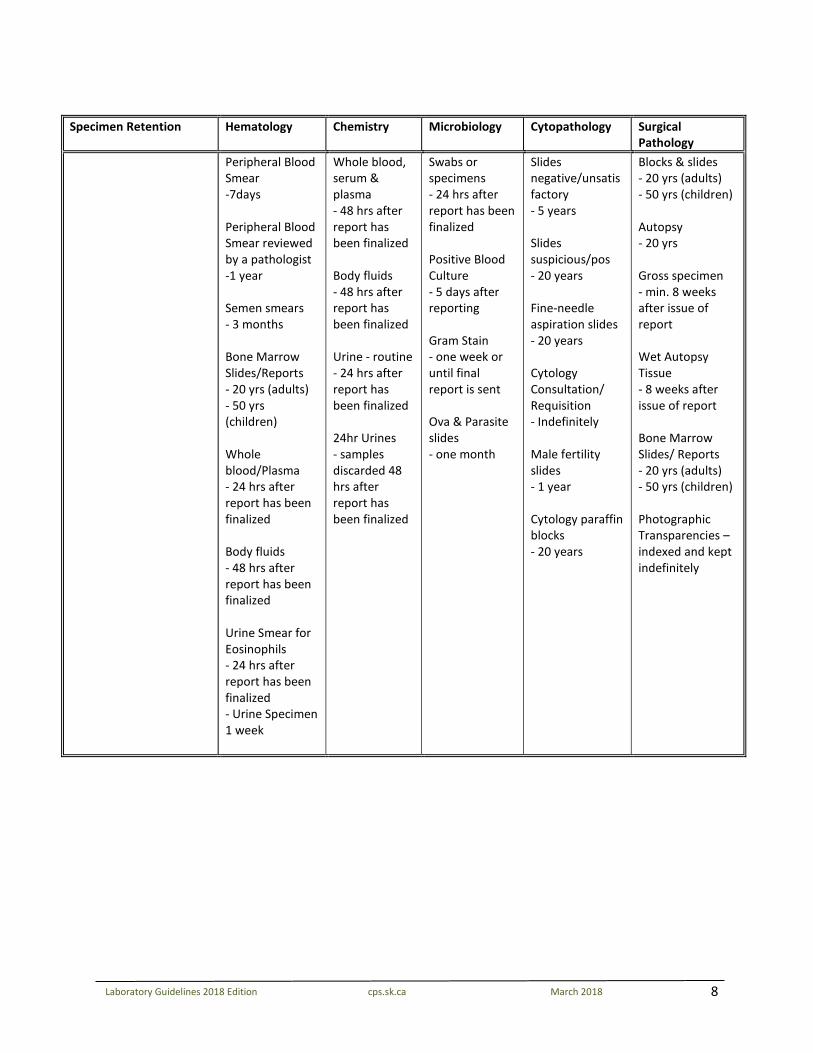
Specimen Retention Hematology Chemistry Microbiology Cytopathology Surgical
Pathology Peripheral Blood
Smear -7days Peripheral Blood Smear reviewed by a pathologist -1 year Semen smears - 3 months Bone Marrow Slides/Reports - 20 yrs (adults) - 50 yrs (children) Whole blood/Plasma - 24 hrs after report has been finalized Body fluids - 48 hrs after report has been finalized Urine Smear for Eosinophils - 24 hrs after report has been finalized - Urine Specimen 1 week
Whole blood, serum & plasma - 48 hrs after report has been finalized Body fluids - 48 hrs after report has been finalized Urine - routine - 24 hrs after report has been finalized 24hr Urines - samples discarded 48 hrs after report has been finalized
Swabs or specimens - 24 hrs after report has been finalized Positive Blood Culture - 5 days after reporting Gram Stain - one week or until final report is sent Ova & Parasite slides - one month
Slides negative/unsatisfactory - 5 years Slides suspicious/pos - 20 years Fine-needle aspiration slides - 20 years Cytology Consultation/ Requisition - Indefinitely Male fertility slides - 1 year Cytology paraffin blocks - 20 years
Blocks & slides - 20 yrs (adults) - 50 yrs (children) Autopsy - 20 yrs Gross specimen - min. 8 weeks after issue of report Wet Autopsy Tissue - 8 weeks after issue of report Bone Marrow Slides/ Reports - 20 yrs (adults) - 50 yrs (children) Photographic Transparencies – indexed and kept indefinitely
9
Laboratory Guidelines 2018 Edition cps.sk.ca March 2018
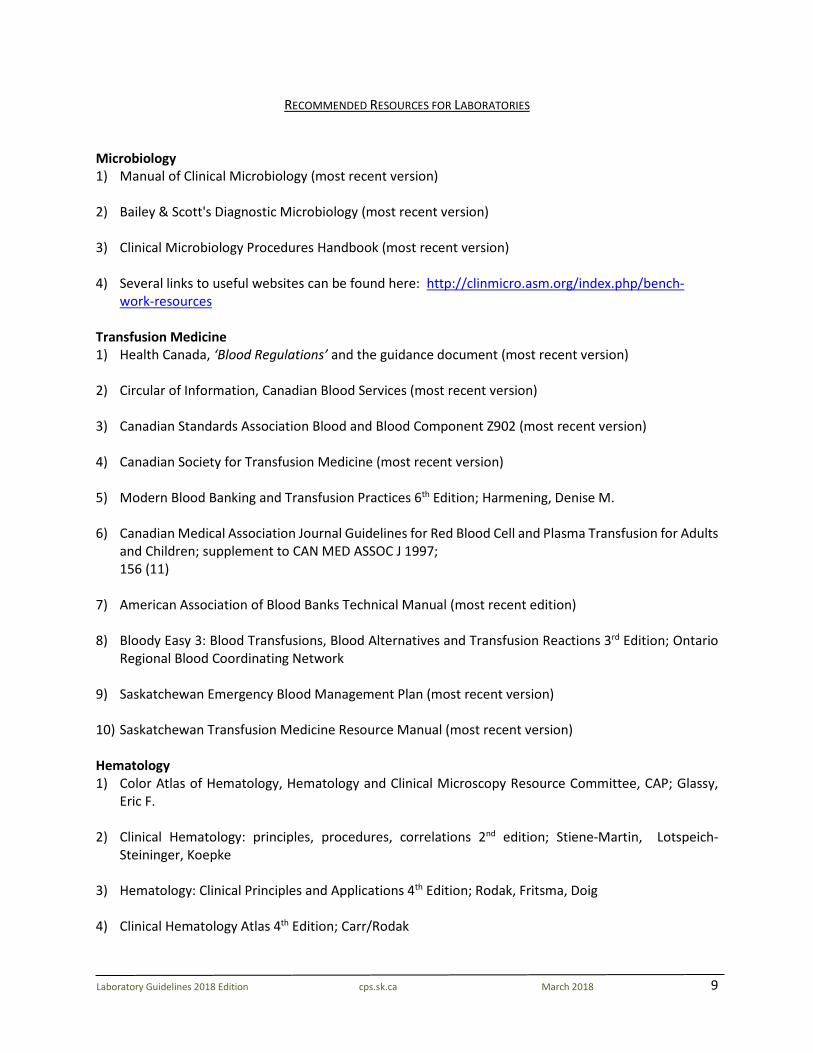
RECOMMENDED RESOURCES FOR LABORATORIES Microbiology 1) Manual of Clinical Microbiology (most recent version) 2) Bailey & Scott's Diagnostic Microbiology (most recent version) 3) Clinical Microbiology Procedures Handbook (most recent version)
4) Several links to useful websites can be found here: http://clinmicro.asm.org/index.php/bench-
work-resources
Transfusion Medicine 1) Health Canada, ‘Blood Regulations’ and the guidance document (most recent version)
2) Circular of Information, Canadian Blood Services (most recent version)
3) Canadian Standards Association Blood and Blood Component Z902 (most recent version) 4) Canadian Society for Transfusion Medicine (most recent version) 5) Modern Blood Banking and Transfusion Practices 6th Edition; Harmening, Denise M. 6) Canadian Medical Association Journal Guidelines for Red Blood Cell and Plasma Transfusion for Adults
and Children; supplement to CAN MED ASSOC J 1997; 156 (11)
7) American Association of Blood Banks Technical Manual (most recent edition) 8) Bloody Easy 3: Blood Transfusions, Blood Alternatives and Transfusion Reactions 3rd Edition; Ontario
Regional Blood Coordinating Network
9) Saskatchewan Emergency Blood Management Plan (most recent version)
10) Saskatchewan Transfusion Medicine Resource Manual (most recent version)
Hematology 1) Color Atlas of Hematology, Hematology and Clinical Microscopy Resource Committee, CAP; Glassy,
Eric F.
2) Clinical Hematology: principles, procedures, correlations 2nd edition; Stiene-Martin, Lotspeich-Steininger, Koepke
3) Hematology: Clinical Principles and Applications 4th Edition; Rodak, Fritsma, Doig
4) Clinical Hematology Atlas 4th Edition; Carr/Rodak
10
Laboratory Guidelines 2018 Edition cps.sk.ca March 2018
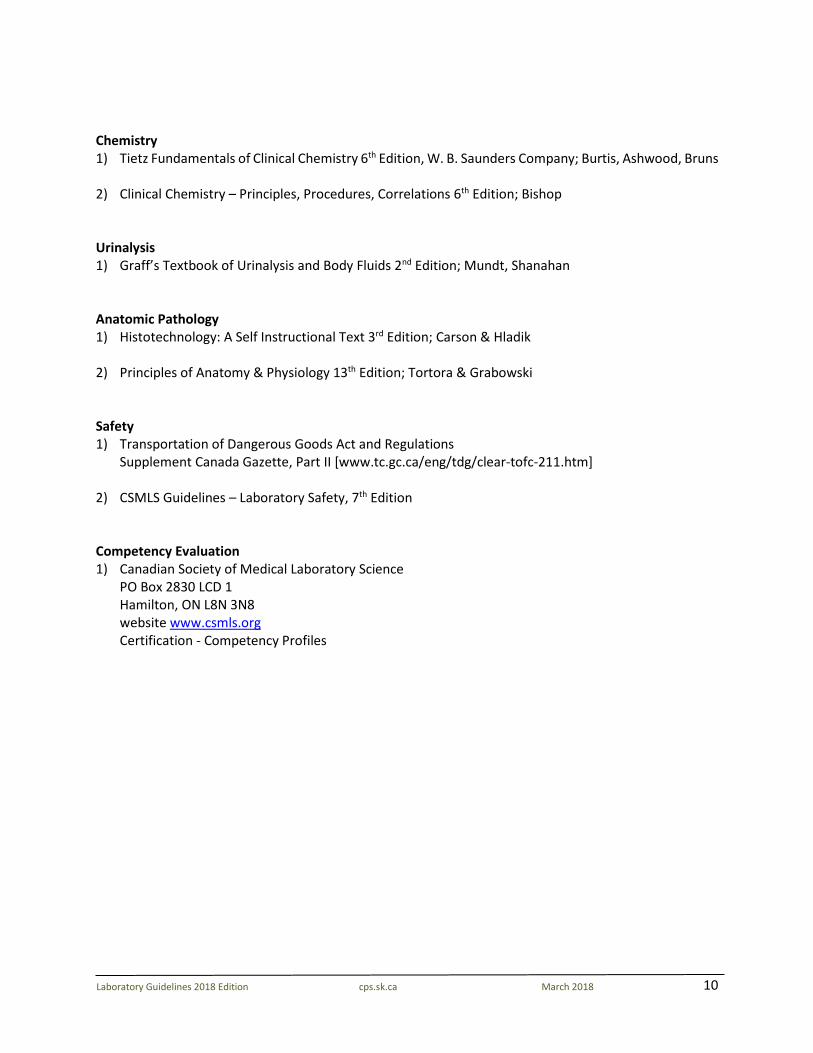
Chemistry 1) Tietz Fundamentals of Clinical Chemistry 6th Edition, W. B. Saunders Company; Burtis, Ashwood, Bruns 2) Clinical Chemistry – Principles, Procedures, Correlations 6th Edition; Bishop Urinalysis 1) Graff’s Textbook of Urinalysis and Body Fluids 2nd Edition; Mundt, Shanahan Anatomic Pathology 1) Histotechnology: A Self Instructional Text 3rd Edition; Carson & Hladik
2) Principles of Anatomy & Physiology 13th Edition; Tortora & Grabowski Safety 1) Transportation of Dangerous Goods Act and Regulations
Supplement Canada Gazette, Part II [www.tc.gc.ca/eng/tdg/clear-tofc-211.htm] 2) CSMLS Guidelines – Laboratory Safety, 7th Edition
Competency Evaluation 1) Canadian Society of Medical Laboratory Science
PO Box 2830 LCD 1 Hamilton, ON L8N 3N8 website www.csmls.org Certification - Competency Profiles
11
Laboratory Guidelines 2018 Edition cps.sk.ca March 2018
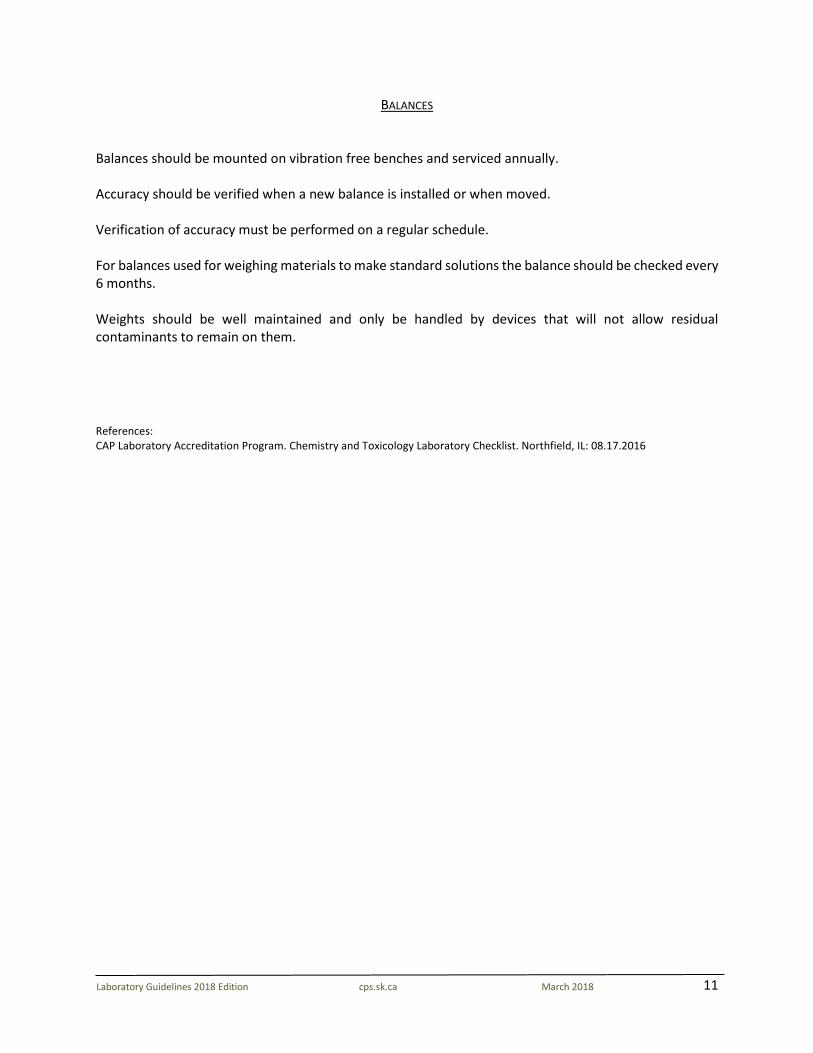
BALANCES Balances should be mounted on vibration free benches and serviced annually. Accuracy should be verified when a new balance is installed or when moved. Verification of accuracy must be performed on a regular schedule. For balances used for weighing materials to make standard solutions the balance should be checked every 6 months. Weights should be well maintained and only be handled by devices that will not allow residual contaminants to remain on them. References: CAP Laboratory Accreditation Program. Chemistry and Toxicology Laboratory Checklist. Northfield, IL: 08.17.2016
12
Laboratory Guidelines 2018 Edition cps.sk.ca March 2018
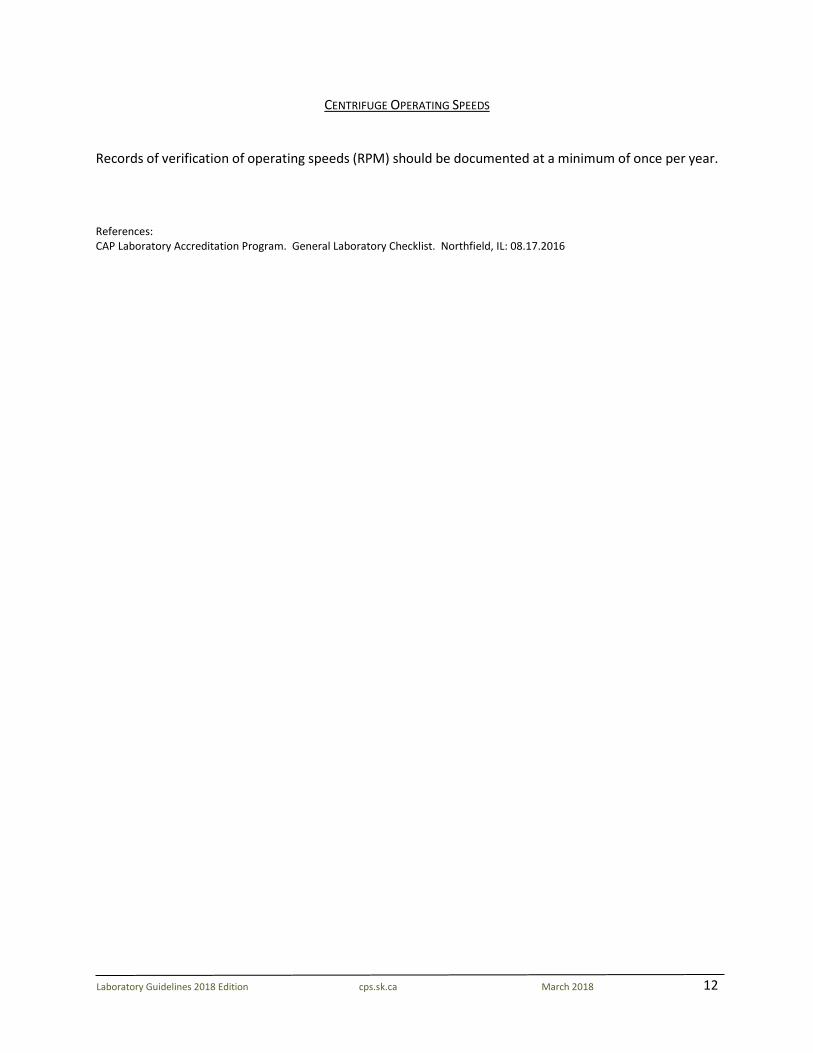
CENTRIFUGE OPERATING SPEEDS Records of verification of operating speeds (RPM) should be documented at a minimum of once per year. References: CAP Laboratory Accreditation Program. General Laboratory Checklist. Northfield, IL: 08.17.2016
13
Laboratory Guidelines 2018 Edition cps.sk.ca March 2018
COMPETENCY The competency of each person performing testing must be assessed. Prior to starting patient testing and prior to reporting patient results for new instruments or methods – each individual must have training and be evaluated for acceptable test performance. Competency assessment should be performed annually. Competency should be documented. Elements of competency assessment include but are not limited to: 1. Direct observations of routine patient test performance, including, as applicable, patient identification
and preparation; and specimen collection, handling, processing and testing. 2. Monitoring the recording and reporting of test results, including, as applicable, reporting critical
results. 3. Review of intermediate test results or worksheets, quality control records, proficiency testing results,
and preventative maintenance records. 4. Direct observation of performance of instrument maintenance and function checks. 5. Assessment of test performance through testing previously analyzed specimens, internal blind testing
samples or external proficiency testing samples; and 6. Evaluation of problem solving skills. References: CAP Laboratory Accreditation Program. General Laboratory Checklist. Northfield, IL: 08.17.2016 CAP Laboratory Accreditation Program. Point of Care Testing Laboratory Checklist. Northfield, IL: 08.17.2016
14
Laboratory Guidelines 2018 Edition cps.sk.ca March 2018
DOCUMENTS Policies, Processes, Procedures
New documents should be reviewed by the laboratory director or designate prior to implementation.
Documented review of all documents by the laboratory director or designate should occur every two years. Laboratory personnel should be knowledgeable about contents of policies and procedure relevant to their scope of examination activities. References: CAP Laboratory Accreditation Program. All Common Checklist. Northfield, IL; 08.17.2016
15
Laboratory Guidelines 2018 Edition cps.sk.ca March 2018
DUTIES OF MEDICAL LABORATORY ASSISTANT (MLA) OR LAB ASSISTANT (LA) A medical laboratory assistant may, under the qualified laboratory professional, perform a list of tasks that are considered pre-examination and post-examination, and do not require interpretation or assessment. *Duties and training of MLA’s vary from facility to facility; therefore, it is the responsibility of the employer to confirm competence. Examples of tasks may include: blood sample procurement sample preparation for analysis, may include centrifugation, separation, numbering, aliquoting reagent preparation/preparation of kits media preparation smear preparation, e.g. blood films staining of smears/slides for hematology, etc. coverslipping of slide preparations concentration of stool samples for parasitology examinations planting and streaking of microbiology specimens and controls set up of anaerobic and CO2 jars titrations using a pH meter urinalysis (excluding microscopic) loading of primary tube to automated instruments set up of erythrocyte sedimentation rates temperature monitoring of thermally controlled equipment filing of records and retrieval of files wash-up and glassware record but not report results (ESR, pregnancy test)
16
Laboratory Guidelines 2018 Edition cps.sk.ca March 2018
HIV POCT QUALITY CONTROL The controls are used to verify test performance and interpretation of results. Kit controls should be run under the following circumstances:
• For new INSTI user verification • When switching to new lot number of INSTI test kits • If a site conducts >24 point-of-care tests per day, the controls should be run everyday • If a site conducts <24 point-of-care tests per day, the controls should be run
approximately once per 24 specimens, but no less than once per week • If a site does no point-of-care tests in a given week, controls do not have to be run in that
week. However, controls must be run prior to conducting a client test, if it has been a week since the last controls were run
References: Guidelines for the Use of HIV Point of Care (POC) Test Kits in Saskatchewan (most current version)
17
Laboratory Guidelines 2018 Edition cps.sk.ca March 2018
PIPETTES
Verification of pipettes used for quantitative dispensing should occur prior to being placed into service and at least annually. References: CAP Laboratory Accreditation Program. Chemistry and Toxicology Laboratory Checklist. Northfield, IL: 08.17.2016
18
Laboratory Guidelines 2018 Edition cps.sk.ca March 2018
QUALITY CONTROL (QC)
Testing personnel must run and review quality control results to ensure acceptability prior to reporting patient results. Controls are run at least daily, or more frequently if specified by manufacturer. Daily quality control should be run as follows:
Quantitative tests – 2 controls at 2 different concentrations Qualitative tests – a negative and positive control
Controls are run:
Prior to reporting patient results After change of reagents After preventative maintenance Change of instrument component
If an internal quality control process (e.g. electronic/procedural/built-in) is used, the laboratory must have a quality control plan to address the internal quality control process. External Quality Control analyzed:
Every 31 days With each new lot number With new shipments of reagents At a frequency recommended by the test manufacturer
References: CAP Laboratory Accreditation Program. Chemistry and Toxicology Laboratory Checklist. Northfield, IL: 08.17.2016 CAP Laboratory Accreditation Program. Point of Care Testing Laboratory Checklist. Northfield, IL: 08.17.2016 CAP Laboratory Accreditation Program. All Common Checklist. Northfield, IL: 08.17.2016
19
Laboratory Guidelines 2018 Edition cps.sk.ca March 2018
TEMPERATURE MONITORING Temperature dependent equipment (refrigerators, freezers, incubators) containing reagents and/or specimens should be monitored daily. Room temperature should be documented daily. Water baths and heat blocks only need to be checked on days of use. The Laboratory director or designate should review temperature charts monthly. References: CAP Laboratory Accreditation Program. All Common Checklist. Northfield, IL; 08.17.2016
20
Laboratory Guidelines 2018 Edition cps.sk.ca March 2018
THERMOMETERS Thermometric standard devices should be recalibrated, recertified, or replaced prior to the expiry date of guaranteed calibration. Non-certified thermometers used should be checked against a thermometric standard device before initial use and annually. References: CAP Laboratory Accreditation Program. All Common Checklist. Northfield, IL; 08.17.2016
21
Laboratory Guidelines 2018 Edition cps.sk.ca March 2018
VISUAL COLOR DISCRIMINATION Personnel performing testing that require color discrimination should be evaluated for visual color discrimination. This evaluation should be documented. http://colorvisiontesting.com References: CAP Laboratory Accreditation Program. General Laboratory Checklist. Northfield, IL: 08.17.2016

22
Laboratory Guidelines 2018 Edition cps.sk.ca March 2018
ANATOMIC PATHOLOGY
23
Laboratory Guidelines 2018 Edition cps.sk.ca March 2018
SPECIMENS EXEMPT FROM ALL GROSS &/OR MICROSCOPIC PATHOLOGY LABORATORIES Irrespective of the exemptions listed below, gross &/or microscopic examinations will be performed whenever the attending physician requests it, or at the discretion of the pathologist when indicated by gross findings.
SPECIMEN TYPE DISCRETIONARY GROSS &/OR MICROSCOPIC Abdominal pannus Accessory Digits Amputation Bone or cartilage removed from the arthritic joints during joint replacement surgery
Bone segments removed as part of corrective orthopedic procedures (for example: rotator cuff, synostosis repair, spinal fusion)
Bunions and hammer toes Calculi (renal bladder etc.), are sent for chemical analysis and description
(By Chemistry Dept.)
Disc Materials Extraocular muscle from corrective surgical procedures (strabismus repair)
Femoral head removed for prosthesis (if straight forward)
Foreign bodies, such as bullets or medicoloegal evidence that is given directly to law enforcement personnel
Gangrenous and traumatized limbs Intrauterine contraceptive devices without attached soft tissue
Loose bodies (joint) Medical devices such as catheters, gastrostomy tubes, myringotomy tubes, stents and sutures that have not contributed to patient illness, injury or death
Middle ear ossicles Nasal bone and cartilage from rhinoplasty or septoplasty
Orthopedic hardware and other radioopaque mechanical devices provided there is an alternative policy for documentation
Placentas which do not meet the criteria for examination
Prosthetic breast implants Prosthetic cardiac without attached tissue
24
Laboratory Guidelines 2018 Edition cps.sk.ca March 2018
SPECIMEN TYPE DISCRETIONARY GROSS &/OR MICROSCOPIC Rib segments or other tissue removed only for the purpose of gaining surgical access from patients who do no have a history of malignancy
Saphenous vein segments harvested for coronary artery bypass
Skin or other normal tissue removed during cosmetic or reconstructive procedures (blepharoplasty, cleft palate repair, abdominoplasty, rhinectomy or syndactyly repair) that is not contiguous with a lesion and that is taken from a patient who does not have a history of malignancy
Teeth without attached soft tissue Therapeutic radioactive sources Tonsils and adenoids if clinically not suspicious (under 10 yrs old) (over 10 yrs) Torn menicus Varicose veins
25
Laboratory Guidelines 2018 Edition cps.sk.ca March 2018
REMOVAL OF TISSUE, BLOCKS OR SLIDES FROM THE ORIGINAL HOSPITAL SITE Anatomic Pathologists are charged with the responsibility of keeping and guarding the integrity of the ever-growing number of tissue containing paraffin blocks and slides derived from surgical, cytological and autopsy diagnostic services. Documentation and maintenance (tracking) of the continuous care shall ensure quality practice. These specimens must be maintained in orderly files to ensure ready access. There are inevitably increasing demands for slides, blocks or tissues to be retrieved from the original site. *A release form must be provided and retained on file at the original institution for permanent release. Summary Follow HIPA guidelines Ensure there is sufficient material for further work-up Indicate reason for request Return all material as soon as possible The lab is the custodian of tissue, blocks or slides collected. The source of material remains the property of the patient. These are the various suggested categories to be considered: In-Province Consultation • Request may be initiated by the primary physician, surgeon or oncologist for review by local or out-
of-district pathologist. • Request may be initiated by the original signing out pathologist who is responsible for maintaining
records and assuring return of the material. Note: The return of materials to the original site must be documented and a consult report sent to the original pathologist as well as the requesting pathologist. Out-of-Province (recommended slides only) • Request from an originating pathologist to seek out-of-province consultation for diagnostic purpose. • Research or national study groups request specimen be referred to another institution for treatment. • If blocks are requested, cut a set and send the cut set. The originals should be maintained at the
processing site. Educational Consultation • Requests for educational rounds should be restricted to slides; to ensure integrity of patient property. • Request should indicate “for rounds” and materials returned promptly to ensure ongoing patient care. Research • Regulations require pathologists to obtain patient authorization and/or an Institutional Review Board
(Ethics Committee) waiver of informed consent when using any identifiable patient health information for research purposes.
• Requests must ensure the integrity of the patient material. • All materials that have critical diagnostic, prognostic or medical-legal implication may be retained at
the discretion of the releasing institution.
26
Laboratory Guidelines 2018 Edition cps.sk.ca March 2018
• Return all materials as soon as possible. References: Guardians of the Wax…and the Patient. Editorial.; American Journal of Clinical Pathology 1995 104 p 356-7 Use of Human Tissue Blocks for research. Association of Directors of Anatomic and Surgical Pathology. Human Pathology 1996.27 p 519-520
27
Laboratory Guidelines 2018 Edition cps.sk.ca March 2018
CHEMISTRY
28
Laboratory Guidelines 2018 Edition cps.sk.ca March 2018
ESTIMATED GLOMERULAR FILTRATION RATE - eGFR The glomerular filtration rate is the estimated volume of glomerular filtrate that moves from renal glomerular capillaries into the Bowman’s capsule per unit time. Evidence-based clinical practice guidelines suggest that an estimate of GFR (eGFR) provides the best clinical tool to gauge kidney function. The Canadian Society of Nephrology has recommended that laboratories report eGFR routinely for adult patients, in order to detect chronic kidney disease. Serum creatinine results can vary significantly and tend to be ineffective in general practice as an early marker. 24 hr. collection for creatinine clearance is impractical and prone to error. eGFR should be reported on outpatients over the age of 18 years. eGFR has not been validated for use in hospitalized patients and therefore, is not recommended for reporting on inpatients. eGFR is less reliable in,
• patients with near normal eGFR • unstable serum creatinine • acute illness • extremes of body composition (eg. obesity, cachexia) • unusual muscle mass (e.g. marked muscularity, muscle disease, amputation) • pregnancy • age under 18 years or over 70 years • drugs with significant renal toxicity or clearance • drugs affecting creatinine metabolism or clearance • unusual dietary intake (e.g. vegetarians) • other serious comorbid conditions
Summary: Reporting of eGFR is becoming the standard of care in helping identify stage and monitor patients with chronic kidney disease.
eGFR > 60 Normal or slightly decreased kidney function (stages 1 or 2) eGFR 30-59 Moderately decreased kidney function (stage 3) eGFR 15-29 Seriously decreased kidney function (stage 4) eGFR < 15 Kidney failure (stage 5)
• eGFR is frequently used for DRUG DOSING using the Cockroft-Gault equation. eGFR-MDRD has not
been validated for this purpose. • eGFR-MDRD assumes “steady state”. For rapidly changing kidney function, monitor serum creatinine.
(MDRD: Modification of Diet in Renal Disease) • The reported eGFR shall be multiplied by 1.21 for patients of African descent. NOTE: This information is intended for clinicians, patients and allied health professionals. References: www.jasn.org, www.csnscn.ca, www.renal.org http://www.kidney.org/professionals/kdoqi/gfr_calculator.cfm
29
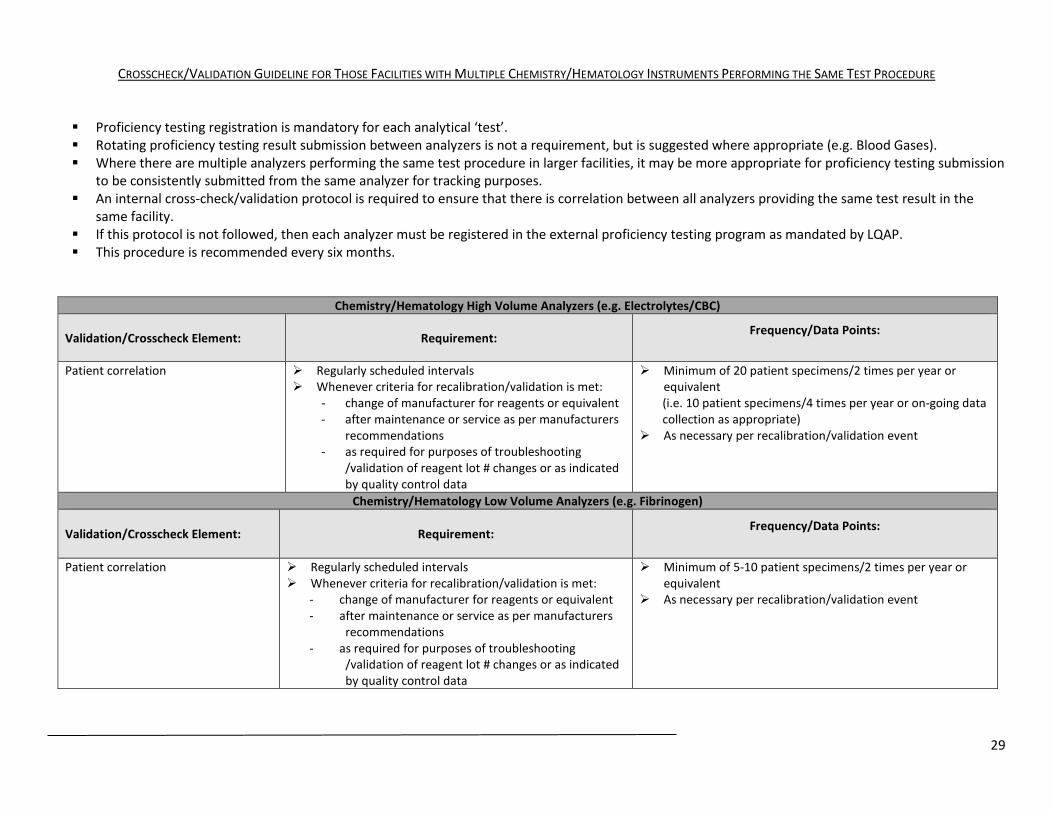
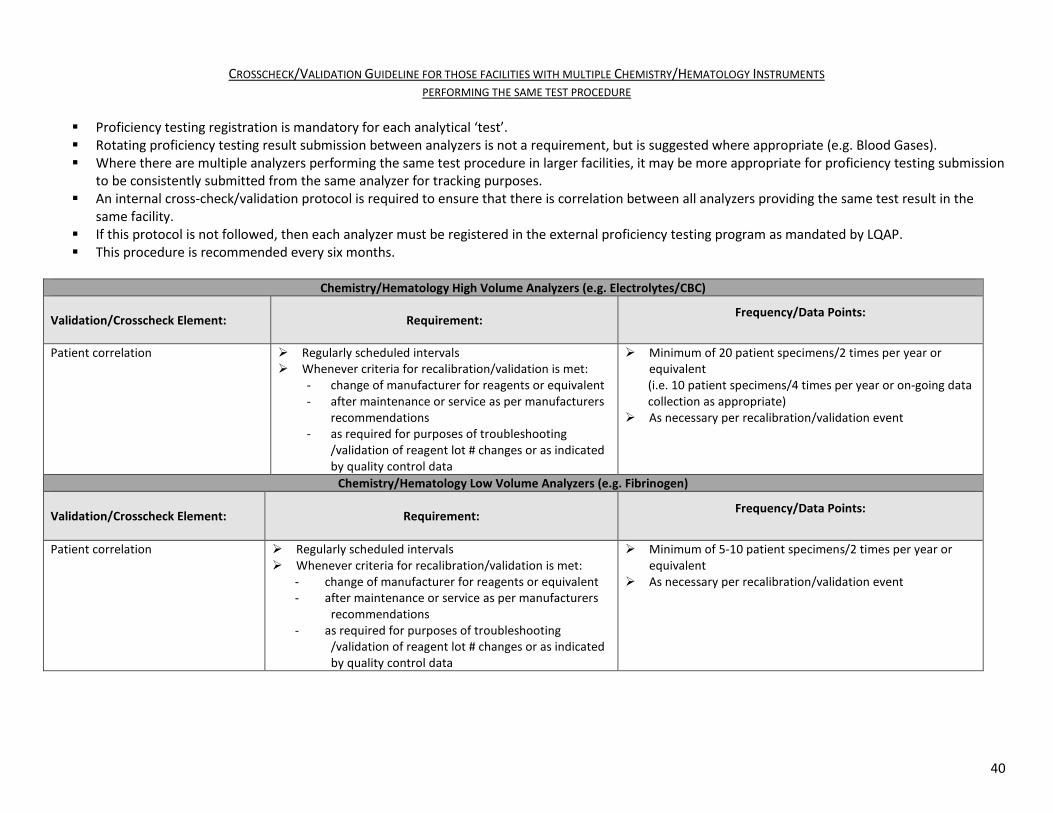
CROSSCHECK/VALIDATION GUIDELINE FOR THOSE FACILITIES WITH MULTIPLE CHEMISTRY/HEMATOLOGY INSTRUMENTS PERFORMING THE SAME TEST PROCEDURE Proficiency testing registration is mandatory for each analytical ‘test’. Rotating proficiency testing result submission between analyzers is not a requirement, but is suggested where appropriate (e.g. Blood Gases). Where there are multiple analyzers performing the same test procedure in larger facilities, it may be more appropriate for proficiency testing submission
to be consistently submitted from the same analyzer for tracking purposes. An internal cross-check/validation protocol is required to ensure that there is correlation between all analyzers providing the same test result in the
same facility. If this protocol is not followed, then each analyzer must be registered in the external proficiency testing program as mandated by LQAP. This procedure is recommended every six months.
Chemistry/Hematology High Volume Analyzers (e.g. Electrolytes/CBC)
Validation/Crosscheck Element: Requirement: Frequency/Data Points:
Patient correlation Regularly scheduled intervals Whenever criteria for recalibration/validation is met:
- change of manufacturer for reagents or equivalent - after maintenance or service as per manufacturers
recommendations - as required for purposes of troubleshooting
/validation of reagent lot # changes or as indicated by quality control data
Minimum of 20 patient specimens/2 times per year or equivalent (i.e. 10 patient specimens/4 times per year or on-going data collection as appropriate)
As necessary per recalibration/validation event
Chemistry/Hematology Low Volume Analyzers (e.g. Fibrinogen)
Validation/Crosscheck Element: Requirement: Frequency/Data Points:
Patient correlation Regularly scheduled intervals Whenever criteria for recalibration/validation is met:
- change of manufacturer for reagents or equivalent - after maintenance or service as per manufacturers
recommendations - as required for purposes of troubleshooting
/validation of reagent lot # changes or as indicated by quality control data
Minimum of 5-10 patient specimens/2 times per year or equivalent
As necessary per recalibration/validation event
30
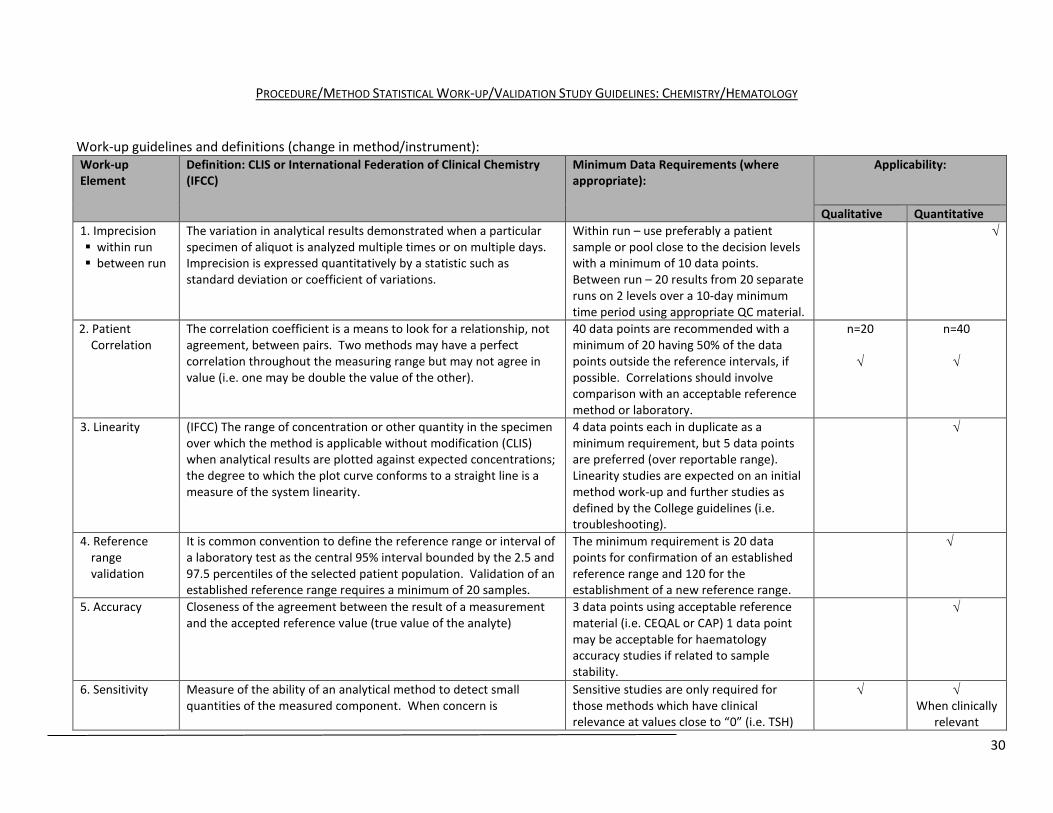
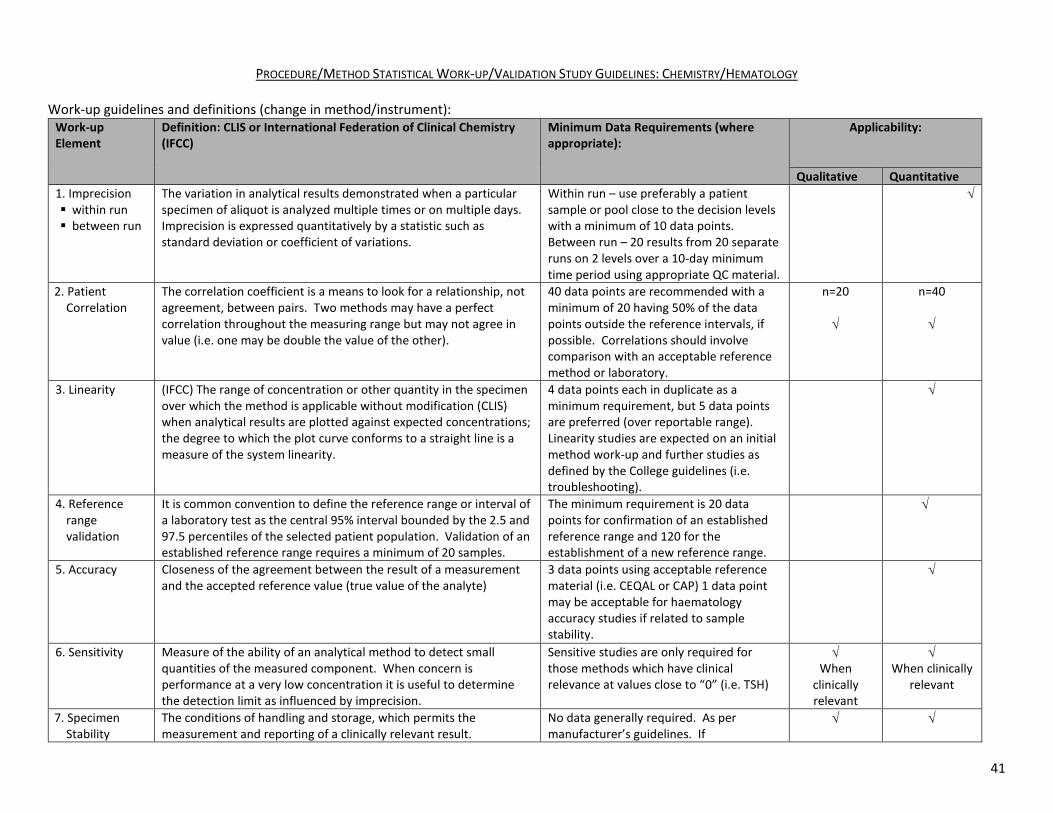
PROCEDURE/METHOD STATISTICAL WORK-UP/VALIDATION STUDY GUIDELINES: CHEMISTRY/HEMATOLOGY
Work-up guidelines and definitions (change in method/instrument): Work-up Element
Definition: CLIS or International Federation of Clinical Chemistry (IFCC)
Minimum Data Requirements (where appropriate):
Applicability:
Qualitative Quantitative 1. Imprecision within run between run
The variation in analytical results demonstrated when a particular specimen of aliquot is analyzed multiple times or on multiple days. Imprecision is expressed quantitatively by a statistic such as standard deviation or coefficient of variations.
Within run – use preferably a patient sample or pool close to the decision levels with a minimum of 10 data points. Between run – 20 results from 20 separate runs on 2 levels over a 10-day minimum time period using appropriate QC material.
√
2. Patient Correlation
The correlation coefficient is a means to look for a relationship, not agreement, between pairs. Two methods may have a perfect correlation throughout the measuring range but may not agree in value (i.e. one may be double the value of the other).
40 data points are recommended with a minimum of 20 having 50% of the data points outside the reference intervals, if possible. Correlations should involve comparison with an acceptable reference method or laboratory.
n=20 √
n=40 √
3. Linearity (IFCC) The range of concentration or other quantity in the specimen over which the method is applicable without modification (CLIS) when analytical results are plotted against expected concentrations; the degree to which the plot curve conforms to a straight line is a measure of the system linearity.
4 data points each in duplicate as a minimum requirement, but 5 data points are preferred (over reportable range). Linearity studies are expected on an initial method work-up and further studies as defined by the College guidelines (i.e. troubleshooting).
√
4. Reference range validation
It is common convention to define the reference range or interval of a laboratory test as the central 95% interval bounded by the 2.5 and 97.5 percentiles of the selected patient population. Validation of an established reference range requires a minimum of 20 samples.
The minimum requirement is 20 data points for confirmation of an established reference range and 120 for the establishment of a new reference range.
√
5. Accuracy Closeness of the agreement between the result of a measurement and the accepted reference value (true value of the analyte)
3 data points using acceptable reference material (i.e. CEQAL or CAP) 1 data point may be acceptable for haematology accuracy studies if related to sample stability.
√
6. Sensitivity Measure of the ability of an analytical method to detect small quantities of the measured component. When concern is
Sensitive studies are only required for those methods which have clinical relevance at values close to “0” (i.e. TSH)
√ √ When clinically
relevant
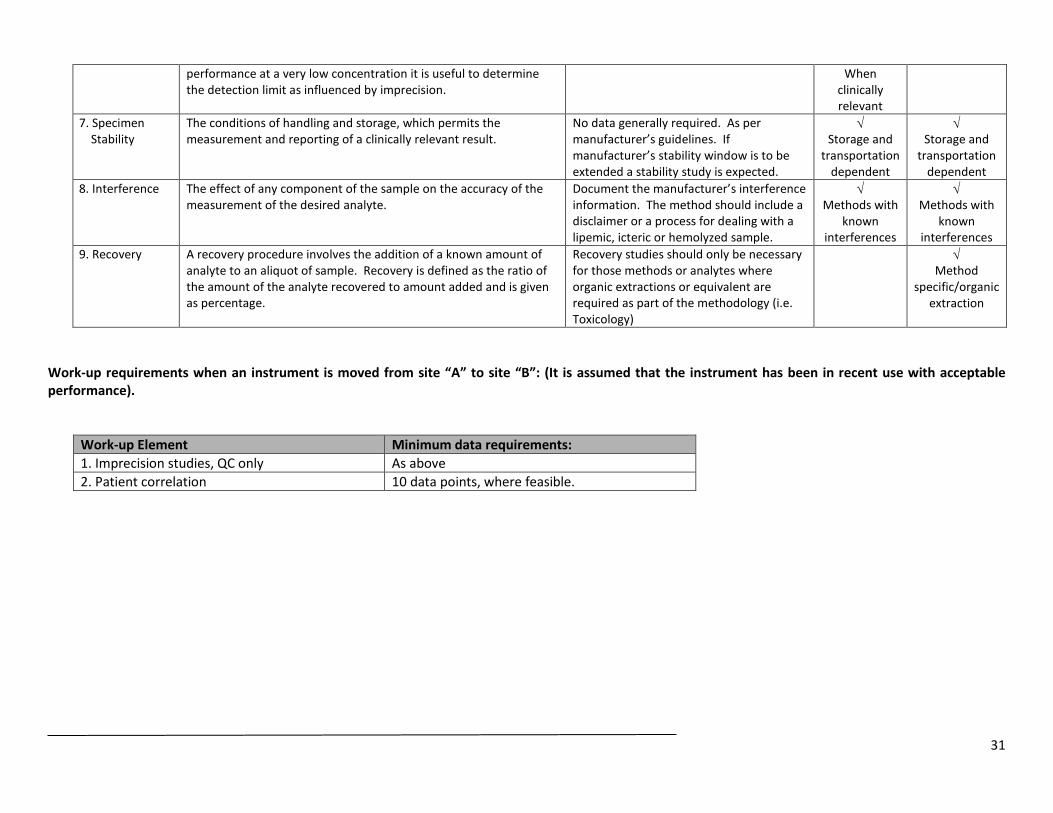
31
performance at a very low concentration it is useful to determine the detection limit as influenced by imprecision.
When clinically relevant
7. Specimen Stability
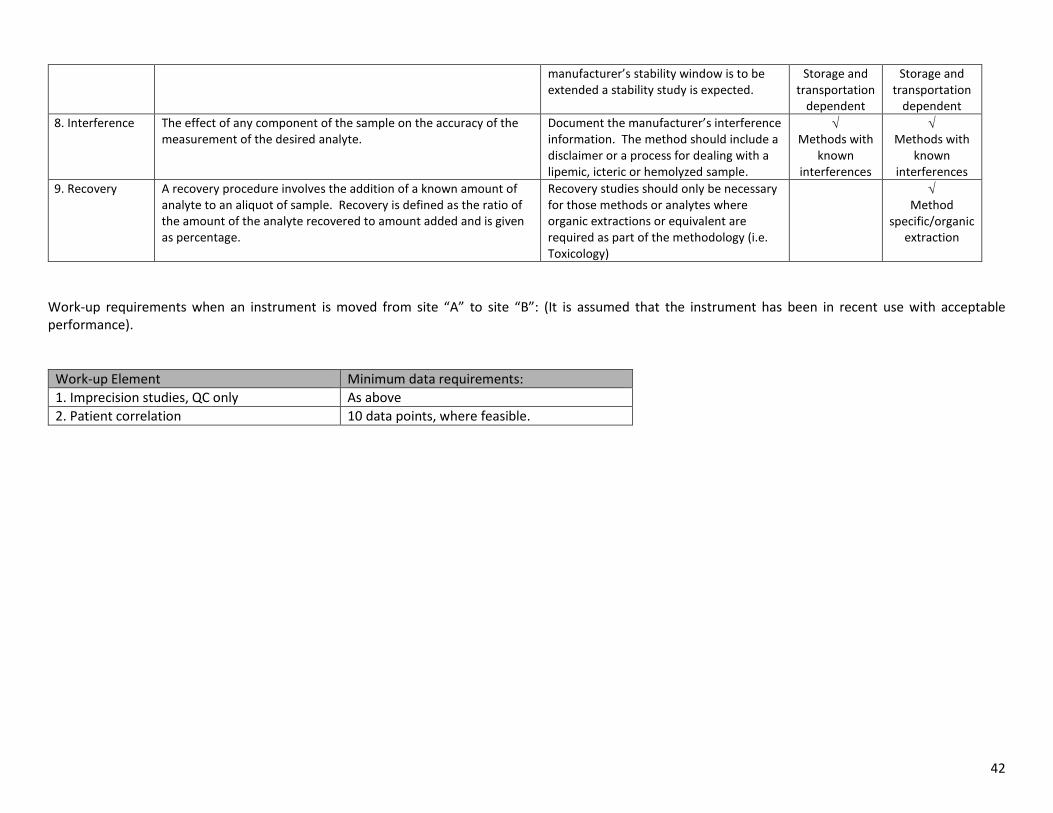
The conditions of handling and storage, which permits the measurement and reporting of a clinically relevant result.
No data generally required. As per manufacturer’s guidelines. If manufacturer’s stability window is to be extended a stability study is expected.
√ Storage and
transportation dependent
√ Storage and
transportation dependent
8. Interference The effect of any component of the sample on the accuracy of the measurement of the desired analyte.
Document the manufacturer’s interference information. The method should include a disclaimer or a process for dealing with a lipemic, icteric or hemolyzed sample.
√ Methods with
known interferences
√ Methods with
known interferences
9. Recovery A recovery procedure involves the addition of a known amount of analyte to an aliquot of sample. Recovery is defined as the ratio of the amount of the analyte recovered to amount added and is given as percentage.
Recovery studies should only be necessary for those methods or analytes where organic extractions or equivalent are required as part of the methodology (i.e. Toxicology)
√ Method
specific/organic extraction
Work-up requirements when an instrument is moved from site “A” to site “B”: (It is assumed that the instrument has been in recent use with acceptable performance).
Work-up Element Minimum data requirements: 1. Imprecision studies, QC only As above 2. Patient correlation 10 data points, where feasible.
32
Laboratory Guidelines 2018 Edition cps.sk.ca March 2018
HEMATOLOGY
33
Laboratory Guidelines 2018 Edition cps.sk.ca March 2018
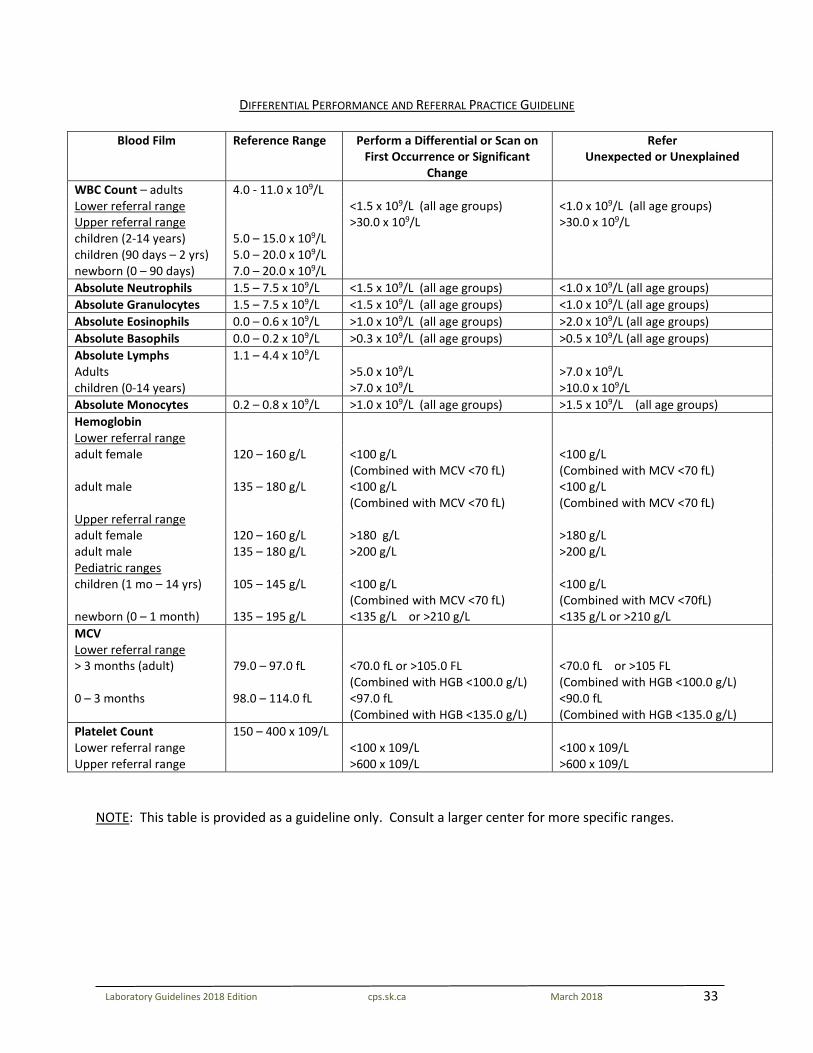
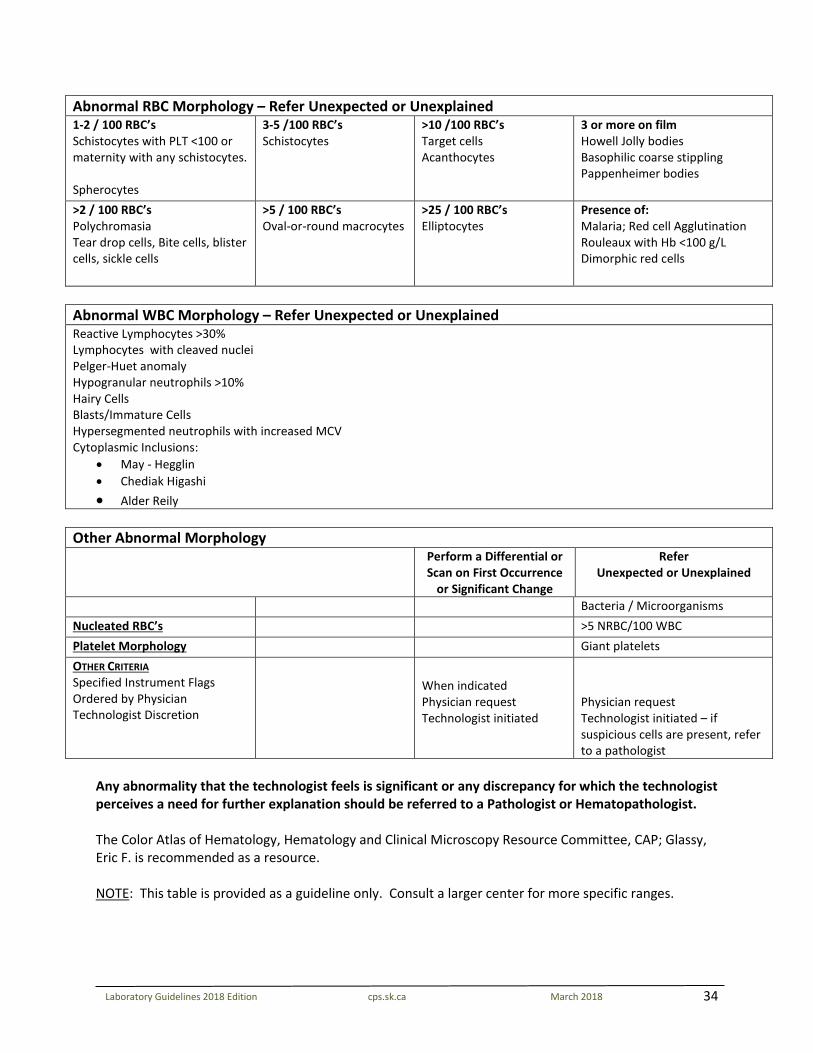
DIFFERENTIAL PERFORMANCE AND REFERRAL PRACTICE GUIDELINE
Blood Film Reference Range Perform a Differential or Scan on First Occurrence or Significant
Change
Refer Unexpected or Unexplained
WBC Count – adults 4.0 - 11.0 x 10⁹/L Lower referral range <1.5 x 10⁹/L (all age groups) <1.0 x 10⁹/L (all age groups) Upper referral range >30.0 x 10⁹/L >30.0 x 10⁹/L children (2-14 years) 5.0 – 15.0 x 10⁹/L children (90 days – 2 yrs) 5.0 – 20.0 x 10⁹/L newborn (0 – 90 days) 7.0 – 20.0 x 10⁹/L Absolute Neutrophils 1.5 – 7.5 x 10⁹/L <1.5 x 10⁹/L (all age groups) <1.0 x 10⁹/L (all age groups) Absolute Granulocytes 1.5 – 7.5 x 10⁹/L <1.5 x 10⁹/L (all age groups) <1.0 x 10⁹/L (all age groups) Absolute Eosinophils 0.0 – 0.6 x 10⁹/L >1.0 x 10⁹/L (all age groups) >2.0 x 10⁹/L (all age groups) Absolute Basophils 0.0 – 0.2 x 10⁹/L >0.3 x 10⁹/L (all age groups) >0.5 x 10⁹/L (all age groups) Absolute Lymphs 1.1 – 4.4 x 10⁹/L Adults >5.0 x 10⁹/L >7.0 x 10⁹/L children (0-14 years) >7.0 x 10⁹/L >10.0 x 10⁹/L Absolute Monocytes 0.2 – 0.8 x 10⁹/L >1.0 x 10⁹/L (all age groups) >1.5 x 10⁹/L (all age groups) Hemoglobin Lower referral range adult female 120 – 160 g/L <100 g/L
(Combined with MCV <70 fL) <100 g/L (Combined with MCV <70 fL)
adult male 135 – 180 g/L <100 g/L (Combined with MCV <70 fL)
<100 g/L (Combined with MCV <70 fL)
Upper referral range adult female 120 – 160 g/L >180 g/L >180 g/L adult male 135 – 180 g/L >200 g/L >200 g/L Pediatric ranges children (1 mo – 14 yrs) 105 – 145 g/L <100 g/L
(Combined with MCV <70 fL) <100 g/L (Combined with MCV <70fL)
newborn (0 – 1 month) 135 – 195 g/L <135 g/L or >210 g/L <135 g/L or >210 g/L MCV Lower referral range > 3 months (adult) 79.0 – 97.0 fL <70.0 fL or >105.0 FL
(Combined with HGB <100.0 g/L) <70.0 fL or >105 FL (Combined with HGB <100.0 g/L)
0 – 3 months 98.0 – 114.0 fL <97.0 fL (Combined with HGB <135.0 g/L)
<90.0 fL (Combined with HGB <135.0 g/L)
Platelet Count Lower referral range Upper referral range
150 – 400 x 109/L <100 x 109/L >600 x 109/L
<100 x 109/L >600 x 109/L
NOTE: This table is provided as a guideline only. Consult a larger center for more specific ranges.
34
Laboratory Guidelines 2018 Edition cps.sk.ca March 2018
Abnormal RBC Morphology – Refer Unexpected or Unexplained 1-2 / 100 RBC’s Schistocytes with PLT <100 or maternity with any schistocytes. Spherocytes
3-5 /100 RBC’s Schistocytes
>10 /100 RBC’s Target cells Acanthocytes
3 or more on film Howell Jolly bodies Basophilic coarse stippling Pappenheimer bodies
>2 / 100 RBC’s Polychromasia Tear drop cells, Bite cells, blister cells, sickle cells
>5 / 100 RBC’s Oval-or-round macrocytes
>25 / 100 RBC’s Elliptocytes
Presence of: Malaria; Red cell Agglutination Rouleaux with Hb <100 g/L Dimorphic red cells
Abnormal WBC Morphology – Refer Unexpected or Unexplained Reactive Lymphocytes >30% Lymphocytes with cleaved nuclei Pelger-Huet anomaly Hypogranular neutrophils >10% Hairy Cells Blasts/Immature Cells Hypersegmented neutrophils with increased MCV Cytoplasmic Inclusions:
• May - Hegglin • Chediak Higashi • Alder Reily
Other Abnormal Morphology Perform a Differential or
Scan on First Occurrence or Significant Change
Refer Unexpected or Unexplained
Bacteria / Microorganisms Nucleated RBC’s >5 NRBC/100 WBC Platelet Morphology Giant platelets OTHER CRITERIA Specified Instrument Flags Ordered by Physician Technologist Discretion
When indicated Physician request Technologist initiated
Physician request Technologist initiated – if suspicious cells are present, refer to a pathologist
Any abnormality that the technologist feels is significant or any discrepancy for which the technologist perceives a need for further explanation should be referred to a Pathologist or Hematopathologist. The Color Atlas of Hematology, Hematology and Clinical Microscopy Resource Committee, CAP; Glassy, Eric F. is recommended as a resource. NOTE: This table is provided as a guideline only. Consult a larger center for more specific ranges.
35
Laboratory Guidelines 2018 Edition cps.sk.ca March 2018
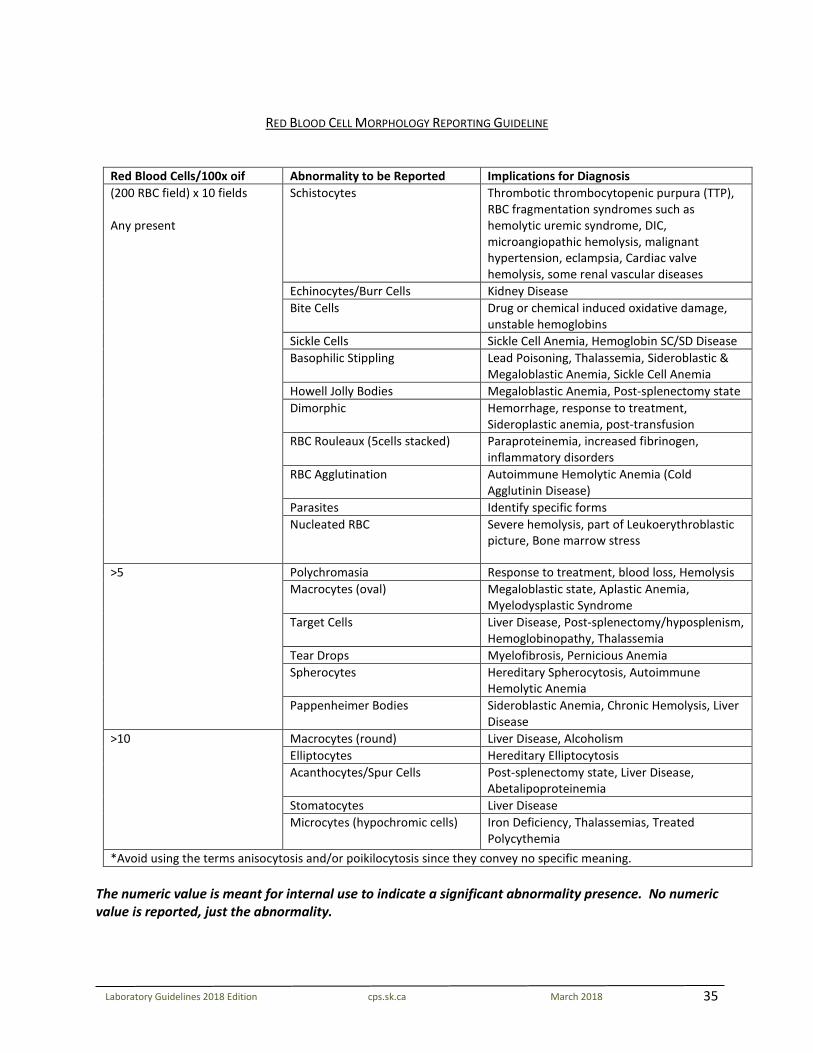
RED BLOOD CELL MORPHOLOGY REPORTING GUIDELINE
Red Blood Cells/100x oif Abnormality to be Reported Implications for Diagnosis (200 RBC field) x 10 fields Any present
Schistocytes Thrombotic thrombocytopenic purpura (TTP), RBC fragmentation syndromes such as hemolytic uremic syndrome, DIC, microangiopathic hemolysis, malignant hypertension, eclampsia, Cardiac valve hemolysis, some renal vascular diseases
Echinocytes/Burr Cells Kidney Disease Bite Cells Drug or chemical induced oxidative damage,
unstable hemoglobins Sickle Cells Sickle Cell Anemia, Hemoglobin SC/SD Disease Basophilic Stippling Lead Poisoning, Thalassemia, Sideroblastic &
Megaloblastic Anemia, Sickle Cell Anemia Howell Jolly Bodies Megaloblastic Anemia, Post-splenectomy state Dimorphic Hemorrhage, response to treatment,
Sideroplastic anemia, post-transfusion RBC Rouleaux (5cells stacked) Paraproteinemia, increased fibrinogen,
inflammatory disorders RBC Agglutination Autoimmune Hemolytic Anemia (Cold
Agglutinin Disease) Parasites Identify specific forms Nucleated RBC Severe hemolysis, part of Leukoerythroblastic
picture, Bone marrow stress
>5 Polychromasia Response to treatment, blood loss, Hemolysis Macrocytes (oval) Megaloblastic state, Aplastic Anemia,
Myelodysplastic Syndrome Target Cells Liver Disease, Post-splenectomy/hyposplenism,
Hemoglobinopathy, Thalassemia Tear Drops Myelofibrosis, Pernicious Anemia Spherocytes Hereditary Spherocytosis, Autoimmune
Hemolytic Anemia Pappenheimer Bodies Sideroblastic Anemia, Chronic Hemolysis, Liver
Disease >10 Macrocytes (round) Liver Disease, Alcoholism
Elliptocytes Hereditary Elliptocytosis Acanthocytes/Spur Cells Post-splenectomy state, Liver Disease,
Abetalipoproteinemia Stomatocytes Liver Disease Microcytes (hypochromic cells) Iron Deficiency, Thalassemias, Treated
Polycythemia *Avoid using the terms anisocytosis and/or poikilocytosis since they convey no specific meaning.
The numeric value is meant for internal use to indicate a significant abnormality presence. No numeric value is reported, just the abnormality.
36
Laboratory Guidelines 2018 Edition cps.sk.ca March 2018
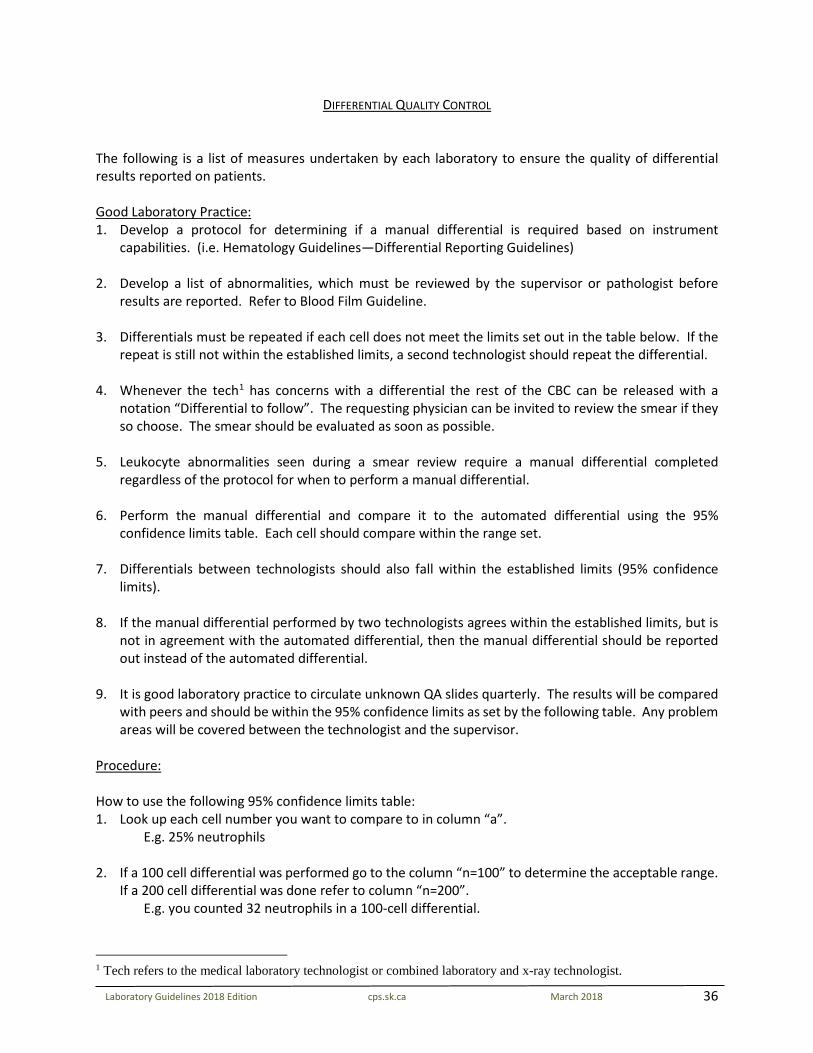
DIFFERENTIAL QUALITY CONTROL The following is a list of measures undertaken by each laboratory to ensure the quality of differential results reported on patients. Good Laboratory Practice: 1. Develop a protocol for determining if a manual differential is required based on instrument
capabilities. (i.e. Hematology Guidelines—Differential Reporting Guidelines) 2. Develop a list of abnormalities, which must be reviewed by the supervisor or pathologist before
results are reported. Refer to Blood Film Guideline. 3. Differentials must be repeated if each cell does not meet the limits set out in the table below. If the
repeat is still not within the established limits, a second technologist should repeat the differential. 4. Whenever the tech1 has concerns with a differential the rest of the CBC can be released with a
notation “Differential to follow”. The requesting physician can be invited to review the smear if they so choose. The smear should be evaluated as soon as possible.
5. Leukocyte abnormalities seen during a smear review require a manual differential completed
regardless of the protocol for when to perform a manual differential. 6. Perform the manual differential and compare it to the automated differential using the 95%
confidence limits table. Each cell should compare within the range set. 7. Differentials between technologists should also fall within the established limits (95% confidence
limits). 8. If the manual differential performed by two technologists agrees within the established limits, but is
not in agreement with the automated differential, then the manual differential should be reported out instead of the automated differential.
9. It is good laboratory practice to circulate unknown QA slides quarterly. The results will be compared
with peers and should be within the 95% confidence limits as set by the following table. Any problem areas will be covered between the technologist and the supervisor.
Procedure: How to use the following 95% confidence limits table: 1. Look up each cell number you want to compare to in column “a”.
E.g. 25% neutrophils
2. If a 100 cell differential was performed go to the column “n=100” to determine the acceptable range. If a 200 cell differential was done refer to column “n=200”.
E.g. you counted 32 neutrophils in a 100-cell differential.
1 Tech refers to the medical laboratory technologist or combined laboratory and x-ray technologist.
37
Laboratory Guidelines 2018 Edition cps.sk.ca March 2018
3. Determine acceptability of the differential by checking if the number you counted for a certain cell falls within the stated range.
E.g. Stated range is 16-35%; you are within this range. 4. Repeat for each cell type. 5. Determine acceptability of each cell line by comparing automated to manual differential. For the
neutrophils/granulocytes, segmented neutrophils, band neutrophils and other neutrophil precursors must be added together and for lymphocytes, reactive lymphocytes and lymphocytes must be added together.
E.g. 77 segs and 15 bands = 92% 6. You must be within this range, or the differential must be repeated. Example: The automated or technologist differential indicated the following differential and the acceptable range for each number was looked up in “n=100” column: Neu: 70 acceptable range 60-79 Lymph: 15 “ “ 8-24 Mono: 7 “ “ 1-12 Eos: 3 “ “ 0-9 A 100 cell differential is completed by another technologist and based on the acceptable range the results are as follows: Neu: 52 not within limits Lymph: 27 not within limits Mono: 12 within limits Eos: 7 within limits Baso: 2 within limits This manual differential would have to be repeated.
38
Laboratory Guidelines 2018 Edition cps.sk.ca March 2018
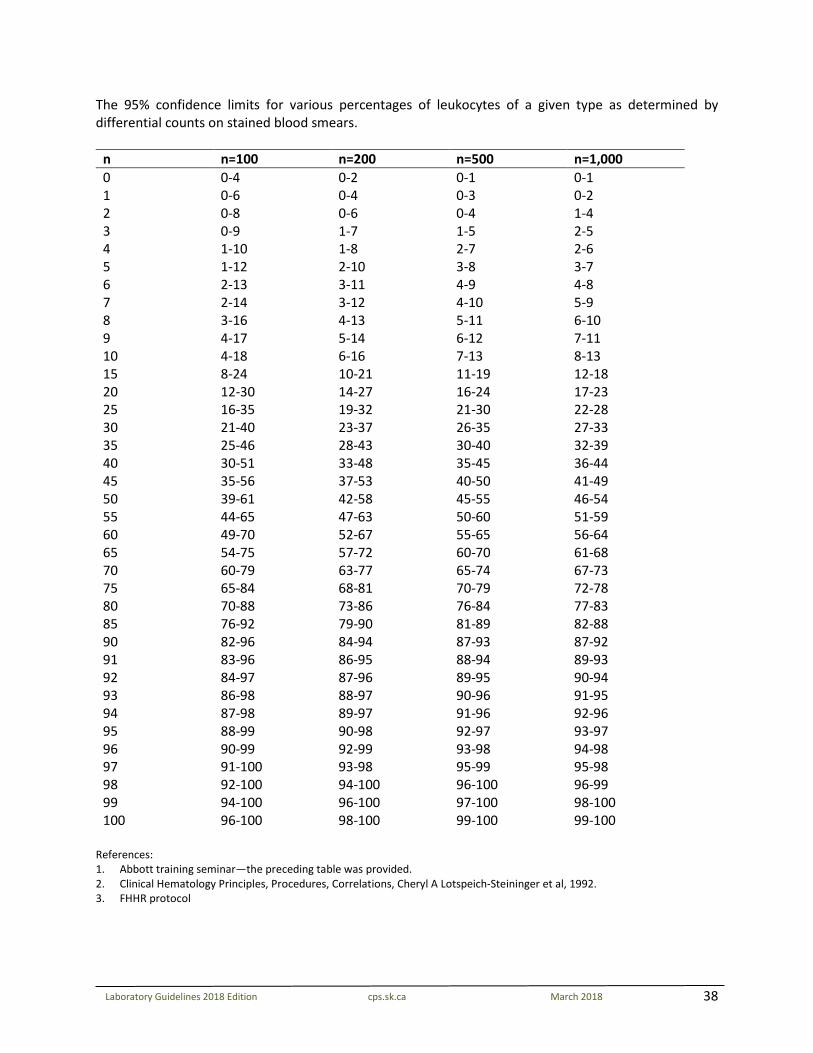
The 95% confidence limits for various percentages of leukocytes of a given type as determined by differential counts on stained blood smears.
n n=100 n=200 n=500 n=1,000 0 0-4 0-2 0-1 0-1 1 0-6 0-4 0-3 0-2 2 0-8 0-6 0-4 1-4 3 0-9 1-7 1-5 2-5 4 1-10 1-8 2-7 2-6 5 1-12 2-10 3-8 3-7 6 2-13 3-11 4-9 4-8 7 2-14 3-12 4-10 5-9 8 3-16 4-13 5-11 6-10 9 4-17 5-14 6-12 7-11 10 4-18 6-16 7-13 8-13 15 8-24 10-21 11-19 12-18 20 12-30 14-27 16-24 17-23 25 16-35 19-32 21-30 22-28 30 21-40 23-37 26-35 27-33 35 25-46 28-43 30-40 32-39 40 30-51 33-48 35-45 36-44 45 35-56 37-53 40-50 41-49 50 39-61 42-58 45-55 46-54 55 44-65 47-63 50-60 51-59 60 49-70 52-67 55-65 56-64 65 54-75 57-72 60-70 61-68 70 60-79 63-77 65-74 67-73 75 65-84 68-81 70-79 72-78 80 70-88 73-86 76-84 77-83 85 76-92 79-90 81-89 82-88 90 82-96 84-94 87-93 87-92 91 83-96 86-95 88-94 89-93 92 84-97 87-96 89-95 90-94 93 86-98 88-97 90-96 91-95 94 87-98 89-97 91-96 92-96 95 88-99 90-98 92-97 93-97 96 90-99 92-99 93-98 94-98 97 91-100 93-98 95-99 95-98 98 92-100 94-100 96-100 96-99 99 94-100 96-100 97-100 98-100 100 96-100 98-100 99-100 99-100
References: 1. Abbott training seminar—the preceding table was provided. 2. Clinical Hematology Principles, Procedures, Correlations, Cheryl A Lotspeich-Steininger et al, 1992. 3. FHHR protocol
39
Laboratory Guidelines 2018 Edition cps.sk.ca March 2018
SMUDGE CELLS Distinguished by their naked amorphous nuclear chromatin material, smudge cells were initially described as white blood cells with broken-down nuclei in patients with chronic lymphocytic leukemia. Subsequently, these nuclear shadows have most often been referred to as smudge cells, but the term basket cells is used synonymously. The mechanism is often associated primarily with traumatic disruption of cells during blood film preparation. In the process, the cell membrane ruptures and when viewed under a microscope, what remains looks like a smudge, hence the term, smudge cells. To ensure reliability of results, it is important to understand the effects of variables associated with smudge cell formation, particularly the blood film preparation. Thus, the angle and the degree of incline of the slide spreader, the type of slide spreader (sharp or smooth), the cleanliness of the slides, and the overall quality of the blood films cannot be overemphasized. For minimal morphologic alterations, blood films should be made within three hours and not more than twelve hours after collection. It is recommended to include smudge cells in the differential as an absolute count, especially when the smudge cell numbers are noticeably increased. This identifies a more appropriate count because smudge cells are actually lymphocyte artifacts. It also avoids the need for repeating or verifying abnormal counts by the time - consuming albumin – treated method. Education is needed (for the ordering physicians especially) to eliminate the risk of misinterpreting this smudge cell count as a new cell type. Criteria for Reporting Smudge Cells Absolute lymphocyte count should be greater than 5.0 x10⁹/L. Patient age should be more than 30 years*. Smudge cells should be reported if greater than 10 per 100 leukocytes. Report smudge cells in absolute numbers. *Although CLL is not often diagnosed in patients under the age of 40, patients over 30 years of age should be considered potentially at risk. CLL is rare in patients under 30 years of age. *In children (18 & under), the smudge cells are not counted as part of the differential. However, the presence of smudge cells may be noted on the report. *Smudge cells are present in those candidates for which definitive diagnostic criteria are well established. Examples include: CLL & Acute Leukemia.
40
CROSSCHECK/VALIDATION GUIDELINE FOR THOSE FACILITIES WITH MULTIPLE CHEMISTRY/HEMATOLOGY INSTRUMENTS PERFORMING THE SAME TEST PROCEDURE
Proficiency testing registration is mandatory for each analytical ‘test’. Rotating proficiency testing result submission between analyzers is not a requirement, but is suggested where appropriate (e.g. Blood Gases). Where there are multiple analyzers performing the same test procedure in larger facilities, it may be more appropriate for proficiency testing submission
to be consistently submitted from the same analyzer for tracking purposes. An internal cross-check/validation protocol is required to ensure that there is correlation between all analyzers providing the same test result in the
same facility. If this protocol is not followed, then each analyzer must be registered in the external proficiency testing program as mandated by LQAP. This procedure is recommended every six months.
Chemistry/Hematology High Volume Analyzers (e.g. Electrolytes/CBC)
Validation/Crosscheck Element: Requirement: Frequency/Data Points:
Patient correlation Regularly scheduled intervals Whenever criteria for recalibration/validation is met:
- change of manufacturer for reagents or equivalent - after maintenance or service as per manufacturers
recommendations - as required for purposes of troubleshooting
/validation of reagent lot # changes or as indicated by quality control data
Minimum of 20 patient specimens/2 times per year or equivalent (i.e. 10 patient specimens/4 times per year or on-going data collection as appropriate)
As necessary per recalibration/validation event
Chemistry/Hematology Low Volume Analyzers (e.g. Fibrinogen)
Validation/Crosscheck Element: Requirement: Frequency/Data Points:
Patient correlation Regularly scheduled intervals Whenever criteria for recalibration/validation is met:
- change of manufacturer for reagents or equivalent - after maintenance or service as per manufacturers
recommendations - as required for purposes of troubleshooting
/validation of reagent lot # changes or as indicated by quality control data
Minimum of 5-10 patient specimens/2 times per year or equivalent
As necessary per recalibration/validation event
41
PROCEDURE/METHOD STATISTICAL WORK-UP/VALIDATION STUDY GUIDELINES: CHEMISTRY/HEMATOLOGY
Work-up guidelines and definitions (change in method/instrument): Work-up Element
Definition: CLIS or International Federation of Clinical Chemistry (IFCC)
Minimum Data Requirements (where appropriate):
Applicability:
Qualitative Quantitative 1. Imprecision within run between run
The variation in analytical results demonstrated when a particular specimen of aliquot is analyzed multiple times or on multiple days. Imprecision is expressed quantitatively by a statistic such as standard deviation or coefficient of variations.
Within run – use preferably a patient sample or pool close to the decision levels with a minimum of 10 data points. Between run – 20 results from 20 separate runs on 2 levels over a 10-day minimum time period using appropriate QC material.
√
2. Patient Correlation
The correlation coefficient is a means to look for a relationship, not agreement, between pairs. Two methods may have a perfect correlation throughout the measuring range but may not agree in value (i.e. one may be double the value of the other).
40 data points are recommended with a minimum of 20 having 50% of the data points outside the reference intervals, if possible. Correlations should involve comparison with an acceptable reference method or laboratory.
n=20 √
n=40 √
3. Linearity (IFCC) The range of concentration or other quantity in the specimen over which the method is applicable without modification (CLIS) when analytical results are plotted against expected concentrations; the degree to which the plot curve conforms to a straight line is a measure of the system linearity.
4 data points each in duplicate as a minimum requirement, but 5 data points are preferred (over reportable range). Linearity studies are expected on an initial method work-up and further studies as defined by the College guidelines (i.e. troubleshooting).
√
4. Reference range validation
It is common convention to define the reference range or interval of a laboratory test as the central 95% interval bounded by the 2.5 and 97.5 percentiles of the selected patient population. Validation of an established reference range requires a minimum of 20 samples.
The minimum requirement is 20 data points for confirmation of an established reference range and 120 for the establishment of a new reference range.
√
5. Accuracy Closeness of the agreement between the result of a measurement and the accepted reference value (true value of the analyte)
3 data points using acceptable reference material (i.e. CEQAL or CAP) 1 data point may be acceptable for haematology accuracy studies if related to sample stability.
√
6. Sensitivity Measure of the ability of an analytical method to detect small quantities of the measured component. When concern is performance at a very low concentration it is useful to determine the detection limit as influenced by imprecision.
Sensitive studies are only required for those methods which have clinical relevance at values close to “0” (i.e. TSH)
√ When
clinically relevant
√ When clinically
relevant
7. Specimen Stability
The conditions of handling and storage, which permits the measurement and reporting of a clinically relevant result.
No data generally required. As per manufacturer’s guidelines. If
√ √
42
manufacturer’s stability window is to be extended a stability study is expected.
Storage and transportation
dependent
Storage and transportation
dependent 8. Interference The effect of any component of the sample on the accuracy of the
measurement of the desired analyte. Document the manufacturer’s interference information. The method should include a disclaimer or a process for dealing with a lipemic, icteric or hemolyzed sample.
√ Methods with
known interferences
√ Methods with
known interferences
9. Recovery A recovery procedure involves the addition of a known amount of analyte to an aliquot of sample. Recovery is defined as the ratio of the amount of the analyte recovered to amount added and is given as percentage.
Recovery studies should only be necessary for those methods or analytes where organic extractions or equivalent are required as part of the methodology (i.e. Toxicology)
√ Method
specific/organic extraction
Work-up requirements when an instrument is moved from site “A” to site “B”: (It is assumed that the instrument has been in recent use with acceptable performance).
Work-up Element Minimum data requirements: 1. Imprecision studies, QC only As above 2. Patient correlation 10 data points, where feasible.
43
Laboratory Guidelines 2018 Edition cps.sk.ca March 2018
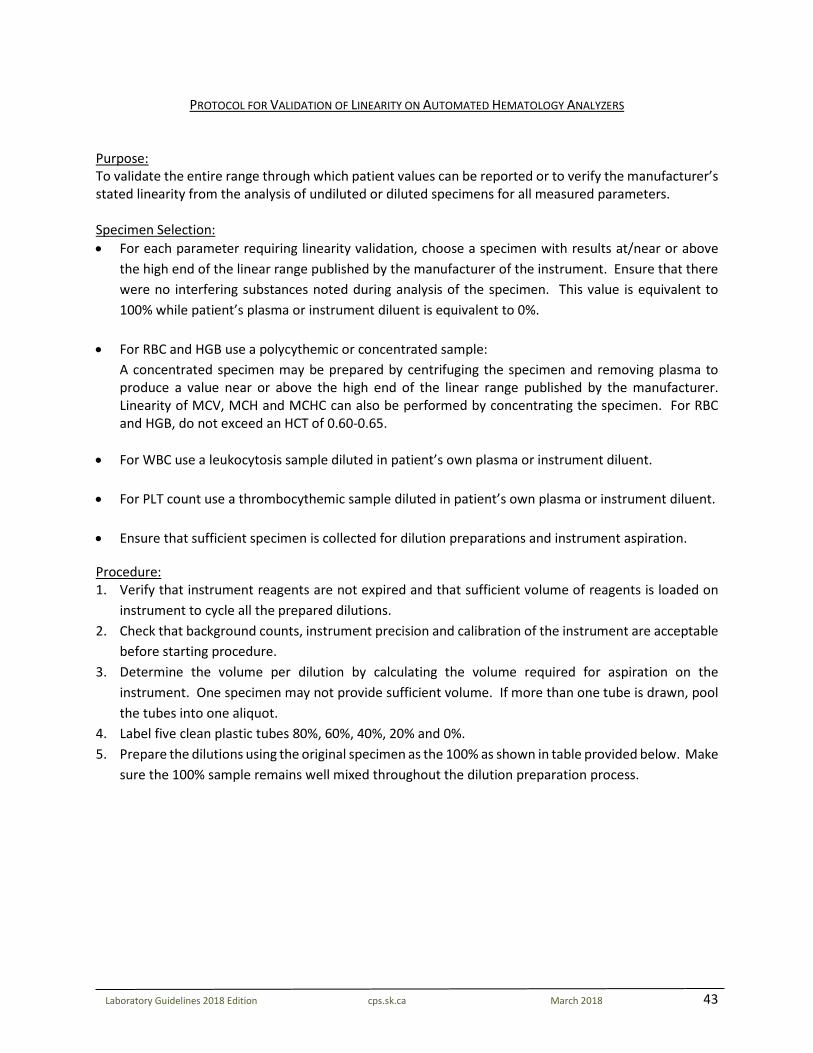
PROTOCOL FOR VALIDATION OF LINEARITY ON AUTOMATED HEMATOLOGY ANALYZERS Purpose: To validate the entire range through which patient values can be reported or to verify the manufacturer’s stated linearity from the analysis of undiluted or diluted specimens for all measured parameters. Specimen Selection: • For each parameter requiring linearity validation, choose a specimen with results at/near or above
the high end of the linear range published by the manufacturer of the instrument. Ensure that there were no interfering substances noted during analysis of the specimen. This value is equivalent to 100% while patient’s plasma or instrument diluent is equivalent to 0%.
• For RBC and HGB use a polycythemic or concentrated sample: A concentrated specimen may be prepared by centrifuging the specimen and removing plasma to
produce a value near or above the high end of the linear range published by the manufacturer. Linearity of MCV, MCH and MCHC can also be performed by concentrating the specimen. For RBC and HGB, do not exceed an HCT of 0.60-0.65.
• For WBC use a leukocytosis sample diluted in patient’s own plasma or instrument diluent. • For PLT count use a thrombocythemic sample diluted in patient’s own plasma or instrument diluent. • Ensure that sufficient specimen is collected for dilution preparations and instrument aspiration.
Procedure: 1. Verify that instrument reagents are not expired and that sufficient volume of reagents is loaded on
instrument to cycle all the prepared dilutions. 2. Check that background counts, instrument precision and calibration of the instrument are acceptable
before starting procedure. 3. Determine the volume per dilution by calculating the volume required for aspiration on the
instrument. One specimen may not provide sufficient volume. If more than one tube is drawn, pool the tubes into one aliquot.
4. Label five clean plastic tubes 80%, 60%, 40%, 20% and 0%. 5. Prepare the dilutions using the original specimen as the 100% as shown in table provided below. Make
sure the 100% sample remains well mixed throughout the dilution preparation process.
44
Laboratory Guidelines 2018 Edition cps.sk.ca March 2018
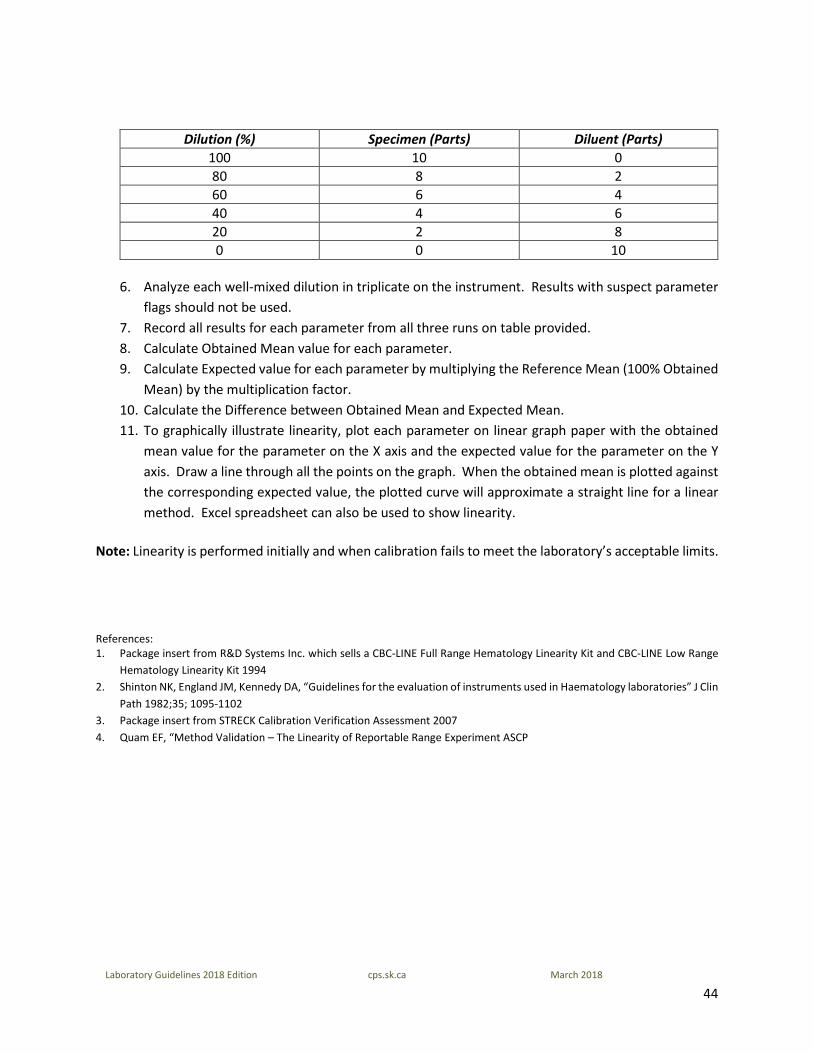
Dilution (%) Specimen (Parts) Diluent (Parts) 100 10 0 80 8 2 60 6 4 40 4 6 20 2 8 0 0 10
6. Analyze each well-mixed dilution in triplicate on the instrument. Results with suspect parameter
flags should not be used. 7. Record all results for each parameter from all three runs on table provided. 8. Calculate Obtained Mean value for each parameter. 9. Calculate Expected value for each parameter by multiplying the Reference Mean (100% Obtained
Mean) by the multiplication factor. 10. Calculate the Difference between Obtained Mean and Expected Mean. 11. To graphically illustrate linearity, plot each parameter on linear graph paper with the obtained
mean value for the parameter on the X axis and the expected value for the parameter on the Y axis. Draw a line through all the points on the graph. When the obtained mean is plotted against the corresponding expected value, the plotted curve will approximate a straight line for a linear method. Excel spreadsheet can also be used to show linearity.
Note: Linearity is performed initially and when calibration fails to meet the laboratory’s acceptable limits. References: 1. Package insert from R&D Systems Inc. which sells a CBC-LINE Full Range Hematology Linearity Kit and CBC-LINE Low Range
Hematology Linearity Kit 1994 2. Shinton NK, England JM, Kennedy DA, “Guidelines for the evaluation of instruments used in Haematology laboratories” J Clin
Path 1982;35; 1095-1102 3. Package insert from STRECK Calibration Verification Assessment 2007 4. Quam EF, “Method Validation – The Linearity of Reportable Range Experiment ASCP
45
Laboratory Guidelines 2018 Edition cps.sk.ca March 2018
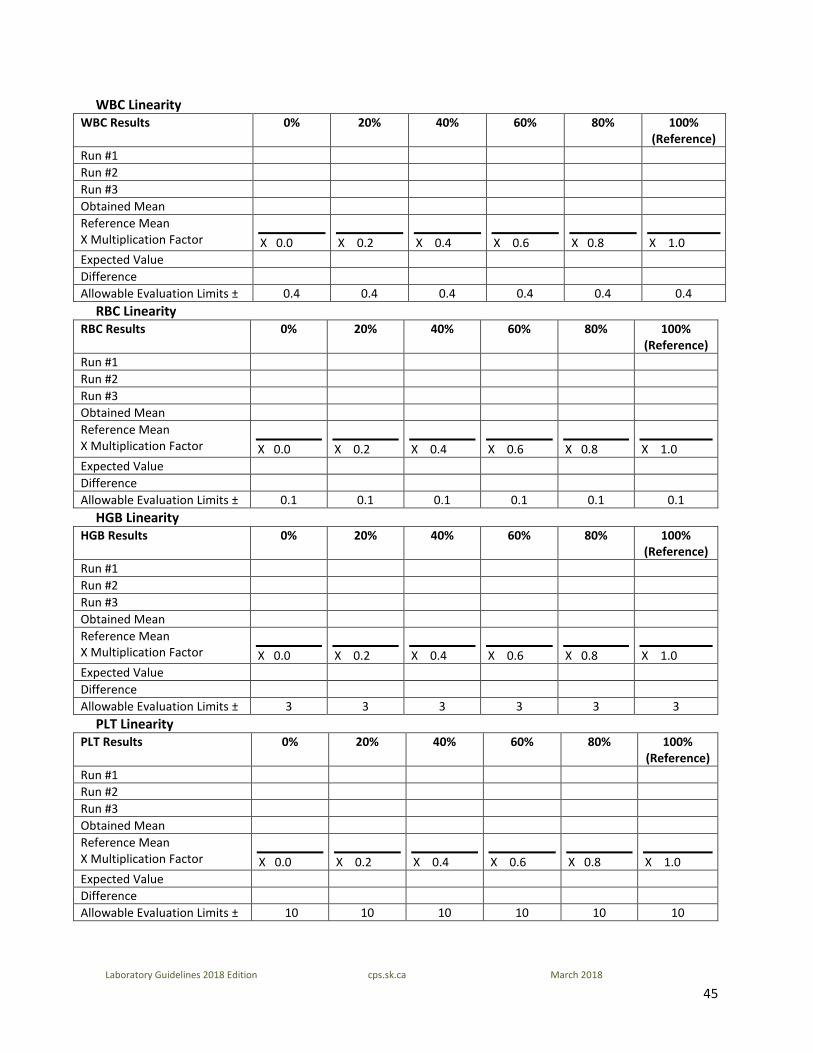
WBC Linearity WBC Results 0% 20% 40% 60% 80% 100%
(Reference) Run #1 Run #2 Run #3 Obtained Mean Reference Mean X Multiplication Factor
X 0.0
X 0.2
X 0.4
X 0.6
X 0.8
X 1.0
Expected Value Difference Allowable Evaluation Limits ± 0.4 0.4 0.4 0.4 0.4 0.4
RBC Linearity RBC Results 0% 20% 40% 60% 80% 100%
(Reference) Run #1 Run #2 Run #3 Obtained Mean Reference Mean X Multiplication Factor
X 0.0
X 0.2
X 0.4
X 0.6
X 0.8
X 1.0
Expected Value Difference Allowable Evaluation Limits ± 0.1 0.1 0.1 0.1 0.1 0.1
HGB Linearity HGB Results 0% 20% 40% 60% 80% 100%
(Reference) Run #1 Run #2 Run #3 Obtained Mean Reference Mean X Multiplication Factor
X 0.0
X 0.2
X 0.4
X 0.6
X 0.8
X 1.0
Expected Value Difference Allowable Evaluation Limits ± 3 3 3 3 3 3
PLT Linearity PLT Results 0% 20% 40% 60% 80% 100%
(Reference) Run #1 Run #2 Run #3 Obtained Mean Reference Mean X Multiplication Factor
X 0.0
X 0.2
X 0.4
X 0.6
X 0.8
X 1.0
Expected Value Difference Allowable Evaluation Limits ± 10 10 10 10 10 10
46
Laboratory Guidelines 2018 Edition cps.sk.ca March 2018
PROCEDURE FOR WBC ESTIMATE
WBC Estimation is to be used for cases in which the instrument flags invalid data or suspect WBC populations and for which you cannot obtain a valid WBC in any mode. 1. Examine the specimen for presence of a clot, strands of fibrin, or gross hemolysis before you proceed. 2. Next examine the histograms for likely causes of interference. Histogram review may help you decide
which version to use if it is necessary to issue a partial CBC report. (If the HGB or PLT results are critical or STAT, these should not be held back.) Most interferences are visible in the lower region of your first WBC histogram, e.g. resistant RBC, NRBC, megathrombocytes, clumped platelets, fibrin, etc. In some cases, the analyzer will incorrectly include these interferences in the lymphocytes. This results in both a falsely elevated WBC and lymphocyte count. Rule of thumb: the lowest WBC from the analyzer is usually the most correct.
3. Make and stain two blood smears. 4. Two techs shall do an estimate, each using a separate slide (if a second tech is not available, one tech
can do two estimates, one on each slide) a. Examine the smears under 10x objective for even distribution of WBC before proceeding. If there
is a ridge or layer of WBC in the tails, the estimate will be invalid. Re-make the slide. b. Choose an area from the tails, where the RBC are evenly spread, or just beginning to overlap
(where 50% of the red cells are overlapping doubles or triplets). This should be the same area where you would do RBC morphology or platelet estimation. Be aware that if the RBC/PCV are low, you must avoid going in too deep. Then count in ten consecutive fields.
c. Switch to hpf. Count the total number of WBC seen in 20 fields. Include disintegrated cells. Do not include NRBC.
d. Divide your total by 20 to obtain the average number of WBC/hpf, to two decimal places. Multiply the average by the conversion factor for the microscope.
Refer to conversion factor procedure for hpf. Average your result with that of the other tech.
e. If your estimate is 0.40 or lower, just call it “less than 0.5” f. If your estimate is over 0.40 calculate the estimate as a range of +/- 40% from this number. Round
off the results of 2.0 or lower to one decimal place; round off results over 2.0 to the nearest whole number.
47
Laboratory Guidelines 2018 Edition cps.sk.ca March 2018
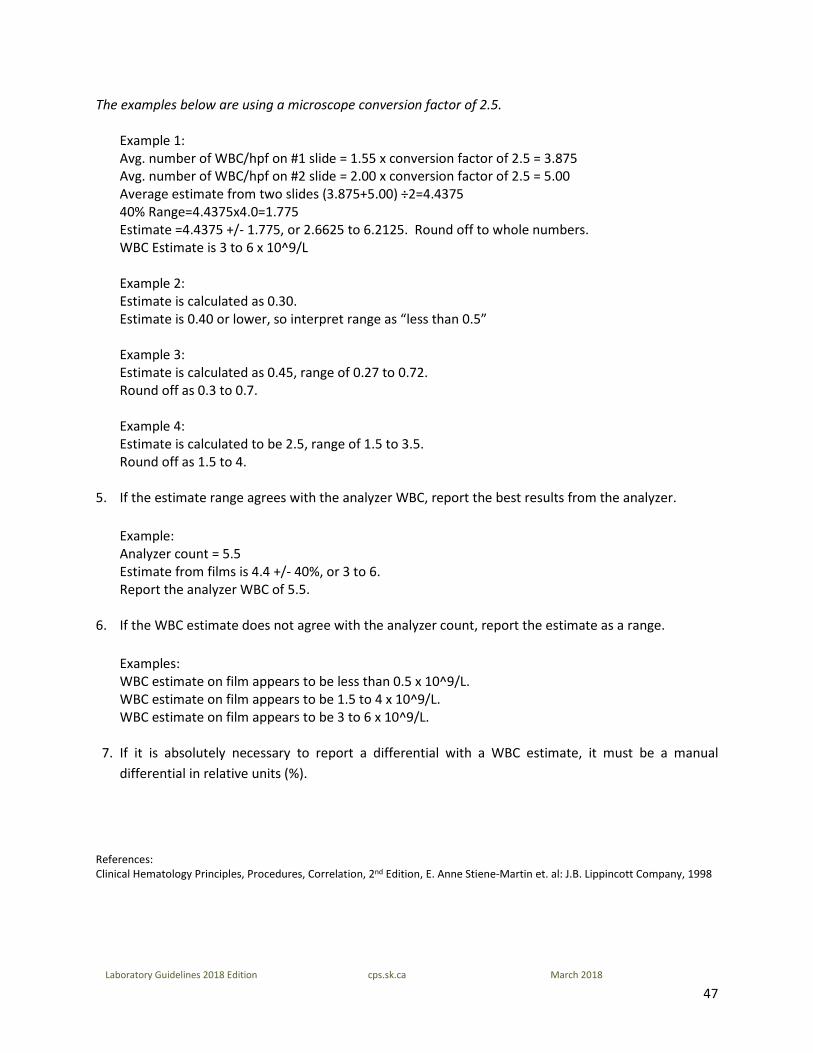
The examples below are using a microscope conversion factor of 2.5.
Example 1: Avg. number of WBC/hpf on #1 slide = 1.55 x conversion factor of 2.5 = 3.875 Avg. number of WBC/hpf on #2 slide = 2.00 x conversion factor of 2.5 = 5.00 Average estimate from two slides (3.875+5.00) ÷2=4.4375 40% Range=4.4375x4.0=1.775 Estimate =4.4375 +/- 1.775, or 2.6625 to 6.2125. Round off to whole numbers. WBC Estimate is 3 to 6 x 10^9/L Example 2: Estimate is calculated as 0.30. Estimate is 0.40 or lower, so interpret range as “less than 0.5” Example 3: Estimate is calculated as 0.45, range of 0.27 to 0.72. Round off as 0.3 to 0.7. Example 4: Estimate is calculated to be 2.5, range of 1.5 to 3.5. Round off as 1.5 to 4.
5. If the estimate range agrees with the analyzer WBC, report the best results from the analyzer.
Example: Analyzer count = 5.5 Estimate from films is 4.4 +/- 40%, or 3 to 6. Report the analyzer WBC of 5.5.
6. If the WBC estimate does not agree with the analyzer count, report the estimate as a range.
Examples: WBC estimate on film appears to be less than 0.5 x 10^9/L. WBC estimate on film appears to be 1.5 to 4 x 10^9/L. WBC estimate on film appears to be 3 to 6 x 10^9/L.
7. If it is absolutely necessary to report a differential with a WBC estimate, it must be a manual
differential in relative units (%).
References: Clinical Hematology Principles, Procedures, Correlation, 2nd Edition, E. Anne Stiene-Martin et. al: J.B. Lippincott Company, 1998
48
Laboratory Guidelines 2018 Edition cps.sk.ca March 2018
ESTABLISHING CONVERSION FACTOR FOR WBC ESTIMATION
Purpose: To provide for instruction for establishing a conversion factor for the hematology microscope by calculating the ratio of electronic count to the number of WBC on either hpf or per oil immersion field. Frequency: The conversion factor must be established once for every microscope used in hematology or when there are major repairs or changes in the analyzer for electronic counts or a new microscope is used for estimates. Procedure: Note: Total leukocyte counts can be estimated roughly either by hpf or 100x oil immersion field. Therefore 100x oil immersion field can be substituted in procedure that states hpf.
Step: Action: 1. Perform electronic WBC count on 30 consecutive fresh patient blood samples. Alternatively
if unable to perform 30 consecutive samples it is acceptable to perform 10 samples per day on 3 consecutive days.
2. Prepare and stain one peripheral blood film for each sample. 3. For each film, under hpf microscopy, find an area where 50% of the red cells are
overlapping doubles or triplets. Then count WBC in 10 consecutive fields. 4. Divide by 10 the total number of WBC found to obtain the average number per hpf. 5. Divide the electronic WBC count by the average number of WBC per hpf. 6. Add the numbers obtained in step 5 and divide by 30 (number of observations in this
analysis) hpf. 7. Round the number calculated in step 6 to the nearest whole number to obtain an
estimation factor. Reference: Clinical Hematology Principles, Procedures, Correlation, 2nd Edition, E. Anne Stiene-Martin et. al: J.B. Lippincott Company, 1998.
49
Laboratory Guidelines 2018 Edition cps.sk.ca March 2018
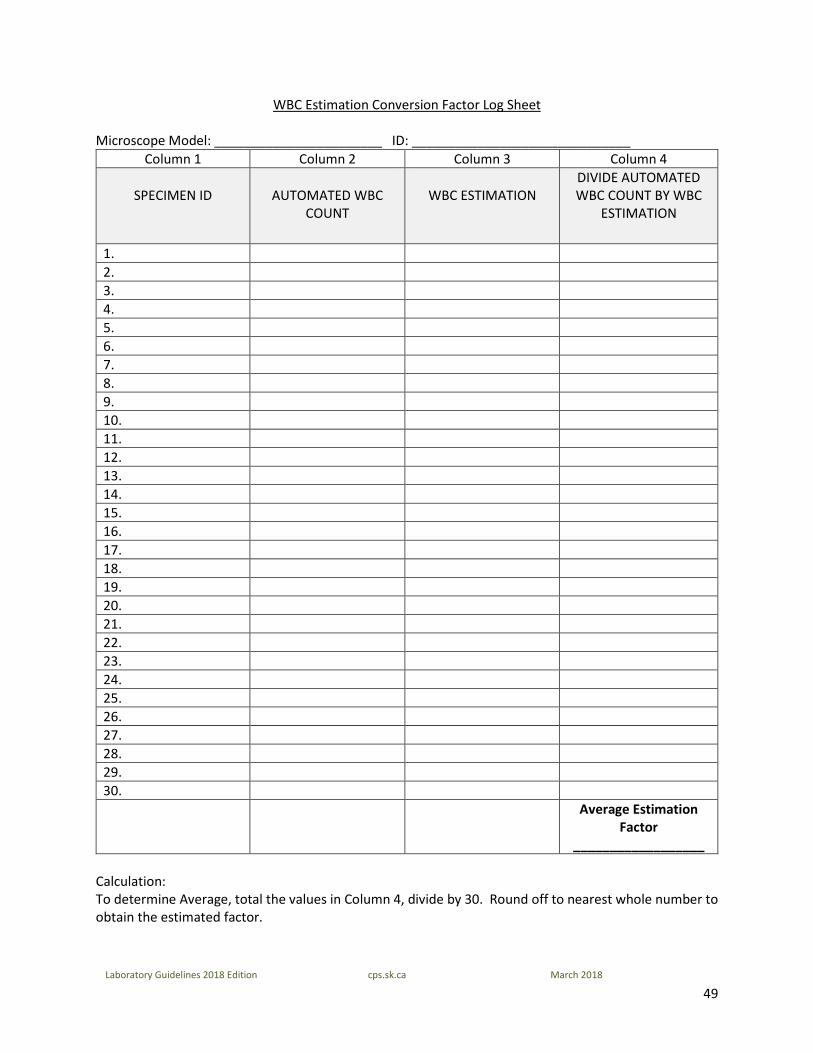
WBC Estimation Conversion Factor Log Sheet
Microscope Model: _______________________ ID: ______________________________ Column 1 Column 2 Column 3 Column 4
SPECIMEN ID
AUTOMATED WBC
COUNT
WBC ESTIMATION
DIVIDE AUTOMATED WBC COUNT BY WBC
ESTIMATION
1. 2. 3. 4. 5. 6. 7. 8. 9. 10. 11. 12. 13. 14. 15. 16. 17. 18. 19. 20. 21. 22. 23. 24. 25. 26. 27. 28. 29. 30. Average Estimation
Factor __________________
Calculation: To determine Average, total the values in Column 4, divide by 30. Round off to nearest whole number to obtain the estimated factor.
50
Laboratory Guidelines 2018 Edition cps.sk.ca March 2018
PROCEDURE FOR PLATELET ESTIMATES
1. Platelet estimation is to be used for cases in which instrument flags identify invalid platelet data, platelet clumps and for verifying platelet counts below 100x109/L. Scan the slide for clumps under hpf. If platelet clumps are present, they cause a false decrease in platelet count. Edit out the platelet count by replacing it with the message “Platelets clumped, results invalid.” Do not report the MPV.
NOTE: For this purpose, platelet clumping is defined as at least 5 clumps, with at least 5 platelets per clump. Rare or occasional smaller clumps should be ignored.
2. Switch to 100x objective. Total the number of platelets in at least 10 fields. Determine the average
number per field. Multiply by the conversion factor established for your microscope. The estimate should agree with the analyzer count +/- 40%
Example: Average of 6.3 cells per field x conversion factor of 11 = estimate of 69 x 10^9/L. Analyzer count of 88. Multiply by 0.6 or 1.4 for +/-40% range of 53 to 123. Platelet estimate agrees with analyzer.
3. If your estimate disagrees with the instrument platelet count by more than 40% in the absence of clumps: a. Have another technologist do an estimate, when possible, to confirm the discrepency.
b. If the patient is anemic or polycythemic (RBC below 4.0 or over 6.0), the estimate may be
inaccurate. A second blood film should be prepared, (see Indirect Platelet Count Procedure) and performed by two technologists, this may require referral.
c. Examine the platelet histograms and the blood smear for the following sources of error: i) RBC fragments: may be small enough to be counted as platelets.
ii) Megathrombocytes: if many of the platelets on the film appear abnormally large, i.e.
approximately the size of RBC, the analyzer may not be including them in the count. If your estimate varies from the analyzer by more than 40%, add the message “Platelet estimate appears higher on film; megathrombocytes may be excluded from count.” Do not comment anything if occasional large platelets are present, and your estimate agrees within 40%.
iii) Leukocyte cytoplasmic fragments, if present in large numbers, may falsely elevate the
instrument platelet count. They appear as particles similar in size to platelets, but with a homogeneous, rather than granular, structure.
4. If you are reporting the platelet estimate instead of the analyzer count, append an appropriate comment:
“Platelet estimate ≤20 x 10^9/L” “Platelet estimate > 20 x 10^9/L” “Platelet estimate > 50 x 10^9/L” “Platelet estimate >100 x 10^9/L”
Note: You should not use this method if RBC is abnormal.
51
Laboratory Guidelines 2018 Edition cps.sk.ca March 2018
5. Send to Senior Technologist/Pathologist for review on first occurrence for each patient for whom the instrument count is determined to be invalid due to RBC fragments, leukocyte fragments, or megathrombocytes.
Reference: Clinical Hematology Principles, Procedures, Correlation, 2nd Edition, E. Anne Stiene-Martin et. al: J.B. Lippincott Company, 1998
52
Laboratory Guidelines 2018 Edition cps.sk.ca March 2018
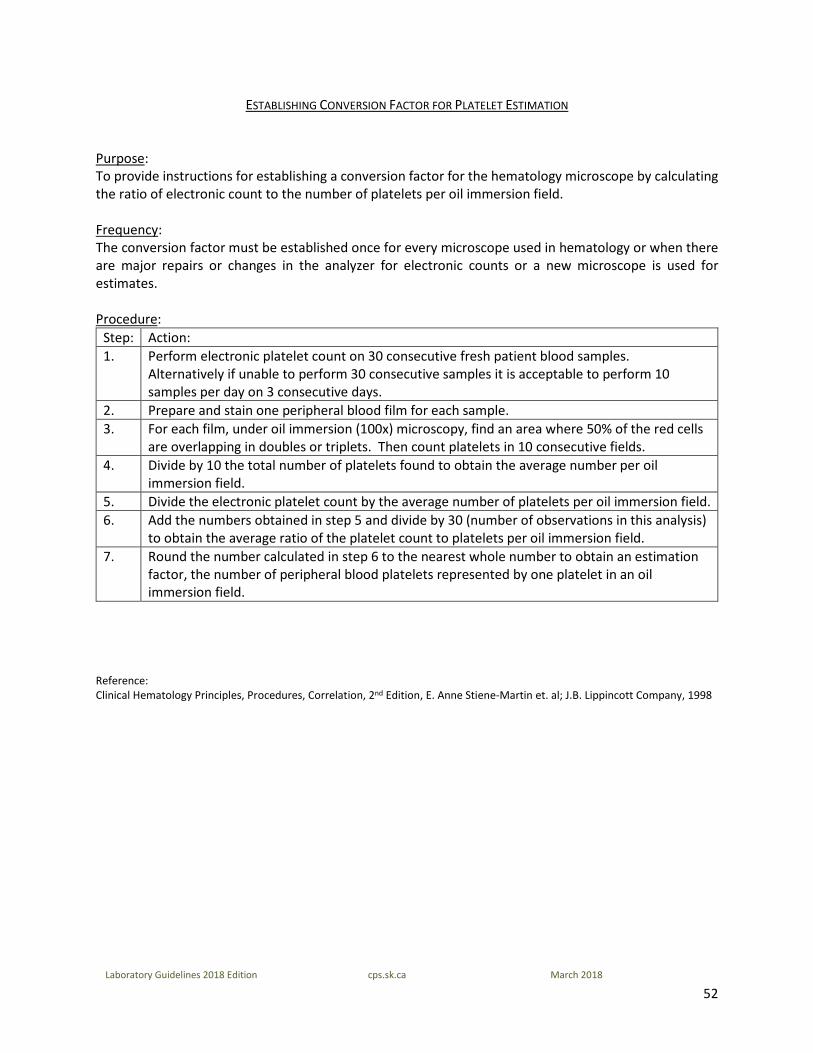
ESTABLISHING CONVERSION FACTOR FOR PLATELET ESTIMATION
Purpose: To provide instructions for establishing a conversion factor for the hematology microscope by calculating the ratio of electronic count to the number of platelets per oil immersion field. Frequency: The conversion factor must be established once for every microscope used in hematology or when there are major repairs or changes in the analyzer for electronic counts or a new microscope is used for estimates. Procedure:
Step: Action: 1. Perform electronic platelet count on 30 consecutive fresh patient blood samples.
Alternatively if unable to perform 30 consecutive samples it is acceptable to perform 10 samples per day on 3 consecutive days.
2. Prepare and stain one peripheral blood film for each sample. 3. For each film, under oil immersion (100x) microscopy, find an area where 50% of the red cells
are overlapping in doubles or triplets. Then count platelets in 10 consecutive fields. 4. Divide by 10 the total number of platelets found to obtain the average number per oil
immersion field. 5. Divide the electronic platelet count by the average number of platelets per oil immersion field. 6. Add the numbers obtained in step 5 and divide by 30 (number of observations in this analysis)
to obtain the average ratio of the platelet count to platelets per oil immersion field. 7. Round the number calculated in step 6 to the nearest whole number to obtain an estimation
factor, the number of peripheral blood platelets represented by one platelet in an oil immersion field.
Reference: Clinical Hematology Principles, Procedures, Correlation, 2nd Edition, E. Anne Stiene-Martin et. al; J.B. Lippincott Company, 1998
53
Laboratory Guidelines 2018 Edition cps.sk.ca March 2018
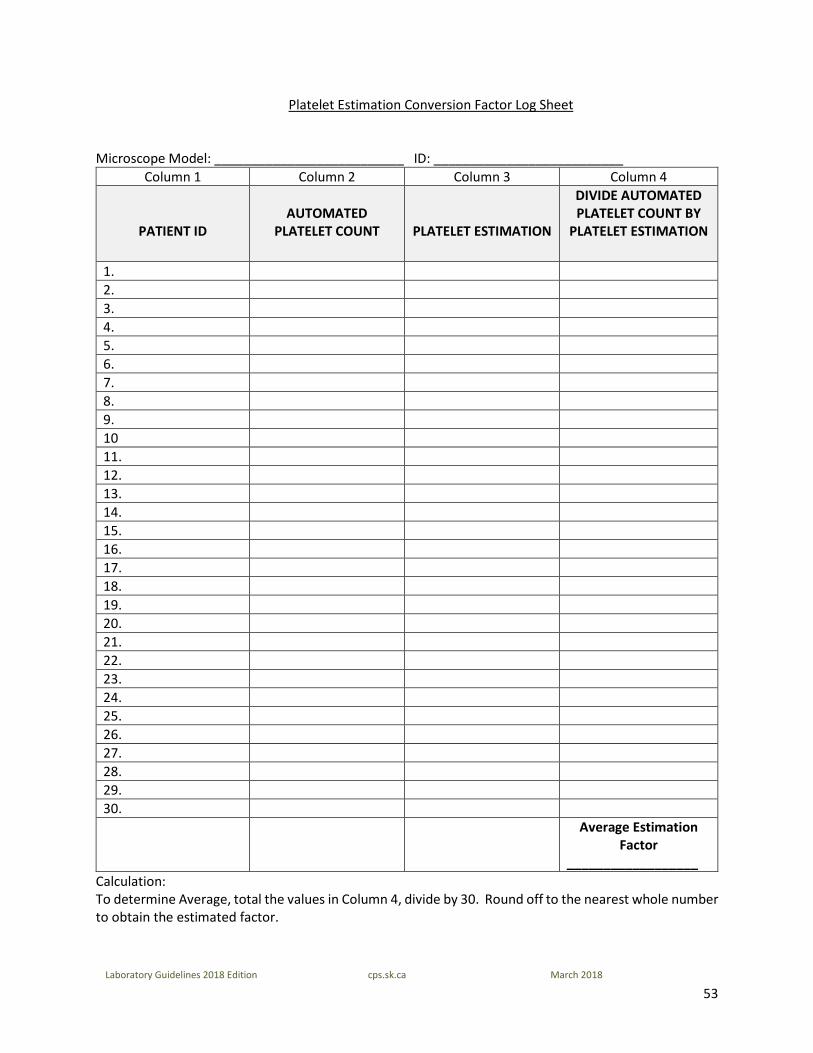
Platelet Estimation Conversion Factor Log Sheet
Microscope Model: __________________________ ID: __________________________ Column 1 Column 2 Column 3 Column 4
PATIENT ID
AUTOMATED
PLATELET COUNT
PLATELET ESTIMATION
DIVIDE AUTOMATED PLATELET COUNT BY
PLATELET ESTIMATION
1. 2. 3. 4. 5. 6. 7. 8. 9. 10 11. 12. 13. 14. 15. 16. 17. 18. 19. 20. 21. 22. 23. 24. 25. 26. 27. 28. 29. 30. Average Estimation
Factor __________________
Calculation: To determine Average, total the values in Column 4, divide by 30. Round off to the nearest whole number to obtain the estimated factor.
54
Laboratory Guidelines 2018 Edition cps.sk.ca March 2018
INDIRECT PLATELET COUNT
Purpose: An indirect platelet count may be obtained by determining the ratio of platelets on a blood film to RBC. The ratio is then used to calculate the number of platelets in comparison to the number of RBC x 1012/L. This method is useful for situations in which an accurate platelet count cannot be obtained from the CBC analyzer e.g. samples with marked megathrombocytes, RBC fragments, or leukocyte cytoplasmic fragments. It is particularly more accurate than conventional estimation when the RBC is abnormal. Procedure: 1. Make two good quality blood smears. Air dry and stain as for differentials. The peripheral smears
must be well made, not touching edges of slide, with rounded end and no visible tails. 2. Obtain the RBC count from the automated CBC analyzer. 3. Using a 100x oil immersion objective, count the number of platelets per 500 RBC. Two technologists
should count one slide each and the platelets counts should check within 10 platelets of each other. If the counts do not check, a third technologist counts in the same manner.
4. Add the two agreeable counts together and multiply this result by the RBC count to obtain the indirect
platelet count in 109/L. Next calculate +/- 10 to report the result as a range rather than an exact number.
Example: RBC = 4.10 1st count = 11 platelets per 500 RBC 2nd count = 15 platelets per 500 RBC
11+15 = 26
26 x 4.10 = 107 Add and subtract 10 to establish the reportable range.
The indirect platelet count is reported as 97 to 117 x 109/L. 5. Compare the indirect platelet count to the analyzer count. If the indirect count is within the analyzer
count +/- 30%, report the analyzer count. 6. If the indirect count is not within the analyzer count +/- 30%, report the indirect platelet count. Procedure Notes: The Indirect Platelet Count is preferable to platelet estimation when an accurate platelet count cannot be obtained on the CBC analyzer. It is particularly more accurate than conventional estimation when the RBC is abnormal. Limitations of the Procedure: The indirect method is not recommended as the method of choice for enumerating platelets. However, it is useful when an accurate platelet count cannot be obtained by the CBC analyzer.
55
Laboratory Guidelines 2018 Edition cps.sk.ca March 2018
References: 1. Raphael SS. Lynch’s Medical Laboratory Technology, Third Edition, Philadelphia PA: WB Saunders Company, 1976, page 1084. 2. Hematology Laboratory Safety Manual, Royal University Hospital, Saskatoon, SK 1998 3. Constantino BT. Leukocyte Cytoplasmic Fragmentation: Its Causes and Laboratory Evaluation, Canadian Journal or Medical
Laboratory Science -60, 1998, page 195
56
Laboratory Guidelines 2018 Edition cps.sk.ca March 2018
INTERNATIONAL SENSITIVITY INDEX (ISI) VERIFICATION
Purpose: Verification of ISI is mandated for all laboratories using assigned instrument-specific ISI’s. Verification must be performed in each laboratory at least annually, to ensure the accuracy of the International Normalized Ratio (INR) result. Verification is done using a set of certified plasmas. NOTE: This guideline does not apply to point-of-care/rapid cartridge-based technology, at this time. Frequency: Verification of ISI is required: • when a new instrument is put into place; • with any change in reagent type; • with any change in reagent lot number; • with any change in instrument; • following instrument repair, if QC is outside acceptable limits; • at a minimum of once per year.
Procedure:
1. Determine Geometric Mean Normal Prothrombin Time (MNPT) for current lot. [*contact LQAP office for Geometric Mean Calculator]
2. Obtain a set of certified plasmas from the manufacturer. A minimum of three certified plasmas with an INR range of 1.5 - 4.5 are recommended. The certified plasma must be appropriate for the instrument in which they will be used.
3. Perform INR test on certified plasma in duplicate over three sessions. 4. Determine mean INR from the three sessions of testing on all certified plasmas. a) If the mean INR is within ± 15% of assigned INR on all certified plasmas then the ISI is valid and
verification is complete. b) If the mean INR is not within ± 15% of assigned INR – revalidate the MNPT. i. If MNPT is valid, then a local system calibration must occur; go to step 5. ii. If MNPT is not valid, then it must be re-established, go back to step 1. 5. Contact the manufacturer for further instructions (ie. calibration). Return to step 3.
57
Laboratory Guidelines 2018 Edition cps.sk.ca March 2018
VERIFYING OR ESTABLISHING A NORMAL REFERENCE RANGE FOR ROUTINE COAGULATION TESTING
Purpose: To provide instructions for establishing or verifying a Normal Reference Range for routine coagulation testing.
1. Verifying a Normal Reference Range: To verify a normal reference range, 20 representative donor samples should be used.
2. Establishing a Normal Reference Range: For an assay that has never previously had a reference range study, 120 donor samples should be used.
To provide instructions for lot number changes of reagent or quality control (QC) material. Frequency: Verify a Normal Reference Range:
• With any change in reagent lot number • Following instrument repair if QC is outside acceptable limits • At a minimum of once per year
Establish a Normal Reference Range:
• When a new instrument-reagent system is put into place • With any change in instrument • With any change in reagent type
Sample Information: Specimens must be the same type and collected in the same container required for a given test (usually 3.2% citrated plasma; see specific procedure). Accumulate the appropriate number of normal donors that meet the following guidelines:
1. Healthy with no known pathological conditions (in-patients should be avoided – they are hospitalized for a medical reason).
2. On no medications affecting coagulation, including anticoagulants/blood thinners. 3. Span the adult age range (unless a pediatric range is required). 4. Equally divided between males and females. If unable to maintain equal male/female ratio, a
larger center may be able to assist with donor specimens. Donor samples can be collected in advance to speed up the evaluation process. The samples should be double spun, aliquoted and stored for up to 14 days at -20 ºC or up to 6 months at -80 ºC. Spun plasma should have <10x109/L platelet counts. Procedure for Verifying a Normal Reference Range
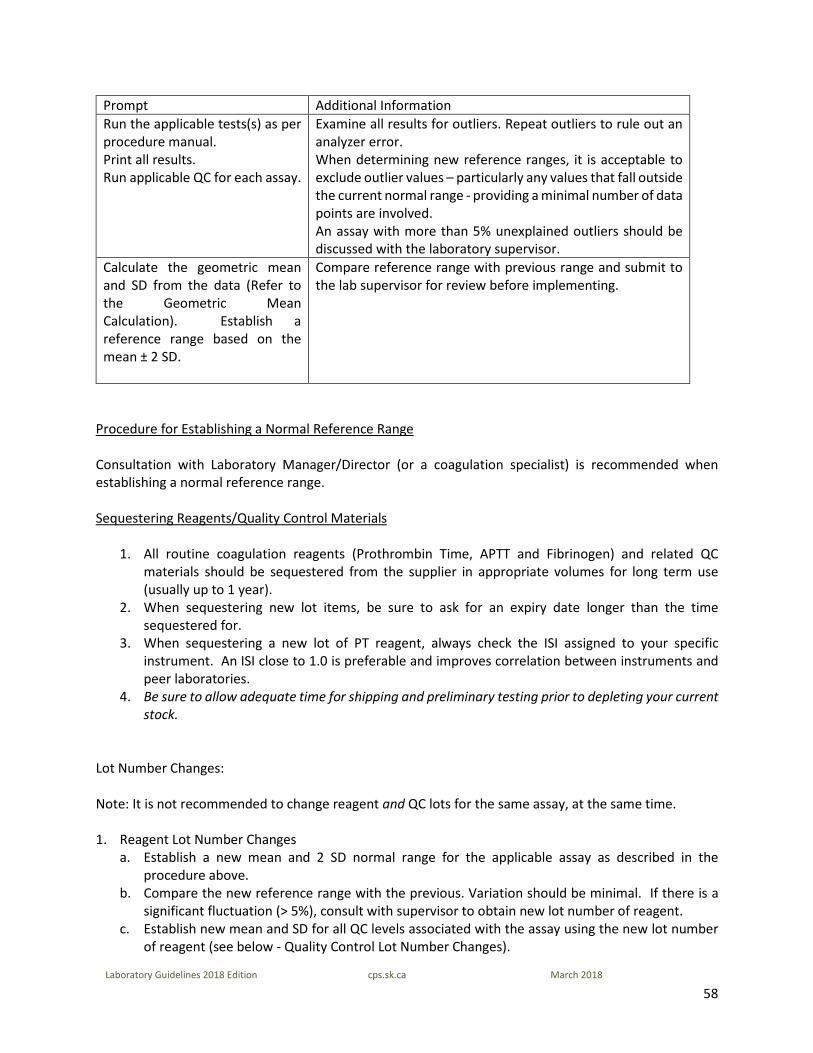
58
Laboratory Guidelines 2018 Edition cps.sk.ca March 2018
Prompt Additional Information Run the applicable tests(s) as per procedure manual. Print all results. Run applicable QC for each assay.
Examine all results for outliers. Repeat outliers to rule out an analyzer error. When determining new reference ranges, it is acceptable to exclude outlier values – particularly any values that fall outside the current normal range - providing a minimal number of data points are involved. An assay with more than 5% unexplained outliers should be discussed with the laboratory supervisor.
Calculate the geometric mean and SD from the data (Refer to the Geometric Mean Calculation). Establish a reference range based on the mean ± 2 SD.
Compare reference range with previous range and submit to the lab supervisor for review before implementing.
Procedure for Establishing a Normal Reference Range Consultation with Laboratory Manager/Director (or a coagulation specialist) is recommended when establishing a normal reference range. Sequestering Reagents/Quality Control Materials
1. All routine coagulation reagents (Prothrombin Time, APTT and Fibrinogen) and related QC materials should be sequestered from the supplier in appropriate volumes for long term use (usually up to 1 year).
2. When sequestering new lot items, be sure to ask for an expiry date longer than the time sequestered for.
3. When sequestering a new lot of PT reagent, always check the ISI assigned to your specific instrument. An ISI close to 1.0 is preferable and improves correlation between instruments and peer laboratories.
4. Be sure to allow adequate time for shipping and preliminary testing prior to depleting your current stock.
Lot Number Changes: Note: It is not recommended to change reagent and QC lots for the same assay, at the same time. 1. Reagent Lot Number Changes
a. Establish a new mean and 2 SD normal range for the applicable assay as described in the procedure above.
b. Compare the new reference range with the previous. Variation should be minimal. If there is a significant fluctuation (> 5%), consult with supervisor to obtain new lot number of reagent.
c. Establish new mean and SD for all QC levels associated with the assay using the new lot number of reagent (see below - Quality Control Lot Number Changes).
59
Laboratory Guidelines 2018 Edition cps.sk.ca March 2018
Note: If possible, run the new lot of reagent in parallel with your current lot whenever QC is run. When performing parallel testing with new lots of reagent, it is not recommended to load any new patient samples on the analyzer – this will prevent possible release of erroneous results.
2. Quality Control Lot Number Changes
a. Establish a new mean and 2 SD reference range for each level of control using a minimum of 20 data points. Run the new control in parallel with the current control whenever QC is required. Note: Running all QC points consecutively is not recommended as this will not reflect changes in the age of reagents or controls, and may result in a reference range that is too narrow. Run QC on multiple days and multiple shifts. b. Compare the SD and mean of your current QC lot to that of the new lot. Generally there should not be any significant fluctuations. Ensure the CV is acceptable (5% or less).
NOTES: Fibrinogen If the reagent being changed is for the fibrinogen assay, a new standard calibration curve must be performed before any preliminary testing proceeds. Compare old and new curves – there should not be a significant change between the lot numbers. APTT If the laboratory performs APTTs on heparinized patients, a “Heparin Therapeutic Range” for APTT must be done using the same unfractionated heparin used for patients. Prothrombin Time 1. If the analyzer requires a “PT Calibration” when changing reagent lot number, this must be performed
before any other testing. 2. Before implementing the new lot number of reagent, ensure that the new ISI and Mean Normal PT
(MNPT) are entered in the appropriate areas of the analyzer and/or LIS (depending on how the INR’s are calculated).
3. When doing the patient correlations (old vs. new lot of reagent) enter the new ISI and MNPT into the analyzer/LIS to enable comparison of INR’s, instead of PT’s (Prothrombin Times may not compare well if the ISI value has changed significantly).
Reference: Adapted from the Regina Qu’Appelle Health Region
60
Laboratory Guidelines 2018 Edition cps.sk.ca March 2018
FLUID REVIEW BY PATHOLOGIST
All differential fluid preparations should be processed according to CLSI guidelines. Wedge smears should not be used with fluids because of their inferior ability in preserving intact cells. Cytocentrifuge preparation is recommended for air-dried body fluid slides as this concentrates the cells, minimizes cell distortion and produces a single layer of cells. This process provides excellent morphologic detail. Additionally, it is in the best interest of patients that all fluid differentials be referred to a pathologist for review. If your facility does not have a pathologist on site, they may be referred to another centre for review. References: H56-A CLSI, Body Fluid Analysis for Cellular Composition; Approved Guideline 2006 CAP Laboratory Accreditation Program. Hematology and Coagulation Laboratory Checklist. Northfield, IL: 08.17.2016 Body Fluids – American Society of Clinical Pathologists; Authors Carl Kjeldsberg and Joseph A. Knight, 1993
61
Laboratory Guidelines 2018 Edition cps.sk.ca March 2018
MANUAL ESR QC PROCEDURE
• ESR racks are controlled on a monthly basis. • Laboratories using one rack - 2 fresh samples are set up in duplicate using different rack positions. • Laboratories using more than one rack - 2 fresh samples are set up in each rack using alternating rack
positions each month. • Set up the samples immediately after thorough mixing is completed. The samples must be remixed
between each rack set up. • Record appropriate results, rack #, position # and initials on the monthly QC sheet. • Results below 20 mm/hr should check within 20%, results over 20 mm/hr should check within 10%. • If results are not within acceptable limits, sample will be repeated if quantity is sufficient or a new
sample is chosen. If results still exceed limits, notify supervisor.
Reference: Laboratory Services Regina Qu’Appelle Health Region