Embed Size (px)
Citation preview
GUIDELINES ON RISK MANAGEMENT PRACTICES IN
STATISTICAL ORGANISATIONS
FIRST DRAFT
April, 2016
Prepared by: In cooperation with:
2 Guidelines on Risk Management practices in statistical organisations – FIRST DRAFT
TABLE OF CONTENTS
FOREWORD ....................................................................................................................................... 5
SECTION 1: RISK MANAGEMENT FRAMEWORK ............................................................................. 7
1. Settling the Risk Management System .................................................................................. 9
1.1 Risk Management Mandate and Strategy .............................................................................. 9
1.2 Establishing Risk Management policy ................................................................................... 11
1.3 Adopting an integrated risk approach connected to Statistical Quality Management ..... 14
2. Risk Management Resources ..................................................................................................... 17
2.1 Risk organizational culture .................................................................................................... 17
2.2 Training ................................................................................................................................... 18
2.3 Delivering roles and responsibilities ..................................................................................... 19
3. Risk Management Process (see Section 2) ............................................................................... 21
4. Monitoring and Reporting ......................................................................................................... 22
4.1 Monitoring & Review of the framework .............................................................................. 22
4.2 Establishing reporting mechanisms .................................................................................... 23
SECTION 2: Risk Management Process ........................................................................................ 29
1. Communication & Consultation ................................................................................................. 31
1.1 Internal Communication ........................................................................................................ 32
1.2 External Communication....................................................................................................... 34
2. Context analysis ...................................................................................................................... 36
2.1 Establishing the context ....................................................................................................... 36
2.2 Process mapping ................................................................................................................... 37
3 Guidelines on Risk Management practices in statistical organisations – FIRST DRAFT
3. Risk Assessment ..................................................................................................................... 39
3.1 Risk Identification .................................................................................................................. 40
3.2 Risk Analysis & Measurement .............................................................................................. 47
3.3 Risk Weighting ...................................................................................................................... 50
4. Risk Treatment ............................................................................................................................ 52
4.1 Risk Treatment Actions ......................................................................................................... 53
4.2 Risk Treatment process ........................................................................................................ 55
5. Monitoring & Control ................................................................................................................ 60
5.1 Monitoring & Review ............................................................................................................ 60
5.2 Key risk indicators .................................................................................................................. 61
6. Risk Based Control & Audit ....................................................................................................... 64
7. Risk Management Information system .................................................................................... 66

4 Guidelines on Risk Management practices in statistical organisations – FIRST DRAFT
5 Guidelines on Risk Management practices in statistical organisations – FIRST DRAFT
FOREWORD
These Guidelines are intended to help the implementation of a Risk Management system in
Statistical Organisations.
In order to identify a practice that accounts for the National Statistical Offices particular
features, the first step of analysis has concerned the collection of actual cases of
implementation of risk management systems at international level. In 2015 two surveys
have been carried out in order to analyze to what extent Risk management systems are
adopted among the NSO’s members of the UNECE – as well as among countries and
international organizations not belonging to the UNECE and yet participating in the
Commission’s activities.
Data collected through the first survey has been pre-analyzed according to a theoretical
paradigm – named “The template” – shared through a research paper during the “Workshop
on modernization of Statistical production and services”, held in Geneva on 19 -20
November 2014. The template takes into account the most relevant and useful standards
such as Enterprise Risk Management Conceptual Framework (ERM): Internal Control –
Integrated Control, developed by the Committee of Sponsoring Organizations of the
Treadway Commission (Co.S.O.) and ISO 31000:2009 (Risk Management – Principles and
guidelines).
The countries involved in the second survey have been selected according to the following
criteria: long-term positioning within the most developed areas; representativeness related
to the geographical area (EU/not EU countries); compliance with acquired standards and
practices.
From a methodological point of view, it should be highlighted that the selection carried out
is not based on a performance ranking. Actually, it aims at focusing on the most relevant
features required for a high-quality Risk management practice, because information from
the respondents will contribute to define a global framework inferred from each system
already developed and spread.
The Guidelines don’t aim at detecting a best practice according to the risk management
international standards, but the practice or practices most adjustable to the NSOs’
organizational context with a view to reproducibility1. Their goal is therefore to provide a
1 The notion of reproducibility refers to a Standard features’ transferability regardless of any difference in the organizational context; that implies emulation, that is, the possibility for other organizations to opt for the same model. "Reproducibility" can be explained through both Portability, that is, the above-mentioned transferability, and
6 Guidelines on Risk Management practices in statistical organisations – FIRST DRAFT
both theoretical and practical tool helping the NSOs modernization process, given that a risk
management system implementation contributes to focus on control in statistical quality.
This draft consists of two sections, whose index complies with Risk Management standard
ISO31000/2009:
• Section 1 investigates the Risk Management system;
• Section 2 focuses on the risk management process.
The Sections 1 and 2 include Question Mark boxes that consistently report some answers to
the questions contained in the first and the second survey.
Each paragraph includes key words (“tags”) to make topic findings easier within the
Guidelines.
The Guidelines also comprise:
• The Annexes which shows a more practical approach to the different domains of Risk
Management, describing two categories of examples:
- Focus points on Risk Management core topics;
- Case-studies, shortly reporting some NSOs' significant experiences on particular
features of the Risk Management systems;
• The References, concerning the main sources of the Guidelines;
• The Glossary, with the definition of the main relevant terms of the Guidelines.
Adaptability, that is, the power to be used in different contexts without any further actions or tools: in other words, the owner to be customizable.
7 Guidelines on Risk Management practices in statistical organisations – FIRST DRAFT
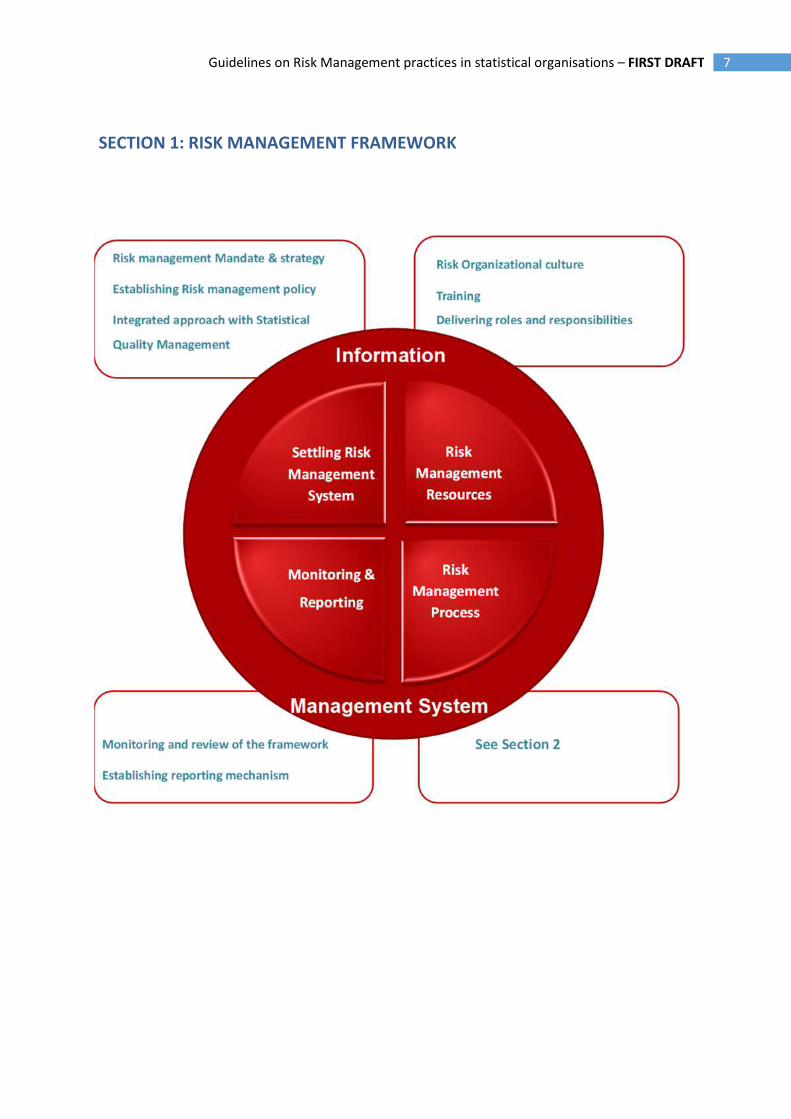
SECTION 1: RISK MANAGEMENT FRAMEWORK

8 Guidelines on Risk Management practices in statistical organisations – FIRST DRAFT
9 Guidelines on Risk Management practices in statistical organisations – FIRST DRAFT
1. Settling the Risk Management System
A Risk management framework (system)2 provides the infrastructure for delivering,
maintaining and governing risk management throughout the organization. As a part of this
framework, an organization should set up:
a. A Risk Management Mandate that is the board statement setting direction and
priorities for Risk management, and through which “who does what” is given proper
authorization as well as all the necessary resources to play his/her role. This is the
main expression of the Risk Governance, through which the organization’s board
engages stakeholders in locating the different responsibilities for managing risks.
b. A Risk strategy, that points out how risk management supports the organization’s
overall strategy and related objectives. It takes into consideration the external and
internal context, focusing in particular on key stakeholders demands.
c. A Risk policy provides a clear and concise outline of the organization’s requirements
for risk management within the organization’s overall approach to governance. It
includes the risk appetite statement, the HR training program to support Risk
Management process as well as a definition of risk assessment criteria.
d. An integrated risk approach supports quality management in improving statistical
data integrity and quality, through identification, analysis and treatment of risks
inherent to statistical and over-arching processes.
1.1 Risk Management Mandate and Strategy
TAGS: Philosophy; Mandate; Scope; Plan.
A Risk Management Strategy includes definition of risk management scope and plan as well
as the discussion of Risk Management philosophy.
I. Risk Philosophy
A Risk management philosophy is the set of shared beliefs and attitudes characterizing how
risk is considered in any organizational activities. It affects how risk management
2 The AS/NZS 4360:2004 standard uses the following definition of Risk Management framework: “set of elements of an
organization’s management system concerned with managing risk”. Within this draft the clauses “RM framework” and “RM system” are being used as synonyms.
10 Guidelines on Risk Management practices in statistical organisations – FIRST DRAFT
components are applied, including how risks are identified, the kinds of risks accepted, and
how they are managed.
When the risk management philosophy is not developed, understood, and embraced by the
staff very well, an uneven application of risk management across business units, functions,
or departments is likely. Even when the philosophy is well developed, nonetheless cultural
differences among units resulting in variation in enterprise risk management application may
be found.
Therefore, risk philosophy, risk appetite e andrisk strategy should be always kept aligned, as
one reflects the other. To this purpose it’s necessary to “measure” risk perception by the
management staff – as some managers may be prepared to take more risk while others are
more conservative – as well as the risk maturity of organizational context, since this latter
could be more or less resilient in facing risk.
II. Mandate
A mandate in Risk management expresses itself through an official statement/document
that clearly indicates the Risk Management strategy and objectives, the people accountable
for them at any level, also authorizing such people to use proper resources for achieving the
objectives assigned.
Defining and communicating this statement testifies an organization’s commitment to
implement a Risk management system.
Box 1 - An example of mandate among NSIs
“Minimizing any significant risks, arising during activities and services, through the application of effective risk
management principles and practices. The organization will bear an acceptable level of risk, but only after
weighing up the likelihood, consequences and cost of an adverse event occurring against the availability of
resources to eliminate or manage the risk”.
Source: Australian Bureau of Statistics – Accountable Authority Instructions
III. Risk Management scope
Dealing with the scope within a Risk Management strategy means that all staff is are made
aware of the relevance of risk in achieving the objectives assigned as well as specific training
for such staff is envisaged. It also means that a common approach to risk management is
shared across the organization, including a common risk language.
11 Guidelines on Risk Management practices in statistical organisations – FIRST DRAFT
IV. Risk Plan
To implement a Risk Management system a Risk Plan is needed suchneeds to include:
• Risk Management objectives (strategic as well as operational ones);
• Risk Management activities to be undertaken within a proper timeframe to help the
organization achieve its strategic objectives;
• Resources required, including people, knowledge and budget;
How the Risk Management strategy progress will be monitored, reviewed and reported.
As regards the activities to be undertaken, several of them are crucial whether resulting
from an extended program or from a “quick” one through a “prototypal release” of the Risk
Management System. The resources that an organization will invest in implementing such a
System are also crucial to determine the quality and progress of results.
1.2 Establishing Risk Management policy
TAGS: Risk appetite; Risk Profile; Top Management; Commitment; Stakeholder.
To achieve consistency in Risk Management activities across the organization, the Risk
Management policy should contain a high level overview and description of the Risk
Management process.
The main features of the policy are:
• Definition of Corporate Risk Appetite: the Board and senior managers set up the risk
tolerance level through identifying general boundaries against unacceptable
exposure to risk. The corporate risk appetite is then used to shape tolerance levels
down the organization (see below);
• Implementation of a Risk Management standardized process at all levels, to ensure
that risk management is an inherent part of how core-business is run (see chapter 4);
• Top Management involvement in Risk Management framework design (see below);
• Stakeholders’ empowerment (see below and see also Section 2, ch. 1);
• Definition of risk criteria (see Section 2, ch. 3);
• Definition of a hierarchy of risks (see Section 2, ch. 3);
12 Guidelines on Risk Management practices in statistical organisations – FIRST DRAFT
• Implementation of a Risk Management unit/office (see ch. 2);
• Definition of HR training policy to support Risk Management process (see ch. 2);
• Establishing a communication system (see Section 2, ch. 1);
• Establishing a reporting system (see ch. 4).
I. Risk Appetite and Risk Profile
The concept of risk appetite may be looked at in different ways depending on whether the
risk (as a sign of uncertainty) under consideration is a threat or an opportunity.
When considering threats the concept of risk appetite points at a level of exposure which is
deemed tolerable and justifiable should the risk be actualized. In this respect risk appetite is
about the (financial or otherwise) cost of constraining risk against the cost of exposure
should this latter become a reality, in order to find an acceptable balance.
When considering opportunity risk appetite concerns how much the organization is actually
willing to risk in order to obtain the related benefits. That is, it concerns the (financial or
otherwise) value of potential benefits against the losses which might be incurred (some
losses may be incurred with or without obtaining such benefits). Indeed, certain kinds of risk
are unavoidable and it is not within reach of the organization to completely put them under
control – for example, the risk arising from terrorist activity. In these cases the organization
needs to make contingency plans.
In both cases, risk appetite will best be expressed as a series of boundaries, properly
authorized by the Board, which provide any level of the organization with clear guidance on
the amount of risk to be undertaken. Risk appetite is not necessarily static; in particular, the
organization’s Bboard is entitled to vary the amount of risk to be dealt with under the
circumstances. It is worth observing that risk appetite can be determined either qualitatively
or quantitatively, so it may be expressed in terms of range rather than exact amount.
Risk appetite is usually defined qualitatively, such as high, moderate, or low. Even if
qualitative measures may be less precise, they still provide valuable guidance in assessing
proper levels of risk taking.
Another consideration when developing risk appetite concerns evaluation of risk capacity,
that is referred to the maximum potential impact from a risk event that an organization can
withstand. Risk capacity is usually established in terms of capital, liquid assets or borrowing
capacity. Risk appetite cannot exceed an entity’s risk capacity, and in fact, in most cases,
appetite is set well below capacity.
Last but not least, an entity should consider its stakeholders’ overall desire for risk. Even if
13 Guidelines on Risk Management practices in statistical organisations – FIRST DRAFT
none of the previous considerations significantly limit an organization’s risk appetite,
stakeholders may have conservative return expectations and a very low appetite for risk-
taking that would directly impact on setting risk appetite by the board Board and
management.
II. Risk Management Commitment
Risk management design should be mostly contributed to by tTop management with the
assistance of middle/low management and technical staff (for example, through mixed
working groups). Especially during the start-up phase any organizational level should be
involved in order to collect inputs and needs (for example, through ad hoc interviews).
Employees best know the most typical and recurring risks in their area and should be both
encouraged and engaged to regularly give information about them.
Risk management goals should be not only clearly defined and communicated by Top
management but also discussed within each of NSOs units. Each unit should have a contact
person entitled to coordinate all the Risk management activities in cooperation with his/her
colleagues, including the head of unit.
III. Stakeholders’ empowerment
It is really important to establish and maintain proper risk frameworks that ensure
cooperation with stakeholders in achieving common objectives (e.g. the public's trust in the
quality of Official Statistics; protection of confidentiality related to respondent data, etc.).
Actually, an organization should regularly circulate information as well as keep dialoguing
about risk management with internal and external stakeholders, in order to ensure that
everybody understands the basis on which decisions are made and the reasons why
particular actions are required.
To this purpose, the organization needs to:
• periodically review interfaces;
• check whether communication is correctly understood and all communication channels
are effective;
• set up clear communication protocols in order to ensure there is a common
understanding of the respective responsibilities;
• implement a consultative team approach to help properly define the internal and external
context and ensure risks are identified effectively; to put different areas of expertise
together when analyzing risks; to ensure different views are properly considered in
evaluating risks; to assure appropriate change management during risk treatment;
14 Guidelines on Risk Management practices in statistical organisations – FIRST DRAFT
• develop communication plan for both internal and external stakeholders at the earliest
stage of the Risk Management process;
• encourage, acknowledge and appreciate unsolicited views;
• provide periodic feedback to show how well what was promised or projected has been
actually performed.
For further information see Section 2, chapter 1.
1.3 Adopting an integrated risk approach connected to Statistical Quality
Management
TAGS: Approach; Statistical risk; Quality framework.
Risk Management is essential to achieve the organization’s strategic outcome and such
fulfilment can only be reached by ensuring that risk is included as a routine in all significant
decision-making. This means that Risk Management should be part of the organization’s
culture, that is, embedded in every organizational process, both production and supporting
ones.
That requires an agreed approach, integrated with corporate strategy, outlining exposures,
issues and potential problem areas: an integrated risk management should result in a system
that is a part of the regular organizational performance review, where the organization not
only looks at performance and events, but identifies, in a systematic way, important gaps,
variations and exposures in order to get ahead of (mitigate) their possible impact.
From a practical point of view:
a. Risk management should not be seen as a separate system existing independently
from the way in which the organization manages itself, makes decisions, allocates
resources and holds people accountable.
b. Risk management cannot take place at some levels if that means excluding other
ones.
c. Risk management cannot take place in few parts of the organization only.
According to the holistic approach, risks should be viewed and assessed at any level in the
organization. They should be a major consideration in approving the investment proposal as
well as integrate tools for project management and performance monitoring. Accordingly,
they should be integrated into key accountability documents and internal strategic and
15 Guidelines on Risk Management practices in statistical organisations – FIRST DRAFT
project planning.
The most advanced statistical institutions (NSOs) have developed integrated models based
on enterprise-wide perspective of risk, adopting standardized terms and concepts to
promote effective implementation across the organization.
In these systems all aspects of internal control are developed through a risk-based approach
built on the following criteria:
a. Policy positions reflect the risk appetite of senior management and are developed to
guide the behavior of empowered staff in managing risks faced in performing their
assignments.
b. Governance arrangements ensure transparency in decision making as well as
accountability by promoting strong leadership, sound management and effective
planning and review.
c. Planning and Reporting provide great opportunities to document goals and related
risks.
d. Assurance activities are a part of Internal audit aiming at verifying that Risk
management within an organization is run consistently with international standards
and established practice3; still, such activities have to be targeted on the comparative
importance assigned to the objectives by the organization.
Such NSOs have adopted an integrated risk management framework by identifying – in
addition to general risk management – a specialized risk management which addresses
persistent risks (for example, fraud, work health and safety, ITC security and disclosure risk)4.
They also put a strong focus on managing statistical risk defined as the possibility that one or
more of the production process components fail to meet the quality standard established, so
resulting in a lower statistical output quality or integrity. Given that statistical risks are
unavoidably managed at all levels (strategic, operational and project ones) within a NSO, it is
worth noting that even when they are managed separately they should eventually be
integrated into an organizational risk framework.
Considering the strong connection between quality and risk5, risks can be treated by
applying quality management especially at operational level.
3 Internal audit should be carried out by an independent organization’s unit playing an advisory role and providing independent assurance and assistance to the Chief Statistician (see Section 2, chapter 5 ) 4 The Institution managing all these persistent risks is the Australian Bureau of Statistics (ABS), which has also developed a quality improvement framework of the statistical chain based on risk management (see Annex). 5 A) Quality is defined as the extent to which characteristics of an object meets the requirements (ISO 9001:2015). Risk is defined as the effect of uncertainty on objectives (ISO 31000). Objectives can be regarded as high level requirements. B) Traditionally, quality is focused on product quality and customer satisfaction (ISO 9001). However, the definition of quality can be applied to other objects such as processes, input as well as the institution as a whole.
16 Guidelines on Risk Management practices in statistical organisations – FIRST DRAFT
Indeed, risk management and quality management are similar:
• Quality management usually defines requirements and assesses whether and when
they are met (through review, audit, etc.). If requirements are not met correction
actions are implemented;
• Risk management identifies threats (risk sources) that can affect objectives. If risk
level is too high mitigating measures are implemented.
Even though a lot of general quality frameworks exist in literature, applications of quality
continuous improvement approaches among NSOs are still limited.
In implementing their framework for statistical business process quality improvement, NSOs
should pay particular attention to:
• extract from the existing models key elements and possible relations for a general
quality framework of statistical processes/chain;
• adopt a common vocabulary for quality and risk management.
Independently of the standard adopted, a first step in implementing a quality framework is
to design process flow map(s), in order to identify the points where to measure products
and process quality.
Process mapping can help to understand how a system works and identifies how a system
interacts with other systems and processes6.
Another key step is to identify the statistics quality demands by users with respect to the
process under consideration7. Quality demands should encompass both quality criteria and
demands related to risks. A process is in control when quality criteria are met and risks are
acceptable.
6 NSOs could use the Generic Statistical Business Process Model (GSBPM) as a guide to map the activities of statistical processes. This grants that all steps of a statistical process are included for monitoring purposes. For example the "Collect" phase of the GSBPM includes any activities related to obtaining data. Considering the recent adoption of the Generic Activity Model for Statistical Organizations (GAMSO) which extends and complements GSBPM by adding other activities which are needed to support statistical production, it would be useful to introduce this standard in order to support implementation of an entire risk management system. For details on process mapping, see Section 2 Ch. 2. 7 BLUE-ETS Project : SP1-Cooperation-Collaborative Project /Small or medium-scale focused research project/FP7-SSH-2009-A/Grant Agreement Number 244767/ Deliverable 7.3
17 Guidelines on Risk Management practices in statistical organisations – FIRST DRAFT
2. Risk Management Resources
TAGS: HR allocation; Internal stakeholders; Organizational changes; Organizational climate;
Organizational culture; Risk Management Training; Skills and competencies.
2.1 Risk organizational culture
Risk management initiatives can promote employees’ sense of belonging to a group as well
as their own significance within the organization. People cooperate to set up a risk
management system, an asset management, to define the cross-organizational measures,
and so on. Moreover, risk management provides a systematic standard mechanism of
internal control that obliges all staff to come together from different areas to discuss,
identify issues and solve problems – that is, it intensifies interactions. Risk management
system also provides a good basis for creating and maintaining quality culture and positive
working atmosphere through making staff feel as a co-author of a huge work done by the
organization.
Human capital is recognized as one of the key elements for obtaining organizational success8
and some uncertainties which give rise to risks can actually come from the organization’s
internal environment.9 For example, the way in which top management reacts to the results
of monitoring may affect the behavior of employees; the organization should be quite clear
about the uncertainty coming from relying on a single human-dependent control to make a
large modification to risk, and should properly reward efforts by individuals. Consistently,
when designing the framework and implementing all aspects of the risk management
process, specific actions are needed in order to integrate such human and cultural factors.
Change, and culture change in particular, is a weakness in risk management: process is not
the problem, but people’s perception of it. Therefore, two important lessons learned from
implementing risk management by some NSOs that other ones should take into account
when developing their own processes, are: embedding clear risk based thinking at the
highest level of the organization, while ensuring its cascading down to lower management
and employees; presenting the risk based thinking not as something totally new to reduce
resistance and showing it as an important feature of any change process.
Job profiles (outlining role, performance expectations and development objectives), should
8 Cf. Porter M.E., 1990. 9 ISO/TR 31004:2013(E) reports common types of error related to human and cultural characteristics: a) failure to detect and respond to early warnings; b) indifference to the views of others or to a lack of knowledge; c) bias due to simplified information processing strategies to address complex issues; d) failure to recognize complexity.
18 Guidelines on Risk Management practices in statistical organisations – FIRST DRAFT
be identified for staff assigned to run risk management matters, and specific descriptions on
specific issues should be included in the General Risk Manager’s and Risk officers’ job
profiles.
With reference to control actions, an organization should establish, among others,
preventive human capital controls to reduce the likelihood and/or impact of adverse and
critical events like noncompliance and misconduct10. Consequently, the organization should
enhance and/or revise the prioritized risk matrix and, as needed, the risk optimization plan
to reflect implemented human capital incentives, according to current residual risk analysis
and performance against planned residual risk analysis.
QUESTION MARK BOX
Q. Have job profiles been identified for the staff assigned to run Risk Management matters?
R1. “Specific descriptions on Risk Management issues are included in the job descriptions of Risk officers and
head of units”
Source: Romania, In-Depth survey on Risk management practices
R2. “Yes, done. There is a job description for the General Risk Manager. The Risk Manager of Statistics Austria
holds a certificate of a Senior Risk Manager with regard to ÖNORM EN ISO 31000 and ONR 49003 (Austrian
Economic Chamber, WIFI-Zertifizierungsstelle)”
Austria, In-Depth survey on Risk management practices
R3. “All staff have a Development and Performance Agreement (DPA) which outlines their role, performance
expectations and development objectives. Roles in relation to risk will be articulated in broad planning and in
the individual DPAs but it may not be reflected in a title. In addition, roles in relation to managing specific risks
are identified in the risk management documentation”
Australia, In-Depth survey on Risk management practices
2.2 Training
To effectively implement a risk management system, an organization should allocate
appropriate resources, suitable human capital as well as ensure that those who are
accountable can fulfil their role by providing them with the training and skills needed. All
staff should be aware of the relevance of risk to achieve the objectives assigned and training
to support staff in risk management should be available. Awareness and ongoing support
enables individuals to know what is expected and reduces the likelihood of errors.
An organization should identify the presence and effectiveness of current actions and
controls in order to deal with threats and opportunities. That includes use of education and 10 At this end, as an example of potential sub practices, an organization can also: define which duties should be segregated to prevent critical events; develop awards and other incentives for contributions by individuals or units that result in reduced residual risk or compliance failures, enforcement actions or other positive challenges to the organization.
19 Guidelines on Risk Management practices in statistical organisations – FIRST DRAFT
awareness programs. The organizations should also conduct a structured needs assessment
identifying risk and training needs (e.g. general control system, specific training on risk
management systems, internal control standards, dedicated tools, statistical quality
modules, etc.) as well as establish appropriate training and support for responsible
personnel. Finally, they determine which kind of awareness, education and support practices
should be put in place for each policy and target audience.
It is advisable to start training with a program devoted to managers and employees assigned
to run risk management matters at different levels; it would be best if kick-off training
activity focuses first on higher-risk areas. It is also important to carry out training initiatives
regularly, in accordance with risk management system development, as well as concurrently
with significant organizational changes.
RM training needs to be integrated into existing job training, both if risk management is
considered a tool for improvement and for the sake of economic efficiency. Using a suitable
level of technology and develop e-learning tools to reach a broader target audience are
advisable to disseminate education and awareness. The organizations should also plan ad
hoc sessions dealing with topics and issues specifically related both to quality and risk
management, and in connection with broad organizational change processes requiring
careful and effective management of the transitional phase, they should envisage specific
training initiatives and/or ad hoc events aimed to describe how risk management does
represent a change strategic lever.
QUESTION MARK BOX
Q. Please point out the frequency of the specific training initiatives delivered from the start of the Risk
Management system, regardless of their kind:
R. “Yearly training on Risk Management and Internal Control System (ICS) in the framework of workshops (RM,
ICS) with an external expert. A presentation of the Risk Management system is provided to all new staff
members within Statistics Austria's general training programme (half-yearly)”.
Source: Austria, In-Depth survey on Risk management practices
2.3 Delivering roles and responsibilities
TAGS: Roles; Responsibilities; Accountabilities
Risk management should work at any organizational level as well as through participation by
the entire staff, according to respective roles and functions.
The Chief Statistician is responsible for ensuring the setup of an effective risk management
system throughout the organization;
20 Guidelines on Risk Management practices in statistical organisations – FIRST DRAFT
The Risk Committee/Board Entity is an oversight entity ruling Risk Management System
together with other strategic matters. The Committee/Board sets risk appetite in
cooperation with senior management and communicates it throughout the organization.
The Committee/Board is responsible for: monitoring compliance with the organization’s risk
policy; monitoring the adequacy of controls; monitoring changes to the organization’s risk
profile considered as a part of the organization’s strategy and planning processes; assisting
the senior management in selecting the key risks; periodically reviewing the Risk
Management reporting system as well as the adequacy of Risk Management resources;
escalating and reporting material risk issues to the Chief Statistician for consideration.
The Risk Manager works under the guidance of the Committee/Board, is either skilled or
even certified in Risk Management and supported by staff consistent with the size of the
organization (see below Risk Management unit). The Risk Manager is responsible for:
cooperating with Top Management in identifying high risk areas related to strategic or
business processes; cooperating with Top Management in defining treatment actions related
to key risks; supervising the Risk Management process. Its role should also include:
promoting a consistent use of risk management and ownership of risk at all levels within the
organization; building a risk-aware culture throughout the organization, including proper
education and training; developing, implementing and reviewing risk management;
coordinating the other advisory functions on specific aspects of risk management;
coordinating responses when risks impact more than one area; managing quality within risk
management; reporting, escalating and communicating risk management issues to key
stakeholders.
Top Management is responsible for: ensuring that there is a fit-for-purpose and up-to-date
risk management framework and process in place and that risk management is adequately
resourced and financed; providing strategic direction on the appropriate consideration of
risk in decisions, also setting risk appetite and associated authority; approving the risk
management policy and disseminating culture on managing risk; ensuring that key risks
facing the organization are properly assessed and managed; providing direction and
receiving feedback on the effectiveness of risk management and compliance with the risk
management policy.
The Head of Department/Divisions/Units must actively manage risks that are part of daily
work through complying with the enterprise risk management framework. In particular, such
offices: establish risk management objectives and formulate key risk indicators; clarify risk
management strategy and risk appetite to the staff; implement the risk management
process; manage the risks that fall within their areas of responsibility; cooperate in
identifying key risks; monitor risk management action programs; regularly report to senior
management any news or changes to existing risks, or failures of existing control measures.
21 Guidelines on Risk Management practices in statistical organisations – FIRST DRAFT
All staff must take risks into account when making decisions and is responsible for an
effective management of risks including identification of them. All staff is also responsible
for understanding and implementing risk management policies and processes.
Internal Audit (see details in Section 2, ch . 5) is responsible for reporting to the Board on
the adequacy of risk management processes within the organization, giving assurance on:
their design and how they are working; the effectiveness of controls and response actions to
key risks; reliability and suitability in assessment of risks. The achievement of the Internal
audit mandate is performed by a governance independent office that directly reports to the
Chief statistician.
The Risk Management Unit is coordinated by the Risk Manager and is responsible for:
collecting the Risk Identification Form filled by the structures (directorates, divisions, units)
under the responsibility of the related risk owner; analyzing the Form and proposing
preliminary treatment actions, escalating risk if it exceeds the unit’s level of authority;
validating or not the closing solution; setting tasks, risk-indicators, targets and deadlines for
proposed actions; preparing documentation for escalated risks and submitting it to
appropriate management level (in particular for the cross-cutting actions); monitoring the
implementation of control actions, to evaluate the results and propose corrective actions;
filling-in the Risk Register; filing risk documents; preparing risk documentation and
submitting it to the Risk Manager; preparing Risk Management meetings.
Description of tasks, deadlines and responsibilities for all the Risk Management process
actors must be included in a procedure to be made known throughout the organization at
least.
3. Risk Management Process (see Section 2)
The Risk Management process is one of the framework elements and derives from the Risk
Management policy, because it expresses such a policy from an operational point of view.
As an integral part of Risk Management framework, the Risk Management process is a
systematic application of management policies, procedures and practices to the tasks of
communicating, establishing the context, assessing, monitoring and reviewing risks.
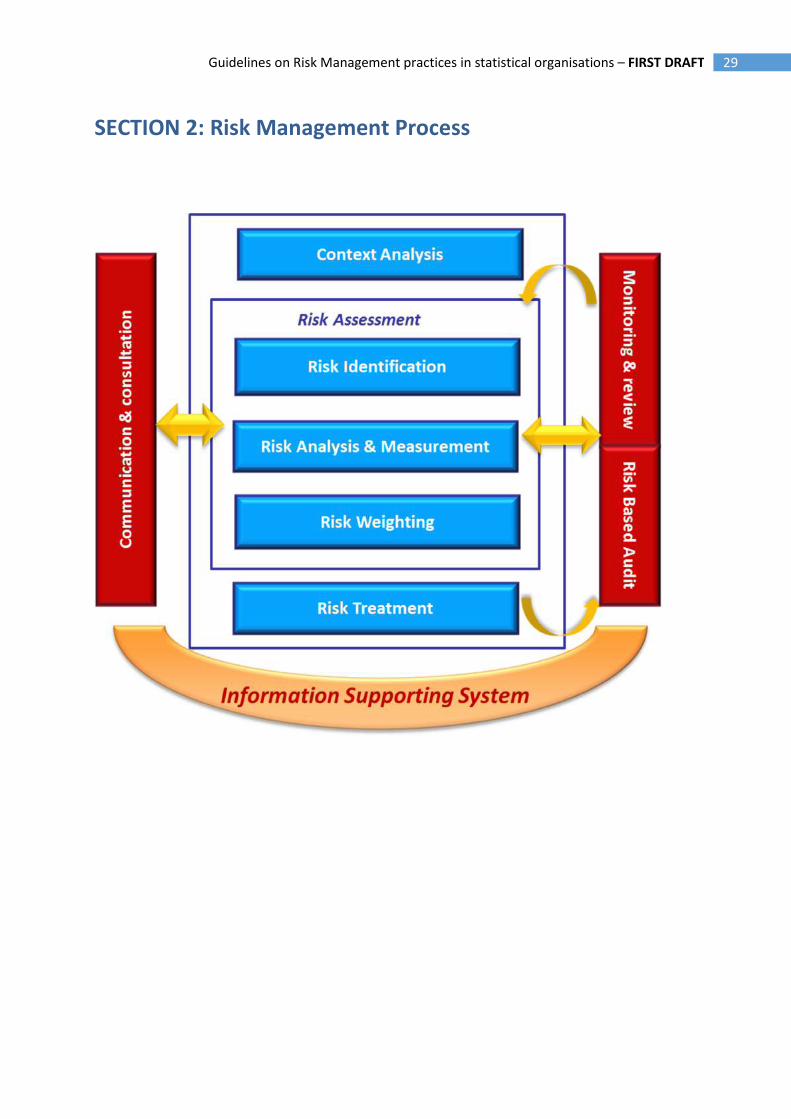
It comprises the following activities:
1) Communication and Consultation;
2) Context analysis;
3) Risk Assessment:
a. Identification;
b. Analysis and Measurement;
c. Weighting;
22 Guidelines on Risk Management practices in statistical organisations – FIRST DRAFT
4) Risk treatment;
5) Monitoring and Review.
The process should also concern the Risk Based Audit and the Information system support all
the phases.
Section 2 in this paper contains an analysis of each process phase.
4. Monitoring and Reporting
4.1 Monitoring & Review of the framework
TAGS: System deviations; Risk Management plan; Context Changes; Feedback.
In order to ensure that Risk Management system is effective and continue to support
organizational performance, an organization should:
1. periodically measure progress against and deviation from the Risk Management
policy and plan: the framework and processes should be fit-for purpose and aligned
to the objectives/priorities of the organization and relevant stakeholders should
receive adequate reporting to enable them to pass their role and responsibilities on
the governance structure;
2. periodically review whether the Risk Management framework, policy and plan are still
appropriate, given the organization's external and internal context: the organization
should ensure that changes to the context, or changes to other factors affecting the
suitability or cost of risk management, are identified and addressed;
3. periodically review of the Risk Management process: the risks management resources
should be quantitatively adequate and people across the organization should have
enough risk management skills, knowledge and competence, in line with the risk role
they are required to perform on a daily basis;
4. periodically report on the results of monitoring to the board: based on the results
from monitoring and review, decisions should be made to improve the organization's
management of risk and its culture, ensuring that the organization is able to learn
from risk events.
23 Guidelines on Risk Management practices in statistical organisations – FIRST DRAFT
4.2 Establishing reporting mechanisms
TAGS: Reporting system; Executive & Operative reporting; Stakeholders’ report;
Accountability.
An organization should ensure that information about risk derived from the risk
management process is adequately reported and used as a basis for decision making at all
relevant levels. To this purpose, clear reporting line mechanisms and strong inter-
department knowledge sharing should be established in order to encourage accountability
of risk and to ensure reports are delivered in an accurate, consistent and timely manner.
Moreover, the risk management policy (please see chapter 1) should clearly state the way
risk management performance will be reported.
In this respect, inadequate risk reporting11 can lead to a failure in fully integrating identified
risks into strategic and operational decisions. Aiming at ensuring that risk management is
effective and continues to support organizational performance, the organization should
report on progress against the risk management plan by proving how well the risk
management policy is being followed. More specifically:
1. the results from risk monitoring and review should be recorded as well as internally
and externally reported, if appropriate;
2. development in implementing risk treatment plans provides a performance measure:
the results should be incorporated into the organization's overall performance
management, measurement and internal and external reporting activities;
3. enhanced risk management comprises continual communications with external and
internal stakeholders (please see Section 2, chapter 1), including comprehensive and
frequent reporting of risk management performance, as a part of good governance.
The quality and success of risk reporting depend on the following factors:
- target audience;
- input and processes;
- frequency;
- content;
- format;
- dissemination channels.
Determining the target audience is important because it affects other risk reporting
11 ISO Guide 73:2009 defines risk reporting as a form of communication intended to inform particular internal or external stakeholders by providing information regarding the current state of risk and its management.
24 Guidelines on Risk Management practices in statistical organisations – FIRST DRAFT
decisions. Whenever a disclosure is asked by a regulatory requirement, the organization
must comply and provide appropriate disclosure. On the other hand, voluntary disclosures
should be subject to cost-benefit analysis of audiences’ needs and the kind of disclosure
(type and detail of risk). Reporting organizational risks should operate on multiple levels to
address the needs of diverse audiences, each with their own specific needs, requirements,
expectations, agendas and levels of expertise. In this regard, there are two areas of risk
reporting:
a) reporting to internal audiences.
b) reporting to external audiences.
The reporting of risks is essential for internal decision makers to integrate risk evaluations
into their operational and investment strategy, review of performance and
compensation/reward decisions. External risk reporting has rapidly developed in the last
years: corporate governance reports focus attention on internal control too and a review of
risks is generally included in the annual reports. Both internal and external audiences can be
further divided into two subgroups: on the one hand, some audiences (i.e., boards of
directors; regulators among external audiences) must be informed about the organizational
risks and risk management processes because of regulation or recommendations. Voluntary
disclosure to other internal audiences (i.e., employees) and external stakeholders (i.e.,
media, citizens’ associations) is recommended because of anticipated benefits to an
improved decision-making.
‘Inputs’ and ‘processes’ are also critical. The most important inputs are represented by:
I. the various risks an organization is facing;
II. the stakeholder risk reporting requirements and expectations;
III. the organization existing risk management governance that provides the context for
establishing risk reporting processes;
IV. the organizational resources (such as individuals with the necessary skills and
experience, financial resources, and access to required information).
How to decide which risks to report, and in what detail, must be discussed according to risk
reporting frequency.
a) Internal reporting
The organization should establish internal reporting mechanisms in order to support and
encourage accountability and ownership of risk. These mechanisms should ensure that: key
components of the risk management framework, its effectiveness and the outcomes and any
subsequent modifications, are properly disseminated; relevant information derived from the
application of risk management is available at appropriate levels and times; there are
25 Guidelines on Risk Management practices in statistical organisations – FIRST DRAFT
processes for consultation with internal stakeholders (please see SECTION 2, Ch. 1). These
mechanisms should, where appropriate, include processes to consolidate risk information
from a variety of sources, and may need to consider the sensitivity of the information.
Internal risk reports can be either real-time or periodic.
The main purpose of periodic internal risk reports is to provide aggregate information about
various relevant organizational risks, with trend indicators and periodic comparisons
highlighting changes in risks. Periodic internal risk reporting contributes to strategic
oversight and decision-making as well as improved operational business decisions. Risk
information may be organized around specific key risk categories rather than around phases
of the risk management process. Residual risk reporting involves comparing gross risk (the
assessment of risk before controls or risk responses are applied) and net risk (the
assessment of risk, taking into account any controls or risk responses applied) to enable a
review of risk response effectiveness and alternative management options. Risk reporting to
the board and committees should be made at least quarterly.
Internal audiences will be interested not only in disclosure of specific risks, but also in the
risk management process. A well established and properly managed process will assure
internal audiences about the reliability of risk reports: organizations must therefore include
information on the quality of their risk management process, particularly in their periodic
risk reports.
Comprehensive and frequent internal reporting on both significant risks and risk
management performance and process, substantially contributes to effective governance. In
this respect, different levels within an organization who need different information from the
risk management process require different report types:
• Executive reporting. The board of directors has the highest oversight responsibility
for developing and implementing the organization’s mission, values, and strategy,
and must carefully review corporate processes of risk identification, monitoring, and
management. The board also originates risk philosophy, risk appetite, and risk
tolerances. Specific reviews of financial objectives, plans and other significant
material transactions also typically fall within a board’s responsibility. These
responsibilities require broad and transparent reporting on the various organizational
risks (strategic, operational, reporting and compliance risks). Appropriate
communication to the board includes reporting on:
- progress against organizational objectives and related risks;
- effectiveness of the ongoing monitoring processes on risk and control matters,
including reporting any significant failings or weaknesses.
Risks can crystallize quickly and the board should ensure that there are clear
26 Guidelines on Risk Management practices in statistical organisations – FIRST DRAFT
processes for bringing significant issues to its attention more rapidly when required,
and agree triggers for getting that. The board should also specify the nature, source,
format and frequency of the information it requires and monitor the information it
receives, ensuring that information quality is enough to allow effective decision-
making.
• Operative Reporting. The risk management system should include procedures for
immediately reporting to appropriate levels of management any significant control
failings or weaknesses that are identified, together with details of corrective actions
being undertaken. Individuals should systematically and promptly report to low and
middle level management any perceived new risks or failures of existing control
measures. Middle level management should systematically and promptly report to
senior management any perceived new risks or failures of existing control measures:
actually, without proper internal reporting on organizational risks, managers cannot
make optimal tactical decisions. Senior management needs relevant and reliable risk
reports on a real-time and periodic basis for effective control: an example is
represented by the risk matrix, a table in which rows show the risks and columns
show their likelihood of occurrence and their impact.
• Review / Audit report. Internal audit reports are a key source of information on the
organization’s performance and control environment. The output of a review or an
audit will be a report summarizing findings and providing conclusions of the
assessment against pre-determined criteria. This report may provide
recommendations for system improvements based on what the reviewers have
observed. An annual report on the overall state of the organization’s internal controls
should be also provided (please see SECTION 2, Ch. 5).
QUESTION MARK BOX
Q. In your Organization, the Risk Management reporting is about:
R. “Management goals, results of risk Workshops, identification and measurement high priority risks,
monitoring of risk treatment actions. Monitoring of the implementation of strategic goals is also part of the
Risk Management reporting. The Risk Management reports are provided to the Management, risk owners, staff
involved and to the Economic Council”.
Source: Austria, In-Depth Survey on Risk management practices
b) External reporting
Organizations see increasing pressure for greater transparency, mandated or voluntary, and
27 Guidelines on Risk Management practices in statistical organisations – FIRST DRAFT
a better alignment of externally reported information with the internally reported one.
Stakeholders expect intensified corporate risk dissemination and awareness of the critical
role of proper risk management. In view of this, an organization should provide accurate,
timely and quality reports to meet the external stakeholders’ needs. Specifically, it should
periodically conduct a review of the effectiveness of the risk management system and report
to stakeholders on that as well as it has been carried out a robust assessment of the
principal risks, describing them and explaining how they are being managed or mitigated.
The organizations may consider preparing different, customized risk reports for different
external stakeholders. Besides, although internal risk reports aim exclusively at internal
audiences, from a broader perspective, external risk reporting, including corporate annual
reports, may include both external users and interested internal groups.
QUESTION MARK BOX
Q. If a specific Risk Management report with external stakeholders is envisaged, please describe its content:
R. “General description of the Risk Management system (in relation with initiatives within SSE and UNECE);
Objectives related to Risk Management process; Main risks identified, treatment actions; Monitoring results,
outcomes; Escalated risks, proposed course of action; Improvement of the Risk Management system, next
steps”.
Source: Romania, In-Depth Survey on Risk management practices
Q. Please specify the frequency of the Risk Management report that is addressed to the external stakeholders:
R1. “On demand”.
Source: Canada, In-Depth Survey on Risk management practices
R2. “Yearly”.
Source: Romania, Australia, In-Depth Survey on Risk management practices
R3. “Quarterly, Yearly”.
Source: Lithuania, In-Depth Survey on Risk management practices

28 Guidelines on Risk Management practices in statistical organisations – FIRST DRAFT
29 Guidelines on Risk Management practices in statistical organisations – FIRST DRAFT
SECTION 2: Risk Management Process

30 Guidelines on Risk Management practices in statistical organisations – FIRST DRAFT
31 Guidelines on Risk Management practices in statistical organisations – FIRST DRAFT
1. Communication & Consultation12
TAGS: Stakeholders’ involvement; Internal communication;
External communication; Information flow; Communication tools.
An organization should ensure that everybody within its staff,
according to their role, knows the organization’s risk strategy, risk
priorities and related accountabilities. Board responsibilities,
among other things, include ensuring sound internal information and communication
processes and taking responsibility for external dissemination on risk management and
internal control. ‘Communication and consultation’ is not a distinct stage in the management
of risk, it runs through the whole process. ‘Communication and consultation’ is important
since stakeholders make judgments about risk based on their own perceptions, which should
be identified, recorded13 and integrated into the decision making process.
Consultation with stakeholders therefore needs careful planning because it can build or
destroy trust. To strengthen trust in the process results and obtain endorsement for a
treatment plan, stakeholders should be involved in all aspects of risk management, including
design of communication and consultation process (please see the following sections: Par.
1.1, Par. 1.2).
To this purpose, a plan to disseminate and to account for risk management should involve:
- engaging internal and appropriate external stakeholders ensuring truthful, relevant,
accurate and effective exchange of information, taking into account confidential and
personal integrity aspects;
- external reporting to comply with legal, regulatory, and governance requirements
(please see SECTION 1, Ch. 4);
- providing feedback on communication, consultation and reporting mechanisms.
12 ISO Guide 73:2009 defines ‘communication and consultation’ as continual and iterative processes regarding the management of risk, that an organization conducts to provide, share or obtain information and to engage in dialogue with stakeholders. Consultation is considered a two-way process of informed communication between an organization and its stakeholders on an issue prior to making a decision or determining a direction. 13 Records of communication and consultation will depend on factors such as the scale and the sensitivity of the activity.
32 Guidelines on Risk Management practices in statistical organisations – FIRST DRAFT
QUESTION MARK BOX
Q. What are the most important lessons learned from implementing risk management in your organization that
other organizations should take into account when developing their own risk management processes?
R. “When develop their own Risk Management processes, National Statistics Institutes should take into account
that is essential ensure listening and using feedback”
Source: UK, Survey on Risk management practices
Q. What are the strengths of the risk management system in your organization?
R. “All employees and necessary stakeholders are consulted during the risk management process”
Source: South-Africa, Survey on Risk management practices
1.1 Internal Communication
Two-way communication with the internal audiences (i.e. board of directors; audit / internal
control steering committees, if any; all management levels; employees; integrated supply
chain partners / other partners, according to an open organization vision) should be
considered as a resource to improve the risk management process. Facilitating risk
management policy implementation and general engagement in the different process
phases is crucial to the entire system effectiveness. Open communication helps decision
making processes use risk management information. Moreover, it helps in getting the
corporate risks14 come out and suggests the cross-organizational actions to be implemented
in cooperation with the different divisions.
To this purpose, the organization should establish internal communication flows in order to
support accountability and ownership of risk along with widespread involvement. These
mechanisms ensure that key components of the risk management framework, as well as any
subsequent modifications, are properly communicated and submitted for consultation.
Internal communication and consultation mechanisms include methodology and the tools
through which an organization ensures that everybody within the organization understands,
according to his/her role:
• what the risk strategy consists of;
• which the risk priorities are;
• how the accountabilities are assigned and how the related responsibilities fit into the
risk framework (who does what).
Identification of new risks or changes in risks already assessed also depends on maintaining a
good communication network that is made as such by relevant contacts and sources of 14 Risks/criticalities gathered into categories according to their strategic significance, and monitored and treated as a
priority.
33 Guidelines on Risk Management practices in statistical organisations – FIRST DRAFT
information. If this is not achieved, risk priorities may not be consistently addressed. A
consultative team approach may therefore be useful to help properly define the context in
order to ensure risks are identified effectively, to bring different areas of expertise together
in analyzing risks, to ensure different views are appropriately considered in evaluating risks
and to make appropriate change management during risk treatment.
Risk management goals should be discussed within each organization unit or project15 and
clearly communicated (for example through the ‘Risk appetite’ statement). All staff, both
management and non-management employees and necessary internal stakeholders, should
be consulted during the risk management process. Risk identification and response should
result from a cooperative effort involving key elements from every project or process, as
well as feedback from management on the Integrated Risk Management process16.
Moreover, in concrete statistical areas, cross-institutional commissions and working groups
can play an important role.
To summarize, the internal communication:
• assists in embedding the desired behaviors throughout the organization;
• engages staff in risk management activities;
• enhances risk management process transparency and encourages accountability and
ownership of risk;
• facilitates cooperation among the offices/units in defining cross-cutting initiatives e
common understanding of concepts, rules for action and integration of risk
management in statistical processes, as a basis to prioritize control actions for
continuous improvement.
Consequently, an Internal Communication Plan should include:
• establishing a team responsible for communicating about managing risk;
• raising awareness about managing risks and the risk management process
throughout the organization.
Plans/policy papers, methodological documents and information resulting from the Risk
management system should be disseminated and made available to all employees. As for
the specific communication channels, here follows some examples: internal events (e.g.
workshops, seminars)17, broadcast e-mails, broadcast voice mails, databases supporting
15 As an example, a risk matrix can be elaborated, as a teamwork task - under the direction by who is responsible for any major statistical and/or organizational project - and the results should be communicated to every participant in the project, in order that they may be aware of their respective duties. 16 Usually on a yearly basis.
17 Especially during the start-up phase, meetings with all the organizational divisions involved should be
organized with the purpose of discussing various topical issues in more detail and providing every staff
member with the opportunity to express its own opinion and to participate in the decision-making process.
34 Guidelines on Risk Management practices in statistical organisations – FIRST DRAFT
specific risk issues, letters from the board, e-mail discussion groups, Intranet sites capturing
information regarding enterprise risk management for easy access by personnel, Web info
sessions, conference calls, posters or signs reinforcing key aspects of enterprise risk
management, face-to-face discussion, newsletters from the Chief risk officer, field debriefing
sessions, Knowledge sharing systems (i.e. wiki, SharePoint sites).
QUESTION MARK BOX
Q. Risk management goals are clearly communicated within your organization.
R. “Strongly Agree. The procedures and other documents related to the Risk Management process could be
disseminated within the body in charge of monitoring, coordination and methodological guidance of the
internal / managerial control system development of the NIS. It should be composed of top management from
all statistical domains”.
Source: Romania, In-Depth survey on Risk management practices
1.2 External Communication
An organization should periodically inform and consult its external stakeholders:
a. about how risks are managed;
b. to deal with stakeholders’ expectations about what the organization can actually
deliver;
c. to assure them that the organization will deliver the way they expect.
Effective external communication and consultation ensures that stakeholders understand
the basis on which decisions are made.
Actually the ‘Risk profile’ should be developed through a comprehensive process including
review of risk information and reflecting recommendations from several sources. It is
important that organizations consider each of their significant relationships with partners,
contractors and third parties and ensure that appropriate communication and
understanding about respective risk priorities are achieved. Communication to external
stakeholders about risk issues is crucial: misunderstanding on respective risk priorities can
cause serious problems.
A regular and well-made Risk Management Stakeholder Relationship Plan should take into
account and effectively set its critical components: dissemination strategy and channels.
Particularly, presentations from senior leaders show support and set expectations for staff in relation to
risk, so positively grounding a risk culture.
35 Guidelines on Risk Management practices in statistical organisations – FIRST DRAFT
With reference to the first element, the corporate site is particularly useful for external real-
time risk communication. With respect to external periodic risk communication, parts of
annual reports or quarterly reports (electronic and/or hard-copy version), are generally
viewed as the main channels. Possible communication tools to share information with
external stakeholders and to promote dialogue are as follows:
1. corporate site;
2. publications and papers;
3. annual meetings;
4. other external events (e.g. conferences, scientific meetings, workshops, seminars,
days of study);
5. corporate newsletters;
6. messages integrated into ongoing corporate communications.
Whatever method is practiced, the communication goal should be to provide external
audiences with a sound basis to make comprehensive assessments of reported data (please
see section 1, chapter 8).
Above all, a model of risk communication should integrate, instead of fragment, the risk-
related information that an organization uses for external disclosure. The challenge is to
inform the average member of the external audiences, while being fair and balanced in
covering all critical perspectives.
QUESTION MARK BOX
Q. If risks are identified with internal and/or external stakeholders please indicate what kind of consultation is
used.
R. “Users of statistics, respondents and other national producers of official statistics should have possibility to
make suggestions, comments, complains. Single contact point is established”
Source: Lithuania, Survey on Risk management practices
36 Guidelines on Risk Management practices in statistical organisations – FIRST DRAFT
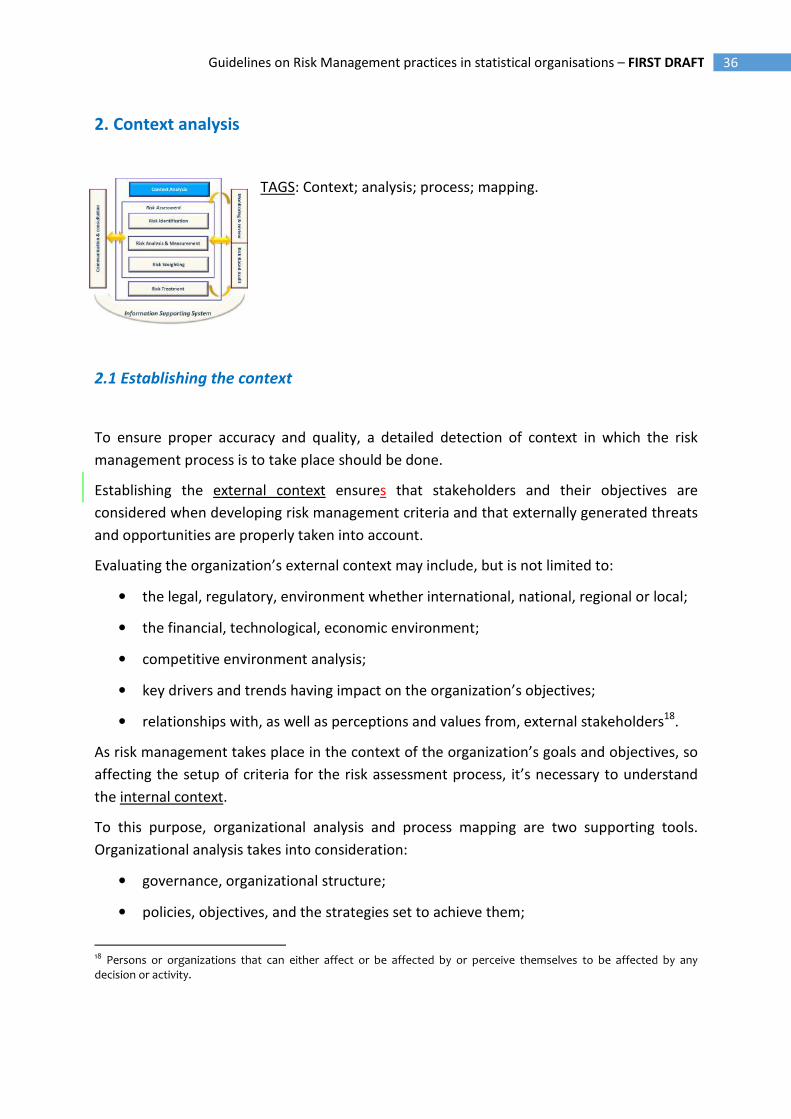
2. Context analysis
TAGS: Context; analysis; process; mapping.
2.1 Establishing the context
To ensure proper accuracy and quality, a detailed detection of context in which the risk
management process is to take place should be done.
Establishing the external context ensures that stakeholders and their objectives are
considered when developing risk management criteria and that externally generated threats
and opportunities are properly taken into account.
Evaluating the organization’s external context may include, but is not limited to:
• the legal, regulatory, environment whether international, national, regional or local;
• the financial, technological, economic environment;
• competitive environment analysis;
• key drivers and trends having impact on the organization’s objectives;
• relationships with, as well as perceptions and values from, external stakeholders18.
As risk management takes place in the context of the organization’s goals and objectives, so
affecting the setup of criteria for the risk assessment process, it’s necessary to understand
the internal context.
To this purpose, organizational analysis and process mapping are two supporting tools.
Organizational analysis takes into consideration:
• governance, organizational structure;
• policies, objectives, and the strategies set to achieve them;
18 Persons or organizations that can either affect or be affected by or perceive themselves to be affected by any decision or activity.
37 Guidelines on Risk Management practices in statistical organisations – FIRST DRAFT
• resources and knowledge (e.g., capital, time, people, processes, systems and
technologies);
• information systems;
• relationships with, as well as perceptions and values from, internal stakeholders and
the organization’s culture;
• standards, guidelines and models adopted by the organization.
Through process mapping all processes are broken down, analyzed and represented while
identifying inputs, information flows, roles and accountabilities and outputs for each of
them.
2.2 Process19
mapping
Risk management system implementation requires a deepen and documented process
analysis concerning the whole organization: it must increasingly involve all activities while
distinguishing among core and cross-cutting, down to operational activities in detail. Process
mapping should allow an organization to carry out ‘Risk identification’ phase (please see
chapter 3) describing objectives, staff, activities, responsibilities, organizational units,
outputs, deadlines, sequence and links/interactions among the sub-processes and related
documented procedures.
Consequently, ‘Risk analysis’ phase (please see chapter 3) is also effective when including
identification of all key processes containing potential exposure to some consequence. To
this purpose, it should involve process analysis, directing special attention to key cross-
organizational dependencies and significant control nodes, for example: where data
originate, where they are stored, how they are converted to useful information and who
uses such information.
Process mapping activity entails different steps:
• identifying all routine activities within the scope of the specific process analyzed;
• grouping the activities into key sub-processes;
• determining the sequence of events and links between the sub-processes.
19 ISO 9000:2000 defines the ‘process’ as a set of interrelated or interacting activities which transforms inputs (financial, people, technology, facilities, information) into outputs. Inputs to a process are generally outputs from other processes. Processes in an organization are planned and carried out under controlled conditions in order to add value. ISO 8042:1994 defines the ‘process’ as a set of inter-related resources and activities which transforms inputs into outputs. Resources may include personnel, facilities, equipment, technology and methodology.
38 Guidelines on Risk Management practices in statistical organisations – FIRST DRAFT
To ensure process maps accurately reflect what actually happens, organizations may
combine different methods (see appendix), so an organization should choose the kind of
‘Process Modelling & Mapping’ suitable for its specific goals. The map can be a simple
macro-flowchart only showing enough information to understand the general process flow,
or it might be detailed to show every single action and decision point.
What follows is a description of different mappings.
• Macro-level process map. This is a very deep level as well as rather rare mapping that
outlines the operational routes of an organization.
• Top-Down or High-level process map. It shows end-to-end processes across the above
operational areas. It is quick and easy to draw, but may not provide the necessary details
to build understanding or realize improvements. It is good to show the major clusters of
activity in a process.
• Cross-functional process map. It shows roles, inputs, outputs and steps required to
complete a specific process within an operational area. Cross-functional process mapping
provides enough information for improvement efforts and uses flowcharts to show the
relationship between a business process and the functional units (such as departments)
responsible for such a process. These charts emphasize where people or groups fit into
the process sequence and how they relate to one another throughout the process. Cross-
functional charts are excellent tools to show how a process flows across organizational
boundaries.
• Detailed Process Flowchart. It details systems, instructions and procedures required to
complete steps in processes at level three (Cross-functional process map) and shows
inputs, outputs, related steps and decision points. Because of the level of detail such a
mapping can be resource-intensive to create, nonetheless it can offer the greatest
improvement potential since it shows decisions and subsequent actions, so providing
excellent training and reference materials. Flowcharts may be maps or graphical
representations.
The process owner should be in charge of process mapping, while process analysis should be
made by other roles (either within or without the organization) in order not to be influenced
by one’s own working method.
Lastly, reference to the maps, procedural information and the maps themselves need to be
stored in a consistent structure called Process Library. Responsibility for Process Library
needs to be clear just like any process itself needs an owner.
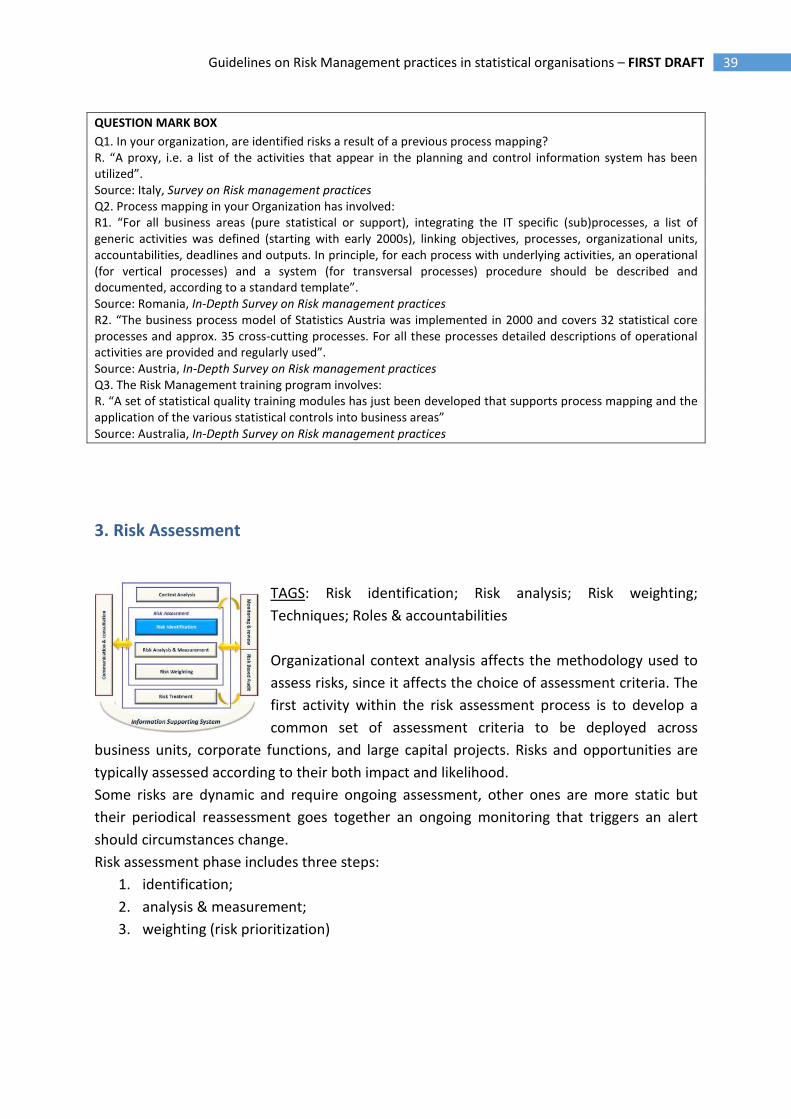
39 Guidelines on Risk Management practices in statistical organisations – FIRST DRAFT
QUESTION MARK BOX
Q1. In your organization, are identified risks a result of a previous process mapping?
R. “A proxy, i.e. a list of the activities that appear in the planning and control information system has been
utilized”.
Source: Italy, Survey on Risk management practices
Q2. Process mapping in your Organization has involved:
R1. “For all business areas (pure statistical or support), integrating the IT specific (sub)processes, a list of
generic activities was defined (starting with early 2000s), linking objectives, processes, organizational units,
accountabilities, deadlines and outputs. In principle, for each process with underlying activities, an operational
(for vertical processes) and a system (for transversal processes) procedure should be described and
documented, according to a standard template”.
Source: Romania, In-Depth Survey on Risk management practices
R2. “The business process model of Statistics Austria was implemented in 2000 and covers 32 statistical core
processes and approx. 35 cross-cutting processes. For all these processes detailed descriptions of operational
activities are provided and regularly used”.
Source: Austria, In-Depth Survey on Risk management practices
Q3. The Risk Management training program involves:
R. “A set of statistical quality training modules has just been developed that supports process mapping and the
application of the various statistical controls into business areas”
Source: Australia, In-Depth Survey on Risk management practices
3. Risk Assessment
TAGS: Risk identification; Risk analysis; Risk weighting;
Techniques; Roles & accountabilities
Organizational context analysis affects the methodology used to
assess risks, since it affects the choice of assessment criteria. The
first activity within the risk assessment process is to develop a
common set of assessment criteria to be deployed across
business units, corporate functions, and large capital projects. Risks and opportunities are
typically assessed according to their both impact and likelihood.
Some risks are dynamic and require ongoing assessment, other ones are more static but
their periodical reassessment goes together an ongoing monitoring that triggers an alert
should circumstances change.
Risk assessment phase includes three steps:
1. identification;
2. analysis & measurement;
3. weighting (risk prioritization)
40 Guidelines on Risk Management practices in statistical organisations – FIRST DRAFT
3.1 Risk Identification
TAGS: Risk Definition; Risk Criteria; Risk Identification; Different approaches; Risk Hierarchy;
Techniques; Stakeholder’s involvement; Roles & accountabilities.
Risk generally is the uncertainty inherently related to consequence – either positive i.e.
opportunity or negative i.e. threat – of actions and events. It is measured through a
combination of likelihood and impact, including perceived relevance. “Inherent risk” is the
exposure arising from a specific risk before any action has been taken to manage it, while
“residual risk” is the exposure arising from a specific risk after any action has been taken to
manage it and in case such an action has proved effective.
An organization defines the criteria to be used to evaluate risk significance. Such criteria
should reflect both the stakeholders’ risk perception based on a set of values/concerns and
the organization’s values, objectives and resources. Some criteria can be imposed by, or
derived from, legal and regulatory requirements. Risk criteria should be consistent with the
organization’s risk management policy defined in the Risk Management framework.
Defining risk criteria involves deciding on:
1. the nature and kind of consequences to be included and how they will be measured;
2. the way probabilities are to be expressed;
3. how a level of risk is going to be determined;
4. the criteria on determining when a risk needs treatment;
5. the criteria on deciding when a risk is acceptable and/or tolerable;
6. whether and how combinations of risks will be taken into account.
Risk identification means analyzing several issues:
• source/root cause event: any activity having a potential to increase a specific risk,
whether or not such an activity is under the control of the organization;
• areas of impact: it deals with categorization/prioritization of consequences;
• enablers: the organizational features helping a risk-event to occur;
• events: occurrence of a particular set of circumstances; and
• their potential consequences: potential outcome of an event. A wide range of risk
consequences should be considered, including cascade and cumulative effects.
The above-said issues can create, enhance, prevent, degrade, accelerate or delay the ability
of either the whole organization or part of it to achieve its own objectives.
41 Guidelines on Risk Management practices in statistical organisations – FIRST DRAFT
I. Identification approaches
The coordination of Risk Management process phases is centralized: the Risk Office analyzes
and draws up information related to each process phase and goes along with strategic
planning as well as the board, which it has to directly report to.
The Risk Committee, with the Risk Manager playing the role of coordinator, sets up the
criteria to select the most relevant information coming from the Risk Management
information system (selective approach). Significant risks as far as either impact or strategic
level are concerned are reported by the office supporting the Risk manager on a regular,
specific and exception basis. The Risk manager gives directions on translating strategies into
risk management objectives and monitors their achievement by divisions/offices and
managers within their own competence. The Risk manager therefore finalizes the
information received by adapting it to the organizational context down to any single office
(top-down perspective), in order to correct possible deviations from strategic priorities.
Risk registers making involves, on the one hand, a folding of organizational risks (corporate
as well as project and operational ones), on the other hand, a setting up of specific risk
registers (work health and safety, fraud, IT security, environment, etc.).
As for the involvement of management & stakeholders, three kinds of approach can be
followed in identifying risks:
• Top down-approach: the decision-making process is centralized at governance level. This
approach can show two modes: a) Full top-down mode, that is, the business units’ risks
are listed at department level, meaning that heads of unit cannot add risks themselves at
unit level. There is no need of risk escalation, except for department level. b) Prevailing
top-down mode, that is, a corporate risk register is directly created from a detailed
operational risk register.
• Bottom-up approach: the decision-making process is done at management level.
Operational risks are identified by any staff member while performing his or her daily
work (e.g., in order to encourage the staff to be more active in defining non-
conformities, an opportunity to register them online has been provided).
• Mixed approach: the board entity states the criteria (top-down) by which the heads of
unit identify and manage risks (bottom-up). Risks may be viewed and assessed
throughout the organization at any level (e.g., Group, Program, Office, Project, etc.). In
order to set the Framework, the hierarchy of risks on which attention is focused
corresponds to the enterprise, operational and project levels.
Such approaches are not mutually exclusive, and a combination of approaches to the risk
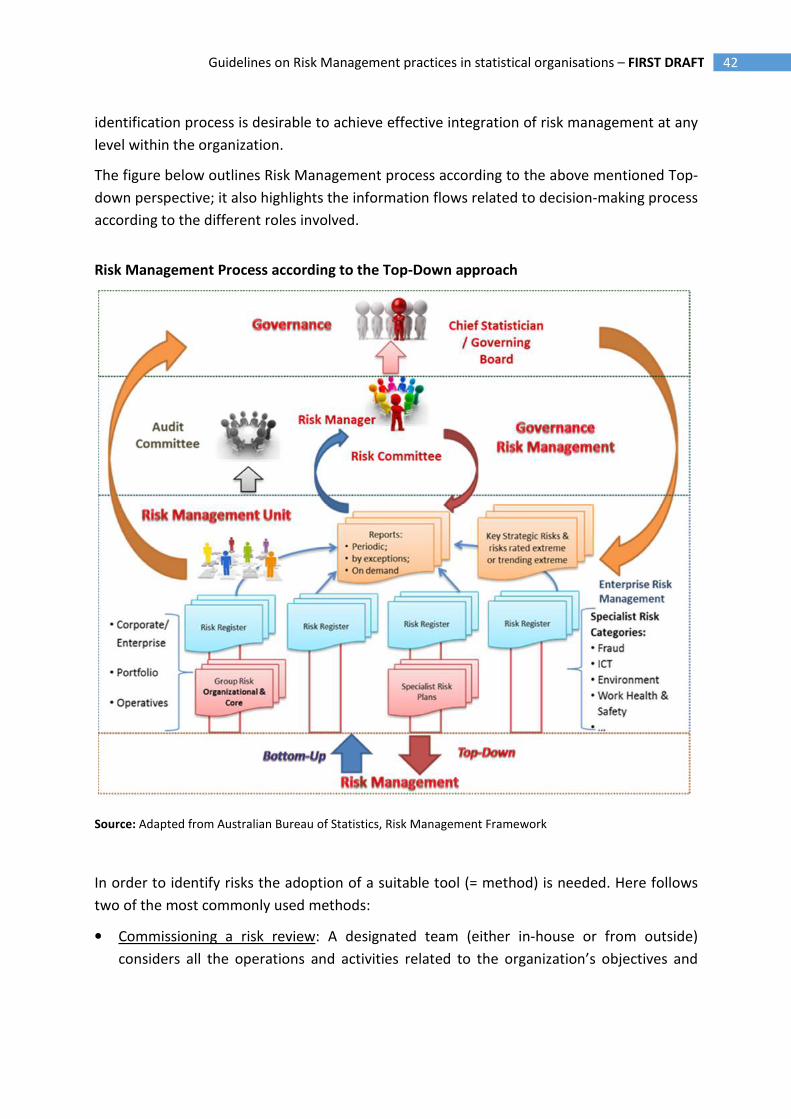
42 Guidelines on Risk Management practices in statistical organisations – FIRST DRAFT
identification process is desirable to achieve effective integration of risk management at any
level within the organization.
The figure below outlines Risk Management process according to the above mentioned Top-
down perspective; it also highlights the information flows related to decision-making process
according to the different roles involved.
Risk Management Process according to the Top-Down approach
Source: Adapted from Australian Bureau of Statistics, Risk Management Framework
In order to identify risks the adoption of a suitable tool (= method) is needed. Here follows
two of the most commonly used methods:
• Commissioning a risk review: A designated team (either in-house or from outside)
considers all the operations and activities related to the organization’s objectives and
43 Guidelines on Risk Management practices in statistical organisations – FIRST DRAFT
identifies the associated risks. Such a team should conduct interviews with key staff at all
organizational levels in order to build a risk profile for the whole range of activities (but it
is important for this approach not to undermine line management’s awareness of their
own responsibilities in managing the risks that are relevant to their objectives);
• Risk self-assessment: Each level and part of the organization is invited to review its
activities and to contribute its diagnosis for the risks it faces. This may be done through
paper documentation (with a framework for diagnosis set out through questionnaires),
but is often more effectively conducted through a workshop approach with facilitators
helping groups of staff to work out the risks affecting their objectives. A particular
strength of this approach is that ownership of risk is better established when the owners
themselves identify the risks.
QUESTION MARK BOX
Q. With reference to the approach adopted, please detail the methodology being used while specifying roles,
accountabilities and connections to the different process phases:
R. The process starting by engaging all Directors to respond to a risk questionnaire to identify the top three/five
risks from a divisional program perspective. For this purpose program-level risk registers were reviewed and
approved by their respective Field Planning Boards, to ensure consistency in the understanding and relative
importance of the risks identified at the divisional or program level. The results of this exercise is presented to
the Top-Management Board, who then provides his-own perspective on the corporate risks facing the
organization.
Source: Statistics Canada, In-Depth survey on risk Management practices
QUESTION MARK BOX
Q. The selected organizational stakeholders have been involved in:
R. All stakeholders should identify risks: every staff member can inform process managers about draw-backs
and risks identified in their process (Statistics Lithuania).
R. Risk identification and analysis should be dispersed around the organization and carried out by the
departments, units, territorial statistical departments, teams and projects (Statistics Finland)
Source: Survey on Risk Management Practices
II. Risk hierarchy & risk categorization
The Risk Management framework includes a hierarchy of risks, that is, a variety of risk levels
together with priorities in risk treatment strategies.
- Enterprise or so-called “corporate” risks are strategic i.e. can significantly impact on
the organization. To manage them is fundamental to the long term viability of the
organization and this must be done under the supervision of the Risk Committee;
- Portfolio management risks are inherently related to the portfolio of projects as a
44 Guidelines on Risk Management practices in statistical organisations – FIRST DRAFT
whole and are managed by senior management. Some examples of portfolio risk are:
affordability of the portfolio; lack of capability/capacity to implement the portfolio;
lack of timely availability of skills and human resources;
- Project risks can impact on the projects’ objectives and outcomes and are managed
by the project risk manager; where appropriate, they will be addressed as part of the
Project Management Framework. Some examples of project risk are: project scope
poorly defined, resources not available when required, quality requirements not
clearly specified.
- Operational risks can impact on a program's objectives and/or outcomes (i.e.
unsuitable skills mix, resources reduced due to budget cuts, outputs not delivered on
time, poor quality outputs) and are managed by the program directors.
While each risk captured may be important to management at function and business unit
level, the corporate risk list requires prioritization to focus board and senior management
attention on key risks.
The management of risk at corporate, enterprise and operational levels needs to be
integrated so that the levels of activity support each other. In this way the organization’s risk
management strategy will be led from the top and embedded in the normal working
routines and activities.
Risks specialists on specific risks, directly referring to the related senior managers, are
needed alongside. Specific risk areas are, for example:
- health and safety risks;
- fraud risks (i.e., manipulation of any procedures for bad purposes; failure to comply
with procedures and/or internal regulations to award management and non-
management offices; alteration of checks on execution of works or on delivery of
supplies; etc.);
- ICT risks (i.e., security systems risks; business continuity; etc.)
An organization should therefore set and document its risk categories and risk consequence
categories according to its size, purpose, nature, complexity and context. The risk categories,
including those from stakeholders, should be communicated through the organization in
order to share a common understanding.
Grouping similar kinds of risks into risk categories helps:
1. allow consistent assessment;
2. profile and report the consequences of actual and potential events;
3. facilitate comparison across the organization;
45 Guidelines on Risk Management practices in statistical organisations – FIRST DRAFT
4. aggregate and map similar kinds of risk across the organization;
5. allocate risk management responsibilities;
6. build internal skills, knowledge and expertise throughout the organization.
The Table below shows risk categories and classes for a NSO according to the allocation
suggested by Co.S.O. Enterprise Risk Management standard.
Strategic Statistical production, Statistical data dissemination,
Management systems and processes, Organization
Operational HR, Finance, ICT, Procurement
Compliance Compliance to law, standards
Reporting Communication flows
III. Risk Identification techniques
Risk identification may require a multidisciplinary approach since risks may cover a wide
range of causes and consequences.
Risk identification methods can include:
a) evidence based methods, for example checklists and historical data reviews;
b) systematic team approaches (a team of experts systematically identifies risks by
means of a structured set of prompts or questions (i.e. structured or semi-structured
interviews, Brainstorming20, Delphi method21);
c) inductive reasoning techniques (i.e. preliminary hazard analysis, HAZOP, HACCP);
d) scenario analysis (i.e. root-cause analysis, scenario analysis as such, cause-
consequence analysis);
e) statistical methods (i.e. Monte-Carlo analysis, Bayesian analysis).
In implementing the techniques the maturity of a Risk Management system should always
be taken into account. During the experimental phase of the Risk Management model, since
the know-how required could not be available from the staff, the experience analysis should
20
Brainstorming is a means of collecting a broad set of ideas and evaluation, ranking them by a team. It may be
stimulated by prompts or by one-on-one and one-on-many interview techniques
21 A means for combining expert opinions to support the source and influence identification, probability and consequence estimation and risk evaluation. It is a cooperative technique for building consensus among experts (ISO ISO31010 – Risk Assessment Techniques)
46 Guidelines on Risk Management practices in statistical organisations – FIRST DRAFT
always be combined with either structured or semi-structured interview or a prompt/check
list, in order to guide risk owners through the risk analysis.
The experience analysis needs to be based on actual information through the examination of
data from various systems (e.g. electronic document management systems, non-
conformities and IT incidents registration system, time use recording system, as well as a
specific system to record quality features of statistical surveys). When in a later stage the risk
management culture is established throughout the organization, brainstorming and the
Delphi technique can replace the interview, the cause/consequence analysis, the check-list
or any other simpler kind of scenario analysis.
Factors influencing selection of techniques are:
1. problem complexity and the methods needed to analyze it;
2. the nature and degree of risk assessment uncertainty, that is based on the amount of
information available as well as on what is required to satisfy objectives;
3. the extent of resources needed in terms of time and level of expertise, data needs or
cost;
4. whether the method can provide a quantitative output.
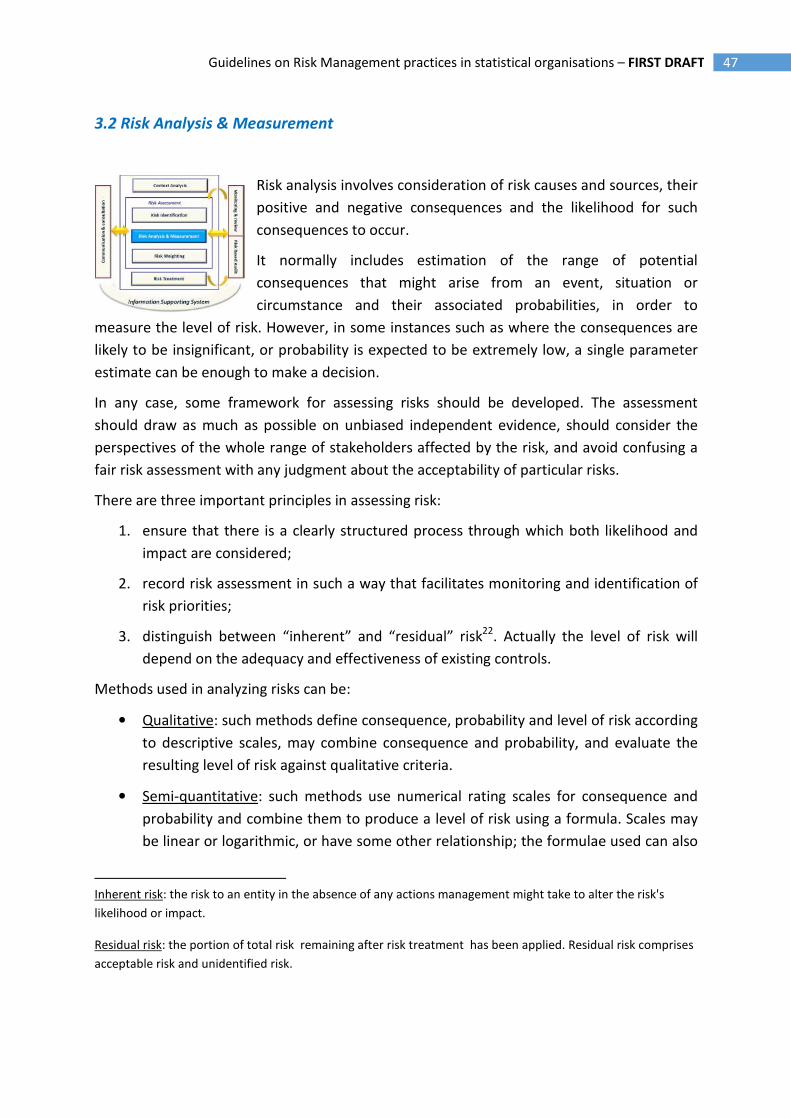
47 Guidelines on Risk Management practices in statistical organisations – FIRST DRAFT
3.2 Risk Analysis & Measurement
Risk analysis involves consideration of risk causes and sources, their
positive and negative consequences and the likelihood for such
consequences to occur.
It normally includes estimation of the range of potential
consequences that might arise from an event, situation or
circumstance and their associated probabilities, in order to
measure the level of risk. However, in some instances such as where the consequences are
likely to be insignificant, or probability is expected to be extremely low, a single parameter
estimate can be enough to make a decision.
In any case, some framework for assessing risks should be developed. The assessment
should draw as much as possible on unbiased independent evidence, should consider the
perspectives of the whole range of stakeholders affected by the risk, and avoid confusing a
fair risk assessment with any judgment about the acceptability of particular risks.
There are three important principles in assessing risk:
1. ensure that there is a clearly structured process through which both likelihood and
impact are considered;
2. record risk assessment in such a way that facilitates monitoring and identification of
risk priorities;
3. distinguish between “inherent” and “residual” risk22. Actually the level of risk will
depend on the adequacy and effectiveness of existing controls.
Methods used in analyzing risks can be:
• Qualitative: such methods define consequence, probability and level of risk according
to descriptive scales, may combine consequence and probability, and evaluate the
resulting level of risk against qualitative criteria.
• Semi-quantitative: such methods use numerical rating scales for consequence and
probability and combine them to produce a level of risk using a formula. Scales may
be linear or logarithmic, or have some other relationship; the formulae used can also
Inherent risk: the risk to an entity in the absence of any actions management might take to alter the risk's
likelihood or impact.
Residual risk: the portion of total risk remaining after risk treatment has been applied. Residual risk comprises
acceptable risk and unidentified risk.
48 Guidelines on Risk Management practices in statistical organisations – FIRST DRAFT
vary.
• Quantitative: this kind of analysis estimates practical values for consequences and
their probabilities, and produces numerical values for impact, likelihood and level of
risk using data from a variety of sources. Full quantitative analysis may not always be
possible or desirable due to poor information about the object being analyzed, lack
of data, influence of human factors, etc.
Both qualitative and quantitative techniques imply advantages and disadvantages.
Qualitative analysis is relatively quick and easy, provides a lot of information about non-
financial impacts and is easily understood by a large number of employees.
On the other hand, it doesn’t make much difference among levels of risk, cannot numerically
aggregate or address risk interactions and correlations and provides limited opportunity to
perform cost-benefit analysis.
Quantitative analysis allows many qualitative methods weaknesses to be overcome,
although it can be time-consuming and costly especially at first, during model development.
Cause-effect analysis is a semi-qualitative, structured method allowing a potential event to
be traced back to its original causes. It organizes possible contributory factors into broad
categories so that all relevant hypotheses can be considered. It does not, however, by itself
point to the actual causes, since these can only be determined by real evidence and
empirical testing of hypotheses. Cause-and-effect analysis provides a structured pictorial
display (diagram) of a list of causes for a specific effect (positive or negative depending on
the context). It is used to allow consensus on all possible scenarios and the most likely
causes detected by a team of experts; such causes can then be tested empirically or by
evaluation of available data.
A cause-and-effect diagram can be made when there is need to:
• identify the possible root-causes for a specific effect, problem or condition;
• sort out and correlate some of the interactions among factors affecting a particular
process;
• analyze existing problems so that improvement action can be taken.
The input to a cause-and-effect analysis may come from expertise and experience from
participants or a previously developed model that has been used in the past.
The cause-and-effect analysis should be carried out by a team of experts aware of the
problem requiring resolution.
The basic steps in performing a cause-and-effect analysis are as follows:
1. establishing the effect to be analyzed and placing it in a box;
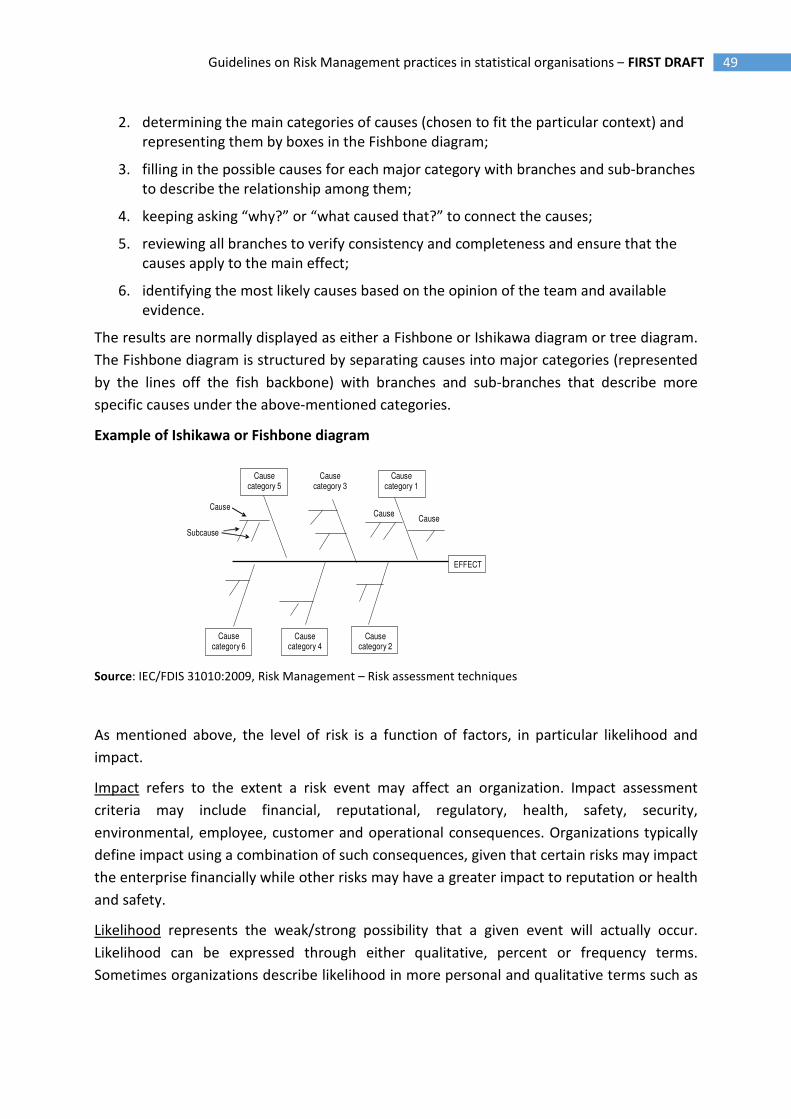
49 Guidelines on Risk Management practices in statistical organisations – FIRST DRAFT
2. determining the main categories of causes (chosen to fit the particular context) and
representing them by boxes in the Fishbone diagram;
3. filling in the possible causes for each major category with branches and sub-branches
to describe the relationship among them;
4. keeping asking “why?” or “what caused that?” to connect the causes;
5. reviewing all branches to verify consistency and completeness and ensure that the
causes apply to the main effect;
6. identifying the most likely causes based on the opinion of the team and available
evidence.
The results are normally displayed as either a Fishbone or Ishikawa diagram or tree diagram.
The Fishbone diagram is structured by separating causes into major categories (represented
by the lines off the fish backbone) with branches and sub-branches that describe more
specific causes under the above-mentioned categories.
Example of Ishikawa or Fishbone diagram
Source: IEC/FDIS 31010:2009, Risk Management – Risk assessment techniques
As mentioned above, the level of risk is a function of factors, in particular likelihood and
impact.
Impact refers to the extent a risk event may affect an organization. Impact assessment
criteria may include financial, reputational, regulatory, health, safety, security,
environmental, employee, customer and operational consequences. Organizations typically
define impact using a combination of such consequences, given that certain risks may impact
the enterprise financially while other risks may have a greater impact to reputation or health
and safety.
Likelihood represents the weak/strong possibility that a given event will actually occur.
Likelihood can be expressed through either qualitative, percent or frequency terms.
Sometimes organizations describe likelihood in more personal and qualitative terms such as
Cause category 5
Cause category 3
Cause category 1
Cause
Subcause
Cause
Cause
EFFECT
Cause category 6
Cause category 4
Cause category 2
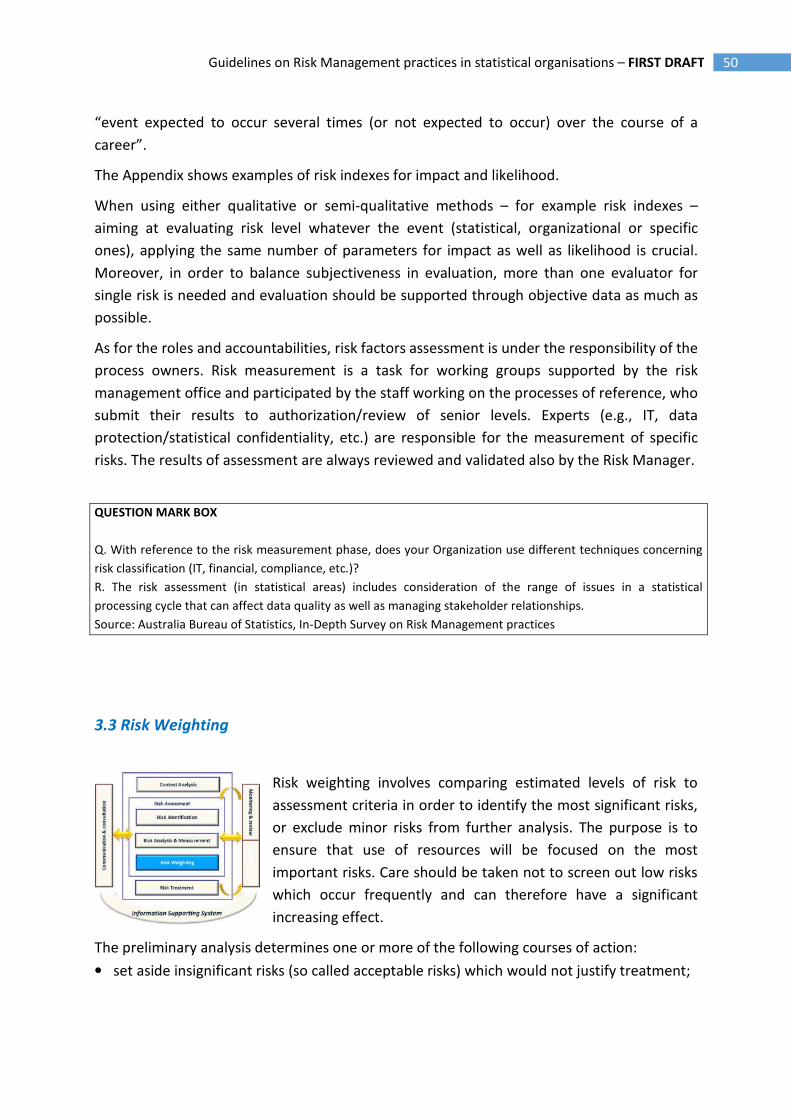
50 Guidelines on Risk Management practices in statistical organisations – FIRST DRAFT
“event expected to occur several times (or not expected to occur) over the course of a
career”.
The Appendix shows examples of risk indexes for impact and likelihood.
When using either qualitative or semi-qualitative methods – for example risk indexes –
aiming at evaluating risk level whatever the event (statistical, organizational or specific
ones), applying the same number of parameters for impact as well as likelihood is crucial.
Moreover, in order to balance subjectiveness in evaluation, more than one evaluator for
single risk is needed and evaluation should be supported through objective data as much as
possible.
As for the roles and accountabilities, risk factors assessment is under the responsibility of the
process owners. Risk measurement is a task for working groups supported by the risk
management office and participated by the staff working on the processes of reference, who
submit their results to authorization/review of senior levels. Experts (e.g., IT, data
protection/statistical confidentiality, etc.) are responsible for the measurement of specific
risks. The results of assessment are always reviewed and validated also by the Risk Manager.
3.3 Risk Weighting
Risk weighting involves comparing estimated levels of risk to
assessment criteria in order to identify the most significant risks,
or exclude minor risks from further analysis. The purpose is to
ensure that use of resources will be focused on the most
important risks. Care should be taken not to screen out low risks
which occur frequently and can therefore have a significant
increasing effect.
The preliminary analysis determines one or more of the following courses of action:
• set aside insignificant risks (so called acceptable risks) which would not justify treatment;
QUESTION MARK BOX
Q. With reference to the risk measurement phase, does your Organization use different techniques concerning
risk classification (IT, financial, compliance, etc.)?
R. The risk assessment (in statistical areas) includes consideration of the range of issues in a statistical
processing cycle that can affect data quality as well as managing stakeholder relationships.
Source: Australia Bureau of Statistics, In-Depth Survey on Risk Management practices
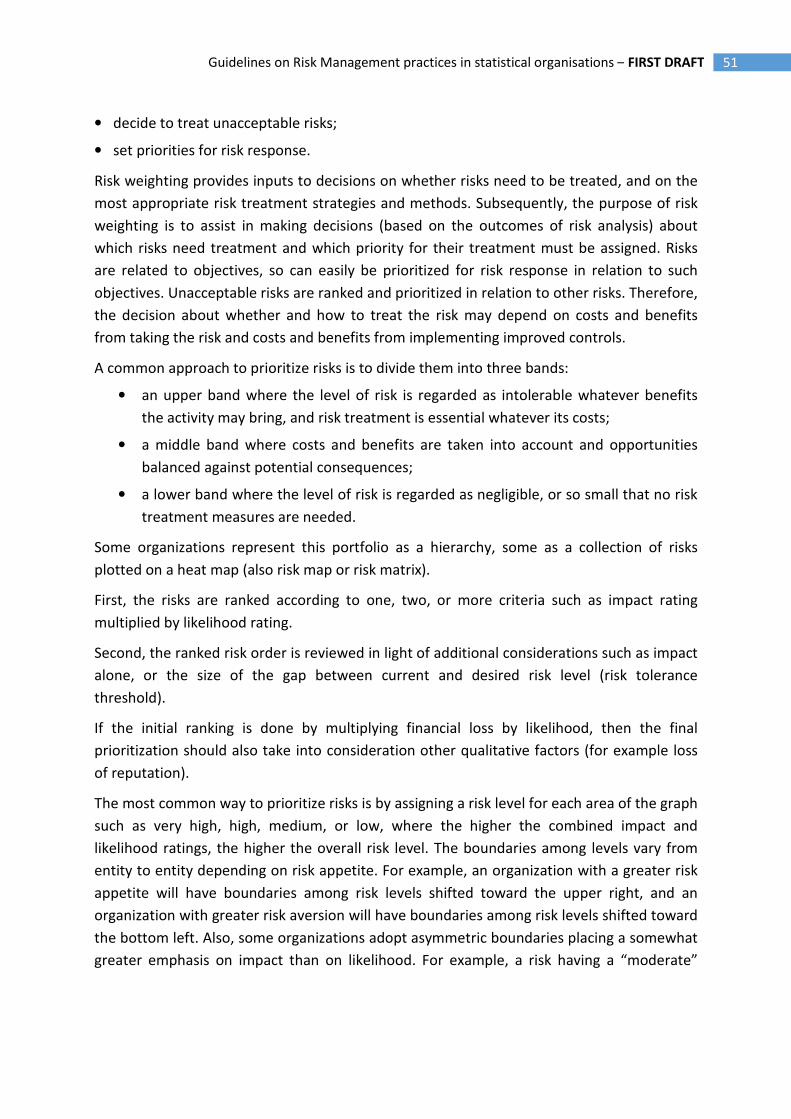
51 Guidelines on Risk Management practices in statistical organisations – FIRST DRAFT
• decide to treat unacceptable risks;
• set priorities for risk response.
Risk weighting provides inputs to decisions on whether risks need to be treated, and on the
most appropriate risk treatment strategies and methods. Subsequently, the purpose of risk
weighting is to assist in making decisions (based on the outcomes of risk analysis) about
which risks need treatment and which priority for their treatment must be assigned. Risks
are related to objectives, so can easily be prioritized for risk response in relation to such
objectives. Unacceptable risks are ranked and prioritized in relation to other risks. Therefore,
the decision about whether and how to treat the risk may depend on costs and benefits
from taking the risk and costs and benefits from implementing improved controls.
A common approach to prioritize risks is to divide them into three bands:
• an upper band where the level of risk is regarded as intolerable whatever benefits
the activity may bring, and risk treatment is essential whatever its costs;
• a middle band where costs and benefits are taken into account and opportunities
balanced against potential consequences;
• a lower band where the level of risk is regarded as negligible, or so small that no risk
treatment measures are needed.
Some organizations represent this portfolio as a hierarchy, some as a collection of risks
plotted on a heat map (also risk map or risk matrix).
First, the risks are ranked according to one, two, or more criteria such as impact rating
multiplied by likelihood rating.
Second, the ranked risk order is reviewed in light of additional considerations such as impact
alone, or the size of the gap between current and desired risk level (risk tolerance
threshold).
If the initial ranking is done by multiplying financial loss by likelihood, then the final
prioritization should also take into consideration other qualitative factors (for example loss
of reputation).
The most common way to prioritize risks is by assigning a risk level for each area of the graph
such as very high, high, medium, or low, where the higher the combined impact and
likelihood ratings, the higher the overall risk level. The boundaries among levels vary from
entity to entity depending on risk appetite. For example, an organization with a greater risk
appetite will have boundaries among risk levels shifted toward the upper right, and an
organization with greater risk aversion will have boundaries among risk levels shifted toward
the bottom left. Also, some organizations adopt asymmetric boundaries placing a somewhat
greater emphasis on impact than on likelihood. For example, a risk having a “moderate”
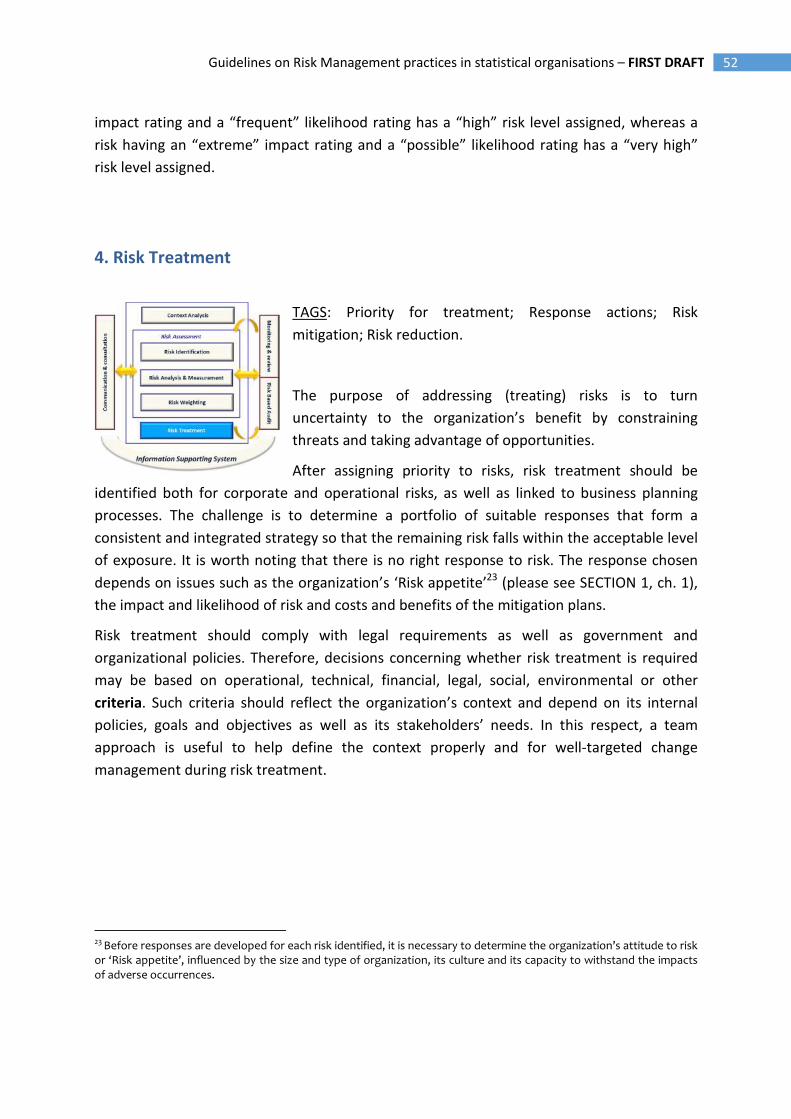
52 Guidelines on Risk Management practices in statistical organisations – FIRST DRAFT
impact rating and a “frequent” likelihood rating has a “high” risk level assigned, whereas a
risk having an “extreme” impact rating and a “possible” likelihood rating has a “very high”
risk level assigned.
4. Risk Treatment
TAGS: Priority for treatment; Response actions; Risk
mitigation; Risk reduction.
The purpose of addressing (treating) risks is to turn
uncertainty to the organization’s benefit by constraining
threats and taking advantage of opportunities.
After assigning priority to risks, risk treatment should be
identified both for corporate and operational risks, as well as linked to business planning
processes. The challenge is to determine a portfolio of suitable responses that form a
consistent and integrated strategy so that the remaining risk falls within the acceptable level
of exposure. It is worth noting that there is no right response to risk. The response chosen
depends on issues such as the organization’s ‘Risk appetite’23 (please see SECTION 1, ch. 1),
the impact and likelihood of risk and costs and benefits of the mitigation plans.
Risk treatment should comply with legal requirements as well as government and
organizational policies. Therefore, decisions concerning whether risk treatment is required
may be based on operational, technical, financial, legal, social, environmental or other
criteria. Such criteria should reflect the organization’s context and depend on its internal
policies, goals and objectives as well as its stakeholders’ needs. In this respect, a team
approach is useful to help define the context properly and for well-targeted change
management during risk treatment.
23 Before responses are developed for each risk identified, it is necessary to determine the organization’s attitude to risk or ‘Risk appetite’, influenced by the size and type of organization, its culture and its capacity to withstand the impacts of adverse occurrences.
53 Guidelines on Risk Management practices in statistical organisations – FIRST DRAFT
4.1 Risk Treatment Actions
There are key general approaches for risk treatment to which correspond different
response action categories:
1. TOLERATE. The exposure may be tolerable without any further action being taken. Even
though the exposure is not tolerable, ability to do anything may be limited, or the cost of
taking any action may be disproportionate to the potential benefit. In these cases the
response may be to tolerate the existing level of risk. This option, of course, may be
supplemented by contingency planning for handling the impact that will arise if the risk
results in actual events.
The actions related to this kind of approach are:
• Risk acceptance: no action is taken to affect likelihood or impact.
• Retaining: after risks have been changed or shared, there will be residual risks that
are retained. The risk can be retained by informed decision: acceptance of the
burden of loss, or benefit of gain, from a particular risk, including the acceptance of
risks that have not been identified. Risks can also be retained by default, e.g. when
there is a failure to identify or appropriately share or otherwise treat risks. Moreover,
after opportunities have been changed or shared, there may be residual
opportunities that are retained without any specific immediate action being required
(retaining the residual opportunity).
2. TREAT. Usually, the greater number of risks are by far addressed this way. The
purpose of treatment is that whilst continuing with the activity giving rise to risk,
specific action is taken in order to constrain such a risk to an acceptable level.
Actions related to this kind of approach are as follows:
• Removing: removing the risk source.
• Risk reduction: action is taken to mitigate likelihood or impact or both, generally
via internal controls.
• Changing likelihood: action taken to reduce the likelihood of negative outcomes
and/or to increase opportunity, in order to enhance good outcomes.
• Changing the consequences: action taken to reduce the extent of losses and/or to
increase the extent of gains with reference to related opportunities. This includes
setting up pre-event measures and post-event responses such as continuity plans.
54 Guidelines on Risk Management practices in statistical organisations – FIRST DRAFT
3. TRANSFER. For some risks the best response may be to transfer them24. The transfer
of risks may be considered to either reduce the exposure of the organization or
because of another organization (which may be another public organization) judged
more capable of effectively managing such risks. It is worth noting that some risks are
not (fully) transferable: in particular, reputational risk can hardly be transferred.
Relationship with the third party which the risk is transferred to needs to be carefully
managed to ensure a successful transfer.
Actions related to this kind of approach are as follows:
• Transferring25 the risk or a portion of it26.
• Sharing27: another party or parties bearing or sharing some part of risk outcomes,
usually by providing additional capabilities or resources that increase the
likelihood of opportunities or the extent of gains from them. Sharing positive
outcomes can involve sharing some of the costs involved in acquiring them.
Sharing arrangements can often introduce new risks, in that the other party or
parties may not effectively deliver the required capabilities or resources.
4. TERMINATE. Some risks will only be treatable, or reducible to acceptable levels, by
terminating the activity. It is worth noting that such an option can be severely limited
in the public sector when compared to the private one. It can be particularly
important in project management.
• Avoiding: action is taken to stop the activities giving rise to risk or avoiding the
risk by not starting such activities (where this option can be practiced). Risk
avoidance cannot occur properly if individuals or organizations are unnecessarily
risk-averse. Inappropriate risk avoidance may either increase the significance of
other risks or lead to the loss of opportunities.
5. TAKE THE OPPORTUNITY. This option is not an alternative to those above; rather it is
an option that should be considered whenever tolerating, transferring or treating a
risk. This can occur in two ways: the first is when an opportunity arises to exploit
positive impact whether or not action is taken to mitigate threats at the same time.
The second is when circumstances arise which, whilst not generating threats, offer
positive opportunities.
24 This might be done by conventional insurance, or it might be done by paying a third party to take the risk in another way. This option is particularly good for mitigating financial risks or risks to assets. 25 ISO 73:2009 Standard considers the ‘Risk transferring’ as a form of risk sharing. 26 For example through insurance or outsourcing. 27 The ISO 73:2009 highlights how risk sharing involves the agreed distribution of risk with other parties, noting that legal or regulatory requirements can limit, prohibit or mandate risk sharing itself. Moreover, the extent to which risk is distributed can depend on the reliability and clarity of the sharing arrangements.
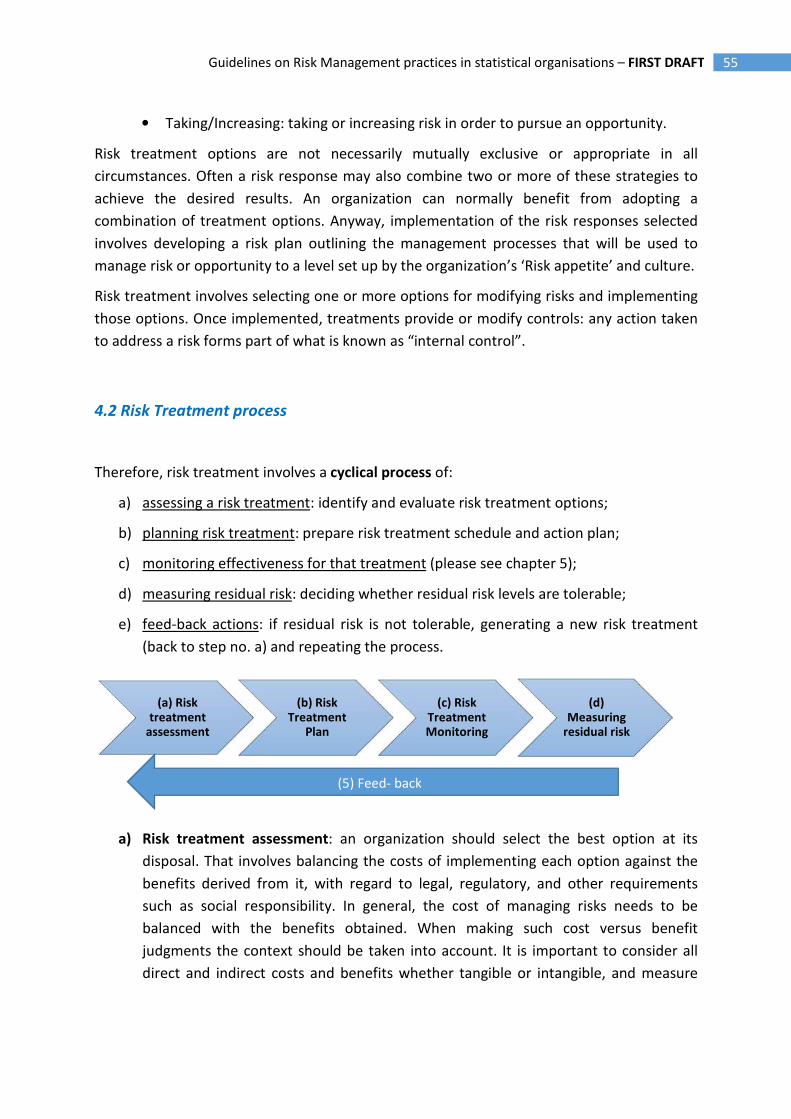
55 Guidelines on Risk Management practices in statistical organisations – FIRST DRAFT
• Taking/Increasing: taking or increasing risk in order to pursue an opportunity.
Risk treatment options are not necessarily mutually exclusive or appropriate in all
circumstances. Often a risk response may also combine two or more of these strategies to
achieve the desired results. An organization can normally benefit from adopting a
combination of treatment options. Anyway, implementation of the risk responses selected
involves developing a risk plan outlining the management processes that will be used to
manage risk or opportunity to a level set up by the organization’s ‘Risk appetite’ and culture.
Risk treatment involves selecting one or more options for modifying risks and implementing
those options. Once implemented, treatments provide or modify controls: any action taken
to address a risk forms part of what is known as “internal control”.
4.2 Risk Treatment process
Therefore, risk treatment involves a cyclical process of:
a) assessing a risk treatment: identify and evaluate risk treatment options;
b) planning risk treatment: prepare risk treatment schedule and action plan;
c) monitoring effectiveness for that treatment (please see chapter 5);
d) measuring residual risk: deciding whether residual risk levels are tolerable;
e) feed-back actions: if residual risk is not tolerable, generating a new risk treatment
(back to step no. a) and repeating the process.
a) Risk treatment assessment: an organization should select the best option at its
disposal. That involves balancing the costs of implementing each option against the
benefits derived from it, with regard to legal, regulatory, and other requirements
such as social responsibility. In general, the cost of managing risks needs to be
balanced with the benefits obtained. When making such cost versus benefit
judgments the context should be taken into account. It is important to consider all
direct and indirect costs and benefits whether tangible or intangible, and measure
(a) Risk treatment
assessment
(b) Risk Treatment
Plan
(c) Risk Treatment Monitoring
(d) Measuring
residual risk
(5) Feed- back
56 Guidelines on Risk Management practices in statistical organisations – FIRST DRAFT
them in financial or other terms.
b) Risk Treatment Plan: Treatment should involve, at operational level, preparing and
implementing a related plan. It shows how the treatment options selected will be
implemented and should be integrated with the management and budgetary
processes. Specifically, the information provided in a treatment plan should include:
a. the reasons for selecting treatment options, including expected benefits;
b. who is accountable for approving the plan and who is responsible for
implementing it;
c. the actions proposed;
d. resource requirements including contingencies;
e. performance measures and constraints;
f. reporting and monitoring requirements;
g. timing and schedule.
Lastly, responsibilities related to the treatment phase should be clearly assigned
specifying who is accountable for the management of particular risks or categories of
risk, for implementing treatment strategies and for the maintenance of risk controls.
To this purpose, the board should ensure that management considers and
implements appropriate risk responses: actually, responsibility for treatment is
usually put at management level (Directors General, Head of Division; Project
Managers) and, where appropriate, assigned to staff. Management should also
identify and note in the ‘Risk register’ the actions selected and should show to the
board how such risk responses improve the performance of the organization. Risk
owners, according to their respective roles in the project or process, are indicated to
set risk treatment plans, even though at this stage responsibilities vary according to
the kind of risks (either corporate or operational). For example, senior managers are
responsible for corporate risks, their mitigation strategies and action plans. The
operational risk responsibility relies on the divisional levels which the program is
assigned to.
c) Risk Treatment Monitoring: in designing response actions, it is important that
controls put in place are proportional to the risks. Risk analysis assists such a process
by identifying those risks requiring attention by the management. Risk control
actions will be prioritized in terms of their potential to benefit the organization.
Effectiveness of internal control is how much the risk will either be eliminated or
reduced by the control measures proposed. These latter need to be measured in
terms of potential economic effect if no action is taken versus the cost of the
action(s) proposed and invariably require more detailed information and
57 Guidelines on Risk Management practices in statistical organisations – FIRST DRAFT
assumptions than are promptly available. Every response action has a related cost
and it is important that the treatment offers value for money in relation to the risk
controlled by it. In this regard, options in addressing risk (“TREAT”) can be further
analyzed into four different types of related/associated controls:
• PREVENTATIVE CONTROLS. These are designed to limit undesirable outcome. The
more an undesirable outcome should be avoided, the more appropriate
preventative controls should be implemented28. Most of controls implemented in
organizations tend to belong to this category.
• CORRECTIVE CONTROLS. These are designed to correct undesirable outcomes
occurred and provide a way to achieve some recovery against loss or damage29.
Contingency planning is an important element of corrective control.
• DIRECTIVE CONTROLS. These are designed to ensure that a particular outcome is
achieved and are particularly important when avoiding an undesirable event –
typically related to Health and Safety or to security – is crucial30.
• DETECTIVE CONTROLS. These are designed to identify occasions for occurring of
undesirable outcomes. Their effect is, by definition, “after the event” so they are
only appropriate when the resulting loss or damage can be accepted31.
d) Residual risk measurement: If a residual risk persists even after treatment, a decision
should be taken about whether to retain this risk or repeat the risk treatment
process. For residual risks that are deemed to be high, information should be
collected about the cost of implementing further mitigation strategies.
28 Examples of preventative controls include limitation of action to authorized persons, for example,
permitting those suitably trained and authorized only to handle media enquiries prevents releasing of
inappropriate comments to the press. 29 For example, drawing up of contract clauses to allow recovery of overpayment. Insurance can also be
regarded as a form of corrective control as it facilitates financial recovery against the actualization of a risk.
30 For example, requiring that staff is trained to get certain skills before being allowed to work
unsupervised.
31 Examples of detective controls include “Post Implementation Reviews” which detect lessons to be learnt
from projects for application in future work, and monitoring activities which detect changes to be
responded to.
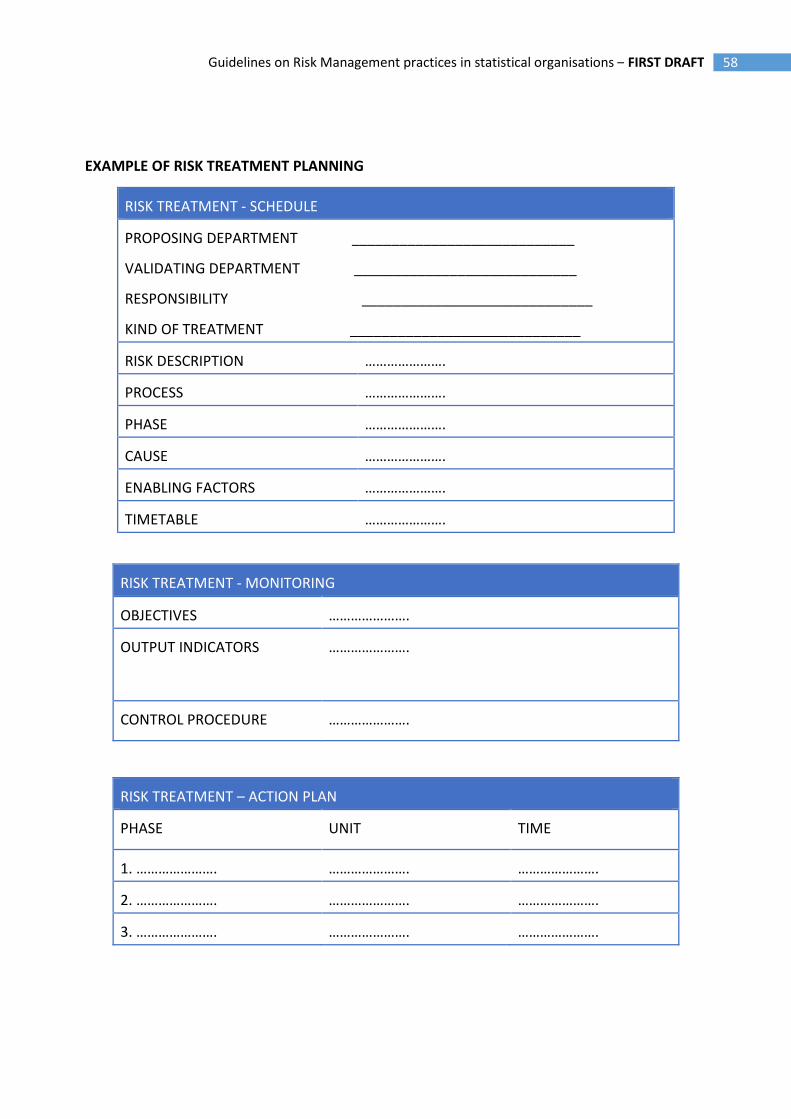
58 Guidelines on Risk Management practices in statistical organisations – FIRST DRAFT
EXAMPLE OF RISK TREATMENT PLANNING
RISK TREATMENT - MONITORING
OBJECTIVES ………………….
OUTPUT INDICATORS ………………….
CONTROL PROCEDURE ………………….
RISK TREATMENT – ACTION PLAN
PHASE UNIT TIME
1. …………………. …………………. ………………….
2. …………………. …………………. ………………….
3. …………………. …………………. ………………….
RISK TREATMENT - SCHEDULE
PROPOSING DEPARTMENT ____________________________
VALIDATING DEPARTMENT ____________________________
RESPONSIBILITY _____________________________
KIND OF TREATMENT _____________________________
RISK DESCRIPTION ………………….
PROCESS ………………….
PHASE ………………….
CAUSE ………………….
ENABLING FACTORS ………………….
TIMETABLE ………………….
59 Guidelines on Risk Management practices in statistical organisations – FIRST DRAFT
QUESTION MARK BOX
Q1. Following risk identification and assessment in your organization, is any treatment of the risks put in
place?
R1. “Yes. Risk treatment of most significant risks is assigned to managers and followed up (annually or bi-
annually by the board of directors). The less significant risks are treated as a part of normal operations. The risk
treatment of moderate or higher risks is taken to departments management team for approval. The treatment
is assigned to person responsible for implementing the treatment as a part of normal operations or if that is
not possible a separate implementation plan is to be prepared”.
Source: Finland, Survey on Risk management practices
R2. “Yes. Risk is weighted and asset owners have to set up a plan to reduce risk that are measured above a
certain level”
Source: Iceland, Survey on Risk management practices
R3. “Yes. Treatments are identified as part of the risk identification process - a template is completed by Heads
of Division twice a year and individual directorate risk registers and a corporate risk register are created.
Ownership of the risk is assigned and the process is reviewed twice a year by the Senior Management
Committee with the individual Head of Division. The project management system also facilitates risk
identification and management and the project team review the project regularly. Risk management
treatments can involve human resource solutions”.
Source: Ireland, Survey on Risk management practices
R4. “Yes. Treatment of the risks is the main result of risk analysis. The results are known as control activities. In
some cases control activities have been established as a result of previous experiences, well before any formal
risk analysis. However only a full analysis can give a reasonable security that everything that counts has been
considered and that the institution are prepared to face the consequences.
Source: México, Survey on Risk management practices
R5. “Yes, in accordance with the System Procedure on the Risk Management approved by the NIS President
(Decision no. 1038/2011). The audit reports on Risk Management are taken into consideration to propose
treatment actions”.
Source: Romania, Survey on Risk management practices
Q2. Please indicate which kind of risks are being managed through the Risk Management process, while
specifying connections and differences in treatment:
R1. “Approach in treatment depends on greater or lower influences of CBS in reducing risk to an acceptable
level. Regarding the risk treatments most of identified and assessed risks have been classified into two
categories: risk reduction and risk avoidance or in combination”.
Source: Croatia, In-Depth Survey on Risk management practices
Q3. Please describe the methodology used in identifying and monitoring the risk treatment, while specifying
the Organization roles involved:
R1. “The methodology used by INEGI is based mainly on the international standard ISO 31000 about Risk
management, ISO/IEC 27000 about information security, some elements of COSO ERM (Enterprise Risk
Management), and also from the standard of the European Federation of risks (FERMA). The first version of the
methodology was released in 2010 and the present version has been the result of the institutional experience
of its use”.
Source: México, In-Depth Survey on Risk management practices
Q4. With reference to RM, Internal Controls and Internal Audit System within your Organization, please
describe the connection/integration between these ones in detail, while specifying: how risk treatment
actions are monitored functions, roles and accountabilities involved in the monitoring of the risk treatment
actions…”
R1. “As for the risks, each head of an administrative unit is responsible to identify, analyze, evaluate and
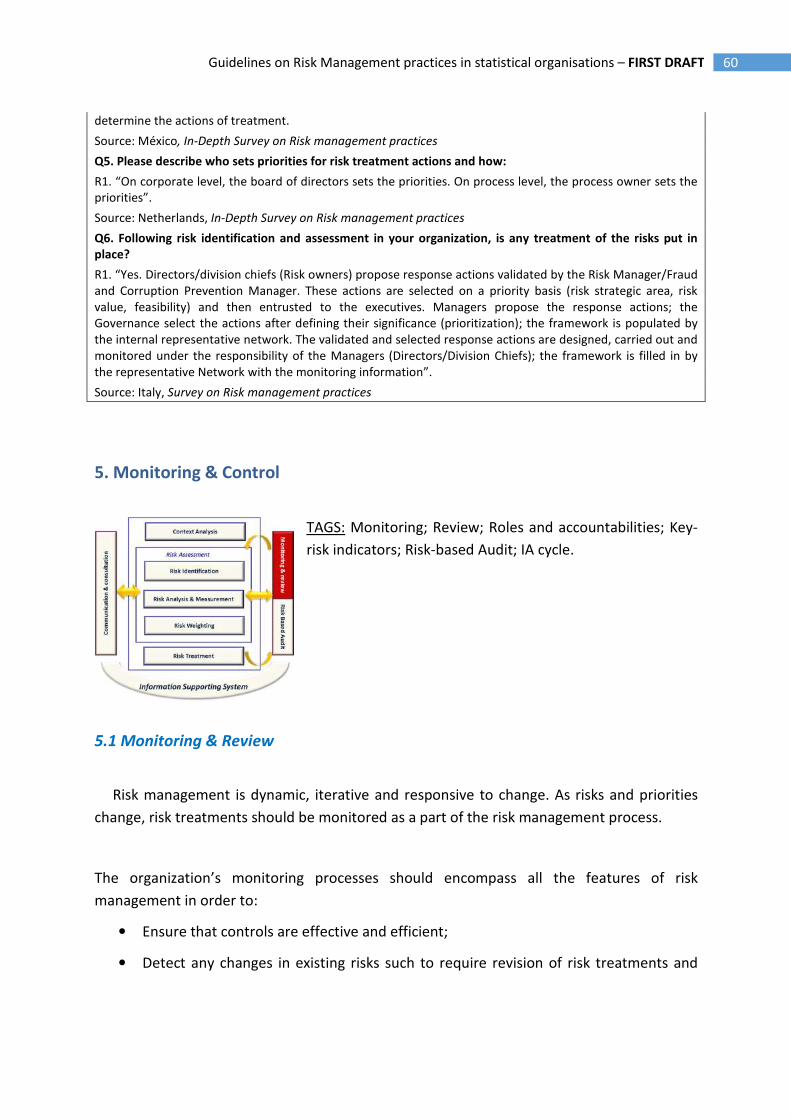
60 Guidelines on Risk Management practices in statistical organisations – FIRST DRAFT
determine the actions of treatment.
Source: México, In-Depth Survey on Risk management practices
Q5. Please describe who sets priorities for risk treatment actions and how:
R1. “On corporate level, the board of directors sets the priorities. On process level, the process owner sets the
priorities”.
Source: Netherlands, In-Depth Survey on Risk management practices
Q6. Following risk identification and assessment in your organization, is any treatment of the risks put in
place?
R1. “Yes. Directors/division chiefs (Risk owners) propose response actions validated by the Risk Manager/Fraud
and Corruption Prevention Manager. These actions are selected on a priority basis (risk strategic area, risk
value, feasibility) and then entrusted to the executives. Managers propose the response actions; the
Governance select the actions after defining their significance (prioritization); the framework is populated by
the internal representative network. The validated and selected response actions are designed, carried out and
monitored under the responsibility of the Managers (Directors/Division Chiefs); the framework is filled in by
the representative Network with the monitoring information”.
Source: Italy, Survey on Risk management practices
5. Monitoring & Control
TAGS: Monitoring; Review; Roles and accountabilities; Key-
risk indicators; Risk-based Audit; IA cycle.
5.1 Monitoring & Review
Risk management is dynamic, iterative and responsive to change. As risks and priorities
change, risk treatments should be monitored as a part of the risk management process.
The organization’s monitoring processes should encompass all the features of risk
management in order to:
• Ensure that controls are effective and efficient;
• Detect any changes in existing risks such to require revision of risk treatments and
61 Guidelines on Risk Management practices in statistical organisations – FIRST DRAFT
priorities;
• Identify emerging risks.
Monitoring and review are two different and complementary activities since monitoring
involves the routine surveillance of actual performance against expected or required
performance, while review involves periodic (yearly at least) checking of the current
situation for changes in the internal/external context.
The overall responsibility for monitoring and review activities relies on the board and top
management: the way the top management reacts to the results of monitoring program will
affect the behavior of employees.
Monitoring should be an integral part of management. Risks and controls should be
allocated to owners, who are therefore responsible for monitoring them. A typical approach
for monitoring includes:
• Environment scan by risk owners to monitor changes in risks or in context;
• Risk treatment plan monitoring by risk owners;
• Control monitoring by control owners and risk officers through performance
indicators and key risks indicators according to the quantitative thresholds described
in the Risk Appetite statement (see below).
Monitoring and review activities can also be considered in terms of a hierarchy.
Responsibilities vary according to the kind of monitored risks (corporate, operational,
project): operational risks are monitored at business unit level, project risks are monitored
within the Project Management system, and corporate risks are monitored by Senior
managers (i.e., Directors General or Heads of Department).
5.2 Key risk indicators
Key risk indicators (KRIs) are used for monitoring risk treatment actions.
Key risk indicators are metrics used to provide an early warning on increasing risk exposures
in different areas within an organization. In some instances, they may represent key ratios
that management throughout the organization tracks as indicators of evolving risks, and
potential opportunities, that alert on the need for actions to be taken. Others may be more
complex and involve aggregation of several individual risk indicators into a multi-dimensional
score about emerging events that may lead to new risks or opportunities.
KRIs are typically derived from specific events or root causes, internally or externally
62 Guidelines on Risk Management practices in statistical organisations – FIRST DRAFT
identified, that can prevent performance goals from being achieved. Linkage of top risks to
core strategies helps pinpoint the most relevant information that can serve as an effective
leading indicator of an emerging risk.
An effective method for developing KRIs begins by analyzing a risk-event that has affected
the organization in the past (or present) and then working backwards to pinpoint
intermediate and root cause events that led to the ultimate loss or lost opportunity. The
closer the KRI is to the root cause of a risk-event, the more likely the KRI will provide
management time to take positive action to respond to such an event.
Effective KRIs often result from being developed by teams that include professional risk
management staff and business unit managers with a deep understanding of the operational
processes subject to potential risks. Ideally, these KRIs are developed in cooperation with
strategic plans for individual business units and can then embed acceptable deviations from
plan that fall within the overall risk appetite of the organization.
The development of KRIs that can provide relevant and timely information to both the board
and senior management is a significant component of effective risk oversight. It is also
important to consider the frequency of reporting KRIs. The appropriate time horizon
depends on the main user of a specific KRI. For operational managers, real-time reporting
may be necessary. For senior management, where a compilation of KRIs that highlights
potential deviations from organization-level targets is the likely goal, a less frequent (e.g.,
weekly) status report may be enough. At the board level, the reporting is often aggregated
to allow a broader analysis. Management can then use such analysis to identify information
related to the root cause event or intermediate event that might serve as a key risk indicator
related to either event. When KRIs for root cause events and intermediate events are
monitored, management is in the best position to identify early mitigation strategies that
can begin to reduce or eliminate the impact associated with an emerging risk event.
KRI does not manage or treat risk, and can lead to a false sense of safety if poorly designed.
So, an important feature of any KRI is the quality of the available data used to monitor a
specific risk. Attention must be paid to the source of information, either internal to the
organization or drawn from an external party. Sources of information advising on the choice
of KRIs to be employed can probably exist; for example, internal data may be available
related to prior risk events that can be informative about potential future exposures.
Nevertheless, internal data is typically unavailable for many risks — especially if not
previously encountered. In addition, risks likely to have a significant impact may often arise
from external sources, such as changes in economic conditions, interest rate shifts, or new
regulatory requirements or legislation. Therefore, many organizations discover that relevant
KRIs are often based on external data, given that many root cause events and intermediate
events that affect strategies arise from outside the organization.
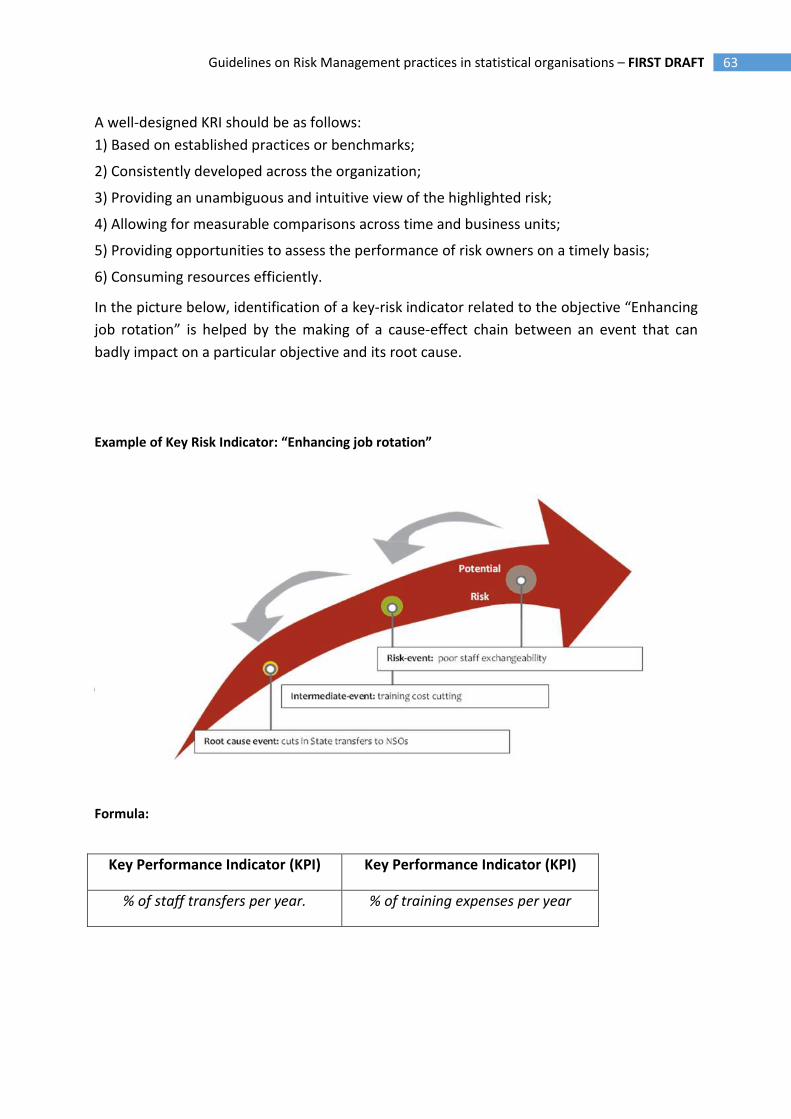
63 Guidelines on Risk Management practices in statistical organisations – FIRST DRAFT
A well-designed KRI should be as follows:
1) Based on established practices or benchmarks;
2) Consistently developed across the organization;
3) Providing an unambiguous and intuitive view of the highlighted risk;
4) Allowing for measurable comparisons across time and business units;
5) Providing opportunities to assess the performance of risk owners on a timely basis;
6) Consuming resources efficiently.
In the picture below, identification of a key-risk indicator related to the objective “Enhancing
job rotation” is helped by the making of a cause-effect chain between an event that can
badly impact on a particular objective and its root cause.
Example of Key Risk Indicator: “Enhancing job rotation”
Formula:
Key Performance Indicator (KPI) Key Performance Indicator (KPI)
% of staff transfers per year. % of training expenses per year
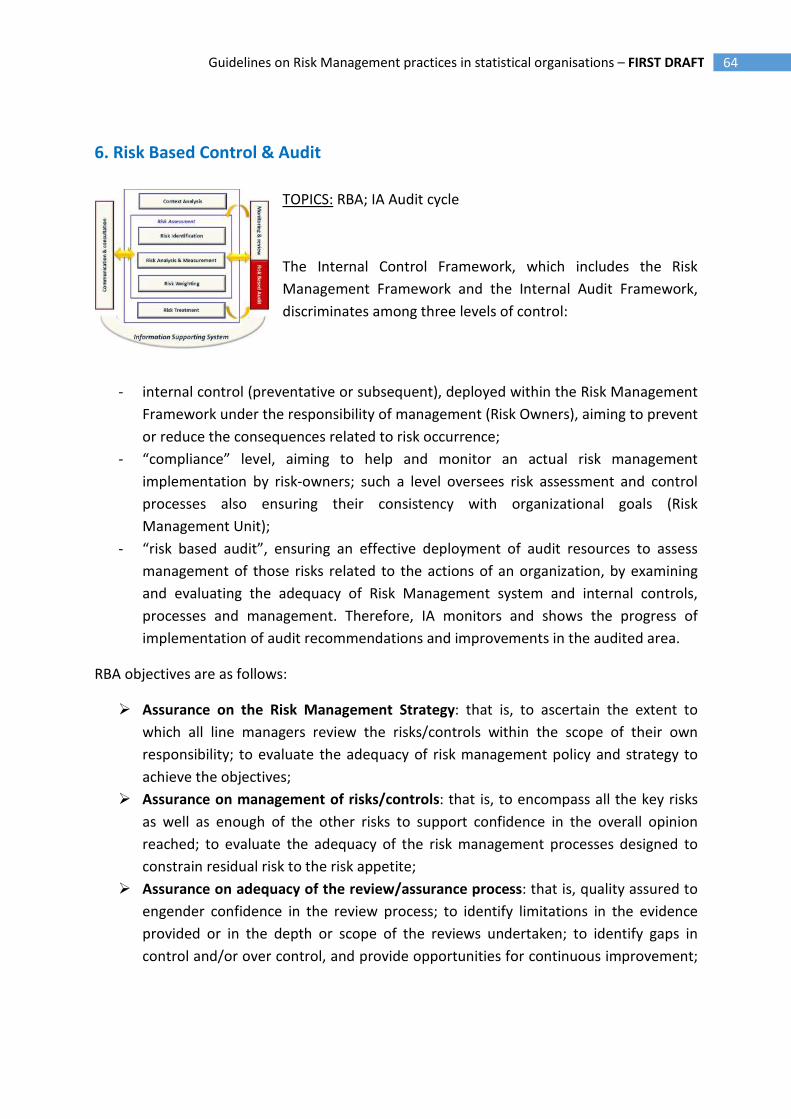
64 Guidelines on Risk Management practices in statistical organisations – FIRST DRAFT
6. Risk Based Control & Audit
TOPICS: RBA; IA Audit cycle
The Internal Control Framework, which includes the Risk
Management Framework and the Internal Audit Framework,
discriminates among three levels of control:
- internal control (preventative or subsequent), deployed within the Risk Management
Framework under the responsibility of management (Risk Owners), aiming to prevent
or reduce the consequences related to risk occurrence;
- “compliance” level, aiming to help and monitor an actual risk management
implementation by risk-owners; such a level oversees risk assessment and control
processes also ensuring their consistency with organizational goals (Risk
Management Unit);
- “risk based audit”, ensuring an effective deployment of audit resources to assess
management of those risks related to the actions of an organization, by examining
and evaluating the adequacy of Risk Management system and internal controls,
processes and management. Therefore, IA monitors and shows the progress of
implementation of audit recommendations and improvements in the audited area.
RBA objectives are as follows:
� Assurance on the Risk Management Strategy: that is, to ascertain the extent to
which all line managers review the risks/controls within the scope of their own
responsibility; to evaluate the adequacy of risk management policy and strategy to
achieve the objectives;
� Assurance on management of risks/controls: that is, to encompass all the key risks
as well as enough of the other risks to support confidence in the overall opinion
reached; to evaluate the adequacy of the risk management processes designed to
constrain residual risk to the risk appetite;
� Assurance on adequacy of the review/assurance process: that is, quality assured to
engender confidence in the review process; to identify limitations in the evidence
provided or in the depth or scope of the reviews undertaken; to identify gaps in
control and/or over control, and provide opportunities for continuous improvement;
65 Guidelines on Risk Management practices in statistical organisations – FIRST DRAFT
to support preparation of IA Summary Report to the Risk Committee/Chief
Statistician.
The RBA management cycle is carried out through the following six steps:
a) Object: procedures, processes and internal service charters, risks selected according
to priorities but: risks within Risk Appetite, risks not requiring audit in the short term,
risks otherwise audited, tolerable risks.
b) Audit Plan: internal audits to be carried out in the short term are managed according
to an annual plan endorsed by the board and shared with the organizational divisions
involved. Such a plan shows, with reference to any action: i) the audit lifespan, ii) the
team composition, iii) the accountabilities, iv) the audit tasks (accordance with
procedures, contractual requirements, etc.), v) the documents required, vi) the lead
times. The annual plan is prepared for a single year on the basis of the strategic plan
according to risk assessment. Therefore, audit planning takes into account the results
of previous audit studies as well as management assessment of current levels of risk
related to specific organizational programs.
c) Audit run-up, consisting of some actions preliminary to actual audit, such as: a)
formal assignment of duties; b) definition of activity plan; c) identification of
documents needed to define the audit range of reference and intervention; d)
communication on audit start; e) kick-off meeting with the staff involved.
d) Audit implementation, that is, actual audit, consisting of: i) operational meetings; ii)
preliminary assessment of criticalities; iii) check of suitability as well as accordance
with either Risk Management or Quality System; iv) drawing up of recommendations
and possible mitigation actions. Audits can be used to assist risk managers in
assessing the effectiveness of controls for each risk. An assessment could be made on
whether the controls are adequate to reduce the level of risk (i.e., to reduce the risk
from extreme/high to medium or low), or additional treatments/controls are
required.
e) Reporting. Auditing ends with a meeting aimed to share the main results achieved.
An Audit Report is drafted that contains: i) the check findings, ii) the actions
performed, iii) the criticalities found, suggestions proposed, iv) possible Action Plan
in cooperation with the unit/division involved. Following the assessment of the
control effectiveness for each risk, will emerge proposals for additional treatment
strategies to reduce the level of risk, and some of the treatment strategies proposed
during this process will be suitable for inclusion in the internal audit plan (feed-back).
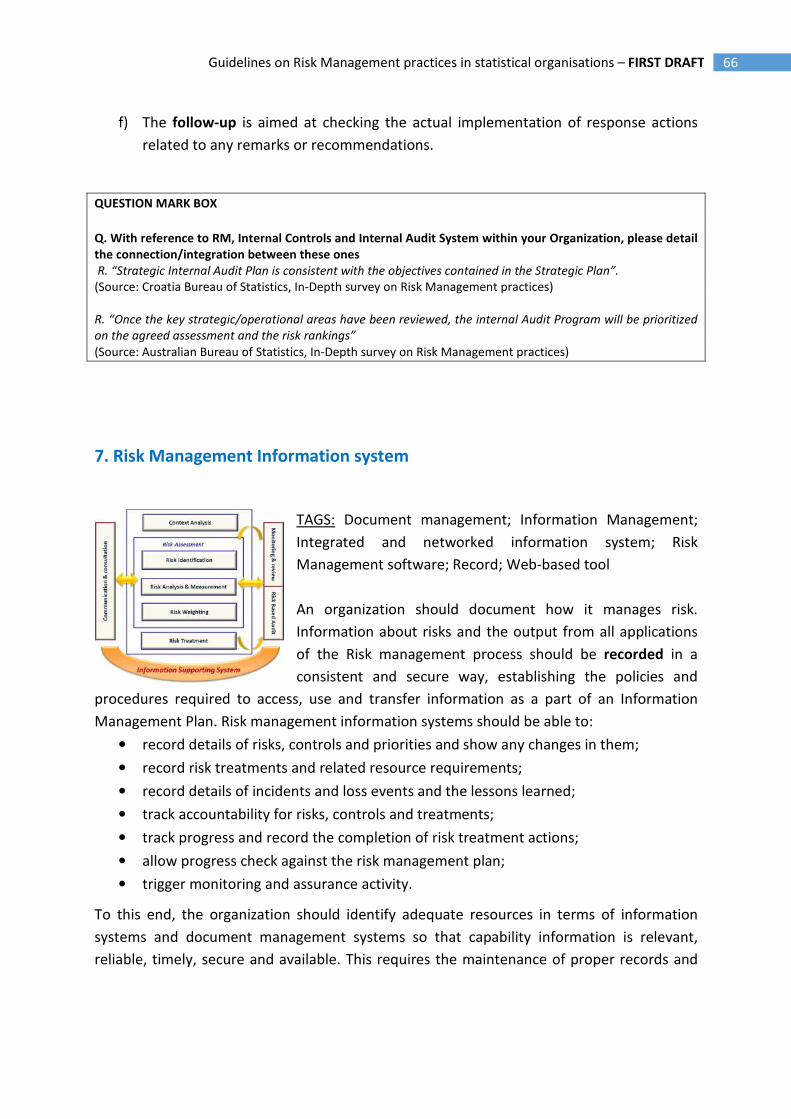
66 Guidelines on Risk Management practices in statistical organisations – FIRST DRAFT
f) The follow-up is aimed at checking the actual implementation of response actions
related to any remarks or recommendations.
QUESTION MARK BOX
Q. With reference to RM, Internal Controls and Internal Audit System within your Organization, please detail
the connection/integration between these ones
R. “Strategic Internal Audit Plan is consistent with the objectives contained in the Strategic Plan”.
(Source: Croatia Bureau of Statistics, In-Depth survey on Risk Management practices)
R. “Once the key strategic/operational areas have been reviewed, the internal Audit Program will be prioritized
on the agreed assessment and the risk rankings”
(Source: Australian Bureau of Statistics, In-Depth survey on Risk Management practices)
7. Risk Management Information system
TAGS: Document management; Information Management;
Integrated and networked information system; Risk
Management software; Record; Web-based tool
An organization should document how it manages risk.
Information about risks and the output from all applications
of the Risk management process should be recorded in a
consistent and secure way, establishing the policies and
procedures required to access, use and transfer information as a part of an Information
Management Plan. Risk management information systems should be able to:
• record details of risks, controls and priorities and show any changes in them;
• record risk treatments and related resource requirements;
• record details of incidents and loss events and the lessons learned;
• track accountability for risks, controls and treatments;
• track progress and record the completion of risk treatment actions;
• allow progress check against the risk management plan;
• trigger monitoring and assurance activity.
To this end, the organization should identify adequate resources in terms of information
systems and document management systems so that capability information is relevant,
reliable, timely, secure and available. This requires the maintenance of proper records and
67 Guidelines on Risk Management practices in statistical organisations – FIRST DRAFT
processes that generate a flow of timely, relevant and reliable information. Therefore, each
stage of the risk management process should be recorded properly. Record management is
an important aspect of good corporate governance: it supports activities and decisions, as
well as ensures accountability to present and future stakeholders.
The quality of an information and document management system depends on the following
principles:
• information should be consistent across the organization to allow for efficient and
accurate flow;
• standardizing definitions of terms and taxonomies ensures that different parts of the
organization do not have different understandings of information, or are not
operating on conflicting sets of information;
• it is not necessary to have a single record management system across the
organization if management designs and operates multiple systems to allow an
efficient consolidation, exchange and integration of information.
• At operational level, the organization should first determine the definitions,
classifications and procedures needed to identify and manage Risk information as a
part of an Information Management Plan. Subsequently, as core sub-practices, it
should set up ‘Risk management records’ through the following steps:
o defining and maintaining a Risk Management classification scheme and
methodology;
o defining an ongoing process for Risk Management information inventory and
classification including characteristics such as: type, preservation
requirement, retention requirement, disposition requirement, availability
requirement, operational/strategic value, data owner, source of information
(data base/application, email, Excel, etc.), confidentiality requirement,
associated organizational processes and policies.
• Periodically the organization should also consider changes to the classification
structure, and its underlying definitions and classifications.
The whole Risk Management process should be documented through a Web-based tool
which allows risks and treatments to be delegated and escalated among the organizational
levels and also makes it possible to connect a risk to a specific goal or activity in the
operational plan of the agency or the departments’ own action plans. Consequently, the
organization should identify resource requirements related to information systems and
databases.
The main features of a Risk management information system within each phase of the Risk
Management process are: data exchange/interoperability, data integration, traceability,
data security.
68 Guidelines on Risk Management practices in statistical organisations – FIRST DRAFT
Actually, risk identification, analysis and measurement should be carried out within a specific
tool through four steps:
1. Qualitative assessment (Risk identification and Risk analysis). The Risk Management
information tool should record the assessment of risk in a way that helps monitoring
and identification of risk priorities. Risk assessment should be documented in a way
which records the process phases. Documenting risk assessment creates an
organization’s risk profile which: facilitates identification of risk priorities (in
particular to identify the most significant risk issues with which senior management
should concern themselves); catches the reasons for decisions made about what a
tolerable exposure is and is not; facilitates recording of how it is decided to address
risk; allows all those concerned with risk management to see the overall risk profile
and how their areas of particular responsibility fit into it; facilitates review and
monitoring of risks.
2. Prioritization;
3. Risk measurement;
4. Monitoring Risk treatment actions. Staff members/managers who are responsible for
risk treatment actions have to periodically report (e.g., monthly, quarterly, yearly) on
the implementation/execution of actions within the tool.
QUESTION MARK BOX
Q1. What are the most important lessons learned from implementing risk management in your organization
that other organizations should take into account when developing their own risk management processes?
R1. “Efficient IT-tool is very important”
Source: Austria, Survey on Risk management practices
Q2. In your organization, the amount of financial resources spent to run the risk management system is
suitable.
R2. “Adequate resources in the information system supporting the Risk Management process have been
invested”.
Source: Italy, Survey on Risk management practices
Q3: In your organization, the risk management process is connected to:
R3. “Organization performance assessment: risk analysis is fully integrated in the planning and follow up
process for operations and is reported by each department in a common web based tool”. As for standardized
techniques for risk identification and assessment: “the important thing is that the result is documented
correctly in the web based tool”.
Source: Sweden, In-Depth Survey on Risk management practices
1 Guidelines on Risk Management practices in statistical organisations – ANNEX - FIRST DRAFT
- ANNEX -
FOCUS ON RISK MANAGEMENT PRACTICES
2 Guidelines on Risk Management practices in statistical organisations – ANNEX - FIRST DRAFT
Index
Introduction ............................................................................................................................................. 4
SECTION 1: RISK FRAMEWORK ................................................................................................................ 5
Paragraph 2. Establishment Risk Policy ............................................................................................... 5
FOCUS ON: Risk Appetite Statement: Australian Bureau Of Statistics (Abs) .................................. 5
FOCUS ON: Building-up a Risk Policy. Statistics Canada (SC) experience........................................ 5
Paragraph 4. Adopting an integrated risk approach connected to Statistical Quality Management . 7
FOCUS ON: Risk and Quality Management ..................................................................................... 7
Examples from Statistics Netherlands and Australian Bureau of Statistics (ABS) ........................... 7
SECTION 2: RISK MANAGEMENT PROCESS............................................................................................ 10
Paragraph 2. CONTEXT ANALYSIS ...................................................................................................... 10
FOCUS ON: Measuring Risk perception and Risk maturity. The Italian experience ...................... 10
FOCUS ON: Process Mapping Methods ......................................................................................... 14
CASE STUDIES ................................................................................................................................ 15
Italian National Institute of Statistics (ISTAT) ................................................................................ 15
Statistics Lithuania (SL) .................................................................................................................. 16
National Institute of Statistics and Geography (INEGI) ................................................................. 17
Paragraph 3. RISK IDENTIFICATION ................................................................................................... 19
FOCUS ON: Corporate risks: Statistics Canada (SC) experience .................................................... 19
Paragraph 4. RISK ASSESSMENT ........................................................................................................ 22
FOCUS ON: Risk Assessment Methodology ................................................................................... 22
Paragraph 5. RISK TREATMENT ......................................................................................................... 23
CASE STUDIES: ............................................................................................................................... 23
Australian Bureau of Statistics (ABS) ............................................................................................. 23
Statistics Lithuania (SL) .................................................................................................................. 25
Statistics Sweden ........................................................................................................................... 25
Paragraph 7. The RM supporting Information system ...................................................................... 27
CASE STUDIES: ............................................................................................................................... 27
Statistics Austria ............................................................................................................................ 27
Statistics Lithuania (SL) .................................................................................................................. 28
Statistics Sweden ........................................................................................................................... 29

3 Guidelines on Risk Management practices in statistical organisations – ANNEX - FIRST DRAFT
4 Guidelines on Risk Management practices in statistical organisations – ANNEX - FIRST DRAFT
Introduction
This Annex has to be considered an integral part of the Guidelines for developing Risk
Management practices and gathers the most significant results coming from the survey
analysis. Its goal is, on the one hand, to highlight the amount of information obtained, on the
other hand, to show a more pratical approach to the different domains of Risk Management.
Like the first, "theoretical" part, the Annex consists of two sections, Risk Framework and Risk
Process; the paragraph arrangement also mirrors the Guidelines in order to help the two
parts in referring to each other.
Within both sections two categories of examples are shown:
1. Focus points on Risk Management core topics, in order to share practices, coming from
the NSOs, able to substantiate "theoretical" information;
2. Case-studies, shortly reporting some NSOs' significant experiences on particular features
of the Risk Management systems in order to, on the one hand, share the know-how
gained from implementing Risk Management within the different organizational
contexts, on the other hand, highlight any elements in common among the different
experiences.
5 Guidelines on Risk Management practices in statistical organisations – ANNEX - FIRST DRAFT
SECTION 1: RISK FRAMEWORK
Paragraph 2. Establishment Risk Policy
FOCUS ON: Risk Appetite Statement: Australian Bureau Of Statistics (Abs)
“The ABS's risk appetite will only tolerate High or Extreme risks when treatment measures
are unable to reduce the level of inherent risk to an acceptable level (i.e. Low or Moderate).
Any Extreme risk, such as a risk which would seriously threaten the credibility/reputation of
the ABS and/or with the potential to result in a parliamentary enquiry, must be brought to
the immediate attention of the Executive Leadership Group (ELG). The Senior Management
Group (SMG) must be informed of any High risk, including those that may impact/tarnish the
reputation of the ABS and/or achievement of program objectives e.g. through sustained
media coverage. Treatment measures are essential for High and Extreme risks. If strategies
to mitigate the risk take time, they must be added as standing Agenda Items to ELG meetings
(Extreme risks) or SMG meetings (High risks) until the risk is reduced. All Low or Moderate
risks will be managed within the specific area and/or routine procedures. All Treatment
measures are selected by considering the cost of implementing versus the benefits. In some
cases, Low and Moderate risks might be accepted if the cost of treating the risk outweighs
the benefit. All risks must be monitored and reviewed on an ongoing basis, and considered in
the context of the ABS work program and strategic directions”.
Source: Risk Management Framework. Part A - The Risk Policy. 2015
FOCUS ON: Building-up a Risk Policy. Statistics Canada (SC) experience
At Statistics Canada, integrated risk management is an ongoing and dynamic activity that
supports corporate decision-making, and is a central theme of the annual integrated
strategic planning process. An integral part of Statistics Canada's Risk Management Model is
the Corporate Risk Profile, a high-level summary of the most critical risks being managed by
Statistics Canada. The development Corporate Risk Profile was a comprehensive process that
included a review of risk information from several sources and reflected recommendations
from the Management Accountability Framework Round IX, as well as feedback from
managers. The process also included an improved risk questionnaire, revised guidelines, and
clearer definitions of risk sources. A communication strategy was developed and
implemented involving information sessions, a documentation package and reinforcement
of the importance of IRM in the Agency. The information sessions also served to remind
managers of their roles and responsibilities in the IRM process and to address any questions
and concerns they had.
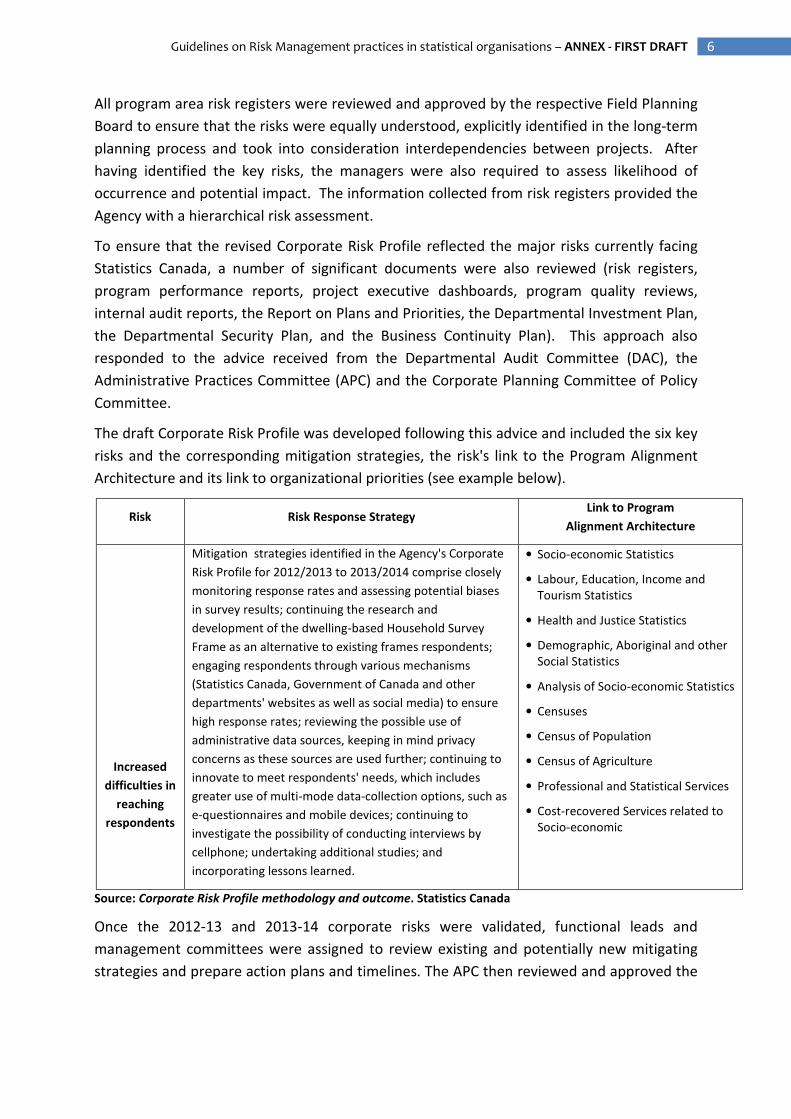
6 Guidelines on Risk Management practices in statistical organisations – ANNEX - FIRST DRAFT
All program area risk registers were reviewed and approved by the respective Field Planning
Board to ensure that the risks were equally understood, explicitly identified in the long-term
planning process and took into consideration interdependencies between projects. After
having identified the key risks, the managers were also required to assess likelihood of
occurrence and potential impact. The information collected from risk registers provided the
Agency with a hierarchical risk assessment.
To ensure that the revised Corporate Risk Profile reflected the major risks currently facing
Statistics Canada, a number of significant documents were also reviewed (risk registers,
program performance reports, project executive dashboards, program quality reviews,
internal audit reports, the Report on Plans and Priorities, the Departmental Investment Plan,
the Departmental Security Plan, and the Business Continuity Plan). This approach also
responded to the advice received from the Departmental Audit Committee (DAC), the
Administrative Practices Committee (APC) and the Corporate Planning Committee of Policy
Committee.
The draft Corporate Risk Profile was developed following this advice and included the six key
risks and the corresponding mitigation strategies, the risk's link to the Program Alignment
Architecture and its link to organizational priorities (see example below).
Risk Risk Response Strategy Link to Program
Alignment Architecture
Increased
difficulties in
reaching
respondents
Mitigation strategies identified in the Agency's Corporate
Risk Profile for 2012/2013 to 2013/2014 comprise closely
monitoring response rates and assessing potential biases
in survey results; continuing the research and
development of the dwelling-based Household Survey
Frame as an alternative to existing frames respondents;
engaging respondents through various mechanisms
(Statistics Canada, Government of Canada and other
departments' websites as well as social media) to ensure
high response rates; reviewing the possible use of
administrative data sources, keeping in mind privacy
concerns as these sources are used further; continuing to
innovate to meet respondents' needs, which includes
greater use of multi-mode data-collection options, such as
e-questionnaires and mobile devices; continuing to
investigate the possibility of conducting interviews by
cellphone; undertaking additional studies; and
incorporating lessons learned.
• Socio-economic Statistics
• Labour, Education, Income and
Tourism Statistics
• Health and Justice Statistics
• Demographic, Aboriginal and other
Social Statistics
• Analysis of Socio-economic Statistics
• Censuses
• Census of Population
• Census of Agriculture
• Professional and Statistical Services
• Cost-recovered Services related to
Socio-economic
Source: Corporate Risk Profile methodology and outcome. Statistics Canada
Once the 2012-13 and 2013-14 corporate risks were validated, functional leads and
management committees were assigned to review existing and potentially new mitigating
strategies and prepare action plans and timelines. The APC then reviewed and approved the
7 Guidelines on Risk Management practices in statistical organisations – ANNEX - FIRST DRAFT
full Corporate Risk Profile, before it was presented to the DAC. After receiving final approval
by the Corporate Planning Committee, the Corporate Risk Profile was posted on Statistics
Canada’s Internal Communications Network.
Paragraph 4. Adopting an integrated risk approach connected to Statistical
Quality Management
FOCUS ON: Risk and Quality Management
Examples from Statistics Netherlands and Australian Bureau of Statistics (ABS)
CBS, The Netherland
Object Oriented Quality and Risk Management (OQRM) model (Nederpelt, 2012) is a quality
framework developed in the field of official statistics in order to improve compliance with
the European Code of Practice and deal with quality standards of statistical output .
One of the goals of OQRM was making CBS being able to decide on focus areas (60). For each
of them, eleven steps can be made, including risk analysis and determining the right
measures or actions to put the focus areas under control.
These measures, proposed by the managers, are integrated in the regular planning and
control cycle of CBS:
• Actions on corporate level: a set of high level objectives is identified on strategic,
finance, operational and compliance level. Actions are identified to meet the objectives
and assigned to the heads of divisions. Progresses of these actions are regularly
monitored.
• Action on process level: The audit framework is based on the Quality Guidelines for
statistical processes. In these guidelines, international frameworks (CoP/QAF), national
frameworks, (SN-law, privacy law, security regulations, archiving) and board decisions
are integrated. Audits are also risk oriented.
The risk level is used to prioritize the recommendations in the audit report and these
recommendations are converted into an action plan by the process owner.
ABS, Australia
Statistical collections are often exposed to the risk that one or more of the components of
the process fail to meet the quality standard expected, such that the quality or the integrity
of the statistical outputs are affected. This kind of risk is the "statistical risk".
8 Guidelines on Risk Management practices in statistical organisations – ANNEX - FIRST DRAFT
Statistical risk arises for various reasons, some of which may include inadequate inputs,
processes not being well defined, changes to existing processes, or human error.
Errors in statistical outputs can be minimized by committing to quality management
strategies, such as risk management. Risk management is concerned with identifying
potential risks, analyzing their consequences, and devising and implementing responses,
ensuring that corporate and business objectives are achieved while upholding quality.
ABS has endeavored to instigate better quality management practices through the
development and use of the risk mitigation strategy known as quality gates.
The six components of a quality gate are:
1. Placement,
2. Quality Measures,
3. Roles,
4. Tolerance,
5. Actions,
6. Evaluation.
1. PLACEMENT. "Placement" is the first component of a quality gate. It refers to the
placement of quality gates throughout a statistical process (also known as a business
process cycle, or statistical process cycle). Placement of a quality gate is determined by
the level of risk associated with given points in the production process. Specifically, the
placement of a quality gate should occur where a risk assessment of the process reveals
that there is a need for a quality gate due to the impact on the process and statistical
outputs that would occur if the risk was realized.
Along with thinking about the inherent risks, it is helpful to draw a basic map of the
production process that is to be monitored which can also help in determining
placement of a quality gate.
The ABS uses the Generic Statistical Business Process Model (GSBPM) as a guide to map
the activities of statistical processes against. This is done to ensure all aspects of the
statistical process are included for monitoring purposes.
By identifying the key activities associated with each step of the statistical process, an
assessment of whether there are any risks in those steps can be made up front. This
assists with determining where best to place quality gates. Some common risky areas in
a process include:
• Hand-over or integration of data between multiple areas;
9 Guidelines on Risk Management practices in statistical organisations – ANNEX - FIRST DRAFT
• Data transformation;
• Changes to processes, methods and systems.
The ABS has an overarching Risk Management Framework, based on the International Risk
Management Standard ISO 31000:2009, which details the ABS approach to risk
management. The ABS has adapted this Risk Management Framework to suit the business
needs of the organization. One such adaptation of this Risk Management Framework is the
ABS' Statistical Risk Management Framework which cross classifies the levels of "Likelihood"
(chance of the risk occurring) and "Consequence" (effect on the immediate process or
statistical outputs of the risk occurring) to reveal an overall assessment of the statistical risk
which could be either Low (L), Moderate (M), High (H) or Extreme (E).
If a statistical risk assessment reveals that the risk rating is extreme or high it is
recommended that a quality gate be utilized to mitigate the statistical risk.
For medium risk ratings it may be useful to utilize additional quality measures in existing
quality gates that assist in monitoring the aspects which will highlight if the process isn't
working correctly.
Routine procedures are generally sufficient for the monitoring of low risk ratings.
2. QUALITY MEASURES. Quality measures are a set of indicators that provide information
about potential problems at a given point in the process. When determining what
quality measures should be included in a specific quality gate it is important to consider
the risks and what information would be required in order to make an assessment about
fitness for purpose at that point in time.
3. ROLES. This component involves assigning tasks to various people or areas involved in
the operation of a quality gate. Roles identifies areas or people who are directly
connected to the quality gate and its operation, along with people or areas who are
affected by issues with the process.
4. TOLERANCE. Tolerance refers to an acceptable level of quality. The acceptable level
could be qualitative (e.g. Yes/No) or quantitative (e.g. 97%). Tolerance levels or
thresholds are generally set by expectations of what should be observed at that point in
the process for a given quality measure.
5. ACTIONS. Actions are predetermined responses to various outcomes for a quality gate.
They provide a definition of what will be done if threshold or tolerance levels are met or
not met with regards to each quality measure.
6. EVALUATION. As with any process that is undertaken an evaluation or review should
occur to examine where improvements can be made for future use. At the end of each
statistical process cycle is it recommended that the quality gates should be evaluated to
determine what worked well, what didn't and where improvements can be made.
10 Guidelines on Risk Management practices in statistical organisations – ANNEX - FIRST DRAFT
SECTION 2: RISK MANAGEMENT PROCESS
Paragraph 2. CONTEXT ANALYSIS
FOCUS ON: Measuring Risk perception and Risk maturity. The Italian experience
At Istat (Italian National Institute of Statistics), in order to measure Risk perception and
Risk maturity, a questionnaire was submitted to the Top-Management in 2011. The survey
was carried out through a web application to about 30 Top Managers and it regarded their
perception of the dynamics and severity of risk factors that could affect the activities of
single offices or of the entire Institute. Among the possible methodological options
evaluated for the topographic analysis of risk perception in ISTAT, the selected questionnaire
is based on an international standard (ISO 31000:2009, AS / NZS 4360:1999, A & O) and
modeled according to the definitions of an EU framework (PD ISO / IEC Guide 73:2002 and
standards FERMA - Federation of European Risk Management Associations).
The Survey is made up of more than 60 questions and focuses on:
1. the level of attention given to risk management when programming and monitoring the
main activities of the Directorates and the Institute;
2. the alignment of the current tools used for programming and control with the risk
management system;
3. finding, although in simplified form, the factors that may cause injury, distinguishing
among internal risks, external risks and cross sectional risks.
The questionnaire uses heterogeneous expressions and different types of responses, in
order to keep constant the level of attention of the respondent; and it sometimes uses
subjective terms, such as "substantially", "normally", "total", etc. as the survey is used to
detect perception.
The survey on risk perception explored the most representative dimensions of managers’
organizational behavior when the critical events occur. The information obtained was
processed to highlight the incidence of risk factors on planning and organizing the activities
of each single structure and of the Institute's goals. For this purpose, ISTAT selected four
dimensions, which are most representative of the attitude of managers with respect to
critical events. They describe:
1. the perception of risk compared to the activities of the manager: measured by the
content of those responses that determine “whether” and “how much” the risk affects
the planning and management of the manager’s activities within the structure of
belonging;
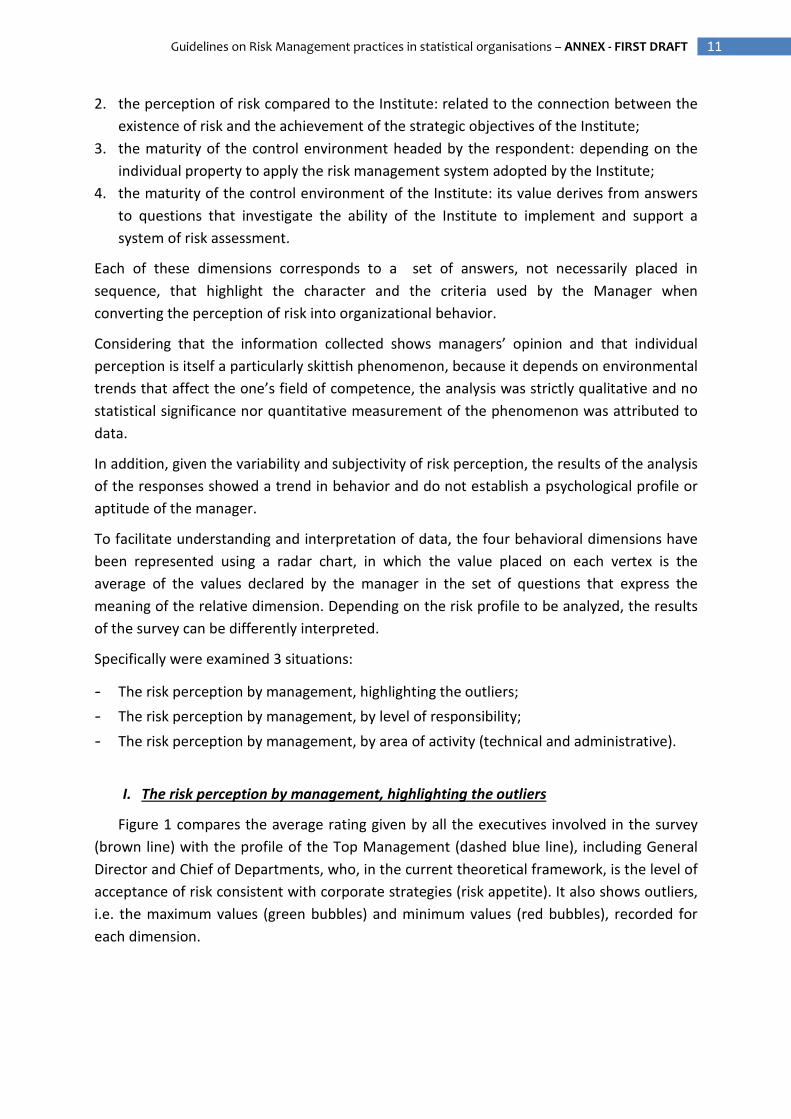
11 Guidelines on Risk Management practices in statistical organisations – ANNEX - FIRST DRAFT
2. the perception of risk compared to the Institute: related to the connection between the
existence of risk and the achievement of the strategic objectives of the Institute;
3. the maturity of the control environment headed by the respondent: depending on the
individual property to apply the risk management system adopted by the Institute;
4. the maturity of the control environment of the Institute: its value derives from answers
to questions that investigate the ability of the Institute to implement and support a
system of risk assessment.
Each of these dimensions corresponds to a set of answers, not necessarily placed in
sequence, that highlight the character and the criteria used by the Manager when
converting the perception of risk into organizational behavior.
Considering that the information collected shows managers’ opinion and that individual
perception is itself a particularly skittish phenomenon, because it depends on environmental
trends that affect the one’s field of competence, the analysis was strictly qualitative and no
statistical significance nor quantitative measurement of the phenomenon was attributed to
data.
In addition, given the variability and subjectivity of risk perception, the results of the analysis
of the responses showed a trend in behavior and do not establish a psychological profile or
aptitude of the manager.
To facilitate understanding and interpretation of data, the four behavioral dimensions have
been represented using a radar chart, in which the value placed on each vertex is the
average of the values declared by the manager in the set of questions that express the
meaning of the relative dimension. Depending on the risk profile to be analyzed, the results
of the survey can be differently interpreted.
Specifically were examined 3 situations:
- The risk perception by management, highlighting the outliers;
- The risk perception by management, by level of responsibility;
- The risk perception by management, by area of activity (technical and administrative).
I. The risk perception by management, highlighting the outliers
Figure 1 compares the average rating given by all the executives involved in the survey
(brown line) with the profile of the Top Management (dashed blue line), including General
Director and Chief of Departments, who, in the current theoretical framework, is the level of
acceptance of risk consistent with corporate strategies (risk appetite). It also shows outliers,
i.e. the maximum values (green bubbles) and minimum values (red bubbles), recorded for
each dimension.
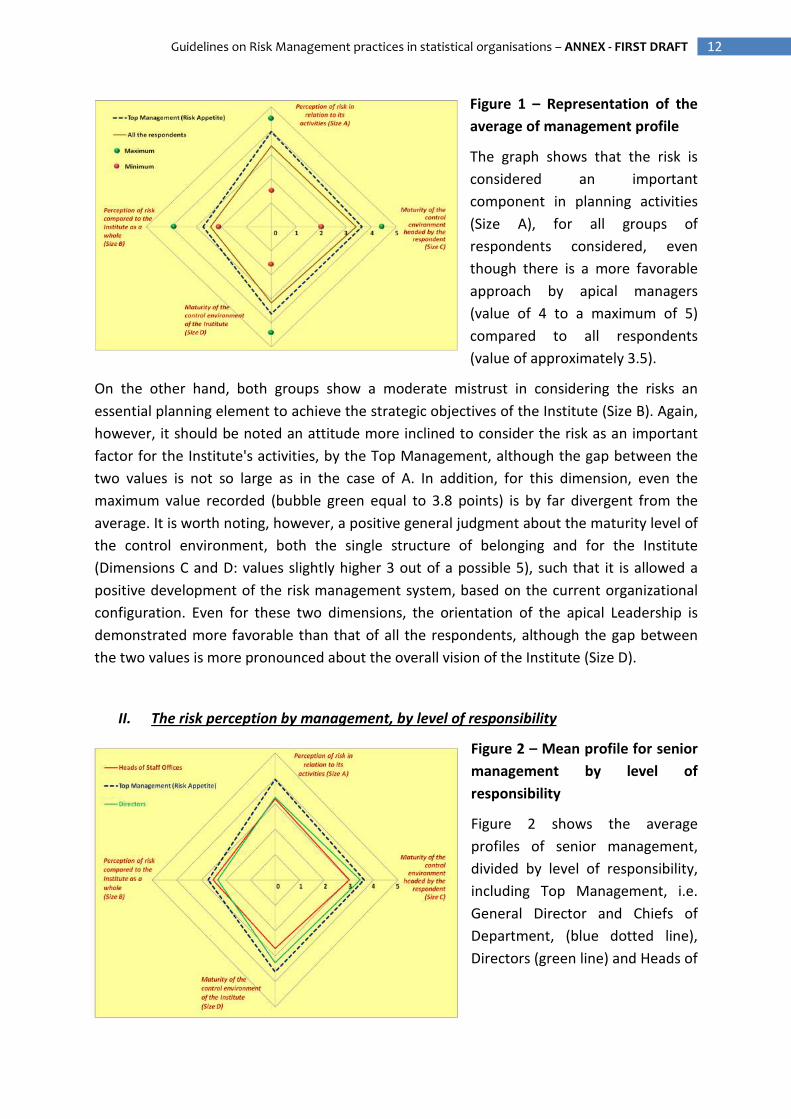
12 Guidelines on Risk Management practices in statistical organisations – ANNEX - FIRST DRAFT
Figure 1 – Representation of the
average of management profile
The graph shows that the risk is
considered an important
component in planning activities
(Size A), for all groups of
respondents considered, even
though there is a more favorable
approach by apical managers
(value of 4 to a maximum of 5)
compared to all respondents
(value of approximately 3.5).
On the other hand, both groups show a moderate mistrust in considering the risks an
essential planning element to achieve the strategic objectives of the Institute (Size B). Again,
however, it should be noted an attitude more inclined to consider the risk as an important
factor for the Institute's activities, by the Top Management, although the gap between the
two values is not so large as in the case of A. In addition, for this dimension, even the
maximum value recorded (bubble green equal to 3.8 points) is by far divergent from the
average. It is worth noting, however, a positive general judgment about the maturity level of
the control environment, both the single structure of belonging and for the Institute
(Dimensions C and D: values slightly higher 3 out of a possible 5), such that it is allowed a
positive development of the risk management system, based on the current organizational
configuration. Even for these two dimensions, the orientation of the apical Leadership is
demonstrated more favorable than that of all the respondents, although the gap between
the two values is more pronounced about the overall vision of the Institute (Size D).
II. The risk perception by management, by level of responsibility
Figure 2 – Mean profile for senior
management by level of
responsibility
Figure 2 shows the average
profiles of senior management,
divided by level of responsibility,
including Top Management, i.e.
General Director and Chiefs of
Department, (blue dotted line),
Directors (green line) and Heads of
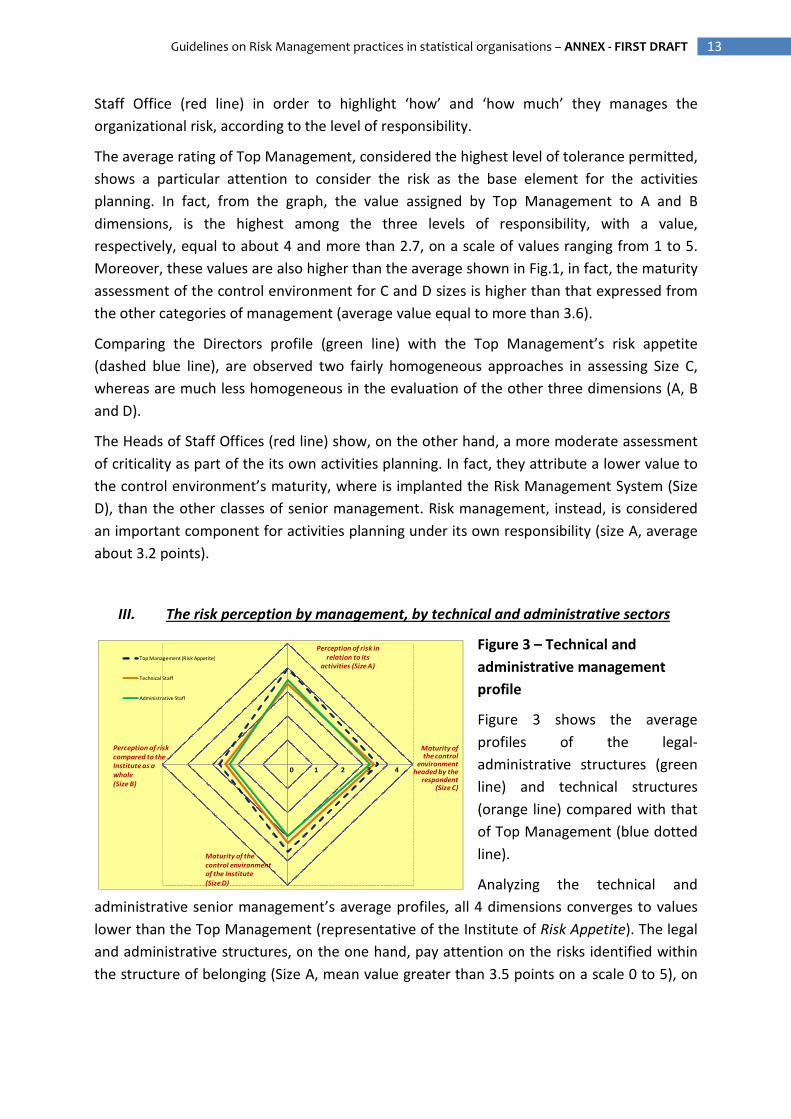
13 Guidelines on Risk Management practices in statistical organisations – ANNEX - FIRST DRAFT
Staff Office (red line) in order to highlight ‘how’ and ‘how much’ they manages the
organizational risk, according to the level of responsibility.
The average rating of Top Management, considered the highest level of tolerance permitted,
shows a particular attention to consider the risk as the base element for the activities
planning. In fact, from the graph, the value assigned by Top Management to A and B
dimensions, is the highest among the three levels of responsibility, with a value,
respectively, equal to about 4 and more than 2.7, on a scale of values ranging from 1 to 5.
Moreover, these values are also higher than the average shown in Fig.1, in fact, the maturity
assessment of the control environment for C and D sizes is higher than that expressed from
the other categories of management (average value equal to more than 3.6).
Comparing the Directors profile (green line) with the Top Management’s risk appetite
(dashed blue line), are observed two fairly homogeneous approaches in assessing Size C,
whereas are much less homogeneous in the evaluation of the other three dimensions (A, B
and D).
The Heads of Staff Offices (red line) show, on the other hand, a more moderate assessment
of criticality as part of the its own activities planning. In fact, they attribute a lower value to
the control environment’s maturity, where is implanted the Risk Management System (Size
D), than the other classes of senior management. Risk management, instead, is considered
an important component for activities planning under its own responsibility (size A, average
about 3.2 points).
III. The risk perception by management, by technical and administrative sectors
Figure 3 – Technical and
administrative management
profile
Figure 3 shows the average
profiles of the legal-
administrative structures (green
line) and technical structures
(orange line) compared with that
of Top Management (blue dotted
line).
Analyzing the technical and
administrative senior management’s average profiles, all 4 dimensions converges to values
lower than the Top Management (representative of the Institute of Risk Appetite). The legal
and administrative structures, on the one hand, pay attention on the risks identified within
the structure of belonging (Size A, mean value greater than 3.5 points on a scale 0 to 5), on
Top Management (Risk Appetite)
Technical Staff
Administrative Staff
0 1 2 3 4
Perception of risk in
relation to its
activities (Size A)
Maturity of the control
environment headed by the
respondent(Size C)
Maturity of the
control environment
of the Institute
(Size D)
Perception of risk
compared to the
Institute as a
whole
(Size B)
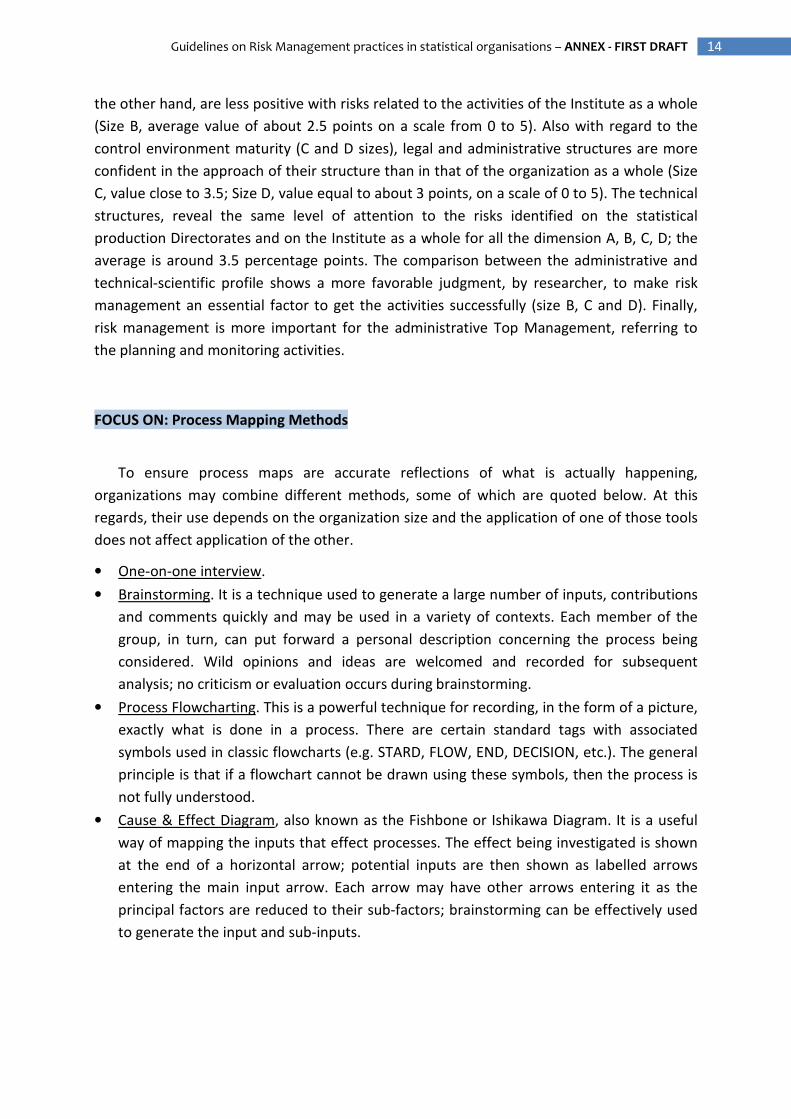
14 Guidelines on Risk Management practices in statistical organisations – ANNEX - FIRST DRAFT
the other hand, are less positive with risks related to the activities of the Institute as a whole
(Size B, average value of about 2.5 points on a scale from 0 to 5). Also with regard to the
control environment maturity (C and D sizes), legal and administrative structures are more
confident in the approach of their structure than in that of the organization as a whole (Size
C, value close to 3.5; Size D, value equal to about 3 points, on a scale of 0 to 5). The technical
structures, reveal the same level of attention to the risks identified on the statistical
production Directorates and on the Institute as a whole for all the dimension A, B, C, D; the
average is around 3.5 percentage points. The comparison between the administrative and
technical-scientific profile shows a more favorable judgment, by researcher, to make risk
management an essential factor to get the activities successfully (size B, C and D). Finally,
risk management is more important for the administrative Top Management, referring to
the planning and monitoring activities.
FOCUS ON: Process Mapping Methods
To ensure process maps are accurate reflections of what is actually happening,
organizations may combine different methods, some of which are quoted below. At this
regards, their use depends on the organization size and the application of one of those tools
does not affect application of the other.
• One-on-one interview.
• Brainstorming. It is a technique used to generate a large number of inputs, contributions
and comments quickly and may be used in a variety of contexts. Each member of the
group, in turn, can put forward a personal description concerning the process being
considered. Wild opinions and ideas are welcomed and recorded for subsequent
analysis; no criticism or evaluation occurs during brainstorming.
• Process Flowcharting. This is a powerful technique for recording, in the form of a picture,
exactly what is done in a process. There are certain standard tags with associated
symbols used in classic flowcharts (e.g. STARD, FLOW, END, DECISION, etc.). The general
principle is that if a flowchart cannot be drawn using these symbols, then the process is
not fully understood.
• Cause & Effect Diagram, also known as the Fishbone or Ishikawa Diagram. It is a useful
way of mapping the inputs that effect processes. The effect being investigated is shown
at the end of a horizontal arrow; potential inputs are then shown as labelled arrows
entering the main input arrow. Each arrow may have other arrows entering it as the
principal factors are reduced to their sub-factors; brainstorming can be effectively used
to generate the input and sub-inputs.
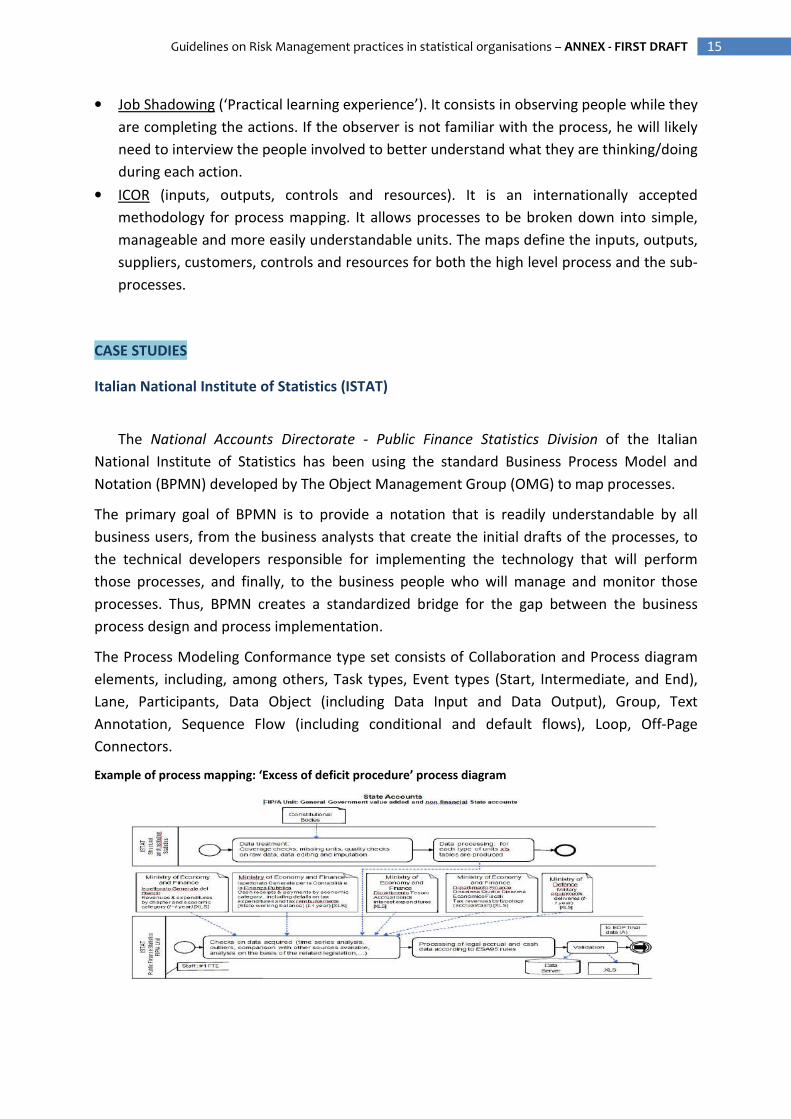
15 Guidelines on Risk Management practices in statistical organisations – ANNEX - FIRST DRAFT
• Job Shadowing (‘Practical learning experience’). It consists in observing people while they
are completing the actions. If the observer is not familiar with the process, he will likely
need to interview the people involved to better understand what they are thinking/doing
during each action.
• ICOR (inputs, outputs, controls and resources). It is an internationally accepted
methodology for process mapping. It allows processes to be broken down into simple,
manageable and more easily understandable units. The maps define the inputs, outputs,
suppliers, customers, controls and resources for both the high level process and the sub-
processes.
CASE STUDIES
Italian National Institute of Statistics (ISTAT)
The National Accounts Directorate - Public Finance Statistics Division of the Italian
National Institute of Statistics has been using the standard Business Process Model and
Notation (BPMN) developed by The Object Management Group (OMG) to map processes.
The primary goal of BPMN is to provide a notation that is readily understandable by all
business users, from the business analysts that create the initial drafts of the processes, to
the technical developers responsible for implementing the technology that will perform
those processes, and finally, to the business people who will manage and monitor those
processes. Thus, BPMN creates a standardized bridge for the gap between the business
process design and process implementation.
The Process Modeling Conformance type set consists of Collaboration and Process diagram
elements, including, among others, Task types, Event types (Start, Intermediate, and End),
Lane, Participants, Data Object (including Data Input and Data Output), Group, Text
Annotation, Sequence Flow (including conditional and default flows), Loop, Off-Page
Connectors.
Example of process mapping: ‘Excess of deficit procedure’ process diagram
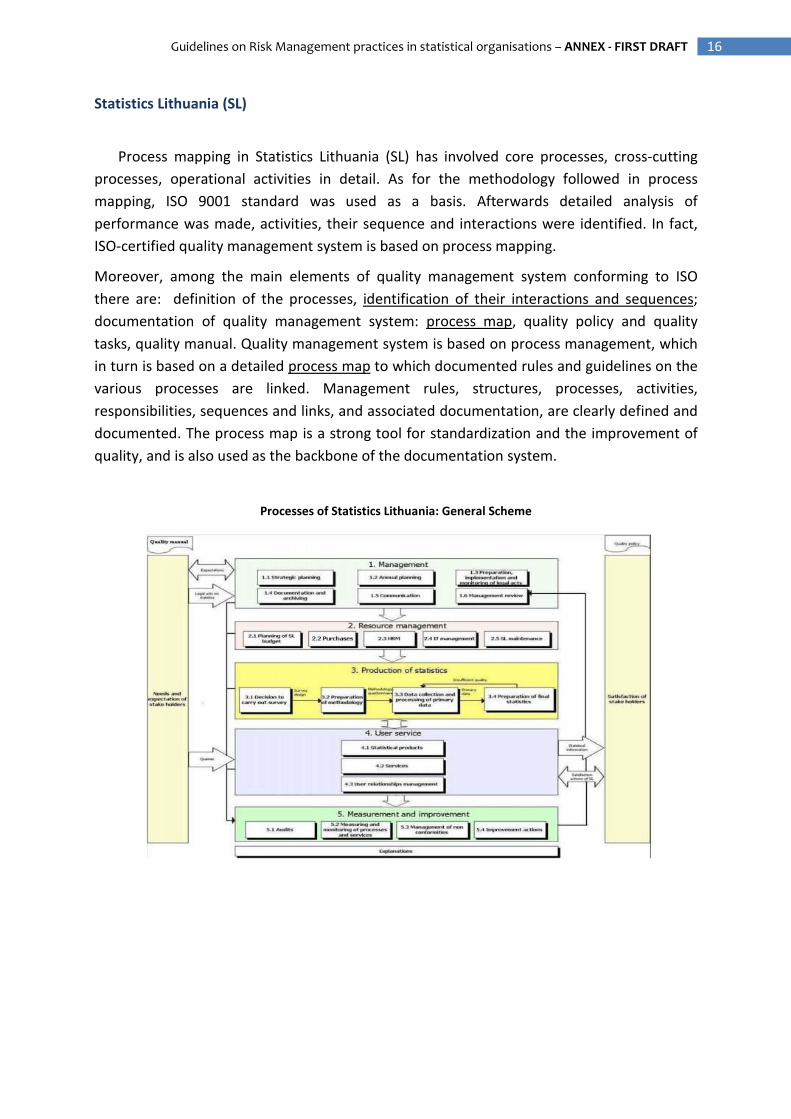
16 Guidelines on Risk Management practices in statistical organisations – ANNEX - FIRST DRAFT
Statistics Lithuania (SL)
Process mapping in Statistics Lithuania (SL) has involved core processes, cross-cutting
processes, operational activities in detail. As for the methodology followed in process
mapping, ISO 9001 standard was used as a basis. Afterwards detailed analysis of
performance was made, activities, their sequence and interactions were identified. In fact,
ISO-certified quality management system is based on process mapping.
Moreover, among the main elements of quality management system conforming to ISO
there are: definition of the processes, identification of their interactions and sequences;
documentation of quality management system: process map, quality policy and quality
tasks, quality manual. Quality management system is based on process management, which
in turn is based on a detailed process map to which documented rules and guidelines on the
various processes are linked. Management rules, structures, processes, activities,
responsibilities, sequences and links, and associated documentation, are clearly defined and
documented. The process map is a strong tool for standardization and the improvement of
quality, and is also used as the backbone of the documentation system.
Processes of Statistics Lithuania: General Scheme
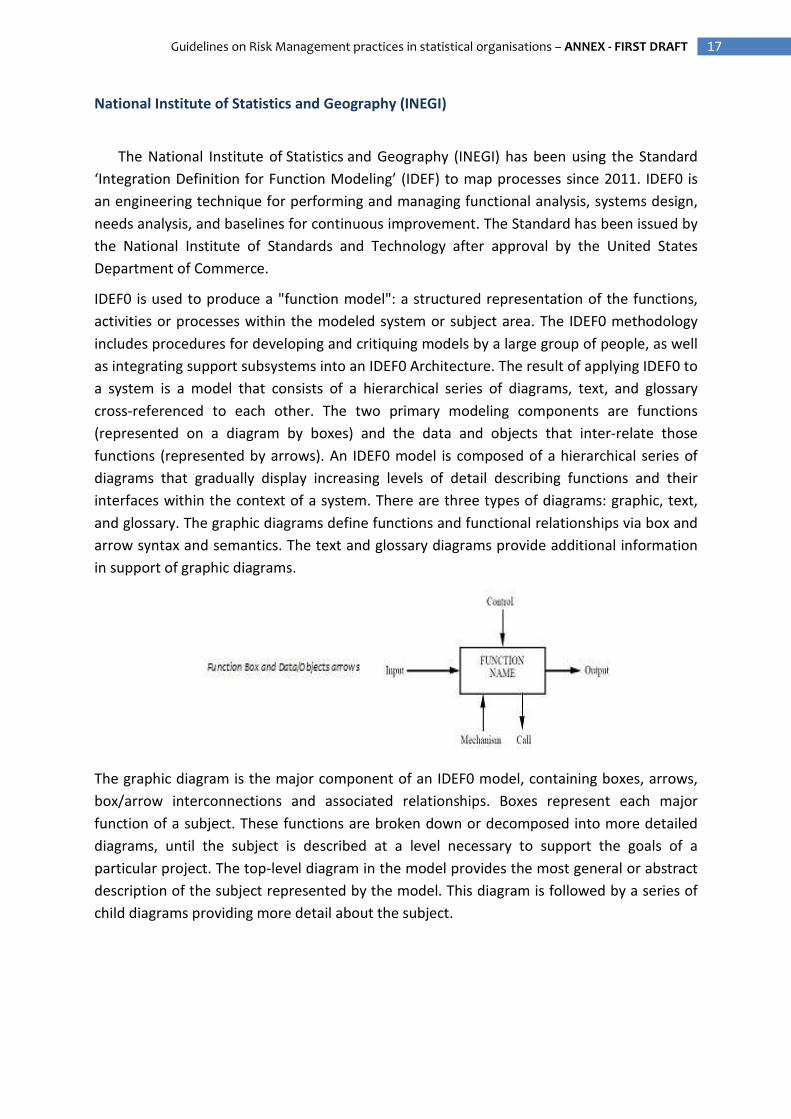
17 Guidelines on Risk Management practices in statistical organisations – ANNEX - FIRST DRAFT
National Institute of Statistics and Geography (INEGI)
The National Institute of Statistics and Geography (INEGI) has been using the Standard
‘Integration Definition for Function Modeling’ (IDEF) to map processes since 2011. IDEF0 is
an engineering technique for performing and managing functional analysis, systems design,
needs analysis, and baselines for continuous improvement. The Standard has been issued by
the National Institute of Standards and Technology after approval by the United States
Department of Commerce.
IDEF0 is used to produce a "function model": a structured representation of the functions,
activities or processes within the modeled system or subject area. The IDEF0 methodology
includes procedures for developing and critiquing models by a large group of people, as well
as integrating support subsystems into an IDEF0 Architecture. The result of applying IDEF0 to
a system is a model that consists of a hierarchical series of diagrams, text, and glossary
cross-referenced to each other. The two primary modeling components are functions
(represented on a diagram by boxes) and the data and objects that inter-relate those
functions (represented by arrows). An IDEF0 model is composed of a hierarchical series of
diagrams that gradually display increasing levels of detail describing functions and their
interfaces within the context of a system. There are three types of diagrams: graphic, text,
and glossary. The graphic diagrams define functions and functional relationships via box and
arrow syntax and semantics. The text and glossary diagrams provide additional information
in support of graphic diagrams.
The graphic diagram is the major component of an IDEF0 model, containing boxes, arrows,
box/arrow interconnections and associated relationships. Boxes represent each major
function of a subject. These functions are broken down or decomposed into more detailed
diagrams, until the subject is described at a level necessary to support the goals of a
particular project. The top-level diagram in the model provides the most general or abstract
description of the subject represented by the model. This diagram is followed by a series of
child diagrams providing more detail about the subject.
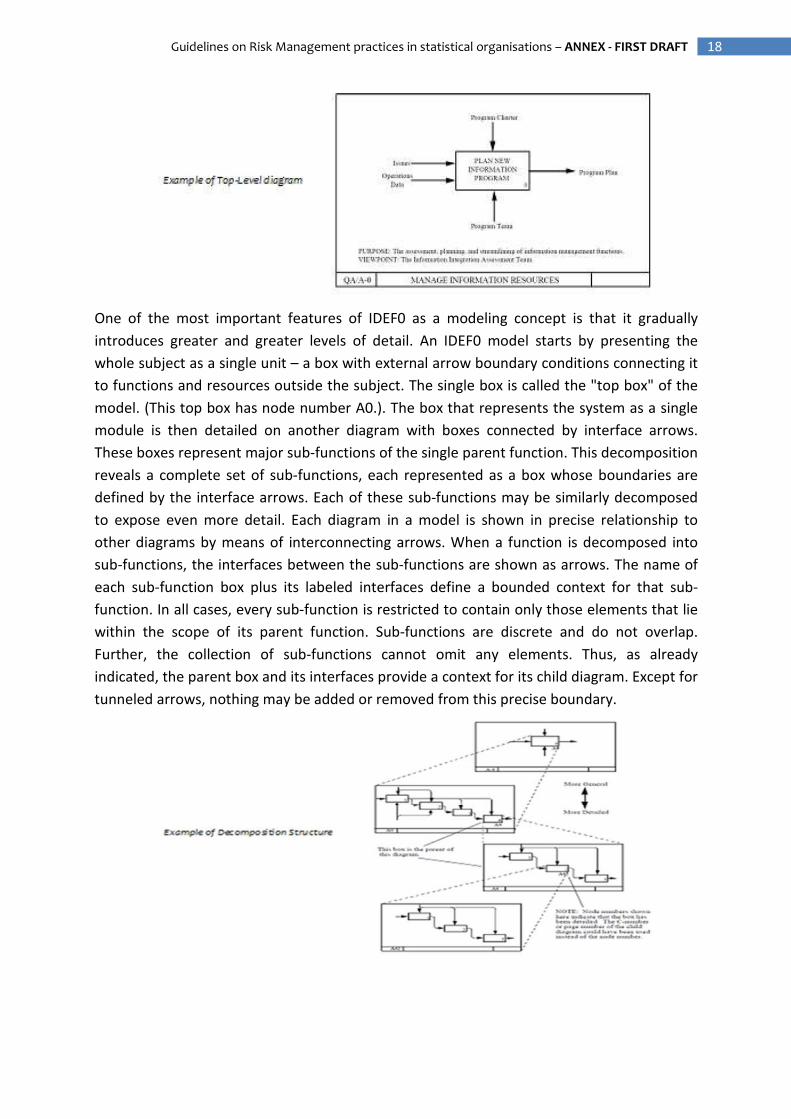
18 Guidelines on Risk Management practices in statistical organisations – ANNEX - FIRST DRAFT
One of the most important features of IDEF0 as a modeling concept is that it gradually
introduces greater and greater levels of detail. An IDEF0 model starts by presenting the
whole subject as a single unit – a box with external arrow boundary conditions connecting it
to functions and resources outside the subject. The single box is called the "top box" of the
model. (This top box has node number A0.). The box that represents the system as a single
module is then detailed on another diagram with boxes connected by interface arrows.
These boxes represent major sub-functions of the single parent function. This decomposition
reveals a complete set of sub-functions, each represented as a box whose boundaries are
defined by the interface arrows. Each of these sub-functions may be similarly decomposed
to expose even more detail. Each diagram in a model is shown in precise relationship to
other diagrams by means of interconnecting arrows. When a function is decomposed into
sub-functions, the interfaces between the sub-functions are shown as arrows. The name of
each sub-function box plus its labeled interfaces define a bounded context for that sub-
function. In all cases, every sub-function is restricted to contain only those elements that lie
within the scope of its parent function. Sub-functions are discrete and do not overlap.
Further, the collection of sub-functions cannot omit any elements. Thus, as already
indicated, the parent box and its interfaces provide a context for its child diagram. Except for
tunneled arrows, nothing may be added or removed from this precise boundary.
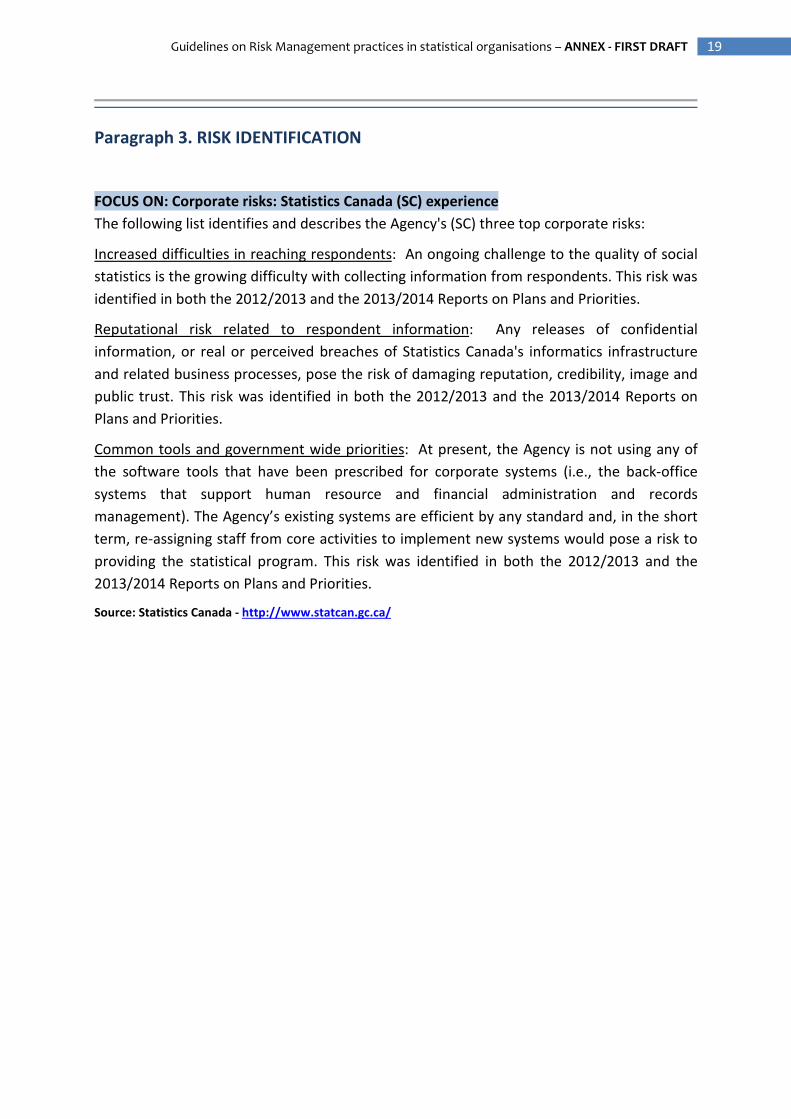
19 Guidelines on Risk Management practices in statistical organisations – ANNEX - FIRST DRAFT
Paragraph 3. RISK IDENTIFICATION
FOCUS ON: Corporate risks: Statistics Canada (SC) experience
The following list identifies and describes the Agency's (SC) three top corporate risks:
Increased difficulties in reaching respondents: An ongoing challenge to the quality of social
statistics is the growing difficulty with collecting information from respondents. This risk was
identified in both the 2012/2013 and the 2013/2014 Reports on Plans and Priorities.
Reputational risk related to respondent information: Any releases of confidential
information, or real or perceived breaches of Statistics Canada's informatics infrastructure
and related business processes, pose the risk of damaging reputation, credibility, image and
public trust. This risk was identified in both the 2012/2013 and the 2013/2014 Reports on
Plans and Priorities.
Common tools and government wide priorities: At present, the Agency is not using any of
the software tools that have been prescribed for corporate systems (i.e., the back-office
systems that support human resource and financial administration and records
management). The Agency’s existing systems are efficient by any standard and, in the short
term, re-assigning staff from core activities to implement new systems would pose a risk to
providing the statistical program. This risk was identified in both the 2012/2013 and the
2013/2014 Reports on Plans and Priorities.
Source: Statistics Canada - http://www.statcan.gc.ca/
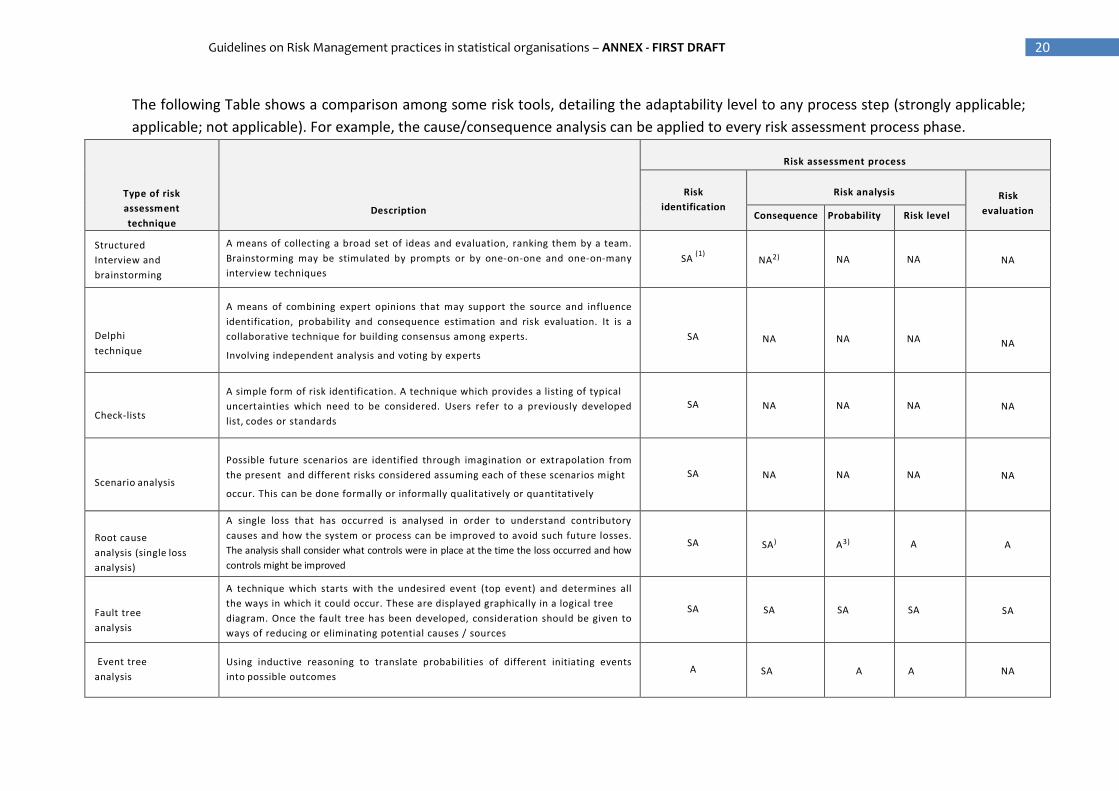
20 Guidelines on Risk Management practices in statistical organisations – ANNEX - FIRST DRAFT
The following Table shows a comparison among some risk tools, detailing the adaptability level to any process step (strongly applicable;
applicable; not applicable). For example, the cause/consequence analysis can be applied to every risk assessment process phase.
Type of risk
assessment
technique
Description
Risk assessment process
Risk
identification
Risk anal ysis
Risk
evaluation Consequence Probabilit y Risk level
Structured
Interview and
brainstorming
A means of collecting a broad set of ideas and evaluation, ranking them by a team.
Brainstorming may be stimulated by prompts or by one-on-one and one-on-many
interview techniques SA
(1) NA2) NA NA NA
Delphi
technique
A means of combining expert opinions that may support the source and influence
identification, probability and consequence estimation and risk evaluation. It is a
collaborative technique for building consensus among experts.
Involving independent analysis and voting by experts
SA
NA
NA
NA
NA
Check-lists
A simple form of risk identification. A technique which provides a listing of typical
uncertainties which need to be considered. Users refer to a previously developed
list, codes or standards SA NA NA NA NA
Scenario analysis
Possible future scenarios are identified through imagination or extrapolation from
the present and different risks considered assuming each of these scenarios might
occur. This can be done formally or informally qualitatively or quantitatively
SA NA NA NA NA
Root cause
analysis (single loss
analysis)
A single loss that has occurred is analysed in order to understand contributory
causes and how the system or process can be improved to avoid such future losses.
The analysis shall consider what controls were in place at the time the loss occurred and how
controls might be improved
SA SA) A3) A A
Fault tree
analysis
A technique which starts with the undesired event (top event) and determines all
the ways in which it could occur. These are displayed graphically in a logical tree
diagram. Once the fault tree has been developed, consideration should be given to
ways of reducing or eliminating potential causes / sources
SA SA SA SA SA
Event tree
analysis Using inductive reasoning to translate probabilities of different initiating events
into possible outcomes A SA A A NA
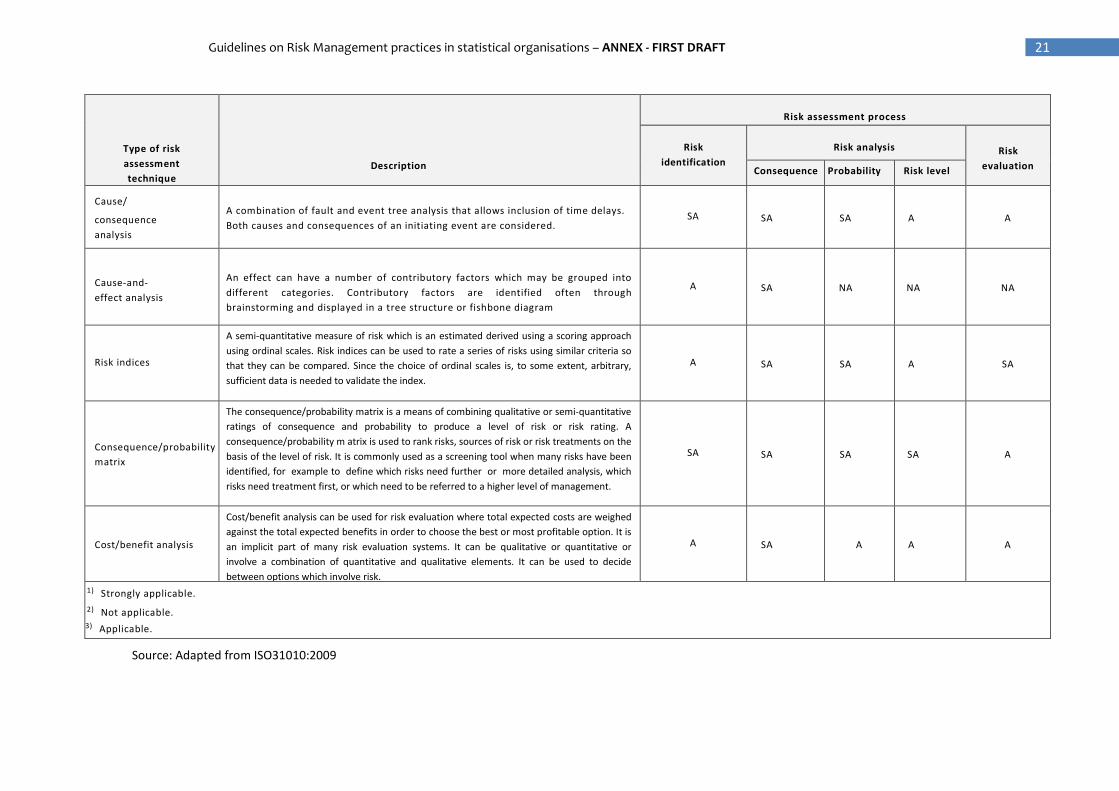
21 Guidelines on Risk Management practices in statistical organisations – ANNEX - FIRST DRAFT
Type of risk
assessment
technique
Description
Risk assessment process
Risk
identification
Risk anal ysis
Risk
evaluation Consequence Probabilit y Risk level
Cause/
consequence
analysis
A combination of fault and event tree analysis that allows inclusion of time delays.
Both causes and consequences of an initiating event are considered. SA SA SA A A
Cause-and-
effect analysis
An effect can have a number of contributory factors which may be grouped into
different categories. Contributory factors are identified often through
brainstorming and displayed in a tree structure or fishbone diagram
A SA NA NA NA
Risk indices
A semi-quantitative measure of risk which is an estimated derived using a scoring approach
using ordinal scales. Risk indices can be used to rate a series of risks using similar criteria so
that they can be compared. Since the choice of ordinal scales is, to some extent, arbitrary,
sufficient data is needed to validate the index.
A SA SA A SA
Consequence/probability
matrix
The consequence/probability matrix is a means of combining qualitative or semi-quantitative
ratings of consequence and probability to produce a level of risk or risk rating. A
consequence/probability m atrix is used to rank risks, sources of risk or risk treatments on the
basis of the level of risk. It is commonly used as a screening tool when many risks have been
identified, for example to define which risks need further or more detailed analysis, which
risks need treatment first, or which need to be referred to a higher level of management.
SA SA SA SA A
Cost/benefit analysis
Cost/benefit analysis can be used for risk evaluation where total expected costs are weighed
against the total expected benefits in order to choose the best or most profitable option. It is
an implicit part of many risk evaluation systems. It can be qualitative or quantitative or
involve a combination of quantitative and qualitative elements. It can be used to decide
between options which involve risk.
A SA A A A
1) Strongly applicable.
2) Not applicable.
3) Applicable.
Source: Adapted from ISO31010:2009
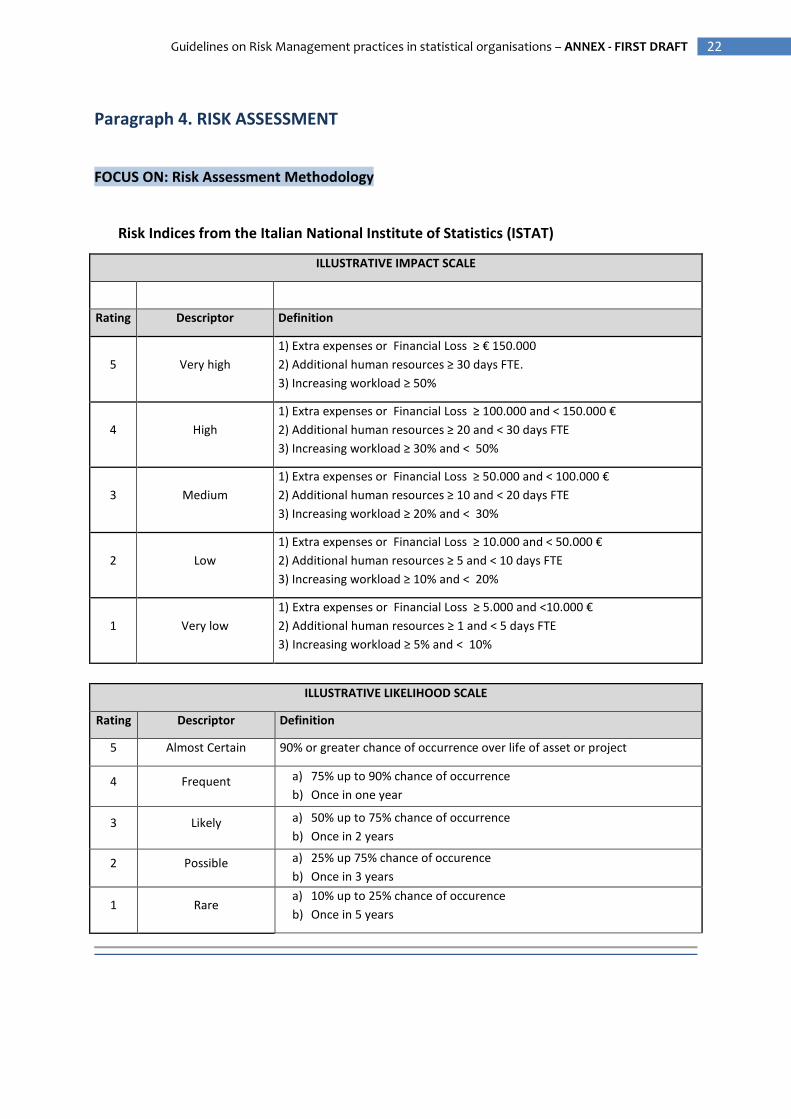
22 Guidelines on Risk Management practices in statistical organisations – ANNEX - FIRST DRAFT
Paragraph 4. RISK ASSESSMENT
FOCUS ON: Risk Assessment Methodology
Risk Indices from the Italian National Institute of Statistics (ISTAT)
ILLUSTRATIVE IMPACT SCALE
Rating Descriptor Definition
5 Very high
1) Extra expenses or Financial Loss ≥ € 150.000
2) Additional human resources ≥ 30 days FTE.
3) Increasing workload ≥ 50%
4 High
1) Extra expenses or Financial Loss ≥ 100.000 and < 150.000 €
2) Additional human resources ≥ 20 and < 30 days FTE
3) Increasing workload ≥ 30% and < 50%
3 Medium
1) Extra expenses or Financial Loss ≥ 50.000 and < 100.000 €
2) Additional human resources ≥ 10 and < 20 days FTE
3) Increasing workload ≥ 20% and < 30%
2 Low
1) Extra expenses or Financial Loss ≥ 10.000 and < 50.000 €
2) Additional human resources ≥ 5 and < 10 days FTE
3) Increasing workload ≥ 10% and < 20%
1 Very low
1) Extra expenses or Financial Loss ≥ 5.000 and <10.000 €
2) Additional human resources ≥ 1 and < 5 days FTE
3) Increasing workload ≥ 5% and < 10%
ILLUSTRATIVE LIKELIHOOD SCALE
Rating Descriptor Definition
5 Almost Certain 90% or greater chance of occurrence over life of asset or project
4 Frequent a) 75% up to 90% chance of occurrence
b) Once in one year
3 Likely a) 50% up to 75% chance of occurrence
b) Once in 2 years
2 Possible a) 25% up 75% chance of occurence
b) Once in 3 years
1 Rare a) 10% up to 25% chance of occurence
b) Once in 5 years
23 Guidelines on Risk Management practices in statistical organisations – ANNEX - FIRST DRAFT
Paragraph 5. RISK TREATMENT
CASE STUDIES:
Australian Bureau of Statistics (ABS)
In ABS (Australian Bureau of Statistics), accountability for risk treatment is determined by
the risk owner and is often shared across a range of areas that are best placed to implement
controls that can reduce the risk which may sit outside the risk owner's immediate span of
control. The ABS bases the approach to risk management on the AS/NZS ISO 31000 standard.
The ABS's Risk appetite only tolerates High or Extreme risks when treatment measures are
unable to reduce the level of inherent risk to an acceptable level (i.e. Low or Moderate). Any
Extreme risk, such as a risk which would seriously threaten the credibility/reputation of the
ABS and/or with the potential to result in a parliamentary enquiry, must be brought to the
immediate attention of the Executive Leadership Group (ELG). The Senior Management
Group (SMG) must be informed of any High risk, including those that may impact/tarnish the
reputation of the ABS and/or achievement of program objectives e.g. through sustained
media coverage. Treatment measures are essential for High and Extreme risks. If strategies
to mitigate the risk take time, they must be added as standing Agenda Items to ELG
meetings (Extreme risks) or SMG meetings (High risks) until the risk is reduced. All Low or
Moderate risks will be managed within the specific area and/or routine procedures. All
Treatment measures are selected by considering the cost of implementing versus the
benefits. In some cases, Low and Moderate risks might be accepted if the cost of treating the
risk outweighs the benefit. Acceptable risks do not require treatment. Unacceptable risks
will need to be treated. The Australian Bureau of Statistics (ABS) leads Australia's national
statistical service, running hundreds of surveys and publishing thousands of pages of output
every year. As with any large and complex organization, problems with processes do arise
and the ABS has suffered errors in their data in the past with varying degrees of impact on
the public domain. Most errors are detected in-house before publication, however this has
at times resulted in intense last-minute work to correct the problems leading to delays in the
release of data. Other errors have only been discovered after release, resulting in re-issue of
statistical output. As a result of these errors the ABS has endeavored to instigate better
quality management practices through the development and use of the risk mitigation
strategy known as ‘Quality gates’. Quality gates are designed to improve the early detection
of errors or flaws in production processes.
Specifically, the principles that underpin the quality gates framework are:
24 Guidelines on Risk Management practices in statistical organisations – ANNEX - FIRST DRAFT
• quality of statistical processes should be managed in a holistic manner i.e. Total Quality
Management;
• quality management and assessment of fitness-for-purpose of statistical processes
should be evidence based;
• roles and responsibilities in the management of process quality should be clear and
explicit;
• Knowledge and information about specific stages of a statistical process should be
documented and shared;
• regular evaluation should capture lessons learnt and lead to continuous improvement of
quality management of statistical processes.
Quality gate framework is used as a statistical risk mitigation strategy primarily for statistical
processes. Where a statistical risk assessment reveals that the risk rating is extreme or high
it is recommended that a quality gate be utilized to mitigate the statistical risk. It is worth
noting that each organization will have their own risk matrix based on their tolerance for risk
and that the ABS' Statistical Risk Assessment Framework may not be suitable for use by
other organizations depending on their needs. It is also important to note that the
placement of a quality gate may be different for each production process and that the
impact on the immediate process and overall quality of the statistical outputs are key pieces
of information to assist in the placement of quality gates.
Along with these considerations it is worth keeping in mind that all quality gates used to
monitor one statistical process cycle may not be controlled by one area alone. It may be that
there are several areas (such as in the case of a hand-over situation) that have responsibility
for the development, maintenance and assessment of quality gates for a particular part of
the statistical process. Quality gates are placed at strategic places throughout a process to
identify errors or problems earlier. The explicit monitoring of the process at these given
points in time ensures that known statistical risks are mitigated. Hence, any issues are fixed
at early stages in the process rather than only identified at the end when it is often too late
to be able to change the impact on the outcome. Any problems arising in statistical
processes should be detected as early as possible. Efficiencies in both time and money are
realized through the earlier detection and resolution of errors. It is more cost effective to fix
a problem when it first occurs than at a later date which may involve months of work that
will need to be re-done.
25 Guidelines on Risk Management practices in statistical organisations – ANNEX - FIRST DRAFT
Statistics Lithuania (SL)
In Statistics Lithuania (SL), according to approved descriptions of procedures, if any risky
activity is identified, management is informed and improvement actions are defined and
performed by responsible staff. On the base of the situation, improvement actions are
implemented as soon as possible or deployed into the improvement action plan.
Process managers, appointed by the order of Director General of Statistics Lithuania, analyze
identified risks, determine their causes and possible ways of their elimination, appoint staff
responsible for improvements and monitor the effectiveness of improvement actions
implemented. The priorities for risk treatment are set by Top Management, according to the
risk measurement results. The priority is given to the activities, which are the most risky for
the process and process results. Usually, process managers are responsible for the risk
treatment, if the risk was identified in their process. They analyze the problems, determine
their causes and possible ways of their elimination, appoint staff responsible for
improvements and monitor the effectiveness of improvement actions implemented.
Especially with reference to the preparation proposals for treatment, in concrete statistical
areas cross-institutional commissions and working groups (e. g. group of experts in national
accounts) established on the initiative of SL, play important role.
Statistics Sweden
In Statistics Sweden, Risk treatment is documented in connection to the risk, specifying the
treatment itself and the person responsible for carrying out the action (always a manager at
department or unit level, in exceptions it can be the Director General). It also has to have a
starting and finishing point. If treatment is more or less constant over time the end date is
set to last of December and the action is carried over to the next year as are risks that have
not been eliminated. Risks and treatments are included in the regular follow up of
operations after each 4 month period with focus on effectiveness and deviations from plan.
All risks that are critical require treatment unless they are impossible to prevent and/or too
costly to mitigate.
High value risks shall, as a rule, result in activities to mitigate the risk, either prevent it from
happening or reduce the consequences. Under corporate risks are included the risks
managed by the security organization. These risks have treatments that are different in
characteristics and more of permanent solutions like insurance policies, contingency plans,
fixed installations, firewalls and so on. Also some compliance risks are included here. They
are documented in a separate module of the system since they have other needs for follow
26 Guidelines on Risk Management practices in statistical organisations – ANNEX - FIRST DRAFT
up purposes than operational risks. All critical risks are to have treatment though and many
of the medium and low risks also have treatments.
On agency level treatments are in general delegated to the director of one or more
departments and added to their risk lists. The directors comment on deviations and
effectiveness and the comments are compiled by the risk manager who may suggest
changes in risk values based on this. The updated risk report for the agency is presented to
the DG, the deputy DG, the Director of the Director Generals Office, the head of internal
audit and the Head of Security by the risk manager and after discussions any adjustments
are made. Once a year, after the second four month period follow up, the risk report is
signed by the DG and a preliminary risk list for the coming year is set up based on the
preliminary operational plan for the next year (operational risks at agency level). At the same
time the risk list for corporate risks (the internal control plan) is signed by the DG.
The internal control plan is regularly followed up and updated by the security organization.
Any escalated risks from departments are also decided upon on these meetings. Protocols
are kept and signed by DG and distributed to all directors along with the risk report, internal
control plan and list of escalated risks. The directors of each department are responsible for
all risks within their department but can delegate carrying out treatment to unit managers.
The units’ risks shall be listed at department level though, since the central follow up only
covers the department level and all operational risk are to be put forward to the Director
General and be more easily analyzed by the Risk manager. This means that the units’ risk
lists are generated from the departments’ risk lists and they cannot add risks themselves at
unit level according to the routine currently used. This also eliminates the need for
escalation routines within the departments. It becomes automatic. All this is documented in
a web based tool which allows risks and treatments to be delegated and escalated between
organizational levels and also makes it possible to connect a risk to a specific goal or activity
in the operational plan of the agency or the departments’ own action plans.
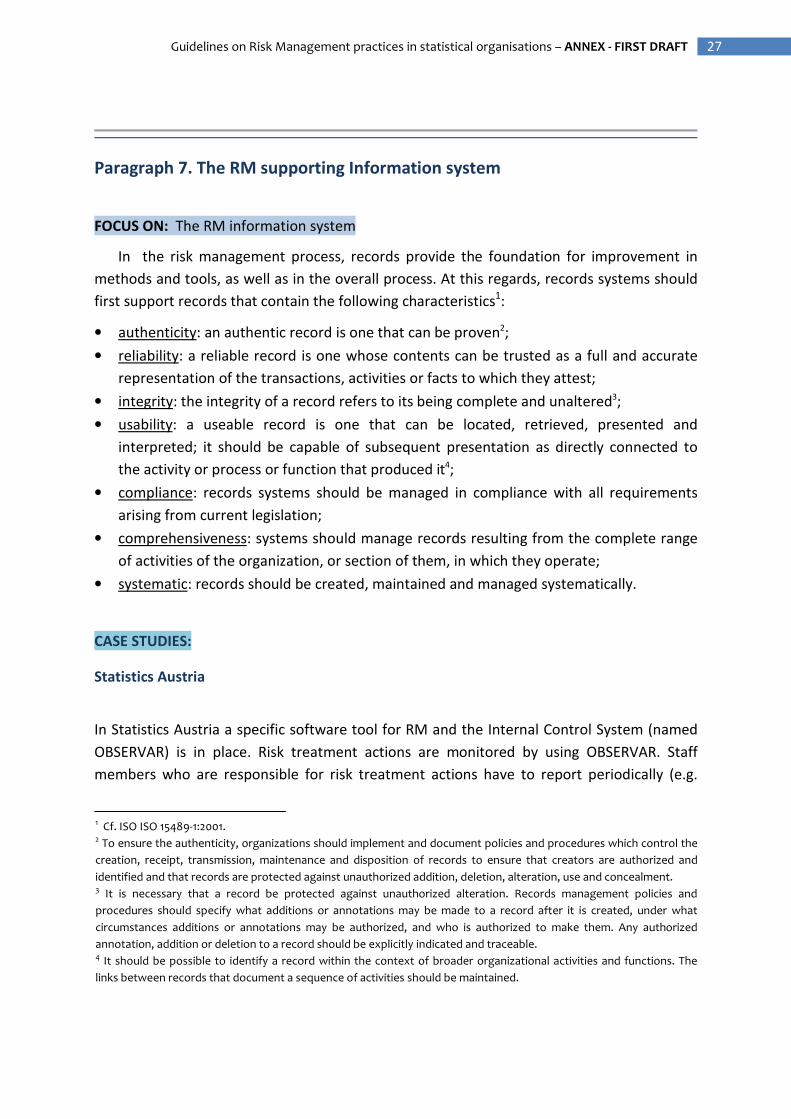
27 Guidelines on Risk Management practices in statistical organisations – ANNEX - FIRST DRAFT
Paragraph 7. The RM supporting Information system
FOCUS ON: The RM information system
In the risk management process, records provide the foundation for improvement in
methods and tools, as well as in the overall process. At this regards, records systems should
first support records that contain the following characteristics1:
• authenticity: an authentic record is one that can be proven2;
• reliability: a reliable record is one whose contents can be trusted as a full and accurate
representation of the transactions, activities or facts to which they attest;
• integrity: the integrity of a record refers to its being complete and unaltered3;
• usability: a useable record is one that can be located, retrieved, presented and
interpreted; it should be capable of subsequent presentation as directly connected to
the activity or process or function that produced it4;
• compliance: records systems should be managed in compliance with all requirements
arising from current legislation;
• comprehensiveness: systems should manage records resulting from the complete range
of activities of the organization, or section of them, in which they operate;
• systematic: records should be created, maintained and managed systematically.
CASE STUDIES:
Statistics Austria
In Statistics Austria a specific software tool for RM and the Internal Control System (named
OBSERVAR) is in place. Risk treatment actions are monitored by using OBSERVAR. Staff
members who are responsible for risk treatment actions have to report periodically (e.g.
1 Cf. ISO ISO 15489-1:2001. 2 To ensure the authenticity, organizations should implement and document policies and procedures which control the
creation, receipt, transmission, maintenance and disposition of records to ensure that creators are authorized and
identified and that records are protected against unauthorized addition, deletion, alteration, use and concealment. 3 It is necessary that a record be protected against unauthorized alteration. Records management policies and
procedures should specify what additions or annotations may be made to a record after it is created, under what
circumstances additions or annotations may be authorized, and who is authorized to make them. Any authorized
annotation, addition or deletion to a record should be explicitly indicated and traceable. 4 It should be possible to identify a record within the context of broader organizational activities and functions. The
links between records that document a sequence of activities should be maintained.
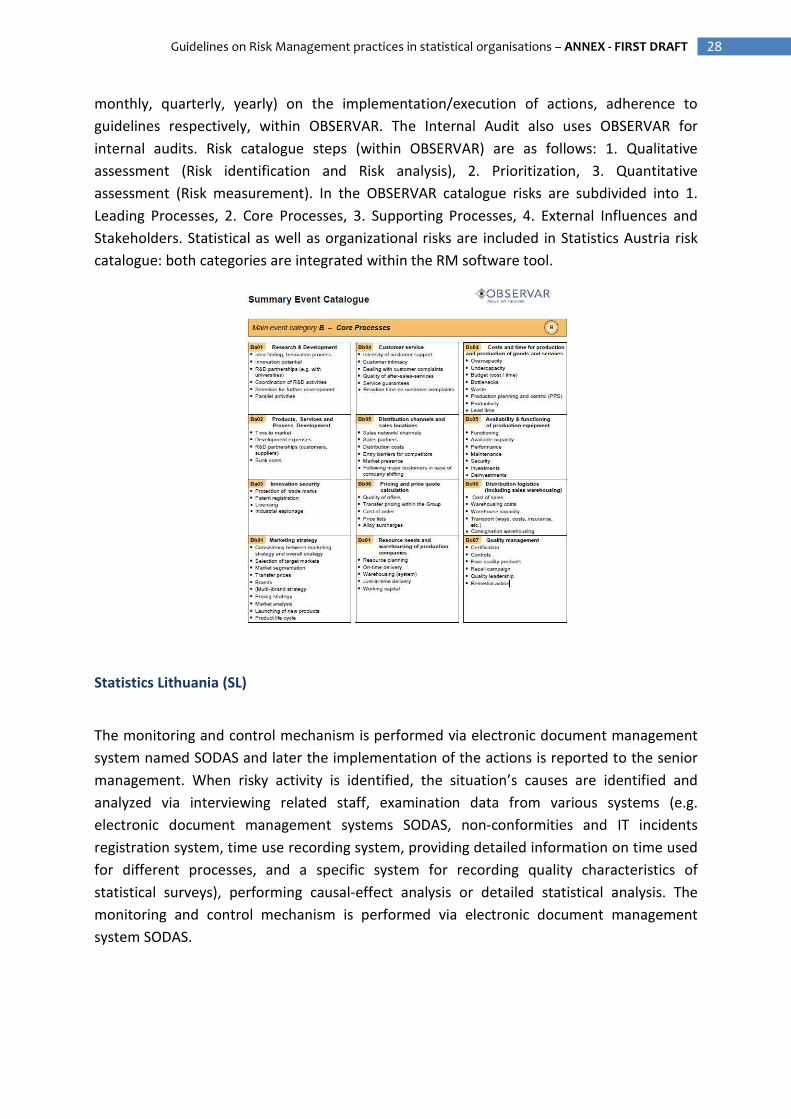
28 Guidelines on Risk Management practices in statistical organisations – ANNEX - FIRST DRAFT
monthly, quarterly, yearly) on the implementation/execution of actions, adherence to
guidelines respectively, within OBSERVAR. The Internal Audit also uses OBSERVAR for
internal audits. Risk catalogue steps (within OBSERVAR) are as follows: 1. Qualitative
assessment (Risk identification and Risk analysis), 2. Prioritization, 3. Quantitative
assessment (Risk measurement). In the OBSERVAR catalogue risks are subdivided into 1.
Leading Processes, 2. Core Processes, 3. Supporting Processes, 4. External Influences and
Stakeholders. Statistical as well as organizational risks are included in Statistics Austria risk
catalogue: both categories are integrated within the RM software tool.
Statistics Lithuania (SL)
The monitoring and control mechanism is performed via electronic document management
system named SODAS and later the implementation of the actions is reported to the senior
management. When risky activity is identified, the situation’s causes are identified and
analyzed via interviewing related staff, examination data from various systems (e.g.
electronic document management systems SODAS, non-conformities and IT incidents
registration system, time use recording system, providing detailed information on time used
for different processes, and a specific system for recording quality characteristics of
statistical surveys), performing causal-effect analysis or detailed statistical analysis. The
monitoring and control mechanism is performed via electronic document management
system SODAS.
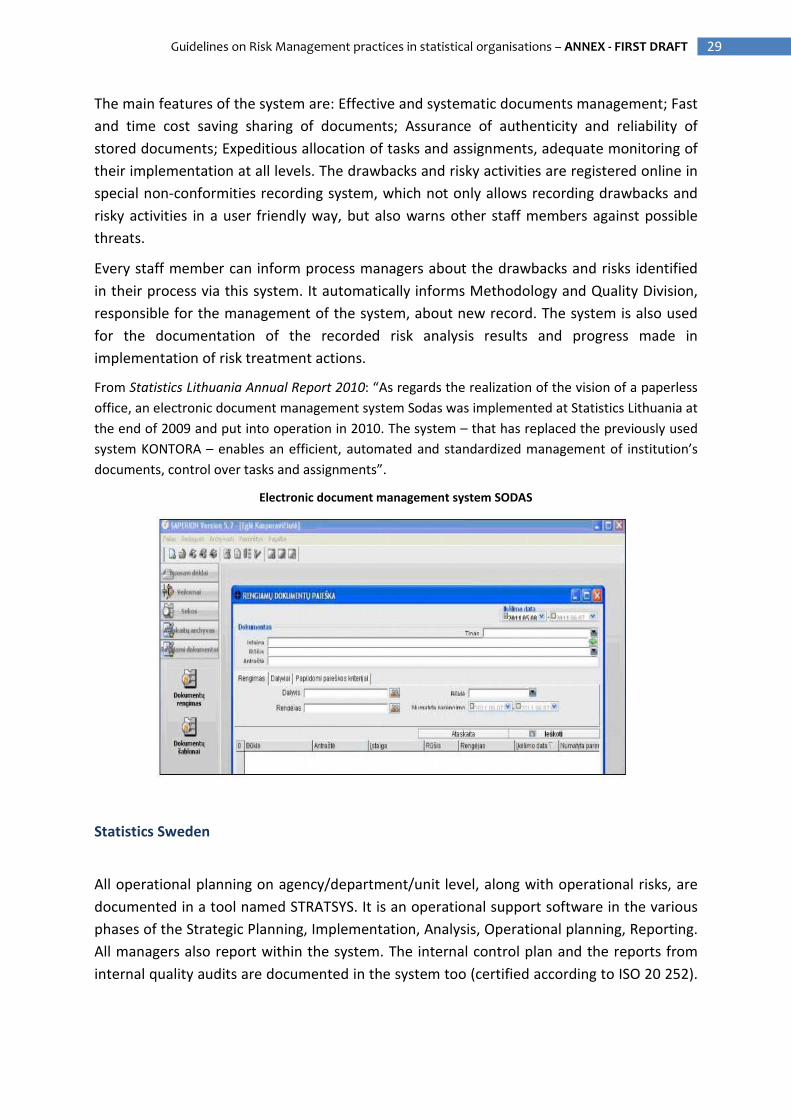
29 Guidelines on Risk Management practices in statistical organisations – ANNEX - FIRST DRAFT
The main features of the system are: Effective and systematic documents management; Fast
and time cost saving sharing of documents; Assurance of authenticity and reliability of
stored documents; Expeditious allocation of tasks and assignments, adequate monitoring of
their implementation at all levels. The drawbacks and risky activities are registered online in
special non-conformities recording system, which not only allows recording drawbacks and
risky activities in a user friendly way, but also warns other staff members against possible
threats.
Every staff member can inform process managers about the drawbacks and risks identified
in their process via this system. It automatically informs Methodology and Quality Division,
responsible for the management of the system, about new record. The system is also used
for the documentation of the recorded risk analysis results and progress made in
implementation of risk treatment actions.
From Statistics Lithuania Annual Report 2010: “As regards the realization of the vision of a paperless
office, an electronic document management system Sodas was implemented at Statistics Lithuania at
the end of 2009 and put into operation in 2010. The system – that has replaced the previously used
system KONTORA – enables an efficient, automated and standardized management of institution’s
documents, control over tasks and assignments”.
Electronic document management system SODAS
Statistics Sweden
All operational planning on agency/department/unit level, along with operational risks, are
documented in a tool named STRATSYS. It is an operational support software in the various
phases of the Strategic Planning, Implementation, Analysis, Operational planning, Reporting.
All managers also report within the system. The internal control plan and the reports from
internal quality audits are documented in the system too (certified according to ISO 20 252).
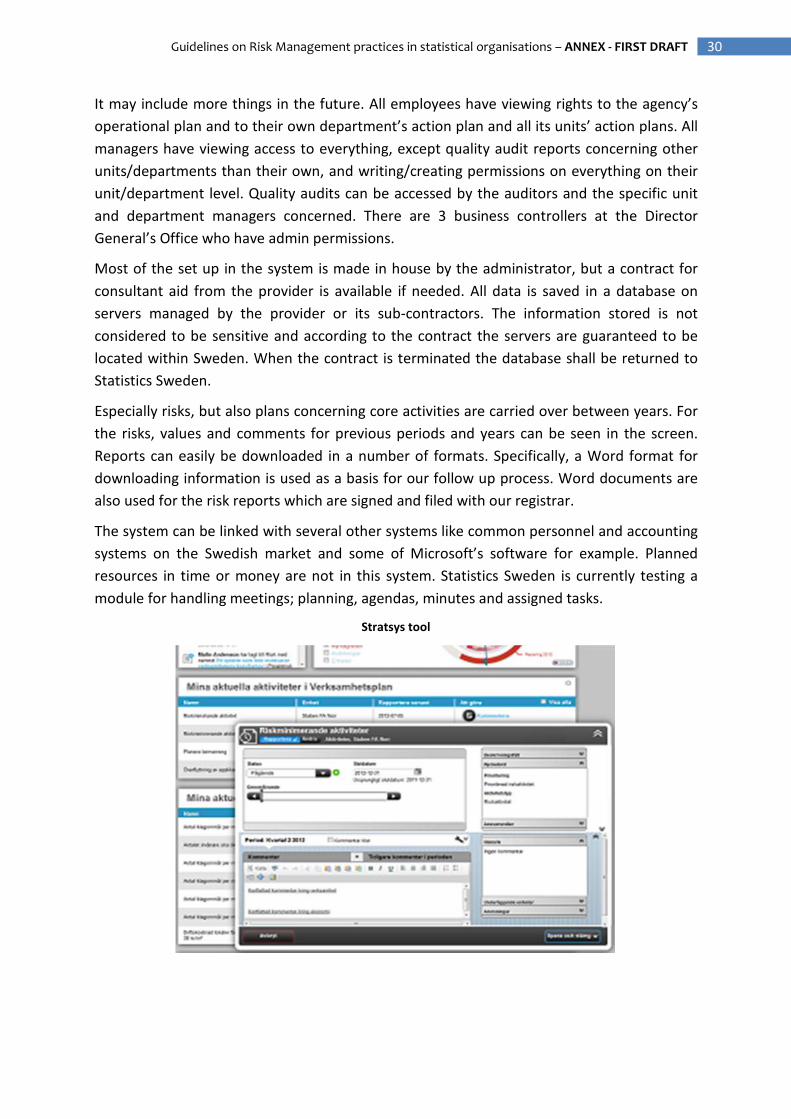
30 Guidelines on Risk Management practices in statistical organisations – ANNEX - FIRST DRAFT
It may include more things in the future. All employees have viewing rights to the agency’s
operational plan and to their own department’s action plan and all its units’ action plans. All
managers have viewing access to everything, except quality audit reports concerning other
units/departments than their own, and writing/creating permissions on everything on their
unit/department level. Quality audits can be accessed by the auditors and the specific unit
and department managers concerned. There are 3 business controllers at the Director
General’s Office who have admin permissions.
Most of the set up in the system is made in house by the administrator, but a contract for
consultant aid from the provider is available if needed. All data is saved in a database on
servers managed by the provider or its sub-contractors. The information stored is not
considered to be sensitive and according to the contract the servers are guaranteed to be
located within Sweden. When the contract is terminated the database shall be returned to
Statistics Sweden.
Especially risks, but also plans concerning core activities are carried over between years. For
the risks, values and comments for previous periods and years can be seen in the screen.
Reports can easily be downloaded in a number of formats. Specifically, a Word format for
downloading information is used as a basis for our follow up process. Word documents are
also used for the risk reports which are signed and filed with our registrar.
The system can be linked with several other systems like common personnel and accounting
systems on the Swedish market and some of Microsoft’s software for example. Planned
resources in time or money are not in this system. Statistics Sweden is currently testing a
module for handling meetings; planning, agendas, minutes and assigned tasks.
Stratsys tool
I Guidelines on Risk Management practices in statistical organisations - REFERENCES – FIRST DRAFT
REFERENCES
Research INVESTIGATION / AD HOC ANALYSIS ..................................................... II
Complementary documentation provided by the respondent Countries
throughout the research was carried out by: ........................................................ II
National / International Standards, Models and Guidelines ................................ IV
ISO (International Organization for Standardization) ........................................... IX
Academic SOURCES, INSTITUTIONAL papers AND professional HANDBOOKS: ... XIV
II Guidelines on Risk Management practices in statistical organisations - REFERENCES – FIRST DRAFT
Research INVESTIGATION / AD HOC ANALYSIS
UNECE (The United Nations Economic Commission for Europe)
High-Level Group for the Modernisation of Official Statistics
Modernisation Committee on Organizational Framework and Evaluation
• Survey on Risk Management Practice, April, 2015
• In-Depth Survey on Risk Management, September, 2015
Short summary
In 2015 two surveys have been carried out by the Italian Institute of Statistics in cooperation with University of Rome Tor Vergata
and UNECE, in order to analyze to what extent Risk management systems are adopted among NSOs members of UNECE as well as
among countries and international organizations not belonging to UNECE but yet participating in Commission’s activities. The
surveys were aimed at building criteria through which the practices could be identified and classified. Due to the complexity of the
matter as well as in order to get more solid achievements, a multi-method model was chosen in order to use heterogeneous yet
complementary approaches for analysis. According to the explorative approach, both qualitative and quantitative-descriptive tools
were used: a mixed model allows to include context factors that enable a deeper understanding of phenomena, also taking into
account the strategic components of the practices observed. The first Survey was submitted in May 2015 to 60 countries and 4
organizations; the response rate was around 57%. Among all respondents, thirteen countries were selected for an In-depth analysis
of the Risk management most interesting practices from a NSO point of view. The selected countries were invited to answer to a
second questionnaire during September 2015.
1. UNECE – MCOFE Survey on Risk Management Practice, April, 2015
Respondent countries / organizations: Australia, Austria, Canada, Croatia, Eurostat, Ireland, Italy, Lithuania, Poland, Norway,
México, Romania, The Netherlands, Belgium, Estonia, Cyprus, Finland, Germany, Hungary, Iceland, Israel, Japan, New Zealand,
Republic of Armenia, Republic of Macedonia, Republic of Moldova, Russia, Serbia, Slovakia, Slovenia, South Africa, Spain, Sweden,
Turkey, United Kingdom.
2. In-Depth Survey on Risk Management, September, 2015
Respondent countries: Australia, Austria, Canada, Croatia, Ireland, Lithuania, México, Romania, The Netherlands, Sweden.
Complementary documentation provided by the respondent Countries throughout the
research was carried out by:
(*In most cases, the following documents are intended for the internal use of recipients only and may not be
distributed or reproduced for external distribution)
Statistik Austria:
• Risikobewertung – Risikokatalog (Observar, angepasst). 2015
• Data Collection for Social Statistics Project - Erhebungsinfrastruktur (EIS) Neu (Survey
infrastructure). New Risk Management. 2015
• Risikomanagement-Katalog. Assessment von Chancen und Risiken. 2013
• Summary Event Catalogue, 2009.
III Guidelines on Risk Management practices in statistical organisations - REFERENCES – FIRST DRAFT
Australian Bureau of Statistics (ABS), Australia:
• Risk Management Framework. Part A - The Risk Policy. 2015
• Risk Management Framework. Part B- The Risk Guidelines. 2015
• Corporate Plan 2015-2019. 2015
• Quality Management of Statistical Processes Using Quality Gates. 2010
• ABS Internal Control Framework.
• Accountable Authority Instructions. 01-01 Managing Risk and Internal Accountability.
Statistics Canada:
• Corporate Risk Profile methodology and outcome (http://www.statcan.gc.ca/)
• Corporate Risk Profile 2012-2104. 2012
Statistics Lithuania:
• Extraction from SL risk register
Instituto Nacional de Estadística, Geografía e Informática (INEGI), México:
• Matriz de Administración de Riesgos. 2015
• Selected items of Risk Matrix for the 2015 Intercensal Survey. 2015
• Manual de integración y funcionamiento del comité de auditoría y riesgos del instituto nacional
de estadística y geografía. 2014
• Metodología para la Administración de Riesgos en el INEGI. 2014
• Acuerdo de la junta de gobierno del instituto nacional de estadística y geografía, por el que se
establecen las normas de control interno para el instituto nacional de estadística y geografía.
2014
• Draft Federal Information Processing Standards Publication 183. Standard for Integration
Definition for Function Modeling (IDEF0). 1993
Institutul National De Statistica, Romania:
• Ordin nr 1038-2011 - procedura sistem management riscuri. 2011
IV Guidelines on Risk Management practices in statistical organisations - REFERENCES – FIRST DRAFT
National / International Standards, Models and Guidelines
ANAO (The Australian National Audit Office)
Reference published Guide:
• Public Sector Audit Committees. 2.1 Risk Management. August, 2011
• Highlights
The Guide updates and replaces the Australian National Audit Office's (ANAO) 2005 Public Sector Audit Committees Better Practice
Guide. While many of the principles and practices remain the same, this Guide incorporates a number of enhancements. These
include a discussion on: a committee's responsibilities in relation to Risk management and other portfolio entities; the benefits of
periodically engaging with the entity Chief Executive/Board, including in relation to the committee's responsibilities for reviewing
high risk programs and projects. This Guide is intended to complement the Fraud Control Guidelines, and to augment the key fraud
control strategies referred to in the Guidelines. While this document is an important tool for senior management and those who
have direct responsibilities for fraud control, elements of this Guide will be useful to a wider audience, including employees,
contractors and service providers. The aim of the Guide is to provide guidance on the operation of the Audit Committees of public
sector entities operating under both the Financial Management and Accountability Act 1997 and the Commonwealth Authorities
and Companies Act 1997. As with all of the ANAO's Better Practice Guides, each entity is encouraged to use it to identify, and apply,
better practice principles and practices that are tailored to its particular circumstances. The Guide discusses a range of functions
and responsibilities, grouped under nine broad areas, that are appropriate for an Audit Committee.
Available:
www.anao.gov.au/html/Files/BPG%20HTML/BPG_PublicSectorAuditCommittees/2_1.html
AS/NZS (Joint Australian New Zealand International Standard). Joint Technical Committee OB-
007, Risk Management
Reference published Guide:
• AS/NZS ISO 31000:2009. Risk Management – Principles and guidelines. November, 2009
Highlights
The Standard is a joint Australia/New Zealand adoption of ISO 31000:2009, and supersedes AS/NZS 4360:2004. It was approved on
behalf the Council of Standards Australia on 6 November 2009 and on behalf of the Council of Standards New Zealand on 16
October 2009. Its predecessor, AS/NZS 4360 Risk management, was first published in 1995. After AS/NZS 4360 was last revised in
2004, the joint Australia/New Zealand committee OB-007 decided that rather than undertake a similar revision in 2009, it would
have promoted the development of an international standard on risk management, which could then be adopted locally. The
standard provides organizations with guiding principles, a generic framework, and a process for managing risk. New to this edition
is the inclusion of 11 risk management principles an organization should comply with, and a management framework for the
effective implementation and integration of these principles into an organization's management system. Emphasis is given to
considering risk in terms of the effect of uncertainty on objectives, rather than the risk incident. This edition also includes an
informative annex that sets out the attributes of enhanced risk management for those organizations that have already been
working on managing their risks and may wish to strive for a higher level of achievement.
Available:
https://shop.standards.govt.nz/catalog/31000%3A2009%28AS%7CNZS+ISO%29/view
V Guidelines on Risk Management practices in statistical organisations - REFERENCES – FIRST DRAFT
Basel Committee - Risk Management Sub-group
Reference published Guidance:
• Framework for Internal Control Systems. September, 1998
Highlights
The Basel Committee on Banking Supervision, which includes supervisory authorities from Belgium, Canada, France, Germany, Italy,
Japan, Luxembourg, the Netherlands, Sweden, Switzerland, the United Kingdom, and the United States, introduced the Framework
for Internal Control Systems in 1998. The Basel Committee distributed this Guidance to supervisory authorities worldwide in the
belief that the principles presented will provide a useful framework for the effective supervision of internal control systems. More
generally, the Committee wished to emphasize that sound internal controls are essential. The five elements of internal control are:
management oversight and control culture, risk recognition and assessment, control activities and segregation of duties,
information and communication, and monitoring activities and correcting deficiencies. The effective functioning of these five
elements is key to an organization achieving its performance, information, and compliance objectives. The guidance does not focus
on specific areas or activities within a banking organization. The exact application depends on the nature, complexity and risks of
the organization’s activities. While closely linked to the specific sector, the principles of this guidance can be taught and effectively
applied throughout different areas.
Available:
www.bis.org/publ/bcbs40.htm
CIMA (The Chartered Institute of Management Accountants)
Reference published Guide:
• Introduction to managing risk. Topic Gateway series no. 28. February, 2008
Highlights
The Chartered Institute of Management Accountants is the world’s largest and leading professional body of management
accountants. It has more than 229,000 members and students in 176 countries. It has strong relationships with employers and
sponsor leading research. The Chartered Institute of Management Accountants supports its members and students with its
Technical Information Service (TIS) for their work and needs. Topic Gateways are intended as a refresher or introduction to topics
of interest to CIMA members. They include a basic definition, a brief overview and a fuller explanation of practical application.
Finally they signpost some further resources for detailed understanding and research. The Guide was prepared by Technical
Information Service.
Available:
www.cimaglobal.com/Documents/ImportedDocuments/cid_tg_intro_to_managing_rist.apr07.pdf
CNRMA
Reference published Guidance:
• OPNAVINST 3500.39 (series), Operational Risk Management (ORM). July, 2010
Highlights
ORM is the guiding Navy instruction for implementing the Operational Risk Management program. CNRMA manages and oversees
shore installation management support and execution within the Mid-Atlantic region. The naval vision is to develop an
environment in which every individual (officer, enlisted and civilian) is trained and motivated to personally manage risk in
everything they do on and off duty, both in peacetime and during conflict, thus enabling successful completion of all operations or
activities with the minimum amount of risk. Commands have a number of responsibilities relative to ORM, including designating
VI Guidelines on Risk Management practices in statistical organisations - REFERENCES – FIRST DRAFT
the Executive Officer as the ORM Program Manager to oversee command ORM training and implementation and ensuring that at
a minimum one officer and one senior enlisted are qualified as ORM instructors. While closely linked to this specific sector, the
principles of this guidance can be taught and effectively applied throughout different areas: many ORM techniques can be
incorporated into operational planning and decision making processes related to various sector of activity.
Available:
www.public.navy.mil/airfor/nalo/Documents/SAFETY/OPNAVINST%203500.39C%20OPERATIONAL
%20RISK%20MANEGEMENT.pdf
COSO (The Committee of Sponsoring Organizations of the Treadway Commission)
Reference published Guidance:
• Enterprise Risk Management (ERM) – Integrated Framework. September, 2004
Reference published papers:
• Risk Assessment in Practice. October, 2012
• Developing Key Risk Indicators to Strengthen Enterprise Risk Management. December, 2010.
• Strengthening Enterprise Risk Management for Strategic Advantage. 2009
Highlights
COSO is a voluntary private-sector organization dedicated to improving the quality of financial reporting through business ethics,
effective internal controls, and corporate governance. The members of COSO are: the American Institute of Certified Public
Accountants, the American Accounting Association, Financial Executives International, the Institute of Management Accountants
and The Institute of Internal Auditors. ERM is a widely used framework in the United States and around the world. Over two
decades ago, the Committee of Sponsoring Organizations of the Treadway Commission (COSO) issued “Internal Control –
Integrated Framework” to help businesses and other entities assess and enhance their internal control systems. That framework
has since been incorporated into policy, rule and regulation and used by thousands of enterprises and organizations to better
control their activities in moving toward achievement of their established objectives. In 2001, COSO initiated a project, and
engaged PricewaterhouseCoopers, to develop a framework that would be readily usable by managements to evaluate and improve
their organizations’ enterprise risk management. COSO engaged PricewaterhouseCoopers after concluding there was a need for a
broadly recognized enterprise risk management framework. PricewaterhouseCoopers was assisted by an advisory council
composed of representatives from the five COSO organizations. Because of the importance of the project, the Framework was
exposed for public comment before final publication. COSO recognized that while many organizations may be engaged in some
aspects of enterprise risk management, there has been no common base of knowledge and principles to enable boards and senior
management to evaluate an organization’s approach to risk management and assist them in building effective programs to identify,
measure, prioritize and respond to risks. “ERM – Integrated Framework” expands on internal control, providing a more robust and
extensive focus on the broader subject of enterprise risk management for all organizations, regardless of size. The framework
defines essential enterprise risk management components, discusses key principles and concepts, suggests a common language,
and provides clear direction and guidance for enterprise risk management.
Available:
www.coso.org/ERM-IntegratedFramework.htm
www.coso.org/documents/COSO_09_board_position_final102309PRINTandWEBFINAL_000.pdf
www.coso.org/documents/COSOAnncsOnlineSurvy2GainInpt4Updt2IntrnlCntrlIntgratdFrmwrk%2
0-%20for%20merge_files/COSO-
ERM%20Risk%20Assessment%20inPractice%20Thought%20Paper%20OCtober%202012.pdf
www.coso.org/documents/COSOKRIPaperFull-FINALforWebPostingDec110_000.pdf
VII Guidelines on Risk Management practices in statistical organisations - REFERENCES – FIRST DRAFT
A (Chartered Professional Accountants of Canada)
Reference published Guide:Guidance on Control. CoCo (Criteria of Control) Framework. 1995
• Highlights
Chartered Professional Accountants of Canada (CPA Canada) is the national organization established to support a unified Canadian
accounting profession. As one of the world’s largest national accounting bodies, with more than 200,000 members across the
country and around the world, CPA Canada carries a strong influential voice: it plays an important role in influencing international
accounting, audit and assurance standards. CoCo was introduced in 1992 with the objective of improving organizational
performance and decision-making with better controls, risk management, and corporate governance. In 1995, Guidance on Control
was produced and described the CoCo framework and defining controls. The framework includes 20 criteria for effective control in
four areas of an organization: purpose (direction), commitment (identity and values), capability (competence), monitoring and
learning (evolution). This model describes internal control as actions that foster the best result for an organization. These actions,
which contribute to the achievement of the organization’s objectives, focus on: effectiveness and efficiency of operations;
reliability of internal and external reporting; compliance with applicable laws and regulations and internal policies. CoCo indicates
that control comprises: “Those elements of an organization (including its resources, systems, processes, culture, structure, and
tasks) that, taken together, support people in the achievement of the organization’s objectives.”
Available: https://www.cpacanada.ca/
FRC (The Financial Reporting Council)
Reference published Guidance:
• Guidance on Risk Management, Internal Control and Related Financial and Business Reporting
(The Turnbull Guidance). September, 2014
Highlights
The Financial Reporting Council is the UK’s independent regulator responsible for promoting high quality corporate governance and
reporting to foster investment. It promotes high standards of corporate governance through the UK Corporate Governance Code. It
sets standards for corporate reporting, audit and actuarial practice and monitor and enforce accounting and auditing standards.
The FRC issues guidance and other publications to assist boards and board committees in considering how to apply the UK
Corporate Governance Code to their particular circumstances. These publications cover, among others: “Risk management, Internal
Control and Related Financial and Business Reporting”. This guidance revises, integrates and replaces the previous editions of the
FRC's Internal Control: Guidance to Directors (formerly known as the Turnbull Guidance) and the Going Concern and Liquidity Risk:
Guidance for Directors of UK Companies and reflects changes made to the UK Corporate Governance Code. It links the
traditional Turnbull guidance on internal control with emerging good practice for risk management reflected in the conclusions of
both the FRC’s Boards and Risk report and the final recommendations of the Sharman Panel of Inquiry into Going Concern and
Liquidity Risk. Internal Control: Guidance for Directors on the Combined Code (The Turnbull guidance) was first issued in 1999. In
2004, the Financial Reporting Council established the Turnbull Review Group to consider the impact of the guidance and the related
disclosures and to determine whether the guidance needed to be updated. In reviewing the impact of the guidance, consultations
revealed that it had very successfully gone a long way to meeting its original objectives. Boards and investors alike indicated that
the guidance had contributed to a marked improvement in the overall standard of risk management and internal control since
1999. The second version was issued in 2005 (Internal Control: Revised Guidance for Directors on the Combined Code). Consistent
with the amendments to any Principles in the 2014 edition of the Code and with the aim of aligning the terminology, a new version
of the Guidance was issued in 2014.
Available:
https://www.frc.org.uk/Our-Work/Codes-Standards/Corporate-governance/UK-Corporate-
Governance-Code/Guidance-for-boards-and-board-committees.aspx#biscuit3
VIII Guidelines on Risk Management practices in statistical organisations - REFERENCES – FIRST DRAFT
GAO (U.S. Government Accountability Office)
Reference published Standard:
• Standards for Internal Control in the Federal Government (The Green Book). September, 2014
Highlights
The standards provide guidance on assessing risks and internal controls system for federal agencies in programmatic, financial, and
compliance operations. On September 10, 2014 GAO issued its revision of Standards for Internal Control in the Federal Government.
The 2014 revision will supersede GAO/AIMD-00-21.3.1, Standards for Internal Control in the Federal Government (November 1999).
Federal Managers' Financial Integrity Act (FMFIA) requires that federal agency executives periodically review and annually report
on the agency's internal control systems. FMFIA requires the Comptroller General to prescribe internal controls standards. These
internal control standards, first issued in 1983, present the internal control standards for federal agencies for both program and
financial management. The Green Book may also be adopted by state, local, and quasi-governmental entities, as well as not-for-
profit organizations, as a framework for an internal control system. Green Book revisions involved an extensive, deliberative
process, including public comments and input from the Green Book Advisory Council. GAO considered all comments and input in
finalizing revisions to the standards. The standards in The Green Book are organized by the five components of internal control.
Each of the five components contains several principles. Principles are the requirements of each component. Contol environment
(5 principles); Risk assessment (4 principles); Control activiteis (3 principles); Information and communication (3 principles);
Monitoring (2 principles).
Available:
www.gao.gov/greenbook/overview
Institute of Risk Management (IRM); Association of Insurance and Risk Managers (AIRMIC);
Alarm (The Public Risk Management Association)
Reference published Standard:
• A Risk Management Standard. 2002
• Highlights
The Risk Management Standard was originally published by the Institute of Risk Management (IRM), The Association of Insurance
and Risk Manager (AIRMIC) and The Public Risk Management Association (Alarm) in 2002. It was subsequently adopted by the
Federation of European Risk Management Association (FERMA). The Standard is the result of work by a team drawn from the major
risk management organizations in the UK. In addition, the team sought the views and opinions of a wide range of other professional
bodies with interests in risk management, during an extensive period of consultation. Despite the publication of ISO 31000, the
Global Risk Management Standard, IRM has decided to retain its support for the original risk management standard because it is a
simple guide that outlines a practical and systematic approach to the management of risk for business managers (rather than just
risk professionals).
Available:
www.theirm.org/knowledge-and-resources/risk-management-standards/irms-risk-management-
standard/
IX Guidelines on Risk Management practices in statistical organisations - REFERENCES – FIRST DRAFT
ISO (International Organization for Standardization)
Technical Committee TC 262 - Risk management
Reference published Standards:
• ISO Guide 73:2009. Risk management - Vocabulary
• ISO 31000:2009. Risk management - Principles and guidelines
• ISO/TR 31004:2013. Risk management - Guidance for the implementation of ISO 31000
• IEC 31010:2009. Risk management - Risk assessment techniques
Available:
www.iso.org/iso/iso_catalogue/catalogue_tc/catalogue_tc_browse.htm?commid=629121
Technical Committee TC 176/SC 1 - Concepts and terminology
Reference published Standard:
• ISO 9000:2000. Quality management systems - Fundamentals and vocabulary
Technical Committee TC 176/SC 2 - Quality systems
Reference published Standard:
• ISO 9004.4:1993. Quality management and quality system elements - Part 4: Guidelines for
quality improvement
Available:
www.iso.org/iso/catalogue_detail?csnumber=29280
www.iso.org/iso/catalogue_detail.htm?csnumber=16544
Joint Technical Committee ISO/IEC JTC 1/SC 7 Software and systems engineering
Technical Committee ISO/TC 159/SC 4 Ergonomics of human-system interaction
Reference published Standards:
• ISO/IEC 9126-1. Software Engineering - Product quality - Part 1: Quality model
• ISO 20282-1:2006. Ease of operation of everyday products - Part 1: Design requirements for
context of use and user characteristics
• ISO/IEC TR 9126-4:2004. Software Engineering - Product quality - Part 4: Quality in use metrics
• ISO 9241-11. Part 11: Guidance on Usability
• ISO/IEC TR 9126-2. Software Engineering - Product quality - Part 2 External metrics
• ISO/IEC TR 9126-3. Software Engineering - Product quality - Part 3 Internal metrics
• ISO/IEC 18019:2004. Guidelines for the design and preparation of user documentation for
application software
• ISO/IEC 15910:1999. Software user documentation process
• ISO 13407:1999. Human-centered design processes for interactive systems
X Guidelines on Risk Management practices in statistical organisations - REFERENCES – FIRST DRAFT
• ISO/IEC 14598-1:1999. Software product evaluation
• ISO/TR 16982:2002. Usability methods supporting human-cantered design
Available:
www.iso.org/iso/catalogue_detail.htm?csnumber=22749
www.iso.org/iso/catalogue_detail.htm?csnumber=34122
www.iso.org/iso/catalogue_detail.htm?csnumber=39752
www.iso.org/iso/catalogue_detail.htm?csnumber=16883
www.iso.org/iso/catalogue_detail.htm?csnumber=22750
www.iso.org/iso/iso_catalogue/catalogue_tc/catalogue_detail.htm?csnumber=22891
www.iso.org/iso/catalogue_detail.htm?csnumber=30804
www.iso.org/iso/catalogue_detail.htm?csnumber=29509
www.iso.org/iso/catalogue_detail.htm?csnumber=21197
www.iso.org/iso/catalogue_detail.htm?csnumber=24902
www.iso.org/iso/iso_catalogue/catalogue_tc/catalogue_detail.htm?csnumber=31176
Highlights
ISO has developed more than 16,000 international standards for stakeholders such as industry and trade associations, science and
academia, consumers and consumer associations, governments and regulators, and societal and other interest groups.
Specifically, as for the family of Standards developed and published under the direct responsibility of TC 262, the first editions of
ISO 31000 and ISO Guide 73 were published in 2009. ISO 31000 has been adopted as a national standard by more than 50 national
standards bodies covering over 70 % of the global population. It has also been adopted by a number of UN agencies and national
governments as a basis for developing their own risk-related standards and policies. All the terms and definitions in ISO 31000 are
contained in ISO Guide 73, so any changes to the terms and definitions in ISO 31000 must be identical in both documents. At this
end, ISO 31000, and its accompanying Guide 73 on risk management terminology come up for revision every five years.
The family of Standards developed by TC 176 are particularly relevant to support organizations in the process mapping activity and
has been used as a reference source for drawing up that section. Its scope is the standardization in the field of quality management
(generic quality management systems and supporting technologies), as well as quality management standardization in specific
sectors. ISO/TC 176 is also entrusted with an advisory function to all ISO and IEC technical committees to ensure the integrity of the
generic quality system standards and the effective implementation of the ISO/IEC sector policy on quality management systems
deliverables.
The family of Standards published under the direct responsibility of JTC 1/SC 7 and TC 159/SC 4 are particularly useful to support
organizations in the design and implementation of the RM Information systems. JTC 1/SC7 has the following mandate from ISO and
IEC: standardization of processes, supporting tools and supporting technologies for the engineering of software products and
systems. As for the TC 159/SC 4, its scope is the standardization in the field of ergonomics, addressing human characteristics and
performance.
OCEG
Reference published Standard:
• The GRC Capability Model 3.0 (Red Book). 2015
Highlights
OCEG is a global, nonprofit think tank and community. It informs, empowers, and helps advance more than 50,000 members on
governance, risk management, and compliance (GRC). Its members include c-suite, executive, management, other professionals
XI Guidelines on Risk Management practices in statistical organisations - REFERENCES – FIRST DRAFT
from small and midsize businesses, international corporations, nonprofits and government agencies. Founded in 2002, OCEG is
headquartered in Scottsdale, AZ. The OCEG framework is centered on the GRC Capability Model (commonly known as the Red
Book). It describes key elements of an effective GRC system that integrates the principle of “Good governance”, “Risk
management”, “Compliance”. The first Red Book was released in 2004: after months of analysis, collaboration, and vetting, the first
OCEG standard emerges. Originally called the OCEG Capability Model, the cover was a deep red. It quickly became known as the
OCEG Red Book. This standard provided both high-level and detailed practices that helped organizations address compliance and
ethics issues. The standard gained wide adoption with over 100,000 downloads in a single year. Version 2.0 was published in 2009;
version 2.1 was issued in 2012. The Red Book version 3.0 reflects 10 years of use and consideration by OCEG's global membership,
which is now approaching 50,000 individuals worldwide. The Red Book Steering Committee attended several drafting and review
sessions and prepared comments on each draft of the Red Book documents throughout the development process.
Available:
www.oceg.org/resources/red-book-3/
The British Standards Institution (BSI)
Reference published Guidance:
• BS 31100:2011 Risk Management: Code of practice and guidance for the implementation of BS
ISO 31000. June, 2011
• Highlights
Formed in 1901, BSI was the world’s first National Standards Body. The BSI Kitemark was first registered by BSI on 12 June 1903.
Originally known as the British Standard Mark, it has grown into one of Britain’s most important and most recognized consumer
quality marks. Through more than a century of growth, BSI now delivers a comprehensive business services portfolio to clients,
helping them raise their performance and enhance their competitiveness worldwide. Based on the consensus of the UK committee
of risk management experts, BS 31100 provides practical and specific recommendations on how to implement the key principles of
effective risk management as specified in ISO 31000. According to British Standards Institute (BSI), “BS 31100 will provide a basis
for understanding, developing, implementing and maintaining risk management within any organization, in order to enhance an
organization’s likelihood of successfully achieving its objectives”. This British Standard establishes the principles and terminology
for risk management, and gives recommendations for the model, framework, process and implementation of risk management.
The recommendations of BS 31100 are generic and intended to be applicable and scalable to all organizations across the public and
private sector, regardless of type, size and nature. How recommendations are implemented will depend on an organization’s
operating environment and complexity. BS 31100 is intended for use by anyone with responsibility for: ensuring that an
organization manages to achieve its objectives; ensuring risks are managed in specific areas or activities; overseeing risk
management in an organization; providing assurance on an organization’s risk management”. The first edition was issued in 2008:
this version was replaced by the 2011 edition.
Available:
http://shop.bsigroup.com/ProductDetail/?pid=000000000030228064
The Institute of Directors in Southern Africa (IoDSA)
Reference published Models:
• King Report on Corporate Governance (King III). September, 2009
• King Code of Governance Principles (King III). September, 2009
Highlights
The Institute of Directors in Southern Africa (IoDSA) established in July 1993 the King Committee on Corporate Governance: it
produced the first King Report on Corporate Governance which was published in 1994. The first King Report was recognized
internationally, when published, as the most comprehensive publication on the subject embracing the inclusive approach to
corporate governance. The King Report on Corporate Governance for South Africa – 2002 (King II Report) was launched at an
XII Guidelines on Risk Management practices in statistical organisations - REFERENCES – FIRST DRAFT
Institute of Directors (IoDSA) Conference attended by 700 persons at the Sandton Convention Centre, 26 March 2002. The Institute
of Directors in Southern Africa (IoDSA) formally introduced the King Code of Governance Principles and the King Report on
Governance (King III) at the Sandton Convention Centre in Sandton, Johannesburg, in 2009. King III came into effect on 1 March
2010 – until then King II applied. The new Code and Report also falls in line with the Companies Act no 71 of 2008, which became
effective on 1 May 2011. Like its 56 commonwealth peers, King III has been written in accordance to comply or explain principle
based approach of governance, but specifically the apply or explain regime. This regime is currently unique in the Netherlands and
now in South Africa. Whilst this approach remains a hotly debated issue globally, the King III Committee continues to believe it
should be a non-legislative code on principles and practices.
Available:
https://iodsa.site-ym.com/store/ListProducts.aspx?catid=177819
https://jutalaw.co.za/uploads/King_III_Report/#p=1
UNECE High-Level Group for the Modernisation of Official Statistics (HLG-MOS)
Modernisation Committee on Standards
Reference released Models:
• Generic Activity Model for Statistical Organizations (GAMSO), Version 1.0. March, 2015
• Generic Statistical Business Process Model (GSBPM), Version 5.0. December, 2013
Highlights
The UNECE High-Level Group for the Modernisation of Official Statistics (HLG-MOS) was set up by the Bureau of the Conference of
European Statisticians in 2010 to oversee and coordinate international work relating to statistical modernisation. It
promotes standards-based modernisation of statistical production and services. It reports directly to the Conference of European
Statisticians and received its mandate from this body. The mission of the HLG-MOS is to oversee development of frameworks, and
sharing of information, tools and methods, which support the modernisation of statistical organizations. The aim is to improve the
efficiency of the statistical production process, and the ability to produce outputs that better meet user needs.
The Joint UNECE / Eurostat / OECD Work Sessions on Statistical Metadata (METIS) have prepared a Common Metadata Framework
(CMF). Part C of this framework is entitled "Metadata and the Statistical Cycle". This part refers to the phases of the statistical
business process and provides generic terms to describe them. Since November 2013, this work has been taken over by the
Modernisation Committee on Standards, under the HLG-MOS. During a workshop on the development of Part C of the CMF, held in
Vienna in July 2007, the participants agreed that the business process model used by Statistics New Zealand would provide a good
basis for developing a Generic Statistical Business Process Model. Following several drafts and public consultations, version 4.0 of
the GSBPM was released in April 2009. It was subsequently widely adopted by the global official statistics community, and formed
one of the cornerstones of the HLG vision and strategy for standards-based modernisation. In December 2012, a complementary
model, the Generic Statistical Information Model (GSIM) was released. The work to develop and subsequently implement the GSIM
resulted in the identification of several possible enhancements to the GSBPM. During 2013, the HLG launched a project on
"Frameworks and Standards for Statistical Modernisation" which included a broader review of the GSBPM and the GSIM, to
improve consistency between the documentation of the models, and to incorporate feedback based on practical implementations.
The current version of the GSBPM (version 5.0) is the direct result of this work. Whilst it is considered final at the time of release, it
is also expected that future updates may be necessary in the coming years, either to reflect further experiences from implementing
the model in practice, or due to the evolution of the nature of statistical production.
The Generic Activity Model for Statistical Organizations (GAMSO) Version 1.0 was endorsed for release by the HLG-MOS on 1 March
2015. Statistical organizations are invited to use GAMSO and provide feedback based on practical implementations on the GAMSO
Review. GAMSO will be reviewed in 2016 taking into account this feedback. GAMSO describes and defines the activities that take
place within a typical statistical organization. It extends and complements the GSBPM by adding additional activities needed to
support statistical production. When the GSBPM was developed, such activities were referred to as over-arching processes, and
XIII Guidelines on Risk Management practices in statistical organisations - REFERENCES – FIRST DRAFT
were listed, but not elaborated in any great detail. Over the years there have been several calls to expand the GSBPM to better
cover these activities. The GAMSO was therefore developed to meet these needs.
Available:
http://www1.unece.org/stat/platform/display/GAMSO/GAMSO+v1.0
http://www1.unece.org/stat/platform/display/metis/The+Generic+Statistical+Business+Process+
Model
UK HM Treasury - Government Financial Management Directorate
Reference published Guidance:
• The Orange Book Management of Risk - Principles and Concepts. October, 2004
Highlights
In central government a number of reports, particularly the National Audit Office’s 2000 report “Supporting innovation – managing
risk in government departments” and the Strategy Unit 2002 report “Risk – improving government’s capacity to handle risk and
uncertainty”, have driven forward the risk management agenda and the development of Statements on Internal Control. In 2001
Treasury produced “Management of Risk – A Strategic Overview” which rapidly became known as the Orange Book: it provided a
basic introduction to the concepts of risk management that proved very popular as a resource for developing and implementing
risk management processes in government organizations. This Guidance is the successor to the 2001 Orange Book. It continues to
provide broad based general guidance on the principles of risk management, but has been enhanced to reflect the lessons learned
about risk management through the experience. The most significant shift since the publication of the 2001 is that all government
organizations had, in 2004, basic risk management processes in place. This means that the main risk management challenge did not
lie in the initial identification and analysis of risk and the development of the risk management process, but rather in the ongoing
review and improvement of risk management. It focuses on both internal processes for risk management and consideration of the
organization’s risk management in relation to the wider environment in which it functions.
Available:
https://www.gov.uk/government/publications/orange-book
XIV Guidelines on Risk Management practices in statistical organisations - REFERENCES – FIRST DRAFT
Academic SOURCES, INSTITUTIONAL papers AND professional HANDBOOKS:
Aabo, T., Fraser, J., & Simkins, B. J. (2005). The rise and evolution of the chief risk officer:
Enterprise risk management at hydro one. Journal of Applied Corporate Finance, 17(3), 62–75.
Ariff, M. S. M., Zakuan, N., Tajudin, M. N. M., & Ismail, K. (2015). A conceptual model of Risk
Management Practices and organizational performance for Malaysia’s Research Universities. The
Role of Service in the Tourism & Hospitality Industry, 153.
Bodein, S., Pugliese, A. & Walker, P. A road map to risk management. Journal of Accountancy,
December 2001, Volume 192, Issue 6, pp 65-70.
Bruce, R. (2005). Swift message on risk management. Accountancy (April), 22.
Bruno-Britz, M. (2009). The age of ERM. Bank Systems & Technology, 1 (February), 20.
Burton, E. J. (2008). The audit committee: How should it handle ERM? The Journal of Corporate
Accounting & Finance, 19(4), 3–5.
Chenhall, R. H., & Euske, K. J. (2007). The role of management control systems in planned
organizational change: An analysis of two organizations. Accounting, Organizations and Society,
32, 601–637.
Chua, W. F. (2007). Accounting, measuring, reporting and strategizing – Re-using verbs: A review
essay. Accounting, Organizations and Society, 32(4–5), 487–494.
Curtis, E., & Turley, S. (2007). The business risk audit – A longitudinal case study of an audit
engagement. Accounting, Organizations and Society, 32, 439–461.
Drennan, L. T., McConnell, A., & Stark, A. (2014). Risk and crisis management in the public sector.
Routledge.
Epstein, M.J., & Rejc, A. (2006). The reporting of organisational risks for internal and external
decision makers, Management Accounting Guideline, Canada: The Society of Management
Accountants of Canada (CMA-Canada)
European Statistical System Committee (ESSC) - Vision Implementation Group & Vision
Implementation Network (2015). Identification and Evaluation of Risks to ESS Vision 2020
Implementation.
Fraser, I., & Henry, W. (2007). Embedding risk management: Structures and approaches.
Managerial Auditing Journal, 22(4), 392–409.
Gates, S. (2006). Incorporating strategic risk into enterprise risk management: A survey of current
corporate practice. Journal of Applied Corporate Finance, 18(4), 81–90.
Gephart, R. P., Van Maanen, J., & Oberlechner, T. (2009). Organizations and risk in late modernity.
Organization Studies, 30(02&03), 141–155.
Greenwood, R., & Hinings, C. R. (1993). Understanding strategic change: The contribution of
archetypes. The Academy of Management Journal, 36(5), 1052–1081.
XV Guidelines on Risk Management practices in statistical organisations - REFERENCES – FIRST DRAFT
Griffioen, R., van Delden, A., & de Wolf, P.P. (2012). BLUE-Enterprise and Trade Statistics- SP1-
Cooperation-Collaborative Project Small or medium-scale focused research project FP7-SSH-2009-
A Grant Agreement Number 244767 SSH-CT-2010-244767. Deliverable 7.3.
Holton, G. A. (2003). Value-at-risk: Theory and practice. San Diego, CA: Academic Press.
Hopkin, P. (2014). Fundamentals of risk management: understanding, evaluating and
implementing effective risk management. Kogan Page Publishers.
Hutter, B. M., & Power, M. (2005). Organizational encounters with risk. Cambridge University.
IMA – Institute of Management Accountants (2006). Enterprise risk management: Frameworks,
elements, and integration, statements on management accounting.
Jaafari, A. (2001). Management of risks, uncertainties and opportunities on projects: Time for a
fundamental shift. International Journal of Project Management, 19(2), 89–101.
Lam, J. (2003). Enterprise risk management: From incentives to controls, Hoboken. New Jersey:
Wiley.
Lam, J. (2006). Emerging best practices in developing key risk indicators and ERM reporting. James
Lam & Associates, Inc..
Lampel, J., Shamsie, J., & Shapira, Z. (2009). Rare events and organizational learning. Organization
Science, 20(5), 835–845.
Liebenberg, A. P., & Hoyt, R. E. (2003). The determinants of enterprise risk management: Evidence
from the appointment of chief risk officers. Risk Management and Insurance Review, 6(1), 37–52.
Martin, D., & Power, M. (2007). The end of enterprise risk management. Aeibrookings Joint Center
for Regulatory Studies, August.
Mikes, A. (2005). Enterprise risk management in action. Centre for the analysis of risk and
regulation (CARR) discussion paper report series no. 35.
Mikes, A. (2009). Risk management and calculative cultures. Management Accounting Research,
20(1), 18–40.
Miller, K. D. (1998). Economic exposure and integrated risk management. Strategic Management
Journal, 19(5), 497–514.
Miller, K. D. (2009). Organizational risk after modernism. Organization Studies, 30(2/3), 157–180.
Miller, P., Kurunmaki, L., & O’Leary, T. (2008). Accounting, hybrids and the management of risk.
Accounting, Organizations and Society, 33(7–8), 942–967.
Page, M., & Spira, L. F. (2004). The turnbull report, internal control and risk management: The
developing role of internal audit. Institute of Chartered Accountants: Scotland.
Porter, M. E. (1990). The Competitive Advantage of Nations. Harvard Business Review 68, no. 2
(March–April 1990): 73–93.
Power, M. (2004). The risk management of everything. London: Demos.
XVI Guidelines on Risk Management practices in statistical organisations - REFERENCES – FIRST DRAFT
Power, M. (2007). Organized uncertainty designing a world of risk management. Oxford University
Press.
Power, M. (2009). The risk management of nothing. Accounting, Organizations and Society, 34(6–
7), 849–855.
Power, M., Scheytt, T., Soin, K., & Sahlin, K. (2009). Reputational risk as a logic of organizing in late
modernity. Organization Studies, 30(2–3), 301–324.
Price, T. (2008). Uncovering unknown risk. Wall Street & Technology, 1 (December), 36.
PricewaterhouseCoopers (2004). Managing risk: An assessment of CEO perspectives. New York:
PwC.
Pritchard, C.L. et al. (2014). Risk management: concepts and guidance. CRC Press.
Rasmussen, J. (1997). Risk management in a dynamic society: A modelling problem. Safety Science,
27(2/3), 183–213.
Rieger, L. (2005). Success factors for implementing enterprise risk management. Bank Accounting
and Finance, 18(3), 21–26.
Rittenberg, L., & Covaleski, M. A. (2001). Internalization versus externalization of the internal audit
function: An examination of professional and organizational imperatives. Accounting,
Organizations & Society, 26(7–8), 617–641.
Sarma, M., Thomas, S., & Shah, A. (2003). Selection of value-at-risk models. Journal of Forecasting,
22(4), 337–358.
Scapens, B., & Bromwich, M. (2009). Editorial: Risk management, corporate governance and
management accounting. Management Accounting Research, 20(1), 1.
Spira, L. F., & Page, M. (2003). Risk management: The reinvention of internal control and the
changing role of internal audit. Accounting, Auditing and Accountability Journal, 16(4), 640–661.
Statistics Netherlands. van Nederpelt, P.W.M. (2010). A new model for quality management. The
Hague/Heerlen.
Taleb, N. N. (2007). The Black Swan: The impact of the highly improbable. Random House.
Walker, P. L., Shenkir, W. G., & Barton, T. L. (2003). ERM in practice. Internal Auditor, 60(4), 51–55.
Walker, P., Shenkir, W., & Barton, T. (2002). Enterprise risk management: Pulling it all together.
Altamonte Springs: Institute of Internal Auditors Research Foundation.
Widener, S. K. (2007). An empirical analysis of the levers of control framework. Accounting,
Organizations, and Society, 32(7–8), 757–788.
Woods, M. (2009). A contingency theory perspective on the risk management control system
within Birmingham City Council. Management Accounting Research, 20(1), 69–81.
Zolkos, R. (2008). Financial crisis shows real need for ERM. Business Insurance, 6(October), 6.
I Guidelines on Risk Management practices in statistical organisations – Glossary – FIRST DRAFT
Glossary
Acceptable risk .......................................................................................................................... III
Communication and consultation ............................................................................................. III
Control ....................................................................................................................................... III
Enterprise-wide risk management (ERM) ................................................................................. III
Establishing the context ............................................................................................................ III
Event .......................................................................................................................................... IV
External context ........................................................................................................................ IV
Identified risk ............................................................................................................................. IV
Inherent risk .............................................................................................................................. IV
Internal context ......................................................................................................................... IV
Impact ......................................................................................................................................... V
Level of risk ................................................................................................................................. V
Likelihood ................................................................................................................................... V
Monitoring .................................................................................................................................. V
Residual risk ................................................................................................................................ V
Risk ............................................................................................................................................. V
Risk analysis ............................................................................................................................... VI
Risk appetite .............................................................................................................................. VI
Risk assessment ......................................................................................................................... VI
Risk attitude .............................................................................................................................. VI
Risk aversion .............................................................................................................................. VI
Risk criteria ................................................................................................................................ VI
Risk exposure............................................................................................................................. VI
Risk identification ..................................................................................................................... VII
Risk management ..................................................................................................................... VII
Risk management framework .................................................................................................. VII
Risk management plan ............................................................................................................. VII
II Guidelines on Risk Management practices in statistical organisations – Glossary – FIRST DRAFT
Risk management policy .......................................................................................................... VII
Risk management process ........................................................................................................ VII
Risk map .................................................................................................................................. VIII
Risk measurement ................................................................................................................... VIII
Risk owner ............................................................................................................................... VIII
Risk profile ............................................................................................................................... VIII
Risk register/risk log ................................................................................................................ VIII
Risk source ............................................................................................................................... VIII
Risk Strategy ............................................................................................................................ VIII
Risk tolerance .......................................................................................................................... VIII
Risk treatment ........................................................................................................................... IX
Risk weighting............................................................................................................................ IX
Review ....................................................................................................................................... IX
Stakeholder ............................................................................................................................... IX
Total risk ..................................................................................................................................... X
Unacceptable risk ....................................................................................................................... X
Unidentified risk ......................................................................................................................... X
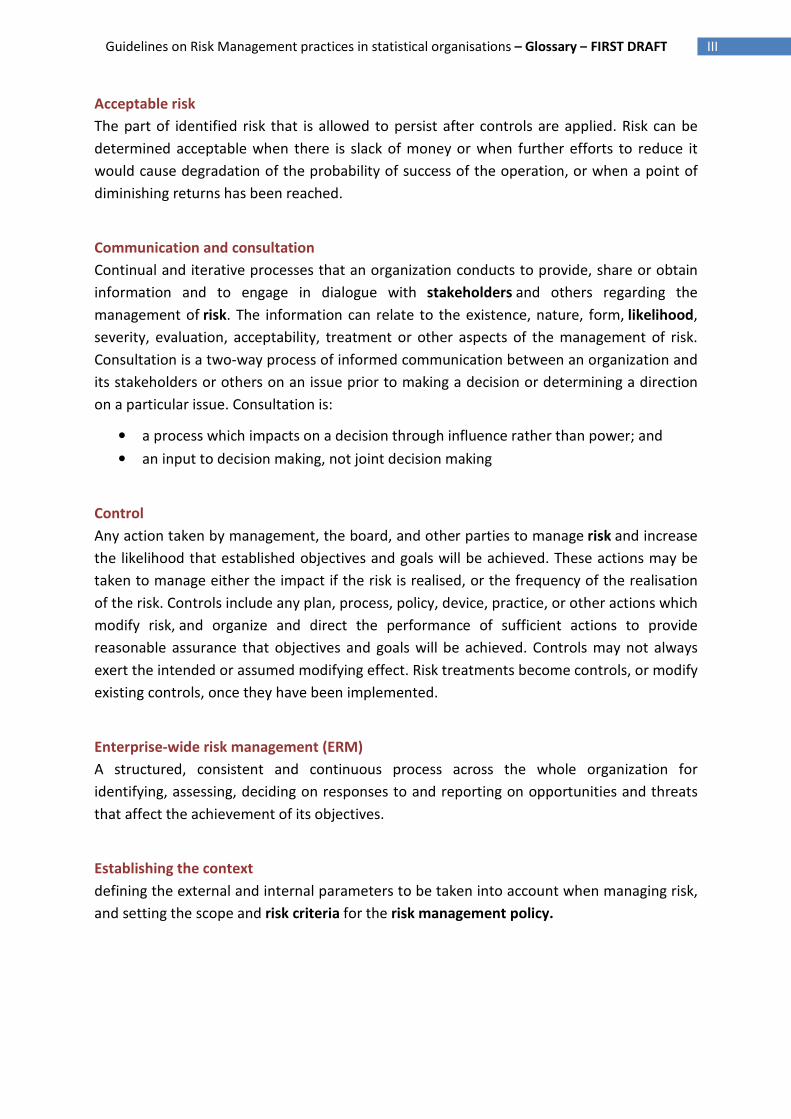
III Guidelines on Risk Management practices in statistical organisations – Glossary – FIRST DRAFT
Acceptable risk
The part of identified risk that is allowed to persist after controls are applied. Risk can be
determined acceptable when there is slack of money or when further efforts to reduce it
would cause degradation of the probability of success of the operation, or when a point of
diminishing returns has been reached.
Communication and consultation
Continual and iterative processes that an organization conducts to provide, share or obtain
information and to engage in dialogue with stakeholders and others regarding the
management of risk. The information can relate to the existence, nature, form, likelihood,
severity, evaluation, acceptability, treatment or other aspects of the management of risk.
Consultation is a two-way process of informed communication between an organization and
its stakeholders or others on an issue prior to making a decision or determining a direction
on a particular issue. Consultation is:
• a process which impacts on a decision through influence rather than power; and
• an input to decision making, not joint decision making
Control
Any action taken by management, the board, and other parties to manage risk and increase
the likelihood that established objectives and goals will be achieved. These actions may be
taken to manage either the impact if the risk is realised, or the frequency of the realisation
of the risk. Controls include any plan, process, policy, device, practice, or other actions which
modify risk, and organize and direct the performance of sufficient actions to provide
reasonable assurance that objectives and goals will be achieved. Controls may not always
exert the intended or assumed modifying effect. Risk treatments become controls, or modify
existing controls, once they have been implemented.
Enterprise-wide risk management (ERM)
A structured, consistent and continuous process across the whole organization for
identifying, assessing, deciding on responses to and reporting on opportunities and threats
that affect the achievement of its objectives.
Establishing the context
defining the external and internal parameters to be taken into account when managing risk,
and setting the scope and risk criteria for the risk management policy.
IV Guidelines on Risk Management practices in statistical organisations – Glossary – FIRST DRAFT
Event
occurrence or change of a particular set of circumstances. An event can be one or more
occurrences, and can have several causes. An event can consist of something not happening.
An event can sometimes be referred to as an "incident" or "accident".
External context
external environment in which the organization seeks to achieve its objectives. External
context can include:
• the cultural, social, political, legal, regulatory, financial, technological, economic,
natural and competitive environment, whether international, national, regional or
local;
• key drivers and trends having impact on the objectives of the organization; and
• relationships with, and perceptions and values of, external stakeholders .
Identified risk
That risk that has been determined to exist using analytical tools. The time and costs of
analysis efforts, the quality of the risk management program, and the state of the
technology involved affect the amount of risk that can be identified.
Inherent risk
the risk to an entity in the absence of any actions management might take to alter the risk's
likelihood or impact. These risks may result from an entity's industry, strategy, and
environmental factors.
Internal context
internal environment in which the organization seeks to achieve its objectives. Internal
context can include:
• governance, organizational structure, roles and accountabilities;
• policies, objectives, and the strategies that are in place to achieve them;
• the capabilities, understood in terms of resources and knowledge (e.g. capital, time,
people, processes, systems and technologies);
• perceptions and values of internal stakeholders;
• information systems, information flows and decision-making processes (both formal
and informal);
• relationships with, and perceptions and values of, internal stakeholders;
• the organization's culture, the integrity, ethical values;
• standards, guidelines and models adopted by the organization;
V Guidelines on Risk Management practices in statistical organisations – Glossary – FIRST DRAFT
• form and extent of contractual relationships.
Impact
represents the potential effects and consequences that a given event could have on an
entity and its objectives. An event can lead to a range of consequences. A consequence can
be certain or uncertain and can have positive or negative effects on objectives. Events that
have positive effects represent opportunities and those with negative effects represent risks.
Consequences can be expressed qualitatively or quantitatively. Entities often describe
events based on severity, effects, or monetary amounts. Initial consequences can escalate
through knock-on effects.
Level of risk
magnitude of a risk, expressed in terms of the combination of consequences and
their likelihood.
Likelihood
the possibility that an event may occur. It can be defined, measured or determined
objectively or subjectively, qualitatively or quantitatively, and it can be described using
qualitative terms (such as high, medium, and low) or quantitative measures (such as a
percentage and frequency).
Monitoring
continual checking, supervising, critically observing or determining the status in order to
identify change from the performance level required or expected. Monitoring can be applied
to a risk management framework, risk management process, risk or control.
Residual risk
the portion of total risk remaining after risk treatment has been applied. Residual risk
comprises acceptable risk and unidentified risk. Management must decide whether this
residual risk is within the entity's risk appetite. Residual risk is also known as "retained risk".
Risk
the possibility of an event occurring that will have an effect on the achievement of
objectives. An effect is a deviation from the expected (positive and/or negative). Objectives
can have different aspects (such as financial, health and safety, and environmental goals)
and can apply at different levels (such as strategic, organization-wide, project, product and
process). All activities of an organization involve risk. Organizations manage risk by
VI Guidelines on Risk Management practices in statistical organisations – Glossary – FIRST DRAFT
identifying it, analysing it and then evaluating whether the risk should be modified by risk
treatment in order to satisfy their risk criteria. Risk is often characterized by reference to
potential events and impact, or a combination of these. Risk is measured in terms of impact
(including changes in circumstances) and likelihood of occurrence. Uncertainty is the state,
even partial, of deficiency of information related to, understanding or knowledge of an
event, its consequences, or likelihood.
Risk analysis
process to comprehend the nature of risk and to determine the level of risk. Risk analysis
provides the basis for risk evaluation and decisions about risk treatment. Risk analysis
includes risk estimation.
Risk appetite
amount and type of risk that an organization is willing and prepared to accept as it tries to
achieve its goal and provide value to stakeholders. Risk appetite is a higher level statement
that considers broadly the levels of risks that management deems acceptable. It reflects the
enterprise's risk management philosophy, and in turn influences the entity's culture and
operating style. Many entities define their risk appetite qualitative, while other take a more
quantitative approach.
Risk assessment
overall process of risk identification, risk analysis, risk measurement and risk weighting.
Risk attitude
organization's approach to assess and eventually pursue, retain, take or turn away from risk.
Risk aversion
attitude to turn away from risk.
Risk criteria
terms of reference against which the significance of a risk is evaluated. Risk criteria are
based on organizational objectives, and external and internal context. Risk criteria can be
derived from standards, laws, policies and other requirements.
Risk exposure
the consequences, as a combination of impact and likelihood, which may be experienced by
an organization if a specific risk is realized.
VII Guidelines on Risk Management practices in statistical organisations – Glossary – FIRST DRAFT
Risk identification
process of finding, recognizing and describing risks. Risk identification involves the
identification of risk sources, events, their causes and their potential consequences. Risk
identification can involve historical data, theoretical analysis, informed and expert opinions,
and stakeholder's needs.
Risk management
coordinated activities to direct and control an organization with regards to risk.
Risk management framework
The totality of the structures, methodology, procedures and definitions that an organization
has chosen for designing, implementing, monitoring, reviewing and continually
improving risk management throughout the organization. The foundations include the
policy, objectives, mandate and commitment to manage risk. The organizational
arrangements include plans, relationships, accountabilities, resources, processes and
activities. The risk management framework is embedded within the organization's overall
strategic and operational policies and practices.
Risk management plan
scheme within the risk management framework specifying the approach, the management
components and resources to be applied to the management of risk. Management
components typically include procedures, practices, assignment of responsibilities, sequence
and timing of activities. The risk management plan can be applied to a particular product,
process and project, and part or whole of the organization.
Risk management policy
statement of the overall intentions and direction of an organization related to risk
management.
Risk management process
systematic application of management policies, procedures and practices to the activities of
communicating, consulting, establishing the context, and identifying, analyzing, evaluating,
treating, monitoring and reviewing risk in order to provide reasonable assurance regarding
the achievement of the organization's objectives.
VIII Guidelines on Risk Management practices in statistical organisations – Glossary – FIRST DRAFT
Risk map
a graphic representation of likelihood and impact of one or more risks. Risk maps may plot
quantitative or qualitative estimates of risk likelihood and impact. Often, risk maps are
referred to as “heat maps” since they present risk levels by color, where red represents high
risk, yellow moderate risk, and green low risk.
Risk measurement
It consists of assigning values to each risk using the defined criteria. Most organizations
define scales for rating risks in terms of impact, likelihood, and other dimensions.
Risk owner
person or entity with the accountability and authority to manage the risk.
Risk profile
description of any set of risks. The set of risks can contain those that relate to the whole
organization, part of the organization, or as otherwise defined.
Risk register/risk log
A master document that records identified risks, their severity, and the responses to be
taken.
Risk source
Element which alone or in combination has the intrinsic potential to give rise to risk. A risk
source can be tangible or intangible.
Risk Strategy
The overall organisational approach to risk management as defined by the entity governing
risk management. This should be documented and easily available throughout the
organisation.
Risk tolerance
the acceptable level of variation relative to achievement of a specific objective. This
variation is often measured using the same units as its related objective. In setting risk
tolerance, management considers the relative importance of the related objective and aligns
risk tolerances with risk appetite. Therefore, an entity operating with its risk tolerances,
narrow boundaries, is operating within its risk appetite, wide boundaries.
IX Guidelines on Risk Management practices in statistical organisations – Glossary – FIRST DRAFT
Risk treatment
means by which an organization elects to manage individual risks. Risk treatments can also
be called risk responses. As part of enterprise risk management, for each significant risk an
entity considers potential responses from a range of response categories. Risk treatment can
involve:
• Avoidance/Terminating is a response where you exit the activities that cause the
risk. Some examples of avoidance are exiting product line, selling a division, or
deciding against expansion.
• Treating/Reduction is a response where action is taken to mitigate the risk
likelihood and impact, or both.
• Transferring/Sharing is a response that reduces the risk likelihood and impact by
sharing or transferring a portion of the risk. An extremely common sharing response
is insurance.
• Tolerance/Acceptance is a response where no action is taken to affect the risk
likelihood or impact.
• Risk treatments that deal with negative consequences are sometimes referred to as
"risk mitigation", "risk elimination", "risk prevention" and "risk reduction". Risk
treatment can create new risks or modify existing risks.
Risk weighting
process of comparing the results of risk analysis with risk criteria to determine whether
the risk and/or its magnitude is acceptable or tolerable. It’s the process of determining risk
management priorities by comparing the level of risk against predetermined target risk
levels and tolerance thresholds. Risk evaluation assists in the decision about risk treatment.
Review
activity undertaken to determine the suitability, adequacy and effectiveness of the subject
matter to achieve established objectives. Review can be applied to a risk management
framework, risk management process, risk or control.
Stakeholder
person or organization that can affect, be affected by, or perceive themselves to be affected
by a decision or activity. A decision maker can be a stakeholder.
X Guidelines on Risk Management practices in statistical organisations – Glossary – FIRST DRAFT
Total risk
The sum of identified and unidentified risk. Ideally, identified risk will comprise the larger
proportion of the two.
Unacceptable risk
That portion of identified risk that cannot be tolerated, but must be either eliminated or
controlled.
Unidentified risk
That risk that has not yet been identified. Some risk is not identifiable or measurable.
Mishap investigations may reveal some previously unidentified risks.