Embed Size (px)
Citation preview
1
Guideway Status Report Minnesota Department of Transportation/Metropolitan Council January 2012
Guideway Status Report January 2012
2
Guideway Status Report Minnesota Department of Transportation/Metropolitan Council January 2012
Guideway Status Report Prepared by the Minnesota Department of Transportation
in collaboration with the Metropolitan Council
January 2012
Report Development Cost As required in Minn. Stat. 3.197, this document must contain the cost of preparing the report, including any costs incurred by another agency or another level of government. The total cost to MnDOT and the Metropolitan Council of preparing this report was approximately $10,000. The report was prepared primarily by a MnDOT intern whose time was funded by a private fellowship. Corridor summaries not led by MnDOT or the Metropolitan Council were provided by the city of Minneapolis and the counties of Ramsey, Washington, Hennepin, and Dakota.
To request this document in an alternative format, please contact MnDOT’s Affirmative Action Office at 651-366-4718 or 1-800-657-3774 (Greater Minnesota); 711 or 1-800-627-3529 (Minnesota Relay). You may also send an e-mail to [email protected].
3
Guideway Status Report Minnesota Department of Transportation/Metropolitan Council January 2012
Contents
Executive Summary ....................................................................................................................................................4
Introduction ................................................................................................................................................................6
I-394 HOT Lane Express Bus Service .................................................................................................................... 12
Hiawatha LRT (Blue Line) ..................................................................................................................................... 15
Northstar Commuter Rail .................................................................................................................................... 19
Central Corridor LRT (Green Line) ....................................................................................................................... 24
Southwest LRT (Green Line extension) ................................................................................................................ 27
Cedar Avenue BRT (Red Line) .............................................................................................................................. 30
I-35W South BRT (Orange Line) ........................................................................................................................... 34
Bottineau Transitway .......................................................................................................................................... 38
Gateway Corridor ................................................................................................................................................ 41
I-35W North ......................................................................................................................................................... 43
Midtown Corridor ................................................................................................................................................ 45
Nicollet-Central Urban Circulator ........................................................................................................................ 47
Red Rock Corridor ................................................................................................................................................ 50
Robert Street Corridor ......................................................................................................................................... 53
Rush Line Corridor ............................................................................................................................................... 56
Northern Lights Express ...................................................................................................................................... 59
Twin Cities to Milwaukee High Speed Rail .......................................................................................................... 62
Rochester ZIP Rail ................................................................................................................................................ 64
St. Paul Union Depot ........................................................................................................................................... 65
The Interchange ................................................................................................................................................... 68
Capacity Analysis ..................................................................................................................................................... 71
Section 1 – Estimated Guideway Capital Expenditures ....................................................................................... 77
Section 2 – Estimated Guideway Operating Expenditures .................................................................................. 79
Section 3 – Estimated Guideway Capital Maintenance Expenditures ................................................................ 80
Section 4 – Overall Totals .................................................................................................................................... 80
Appendix 1 – Statutory Language ........................................................................................................................... 81
Appendix 2 –Transit Funding Sources ..................................................................................................................... 83
4
Guideway Status Report Minnesota Department of Transportation/Metropolitan Council January 2012
Executive Summary State law (Minn. Stat. 174.93, adopted by the Legislature in 2010 and amended in 2011) requires the Minnesota Department of Transportation to prepare, in collaboration with the Metropolitan Council (the Council), a biennial report about the status of guideways in the state. A guideway is a transitway that operates on exclusive or controlled right of way, such as rail or a highway managed lane. The Guideway Status Report must include information available about project progress, funding sources and funding uses. It must also include a capacity analysis that looks ahead 10 years at anticipated expenditures for the overall system. This is the first such report. It primarily consolidates existing guideway information as required by statute. It does not provide a holistic view of transit and transit funding needs in Minnesota as it focuses only on transit in exclusive or controlled rights of way.
The report has two main sections with an explanation before each. First, it contains a summary of the project development process for transit projects followed by informational summaries for 18 individual corridors that are in study, planning, design, construction or operation as a guideway project. Following these corridor summaries, the report takes a 10-year, system-wide view of capital, operating and maintenance costs. This part of the report, called the capacity analysis, includes only projects that are in design, construction or operation because only these projects have chosen a transit mode and have sufficient cost data to meaningfully look ahead 10 years. Seven guideway projects meet the criteria for inclusion in the capacity analysis section of this report: I-394 High Occupancy Toll (HOT) lane express bus service, Hiawatha light rail transit (LRT), Northstar commuter rail, Cedar Avenue bus rapid transit (BRT), I-35W South BRT, Central Corridor LRT and Southwest LRT. Two special projects are also included in the Guideway Status Report even though they do not meet the legislative definition of a guideway: the St. Paul Union Depot and The Interchange in Minneapolis. While these are multimodal transportation hubs, not transit corridors, they are included in the report because they will be important components in the region’s overall transitway system. In the capacity analysis, these projects are only included in the table for capital costs. The remaining potential guideway projects are still in the feasibility or alternatives analysis (AA) study phase and are not included in the capacity analysis. These corridors are still considering a number of transit alternatives with varying modes and alignments, leading to a wide range of potential capital and operating costs. Given that these corridors are still being studied, it is uncertain if a guideway project will be selected as the preferred transit option for the corridor and if the project will progress into design and construction during the 10-year timeframe of the capacity analysis. Metropolitan area corridors in the study phase include the following: Bottineau, Gateway (I-94 East), I-35W North, Midtown, Nicollet-Central, Red Rock, Robert Street and Rush Line. Intercity passenger rail projects are also among the group of corridors still in the study phase. Intercity passenger rail projects included in the corridor summaries are the Northern Lights Express corridor from Minneapolis to Duluth, the Twin Cities to Milwaukee High Speed Rail, and the Rochester ZIP Rail.
5
Guideway Status Report Minnesota Department of Transportation/Metropolitan Council January 2012
The report does not include transitways that do not qualify as guideways, such as bus service operating on arterial roads or highway shoulders, nor does it include any discussion of the costs and benefits of expanding the base bus system in the Twin Cities metropolitan area.
The report provides a narrow evaluation of operating costs and capital expenditures, including ongoing capital maintenance, based on the best information available today for guideways that have advanced through the mode and route selection process. If guideway projects that are not included in the capacity analysis progress significantly in the next 10 years, they will be included in the next update of this report, statutorily required in November 2013.
The report contains estimates and historical data for expenditures relative to the seven guideways in the capacity analysis and intentionally avoids drawing conclusions about future funding needs of any additional projects or for the transit system as a whole.
Capital Costs – This report assumes that rail projects will be funded through the federal New Starts program and will use the accepted capital funding shares of 50 percent federal, 30 percent Counties Transit Improvement Board (CTIB), 10 percent state and 10 percent local funding. Highway BRT projects such as Cedar Avenue BRT and I-35W South BRT do not have a formal funding program such as New Starts. For the purposes of this report, Highway BRT projects are assumed to be funded 30 percent each from federal, CTIB and state funds along with 10 percent local funds. Based on the capital assumptions in this report, over the next 10 years, the anticipated state share of the as-yet-uncommitted capital costs of the seven projects described in the capacity analysis totals approximately $195 million, of which $120 million is for Southwest LRT. The remaining costs are anticipated for I-35W South BRT, Cedar Avenue BRT and The Interchange in Minneapolis.
Operating Schedule – By 2021, all seven guideway projects in the capacity analysis (Hiawatha, Central, and Southwest LRT; Cedar and I-35W South BRT; Northstar commuter rail) are expected to be fully operational. At that time, the state share of operations funding will total approximately $45 million, $33 million of which falls under an existing obligation for 50 percent state funding of LRT operations codified at Minn. Stat. 473.4051.
Capital Maintenance – Capital maintenance includes ongoing capital costs typically included in an annual capital budget, such as track maintenance, periodic vehicle overhauls, signal work and other smaller-scale capital improvements. These maintenance costs can vary significantly from year to year. They also start out low as a new line is opened and grow over time as the line ages and more ongoing maintenance is required. As new rail lines come online, the federal transit formula funding allocated to the metropolitan region typically increases due to the increase in guideway mileage and service. If the federal formula continues as anticipated, additional federal funds will be available to pay approximately 80 percent of the annual capital maintenance costs of the guideway projects. The Council, using its Regional Transit Capital property tax-backed bonds, is responsible for the remaining amount with no expectation for state funding.
6
Guideway Status Report Minnesota Department of Transportation/Metropolitan Council January 2012
Introduction
The Minnesota Legislature adopted Minn. Stat. 174.93 in 2010. It requires that the Minnesota Department of Transportation (MnDOT) prepare, in collaboration with the Metropolitan Council (the Council), a biennial report about the status of guideway projects in the state, with an emphasis on funding sources and project progress. In the first special legislative session of 2011, the Legislature amended the statute to require that the report take a system view as well as a project view and that it include information about uses of funds in addition to funding sources. (See Appendix 1 for statutory language.) The report will be referred to hereafter as the Guideway Status Report. The statute defines guideways as a form of transportation service provided to the public on a regular or ongoing basis that operates on exclusive or controlled rights of way. Thus, guideways include light-rail transit (LRT), commuter rail, intercity passenger rail and bus service that utilizes an exclusive or managed lane. The statute further requires that the report include those guideways undergoing planning, design or construction as well as those already in operation. The statutory definition of guideway is slightly narrower than the term transitway, which is the term more commonly used by transit planners. In addition to LRT, commuter rail and bus rapid transit (BRT) corridors, the region’s Transportation Policy Plan (TPP) includes within the definition of transitway corridors anything that has major transit advantages. This includes stations, park-and-rides and bus-only shoulders, but do not necessarily have a dedicated guideway or right of way. Thus the term transitway also includes BRT operating on major arterial roadways (Arterial BRT) and express bus corridors with bus-only shoulder lanes. While the term transitway may be used in general discussion within this report, the information in this report is only for those corridors meeting the narrower definition of a guideway. The TPP was adopted in November 2010 by the Council as the region’s federally designated Metropolitan Planning Organization (MPO). Statewide Planning
MnDOT completed a collaborative, 50-year visioning process called Minnesota GO in November 2011. The objective of the process was to better align the transportation system with what Minnesotans expect for their quality of life, economy and natural environment. The effort was based on an understanding that transportation is a means to other ends, not an end in itself, and that infrastructure is only one of many elements necessary to achieving a high quality of life, a competitive economy and a healthy environment. The resulting vision focuses on a statewide transportation system that:
• Connects Minnesota’s primary assets—the people, natural resources and businesses within the state—to each other and to markets and resources outside the state and country
• Provides safe, convenient, efficient and effective movement of people and goods • Is flexible and nimble enough to adapt to changes in society, technology the environment and
the economy
7
Guideway Status Report Minnesota Department of Transportation/Metropolitan Council January 2012
These broad principles should guide planning efforts within the state, including intercity passenger rail. Additional information about Minnesota GO and the 50-year statewide transportation vision can be found at www.MinnesotaGO.org. Intercity passenger rail is a statewide issue that transcends localities and regions and is therefore overseen by MnDOT. Also, federal oversight and grants for passenger rail come through the Federal Railroad Administration (FRA) rather than the Federal Transit Administration (FTA). The FRA currently does not have a grant program similar in scale to the FTA’s New Starts program and is just beginning to develop common guidance and criteria for states to use when implementing intercity passenger rail. In 2008, the Minnesota Legislature required that MnDOT prepare a Statewide Freight and Intercity Passenger Rail Plan. This was the first plan of its kind and was completed in 2010. It identifies rail corridors with the most potential for passenger rail development and divides them into two phases of development. Among the Phase I corridors, three stand out as having the most potential for development in the next 10 years. These corridors are discussed in this report. In addition to intercity passenger rail, MnDOT has authority to plan, develop, construct, operate and maintain LRT and commuter rail. For commuter rail, MnDOT may delegate this authority to local entities such as the Council or a regional railroad authority. For LRT, both MnDOT and the Council have concurrent authority, and state statute requires that the governor designate one of the agencies as project lead. After the projects are constructed, the Council operates and maintains LRT facilities as well as commuter rail facilities located completely or partially within the Twin Cities metropolitan area. Regional Planning
The vision for transitway development in the Twin Cities metropolitan area is identified in the TPP, which establishes a regional goal of doubling transit ridership by 2030 from 2003 levels, resulting in approximately 150 million rides annually by 2030. The plan calls for accomplishing this goal by both expanding the existing base local and express bus system and developing a regional system of bus and rail transitways. It is important to note that the Guideway Status Report addresses only transitways and does not include cost estimates for expansion of the local and express bus system. Doubling transit ridership cannot be accomplished without making investments in the entire transit system. The corridor summaries provided in this report focus on the guideway projects that are being, or may be, implemented over the next 20 years as part of this regional vision. For the past four to five years, the Council’s base bus system budget has been at a service preservation level with minimal service expansion. Additional resources will be necessary to increase service levels in the base bus system and to build a system of transitways to achieve the 2030 ridership goal. The TPP Work Program (chapter 12) calls for the Council to conduct a Transit System Financial Analysis which will provide a 20-year analysis of the revenues and expenses needed to maintain and expand the base bus system and to develop a system of transitways. This report provides an important first step in this process by identifying the revenues and expenses of the guideway projects that are operational or will
8
Guideway Status Report Minnesota Department of Transportation/Metropolitan Council January 2012
become so in the next 10 years. It is the Council’s intent to build upon the initial work in this report and complete the full Transit System Financial Analysis prior to the next update of the TPP in 2014. The full Transit System Financial Analysis will provide insight about the costs and revenues needed to expand the base local and express bus system, continue operation of the guideway projects covered in this report and implement additional transitways. Some of these may be on dedicated or controlled rights of way, thus would be guideways, while others may not be, such as Arterial BRT or express bus transitways without a managed lane. Planning Process
All metropolitan area transit corridors in this report are identified in the TPP and are in, or have already completed, a local planning process intended to identify the locally preferred transit alternative for the corridor. Typically, this local corridor planning process is initiated and led by the county or counties in which the corridor is located. A city may also lead a corridor study when a majority of the corridor is contained within its boundaries. In early 2012, the Council will adopt Regional Transitway Guidelines which were developed through a two-year collaborative process to help ensure that transitway projects in the Twin Cities metropolitan area are planned and implemented in a consistent, equitable, and efficient manner regardless of the entity leading the process. They provide technical guidance and best practices for developing transitways in corridors that will be served by commuter rail, LRT and BRT. The Regional Transitway Guidelines will achieve the following goals:
• Establish technical best practices for transitway elements in the region, including fare collection systems, stations, public facilities and vehicles
• Provide consistent practices for project partners to use in developing transitways • Serve as a foundation to build on as other transitways are developed
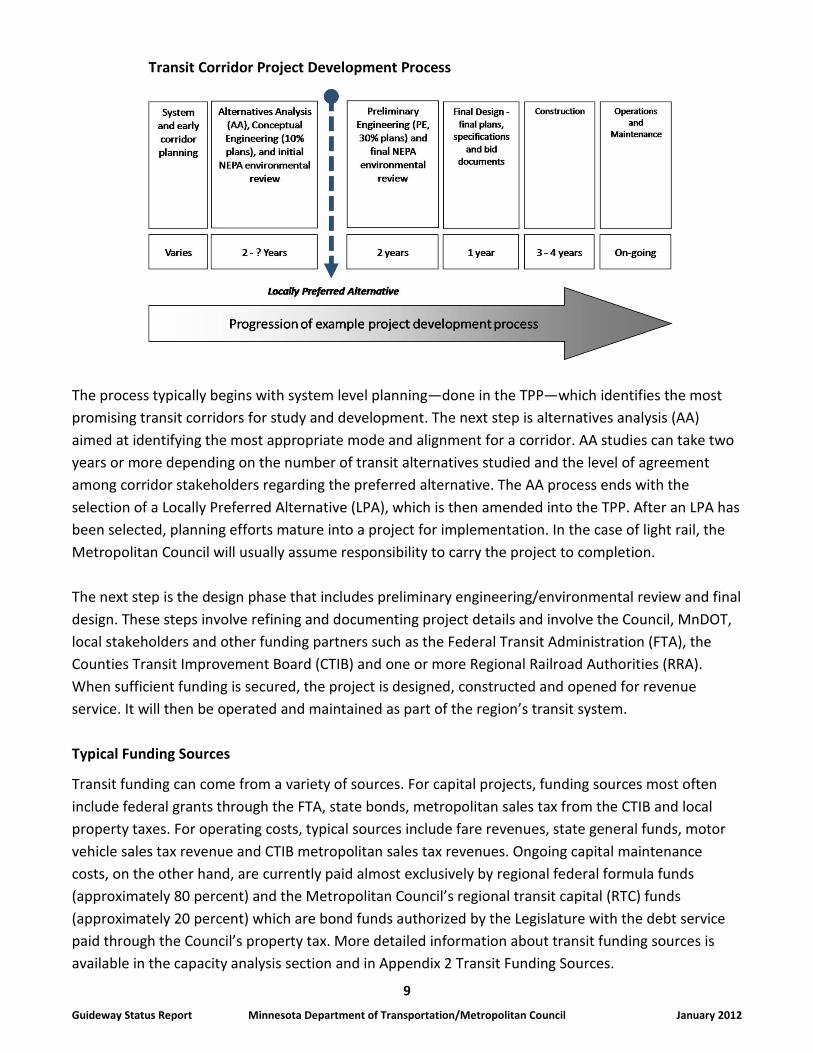
The draft Regional Transitway Guidelines can be found at: www.metrocouncil.org/planning/transportation/transitways/TransitwayGuidelines.htm The graphic below shows the typical project development process for a corridor seeking to implement a transit option as a solution to an identified transportation need.
9
Guideway Status Report Minnesota Department of Transportation/Metropolitan Council January 2012
Transit Corridor Project Development Process
The process typically begins with system level planning—done in the TPP—which identifies the most promising transit corridors for study and development. The next step is alternatives analysis (AA) aimed at identifying the most appropriate mode and alignment for a corridor. AA studies can take two years or more depending on the number of transit alternatives studied and the level of agreement among corridor stakeholders regarding the preferred alternative. The AA process ends with the selection of a Locally Preferred Alternative (LPA), which is then amended into the TPP. After an LPA has been selected, planning efforts mature into a project for implementation. In the case of light rail, the Metropolitan Council will usually assume responsibility to carry the project to completion. The next step is the design phase that includes preliminary engineering/environmental review and final design. These steps involve refining and documenting project details and involve the Council, MnDOT, local stakeholders and other funding partners such as the Federal Transit Administration (FTA), the Counties Transit Improvement Board (CTIB) and one or more Regional Railroad Authorities (RRA). When sufficient funding is secured, the project is designed, constructed and opened for revenue service. It will then be operated and maintained as part of the region’s transit system. Typical Funding Sources
Transit funding can come from a variety of sources. For capital projects, funding sources most often include federal grants through the FTA, state bonds, metropolitan sales tax from the CTIB and local property taxes. For operating costs, typical sources include fare revenues, state general funds, motor vehicle sales tax revenue and CTIB metropolitan sales tax revenues. Ongoing capital maintenance costs, on the other hand, are currently paid almost exclusively by regional federal formula funds (approximately 80 percent) and the Metropolitan Council’s regional transit capital (RTC) funds (approximately 20 percent) which are bond funds authorized by the Legislature with the debt service paid through the Council’s property tax. More detailed information about transit funding sources is available in the capacity analysis section and in Appendix 2 Transit Funding Sources.
10
Guideway Status Report Minnesota Department of Transportation/Metropolitan Council January 2012
System Branding
The Metropolitan Council approved a branding framework in 2010 that will unify the LRT and highway BRT services in the Twin Cities region under a single system name and branding identity, with color names for different lines. The goal of this framework is to clearly communicate what users can expect from the service: that it is frequent, fast and reliable, with special vehicles on dedicated running ways. The key is that BRT service will be LRT-like in terms of service quality and service levels (all-day frequent service) and that the connected system allows users to travel throughout the network of colored transit lines, in some cases without needing a schedule. The Council voted in mid-2011 to approve the color names for the various corridors. The Blue Line (Hiawatha LRT) is the only operational line that is affected by this change. The other lines are in various stages of design and construction. A line will receive its color name when a locally preferred alternative for the route and mode of the transitway service is forwarded to the Council for inclusion in the region's TPP. Note that commuter service, such as the Northstar Line, is not included in this system branding because service is not available all day. The system name and other LRT/BRT branding elements will be chosen by the Council in early 2012. Report Contents
This report has two main sections. First, it contains informational summaries for 18 individual corridors that are undergoing study, planning, design or construction or are in operation as a guideway project. Following these corridor summaries, the report takes a 10-year, system-wide view of capital costs, operating costs and maintenance costs. This part of the report, called the capacity analysis, includes only projects that are in design, construction or operation because only these projects have chosen a guideway mode and have sufficient cost data to meaningfully look ahead 10 years. Seven guideway projects meet the criteria for inclusion in the capacity analysis section of this report: I-394 High Occupancy Toll (HOT) lane, Hiawatha LRT (Blue Line), Northstar Commuter Rail, Cedar Avenue BRT (Red Line), I-35W South BRT (Orange Line), Central Corridor LRT (Green Line) and Southwest LRT (Green Line extension). Two special projects have also been included in the Guideway Status Report even though they do not meet the legislative definition of a guideway: the St. Paul Union Depot and The Interchange in Minneapolis. While these are multimodal transportation hubs, not transit corridors, they are included in the report because they will be important components in the region’s overall transitway system. In the capacity analysis, these projects are only included in the table for capital costs. The remaining potential guideway projects are still in the feasibility or alternatives analysis (AA) study phase and are not included in the capacity analysis. These corridors are still considering a number of transit alternatives with varying modes and alignments, leading to a wide range of potential capital and
11
Guideway Status Report Minnesota Department of Transportation/Metropolitan Council January 2012
operating costs. However, the individual corridor summaries include potential cost ranges, if project costs have been estimated for the corridor. In addition, given that these corridors are still being studied, it is uncertain whether a guideway project will be selected as the preferred transit option for the corridor and whether the project will progress into design and construction during the 10-year timeframe of the capacity analysis. Metropolitan area corridors in the study phase include the following: Bottineau, Gateway (I-94 East), I-35W North, Midtown, Nicollet-Central, Red Rock, Robert Street and Rush Line. MnDOT has programmed the construction of a managed lane on I-35E between Little Canada Road and downtown St. Paul in 2013. This managed lane lies within a portion of the Rush Line corridor but is not a transit guideway project because the LPA for this corridor has not yet been determined. The Rush Line corridor is expected to recommend a LPA at some point in the future which will define the expected transit capital and service improvements for the corridor. Intercity passenger rail projects are also among the group of corridors still in the study phase. Intercity passenger rail projects included in the corridor summaries are the Northern Lights Express corridor from Minneapolis to Duluth, the Twin Cities to Milwaukee High Speed Rail and the Rochester ZIP Rail. The following pages contain a brief corridor description, ridership estimate and capital and operating cost summary for each of the guideway projects under study or in design, construction or operation. Note that some tables may not add perfectly due to rounding.
12
Guideway Status Report Minnesota Department of Transportation/Metropolitan Council January 2012
Corridor Summaries
I-394 HOT Lane Express Bus Service
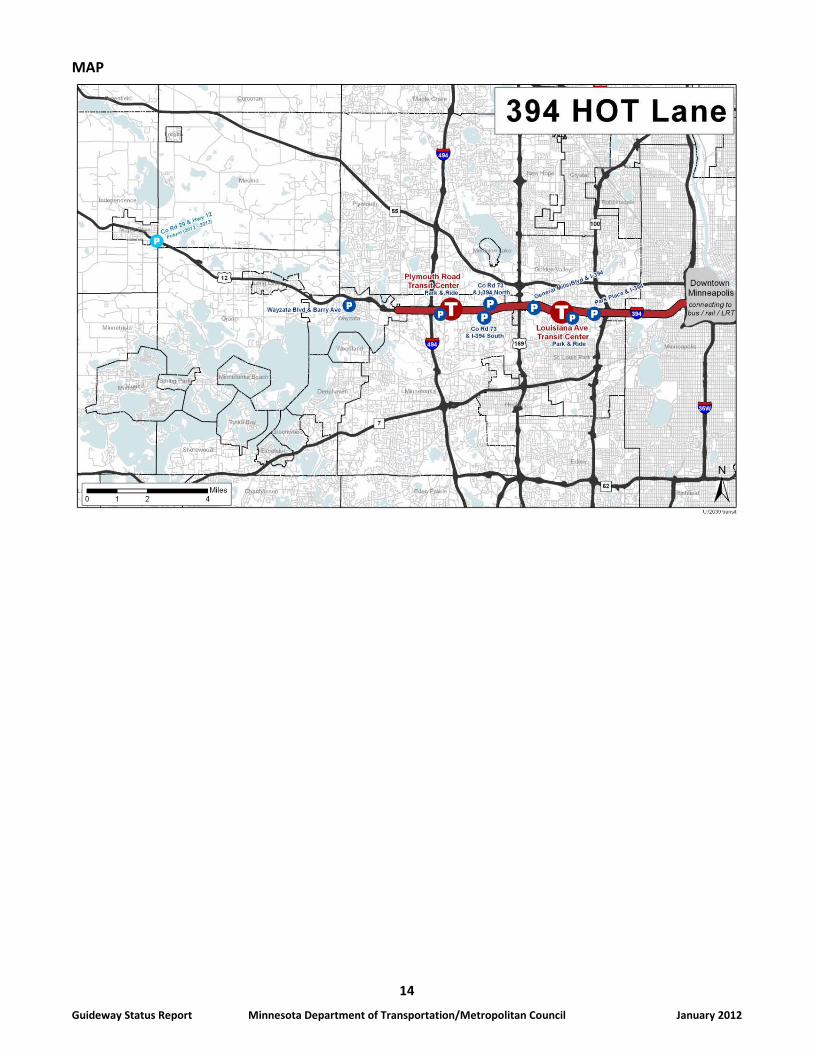
Corridor Description The Interstate 394 HOT lane express bus corridor is 11 miles long and extends from downtown Minneapolis to Minnetonka, including Golden Valley, St. Louis Park and Plymouth. The I-394 transitway opened in 1991 with the region’s first high-occupancy vehicle (HOV) lanes, which were converted to high-occupancy toll (HOT) lanes, part of the MnPASS express lanes system, in 2005. As a major commuter corridor, I-394 serves a high volume of express bus routes during the morning and afternoon peak travel periods. Currently, 40 express routes operated by six regional providers (Metro Transit, Metropolitan Council, Plymouth Metrolink, SouthWest Transit, Shakopee Transit and Prior Lake Laker Lines) use the I-394 HOT lanes to offer more than 500 daily bus trips serving 28 park-and-ride facilities. Four of the 28 park-and-rides are located immediately on I-394. They are served by 11 of the 40 express routes using the HOT lanes. The other 24 park-and-rides are served by 29 routes linking western and southwestern suburban areas with downtown Minneapolis, the University of Minnesota, and other local bus, express bus and transitway service via I-394. In addition to peak commuter service, limited midday and weekend transit service is also provided in the corridor. In 2010, the routes using the corridor carried more than 3 million passengers, an average of about 12,000 riders per weekday.
Project Status and Timeline The I-394 corridor transitway has been operational since 1991.
Summary Financial Plan CAPITAL COST AND FUNDING SOURCES The cost to build I-394 in 1991, including several parking garages to serve both transit and carpoolers on the edge of downtown Minneapolis, was $420 million. The cost to convert the HOV lanes to HOT lanes in 2005 was $10.1 million. Recent transit-related capital improvement projects in the corridor since the 2005 HOT lane conversion include rehabilitation of the Louisiana Transit Center (2007), construction of the park-and-ride ramp at County Road 73 (2009), sign upgrades at multiple facilities (2009), repaving the General Mills Boulevard lot (2009) and other facility improvements along I-394 (2010). The combined cost of these projects was $11.3 million with $8.2 million of funding from state trunk highway bonds and $2.9 million from Metropolitan Council regional transit capital (RTC) funds. Also,
13
Guideway Status Report Minnesota Department of Transportation/Metropolitan Council January 2012
construction of a park-and-ride lot at Highway 12 and County Road 29 in Maple Plain is programmed in 2012 and will be funded by $700,000 in state trunk highway bonds and $200,000 in RTC funds from the Metropolitan Council. Additional park-and-ride expansion is anticipated between 2017 and 2030 but is not included in the Council’s current capital improvement plan. ANNUAL OPERATING AND MAINTENANCE COSTS In 2010, transit routes serving the I-394 corridor cost approximately $19.8 million to operate. This service, along with other standard Metro Transit bus service, is funded with a combination of transit fares, motor vehicle sales tax revenue, and state general funds. Other Project Information
LEAD AGENCY Metropolitan Council PROJECT CONTACT Arlene McCarthy John Griffith Director, Metropolitan Transportation Services West Area Manager, MnDOT Metropolitan Council Waters Edge Building 390 N. Robert St. 1500 W. County Road B-2 St. Paul, MN 55101 Roseville, MN 55113 651-602-1754 651-234-7728 [email protected] [email protected]
14
Guideway Status Report Minnesota Department of Transportation/Metropolitan Council January 2012
MAP
15
Guideway Status Report Minnesota Department of Transportation/Metropolitan Council January 2012
Hiawatha LRT (Blue Line)
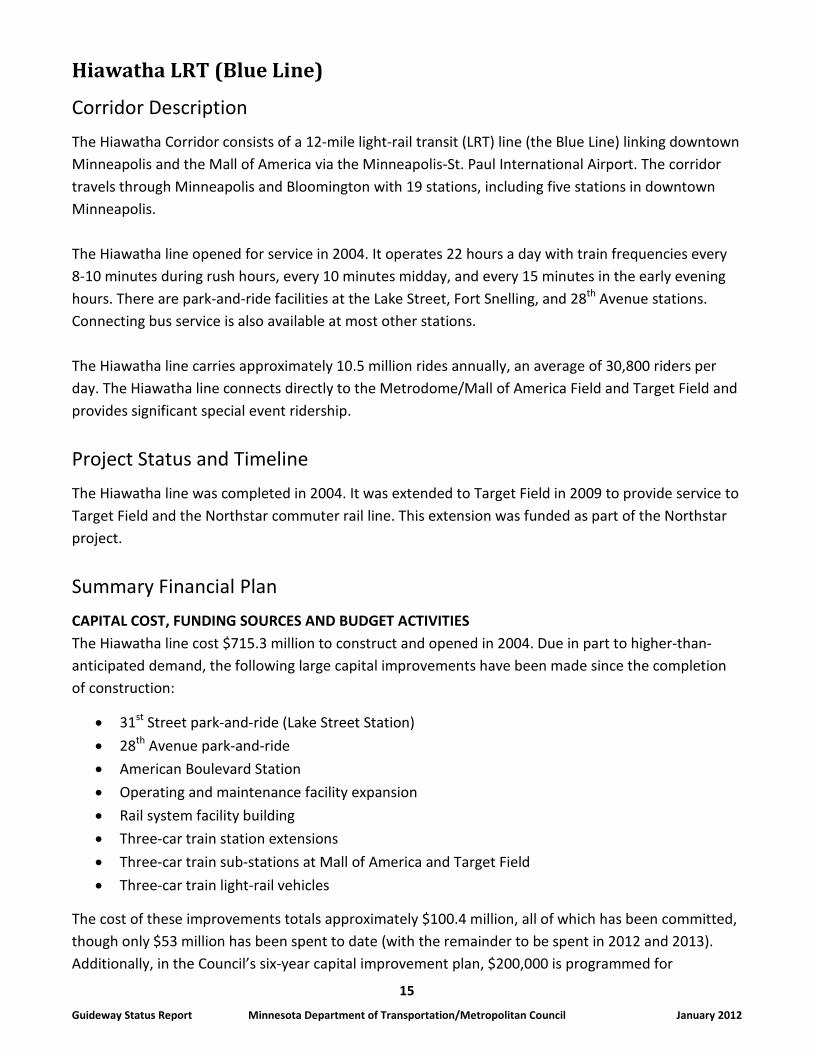
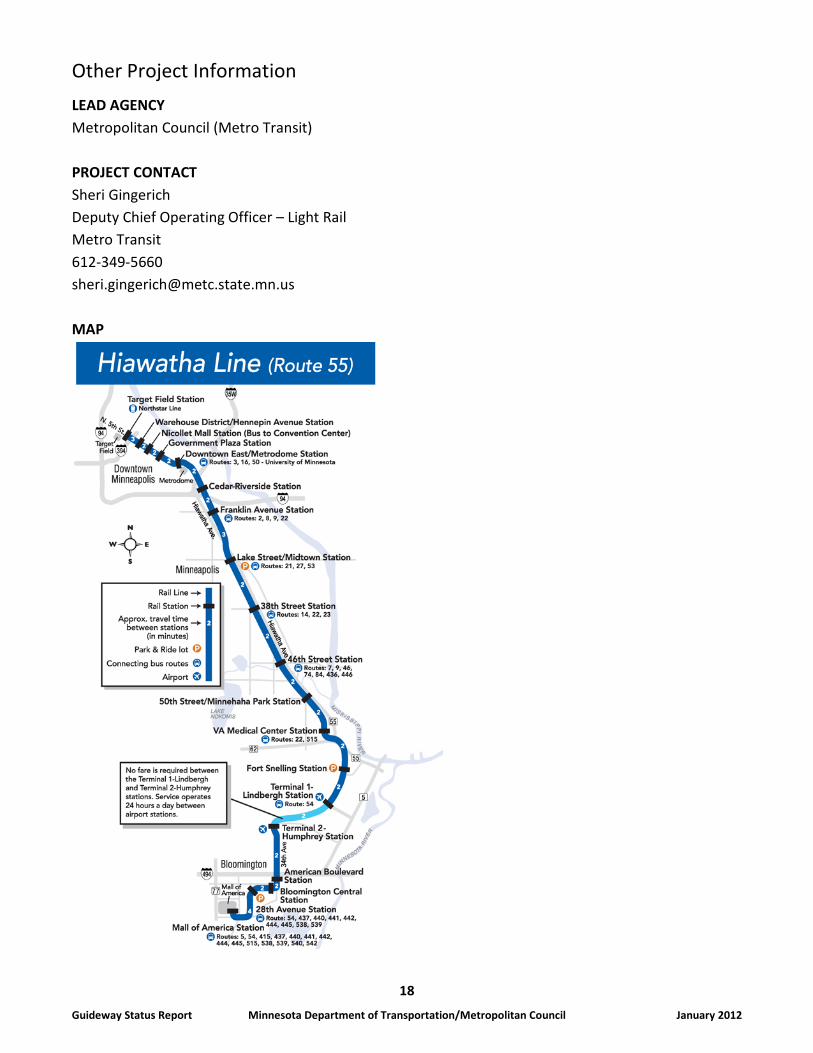
Corridor Description The Hiawatha Corridor consists of a 12-mile light-rail transit (LRT) line (the Blue Line) linking downtown Minneapolis and the Mall of America via the Minneapolis-St. Paul International Airport. The corridor travels through Minneapolis and Bloomington with 19 stations, including five stations in downtown Minneapolis. The Hiawatha line opened for service in 2004. It operates 22 hours a day with train frequencies every 8-10 minutes during rush hours, every 10 minutes midday, and every 15 minutes in the early evening hours. There are park-and-ride facilities at the Lake Street, Fort Snelling, and 28th Avenue stations. Connecting bus service is also available at most other stations. The Hiawatha line carries approximately 10.5 million rides annually, an average of 30,800 riders per day. The Hiawatha line connects directly to the Metrodome/Mall of America Field and Target Field and provides significant special event ridership.
Project Status and Timeline The Hiawatha line was completed in 2004. It was extended to Target Field in 2009 to provide service to Target Field and the Northstar commuter rail line. This extension was funded as part of the Northstar project.
Summary Financial Plan CAPITAL COST, FUNDING SOURCES AND BUDGET ACTIVITIES The Hiawatha line cost $715.3 million to construct and opened in 2004. Due in part to higher-than-anticipated demand, the following large capital improvements have been made since the completion of construction:
• 31st Street park-and-ride (Lake Street Station) • 28th Avenue park-and-ride • American Boulevard Station • Operating and maintenance facility expansion • Rail system facility building • Three-car train station extensions • Three-car train sub-stations at Mall of America and Target Field • Three-car train light-rail vehicles
The cost of these improvements totals approximately $100.4 million, all of which has been committed, though only $53 million has been spent to date (with the remainder to be spent in 2012 and 2013). Additionally, in the Council’s six-year capital improvement plan, $200,000 is programmed for
16
Guideway Status Report Minnesota Department of Transportation/Metropolitan Council January 2012
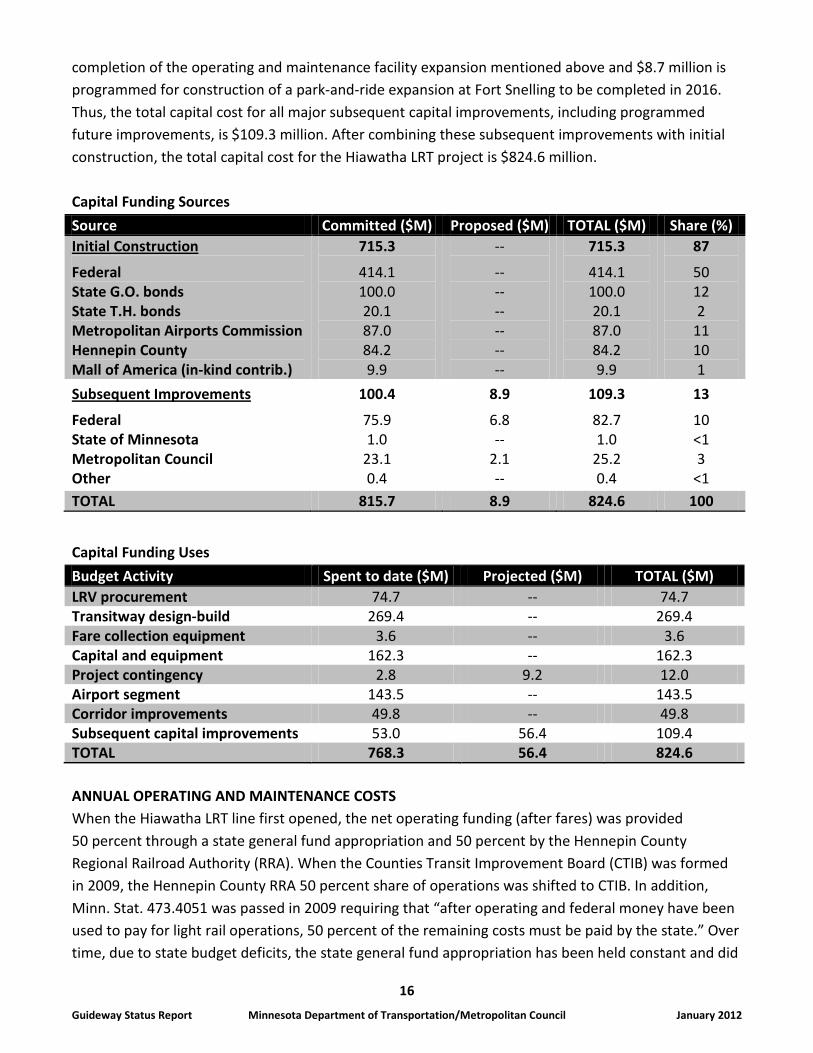
completion of the operating and maintenance facility expansion mentioned above and $8.7 million is programmed for construction of a park-and-ride expansion at Fort Snelling to be completed in 2016. Thus, the total capital cost for all major subsequent capital improvements, including programmed future improvements, is $109.3 million. After combining these subsequent improvements with initial construction, the total capital cost for the Hiawatha LRT project is $824.6 million. Capital Funding Sources Source Committed ($M) Proposed ($M) TOTAL ($M) Share (%) Initial Construction
Federal State G.O. bonds State T.H. bonds Metropolitan Airports Commission Hennepin County Mall of America (in-kind contrib.)
715.3
414.1 100.0 20.1 87.0 84.2 9.9
--
-- -- -- -- -- --
715.3
414.1 100.0 20.1 87.0 84.2 9.9
87
50 12 2
11 10 1
Subsequent Improvements
Federal State of Minnesota Metropolitan Council Other
100.4
75.9 1.0
23.1 0.4
8.9
6.8 --
2.1 --
109.3
82.7 1.0
25.2 0.4
13
10 <1 3
<1 TOTAL 815.7 8.9 824.6 100
Capital Funding Uses Budget Activity Spent to date ($M) Projected ($M) TOTAL ($M) LRV procurement 74.7 -- 74.7 Transitway design-build 269.4 -- 269.4 Fare collection equipment 3.6 -- 3.6 Capital and equipment 162.3 -- 162.3 Project contingency 2.8 9.2 12.0 Airport segment 143.5 -- 143.5 Corridor improvements 49.8 -- 49.8 Subsequent capital improvements 53.0 56.4 109.4 TOTAL 768.3 56.4 824.6 ANNUAL OPERATING AND MAINTENANCE COSTS When the Hiawatha LRT line first opened, the net operating funding (after fares) was provided 50 percent through a state general fund appropriation and 50 percent by the Hennepin County Regional Railroad Authority (RRA). When the Counties Transit Improvement Board (CTIB) was formed in 2009, the Hennepin County RRA 50 percent share of operations was shifted to CTIB. In addition, Minn. Stat. 473.4051 was passed in 2009 requiring that “after operating and federal money have been used to pay for light rail operations, 50 percent of the remaining costs must be paid by the state.” Over time, due to state budget deficits, the state general fund appropriation has been held constant and did
17
Guideway Status Report Minnesota Department of Transportation/Metropolitan Council January 2012
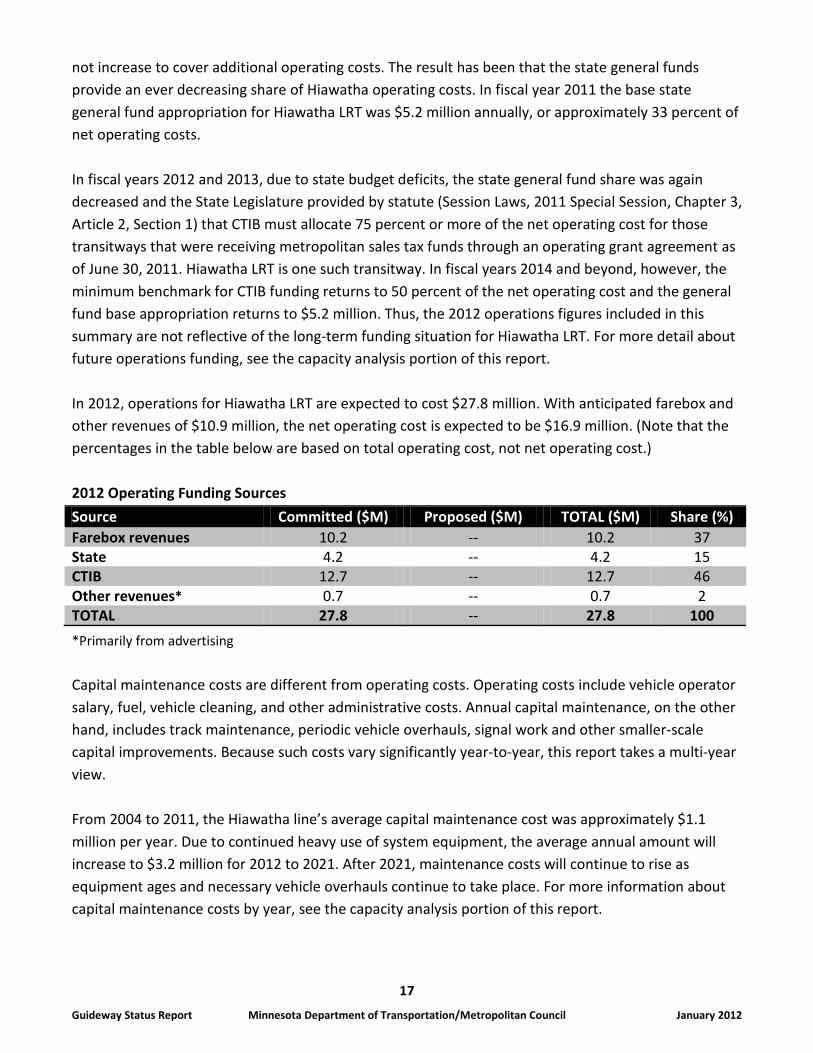
not increase to cover additional operating costs. The result has been that the state general funds provide an ever decreasing share of Hiawatha operating costs. In fiscal year 2011 the base state general fund appropriation for Hiawatha LRT was $5.2 million annually, or approximately 33 percent of net operating costs. In fiscal years 2012 and 2013, due to state budget deficits, the state general fund share was again decreased and the State Legislature provided by statute (Session Laws, 2011 Special Session, Chapter 3, Article 2, Section 1) that CTIB must allocate 75 percent or more of the net operating cost for those transitways that were receiving metropolitan sales tax funds through an operating grant agreement as of June 30, 2011. Hiawatha LRT is one such transitway. In fiscal years 2014 and beyond, however, the minimum benchmark for CTIB funding returns to 50 percent of the net operating cost and the general fund base appropriation returns to $5.2 million. Thus, the 2012 operations figures included in this summary are not reflective of the long-term funding situation for Hiawatha LRT. For more detail about future operations funding, see the capacity analysis portion of this report. In 2012, operations for Hiawatha LRT are expected to cost $27.8 million. With anticipated farebox and other revenues of $10.9 million, the net operating cost is expected to be $16.9 million. (Note that the percentages in the table below are based on total operating cost, not net operating cost.) 2012 Operating Funding Sources Source Committed ($M) Proposed ($M) TOTAL ($M) Share (%) Farebox revenues 10.2 -- 10.2 37 State 4.2 -- 4.2 15 CTIB 12.7 -- 12.7 46 Other revenues* 0.7 -- 0.7 2 TOTAL 27.8 -- 27.8 100
*Primarily from advertising Capital maintenance costs are different from operating costs. Operating costs include vehicle operator salary, fuel, vehicle cleaning, and other administrative costs. Annual capital maintenance, on the other hand, includes track maintenance, periodic vehicle overhauls, signal work and other smaller-scale capital improvements. Because such costs vary significantly year-to-year, this report takes a multi-year view. From 2004 to 2011, the Hiawatha line’s average capital maintenance cost was approximately $1.1 million per year. Due to continued heavy use of system equipment, the average annual amount will increase to $3.2 million for 2012 to 2021. After 2021, maintenance costs will continue to rise as equipment ages and necessary vehicle overhauls continue to take place. For more information about capital maintenance costs by year, see the capacity analysis portion of this report.
18
Guideway Status Report Minnesota Department of Transportation/Metropolitan Council January 2012
Other Project Information LEAD AGENCY Metropolitan Council (Metro Transit) PROJECT CONTACT Sheri Gingerich Deputy Chief Operating Officer – Light Rail Metro Transit 612-349-5660 [email protected] MAP
19
Guideway Status Report Minnesota Department of Transportation/Metropolitan Council January 2012
Northstar Commuter Rail
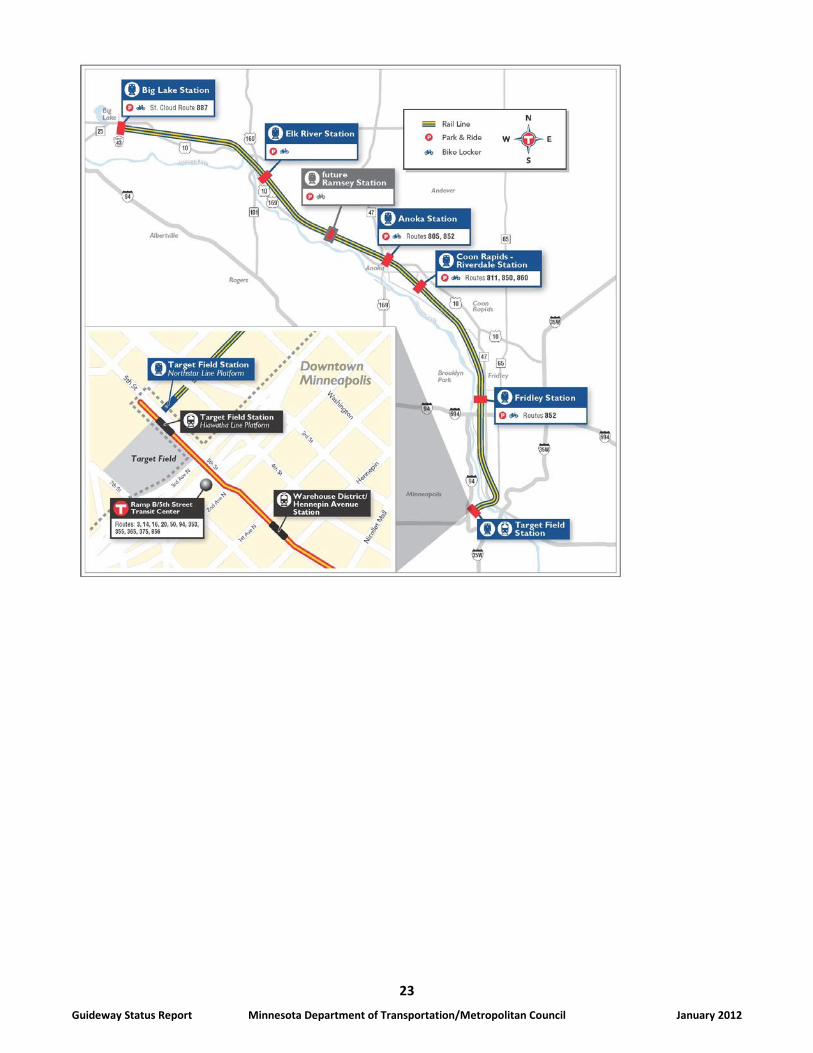
Corridor Description The Northstar Corridor consists of a 40-mile commuter rail line traveling from Big Lake in Sherburne County to downtown Minneapolis, where it connects with the Hiawatha LRT line at Target Field Station. The Northstar line provides 12 weekday trips (six inbound and six outbound, including one reverse direction trip each morning and afternoon during rush hours). The line serves five suburban park-and-ride stations on its way downtown – Big Lake, Elk River, Anoka, Coon Rapids and Fridley. Three roundtrips are offered on weekend days and schedules are adjusted for special events. The Northstar line carried approximately 700,000 rides in 2011, an average of just over 2,300 riders per weekday. By providing service to Target Field Station, it provides significant special event ridership.
Project Status and Timeline The Northstar line was completed in 2009, including an extension of the Hiawatha LRT line (Blue Line) from the Warehouse District Station to Target Field Station where it connects with the Northstar line. Construction of an additional Northstar station in Ramsey is expected to be completed in 2012.
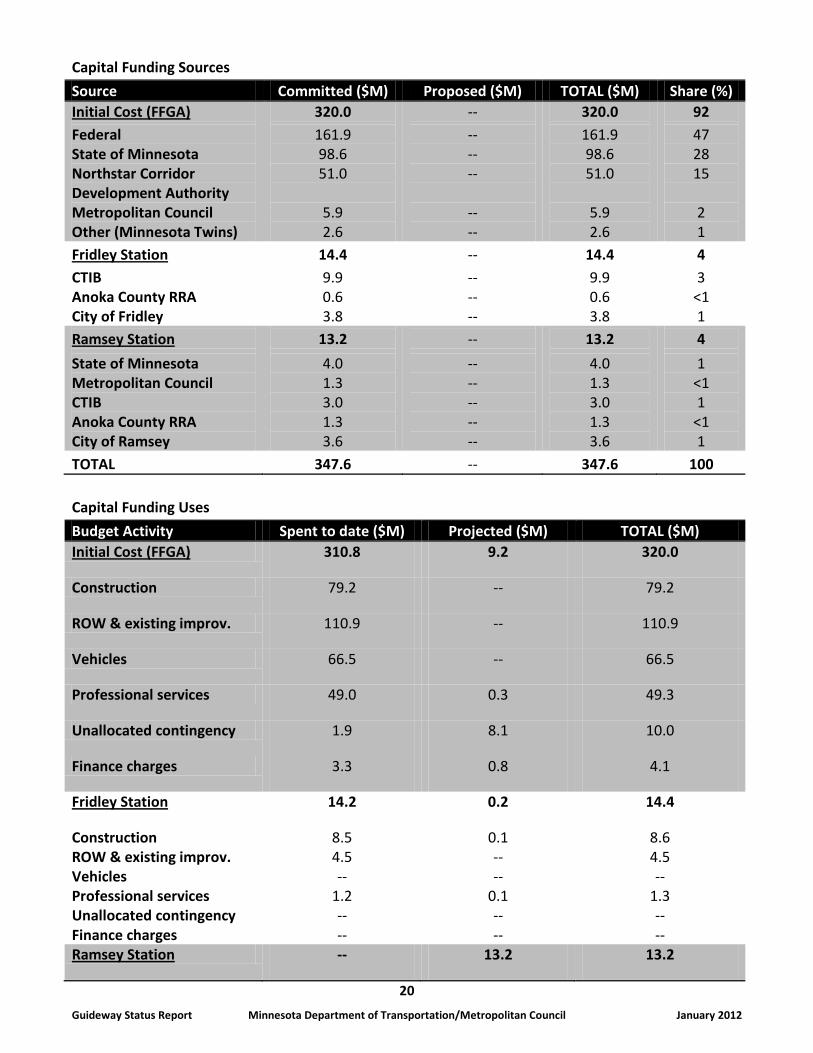
Summary Financial Plan CAPITAL COST, FUNDING SOURCES, AND BUDGET ACTIVITIES The Northstar line was constructed for $320 million as a New Starts project with the Federal Transit Administration (FTA). The Fridley Station was a separate project built concurrently with the New Starts project at a cost of $14.4 million and opened in 2009 at the same time as the overall project. Also, plans recently have been made to construct Ramsey Station, estimated to cost $13.2 million, bringing the total capital cost for the Northstar line to $347.6 million.
20
Guideway Status Report Minnesota Department of Transportation/Metropolitan Council January 2012
Capital Funding Sources Source Committed ($M) Proposed ($M) TOTAL ($M) Share (%) Initial Cost (FFGA)
Federal State of Minnesota Northstar Corridor Development Authority Metropolitan Council Other (Minnesota Twins)
320.0
161.9 98.6 51.0
5.9 2.6
--
-- -- --
-- --
320.0
161.9 98.6 51.0
5.9 2.6
92
47 28 15
2 1
Fridley Station
CTIB Anoka County RRA City of Fridley
14.4
9.9 0.6 3.8
--
-- -- --
14.4
9.9 0.6 3.8
4
3 <1 1
Ramsey Station
State of Minnesota Metropolitan Council CTIB Anoka County RRA City of Ramsey
13.2
4.0 1.3 3.0 1.3 3.6
--
-- -- -- -- --
13.2
4.0 1.3 3.0 1.3 3.6
4
1 <1 1
<1 1
TOTAL
347.6
--
347.6
100 Capital Funding Uses Budget Activity Spent to date ($M) Projected ($M) TOTAL ($M) Initial Cost (FFGA) 310.8 9.2 320.0
Construction 79.2 -- 79.2
ROW & existing improv. 110.9 -- 110.9
Vehicles 66.5 -- 66.5
Professional services 49.0 0.3 49.3
Unallocated contingency 1.9 8.1 10.0
Finance charges 3.3 0.8 4.1
Fridley Station 14.2 0.2 14.4
Construction 8.5 0.1 8.6 ROW & existing improv. 4.5 -- 4.5 Vehicles -- -- -- Professional services 1.2 0.1 1.3 Unallocated contingency -- -- -- Finance charges -- -- -- Ramsey Station -- 13.2 13.2
21
Guideway Status Report Minnesota Department of Transportation/Metropolitan Council January 2012
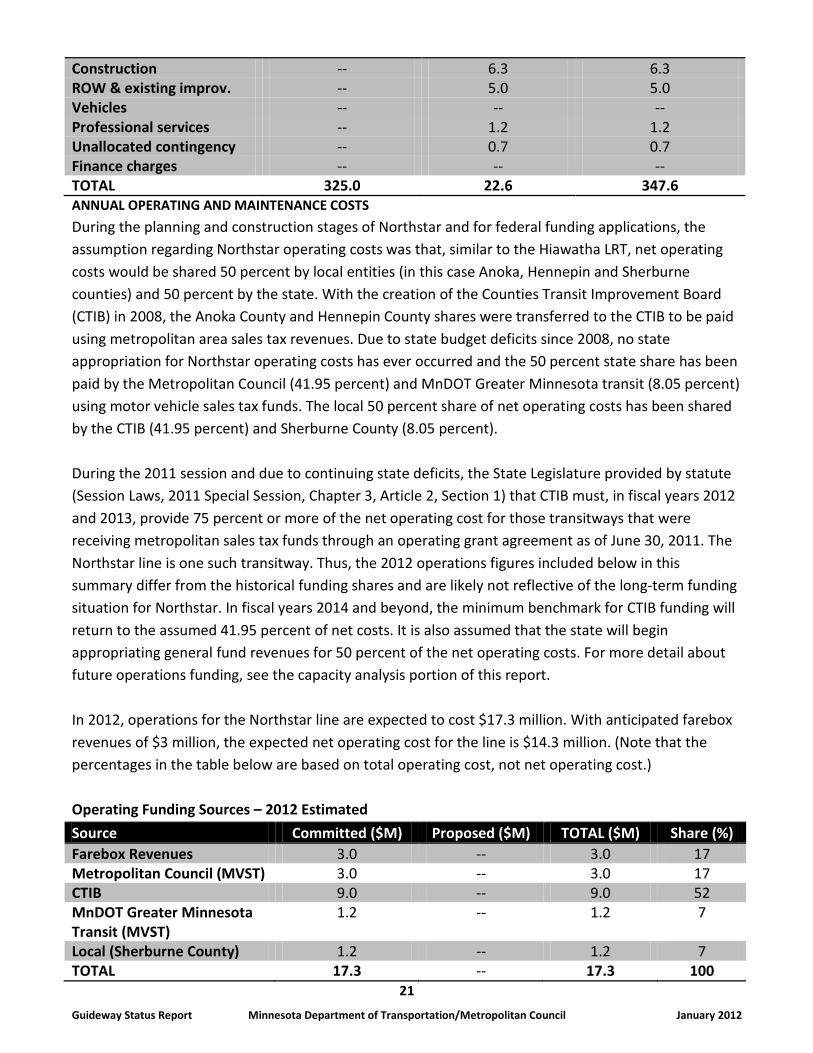
Construction -- 6.3 6.3 ROW & existing improv. -- 5.0 5.0 Vehicles -- -- -- Professional services -- 1.2 1.2 Unallocated contingency -- 0.7 0.7 Finance charges -- -- -- TOTAL 325.0 22.6 347.6 ANNUAL OPERATING AND MAINTENANCE COSTS During the planning and construction stages of Northstar and for federal funding applications, the assumption regarding Northstar operating costs was that, similar to the Hiawatha LRT, net operating costs would be shared 50 percent by local entities (in this case Anoka, Hennepin and Sherburne counties) and 50 percent by the state. With the creation of the Counties Transit Improvement Board (CTIB) in 2008, the Anoka County and Hennepin County shares were transferred to the CTIB to be paid using metropolitan area sales tax revenues. Due to state budget deficits since 2008, no state appropriation for Northstar operating costs has ever occurred and the 50 percent state share has been paid by the Metropolitan Council (41.95 percent) and MnDOT Greater Minnesota transit (8.05 percent) using motor vehicle sales tax funds. The local 50 percent share of net operating costs has been shared by the CTIB (41.95 percent) and Sherburne County (8.05 percent). During the 2011 session and due to continuing state deficits, the State Legislature provided by statute (Session Laws, 2011 Special Session, Chapter 3, Article 2, Section 1) that CTIB must, in fiscal years 2012 and 2013, provide 75 percent or more of the net operating cost for those transitways that were receiving metropolitan sales tax funds through an operating grant agreement as of June 30, 2011. The Northstar line is one such transitway. Thus, the 2012 operations figures included below in this summary differ from the historical funding shares and are likely not reflective of the long-term funding situation for Northstar. In fiscal years 2014 and beyond, the minimum benchmark for CTIB funding will return to the assumed 41.95 percent of net costs. It is also assumed that the state will begin appropriating general fund revenues for 50 percent of the net operating costs. For more detail about future operations funding, see the capacity analysis portion of this report. In 2012, operations for the Northstar line are expected to cost $17.3 million. With anticipated farebox revenues of $3 million, the expected net operating cost for the line is $14.3 million. (Note that the percentages in the table below are based on total operating cost, not net operating cost.) Operating Funding Sources – 2012 Estimated Source Committed ($M) Proposed ($M) TOTAL ($M) Share (%) Farebox Revenues 3.0 -- 3.0 17 Metropolitan Council (MVST) 3.0 -- 3.0 17 CTIB 9.0 -- 9.0 52 MnDOT Greater Minnesota Transit (MVST)
1.2 -- 1.2 7
Local (Sherburne County) 1.2 -- 1.2 7 TOTAL 17.3 -- 17.3 100
22
Guideway Status Report Minnesota Department of Transportation/Metropolitan Council January 2012
For 2009 to 2021, the average annual capital maintenance cost for Northstar is expected to be approximately $900,000. These costs will be low initially, but they will increase as the system ages. For more information about capital maintenance costs, see the capacity analysis portion of this report.
Other Project Information LEAD AGENCY Metropolitan Council (Metro Transit) PROJECT CONTACT Ed Byers Director of Commuter Rail Metro Transit 612-349-7080 [email protected] MAP
23
Guideway Status Report Minnesota Department of Transportation/Metropolitan Council January 2012
24
Guideway Status Report Minnesota Department of Transportation/Metropolitan Council January 2012
Central Corridor LRT (Green Line)
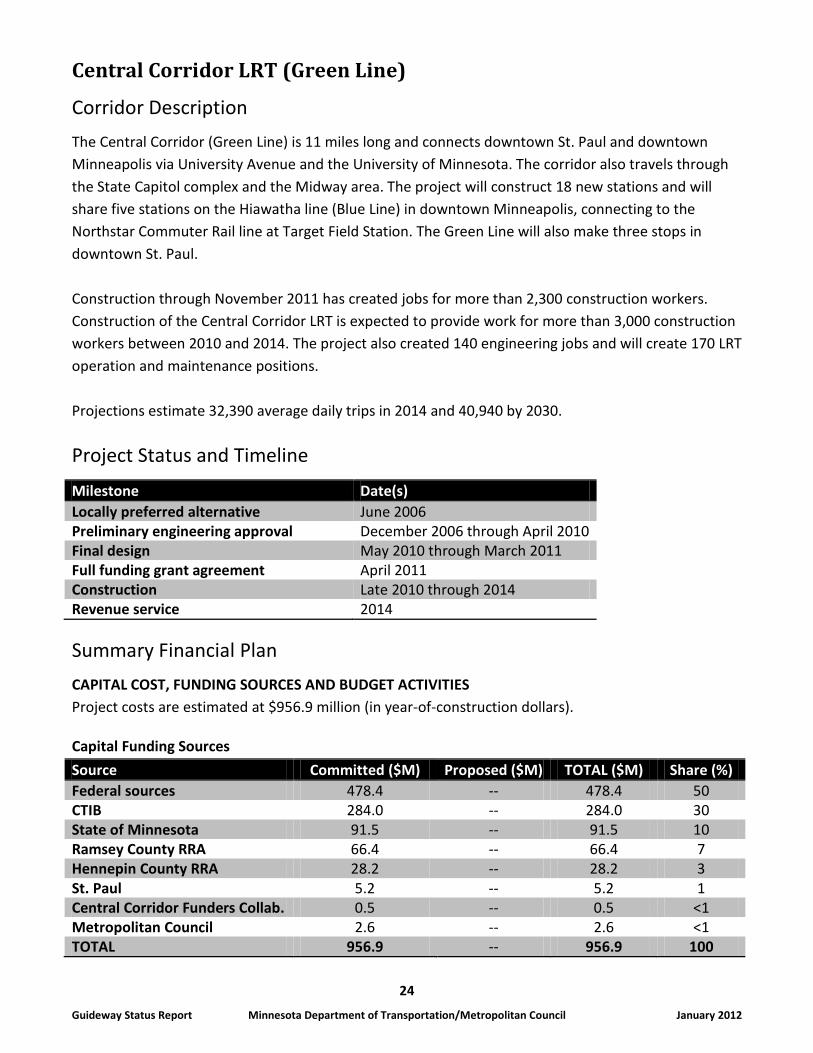
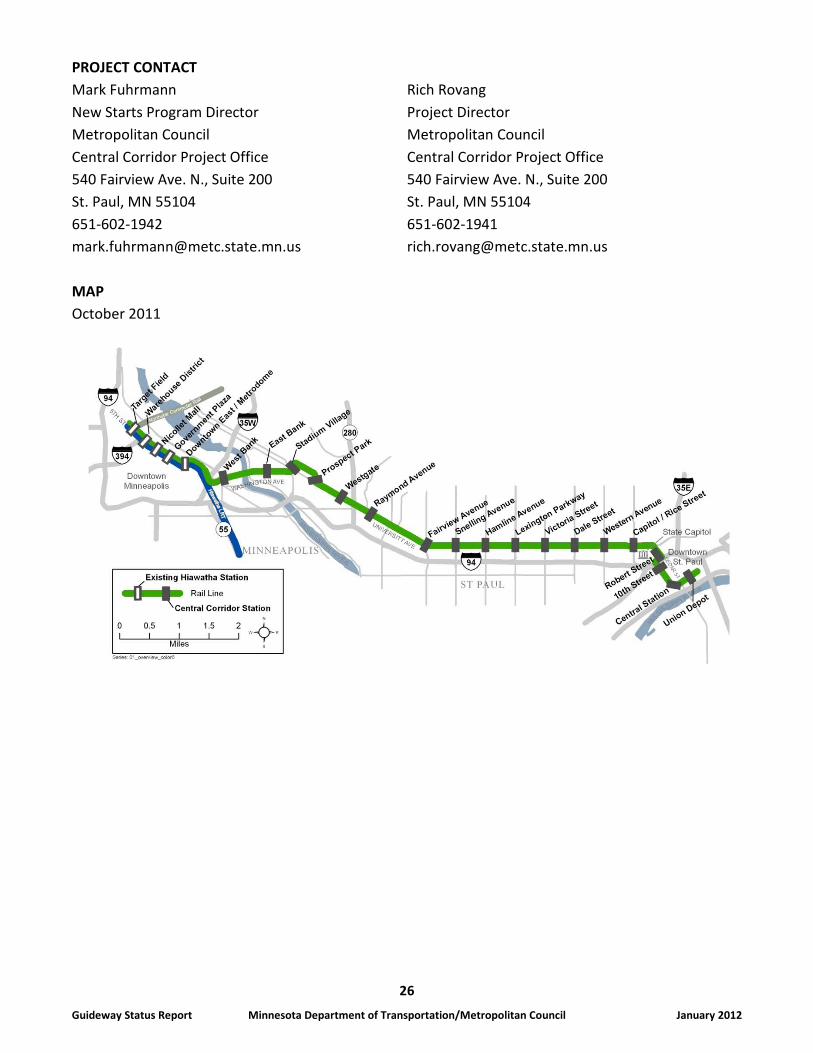
Corridor Description The Central Corridor (Green Line) is 11 miles long and connects downtown St. Paul and downtown Minneapolis via University Avenue and the University of Minnesota. The corridor also travels through the State Capitol complex and the Midway area. The project will construct 18 new stations and will share five stations on the Hiawatha line (Blue Line) in downtown Minneapolis, connecting to the Northstar Commuter Rail line at Target Field Station. The Green Line will also make three stops in downtown St. Paul. Construction through November 2011 has created jobs for more than 2,300 construction workers. Construction of the Central Corridor LRT is expected to provide work for more than 3,000 construction workers between 2010 and 2014. The project also created 140 engineering jobs and will create 170 LRT operation and maintenance positions. Projections estimate 32,390 average daily trips in 2014 and 40,940 by 2030.
Project Status and Timeline
Milestone Date(s) Locally preferred alternative June 2006 Preliminary engineering approval December 2006 through April 2010 Final design May 2010 through March 2011 Full funding grant agreement April 2011 Construction Late 2010 through 2014 Revenue service 2014
Summary Financial Plan CAPITAL COST, FUNDING SOURCES AND BUDGET ACTIVITIES Project costs are estimated at $956.9 million (in year-of-construction dollars).
Capital Funding Sources Source Committed ($M) Proposed ($M) TOTAL ($M) Share (%) Federal sources 478.4 -- 478.4 50 CTIB 284.0 -- 284.0 30 State of Minnesota 91.5 -- 91.5 10 Ramsey County RRA 66.4 -- 66.4 7 Hennepin County RRA 28.2 -- 28.2 3 St. Paul 5.2 -- 5.2 1 Central Corridor Funders Collab. 0.5 -- 0.5 <1 Metropolitan Council 2.6 -- 2.6 <1 TOTAL 956.9 -- 956.9 100
25
Guideway Status Report Minnesota Department of Transportation/Metropolitan Council January 2012
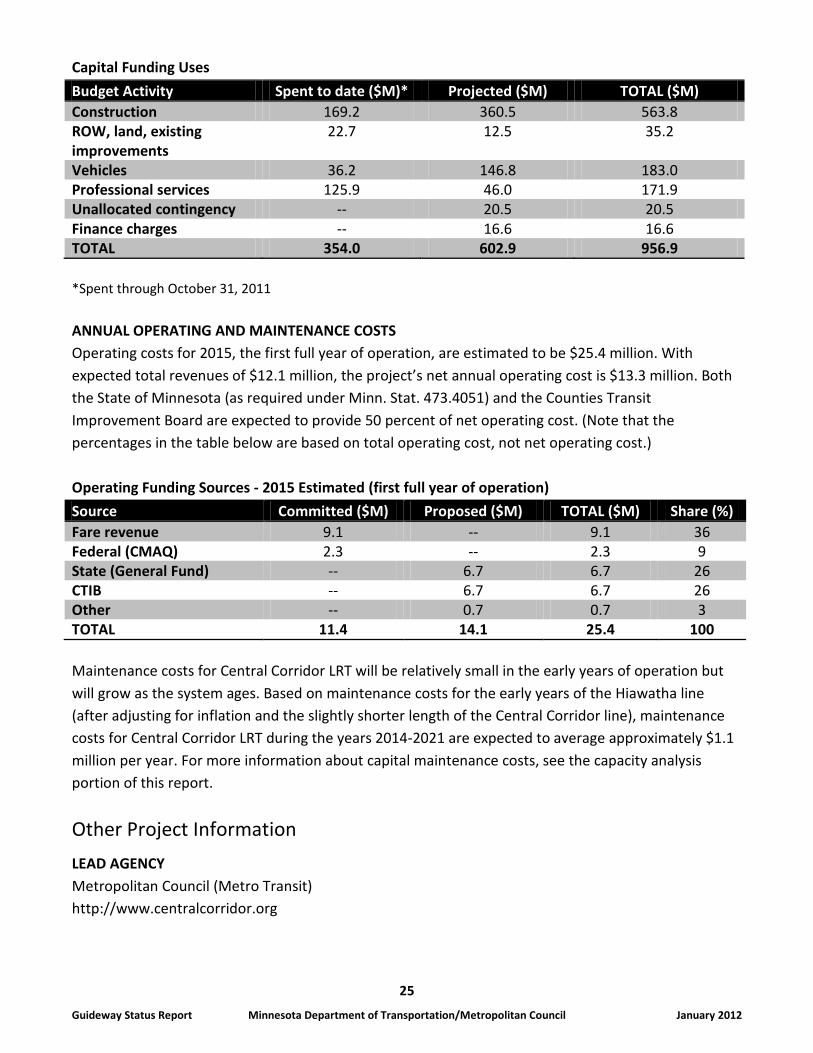
Capital Funding Uses Budget Activity Spent to date ($M)* Projected ($M) TOTAL ($M) Construction 169.2 360.5 563.8 ROW, land, existing improvements
22.7 12.5 35.2
Vehicles 36.2 146.8 183.0 Professional services 125.9 46.0 171.9 Unallocated contingency -- 20.5 20.5 Finance charges -- 16.6 16.6 TOTAL 354.0 602.9 956.9 *Spent through October 31, 2011 ANNUAL OPERATING AND MAINTENANCE COSTS Operating costs for 2015, the first full year of operation, are estimated to be $25.4 million. With expected total revenues of $12.1 million, the project’s net annual operating cost is $13.3 million. Both the State of Minnesota (as required under Minn. Stat. 473.4051) and the Counties Transit Improvement Board are expected to provide 50 percent of net operating cost. (Note that the percentages in the table below are based on total operating cost, not net operating cost.) Operating Funding Sources - 2015 Estimated (first full year of operation) Source Committed ($M) Proposed ($M) TOTAL ($M) Share (%) Fare revenue 9.1 -- 9.1 36 Federal (CMAQ) 2.3 -- 2.3 9 State (General Fund) -- 6.7 6.7 26 CTIB -- 6.7 6.7 26 Other -- 0.7 0.7 3 TOTAL 11.4 14.1 25.4 100 Maintenance costs for Central Corridor LRT will be relatively small in the early years of operation but will grow as the system ages. Based on maintenance costs for the early years of the Hiawatha line (after adjusting for inflation and the slightly shorter length of the Central Corridor line), maintenance costs for Central Corridor LRT during the years 2014-2021 are expected to average approximately $1.1 million per year. For more information about capital maintenance costs, see the capacity analysis portion of this report.
Other Project Information LEAD AGENCY Metropolitan Council (Metro Transit) http://www.centralcorridor.org
26
Guideway Status Report Minnesota Department of Transportation/Metropolitan Council January 2012
PROJECT CONTACT Mark Fuhrmann Rich Rovang New Starts Program Director Project Director Metropolitan Council Metropolitan Council Central Corridor Project Office Central Corridor Project Office 540 Fairview Ave. N., Suite 200 540 Fairview Ave. N., Suite 200 St. Paul, MN 55104 St. Paul, MN 55104 651-602-1942 651-602-1941 [email protected] [email protected] MAP October 2011
27
Guideway Status Report Minnesota Department of Transportation/Metropolitan Council January 2012
Southwest LRT (Green Line extension)
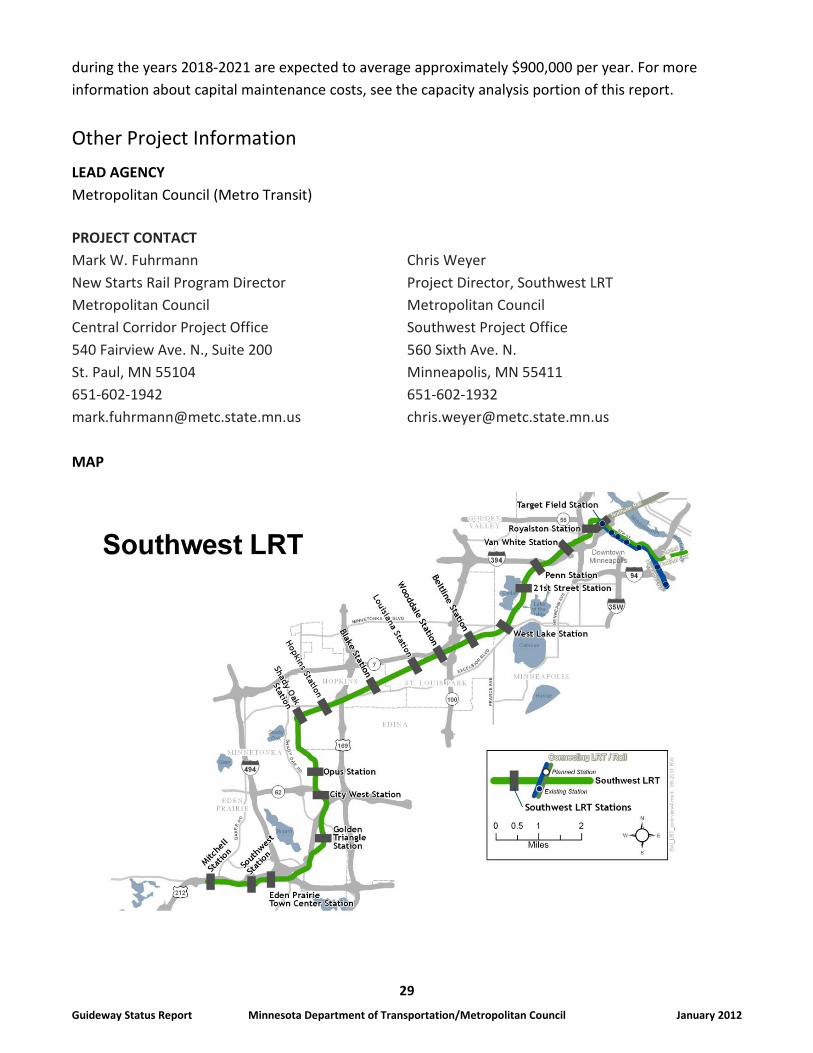
Corridor Description The Southwest Light Rail Transit (LRT) project is a proposed 15 mile extension of the Central Corridor LRT line (Green Line) from downtown Minneapolis through the southwestern suburban cities of St. Louis Park, Hopkins, Minnetonka and Eden Prairie. The LRT extension, as proposed, will have 17 new stations, a fleet of 26 new light rail vehicles, and will connect with the Hiawatha LRT line (Blue Line) and the Northstar Commuter Rail line using Target Field Station at The Interchange. The combined line will provide direct, high quality LRT access to major activity and employment centers in the region including Eden Prairie Center Mall, Opus/Golden Triangle employment area, Methodist Hospital, Minneapolis Chain of Lakes, downtown Minneapolis, the University of Minnesota, the State Capitol area and downtown St. Paul. Improving regional access and offering mobility options to these regional centers of employment, business, education and other services with the high quality of service that LRT provides will help ensure the region’s continued economic health and vitality. Within a half-mile walk of the Southwest LRT stations, there were almost 210,000 jobs, 60,000 people in 31,000 households, and more than 31,000 college/university students in 2000. By 2030, 60,000 more jobs, 15,000 more people, and 10,000 more households are expected within a half-mile walk of the Southwest LRT stations. Ridership projections estimate 29,660 average daily trips in 2030. Governor Dayton recommends providing $25 million in bonding for this project during the 2012 legislative session. Project Status and Timeline The project received approval from the Federal Transit Administration to enter the preliminary engineering (PE) phase of project development on Sept. 2, 2011. The PE phase of the project is expected to continue for approximately two years. The following table summarizes the actual and projected achievement of key project milestones.
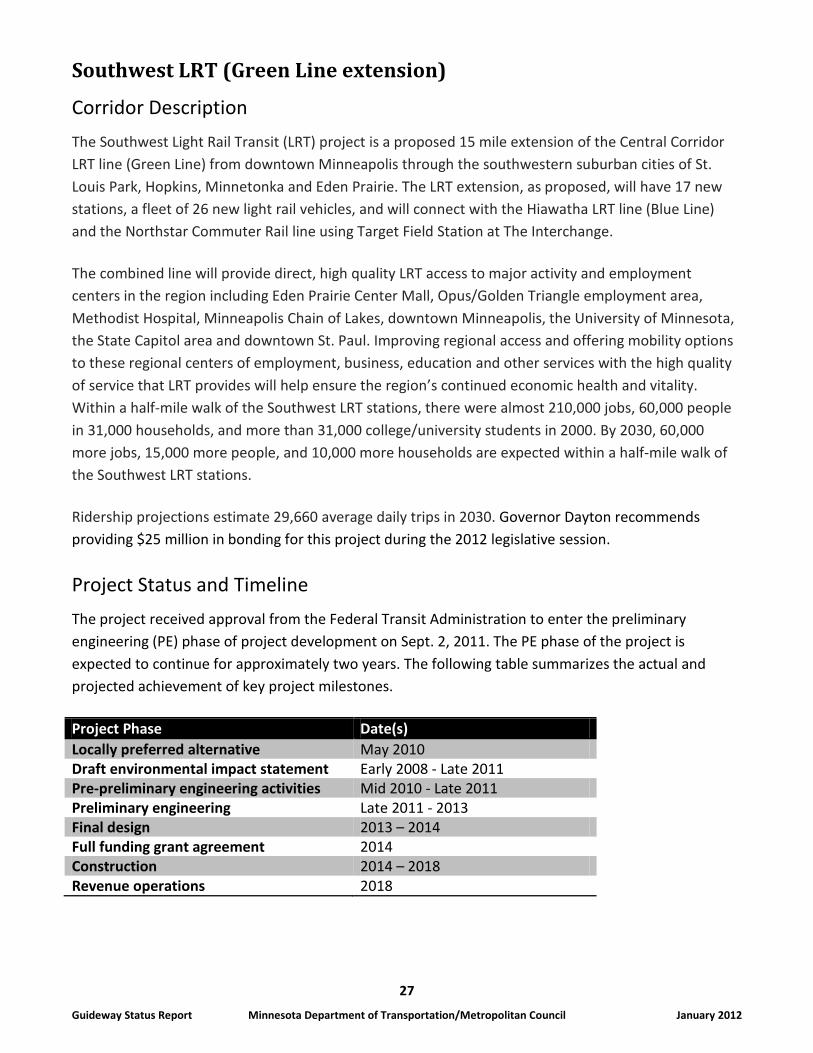
Project Phase Date(s) Locally preferred alternative May 2010 Draft environmental impact statement Early 2008 - Late 2011 Pre-preliminary engineering activities Mid 2010 - Late 2011 Preliminary engineering Late 2011 - 2013 Final design 2013 – 2014 Full funding grant agreement 2014 Construction 2014 – 2018 Revenue operations 2018
28
Guideway Status Report Minnesota Department of Transportation/Metropolitan Council January 2012
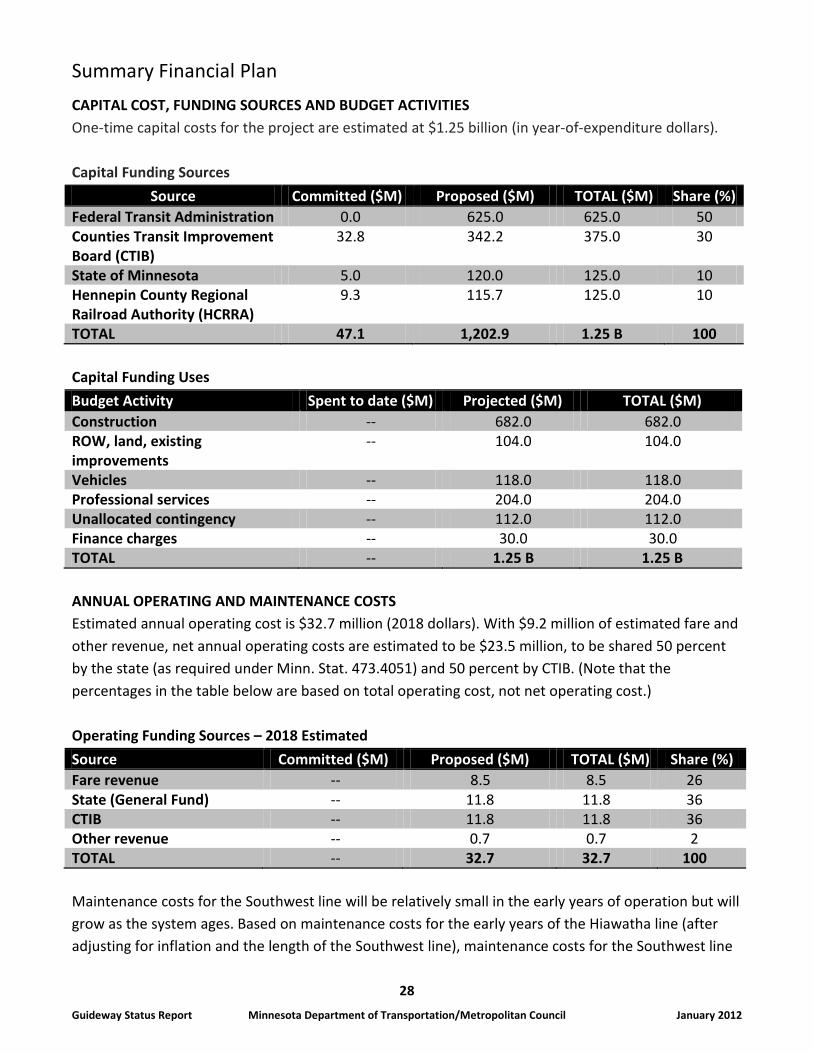
Summary Financial Plan CAPITAL COST, FUNDING SOURCES AND BUDGET ACTIVITIES One-time capital costs for the project are estimated at $1.25 billion (in year-of-expenditure dollars). Capital Funding Sources
Source Committed ($M) Proposed ($M) TOTAL ($M) Share (%) Federal Transit Administration 0.0 625.0 625.0 50 Counties Transit Improvement Board (CTIB)
32.8 342.2 375.0 30
State of Minnesota 5.0 120.0 125.0 10 Hennepin County Regional Railroad Authority (HCRRA)
9.3 115.7 125.0 10
TOTAL 47.1 1,202.9 1.25 B 100 Capital Funding Uses Budget Activity Spent to date ($M) Projected ($M) TOTAL ($M) Construction -- 682.0 682.0 ROW, land, existing improvements
-- 104.0 104.0
Vehicles -- 118.0 118.0 Professional services -- 204.0 204.0 Unallocated contingency -- 112.0 112.0 Finance charges -- 30.0 30.0 TOTAL -- 1.25 B 1.25 B ANNUAL OPERATING AND MAINTENANCE COSTS Estimated annual operating cost is $32.7 million (2018 dollars). With $9.2 million of estimated fare and other revenue, net annual operating costs are estimated to be $23.5 million, to be shared 50 percent by the state (as required under Minn. Stat. 473.4051) and 50 percent by CTIB. (Note that the percentages in the table below are based on total operating cost, not net operating cost.) Operating Funding Sources – 2018 Estimated Source Committed ($M) Proposed ($M) TOTAL ($M) Share (%) Fare revenue -- 8.5 8.5 26 State (General Fund) -- 11.8 11.8 36 CTIB -- 11.8 11.8 36 Other revenue -- 0.7 0.7 2 TOTAL -- 32.7 32.7 100 Maintenance costs for the Southwest line will be relatively small in the early years of operation but will grow as the system ages. Based on maintenance costs for the early years of the Hiawatha line (after adjusting for inflation and the length of the Southwest line), maintenance costs for the Southwest line
29
Guideway Status Report Minnesota Department of Transportation/Metropolitan Council January 2012
during the years 2018-2021 are expected to average approximately $900,000 per year. For more information about capital maintenance costs, see the capacity analysis portion of this report.
Other Project Information LEAD AGENCY Metropolitan Council (Metro Transit) PROJECT CONTACT Mark W. Fuhrmann Chris Weyer New Starts Rail Program Director Project Director, Southwest LRT Metropolitan Council Metropolitan Council Central Corridor Project Office Southwest Project Office 540 Fairview Ave. N., Suite 200 560 Sixth Ave. N. St. Paul, MN 55104 Minneapolis, MN 55411 651-602-1942 651-602-1932 [email protected] [email protected] MAP
30
Guideway Status Report Minnesota Department of Transportation/Metropolitan Council January 2012
Cedar Avenue BRT (Red Line)
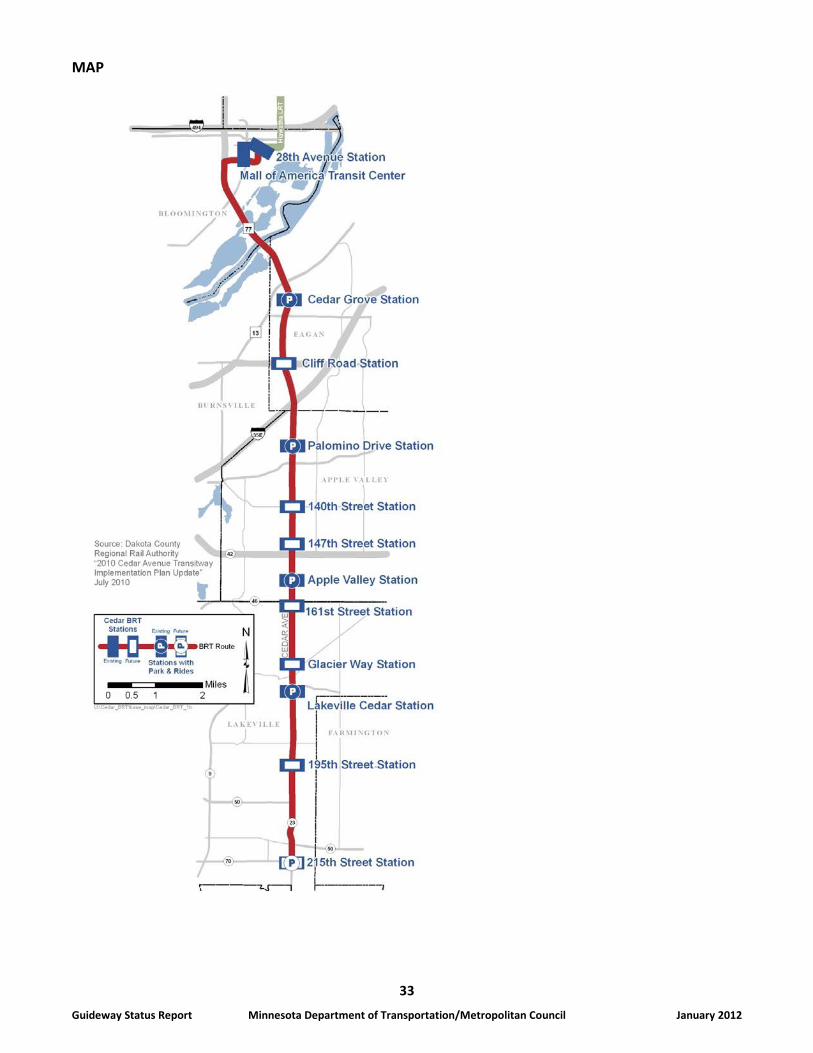
Corridor Description The Cedar Avenue Corridor extends 16 miles from the Mall of America in Bloomington to County Highway 10 in Lakeville, connecting Bloomington, Eagan, Apple Valley and Lakeville. The selected mode for the Cedar Avenue Corridor is bus-rapid transit (BRT) and it is designated as the Red Line in the regional system. Construction along the corridor is taking place in three stages. Stage I includes design and construction of bus shoulder lanes along Cedar Avenue from 138th to 181st streets. Stage I also includes construction of park-and-ride stations in Eagan, Apple Valley and Lakeville and construction of walk-up stations in Apple Valley. Stages II and III are planned to add park-and-ride facilities, additional stations and additional service capacity by 2020 and 2030, as warranted by ridership in the corridor. By 2030, the corridor is planned to have 13 BRT stations, with four or five park-and-ride facilities, and regional transit connections with the Hiawatha LRT line (Blue Line) and other bus service at the Mall of America. An Implementation Plan for the transitway was published in December 2010 and amended in June 2011. It provides high-level planning for development and operations for each stage. Current corridor express BRT service provides approximately 2,150 trips each weekday. Transitway express and station-to-station rides are projected at 5,750 average weekday trips in Stage I. Stages II and III are planned to increase average weekday trips to 9,000 by 2030.
Project Status and Timeline Stage I construction remains on schedule and under budget based on the Implementation Plan. The 2007 Urban Partnership Agreement (UPA) grants from the USDOT and associated local match from state and local sources advanced several Stage 1 components. The Apple Valley Transit Station park-and-ride facility was expanded, new park-and-ride facilities were constructed in Lakeville and Eagan and new buses were purchased for express service to the new facilities as part of the UPA project. Major bus shoulder construction began in April 2011 and is anticipated to be near 45 percent complete by the end of 2011. In 2012, bus shoulder construction will be completed, technology enhancements will be implemented and walk-up stations will be constructed in Apple Valley. Station-to-station service is expected to begin in late 2012.
31
Guideway Status Report Minnesota Department of Transportation/Metropolitan Council January 2012
Project Phase Date(s) UPA Investments 2008-2010 Stage I: Construction of park-and-rides 2009 through 2010 Stage I: Expansion of BRT express service 2009 through 2010 Stage I: Construction of shoulder lanes 2011 through Fall 2012 Stage I: Construction of walk up stations 2012 Stage I: Intelligent Transportation Systems installation at existing stations
2012
Stage I: Start BRT station-to-station service
Late 2012
Stage II 2013 through 2020 Stage III 2021 through 2030
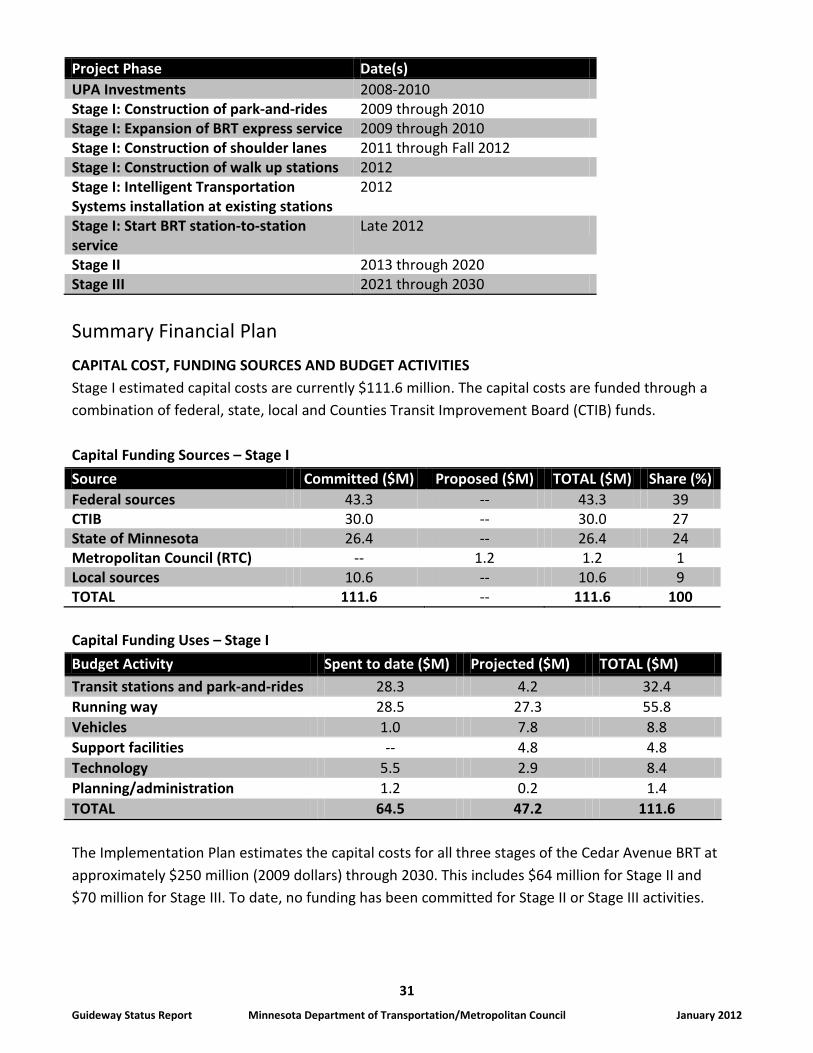
Summary Financial Plan CAPITAL COST, FUNDING SOURCES AND BUDGET ACTIVITIES Stage I estimated capital costs are currently $111.6 million. The capital costs are funded through a combination of federal, state, local and Counties Transit Improvement Board (CTIB) funds. Capital Funding Sources – Stage I Source Committed ($M) Proposed ($M) TOTAL ($M) Share (%) Federal sources 43.3 -- 43.3 39 CTIB 30.0 -- 30.0 27 State of Minnesota 26.4 -- 26.4 24 Metropolitan Council (RTC) -- 1.2 1.2 1 Local sources 10.6 -- 10.6 9 TOTAL 111.6 -- 111.6 100 Capital Funding Uses – Stage I Budget Activity Spent to date ($M) Projected ($M) TOTAL ($M) Transit stations and park-and-rides 28.3 4.2 32.4 Running way 28.5 27.3 55.8 Vehicles 1.0 7.8 8.8 Support facilities -- 4.8 4.8 Technology 5.5 2.9 8.4 Planning/administration 1.2 0.2 1.4 TOTAL 64.5 47.2 111.6 The Implementation Plan estimates the capital costs for all three stages of the Cedar Avenue BRT at approximately $250 million (2009 dollars) through 2030. This includes $64 million for Stage II and $70 million for Stage III. To date, no funding has been committed for Stage II or Stage III activities.
32
Guideway Status Report Minnesota Department of Transportation/Metropolitan Council January 2012
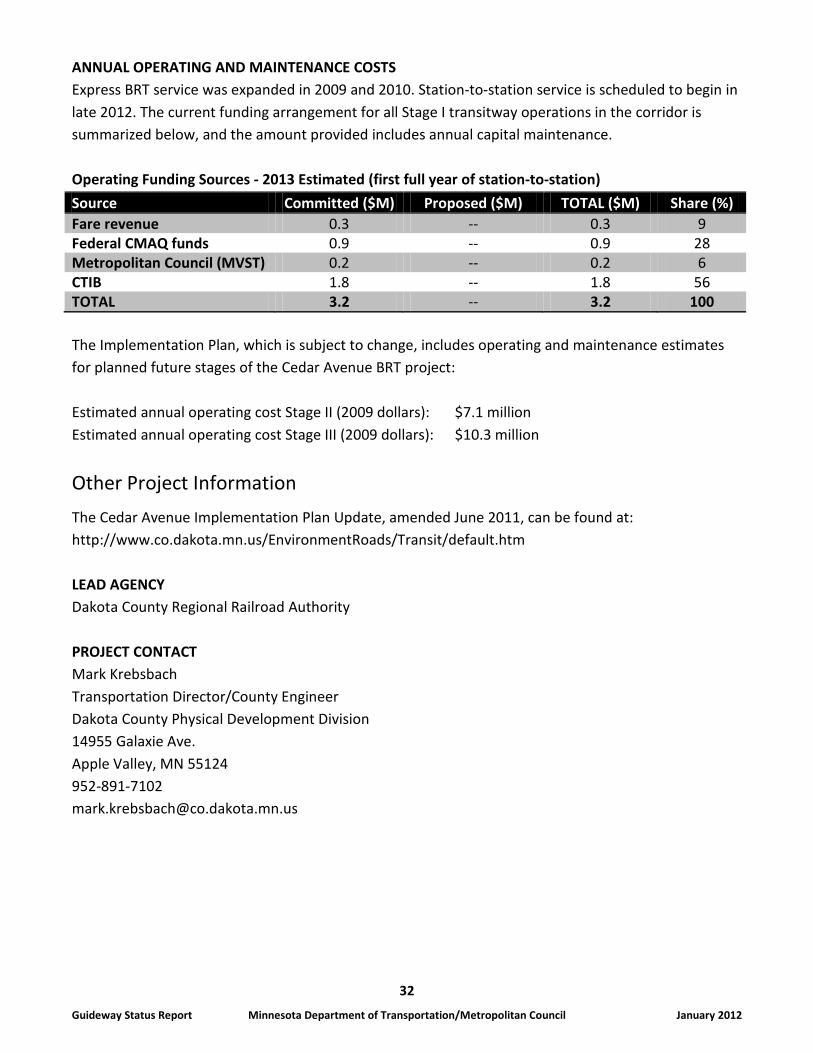
ANNUAL OPERATING AND MAINTENANCE COSTS Express BRT service was expanded in 2009 and 2010. Station-to-station service is scheduled to begin in late 2012. The current funding arrangement for all Stage I transitway operations in the corridor is summarized below, and the amount provided includes annual capital maintenance. Operating Funding Sources - 2013 Estimated (first full year of station-to-station) Source Committed ($M) Proposed ($M) TOTAL ($M) Share (%) Fare revenue 0.3 -- 0.3 9 Federal CMAQ funds 0.9 -- 0.9 28 Metropolitan Council (MVST) 0.2 -- 0.2 6 CTIB 1.8 -- 1.8 56 TOTAL 3.2 -- 3.2 100 The Implementation Plan, which is subject to change, includes operating and maintenance estimates for planned future stages of the Cedar Avenue BRT project: Estimated annual operating cost Stage II (2009 dollars): $7.1 million Estimated annual operating cost Stage III (2009 dollars): $10.3 million
Other Project Information The Cedar Avenue Implementation Plan Update, amended June 2011, can be found at: http://www.co.dakota.mn.us/EnvironmentRoads/Transit/default.htm LEAD AGENCY Dakota County Regional Railroad Authority PROJECT CONTACT Mark Krebsbach Transportation Director/County Engineer Dakota County Physical Development Division 14955 Galaxie Ave. Apple Valley, MN 55124 952-891-7102 [email protected]
33
Guideway Status Report Minnesota Department of Transportation/Metropolitan Council January 2012
MAP
34
Guideway Status Report Minnesota Department of Transportation/Metropolitan Council January 2012
I-35W South BRT (Orange Line)
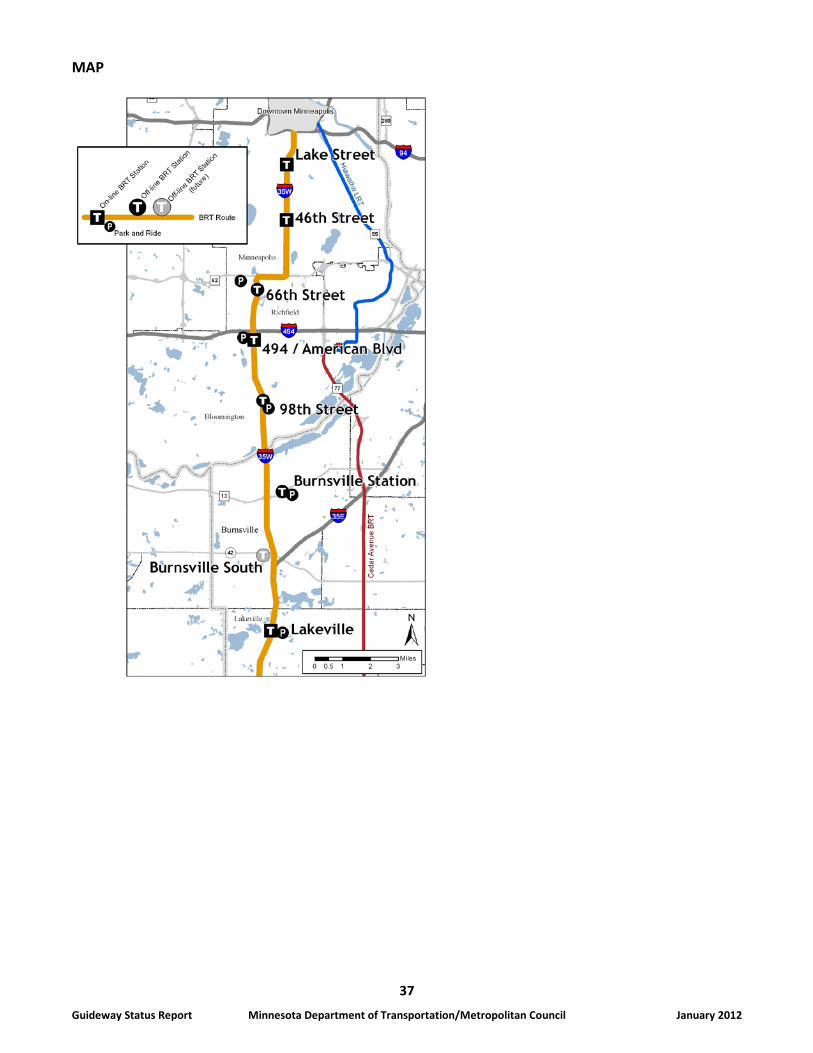
Corridor Description The I-35W South BRT (Orange Line) corridor will operate along 22 miles of Interstate 35W from downtown Minneapolis to Lakeville with a mix of express and station-to-station routes serving online and offline stations in Minneapolis, Richfield, Bloomington, Burnsville and Lakeville. Currently, the corridor is served by limited stop and express/commuter bus routes and one online station at I-35W and 46th Street. Additional highway and transit improvements are being made in the corridor to accommodate fast, frequent and reliable all-day transit service. All-day station-to-station service will begin after completion of a new online station at I-35W and Lake Street. Express and limited stop services in the corridor currently carry 12,000 daily rides. New station-to-station service is forecast to carry an additional 4,000 to 6,000 each weekday by 2030 and express ridership is expected to double by 2030. Updated ridership forecasts are currently being developed.
Project Status and Timeline The running way for I-35W South BRT has been developed through several MnDOT projects to install HOV lanes on I-35W between Burnsville and Minneapolis. These projects include the recently completed Crosstown Commons reconstruction which also reconfigured the roadway to make room for the I-35W and 46th Street Station. The costs of these roadway projects are not included in the overall cost of the I-35W South BRT project below. Several elements of the I-35W South BRT project were also advanced by 2007 Urban Partnership Agreement (UPA) grants from the USDOT and associated local match from state and local sources. The UPA funded conversion of HOV lanes to MnPASS HOT lanes, construction of the Kenrick park-and-ride in Lakeville, and purchase of buses for BRT express service. BRT express service is provided in the corridor with ridership continuing to grow. Startup of Phase 1 BRT station-to-station service has been delayed from 2012 until at least 2016. It is no longer feasible to use the existing station at Lake Street for BRT station-to-station service. Phase 1 of the I-35W South BRT project will include all-day station-to-station service and will start concurrently with the opening of a planned new I-35W and Lake Street station. Other station improvements, including a new online station at American Boulevard, may be completed in the same period. Phase 2, including additional stations in Burnsville and Lakeville, is expected to occur in 2020 or later.
35
Guideway Status Report Minnesota Department of Transportation/Metropolitan Council January 2012
Project Phase Date(s) UPA/managed lane construction 2008-2010 BRT Express service to Lakeville September 2009 I-35W and 46th Street Station and UPA/managed lane opening
December 2010
Additional station (Lake Street) planning and construction
2012-2016
Phase 1 station-to-station service 2016
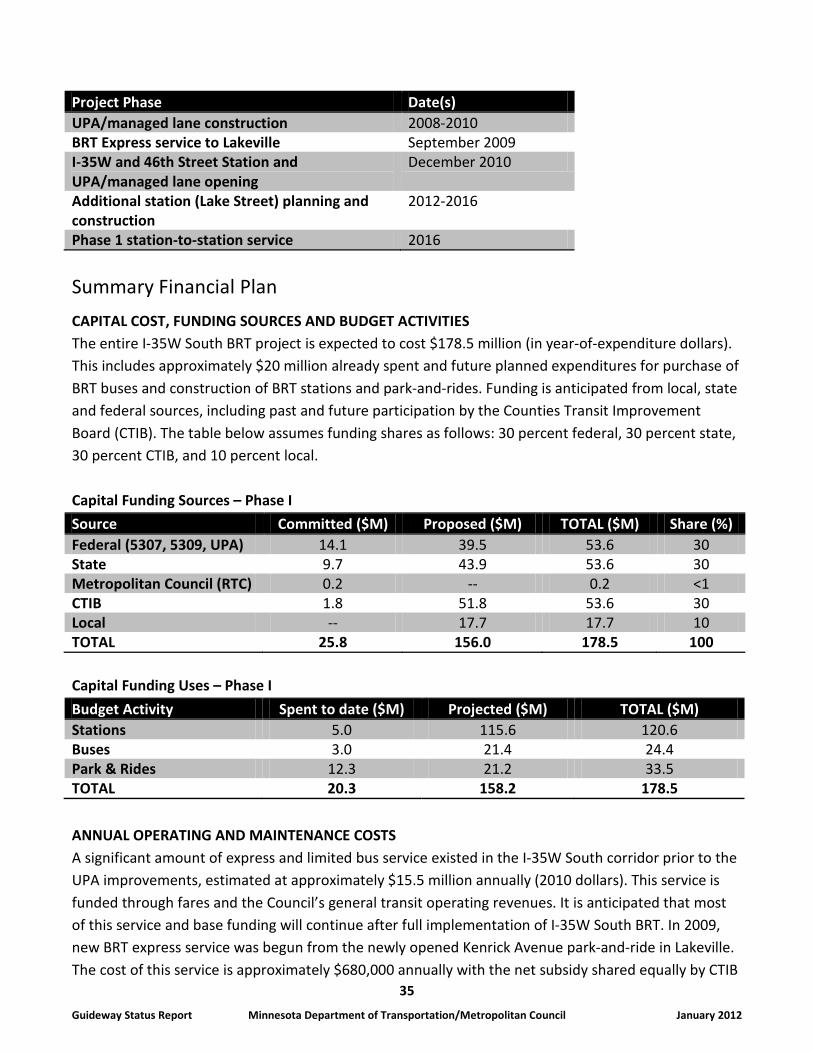
Summary Financial Plan CAPITAL COST, FUNDING SOURCES AND BUDGET ACTIVITIES The entire I-35W South BRT project is expected to cost $178.5 million (in year-of-expenditure dollars). This includes approximately $20 million already spent and future planned expenditures for purchase of BRT buses and construction of BRT stations and park-and-rides. Funding is anticipated from local, state and federal sources, including past and future participation by the Counties Transit Improvement Board (CTIB). The table below assumes funding shares as follows: 30 percent federal, 30 percent state, 30 percent CTIB, and 10 percent local. Capital Funding Sources – Phase I Source Committed ($M) Proposed ($M) TOTAL ($M) Share (%) Federal (5307, 5309, UPA) 14.1 39.5 53.6 30 State 9.7 43.9 53.6 30 Metropolitan Council (RTC) 0.2 -- 0.2 <1 CTIB 1.8 51.8 53.6 30 Local -- 17.7 17.7 10 TOTAL 25.8 156.0 178.5 100 Capital Funding Uses – Phase I Budget Activity Spent to date ($M) Projected ($M) TOTAL ($M) Stations 5.0 115.6 120.6 Buses 3.0 21.4 24.4 Park & Rides 12.3 21.2 33.5 TOTAL 20.3 158.2 178.5 ANNUAL OPERATING AND MAINTENANCE COSTS A significant amount of express and limited bus service existed in the I-35W South corridor prior to the UPA improvements, estimated at approximately $15.5 million annually (2010 dollars). This service is funded through fares and the Council’s general transit operating revenues. It is anticipated that most of this service and base funding will continue after full implementation of I-35W South BRT. In 2009, new BRT express service was begun from the newly opened Kenrick Avenue park-and-ride in Lakeville. The cost of this service is approximately $680,000 annually with the net subsidy shared equally by CTIB
36
Guideway Status Report Minnesota Department of Transportation/Metropolitan Council January 2012
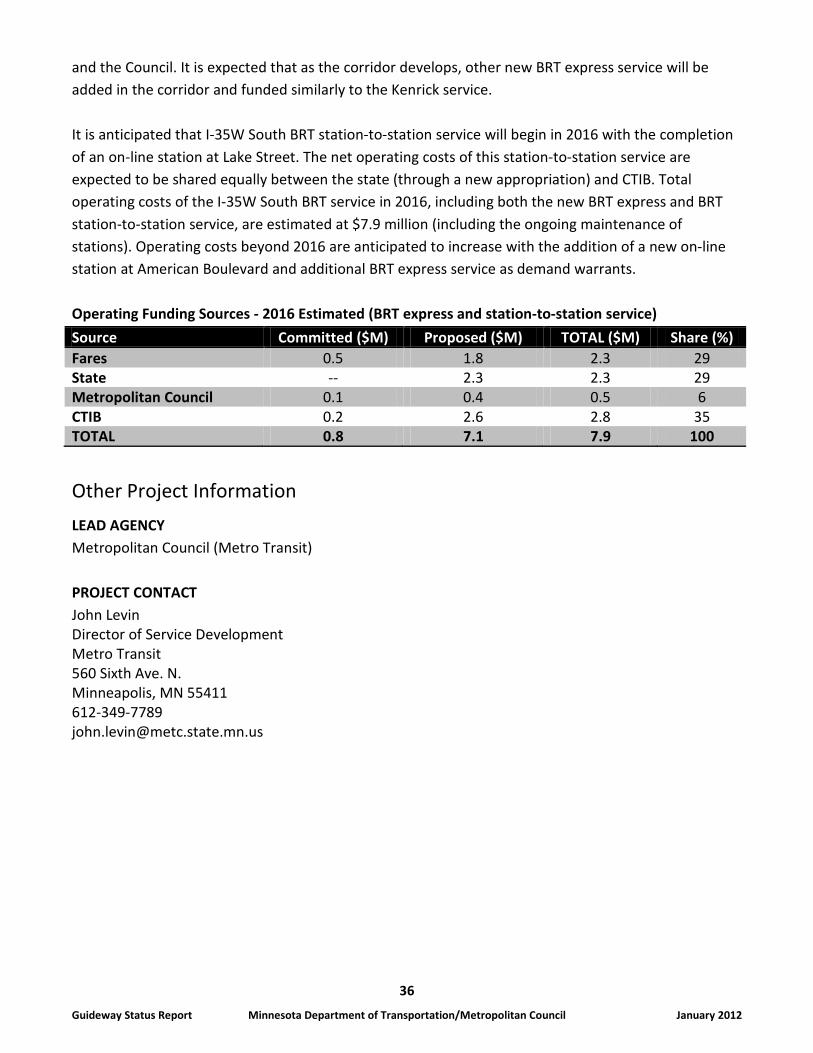
and the Council. It is expected that as the corridor develops, other new BRT express service will be added in the corridor and funded similarly to the Kenrick service. It is anticipated that I-35W South BRT station-to-station service will begin in 2016 with the completion of an on-line station at Lake Street. The net operating costs of this station-to-station service are expected to be shared equally between the state (through a new appropriation) and CTIB. Total operating costs of the I-35W South BRT service in 2016, including both the new BRT express and BRT station-to-station service, are estimated at $7.9 million (including the ongoing maintenance of stations). Operating costs beyond 2016 are anticipated to increase with the addition of a new on-line station at American Boulevard and additional BRT express service as demand warrants. Operating Funding Sources - 2016 Estimated (BRT express and station-to-station service) Source Committed ($M) Proposed ($M) TOTAL ($M) Share (%) Fares 0.5 1.8 2.3 29 State -- 2.3 2.3 29 Metropolitan Council 0.1 0.4 0.5 6 CTIB 0.2 2.6 2.8 35 TOTAL 0.8 7.1 7.9 100
Other Project Information LEAD AGENCY Metropolitan Council (Metro Transit) PROJECT CONTACT John Levin Director of Service Development Metro Transit 560 Sixth Ave. N. Minneapolis, MN 55411 612-349-7789 [email protected]
37
Guideway Status Report Minnesota Department of Transportation/Metropolitan Council January 2012
MAP
38
Guideway Status Report Minnesota Department of Transportation/Metropolitan Council January 2012
Bottineau Transitway
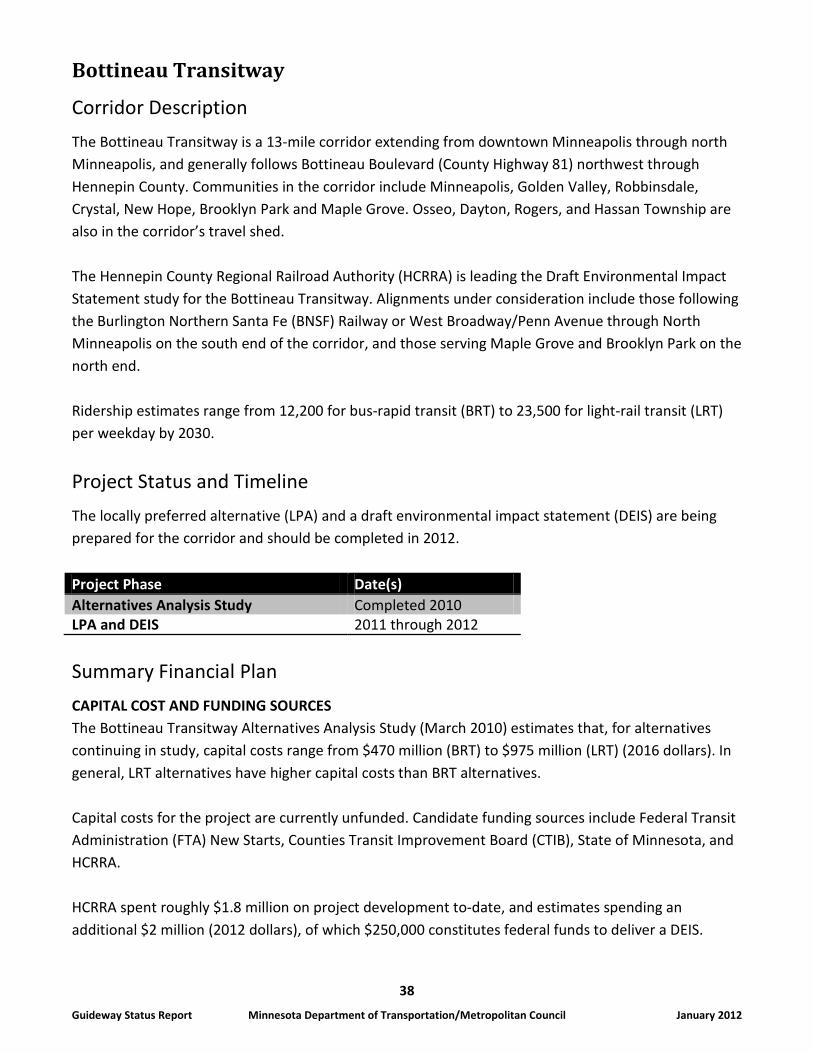
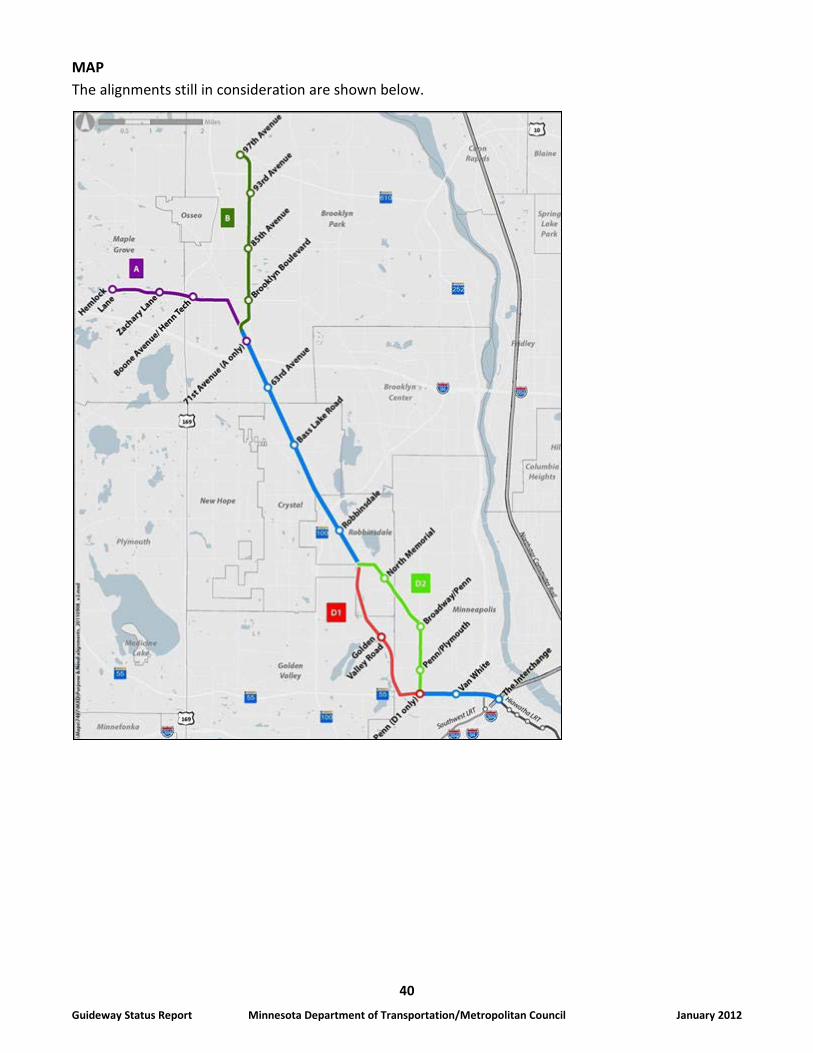
Corridor Description The Bottineau Transitway is a 13-mile corridor extending from downtown Minneapolis through north Minneapolis, and generally follows Bottineau Boulevard (County Highway 81) northwest through Hennepin County. Communities in the corridor include Minneapolis, Golden Valley, Robbinsdale, Crystal, New Hope, Brooklyn Park and Maple Grove. Osseo, Dayton, Rogers, and Hassan Township are also in the corridor’s travel shed. The Hennepin County Regional Railroad Authority (HCRRA) is leading the Draft Environmental Impact Statement study for the Bottineau Transitway. Alignments under consideration include those following the Burlington Northern Santa Fe (BNSF) Railway or West Broadway/Penn Avenue through North Minneapolis on the south end of the corridor, and those serving Maple Grove and Brooklyn Park on the north end. Ridership estimates range from 12,200 for bus-rapid transit (BRT) to 23,500 for light-rail transit (LRT) per weekday by 2030.
Project Status and Timeline The locally preferred alternative (LPA) and a draft environmental impact statement (DEIS) are being prepared for the corridor and should be completed in 2012. Project Phase Date(s) Alternatives Analysis Study Completed 2010 LPA and DEIS 2011 through 2012
Summary Financial Plan CAPITAL COST AND FUNDING SOURCES The Bottineau Transitway Alternatives Analysis Study (March 2010) estimates that, for alternatives continuing in study, capital costs range from $470 million (BRT) to $975 million (LRT) (2016 dollars). In general, LRT alternatives have higher capital costs than BRT alternatives. Capital costs for the project are currently unfunded. Candidate funding sources include Federal Transit Administration (FTA) New Starts, Counties Transit Improvement Board (CTIB), State of Minnesota, and HCRRA. HCRRA spent roughly $1.8 million on project development to-date, and estimates spending an additional $2 million (2012 dollars), of which $250,000 constitutes federal funds to deliver a DEIS.
39
Guideway Status Report Minnesota Department of Transportation/Metropolitan Council January 2012
ANNUAL OPERATING AND MAINTENANCE COSTS The Alternatives Analysis Study reports operating and maintenance cost estimates ranging from $20 million (BRT) to $29 million (LRT) per year (2009 dollars). In general, LRT alternatives have higher annual operating cost estimates than BRT alternatives. Estimates of fare revenue and subsidies have not yet been developed. Operating and maintenance costs are currently unfunded and potential funding partners have not been identified.
Other Project Information LEAD AGENCY Hennepin County Regional Railroad Authority PROJECT CONTACT Joseph Gladke Manager, Division of Engineering and Transit Planning Hennepin County 701 Fourth Ave. S., Suite 400 Minneapolis, MN 55415 612-348-2134 [email protected]
40
Guideway Status Report Minnesota Department of Transportation/Metropolitan Council January 2012
MAP The alignments still in consideration are shown below.
41
Guideway Status Report Minnesota Department of Transportation/Metropolitan Council January 2012
Gateway Corridor
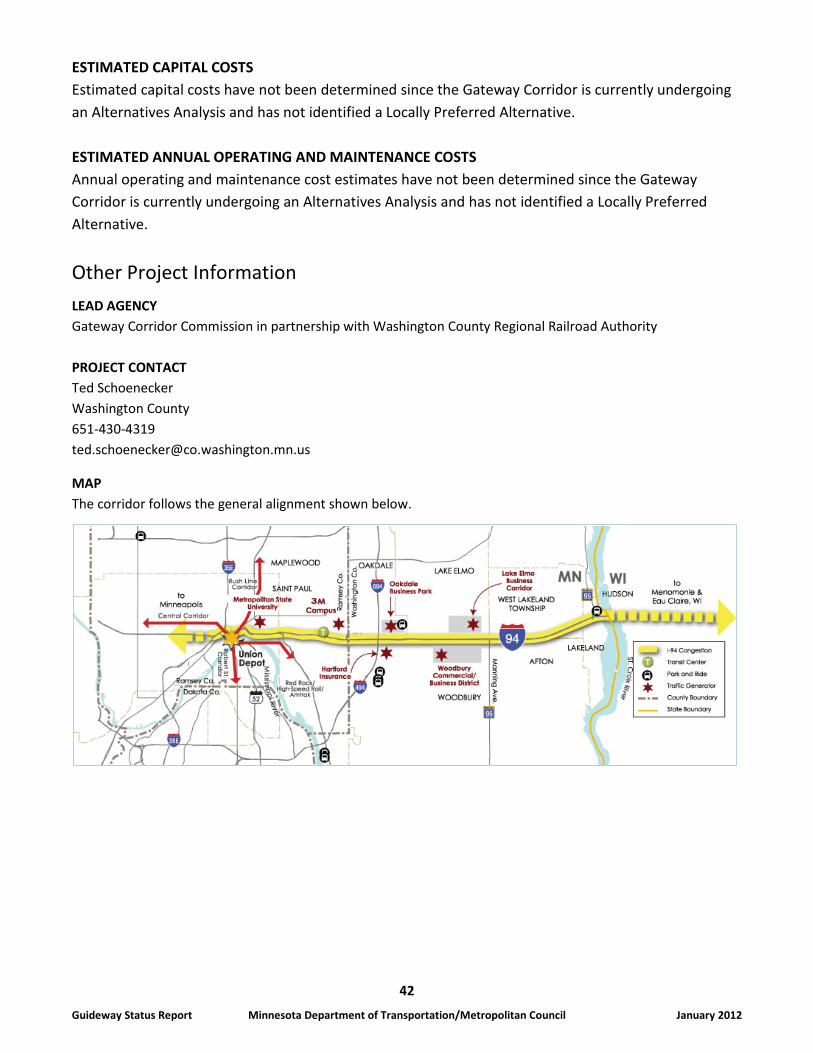
Corridor Description The Gateway Corridor generally follows Interstate 94 from Minneapolis/St. Paul through the eastern Twin Cities suburbs to western Wisconsin. The corridor is a vital transportation connection between urban, suburban and rural communities – both for businesses and residents – and provides a link to some of the region’s largest employers, as well as the major employment centers in the downtown areas. Today, more than 300,000 people live along the corridor and more than 90,000 vehicles cross the St. Croix River Bridge each day. By downtown St. Paul, the number of commuters reaches 150,000. These current traffic levels exceed the interstate’s capacity along several segments. By 2030, the corridor’s population is expected to grow by nearly 30 percent with more than 30,000 new jobs. Transit ridership forecasts are not available at this time, but the corridor is currently undergoing an Alternatives Analysis to determine transit mode, alignment, ridership, and costs.
Project Status and Timeline An alternatives analysis (AA) is being performed on the Gateway Corridor and is anticipated to be completed in spring 2012. The AA is studying transit alternatives in the corridor from Minneapolis, through St. Paul to Eau Claire, Wis. The study is examining ridership, capital and operating cost estimates, potential transit modes and alignments with the final goal of recommending the Locally Preferred Alternative. The corridor will then begin the next phase of analysis, the draft environmental impact statement (DEIS), in 2012.
Milestone Date(s) Corridor Commission created 2009 Alternatives analysis August 2010 – spring 2012 Draft environmental impact statement (DEIS) Beginning fall 2012
Summary Financial Plan FUNDING SOURCES The alternatives analysis will cost $1.5 million and is funded from the following sources. Source Amount Federal sources $250,000 Washington County Regional Railroad Authority
$550,000
Ramsey County Regional Railroad Authority $500,000 Metropolitan Council $200,000 TOTAL $1.5 million
42
Guideway Status Report Minnesota Department of Transportation/Metropolitan Council January 2012
ESTIMATED CAPITAL COSTS Estimated capital costs have not been determined since the Gateway Corridor is currently undergoing an Alternatives Analysis and has not identified a Locally Preferred Alternative. ESTIMATED ANNUAL OPERATING AND MAINTENANCE COSTS Annual operating and maintenance cost estimates have not been determined since the Gateway Corridor is currently undergoing an Alternatives Analysis and has not identified a Locally Preferred Alternative.
Other Project Information LEAD AGENCY Gateway Corridor Commission in partnership with Washington County Regional Railroad Authority PROJECT CONTACT Ted Schoenecker Washington County 651-430-4319 [email protected]
MAP The corridor follows the general alignment shown below.
43
Guideway Status Report Minnesota Department of Transportation/Metropolitan Council January 2012
I-35W North
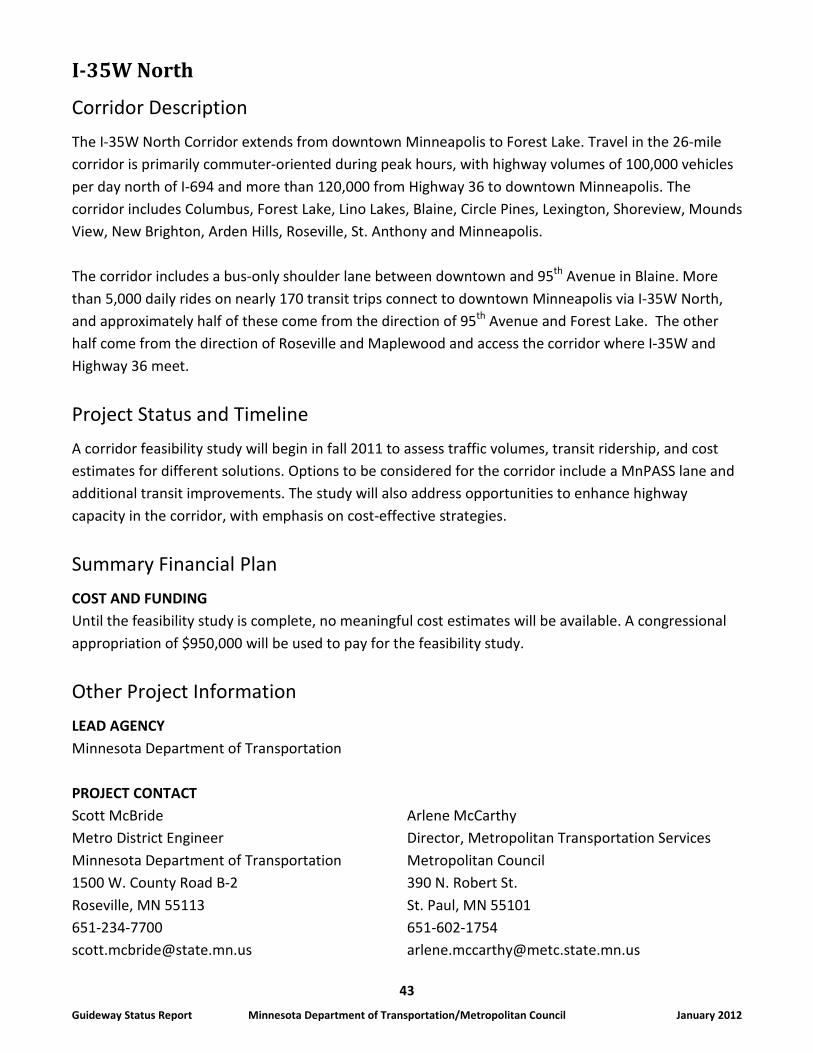
Corridor Description The I-35W North Corridor extends from downtown Minneapolis to Forest Lake. Travel in the 26-mile corridor is primarily commuter-oriented during peak hours, with highway volumes of 100,000 vehicles per day north of I-694 and more than 120,000 from Highway 36 to downtown Minneapolis. The corridor includes Columbus, Forest Lake, Lino Lakes, Blaine, Circle Pines, Lexington, Shoreview, Mounds View, New Brighton, Arden Hills, Roseville, St. Anthony and Minneapolis. The corridor includes a bus-only shoulder lane between downtown and 95th Avenue in Blaine. More than 5,000 daily rides on nearly 170 transit trips connect to downtown Minneapolis via I-35W North, and approximately half of these come from the direction of 95th Avenue and Forest Lake. The other half come from the direction of Roseville and Maplewood and access the corridor where I-35W and Highway 36 meet.
Project Status and Timeline
A corridor feasibility study will begin in fall 2011 to assess traffic volumes, transit ridership, and cost estimates for different solutions. Options to be considered for the corridor include a MnPASS lane and additional transit improvements. The study will also address opportunities to enhance highway capacity in the corridor, with emphasis on cost-effective strategies.
Summary Financial Plan COST AND FUNDING Until the feasibility study is complete, no meaningful cost estimates will be available. A congressional appropriation of $950,000 will be used to pay for the feasibility study.
Other Project Information LEAD AGENCY Minnesota Department of Transportation PROJECT CONTACT Scott McBride Arlene McCarthy Metro District Engineer Director, Metropolitan Transportation Services Minnesota Department of Transportation Metropolitan Council 1500 W. County Road B-2 390 N. Robert St. Roseville, MN 55113 St. Paul, MN 55101 651-234-7700 651-602-1754 [email protected] [email protected]
44
Guideway Status Report Minnesota Department of Transportation/Metropolitan Council January 2012
MAP
45
Guideway Status Report Minnesota Department of Transportation/Metropolitan Council January 2012
Midtown Corridor
Corridor Description The Midtown Corridor travels 4.4 miles through the heart of south Minneapolis along the Lake Street and Midtown Greenway alignments. The corridor features dense residential neighborhoods, a thriving commercial district, several major employers and multiple connections to the regional transit network. While the corridor is currently served by high frequency local and limited-stop bus routes, traffic congestion and high ridership make transit service very slow. An alternatives analysis (AA) in 2012-2013 will explore a broad range of options for transit improvements in the corridor including streetcar and bus rapid transit (BRT) on Lake Street, and streetcar, light rail and dedicated busway along the Midtown Greenway. The implementation of improved transit service, combined with associated improvements in customer facilities and vehicles, will increase the speed and attractiveness of transit service in the Midtown Corridor.
Project Status and Timeline The AA will begin in 2012 and be completed in 2013. Once it is completed, environmental analysis, engineering, design and construction will proceed with a goal of starting revenue operations before or concurrent with the start of revenue operations of the Southwest LRT line in 2018.
Summary Financial Plan CAPITAL COST, FUNDING SOURCES AND BUDGET ACTIVITIES Funding for the AA, totaling $750,000, has been secured through a federal grant and regional transit capital funding. The AA will determine capital costs for development of the transitway. Before the AA begins, preliminary studies are being undertaken to address specific technical issues in the corridor. The total cost of these pre-AA studies is anticipated to be $85,000 and will be funded through regional transit capital. Source Committed ($M) Proposed ($M) TOTAL ($M) FTA 5339 0.6 -- 0.6 RTC 0.2 -- 0.2 TOTAL 0.8 -- 0.8
Budget Activity Spent to date ($M) Projected ($M) TOTAL ($M) Pre-AA studies -- 0.1 0.1 Alternatives analysis -- 0.7 0.7 TOTAL -- 0.8 0.8 ANNUAL OPERATING AND MAINTENANCE COSTS Annual operating and maintenance costs will be determined as part of the AA process in 2012.
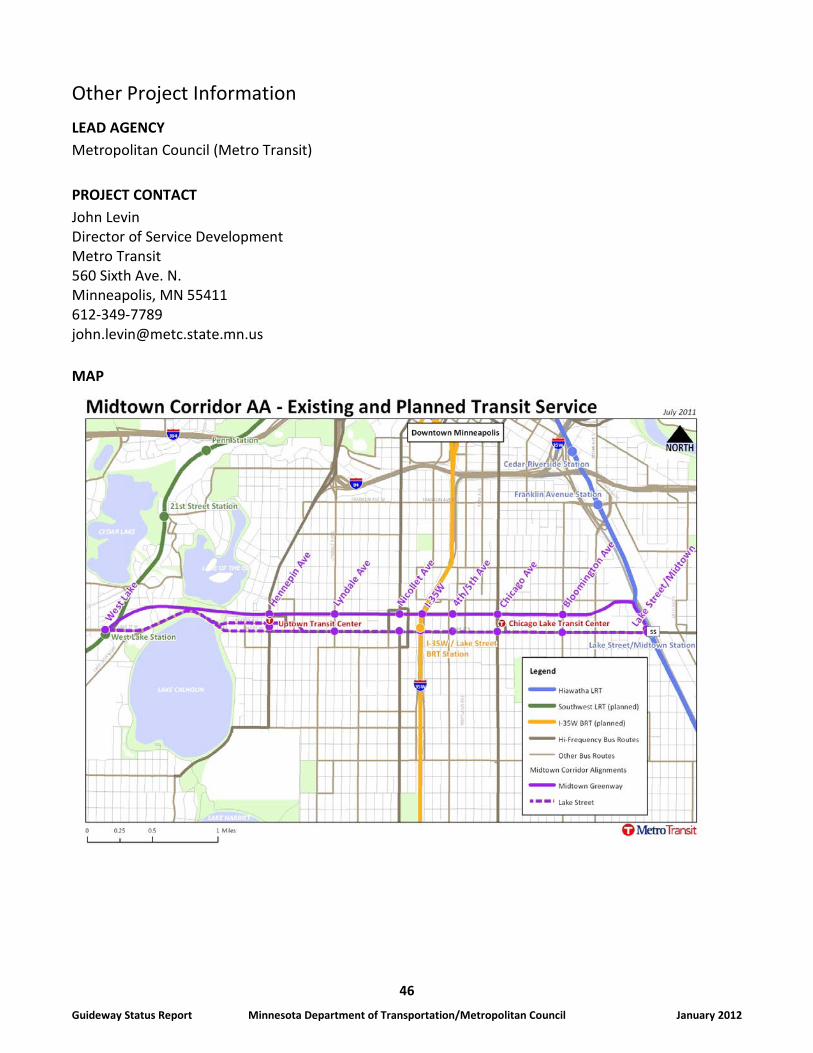
46
Guideway Status Report Minnesota Department of Transportation/Metropolitan Council January 2012
Other Project Information LEAD AGENCY Metropolitan Council (Metro Transit) PROJECT CONTACT John Levin Director of Service Development Metro Transit 560 Sixth Ave. N. Minneapolis, MN 55411 612-349-7789 [email protected] MAP
47
Guideway Status Report Minnesota Department of Transportation/Metropolitan Council January 2012
Nicollet-Central Urban Circulator
Corridor Description The Nicollet-Central Corridor is 9 miles long and is generally located on Nicollet Avenue South and Central Avenue NE between the existing I-35W and 46th Street BRT station in south Minneapolis and the existing transit center in downtown Columbia Heights. In downtown Minneapolis, the corridor runs through the central business district on Nicollet Mall and over the Mississippi River on Hennepin Avenue. Transit modes likely to be considered for the corridor include streetcar and enhanced bus service. The Minneapolis Streetcar Feasibility Study estimated ridership for the streetcar alternative at 15,000-19,000 weekday riders for the 9-mile corridor. New ridership estimates for streetcar and other modes will be developed during alternatives analysis (AA).
Project Status and Timeline In 2012, an AA evaluating various transit modes, including streetcar and enhanced bus, will be initiated. The AA will result in selection of a Locally Preferred Alternative including mode, minimum operating segment (which will likely be shorter than the full 9-mile corridor) and possible future extensions. A significant amount of transit planning has already been completed for the Nicollet-Central Urban Circulator. The Access Minneapolis Transportation Action Plan, the Minneapolis Streetcar Feasibility Study and the Minneapolis Streetcar Funding Study completed in 2006-2010 identified the Nicollet and Central Avenue corridors as an important part of the Minneapolis Primary Transit Network and as a high-priority streetcar corridor. The corridor is also being considered for bus rapid transit under the Arterial Transitway Corridor Study and was considered, but not recommended, for an LRT alignment alternative for the Southwest Transitway project. Project Phase Date(s) Corridor-related transit studies 2005-2012 Urban circulator alternatives analysis 2012-2013
Summary Financial Plan CAPITAL COST, FUNDING SOURCES AND BUDGET ACTIVITIES The Alternatives Analysis will be funded by a $900,000 Federal Transit Administration Alternatives Analysis program grant and $300,000 in city of Minneapolis funds. The Minneapolis Streetcar Feasibility Study estimated the total capital costs for the streetcar alternative at approximately $300 million in 2007 dollars for the 9-mile corridor. New estimates and an
48
Guideway Status Report Minnesota Department of Transportation/Metropolitan Council January 2012
anticipated shorter, less costly minimum operating segment for the streetcar alternative will be developed in 2012. ANNUAL OPERATING AND MAINTENANCE COSTS The Minneapolis Streetcar Feasibility Study estimated the annual operating and maintenance costs for the 9-mile streetcar alternative at approximately $14 million in 2005 dollars. New estimates and an anticipated shorter minimum operating segment for the streetcar alternative will be developed in 2012.
Other Project Information LEAD AGENCY City of Minneapolis www.minneapolismn.gov/nicollet-central PROJECT CONTACT Steve Kotke Director/City Engineer City of Minneapolis Department of Public Works 350 S. Fifth St. - Room 203 Minneapolis, MN 55415 612-673-2443 [email protected]
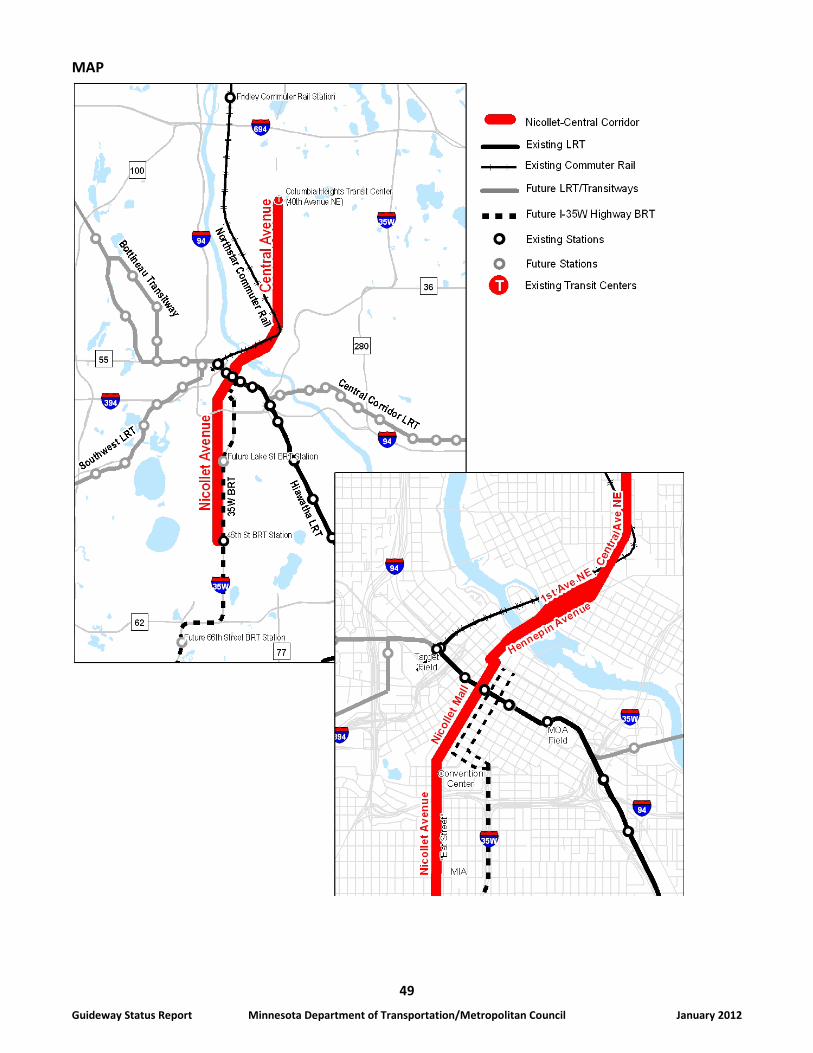
49
Guideway Status Report Minnesota Department of Transportation/Metropolitan Council January 2012
MAP
50
Guideway Status Report Minnesota Department of Transportation/Metropolitan Council January 2012
Red Rock Corridor
Corridor Description The Red Rock Corridor is a 30-mile commuter corridor connecting Hastings, downtown St. Paul and downtown Minneapolis with an alignment generally following or parallel to U.S. Highway 61 and Interstate 94. The corridor runs through Cottage Grove, Denmark Township, Hastings, Newport, St. Paul Park, St. Paul and Minneapolis. As a potential commuter rail corridor, it would utilize the BNSF Railway and Canadian Pacific (CP) mainlines terminating at the Union Depot, where riders could connect with the Central Corridor LRT (Green Line). Long-term plans include a secondary phase connecting the line to downtown Minneapolis. The corridor would also be shared with existing Amtrak passenger trains, BNSF and CP freight trains and the preferred alignment for high-speed rail service to Chicago. An alternatives analysis study (AA Study) completed in 2007 estimated ridership in the range of 900 to 3,200 riders per weekday, depending on the transit mode.
Project Status and Timeline The AA study also indicated that expanding bus service, increasing bus frequency and providing additional park-and-ride facilities are the first steps towards building a stronger transit base in the corridor. Building a stronger transit base is the key component in the phasing of corridor improvements prior to potentially investing in commuter rail. The Commuter Bus Feasibility Study completed in 2009 outlined a preferred service development plan. Station area and site master plans for four proposed stations were completed in 2011. Station area master plans will be utilized in the development of stations that can serve express bus service in the short term and potentially transition to commuter rail in the long term once ridership grows to a supportable level. Engineering and design for a Newport transit station is scheduled to begin in early 2012. A Locally Preferred Alternative (LPA) has not yet been selected for this corridor or included in the region’s Transportation Policy Plan (TPP). Interim capital improvements which benefit commuters and bus services are being made, including construction of the Hastings park-and-pool and Newport park-and-ride. Included below is a summary of actual and anticipated project milestones.
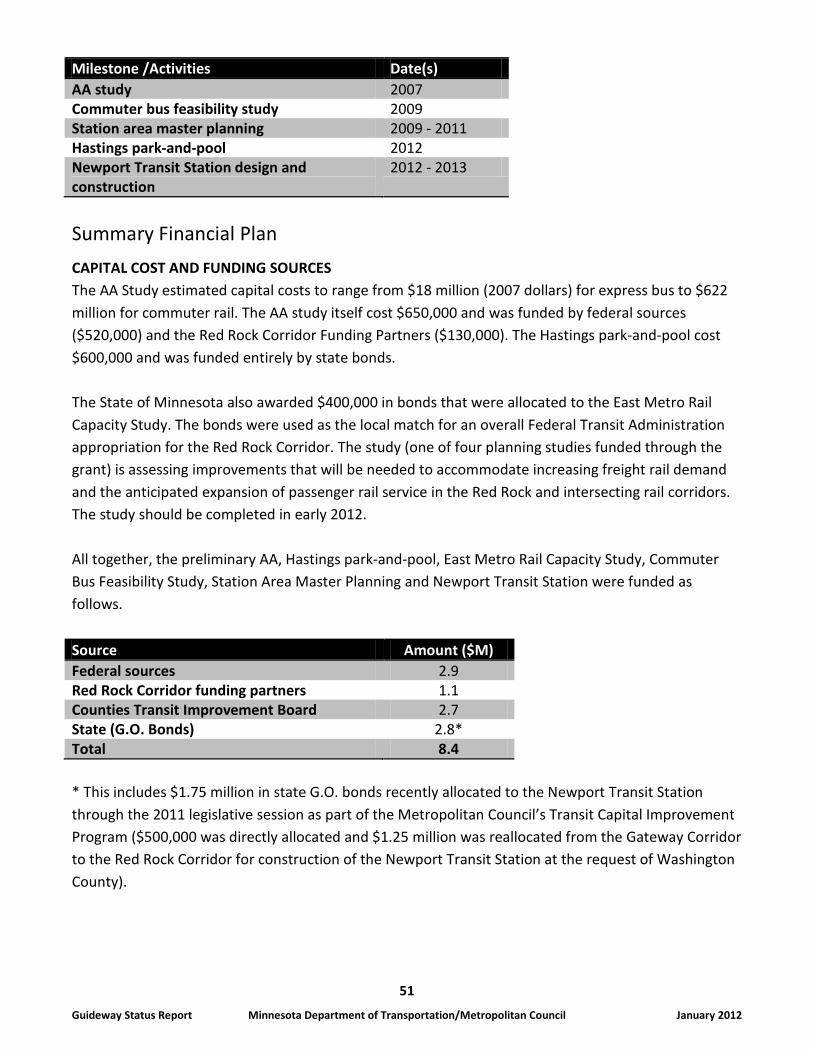
51
Guideway Status Report Minnesota Department of Transportation/Metropolitan Council January 2012
Milestone /Activities Date(s) AA study 2007 Commuter bus feasibility study 2009 Station area master planning 2009 - 2011 Hastings park-and-pool 2012 Newport Transit Station design and construction
2012 - 2013
Summary Financial Plan CAPITAL COST AND FUNDING SOURCES The AA Study estimated capital costs to range from $18 million (2007 dollars) for express bus to $622 million for commuter rail. The AA study itself cost $650,000 and was funded by federal sources ($520,000) and the Red Rock Corridor Funding Partners ($130,000). The Hastings park-and-pool cost $600,000 and was funded entirely by state bonds. The State of Minnesota also awarded $400,000 in bonds that were allocated to the East Metro Rail Capacity Study. The bonds were used as the local match for an overall Federal Transit Administration appropriation for the Red Rock Corridor. The study (one of four planning studies funded through the grant) is assessing improvements that will be needed to accommodate increasing freight rail demand and the anticipated expansion of passenger rail service in the Red Rock and intersecting rail corridors. The study should be completed in early 2012. All together, the preliminary AA, Hastings park-and-pool, East Metro Rail Capacity Study, Commuter Bus Feasibility Study, Station Area Master Planning and Newport Transit Station were funded as follows. Source Amount ($M) Federal sources 2.9 Red Rock Corridor funding partners 1.1 Counties Transit Improvement Board 2.7 State (G.O. Bonds) 2.8* Total 8.4 * This includes $1.75 million in state G.O. bonds recently allocated to the Newport Transit Station through the 2011 legislative session as part of the Metropolitan Council’s Transit Capital Improvement Program ($500,000 was directly allocated and $1.25 million was reallocated from the Gateway Corridor to the Red Rock Corridor for construction of the Newport Transit Station at the request of Washington County).
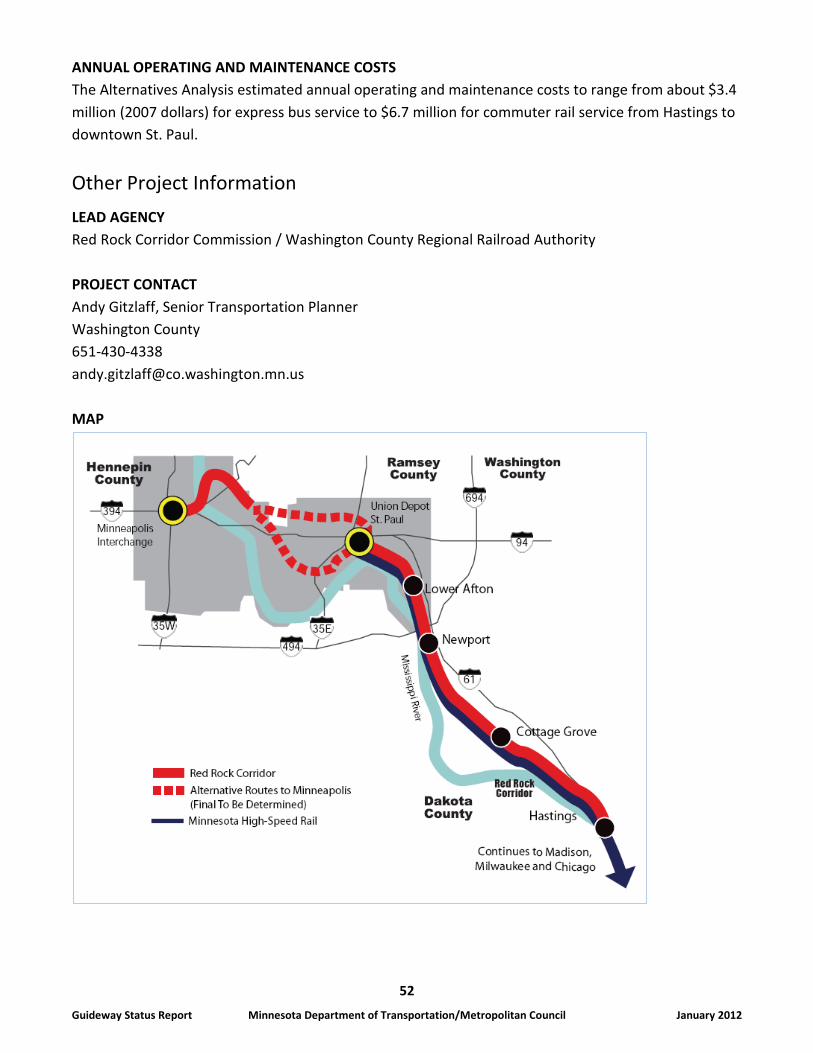
52
Guideway Status Report Minnesota Department of Transportation/Metropolitan Council January 2012
ANNUAL OPERATING AND MAINTENANCE COSTS The Alternatives Analysis estimated annual operating and maintenance costs to range from about $3.4 million (2007 dollars) for express bus service to $6.7 million for commuter rail service from Hastings to downtown St. Paul.
Other Project Information LEAD AGENCY Red Rock Corridor Commission / Washington County Regional Railroad Authority PROJECT CONTACT Andy Gitzlaff, Senior Transportation Planner Washington County 651-430-4338 [email protected] MAP
53
Guideway Status Report Minnesota Department of Transportation/Metropolitan Council January 2012
Robert Street Corridor
Corridor Description The Robert Street Transitway, as defined by the 2030 Transportation Policy Plan, extends from downtown St. Paul to West St. Paul, generally along the alignment of Robert Street. However, the transitway study area includes the area bounded on the north by downtown St. Paul/I-94, the Mississippi River to the east, I-35E to the west and County Road 42 to the south. The transitway study area includes St. Paul, West St. Paul, South St. Paul, Sunfish Lake, Mendota, Lilydale, Mendota Heights, Inver Grove Heights, Eagan, and Rosemount. The Dakota County Regional Railroad Authority (DCRRA) completed a transit feasibility study in November 2008. The next step for the transitway is to undergo a formal alternatives analysis (AA), anticipated to commence in January 2012. This process will narrow the preferred options and identify preferred improvements for transit development in the corridor. The AA Study is being funded by DCRRA, the Ramsey County Regional Railroad Authority (RCRRA) and the Federal Transit Administration (FTA). Ridership forecasts for the transitway from the 2008 feasibility study range between 2,500 and 5,800 weekday riders, depending on mode, for planning year 2030.
Project Status and Timeline The Robert Street Corridor Transit Feasibility Study was completed in November 2008. The DCRRA was awarded an FTA grant of $1.18 million in 2011 to conduct an AA for the corridor. It is anticipated that the AA will commence in January 2012 and proceed for 18-24 months. Upon completion of the AA, a detailed project timeline will be developed for implementation of the preferred improvements. Project Phase Date(s) Feasibility study 2006-2008 Alternatives analysis 2012-2013
Summary Financial Plan CAPITAL COST, FUNDING SOURCES, AND BUDGET ACTIVITIES The transit feasibility study was funded through $500,000 from the state. The AA study is being funded by the DCRRA ($147,500), the RCRRA ($147,500) and the FTA ($1.18 million). ANNUAL OPERATING AND MAINTENANCE COSTS Operating and maintenance costs depend on potential transit routes and alignments in the transitway, as determined by the AA. Estimated annual operating costs for modes identified in the Transit Feasibility Study range from $10 million to $23 million (in 2007 dollars). Potential funding sources include the Counties Transit Improvement Board and Metropolitan Council transit operating funds.
54
Guideway Status Report Minnesota Department of Transportation/Metropolitan Council January 2012
Other Project Information LEAD AGENCY Dakota County Regional Railroad Authority Partnering agency: Ramsey County Regional Railroad Authority PROJECT CONTACT Mark Krebsbach Transportation Director/County Engineer Dakota County Physical Development Division 14955 Galaxie Ave. Apple Valley, MN 55124 952-891-7102 [email protected]
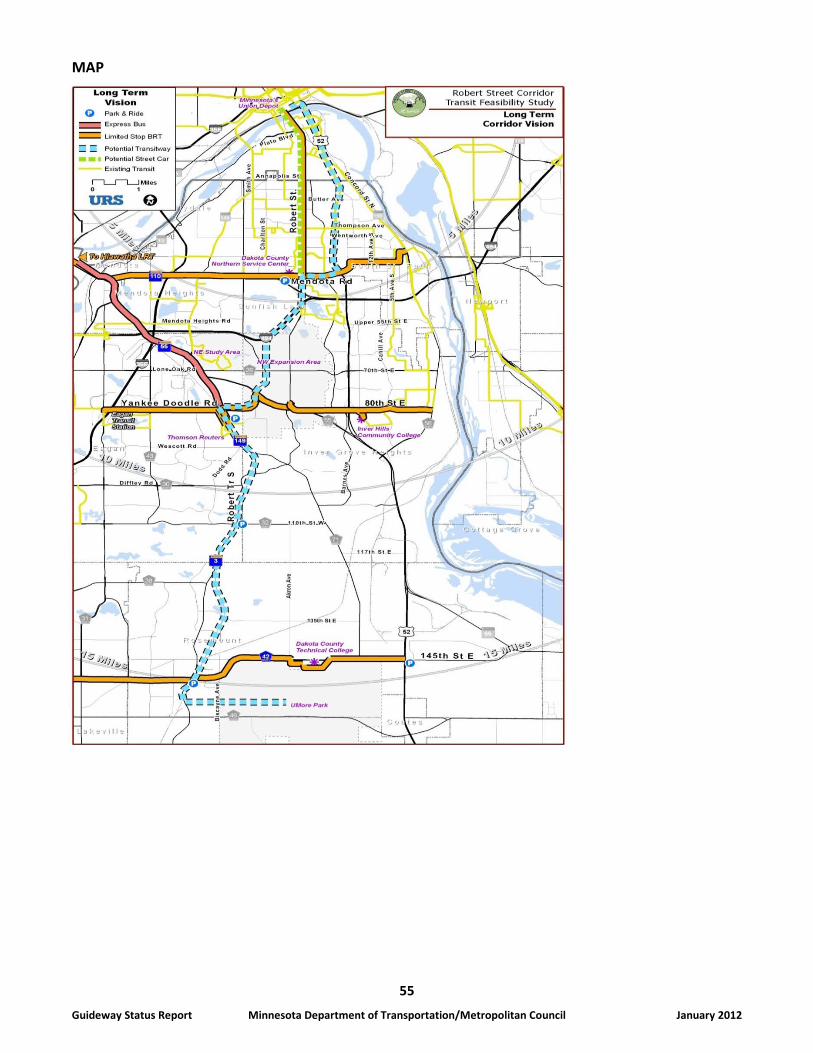
55
Guideway Status Report Minnesota Department of Transportation/Metropolitan Council January 2012
MAP
56
Guideway Status Report Minnesota Department of Transportation/Metropolitan Council January 2012
Rush Line Corridor
Corridor Description The 80-mile Rush Line Corridor begins at the Union Depot in downtown St. Paul and generally follows Highway 61 and Interstate 35/35E north through Ramsey, Anoka, Washington, Chisago, and Pine counties to Hinckley.
The Rush Line Corridor Alternatives Analysis Study, completed in November 2009 and available at www.rushline.org, analyzed multiple transit alternatives for the corridor including commuter rail, bus-rapid transit (BRT), and light-rail transit (LRT). The results of the analysis show that the two highest scoring alternatives are:
• BRT on I-35E/I-35 from the Union Depot in downtown St. Paul to the Forest Lake area. • LRT on the Ramsey County Regional Railroad Authority right of way from the Union Depot to
Highway 96 in White Bear Lake.
Following input from the public, the Rush Line Corridor Task Force concluded that both alternatives should continue to be analyzed to more accurately determine the impacts, benefits, costs and ridership for each alternative with the goal of narrowing the number of alternatives. After continued analysis of corridor alternatives, a single locally preferred alternative (LPA) will be chosen. The Rush Line Corridor will continue to promote transit service in Chisago and Pine counties to encourage a proactive approach to development that allows for extensions of the corridor to the north as demand warrants.
Ridership estimates range from 7,270 riders per weekday by 2030 for BRT to 8,800 riders per weekday by 2030 for LRT.
Project Status and Timeline The Rush Line Corridor Task Force is currently developing a scope of work for further analysis of the BRT and LRT alternatives described above with the goal to select an LPA for adoption into the Transportation Policy Plan, the region’s long-range transportation plan. Funding for this analysis has not yet been identified. Project Phase Date(s) Transit feasibility study 2001 Alternatives analysis study 2007 - 2009 Demonstration commuter bus service October 2010 - present Continued AA/Selection of an LPA TBD
57
Guideway Status Report Minnesota Department of Transportation/Metropolitan Council January 2012
Summary Financial Plan CAPITAL COST Capital cost estimates range from $190 million for BRT to $442 million for LRT (2008 dollars). The corridor has currently spent approximately $1 million to complete its feasibility study and Alternatives Analysis Study. These funds were spent between 2000 and 2009. It is estimated that an additional $1.0 million to $1.5 million will be needed to complete the further analysis necessary to select an LPA. ANNUAL OPERATING AND MAINTENANCE COSTS The Rush Line Corridor Alternatives Analysis Study estimated annual operating and maintenance costs at $16.3 million for BRT and $17.9 million for LRT (2008 dollars).
Other Project Information LEAD AGENCY Rush Line Corridor Task Force PROJECT CONTACT Victoria Reinhardt Staff: Rush Line Corridor Task Force Chair Mike Rogers Commissioner, Ramsey County Senior Transportation Planner Ramsey County Board Office Ramsey County Regional Railroad Authority Room 220 Court House Suite 6650 RCGC-West 15 W. Kellogg Blvd. 50 W. Kellogg Blvd. St. Paul, MN 55102 St. Paul, MN 55102 651-266-8363 651-266-2773 [email protected] [email protected]
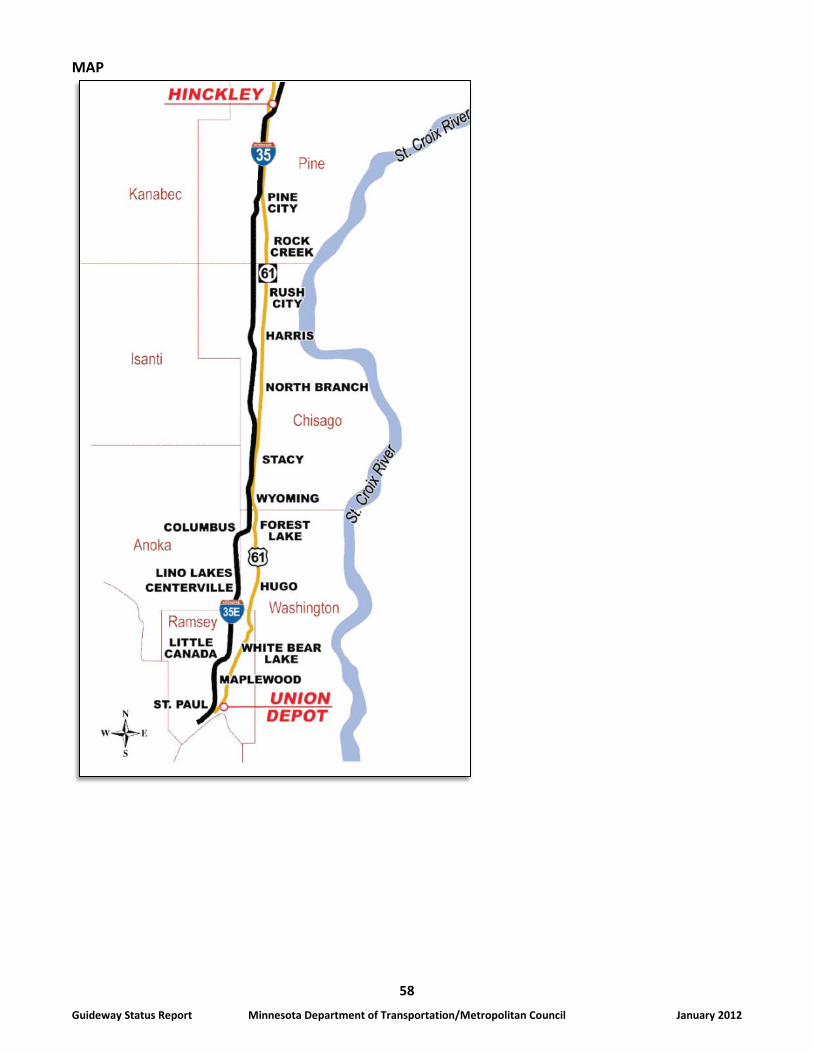
58
Guideway Status Report Minnesota Department of Transportation/Metropolitan Council January 2012
MAP
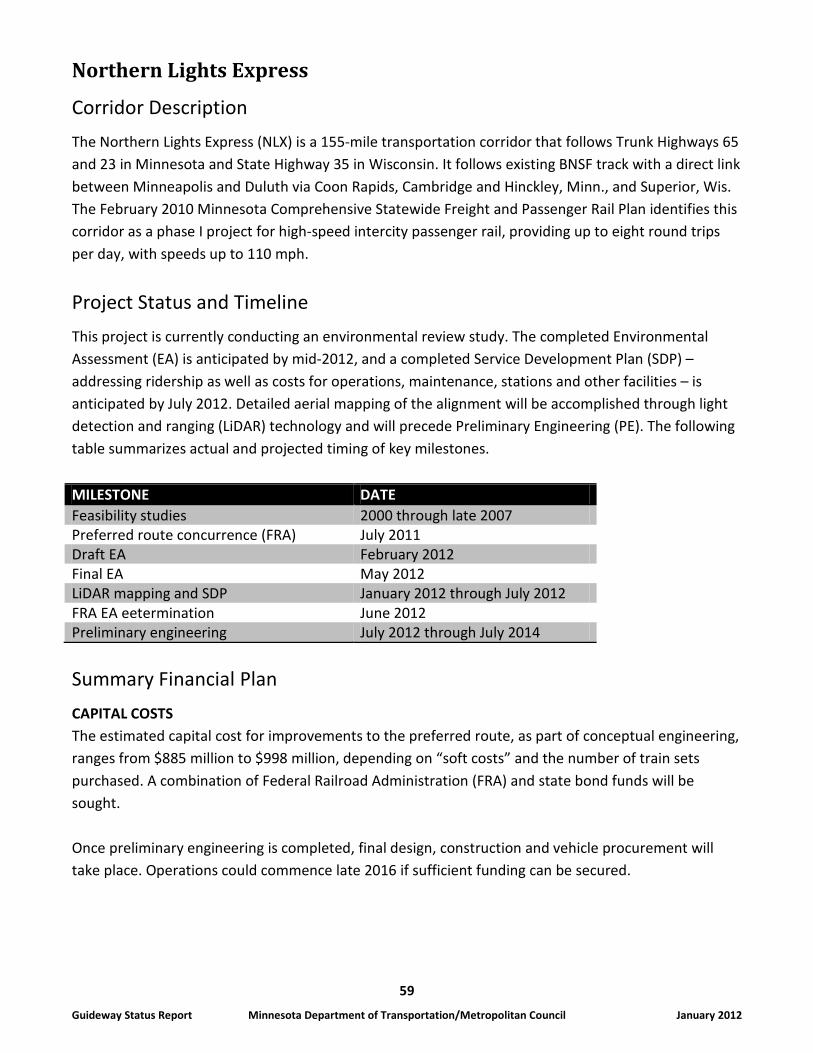
59
Guideway Status Report Minnesota Department of Transportation/Metropolitan Council January 2012
Northern Lights Express
Corridor Description The Northern Lights Express (NLX) is a 155-mile transportation corridor that follows Trunk Highways 65 and 23 in Minnesota and State Highway 35 in Wisconsin. It follows existing BNSF track with a direct link between Minneapolis and Duluth via Coon Rapids, Cambridge and Hinckley, Minn., and Superior, Wis. The February 2010 Minnesota Comprehensive Statewide Freight and Passenger Rail Plan identifies this corridor as a phase I project for high-speed intercity passenger rail, providing up to eight round trips per day, with speeds up to 110 mph.
Project Status and Timeline This project is currently conducting an environmental review study. The completed Environmental Assessment (EA) is anticipated by mid-2012, and a completed Service Development Plan (SDP) – addressing ridership as well as costs for operations, maintenance, stations and other facilities – is anticipated by July 2012. Detailed aerial mapping of the alignment will be accomplished through light detection and ranging (LiDAR) technology and will precede Preliminary Engineering (PE). The following table summarizes actual and projected timing of key milestones. MILESTONE DATE Feasibility studies 2000 through late 2007 Preferred route concurrence (FRA) July 2011 Draft EA February 2012 Final EA May 2012 LiDAR mapping and SDP January 2012 through July 2012 FRA EA eetermination June 2012 Preliminary engineering July 2012 through July 2014
Summary Financial Plan CAPITAL COSTS The estimated capital cost for improvements to the preferred route, as part of conceptual engineering, ranges from $885 million to $998 million, depending on “soft costs” and the number of train sets purchased. A combination of Federal Railroad Administration (FRA) and state bond funds will be sought. Once preliminary engineering is completed, final design, construction and vehicle procurement will take place. Operations could commence late 2016 if sufficient funding can be secured.
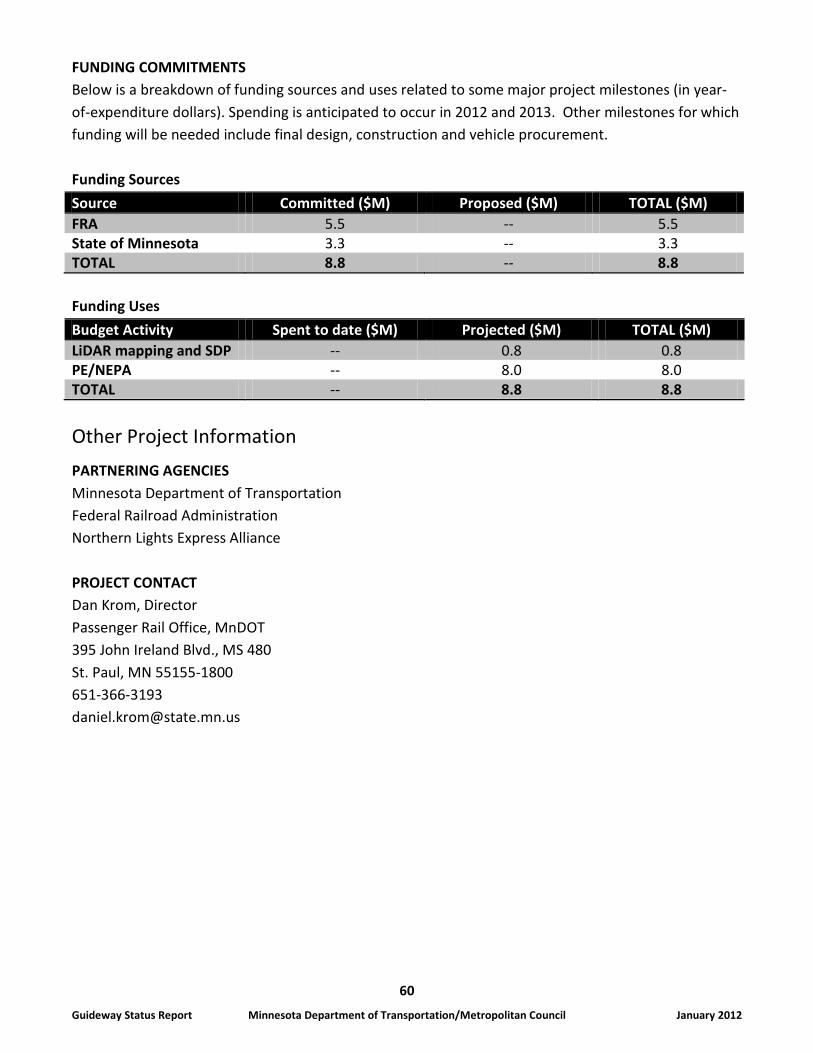
60
Guideway Status Report Minnesota Department of Transportation/Metropolitan Council January 2012
FUNDING COMMITMENTS Below is a breakdown of funding sources and uses related to some major project milestones (in year-of-expenditure dollars). Spending is anticipated to occur in 2012 and 2013. Other milestones for which funding will be needed include final design, construction and vehicle procurement. Funding Sources Source Committed ($M) Proposed ($M) TOTAL ($M) FRA 5.5 -- 5.5 State of Minnesota 3.3 -- 3.3 TOTAL 8.8 -- 8.8 Funding Uses Budget Activity Spent to date ($M) Projected ($M) TOTAL ($M) LiDAR mapping and SDP -- 0.8 0.8 PE/NEPA -- 8.0 8.0 TOTAL -- 8.8 8.8
Other Project Information PARTNERING AGENCIES Minnesota Department of Transportation Federal Railroad Administration Northern Lights Express Alliance PROJECT CONTACT Dan Krom, Director Passenger Rail Office, MnDOT 395 John Ireland Blvd., MS 480 St. Paul, MN 55155-1800 651-366-3193 [email protected]
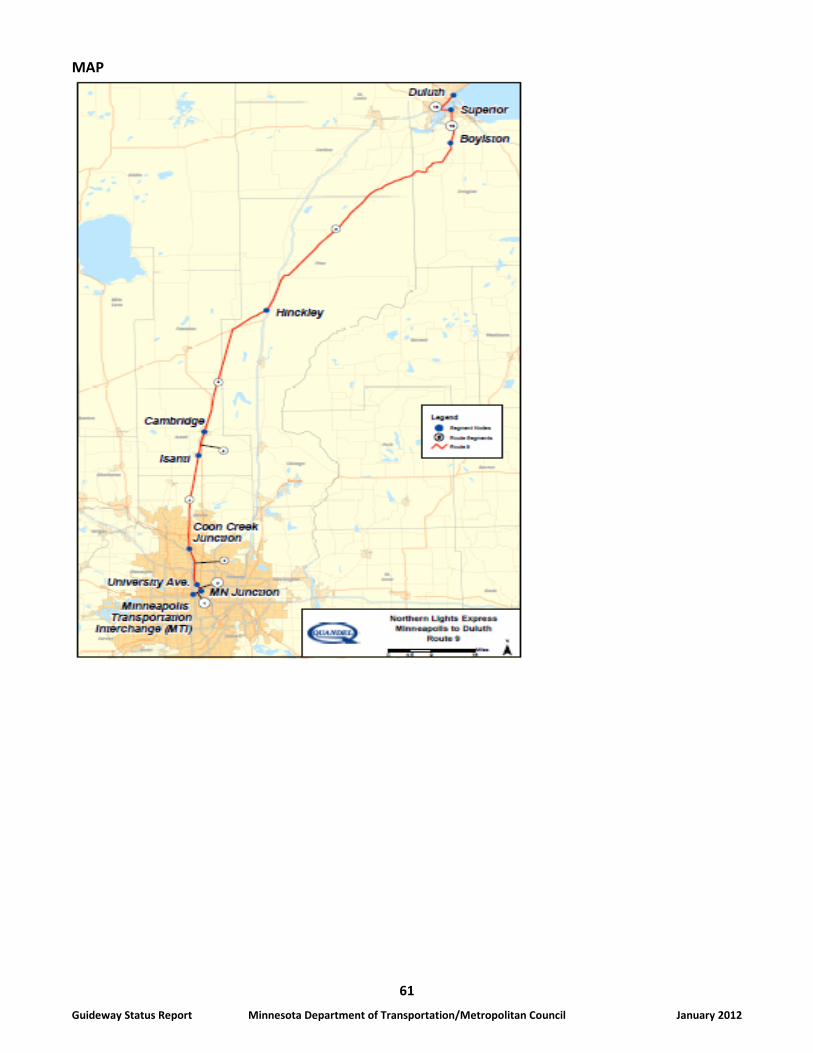
61
Guideway Status Report Minnesota Department of Transportation/Metropolitan Council January 2012
MAP
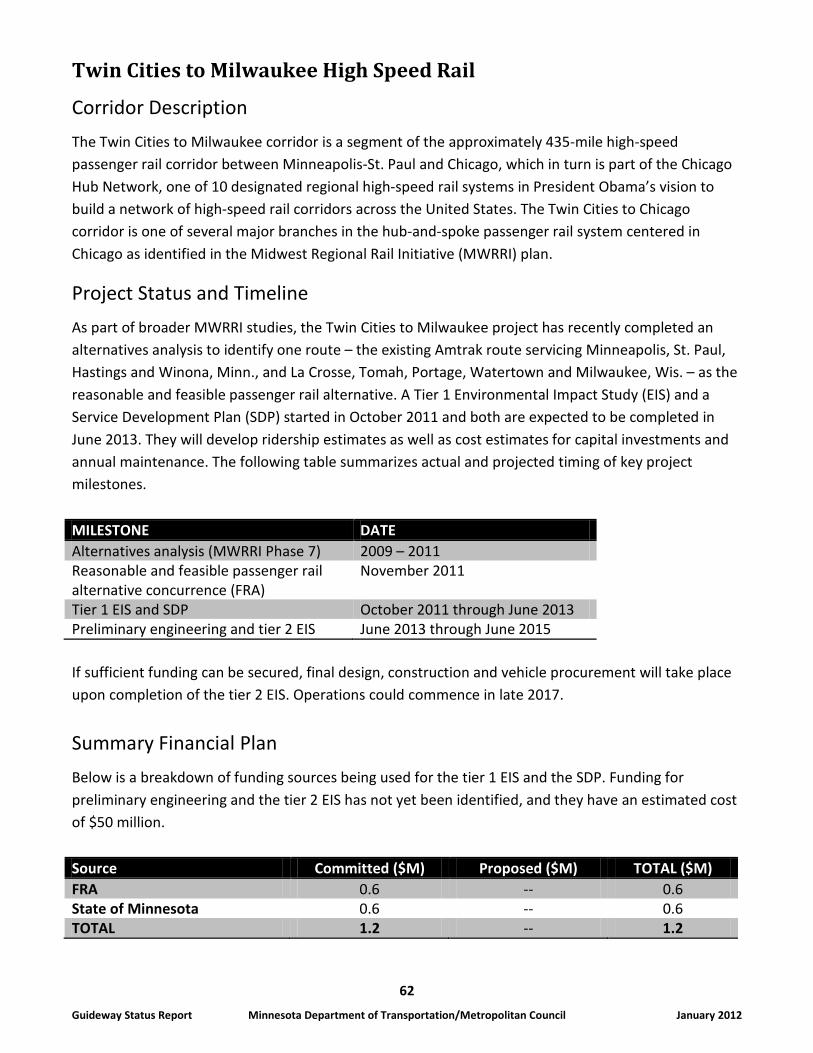
62
Guideway Status Report Minnesota Department of Transportation/Metropolitan Council January 2012
Twin Cities to Milwaukee High Speed Rail
Corridor Description The Twin Cities to Milwaukee corridor is a segment of the approximately 435-mile high-speed passenger rail corridor between Minneapolis-St. Paul and Chicago, which in turn is part of the Chicago Hub Network, one of 10 designated regional high-speed rail systems in President Obama’s vision to build a network of high-speed rail corridors across the United States. The Twin Cities to Chicago corridor is one of several major branches in the hub-and-spoke passenger rail system centered in Chicago as identified in the Midwest Regional Rail Initiative (MWRRI) plan.
Project Status and Timeline As part of broader MWRRI studies, the Twin Cities to Milwaukee project has recently completed an alternatives analysis to identify one route – the existing Amtrak route servicing Minneapolis, St. Paul, Hastings and Winona, Minn., and La Crosse, Tomah, Portage, Watertown and Milwaukee, Wis. – as the reasonable and feasible passenger rail alternative. A Tier 1 Environmental Impact Study (EIS) and a Service Development Plan (SDP) started in October 2011 and both are expected to be completed in June 2013. They will develop ridership estimates as well as cost estimates for capital investments and annual maintenance. The following table summarizes actual and projected timing of key project milestones. MILESTONE DATE Alternatives analysis (MWRRI Phase 7) 2009 – 2011 Reasonable and feasible passenger rail alternative concurrence (FRA)
November 2011
Tier 1 EIS and SDP October 2011 through June 2013 Preliminary engineering and tier 2 EIS June 2013 through June 2015 If sufficient funding can be secured, final design, construction and vehicle procurement will take place upon completion of the tier 2 EIS. Operations could commence in late 2017.
Summary Financial Plan Below is a breakdown of funding sources being used for the tier 1 EIS and the SDP. Funding for preliminary engineering and the tier 2 EIS has not yet been identified, and they have an estimated cost of $50 million. Source Committed ($M) Proposed ($M) TOTAL ($M) FRA 0.6 -- 0.6 State of Minnesota 0.6 -- 0.6 TOTAL 1.2 -- 1.2
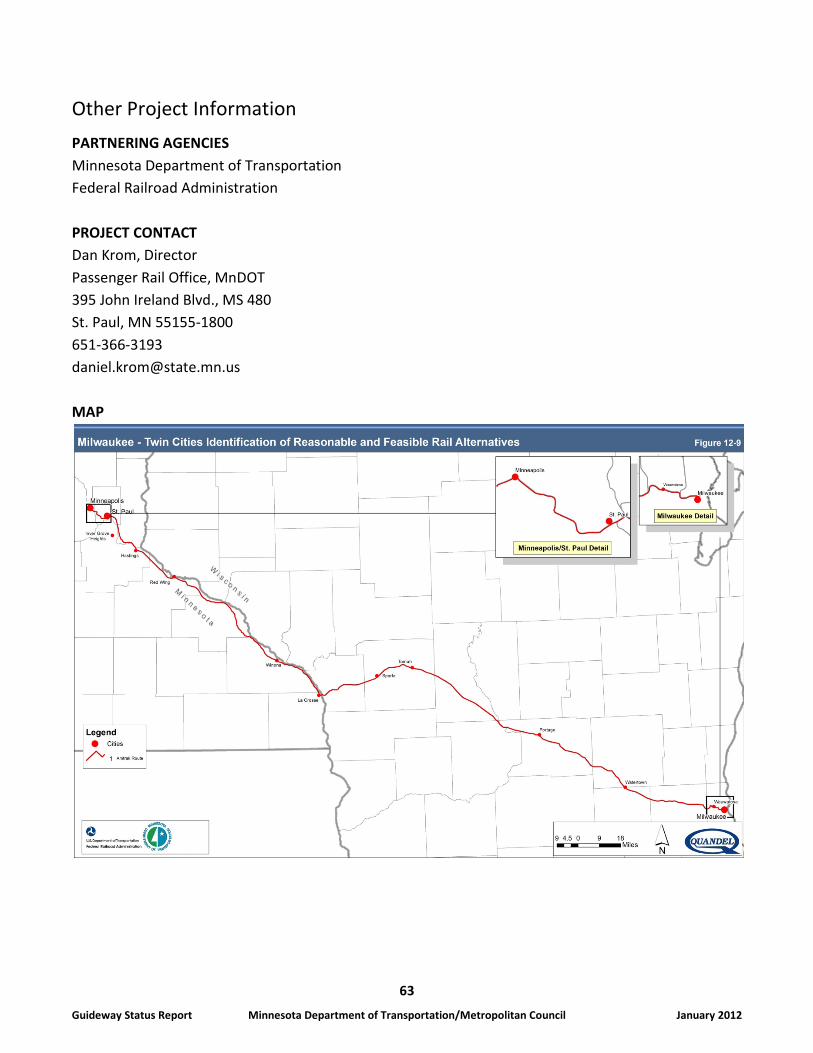
63
Guideway Status Report Minnesota Department of Transportation/Metropolitan Council January 2012
Other Project Information PARTNERING AGENCIES Minnesota Department of Transportation Federal Railroad Administration PROJECT CONTACT Dan Krom, Director Passenger Rail Office, MnDOT 395 John Ireland Blvd., MS 480 St. Paul, MN 55155-1800 651-366-3193 [email protected] MAP
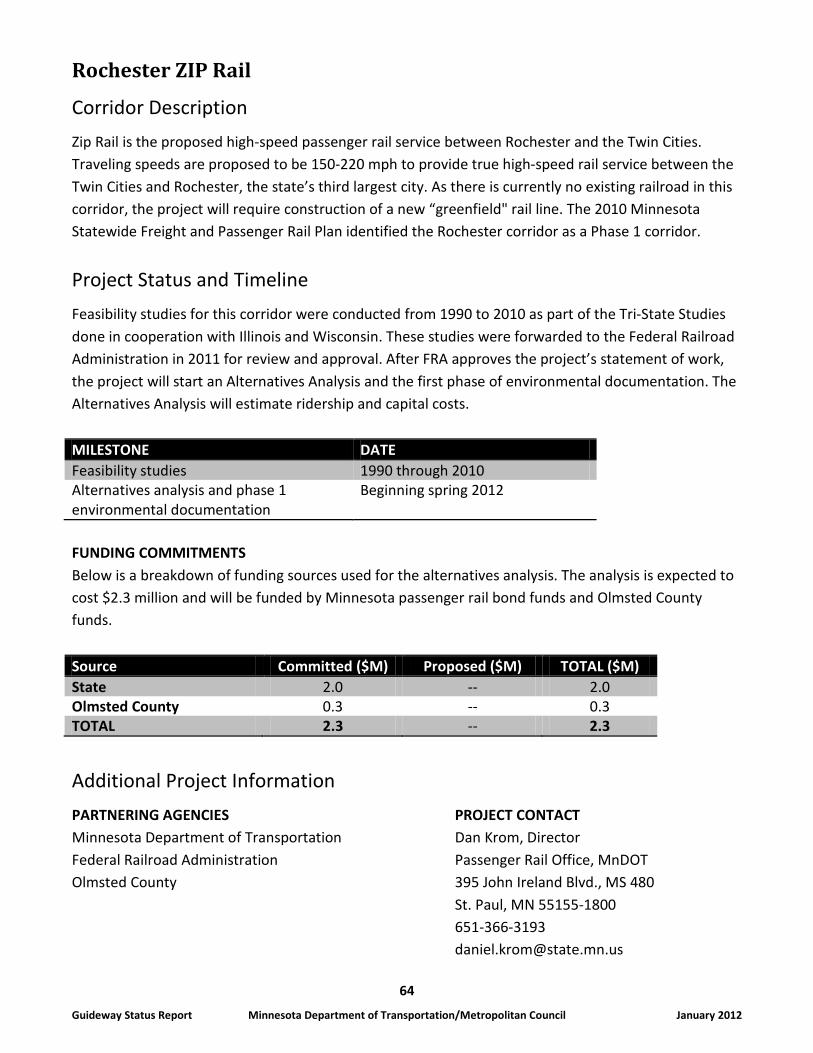
64
Guideway Status Report Minnesota Department of Transportation/Metropolitan Council January 2012
Rochester ZIP Rail
Corridor Description Zip Rail is the proposed high-speed passenger rail service between Rochester and the Twin Cities. Traveling speeds are proposed to be 150-220 mph to provide true high-speed rail service between the Twin Cities and Rochester, the state’s third largest city. As there is currently no existing railroad in this corridor, the project will require construction of a new “greenfield" rail line. The 2010 Minnesota Statewide Freight and Passenger Rail Plan identified the Rochester corridor as a Phase 1 corridor.
Project Status and Timeline Feasibility studies for this corridor were conducted from 1990 to 2010 as part of the Tri-State Studies done in cooperation with Illinois and Wisconsin. These studies were forwarded to the Federal Railroad Administration in 2011 for review and approval. After FRA approves the project’s statement of work, the project will start an Alternatives Analysis and the first phase of environmental documentation. The Alternatives Analysis will estimate ridership and capital costs. MILESTONE DATE Feasibility studies 1990 through 2010 Alternatives analysis and phase 1 environmental documentation
Beginning spring 2012
FUNDING COMMITMENTS Below is a breakdown of funding sources used for the alternatives analysis. The analysis is expected to cost $2.3 million and will be funded by Minnesota passenger rail bond funds and Olmsted County funds. Source Committed ($M) Proposed ($M) TOTAL ($M) State 2.0 -- 2.0 Olmsted County 0.3 -- 0.3 TOTAL 2.3 -- 2.3
Additional Project Information PARTNERING AGENCIES PROJECT CONTACT Minnesota Department of Transportation Dan Krom, Director Federal Railroad Administration Passenger Rail Office, MnDOT Olmsted County 395 John Ireland Blvd., MS 480 St. Paul, MN 55155-1800 651-366-3193 [email protected]
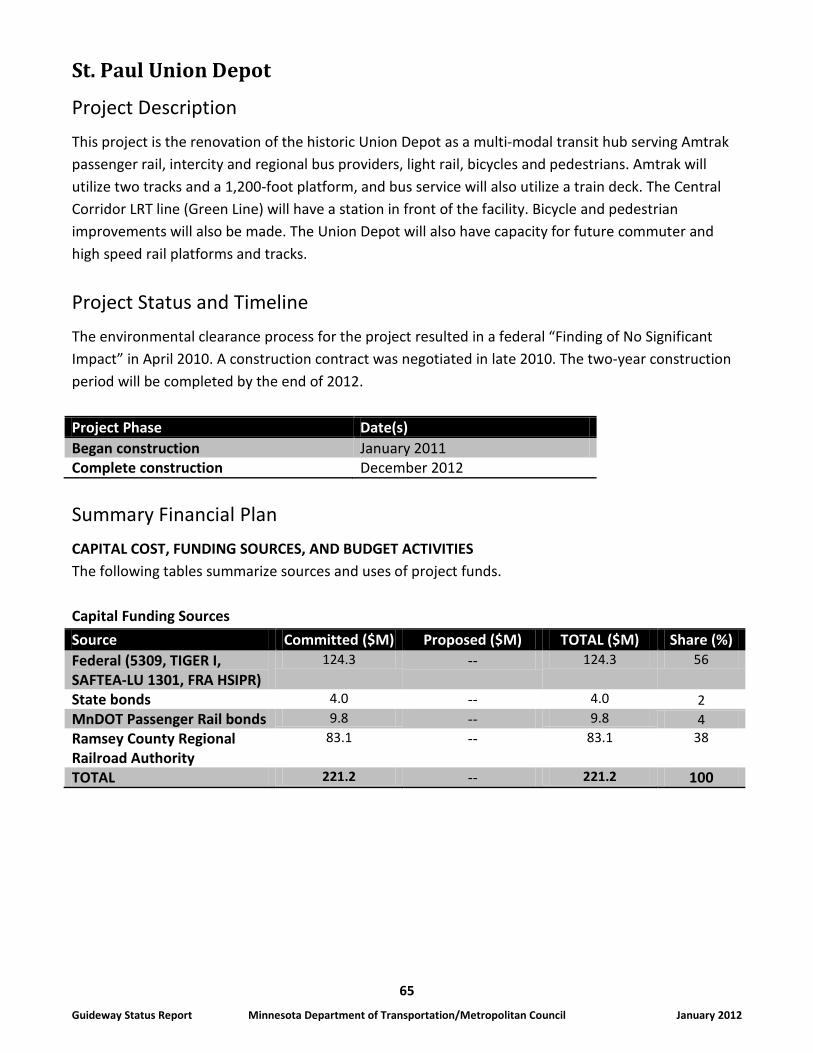
65
Guideway Status Report Minnesota Department of Transportation/Metropolitan Council January 2012
St. Paul Union Depot
Project Description This project is the renovation of the historic Union Depot as a multi-modal transit hub serving Amtrak passenger rail, intercity and regional bus providers, light rail, bicycles and pedestrians. Amtrak will utilize two tracks and a 1,200-foot platform, and bus service will also utilize a train deck. The Central Corridor LRT line (Green Line) will have a station in front of the facility. Bicycle and pedestrian improvements will also be made. The Union Depot will also have capacity for future commuter and high speed rail platforms and tracks.
Project Status and Timeline The environmental clearance process for the project resulted in a federal “Finding of No Significant Impact” in April 2010. A construction contract was negotiated in late 2010. The two-year construction period will be completed by the end of 2012. Project Phase Date(s) Began construction January 2011 Complete construction December 2012
Summary Financial Plan CAPITAL COST, FUNDING SOURCES, AND BUDGET ACTIVITIES The following tables summarize sources and uses of project funds. Capital Funding Sources Source Committed ($M) Proposed ($M) TOTAL ($M) Share (%) Federal (5309, TIGER I, SAFTEA-LU 1301, FRA HSIPR)
124.3 -- 124.3 56
State bonds 4.0 -- 4.0 2 MnDOT Passenger Rail bonds 9.8 -- 9.8 4 Ramsey County Regional Railroad Authority
83.1 -- 83.1 38
TOTAL 221.2 -- 221.2 100
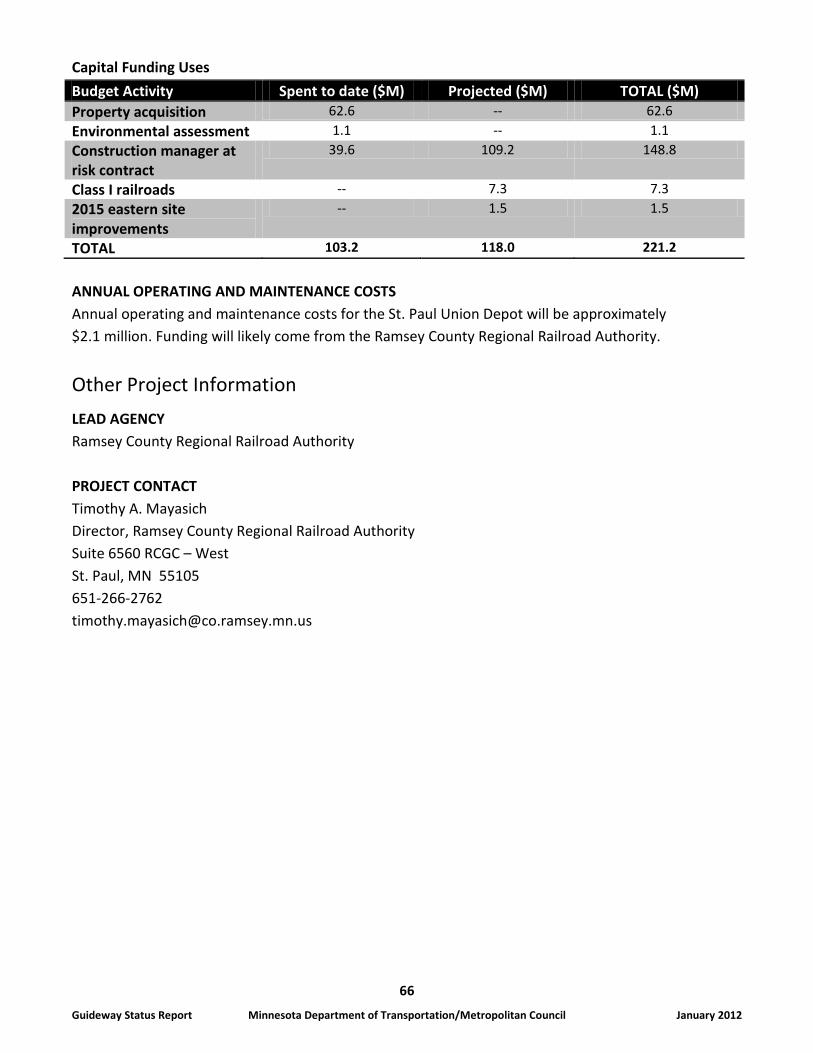
66
Guideway Status Report Minnesota Department of Transportation/Metropolitan Council January 2012
Capital Funding Uses Budget Activity Spent to date ($M) Projected ($M) TOTAL ($M) Property acquisition 62.6 -- 62.6 Environmental assessment 1.1 -- 1.1 Construction manager at risk contract
39.6 109.2 148.8
Class I railroads -- 7.3 7.3 2015 eastern site improvements
-- 1.5 1.5
TOTAL 103.2 118.0 221.2 ANNUAL OPERATING AND MAINTENANCE COSTS Annual operating and maintenance costs for the St. Paul Union Depot will be approximately $2.1 million. Funding will likely come from the Ramsey County Regional Railroad Authority.
Other Project Information LEAD AGENCY Ramsey County Regional Railroad Authority PROJECT CONTACT Timothy A. Mayasich Director, Ramsey County Regional Railroad Authority Suite 6560 RCGC – West St. Paul, MN 55105 651-266-2762 [email protected]
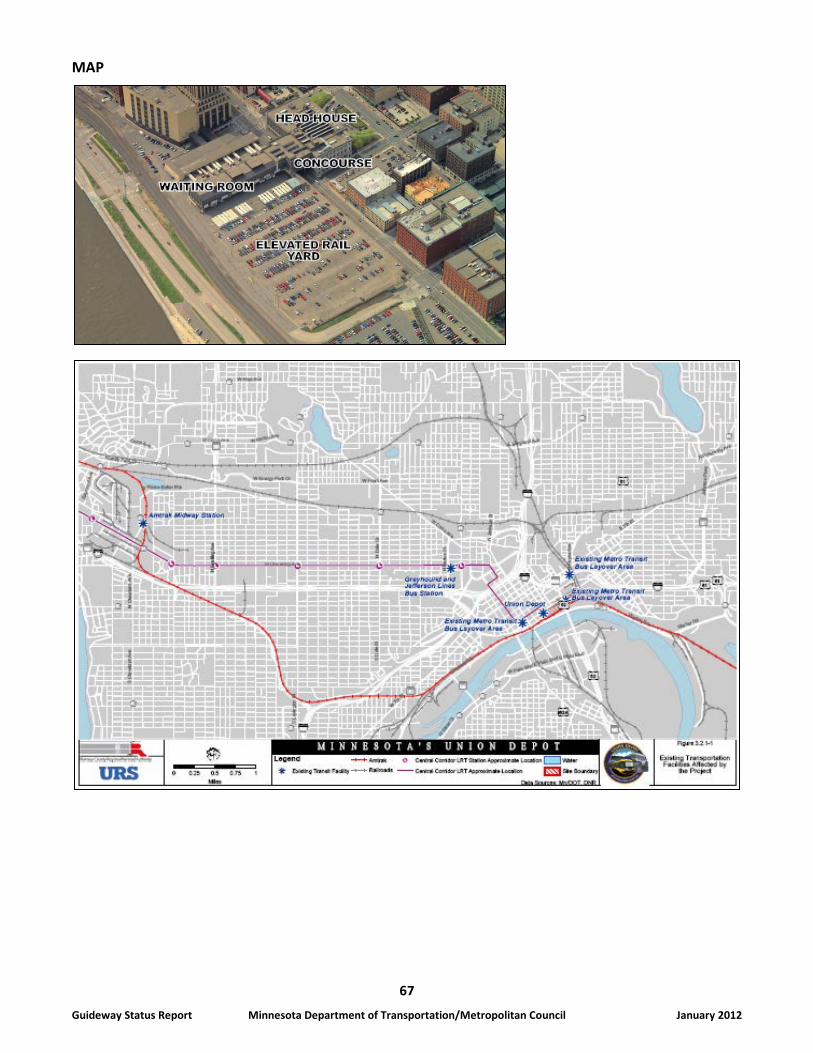
67
Guideway Status Report Minnesota Department of Transportation/Metropolitan Council January 2012
MAP
68
Guideway Status Report Minnesota Department of Transportation/Metropolitan Council January 2012
The Interchange
Corridor Description The Interchange in downtown Minneapolis will unite transit and development creating a civic space that connects multiple transportation options, supports a vibrant regional economy, reduces greenhouse gas emissions and increases mobility. A project of the Hennepin County Regional Railroad Authority, Hennepin County and the Hennepin County Housing and Redevelopment Authority, the Interchange will be located in the area adjacent to Target Field. Phase 1 of the project addresses facility enhancements to accommodate the convergence of the existing Hiawatha LRT (Blue Line) and Northstar Commuter Rail as well as Central Corridor LRT (Green Line) in 2014, Southwest LRT (Green Line extension) in 2018 and possible future transit service in the Bottineau Corridor (mode yet unselected). Future phases will depend on development of other transitways. Currently, more than 240 trains arrive and depart daily at this location via Hiawatha LRT and Northstar Commuter Rail. An additional 240 trains are expected in 2014, when Central Corridor LRT opens. Daily ridership averages 2,900 weekday passengers and 7,700 on Minnesota Twins game days. Projected 2014 ridership is approximately 4,000 daily passengers with the two light-rail lines and Northstar and game-day ridership approaching 12,400 passengers.
Project Status and Timeline Project Phase Date(s) Design-build procurement process September 2011-April 2012 Determination regarding a Finding of No Significant Impact (FONSI) from Federal Transit Administration
March / April, 2012
Project construction April 2012-April 2014 Public opening April 1, 2014
Summary Financial Plan CAPITAL COST, FUNDING SOURCES AND BUDGET ACTIVITIES The total capital cost for the Transportation Interchange project Phase 1 is currently estimated at $67.7 million. This estimate is for a multi-element transitway project. Project elements contributing to the total capital cost include, among other things, a pedestrian plaza, elevated track and platforms, necessary replacement of an administrative facility for the Hennepin Energy Recovery Center and connections from the plaza to the neighborhood, surrounding activities and multiple transportation options.
69
Guideway Status Report Minnesota Department of Transportation/Metropolitan Council January 2012
Capital Funding Sources Source Committed ($M) Proposed ($M) Total ($M) Share (%) Federal sources 10.5 15.0 25.5 38 State 14.7 10.3 25.0 37 Hennepin County RRA 6.7 -- 6.7 10 Other 1.7 8.8 ¹ 10.5 15 TOTAL ² 33.6 34.1 67.7 100 ¹ Minimum amount expected from the Minnesota Ballpark Authority and private sources ² Will change as funding sources become more definitive ANNUAL OPERATING AND MAINTENANCE COSTS Annual operating and maintenance costs are still being determined. When Phase 1 is completed, parts of the project will likely be owned and operated by different entities. Revenue streams from public and private uses may be available for ongoing expenses.
Other Project Information LEAD AGENCY Hennepin County Regional Railroad Authority PROJECT CONTACT Ed Hunter, Interchange Project Manager 200 Grain Exchange 400 S. Fourth St. Minneapolis, MN 55415 [email protected] 612-543-7273
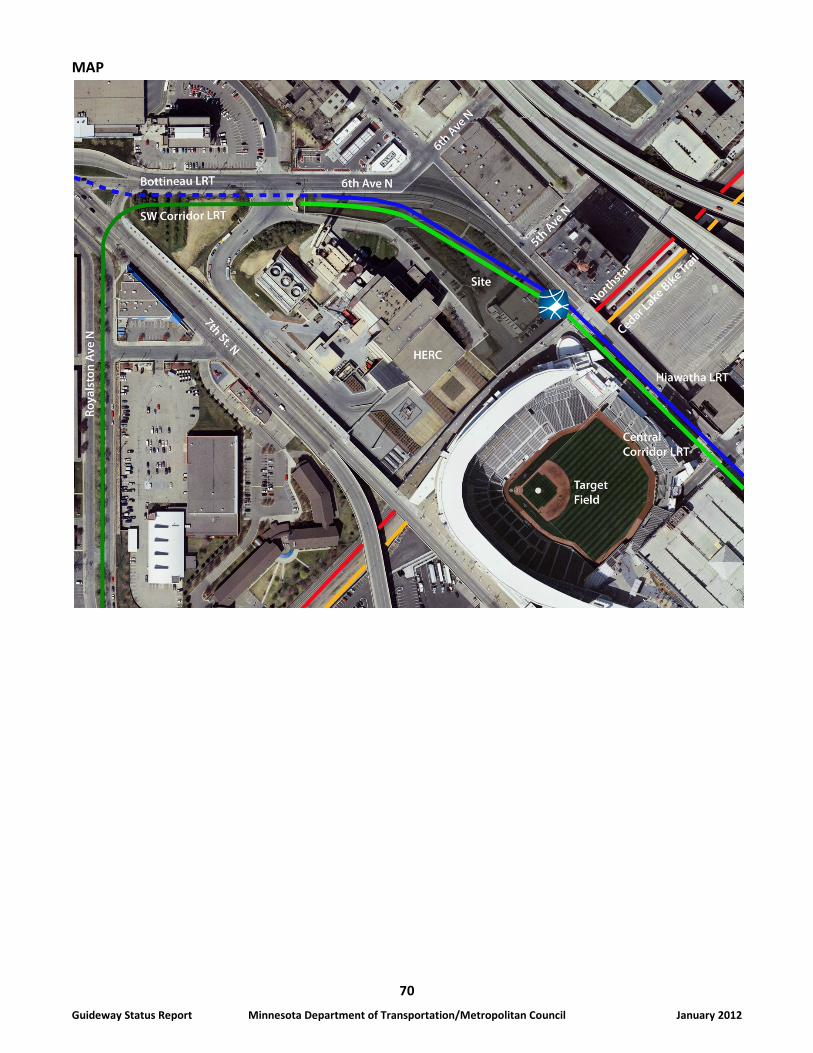
70
Guideway Status Report Minnesota Department of Transportation/Metropolitan Council January 2012
MAP
71
Guideway Status Report Minnesota Department of Transportation/Metropolitan Council January 2012
Capacity Analysis The capacity analysis portion of the report seeks to aggregate and synthesize information about individual project finances, thus providing a system-wide view that the corridor summaries do not provide alone. The requirement to include the capacity analysis in the report came from an amendment to Minn. Stat. 174.93 enacted by the Legislature in the first special legislative session of 2011. General Approach
The general instructions from the Legislature regarding the capacity analysis are to look at system-wide funding needs and sources related to capital costs, operating costs and capital maintenance costs for the next 10 years. Consequently, the capacity analysis consists of tables of anticipated project expenditures for each of these three categories of costs. Costs in each category are shown in the anticipated year of expenditure. It should be noted that funding requests precede anticipated project expenditures. Therefore, some of the funds shown in 2012 and future years, while not yet expended, have already been secured through previous funding requests and are “committed” to the project. In other instances, funds shown in the future years are anticipated funding requests from the identified funding sources and are not yet committed. The text for each of the cost categories seeks to indicate the level of funding that has been previously committed and those funds that have yet to be secured. The individual corridor summaries also provide information about funds committed to a given project. When discussing the information that should be included in the report, the statute mentions that financial information should reflect “the level of detail available” and that information related to categorization of expenditures should be provided “if feasible.” Thus, the statute does not appear to require that new information be generated solely for the report. This approach has implications for the capacity analysis. Most importantly, as previously noted, due to the high uncertainty and large range of cost estimates for projects still in the planning phase, the capacity analysis section includes only those guideway projects that have selected a locally preferred alternative (LPA) and are in preliminary engineering, design, construction or operation. This includes seven corridors: I-394 High Occupancy Toll (HOT) lane express bus service, Hiawatha LRT (Blue Line), Northstar commuter rail, Cedar Avenue BRT (Red Line), I-35W South BRT (Orange Line), Central Corridor LRT (Green Line) and the Southwest LRT (Green Line extension). In addition, the St. Paul Union Depot and the Minneapolis Interchange multimodal hubs are included in the capital cost analysis. For past expenditures, any figures shown represent actual expenditures. For future expenditures, the numbers shown are the best estimates currently available but should still be viewed as estimates that may change over time.
72
Guideway Status Report Minnesota Department of Transportation/Metropolitan Council January 2012
Capital Cost Analysis
Guideway project capital cost estimates are shown in Section 1 of the capacity analysis table on pages 75-76 and are organized by anticipated expenditures. The capital cost category includes design and construction costs to build a guideway project as well as costs for subsequent major, one-time capital improvements that occur after the initial project construction, such as expanding station platforms or purchasing additional vehicles. These subsequent capital costs occur only for the guideway projects currently operating (i.e. I-394 HOT lane express bus service, Hiawatha LRT and Northstar commuter rail). Total estimated capital cost for the seven guideway projects and two multimodal hubs is slightly more than $4 billion. This total includes a substantial amount of funding that has already been spent or committed to the projects. Capital funding for five of the projects (I-394 HOT lane express bus service, Hiawatha LRT, Northstar commuter rail, Central Corridor LRT and Union Depot) has all been identified and is either spent or committed. In addition, funding for all of Cedar Avenue BRT Stage I, totaling $112 million, has been secured. The Southwest LRT project has the largest amount of capital funding (approximately $1.2 billion) yet to be secured, including $625 million needed from the federal New Starts program, $120 million in state bonds, $342 million from CTIB and $116 million from the Hennepin County Regional Railroad Authority. This anticipated funding split follows a funding formula similar to that of Central Corridor with 50 percent from the New Starts program, 30 percent from CTIB, 10 percent from the state and 10 percent from local sources. There is no federal funding program or standard funding formula for BRT projects such as I-35W South or Cedar Avenue BRT. For purposes of this analysis, it is assumed that capital costs will be shared approximately equally among federal sources, the state and CTIB (30 percent each), with a 10 percent local contribution. The I-35W South BRT project has spent approximately $26 million in capital funds to date and anticipates securing an additional $156 million over the next six years primarily for the construction of on-line stations at Lake Street and American Boulevard. Given what has already been spent, and with the assumed funding formula, this will require approximately an additional $41 million in federal funds, $45 million in state funds, $53 million from CTIB and $18 million from local or other sources. It should be noted that the state share of the I-35W South costs may also come from trunk highway funds or trunk highway bonds since some of the needed improvements will be highway related. Stage II of the Cedar Avenue BRT project, which is expected to begin in 2014, does not yet have committed funding. This phase of the project is estimated to total approximately $64 million and will follow a funding formula similar to that described above, requiring approximately $20 million each from federal sources, the state and CTIB. The remaining local share is estimated at $6.4 million.
73
Guideway Status Report Minnesota Department of Transportation/Metropolitan Council January 2012
The Minneapolis Interchange also has capital funding that has yet to be secured. The project is expected to total approximately $68 million with $34 million identified to date. The remaining shares are expected to be $15 million from federal sources, $10 million from the state and $9 million from local and other sources. Based on the assumptions in this report, over the next 10 years, the expected state share of the as-yet-uncommitted capital costs of the guideway projects described above totals approximately $195 million. Operating Cost Analysis
Operating costs include annual vehicle operator salaries and benefits, fuel, vehicle cleaning and other administrative costs. The estimated operating costs for those guideway projects expected to be in operation by 2021 are shown in Section 2 of the capacity analysis table on page 77. Operating costs are typically paid first through fares and any operating revenue generated by the guideway project such as advertising revenue. The remaining operating costs are referred to as the net operating costs or subsidy, which is typically paid from a combination of state, CTIB, Council and federal revenues. The fare revenue figures shown in the operating cost analysis assume the current fare structure (i.e. no fare increase), with any fare revenue increases over the ten year analysis due to ridership growth. Most likely at least one fare increase would take place over this time period, but it is difficult to predict when and what amount of increase should be assumed. By including no fare increase, the figures shown in the table show a high, or worst case estimate, for the necessary subsidy from the non-fare funding sources. For the operating cost analysis, only those corridors that have an expectation of funding from the state and/or CTIB above the Council’s base transit operations budget are included in the analysis. This means that the I-394 HOT lane express bus service costs are not included in the operating costs analysis. Most of the I-394 service existed prior to implementation of the HOT lane and the service is integrated into the Council’s and Suburban Transit Providers’ base bus operating costs. At this time there is no expectation that additional operating funds will be requested for this guideway project from the state or CTIB. For light rail transit projects, Minn. Stat. 473.4051 states that, “after operating and federal money have been used to pay for light rail operations, 50 percent of the remaining costs must be paid by the state.” In line with state law, this capacity analysis assumes that after 2014, net operating costs for Hiawatha LRT, Central LRT and the Southwest LRT will be shared 50 percent by the state and 50 percent by CTIB. In the capacity analysis table these operating revenues are shown as “state (M.S. 473.4051 obligation).” Any other expectation of state funding for guideway operations that does not fall under this statutory requirement is shown in the table as “state (additional request).” In 2004, when Hiawatha LRT first opened, the state provided a 50 percent share for the net operations; however, over the ensuing years the appropriation was not increased and did not keep pace with
74
Guideway Status Report Minnesota Department of Transportation/Metropolitan Council January 2012
inflationary pressures. In fiscal year 2011 the Council’s transit general fund appropriation continued to include a base appropriation of approximately $5.2 million for Hiawatha LRT, covering approximately 33 percent of the net costs. For fiscal years 2012 and 2013, the Council’s general fund appropriation for Hiawatha LRT was reduced as described further below. However, it will return to the previous base of $5.2 million in fiscal year 2014 under state law. This capacity analysis includes an assumption that as required under Minn. Stat. 473.4051, the state will begin fully funding its 50 percent share of Hiawatha LRT and Central LRT in 2014, followed by a 50 percent contribution to Southwest LRT operations when it opens in 2018. The estimated annual operating costs shown in the table for both Central LRT and Southwest LRT are existing best estimates taken from the federal New Starts applications submitted to the FTA for these corridors. Central LRT is expected to open mid-2014, thus calendar year 2015 reflects the first full year of operating costs for it. For the first three years of operations, Central LRT has received a Congestion Mitigation Air Quality (CMAQ) grant which will contribute $2.3 million each year in federal funds, thereby reducing the expected contributions from both the state and CTIB. In calendar year 2015, the state’s expected contribution is $6.7 million. The Southwest LRT line is expected to open in January 2018 with a required state funding share of $11.8 million in its first year of operations. The Southwest LRT project has not received a federal CMAQ grant for operations, though it is expected the project will apply in the future if this federal program is still available. In 2018, the required state share for 50 percent of the net operating cost of the three light rail projects covered under Minn. Stat. 473.4051 will total approximately $30 million (including the existing $5.2 million general fund appropriation for Hiawatha LRT). There is no existing state statute that speaks to how the operating costs for commuter rail are to be funded. The financial analysis section of the Northstar Commuter Rail New Starts application showed that the net costs were assumed to be paid 50 percent from the state and 50 percent from local sources. However, due to state budget shortfalls, no state appropriation has yet been made for Northstar operations. To date the 50 percent state share has been funded using motor vehicle sales tax funds, the Council (41.95 percent) and MnDOT (8.05 percent). For 2014 and beyond, the capacity analysis assumes that the state will begin funding a 50 percent share of Northstar’s net operating costs, totaling approximately $6.4 million in 2014. Currently, the Cedar Avenue BRT and I-35W South BRT corridors have only added BRT express service operating in the corridors. This service was added due to the federal Urban Partnership Agreement capital investments made in 2008/2009. Cedar Avenue BRT express service to Minneapolis was added from two newly opened park-and-rides—Cedar Grove in Eagan and Cedar Lakeville. I-35W South BRT express service was added from the newly opened Kenrick Avenue park-and-ride in Lakeville. The net operating costs of this added BRT express service has been funded by 50 percent from CTIB and 50 percent from the Council through its base bus operating budget. (CTIB’s share will increase to 75 percent for the 2012-2013 biennium.) A similar funding share is expected as additional BRT express service is added in these corridors in the future.
75
Guideway Status Report Minnesota Department of Transportation/Metropolitan Council January 2012
Cedar Avenue BRT is expected to begin operating all day station-to-station service beginning in late calendar year 2012. The funding shares for station-to-station BRT service are expected to be similar to that of light rail, with the net operating costs shared 50 percent by CTIB and 50 percent by the state (after the 2012-2013 biennium where the CTIB share is 75 percent through June 2013). For the first full three years of operations, the state share of Cedar Avenue BRT station-to-station service will be funded through an existing federal CMAQ grant with the remainder paid by CTIB. In 2016 when the CMAQ grant expires, the needed state share is estimated at $1.2 million. I-35W South BRT all day station-to-station service is expected to begin in 2016. Similar to LRT and Cedar Avenue BRT, the net costs of this service are expected to be shared 50 percent by CTIB and 50 percent by the state, requiring $2.3 million in 2016. The net costs of new BRT express services in both corridors will continue to be funded 50 percent by CTIB and 50 percent by the Council. During the 2011 session due to a state funding shortfall, the Council’s general fund appropriation for transit operations for fiscal years 2012 and 2013 was reduced by approximately $52 million. To partially off-set this reduction, the Legislature required CTIB for the 2012-2013 biennium to contribute at least 75 percent of the cost of operating those corridors. The CTIB provided a 50 percent share of funding in 2011. Thus the capacity analysis shows a higher share for CTIB in calendar years 2012 and 2013 for the four guideway projects currently in operations—Hiawatha LRT, Northstar commuter rail, Cedar BRT express service and I-35W South BRT express service. In 2014 the funding shares for these projects are expected to return to the standard formula for the net operating subsidy with 50 percent from CTIB or local sources and 50 percent from the state or Metropolitan Council funding sources. In 2021, when all seven guideway projects are fully operational, the state share of operations funding will total approximately $45 million. This breaks down to $33 million under the existing Minn. Stat. 473.4051 obligation for Hiawatha LRT, Central LRT and Southwest LRT and $12 million to be requested from the state for operating Northstar commuter rail and the Cedar Avenue and I-35W South BRT station-to-station services. Capital Maintenance Cost Analysis
Capital maintenance includes ongoing capital costs typically included in an annual capital budget, such as track maintenance, periodic vehicle overhauls, signal work and other smaller-scale capital improvements. These maintenance costs can vary significantly from year-to-year depending on the needed maintenance, so the capacity analysis uses average figures over time. In addition, capital maintenance costs start out low as a new corridor is opened and grow over time as the line ages and more ongoing maintenance is required. As rail corridors come on-line, the federal transit formula funding allocated to the metropolitan region typically increases due to the added guideway mileage and service. It is expected that this will continue to occur in the future so that additional federal funds will be available to pay 80 percent of the annual capital maintenance costs of the guideway projects. The Council, using its RTC property tax-backed bonds, would be responsible for the remaining 20 percent of capital maintenance costs.
76
Guideway Status Report Minnesota Department of Transportation/Metropolitan Council January 2012
The estimated capital maintenance costs for the guideway projects are shown in Section 3 of the capacity analysis table. For three corridors (I-394 HOT lane express, I-35W South BRT and Cedar Avenue BRT), the annual capital maintenance costs are included within the corridors’ annual operating costs. Given that it has been operating the longest of the rail corridors, the Hiawatha LRT corridor has the best historical data from which to calculate annual capital maintenance costs. The capital maintenance costs for Central LRT and Southwest LRT are modeled after the experience with Hiawatha. The Northstar costs are estimated based on the limited two-year experience in that corridor. In 2012, capital maintenance costs for Hiawatha are estimated at slightly more than $2 million and Northstar at $500,000. By 2021, the total annual capital maintenance costs for the four rail lines in operation are expected to average just more than $9 million per year. Other Financial Notes
Rounding: As with the corridor summaries, the capacity analysis rounds estimated expenditures to the nearest $100,000. This causes some rows and columns to add imperfectly. In most instances the sum will only differ by $100,000 if at all. Inflation: To facilitate meaningful comparison, the capacity analysis inflates cost estimates to the estimated year of expenditure using a capital cost inflation rate of 3.5 percent and an operating cost inflation rate of 3.15 percent. These rates were approved by the FTA and used in the financial analysis for the Central Corridor LRT New Starts full funding grant application. Cashflow: As shown in the capital cost tables for the Central Corridor and Southwest lines, federal payments for New Starts projects often do not begin until after construction has commenced and typically continue for a few years after the project has been completed. To meet cashflow needs, this requires heavy front-end funding by the state, CTIB and local funding sources as well as borrowing by the Council against future federal payments once a Full Funding Grant Agreement (FFGA) has been issued by the FTA. The financing costs necessary for such borrowing are accounted for in project capital cost estimates, and the associated cashflow adjustments for the Central Corridor and Southwest projects are shown in the capacity analysis.
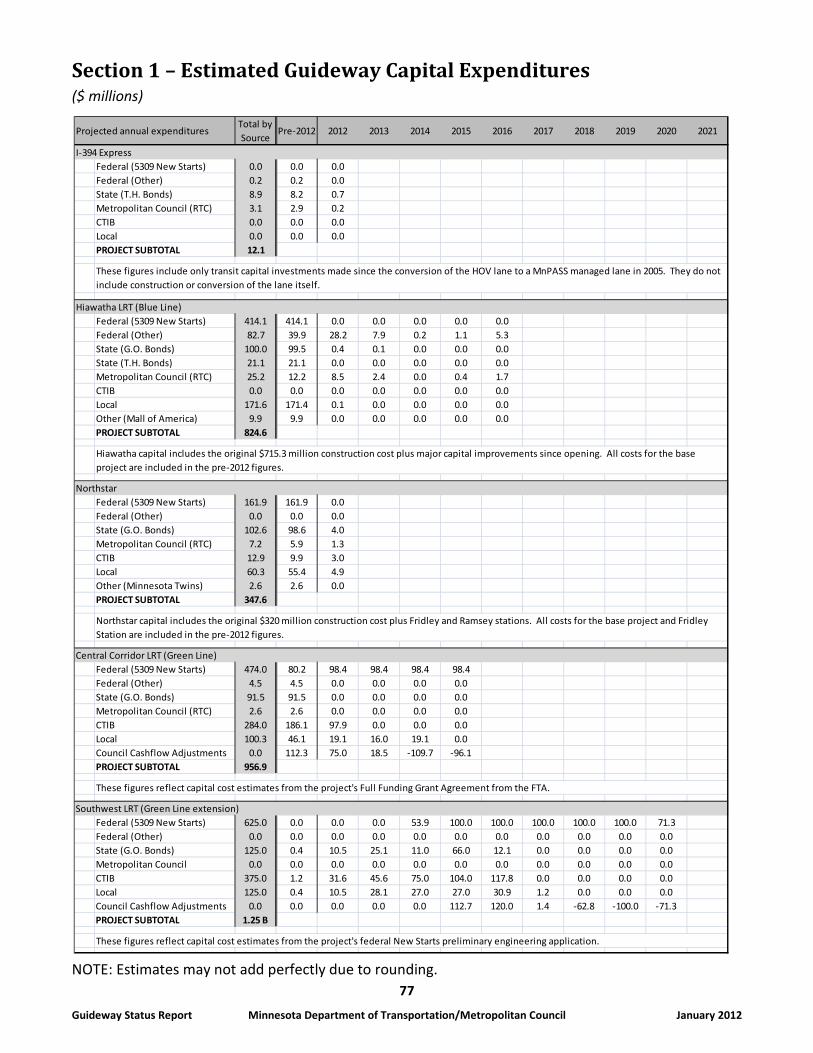
77
Guideway Status Report Minnesota Department of Transportation/Metropolitan Council January 2012
Section 1 – Estimated Guideway Capital Expenditures ($ millions)
NOTE: Estimates may not add perfectly due to rounding.
Projected annual expendituresTotal by Source
Pre-2012 2012 2013 2014 2015 2016 2017 2018 2019 2020 2021
I-394 ExpressFederal (5309 New Starts) 0.0 0.0 0.0Federal (Other) 0.2 0.2 0.0State (T.H. Bonds) 8.9 8.2 0.7Metropolitan Council (RTC) 3.1 2.9 0.2CTIB 0.0 0.0 0.0Local 0.0 0.0 0.0PROJECT SUBTOTAL 12.1
Hiawatha LRT (Blue Line)Federal (5309 New Starts) 414.1 414.1 0.0 0.0 0.0 0.0 0.0Federal (Other) 82.7 39.9 28.2 7.9 0.2 1.1 5.3State (G.O. Bonds) 100.0 99.5 0.4 0.1 0.0 0.0 0.0State (T.H. Bonds) 21.1 21.1 0.0 0.0 0.0 0.0 0.0Metropolitan Council (RTC) 25.2 12.2 8.5 2.4 0.0 0.4 1.7CTIB 0.0 0.0 0.0 0.0 0.0 0.0 0.0Local 171.6 171.4 0.1 0.0 0.0 0.0 0.0Other (Mall of America) 9.9 9.9 0.0 0.0 0.0 0.0 0.0PROJECT SUBTOTAL 824.6
NorthstarFederal (5309 New Starts) 161.9 161.9 0.0Federal (Other) 0.0 0.0 0.0State (G.O. Bonds) 102.6 98.6 4.0Metropolitan Council (RTC) 7.2 5.9 1.3CTIB 12.9 9.9 3.0Local 60.3 55.4 4.9Other (Minnesota Twins) 2.6 2.6 0.0PROJECT SUBTOTAL 347.6
Central Corridor LRT (Green Line)Federal (5309 New Starts) 474.0 80.2 98.4 98.4 98.4 98.4Federal (Other) 4.5 4.5 0.0 0.0 0.0 0.0State (G.O. Bonds) 91.5 91.5 0.0 0.0 0.0 0.0Metropolitan Council (RTC) 2.6 2.6 0.0 0.0 0.0 0.0CTIB 284.0 186.1 97.9 0.0 0.0 0.0Local 100.3 46.1 19.1 16.0 19.1 0.0Council Cashflow Adjustments 0.0 112.3 75.0 18.5 -109.7 -96.1PROJECT SUBTOTAL 956.9
Southwest LRT (Green Line extension)Federal (5309 New Starts) 625.0 0.0 0.0 0.0 53.9 100.0 100.0 100.0 100.0 100.0 71.3Federal (Other) 0.0 0.0 0.0 0.0 0.0 0.0 0.0 0.0 0.0 0.0 0.0State (G.O. Bonds) 125.0 0.4 10.5 25.1 11.0 66.0 12.1 0.0 0.0 0.0 0.0Metropolitan Council 0.0 0.0 0.0 0.0 0.0 0.0 0.0 0.0 0.0 0.0 0.0CTIB 375.0 1.2 31.6 45.6 75.0 104.0 117.8 0.0 0.0 0.0 0.0Local 125.0 0.4 10.5 28.1 27.0 27.0 30.9 1.2 0.0 0.0 0.0Council Cashflow Adjustments 0.0 0.0 0.0 0.0 0.0 112.7 120.0 1.4 -62.8 -100.0 -71.3PROJECT SUBTOTAL 1.25 B
These figures include only transit capital investments made since the conversion of the HOV lane to a MnPASS managed lane in 2005. They do not include construction or conversion of the lane itself.
Hiawatha capital includes the original $715.3 million construction cost plus major capital improvements since opening. All costs for the base project are included in the pre-2012 figures.
Northstar capital includes the original $320 million construction cost plus Fridley and Ramsey stations. All costs for the base project and Fridley Station are included in the pre-2012 figures.
These figures reflect capital cost estimates from the project's Full Funding Grant Agreement from the FTA.
These figures reflect capital cost estimates from the project's federal New Starts preliminary engineering application.
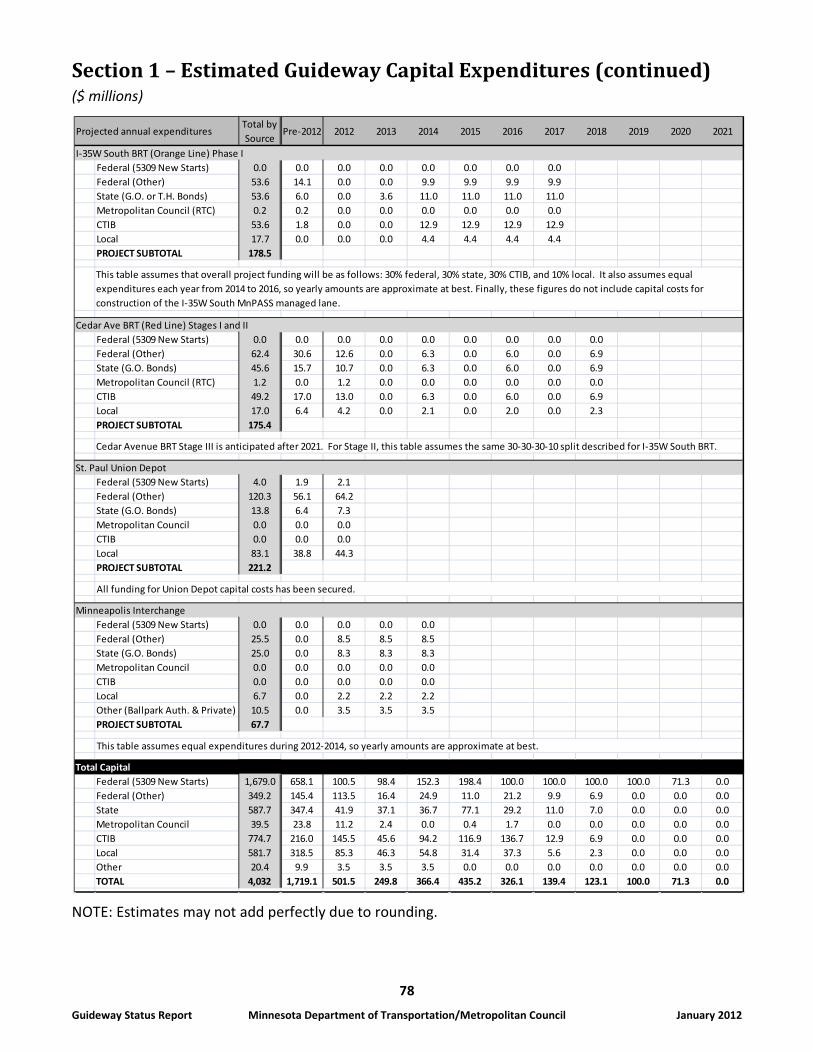
78
Guideway Status Report Minnesota Department of Transportation/Metropolitan Council January 2012
Section 1 – Estimated Guideway Capital Expenditures (continued) ($ millions)
NOTE: Estimates may not add perfectly due to rounding.
Projected annual expendituresTotal by Source
Pre-2012 2012 2013 2014 2015 2016 2017 2018 2019 2020 2021
I-35W South BRT (Orange Line) Phase IFederal (5309 New Starts) 0.0 0.0 0.0 0.0 0.0 0.0 0.0 0.0Federal (Other) 53.6 14.1 0.0 0.0 9.9 9.9 9.9 9.9State (G.O. or T.H. Bonds) 53.6 6.0 0.0 3.6 11.0 11.0 11.0 11.0Metropolitan Council (RTC) 0.2 0.2 0.0 0.0 0.0 0.0 0.0 0.0CTIB 53.6 1.8 0.0 0.0 12.9 12.9 12.9 12.9Local 17.7 0.0 0.0 0.0 4.4 4.4 4.4 4.4PROJECT SUBTOTAL 178.5
Cedar Ave BRT (Red Line) Stages I and IIFederal (5309 New Starts) 0.0 0.0 0.0 0.0 0.0 0.0 0.0 0.0 0.0Federal (Other) 62.4 30.6 12.6 0.0 6.3 0.0 6.0 0.0 6.9State (G.O. Bonds) 45.6 15.7 10.7 0.0 6.3 0.0 6.0 0.0 6.9Metropolitan Council (RTC) 1.2 0.0 1.2 0.0 0.0 0.0 0.0 0.0 0.0CTIB 49.2 17.0 13.0 0.0 6.3 0.0 6.0 0.0 6.9Local 17.0 6.4 4.2 0.0 2.1 0.0 2.0 0.0 2.3PROJECT SUBTOTAL 175.4
St. Paul Union DepotFederal (5309 New Starts) 4.0 1.9 2.1Federal (Other) 120.3 56.1 64.2State (G.O. Bonds) 13.8 6.4 7.3Metropolitan Council 0.0 0.0 0.0CTIB 0.0 0.0 0.0Local 83.1 38.8 44.3PROJECT SUBTOTAL 221.2
Minneapolis InterchangeFederal (5309 New Starts) 0.0 0.0 0.0 0.0 0.0Federal (Other) 25.5 0.0 8.5 8.5 8.5State (G.O. Bonds) 25.0 0.0 8.3 8.3 8.3Metropolitan Council 0.0 0.0 0.0 0.0 0.0CTIB 0.0 0.0 0.0 0.0 0.0Local 6.7 0.0 2.2 2.2 2.2Other (Ballpark Auth. & Private) 10.5 0.0 3.5 3.5 3.5PROJECT SUBTOTAL 67.7
Total CapitalFederal (5309 New Starts) 1,679.0 658.1 100.5 98.4 152.3 198.4 100.0 100.0 100.0 100.0 71.3 0.0Federal (Other) 349.2 145.4 113.5 16.4 24.9 11.0 21.2 9.9 6.9 0.0 0.0 0.0State 587.7 347.4 41.9 37.1 36.7 77.1 29.2 11.0 7.0 0.0 0.0 0.0Metropolitan Council 39.5 23.8 11.2 2.4 0.0 0.4 1.7 0.0 0.0 0.0 0.0 0.0CTIB 774.7 216.0 145.5 45.6 94.2 116.9 136.7 12.9 6.9 0.0 0.0 0.0Local 581.7 318.5 85.3 46.3 54.8 31.4 37.3 5.6 2.3 0.0 0.0 0.0Other 20.4 9.9 3.5 3.5 3.5 0.0 0.0 0.0 0.0 0.0 0.0 0.0TOTAL 4,032 1,719.1 501.5 249.8 366.4 435.2 326.1 139.4 123.1 100.0 71.3 0.0
This table assumes that overall project funding will be as follows: 30% federal, 30% state, 30% CTIB, and 10% local. It also assumes equal expenditures each year from 2014 to 2016, so yearly amounts are approximate at best. Finally, these figures do not include capital costs for construction of the I-35W South MnPASS managed lane.
Cedar Avenue BRT Stage III is anticipated after 2021. For Stage II, this table assumes the same 30-30-30-10 split described for I-35W South BRT.
All funding for Union Depot capital costs has been secured.
This table assumes equal expenditures during 2012-2014, so yearly amounts are approximate at best.
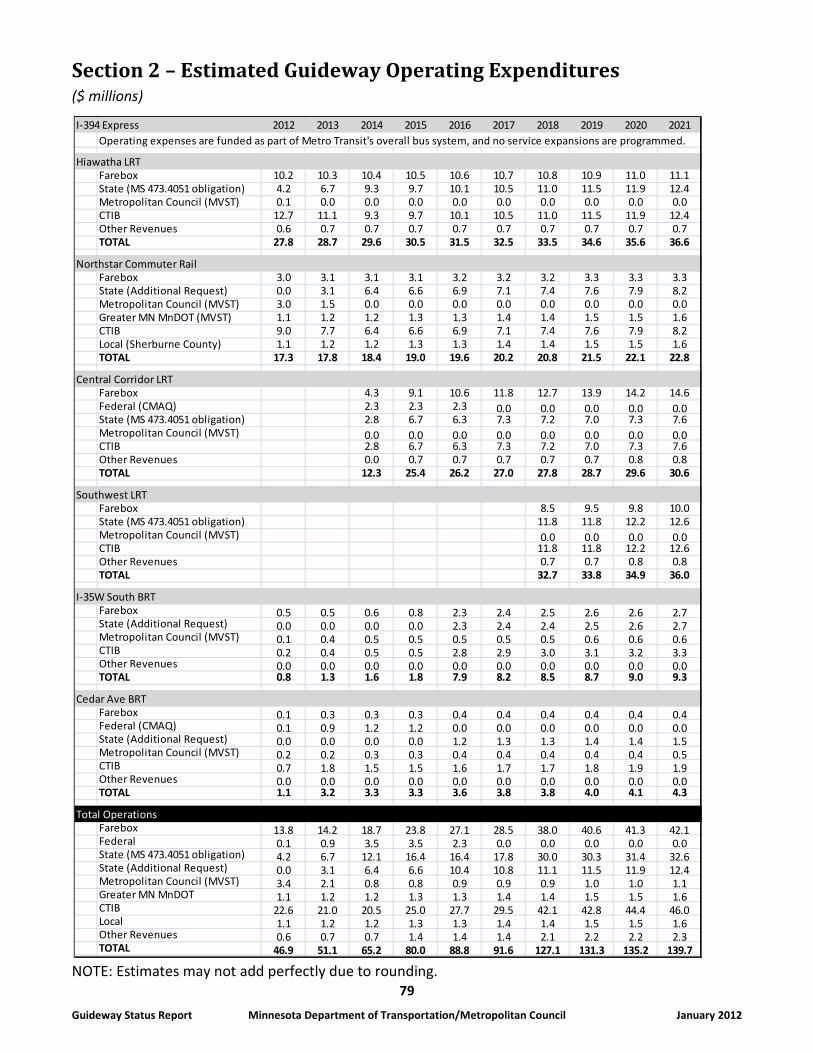
79
Guideway Status Report Minnesota Department of Transportation/Metropolitan Council January 2012
Section 2 – Estimated Guideway Operating Expenditures ($ millions)
NOTE: Estimates may not add perfectly due to rounding.
I-394 Express 2012 2013 2014 2015 2016 2017 2018 2019 2020 2021
Hiawatha LRTFarebox 10.2 10.3 10.4 10.5 10.6 10.7 10.8 10.9 11.0 11.1State (MS 473.4051 obligation) 4.2 6.7 9.3 9.7 10.1 10.5 11.0 11.5 11.9 12.4Metropolitan Council (MVST) 0.1 0.0 0.0 0.0 0.0 0.0 0.0 0.0 0.0 0.0CTIB 12.7 11.1 9.3 9.7 10.1 10.5 11.0 11.5 11.9 12.4Other Revenues 0.6 0.7 0.7 0.7 0.7 0.7 0.7 0.7 0.7 0.7TOTAL 27.8 28.7 29.6 30.5 31.5 32.5 33.5 34.6 35.6 36.6
Northstar Commuter RailFarebox 3.0 3.1 3.1 3.1 3.2 3.2 3.2 3.3 3.3 3.3State (Additional Request) 0.0 3.1 6.4 6.6 6.9 7.1 7.4 7.6 7.9 8.2Metropolitan Council (MVST) 3.0 1.5 0.0 0.0 0.0 0.0 0.0 0.0 0.0 0.0Greater MN MnDOT (MVST) 1.1 1.2 1.2 1.3 1.3 1.4 1.4 1.5 1.5 1.6CTIB 9.0 7.7 6.4 6.6 6.9 7.1 7.4 7.6 7.9 8.2Local (Sherburne County) 1.1 1.2 1.2 1.3 1.3 1.4 1.4 1.5 1.5 1.6TOTAL 17.3 17.8 18.4 19.0 19.6 20.2 20.8 21.5 22.1 22.8
Central Corridor LRTFarebox 4.3 9.1 10.6 11.8 12.7 13.9 14.2 14.6Federal (CMAQ) 2.3 2.3 2.3 0.0 0.0 0.0 0.0 0.0State (MS 473.4051 obligation) 2.8 6.7 6.3 7.3 7.2 7.0 7.3 7.6Metropolitan Council (MVST) 0.0 0.0 0.0 0.0 0.0 0.0 0.0 0.0CTIB 2.8 6.7 6.3 7.3 7.2 7.0 7.3 7.6Other Revenues 0.0 0.7 0.7 0.7 0.7 0.7 0.8 0.8TOTAL 12.3 25.4 26.2 27.0 27.8 28.7 29.6 30.6
Southwest LRTFarebox 8.5 9.5 9.8 10.0State (MS 473.4051 obligation) 11.8 11.8 12.2 12.6Metropolitan Council (MVST) 0.0 0.0 0.0 0.0CTIB 11.8 11.8 12.2 12.6Other Revenues 0.7 0.7 0.8 0.8TOTAL 32.7 33.8 34.9 36.0
I-35W South BRTFarebox 0.5 0.5 0.6 0.8 2.3 2.4 2.5 2.6 2.6 2.7State (Additional Request) 0.0 0.0 0.0 0.0 2.3 2.4 2.4 2.5 2.6 2.7Metropolitan Council (MVST) 0.1 0.4 0.5 0.5 0.5 0.5 0.5 0.6 0.6 0.6CTIB 0.2 0.4 0.5 0.5 2.8 2.9 3.0 3.1 3.2 3.3Other Revenues 0.0 0.0 0.0 0.0 0.0 0.0 0.0 0.0 0.0 0.0TOTAL 0.8 1.3 1.6 1.8 7.9 8.2 8.5 8.7 9.0 9.3
Cedar Ave BRTFarebox 0.1 0.3 0.3 0.3 0.4 0.4 0.4 0.4 0.4 0.4Federal (CMAQ) 0.1 0.9 1.2 1.2 0.0 0.0 0.0 0.0 0.0 0.0State (Additional Request) 0.0 0.0 0.0 0.0 1.2 1.3 1.3 1.4 1.4 1.5Metropolitan Council (MVST) 0.2 0.2 0.3 0.3 0.4 0.4 0.4 0.4 0.4 0.5CTIB 0.7 1.8 1.5 1.5 1.6 1.7 1.7 1.8 1.9 1.9Other Revenues 0.0 0.0 0.0 0.0 0.0 0.0 0.0 0.0 0.0 0.0TOTAL 1.1 3.2 3.3 3.3 3.6 3.8 3.8 4.0 4.1 4.3
Total OperationsFarebox 13.8 14.2 18.7 23.8 27.1 28.5 38.0 40.6 41.3 42.1Federal 0.1 0.9 3.5 3.5 2.3 0.0 0.0 0.0 0.0 0.0State (MS 473.4051 obligation) 4.2 6.7 12.1 16.4 16.4 17.8 30.0 30.3 31.4 32.6State (Additional Request) 0.0 3.1 6.4 6.6 10.4 10.8 11.1 11.5 11.9 12.4Metropolitan Council (MVST) 3.4 2.1 0.8 0.8 0.9 0.9 0.9 1.0 1.0 1.1Greater MN MnDOT 1.1 1.2 1.2 1.3 1.3 1.4 1.4 1.5 1.5 1.6CTIB 22.6 21.0 20.5 25.0 27.7 29.5 42.1 42.8 44.4 46.0Local 1.1 1.2 1.2 1.3 1.3 1.4 1.4 1.5 1.5 1.6Other Revenues 0.6 0.7 0.7 1.4 1.4 1.4 2.1 2.2 2.2 2.3TOTAL 46.9 51.1 65.2 80.0 88.8 91.6 127.1 131.3 135.2 139.7
Operating expenses are funded as part of Metro Transit's overall bus system, and no service expansions are programmed.
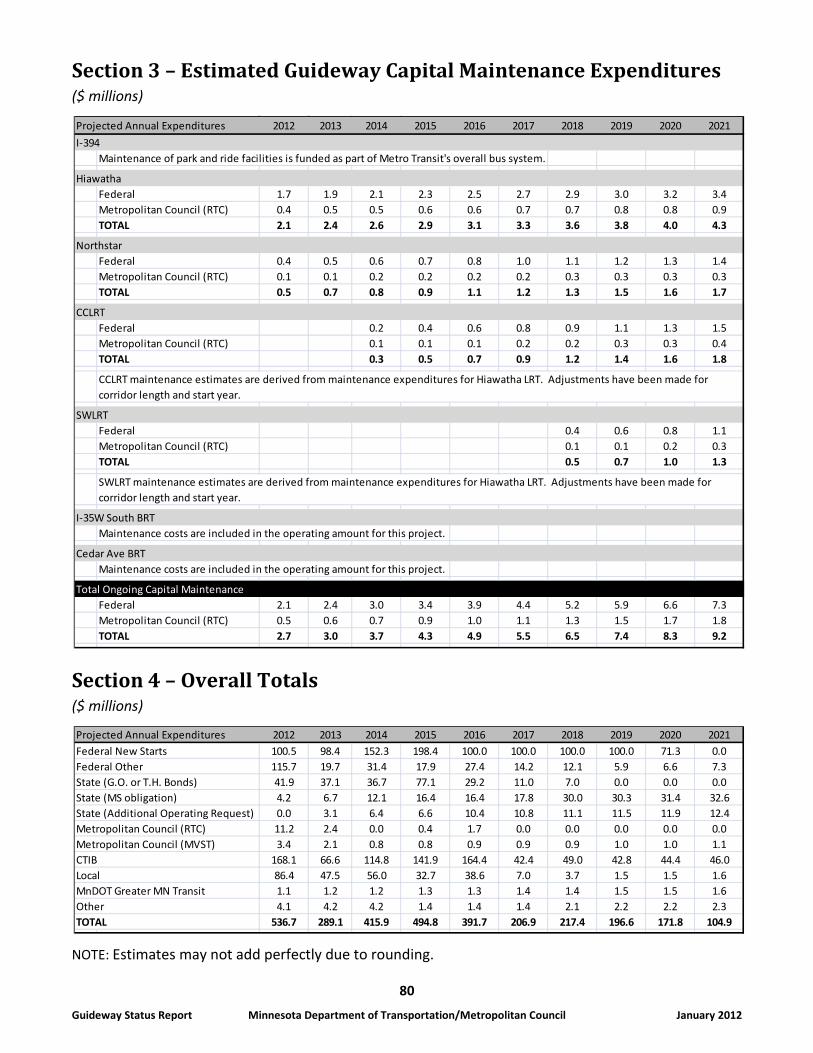
80
Guideway Status Report Minnesota Department of Transportation/Metropolitan Council January 2012
Section 3 – Estimated Guideway Capital Maintenance Expenditures ($ millions)
Section 4 – Overall Totals ($ millions)
NOTE: Estimates may not add perfectly due to rounding.
Projected Annual Expenditures 2012 2013 2014 2015 2016 2017 2018 2019 2020 2021I-394
Maintenance of park and ride facilities is funded as part of Metro Transit's overall bus system.
HiawathaFederal 1.7 1.9 2.1 2.3 2.5 2.7 2.9 3.0 3.2 3.4Metropolitan Council (RTC) 0.4 0.5 0.5 0.6 0.6 0.7 0.7 0.8 0.8 0.9TOTAL 2.1 2.4 2.6 2.9 3.1 3.3 3.6 3.8 4.0 4.3
NorthstarFederal 0.4 0.5 0.6 0.7 0.8 1.0 1.1 1.2 1.3 1.4Metropolitan Council (RTC) 0.1 0.1 0.2 0.2 0.2 0.2 0.3 0.3 0.3 0.3TOTAL 0.5 0.7 0.8 0.9 1.1 1.2 1.3 1.5 1.6 1.7
CCLRTFederal 0.2 0.4 0.6 0.8 0.9 1.1 1.3 1.5Metropolitan Council (RTC) 0.1 0.1 0.1 0.2 0.2 0.3 0.3 0.4TOTAL 0.3 0.5 0.7 0.9 1.2 1.4 1.6 1.8
SWLRTFederal 0.4 0.6 0.8 1.1Metropolitan Council (RTC) 0.1 0.1 0.2 0.3TOTAL 0.5 0.7 1.0 1.3
I-35W South BRTMaintenance costs are included in the operating amount for this project.
Cedar Ave BRTMaintenance costs are included in the operating amount for this project.
Total Ongoing Capital MaintenanceFederal 2.1 2.4 3.0 3.4 3.9 4.4 5.2 5.9 6.6 7.3Metropolitan Council (RTC) 0.5 0.6 0.7 0.9 1.0 1.1 1.3 1.5 1.7 1.8TOTAL 2.7 3.0 3.7 4.3 4.9 5.5 6.5 7.4 8.3 9.2
CCLRT maintenance estimates are derived from maintenance expenditures for Hiawatha LRT. Adjustments have been made for corridor length and start year.
SWLRT maintenance estimates are derived from maintenance expenditures for Hiawatha LRT. Adjustments have been made for corridor length and start year.
Projected Annual Expenditures 2012 2013 2014 2015 2016 2017 2018 2019 2020 2021Federal New Starts 100.5 98.4 152.3 198.4 100.0 100.0 100.0 100.0 71.3 0.0Federal Other 115.7 19.7 31.4 17.9 27.4 14.2 12.1 5.9 6.6 7.3State (G.O. or T.H. Bonds) 41.9 37.1 36.7 77.1 29.2 11.0 7.0 0.0 0.0 0.0State (MS obligation) 4.2 6.7 12.1 16.4 16.4 17.8 30.0 30.3 31.4 32.6State (Additional Operating Request) 0.0 3.1 6.4 6.6 10.4 10.8 11.1 11.5 11.9 12.4Metropolitan Council (RTC) 11.2 2.4 0.0 0.4 1.7 0.0 0.0 0.0 0.0 0.0Metropolitan Council (MVST) 3.4 2.1 0.8 0.8 0.9 0.9 0.9 1.0 1.0 1.1CTIB 168.1 66.6 114.8 141.9 164.4 42.4 49.0 42.8 44.4 46.0Local 86.4 47.5 56.0 32.7 38.6 7.0 3.7 1.5 1.5 1.6MnDOT Greater MN Transit 1.1 1.2 1.2 1.3 1.3 1.4 1.4 1.5 1.5 1.6Other 4.1 4.2 4.2 1.4 1.4 1.4 2.1 2.2 2.2 2.3TOTAL 536.7 289.1 415.9 494.8 391.7 206.9 217.4 196.6 171.8 104.9
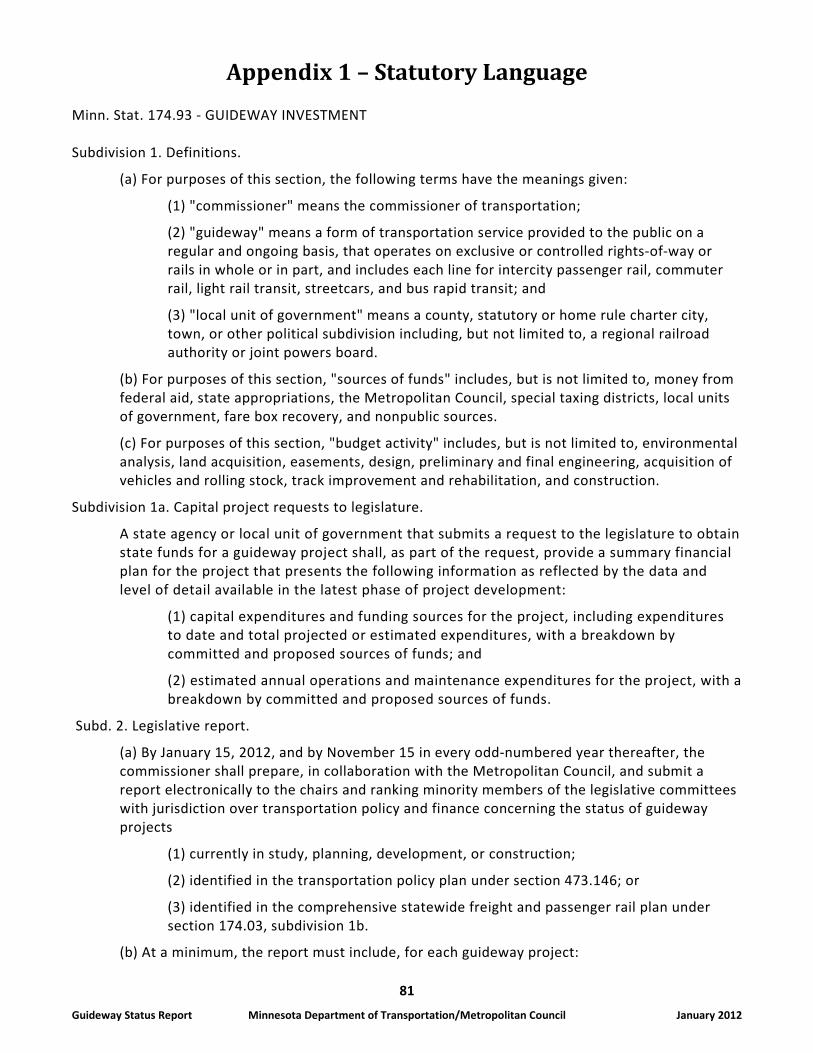
81
Guideway Status Report Minnesota Department of Transportation/Metropolitan Council January 2012
Appendix 1 – Statutory Language
Minn. Stat. 174.93 - GUIDEWAY INVESTMENT Subdivision 1. Definitions.
(a) For purposes of this section, the following terms have the meanings given:
(1) "commissioner" means the commissioner of transportation;
(2) "guideway" means a form of transportation service provided to the public on a regular and ongoing basis, that operates on exclusive or controlled rights-of-way or rails in whole or in part, and includes each line for intercity passenger rail, commuter rail, light rail transit, streetcars, and bus rapid transit; and
(3) "local unit of government" means a county, statutory or home rule charter city, town, or other political subdivision including, but not limited to, a regional railroad authority or joint powers board.
(b) For purposes of this section, "sources of funds" includes, but is not limited to, money from federal aid, state appropriations, the Metropolitan Council, special taxing districts, local units of government, fare box recovery, and nonpublic sources.
(c) For purposes of this section, "budget activity" includes, but is not limited to, environmental analysis, land acquisition, easements, design, preliminary and final engineering, acquisition of vehicles and rolling stock, track improvement and rehabilitation, and construction.
Subdivision 1a. Capital project requests to legislature.
A state agency or local unit of government that submits a request to the legislature to obtain state funds for a guideway project shall, as part of the request, provide a summary financial plan for the project that presents the following information as reflected by the data and level of detail available in the latest phase of project development:
(1) capital expenditures and funding sources for the project, including expenditures to date and total projected or estimated expenditures, with a breakdown by committed and proposed sources of funds; and
(2) estimated annual operations and maintenance expenditures for the project, with a breakdown by committed and proposed sources of funds.
Subd. 2. Legislative report.
(a) By January 15, 2012, and by November 15 in every odd-numbered year thereafter, the commissioner shall prepare, in collaboration with the Metropolitan Council, and submit a report electronically to the chairs and ranking minority members of the legislative committees with jurisdiction over transportation policy and finance concerning the status of guideway projects
(1) currently in study, planning, development, or construction;
(2) identified in the transportation policy plan under section 473.146; or
(3) identified in the comprehensive statewide freight and passenger rail plan under section 174.03, subdivision 1b.
(b) At a minimum, the report must include, for each guideway project:
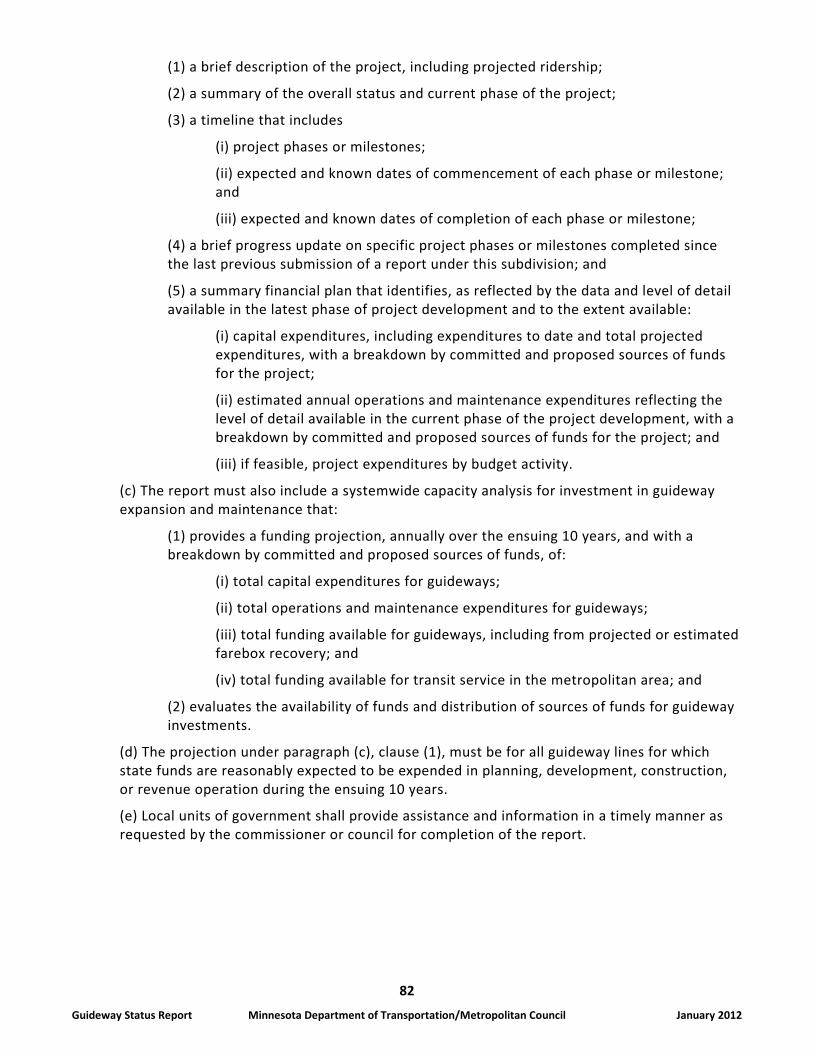
82
Guideway Status Report Minnesota Department of Transportation/Metropolitan Council January 2012
(1) a brief description of the project, including projected ridership;
(2) a summary of the overall status and current phase of the project;
(3) a timeline that includes
(i) project phases or milestones;
(ii) expected and known dates of commencement of each phase or milestone; and
(iii) expected and known dates of completion of each phase or milestone;
(4) a brief progress update on specific project phases or milestones completed since the last previous submission of a report under this subdivision; and
(5) a summary financial plan that identifies, as reflected by the data and level of detail available in the latest phase of project development and to the extent available:
(i) capital expenditures, including expenditures to date and total projected expenditures, with a breakdown by committed and proposed sources of funds for the project;
(ii) estimated annual operations and maintenance expenditures reflecting the level of detail available in the current phase of the project development, with a breakdown by committed and proposed sources of funds for the project; and
(iii) if feasible, project expenditures by budget activity.
(c) The report must also include a systemwide capacity analysis for investment in guideway expansion and maintenance that:
(1) provides a funding projection, annually over the ensuing 10 years, and with a breakdown by committed and proposed sources of funds, of:
(i) total capital expenditures for guideways;
(ii) total operations and maintenance expenditures for guideways;
(iii) total funding available for guideways, including from projected or estimated farebox recovery; and
(iv) total funding available for transit service in the metropolitan area; and
(2) evaluates the availability of funds and distribution of sources of funds for guideway investments.
(d) The projection under paragraph (c), clause (1), must be for all guideway lines for which state funds are reasonably expected to be expended in planning, development, construction, or revenue operation during the ensuing 10 years.
(e) Local units of government shall provide assistance and information in a timely manner as requested by the commissioner or council for completion of the report.
83
Guideway Status Report Minnesota Department of Transportation/Metropolitan Council January 2012
Appendix 2 –Transit Funding Sources Excerpt from Regional Transitway Guidelines Technical Report, May 2011 Chapter 10: Project Development, Leadership and Oversight The draft Regional Transitway Guidelines can be accessed at: www.metrocouncil.org/planning/transportation/transitways/TransitwayGuidelines.htm Transit Funding Sources and Programs
The following section highlights transit and transitway funding programs available under existing federal and state laws. The table at the end of this section provides a summary of the information including a listing of the potential funding sources, approximate amount available annually, a summary of how the funds are made available, and requirements governing how the funds may be used.
Federal Transit Funding
New Starts (5309) – New Starts funding may be used for new or extended fixed-guideway transit system projects. A project is only eligible for New Starts funding once it has entered the preliminary engineering phase of development. The funding may only be used on projects approved through the New Starts application and approval process. A minimum local match of 20 percent is required for all New Starts funding. Current federal policy has limited annual funding from the New Starts program to $95 M.
Small Starts (5309) – Small Starts funding may be used on new or extended transit system projects that are fixed guideway for at least 50 percent or bus projects with ten/fifteen minute headways. A project is only eligible for Small Starts funding once it has entered the preliminary engineering phase of development. The funding may only be used on projects approved through the Small Starts application and approval process and requires. A minimum local match of 20 percent is required for all Small Starts funding.
Bus Capital Improvements (5309) – Bus Capital Improvements funding may be used for bus capital and preventative maintenance projects. Rail capital projects are not eligible for this funding. The funding is provided through congressional earmarks and varies in amount from year to year. The Metropolitan Council or Mn/DOT serves as the designated federal recipient for these funds and, if awarded to another regional entity, acts as the fiscal oversight agency. A minimum local match of 20 percent is required for all Bus Capital Improvements funding.
Urbanized Area Formula (5307 & 5340) – Urban Area Formula funding may be used for transit system replacement and expansion, capital purposes, preventative maintenance, and the capital costs of contracting. Non-transit capital projects are not eligible for this funding. The Metropolitan Council is allocated the Urban Area Formula funds through a federal formula and allocates funds to specific
84
Guideway Status Report Minnesota Department of Transportation/Metropolitan Council January 2012
projects in the region through the annual development of the Council’s six-year Capital Improvement Plan (CIP). The Twin Cities region typically receives an estimated $50 million annually in Urbanized Area Formula funding (per 2010 data). A minimum local match of 20 percent is required for all Urban Area Formula funds.
Fixed Guideway Modernization (5309) – Fixed Guideway Modernization funding may be used for capital and preventative maintenance on fixed guideway projects, including BRT on exclusive or high-occupancy vehicle (HOV) lanes and bus-only shoulders. Non-fixed-guideway projects are not eligible for this funding. The Metropolitan Council is allocated the Fixed Guideway Modernization funds through a federal formula and allocates these funds to specific fixed-guideway projects through annual development of the six-year CIP. The Twin Cities region typically receives an estimated $13.6 million annually in Fixed Guideway Modernization funding (per 2010 data). A minimum local match of 20 percent is required for all Fixed Guideway Modernization funding.
Alternative Analysis (AA) (5339) – Alternative analysis funding may be used on a transit project during the alternative analysis phase of development, until the selection of the locally preferred alternative (LPA). The spending of the AA funding must be completed by the project’s entry into the preliminary engineering (PE) phase of development. Alternative analysis funding is provided through congressional earmarks and varies in amount from year-to-year. A minimum local match of 20 percent is required for all AA funding.
Congestion Mitigation and Air Quality (CMAQ) – Congestion Mitigation and Air Quality funding may be used on transit capital and operating expansion. Existing transit operations and capital are not eligible for CMAQ funding. CMAQ funding is distributed in the region through a regional solicitation process led by the Transportation Advisory Board (TAB) and its Technical Advisory Committee (TAC). The Twin Cities region typically receives an estimated $25 million annually in CMAQ funding (per 2010 data). The regional solicitation process limits projects to a maximum of $7.0 million and allocates these funds four years in advance of expected expenditure (i.e. 2011 solicitation is for funds in 2015 and 2016) though recipients can choose to advance construct projects and be reimbursed in the award year. A minimum local match of 20 percent is required for all CMAQ funding.
Surface Transportation Urban Program (STP-U/STP-Urban) – Surface Transportation Urban Program funding is primarily used for road construction purposes, up to $7 million per project. In order to be eligible for funding, a project must meet the solicitation category requirements. STP-Urban funding is distributed in the region through a regional solicitation process led by the TAB and its TAC. The Twin Cities region typically receives an estimated $43 million annually in STP-Urban funding (per 2010 data). A minimum local match of 20 percent is required for all STP-Urban funding. Currently, the solicitation categories do not include a category specifically for transit projects, but elements of a road project that benefit transit are eligible and typically given extra points to the project ranking.
Transportation Enhancements – Transportation Enhancements funding is used primarily for bicycle, pedestrian, and trail projects. In order to be eligible for funding, a project must meet the solicitation category requirements. Transportation Enhancements funding is distributed in the region through a
85
Guideway Status Report Minnesota Department of Transportation/Metropolitan Council January 2012
regional solicitation process led by the TAB its TAC. The Twin Cities region typically receives an estimated $8 million annually in Transportation Enhancements funding (per 2010 data). A minimum local match of 20 percent is required for all Transportation Enhancements funding.
Federal Railroad Administration (FRA) – Federal Railroad Administration funding may be used on intercity passenger rail facilities. FRA funding is provided through congressional appropriations and varies in amount from year to year.
Unified Planning Work Program (UPWP) (5303) – Unified Planning Work Program funding may be used for transportation planning activities but may not be used on design, engineering, construction or capital related expenditures. As the regional Metropolitan Planning Organization (MPO) UPWP funding is allocated to the Metropolitan Council Metropolitan Transportation Services (MTS). MTS produces an annual work program specifying how the planning funds will be used with the majority of the funding used to support MTS planning staff work. The Twin Cities region typically receives an estimated $3.5 million annually in UPWP funding (per 2010 data). A minimum local match of 20 percent is required for all UPWP funding.
Special Grant Programs – There are many special grant programs that may provide funding for transitway projects, past programs include the Urban Partnership Agreement (UPA), the American Recovery and Reinvestment Act (ARRA), Transportation Investment Generating Economic Recovery (TIGER), and Transit Investments for Greenhouse Gas and Energy Reduction (TIGGER). The specifics of funding from these competitive programs - eligible/ineligible uses, estimated annual amount, local match – vary by specific grant type. The funding is allocated through Federal grant processes both FTA and Federal Highway Administration (FHWA), with some grants requiring submittal through the Metropolitan Council or Mn/DOT.
State Transit Funding
State General Fund – Funding from the state general fund is made available for transitway projects through appropriations by the state legislature and varies in amount from year to year. General funds are rarely used for capital investments and may include additional restrictions as specified in the appropriation language. General funds may be used for transitway operations and currently Hiawatha LRT receives an annual general fund appropriation of $5.2 million.
General Obligation (GO) Bonds – General obligation bonds can provide funding for transitway capital and are allocated through state legislative appropriations in varying amounts. Typically, the state has a large bonding bill in even numbered sessions and smaller or no bonding bill in the odd numbered sessions. The specific use of the funds is dictated by the appropriation language. Any capital expenditure funded by GO bonds must be for a specific capital project that will have a 20-year life and the asset must be owned by the public entity specified in the appropriation. GO bonds may not be used for planning studies, alternatives analysis, technology, vehicles, or operations expenditures. Minnesota Management and Budget (MMB) has directed that state GO bonds appropriated to the
86
Guideway Status Report Minnesota Department of Transportation/Metropolitan Council January 2012
Council are not to be passed through to sub-recipients unless the bond appropriation language permits a pass-through.
Mn/DOT Trunk Highway Funds and Bonds – Mn/DOT trunk highway funds and bonds may be used on transitway projects that further a trunk highway purpose. Trunk highway funding can only be used for trunk highway purposes and cannot be used for transit operations. Capital assets that utilize trunk highway bonds must have a 20-year life, be owned by Mn/DOT and are considered part of the trunk highway system. Trunk highway funding and bonds are allocated through the state legislative process or a Mn/DOT grant program in varying amounts.
State Transit Funding Related Laws – Minn. Stat. 473.4051 subd. 3, prohibits state money from being used to pay more than 10 percent of the total capital cost of an LRT project.
In addition, Minn. Stat. 473.4051, subd. 2, states that “after operating and federal money have been used to pay for light rail transit operations, 50 percent of the remaining costs must be paid by the state.”
Metropolitan Council Funding
Motor Vehicle Sales Tax (MVST) – Minn. Stat. 297B.09 allocated 36 percent of the state Motor Vehicle Sales Tax funding to the metropolitan area transit fund to be used for transit assistance in the metropolitan area. The Metropolitan Council is responsible for allocating the MVST funds to various transit purposes. The funds are primarily used to pay for existing transit operations, both rail and bus. The funds may be used on transitway projects for existing operations or capital and operating expansion. MVST funding is allocated annually by the Council through the adopted Regional Transit Operating Revenue Allocation Procedure and Regional Transit Capital Revenue Allocation Procedure (adopted in September 2010).
Regional Transit Capital (RTC) Bonds – Regional transit capital funds are bond funds where the debt service is paid using the Council’s transit capital levy. The legislature is responsible for authorizing the amount of RTC bonds that may be sold and the Council is responsible for setting the annual levy to pay the debt. RTC funds are used for transit capital expenditures including assets with shorter than a 20-year life including transit vehicles and technology. RTC funds may not be used for transit operations or planning activities. RTC funds are allocated by the Council through annual development of the six-year CIP. There is typically $35 million in RTC funding available annually in the Twin Cities region.
Fares and Other Self-Generated Funds – Fares and other self-generated funds are typically used for transit operations. Fares from a transitway project are allocated specifically to the operations of that transitway. This allows for calculation of a net subsidy which represents the public cost after accounting for the fare revenue. The transit operator is responsible for allocating fare revenues through the budgeting process. Other self-generated revenue may include advertising revenue or interest income. These revenues are typically used for operating purposes but could be allocated to a capital expenditure.
87
Guideway Status Report Minnesota Department of Transportation/Metropolitan Council January 2012
Counties Transit Improvement Board (CTIB) Funding
Metro Counties Sales Tax – In April 2008 under authorizing legislation contained in Minn. Stat. 297A.99, five counties – Anoka, Dakota, Hennepin, Ramsey and Washington – formed a joint powers board known as the Counties Transit Improvement Board (CTIB) and implemented a quarter-cent sales tax and $20 a motor vehicle sales tax to fund transitway projects within these counties. The sales tax currently raises approximately $88 million annuals and under the legislation, may be used for transitway capital and operating costs. CTIB has adopted a Transitway Investment Framework, which establishes principles and rules regarding how the CTIB will invest in transitway development. Additionally, Metro Counties Sales Tax revenues cannot be used to fund more than 30 percent of the total transitway costs, though an individual component of the overall project may receive more than 30 percent if approved by CTIB. Currently, the Metro Counties Sales Tax raises an estimated $88 million annually and the funding is allocated through the CTIB grant application process. A minimum of a ten percent local (non-state) match is required for all CTIB funding.
Local Funding
Regional Railroad Authority (RRA) – Minn. Stat. 398A.04 provides RRAs with the power to impose a property tax levy not to exceed 0.04835 percent of market value of all taxable property within the RRA boundary. Minn. Stat. 398A.07 states that a regional railroad authority may issue bonds as necessary to fulfill its purpose and to exercise any of its powers to provide funds for operating expenses in anticipation of revenues or for capital expenditures in anticipation of other funds.
Regional Railroad Authority funds may be available for transitway projects. Typically RRA funds are used for the AA phase of development, environmental processes, right of way acquisition, or for the local match in rail projects, with the exception of the Cedar Avenue BRT project in Dakota County. RRA funds must be no more than ten percent of the total capital project costs and cannot be used for rail operations in the counties that have enacted the Metro Counties Sales Tax (see Minn. Stat. 398A.10). The amount of funding available is tied to the levy limit and is allocated through the RRA budgeting process.
County General Fund – County general funds may be used on transitway projects as allocated. General funds are allocated through the county budget process and vary in amount from year to year.
County Highway Funds –County highway funds may be used for highway related transit improvements but may not be used for non-highway transitway purposes. Highway funds are allocated through the county budget process and vary from year to year.
City General Fund – City general funds may be used on transitway projects as allocated. General funds are allocated through the city budget process and vary in amount from year to year.
Municipal Highway Funds – Municipal highway funds may be used for highway related transit improvements but may not be used for non-highway transitway purposes. Highway funds are allocated through the city budget process and vary in amount from year to year.
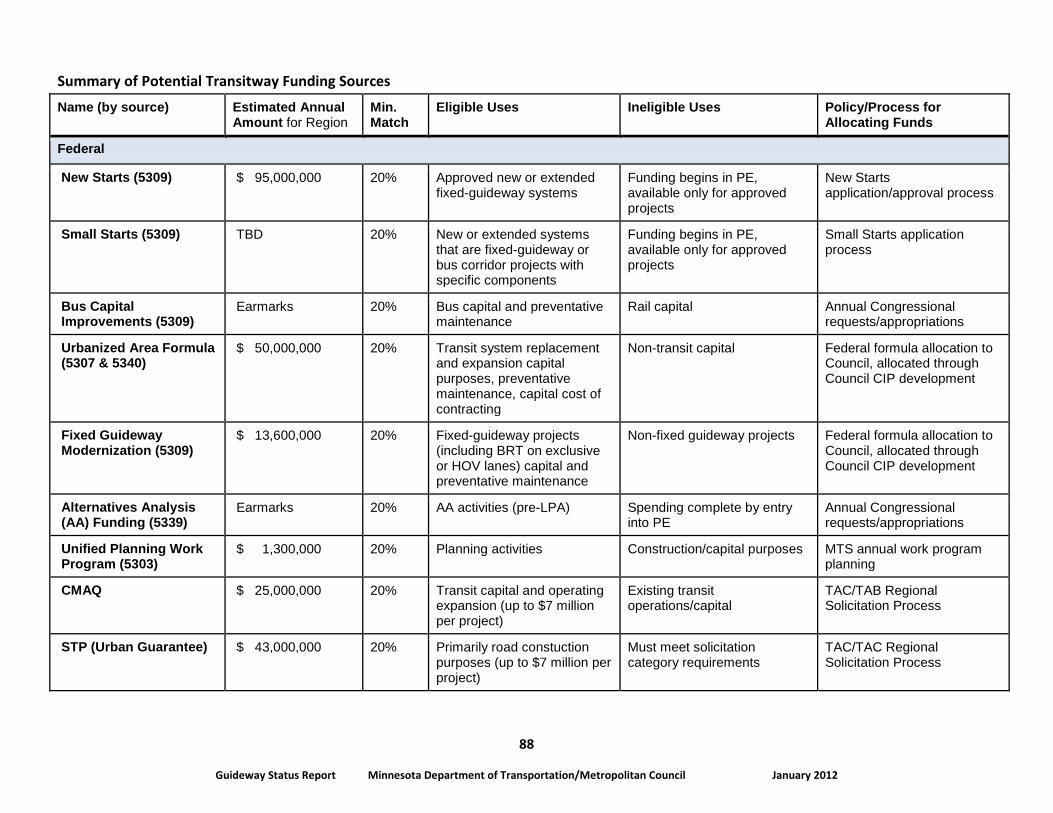
88
Guideway Status Report Minnesota Department of Transportation/Metropolitan Council January 2012
Summary of Potential Transitway Funding Sources
Name (by source) Estimated Annual Amount for Region
Min. Match
Eligible Uses Ineligible Uses Policy/Process for Allocating Funds
Federal
New Starts (5309) $ 95,000,000 20% Approved new or extended fixed-guideway systems
Funding begins in PE, available only for approved projects
New Starts application/approval process
Small Starts (5309) TBD 20% New or extended systems that are fixed-guideway or bus corridor projects with specific components
Funding begins in PE, available only for approved projects
Small Starts application process
Bus Capital Improvements (5309)
Earmarks 20% Bus capital and preventative maintenance
Rail capital Annual Congressional requests/appropriations
Urbanized Area Formula (5307 & 5340)
$ 50,000,000 20% Transit system replacement and expansion capital purposes, preventative maintenance, capital cost of contracting
Non-transit capital Federal formula allocation to Council, allocated through Council CIP development
Fixed Guideway Modernization (5309)
$ 13,600,000 20% Fixed-guideway projects (including BRT on exclusive or HOV lanes) capital and preventative maintenance
Non-fixed guideway projects Federal formula allocation to Council, allocated through Council CIP development
Alternatives Analysis (AA) Funding (5339)
Earmarks 20% AA activities (pre-LPA) Spending complete by entry into PE
Annual Congressional requests/appropriations
Unified Planning Work Program (5303)
$ 1,300,000 20% Planning activities Construction/capital purposes MTS annual work program planning
CMAQ $ 25,000,000 20% Transit capital and operating expansion (up to $7 million per project)
Existing transit operations/capital
TAC/TAB Regional Solicitation Process
STP (Urban Guarantee) $ 43,000,000 20% Primarily road constuction purposes (up to $7 million per project)
Must meet solicitation category requirements
TAC/TAC Regional Solicitation Process
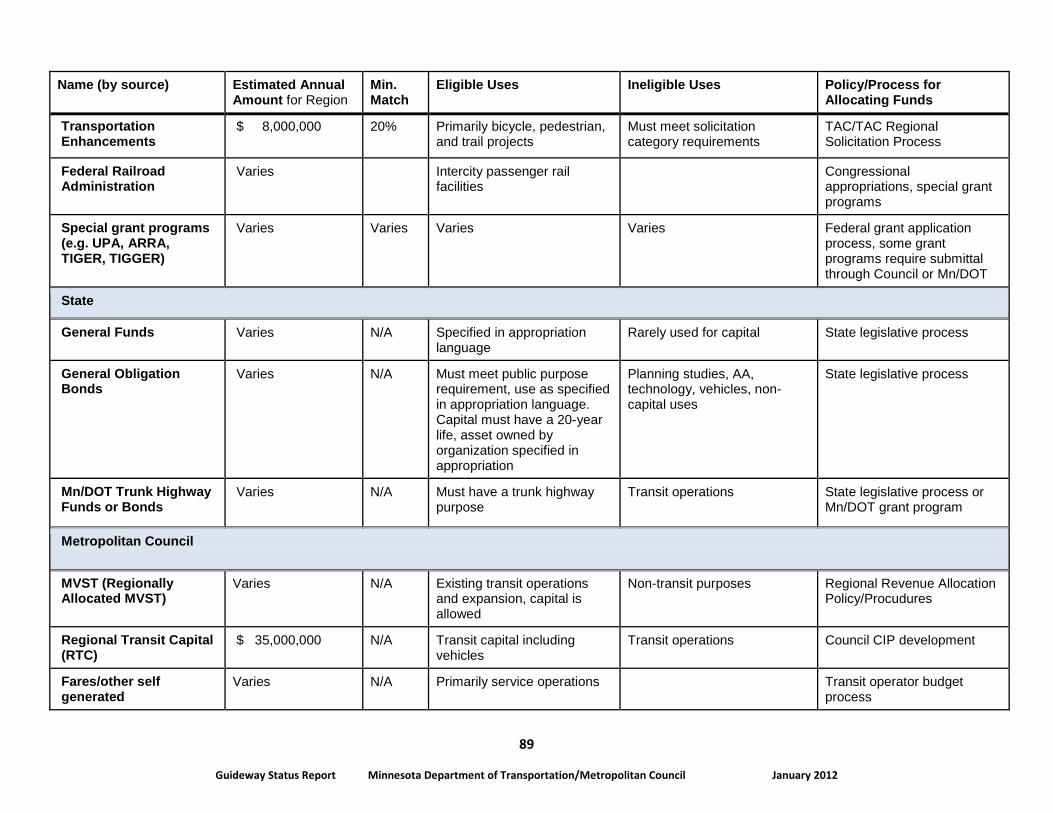
89
Guideway Status Report Minnesota Department of Transportation/Metropolitan Council January 2012
Name (by source) Estimated Annual Amount for Region
Min. Match
Eligible Uses Ineligible Uses Policy/Process for Allocating Funds
Transportation Enhancements
$ 8,000,000 20% Primarily bicycle, pedestrian, and trail projects
Must meet solicitation category requirements
TAC/TAC Regional Solicitation Process
Federal Railroad Administration
Varies Intercity passenger rail facilities
Congressional appropriations, special grant programs
Special grant programs (e.g. UPA, ARRA, TIGER, TIGGER)
Varies Varies Varies Varies Federal grant application process, some grant programs require submittal through Council or Mn/DOT
State
General Funds Varies N/A Specified in appropriation language
Rarely used for capital State legislative process
General Obligation Bonds
Varies N/A Must meet public purpose requirement, use as specified in appropriation language. Capital must have a 20-year life, asset owned by organization specified in appropriation
Planning studies, AA, technology, vehicles, non-capital uses
State legislative process
Mn/DOT Trunk Highway Funds or Bonds
Varies N/A Must have a trunk highway purpose
Transit operations State legislative process or Mn/DOT grant program
Metropolitan Council
MVST (Regionally Allocated MVST)
Varies N/A Existing transit operations and expansion, capital is allowed
Non-transit purposes Regional Revenue Allocation Policy/Procudures
Regional Transit Capital (RTC)
$ 35,000,000 N/A Transit capital including vehicles
Transit operations Council CIP development
Fares/other self generated
Varies N/A Primarily service operations Transit operator budget process
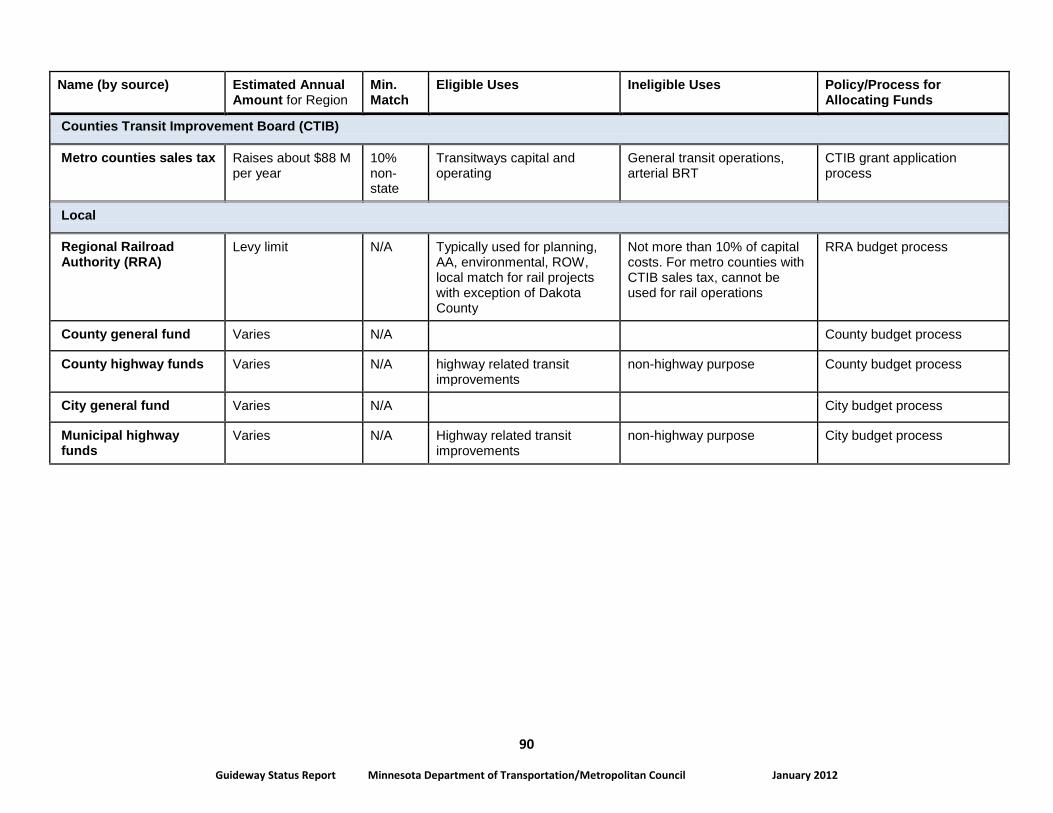
90
Guideway Status Report Minnesota Department of Transportation/Metropolitan Council January 2012
Name (by source) Estimated Annual Amount for Region
Min. Match
Eligible Uses Ineligible Uses Policy/Process for Allocating Funds
Counties Transit Improvement Board (CTIB)
Metro counties sales tax Raises about $88 M per year
10% non-state
Transitways capital and operating
General transit operations, arterial BRT
CTIB grant application process
Local
Regional Railroad Authority (RRA)
Levy limit N/A Typically used for planning, AA, environmental, ROW, local match for rail projects with exception of Dakota County
Not more than 10% of capital costs. For metro counties with CTIB sales tax, cannot be used for rail operations
RRA budget process
County general fund Varies N/A County budget process
County highway funds Varies N/A highway related transit improvements
non-highway purpose County budget process
City general fund Varies N/A City budget process
Municipal highway funds
Varies N/A Highway related transit improvements
non-highway purpose City budget process