Embed Size (px)
Citation preview
Guiding PrinciplesGuiding Principles
David Eherts PhD VP and Chief Safety OfficerSikorsky Aircraft CorporationEEI Contractor Safety Summit 2009

Overview
• Safety is Safety• Safety is Safety• Management Systems are
M t S tManagement Systems• Strong Leadership is
Strong Leadership• Safety is Valuey• Culture and Risk Management
Save the MostSave the Most

SAFETY MANAGEMENT SYSTEMSLeadershipLeadershipEmployee EngagementRisk Management

2006 WATERFALL CHART FOR 2010 GOALS
4(TRIR - Worldwide)
2 5
3
3.5
1.5
2
2.5
0.5
1
0
2006
sibl
ede
rshi
pm
itmen
t
ploy
eege
men
t
Ris
kge
men
t
2010
Vis
Lead
Com
m
Emp
Enga
g RM
anag

MANAGEMENT COMMITMENT
There are two things that must happen every day. First, every Sikorsky aircraft ever manufactured must land at the time and place of choosing of the pilot. Second, every employee must go h tl th i b tt W ’home exactly as they came in, or better. We’re much better at the first than the second. We must be perfect in both casesmust be perfect in both cases.
Jeff Pino PresidentJeff Pino, President

VISIBLE MANAGEMENT COMMITMENT
“There are two things that must happen every day.”

VISIBLE MANAGEMENT COMMITMENT
“There are two things that must happen every day.”

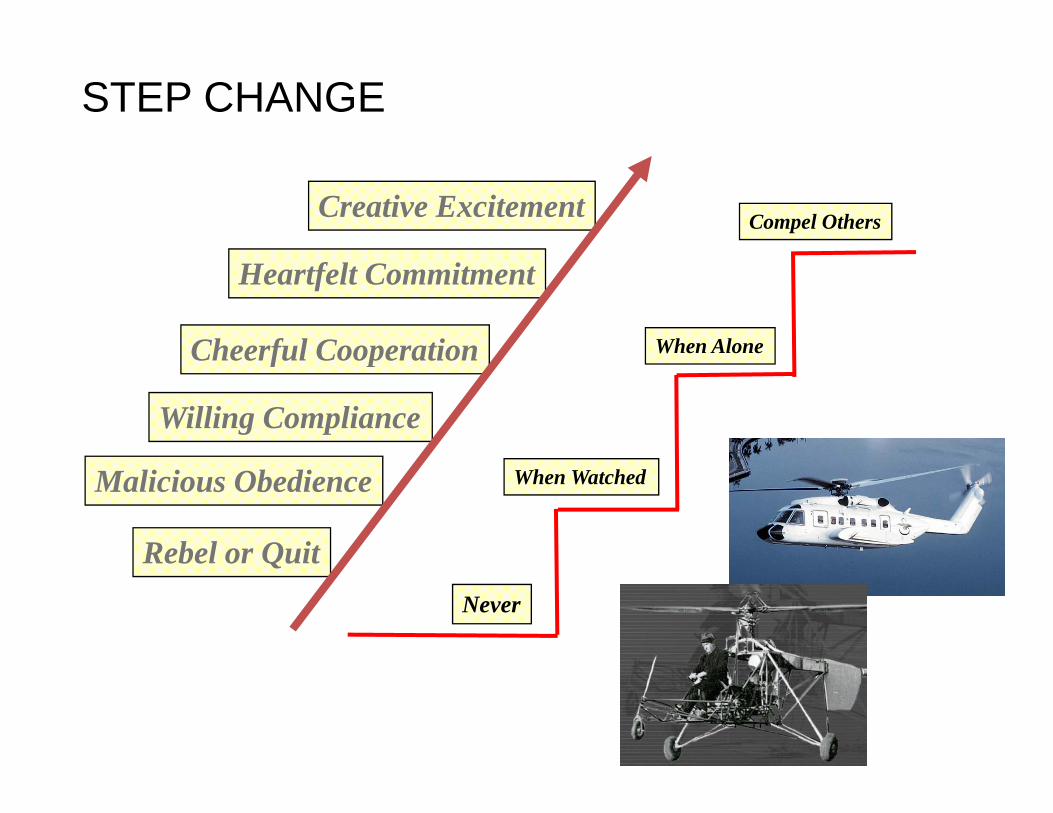
STEP CHANGE
Creative Excitement
Cheerful Cooperation
Heartfelt Commitment
When Alone
Willing Compliance
Cheerful Cooperation
Rebel or Quit
Malicious Obedience When Watched
Rebel or QuitNever
STEP CHANGE
Creative Excitement Compel Others
Cheerful Cooperation
Heartfelt Commitment
When Alone
Willing Compliance
Cheerful Cooperation
Rebel or Quit
Malicious Obedience When Watched
Rebel or QuitNever

EMPLOYEE ENGAGEMENT“Hey brother, I don’t want you to get hurt. Put your
safety glasses on. Teamsters take care of each other ”other.

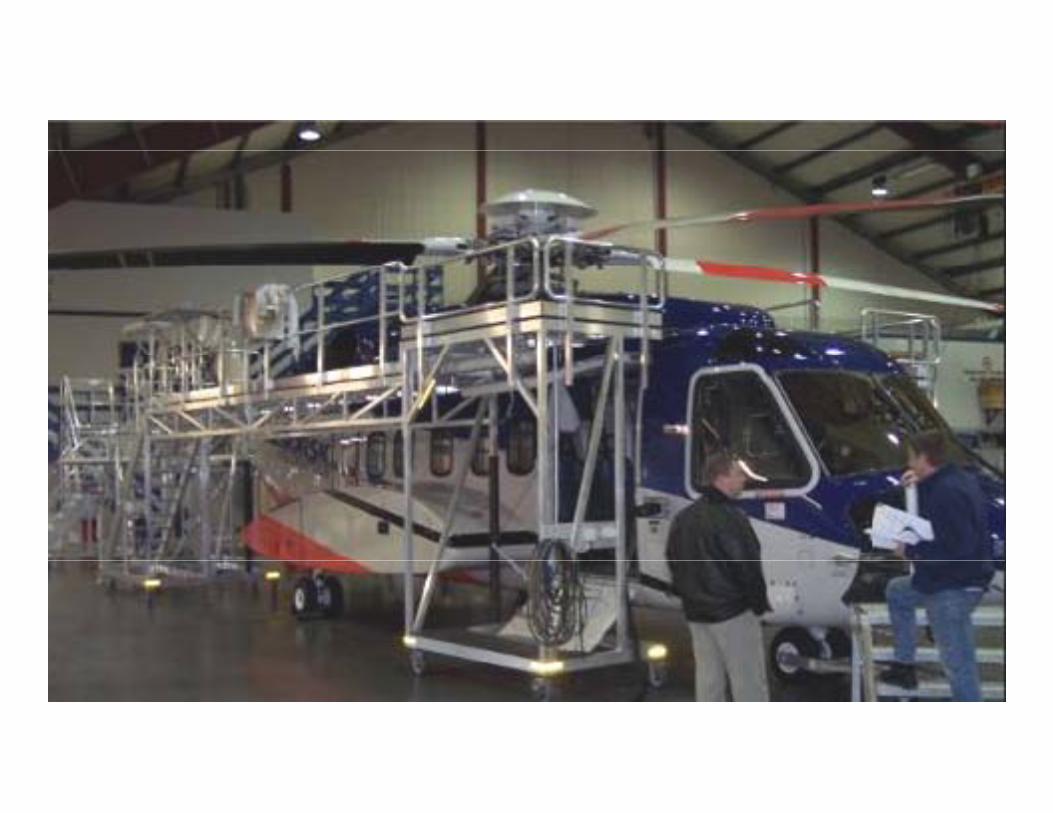
SIKORSKY AIRCRAFT
UTC EMPLOYEE SURVEY Most improved – top 5
Chg %FavHow would you rate your work group’s
Most improved top 5
How would you rate your work group s performance in……safety +37% 79%…quality +30% 74%…keeping talent +29% 50%…customer service +24% 72%

WHAT’S GOING TO HAPPEN AND WHEN ?WHEN ?40
25
30
35
10
15
20
Eye/Face
Hearing Head Other
86%0
5
Jan Feb Mar Apr May Jun Jul Aug Sep Oct Nov Dec
Ergonomic Ergonomic
Employee59%
EmployeeSafety


NIOSH PROSPECTIVE ERGONOMICS STUDY
Injury Injury Data Data
AnalysisAnalysis
SymptomsSymptomsSurveysSurveys
ImplementImplementSolutionsSolutions
Determine Determine AppropriateAppropriate
InterventionsInterventions
Injury Injury Data Data
AnalysisAnalysis
SymptomsSymptomsSurveysSurveys
Cost Cost Benefit Benefit AnalysisAnalysisAnalysisAnalysis yy InterventionsInterventions AnalysisAnalysis
CommunicateCommunicateHighHigh--RiskRiskHEGsHEGs
Allow InterventionsAllow InterventionsTo WorkTo Work
AnalysisAnalysis


Avg Intervention Cost: $19,000Avg Intervention Cost: $19,000Avg NPV: $244,000Avg DPP: 2.1 years

LEADERSHIP THAT GETS IT…


And there is an absolute competitiveadvantage in keeping injury rates down, Pino insisted. “We have reduced workers’ compensation rates by $200 per US employee
i th U it d St t I d ’t lik d iper year in the United States. I don’t like doingmath in public, but that’s $2 million per year”

WORKERS’ COMPENSATION
Sikorsky
Incurred cost per employee($)
Claims per 100 employees

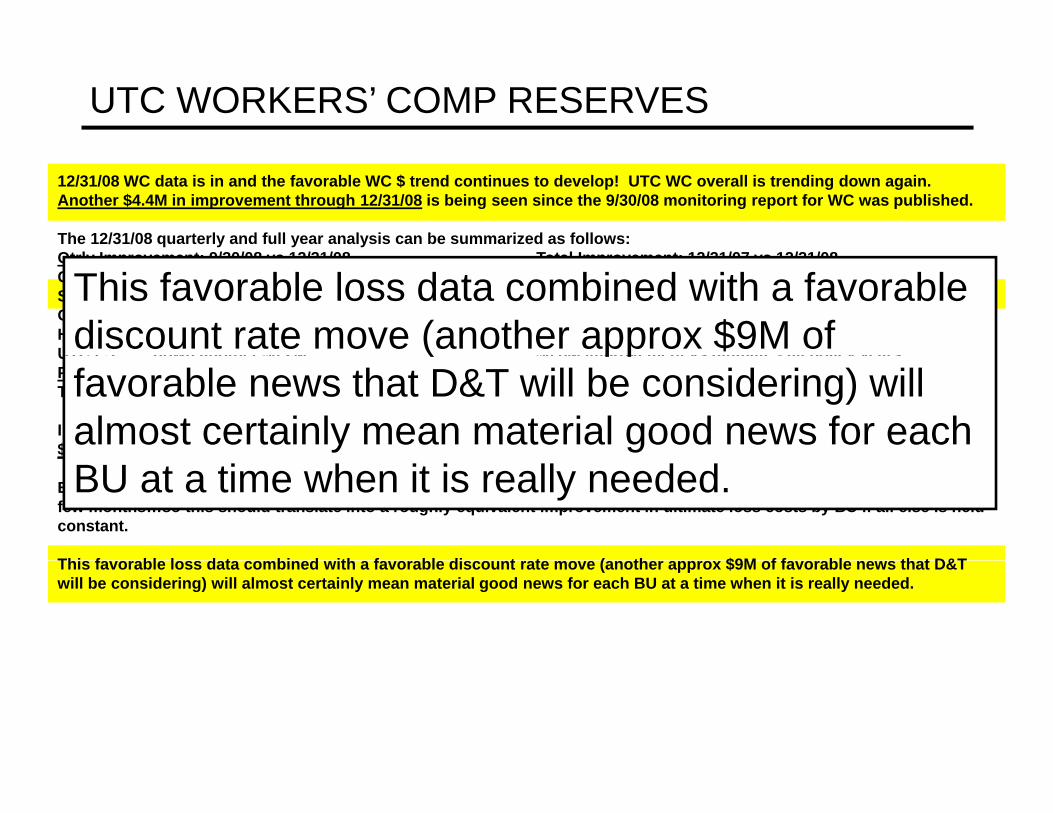
UTC WORKERS’ COMP RESERVES
12/31/08 WC data is in and the favorable WC $ trend continues to develop! UTC WC overall is trending down again. Another $4.4M in improvement through 12/31/08 is being seen since the 9/30/08 monitoring report for WC was published.
The 12/31/08 quarterly and full year analysis can be summarized as follows: Qt l I t 9/30/08 12/31/08 T t l I t 12/31/07 12/31/08Qtrly Improvement: 9/30/08 vs 12/31/08 Total Improvement: 12/31/07 vs 12/31/08Carrier down another $1.7M $3.9M improvement vs ultimate - all policy yearsSikorsky down another $1.7M $3.3M improvement vs ultimate - all policy yearsOtis down another $0.5M $3.4M improvement vs ultimate - all policy yearsHS down another $0.4M $1.2M improvement vs ultimate - all policy yearsUTC FS down another $0 2M $0 8M improvement vs ultimate - all policy yearsUTC FS down another $0.2M $0.8M improvement vs ultimate - all policy yearsPratt flat vs 9/30/08 <$0.4M deterioration vs ultimate - all policy years>Total down in qrtr: $4.4M $12.2M improvement vs ultimate - all policy years
In aggregate since the finalization of the last complete Cost Forecast / Reforecast (as of 12/31/07 core data) we are seeing $12.2M improvement vs the last full actuarial forecast of ultimate WC costs across all BU's - all policy years.
Embedded in this quick snapshot is the raw data that will be used by D&T in updating their actuarial analysis in the next few months…so this should translate into a roughly equivalent improvement in ultimate loss costs by BU if all else is held constant.
Thi f bl l d t bi d ith f bl di t t ( th $9M f f bl th t D&TThis favorable loss data combined with a favorable discount rate move (another approx $9M of favorable news that D&T will be considering) will almost certainly mean material good news for each BU at a time when it is really needed.
UTC WORKERS’ COMP RESERVES
12/31/08 WC data is in and the favorable WC $ trend continues to develop! UTC WC overall is trending down again. Another $4.4M in improvement through 12/31/08 is being seen since the 9/30/08 monitoring report for WC was published.
The 12/31/08 quarterly and full year analysis can be summarized as follows: Qt l I t 9/30/08 12/31/08 T t l I t 12/31/07 12/31/08Qtrly Improvement: 9/30/08 vs 12/31/08 Total Improvement: 12/31/07 vs 12/31/08Carrier down another $1.7M $3.9M improvement vs ultimate - all policy yearsSikorsky down another $1.7M $3.3M improvement vs ultimate - all policy yearsOtis down another $0.5M $3.4M improvement vs ultimate - all policy yearsHS down another $0.4M $1.2M improvement vs ultimate - all policy yearsUTC FS down another $0 2M $0 8M improvement vs ultimate - all policy years
This favorable loss data combined with a favorable discount rate move (another approx $9M of UTC FS down another $0.2M $0.8M improvement vs ultimate - all policy years
Pratt flat vs 9/30/08 <$0.4M deterioration vs ultimate - all policy years>Total down in qrtr: $4.4M $12.2M improvement vs ultimate - all policy years
In aggregate since the finalization of the last complete Cost Forecast / Reforecast (as of 12/31/07 core data) we are seeing $12.2M improvement vs the last full actuarial forecast of ultimate WC costs across all BU's - all policy years.
( ppfavorable news that D&T will be considering) will almost certainly mean material good news for each
Embedded in this quick snapshot is the raw data that will be used by D&T in updating their actuarial analysis in the next few months…so this should translate into a roughly equivalent improvement in ultimate loss costs by BU if all else is held constant.
Thi f bl l d t bi d ith f bl di t t ( th $9M f f bl th t D&T
BU at a time when it is really needed.
This favorable loss data combined with a favorable discount rate move (another approx $9M of favorable news that D&T will be considering) will almost certainly mean material good news for each BU at a time when it is really needed.

EMPLOYEE SAFETY
• Safe work area • Labor working safely• Labor working safely • Lowest accident rate in history
3 00
4.00Total Recordable Incident Rate
Goal 2007 -2010
2.00
3.00
1.00
0.002004 2005 2006 2007 2008 2009 2010

WHAT’S GOING TO HAPPEN WHEN, AND WHAT CAN WE DOAND WHAT CAN WE DO…
Hearing EHSEye/Face
Hearing Head Other
Ergonomic
86% theory of multiple causes
EHS
ErgonomicErgonomic
59% AviationSafety
MAINTENANCE
MATERIALOTHER
Safety
HUMANMAINTENANCE
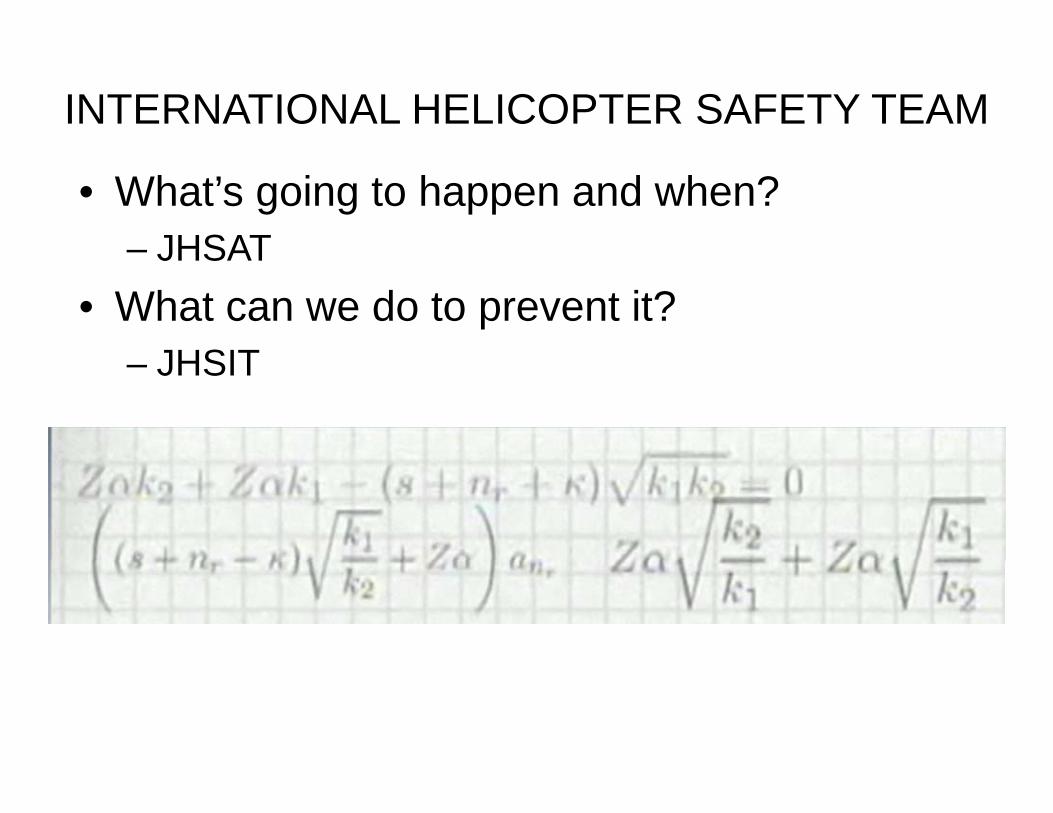
INTERNATIONAL HELICOPTER SAFETY TEAM
• What’s going to happen and when?– JHSATJHSAT
• What can we do to prevent it?JHSIT– JHSIT
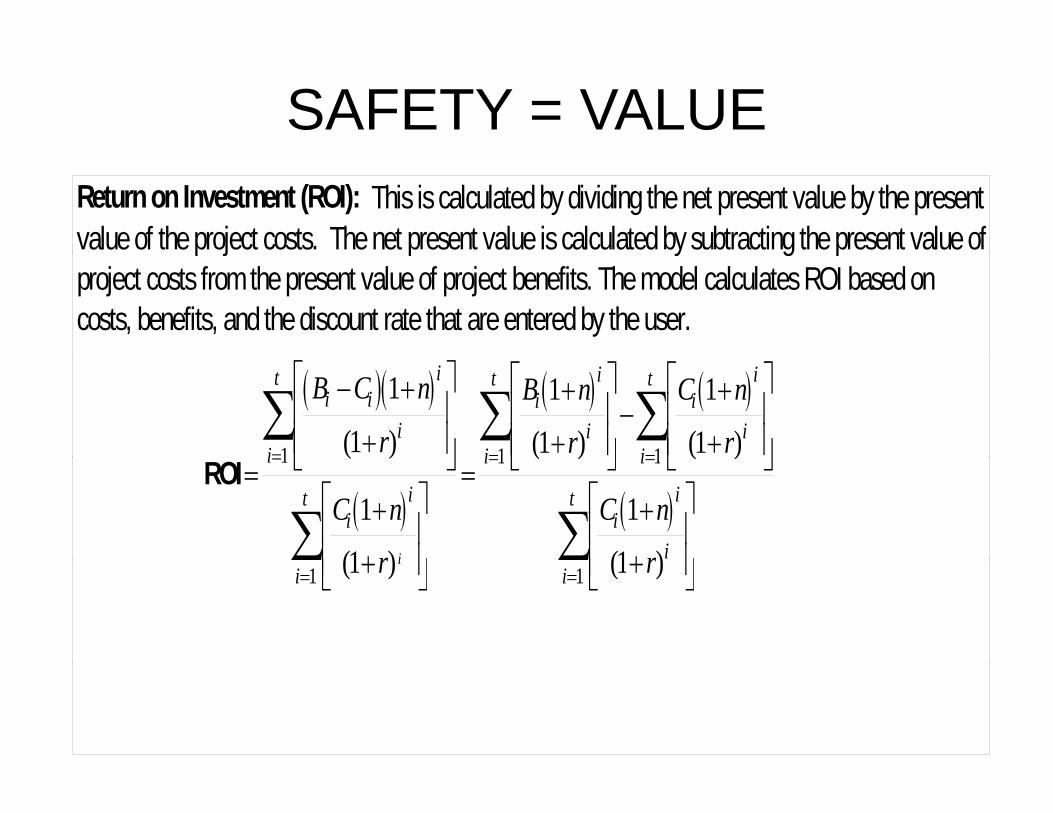
SAFETY = VALUEReturn on Investment (ROI): This is calculated by dividing the net present value by the present value of the project costs. The net present value is calculated by subtracting the present value of p j p y g pproject costs from the present value of project benefits. The model calculates ROI based on costs, benefits, and the discount rate that are entered by the user.
( )( ) ( ) ( )− +
+
⎡
⎣⎢⎢
⎤
⎦⎥⎥
+
+
⎡
⎣⎢⎢
⎤
⎦⎥⎥−
+
+
⎡
⎣⎢⎢
⎤
⎦⎥⎥= = =
∑ ∑ ∑B C n
rB n
r
C n
ri i
i
ii
ti
i
ii
ti
i
ii
t1
11
1
1
11 1 1( ) ( ) ( )
( ) ( )ROI= ⎣ ⎦
+
+
⎡
⎣⎢⎢
⎤
⎦⎥⎥
= ⎣ ⎦ ⎣ ⎦
+
+
⎡
⎣⎢⎢
⎤
⎦⎥⎥
= = =
∑ ∑C n
r
C n
r
i
iit
i i
ii
i
t
i
1
1
1
1
1 1 1( )
( )
( ) ( )
( )+⎣⎢ ⎦⎥ +⎣⎢ ⎦⎥= =r ri ii1 11 1( ) ( )
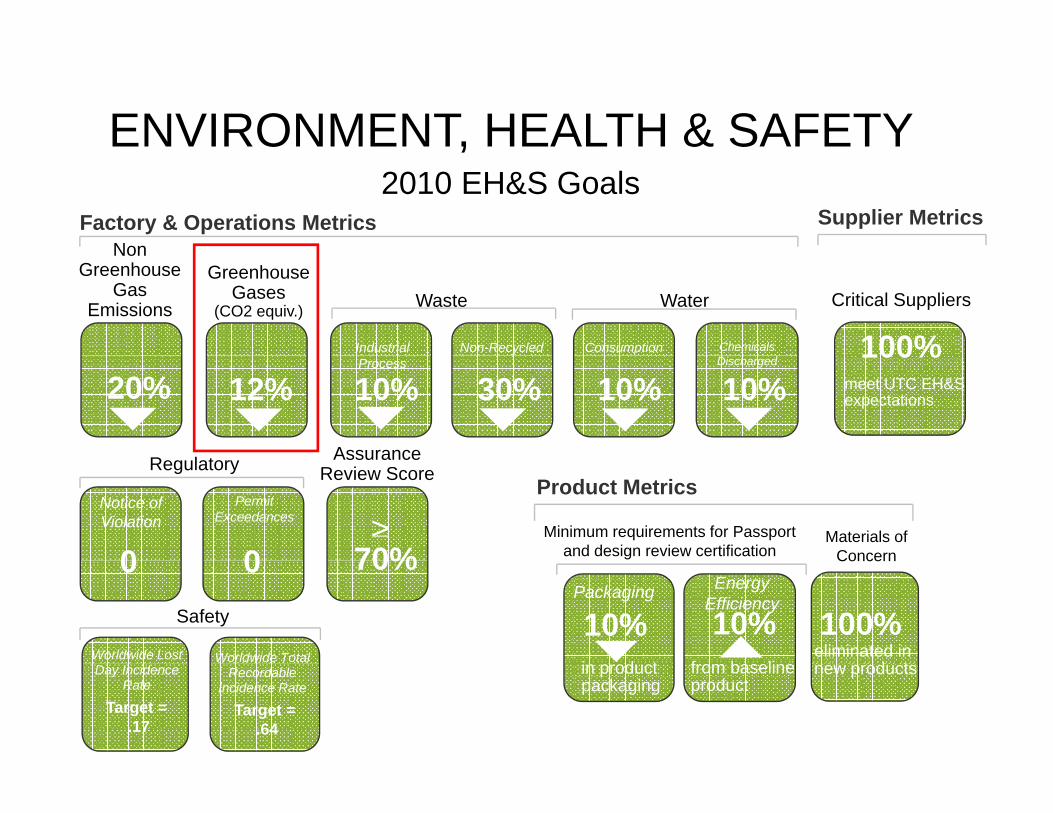
ENVIRONMENT, HEALTH & SAFETY ,2010 EH&S Goals
Factory & Operations MetricsNon
Supplier MetricsNon
Greenhouse Gas
Emissions
GreenhouseGases
(CO2 equiv.) Waste
Industrial Non-Recycled
Critical Suppliers
100%Water
Consumption Chemicals
R l t Assurance
20% 12% 10%Process
30%100%
meet UTC EH&Sexpectations10% 10%
Discharged
Regulatory
Notice of Violation
Permit Exceedances
0 0
Assurance Review Score
>_70%
Product Metrics
Minimum requirements for Passport and design review certification
Materials of Concern0 0 70%
10%i d t
10%f b li
Packaging EnergyEfficiency
100%eliminated in
d t
Concern
Worldwide Lost Worldwide Total
Safety
in productpackaging
from baselineproduct
new productsDay Incidence Rate
Recordable Incidence Rate
Target = .17
Target = .64

THE BUSINESS CASE FOR EH&S

Sik k i illi t i t th ti d t k l tiSikorsky is willing to invest the time and money to seek solutionsto problems that might not manifest for years. By protecting its employees and remaining dedicated to “doing the right thing”,Sikorsky has reduced its accident rates workers’ comp costsSikorsky has reduced its accident rates, workers comp costsand carbon footprint to become a company synonymous with
strong leadership, safety and environmental responsibility.

UTC RANKED AS MOST SUSTAINABLE
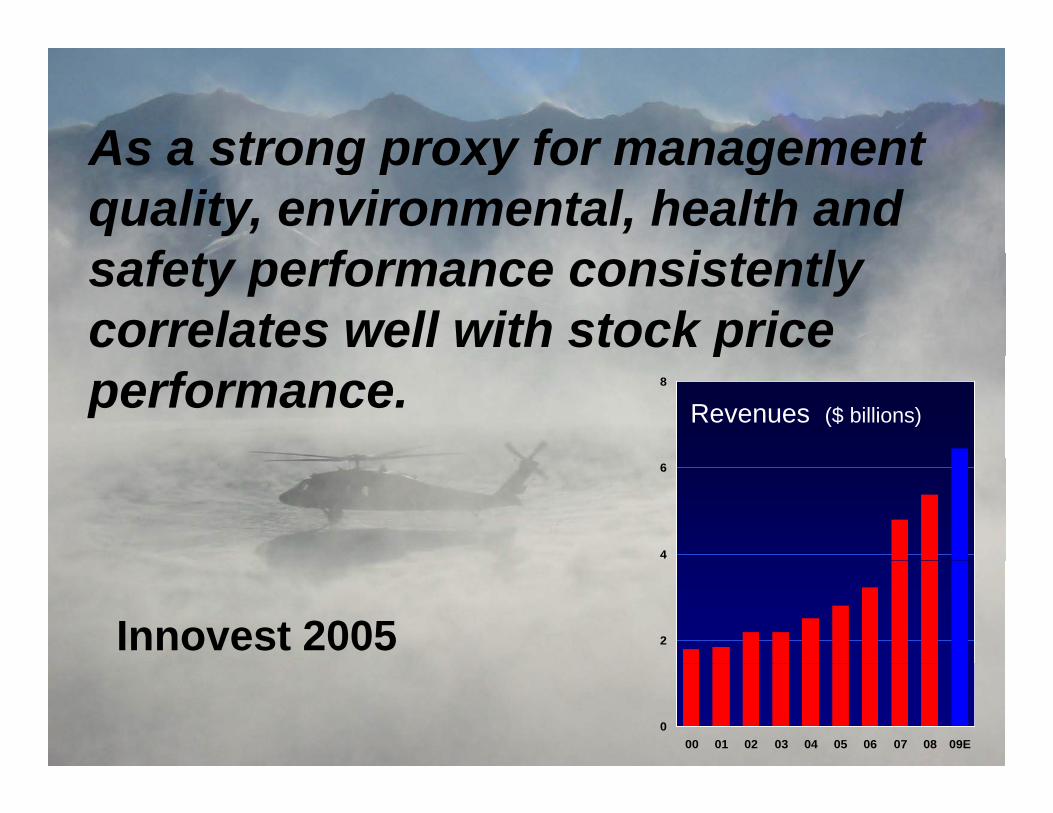
As a strong proxy for managementAs a strong proxy for management quality, environmental, health and
f t f i t tlsafety performance consistently correlates well with stock price pperformance. 8
Revenues ($ billions)
4
6
Innovest 2005 2
000 01 02 03 04 05 06 07 08 09E

Questions?Questions?
David Eherts PhDVP and Chief Safety OfficerSikorsky Aircraft [email protected] 386 8666203 386 8666