Embed Size (px)
Citation preview
2015-16 School Accountability Report Card for Guin Foss Elementary School Page 1 of 13
Guin Foss Elementary School
School Accountability Report Card
Reported Using Data from the 2015-16 School Year
Published During 2016-17
By February 1 of each year, every school in California is required by state law to publish a School Accountability Report Card (SARC). The SARC contains information about the condition and performance of each California public school. Under the Local Control Funding Formula (LCFF) all local educational agencies (LEAs) are required to prepare a Local Control and Accountability Plan (LCAP), which describes how they intend to meet annual school-specific goals for all pupils, with specific activities to address state and local priorities. Additionally, data reported in an LCAP is to be consistent with data reported in the SARC. • For more information about SARC requirements, see the California Department of Education (CDE) SARC Web page at
http://www.cde.ca.gov/ta/ac/sa/. • For more information about the LCFF or LCAP, see the CDE LCFF Web page at http://www.cde.ca.gov/fg/aa/lc/. • For additional information about the school, parents/guardians and community members should contact the school principal or
the district office. DataQuest DataQuest is an online data tool located on the CDE DataQuest Web page at http://dq.cde.ca.gov/dataquest/ that contains additional information about this school and comparisons of the school to the district and the county. Specifically, DataQuest is a dynamic system that provides reports for accountability (e.g., test data, enrollment, high school graduates, dropouts, course enrollments, staffing, and data regarding English learners). Internet Access Internet access is available at public libraries and other locations that are publicly accessible (e.g., the California State Library). Access to the Internet at libraries and public locations is generally provided on a first-come, first-served basis. Other use restrictions may include the hours of operation, the length of time that a workstation may be used (depending on availability), the types of software programs available on a workstation, and the ability to print documents.
About This School Contact Information (School Year 2016-17)
School Contact Information
School Name------- Guin Foss Elementary School
Street------- 18492 Vanderlip Ave.
City, State, Zip------- Santa Ana, CA 92705
Phone Number------- (714) 730-7552
Principal------- Kelly Fresch
E-mail Address------- [email protected]
Web Site------- http://www.tustin.k12.ca.us/guinfosses
CDS Code 30-73643-6030605
2015-16 School Accountability Report Card for Guin Foss Elementary School Page 2 of 13
District Contact Information
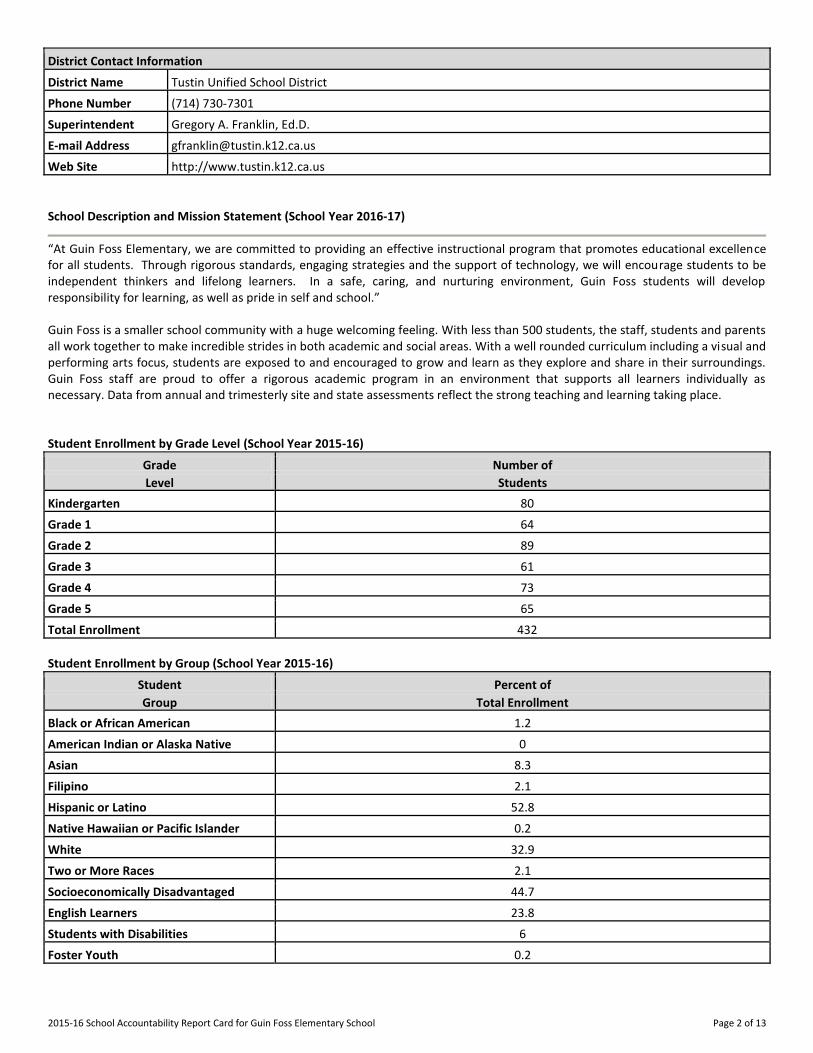
District Name------- Tustin Unified School District
Phone Number------- (714) 730-7301
Superintendent------- Gregory A. Franklin, Ed.D.
E-mail Address------- [email protected]
Web Site------- http://www.tustin.k12.ca.us
School Description and Mission Statement (School Year 2016-17)
“At Guin Foss Elementary, we are committed to providing an effective instructional program that promotes educational excellence for all students. Through rigorous standards, engaging strategies and the support of technology, we will encourage students to be independent thinkers and lifelong learners. In a safe, caring, and nurturing environment, Guin Foss students will develop responsibility for learning, as well as pride in self and school.” Guin Foss is a smaller school community with a huge welcoming feeling. With less than 500 students, the staff, students and parents all work together to make incredible strides in both academic and social areas. With a well rounded curriculum including a visual and performing arts focus, students are exposed to and encouraged to grow and learn as they explore and share in their surroundings. Guin Foss staff are proud to offer a rigorous academic program in an environment that supports all learners individually as necessary. Data from annual and trimesterly site and state assessments reflect the strong teaching and learning taking place. Student Enrollment by Grade Level (School Year 2015-16)
Grade Number of
Level Students
Kindergarten 80
Grade 1 64
Grade 2 89
Grade 3 61
Grade 4 73
Grade 5 65
Total Enrollment 432
Student Enrollment by Group (School Year 2015-16)
Student Percent of
Group Total Enrollment
Black or African American 1.2
American Indian or Alaska Native 0
Asian 8.3
Filipino 2.1
Hispanic or Latino 52.8
Native Hawaiian or Pacific Islander 0.2
White 32.9
Two or More Races 2.1
Socioeconomically Disadvantaged 44.7
English Learners 23.8
Students with Disabilities 6
Foster Youth 0.2
2015-16 School Accountability Report Card for Guin Foss Elementary School Page 3 of 13
A. Conditions of Learning
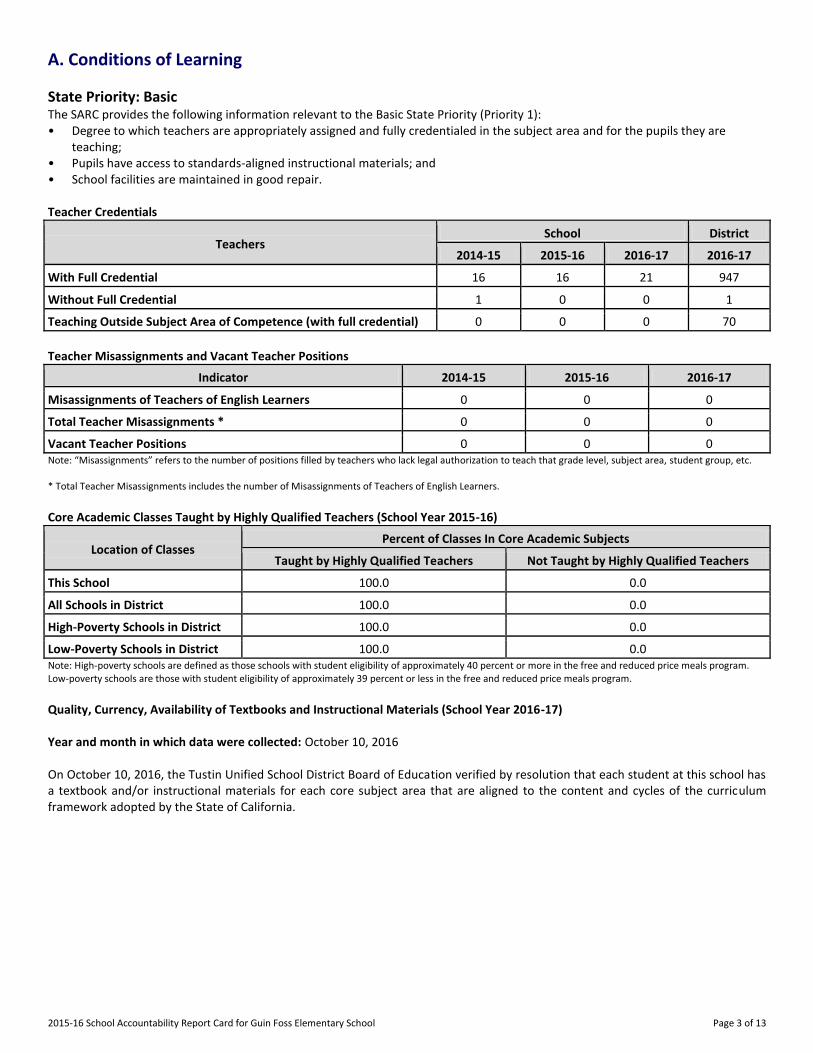
State Priority: Basic The SARC provides the following information relevant to the Basic State Priority (Priority 1): • Degree to which teachers are appropriately assigned and fully credentialed in the subject area and for the pupils they are
teaching; • Pupils have access to standards-aligned instructional materials; and • School facilities are maintained in good repair. Teacher Credentials
Teachers School District
2014-15 2015-16 2016-17 2016-17
With Full Credential 16 16 21 947
Without Full Credential 1 0 0 1
Teaching Outside Subject Area of Competence (with full credential) 0 0 0 70
Teacher Misassignments and Vacant Teacher Positions
Indicator 2014-15 2015-16 2016-17
Misassignments of Teachers of English Learners 0 0 0
Total Teacher Misassignments * 0 0 0
Vacant Teacher Positions 0 0 0 Note: “Misassignments” refers to the number of positions filled by teachers who lack legal authorization to teach that grade level, subject area, student group, etc. * Total Teacher Misassignments includes the number of Misassignments of Teachers of English Learners. Core Academic Classes Taught by Highly Qualified Teachers (School Year 2015-16)
Location of Classes Percent of Classes In Core Academic Subjects
Taught by Highly Qualified Teachers Not Taught by Highly Qualified Teachers
This School 100.0 0.0
All Schools in District 100.0 0.0
High-Poverty Schools in District 100.0 0.0
Low-Poverty Schools in District 100.0 0.0 Note: High-poverty schools are defined as those schools with student eligibility of approximately 40 percent or more in the free and reduced price meals program. Low-poverty schools are those with student eligibility of approximately 39 percent or less in the free and reduced price meals program. Quality, Currency, Availability of Textbooks and Instructional Materials (School Year 2016-17) Year and month in which data were collected: October 10, 2016 On October 10, 2016, the Tustin Unified School District Board of Education verified by resolution that each student at this school has a textbook and/or instructional materials for each core subject area that are aligned to the content and cycles of the curriculum framework adopted by the State of California.
2015-16 School Accountability Report Card for Guin Foss Elementary School Page 4 of 13
Subject Textbooks and Instructional Materials/
Year of Adoption
From Most Recent
Adoption?
Percent of Students Lacking Own
Assigned Copy
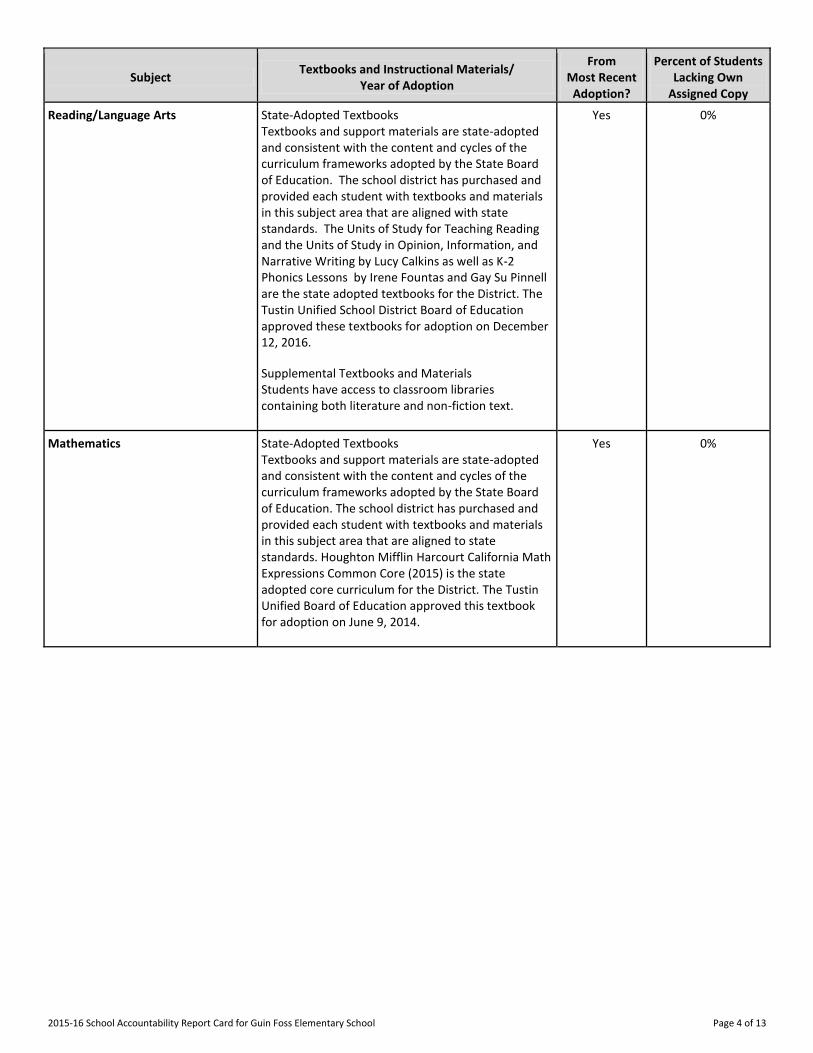
Reading/Language Arts State-Adopted Textbooks
Textbooks and support materials are state-adopted and consistent with the content and cycles of the curriculum frameworks adopted by the State Board of Education. The school district has purchased and provided each student with textbooks and materials in this subject area that are aligned with state standards. The Units of Study for Teaching Reading and the Units of Study in Opinion, Information, and Narrative Writing by Lucy Calkins as well as K-2 Phonics Lessons by Irene Fountas and Gay Su Pinnell are the state adopted textbooks for the District. The Tustin Unified School District Board of Education approved these textbooks for adoption on December 12, 2016.
Supplemental Textbooks and Materials
Students have access to classroom libraries containing both literature and non-fiction text.
Yes 0%
Mathematics State-Adopted Textbooks
Textbooks and support materials are state-adopted and consistent with the content and cycles of the curriculum frameworks adopted by the State Board of Education. The school district has purchased and provided each student with textbooks and materials in this subject area that are aligned to state standards. Houghton Mifflin Harcourt California Math Expressions Common Core (2015) is the state adopted core curriculum for the District. The Tustin Unified Board of Education approved this textbook for adoption on June 9, 2014.
Yes 0%
2015-16 School Accountability Report Card for Guin Foss Elementary School Page 5 of 13
Subject Textbooks and Instructional Materials/
Year of Adoption
From Most Recent
Adoption?
Percent of Students Lacking Own
Assigned Copy
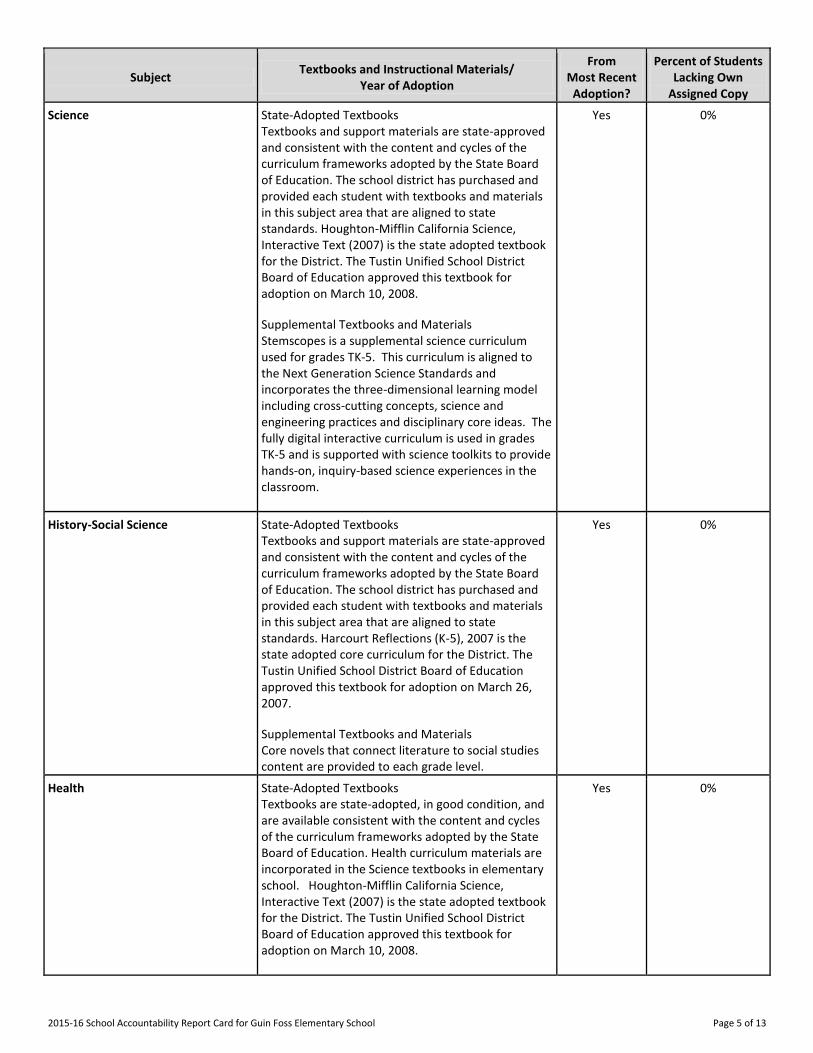
Science State-Adopted Textbooks
Textbooks and support materials are state-approved and consistent with the content and cycles of the curriculum frameworks adopted by the State Board of Education. The school district has purchased and provided each student with textbooks and materials in this subject area that are aligned to state standards. Houghton-Mifflin California Science, Interactive Text (2007) is the state adopted textbook for the District. The Tustin Unified School District Board of Education approved this textbook for adoption on March 10, 2008.
Supplemental Textbooks and Materials
Stemscopes is a supplemental science curriculum used for grades TK-5. This curriculum is aligned to the Next Generation Science Standards and incorporates the three-dimensional learning model including cross-cutting concepts, science and engineering practices and disciplinary core ideas. The fully digital interactive curriculum is used in grades TK-5 and is supported with science toolkits to provide hands-on, inquiry-based science experiences in the classroom.
Yes 0%
History-Social Science State-Adopted Textbooks
Textbooks and support materials are state-approved and consistent with the content and cycles of the curriculum frameworks adopted by the State Board of Education. The school district has purchased and provided each student with textbooks and materials in this subject area that are aligned to state standards. Harcourt Reflections (K-5), 2007 is the state adopted core curriculum for the District. The Tustin Unified School District Board of Education approved this textbook for adoption on March 26, 2007.
Supplemental Textbooks and Materials
Core novels that connect literature to social studies content are provided to each grade level.
Yes 0%
Health State-Adopted Textbooks
Textbooks are state-adopted, in good condition, and are available consistent with the content and cycles of the curriculum frameworks adopted by the State Board of Education. Health curriculum materials are incorporated in the Science textbooks in elementary school. Houghton-Mifflin California Science, Interactive Text (2007) is the state adopted textbook for the District. The Tustin Unified School District Board of Education approved this textbook for adoption on March 10, 2008.
Yes 0%
2015-16 School Accountability Report Card for Guin Foss Elementary School Page 6 of 13
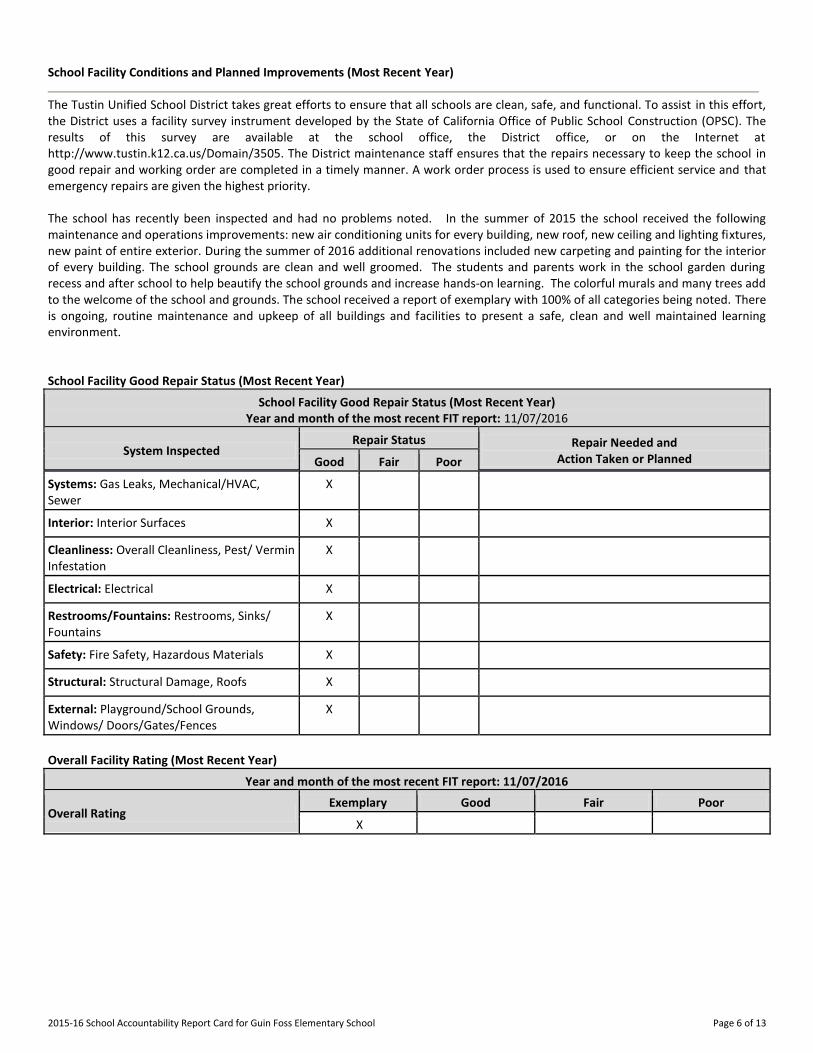
School Facility Conditions and Planned Improvements (Most Recent Year)
The Tustin Unified School District takes great efforts to ensure that all schools are clean, safe, and functional. To assist in this effort, the District uses a facility survey instrument developed by the State of California Office of Public School Construction (OPSC). The results of this survey are available at the school office, the District office, or on the Internet at http://www.tustin.k12.ca.us/Domain/3505. The District maintenance staff ensures that the repairs necessary to keep the school in good repair and working order are completed in a timely manner. A work order process is used to ensure efficient service and that emergency repairs are given the highest priority. The school has recently been inspected and had no problems noted. In the summer of 2015 the school received the following maintenance and operations improvements: new air conditioning units for every building, new roof, new ceiling and lighting fixtures, new paint of entire exterior. During the summer of 2016 additional renovations included new carpeting and painting for the interior of every building. The school grounds are clean and well groomed. The students and parents work in the school garden during recess and after school to help beautify the school grounds and increase hands-on learning. The colorful murals and many trees add to the welcome of the school and grounds. The school received a report of exemplary with 100% of all categories being noted. There is ongoing, routine maintenance and upkeep of all buildings and facilities to present a safe, clean and well maintained learning environment. School Facility Good Repair Status (Most Recent Year)
School Facility Good Repair Status (Most Recent Year) Year and month of the most recent FIT report: 11/07/2016
System Inspected Repair Status Repair Needed and
Action Taken or Planned Good Fair Poor
Systems: Gas Leaks, Mechanical/HVAC, Sewer
X
Interior: Interior Surfaces X
Cleanliness: Overall Cleanliness, Pest/ Vermin Infestation
X
Electrical: Electrical X
Restrooms/Fountains: Restrooms, Sinks/ Fountains
X
Safety: Fire Safety, Hazardous Materials X
Structural: Structural Damage, Roofs X
External: Playground/School Grounds, Windows/ Doors/Gates/Fences
X
Overall Facility Rating (Most Recent Year)
Year and month of the most recent FIT report: 11/07/2016
Overall Rating Exemplary Good Fair Poor
X
2015-16 School Accountability Report Card for Guin Foss Elementary School Page 7 of 13
B. Pupil Outcomes
State Priority: Pupil Achievement The SARC provides the following information relevant to the State priority: Pupil Achievement (Priority 4): • Statewide assessments (i.e., California Assessment of Student Performance and Progress [CAASPP] System, which includes the
Smarter Balanced Summative Assessments for students in the general education population and the California Alternate Assessments [CAAs] for English language arts/literacy [ELA] and mathematics given in grades three through eight and grade eleven. The CAAs have replaced the California Alternate Performance Assessment [CAPA] for ELA and mathematics, which were eliminated in 2015. Only eligible students may participate in the administration of the CAAs. CAA items are aligned with alternate achievement standards, which are linked with the Common Core State Standards [CCSS] for students with significant cognitive disabilities); and
• The percentage of students who have successfully completed courses that satisfy the requirements for entrance to the University of California and the California State University, or career technical education sequences or programs of study
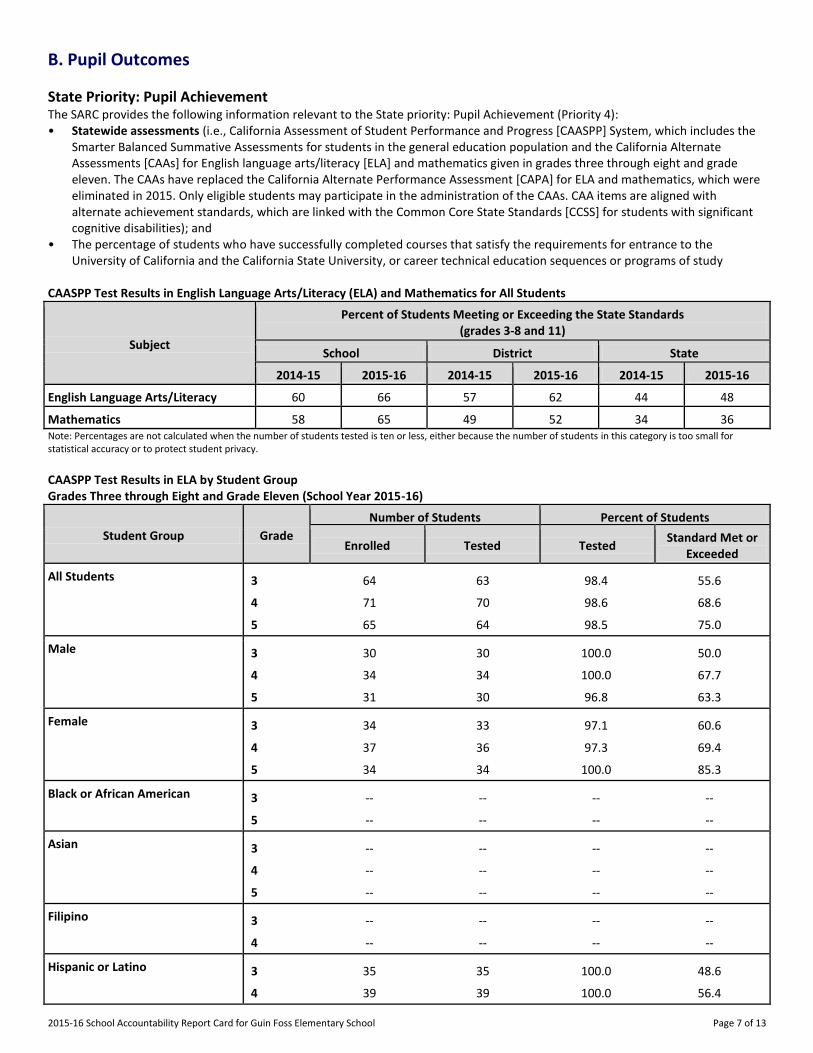
CAASPP Test Results in English Language Arts/Literacy (ELA) and Mathematics for All Students
Subject
Percent of Students Meeting or Exceeding the State Standards (grades 3-8 and 11)
School District State
2014-15 2015-16 2014-15 2015-16 2014-15 2015-16
English Language Arts/Literacy 60 66 57 62 44 48
Mathematics 58 65 49 52 34 36 Note: Percentages are not calculated when the number of students tested is ten or less, either because the number of students in this category is too small for statistical accuracy or to protect student privacy.
CAASPP Test Results in ELA by Student Group Grades Three through Eight and Grade Eleven (School Year 2015-16)
Student Group Grade
Number of Students Percent of Students
Enrolled Tested Tested Standard Met or
Exceeded
All Students 3 64 63 98.4 55.6
4 71 70 98.6 68.6
5 65 64 98.5 75.0
Male 3 30 30 100.0 50.0
4 34 34 100.0 67.7
5 31 30 96.8 63.3
Female 3 34 33 97.1 60.6
4 37 36 97.3 69.4
5 34 34 100.0 85.3
Black or African American 3 -- -- -- --
5 -- -- -- --
Asian 3 -- -- -- --
4 -- -- -- --
5 -- -- -- --
Filipino 3 -- -- -- --
4 -- -- -- --
Hispanic or Latino 3 35 35 100.0 48.6
4 39 39 100.0 56.4
2015-16 School Accountability Report Card for Guin Foss Elementary School Page 8 of 13
Student Group Grade
Number of Students Percent of Students
Enrolled Tested Tested Standard Met or
Exceeded
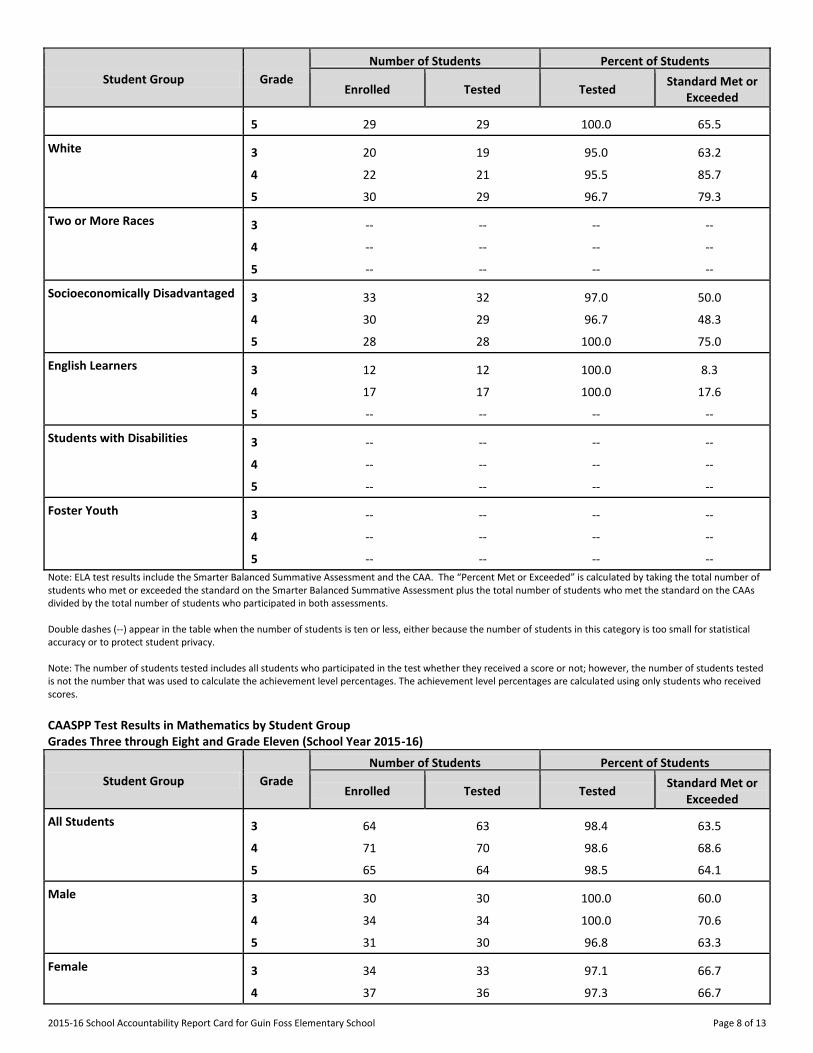
5 29 29 100.0 65.5
White 3 20 19 95.0 63.2
4 22 21 95.5 85.7
5 30 29 96.7 79.3
Two or More Races 3 -- -- -- --
4 -- -- -- --
5 -- -- -- --
Socioeconomically Disadvantaged 3 33 32 97.0 50.0
4 30 29 96.7 48.3
5 28 28 100.0 75.0
English Learners 3 12 12 100.0 8.3
4 17 17 100.0 17.6
5 -- -- -- --
Students with Disabilities 3 -- -- -- --
4 -- -- -- --
5 -- -- -- --
Foster Youth 3 -- -- -- --
4 -- -- -- --
5 -- -- -- --
Note: ELA test results include the Smarter Balanced Summative Assessment and the CAA. The “Percent Met or Exceeded” is calculated by taking the total number of students who met or exceeded the standard on the Smarter Balanced Summative Assessment plus the total number of students who met the standard on the CAAs divided by the total number of students who participated in both assessments. Double dashes (--) appear in the table when the number of students is ten or less, either because the number of students in this category is too small for statistical accuracy or to protect student privacy. Note: The number of students tested includes all students who participated in the test whether they received a score or not; however, the number of students tested is not the number that was used to calculate the achievement level percentages. The achievement level percentages are calculated using only students who received scores.
CAASPP Test Results in Mathematics by Student Group Grades Three through Eight and Grade Eleven (School Year 2015-16)
Student Group Grade
Number of Students Percent of Students
Enrolled Tested Tested Standard Met or
Exceeded
All Students 3 64 63 98.4 63.5
4 71 70 98.6 68.6
5 65 64 98.5 64.1
Male 3 30 30 100.0 60.0
4 34 34 100.0 70.6
5 31 30 96.8 63.3
Female 3 34 33 97.1 66.7
4 37 36 97.3 66.7
2015-16 School Accountability Report Card for Guin Foss Elementary School Page 9 of 13
Student Group Grade
Number of Students Percent of Students
Enrolled Tested Tested Standard Met or
Exceeded
5 34 34 100.0 64.7
Black or African American 3 -- -- -- --
5 -- -- -- --
Asian 3 -- -- -- --
4 -- -- -- --
5 -- -- -- --
Filipino 3 -- -- -- --
4 -- -- -- --
Hispanic or Latino 3 35 35 100.0 51.4
4 39 39 100.0 53.9
5 29 29 100.0 58.6
White 3 20 19 95.0 79.0
4 22 21 95.5 85.7
5 30 29 96.7 65.5
Two or More Races 3 -- -- -- --
4 -- -- -- --
5 -- -- -- --
Socioeconomically Disadvantaged 3 33 32 97.0 53.1
4 30 29 96.7 41.4
5 28 28 100.0 64.3
English Learners 3 12 12 100.0 33.3
4 17 17 100.0 17.6
5 -- -- -- --
Students with Disabilities 3 -- -- -- --
4 -- -- -- --
5 -- -- -- --
Foster Youth 3 -- -- -- --
4 -- -- -- --
5 -- -- -- --
Note: Mathematics test results include the Smarter Balanced Summative Assessment and the CAA. The “Percent Met or Exceeded” is calculated by taking the total number of students who met or exceeded the standard on the Smarter Balanced Summative Assessment plus the total number of students who met the standard on the CAAs divided by the total number of students who participated in both assessments. Double dashes (--) appear in the table when the number of students is ten or less, either because the number of students in this category is too small for statistical accuracy or to protect student privacy. Note: The number of students tested includes all students who participated in the test whether they received a score or not; however, the number of students tested is not the number that was used to calculate the achievement level percentages. The achievement level percentages are calculated using only students who received scores.
2015-16 School Accountability Report Card for Guin Foss Elementary School Page 10 of 13
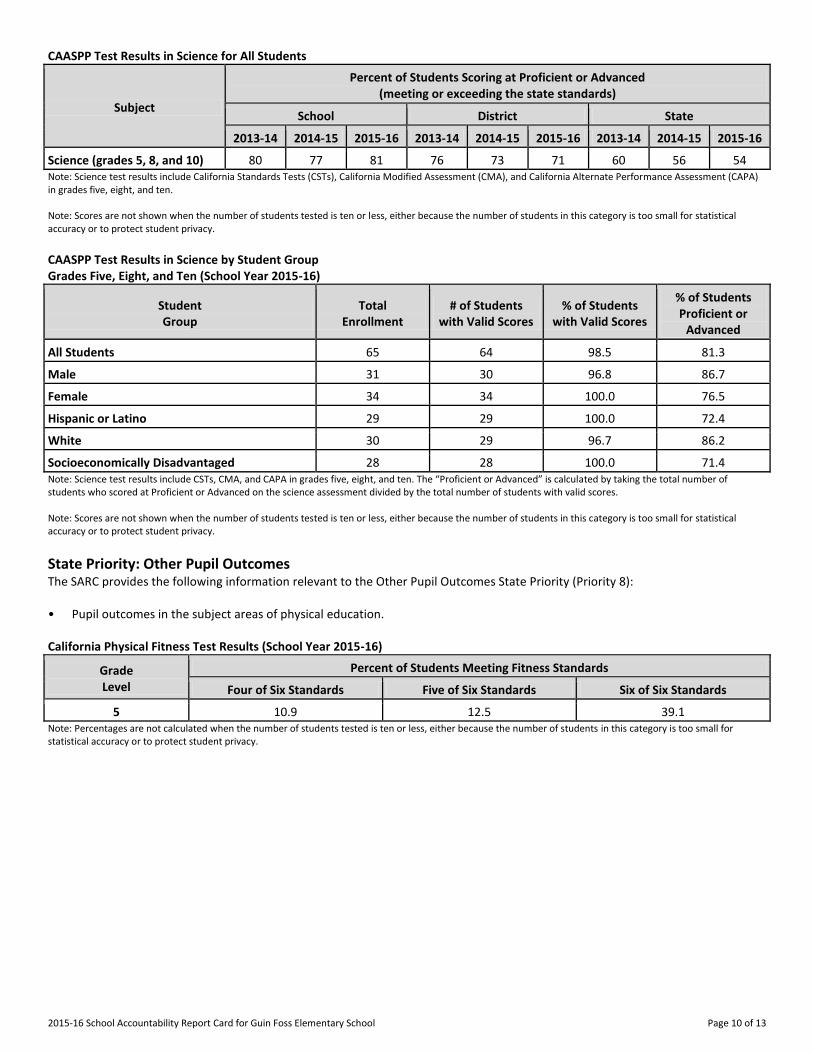
CAASPP Test Results in Science for All Students
Subject
Percent of Students Scoring at Proficient or Advanced (meeting or exceeding the state standards)
School District State
2013-14 2014-15 2015-16 2013-14 2014-15 2015-16 2013-14 2014-15 2015-16
Science (grades 5, 8, and 10) 80 77 81 76 73 71 60 56 54 Note: Science test results include California Standards Tests (CSTs), California Modified Assessment (CMA), and California Alternate Performance Assessment (CAPA) in grades five, eight, and ten. Note: Scores are not shown when the number of students tested is ten or less, either because the number of students in this category is too small for statistical accuracy or to protect student privacy.
CAASPP Test Results in Science by Student Group Grades Five, Eight, and Ten (School Year 2015-16)
Student Group
Total Enrollment
# of Students with Valid Scores
% of Students with Valid Scores
% of Students Proficient or
Advanced
All Students 65 64 98.5 81.3
Male 31 30 96.8 86.7
Female 34 34 100.0 76.5
Hispanic or Latino 29 29 100.0 72.4
White 30 29 96.7 86.2
Socioeconomically Disadvantaged 28 28 100.0 71.4 Note: Science test results include CSTs, CMA, and CAPA in grades five, eight, and ten. The “Proficient or Advanced” is calculated by taking the total number of students who scored at Proficient or Advanced on the science assessment divided by the total number of students with valid scores. Note: Scores are not shown when the number of students tested is ten or less, either because the number of students in this category is too small for statistical accuracy or to protect student privacy.
State Priority: Other Pupil Outcomes The SARC provides the following information relevant to the Other Pupil Outcomes State Priority (Priority 8): • Pupil outcomes in the subject areas of physical education. California Physical Fitness Test Results (School Year 2015-16)
Grade Level
Percent of Students Meeting Fitness Standards
Four of Six Standards Five of Six Standards Six of Six Standards
---5--- 10.9 12.5 39.1 Note: Percentages are not calculated when the number of students tested is ten or less, either because the number of students in this category is too small for statistical accuracy or to protect student privacy.
2015-16 School Accountability Report Card for Guin Foss Elementary School Page 11 of 13
C. Engagement
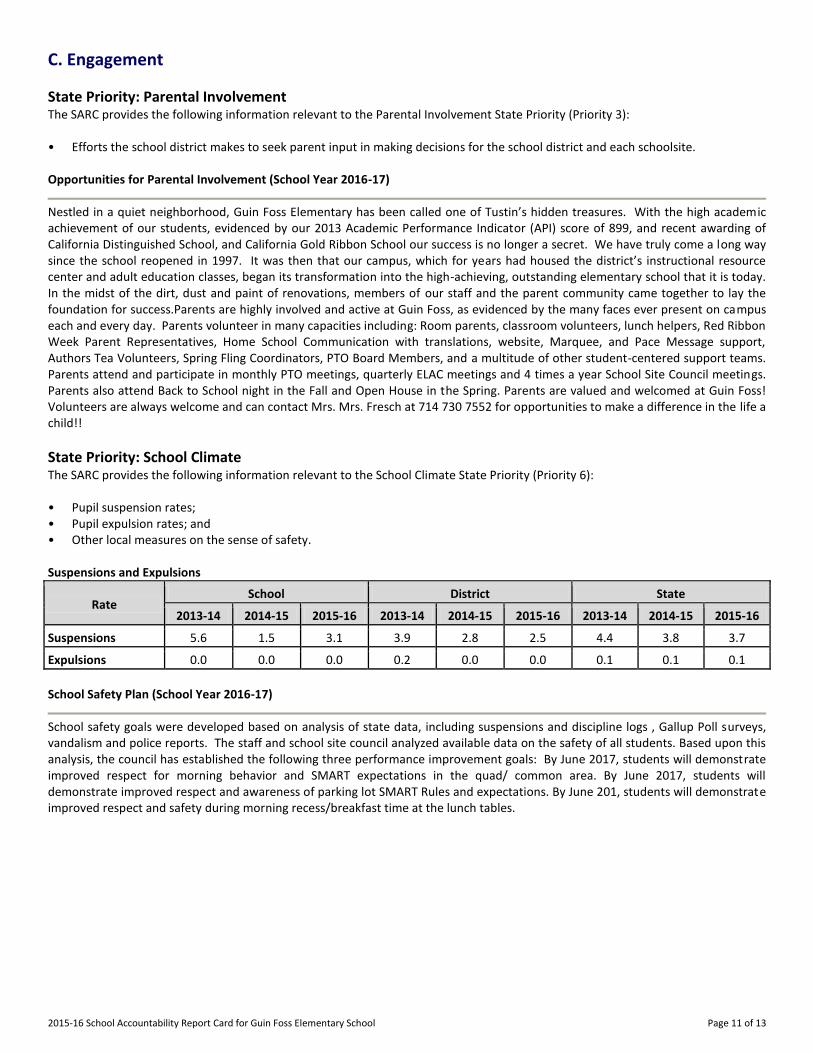
State Priority: Parental Involvement The SARC provides the following information relevant to the Parental Involvement State Priority (Priority 3): • Efforts the school district makes to seek parent input in making decisions for the school district and each schoolsite. Opportunities for Parental Involvement (School Year 2016-17)
Nestled in a quiet neighborhood, Guin Foss Elementary has been called one of Tustin’s hidden treasures. With the high academ ic achievement of our students, evidenced by our 2013 Academic Performance Indicator (API) score of 899, and recent awarding of California Distinguished School, and California Gold Ribbon School our success is no longer a secret. We have truly come a long way since the school reopened in 1997. It was then that our campus, which for years had housed the district’s instructional resource center and adult education classes, began its transformation into the high-achieving, outstanding elementary school that it is today. In the midst of the dirt, dust and paint of renovations, members of our staff and the parent community came together to lay the foundation for success.Parents are highly involved and active at Guin Foss, as evidenced by the many faces ever present on campus each and every day. Parents volunteer in many capacities including: Room parents, classroom volunteers, lunch helpers, Red Ribbon Week Parent Representatives, Home School Communication with translations, website, Marquee, and Pace Message support, Authors Tea Volunteers, Spring Fling Coordinators, PTO Board Members, and a multitude of other student-centered support teams. Parents attend and participate in monthly PTO meetings, quarterly ELAC meetings and 4 times a year School Site Council meetings. Parents also attend Back to School night in the Fall and Open House in the Spring. Parents are valued and welcomed at Guin Foss! Volunteers are always welcome and can contact Mrs. Mrs. Fresch at 714 730 7552 for opportunities to make a difference in the life a child!!
State Priority: School Climate The SARC provides the following information relevant to the School Climate State Priority (Priority 6): • Pupil suspension rates; • Pupil expulsion rates; and • Other local measures on the sense of safety. Suspensions and Expulsions
Rate School District State
2013-14 2014-15 2015-16 2013-14 2014-15 2015-16 2013-14 2014-15 2015-16
Suspensions------- 5.6 1.5 3.1 3.9 2.8 2.5 4.4 3.8 3.7
Expulsions------- 0.0 0.0 0.0 0.2 0.0 0.0 0.1 0.1 0.1
School Safety Plan (School Year 2016-17)
School safety goals were developed based on analysis of state data, including suspensions and discipline logs , Gallup Poll surveys, vandalism and police reports. The staff and school site council analyzed available data on the safety of all students. Based upon this analysis, the council has established the following three performance improvement goals: By June 2017, students will demonstrate improved respect for morning behavior and SMART expectations in the quad/ common area. By June 2017, students will demonstrate improved respect and awareness of parking lot SMART Rules and expectations. By June 201, students will demonstrate improved respect and safety during morning recess/breakfast time at the lunch tables.
2015-16 School Accountability Report Card for Guin Foss Elementary School Page 12 of 13
D. Other SARC Information
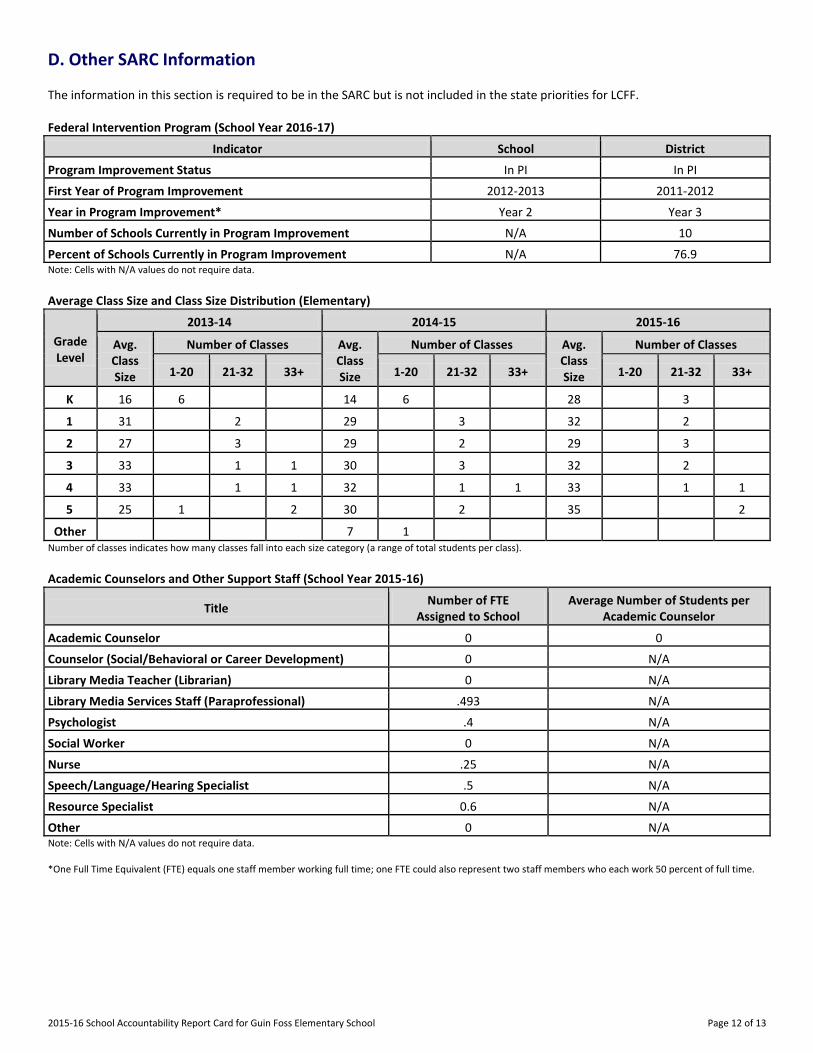
The information in this section is required to be in the SARC but is not included in the state priorities for LCFF. Federal Intervention Program (School Year 2016-17)
Indicator School District
Program Improvement Status In PI In PI
First Year of Program Improvement 2012-2013 2011-2012
Year in Program Improvement* Year 2 Year 3
Number of Schools Currently in Program Improvement N/A 10
Percent of Schools Currently in Program Improvement N/A 76.9 Note: Cells with N/A values do not require data.
Average Class Size and Class Size Distribution (Elementary)
Grade Level
2013-14 2014-15 2015-16
Avg. Class Size
Number of Classes Avg. Class Size
Number of Classes Avg. Class Size
Number of Classes
1-20 21-32 33+ 1-20 21-32 33+ 1-20 21-32 33+
K
16 6 14 6 28 3
1
31 2 29 3 32 2
2
27 3 29 2 29 3
3
33 1 1 30 3 32 2
4
33 1 1 32 1 1 33 1 1
5
25 1 2 30 2 35 2
Other
7 1 Number of classes indicates how many classes fall into each size category (a range of total students per class).
Academic Counselors and Other Support Staff (School Year 2015-16)
Title Number of FTE
Assigned to School Average Number of Students per
Academic Counselor
Academic Counselor------- 0 0
Counselor (Social/Behavioral or Career Development) 0 N/A
Library Media Teacher (Librarian) 0 N/A
Library Media Services Staff (Paraprofessional) .493 N/A
Psychologist------- .4 N/A
Social Worker------- 0 N/A
Nurse------- .25 N/A
Speech/Language/Hearing Specialist .5 N/A
Resource Specialist------- 0.6 N/A
Other------- 0 N/A Note: Cells with N/A values do not require data. *One Full Time Equivalent (FTE) equals one staff member working full time; one FTE could also represent two staff members who each work 50 percent of full time.
2015-16 School Accountability Report Card for Guin Foss Elementary School Page 13 of 13
Expenditures per Pupil and School Site Teacher Salaries (Fiscal Year 2014-15)
Level
Expenditures Per Pupil Average Teacher Salary Total
Supplemental/ Restricted
Basic/ Unrestricted
School Site------- $7,290 $1,847 $5,442 $88,947
District------- N/A N/A $4,915 $79,250
Percent Difference: School Site and District N/A N/A 10.7 12.2
State------- N/A N/A $5,677 $75,837
Percent Difference: School Site and State N/A N/A -4.1 17.3 Note: Cells with N/A values do not require data.
Types of Services Funded (Fiscal Year 2015-16)
Guin Foss Elementary School receives funding for categorical programs that are available at our school site. These programs include Economic LFCC-EL and Title 1 -School-wide Program funds. The Tustin Public Schools Foundation and site PTO also support the school with donations and financial support throughout the year. The school’s Single Plan for Student Achievement (SPSA) identifies student needs and addresses specifically how these categorical funds will support student learning and achievement. Programs that are offered using categorical monies include Multi Tiered Systems of Support (MTSS) which includes specialized teachers/staff for daily interventions for at-risk students, extra hours for ELD support teachers, PE time to allow for PLC time for teachers, professional development opportunities, additional paraeducators to support all students, instructional materials and technology resources. Teacher and Administrative Salaries (Fiscal Year 2014-15)
Category District Amount State Average for Districts In Same Category
Beginning Teacher Salary $48,196 $45,092
Mid-Range Teacher Salary $77,747 $71,627
Highest Teacher Salary $103,485 $93,288
Average Principal Salary (Elementary) $131,008 $115,631
Average Principal Salary (Middle) $146,875 $120,915
Average Principal Salary (High) $148,859 $132,029
Superintendent Salary $293,164 $249,537
Percent of Budget for Teacher Salaries 41% 37%
Percent of Budget for Administrative Salaries 6% 5% For detailed information on salaries, see the CDE Certificated Salaries & Benefits Web page at http://www.cde.ca.gov/ds/fd/cs/. Professional Development (Most Recent Three Years)
Teachers have 3 District-wide non-student days a year for professional development training, 3 voluntary curriculum-focused professional development days for compensation, in addition to 3 professional development hours each month at the end of the teaching day. These days are carefully planned based on identified needs of students based on various assessments, as well as teachers informal surveys for their interests and needs. Trainings include: Multi-tiered Scaffolded Support/ intervention, Balanced Literacy Professional Development and consultant agreement, Houghton Mifflin Language Arts training, CGI Math as a signature practice, GATE, Systematic ELD instruction and training for differentiated curriculum in depth and complexity for gifted students. Teachers also receive on-going training in technology to include newly acquired hand held responders, iPads, Haiku, CCSS Resources, and Smart-boards. Many different methods of professional development trainings are offered to include: Grade level training and collaboration, three school sites shared ELA Coach/ TOSA, district mentors, digital learning coaches, conference attendance, and after school workshops. Teachers are encouraged and supported with grade level collaboration meetings, grade level meetings with administrator, individual meetings with administrator, and peer assistance from colleagues.


![Ursula K. Le Guin [American Author] - um.edu.mt · Ursula K. Le Guin [American Author] Department of Obstetrics & Gynaecology University of Malta Medical School A History of the Menopause](https://img.pdfslide.net/doc/110x75/5c75e3c409d3f2b0618b8a06/ursula-k-le-guin-american-author-umedumt-ursula-k-le-guin-american.jpg)