Embed Size (px)
Citation preview
1
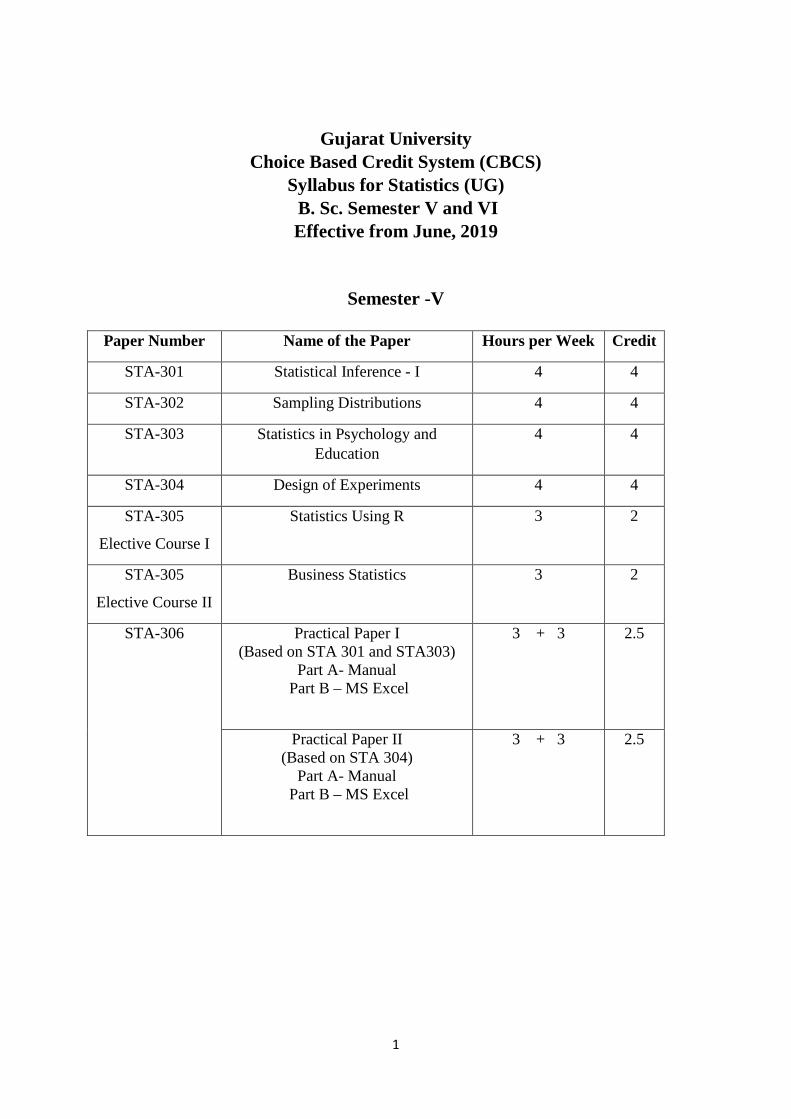
Gujarat University Choice Based Credit System (CBCS)
Syllabus for Statistics (UG) B. Sc. Semester V and VI Effective from June, 2019
Semester -V
Paper Number Name of the Paper Hours per Week Credit
STA-301 Statistical Inference - I 4 4
STA-302 Sampling Distributions 4 4
STA-303 Statistics in Psychology and Education
4 4
STA-304 Design of Experiments 4 4
STA-305
Elective Course I
Statistics Using R
3 2
STA-305
Elective Course II
Business Statistics
3 2
STA-306
Practical Paper I (Based on STA 301 and STA303)
Part A- Manual Part B – MS Excel
3 + 3 2.5
Practical Paper II (Based on STA 304)
Part A- Manual Part B – MS Excel
3 + 3 2.5

2
Semester -VI
Paper Number Name of the Paper Hours per Week Credit
STA-307 Testing of Hypothesis 4 4
STA-308 Sampling Techniques
4 4
STA-309 Statistical Quality Control 4 4
STA-310 Operations Research -1
4 4
STA-311
Elective Course I
Medical Statistics 3 2
STA-311
Elective Course II
Operations Research -1
3 2
STA-312
Practical Paper I (Based on STA 307 and STA 308)
Part A- Manual Part B – MS Excel
3 + 3 2.5
Practical Paper II (Based on STA 309 and STA 310)
Part A- Manual Part B – MS Excel
3 + 3 2.5

3
Semester V
STA- 301 Statistical Inference - I
HOURS PER WEEK CREDIT EXAM HRS 4 4 3 Unit 1: Standard Errors of moments
- Review of standard errors, moments, raw and central moments for a sample of n observations
- Standard error of sample raw moments - Standard error of sample central moments - Standard error of sample correlation coefficient and related results
Unit 2: Point Estimation
- Notion of parameter, parameter space, General problem of estimating an unknown parameter by point estimation
- Concepts of statistic and estimator, Properties of Estimator: unbiasedness, consistency, sufficiency, efficiency
- Factorization theorem on sufficiency – discrete case only - Fisher’s information contained in sample and its use in sufficient statistics - Minimum Variance Unbiased estimator (MVUE) - definition and properties - Rao
Cramer inequality - Related examples
Unit 3: Methods of Estimation - Method of moments - Method of maximum likelihood with properties (statements only) - Method of iteration for maximum likelihood estimators (Method of scoring) - Related examples with standard errors of estimators
Unit 4: Interval Estimation - Introduction to interval estimation - Construction of confidence interval for unknown parameters using (i) Pivotal
Statistics, (II) Maximum Likelihood Estimation, (III) General Method.
Books:
1. Mukhopadhyay, P. (2006): Mathematical Statistics, 3-ed., Books abd Allied(P) Ltd. 2. Mukhopadhyay, N.(2000): Probability and Statistical inference, Marcel Dekker. 3. Rohatgi, V.K. & A.K. Md.E. Saleh (2001) : An Introduction to Probability & Statistics,
John Wiley,2nd Edition 4. Biswas, S. and Sriwastav, G. L. (2011): Mathematical Statistics- a Textbook, Narosa. 5. Ross, S.M.: Introduction to Probability and Statistics for Engineers and Scientists,
Elsevier. 6. Gupta, S. C. and Kapoor, V. K. (2005): Fundamental of Mathematical Statistics,
Sulatan Chand and Sons.

4
7. Hogg, R.V. and Craig, A.T. (1972): Introduction to Mathematical Statistics, Amerind Publishing Co.
8. K.R. Koch (1987) : Parameter Estimation and Hypothesis Testing in Linear Models, 9. Mood, A.M., Greybill, F.A. and Bose, D.C. (1974): Introduction to the Theory of
Statistics, McGraw Hill. 10. Goon, A.M., Gupta, M.K. and Das Gupta, B. (1991): Fundamentals of Statistics, Vol. I,
World Press, Calcutta. 11. Stuart G & Ord J.K. (1991): Advanced Theory of Statistics (Vol 2), Charles Griffin. 12. Lehmann, E.L. (1983) : Theory of Point estimation, Wiley Eastern. 13. Kale, B. K. (1999) : A first course on parametric inference, Narosa publishing, New
Delhi.
5
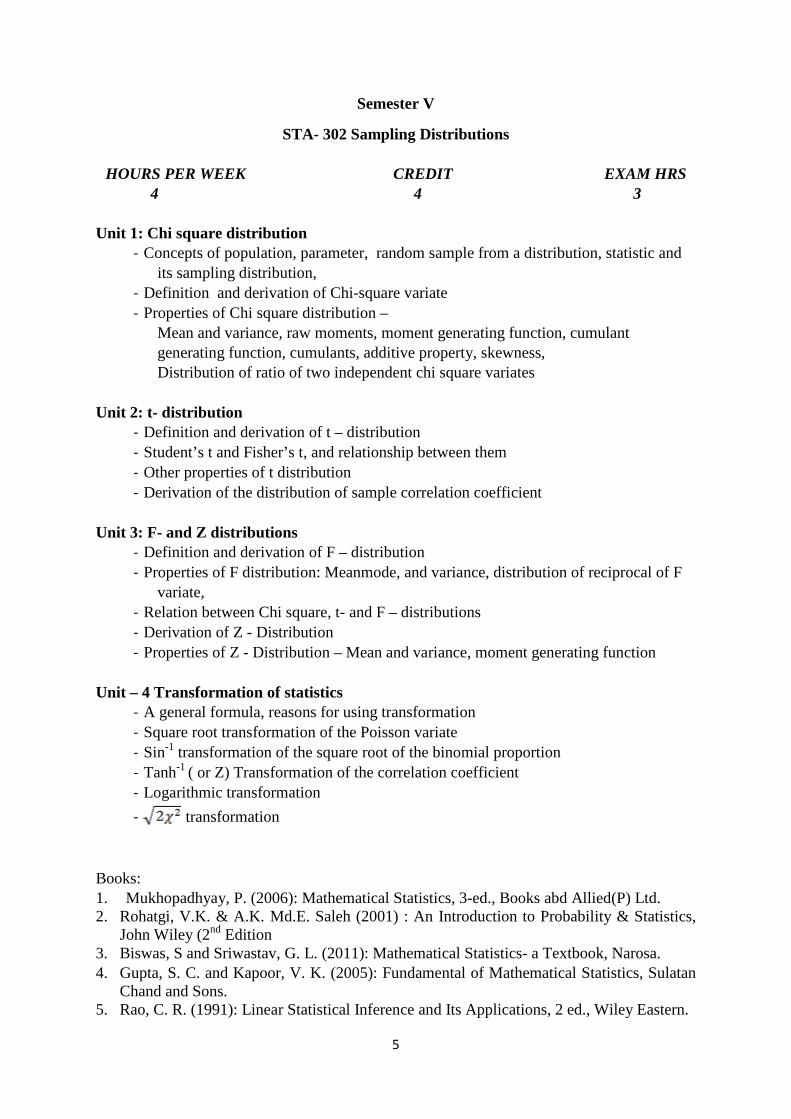
Semester V
STA- 302 Sampling Distributions
HOURS PER WEEK CREDIT EXAM HRS 4 4 3
Unit 1: Chi square distribution
- Concepts of population, parameter, random sample from a distribution, statistic and its sampling distribution,
- Definition and derivation of Chi-square variate - Properties of Chi square distribution –
Mean and variance, raw moments, moment generating function, cumulant generating function, cumulants, additive property, skewness, Distribution of ratio of two independent chi square variates
Unit 2: t- distribution
- Definition and derivation of t – distribution - Student’s t and Fisher’s t, and relationship between them - Other properties of t distribution - Derivation of the distribution of sample correlation coefficient
Unit 3: F- and Z distributions
- Definition and derivation of F – distribution - Properties of F distribution: Meanmode, and variance, distribution of reciprocal of F
variate, - Relation between Chi square, t- and F – distributions - Derivation of Z - Distribution - Properties of Z - Distribution – Mean and variance, moment generating function
Unit – 4 Transformation of statistics
- A general formula, reasons for using transformation - Square root transformation of the Poisson variate - Sin-1 transformation of the square root of the binomial proportion - Tanh-1 ( or Z) Transformation of the correlation coefficient - Logarithmic transformation - transformation
Books: 1. Mukhopadhyay, P. (2006): Mathematical Statistics, 3-ed., Books abd Allied(P) Ltd. 2. Rohatgi, V.K. & A.K. Md.E. Saleh (2001) : An Introduction to Probability & Statistics,
John Wiley (2nd Edition 3. Biswas, S and Sriwastav, G. L. (2011): Mathematical Statistics- a Textbook, Narosa. 4. Gupta, S. C. and Kapoor, V. K. (2005): Fundamental of Mathematical Statistics, Sulatan
Chand and Sons. 5. Rao, C. R. (1991): Linear Statistical Inference and Its Applications, 2 ed., Wiley Eastern.

6
Semester V
STA- 303 Statistics in Psychology and Education
HOURS PER WEEK CREDIT EXAM HRS 4 4 3
Unit 1: Methods of Scaling of Tests
- T – scaling with uses and limitations - Stanine Scaling – Concept, advantages and limitations of Stanine Scaling - Percentile Rank Scaling and its disadvantages, comparison between methods of
Scaling - Scaling of Judgements – types of judgement scaling – (i) Scaling of answer to a questionnaire (ii) Scaling of ratings in terms of normal curves (iii) Scaling of test items in context with level of difficulty
Unit 2: Item Analysis
- Two aspects of item Analysis- (A) Difficulty value, (B) Discriminating value with their detailed explanation
- Steps required in item analysis - Validity and Bi-serial correlation coefficient r. - Distractor and power of distraction - Criterion reference test in item analysis – (A)logical Review, (B) Empirical Review
Unit 3: Reliability of test scores and Methods of determining reliability
- (A) Test – Retest method, (B) Method of alternate or parallel forms, (C) Split – half Method, (D) Rational Equivalence Method
- Reliability and errors of measurements - Standard error of Measurements and Reliability coefficient - Effect of size of groups on reliability
Unit 4: Validity of Scores
- Meaning of validity - types of validity- (A) Operational or Content validity, (B) Functional (or concurrent)
validity, (C) Factorial validity, (D) Face validity, (E) Cross validity - Criteria for validity – (A) Age, (B) Ratings and Scaling of judgement,
(C) Performance in definite job, (D) Correlation with well reputed tests, (E) Educational achievements
- Test length and validity, dependence of validity in reliability Books: 1. Patel, R. S. ( 2008): Statistical Methods for Educational Research, Jay Publication,
Ahmedabad.

7
2. Freeman, F. S.( 1968): Theory and Practice of Psychological testing , Oxford and IBH Publishing Co. New Delhi.
3. Lindquist, E. F. (1968): Statistical Analysis in Educational Research, Oxford and IBH Publishing Co. New Delhi.
4. Mukhopadhyay, P. (1999): Applied Statistics, Books and Allied(P) Ltd, Calcutta.

8
Semester V
STA- 304 Design of Experiments
HOURS PER WEEK CREDIT EXAM HRS 4 4 3
Unit 1: One Way Analysis of Variance and Completely Randomized Design (CRD)
- For fixed effect model One way classification – purpose and Analysis with equal number of observations per cell using ANOVA technique
- Concept of treatment, plot, block, yield, Shapes and Sizes of Plots and Blocks - Principles of experimental design: Randomization, Replication and Local Control - Complete randomized Design (CRD)- Introduction, Layout, statistical analysis and
merit demerits of CRD. Unit 2: Two Way Analysis of Variance and Randomized Block Design (RBD)
- Two way classification – purpose and Analysis with equal number of observations per cell using ANOVA technique - Expected values of sum of squares for both one and two way classifications
- Randomized Block Design (RBD) - Introduction, Layout, statistical analysis and merit demerits of RBD
- Estimation of One and two missing yields - Efficiency of Randomized Block Design over Completely Randomized Design.
Unit 3: Latin Square Design (LSD)
- Latin Square Design - Introduction, Layout, statistical analysis and merit demerits of LSD
- Estimation of One and two missing yields - Efficiency of Latin Square Design (LSD) over Randomized Block Design (RBD) and
over Completely Randomized Design (CRD)
Unit 4 Factorial Design - Concept and need of factorial experiments - Idea of terms – main and interaction effect, - Yates’ Procedure and Yates’ table – for analysing 22 and 23 factorial designs - confounding – total and partial,
Books: 1. Gupta, S. C. And Kapoor, V. K.(2005): Fundamentals of Applied Statistics, Sultan Chand
& Sons. 2. Das, M. N. &Giri, N.: Design of experiments, ( Wiley Eastern Ltd ) 3. Montgomery D.C. (1976): Design and Analysis of Experiments, John Wiley 4. Cochran W.G. & Cox G.M. (1957): Experimental Designs, John Wiley 5. Federer W.T. (1975): Experimental Designs – Theory and Application, Oxford & IBH 6. Mukhopadhyay P. (1999): Applied Statistics

9
ELECTIVE COURSE I
STA-305
STATISTICS USING R
HOUR PER WEEK CREDIT EXAM HRS
3 2 3
Unit I: Introduction to R
R as a Statistical Software and language, R preliminaries, Method of data input, Data accessing or indexing, Data frames and lists, Functions, Graphics with R, Saving, Storing and retrieving work, work space and files, using scripts, using packages. Descriptive Statistics Using R – Diagrammatic representation of data, Graphical representation of data, Measures of central tendency, Measures of dispersion, Measures of skewness and Kurtosis, Selection of representative samples.
Unit II: Probability and Probability distributions using R Probability; definition and properties, probability distributions, some special discrete distributions (Binomial, Poisson), Continuous probability distribution, some special continuous distributions (Normal, exponential)
Methods for generating random variables – Introduction, Random generation of common probability distribution in R, the inverse method, the acceptance rejection methods, transformation methods, sums and mixture, Poisson distribution.
Unit IV: Monte Carlo methods in estimation and Testing
Correlation and Regression Analysis Correlation, Inference procedures for correlation coefficient, Linear Regression, Inference Procedures for simple linear model, validation of linear regression model Monte Carlo estimation and standard error, estimation of MSE, estimating a confidence interval, Monte Carlo methods for hypothesis test, Empirical type I error rate, Power of a test, Comparison of powers of two tests. Statistical Inference – Sampling distribution of the sample mean, Estimation of parameters, plots to check normality, Hypothesis testing, Goodness of fit, one way ANOVA. Books:
1. Statistics Using R –Purohit, S.G., et al. (2008 ) (Narosa Publishing House) 2. Statistical Computing with R – Rizzo, M. L. (2007) (Chapman& Hall/CRC)

10
ELECTIVE COURSE II
STA-305
BUSINESS STATISTICS
HOUR PER WEEK CREDIT EXAM HRS
3 2 3
Unit 1. - Applications of Markov Chain:
- Concept of Markov process, Markov chain, - Construction of transition probability matrix, Chapman – Kolmogorov equation for
higher transition probabilities. - Steady state ( Equilibrium) conditions - Applications of Markov chain in Business and Administration.
Unit 2. - Decision Analysis:
- Introduction to Decision making problem, Decision under uncertainty - Laplace criterion, Minimax, Maximin, Maximax and Minimin criterions,
Hurwicz criterion - Decision under risk- Expected monitory value (EMV) criterion, Expected opportunity
loss (EOL) criterion, EPPI and EVPI
Unit 3. - Simulation: - Introduction, Need of simulation, A general method of simulation - Generationof random numbers, Monte-Carlo Simulation. Applications of simulations,
Advantages and limitations of simulation.
Books: 1. Medhi, J.(1982): Stochastic Processes, Wiley Eastern, 2. Swarup, K, Gupt, P. K. and Mohan, M.(2005): Operations Research, Sultan Chand &
Sons. 3. Gupta, S. P. and Gupta, M. P. (2005): Business Statistics, Sultan Chand & Sons. 4. Isaacson, D.L. and Madesen, R.W. (1976): Markov Chain- Theory and Applications,
Wiley. 5. Gupta, P.K. and Mohan, M ( 2004): Problems in Operations Research, Sultan Chand &
Sons.

11
STA-306 Practical Paper I (Based on STA 301 and STA 303)
HOURS PER WEEK CREDIT EXAM HRS 3 + 3 2.5 3
Part A – Manual
1. Method of moments of finding estimator: - Bernoulli, Binomial and Poisson Distributions. - Truncated Binomial and Truncated Poisson Distributions (Truncated at X = 0 only). - Geometric, negative binomial, Exponential, Beta, Gamma, Normal, Weibull distributions. 2. Method of Maximum Likelihood of finding estimator: - Bernoulli, Binomial and Poisson distributions. - Truncated Binomial and Truncated Poisson Distributions (Truncated at X = 0 only) - Geometric, negative binomial, Exponential, Beta, Gamma, Normal, Weibull distributions. - Use of order statistics for Continuous uniform and exponential distributions. 3. Conversion of raw scores:
- T – scores, Stanine scores. 4. Calculation of σ-score and standardised score. 5. Scaling of Judgements:
- Scaling of answer to a questionnaire. - Scaling of ratings in terms of normal curves. - Scaling of test items in context with level of difficulty.
6. Practical based on Difficulty value and Discriminating value.
7. Criterion reference test in item analysis – (A)logical Review, (B) Empirical Review.
Part B - Statistics Practical using Microsoft Excel
1. Method of moments of finding estimator: - Bernoulli, Binomial and Poisson Distributions. - Truncated Binomial and Truncated Poisson Distributions (Truncated at X = 0 only). - Geometric, negative binomial, Exponential, Beta, Gamma, Normal, Weibull distributions. 2. Method of Maximum Likelihood of finding estimator: - Bernoulli, Binomial and Poisson distributions. - Truncated Binomial and Truncated Poisson Distributions (Truncated at X = 0 only) - Geometric, negative binomial, Exponential, Beta, Gamma, Normal, Weibull distributions. - Use of order statistics for Continuous uniform and exponential distributions. 3. Conversion of raw scores:
- T – scores, Stanine scores.
12
- Calculation of σ-score and standardised score. 4. Scaling of Judgements:
- Scaling of answer to a questionnaire. - Scaling of ratings in terms of normal curves. - Scaling of test items in context with level of difficulty.
5. Practical based on Difficulty value and Discriminating value.
6. Criterion reference test in item analysis – (A) logical Review, (B) Empirical Review.
13
STA-306 Practical Paper II (Based on STA 304)
HOURS PER WEEK CREDIT EXAM HRS 3 + 3 2.5 3
Part A – Manual
1. Statistical analysis of One – way classification. 2. Statistical analysis of Two – way classification. 3. Statistical analysis of Completely Randomized Design, comparison of two treatments. 4. Randomised Block and Latin Square Designs: Statistical Analysis and comparison of treatments, Tukey’s test, Bonferroni’s test for critical difference among treatments. 5. Estimation of missing yields (upto two missing yields) in Randomised Block and Latin Square Designs, Efficiency of these designs. 6. Statistical Analysis of 22 and 23 factorial experiments. 7. Confounding – total and partial
Part B
Statistics Practical using Microsoft Excel
1. Statistical analysis of One – way classification. 2. Statistical analysis of Two – way classification. 3. Statistical analysis of Completely Randomized Design, comparison of two treatments. 4. Randomised Block and Latin Square Designs: Statistical Analysis and comparison of treatments, Tukey’s test, Bonferroni’s test for critical difference among treatments. 5. Estimation of missing yields (upto two missing yields) in Randomised Block and Latin Square Designs, Efficiency of these designs. 8. Statistical Analysis of 22 and 23 factorial experiments.
14
Semester VI
STA- 307 Testing of Hypothesis
HOURS PER WEEK CREDIT EXAM HRS 4 4 3
Unit 1: Parametric Test - Idea of testing of hypothesis - Concept of Statistical Hypothesis, Null and alternative hypotheses, simple and
composite hypothesis - Types of error, level of significance, power of a test, Critical region. Related examples - Neyman Pearson Lemma, Most powerful test, UMP test( Simple versus one sided
alternative without any proof), applications of NP Lemma. Unit 2: Large sample tests - To test the significance of population mean and Proportion - To test the significant difference between two population means, Proportions and
Variances. - Fisher’s Z – transformation for testing significance of observed correlation coefficient - Fisher’s Z – transformation for testing significance of two observed correlation
coefficients Unit 3: Tests based on chi-square, t and F distributions - test for single variance - To test the goodness of fit - To test homogeneity and independence in a contingency table - Fisher’s Z- transformation for testing significance of observed correlation coefficients
based on three or more samples - To test the significance of single mean - To test the significance of difference of two means for independent samples - Paired t- test - To test the significance the significance of observed correlation coefficient - To test the significance the significance of observed partial correlation coefficient - To test the significance of ratio of two variances - To test the significance of observed multiple correlation coefficient
Unit 4: Non-parametric tests - Introduction to nonparametric tests, difference between parametric and nonparametric
tests - Sign test, Wilcoxon signed- rank test, Median test, - Concept of Run and Run test - Mann Whitney U test.

15
Books:
1. Hogg, R.V. and Craig, A.T. (1972): Introduction to Mathematical Statistics, Amerind Publishing Co.
2. K.R. Koch (1987) : Parameter Estimation and Hypothesis Testing in Linear Models, 3. Mukhopadhyay, N.(2000): Probability and Statistical inference, Marcel Dekker. 4. Kale, B. K. (1999) : A first course on parametric inference. Narosa publishing, New
Delhi. 5. Rohatgi, V.K. & A.K. Md.E. Saleh (2001) : An Introduction to Probability & Statistics,
John Wiley (2nd Edition 6. Gupta, S. C. and Kapoor, V. K. (2005): Fundamental of Mathematical Statistics,
Sulatan Chand and Sons. 7. Mukhopadhyay, P. (2006): Mathematical Statistics, 3-ed., Books abd Allied(P) Ltd. 8. Siegel, S.(1956): Non parametric statistics for the behavioural sciences. McGraw-Hill
Book company.

16
Semester VI
STA- 308 Sampling Techniques
HOURS PER WEEK CREDIT EXAM HRS 4 4 3
Unit 1: Simple Random Sampling - Simple Random Sampling with and without replacement and their properties. - Methods of selecting a simple random sample - Estimation of population mean, total and proportion, Standard error and estimation of
standard errors - Confidence Limits for Population Mean and Total, Estimation of sample size
Unit 2: Stratified Random Sampling - Meaning of stratification, stratified sampling and stratified sample - Estimation of population mean and total, standard error of estimators and estimation of
standard errors. - Allocation - Proportional, Neyman and Optimum allocations for fixed precision. - Determination of sample sizes when (i) variance of stratified mean is known and
(ii) when total cost of sampling (C) is known - Comparison between stratified sampling and Simple Random Sampling - Merits and demerits of stratified sampling
Unit 3: Systematic Sampling - Idea of systematic sampling - Advantages and limitations of systematic sampling - Estimation of the population mean and standard error of the estimator. - Comparison of systematic sampling (N = nk) with SRSWOR and stratified sampling.
Unit 4: Two Stage Sampling - Concept of two state sampling - Estimator, variance of estimator. Unbiased estimator of variance of estimator - Estimation of mopt and nopt.
Books: Murthy, M.N : Sampling Theory and Methods, (Statistical Probability Society , Calcutta. 1. Cochran, W.G: Sampling Techniques, Wiley Eastern Ltd. 3. Desraj: Sampling Theory, Tata Mc Graw Hill. 4. Singh, D. and Chaudhary, F.S.: Theory and Analysis of Sample survey, John Wiley and Sons. 5. Mukhopadhyay, P. (1998): Theory and Methods of Survey Sampling, Prentice Hall. 6. Goon, A.M., Gupta, M.K. and Das Gupta, B. (1991): Fundamentals of Statistics, Vol. II, 7. Mukhopadhyay, P. (1999): Applied Statistics, World Press, Calcutta. 8. Gupta, S. C. And Kapoor, V. K.(2005): Fundamentals of Applied Statistics, Sultan Chand & Sons.

17
Semester VI STA- 309 Statistical Quality Control
HOURS PER WEEK CREDIT EXAM HRS
4 4 3 Unit 1: General Theory of Control Charts - Introduction to quality and quality control - Importance of Statistical methods in industrial research - Importance of SQC, Meaning and specification of item and lot qualities, - Chance and Assignable Causes of Variation in quality - Determination of tolerance limits, specification limits and warning limits, 3 – σ limits, - General theory of control charts, Theory of runs. Criterion for detecting lack of control.
Unit 2: Control Charts - Control Charts - Basis, Rational subgroups,
Control charts for variables: Construction of -chart, R-chart, S-chart and their interpretations. OC function of chart only.
- Control charts for attributes: Construction of p, np, c, u charts and their interpretations. Unit 3: Acceptance Sampling Plans for attributes - Principle of accepting sampling, stipulation of good and bad lots. - Meaning and purpose of Average Quality Level (AQL), Lot Tolerance Percentage
Defective (LTPD), Producer’s risk and Consumer’s risk, Operation Characteristic (OC) curve and ideal O C curve, Average Outgoing Quality (AOQ), Average Outgoing Quality Level (AOQL), Average Sample Number (ASN), Average Total Inspection (ATI).
- Single sampling plan-Construction of Single Sampling Plan given two points on the OC curve, O C curve, Average Outgoing Quality (AOQ), Average Outgoing Quality Level (AOQL), Average Sample Number (ASN), Average Total Inspection (ATI) for single sampling plan.
- Double sampling plan- OC curve, Average Outgoing Quality (AOQ) for double sampling plan.
Unit 4: Acceptance Sampling Plans for variables - Sampling plan for variables
(i) when LCL is specified (a) σ is known, (b) σ is unknown, (ii) when UCL is specified (a) σ is known, (b) σ is unknown
- Advantages and disadvantages of sampling inspection plans for variables compare to sampling inspection plans for attributes.

18
Books:
1. Montgomery, D.C. (2001): Introduction to Statistical Quality Control, Wiley. 2. Grant, E.L. (2000) : Statistical Quality Control, 7th Ed., Tata Mcgraw Hill. 3. Ott, E.R. (1975) : Process Quality Control, McGraw Hill. 4. Wetherill, G.B. (1977) : Sampling Inspection and Quality Control, Halsted Press. 5. Wetherill, G.B. and Brown, D.W. : Statistical Process Control, Theory and Practice, 6. Chapman and Hall, - Brownlee, K. A (1960): Statistical Theory and Methodology in
Science and - Engineering, John Wiley & sons. 7. Gupta, S. C. And Kapoor, V. K. Fundamentals of Applied Statistics

19
Semester VI STA- 310 Operations Research - 1
HOURS PER WEEK CREDIT EXAM HRS
3 4 3 Unit 1. Operations Research and Linear Programming - Nature, Scope and Models in Operations Research - Linear programming problems – formulation, solution by – graphical method, simplex
algorithm (without proof), Charne’s M-technique (without proof). condition for alternative basic feasible solution, Opportunity cost, Shadow cost, Related examples.
Unit 2. Transportation and Assignment problems - Transportation problem-Balanced and unbalanced problems, Initial solution by north
west corner rule, table minimum method and Vogel’s method. Stepping stone algorithm and U-V method of solving Transportation problem (without proof). Degenerate transportation problems
- Assignment problem- Balanced and unbalanced problems . Hungarian algorithm (without proof).
Unit 3. PERT and CPM: - Project planning with PERT and CPM - Drawing of Project network, critical path identification, slack time and float. - Calculation of probability of completing the Project within a specified time.
Unit 4. Game Theory: - Introduction, Two-Person zero sum games, Basic terms of game problem. - Maximin- Minimax principle, Rule for determining a saddle point, value of the game. - Game without saddle point (mixed strategies) for two strategies(without proof). - Dominance property.
Books:
1. Hillier, F.S. and Liebermann G.J. (1970): Introduction to Operations Research, Tata McGraw.Hill.
2. Gass, S.I. (1975) : Linear Programming, Methods and Applications, 4th Ed 3. Sivazlian, B.D. and Stanfel, L.E.(1975): Analysis of Operations Research. 4. Kanti Swarup, Gupta, P.K. and Singh, M.M. (1985): Operations Research, Sultan
Chand and Sons. 5. Taha, H.A. (1976) : Operational Research : An Introduction, 2nd Ed. 6. Philips, D.T., Ravindran, A. And Solberg, J. (1976): Operations Research, Principles
and Practice. 7. Heardly, G. (1962): Linear Programming.

20
ELECTIVE COURSE I
STA-311 - Medical Statistics
HOUR PER WEEK CREDIT EXAM HRS
4 2 3
Unit 1. Population study - India's population and census, - Population growth and models for population growth, - Birth and death rates, - Survival function, - Hazard rate (age specific mortality rate), - Use of exponential and Weibull distribution for modelling hazard rate.
Unit 2. Epidemiology
- Epidemiology. - Odds, odds ratio, relative risk. - Estimation of odds ratio (OR), Confidence interval for OR. Relation with parameter in a log it model. - Symmetry in square contingency tables, collapsing tables and Simpson's paradox
Unit 3. Clinical trials-I & II Clinical trials-I
- General information on history of drug discovery including Louis Pasteur (rabies and small pox, Ronald Ross and malaria, Alexander Fleming and penicillin, Jonas Salk and polio, Cholera, asthma, diabetes, blood pressure, heart attack, arthritis. - Phases of clinical trial, purpose, duration, cost, drug regulatory bodies, ICH, statistical analysis plan, clinical study report - Parallel designs, case control studies, longitudinal studies, safety studies
Clinical trials-II - treatments, 2 periods cross over design. - Bioequivalence and bio-availability, non-inferiority trial. - Practice based medical research, evidence based medicine.
Books: 1. Piantadosi, S. (1977): Clinical: A Methodologic Perspective. Wieley and Sons. 2. Jennison, C. and Turnbull, B.W.(1999): Group Sequential Methods with Applications to Clinical Trials, CRC Press. 2. Flesis, J.(1989): The Design and Analysis of Clinical Experiments. Wiely and Sons. 4. Marubeni, E. and Valsechhi, M.G. (1994). Analyzing Survival Data From Clinical Trials and Observational Studies. Wiley and Sons. 5. Friendman, L. M, Furbery, C. D. Demets, D. L. : Fundamental of clinical Trials, Springer
Publication,Third Edition. 6. Duolaowang, Ameet Bakhai (2006) Clinical Trials A Practical Guide to Design, Analysis,
and Reporting, Published By Remedica, USA.
21
ELECTIVE COURSE II
STA – 311 OPERATIONS RESEARCH - 2
HOUR PER WEEK CREDIT EXAM HRS
4 2 3 Unit 1. Duality:
-Introduction, Formulating dual problem, general primal –dual pair, The fundamental theorem of duality( without proof), Solution of dual problem formprimal problem in simplex method -Revised simples method: Introduction, Algorithm of revised simplex method for
unbounded variables, examples.
Unit 2. Sequencing Problem: -Introduction, Basic terms, Processing n jobs through twomachines, algorithm, processing of n jobs through k machines, algorithm, problems.
Unit 3. Replacement Problem: -Introduction, Replacement model for items whichdeteriorate with time when value of money does not change with time and (i) when time is a continuous variable and (ii) discrete variable, examples - Group replacement of items: concept of group replacement, criterion for group replacement, examples
Books:
1. Kanti Swarup, Gupta, P.K. and Singh, M.M. (1985): Operations Research, Sultan Chand and Sons.
2. Hillier, F.S. and Liebermann G.J. (1970): Introduction to Operations Research, Tata McGraw.Hill.
3. Sivazlian, B.D. and Stanfel, L.E.(1975): Analysis of Operations Research. 4. Taha, H.A. (1976) : Operational Research : An Introduction, 2nd Ed. 5. Philips, D.T., Ravindran, A. And Solberg, J. (1976): Operations Research, Principles and
Practice.

22
STA-312 Practical Paper I (Based on STA 307 STA 308)
HOURS PER WEEK CREDIT EXAM HRS 3 + 3 2.5 3
Part A – Manual
1. Problems based on Testing of Hypothesis: To find size of type – I and type – II error, Power of test and power curve, Critical Region, 2. Use of NP Lemma to find MP critical region – Basic Discrete distribution. 3. Use of NP Lemma to find MP critical region – Basic Continuous distribution. 4. Use of likelihood ratio test to find UMP critical region – Basic Discrete distribution. 5. Use of likelihood ratio test to find UMP critical region – Basic Continuous distribution. 6. To test the significance of population mean and Proportion 7. To test the significant difference between two population means, Proportions and
Variances. 8. Fisher’s Z – transformation for testing significance of observed correlation coefficient 9. Fisher’s Z – transformation for testing significance of two observed correlation
coefficients 10. tests based on chi square, t and F statistics. 11. Nonparametric Tests and related problems based on Sign test, Wilcoxon signed rank test,
run test, median test, Mann-Whitney U-test. 12. Simple Random Sampling 13. Stratified Random Sampling 14. Systematic sampling 15. Two stage sampling
Part B
Statistics Practical using Microsoft Excel
1. To test the significance of population mean and Proportion 2. To test the significant difference between two population means, Proportions and
Variances. 3. Fisher’s Z – transformation for testing significance of observed correlation coefficient 3. Fisher’s Z – transformation for testing significance of two observed correlation coefficients 4. Tests based on chi square, t and F statistics. 5. Simple Random Sampling 6. Stratified Random Sampling 7. Systematic sampling 8. Two stage sampling

23
STA-312 Practical Paper II (Based on STA 309 STA 310)
HOURS PER WEEK CREDIT EXAM HRS 3 + 3 2.5 3
Part A – Manual
1. Construction of X-bar , R – chart, 2. Construction of X-bar and S – chart, O.C. curve for X-bar – chart. 3. Simple examples on X-bar , R and S charts, 4. Construction of p and np charts with fixed and floating sample sizes, 5. Construction of C, and U charts. 6. Acceptance Sampling: Single sampling Plan (for attributes). Drawing of O.C. curve, AOQ curve, ASN curve, ATI curve, problems based on AQL and LTPD 7. Simple problems based on acceptance sampling plans for variables. 8. Formulation of LPP and its solution using graphical method. 9. Simplex method (for 3 variables only) 10. Simplex Method and artificial variable (for 3 variables only) 11. Transportation problem – Initial Solution by North West corner rule, Row minima, column minima, matrix minima, Vogel’s Approximation method 12. Optimum solution to the transportation problem using MODI method and assignment problem using Hungarian method. 13. Problems based on PERT and CPM. 14. Problems based on game theory.
Part B
Statistics Practical using Microsoft Excel
1. Construction of X-bar , R – chart, 2. Construction of X-bar and S – chart, O.C. curve for X-bar – chart. 3. Simple examples on X-bar , R and S charts, 4. Construction of p and np charts with fixed and floating sample sizes, 5. Construction of C, and U charts. 6. Acceptance Sampling: Single sampling Plan (for attributes). Drawing of O.C. curve, AOQ curve, ASN curve, ATI curve, problems based on AQL and LTPD 7. Simple problems based on acceptance sampling plans for variables. 8. Problems based on game theory.