Embed Size (px)
Citation preview
Gulf Hypoxia and Water Quality in the Upper
Mississippi River Basin
Catherine L. Kling
Iowa State University
“Least Cost Control of Agricultural Nutrient Contributions to the Gulf of Mexico
Hypoxic Zone,” Sergey Rabotyagov, Todd Campbell, Manoj Jha, Hongli Feng, Philip
W. Gassman, Lyubov Kurkalova, Silvia Secchi, and Catherine L. Kling.
2
Overview Water quality related to water quantity, floods,
climate, hydrology, and land use, which are all related economics and policy
Gulf hypoxia and water quality in UMRB
Modeling system for Upper Mississippi River Basin
Water quality and hydrology
Economics/land use models

3
Gulf Hypoxia
• Over 400 hypoxic areas worldwide, combined
affected area of 245,000 km2 (Diaz and
Rosenberg, 2008)
•Naturally occurring, but significantly enhanced
by anthropogenic sources of nutrients
•43% N and 41 % P reaching hypoxic zone
originates from UMRB (USGS)
•Gulf of Mexico effects still poorly documented,
brown shrimp fishery effects, recreational fishing
4
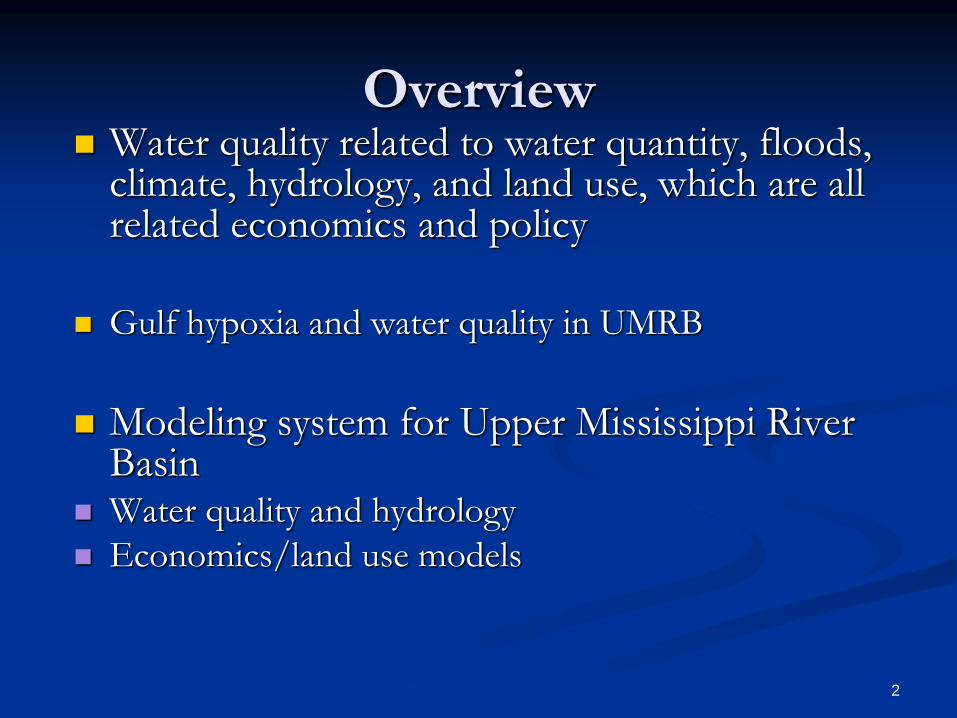
2008 Hypoxic Zone
2nd largest on record, ~ size of New Jersey

5
189,000 square miles in seven states,
dominated by agriculture: 67% of total area,
> 1200 stream segments and lakes on EPAs impaired waters list,
Upper Mississippi River Basin

6
How to Address?
Enormous number of farm fields/decision makers
Each : one or more land use/conservation practices
Retire land (e.g., CRP), Reduce tillage, Terraces, Contouring, Grassed Waterways, Reduce fertilizer, better timing, etc.
Costs and effectiveness vary across locations
Other complications:
Biofuels,
Climate change
Other environmental concerns

UMRB Modeling System
Designed to support policy design and to understand
consequences of land use change
Components: SWAT model linked with land use
economic model, loads of data
Evaluation policies by running scenarios Posit changes in prices or policies (taxes, cap and trade, etc.)
Predict changes in land use (shift crop choices, implement conservation practices, retire land from production)
Evaluate water quality effects of a configuration of conservation practices
7

SWAT
Physically based and continuous watershed based hydrology and water quality model, daily time step
Developed to predict impacts of land management practices on watershed hydrology and water quality
Watershed divided into sub watersheds, then HRUs, mass balances performed at HRU level, loadings routed through main channels, reservoirs to the watershed outlet
Extensively used world wide; over 250 peer reviewed publications

Key Data Sources
Land use data: 1997 NRI database, 114,000 survey points in
UMRB (non-GIS),Comprehensive cropping history
(rotation),Other land use data
Topography: 30m DEM, USGS Seamless Data Distribution
System,
Climate data: Illinois Water Survey, 535 stations across UMRB
Fertilizer rates and tillage data, 1990-95 Cropping Practice
Survey, ARMS, CTIC
Soil data, derived from USDA Soils5 Data
Economics cost data, crop budgets, state conservation program
costs, land retirement (2007 rental rates)

10
UMRB Watershed Model
7070
7120
7090
7030
71007080
7140
7040
7130
7010
7020
7050
7110
7060
Sub Basin
NRI points
Average size NRI “point”
(Acres) HRU Count
7030 4113 1,199 27
7060 5930 922 105
7050 3847 1,581 52
7110 5883 1,088 118
7040 6495 1,056 119
7120 7661 905 151
7090 7167 971 183
7070 5141 1,480 49
7100 8375 1,097 283
7020 7797 1,380 373
7140 7776 1,397 203
7130 9745 1,171 433
7010 8954 1,415 139
7080 14965 975 495
11
Using Integrated Models to provide
information on Gulf Hypoxia
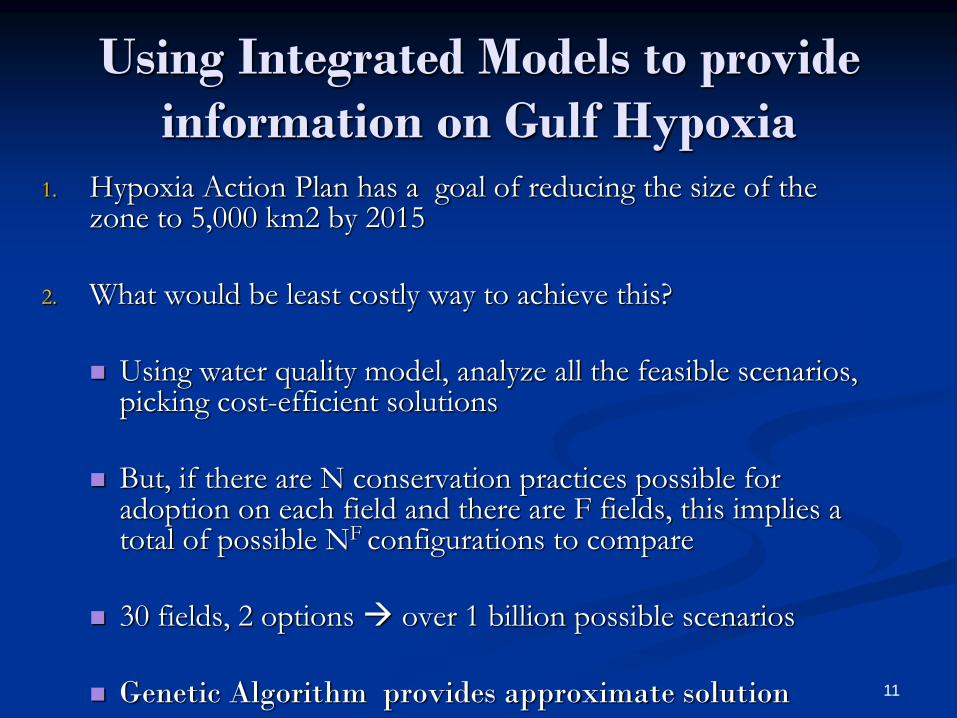
1. Hypoxia Action Plan has a goal of reducing the size of the zone to 5,000 km2 by 2015
2. What would be least costly way to achieve this?
Using water quality model, analyze all the feasible scenarios, picking cost-efficient solutions
But, if there are N conservation practices possible for adoption on each field and there are F fields, this implies a total of possible NF configurations to compare
30 fields, 2 options over 1 billion possible scenarios
Genetic Algorithm provides approximate solution
12
One possible watershed
configuration
a
d b
a b
c
a
d
a
b
a a
a
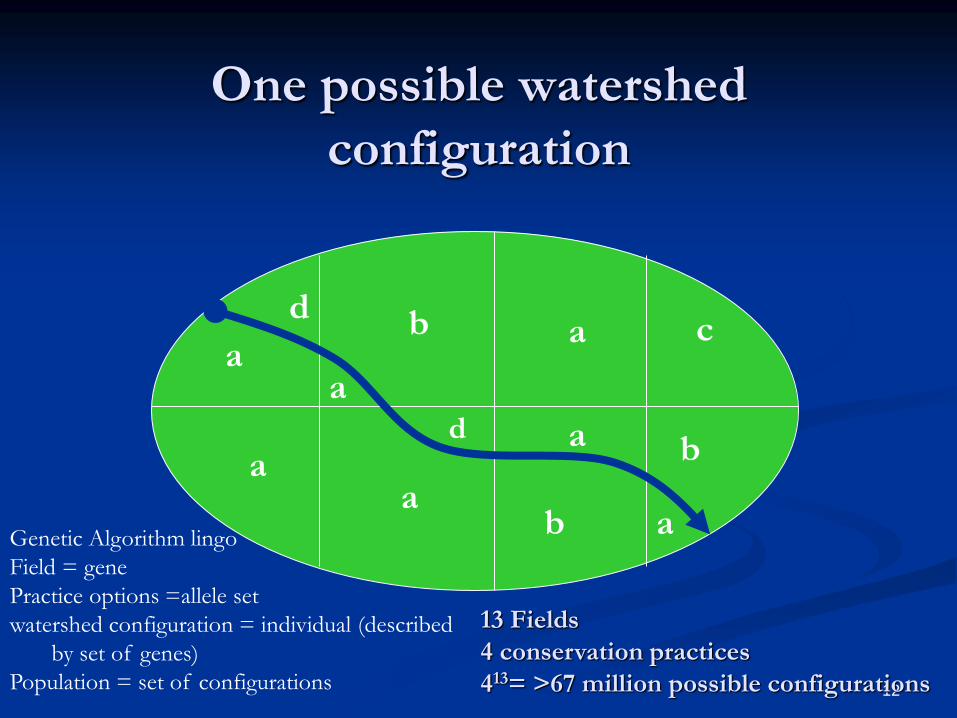
13 Fields
4 conservation practices
413= >67 million possible configurations
Genetic Algorithm lingo
Field = gene
Practice options =allele set
watershed configuration = individual (described
by set of genes)
Population = set of configurations

13
Algorithm flow diagram
Individual = watershed configuration
= specific assignment of practices
to fields
Population = set of watershed configurations

14
Pareto frontier: UMRB
15
Tradeoffs of NPS control costs and
water quality benefits
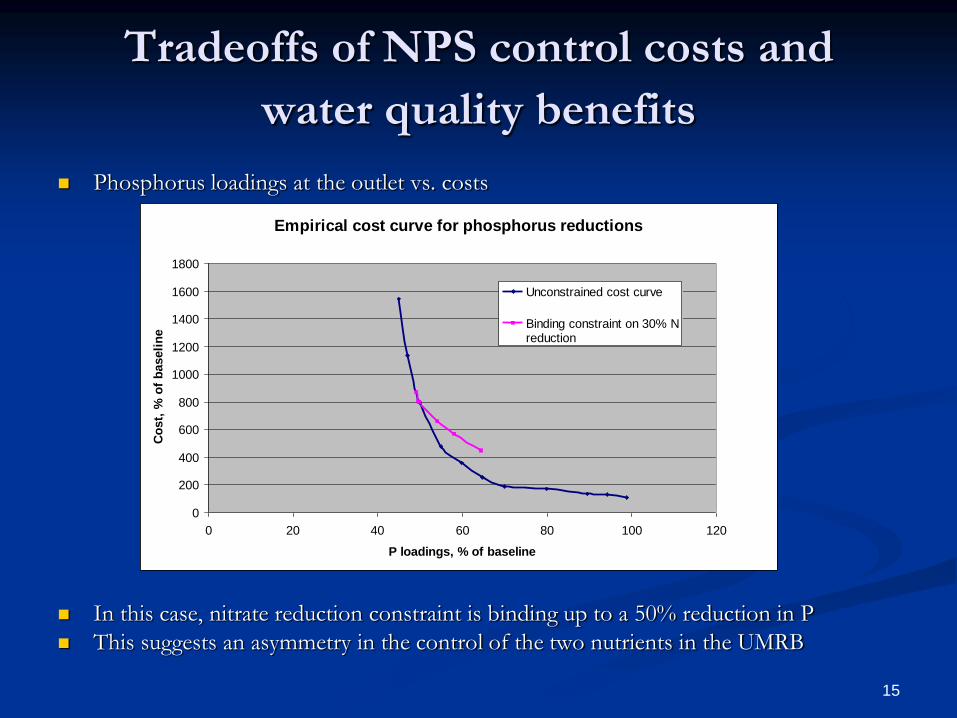
Phosphorus loadings at the outlet vs. costs
In this case, nitrate reduction constraint is binding up to a 50% reduction in P
This suggests an asymmetry in the control of the two nutrients in the UMRB
Empirical cost curve for phosphorus reductions
0
200
400
600
800
1000
1200
1400
1600
1800
0 20 40 60 80 100 120
P loadings, % of baseline
Co
st,
% o
f b
aseli
ne
Unconstrained cost curve
Binding constraint on 30% Nreduction
16
Tradeoffs of NPS control costs and
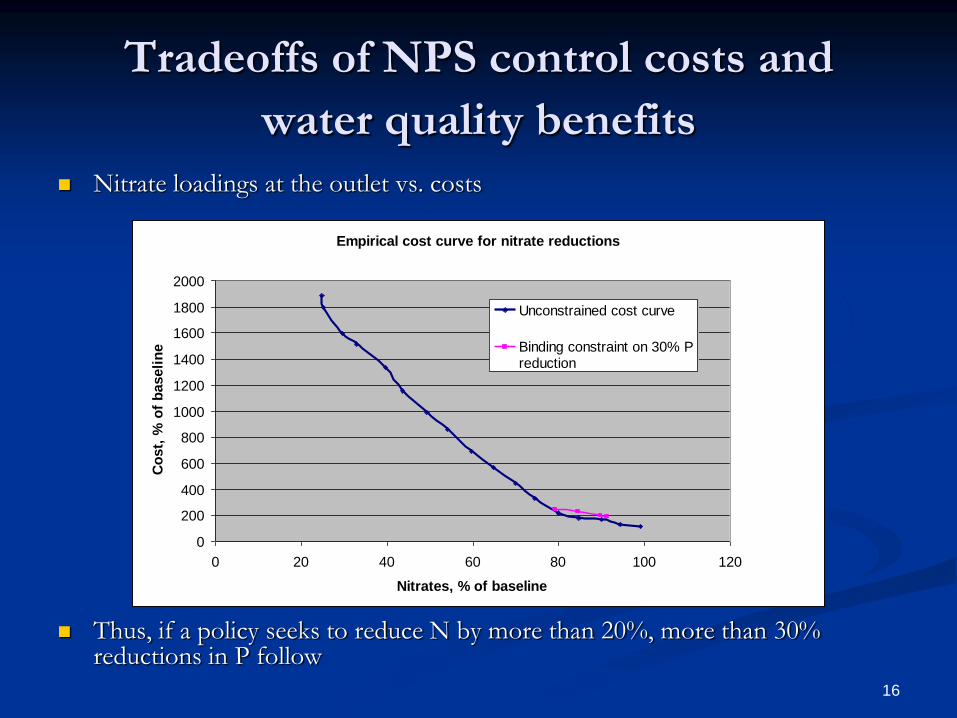
water quality benefits Nitrate loadings at the outlet vs. costs
Thus, if a policy seeks to reduce N by more than 20%, more than 30% reductions in P follow
Empirical cost curve for nitrate reductions
0
200
400
600
800
1000
1200
1400
1600
1800
2000
0 20 40 60 80 100 120
Nitrates, % of baseline
Co
st,
% o
f b
aseli
ne
Unconstrained cost curve
Binding constraint on 30% Preduction

Nitrate-N loading
that yields 30%
nitrate-N and
36% P loading
reduction
Annual additional cost: $ 1.4 billionost)

18
USDA payments for farms in Iowa
($million, From EWG)
Year Conservation
Payments
Disaster
Payments
Commodity
Payments
Total USDA
Payments
2000 $169.25 $15.63 $2,118.23 $2,303.10
2001 $208.16 $20.26 $1,742.67 $1,971.09
2002 $223.19 $18.00 $498.03 $739.22
2003 $219.12 $65.30 $761.06 $1,045.48
2004 $221.21 $1.30 $1,030.59 $1,253.10
2005 $219.22 $85.00 $1,936.61 $2,240.83
Next Steps
Compare cost savings to alternative decision
rules
Look at sensitivity of costs to climate change by
incorporating regional climate model predictions
into modeling framework
Investigate policy design: how do we design
incentives to achieve improvements in water
quality at low cost?
19


![LCC Mississippi Gulf Hypoxia Initiative (MRB/GHI ... Hypoxia... · will change hands –some to international investors. [all national cropland = 442 million acres] From: Oakland](https://img.pdfslide.net/doc/110x75/605a6fc00734c910bc13f266/lcc-mississippi-gulf-hypoxia-initiative-mrbghi-hypoxia-will-change-hands.jpg)