Embed Size (px)
Citation preview

Gupta, V; Downs, SM; Ghosh-Jerath, S; Lock, K; Singh, A (2016) Un-healthy Fat in Street and Snack Foods in Low-Socioeconomic Settingsin India: A Case Study of the Food Environments of Rural Villagesand an Urban Slum. Journal of nutrition education and behavior, 48(4). 269-79.e1. ISSN 1499-4046 DOI: https://doi.org/10.1016/j.jneb.2015.11.006
Downloaded from: http://researchonline.lshtm.ac.uk/2531247/
DOI: 10.1016/j.jneb.2015.11.006
Usage Guidelines
Please refer to usage guidelines at http://researchonline.lshtm.ac.uk/policies.html or alterna-tively contact [email protected].
Available under license: http://creativecommons.org/licenses/by/2.5/

Research ArticleUnhealthy Fat in Street and Snack Foods inLow-Socioeconomic Settings in India: A Case Studyof the Food Environments of Rural Villagesand an Urban SlumVidhu Gupta, MSc1; Shauna M. Downs, PhD2; Suparna Ghosh-Jerath, PhD, APD1;Karen Lock, PhD3; Archna Singh, PhD, MPH4
ABSTRACT
Objective: To describe the food environment in rural villages and an urban slum setting in India withreference to commercially available unbranded packaged snacks and street foods sold by vendors, andto analyze the type and quantity of fat in these foods.Design: Cross-sectional.Setting: Two low-income villages in Haryana and an urban slum in Delhi.Participants: Street vendors (n¼ 44) were surveyed and the nutritional content of snacks (n¼ 49) sold byvendors was analyzed.Main Outcome Measures: Vendors’ awareness and perception of fats and oils, as well as the type ofsnacks sold, along with the content and quality of fat present in the snacks.Analysis: Descriptive statistics of vendor survey and gas chromatography to measure fatty acid contentin snacks.Results: A variety of snacks were sold, including those in unlabeled transparent packages and open glassjars. Mean fat content in snacks was 28.8 g per 100-g serving in rural settings and 29.6 g per 100-g serving inurban settings. Sampled oils contained high levels of saturated fats (25% to 69% total fatty acids) and transfats (0.1% to 30% of total fatty acids).Conclusions and Implications: Interventions need to target the manufacturers of oils and fats used infreshly prepared products to improve the quality of foods available in the food environment of low-socioeconomic groups in India.Key Words: trans fatty acids, fatty acids, food environment, snacks, low- or middle-income country (JNutr Educ Behav. 2016;48:269-279.)
Accepted November 28, 2015. Published online February 9, 2016.
INTRODUCTION
What people eat depends not only onindividual and cultural factors butalso on their surrounding food envi-
ronment.1 The food environment isone of the major domains in whichpolicies can intervene to improve theavailability, affordability, and accept-ability of healthier food.2 By improving
nutrition labeling, offering healthierfoods, setting standards in public insti-tutions, using economic tools toaddress food affordability, restrictingfood advertising, improving the qual-ity of the food supply, and setting in-centives and rules to create a healthyretail environment, the food environ-ment can better support consumers tomake healthier food choices.2
Most research on food environ-ments has been conducted in the USand other high-income countries.1 Inthe US, studies have shown that lower-socioeconomic communities tend tobe characterized by the high availabil-ity of convenience and energy-densefoods of little nutritional value andthe low availability of fresh produceand other nutritious foods.3,4 Barriersto access can make it difficult forpeople to choose healthy food.5-7 How-
1Indian Institute for Public Health–Delhi, Public Health Foundation of India, Haryana, India2Menzies Centre for Health Policy, University of Sydney, Sydney, Australia3London School of Hygiene and Tropical Medicine and Leverhulme Centre for IntegrativeResearch on Agriculture and Health, London, United Kingdom4Indian Institute for Public Health–Delhi, Public Health Foundation of India and All IndiaInstitute of Medical Sciences, Delhi, IndiaConflict of Interest Disclosure: The authors’ conflict of interest disclosures can be found onlinewith this article on www.jneb.org.Address for correspondence: Shauna M. Downs, PhD, Menzies Centre for Health Policy,Victor Coppleson Bldg (D02), University of Sydney, Sydney NSW 2006, Australia; Phone:þ(1 347) 431 5630; E-mail: [email protected]�2016 The Authors. Published by Elsevier, Inc. on behalf of the Society for NutritionEducation and Behavior. This is an open access article under the CC BY license (http://creativecommons.org/licenses/by/4.0/).http://dx.doi.org/10.1016/j.jneb.2015.11.006
Journal of Nutrition Education and Behavior � Volume 48, Number 4, 2016 269

ever, there is a paucity of researchassessing the food environments oflow-socioeconomic status (SES) set-tings in low-income (defined as thosewith a gross national income per cap-ita of # $1,045 in 2013) and middle-income countries (defined as thosewith a gross national income per cap-ita of> $1,045but< $12,746) (LMICs).Therefore, it is important to examinethe situation in LMICs, because littleis known about the nature of theirfood environments.
ManyLMICsworldwide are currentlyundergoing a nutrition transition: ashift from traditional dietary patternstoward a more Western diet consist-ing of energy-dense foods high infat, sugar, and salt.8-10 The transition,which has been linked to a rise indiet-related noncommunicable dis-eases, is rooted in globalization.11 Asa result, many countries now face adouble burden of diet-related diseasesin which undernutrition and overnu-trition coexist, even within the samehousehold (HH).12-14
Although the dietary intakes oflower-socioeconomic groups in LMICsare often limited by the scarcity offood, itmay no longer be themain fac-tor affecting energy intakes in somesettings; instead, the availability ofcheap, energy-dense foods, includingthose from street vendors, may resultin increased energy intake.15 Streetand snack foods have become a signif-icant source of food for many peoplein LMICs as people migrate fromrural to urban areas.16 In particular,low-incomepopulations often dependalmost exclusively on food preparedby street vendors.16 Unfortunately,many vendors sell food of suboptimalnutritional quality.15 A study conduct-ed in India found that migrant and ur-banmenconsumedahigherproportionof energy from fat and saturated fatthan do rural men, which suggests ashift toward a lower-quality diet aftermigration.17 In the absence of a diver-sified, nutrient-dense diet, there maybe a propensity for overconsumptionleading to overweight and obesitybut a simultaneous failure to meet mi-cronutrient requirements.18
In India, HHs in both urban and ru-ral areas are dealing concomitantlywith undernutrition and diet-relatednoncommunicable diseases, particu-larly heart disease and diabetes.19 Ur-ban slum dwellers in India are often
deficient in key nutrients20 whileconsuming high intakes of trans fattyacids (TFAs) from hydrogenated oils.21
These dietary TFAs have adverse effectson blood lipoprotein profiles and coro-nary heart disease risk affecting indi-viduals and populations. The adverseeffects on coronary heart disease aremediated by increases in plasma con-centrations of low-density lipoproteincholesterol and lipoprotein A, and re-ductions in high-density lipoproteincholesterol, promotion of inflamma-tion, and endothelial dysfunction.22
Many Indian snacks have been foundto be high in TFA ($2% of total fattyacids).23,24 The Government of Indiarecently took steps to limit the amo-unt of TFA in foods by publishing aregulation setting an upper limit of10% TFA in partially hydrogenatedvegetables oils (PHVOs). This regu-lation was subsequently revised to a5% limit that will come into effect inAugust, 2016, in addition to requiringthat TFA be labeled on packagedfoods.25,26 However, it is unclear towhat extent this regulation will be en-forced and what substitutions vendorswill make to keep consumers satisfiedand maintain product demand despitethe changes.
There is currently limited informa-tion about the food retail environ-ments of low-socioeconomic groupsin LMICs, particularly those living inrural areas and urban slums. Creatinghealthy public policies and supportivefood environments can facilitate accessto safe, affordable, nutritious food.27 Toidentify which policies might be themost effective in specific settings, it isimportant to gain a thorough under-standing of the existing food environ-ment. Thus, a project was designedthat aimed to examine awareness ofand use of TFAs and the feasibility oftheir removal from the Indian foodsupply chain by integrating perspec-tives from 3 levels: manufacturers, re-tailers, and consumers. The currentstudy, which is part of the larger proj-ect, describes the retail food environ-ment with a focus on unbrandedpackaged products and street foods inrural and urban low-SES settings of 2states in North India. The objectivesof this study were to (1) describe thefood environment in selected low-SESrural and urban settings in North Indiawith reference to commercially avail-able, unbranded, packaged, ready-to-
eat snacks and street foods sold byvendors; and (2) analyze the type andquantity of fat in these foods to under-stand the exposure to the population.
METHODS
This study analyzed the retail foodenvironment in terms of the snacksand street foods available and sampledfrom the vendors in the low-SES set-tings in North India. The researchersdetermined the snack sampling strat-egy using data obtained from theconsumer-level study. This included asurvey of the dietary intake patternswith an emphasis on snacking patternsconducted in low-SES HHs (260 HH ineach community). The HH surveysincluded a dietary intake questionnaireas well as 2 24-hour dietary recalls,which were conducted on 2 consecu-tive days. The dietary questionnaire,in addition to the 24-hour recalls, pro-vided information regarding consump-tion of commercially prepared snacks,which was then subsequently used todetermine the snack sampling strategy.Only unbranded (unlabeled, open, orfreshly prepared) snacks from all ven-dorswilling to participate were sampled(details are provided subsequently).Therefore, snacks sampled from thevendors were those consumed (if repo-rted in the24-hour recall) byparticipantsin the HH survey. The authors ob-tained ethics approval for the studyfrom the Public Health Foundation ofIndia's Institutional Ethics Committees.
Setting
The researchers examined the food en-vironments of 3 purposively selectedsettings, which included 2 rural vil-lages (Sundh andHasanpur) in theMe-wat district of Haryana and an urbanslum (Chanderpuri) in the northeastdistrict of Delhi. These communitieswere selected specifically to examinesnacking patterns (through the HHsurvey) in low-SES settings in 2 adja-cent states that typically consumevanaspati (PHVO high in TFA) andunbranded snacks made using PHVOs.Before beginning the study, the au-thors obtained permission to conductthe study from the local leader (acommunity representative such asthe Councilor, Pradhan, or Sarpanch)of the study areas. The populations of
270 Gupta et al Journal of Nutrition Education and Behavior � Volume 48, Number 4, 2016

the villages were 5,000 and 6,000 peo-ple, which corresponded to 525 and800 HHs, respectively. The populationof the urban slum was approximately10,812, which represented 1,802 HHs.Data collection took place betweenOctober and November, 2012 in thevillages and February to March, 2013in the urban slum.
Study Design
The researchers conducted a cross-sectional exploratory study that incl-uded surveying local food vendorsand performing laboratory analysesof the fat content of snack and streetfoods sampled from the study com-munities. Street foods were definedas ready-to-eat foods and beveragesprepared and/or sold by vendors and
hawkers, especially in streets andother similar public places, and snackfoods were defined as foods eaten be-tween meals.20 Street and snack foodsincluded both branded and unbrandedsnacks; however, the focus of thisstudy was on unbranded snacks thatwere unlabeled, as well as open orfreshly prepared street foods. Brandedpackaged snacks were defined as thosemanufactured by multinational com-panies, containing a label and brandname available in commercially avail-able standard packages. Labels ofthese products included informationabout the net weight, nutritionalcomposition, ingredients, brand name,standard packages, manufacturing,and expiration date. Unbranded pack-aged snacks were defined as those thatwere produced by local and district-level manufacturers but that were
available in unlabeled transparent pack-ages. Information about weight, brand,andmanufacturing datewas sometimesavailable but no nutritional composi-tion was mentioned on the package.Open snacks included those that werenot packaged and were available injars or tins (eg, soan papdi, mathri).Freshly prepared snacks (eg, samosas,kachodi [deep-fried, salted, puffed breadmade of wheat flour]) were thosecooked at the time of purchase.
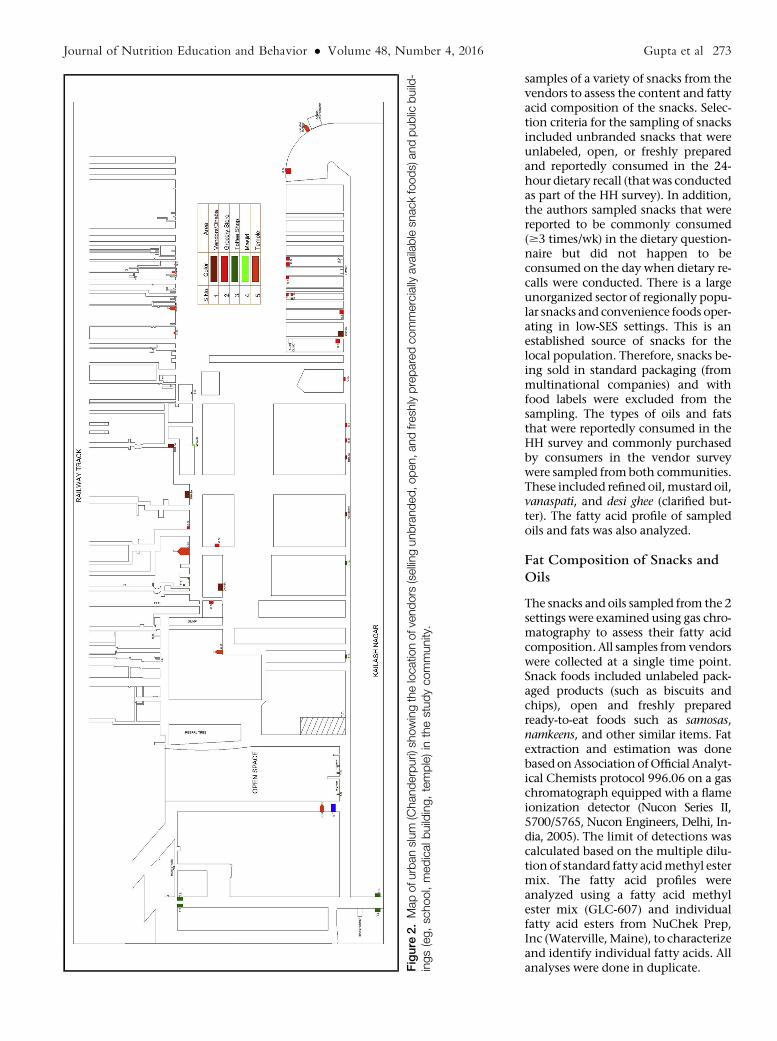
Before inviting vendors to partici-pate in the study, the authors mappedthe food environments (with a focuson snack foods) in the villages andthe urban slum by documenting thenumber and location of all HHs, ven-dors, and public buildings (includingschools, temples, etc) in each commu-nity to facilitate the survey (Figures 1and 2). These maps were then used
Figure 1. (A) Map of village (Sundh) showing the location of vendors (selling unbranded, open, and freshly prepared commerciallyavailable snack foods) and public buildings (eg, school, medical building) in the study community. (B) Map of village (Hasanpur)showing the location of vendors (selling unbranded, open, and freshly prepared commercially available snack foods) and publicbuildings (eg, school, medical building) in the study community.
Journal of Nutrition Education and Behavior � Volume 48, Number 4, 2016 Gupta et al 271

to describe the food environment interms of the location of vendors withrespect to the HHs, who sold un-branded, open, and freshly preparedcommercially available snack foodsin these survey communities.
All food vendors working in eachof the communities were invited toparticipate in the study. All partici-pating vendors provided informedconsent and all surveys were conduct-ed in Hindi. Responses were subse-quently translated into English.
Vendor Surveys
The research staff contacted the ven-dors at their shops subsequent to map-ping the survey areas. The vendorsurvey instrument was a 17-question
structured survey administered in per-son by the trained research staff; sur-veys were completed at the shops ofparticipating vendors. The majority ofthe questions were open-ended (16of 17), which allowed vendors to pro-vide specific answers to each question.The survey questionnaire was review-ed by experts in the field (nutrition,public health, and biochemistry)before data collection; however, itwas not validated. Vendor practiceswere explored by collecting informa-tion on the types of snack foods theysold, how they prepared them, andtheir use of cooking oils. Vendorswere also asked about the oils theyuse (if they prepared snacks them-selves), why they used them, wherethey purchased the oils, the quantityand cost of the oil, the length of time
they used the oil and how they dis-carded it, and questions related topreferences about the oil. Moreover,vendors were asked about their aware-ness of TFAs and their views aboutthe overall healthiness of oils. Toassess awareness about TFAs, the re-searchers asked vendors if they hadheard of TFAs. If they responded yes,the researchers asked them what thehealth implications were (both posi-tive and negative) of TFA consump-tion. The average survey durationwas 20–30 minutes.
Sampling Strategy of Snacks andOils
In addition to administering vendorsurveys, the researchers obtained
Figure 1. Continued
272 Gupta et al Journal of Nutrition Education and Behavior � Volume 48, Number 4, 2016
samples of a variety of snacks from thevendors to assess the content and fattyacid composition of the snacks. Selec-tion criteria for the sampling of snacksincluded unbranded snacks that wereunlabeled, open, or freshly preparedand reportedly consumed in the 24-hour dietary recall (that was conductedas part of the HH survey). In addition,the authors sampled snacks that werereported to be commonly consumed($3 times/wk) in the dietary question-naire but did not happen to beconsumed on the day when dietary re-calls were conducted. There is a largeunorganized sector of regionally popu-lar snacks and convenience foods oper-ating in low-SES settings. This is anestablished source of snacks for thelocal population. Therefore, snacks be-ing sold in standard packaging (frommultinational companies) and withfood labels were excluded from thesampling. The types of oils and fatsthat were reportedly consumed in theHH survey and commonly purchasedby consumers in the vendor surveywere sampled fromboth communities.These included refined oil,mustard oil,vanaspati, and desi ghee (clarified but-ter). The fatty acid profile of sampledoils and fats was also analyzed.
Fat Composition of Snacks andOils
The snacks and oils sampled from the 2settings were examined using gas chro-matography to assess their fatty acidcomposition. All samples fromvendorswere collected at a single time point.Snack foods included unlabeled pack-aged products (such as biscuits andchips), open and freshly preparedready-to-eat foods such as samosas,namkeens, and other similar items. Fatextraction and estimation was donebased onAssociationofOfficial Analyt-ical Chemists protocol 996.06 on a gaschromatograph equipped with a flameionization detector (Nucon Series II,5700/5765, Nucon Engineers, Delhi, In-dia, 2005). The limit of detections wascalculated based on the multiple dilu-tion of standard fatty acidmethyl estermix. The fatty acid profiles wereanalyzed using a fatty acid methylester mix (GLC-607) and individualfatty acid esters from NuChek Prep,Inc (Waterville, Maine), to characterizeand identify individual fatty acids. Allanalyses were done in duplicate.F
igure
2.Mapofu
rbanslum
(Chanderpuri)sh
owingthelocatio
nofvendors
(sellingunbranded,open,andfresh
lypreparedcommercially
availablesn
ackfoods)andpublic
build-
ings(eg,school,medicalbuilding,temple)in
thestudycommunity.
Journal of Nutrition Education and Behavior � Volume 48, Number 4, 2016 Gupta et al 273

Analysis
Responses to the open-ended vendorsurvey questions were summarized bykey themes such as type of snacks sold,vendor practices, and health aware-ness among vendors. All descriptivestatistics for the vendor survey wereconducted using Microsoft Excel(version 12.1, Washington, DC,2008). AIMIL software (New Delhi, In-dia) was used to edit the chromato-gram (the graph of detector responseagainst the retention time of the indi-vidual fatty acids). The chromatogramprovides the range of peaks represent-ing the specific fatty acids present inthe sample. Editing is analogous todata cleaning and involves integratingthe peaks eluted. Once this iscompleted, the individual peak areasrepresent the percentage contributedto the sample by individual fatty acids.Thus, the saturated, monounsatu-rated, polyunsaturated, and TFA con-tent of the fats extracted from thesampled snacks was calculated. Thecontent of each fatty acid in the sam-ple was expressed as a percentage ofthe total fatty acids in that sample.
RESULTSCharacteristics of Vendors
Of the 40 vendors in the villages andthe 29 vendors in the slum, 27 (68%participation rate) and 17 (59% partic-ipation rate) agreed to participate,respectively. The 2 rural adjacent vil-lages that were examined had a busstop between themwhere the vendorsof both villages procured the snacksfor their shops; however, 7 villagevendors (26%) prepared at least someof the items themselves. Six of thevendors (35%) in the urban slum pre-pared some of their own snacks; theremaining snacks were procured fromthird-party wholesalers who came tothe slum to sell directly to the ven-dors, and from wholesale distribu-tors and grocery shops. However,snacks sampled from vendors for testingincluded those purchased from third-party vendors or prepared fresh aslong as they were also unbranded.
Types of Snacks Sold byVendors
Vendors sold both branded and un-branded packaged snacks as well as
open and freshly prepared streetfoods. The total number of snacksavailable was 33 and 52 in the ruralarea and the urban slum, respec-tively. Thirty-six percent of snackswere branded packaged snacks inthe rural setting compared with 33%in the urban setting. The remainingsnacks (64% rural and 67% urban)were unbranded. In addition to un-branded snacks, confectionery andfreshly prepared snacks (8 in the ruralarea and 13 in the urban slum) wereavailable.
Vendor Practices
A variety of oils including soybean andother unspecified refined oils, vanas-pati, and local oil brands were used bythe rural and urban vendors. Vendorsin both settings reported preparingsnacks using refined oil to fry snackssuch as samosa, kachodi, bhatura, breadpakoda, and golgappe. Vanaspati wasused as shortening in these snacks by2 (out of 7) and 3 (out of 6) of vendorsin rural and urban settings, respec-tively. Most of the urban vendors (4of 6) bought the oils from a localmarket whereas the rural vendors (5in 7) bought them from the nearbytown. Vendors indicated that theychose these oils based on the quality,including organoleptic properties (4of 7 in rural areas; 2 of 6 in the urbanarea), taste (1 of 7 in the rural settings;5 of 6 in the urban setting), traditionaluse (1 of 7 in the rural areas), cost (1 of6 in the urban slum), and customerpreferences (1 of 7 in the rural set-tings). Most urban vendors (n ¼ 5 of6) indicated that theywould bewillingto change the type of oil used providedthe taste (n ¼ 1), cost (n ¼ 3), andcustomer acceptability (n ¼ 1) wereadequate; rural vendors (n ¼ 3 of 7)weremore resistant to change.Howev-er, some vendors (n ¼ 2 of 7) statedthat they would change if the qualitywere maintained.
Health Awareness AmongVendors
Awareness regarding TFAs was lowamong vendors. Only 1 of the villagevendors and 2 of the urban slum ven-dors stated that they were aware ofTFAs and described them as being badfor health. Overall, village vendors
(n ¼ 5) indicated that they either didnot know which oils could be consid-ered better or worse for health or thatmustard oil was healthy (n ¼ 8). Themajority (n ¼ 10) of urban vendorsindicated that refined oils (includingsoybean, mustard, and safflower) werehealthy.
Fat Content of Street and SnackFoods
The researchers sampled and an-alyzed 17 snack samples from the vil-lages and 32 from the slums. Tables 1and 2 provide the fat and fatty acidprofiles of the unbranded, open, andfreshly prepared snacks from boththe rural and urban settings. The fatcontent of snacks in their usual serv-ings ranged from 0.1 to 32 g in vil-lages and 0.6 to 26 g in the urbanslum. The mean fat content in snacksin villages was 28.8 g per 100-gserving (SD, 17.8 g) and in the urbanslum it was 29.6 g per 100-g serving(SD, 12.6 g). The fat content (per100 g) was highest in the open snackmixture (salted tidbits of wheat andlentils: 64.8 g per 100 g) and freshlyprepared kachodi (46.6 g per 100-gserving) in rural and urban settings,respectively. The overall average ser-ving size of all snacks combined waslarger in the urban slum comparedwith the rural setting (41 vs 25 g,respectively); however, there was agreater variety of snacks in the urbanslum. Fat (per 100 g) and TFA levelswere higher in the open and freshlyprepared snacks than in the un-branded packaged snacks.
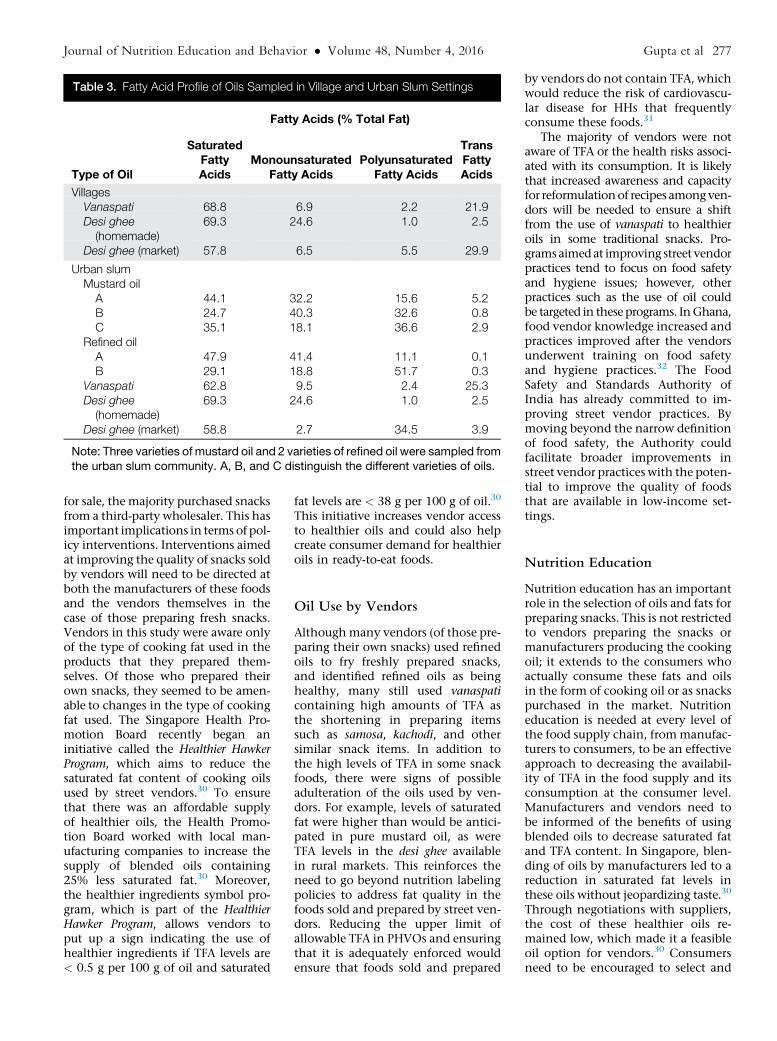
Three and 7 oils and fats weresampled from rural and urban set-tings, respectively. Table 3 providesthe fatty acid profile of the differentoils sampled from both vendors andHHs. The fat content of sampled oils,expressed as a percentage of total fattyacids, contained high levels of satu-rated fat (ranging from 24.7% to69.3%) and TFA (ranging from 0.1%to 29.9%). The TFA levels exceeded20% of total fatty acids in both thevanaspati samples and the sample ofdesi ghee from the village market.
DISCUSSION
Understanding the broad food envi-ronment is crucial in terms of informing
274 Gupta et al Journal of Nutrition Education and Behavior � Volume 48, Number 4, 2016

the development of policy interven-tions aimed at improving the qualityof the food supply. As the food envi-ronments of LMICs such as Indiaevolve, policy interventions will needto be context-specific to improve dietquality and reduce the risk of diet-related disease most effectively. Theauthors found that both rural villagesand an urban slum setting in Indiahad a large number of vendors sellingenergy-dense snacks high in fat (incl-uding saturated fat and TFA).
Nutrition Labels
The lack of nutrition labels on snackfoods in this study is problematicand was previously noted in a studyconducted in the Indian state of Ker-ala.24 The majority of confectioneryproducts in that study contained TFA
and/or high levels of saturated fat,mainly palmitic acid (from palmoil).24 In the current study, high levelsof TFA were found in open snacks thatdo not contain labels. These highlevels of unhealthy fat are consistentwith the levels found in a recent studyconducted in Uttar Pradesh, India.28
Although India recently published aregulation requiring TFA labeling inpackaged foods, it is likely that theregulation will not apply to snackfoods that are sold open or freshly pre-pared, which contain the highestlevels of TFA in the Indian food envi-ronment.25,26 Moreover, packaged unbr-anded snacks produced by the informalsector will likely evade regulation aswell. Because many foods do not con-tain labels, consumers will be unableto identify the contents of foods theyare consuming. Labeling regulation
currently does not reach the largeinformal food processing and retailsectors in the country and new ap-proaches are needed to target thesefoods, which reinforces the need totarget more upstream steps in thefood supply chain. Moreover, the useof nutrition labels is limited in Indiaand knowledge about how to usethem is low.29 In addition to inter-vening at the manufacturing level,alternative approaches to increase con-sumer demand for improved transpar-ency and healthier snack food optionsare needed, which would in turn facil-itate greater emphasis on these as-pects by vendors and manufacturers.
Food Sold by Vendors
Although a small number of vendors inthis study prepared their own snacks
Table 1. Total and Trans Fat Content of Snacks Sampled From Village Settings
Snack Name and DescriptionWeight ofSnack, ga
TotalFat, g
Fat per100-g
Serving, g
SaturatedFattyAcidsb
MonounsaturatedFatty Acidsb
PolyunsaturatedFatty Acidsb
TransFattyAcidsb
Packaged unlabeled snacksBhindi (wheat puffs) 4.00 0.32 8.00 61.27 19.11 18.45 0.53Sweet biscuits (1 biscuit) 5.40 0.76 14.07 53.72 33.28 11.43 0.00Salted biscuits (1 biscuit)c 4.50 1.56 34.67Rusk (dry biscuit,twice-baked bread)
8.00 1.68 21.00 44.42 13.70 40.77 0.29
Pao (bread buns) 2.00 0.08 4.00 34.13 18.96 41.53 1.15Fan (wafer-shaped, flaky,salted pastry puffs)
28.78 6.91 24.01 87.00 2.17 0.51 10.25
Open snacksMixture (salted tidbitsin a pack-mixof wheat and lentils)
10.00 6.48 64.80 42.79 36.71 12.22 0.39
Mathri (fried, salted thickwheat crackers)
11.00 6.29 57.18 18.19 22.79 57.76 1.26
Moong dal (savory lentils) 21.00 3.74 17.81 59.39 19.41 18.15 0.60Soan papdi (a flaky sweetmade of graham flour)
20.00 7.80 39.00 62.94 12.05 15.03 9.86
Freshly prepared snacksSamosaa (potato-stuffed,deep-fried, salted,refined-wheat flour pockets)
79.25 23.46 29.62 60.21 14.25 13.27 10.35
Kachori (deep-fried, salted,puffed bread made ofwheat flour)
55.70 17.82 31.99 45.73 1.84 31.49 11.67
Bread pakora (deep-fried grahamflour–coated bread triangles)
67.50 32.13 47.60 25.95 23.24 41.36 0.37
Bhatura (deep-fried, leavened,puffed bread made of refinedwheat flour)
33.00 3.30 10.00 47.01 37.40 9.09 0.00
aThe weight reflects the serving size in which the snack was sold in the village markets, with the exception of biscuits, whichrefers to the weight of 1 biscuit; bExpressed as a percentage of total fatty acids; cFatty acid profile not available.
Journal of Nutrition Education and Behavior � Volume 48, Number 4, 2016 Gupta et al 275

Table 2. Total and Trans Fat Content of Snacks Sampled From Urban Slum
Snack Name and DescriptionWeight ofSnack, ga
TotalFat, g
Fat per100-g
Serving, g
SaturatedFattyAcidsb
MonounsaturatedFatty Acidsb
PolyunsaturatedFatty Acidsb
TransFattyAcidsb
Packaged unlabeled snacksChakri (deep-fried spiral wheat crackers) 21.42 7.88 36.79 63.94 16.79 18.73 0.97Kachri (rice puffs) 9.06 3.22 35.54 48.48 38.90 10.61 0.33Fun Pop (rice puffs, chips) 3.89 0.61 15.68 54.02 27.01 18.46 0.42Jo’s Onion Rings (chips) 14.65 6.62 45.19 57.22 26.82 14.91 0.45Bun (2 pieces) 78.20 3.28 4.19 39.22 5.35 49.94 4.56Rusk (dry biscuit, twice-baked bread) 23.94 3.16 13.20 44.32 22.76 40.76 0.53
Open snacksMathri (fried, salted thick wheat crackers) 21.35 8.22 38.50 87.34 5.05 2.62 4.43Biscuits, unpackaged (4 biscuits) 20.26 8.27 40.82 88.45 9.00 0.08 0.35Bhujia (fried, salted snack made of graham flour and shredded) 31.96 12.66 39.61 59.62 22.71 16.43 0.46Moong dal (savory lentils) 18.29 5.01 27.39 33.28 8.94 55.27 1.26Besan ladoo (a ball-shaped sweet made of fried graham flour) 33.33 7.93 23.79 62.45 29.17 7.42 0.37Besan barfi (sweet graham flour squares) 49.10 10.51 21.41 68.37 5.40 0.50 22.96Maida barfi (sweet flour and condensed milk triangles) 44.52 2.58 5.80 50.77 26.38 20.19 0.00Soan papdi (a flaky sweet made of graham flour) 49.01 9.90 20.20 49.81 38.54 11.14 0.29Besan papdic (a flaky sweet made with graham flour) (1 piece) 32.80 16.53 50.40Besan papdic (a flaky sweet made of graham flour with ground nuts)(1 piece)
30.13 17.47 57.98
Confectionery snacksCream roll 58.00 18.44 31.79 86.79 2.10 0.60 2.88Pastry 32.53 6.90 21.21 67.50 16.89 14.76 0.26Patty 89.34 26.09 29.20 69.62 6.86 11.21 10.25Fan (wafer-shaped, flaky, salted pastry puffs) 23.67 7.77 32.83 90.74 2.66 0.54 4.98Muffin 21.87 8.40 38.41 61.70 27.83 9.13 0.37
Freshly prepared snacksBhatura (deep-fried, leavened, puffed bread made of refined wheatflour)
52.04 10.20 19.60 58.81 28.55 11.42 0.44
Kachodi (deep-fried, salted, puffed bread made of wheat flour) 53.83 25.09 46.61 85.40 1.81 0.31 11.77Bread pakora (deep-fried graham flour–coated bread triangles) 90.10 23.79 26.40 64.07 19.93 14.59 1.06Namakpara (fried, salted wheat flour cubes) 64.12 22.44 35.00 84.49 1.71 0.42 12.81Samosa (potato-stuffed, deep-fried, salted, refined-wheat flourpockets)
46.66 13.62 29.19 49.16 41.56 8.99 0.29
Pakoras (deep-fried, graham flour–coated bread triangles) 54.16 16.57 30.59 46.95 40.07 11.61 0.34Aloo tikki (deep- or shallow-fried patty made of potato) 45.24 12.40 27.41 60.39 33.77 4.98 0.38Boondi ladoo (a ball-shaped sweet made of fried graham flourgranules dipped in sugar syrup)
87.84 12.82 14.59 55.68 22.61 20.81 0.44
aThe weight reflects the serving size in which the snack was sold in the urban slummarkets; bExpressed as a percentage of total fatty acids; cFatty acid profile not available.
276Gupta
etal
JournalofNutritio
nEducatio
nandBehavior�
Volume48,
Number
4,2016
for sale, the majority purchased snacksfrom a third-party wholesaler. This hasimportant implications in terms of pol-icy interventions. Interventions aimedat improving the quality of snacks soldby vendors will need to be directed atboth the manufacturers of these foodsand the vendors themselves in thecase of those preparing fresh snacks.Vendors in this study were aware onlyof the type of cooking fat used in theproducts that they prepared them-selves. Of those who prepared theirown snacks, they seemed to be amen-able to changes in the type of cookingfat used. The Singapore Health Pro-motion Board recently began aninitiative called the Healthier HawkerProgram, which aims to reduce thesaturated fat content of cooking oilsused by street vendors.30 To ensurethat there was an affordable supplyof healthier oils, the Health Promo-tion Board worked with local man-ufacturing companies to increase thesupply of blended oils containing25% less saturated fat.30 Moreover,the healthier ingredients symbol pro-gram, which is part of the HealthierHawker Program, allows vendors toput up a sign indicating the use ofhealthier ingredients if TFA levels are< 0.5 g per 100 g of oil and saturated
fat levels are < 38 g per 100 g of oil.30
This initiative increases vendor accessto healthier oils and could also helpcreate consumer demand for healthieroils in ready-to-eat foods.
Oil Use by Vendors
Althoughmany vendors (of those pre-paring their own snacks) used refinedoils to fry freshly prepared snacks,and identified refined oils as beinghealthy, many still used vanaspaticontaining high amounts of TFA asthe shortening in preparing itemssuch as samosa, kachodi, and othersimilar snack items. In addition tothe high levels of TFA in some snackfoods, there were signs of possibleadulteration of the oils used by ven-dors. For example, levels of saturatedfat were higher than would be antici-pated in pure mustard oil, as wereTFA levels in the desi ghee availablein rural markets. This reinforces theneed to go beyond nutrition labelingpolicies to address fat quality in thefoods sold and prepared by street ven-dors. Reducing the upper limit ofallowable TFA in PHVOs and ensuringthat it is adequately enforced wouldensure that foods sold and prepared
by vendors do not contain TFA, whichwould reduce the risk of cardiovascu-lar disease for HHs that frequentlyconsume these foods.31
The majority of vendors were notaware of TFA or the health risks associ-ated with its consumption. It is likelythat increased awareness and capacityfor reformulationof recipes amongven-dors will be needed to ensure a shiftfrom the use of vanaspati to healthieroils in some traditional snacks. Pro-gramsaimedat improving street vendorpractices tend to focus on food safetyand hygiene issues; however, otherpractices such as the use of oil couldbe targeted in these programs. InGhana,food vendor knowledge increased andpractices improved after the vendorsunderwent training on food safetyand hygiene practices.32 The FoodSafety and Standards Authority ofIndia has already committed to im-proving street vendor practices. Bymoving beyond the narrow definitionof food safety, the Authority couldfacilitate broader improvements instreet vendor practices with the poten-tial to improve the quality of foodsthat are available in low-income set-tings.
Nutrition Education
Nutrition education has an importantrole in the selection of oils and fats forpreparing snacks. This is not restrictedto vendors preparing the snacks ormanufacturers producing the cookingoil; it extends to the consumers whoactually consume these fats and oilsin the form of cooking oil or as snackspurchased in the market. Nutritioneducation is needed at every level ofthe food supply chain, frommanufac-turers to consumers, to be an effectiveapproach to decreasing the availabil-ity of TFA in the food supply and itsconsumption at the consumer level.Manufacturers and vendors need tobe informed of the benefits of usingblended oils to decrease saturated fatand TFA content. In Singapore, blen-ding of oils by manufacturers led to areduction in saturated fat levels inthese oils without jeopardizing taste.30
Through negotiations with suppliers,the cost of these healthier oils re-mained low, which made it a feasibleoil option for vendors.30 Consumersneed to be encouraged to select and
Table 3. Fatty Acid Profile of Oils Sampled in Village and Urban Slum Settings
Type of Oil
Fatty Acids (% Total Fat)
SaturatedFattyAcids
MonounsaturatedFatty Acids
PolyunsaturatedFatty Acids
TransFattyAcids
VillagesVanaspati 68.8 6.9 2.2 21.9Desi ghee(homemade)
69.3 24.6 1.0 2.5
Desi ghee (market) 57.8 6.5 5.5 29.9
Urban slumMustard oilA 44.1 32.2 15.6 5.2B 24.7 40.3 32.6 0.8C 35.1 18.1 36.6 2.9
Refined oilA 47.9 41.4 11.1 0.1B 29.1 18.8 51.7 0.3
Vanaspati 62.8 9.5 2.4 25.3Desi ghee(homemade)
69.3 24.6 1.0 2.5
Desi ghee (market) 58.8 2.7 34.5 3.9
Note: Three varieties of mustard oil and 2 varieties of refined oil were sampled fromthe urban slum community. A, B, and C distinguish the different varieties of oils.
Journal of Nutrition Education and Behavior � Volume 48, Number 4, 2016 Gupta et al 277

use healthier oil for cooking and deep-frying purposes. At the same time,alternate ways of cooking traditionalsnacks, such as baking rather thanfrying, should be encouraged.
A limitation of this study was therelatively small sample size. Thus, find-ings of the current study cannot begeneralized to broader food environ-ments across India. Only 60% of ven-dors participated in the current studyand few vendors among these actuallyprepared fresh snacks compared withvendors who sold ready-to-eat snacksprocured from third-party wholesalers.Therefore, the authorsobserved limitedknowledge among the vendors aboutthe type of oils used to prepare theproducts. The survey instrument hadnot been previously validated. Finally,the authors did not investigate differ-ences between thevendorswhopartic-ipated in the survey and thosewho didnot, which could have influenced thestudy findings. However, the authorsdidnot observeobviousdifferences be-tween the 2 groups.
IMPLICATIONS FORRESEARCH ANDPRACTICE
The food environments in low-SEScommunities in India are saturatedwith energy-dense street and snackfoods containing high amounts ofTFA and saturated fat. Because it is un-likely that consumers will stop pur-chasing these snacks in the shortterm, it is vital to improve the qualityand transparency of the contents ofsnack foods that are available. Inter-ventions aimed at targeting the man-ufacturers of oils and fats used infreshly prepared products, wholesaleproducers of unbranded snacks, andvendors preparing their own snackshave the potential to improve thequality of foods available in the foodenvironment of low-SES groups in ru-ral and urban areas in India. However,this will require research and thedevelopment of products that arecost-effective for manufacturers andvendors and also have a healthierfatty acid profile.
Incentives upstream in the foodsupply chain are needed to ensureadequate and cost-effective technol-ogy transfer to manufacturers for the
production of healthier alternatives tooils high in unhealthy fats. Both gov-ernment and nongovernmental orga-nizations in India should consideradopting programs such as the Health-ier Hawker Program (Singapore) thattry to encourage vendors to swap tohealthier oils. This will need to becoupled with initiatives aimed atimproving both vendor and consumerawareness related to TFA. One way toaccomplish this could be to imple-ment a social marketing campaignthat provides information about theuse of healthier fats and oils for cook-ing traditional Indian snack recipes.Moreover, information about theimportance of consuming healthierfats and oils should be included inthe Indian Dietary Guidelines,33
which currently focus primarily oncombating undernutrition. The guide-lines should emphasize the use ofindigenous vegetable oils high in poly-unsaturated fat rather than those highin saturated fat and TFA. Withoutimproved awareness, it is unlikelythat consumers will demand healthiersnacks. Because there may be a prefer-ence for lower-cost oils that are oftenhigh in saturated fat and/or TFA,34
blended oils with different fatty acidprofiles could be used to producehealthier oil available at a competitiveprice. The technology exists to make aproduct that is TFA-free with moderateamounts of saturated fat35,36 and it iscurrently being used in Europe andNorth America, but ways are neededto make it a cost-effective solution inIndia and other low- and middle-income settings.
ACKNOWLEDGMENTS
This work was supported by a Well-come Trust Capacity StrengtheningStrategic Award to the Public HealthFoundation of India and a consortiumofUKuniversities. SMDwas supportedby a Doctoral Award from the Cana-dian Institutes of Health Researchand an International PostgraduateResearch Scholarship from theUniver-sity of Sydney. The funders played norole in the design, analysis, or writingof this article. The authors acknowl-edge the contributions made by studyparticipants.
REFERENCES
1. Glanz K, Sallis JF, Saelens BE,Frank LD. Healthy nutrition environ-ments: concepts and measures. Am JHealth Promot. 2005;19:330-333.
2. Hawkes C, Jewell J, Allen K. A foodpolicy package for healthy diets andthe prevention of obesity and diet-related non-communicable diseases: theNOURISHING framework. ObesityRev. 2013;14:159-168.
3. Gittelsohn J, Franceschini MCT,Rasooly IR, et al. Understanding thefood environment in a low-income ur-ban setting: implications for food storeinterventions. J Hunger Environ Nutr.2008;2:33-50.
4. Darmon N, Drewnowski A. Does so-cial class predict diet quality? Am JClin Nutr. 2008;87:1107-1117.
5. Drewnowski A. Obesity and the foodenvironment: dietary energy densityand diet costs. Am J Prev Med. 2004;27:154-162.
6. Cummins S, Macintyre S. Food envi-ronments and obesity—neighbourhoodor nation? Int J Epidemiol. 2006;35:100-104.
7. Swinburn BA, Sacks G, Hall KD, et al.The global obesity pandemic: shapedby global drivers and local environ-ments. Lancet. 2011;378:804-814.
8. Popkin BM. An overview on the nutri-tion transition and its health implica-tions: the Bellagio meeting. PublicHealth Nutr. 2002;5:93-103.
9. Popkin BM. The nutrition transition inlow- income countries: an emergingcrisis. Nutr Rev. 1994;52:285-298.
10. Popkin BM, Gordon-Larsen P. Thenutrition transition: worldwide obesitydynamics and their determinants. Int JObes Relat Metab Disord. 2004;28(suppl3):S2-S9.
11. Hawkes C, ed. Trade, Food, Diet, andHealth: Perspectives and Policy Options.Chichester, UL: Blackwell; 2010.
12. Black RE, Vitoria CG, Walker SP,et al. Maternal and child undernutritionand overweight in low-income andmiddle-income countries. Lancet. 2013;382:427-451.
13. Garrett J, Ruel MT. The coexistence ofchild undernutrition and maternaloverweight: prevalence, hypotheses,and programme and policy implica-tions. Matern Child Nutr. 2005;1:185-196.
14. Caballero B. A nutrition paradox—un-derweight and obesity in developing
278 Gupta et al Journal of Nutrition Education and Behavior � Volume 48, Number 4, 2016

countries. N Engl J Med. 2005;352:1514-1516.
15. Food and Agriculture Organization.Selling street and snack foods. Food andAgriculture Organization of the UnitedNations, Rome. 2011. http://www.fao.org/docrep/015/i2474e/i2474e00.pdf. Ac-cessed May 6, 2014.
16. Food and Agriculture Organization.Food for the Cities: Street foods. 1997.http://www.fao.org/docrep/W4128T/W4128T00.HTM. Accessed May 6,2014.
17. Bowen L, Ebrahim S, De Stavola B,et al. Dietary intake and rural-urbanmigration in India: a cross-sectionalstudy. PLoS One. 2011;6:e14822.
18. Varadharajan KS, Thomas T,Kurpad AV. Poverty and the state ofnutrition in India. Asia Pac J ClinNutr. 2013;22:326-339.
19. Ravishankar A. Is India shouldering adouble burden of malnutrition? J HealthManag. 2012;14:313-328.
20. Ghosh S, Shah D. Nutritional problemsin urban slum children. Indian Paediatr.2004;41:682-696.
21. Misra A, Sharma R, Pandey RM,Khanna N. Adverse profile of dietarynutrients, anthropometry and lipids inurban slum dwellers of northern India.Eur J Clin Nutr. 2001;55:727-734.
22. Uauy R, Aro A, Clarke R, et al. WHOScientific Update on trans fatty acids:summary and conclusions. Eur J ClinNutr. 2009;63(suppl):S68-S75.
23. Agarwal A, Gupta R, Varma K,Mathur B. High trans fatty acid content
in common Indian fast foods.Nutr FoodSci. 2008;38:564-569.
24. Reshma MV, Kiran RC, Nisha P, et al.Trans fat content in labelled and unla-belled Indian bakery products includingfried snacks. Int Food Res J. 2012;19:1609-1614.
25. Food Safety and Standards Authority ofIndia. Notification F.No.P.15014/1/2011-PFA/FSSAI. Government ofIndia: New Delhi, India; 2013.
26. Food Safety and Standards Authority ofIndia. Food Safety and Standards Au-thority of India Notification. Ministryof Health and FamilyWelfare, Govern-ment of India: New Delhi, India; 2014.
27. Wegener J, Raine K, Hanning RM. In-sights into the government’s role infood system policy making: improvingaccess to healthy, local food alongsideother priorities. Int J Environ Res PublicHealth. 2012;9:4103-4121.
28. Dixit S, Das M. Fatty acid compositionincluding trans fatty acids in edible oilsand fats: probable intake in Indian pop-ulation. J Food Sci. 2012;77:T188-T199.
29. Vemula SR, Gavaravarapu SM,Mendu VV, Mathur P, Avula L. Useof food label information by urban con-sumers in India—a study among super-market shoppers. Public Health Nutr.2014;17:2104-2114.
30. Hawkes C, Thow AM, Downs SM,et al. Identifying effective food systemssolutions for nutrition and non-communicable diseases: creating policycoherence in the fats supply chain.SCN News. 2014;40:39-47.
31. Downs SM, Thow AM, Ghosh-Jerath S, McNab J, Reddy KS,Leeder SR. From Denmark to Delhi:the multisectoral challenge of regu-lating trans fats in India. Public HealthNutr. 2013;16:2273-2280.
32. Donkor ES, Kayang BB, Quaye J,Akyeh ML. Application of the WHOkeys of safer food to improve handlingpractices of food vendors in a poorresource community in Ghana. Int JEnviron Res Public Health. 2009;6:2833-2842.
33. ICMR. Indian Council of MedicalResearch: Dietary Guidelines for Indians -AManual. 2nd ed.NewDelhi:NationalInstitute ofNutrition; IndianCouncil ofMedical Research; 2010.
34. Downs SM, Gupta V, Ghosh-Jerath S,Lock K, Thow AM, Singh A. Refor-mulating partially hydrogenated vege-table oils to maximise health gains inIndia: is it feasible and will it meet con-sumer demand? BMC Public Health.2013;13:1-9.
35. Culliney K. Bunge: Consumer con-cerns on hydrogenation prompted R& D. Food Navigator; 2013. http://www.bakeryandsnacks.com/Ingredients/Bunge-Consumer-concerns-on-hydrogenation-prompted-R-D. Accessed Nov-ember 15, 2015.
36. Heller L. Cargill expands high oleiccanola line. Food Navigator; 2007.http://www.foodnavigator-usa.com/Suppliers2/Cargill-expands-high-oleic-canola-line. Accessed November 15,2015.
Journal of Nutrition Education and Behavior � Volume 48, Number 4, 2016 Gupta et al 279

CONFLICT OF INTEREST
The authors have not stated any con-flicts of interest.
279.e1 Gupta et al Journal of Nutrition Education and Behavior � Volume 48, Number 4, 2016


![Aromataseinhibitorsfortreatmentofadvancedbreastcancer ...researchonline.lshtm.ac.uk/4668/1/Gibson_et_al... · [Intervention Review] Aromatase inhibitors for treatment of advanced](https://img.pdfslide.net/doc/110x75/606bd20ad618f10fde1d84e4/aromataseinhibitorsfortreatmentofadvancedbreastcancer-intervention-review.jpg)