Embed Size (px)
Citation preview
Gu
yana
Sys
tem
of N
atio
nal A
ccou
nts
Bureau of Statistics March 2010
- 2 -
Guyana System of National Accounts
Bureau of Statistics March 2010
- 3 -
CONTENTS
Foreword by the Minister of Finance Preface by the Chief Statistician Selected Acronyms Executive Summary 1. Introduction to the System of National Accounts
Overview Key Concepts and Definitions
2. Guyana System of National Accounts Background National Economic Survey Supply and Use Table Rebasing and revising the GDP series GDP by Industry at Current Prices: Estimation Method
GDP by Industry at Constant Prices: Estimation Method 3. Results:
Highlights Main Features of the New GDP Series
Appendixes Appendix 1 Guyana: GDP at Current Factor Cost, 2006 ‐ 2009 (G$M – Previous Series) Appendix II Guyana: GDP at Current Basic Prices 2006–2009 (G$M – Current Series) Appendix III Guyana: GDP at Constant (1988) Prices, 2006 ‐ 2009 (G$M) Appendix IV Guyana: GDP at Constant (2006) Basic Prices 2006 – 2009 (G$M) Appendix V Guyana: GDP at Constant (1988) Prices, 2006 – 2009 (Growth rates) Appendix VI Guyana: GDP at Constant (2006) Basic Prices, 2007 – 2009 (Growth rates) Appendix VII International Standard Industrial Classifications Rev. 4: Broad Structures Appendix VIII Selected Indicators on Mining & Quarrying Appendix IX Selected Indicators on Wholesale & Retail Trade
Copyright © 2010
The Bureau of Statistics http://www.statisticsguyana.gov.gy All rights reserved. Published by the Bureau of Statistics, Guyana with funding from the Caribbean Regional Technical Assistance Centre (CARTAC).
- 4 -
Foreword The global demand for economic and financial statistics that are accurate, comprehensive, and comparable across countries is increasingly shaping the deliverables of national statistical systems. The compilation of national accounts is a cornerstone of such systems, producing outputs that inform evidence‐based policy decision making at the individual, corporate, sector, national, as well as regional and international levels. In Guyana, our Government has worked, and will continue to work assiduously to strengthen the Bureau of Statistics (BoS) and other statistics‐producing units within Government to promote the development of a national statistical system that embraces international best practices in data collection, analysis and dissemination. This publication reports on the outcomes of a three‐year project (2007‐2009) on benchmarking and rebasing Guyana’s national accounts (from base year 1988 to base year 2006), which included the incorporation of new data sources, and the adoption of new international methodological and industrial classification standards. These outcomes─and the publication of this report─underscore the Government’s strong commitment to producing and disseminating high‐quality data. They also attest to the Bureau’s important role as a catalyst for promoting the culture of statistics in Guyana. This is Guyana’s first comprehensive national accounts report since the compilation of national accounts statistics began in 1960. I take this opportunity to congratulate the Chief Statistician and his competent and dedicated staff on this important milestone. I would like to thank the Caribbean Regional Technical Assistance Center (CARTAC) for the extensive technical support provided in this exercise.
The early phase of this project, the development of a supply and use table for benchmarking the 2006 Gross Domestic Product (GDP) estimates, also benefited from technical support provided by the United States Census Bureau, with funding from the InterAmerican Development Bank. The role of these partners in our statistical development is gratefully acknowledged. I am pleased to commend this report to national and international users of Guyana’s national accounts statistics. I am confident that the information on sources and methods used in compiling the national accounts will inform users of the methodological soundness, international comparability, accuracy and reliability of Guyana’s GDP. The Honourable Dr. Ashni K. Singh, M.P. Minister of Finance Republic of Guyana
- 5 -
Preface from the Chief Statistician Guyana: System of National Accounts is the first comprehensive national accounts statistics publication to be released by the Bureau of Statistics (BoS). This publication marks the culmination of a project initiated by the BoS in 2007, to benchmark and rebase to 2006, Guyana’s annual national accounts series.
This is the third rebasing exercise in the history of Guyana’s national accounts (the previous base years for the GDP constant price series were 1977 and 1988), and perhaps the most challenging in many respects. Guyana’s previous base year was 1988, over twenty years ago. Since then, the profile of Guyana’s economy has evolved considerably. There have been changes in the patterns of relative prices, changes in economic structure and consumption patterns, introduction of new products; and not least, revisions in international standards and statistical methods used in compiling national accounts. In planning for the national accounts rebasing exercise, the need for a comprehensive update of the data compilation system through the use of additional data sources, and an expansion of the scope of the current methodology was recognized as critical. Accordingly, benchmarking through the creation of a supply and use table for 2006 was seen as an important step in the rebasing exercise. An important factor in the choice of the new base year was the fact that this was also the reference year for the Household Budget Survey (HBS), allowing our national accountants to leverage household‐based data for commodity balancing in the production‐based approach to GDP calculations. Further, from a regional perspective, the Standing Committee of Caribbean Statisticians has adopted a resolution urging all CARICOM Member States to revise their GDP series to a base year not earlier than year 2000, in order to effect closer harmonization and more meaningful comparison across CARICOM economies. It is worth noting that any country’s national accounts system is always considered a work in progress. We have indeed reached a significant milestone, but work will continue on the improvement of our methods, data sources, and ability to efficiently measure and report on our economy.
The production of this national accounts series would not have been possible without the participation of a myriad of persons and institutions. The BoS acknowledges the contribution and cooperation of the business community, public corporations, government agencies, and individuals, in the provision of the necessary data, to facilitate the completion of this report. Their continued cooperation in supplying data to the BoS in a timely manner will be critical to the maintenance of the new series. I also extend sincere thanks to the Director and staff of the Central Statistics Office (CSO), Trinidad and Tobago. The CSO facilitated the start of this process, with CARTAC funding, by hosting a three‐person team from the Bureau in 2007 to be briefed by their National Accounts Division in the mechanisms required to undertake such an important exercise. I would also take the opportunity to extend the deepest appreciation to the Caribbean Regional Technical Assistance Centre (CARTAC) which was with us at the beginning (the design stage) of the survey and assisted with compilation subsequent to the benchmark year, 2006. Additionally, it would be remiss of me not to mention the sterling inputs and contributions of the US Bureau of Census in the national economic survey and the process of benchmarking the accounts to the year 2006. These acknowledgements underscore the fact that this important and major exercise was truly a combination of local, regional and international effort, our partners being among the most renowned regional and international agencies in the field of statistics and statistics training. Finally, I commend Ms. Sharon Kreuter and her team in the BoS National Accounts Division for their unwavering commitment in bringing this project to a successful end. Lennox Benjamin Chief Statistician
- 6 -
Selected Acronyms 1993 SNA System of National Accounts, 1993 2008 SNA System of National Accounts, 2008 BoS Bureau of Statistics, Guyana CARICOM Caribbean Community CARTAC Caribbean Regional Technical Assistance Centre CSME Caribbean Single Market Economy CPI Consumer Price Index FISIM Financial Intermediation Services Indirectly Measured GGMC Guyana Geology and Mines Commission GGB Guyana Gold Board GDP Gross Domestic Product GUYSUCO Guyana Sugar Corporation IADB Inter‐American Development Bank IMF International Monetary Fund ISIC International Standard Industrial Classification of All Economic Activities MoA Ministry of Agriculture MoE Ministry of Education MoF Ministry of Finance MoH Ministry of Health NES National Economic Survey NIS National Insurance Scheme PSIP Public Sector Investment Program SUT Supply and Use Table BoG Bank of Guyana T&HD Transport and Harbours Department VAT Value Added Tax
- 7 -
Executive Summary National accounts are an indispensable tool in analyzing, monitoring and evaluating the performance of the economy; they are compiled relative to a base year which should be updated periodically due to structural change. It is widely acknowledged that the structure of Guyana’s economy has changed significantly since 1988, the last base year. Success in maintaining the national accounts series over the years has been achieved in spite of facing challenges common to statistics offices regionally and internationally, such as the changing face of businesses, survey response rates, and quality of data. Consequently, in 2007 the Bureau of Statistics (BoS) embarked on a three step project for improving the accuracy and reliability of Guyana’s GDP statistics by conducting a comprehensive national economic survey, developing a supply and use table for benchmarking the GDP estimates to 2006, and using the benchmark results for rebasing the GDP constant price series to base year 2006. Underlying these outcomes was the rebuilding of the national accounts system to allow for an integrated production account of gross output, intermediate consumption and value added; and the adoption of ─to the best extent possible─the recommended international methodological and classification guidelines, including the 1993 SNA, and the International Standard Industrial Classification, Revision 4. Having completed this exercise, the BoS has introduced the rebased series as the basis for national accounts statistics with effect from January 2010, with the base year of 2006. A rebasing exercise immediately results in two predictable outcomes: the size of nominal GDP expands significantly and the growth rate generally increases. As a result of the rebasing, Guyana’s GDP (in current purchaser or market prices) estimates are now significantly higher than previous estimates, averaging 62.2 percent higher for the years 2006‐20091. In 2009, under the 1988 series, Guyana’s GDP in current market prices was estimated at G$255,823 M. Re‐calculating under the new system for 2009, the GDP at market prices is G$413,114 M.2 GDP estimates at current basic prices (formerly ‘factor cost’) average 77.5 percent higher for the years 2006‐2009. The new GDP series has also revealed higher historical real growth rates and changes in sectoral composition of GDP, owing to both the change in the structure of the economy and a better accounting of the activities in all sectors. The top 5 industry groupings, as measured by contribution to constant prices GDP in 2009 are now: agriculture, fishing and forestry (21.4 percent); mining and quarrying (12.6 percent); wholesale and retail trade (12.4 percent); construction (9.8 percent); and public administration (9.0 percent). In the 1988 series, for the year 2009 agriculture, fishing and forestry was also the leader at 28.1 percent, followed by transport and communication (14.2 percent), government (11.5 percent), engineering and construction (11 percent) and distribution (10.5 percent). Better accounting of activity in key sectors in the rebased GDP results in higher weights in 2009 for several sectors. For example, government services now includes an estimate for consumption of fixed capital. Health and education─formerly classified under government─are now separated and expanded to include private sector activities. The distribution industry has an expanded coverage of commodity flows (using data on imports and domestic production), and an improved basis for estimating trade margins. At the same time, the mining and quarrying industry now reflects a larger share for gold, and a reduced share for bauxite. The new benchmark for manufacturing reflects the use of an expanded index of products; and in the “other services” industry certain categories, including tourism, hotels and restaurants, and professional services are better accounted for.
1 Based on four-year annual average (2006-2009).
2 Under the 2006 series, adopted from 2010, estimates of GDP at current purchaser (or market) prices for 2010 are G$448,072 M. If the 1988 series is extrapolated to 2010, the estimated GDP at current market prices is G$268,489M.
- 8 -
1. Introduction to the System of National Accounts Overview The System of National Accounts (SNA) is the internationally‐agreed standard set of recommendations on how to compile measures of economic activity in accordance with strict conventions based on economic principles. The recommendations are expressed in terms of a set of concepts, definitions, classifications and accounting rules that comprise the standard for measuring such items as gross domestic product (GDP), the most frequently quoted indicator of economic performance. The standard governing national accounts is embodied in the international reference manual, the System of National Accounts 1993 (1993 SNA), and in its recently updated version─the System of National Accounts 2008 (2008 SNA).3 With the rebenchmarking and rebasing of the GDP series to 2006, Guyana has now formally adopted─on a best efforts basis─the recommendations of the 1993 SNA. National accounts are an indispensable tool in analyzing, monitoring and evaluating the performance of the economy. Its systematic framework allows for the organizing and presenting of data in a way that highlights economic activities and the interactions of different economic agents within the country while evidencing the various linkages between the domestic economy and the rest of the world. However, its use also extends to the micro level─providing important data inputs for market research and analysis. GDP, gross domestic product, combines in a single figure, and with no double counting, all the output (or production) undertaken by all firms, nonprofit institutions, government bodies and households in a given country during a given period, regardless of the type of goods and services produced, provided that the production takes place within the country’s economic territory. In most cases, GDP is compiled quarterly or annually; in Guyana, GDP estimates are compiled annually, and at the half year. GDP can be derived by three broad approaches: the income approach, the expenditure approach, and the production approach. Each measure should, conceptually, deliver the same estimate of GDP. A description of each approach is as follows: • GDP using the income approach is derived as the sum of compensation of employees, gross
operating surplus, gross mixed income and taxes less subsidies on production and imports;
• GDP using the expenditure approach is derived as the sum of all final expenditures, changes in inventories and exports of goods and services less imports of goods and services;
• GDP using the production approach is derived as the sum of gross value added for each industry, at basic prices, plus taxes less subsidies on products. Basic values represent the amounts received by producers, including the value of any subsidies on products, but before any taxes on products. The difference between the sum over all industries of gross value added at basic prices, and GDP at market (or purchaser’s) prices, is the value of taxes less subsidies on products.
3 These global manuals are published jointly by five major international economic organizations: the United Nations, the International Monetary Fund, the Organization for Economic Cooperation and Development (OECD), the World Bank and the European Commission. The adoption of the 2008 SNA is a future goal for the majority of countries, with implementation by the countries with the most advanced statistics systems not expected before 2014.
- 9 -
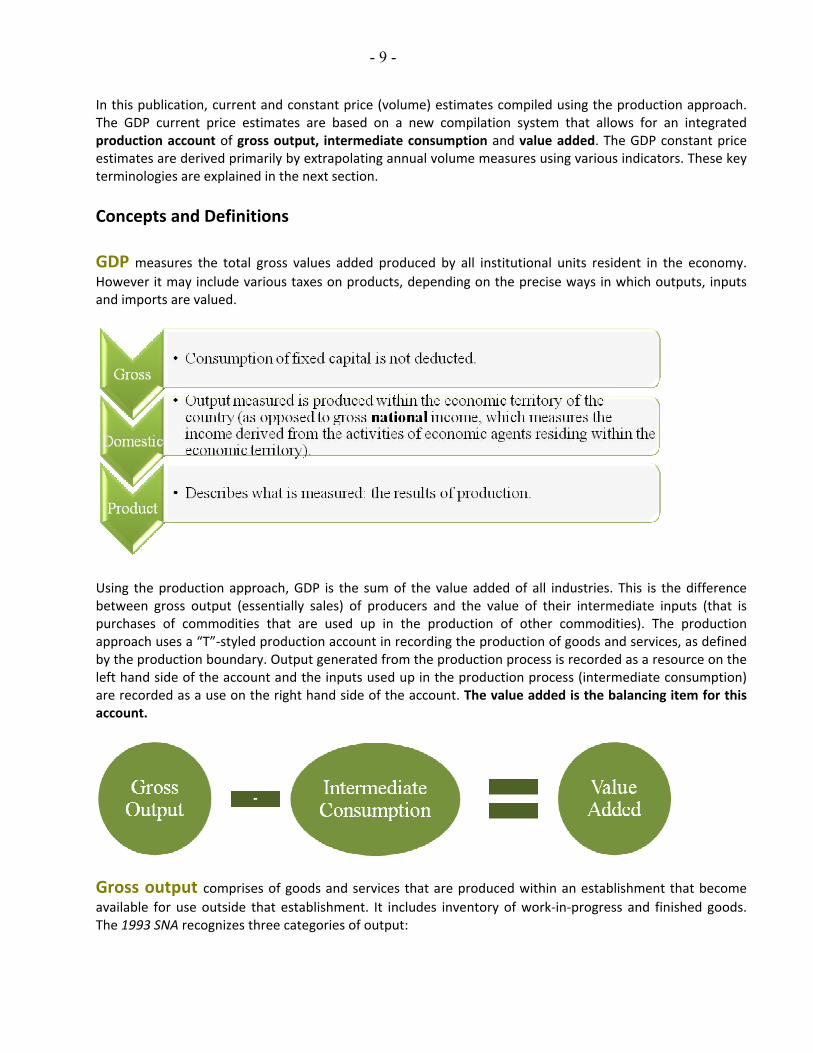
In this publication, current and constant price (volume) estimates compiled using the production approach. The GDP current price estimates are based on a new compilation system that allows for an integrated production account of gross output, intermediate consumption and value added. The GDP constant price estimates are derived primarily by extrapolating annual volume measures using various indicators. These key terminologies are explained in the next section. Concepts and Definitions GDP measures the total gross values added produced by all institutional units resident in the economy. However it may include various taxes on products, depending on the precise ways in which outputs, inputs and imports are valued.
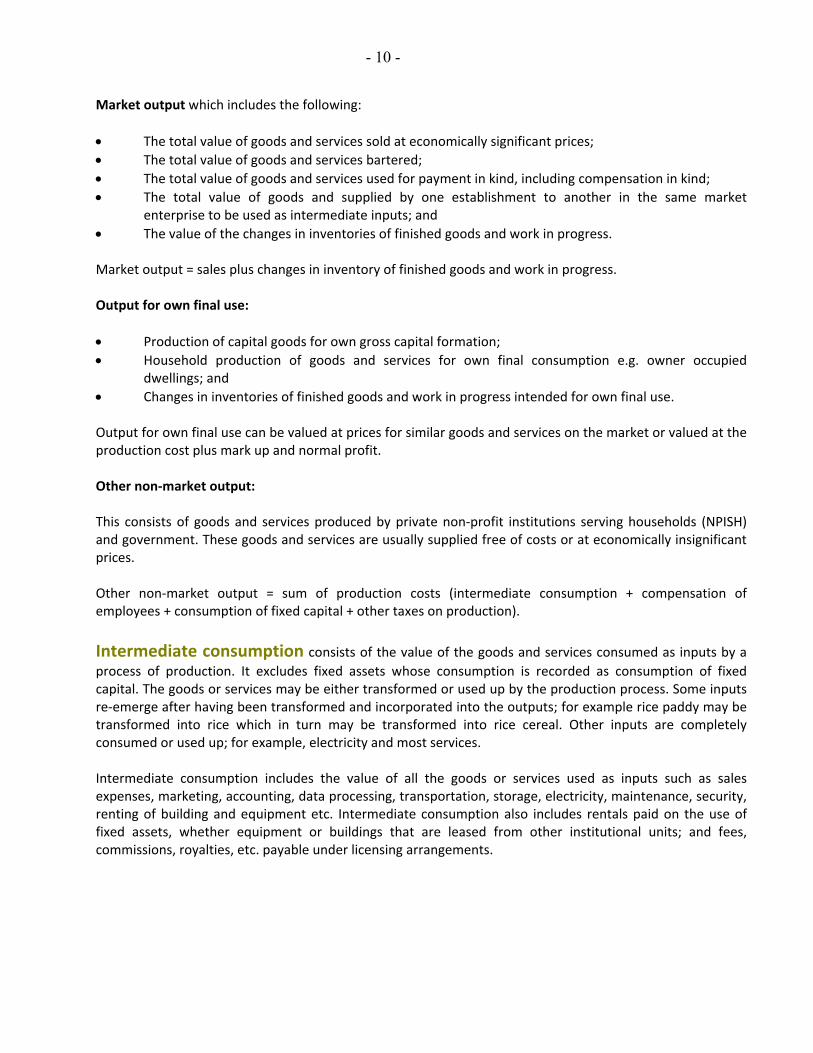
Using the production approach, GDP is the sum of the value added of all industries. This is the difference between gross output (essentially sales) of producers and the value of their intermediate inputs (that is purchases of commodities that are used up in the production of other commodities). The production approach uses a “T”‐styled production account in recording the production of goods and services, as defined by the production boundary. Output generated from the production process is recorded as a resource on the left hand side of the account and the inputs used up in the production process (intermediate consumption) are recorded as a use on the right hand side of the account. The value added is the balancing item for this account.
Gross output comprises of goods and services that are produced within an establishment that become available for use outside that establishment. It includes inventory of work‐in‐progress and finished goods. The 1993 SNA recognizes three categories of output:
- 10 -
Market output which includes the following:
• The total value of goods and services sold at economically significant prices; • The total value of goods and services bartered; • The total value of goods and services used for payment in kind, including compensation in kind; • The total value of goods and supplied by one establishment to another in the same market
enterprise to be used as intermediate inputs; and • The value of the changes in inventories of finished goods and work in progress. Market output = sales plus changes in inventory of finished goods and work in progress.
Output for own final use:
• Production of capital goods for own gross capital formation; • Household production of goods and services for own final consumption e.g. owner occupied
dwellings; and • Changes in inventories of finished goods and work in progress intended for own final use. Output for own final use can be valued at prices for similar goods and services on the market or valued at the production cost plus mark up and normal profit. Other non‐market output: This consists of goods and services produced by private non‐profit institutions serving households (NPISH) and government. These goods and services are usually supplied free of costs or at economically insignificant prices. Other non‐market output = sum of production costs (intermediate consumption + compensation of employees + consumption of fixed capital + other taxes on production). Intermediate consumption consists of the value of the goods and services consumed as inputs by a process of production. It excludes fixed assets whose consumption is recorded as consumption of fixed capital. The goods or services may be either transformed or used up by the production process. Some inputs re‐emerge after having been transformed and incorporated into the outputs; for example rice paddy may be transformed into rice which in turn may be transformed into rice cereal. Other inputs are completely consumed or used up; for example, electricity and most services. Intermediate consumption includes the value of all the goods or services used as inputs such as sales expenses, marketing, accounting, data processing, transportation, storage, electricity, maintenance, security, renting of building and equipment etc. Intermediate consumption also includes rentals paid on the use of fixed assets, whether equipment or buildings that are leased from other institutional units; and fees, commissions, royalties, etc. payable under licensing arrangements.
- 11 -
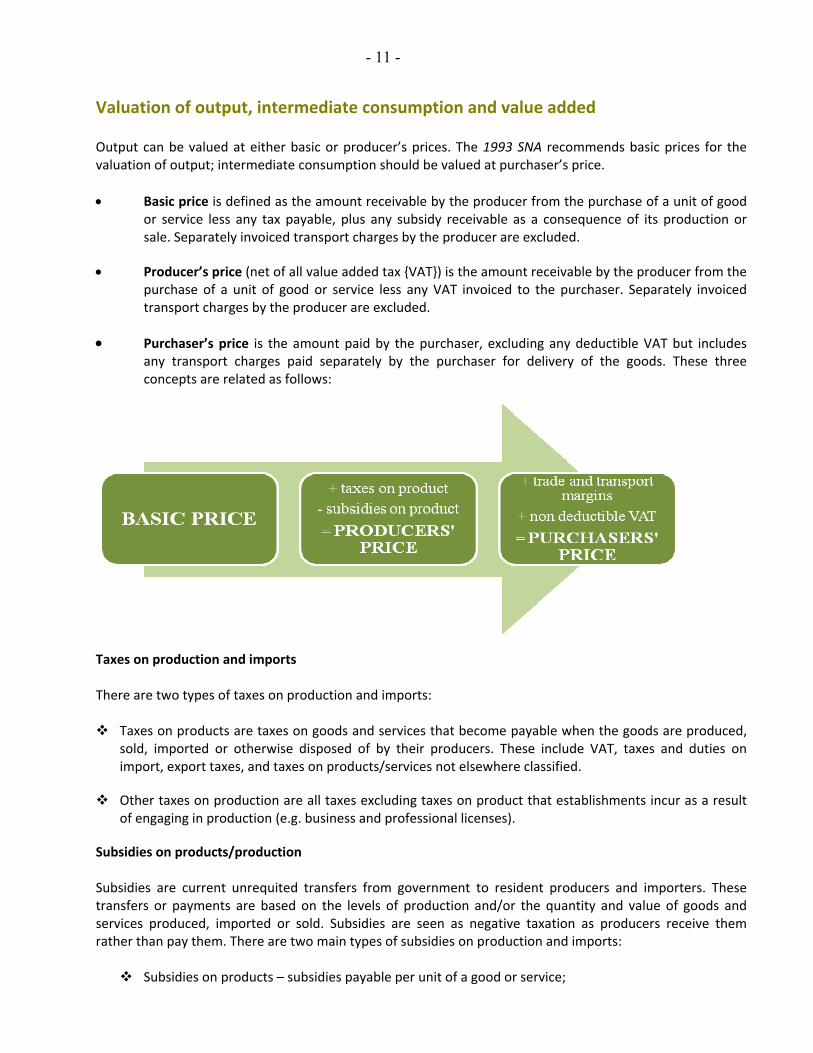
Valuation of output, intermediate consumption and value added Output can be valued at either basic or producer’s prices. The 1993 SNA recommends basic prices for the valuation of output; intermediate consumption should be valued at purchaser’s price. • Basic price is defined as the amount receivable by the producer from the purchase of a unit of good
or service less any tax payable, plus any subsidy receivable as a consequence of its production or sale. Separately invoiced transport charges by the producer are excluded.
• Producer’s price (net of all value added tax {VAT}) is the amount receivable by the producer from the purchase of a unit of good or service less any VAT invoiced to the purchaser. Separately invoiced transport charges by the producer are excluded.
• Purchaser’s price is the amount paid by the purchaser, excluding any deductible VAT but includes any transport charges paid separately by the purchaser for delivery of the goods. These three concepts are related as follows:
Taxes on production and imports There are two types of taxes on production and imports:
Taxes on products are taxes on goods and services that become payable when the goods are produced, sold, imported or otherwise disposed of by their producers. These include VAT, taxes and duties on import, export taxes, and taxes on products/services not elsewhere classified.
Other taxes on production are all taxes excluding taxes on product that establishments incur as a result of engaging in production (e.g. business and professional licenses).
Subsidies on products/production Subsidies are current unrequited transfers from government to resident producers and importers. These transfers or payments are based on the levels of production and/or the quantity and value of goods and services produced, imported or sold. Subsidies are seen as negative taxation as producers receive them rather than pay them. There are two main types of subsidies on production and imports:
Subsidies on products – subsidies payable per unit of a good or service;
- 12 -
Other subsidies on production ‐ subsidies excluding subsidies on products that are paid to resident establishments as a result of engaging in production.
In Guyana’s new GDP series, current price value added is derived from calculations made in valuing gross output at basic prices, and intermediate consumption at purchaser’s prices. Taxes on products net of subsidies are then added (at the aggregate level) to derive GDP at purchaser’s prices (or market prices). This adjustment is done only for the GDP current price estimates. In Guyana’s case, GDP at basic prices moves to GDP at purchaser’s prices since trade and transport margins are implicitly accounted for in intermediate consumption.
- 13 -
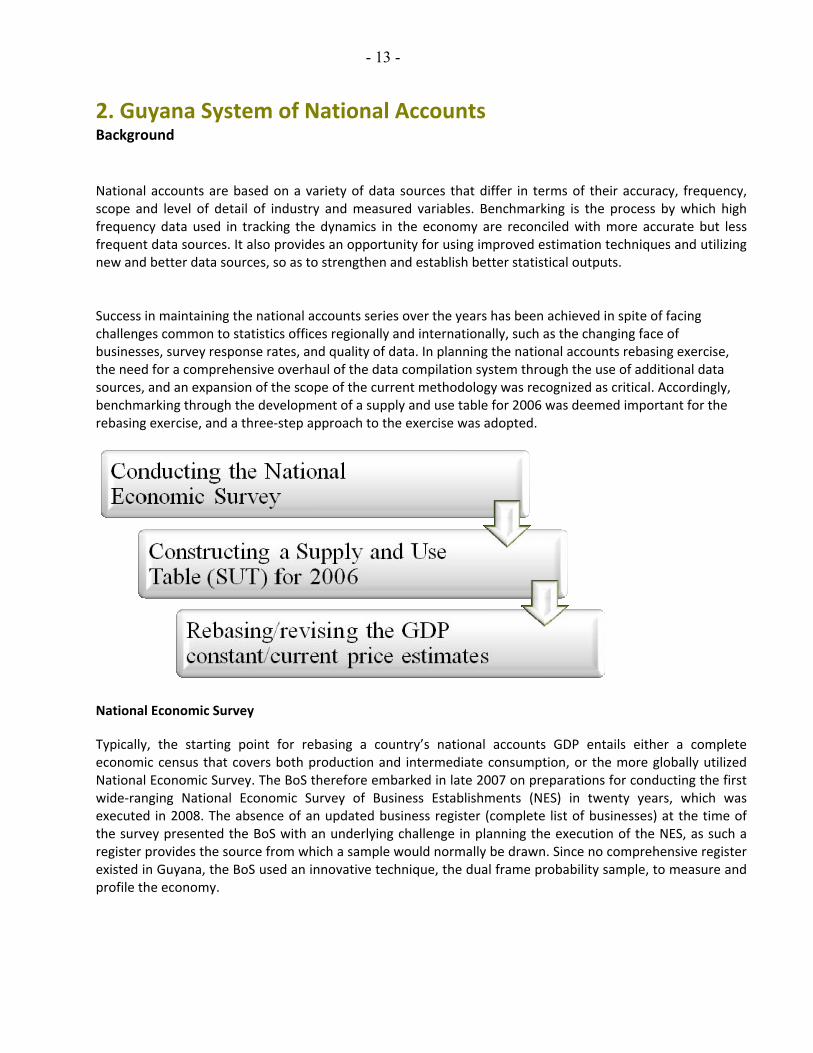
2. Guyana System of National Accounts Background National accounts are based on a variety of data sources that differ in terms of their accuracy, frequency, scope and level of detail of industry and measured variables. Benchmarking is the process by which high frequency data used in tracking the dynamics in the economy are reconciled with more accurate but less frequent data sources. It also provides an opportunity for using improved estimation techniques and utilizing new and better data sources, so as to strengthen and establish better statistical outputs. Success in maintaining the national accounts series over the years has been achieved in spite of facing challenges common to statistics offices regionally and internationally, such as the changing face of businesses, survey response rates, and quality of data. In planning the national accounts rebasing exercise, the need for a comprehensive overhaul of the data compilation system through the use of additional data sources, and an expansion of the scope of the current methodology was recognized as critical. Accordingly, benchmarking through the development of a supply and use table for 2006 was deemed important for the rebasing exercise, and a three‐step approach to the exercise was adopted.
National Economic Survey
Typically, the starting point for rebasing a country’s national accounts GDP entails either a complete economic census that covers both production and intermediate consumption, or the more globally utilized National Economic Survey. The BoS therefore embarked in late 2007 on preparations for conducting the first wide‐ranging National Economic Survey of Business Establishments (NES) in twenty years, which was executed in 2008. The absence of an updated business register (complete list of businesses) at the time of the survey presented the BoS with an underlying challenge in planning the execution of the NES, as such a register provides the source from which a sample would normally be drawn. Since no comprehensive register existed in Guyana, the BoS used an innovative technique, the dual frame probability sample, to measure and profile the economy.
- 14 -
The choice of base year is the next step; this entails finding a year which can be considered a relatively normal year for the economy, with no major disasters, entry or exit of huge businesses, major reforms in taxation, etc. The detailed data on consumption that was collected for the year 2006 from the HBS was a major factor in the decision to select 2006 as Guyana’s new base year. Additionally, the flood in 2005 and the unusual movements in world commodity prices as well as the transition to VAT in 2007 precluded those years, while earlier years would have posed challenges with data availability. In the first stage of the survey a certainty frame of businesses was compiled, which was created from previous data collections and traditional respondents, the Guyana Telephone Directory, trade and related organizations, Chambers of Commerce and administrative records that could be sourced. This list of certainty businesses, some of which were enterprises with multiple establishments, was qualitatively estimated to cover about 85 percent of the economy. All businesses on this list were enumerated (sampled with “certainty”). In the second stage, the survey employed a second frame based on enumeration districts (EDs) used in the Guyana 2002 Housing and Population Census. The area survey population was all economic establishments that operated at any time during the reference year 2006 and that are located in Regions 2‐5, the coastal sections of Regions 6 and 10, the Bartica area of Region 7, the Lethem area of Region 9, and the Mabaruma area of Region 1. These EDs were randomly selected after being weighted by levels of business activity. The survey instrument itself was a self‐administered questionnaire developed by the BOS, with technical advice from the US Census Bureau and CARTAC. A general questionnaire was developed for use in the area sample (“short form”), which was used as the basis for producing a more detailed general questionnaire and thirteen other industry‐specific detailed questionnaires (“long forms”) for the certainty phase. Coverage of larger industries was further supplemented with administrative records data, and other data sources (for example, the 2006 HBS provides data on household expenditure on recreation and personal services). Supply and Use Table The results of the NES were used to construct a supply and use table (SUT), which resulted in the benchmarking of the GDP of Guyana for 2006. The results of the benchmarking emphasized the need for ongoing work in a few key sectors, including construction. Additionally, it provided the basis for advancing work on the rebasing exercise, since Guyana now had to use improved techniques to continue estimating GDP beyond the base year of 2006. Rebasing and Revising the GDP Series
The presentation of the new GDP series with base year 2006 is a milestone in a process that began with the NES, conducted in 2008 as a systematic and rigorous attempt to measure economic activities for the purpose of re‐benchmarking and rebasing the GDP.
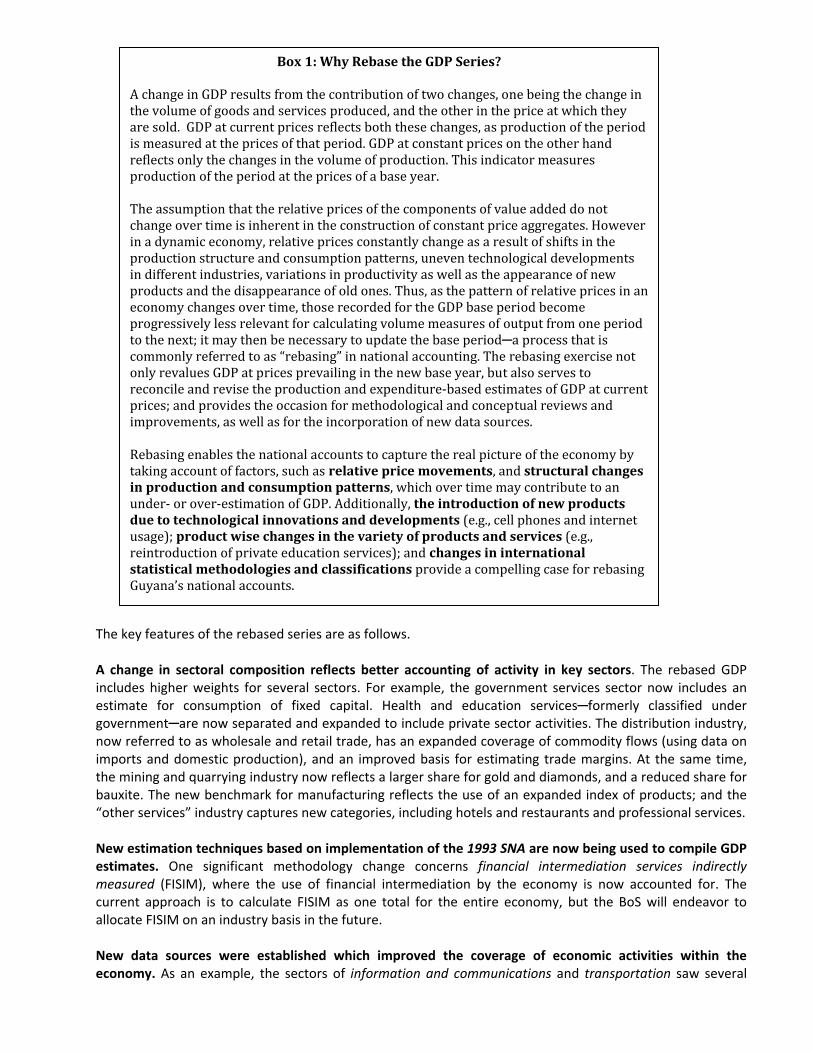
A change in GDP resultsthe volume of goods andare sold. GDP at currenis measured at the priceeflects only the changerproduction of the period The assumption that thechange over time is inhein a dynamic economy, rproduction structure anin different industries, vproducts and the disappeconomy changes over tprogressively less relevto the next; it may then commonly referred to aonly revalues GDP at prreconcile and revise therices; and provides thepimprovements, as well a Rebasing enables the nataking account of factorin production and conunder‐ or over‐estimatidue to technological inusage); product wise creintroduction of privatstatistical methodologGuyana’s national accou
The key features of the rebas A change in sectoral compoincludes higher weights for sestimate for consumption government─are now separanow referred to as wholesaleimports and domestic produthe mining and quarrying indubauxite. The new benchmark“other services” industry capt New estimation techniques bestimates. One significant measured (FISIM), where thecurrent approach is to calcuallocate FISIM on an industry New data sources were eseconomy. As an example, th
- 15 - Box 1: Why Rebase the GDP Series?
from the contribution of two changes, one being the change in services produced, and the other in the price at which they t prices reflects both these changes, as production of the period s of that period. GDP at constant prices on the other hand s in the volume of production. This indicator measures at the prices of a base year.
relative prices of the components of value added do not rent in the construction of constant price aggregates. However elative prices constantly change as a result of shifts in the d consumption patterns, uneven technological developments ariations in productivity as well as the appearance of new earance of old ones. Thus, as the pattern of relative prices in an ime, those recorded for the GDP base period become ant for calculating volume measures of output from one period be necessary to update the base period─a process that is s “rebasing” in national accounting. The rebasing exercise not ices prevailing in the new base year, but also serves to production and expenditure‐based estimates of GDP at current occasion for methodological and conceptual reviews and s for the incorporation of new data sources.
tional accounts to capture the real picture of the economy by s, such as relative price movements, and structural changes sumption patterns, which over time may contribute to an on of GDP. Additionally, the introduction of new products novations and developments (e.g., cell phones and internet hanges in the variety of products and services (e.g., e education services); and changes in international ies and classifications provide a compelling case for rebasing nts.
ed series are as follows.
sition reflects better accounting of activity in key sectors. The rebased GDP everal sectors. For example, the government services sector now includes an of fixed capital. Health and education services─formerly classified under ted and expanded to include private sector activities. The distribution industry, and retail trade, has an expanded coverage of commodity flows (using data on ction), and an improved basis for estimating trade margins. At the same time, stry now reflects a larger share for gold and diamonds, and a reduced share for for manufacturing reflects the use of an expanded index of products; and the ures new categories, including hotels and restaurants and professional services.
ased on implementation of the 1993 SNA are now being used to compile GDP methodology change concerns financial intermediation services indirectly use of financial intermediation by the economy is now accounted for. The late FISIM as one total for the entire economy, but the BoS will endeavor to basis in the future.
tablished which improved the coverage of economic activities within the e sectors of information and communications and transportation saw several
- 16 -
important coverage enhancements—for instance, the scope of telecommunications was expanded to include cell phone activities, and services such as internet service providers and TV broadcasting were added to communications. The operations of mini buses, taxis, lorries, domestic air services and coastal speedboats, as well as the services provided by air/sea ports and bridges, are better accounted for in an expanded transportation sector. The economic profile now benefits from improved industrial classification and uses the most current international standard, ISIC Revision 4. As a result, for example, public health and education are classified into those industries and are no longer measured under public administration (formerly government). Similarly, a sub‐industry measuring support to transport (operation of bridges and airports) is now measured in the transport industry. The rebuilt national accounts system allows for an integrated production account of gross output, intermediate consumption and value added; and employs─to the best extent possible─the 1993 SNA guidelines. In compiling the GDP volume estimates (constant prices), the single indicator method used is mainly the direct extrapolation of base year value added by a volume index of gross output; this represents a marked improvement on existing practices. The intermediate consumption and value‐added ratios now better reflect the reality, as they are based on updated information derived from the NES, and other statistical enquiries. GDP by Industrial Activity at Current Prices: Estimation Methods The industry‐specific details of the data sources and methodology used in estimating the GDP at current prices are described as follows.
Agriculture, Forestry and Fisheries Sugar cane For estimating value added, detailed financial data are obtained from the Guyana Sugar Corporation (GUYSUCO) via the NES. The NES data are used for calculating the production account components, including depreciation as a proxy for consumption of fixed capital (CFC).4 The BoS also collects from GUYSUCO data on sugar output, export and domestic sales (quantity and prices), and stocks that facilitate validation of sales estimates, and provide inputs for constructing volume measures of GDP. GUYSUCO is a vertically integrated enterprise, with the output of its sugar cane plantations (sugar cane) used to manufacture sugar for sale. In line with the 1993 SNA, the BoS separates the activities in accordance with the first level breakdown of ISIC . This is done by first calculating value added at the level of the enterprise (GUYSUCO), and then splitting the value added between agriculture and manufacturing, based on the field and factory employment costs. Further work is needed to identify the costs incurred at each stage of production (sugar cane to manufactured sugar) to ensure a more robust application of the 1993 SNA guidelines.
4 Historically, value added was measured by the income method (compensation of employees and operating surplus), with no estimate for CFC.
- 17 -
Rice Data on rice paddy production and prices are available from the Guyana Rice Development Board (GRDB). The SUT provides detailed information on costs of production, from which the current estimates of value‐added were derived from gross output in the benchmark year of 2006. Other Crops Annual data on other crops production are available from the Ministry of Agriculture (MoA). The data are collected by the MoA through its regional field offices, but the data appear to be based only on reported information with no coverage adjustments for nonreporters. In estimating gross output, the BoS uses interpolation techniques at the individual crop level when the magnitudes deviated significantly from the trend level. The value of gross output is then calculated using wholesale/Parika farm gate price data published by the New Guyana Marketing Corporation. Based on market information, wholesale markets’ price data (for markets other than Parika) were revised downwards to derive a farm gate price. In deriving value added (gross output minus intermediate consumption), intermediate consumption is calculated using cost coefficients, classified by crop types.5 These coefficients differ according to crop type; and were based on industry knowledge and discussion with the MoA, and validated against those applied in other CARICOM countries. Livestock Data on poultry, beef, mutton, pork, egg and milk production are available from the Livestock Division of the MoA. The BoS also relies on information from the Guyana Poultry Producers Association as a secondary source for poultry data. The value of gross output is calculated using estimated farm gate prices, derived from the BoS consumer prices database for those products. In deriving value added, intermediate consumption is calculated using cost coefficients, based on industry knowledge. Fishing Volume data on prawns, shrimp and fish (the latter two further classified by method of catch─ artisanal and industrial) are available from the Fisheries Division of the MoA. The BoS adjusted the 2006 and 2007 data where volatility could not be validated against observed trends in export volume and price movements, and was clearly due to a coverage problem. The value of gross output is calculated using landed catch prices, estimated by the BoS as a percentage of the average retail price of various species of fish and shrimp, as reported by the Fisheries Department. In deriving value added, intermediate consumption is calculated using cost coefficients derived from the National Economic Survey (NES)─for large industrial fishing companies; and from cost studies on artisanal fishing done by the Institute of Private Enterprise Development (IPED). Forestry Detailed volume data on forestry products are available from the Guyana Forestry Commission (GFC). Gross output is calculated using GFC data on the value of export and domestic sales (both quantity and
5 The classifications are: root crops, vegetables, spices and seasonings, citrus, non-citrus non-tree fruits, non-citrus tree fruits, legumes, horticulture, coconuts and other (coffee, cocoa).
- 18 -
price are available). In deriving value added, intermediate consumption is calculated using cost coefficients derived from the NES and the SUT. Mining Mining covers bauxite, gold, diamonds, and quarrying (sand and stone). The gross output of bauxite is measured as the volume of output multiplied by export prices (all bauxite is exported). Value added is derived from data supplied by the industry. For gold, the BoS collects monthly production data from the Guyana Gold Board (GGB), and the value of output is calculated by applying the London Gold Bullion Market Prices. In determining intermediation consumption, the BoS held discussions (in 2006) with the GGMC within the context of work on the SUT. The cost structure of dredging operations was determined for the base year and then applied for the benchmark estimates in 2006. Since updated cost data did not exist for years beyond 2006, the dredging costs from the base year were extrapolated by the CPI sub‐index for fuel, and the increments in the amount of licensed dredges for the subsequent years. For diamonds, gross output is based on GGMC data on output, with average export prices applied. Intermediate consumption is estimated as a percentage of the cost of gold extraction. Sand and stone production data are collected from the GGMC. The basis for measuring the gross output of sand was changed as part of the GDP revision process, with GGMC data on estimated sand extraction now used instead of data on sand declarations, which is recorded when royalties are paid. The BoS has utilized the detailed knowledge of the industry that the GGMC possesses together with the partial data from the NES for stone to derive estimates of intermediate consumption and value‐added, respectively. Manufacturing Sugar GUYSUCO is a vertically integrated enterprise, with the output of its sugar cane plantations (sugar cane) used to manufacture sugar for sale. In line with the 1993 SNA, the BoS separates the activities in accordance with the first level of ISIC breakdown (estimation procedure outlined earlier in this report). Rice Data on rice production are available from the GRDB. Gross output is estimated by applying the annual average export price to the production data. Value added is derived by applying the intermediate consumption/gross output coefficient of the base year (sourced from the NES) to gross output. Other Manufacturing The basis for the current price estimates is the 2006 SUT which provides gross output, intermediate consumption and value added calculations for the following product categories: food, beverage, clothing, footwear, and other manufacturing (with breakdowns for paper and paper products; chemicals and chemical products; pharmaceuticals; rubber and plastic products; wood products; and other, including jewelry manufacturing, etc.). Using these benchmark estimates, current price estimates were estimated using volume and price estimates for subsequent years.
- 19 -
For industries with a high degree of concentration (such as beverages, stock feeds, pharmaceuticals and footwear), the volume estimates are robust, and data validation was possible through reference to other data sources, including the published annual reports of the main companies involved in these activities. However, while the monthly production survey has been ongoing for well over twenty years, there is scope for improvement and work is proceeding on monthly manufacturing production data collection in this industry, particularly for activities of small‐scale manufacturing. Electricity, Water and Sewerage and Waste Management Value added estimates are based on NES (2006) data and the financial statements for subsequent years of Guyana Power and Light (GPL) and Guyana Water Incorporated (GWI). Private sector activities in waste management are based on NES data. Construction The estimation procedures for public and private construction are as follows. The MoF’s Public Sector Investment Program (PSIP) data provide the basis for estimating value added for public construction. At the first stage, the MoF identified the construction‐related components of the PSIP. The construction components of additional projects such as the Berbice River Bridge, GUYSUCO’s Skeldon Sugar Factory, and Guyana Power and Light’s new Wartsila Power Plant are also included. Measured by the income approach, the value added for these projects aggregated local employment costs and the operating surplus of any domestic sub‐contractors to the projects. Derivation of the aforementioned components required the obtaining of more than cursory details of financial arrangements for the construction‐related components of the PSIP and other corporate construction projects. For estimating private construction, the BoS employed the commodity flow approach.6 Using this approach, the total supply of building materials was estimated from the external trade data, as well as production of domestically produced building materials (forestry products, sand and stone). These supplies were then adjusted to exclude estimated amounts utilized under the PSIP, as well as amounts used as part of maintenance of residential buildings (which is part of intermediate consumption of real estate activities). The resulting estimate is intermediate consumption for private construction (residential and commercial), which was then used to derive gross output and value added on the basis of industry estimates on construction costs for residential buildings. These estimates were derived from a number of sources, including house plan estimates (low and medium size) and were assessed against regional estimates, including those of other CARICOM countries. The intermediate results were also validated against related indicators, including the number and value of residential mortgages, sourced from the Guyana Deeds Registry.
6 A number of underlying indicators were also examined, including house lots allocated by the government, and Central Housing and Planning Authority (CHPA) applications for building permits. This could be refined with more timely availability of data on building permits granted, and determination of the lag between housing lot allocation and actual construction.
- 20 -
Wholesale and Retail Trade The procedure introduced for measuring wholesale and retail trade (WRT), formerly referred to as distribution, is the commodity flow approach, using existing external trade data and the gross output of domestically‐produced goods. Using the BoS external trade database, imports entering the distribution stream by economic classification were identified, and trade margins (which approximates to gross output for WRT7) and value added were then calculated using industry specific information according to product types. This information was based on the NES and on BoS/CARTAC mission discussions with different categories of wholesalers/retailers. A similar exercise was undertaken for domestically produced goods, with estimates of domestically‐produced goods entering the distribution stream based on the product balancing approach, using direct information where available (for example, rice, sugar and forestry products─data on local sales/consumption), or by estimates based on adjusting production by exports and/or use in intermediate consumption (e.g. for other crops). For household consumption products, data from the 2006 Household Expenditure Survey were also used either as part of the estimation procedures, or to validate the estimates (e.g., household fish and meat consumption). Transport Transportation value added comprises direct transport activities categorized by air (domestic passenger and cargo), land (lorries, minibuses and taxis), and sea (public ferries and private speed boats), supporting transport activities, and postal and courier services. 8
Recording the activities of this industry had presented and will continue to present challenges, but its gradual transition to the formal economy and the results of the NES allowed improved 2006 estimates for these activities. Data on land transport, air transport (and auxiliary services) and public sea transport (and auxiliary services) are sourced from the records of the License Revenue Authority (LRO), Civil Aviation Authority (CAA), the Cheddi Jagan International Airport (CJIA) and the Transport and Harbours Department (T&HD). Information and Communication This activity, formerly grouped under transport and communications, is now separately distinguished and its scope expanded, covering telecommunications (including mobile phones9); internet service providers (ISPs); newspaper and other publishing activities; and TV programming and broadcast activities. The estimates for gross output, intermediate consumption and value added are based on the 2006 SUT, with additional information (for subsequent years) sourced from the NES.
7 Data on opening/closing inventories of wholesale and retail establishments are not available, but empirical evidence suggests no significant inventory holdings of consumer imports, and in the case of capital and intermediate goods, there is either fast turnover or goods are imported on order (for large capital equipment). Inventory information is enumerated in the NES, but in most cases was not completed. 8 According to ISIC, this activity should also include storage but there are no known firms in Guyana operating storage facilities as their primary activity. 9 Digicel entered the Guyana market in November 2006 by acquiring the Guyanese mobile operator U-Mobile through the direct acquisition of its ultimate parent holding company. This new activity is reflected in the significant real growth rate of the telecommunications sub-sector observed in 2007.
- 21 -
Financial and Insurance Activities The compilation system for financial services was redesigned to take account of the requirements of the SNA 1993 with regard to the calculation of financial intermediation services indirectly measured (FISIM), and to streamline the ISIC classification classes. With the more detailed data that has become available through the NES, the gross output for the following classes are now estimated directly: central banking, commercial banks, securities and commodity contracts brokerages (mainly non‐bank cambios), trust companies and insurance. Under the SNA 1968, predecessor to SNA 1993, the measurement of financial services output included both explicit service charges, and imputed bank service charges (IBSC), calculated as the difference between interest receivable and interest payable. The SNA 1993 recommends that IBSC be replaced with FISIM, and that the output of financial services comprise both FISIM and commissions and fees directly measured. In calculating FISIM, the BoS applied the reference rate approach, using data on consolidated financial institutions’ balance sheet, as compiled by the BoG. However, in line with the SNA 2008, no adjustment was made for banking sector lending own funds. A simple approach was applied for Guyana as follows. The reference rate chosen was the BoG bank rate (as there is no interbank rate), the average interest rate on deposits was proxied by the small savings rate, and the average rate on loans was proxied by the prime lending rate. The formula referred to in Box 2 was then applied, using the respective average deposits and loan stock data (excluding nonresident component). Using the NES data, fees and commissions were added to FISIM to determine the overall output. Intermediate consumption was estimated using NES data, and value added derived. The results were assessed against the BoG data on (consolidated) commercial banks’ operating costs and profits. The value added for the BoG was calculated as the sum of employments costs, operating profits and depreciation as reported in the BoG Annual Reports. Insurance was estimated using NES data. An upward adjustment was taken to cover financial service activities not adequately captured in the NES; these mainly relate to the activities of nonbank cambios and money remittance firms. The new procedures for estimating financial services represent a significant departure from the current extrapolation‐based estimates, and thus yield different results.
Unlike the 1968 SNA, the 1993 SNA recommends that FISIM be allocated not only to industries but also to households, government and the export of services as they too are users of the financial intermediation process. The 1993 SNA proposes two approaches to the allocation of FISIM to final users and industries:
♦ To base the allocation of interest paid by borrowers and received by lenders on a sector to sector basis by applying the difference between the reference or pure rate and the actual rates. This reference rate represents the pure cost of borrowing and would eliminate the risk associated with making transactions. The “actual” interest rate contains both a fee for intermediation services as well as transaction risks. However, this approach requires a great deal of detailed information;
♦ or to allocate the FISIM to the different users proportionately to their financial assets and liabilities or other financial indicators.
- 22 -
BOX 2: METHOD FOR CALCULATING FISIM IN SNA 2008 (CONTINUED)
BOX 2: METHOD FOR CALCULATING FISIM IN SNA 2008 The method for calculating financial intermediation services indirectly measured, widely known as FISIM, has been refined in the light of experience in implementing the 1993 SNA recommendations. By convention the 2008 SNA recommends that FISIM applies only to loans and deposits and only when those loans and deposits are provided by, or deposited ith, financial institutions. The 2008 SNA calculates the output of FISIM on loans and w
deposits only, using a reference rate applied within a specific formula. The method recommended in the 2008 SNA (indicated earlier to be implemented by more advanced countries around 2014 era) for the calculation of FISIM implies several changes to the 1993 SNA formula. For financial intermediaries, all loans and deposits are included, not just those made from intermediated funds. The reference rate should contain no service element and reflect the risk and maturity structure of deposits and loans. The rate prevailing for inter‐bank borrowing and lending may be a suitable choice as a reference rate. However, different reference rates may be needed for each currency in which loans and deposits are denominated, especially when a non‐resident financial institution is involved. or banks within the same economy, there is often little if any service provided in association Fwith banks lending to and borrowing from other banks. The 2008 SNA recommends that the consumption of FISIM should be allocated between sers (lenders as well as borrowers) treating the allocated amounts either as intermediate uconsumption by enterprises or as final consumption or exports. The 1993 SNA calculated FISIM as the difference between property income receivable and interest payable. The property income receivable excluded that part which was receivable from investment of own funds. The 1993 SNA recognized that in practice it may be difficult to find any method of allocating FISIM among different users and, therefore, accepted that some countries may prefer to continue to use the convention whereby the whole of the ervices are allocated to intermediate consumption of a notional industry. This possibility as been removed in the 2008 SNA. sh Source: System of National Accounts 2008
However, the 1993 SNA recognizes that these two approaches may not be feasible for all countries due to data constraints. The alternative would be (similar to the 1968 SNA) to create a notional industry with no output and the FISIM treated as intermediate consumption resulting in negative value added. This implies that industries use all of the services of the banks. This approach was used for Guyana for the reasons stated above, and the new tables have a line item called “adjustment for FISIM.”
Public Administration Using data from the Guyana Public Sector Estimates, compensation of employees is calculated and disaggregated into the ISIC Revision 4 classifications, separately identifying the components: education, health and social work, personal and recreational services10, and public administration. The component
10 The data on personal and recreational services are included under other activities in the new data presentation format.
- 23 -
public administration is then added to the compensation of employees for the National Insurance Scheme (NIS, a compulsory social security scheme), municipalities and statutory agencies.
Currently central government and municipalities do not estimate consumption of fixed capital (CFC) and this will be one new area to address in the ongoing work for the national accounts. The basic data needed would be the stock of government fixed assets by major categories (buildings, transport equipment, office machinery etc.); or alternatively, an application of the perpetual inventory method to government’s expenditure on capital formation (by similar breakdowns) would suffice. As an interim measure, the BoS examined the CFC/compensation of employees’ ratios for two Caribbean countries and estimated an appropriate ratio for Guyana. Summing the CFC estimates plus the compensation of employees yields the gross value added, which is the GDP at current prices for public administration.
Education Public education services’ value added data are estimated using employment costs data sourced from the Public Sector Estimates, along with an adjustment for CFC (see discussion under public administration). Value added data for private education are based on the NES and administrative data, with coverage adjustments made by the BoS to account for schools either not covered or since established.
Health and Social Work Public health and social services value added data are estimated using employment costs data sourced from the Public Sector Estimates, and from information from the Georgetown Public Hospital Incorporated, along with an adjustment for CFC (see discussion under public administration). Value added data for private health and social work are based on the NES and administrative data, with coverage adjustments made by the BoS to account for entities either not covered or since established.
Real Estate Activities Housing services are part of GDP, in both the national income and product accounts. The rental value of tenant‐occupied housing and the imputed rental value of owner‐occupied housing are both part of housing services, reflecting the amount of money tenants spend for the service of shelter and the amount of money owner occupants would have spent had they been renting. Owner‐occupied housing falls within the production boundary of the 1993 SNA, and are therefore included in ISIC Revision 4 (section L, real estate activities).
Value added for owner‐occupied housing is calculated as the imputed output of housing services (space rent) less the expenses associated with owner‐occupied housing, such as maintenance and repairs. Estimates of space rent for tenant‐ and owner‐occupied housing are estimated as the number of tenant‐occupied (or owner‐occupied) units multiplied by the average rental value (or imputed rental value).
However, the procedures outlined in the previous two paragraphs were difficult to implement. As a benchmark, the SUT used the housing stock (with split between owner occupied and rented housing) derived from the 2006 HBS. With the extensive housing program, output estimates were made for years subsequent to 2006, but with negligible population growth, an assumption was made that the growth in owner‐occupied housing would be offset to some extent by a reduction in rental housing, squatting, and in the size of extended households. An improved basis for the estimates may be possible after the 2010 Census is conducted and provides an updated number of households.
- 24 -
With these caveats, gross output is based on the housing stock estimates multiplied by the average yearly rental value. 2006 rental values are estimated from the HBS, and these values were adjusted by the CPI housing sub‐index for years subsequent to 2006. Intermediate consumption is estimated as the equivalent of one month’s rent (this estimate is currently used in some CARICOM countries).
Other Activities Other activities cover hotels and restaurants; professional services; arts, entertainment and recreational services; and a number of other services, including beauty salons, security services and funeral homes. Estimates are derived predominantly from the HBS and NES data. However, this sector remains continuous work in progress, as constraints in our knowledge in the locations of many small and medium size businesses in this category precluded full coverage of some activities. Again, the execution of the Census, where every building will be listed and every economic activity found will be recorded, will greatly enhance data availability and the GDP estimates.
GDP by Industrial Activity at Constant Prices: Estimation Methods Taking the production accounts data (compiled at current prices) as the appropriate starting point for the volume estimates, the additional source data needed are either price or volume indicators. For most of Guyana’s commodity‐producing sectors, quantity and output price data are available, though of varying degrees of comprehensiveness. The CPI (1994=100) covers the majority of household goods and services, and sub‐indices for specific goods or services are applied for the volume estimates where appropriate. For electricity, water, transport, communication and information, a range of physical quantity indicators are available. Guyana does not compile a producer price index (PPI).
The main recommendation of the 1993 SNA for deriving volume measures is to apply the double deflation method, where value added is obtained as the difference between deflated output and deflated intermediate consumption; the implicit price change of value added derived in this way will by definition always be unaffected by the changes of output and input prices (see Box 3). While aggregate data for output and intermediate consumption are available for most economic activities, the absence of detailed intermediation consumption components, and the lack of data on input prices preclude the use of double deflation in Guyana’s constant price value added estimates. Accordingly, the single indicator method, applied as a direct calculation of the volume of value added from the current price value added either using price deflation or quantity extrapolation (extrapolation of base year value added by a volume index of gross output) is applied. Regarding the use of price indicators in single indicator methods, the IMF’s Data Quality Assessment Framework (DQAF) for National Accounts recommends the procedure of using the price index to deflate output to obtain a volume index for extrapolating base‐year value added. This procedure is followed in the few cases where, in the absence of a direct volume measure, the volume index is calculated indirectly by deflating gross output at current prices by the appropriate price index.
- 25 -
The procedures used in determ
Double deflation is thedeflating both gross ousubtracting the latter fintermediate consumpt constant prices. Howaprice indicators for bot The alternative to doubdeflate GDP at current industries where the reintermediate consump sensitive to errors in otends to be the most frvalue added to gross oThis assumption might in the long run, hence pconstant price estimate
Agriculture, Fishing and Forest Sugar cane A quantity index based on suga
Rice Paddy A quantity index based on rice p
Other Crops, Livestock, and Fis A composite volume index (val2006 prices) is used to extrapooutput data was augmented w(adjusted to exclude GUYSUCOoutput, imports of broilers. Forestry A composite volume index (va2006 prices) is used to extrapol
Box 3:What is Double Deflation?
process of estimating value added at constant prices by tput and intermediate consumption separately and then rom the former. This means estimating both gross output and tion at constant prices, and taking the difference to yield GDP ever, its application requires detailed data of good quality on h gross output and intermediate inputs.
le deflation is the use of a single indicator to extrapolate or prices. Although single indicators are generally unsuitable in lationship between value added, gross output and tion vary significantly from one year to the other, they are lessther industries and hence extensively used. This approach equently used and is based on the assumption that the ratio of utput in current prices remains unchanged at constant prices. hold in the short run but becomes progressively less relevanteriodic rebasing – in practice every five to ten years ‐ of the s is recommended.
ining the volume estimates are as follows.
ry
r production is used to extrapolate the base year value added.
addy production is used to extrapolate the base year value added.
hing
uing the respective outputs by detailed product types using their respective late the base year value added for each sub‐industry separately. Available ith other indicators, including ‐ for other crops - data on fertilizer imports imports as well an estimate for use in rice paddy farming); and for poultry
luing the current year outputs by detailed product types at their respective ate the base year value added.

- 26 -
Mining For bauxite, a composite volume index (valuing the current year outputs by detailed product types at their respective 2006 prices) is used to extrapolate the base year value added. For gold, diamonds, and quarry products (sand and stone), base year value added is also extrapolated by the respective volume indices. Manufacturing For both sugar and rice, quantity indices based on rice and sugar production are used to extrapolate the base year value added. For other manufacturing, base year value added is derived from the 2006 SUT which provides calculations for the following product categories: food, beverage, clothing, footwear, and other manufacturing (with breakdowns for paper and paper products; chemicals and chemical products; pharmaceuticals; rubber and plastic products; wood products; and other. Volume indices for these product categories are then used to extrapolate the base year value added. Electricity, Water and Sewerage and Waste Management Volume indices of electricity generation and water consumption are used to extrapolate base year value added of the respective sub‐industries. Volume measures of waste collected will be accessed for waste management.
Construction
The absence of a comprehensive building materials price index impacted on efforts to implement sound deflation techniques in deriving volume estimates for construction. The BoS examined price trends for sand, stone, cement, lumber and other building materials. Price variability was noted for some products, often reflecting temporary supply shortages, but on an annual basis, these trends tended to smooth out. Given that there was no sound basis for weighting these price observations, and since the output of the construction industry is not a homogeneous product and the mix or composition of input materials would vary based on the size and type of construction, the BoS uses the overall CPI as a basis for deflating the current value of gross output to derive an implicit volume index for construction.
Wholesale and Retail Trade
For imported goods, the volume measures for WRT were derived by deflating the value of these imports by an appropriate price deflator, as follows:
• for consumer goods, the Guyana CPI was used;
• for intermediate goods (which comprises largely of fuel and lubricants), the value of imports was deflated by an energy price index (crude oil) compiled by the IMF (Average Petroleum Spot Price {APSP}),which is the average of U.K. Brent, Dubai, and West Texas Intermediate, equally weighted); 11
• for capital goods, the sub index of the Guyana CPI that covers building materials (CPI sub index 401‐rent and maintenance) was used as a proxy.
11 See http://www.imf.org/external/np/res/commod/index.asp
- 27 -
For domestically produced goods, the volume measures were derived by deflating the value of these products by the Guyana CPI. A future improvement would be to use the implicit deflators derived from the output at constant prices, or the output of goods at constant prices directly. Transport Base year value added (at seven sub‐sector levels) was extrapolated using related volume indicators (lorry, minibus and taxi registration, air passenger and air cargo volumes, ferry passengers and speed boat registration).
Information and Communication
Base year value added (at sub‐sector levels) was extrapolated using related volume indicators derived either by price deflation of gross output (ISPs and TV programming), or by direct volume measures (estimated newspaper circulation, number of land access telephone lines/cell phone subscribers, inbound and outbound calls).
Financial and Insurance Services
To calculate financial services at constant prices, the average stock of loans and deposits is deflated by the CPI to derive a volume index of loans and deposits. FISIM at constant prices was also calculated using this method, with the further step of having the deflated values (of loans and deposits) applied to the base year bank rate, small savings rate and prime lending rate to derive FISIM on loans and deposits.
The main limitation of this estimate is that there is no separate volume measurement for insurance services. Data on insurance services are limited, with information on number and value of new, active and terminated policies (by different categories) unavailable.
Public Administration
A weighted volume index is created by applying each year’s employment size (number of employees in the public service) to the detailed base year (2006) data on wages. The volume index is then used to extrapolate the 2006 current price value added. The volume index is then used to extrapolate the base year value added.
By applying the central government volume index to extrapolate the entire public administration, it is assumed that employment in NIS and municipalities exhibit identical growth trends. A more robust method is to construct volume indices for NIS and municipalities separately along the lines of that created for central government, and use same to extrapolate the base year value added. This would yield constant price series for each element (Central Government, NIS and municipalities) and is an area for further refinement.
Education Education activities consist of both private and public entities. With the growth in private education during the period under review, the absence of reliable data on enrollment in private schools impacts the reliability of the volume estimates. This is expected to be addressed by the forthcoming Education Act which would make more information available. For public education, an input indicator based on employment of teachers (weighted by wage bands) was used to extrapolate the base year value added.
- 28 -
Health and Social Work Health and social work consist of both private and public entities. For public entities (including GHPC), the weighted wage index is used to deflate the current price estimate as is the case with public administration and defense. For private entities, base year estimates of value added (derived from the NES) are extrapolated using a volume index based on the numbers of nurses and doctors. Room for future improvement includes efforts to access data on number of outpatients and hospital bed nights. Real Estate Activities A volume index of owner and tenant‐occupied housing is used to extrapolate base year value added.
Other Activities
Other activities cover hotels and restaurants; professional services; arts, entertainment and recreational services; and a number of other services, including beauty salons, security services and funeral homes. Base year value added estimates are derived from the NES and administrative data.
However, volume estimates for this sector remains continuous work in progress, as collection of appropriate indicators for some activities is not yet established. For hotels and restaurants, the base year value added is extrapolated using a volume index of tourist arrivals. For other product groups, the gross turnover of firms is deflated by the CPI (or relevant CPI sub index, as applicable) to determine a volume growth (of gross output) that is assumed to be representative of that product group, and used to extrapolate the base year value added.
- 29 -
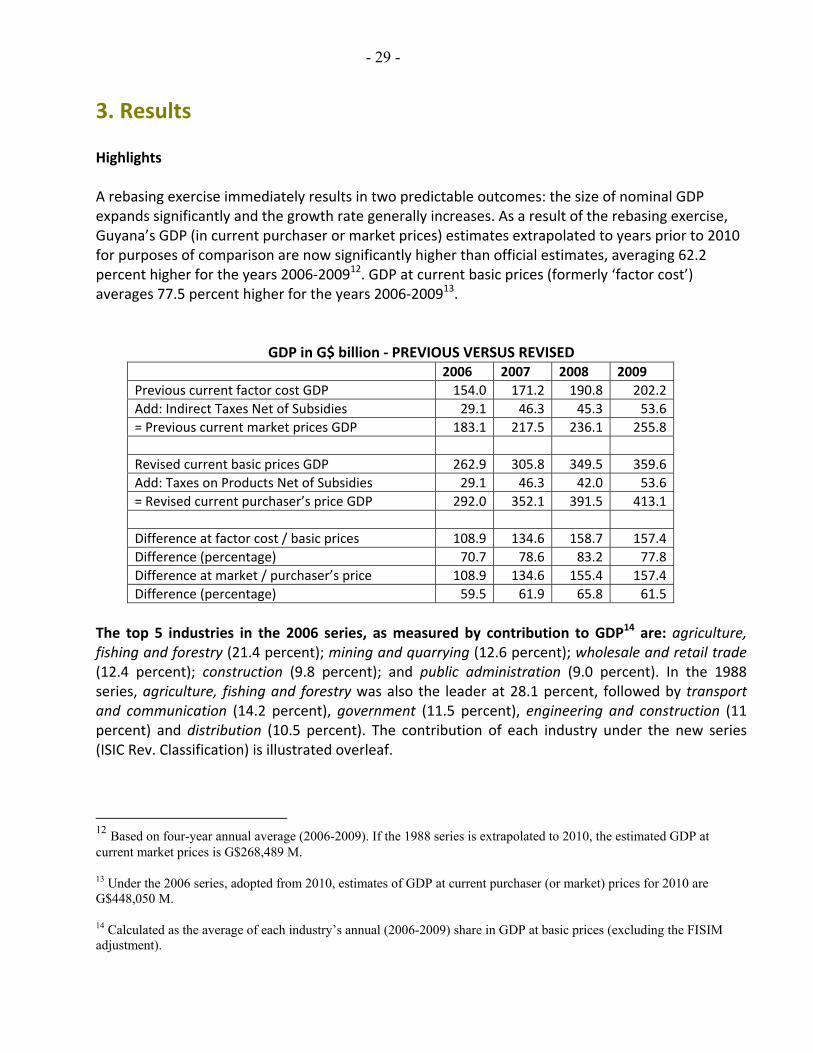
3. Results Highlights A rebasing exercise immediately results in two predictable outcomes: the size of nominal GDP expands significantly and the growth rate generally increases. As a result of the rebasing exercise, Guyana’s GDP (in current purchaser or market prices) estimates extrapolated to years prior to 2010 for purposes of comparison are now significantly higher than official estimates, averaging 62.2 percent higher for the years 2006‐200912. GDP at current basic prices (formerly ‘factor cost’) averages 77.5 percent higher for the years 2006‐200913.
GDP in G$ billion ‐ PREVIOUS VERSUS REVISED 2006 2007 2008 2009 Previous current factor cost GDP 154.0 171.2 190.8 202.2Add: Indirect Taxes Net of Subsidies 29.1 46.3 45.3 53.6= Previous current market prices GDP 183.1 217.5 236.1 255.8 Revised current basic prices GDP 262.9 305.8 349.5 359.6Add: Taxes on Products Net of Subsidies 29.1 46.3 42.0 53.6= Revised current purchaser’s price GDP 292.0 352.1 391.5 413.1 Difference at factor cost / basic prices 108.9 134.6 158.7 157.4Difference (percentage) 70.7 78.6 83.2 77.8Difference at market / purchaser’s price 108.9 134.6 155.4 157.4Difference (percentage) 59.5 61.9 65.8 61.5
The top 5 industries in the 2006 series, as measured by contribution to GDP14 are: agriculture, fishing and forestry (21.4 percent); mining and quarrying (12.6 percent); wholesale and retail trade (12.4 percent); construction (9.8 percent); and public administration (9.0 percent). In the 1988 series, agriculture, fishing and forestry was also the leader at 28.1 percent, followed by transport and communication (14.2 percent), government (11.5 percent), engineering and construction (11 percent) and distribution (10.5 percent). The contribution of each industry under the new series (ISIC Rev. Classification) is illustrated overleaf.
12 Based on four-year annual average (2006-2009). If the 1988 series is extrapolated to 2010, the estimated GDP at current market prices is G$268,489 M.
13 Under the 2006 series, adopted from 2010, estimates of GDP at current purchaser (or market) prices for 2010 are G$448,050 M.
14 Calculated as the average of each industry’s annual (2006-2009) share in GDP at basic prices (excluding the FISIM adjustment).
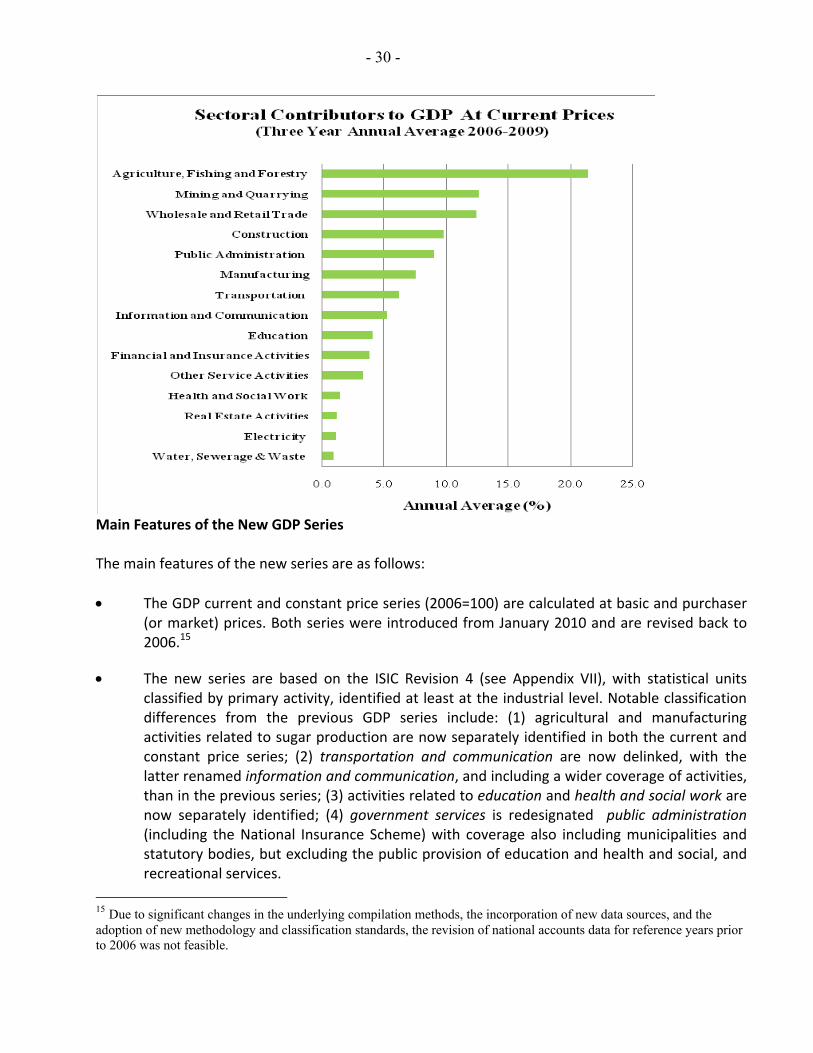
- 30 -
Main Features of the New GDP Series The main features of the new series are as follows: • The GDP current and constant price series (2006=100) are calculated at basic and purchaser
(or market) prices. Both series were introduced from January 2010 and are revised back to 2006.15
• The new series are based on the ISIC Revision 4 (see Appendix VII), with statistical units classified by primary activity, identified at least at the industrial level. Notable classification differences from the previous GDP series include: (1) agricultural and manufacturing activities related to sugar production are now separately identified in both the current and constant price series; (2) transportation and communication are now delinked, with the latter renamed information and communication, and including a wider coverage of activities, than in the previous series; (3) activities related to education and health and social work are now separately identified; (4) government services is redesignated public administration (including the National Insurance Scheme) with coverage also including municipalities and statutory bodies, but excluding the public provision of education and health and social, and recreational services.
15 Due to significant changes in the underlying compilation methods, the incorporation of new data sources, and the adoption of new methodology and classification standards, the revision of national accounts data for reference years prior to 2006 was not feasible.
- 31 -
• An estimate for financial intermediation services indirectly measured (FISIM) is introduced but not allocated across sectors.
• With the development of production accounts for most industries, estimates of gross output and intermediate consumption are available.
• Updated terminology has been adopted in the move from SNA 1968 to SNA 1993: national accounts now calls a group of companies engaged in similar activities an “industry” instead of “sector”; indirect taxes are now referred to as taxes on products; the term “market prices” has been replaced by “at purchaser prices”; the term “factor cost” has been replaced by “basic prices”.
- 32 -
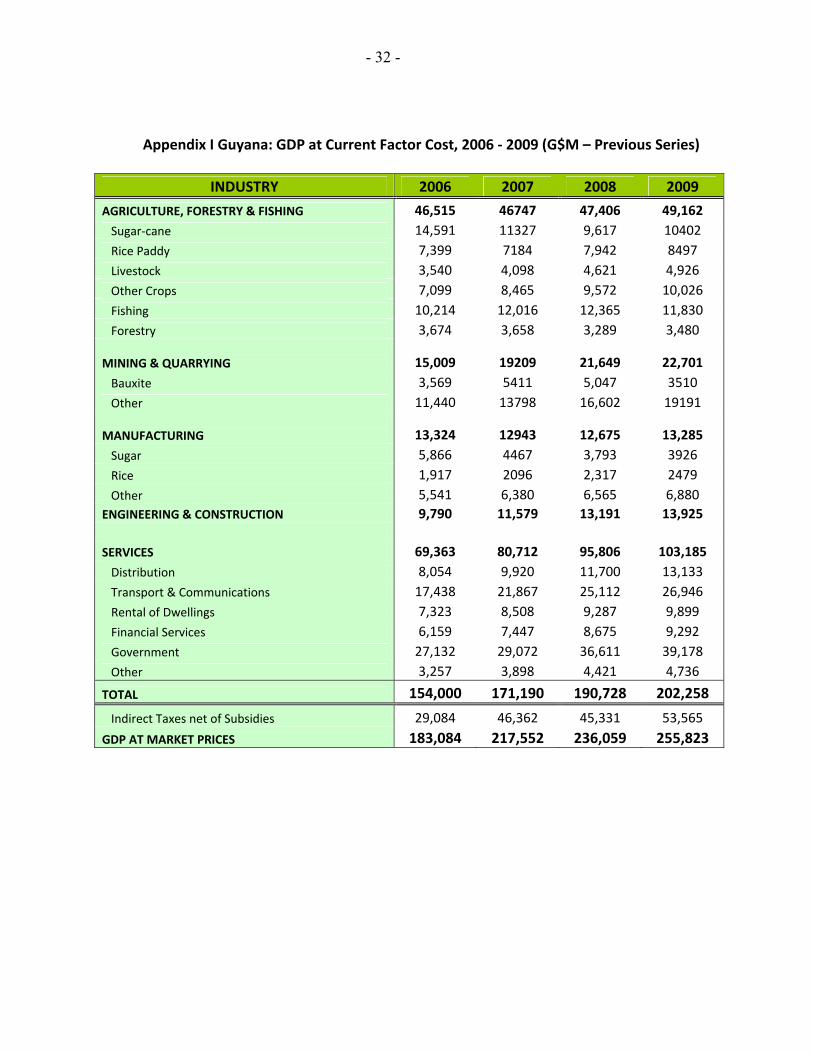
Appendix I Guyana: GDP at Current Factor Cost, 2006 ‐ 2009 (G$M – Previous Series)
INDUSTRY 2006 2007 2008 2009
AGRICULTURE, FORESTRY & FISHING 46,515 46747 47,406 49,162 Sugar‐cane 14,591 11327 9,617 10402 Rice Paddy 7,399 7184 7,942 8497 Livestock 3,540 4,098 4,621 4,926 Other Crops 7,099 8,465 9,572 10,026 Fishing 10,214 12,016 12,365 11,830 Forestry 3,674 3,658 3,289 3,480 MINING & QUARRYING 15,009 19209 21,649 22,701 Bauxite 3,569 5411 5,047 3510 Other 11,440 13798 16,602 19191 MANUFACTURING 13,324 12943 12,675 13,285 Sugar 5,866 4467 3,793 3926 Rice 1,917 2096 2,317 2479 Other 5,541 6,380 6,565 6,880 ENGINEERING & CONSTRUCTION 9,790 11,579 13,191 13,925 SERVICES 69,363 80,712 95,806 103,185 Distribution 8,054 9,920 11,700 13,133 Transport & Communications 17,438 21,867 25,112 26,946 Rental of Dwellings 7,323 8,508 9,287 9,899 Financial Services 6,159 7,447 8,675 9,292 Government 27,132 29,072 36,611 39,178 Other 3,257 3,898 4,421 4,736
TOTAL 154,000 171,190 190,728 202,258
Indirect Taxes net of Subsidies 29,084 46,362 45,331 53,565
GDP AT MARKET PRICES 183,084 217,552 236,059 255,823
- 33 -
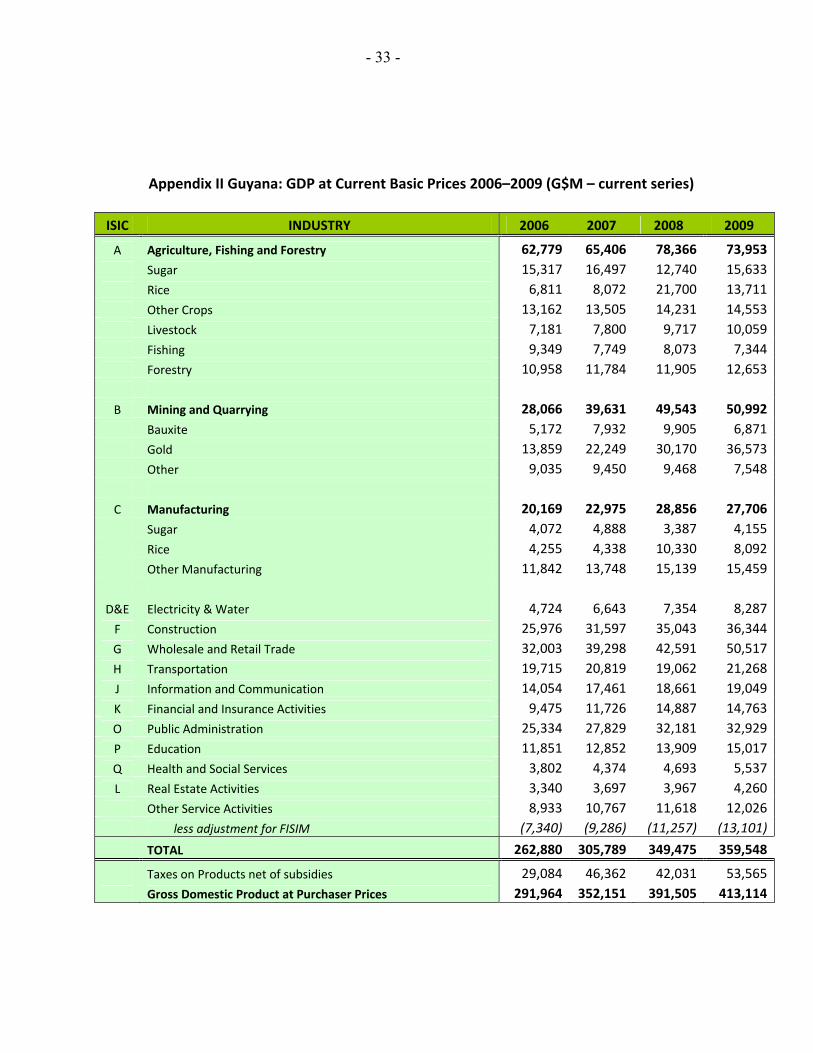
Appendix II Guyana: GDP at Current Basic Prices 2006–2009 (G$M – current series)
ISIC INDUSTRY 2006 2007 2008 2009
A Agriculture, Fishing and Forestry 62,779 65,406 78,366 73,953 Sugar 15,317 16,497 12,740 15,633 Rice 6,811 8,072 21,700 13,711 Other Crops 13,162 13,505 14,231 14,553 Livestock 7,181 7,800 9,717 10,059 Fishing 9,349 7,749 8,073 7,344 Forestry 10,958 11,784 11,905 12,653 B Mining and Quarrying 28,066 39,631 49,543 50,992 Bauxite 5,172 7,932 9,905 6,871 Gold 13,859 22,249 30,170 36,573 Other 9,035 9,450 9,468 7,548 C Manufacturing 20,169 22,975 28,856 27,706 Sugar 4,072 4,888 3,387 4,155 Rice 4,255 4,338 10,330 8,092 Other Manufacturing 11,842 13,748 15,139 15,459
D&E Electricity & Water 4,724 6,643 7,354 8,287F Construction 25,976 31,597 35,043 36,344G Wholesale and Retail Trade 32,003 39,298 42,591 50,517H Transportation 19,715 20,819 19,062 21,268J Information and Communication 14,054 17,461 18,661 19,049K Financial and Insurance Activities 9,475 11,726 14,887 14,763O Public Administration 25,334 27,829 32,181 32,929P Education 11,851 12,852 13,909 15,017Q Health and Social Services 3,802 4,374 4,693 5,537L Real Estate Activities 3,340 3,697 3,967 4,260 Other Service Activities 8,933 10,767 11,618 12,026 less adjustment for FISIM (7,340) (9,286) (11,257) (13,101)
TOTAL 262,880 305,789 349,475 359,548
Taxes on Products net of subsidies 29,084 46,362 42,031 53,565 Gross Domestic Product at Purchaser Prices 291,964 352,151 391,505 413,114
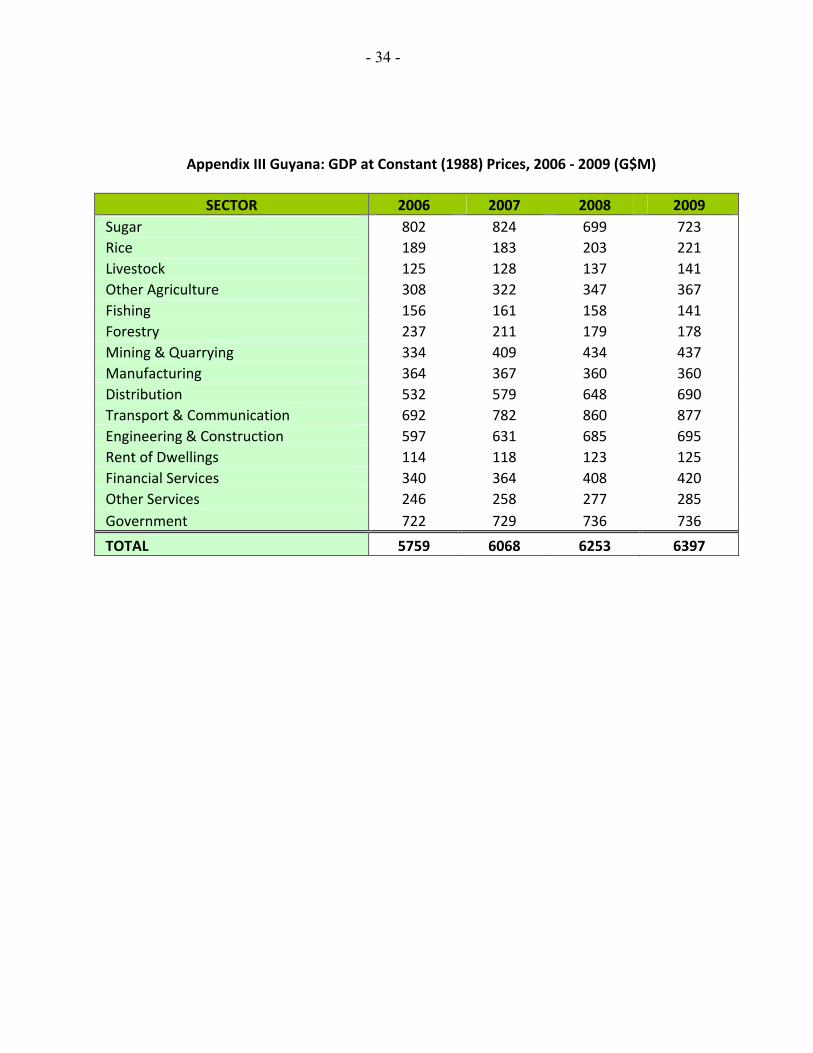
- 34 -
Appendix III Guyana: GDP at Constant (1988) Prices, 2006 ‐ 2009 (G$M)
SECTOR 2006 2007 2008 2009 Sugar 802 824 699 723 Rice 189 183 203 221 Livestock 125 128 137 141 Other Agriculture 308 322 347 367 Fishing 156 161 158 141 Forestry 237 211 179 178 Mining & Quarrying 334 409 434 437 Manufacturing 364 367 360 360 Distribution 532 579 648 690 Transport & Communication 692 782 860 877 Engineering & Construction 597 631 685 695 Rent of Dwellings 114 118 123 125 Financial Services 340 364 408 420 Other Services 246 258 277 285 Government 722 729 736 736
TOTAL 5759 6068 6253 6397
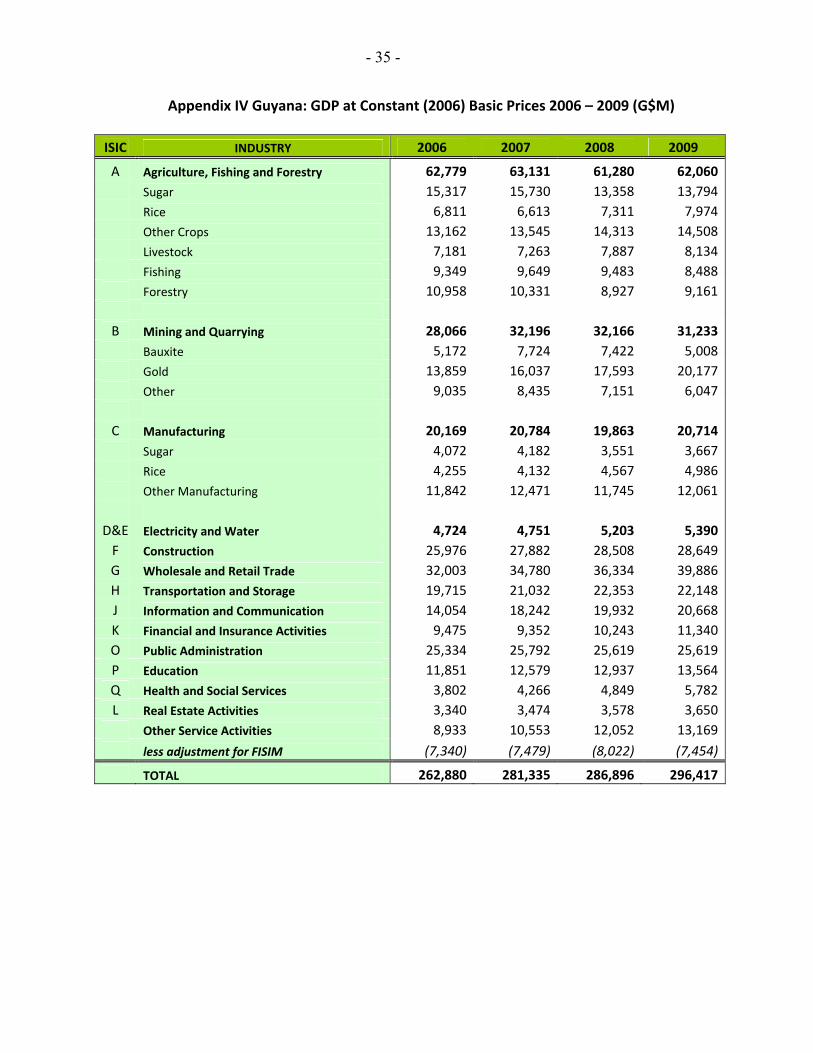
- 35 -
Appendix IV Guyana: GDP at Constant (2006) Basic Prices 2006 – 2009 (G$M)
ISIC INDUSTRY 2006 2007 2008 2009
A Agriculture, Fishing and Forestry 62,779 63,131 61,280 62,060 Sugar 15,317 15,730 13,358 13,794 Rice 6,811 6,613 7,311 7,974 Other Crops 13,162 13,545 14,313 14,508 Livestock 7,181 7,263 7,887 8,134 Fishing 9,349 9,649 9,483 8,488 Forestry 10,958 10,331 8,927 9,161 B Mining and Quarrying 28,066 32,196 32,166 31,233 Bauxite 5,172 7,724 7,422 5,008 Gold 13,859 16,037 17,593 20,177 Other 9,035 8,435 7,151 6,047 C Manufacturing 20,169 20,784 19,863 20,714 Sugar 4,072 4,182 3,551 3,667 Rice 4,255 4,132 4,567 4,986 Other Manufacturing 11,842 12,471 11,745 12,061
D&E Electricity and Water 4,724 4,751 5,203 5,390F Construction 25,976 27,882 28,508 28,649G Wholesale and Retail Trade 32,003 34,780 36,334 39,886H Transportation and Storage 19,715 21,032 22,353 22,148J Information and Communication 14,054 18,242 19,932 20,668K Financial and Insurance Activities 9,475 9,352 10,243 11,340O Public Administration 25,334 25,792 25,619 25,619P Education 11,851 12,579 12,937 13,564Q Health and Social Services 3,802 4,266 4,849 5,782L Real Estate Activities 3,340 3,474 3,578 3,650 Other Service Activities 8,933 10,553 12,052 13,169
less adjustment for FISIM (7,340) (7,479) (8,022) (7,454)
TOTAL 262,880 281,335 286,896 296,417
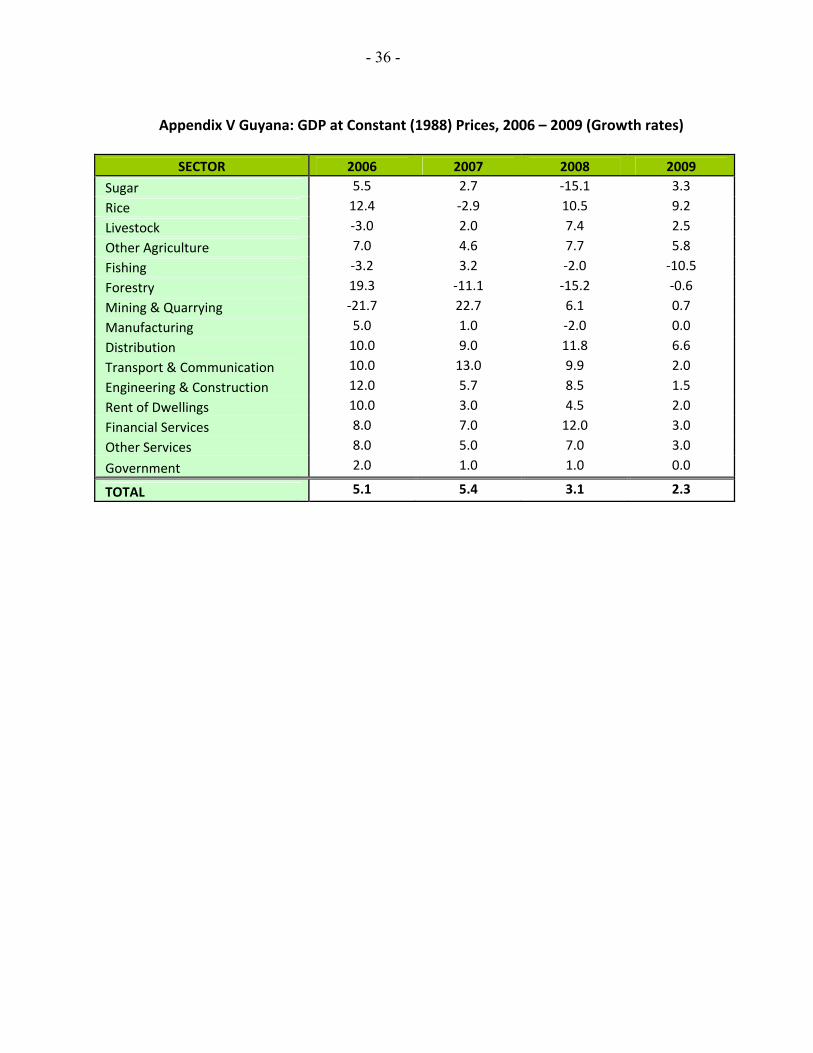
- 36 -
Appendix V Guyana: GDP at Constant (1988) Prices, 2006 – 2009 (Growth rates)
SECTOR 2006 2007 2008 2009
Sugar 5.5 2.7 ‐15.1 3.3
Rice 12.4 ‐2.9 10.5 9.2
Livestock ‐3.0 2.0 7.4 2.5
Other Agriculture 7.0 4.6 7.7 5.8
Fishing ‐3.2 3.2 ‐2.0 ‐10.5
Forestry 19.3 ‐11.1 ‐15.2 ‐0.6
Mining & Quarrying ‐21.7 22.7 6.1 0.7
Manufacturing 5.0 1.0 ‐2.0 0.0
Distribution 10.0 9.0 11.8 6.6
Transport & Communication 10.0 13.0 9.9 2.0
Engineering & Construction 12.0 5.7 8.5 1.5
Rent of Dwellings 10.0 3.0 4.5 2.0
Financial Services 8.0 7.0 12.0 3.0
Other Services 8.0 5.0 7.0 3.0
Government 2.0 1.0 1.0 0.0
TOTAL 5.1 5.4 3.1 2.3
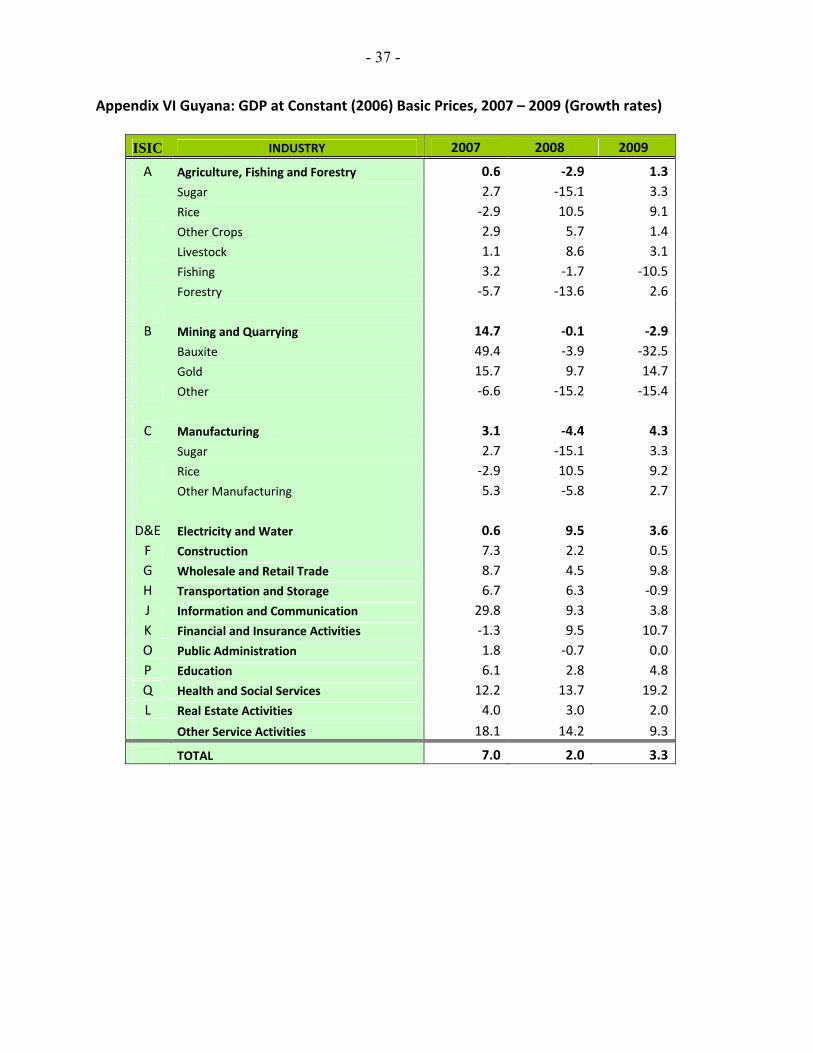
- 37 -
Appendix VI Guyana: GDP at Constant (2006) Basic Prices, 2007 – 2009 (Growth rates)
ISIC INDUSTRY 2007 2008 2009
A Agriculture, Fishing and Forestry 0.6 ‐2.9 1.3 Sugar 2.7 ‐15.1 3.3 Rice ‐2.9 10.5 9.1 Other Crops 2.9 5.7 1.4 Livestock 1.1 8.6 3.1 Fishing 3.2 ‐1.7 ‐10.5 Forestry ‐5.7 ‐13.6 2.6 B Mining and Quarrying 14.7 ‐0.1 ‐2.9 Bauxite 49.4 ‐3.9 ‐32.5 Gold 15.7 9.7 14.7 Other ‐6.6 ‐15.2 ‐15.4 C Manufacturing 3.1 ‐4.4 4.3 Sugar 2.7 ‐15.1 3.3 Rice ‐2.9 10.5 9.2 Other Manufacturing 5.3 ‐5.8 2.7
D&E Electricity and Water 0.6 9.5 3.6F Construction 7.3 2.2 0.5G Wholesale and Retail Trade 8.7 4.5 9.8H Transportation and Storage 6.7 6.3 ‐0.9J Information and Communication 29.8 9.3 3.8K Financial and Insurance Activities ‐1.3 9.5 10.7O Public Administration 1.8 ‐0.7 0.0P Education 6.1 2.8 4.8Q Health and Social Services 12.2 13.7 19.2L Real Estate Activities 4.0 3.0 2.0
Other Service Activities 18.1 14.2 9.3
TOTAL 7.0 2.0 3.3
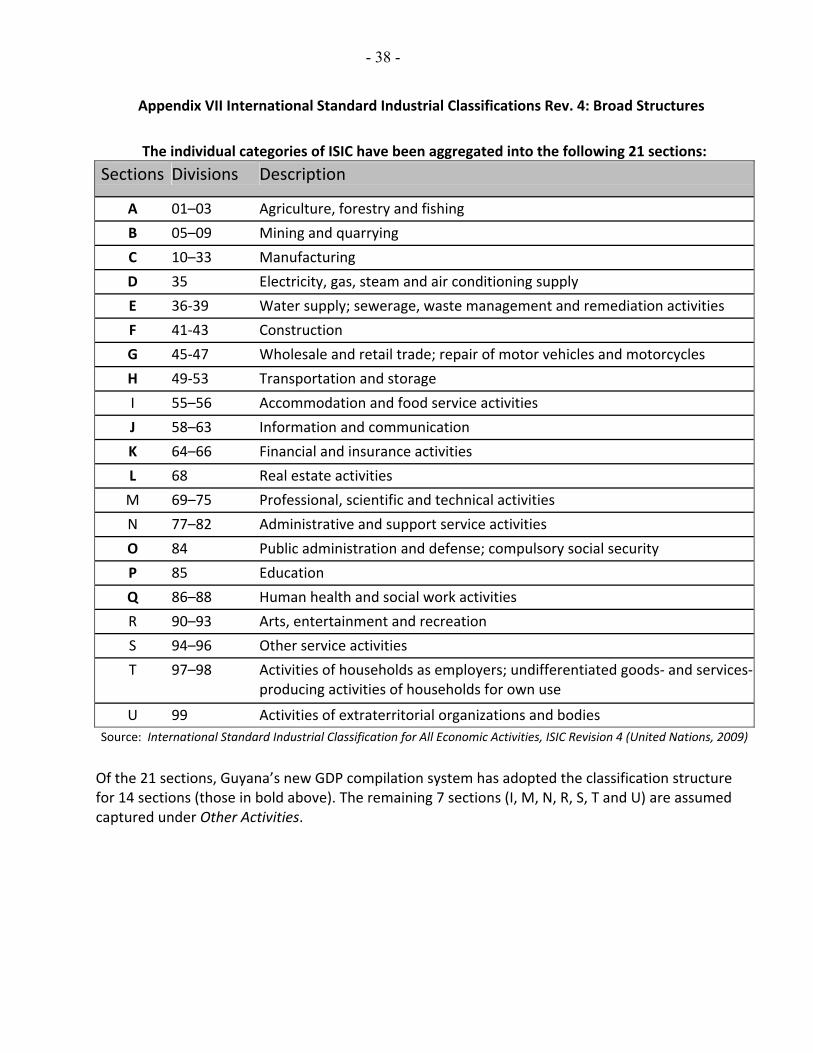
- 38 -
Appendix VII International Standard Industrial Classifications Rev. 4: Broad Structures
The individual categories of ISIC have been aggregated into the following 21 sections:
Sections Divisions Description
A 01–03 Agriculture, forestry and fishing
B 05–09 Mining and quarrying
C 10–33 Manufacturing
D 35 Electricity, gas, steam and air conditioning supply
E 36‐39 Water supply; sewerage, waste management and remediation activities
F 41‐43 Construction
G 45‐47 Wholesale and retail trade; repair of motor vehicles and motorcycles
H 49‐53 Transportation and storage
I 55–56 Accommodation and food service activities
J 58–63 Information and communication
K 64–66 Financial and insurance activities
L 68 Real estate activities
M 69–75 Professional, scientific and technical activities
N 77–82 Administrative and support service activities
O 84 Public administration and defense; compulsory social security
P 85 Education
Q 86–88 Human health and social work activities
R 90–93 Arts, entertainment and recreation
S 94–96 Other service activities
T 97–98 Activities of households as employers; undifferentiated goods‐ and services‐producing activities of households for own use
U 99 Activities of extraterritorial organizations and bodies Source: International Standard Industrial Classification for All Economic Activities, ISIC Revision 4 (United Nations, 2009)
Of the 21 sections, Guyana’s new GDP compilation system has adopted the classification structure for 14 sections (those in bold above). The remaining 7 sections (I, M, N, R, S, T and U) are assumed captured under Other Activities.
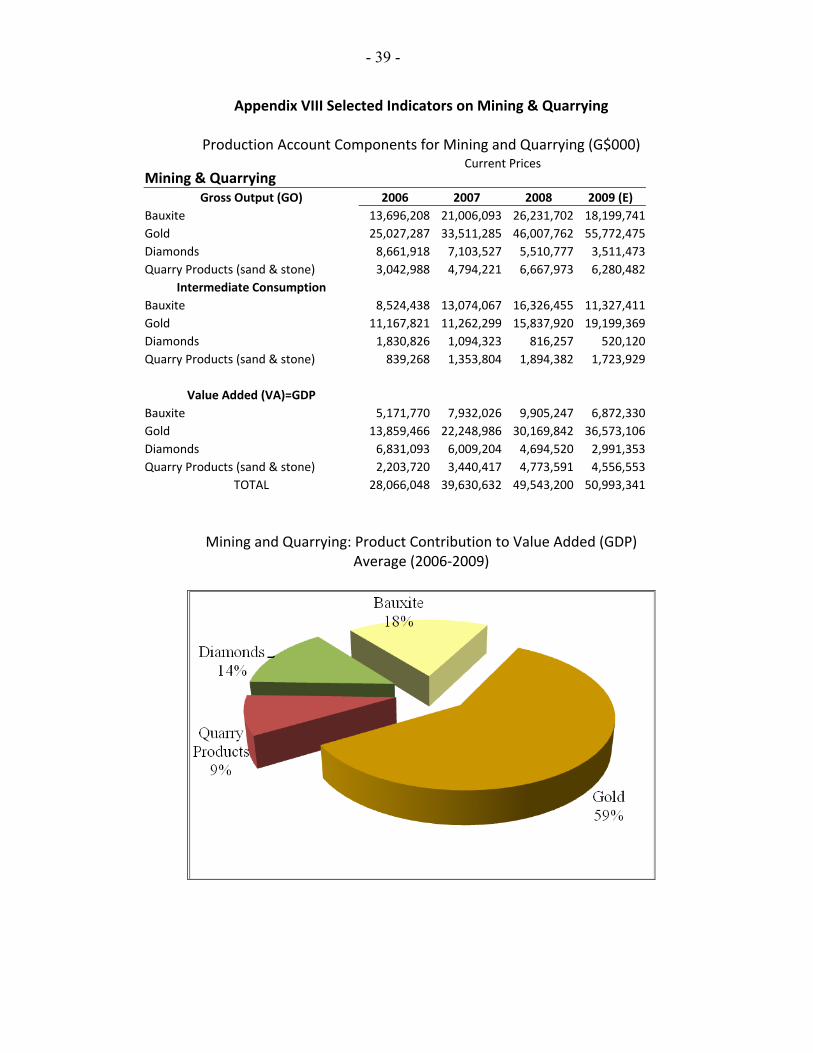
- 39 -
Appendix VIII Selected Indicators on Mining & Quarrying
Production Account Components for Mining and Quarrying (G$000)
Mining & Quarrying Current Prices
Gross Output (GO) 2006 2007 2008 2009 (E)
Bauxite 13,696,208 21,006,093 26,231,702 18,199,741 Gold 25,027,287 33,511,285 46,007,762 55,772,475 Diamonds 8,661,918 7,103,527 5,510,777 3,511,473 Quarry Products (sand & stone) 3,042,988 4,794,221 6,667,973 6,280,482
Intermediate Consumption Bauxite 8,524,438 13,074,067 16,326,455 11,327,411 Gold 11,167,821 11,262,299 15,837,920 19,199,369 Diamonds 1,830,826 1,094,323 816,257 520,120 Quarry Products (sand & stone) 839,268 1,353,804 1,894,382 1,723,929
Value Added (VA)=GDP Bauxite 5,171,770 7,932,026 9,905,247 6,872,330 Gold 13,859,466 22,248,986 30,169,842 36,573,106 Diamonds 6,831,093 6,009,204 4,694,520 2,991,353 Quarry Products (sand & stone) 2,203,720 3,440,417 4,773,591 4,556,553
TOTAL 28,066,048 39,630,632 49,543,200 50,993,341
Mining and Quarrying: Product Contribution to Value Added (GDP) Average (2006‐2009)
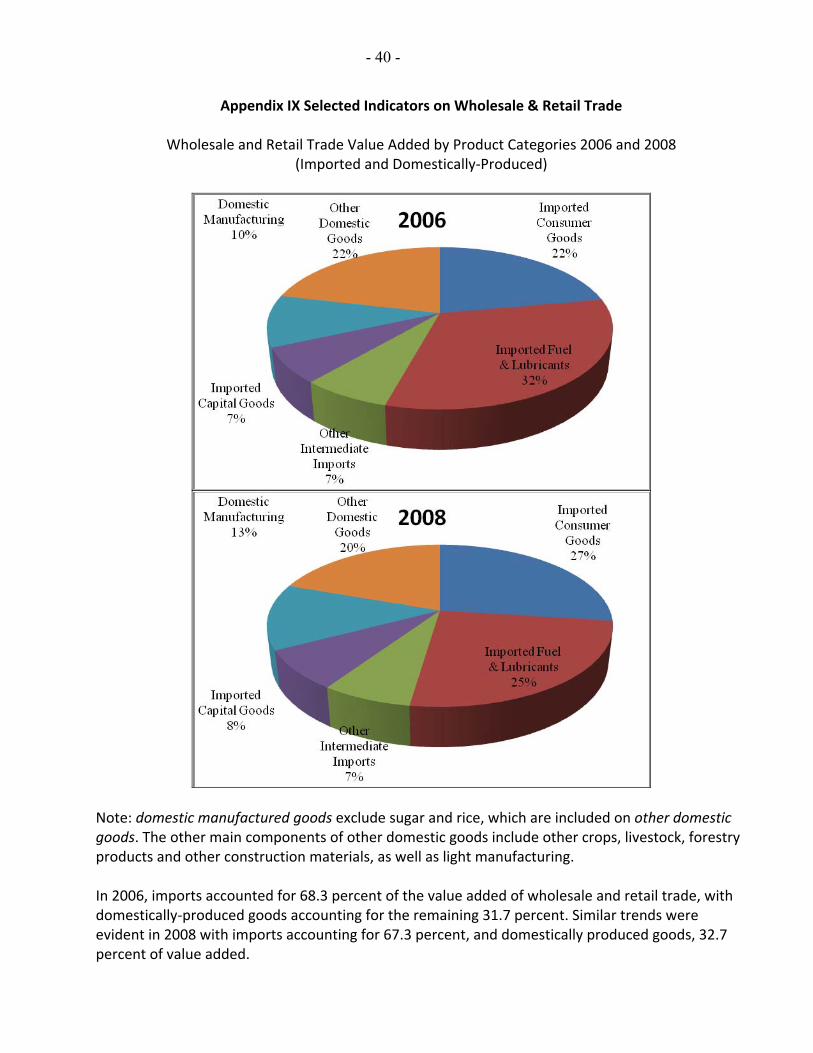
- 40 -
Appendix IX Selected Indicators on Wholesale & Retail Trade
Wholesale and Retail Trade Value Added by Product Categories 2006 and 2008 (Imported and Domestically‐Produced)
Note: domestic manufactured goods exclude sugar and rice, which are included on other domestic goods. The other main components of other domestic goods include other crops, livestock, forestry products and other construction materials, as well as light manufacturing. In 2006, imports accounted for 68.3 percent of the value added of wholesale and retail trade, with domestically‐produced goods accounting for the remaining 31.7 percent. Similar trends were evident in 2008 with imports accounting for 67.3 percent, and domestically produced goods, 32.7 percent of value added.