Embed Size (px)
Citation preview

Gypsum boards from waste material: a cost effective process
Utility: Hot air
Substance: Gypsum
Dina Boer S2206897 Chemical Engineering 07-07-2015 Bachelor Assignment Chemical Engineering Course: CHBOST-09

Page 2 of 54
Table of content
Summary ................................................................................................................................................. 4
Chapter 1: Introduction ........................................................................................................................... 5
List of abbreviations ............................................................................................................................ 5
Research question ............................................................................................................................... 6
Introduction ......................................................................................................................................... 6
Chapter 2: Process and technology ......................................................................................................... 7
Process description ............................................................................................................................. 7
Technology: Calcination ...................................................................................................................... 9
Chemistry .......................................................................................................................................... 12
Block diagrams .................................................................................................................................. 13
PFD .................................................................................................................................................... 15
Chapter 3: Utility and specification ....................................................................................................... 17
Explanation utility .............................................................................................................................. 17
Utility requirements .......................................................................................................................... 18
Specification OSBL ............................................................................................................................. 18
Pinch .................................................................................................................................................. 19
Chapter 4: Mass and Energy balance .................................................................................................... 21
Process control and P&ID .................................................................................................................. 21
HAZOP ............................................................................................................................................... 22
Aspen drawing ................................................................................................................................... 23
Stream summary ............................................................................................................................... 25
Chapter 5: Equipment list and estimation costs ................................................................................... 27
Specification ISBL and OSBL .............................................................................................................. 27
Equipment list and vendor information ............................................................................................ 27
Capital costs7 ..................................................................................................................................... 31
Costs .................................................................................................................................................. 32
Appendix 1: Literature ........................................................................................................................... 35
Appendix 2: Substances and specifications ........................................................................................... 37
Appendix 3: Pre-aspen assignment: Classifier ...................................................................................... 38
Content .............................................................................................................................................. 39
The classifier ...................................................................................................................................... 40
Separation and selection functions ................................................................................................... 41

Page 3 of 54
Aspen Manual .................................................................................................................................... 44
Literature ........................................................................................................................................... 54

Page 4 of 54
Summary A new process is developed for making gypsum boards from waste gypsum material with a capacity of 5000 kg/h. For this process 95 wt% of the feed consists of waste gypsum boards, the other 5% consists of boards made in this process which did not met the requirements. The waste gypsum boards were crushed in such a way that the particle size distribution was comparable to mining and flue-gas gypsum. The gypsum boards consisted out of 9 wt% water, which was removed before the calcination step. After the calcination, the stucco was rehydrated and the slurry was put between paper to make the final gypsum boards, which had to be dried for the last time. All the heating was provided by a hot air system. This process was focused on winning back energy from this system, to make it overall more cost effective. This was done by using the hot air coming out of the calciner in the first dryer. This saves the process €446.- each day since less gas is needed to supply the devices with hot air. Looking back to the research question it is concluded that it is possible to make gypsum board from waste gypsum board is a more energy efficient process than the current process. For further research it is important to establish whether or not it is possible to produce gypsum board from 95 wt% waste gypsum board without deteriorating the material. This could be done by increasing the particle size more effectively, for example by recrystallization with seed crystals added to it. For further research it is also important that the heat loss during transportation is taken into account, because in this research it is assumed that there is no heat loss during transportation. A last option for further research is the possibility to add less water in the rehydrater which significantly reduces the amount of hot air needed to evaporate the water in the last drying step. This could be possible when adding water reducing additives.

Page 5 of 54
Chapter 1: Introduction
List of abbreviations ATO Air to open BDP Block diagram process CR Crusher D Dryer G Gas phase ISBL Inside Battery Limit K Fan L Liter L Liquid phase OBD Overall block diagram OSBL Outside Battery Limit P Pump (in PFD) P&ID Piping & Instrumentation Diagram PFD Process Flow Diagram PSD Particle Size Distribution PSV Pressure safety valve R Reactor S Screen S Solid phase t ton (metric) T Storage tank (in PFD) TIC Temperature indicator controller TSL To safe location TV Temperature Valve USGC U.S. Gulf Coast V Vessel

Page 6 of 54
Research question Is it possible to make gypsum board from waste gypsum board in a more energy efficient process
than the current process?
Introduction Gypsum board consists of hardened gypsum sandwiched between two sheets of paper. It is
extremely light and has a density of approximately 1000 kg/m3. It has several useful properties such
as fire-resistance, heat insulation and sound insulation. Therefore gypsum board is widely used for
construction all over the world. Because of this there is a very large amount of waste gypsum board
discharged each year. In Japan alone this is 1.700.000 ton/year1. Therefore it is highly desirable to
use waste gypsum boards as feed to produce new gypsum boards. For this process the feed consists
of 95 wt% waste gypsum boards and 5 wt% gypsum boards made in the process which did not met
the requirements.
The current process for making gypsum boards is not very cost efficient due to the large amount of
water that has to be evaporated. Therefore a more efficient process is developed which reduces the
amount of hot air which is used to evaporate the water.
To see the process in detail, see attached .bkp file ‘complete process Dina Boer.bkp’. To see the pre-aspen assignment in detail, see attached .bkp file ‘Classifier Dina Boer.bkp’.

Page 7 of 54
Chapter 2: Process and technology
Process description Gypsum boards are manufactured using 95 wt% waste gypsum board. The resulting 5 wt% comes from rejected gypsum boards from this process, because the boards did not met the requirements. Until now only up to 30 wt% of recycle material is used as feed for new gypsum boards2. This is because the gypsum dihydrate particles become too small during the dehydration process. When the particle size is less than 5 μm the gypsum hemihydrate can set too quickly and the quality of the product deteriorates. In order to recycle greater quantities of waste gypsum board, particle size of the gypsum dihydrate needs to be much larger. Kojima1 has done research to increase particle size and with the use of 40 μm seed crystals he was able to obtain characteristics of gypsum dihydrate from waste gypsum boards with characteristics similar to those of natural gypsum and flue-gas gypsum. Therefore it is assumed that it is possible to use 95 wt% waste gypsum boards and to still receive high quality products. The waste gypsum boards may have a maximum contamination of 2 wt% other than paper. This contamination mainly consists out of nails, screws, wood and insulation material. The waste gypsum plates, as well as the rejected plates from the process, are crushed by a hammer mill. This hammer mill has a size reduction ratio of 10:1. The reduction ratio is broadly defined as the ratio of the feed size to the product size3. We assume that the waste gypsum has a d50 of 100cm. This means that the d50 after the hammer mill is about 10 cm. The crushed material will go through a screener which will remove the contamination and which will separate the coarse from the fines. The coarse is transported back to the hammer mill. The largest form of contamination is paper, of the gypsum waste about 95 wt% turns out to be recycled gypsum powder and about 5 wt% is paper. This can be further recycled to make new paper. The fines are transported to the first dryer. Waste gypsum boards contain up to 10 wt% water, which needs to be removed at the rotating drum dryer. The dry gypsum is led to a ball mill to reduce the particle size to create a d50 of 0,1 mm. The very fine material is transported to the calciner. In the calciner gypsum dihydrate is converted to gypsum hemihydrate, which is also known as stucco. The temperature needed for this reaction is 140°C. The calciner is further explained in the next section; technology. When gypsum is converted to the hemihydrate, it will leave the reactor vessel. In this report the conversion of gypsum to hemihydrate is set as 1, but in reality this of course would not happen. If the conversion is 0.99, it would not be harmful because later on in the process the hemihydrate is converted back into gypsum. To enter the rehydrater, the material is not allowed to have a temperature above 40°C, since additives are added to the water for better product properties. Also chemical soap is added, which creates air bubbles to make the board more light-weight. In the Aspen file (see chapter 4) it can be seen that the temperature of the hemihydrate is 143°C so it is necessary to cool it down. In the Aspen file a heat exchanger is shown, in real life this is of course not possible since the hemihydrate is a solid. Therefore the solid is transported through a screw conveyer with double walls, in which cold water flows. This way the water, which needs to be added in the next step is pre-warmed and the solid is cooled. When the solid has the right temperature, it is added to the rehydrater. The amount of water that needs to be added is a 61 wt% of stucco4. This great amount of excess is needed to make a slurry, such that it can be correctly spread between the paper layers. Because the water which was needed

Page 8 of 54
in this step was already pre-warmed, as well as that the reaction is exothermic, a temperature of 85ᵒC is reached for the slurry. This is favorable because the last step of the process is to dry the gypsum board, such that all the excess water is removed. To get a better overview of this system, see the PFD later in this chapter or the Aspen drawing in chapter 4.

Page 9 of 54
Technology: Calcination The calcination is used for the dehydration of gypsum, which is the production of stucco. There are different kind of reactors possible for the calcination. The three most used processes are:
- Single-stage calcining in the MPS vertical roller mill - Single-stage calcining in the gypsum kettle - Multi-stage calcining
Gypsum kettle5
The key components of a gypsum kettle are an inlet and outlet slide, stirring device, hot air supply via the bottom of the kettle, hot air pipe system and the equipment for separate removal of flue gases and water vapours. The gypsum has to be pre-crushed before it enters the gypsum kettle. Then it enters via the inlet slide and it is heated indirectly by hot air, which can be of a temperature up to 750ᵒC. The stirring device ensures a uniform calcining process. The exhaust gases and the water vapours forming in the kettle are removed separately. The process is monitored by continuous temperature measurement. When the gypsum has reached 140ᵒC, which is the temperature required for the complete conversion of calcium dihydrate to calcium hemihydrate, the hot air generator switches to low-fire, and the finished product passes through the open outlet slide and into the buffer silo before the next batch enters the kettle. The time required for processing a batch, and hence the dwell time of the gypsum in the kettle ranges from roughly one hour to three hours, depending on the purity and the degree of pre-calcination of the feed material. The gypsum kettle has a relatively long setting time and its products are used above all as basic plaster for the production of wall plaster and as special products. The gypsum kettle has throughput rates of 0.5-12.5 t/h, and requires a feed size smaller than 2 mm6.
Figure 1: Gypsum kettle

Page 10 of 54
MPS vertical roller mill5,6
MPS vertical roller mills are widely used in grinding raw material such as gypsum. The comminution is carried out between three stationary grinding rollers and a rotating grinding table. The material is drawn in between grinding rollers and grinding track and ground by pressure and shear. The compression force required for the comminution of the material is generated by a hydropneumatic tensioning system. The material is ground and conveyed by centrifugal force towards the stationary nozzle ring, where the drying and calcining mainly takes place in a fluidized bed, through which the hot air flows directly. The hot air carries the material up to the classifier. In the separating zone a separating wheel separates the ground and dried material into fine finished product and grits. The grits fall back into the center of the grinding zone. The finished product leaves the classifier together with the gas stream and is separated in a downstream filter unit. The MPS mill has relatively short setting times and its products are used above all for the plasterboard production, the production of structural gypsum elements, and as a basic plaster for the production of wall plaster. The MPS mill has throughput rates of 1-60 t/h, requires a feed size smaller than 30 mm and will grind it to a target fineness of 0.02 – 2 mm.
Figure 2: MPS vertical roller mill

Page 11 of 54
Multi-stage calcination5
Prior to being fed into the gypsum kettle, gypsum has to be pre-crushed. At a multi-stage process this pre-crushing is done by a MPS vertical roller mill. In the kettle, the material is calcined further to form hemihydrate. The fact that this entails less heat transformation enables smaller kettle sizes to be used. If partial calcination takes place, the mill product, and hence the kettle feed material, usually still contains 10 to 15 wt% of crystal water. The dwell time of the partly calcined gypsum in the kettle in a water vapour atmosphere is still significantly longer than when the whole calcination procedure takes place within the vertical roller mill. As a consequence, the product thus obtained does not differ significantly from kettle plaster produced without partial calcination in a mill. The extra cost of gearing an MPS grinding plant to partial calcination is significantly lower than the cost saved as a result of the reduced heat transformation in the kettle. On the whole, while the quality of the product is similar, multi-stage calcination tends to be more cost-effective than carrying out the complete calcination procedure in the gypsum kettle. Multi-stage calcining has medium to long settling times and are used above all for the plasterboard production, the production of structural gypsum element, as basic plaster for the production of wall plaster and as special plaster6. Calcination in this process For this process a MPS vertical roller mill is chosen. It is has a shorter settling time, which is costs favorable. Also, in a MPS mill, heat is transmitted to the gypsum directly from the hot air in the fluidized bed. In the case of the kettle, however, the heat is introduced indirectly, via the bottom and the walls of the kettle and the pipes. This leads to a fuel consumption which is approximately 10 – 20 vol% higher than using a MPS mill5. A MPS mill alone is chosen above a multi-stage process because the dwell time is significantly shorter for the MPS mill.

Page 12 of 54
Chemistry Gypsum occurs in three forms, gypsum dihydrate, gypsum hemihydrate and gypsum anhydrate. Depending on the method of calcination of gypsum dihydrate, specific hemihydrates are distinguished: α-hemihydrate and β-hemihydrate. They appear to differ only in crystal shape. α-hemihydrate crystals are more prismatic than β-hemihydrate crystals and, when mixed with water, form a much stronger and harder structure. Because of this reason for gypsum boards β-hemihydrate is preferred. The chemistry in the process can be divided into two parts: the calcination and the rehydration. Calcination During the calcination ¾ of the chemically bonded crystal water is evaporated. This reaction is shown below.
𝐶𝑎𝑆𝑂4 ∙ 2𝐻2𝑂 → 𝐶𝑎𝑆𝑂4 ∙ 1 2⁄ 𝐻2𝑂 + 3 2⁄ 𝐻2𝑂 This reaction is endothermic (-348.5 kJ/kg22,23), which means that it will absorb energy, in the form of heat, from its surroundings. For this reaction to occur, a temperature of 140ᵒC is needed. Rehydration The rehydration reaction is the reverse of the calcination reaction. This reaction is thus as follows:
𝐶𝑎𝑆𝑂4 ∙ 1 2⁄ 𝐻2𝑂 + 3 2⁄ 𝐻2𝑂 → 𝐶𝑎𝑆𝑂4 ∙ 2𝐻2𝑂 This reaction is exothermic, which means that it will release energy in the form of heat.

Page 13 of 54
Block diagrams Two types of block diagrams are constructed. The first is an Overall Block Diagram (OBD). In the block diagram the in- and outflow of each component is shown, as well as the temperature and the pressure. To design this process, it is important to know that this process is product driven, as it was the assignment to produce 5000 kg/h Gypsum. Since the mass flow of the product is known it is possible to classify the process with respect to size:
tiny (< 1 kg/h) ~ < 100 kg/yr laboratory size
small (1 - 10 kg/h), ~ 1 - 10 tons/yr bench scale
medium (10 – 1000 kg/h) ~ 0.01 - 10 ktons/yr pilot scale
large (1000 – 10000 kg/h) ~ 10 – 100 ktons/yr large production plant With a mass flow of 5000 kg/h it is clear that the process is classified as a large production plant.
Gypsum + 9 wt% free water (S)Φ=5500 kg/h
T=12ᵒCP=1 atm
Water (L)Φ=2571 kg/h
T=12ᵒCP=1 atm
Air (G)Φ=4220 kg/h
T=295ᵒCP=1 atm
Air/Water vapour (G)Φ=7291 kg/h
of which 3465 kg/h waterT=95ᵒC
P=1 atm
Gypsum (S)Φ=5000 kg/h
T=99ᵒCP=1 atm
Figure 3: OBD for complete process
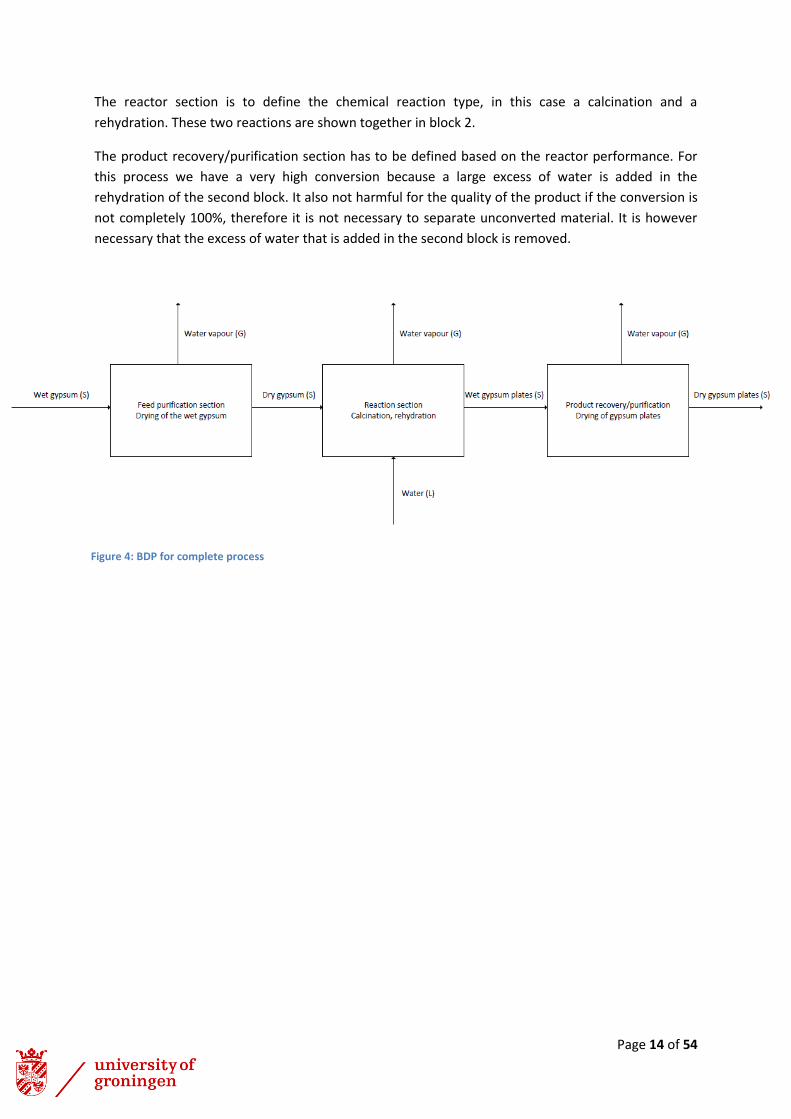
The second block diagram used is a Block Diagram Process (BDP). This diagram is used to identify the separate main functions within the process. For this process three different sections are distinguished:
- Feed purification section
- Reaction section
- Product recovery/purification
The feed purification section is needed to adjust the feed stream to the required specification
needed for the reactor conditions. In this process it means that the not chemically bound water must
be removed before the calcination can start. Therefore the drying of the wet gypsum is shown in the
first block.
Page 14 of 54
The reactor section is to define the chemical reaction type, in this case a calcination and a
rehydration. These two reactions are shown together in block 2.
The product recovery/purification section has to be defined based on the reactor performance. For
this process we have a very high conversion because a large excess of water is added in the
rehydration of the second block. It also not harmful for the quality of the product if the conversion is
not completely 100%, therefore it is not necessary to separate unconverted material. It is however
necessary that the excess of water that is added in the second block is removed.
Figure 4: BDP for complete process
Page 15 of 54
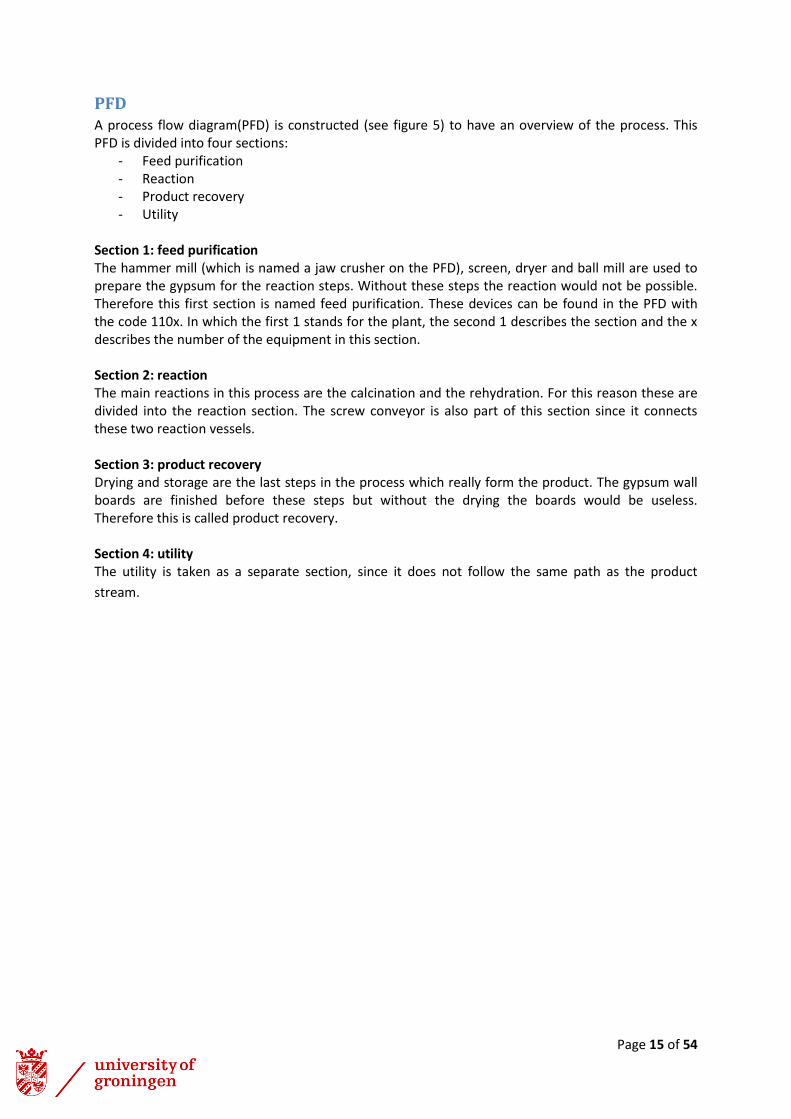
PFD A process flow diagram(PFD) is constructed (see figure 5) to have an overview of the process. This PFD is divided into four sections:
- Feed purification - Reaction - Product recovery - Utility
Section 1: feed purification The hammer mill (which is named a jaw crusher on the PFD), screen, dryer and ball mill are used to prepare the gypsum for the reaction steps. Without these steps the reaction would not be possible. Therefore this first section is named feed purification. These devices can be found in the PFD with the code 110x. In which the first 1 stands for the plant, the second 1 describes the section and the x describes the number of the equipment in this section. Section 2: reaction The main reactions in this process are the calcination and the rehydration. For this reason these are divided into the reaction section. The screw conveyor is also part of this section since it connects these two reaction vessels. Section 3: product recovery Drying and storage are the last steps in the process which really form the product. The gypsum wall boards are finished before these steps but without the drying the boards would be useless. Therefore this is called product recovery. Section 4: utility The utility is taken as a separate section, since it does not follow the same path as the product
stream.

Page 16 of 54
Figure
5: P
FD fo
r com
ple
te p
roce
ss

Page 17 of 54
Figure 6: Utility system
Chapter 3: Utility and specification
Explanation utility The utility for this system is a hot air system. The hot air system is shown below in figure 6. In this figure the hot air stream with a relative low percentage of water is shown with a bold green line. The bold purple line shows hot air streams with a significantly large amount of water vapour present. The hot air is generated by a fired heater, which uses natural gas (81.3 vol% methane and 3.5 vol% longer-chained hydrocarbons, 15.2 vol% incombustible gases, primarily nitrogen and a little carbon dioxide) as a fuel, as it is cleaner burning than fuel oil and therefore it is easier to fit NOx control systems and obtain permits. Natural gas also requires less maintenance of burners and fuel lines7. On the bottom left the a green stream comes into a mixer (1). This incoming stream consists of pre-mixed gas-air. This is done to make sure that there will be a maximal value of 7.5 mol% oxygen after combustion, for safety issues. This 7.5 mol% is taken of dry air, so the water content does not count. The incoming gas-air mixture is mixed in the mixer (1) with the recycle stream of air. This stream goes to the furnace (2). Here the natural gas will be burned to make hot air. The hot air is split (3) into two streams, of which one goes to the first dryer and the calciner and the other goes to the dryer for the plates. The first stream splits (4) again such that one part goes to the calciner (5,6), this hot air gets colder and the amount of water vapour is increased. The other stream mixes (7) with the stream coming out of the calciner. Together these streams go to the first dryer (8). The outlet of this dryer again is colder and the amount of water vapour is increased further. The outlet stream of this dryer is 91ᵒC (see the Aspen drawing in chapter 4). This is to be sure of a driving force because the dew point in the dryer is 86ᵒC. The second stream from splitter (3) goes to the dryer for the gypsum plates (9). To make sure that there is a driving force over this dryer the outlet stream has a temperature of 99ᵒC, since the dew point in the dryer is 87ᵒC. Both the outlet streams of the dryers are combined in a mixer (10). This combined stream goes to a splitter (11) to purge air with the excess of water vapour. Then the stream can be recycled and it goes back to the mixer (1) as well as the fresh gas-air mixture.

Page 18 of 54
Utility requirements The utility needs to meet some requirements. It has to be effective for drying wet gypsum, for the calcination and for drying the wet gypsum boards. It has to be recyclable. It has to be cost effective. To meet this requirements a hot air system is build using:
- Furnace: to burn natural gas to make hot air. - Splitters and mixers: to divide the streams into as much streams as necessary and to let them
combine again. - Fans: to keep the air flowing through the pipes. - Air-gas pre-mixer: to make sure that the air/gas ratio in the furnace is stable.
Specification OSBL The complete process can be divided into two parts, inside the battery limits (ISBL) and outside the battery limits (OSBL). ISBL is typically the process units and the focus of the project. OSBL consists of all connections necessary to make ISBL function: feed and product streams, utilities, waste streams, etc8. The utility system thus is part of the OSBL. To design the utility system it is important to know how much of this utility is necessary for the ISBL, which is calculated by Aspen.

Page 19 of 54
Pinch One of the goals of this research was to make the overall process more energy, and thus cost, effective in comparison to the current way of producing gypsum board. To compare the current way and the way of this research, an Aspen model is constructed for the current way. The current process is shown below in figure 7. For this process a gas-air inflow of 4750 kg/h is necessary, of which 190 kg/h natural gas and 4560 kg/h air. For the process of this research a gas-air inflow of 4220 kg/h is necessary, of which 169 kg/h gas and 4051 kg/h air (see Aspen drawing in chapter 4. This difference is because in the current process the hot air coming out of the calciner and both dryers are not re-used. In the process of this research, the hot air coming out of the calciner is used for partly heating the first dryer, thus less hot air is needed in the system. The difference between the regular and the new process is thus 21 kg/h natural gas, which is 29.5 m3/h at P = 1 bar, T = 12ᵒC. The gas price in The Netherlands at 11 February 2015 was €0.63/m3 gas. This means that if the plant is on stream 24h/day, this will safe €446.- each day.
Figure 7: Gypsum board process without energy recovery
Page 20 of 54
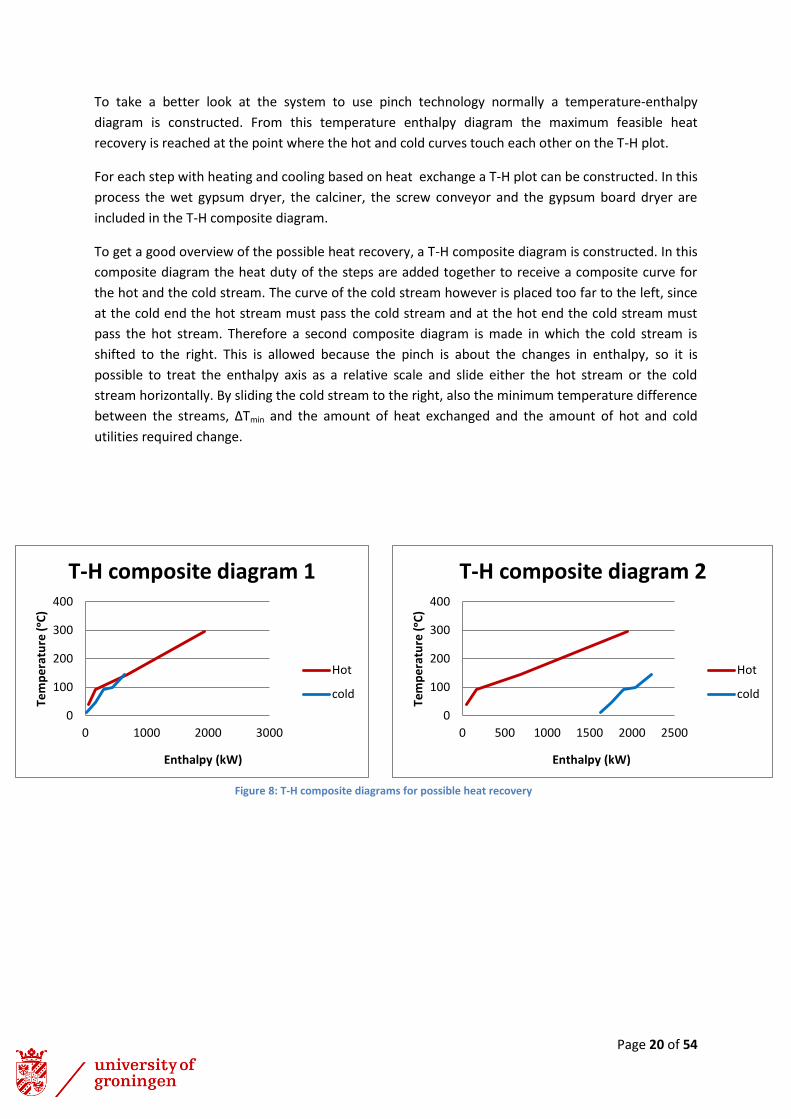
To take a better look at the system to use pinch technology normally a temperature-enthalpy
diagram is constructed. From this temperature enthalpy diagram the maximum feasible heat
recovery is reached at the point where the hot and cold curves touch each other on the T-H plot.
For each step with heating and cooling based on heat exchange a T-H plot can be constructed. In this
process the wet gypsum dryer, the calciner, the screw conveyor and the gypsum board dryer are
included in the T-H composite diagram.
To get a good overview of the possible heat recovery, a T-H composite diagram is constructed. In this
composite diagram the heat duty of the steps are added together to receive a composite curve for
the hot and the cold stream. The curve of the cold stream however is placed too far to the left, since
at the cold end the hot stream must pass the cold stream and at the hot end the cold stream must
pass the hot stream. Therefore a second composite diagram is made in which the cold stream is
shifted to the right. This is allowed because the pinch is about the changes in enthalpy, so it is
possible to treat the enthalpy axis as a relative scale and slide either the hot stream or the cold
stream horizontally. By sliding the cold stream to the right, also the minimum temperature difference
between the streams, ΔTmin and the amount of heat exchanged and the amount of hot and cold
utilities required change.
0
100
200
300
400
0 500 1000 1500 2000 2500
Tem
pe
ratu
re (
ᵒC)
Enthalpy (kW)
T-H composite diagram 2
Hot
cold
0
100
200
300
400
0 1000 2000 3000
Tem
pe
ratu
re (
ᵒC)
Enthalpy (kW)
T-H composite diagram 1
Hot
cold
Figure 8: T-H composite diagrams for possible heat recovery

Page 21 of 54
Chapter 4: Mass and Energy balance
Process control and P&ID When designing a process it is necessary that there will be some sort of control to maintain safe operation. For this process the pressure, temperature and level are controlled. To see clearly how these parameters are controlled, a piping and instrumentation diagram (P&ID) is constructed for a part of the process, see figure 9. The calciner is chosen since this was the main technology for this research. Pressure control Pressure control is necessary for this system since it is a system handling a vapour. To make sure that the pressure will not be too high, a pressure safety valve (PSV) is placed on top of the reactor. This is a mechanical safety valve, which will open if the pressure exceeds a pre-defined value. This means that it is closed during normal operation. The PSV operates like a spring, such that if the power goes down, it still works. Level control In any equipment where an interface exists between two phases (in this case solid and vapour), some means of maintaining the interface at the required level must be provided. This can be done by control of the flow from the equipment. To make sure that there is not too much and not too little gypsum in the reactor, a level transmitter (LT) is connected to the reactor. If the level becomes too high or too low, it will send a level alarm high (LAH) or a level alarm low (LAL), respectively. The level indicator controller will adjust the outflow of hemihydrate such that for a LAL the outflow will go slower/stops. For a LAH, the outflow will go faster such that the reactor empties faster than it is filled. Temperature control To make sure that the temperature in the reactor will not become too high, a temperature transmitter (TT) is connected to the reactor vessel. This is connected to a temperature indicator controller (TIC), which will give a signal to the furnace. When the temperature in the reactor will become too high, the TIC will give a signal to the furnace to lower the temperature. This is done by letting less gas into the furnace, which will cause the temperature to drop, but it does not significantly reduce the air flow. This way the hot air that reaches the reactor has a lower temperature. There is also a valve on the pipeline to the reactor which is opened during normal operating, which means that it is an air to open (ATO) valve. Thus when it loses its signal, the valve closes and the hot air will not reach the reactor, which means that the temperature cannot become too high during failure. It is not possible for this process to control the temperature by closing the valve in the hot air pipeline to the kettle, because the calciner uses a fluidized bed to perform the calcination. So if the air flow decreases the calciner would not work well anymore. Maintenance On both sides of the valve connected to the air inflow pipe, and on the air outflow pipe there are flanges. These are useful for maintenance to the pipes. The circle in the reactor is a manhole, this is also useful for maintenance.

Page 22 of 54
CalcinerR-1201
Hot-hemi
Air out calciner
Air to calciner
Dry-gypsum
GBM Delfzijl, 22-06-2015Capacity: 5000 kg/h Drawing #1 Code writer: D.G. BoerCode approver/checker: M.W.M. Boesten
LICLT
LAHLAL
ValveOpenATO
TICTT
To furnace
GypsumT = 91ᵒCP = 1 bar
StuccoT = 143ᵒCP = 1 bar
PSV
TSL
1 2
3
4
Figure 9: P&ID for calciner
HAZOP A hazard and operability study is a systematic procedure for critical examination of the operability of a process.7 When applied to a process design or an operating plant, it indicates potential hazards that may arise from deviations from the intended design conditions. For this report, a small HAZOP study is performed over the calcinator and the streams (1 t/m 4) which are embedded in the P&ID. For the HAZOP study the intention, deviation, cause, consequence and hazards of each stream is determined, which can be seen in the table on the next page.

Page 23 of 54
Aspen drawing The process for the manufacturing of gypsum boards from waste gypsum boards is simulated in Aspen. In this system the contamination, (such as paper, nails, screws and insulation) of the feed is not included. In this model it is also assumed that there is a conversion of 1 for gypsum to hemihydrate and the reverse reaction. To make a recycle loop in the model for the gypsum boards which are too large for the screener, a
purge needed to be incorporated. In a real process it is not necessary to purge a part of these too
large pieces of gypsum boards. Therefore this is only incorporated in the Aspen drawing but not in
the rest of the report.
Vessel -Calciner Intention - to perform calcination of gypsum particles
Guide word Deviation Cause Consequences and Action
Line No. 1 Intention - transport gypsum (1 bar, 5000 kg/h, 91°C) into the calciner
NO Flow Transport belt failure, inlet blockage
Too little gypsum in calciner (LAL)
MORE Flow Transport belt failure Too much gypsum in calciner (LAH)
LESS Flow Inlet blockage Too little gypsum in calciner (LAL)
Line No. 2 Intention - transport of demihydrate (1 bar, 4215 kg/h, 143°C) from the calciner to rest of process
NO Flow Outlet blockage Too much gypsum in calciner (LAH)
LESS Flow Outlet blockage Too much gypsum in calciner (LAH)
Line No. 3 Intention - transport of air (1 bar, 12205 kg/h, 296°C) into the calciner
NO Flow Fan failure, inlet blockage
Fluidized bed will not work, so calcination will not be performed well.
MORE Flow Fan failure Calcinator will become too hot, pressure increases. Hazard!
LESS Flow Fan failure, inlet blockage
Fluidized bed will not work, so calcination will not be performed well.
Line No. 4 Intention - transport of air (1 bar, 16169 kg/h, 91°C) out of the calciner
NO Flow Outlet blockage, fan failure
Calcinator will become too hot, pressure will increase. Hazard!
LESS Flow Outlet blockage, fan failure
Calcinator will become too hot, pressure will increase. Hazard!

Page 24 of 54
Figure
10
: Asp
en
system

Page 25 of 54
Stream summary A stream summary from Aspen is obtained and showed in the two tables underneath. The first table shows the values for the pressure (bar), temperature (ᵒC), vapor fraction, enthalpy (kW) and density (kg/m3) for all the streams of the Aspen model (see Aspen drawing). In the second table, the total mass flow (kg/h) is shown for each stream, as well as the mass flow for each different component. To keep it compact, the mass flow of ethane, propane, butane, pentane and hexane are added and shown in one column.
Stream Pressure (bar) Temperature (ᵒC) Vapor Fraction Enthalpy (kW) Density kg/m3
AIR-CAL2 1 296 1 -20200 0.5
AIR-CALC 1 296 1 -24634 0.5
AIR-CL-O 1 143 1 -23813 0.7
AIR-DRY2 1 296 1 -4434 0.5
AIR-DRY3 1 169 1 -28247 0.6
AIR-DRYE 1 296 1 -25132 0.5
AIR-GAS 1 12 1 -258 1.2
AIR-OUT 1 91 1 -30576 0.8
AIR-OUT2 1 99 1 -32901 0.7
AIR-OUTM
1 95 1 -63471 0.8
AIR-RECY 1 95 1 -49507 0.8
CLOUT 1 143 1 -36419 0.7
COARSE 1 12 0 -588
DRY-SMAL
1 91 0 -16219
DRYFEED 1 91 0 -16219
F-LARGE 1 12 0 -19135 999
F-SMALL 1 12 0 -19135 999
FEED 1 12 0 -18553 999
FINES 1 12 0 -18547 999
HEMI-40 1 40 0 -12705
HEMI-HOT 1 143 0 -12606
HOTAIR 1 296 1 -49766 0.5
MIXAIRGA 1 86 1 -49766 0.8
NEWWT 1 12 0 -11369 999
PRODUCT 1 99 0 -16206
PURGE 1 95 1 -13964 0.8
PURGE2 1 12 0 -6
RECYCLE 1 12 0 -582
SLURRY 1 85 0 -11269 966
WAT-45 1 45 0 -23974 987

Page 26 of 54
Stream Mass Flow (kg/h)
HEMI-SOL (kg/h)
GYPS-SOL (kg/h)
WATER (kg/h)
CO2 (kg/h)
O2 (kg/h)
N2 (kg/h)
ARGON (kg/h)
METHANE (kg/h)
ETHANE-HEXANE (kg/h)
AIR-CAL2 12205 5147 925 569 5436 129 AIR-CALC 14885 6277 1128 694 6629 158 AIR-CL-O 12990 5931 925 569 5436 129 AIR-DRY2 2679 1130 203 125 1193 28 AIR-DRY3 15669 7061 1128 694 6629 158 AIR-DRYE 15185 6403 1151 708 6763 161 AIR-GAS 4220 0 8 1017 2946 70 164 15 AIR-OUT 16169 7561 1128 694 6629 158 AIR-OUT2 16972 8190 1151 708 6763 161 AIR-OUTM 33141 15751 2278 1401 13392 318 AIR-RECY 25850 12286 1777 1093 10446 248 CLOUT 17205 4215 5931 925 569 5436 129 COARSE 180 180 DRY-SMAL 5000 5000 DRYFEED 5000 5000 F-LARGE 5680 5180 500 F-SMALL 5680 5180 500 FEED 5502 5002 500 FINES 5500 5000 500 HEMI-40 4215 4215 HEMI-HOT 4215 4215 HOTAIR 30070 12680 2278 1401 13392 318 MIXAIRGA 30070 12286 1785 2110 13392 318 164 15 NEWWT 2571 2571 PRODUCT 5000 5000 PURGE 7291 3465 501 308 2946 70 PURGE2 2 2 RECYCLE 178 178 SLURRY 6786 5000 1786 WAT-45 2571 2571

Page 27 of 54
Chapter 5: Equipment list and estimation costs
Specification ISBL and OSBL As stated in chapter 3, the complete process can be divided into two parts, inside the battery limits (ISBL) and outside the battery limits (OSBL). ISBL is typically the process units and the focus of the project. OSBL consists of all connections necessary to make ISBL function: feed and product streams, utilities, waste streams, etc8. For this system the ISBL consists of the feed storage, the crushers, the screener, the dryers, the calciner, the screw conveyor with double wand, the hydrater, transport belts and the gypsum boards storage place. The OSBL consists of the feed to the wet gypsum storage, the hot air system, the water for the hydrater, the transport of the gypsum boards and the waste stream in the form of the purge.
Equipment list and vendor information An equipment list is constructed for the equipment which is part of the ISBL.
Equipment Code Capacity Vendor Power
Gypsum waste board storage
T-1101
400 ton
Hammer mill
CR-1102 3-8 t/h XINFEI 55.5 kW
Screen
S-1103 5 t/h W.S. TYLER
Rotating drum dryer
D-1104
2-6 t/h FTM 11 kW
Ball mill
CR-1105 1.5-5.8 t/h SAM mining equipment
55 kW
Calciner (MPS vertical roller mill)
R-1201 1-160 t/h PFEIFFER 7.5 kW
Screw conveyor (double wand)
H-1202
35 t/h Reno Machinery
Hydrater R-1203
5.3 m3 STAES DYNAMIX
Gypsum board dryer
D-1301
6 t/h Grenzebach
Transport belt (5x)
6 t/h SANDVIK
Gypsum board storage
T-1302
400 ton

Page 28 of 54
Gypsum waste board storage
Equipment Code Capacity Vendor Power MOC Temperature
Pressure
Gypsum waste board storage
T-1101
400 ton - - Bricks 12 °C 1 bar
The storage of gypsum waste board is done in a large indoor place, which is necessary to make sure that the water content does not exceed 10 wt%. The capacity for this hall is 400 ton, to make sure that the continuous process does not have to be stopped when there is no feed supply during the weekends. Since gypsum board has a density of approximately 700 kg/m3, this means that the storage must be 571 m3. Hammer mill9
Equipment Code Capacity Vendor Power MOC Temperature Pressure
Hammer mill
CR-1102 3-8 t/h XINFEI 55.5 kW 304 Stainless steel
12 °C 1 bar
To crush the large waste gypsum boards a crusher is necessary. To ensure the highest reduction ratio for the size, it is chosen to use a hammer mill. A wood crusher from XINFEI, model 800, is used for this size reduction. The main structure of the machine is composed of rack, housing, motor housing, shaft, hammer, screw conveyor and fan. The capacity of the process is within the range for the capacity of the equipment. However, the feeding width is too small. Therefore the plates either have to be crushed before entering this machine or the machine has to be custom made such that the feeding with is applicable for this process. Screen10
Equipment Code Capacity Vendor Power MOC Temperature Pressure
Screen
S-1103 5 t/h W.S. TYLER
304 Stainless steel
12 °C 1 bar
For the classification of the gypsum particles, a screen is necessary. For this operation the TYCAN 1100 F-class model from W.S. TYLER is used. This model however has a maximum capacity of 5 t/h which is exactly the amount of gypsum processed. To make sure that the process can be optimized for a higher capacity, it is preferred to have equipment which can process for example 1 or 2 t/h more than the current process. This type of screener has cut sizes up to 15 cm and a maximum lump size of 30 cm.

Page 29 of 54
Rotating drum dryer11
Equipment Code Capacity Vendor Power MOC Max temperature
Pressure
Rotating drum dryer
D-1104
2-6 t/h FTM 11 kW 304 stainless steel
169 °C 1 bar
For the first drying step, a rotating drum dryer, model Φ1200x12000 is used from FTM. The dryer is able to process a capacity between 2-6 t/h, which will cost 11 kW of power. The intake air temperature must be lower than 700ᵒC, which is not a problem in this process since the temperature of the hot air coming into the dryer is 169ᵒC. Ball mill12
Equipment Code Capacity Vendor Power MOC Temperature Pressure
Ball mill
CR-1105 1.5-5.8 t/h
SAM mining equipment
55 kW 304 stainless steel
91 °C 1 bar
To perform the second crushing step a ball mill is used. The model used is Φ1200x4500 from SAM mining equipment. The capacity of the ball mill is 1.5 to 5.8 t/h. It is possible to choose another model to increase the capacity, however when choosing a model with a capacity of 3-6 t/h the power needed is 110 kW. For the chosen model the required power is only 55 kW. Therefore it is chosen to use a model with relatively low possibilities for upscaling.
Calciner6
Equipment Code Capacity Vendor Power MOC Max temperature
Pressure
Calciner (MPS vertical roller mill)
R-1201
6 t/h PFEIFFER 304 stainless steel
296 °C 1 bar
For the calcination a MPS vertical roller mill from PFEIFFER is chosen. This equipment is able to process a very large range of capacities. It is chosen to use one which has a capacity of 6 t/h. The product fineness and product characteristics can be varied within a wide range (0.063 to 0.5 mm). Screw conveyor13
Equipment Code Capacity Vendor Power MOC Max Temperature
Pressure
Screw conveyor (double wand)
H-1202
35 t/h Reno Machinery
304 stainless steel
143 °C 1 bar
A screw conveyor of Reno Machinery is chosen, this piece of equipment has to be custom made because the capacity of the standard equipment is much higher than needed. Another reason it has to be custom made is that the conveyor has to be equipped with a double want, in which water can flow to cool down the hemihydrate in the screw conveyor.

Page 30 of 54
Hydrater
Equipment Code Capacity Vendor Power MOC Max temperature
Pressure
Hydrater R-1203
5300 L STAES DYNAMIX
304 stainless steel
85 °C 1 bar
For the hydrater a stainless steel storage tank is used with a mixer. The capacity of the tank is 5300 L. The minimal capacity is 4000 L, but it is not preferable to have a completely filled tank when stirring. Therefore a bigger one is chosen from STAES. The material used is stainless steel 304. The diameter and the height of the tank are 1.6 meter and 3.6 meter respectively14.
The mixer used is a mixer from DYNAMIX agitators, of the DMX line of industrial mixers. This heavy duty mixer is designed to be portable and flexible enough to be applied to an industrial tanks with the used size of 5.3 m3. 15 Gypsum board dryer16
Equipment Code Capacity Vendor Power MOC Max temperature
Pressure
Gypsum board dryer
D-1301
6 t/h Grenzebach 304 stainless steel
296 °C 1 bar
The gypsum board dryer used is a BSH Screen Belt dryer from Grenzebach. This dryer provides speciality drying for gypsum and other materials, having low strength when wet. The dryer has to be specially designed for this process since the number of decks and conveying widths are different for each process. The gypsum board dryer will be designed for a capacity of 6 t/h. Transport belt17
Equipment Code Capacity Vendor Power MOC Max temperature
Pressure
Transport belt (5x)
6 t/h SANDVIK 304 stainless steel
143 °C 1 bar
The transport belts used in this system are horizontal and from SANDVIK. These belts can handle a large range of capacities. For this process a belt of 0.5 meter wide and 5 meter length is chosen with a capacity of 6t/h.
Gypsum board storage
Equipment Code Capacity Vendor Power MOC Temperature Pressure
Gypsum board storage
T-1302
400 ton Bricks 99 °C 1 bar
The storage of gypsum boards need to be a large indoor place. It needs to be at least 400 ton, that
the production of the weekend can be stored and it can be distributed after the weekend.

Page 31 of 54
Capital costs7
The fixed capital investment is the total cost of designing, constructing, and installing a plant and the associated modifications needed to prepare the plant site. The fixed capital investment is made up of:
- The ISBL investment – the cost of the plant itself - The modifications and improvements that must be made to the site infrastructure, known as
offsite or OSBL investment. - Engineering and construction costs - Contingency charges
ISBL plant costs The ISBL plant cost includes the cost of procuring and installing all the process equipment that makes up the new plant. The direct field costs include:
- All the major process equipment such as vessels, reactors, columns, furnaces etc. including field fabrication and testing if necessary
- Bulk items, such as piping, valves, wiring, instruments, insulation, paint, lube oils, solvents etc.
- Civil works such as roads, foundations, piling, buildings etc. - Installation labor and supervision
In addition to the direct field costs there will be indirect field costs including:
- Construction costs such as construction equipment rental, temporary construction, temporary water and power etc.
- Field expenses and services such as field canteens, specialists’ costs, overtime pay and adverse weather costs
- Construction insurance - Labor benefits and burdens - Miscellaneous overhead items such as agent’s fees, legal costs, import duties, local taxes etc.
OSBL plant costs OSBL investment includes the cost of the additions that must be mad to the site infrastructure to accommodate adding a new plant or increasing the capacity of an existing plant. OSBL investments may include:
- Electric main substations, transformers, switchgear, power lines - Power generation plants, turbine engines, standby generators - Boilers, steam mains, condensate lines, boiler feed water treatment plant, supply pumps - Cooling towers, circulation pumps, cooling water mains, cooling water treatment - Water pipes, water demineralization, waste water treatment plant, site drainage and sewers - Air separation plants to provide site nitrogen for inert gas, nitrogen lines - Dryers and blowers for instrument air, instrument air lines - Pipe bridges, feed and product pipelines - Tanker farms, loading facilities, silos, conveyors, docks, warehouses, railroads, lift trucks - Laboratories, analytical equipment - Offices, canteens, changing rooms, central control rooms - Workshop and maintenance facilities - Emergency services, firefighting equipment, fire hydrant, medical facilities et c. - Site security, fencing, gatehouses, landscaping
OSBL costs are typically estimated as a proportion of ISBL costs in the early stages of design. For typical chemical projects, ISBL costs are usually between 20% and 50% of ISBL cost, and 40% is usually used as an initial estimate if no details of the site are known.
Page 32 of 54
Engineering costs The engineering costs include the costs of detailed design and other engineering services required to carry out the project:
- Detailed design engineering of process equipment, piping systems, control systems and offsites, plant layout, drafting, cost engineering, scale models, and civil engineering
- Procurement of main plant items and bulks - Construction supervision and services - Administrative charges - Bonding - Contractor’s profit
Engineering costs are best estimated individually based on project scope, as they are not directly proportional to project size. A rule of thumb for engineering costs is 30% of ISBL plus OSBL cost for smaller projects and 10% of ISBL plus OSBL cost for larger projects. Contingency charges Contingency charges are extra costs added into the project budget to allow for variation from the cost estimate. All cost estimates are uncertain and the final installed cost of many items is not known until installation has been successfully completed. Apart from errors in the cost estimate, contingency costs also help cover:
- Minor changes in project scope - Changes in prizes (e.g., prices of steel, copper, catalyst etc.) - Currency fluctuations - Labor disputes - Subcontractor problems - Other unexpected problems
A minimum of contingency charge of 10% of ISBL plus OSBL cost should be used on all projects. If the technology is uncertain then higher contingency charges are used.
Costs To make an estimation of the ISBL cost, first the equipment cost was estimated. For the equipment estimation the following formula was used: 𝐶𝑒 = 𝑎 + 𝑏 ∙ 𝑆𝑛 In which Ce = purchased equipment cost on a U.S. Gulf Coast basis, Jan.2010 a, b = cost constants S = size parameter n = exponent for that type of equipment For the equipment for which it was possible to determine the costs using this formula, the prices are shown in the table on the next page. The formula used gave a price for the equipment made of carbon steel. For this process it is however preferable to use stainless steel equipment. Therefore the material factor is taken into account. It is also necessary to calculate the include the other costs which belong to the ISBL costs, for example piping, process control and electrical work. To calculate the ISBL cost for the 304 stainless steel equipment the following formula was used:
𝐶 = ∑ 𝐶𝑒,𝑖,𝐶𝑆 [(1 + 𝑓𝑝)𝑓𝑚 + (𝑓𝑒𝑟 + 𝑓𝑒𝑙 + 𝑓𝑖 + 𝑓𝑠 + 𝑓𝑙)]
𝑖=𝑚
𝑖=1

Page 33 of 54
In which Ce,i,CS = purchased equipment cos of equipment i in carbon steel M = total number of pieces of equipment fm = material cost factor fp = installation factor for piping fer = installation factor for equipment erection fel = installation factor for electrical work fi = installation factor for instrumentation and process control fc = installation factor for civil engineering work fs = installation factor for structures and buildings fl = installation factor for lagging, insulation or paint For this process these factors are known since it is a solid process. fm = 1.3 fp = 0.2 fer = 0.6 fel = 0.15 fi = 0.2 fc = 0.2 fs = 0.1 fl = 0.05
Equipment S a b n Ce ($) C ($)
Hammer mill 5 t/h 68400 730 1 72050 206063
Drum dryer 1,13 m2 15000 10500 0,9 26721 76422
Ball mill 5 t/h 242000 -23000 0,4 198216 566898
Hydrater 5,3 m3 61500 32500 0,8 184897 528805
Belt 1 5 m 41000 730 1 44650 127699
Belt 2 5 m 41000 730 1 44650 127699
Belt 3 5 m 41000 730 1 44650 127699
Belt 4 5 m 41000 730 1 44650 127699
Belt 5 5 m 41000 730 1 44650 127699
Belt 6 5 m 41000 730 1 44650 127699
Pump 1 0,714 l/s 8000 240 0,9 8177 23387
Pump 2 0,714 l/s 8000 240 0,9 8177 23387
Fan 1 211 m3/h 4450 57 0,8 8574 24521
Fan 2 3307 m3/h 4450 57 0,8 41725 119335
Fan 3 37909 m3/h 4450 57 0,8 266793 763027
Fan 4 19361 m3/h 4450 57 0,8 157706 451039
Fan 5 21143 m3/h 4450 57 0,8 168890 483026
Fan 6 22822 m3/h 4450 57 0,8 179257 512674
Water tank 61,7 m3 113000 3250 0,65 160377 458679
Furnace 3 MW 80000 10900 0,8 106250 303874
Total calculated 1.855.709 5.307.329
Page 34 of 54
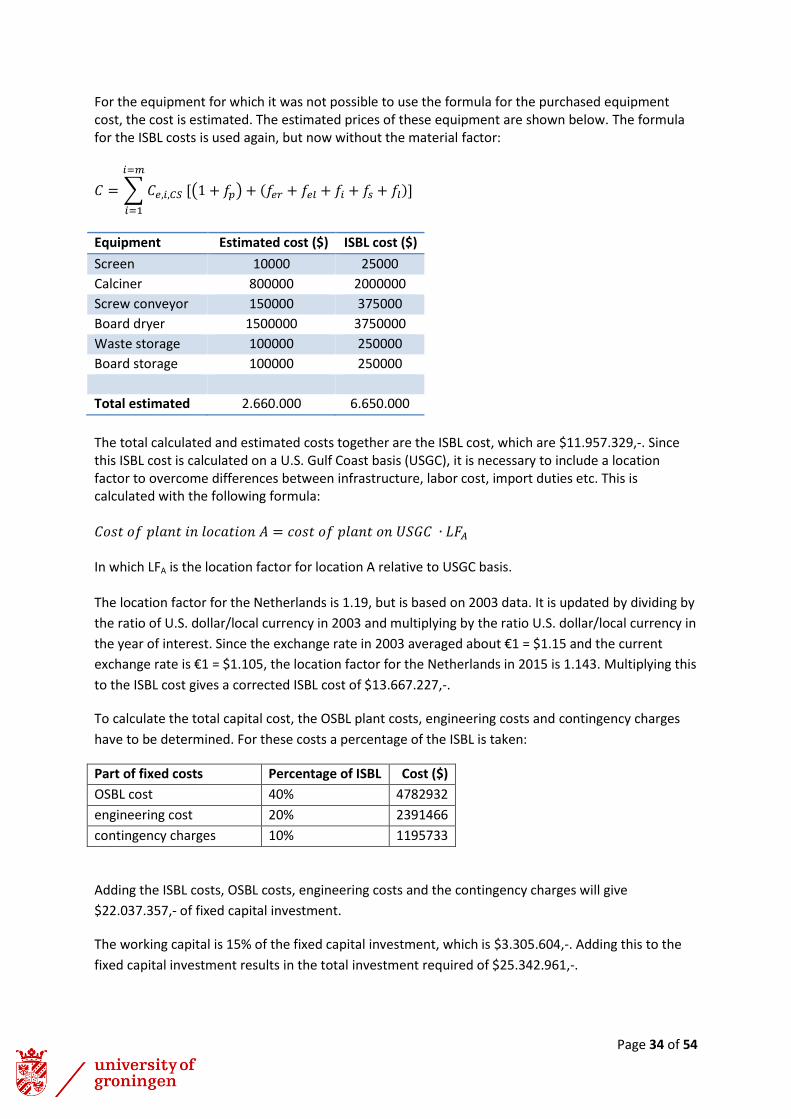
For the equipment for which it was not possible to use the formula for the purchased equipment cost, the cost is estimated. The estimated prices of these equipment are shown below. The formula for the ISBL costs is used again, but now without the material factor:
𝐶 = ∑ 𝐶𝑒,𝑖,𝐶𝑆 [(1 + 𝑓𝑝) + (𝑓𝑒𝑟 + 𝑓𝑒𝑙 + 𝑓𝑖 + 𝑓𝑠 + 𝑓𝑙)]
𝑖=𝑚
𝑖=1
Equipment Estimated cost ($) ISBL cost ($)
Screen 10000 25000
Calciner 800000 2000000
Screw conveyor 150000 375000
Board dryer 1500000 3750000
Waste storage 100000 250000
Board storage 100000 250000
Total estimated 2.660.000 6.650.000
The total calculated and estimated costs together are the ISBL cost, which are $11.957.329,-. Since this ISBL cost is calculated on a U.S. Gulf Coast basis (USGC), it is necessary to include a location factor to overcome differences between infrastructure, labor cost, import duties etc. This is calculated with the following formula: 𝐶𝑜𝑠𝑡 𝑜𝑓 𝑝𝑙𝑎𝑛𝑡 𝑖𝑛 𝑙𝑜𝑐𝑎𝑡𝑖𝑜𝑛 𝐴 = 𝑐𝑜𝑠𝑡 𝑜𝑓 𝑝𝑙𝑎𝑛𝑡 𝑜𝑛 𝑈𝑆𝐺𝐶 ∙ 𝐿𝐹𝐴 In which LFA is the location factor for location A relative to USGC basis. The location factor for the Netherlands is 1.19, but is based on 2003 data. It is updated by dividing by
the ratio of U.S. dollar/local currency in 2003 and multiplying by the ratio U.S. dollar/local currency in
the year of interest. Since the exchange rate in 2003 averaged about €1 = $1.15 and the current
exchange rate is €1 = $1.105, the location factor for the Netherlands in 2015 is 1.143. Multiplying this
to the ISBL cost gives a corrected ISBL cost of $13.667.227,-.
To calculate the total capital cost, the OSBL plant costs, engineering costs and contingency charges
have to be determined. For these costs a percentage of the ISBL is taken:
Part of fixed costs Percentage of ISBL Cost ($)
OSBL cost 40% 4782932
engineering cost 20% 2391466
contingency charges 10% 1195733
Adding the ISBL costs, OSBL costs, engineering costs and the contingency charges will give
$22.037.357,- of fixed capital investment.
The working capital is 15% of the fixed capital investment, which is $3.305.604,-. Adding this to the
fixed capital investment results in the total investment required of $25.342.961,-.

Page 35 of 54
Appendix 1: Literature 1) Kojima, Y. and Yasue, T. Synthesis of large plate-like gypsum dehydrate from waste gypsum
board, Journal of the European Ceramic Society, 2006, p. 777-783
2) http://www.gypsumrecycling.biz/
3) Mayo, P. Crusher selection II, Technical briefing paper No4., Institute of Quarrying Australia
4) Yu, Q.L. Brouwers, H.J.H. and De Korte, A.C.J. ‘Gypsum hydration: a theoretical and
experimental study’, 17thInternational Conference on Building Materials, 2009,
Weimar,Germany
5) Reichardt, Y. and Sander, E. ‘Calcining of gypsum’, Global gypsum , Gebr.Pfeiffer, 2006
6) Competence in gypsum, Gebr. Pfeiffer
7) Towler, G. and Sinnot, R. Chemical engineering design, 2013
8) Bray, K. ‘OSBL tips for process engineers’, The American institute of chemical engineers,
newsletter #5, 2007
9) http://www.xinfeiwoodcrusher.com/product/Wood-Crushing-Machine/Wood-Plate-
Crusher.html
10) http://www.directindustry.com/prod/wstyler/product-28339-836443.html
11) http://www.hnftm.com/product/desulfurization-gypsum-dryer.html
12) http://plant.raasindia.in/products/ball-mill.html
13) http://www.renomachinery.com/product_70.html
14) http://www.staes.com/en/nieuwe-tanks/f=new-storage-tanks-in-ss-stainless-
steel#/f=new&f2=nieuwe-tanks&cats=12-new-storage-tanks-in-ss-stainless-steel
15) http://www.dynamixinc.com/mixers-by-model/dmx
16) Gypsum technology, Grenzebach
17) http://www.directindustry.com/prod/sandvik-mining/product-40142-444278.html
18) http://www.sigmaaldrich.com/MSDS/MSDS/DisplayMSDSPage.do?country=NL&language=E
Ngeneric&productNumber=C3771&brand=SIAL&PageToGoToURL=http%3A%2F%2Fwww.sig
maaldrich.com%2Fcatalog%2Fproduct%2Fsial%2Fc3771%3Flang%3Den

Page 36 of 54
19) http://www.usg.com/content/dam/USG_Marketing_Communications/canada/product_pro
motional_materials/finished_assets/sheetrock-wall-liner-gypsum-panels-cavity-shaft-wall-
msds-en-can.pdf
20) http://www.sigmaaldrich.com/MSDS/MSDS/DisplayMSDSPage.do?country=NL&language=E
Ngeneric&productNumber=12090&brand=SIAL&PageToGoToURL=http%3A%2F%2Fwww.sig
maaldrich.com%2Fcatalog%2Fproduct%2Fsial%2F12090%3Flang%3Den
21) http://www.gasterra.nl/en/products-and-services/natural-gas
22) CRC Handbook of Chemistry and Physics, 68th Edition; CRC Press: Boca Raton, 1987.
23) Smith JM, Van Ness HC. Introduction to Chemical Engineering Thermodynamics; McGraw-Hill Book Co.: New York, 1975.

Page 37 of 54
Appendix 2: Substances and specifications
The substances used are gypsum (s), stucco(s), water(l), natural gas(g) and air(g). The most relevant
properties of gypsum and stucco are shown below, as well as the health risks.
Gypsum18
Product name Calcium sulfate dihydrate
Formula CaSO4 · 2H2O
CAS-number 10101-41-4
Molecular weight 172.17 g/mol
Intrinsic density 2320 kg/m3
Melting point 127-162ᵒC it loses its water
Boiling point -
Health and safety19
The feed consists of 95 wt% gypsum waste plates, and 5wt% plates made in the factory which did not met the product specifications. The gypsum plates are not expected to produce any unusual hazards during normal use. It does not present an inhalation, ingestion or contact health hazard. But when the gypsum plates are crushed, airborne particles are generated, as well as high dust levels, which may irritate the skin, eyes, nose, throat, or upper respiratory tract.
Stucco20
Product name Calcium sulfate hemihydrate
Formula CaSO4 · 1/2H2O
CAS-number 10034-76-1
Molecular weight 145.15 g/mol
Intrinsic density 2960 kg/m3
Melting point -
Boiling point -
Health and safety Stucco is made in the factory by calcinating the gypsum. This is a very fine powder. It is slightly hazardous in case of skin contact, of eye contact, of ingestion and of inhalation. The substance may be toxic to the upper respiratory tract. Repeated or prolonged exposure to the substance can produce target organs damage. Natural gas21
Natural gas is burned to generate hot air for the utility system. It is chosen to use natural gas from the gas field in Groningen. This consist of approximately 81.3 vol% methane and 3.5 vol% longer-chained hydrocarbons, such as ethane, propane etc. It also contains approximately 15.2 vol% incombustible gases, primarily nitrogen and a little carbon dioxide. Natural gas from other reserves generally contains other percentages of methane, a higher percentage of hydrocarbons and less nitrogen.

Page 38 of 54
Appendix 3: Pre-aspen assignment: Classifier
Aspen manual: classifier Substance: gypsum (CaSO4·2H2O)
Dina Boer
S2206897
22-06-2015

Page 39 of 54
Content
The classifier 3 Separation and selection functions 4 Aspen manual 7 Literature 17
Page 40 of 54
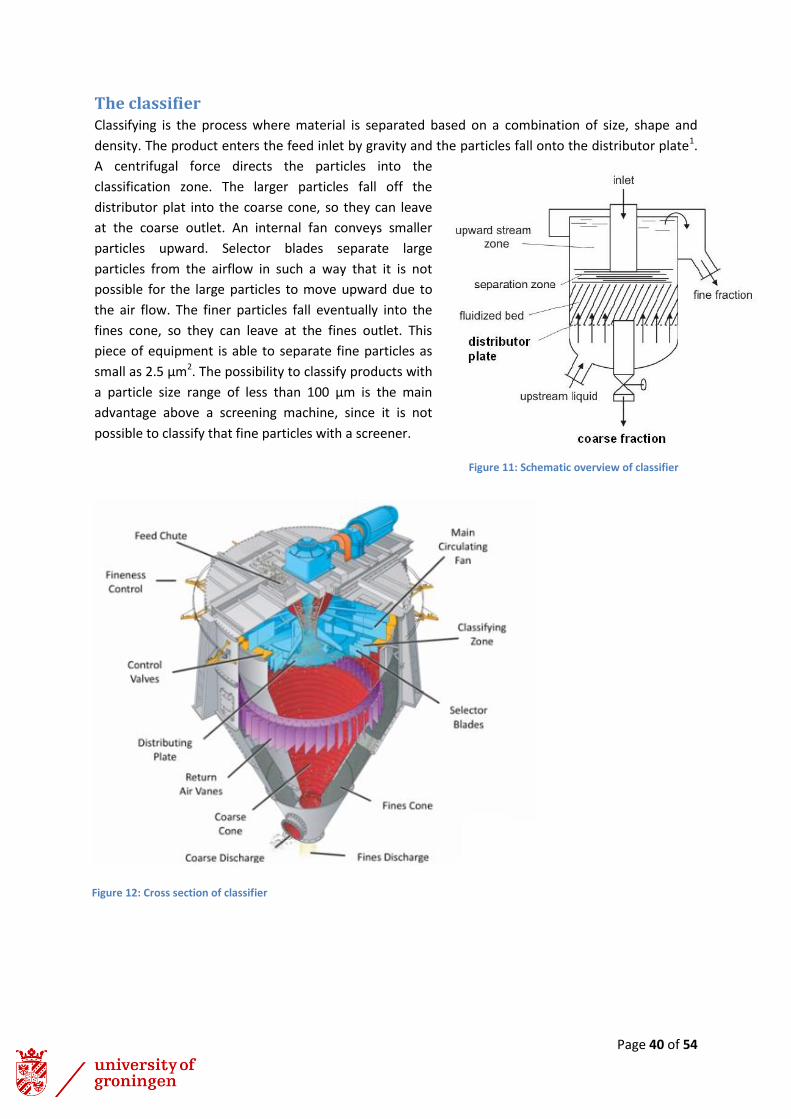
The classifier Classifying is the process where material is separated based on a combination of size, shape and
density. The product enters the feed inlet by gravity and the particles fall onto the distributor plate1.
A centrifugal force directs the particles into the
classification zone. The larger particles fall off the
distributor plat into the coarse cone, so they can leave
at the coarse outlet. An internal fan conveys smaller
particles upward. Selector blades separate large
particles from the airflow in such a way that it is not
possible for the large particles to move upward due to
the air flow. The finer particles fall eventually into the
fines cone, so they can leave at the fines outlet. This
piece of equipment is able to separate fine particles as
small as 2.5 μm2. The possibility to classify products with
a particle size range of less than 100 μm is the main
advantage above a screening machine, since it is not
possible to classify that fine particles with a screener.
Figure 11: Schematic overview of classifier
Figure 12: Cross section of classifier

Page 41 of 54
Separation and selection functions Ideal separation In ideal separation, a cut point can be defined which marks the border between the fines and coarse product. Below this value, the particles are flowing upwards with the air, these are the fines. Above the value the particles will fall down in the coarse cone, these are the coarse particles. A mass density plotted against particle size can be seen in figure 3. In figure 4, a selection function (also known as ‘grade efficiency curve’ or ‘separation curve’) shows a sharp separation between coarse and fine particles. An ideal separation would not occur in practice because in practice the particle size distributions of the products do overlap.
Real separation In contrast with ideal separation, real separation is achievable. Here it is taken into account that some of the feed material can be found as misplaced material in the wrong product. Particles which are smaller than the cut size and are nonetheless part of the coarse product (misplaced material of coarse fraction) or which are larger than the cut size and appear in the fines product (misplaced material of fines fraction). In the corresponding selection function, a s-shaped function around the dcut can be seen, where the shape is quite similar to the selection function of ideal separation.
Figure 3: Mass density vs particle size, ideal separation
Figure 413: Selection function, ideal separation
Figure 514: Mass density vs particle size, real separation
Figure 6: Selection funcction, real separation

Page 42 of 54
Fines product / coarse product The fines product is the fraction of the feed which can flow upwards due to the air. The coarse product is the fraction which does not flow upwards with the air flow but falls down into the coarse cone. A plot of the mass density against the particle size is shown in figure 7 for fines and in figure 8 for coarse. In these plots it can be clearly seen that there are some fines in the coarse product and some coarse particles in the fines product, as the plots cross the dcut.
Misplaced material and median cut point Misplaced material is the fraction which appears on the wrong side of the classifier. A separation which contains misplaced material is called a real separation. Furthermore, in real separation 50% of the particles of size equal to the median cut point exit the process in the coarse product stream, the other 50% exit in the fines product stream. Note: this is different than the d50 of the inlet particle size distribution. This d50 corresponds to a value of 0.5 of the selection function, which will be explained in the next chapter. The cut size dcut is the characteristic size which forms the desired upper limit of particle size in the fines and desired lower limit of particle size in the coarse product. For many models based on selection functions, the cut size equals the median cut point if there is no offset of fines.
Figure 15: Fines product Figure 16: Coarse product
Figure 17: Misplaced material in products Figure 18: Median cut point

Page 43 of 54
Selection function The selection function Si of a screen is defined as the mass fraction of material within the size I in the feed (mi,inlet) that leaves the classifier in the coarse stream (mi,coarse):
𝑆𝑖 =𝑀𝑖,𝑐𝑜𝑎𝑟𝑠𝑒
𝑀𝑖,𝑖𝑛𝑙𝑒𝑡
Which can be calculated as: 𝑀𝑖,𝑐𝑜𝑎𝑟𝑠𝑒 = 𝑆𝑖 ∙ 𝑀𝑖,𝑖𝑛𝑙𝑒𝑡
𝑀𝑖,𝑓𝑖𝑛𝑒𝑠 = (1 − 𝑆𝑖) ∙ 𝑀𝑖,𝑖𝑛𝑙𝑒𝑡
The selection function can also be expressed in terms of the coarse fraction c and the mass density distribution of the inlet and the coarse streams as:
𝑆(𝑑) =𝑐∙𝑞𝑐(𝑑)
𝑞𝑖𝑛(𝑑) With 𝑐 =
𝑀𝑐𝑜𝑎𝑟𝑠𝑒
𝑀𝑖𝑛𝑙𝑒𝑡
The graphical representation of the selection function shows the fraction separated with the coarse
stream for all particle size classes in figure 11. Based on its
definition, the selection function has the following
attributes:
- Below of du the value of S(d) is 0, which means that
none of this material can be found in coarse
product.
- Above of d0 the value of S(d) is 1, which means that
all of this material can be found in the coarse
product.
- At d50 the value of S(d) is 0.5
Separation sharpness Separation sharpness describes how close a real separation is from an ideal separation where the quality of the classification can be quantified by the steepness of the selection function curve. The higher the steepness of the selection curve, the higher the sharpness of the separation. A typical characteristic value is the degree of separation by Eder:
𝑥 =𝑑25
𝑑75
Where d25 and d75 are the particle sizes for which the selection function S(d) = 0.25 and 0.75 respectively (but these values are different than the d25 and d75 of the inlet particle size distribution).
Figure 19: Selection function
Figure 20: Separation sharpness
Page 44 of 54
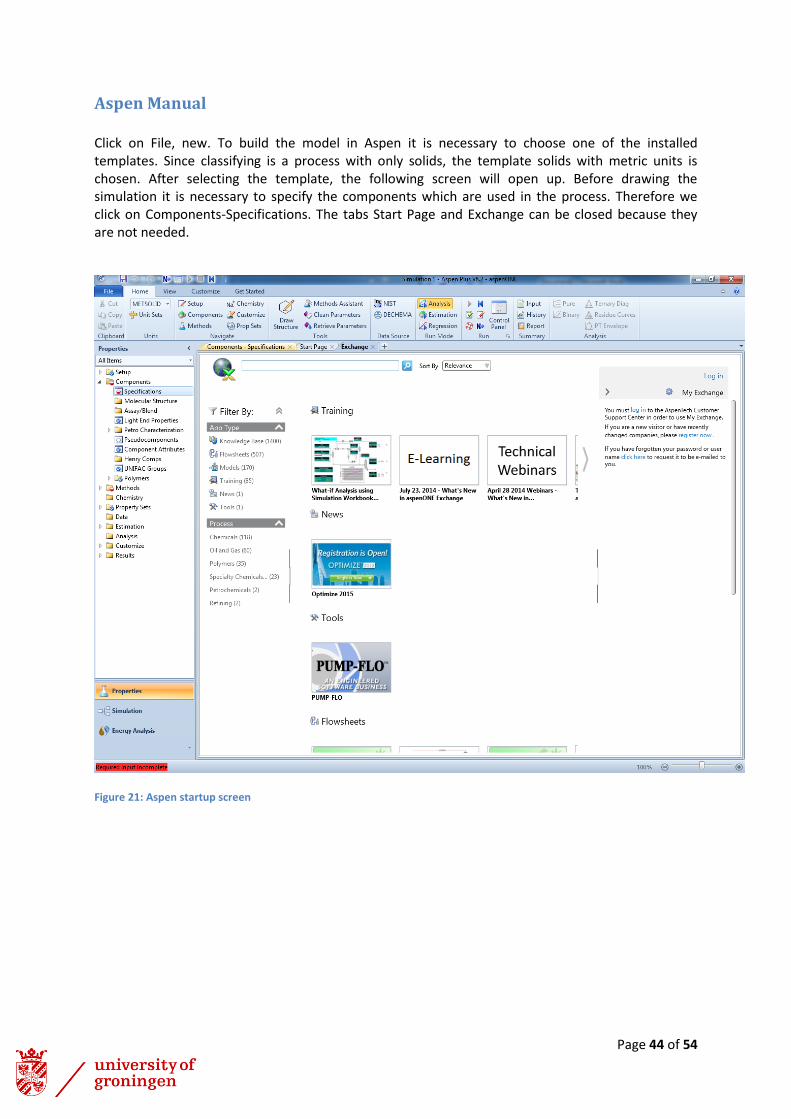
Aspen Manual Click on File, new. To build the model in Aspen it is necessary to choose one of the installed templates. Since classifying is a process with only solids, the template solids with metric units is chosen. After selecting the template, the following screen will open up. Before drawing the simulation it is necessary to specify the components which are used in the process. Therefore we click on Components-Specifications. The tabs Start Page and Exchange can be closed because they are not needed.
Figure 21: Aspen startup screen

Page 45 of 54
In the Components-Specifications tab the components used for the design are specified. For this
design only gypsum has to be added. Select for gypsum the type to be solid.
Figure 22: Components specification
Click on next input. Automatically the screen Methods-Specifications will open. Select for Method
filter: ALL and for Base method: SOLIDS. Aspen will automatically fill in for Method name: SOLIDS.
Figure 23: Methods specifications
Click on next input and run the simulation. Aspen will give an error, but this is due to a mistake in
Aspen so click ok. The results are shown in the Control Panel. Now go to simulation in the bottom left
corner.
Now the model flow sheet is open and it is time to build the set-up. Select ‘Solids’ and ‘Classifier’ by
the Model Palette (bottom of the screen). The Classifier is called B1, change the name to ‘CLASSIFI’.
Add an input stream called ‘GY-1’ (referring to gypsum) and two output streams called ‘GY-COURS’
and ‘GY-FINES’ (referring to respectively gypsum coarse particles and gypsum fine particles). If
correctly carried out, you will have the following screen:

Page 46 of 54
Figure 24: Simulation drawing
Now the specification of the classifier needs to be added. Click on ‘Setup’ and ‘Specifications’ in the
upper left corner. Add for the title ‘Classifier’. Set the Global unit set to SI-CBAR and set the
operational year to 1 year.
Figure 25: Setup specifications
Click on next input and Aspen will automatically open the tab GY-1(MATERIAL)-Input. This means it is
time to fill in the specifications for the input stream.

Page 47 of 54
GY-1 is a solid stream with only solid gypsum present. Therefore the Mixed sheet is not defined. The
CI Solid sheet needs to be defined, so click on the CI Solid tab. The solid particles are specified with
sub stream name CIPSD. The temperature is set to 10ᵒC, the pressure is 1 bar and the total flow rate
is 1000 kg/hr. At the composition selection the mass fraction needs to be selected where GYPSUM =
1.
Important: the output streams GY-COARSE and GY-FINES are defined by aspen after the simulation,
so no values needs to be added for them.
Do not click on next input yet but open the Particle Size Distribution part, underneath the
specifications part.
Figure 26: CI Solid
The following step is adding the particle size distribution for the GY-1 stream. It is assumed that the
particles are fine grinded and that the particle size of gypsum particles is between 1 and 100 μm.

Page 48 of 54
Click on Edit PSD Mesh, a new screen will pop up. Change the size units to mu (this means μm). Set
for the number of intervals 30. This number can be varied, more intervals means a better PSD, less
intervals will not give a smooth line. Because the particle size deviates between 1 and 100 μm, make
sure that the first interval starts with 1 and the last interval ends with (approximately) 100. When it is
not exactly 100 Aspen will normalize it automatically. It is most easy to make the PSD first in excel
and then copy and paste it into Aspen.
Figure 27: PSD mesh

Page 49 of 54
Click on the green arrow at the bottom of the pop up. It is a lot of work to add the weight fractions
by hand, so let Aspen do it. Click on: Populate PSD using A distribution function. Add a D50 of 50 μm
and a standard deviation of 20 μm and click on calculate. Aspen will ask if you want to normalize the
cumulative weight fraction to 1. Click on yes.
Figure 28: PSD weight fractions
After clicking on yes, Aspen will show the PSD curve for the inlet stream.
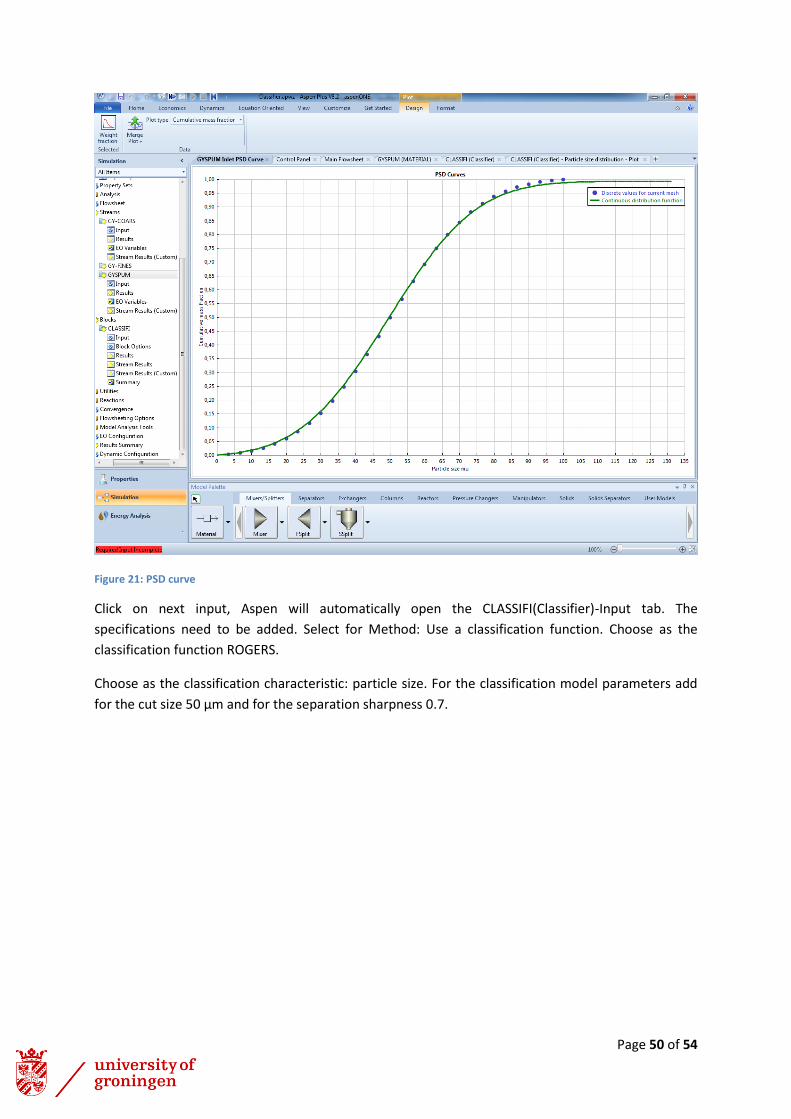
Page 50 of 54
Figure 21: PSD curve
Click on next input, Aspen will automatically open the CLASSIFI(Classifier)-Input tab. The
specifications need to be added. Select for Method: Use a classification function. Choose as the
classification function ROGERS.
Choose as the classification characteristic: particle size. For the classification model parameters add
for the cut size 50 μm and for the separation sharpness 0.7.

Page 51 of 54
Figure 29: Specification classifyer
Click on next input and run the simulation. An error will occur but this is again the mistake of Aspen,
so just click on ok. The results will show in the control panel and if it is done correctly the control
panel will show no errors. Go to the Main Flowsheet tab to see some results of the simulation.
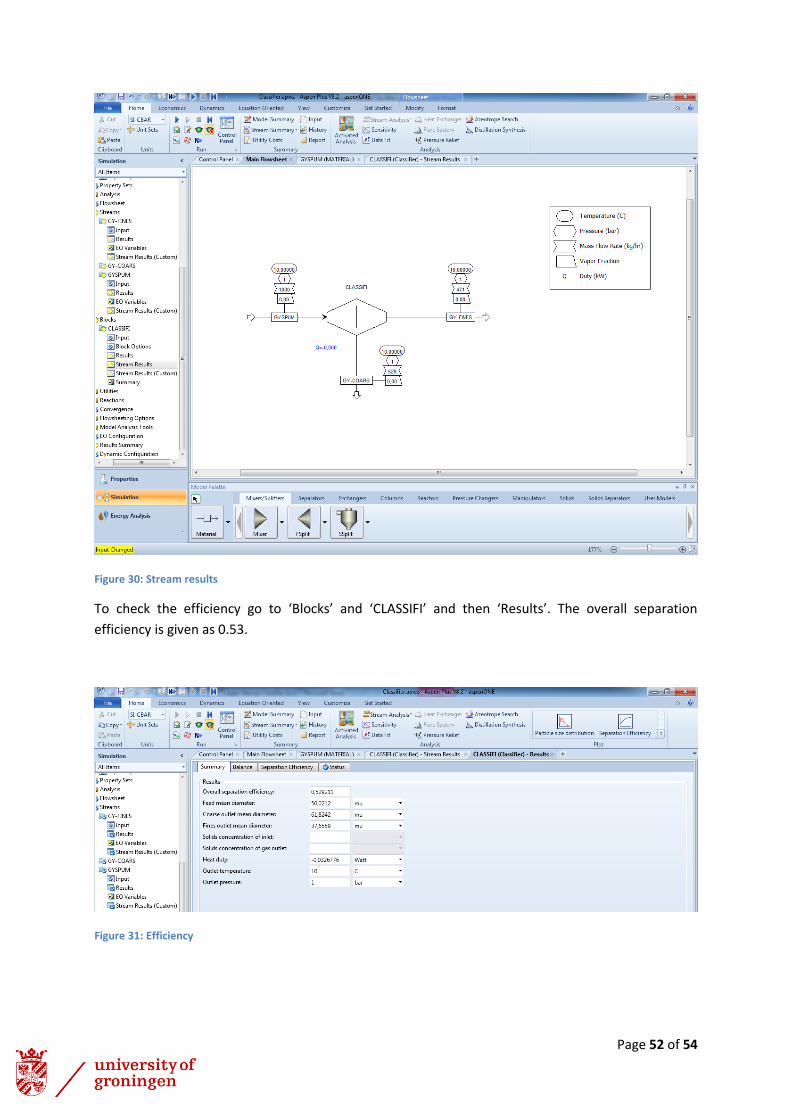
Page 52 of 54
Figure 30: Stream results
To check the efficiency go to ‘Blocks’ and ‘CLASSIFI’ and then ‘Results’. The overall separation
efficiency is given as 0.53.
Figure 31: Efficiency

Page 53 of 54
Click on the particle size distribution in the right upper corner to see the PSD curve of the gypsum
feed, the fines and the coarse.
Figure 32: PSD total, fines, coarse

Page 54 of 54
Literature 1) http://www.sturtevantinc.com/products/product/whirlwind-air-classifier/
2) http://www.netzsch-grinding.com/en/products-solutions/classifying/inlinestar-inline-
classifier.html#!tabs/technique
3) Plus, Aspen. Help Function. [Aspen Tech] s.l. : Aspen Tech, 2013


![OTC Paper 13210, 2001 Taco Terpstra[1]](https://img.pdfslide.net/doc/110x75/5540aa8e550346096e8b4b3f/otc-paper-13210-2001-taco-terpstra1.jpg)