Embed Size (px)
Citation preview

P R E P A R E D B YA C O L L A B O R AT I O N
ESC Polytech Consultants, Inc. 8800 Paul B. Koonce Street, Suite 225
Houston, Texas 77061-5119
HobbyLIVABLE CENTERS STUDY
F INAL REPORT March 2017

ii |
Credit: Morris Malakoff, UP Art Studio

HobbyLIVABLE CENTERS STUDY
MARCH 2017
Prepared for:Houston-Galveston Area CouncilHobby Area Management DistrictCity of Houston Planning DepartmentTexas Department of Transportation
iv |
ACKNOWLEDGEMENTS
FUNDING PARTNERS
Houston-Galveston Area Council
Hobby Area Management District
City of Houston Planning Department
Texas Department of Transportation
CONSULTANT TEAM
Design Workshop, Inc.
ESC Polytech Consultants, Inc.
Community Development Strategies
Lockwood, Andrews & Newnam, Inc.
The preparation of this document has been financed in part through grant[s] from the Federal Highway Administration and Federal Transit Administration, U.S. Department of Transportation, under the Metropolitan Planning Program, Section 104(f) of Title 23, U.S. Code. The contents of this document do not necessarily reflect the official views or policy of the U.S. Department of Transportation.
Copyright notice: © 2016 Design Workshop, Inc.
Disclaimer: All rights reserved. Unauthorized use and/or duplication of this material without prior written permission from the owner is strictly prohibited. For permission requests, write to the Houston-Galveston Area Council.
Note: Concept designs are for illustrative purposes only and have not been formally reviewed nor approved by the City. Should these concept designs mature, they will undergo a formalized plan, design and construction process with appropriate permitting.

v
EXECUTIVE SUMMARY
INTRODUCTION 1PURPOSE 2
NEEDS ASSESSMENT 7PREVIOUS STUDIES 8THE DISTRICT TODAY 10FORECASTED MARKET DEMAND 11EXISTING CONDITIONS ANALYSIS 12
ENVISIONING LIVABLE CENTERS 23STAKEHOLDER ENGAGEMENT 24OVERALL VISION 28CENTERS VISION 30CONNECTIVITY VISION 36OPEN SPACE VISION 54CULTURAL IDENTITY VISION 60DISTRICT WAYFINDING VISION 66CATALYST OPPORTUNITIES 72
ROADMAP FOR IMPLEMENTATION 87IMPLEMENTATION STRATEGIES 88LEADERS 89CONCLUSIONS 176
APPENDIX 180
vi |
The Hobby Area District, located 11 miles southeast from Downtown Houston, includes the area south of Dixie Drive, west of the Gulf Freeway (IH-45), north of Almeda Genoa Road and east of Mykawa Road. Home to the William P. Hobby Airport, the Hobby Area District is a gateway connecting the world to Houston’s other international centers, such as the Texas Medical Center, Downtown, Museum District, Rice, University of Houston, and Texas Southern, which are attractive to national and international visitors.
Expansion of METRORail services along Telephone Road will enhance the role of the District as an international center and provide greater opportunity as a location for job growth with expanding business and industrial activity. By 2040, the District is expecting an increase in approximately 15,300 jobs and an additional 50,000 residents . Accompanying this growth will be the need for additional amenities, services and new spaces in which residents can live, work and play.
Livable Centers are places where people can live, work and play without relying on their cars because they are compact and mixed-use, designed to be walkable, and connected and accessible. Livable Centers provide mobility benefits by reducing the number of single-occupant vehicle (SOV) trips by providing transit, walking and bicycling options. Conceptual ideas in this document aim to create live/work/play destinations that further six livability principles, as defined by the U.S. Department of Housing and Urban Development (HUD):
1. Provide more transportation choices2. Promote equitable, affordable housing3. Enhance economic competitiveness4. Support existing communities5. Coordinate and leverage federal policies and investment6. Value communities and neighborhoods
This Hobby Livable Centers Study, published in 2017, was a collaborative effort between the Houston-Galveston Area Council (H-GAC), Hobby Area District (the District), City of Houston and Texas Department of Transportation (TxDOT). It was the first coordinated planning effort specific to the District and gathered input from more than 270 business, civic and governmental leaders. This booklet summarizes outcomes of a yearlong public outreach and visioning effort. The community identified a common vision and four goals. Each recommendation reflects community aspirations and guides future investments that support growth and improve quality of life for existing residents.
EXECUTIVE SUMMARYThis booklet provides a road map towards
implementation of the vision and goals
identified by Hobby stakeholders. Funding
and implementation strategies are discussed,
but it is important to note that creating
vibrant places does not have to begin with
expensive infrastructure investments.
Simple and creative placemaking efforts
can spark interest and spur catalytic change
throughout the District. Three catalyst designs
illustrate how change might occur in a way
that supports Livable Centers goals. The
community may prioritize recommendations
as partnerships and funding opportunities for
plan implementation become available. These
recommendations work together to create a
vibrant, lively and desirable District for people
to live and businesses to invest.
vii
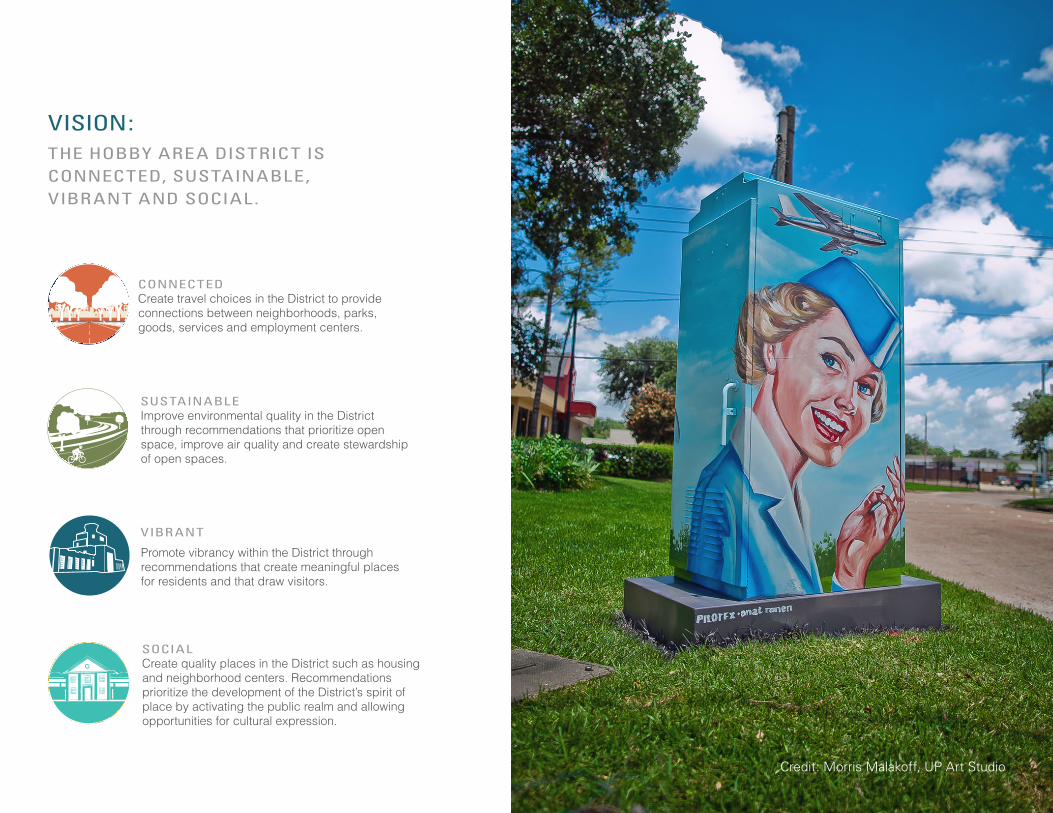
VISION: THE HOBBY AREA DISTRICT IS CONNECTED, SUSTAINABLE, VIBRANT AND SOCIAL.
CONNECTEDCreate travel choices in the District to provide connections between neighborhoods, parks, goods, services and employment centers.
SUSTAINABLEImprove environmental quality in the District through recommendations that prioritize open space, improve air quality and create stewardship of open spaces.
VIBR ANT
Promote vibrancy within the District through recommendations that create meaningful places for residents and that draw visitors.
SOCIALCreate quality places in the District such as housing and neighborhood centers. Recommendations prioritize the development of the District’s spirit of place by activating the public realm and allowing opportunities for cultural expression.
Credit: Morris Malakoff, UP Art Studio
viii |
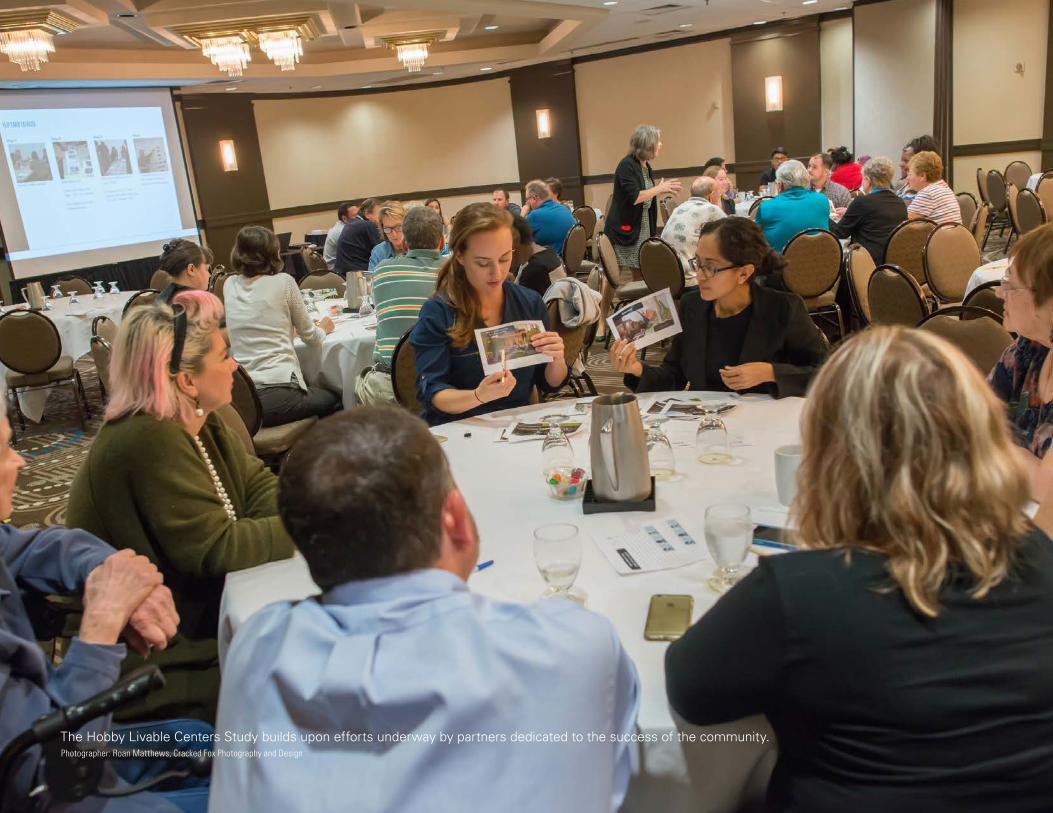
The Hobby Livable Centers Study builds upon efforts underway by partners dedicated to the success of the community.Photographer: Roan Matthews, Cracked Fox Photography and Design

1
IntroductionThe goal of the study is to create a Livable Centers plan for the Hobby Area District that will promote pedestrian accessibility, increase access to transit, provide a range of quality housing options and increase opportunities for private investment. The study includes practical implementation strategies to improve the quality of the living/working/civic environment in the area. It enhances the area as a destination which is walkable, transit-served, characterized by diverse housing and employment choices, thriving businesses, vibrant street life, and civic amenities.
2 | Introduction
PURPOSEThe Hobby Livable Centers Study is the result of collaborative planning efforts between the Houston-Galveston Area council (H-GAC), Hobby Area District (the District), City of Houston, and Texas Department of Transportation (TxDOT).
The overall goal of the study is to create Livable Centers for the District that will spur reinvestment, help rediscover the character that made the Hobby area attractive, and create an environment that is rich in opportunities.
The Hobby Livable Centers Study is the first planning effort specific to the District. Through a thorough community engagement process, over 270 business, civic and governmental leaders provided input and feedback. The resulting plan represents a melding of the District’s community ideals with principles of the Livable Centers program. Recommendations further the District’s goals and improve safety and support upward mobility and economic opportunity for residents and businesses.
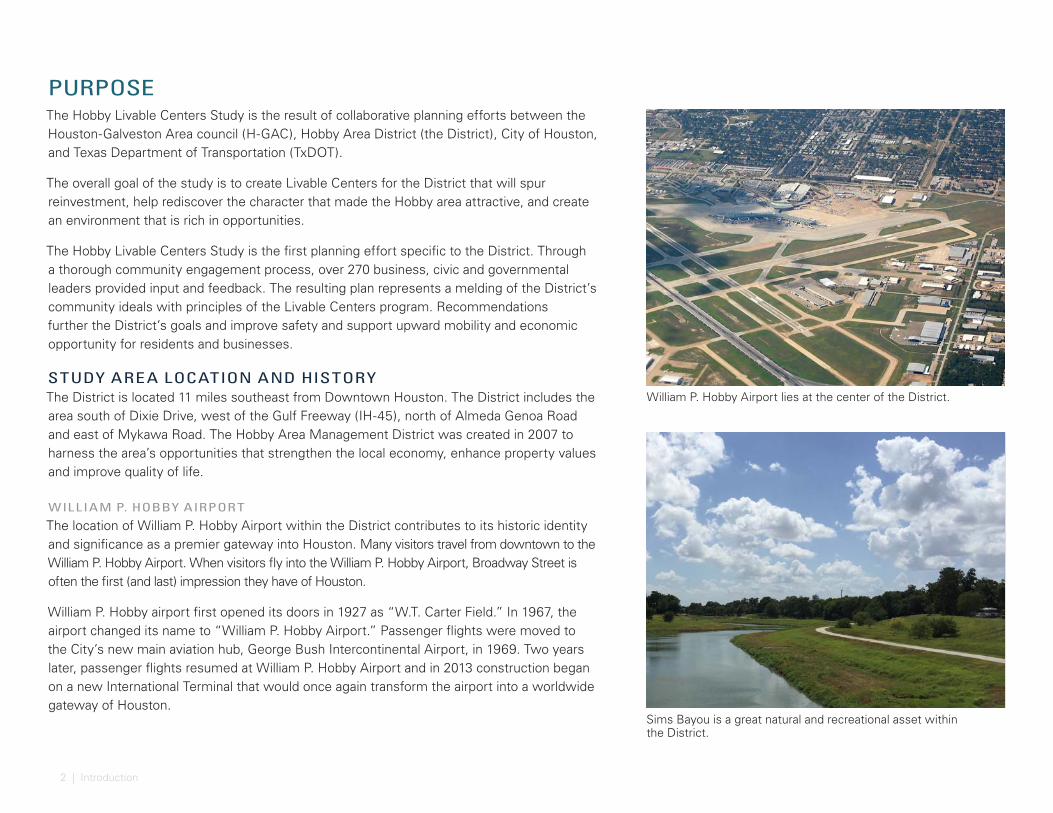
STUDY AREA LOCATION AND HISTORYThe District is located 11 miles southeast from Downtown Houston. The District includes the area south of Dixie Drive, west of the Gulf Freeway (IH-45), north of Almeda Genoa Road and east of Mykawa Road. The Hobby Area Management District was created in 2007 to harness the area’s opportunities that strengthen the local economy, enhance property values and improve quality of life.
WILLIAM P. HOBBY AIRPORT
The location of William P. Hobby Airport within the District contributes to its historic identity and significance as a premier gateway into Houston. Many visitors travel from downtown to the William P. Hobby Airport. When visitors fly into the William P. Hobby Airport, Broadway Street is often the first (and last) impression they have of Houston.
William P. Hobby airport first opened its doors in 1927 as “W.T. Carter Field.” In 1967, the airport changed its name to “William P. Hobby Airport.” Passenger flights were moved to the City’s new main aviation hub, George Bush Intercontinental Airport, in 1969. Two years later, passenger flights resumed at William P. Hobby Airport and in 2013 construction began on a new International Terminal that would once again transform the airport into a worldwide gateway of Houston.
William P. Hobby Airport lies at the center of the District.
Sims Bayou is a great natural and recreational asset within the District.

3
Figure 1: Hobby Area District Study Area and Neighborhoods °MAY 2016
WILLIAM P. HOBBY AIRPORT
DOW PARK
HOUSTON BOTANIC GARDEN
GARDEN VILLAS PARK
F.M LAW PARK
ROBERT C. STUART PARK
DIXIE DR
GU
LF FREEWAY
(IH-45)
MY
KA
WA
RD
BR
OA
DW
AY
ST
TE
LEP
HO
NE
RD
MO
NR
OE
RD
AIRPORT BLVD
BELLFORT ST
ALMEDA GENOA RD
° 1200’600’0’
Scale 1” = 1200’
Hobby LIVABLE CENTERS | STUDY AREA
Study Area Boundary Sims Bayou Parks
1 23
4
567
7
7
8
9
10
111213
1415
16
17
18
19
20
21
NEIGHBORHOODS
There are twenty-three neighborhoods within the District.
1. Houston Skyscraper Shadows
2. Suncrest
3. Sierra Vista
4. Easthaven
5. Gulf Freeway Oaks
6. Meadowbrook
7. Glenbrook Valley
8. Pecan Villas
9. Clara Vista
10. Broadview
11. Sims Bayou Estates
12. Santa Rosa
13. Oakland Plaza
14. Greenway Park
15. Tropicana Village
16. Andover Place
17. Southview
18. Dixeland Plaza
19. Bayou Oaks
20. Overbrook
21. Garden Villas
22. Robin Hood Poultry
23. Farms Allen Farms
4 | Introduction
DE VELOPMENT AND GROW TH
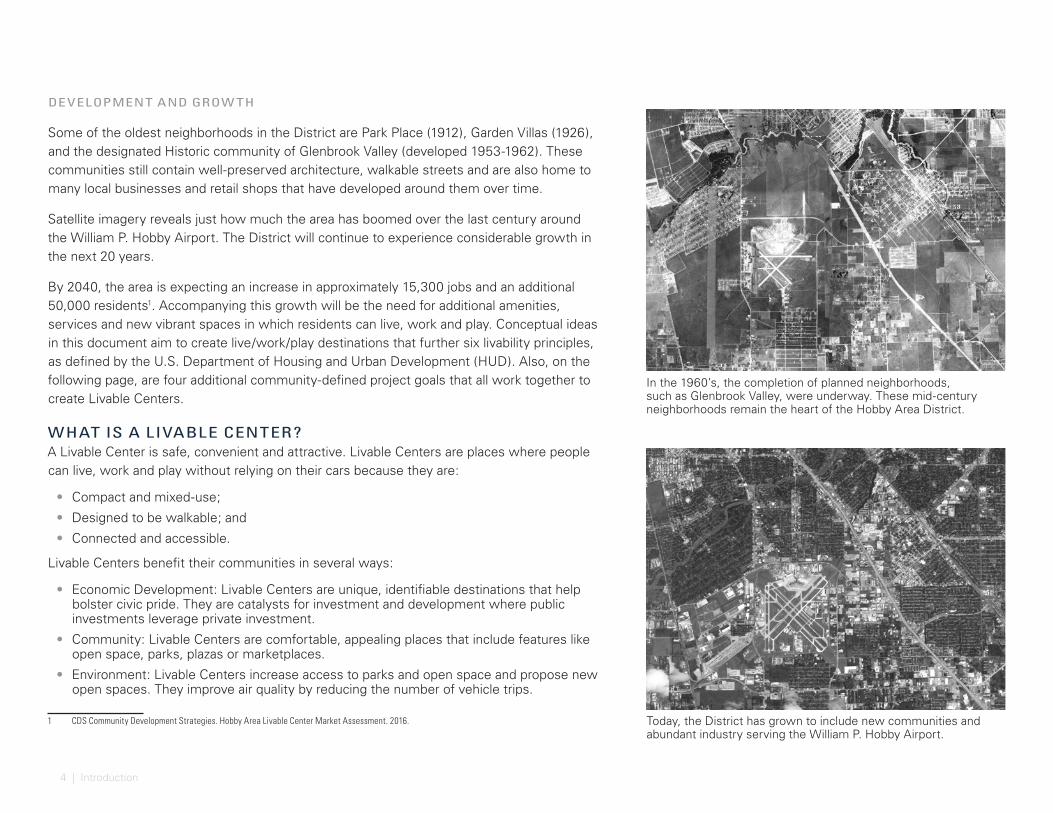
Some of the oldest neighborhoods in the District are Park Place (1912), Garden Villas (1926), and the designated Historic community of Glenbrook Valley (developed 1953-1962). These communities still contain well-preserved architecture, walkable streets and are also home to many local businesses and retail shops that have developed around them over time.
Satellite imagery reveals just how much the area has boomed over the last century around the William P. Hobby Airport. The District will continue to experience considerable growth in the next 20 years.
By 2040, the area is expecting an increase in approximately 15,300 jobs and an additional 50,000 residents1. Accompanying this growth will be the need for additional amenities, services and new vibrant spaces in which residents can live, work and play. Conceptual ideas in this document aim to create live/work/play destinations that further six livability principles, as defined by the U.S. Department of Housing and Urban Development (HUD). Also, on the following page, are four additional community-defined project goals that all work together to create Livable Centers.
WHAT IS A LIVABLE CENTER?A Livable Center is safe, convenient and attractive. Livable Centers are places where people can live, work and play without relying on their cars because they are:
• Compact and mixed-use;
• Designed to be walkable; and
• Connected and accessible.
Livable Centers benefit their communities in several ways:
• Economic Development: Livable Centers are unique, identifiable destinations that help bolster civic pride. They are catalysts for investment and development where public investments leverage private investment.
• Community: Livable Centers are comfortable, appealing places that include features like open space, parks, plazas or marketplaces.
• Environment: Livable Centers increase access to parks and open space and propose new open spaces. They improve air quality by reducing the number of vehicle trips.
1 CDS Community Development Strategies. Hobby Area Livable Center Market Assessment. 2016.
In the 1960’s, the completion of planned neighborhoods, such as Glenbrook Valley, were underway. These mid-century neighborhoods remain the heart of the Hobby Area District.
Today, the District has grown to include new communities and abundant industry serving the William P. Hobby Airport.
5
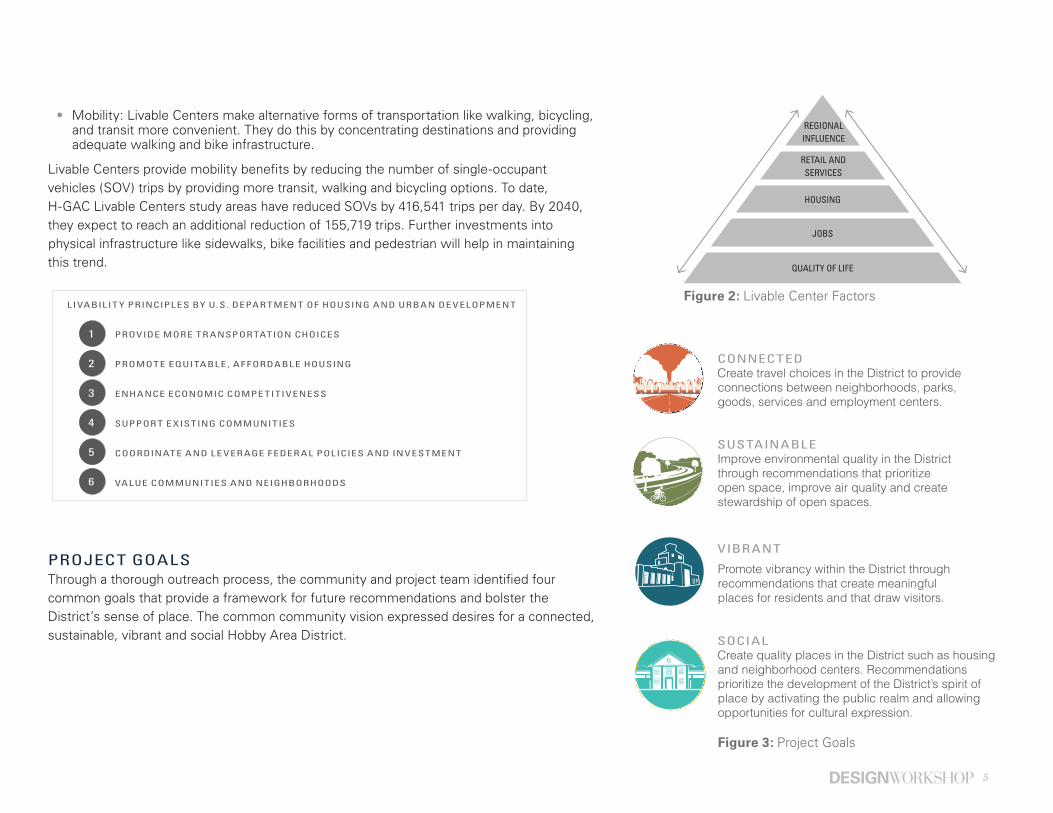
PROJECT GOALSThrough a thorough outreach process, the community and project team identified four common goals that provide a framework for future recommendations and bolster the District’s sense of place. The common community vision expressed desires for a connected, sustainable, vibrant and social Hobby Area District.
CONNECTEDCreate travel choices in the District to provide connections between neighborhoods, parks, goods, services and employment centers.
SUSTAINABLEImprove environmental quality in the District through recommendations that prioritize open space, improve air quality and create stewardship of open spaces.
VIBR ANT
Promote vibrancy within the District through recommendations that create meaningful places for residents and that draw visitors.
SOCIALCreate quality places in the District such as housing and neighborhood centers. Recommendations prioritize the development of the District’s spirit of place by activating the public realm and allowing opportunities for cultural expression.
REGIONAL INFLUENCE
RETAIL ANDSERVICES
JOBS
HOUSING
QUALITY OF LIFE
Figure 2: Livable Center Factors
Figure 3: Project Goals
LIVABIL IT Y PRINCIPL ES BY U.S. DEPAR TMENT OF HOUSING AND URBAN DE VELOPMENT
PROVIDE MORE TR ANSPOR TATION CHOICES
PROMOTE EQUITABL E, A F FORDABL E HOUSING
ENHANCE ECONOMIC COMPE TITIVENESS
SUPPOR T E XIS TING COMMUNITIES
COORDINATE AND L E VER AGE FEDER AL POLICIES AND INVESTMENT
VALUE COMMUNITIES AND NEIGHBORHOODS
1
6
5
4
3
2
• Mobility: Livable Centers make alternative forms of transportation like walking, bicycling, and transit more convenient. They do this by concentrating destinations and providing adequate walking and bike infrastructure.
Livable Centers provide mobility benefits by reducing the number of single-occupant vehicles (SOV) trips by providing more transit, walking and bicycling options. To date, H-GAC Livable Centers study areas have reduced SOVs by 416,541 trips per day. By 2040, they expect to reach an additional reduction of 155,719 trips. Further investments into physical infrastructure like sidewalks, bike facilities and pedestrian will help in maintaining this trend.
6 | Needs Assessment
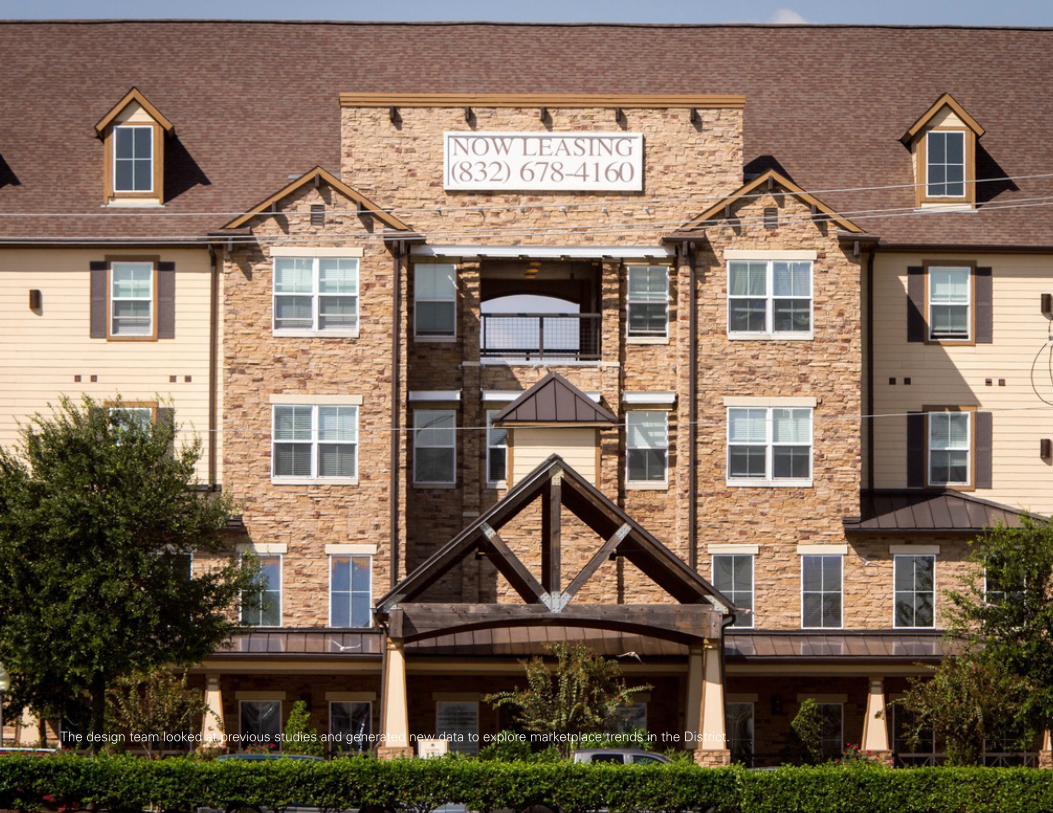
The design team looked at previous studies and generated new data to explore marketplace trends in the District.

7
Needs AssessmentA Livable Center is safe, convenient and attractive. Livable Centers are places where people can live, work and play without relying on their cars. What barriers exist to implementing change and what marketplace trends affect the District’s future growth? Research conducted by the District and its partners explored existing conditions and related studies in order to comprehensively understand relevant factors. This research generated new data to quantify population trends and future market demands.
8 | Needs Assessment
P L A N
HOUSTON Opportunity. Diversity. Community. Home.
Final Report
September 30, 2015
planhouston.org
HPARD MASTER PLANPHASE II : PARK SECTOR PROFILES
The Park Sector Profile describes the physical and demographic characteristic of the Park Sector, provides information on existing parks and facilities and
level of service according to park standards and highlights relevant local and regional studies and plans affecting this Park Sector.
PREVIOUS STUDIESThe Hobby Livable Centers Study builds on several planning efforts completed over the last several years and those currently underway. This section outlines some of these efforts as they relate to our process.
HOBBY ARE A DISTRICT 10-YE AR SERVICE PL AN (2008-2017)
The District establishes long-term goals for programs and projects through its service plan. Topic areas for the service plan include Security and Public Safety, Business Development, Transportation Planning and Visual Improvements and Cultural Promotion. The plan calls for mobility and transportation infrastructure improvements such as landscaping, streetscaping, lighting, bus shelters, seating, parks, trails and open space. Community art and the preservation of the District’s Art Deco architectural style from the 1930s and 1940s are key themes of the service plan. The need for safety programs and additional maintenance for public spaces are also identified.
CIT Y OF HOUSTON PL AN HOUSTON (2015)
Plan Houston, the City’s first general plan, was adopted in 2015. It describes a vision for Houston’s future and identifies the City’s long-term priorities. Core strategies were developed that the District should consider to help achieve the larger community’s vision and goals. Core strategies relating to the Hobby Area Livable Centers Study include grow responsibly; communicate clearly and with transparency; sustain quality infrastructure; nurture safe and healthy neighborhoods; connect people and places; support our global economy; champion learning; and foster an affordable city.
CIT Y OF HOUSTON PARKS MASTER PL AN PHASE II (2015 )
In 2015, the City completed a master plan to help guide growth in the parks and recreation system. Goals resulting from the plan that relate to the Hobby Livable Centers Study are to create connections, demonstrate environmental leadership and to provide equitable services for all citizens. The District is located in Park Sector 7. The report identifies this sector as being deficient in playgrounds, picnic shelters, trails, volleyball courts, dog parks, skate parks, community centers, swimming pools, outdoor spray grounds, softball and soccer fields. In 2014, residents prioritized recreational needs they felt were most important for their neighborhood. Top priorities were hike and bike trails, walking trails, upgraded community centers and playground areas. Additional needs identified by the 2014 survey were fitness and nutrition programming, swim lessons, dance, art programs and community gardens.
9
CIT Y OF HOUSTON MAJOR THOROUGHFARE AND FREE WAY PL AN (2014)
Houston’s Major Thoroughfare and Freeway Plan guides the implementation of thoroughfare and highway improvements by other governmental agencies within the City of Houston, including the Texas Department of Transportation. Interpretation of the plan through the City’s Chapter 42 of the Code of Ordinances and the Public Works and Engineering’s Infrastructure Design Manual continues to evolve as the city grows and changes.
HOUSTON BIKE PL AN (2016 )
Plan Houston called for the development and maintenance of a citywide bicycle plan. The Bayou Greenways Initiative is expanding rapidly, while METRO and Houston B-cycle are connecting more neighborhoods with destinations. The City of Houston updated its bikeway plan in 2015 to include a new bicycle toolbox of projects and policies that help make Houston bicycle-friendly. The plan identifies future projects in the District (Figure 9: Bicycle Network on page 18) that will create a citywide bicycle network and tie into Houston’s Bayou Greenways. The envisioned improvements serve people of all ages and skill levels and provide more transportation choices.
REIMAGINE ME TRO (2015)
A new transit plan, updated in 2015, reimagines METRO’s new bus network. The new transit system is designed to be simpler, faster, more frequent and provide better service on weekends, and more ways to get to destinations. The reimagined network reduces the number of street-level freight rail crossings. It also features five bus routes that run through the District, all of which provide access to the William P. Hobby Airport (Figure 10: Reimagined Bus Service on page 19).
WILLIAM P. HOBBY MASTER PL AN UPDATE (2014)
The William P. Hobby Master Plan Update identifies facilities and services to accommodate passenger, cargo and aviation demands through the year 2030. It also identifies improvements and appropriate development for areas surrounding the William P. Hobby Airport including transportation, economic development and design recommendations.
BAYOU GREENWAYS 2020
Bayou Greenways 2020 is a public-private partnership among the Houston Parks Board, the City of Houston Parks and Recreation Department and the Harris County Flood Control District. Bayou Greenways 2020 will create a continuous park along Houston’s major waterways and connect 150 miles of hike and bike trails. As part of this project a 10-foot trail will be built along Sims Bayou (which runs through the District) from S. Post Oak to IH-45.
City of HoustonJune 2016
10 | Needs Assessment
POPUL ATION GROW TH FOR COMPE TITIVE MARKE T ARE A
EMPLOYMENT FORECASTS FOR COMPE TITIVE MARKE T ARE A
AFFORDABILIT Y
POPULATION HOUSEHOLDS FAMILIES AVERAGE HOUSEHOLD SIZE
43,93147,966 48,544 50,205
14,771 15,537 15,630 16,136
_
11,092 11,083 11,393
2.95 3.09 3.1 3.110
10,000
20,000
30,000
40,000
50,000
60,000
2000 2010 2015 2020
POPULATION HOUSEHOLDS
0
50,000
100,000
150,000
200,000
250,000
300,000 277,881
86,900
2030
290,370
93,243
2040
240,398
74,554
2015
251,114
77,744
2020
EMPLOYMENT
80,53083,479
90,259
95,858
70,000
75,000
80,000
85,000
90,000
95,000
100,000
2015 2020 2030 2040
BLUE COLLAR OCCUPATIONS
WHITE COLLAR OCCUPATIONS
SERVICE&FARM
42%33%
$144,586
$190,915 $168,437
$285,700
$0
$50,000
$100,000
$150,000
$200,000
$250,000
$300,000
MEDIAN HOME VALUE AVERAGE HOME VALUE
DISTRICT
HOUSTON
2015 HOUSING UNITS
939,289
17,607
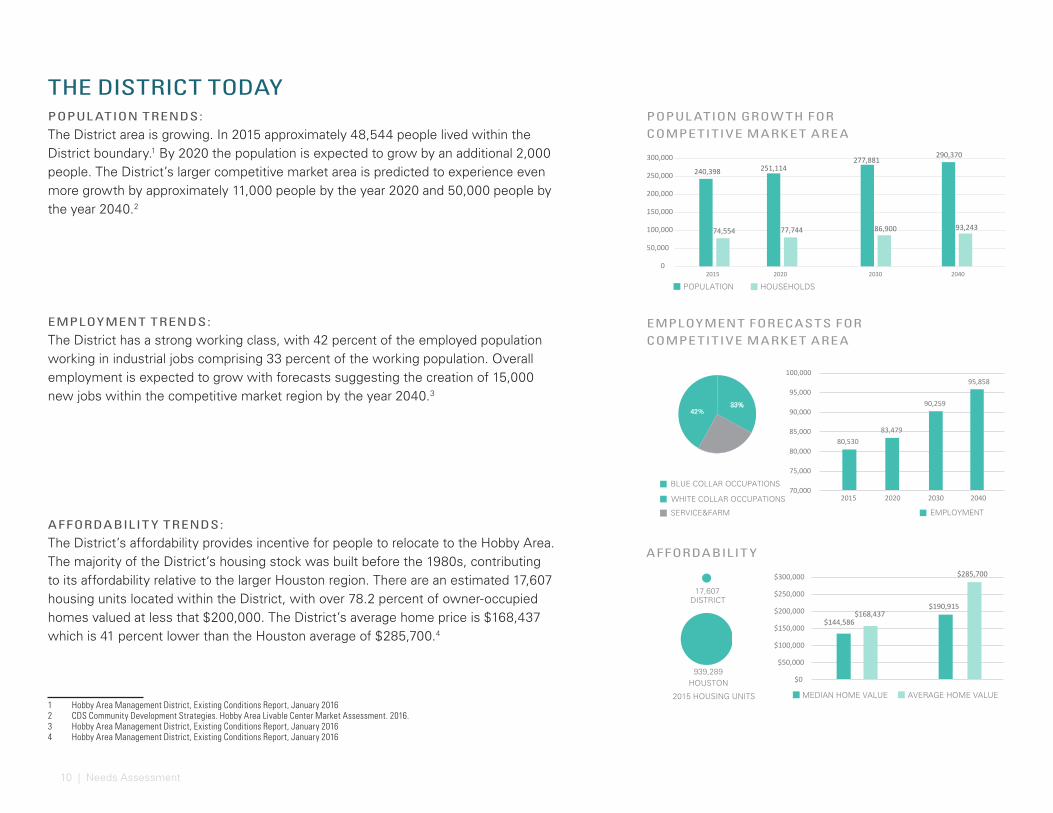
POPUL ATION TRENDS:
The District area is growing. In 2015 approximately 48,544 people lived within the District boundary.1 By 2020 the population is expected to grow by an additional 2,000 people. The District’s larger competitive market area is predicted to experience even more growth by approximately 11,000 people by the year 2020 and 50,000 people by the year 2040.2
EMPLOYMENT TRENDS:
The District has a strong working class, with 42 percent of the employed population working in industrial jobs comprising 33 percent of the working population. Overall employment is expected to grow with forecasts suggesting the creation of 15,000 new jobs within the competitive market region by the year 2040.3
AFFORDABILIT Y TRENDS:
The District’s affordability provides incentive for people to relocate to the Hobby Area. The majority of the District’s housing stock was built before the 1980s, contributing to its affordability relative to the larger Houston region. There are an estimated 17,607 housing units located within the District, with over 78.2 percent of owner-occupied homes valued at less that $200,000. The District’s average home price is $168,437 which is 41 percent lower than the Houston average of $285,700.4
1 Hobby Area Management District, Existing Conditions Report, January 2016 2 CDS Community Development Strategies. Hobby Area Livable Center Market Assessment. 2016.3 Hobby Area Management District, Existing Conditions Report, January 20164 Hobby Area Management District, Existing Conditions Report, January 2016
THE DISTRICT TODAY
11
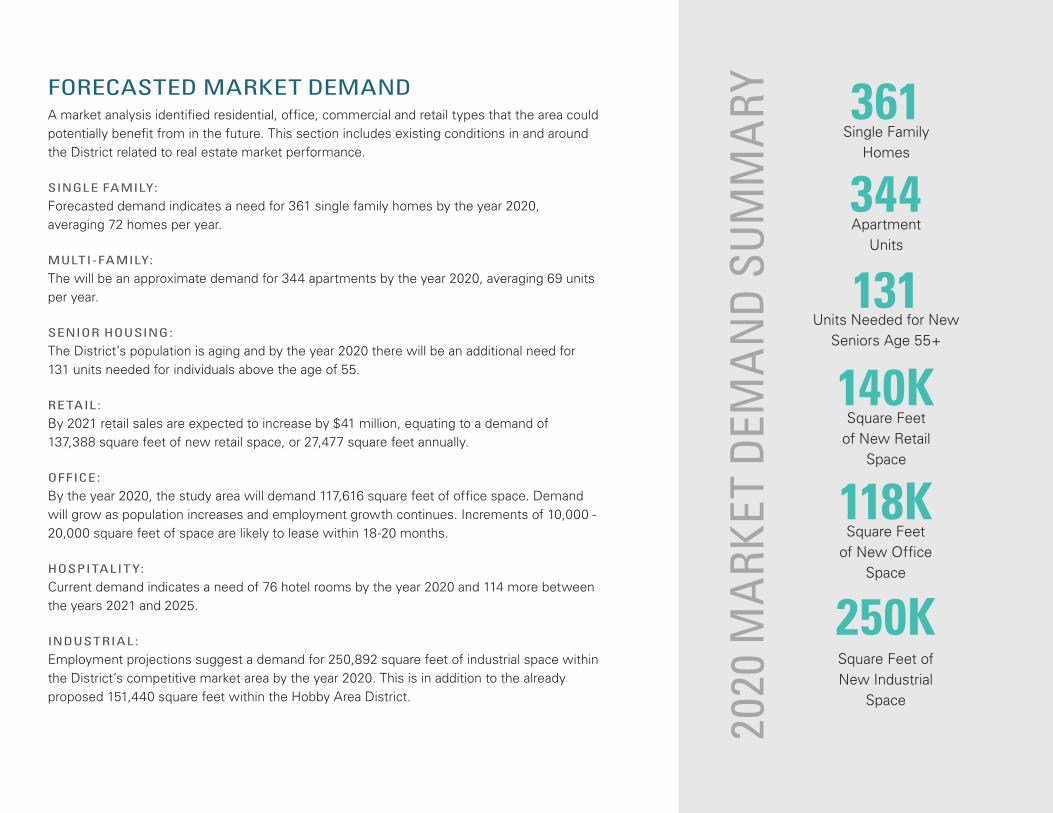
FORECASTED MARKET DEMANDA market analysis identified residential, office, commercial and retail types that the area could potentially benefit from in the future. This section includes existing conditions in and around the District related to real estate market performance.
SINGLE FAMILY:
Forecasted demand indicates a need for 361 single family homes by the year 2020, averaging 72 homes per year.
MULTI-FAMILY:
The will be an approximate demand for 344 apartments by the year 2020, averaging 69 units per year.
SENIOR HOUSING:
The District’s population is aging and by the year 2020 there will be an additional need for 131 units needed for individuals above the age of 55.
RE TAIL :
By 2021 retail sales are expected to increase by $41 million, equating to a demand of 137,388 square feet of new retail space, or 27,477 square feet annually.
OFFICE :
By the year 2020, the study area will demand 117,616 square feet of office space. Demand will grow as population increases and employment growth continues. Increments of 10,000 - 20,000 square feet of space are likely to lease within 18-20 months.
HOSPITALIT Y:
Current demand indicates a need of 76 hotel rooms by the year 2020 and 114 more between the years 2021 and 2025.
INDUSTRIAL :
Employment projections suggest a demand for 250,892 square feet of industrial space within the District’s competitive market area by the year 2020. This is in addition to the already proposed 151,440 square feet within the Hobby Area District.
361
2020
MA
RKET
DEM
AN
D SU
MM
ARY
344
131
140K
118K
250K
Single Family Homes
Apartment Units
Units Needed for New Seniors Age 55+
Square Feet of New Retail
Space
Square Feet of New Office
Space
Square Feet of New Industrial
Space

12 | Needs Assessment
K E Y TAK E AWAYS:
• 9 , 4 0 0 ACRE DISTRIC T ARE A
• NE W EST RESIDENTIAL DE VELOPMENT ALONG HEF FERMAN STREE T
• GL ENBROOK VAL L E Y, A SUBDIVISION OF MIDCENTURY HOMES, IS OF GROWING INTEREST TO HOME BU Y ERS
• THERE IS POTENTIAL TO ENCOUR AGE MANUFAC TURING, W HICH BOOSTS EMPLOY MENT AND DAY TIME AC TIVIT Y, POSITIVELY IMPAC TING RE TAIL AND RESIDENTIAL USES
EXISTING CONDITIONS ANALYSIS
Figure 4: Existing Land Use
L AND USE
A key ingredient of a Livable Center is having many uses near each other. At a district scale, the areas host a diverse mix of land uses areas. There are 9,358 single family homes in the Hobby Area District and 8,937 multi-family homes, which include apartments, townhomes, duplexes, tri-plexes and four-plexes. The newest development is Southview Villas along Hefferman Street, which includes “for lease” townhomes built in 2015. Glenbrook Valley, a subdivision of midcentury homes, is of growing interest to home buyers. Work destinations are limited outside of the airport, but businesses parks along Airport Boulevard and Telephone Road are home to 390 active industrial offices. Commercial activity is largely comprised of auto-dominant strip retail and is not necessarily well utilized by area residents, particularly those with disposable income. A detailed inventory of district destinations is provided in Appendix E on page 221.
Source: City of Houston GIS Public Data, 2016
L AND USE
0 - AGRICULTURE PRODUC TION
1- SINGL E FAMILY RESIDENTIAL
2- MULTI-FAMILY RESIDENTIAL
3 - COMMERCIAL
4 - OF FICE
5 - INDUSTRIAL
6 - PUBLIC / INS TITUTIONAL [E XEMP T ]
7- TR ANSPOR TATION / UTIL IT Y [ E XEMP T ]
8 - PARK / OPEN SPACES
9- UNDE VELOPED
# - STUDY ARE A BOUNDARY
2 7% SINGL E FAMILY
4 .5% MULTI- FAMILY
31% COMMERCIAL AND OF FICE
1.8 % INDUSTRIAL
2 .3 % E XEMP T
1% OPEN SPACE
2% UNDE VELOPED
8 % AGRICULTURE
DIXIE DR
GULF FREEWAY (IH-45)
MYKAW
A RD
BROADWAY ST
TELEPHONE RD
BELLFORT ST.
AIRPORT BLVD
ALMEDA GENOA RD
13
NUMBER OF VEHICL ES PER DAY
UP TO 6, 0 0 0
6 , 0 0 01 - 15 , 0 0 0
15, 0 0 01 - 3 0, 0 0 0
3 0, 0 01 - 5 0, 0 0 0
5 0, 0 01 - 10 0, 0 0 0
MORE THAN 10 0 .0 0 0
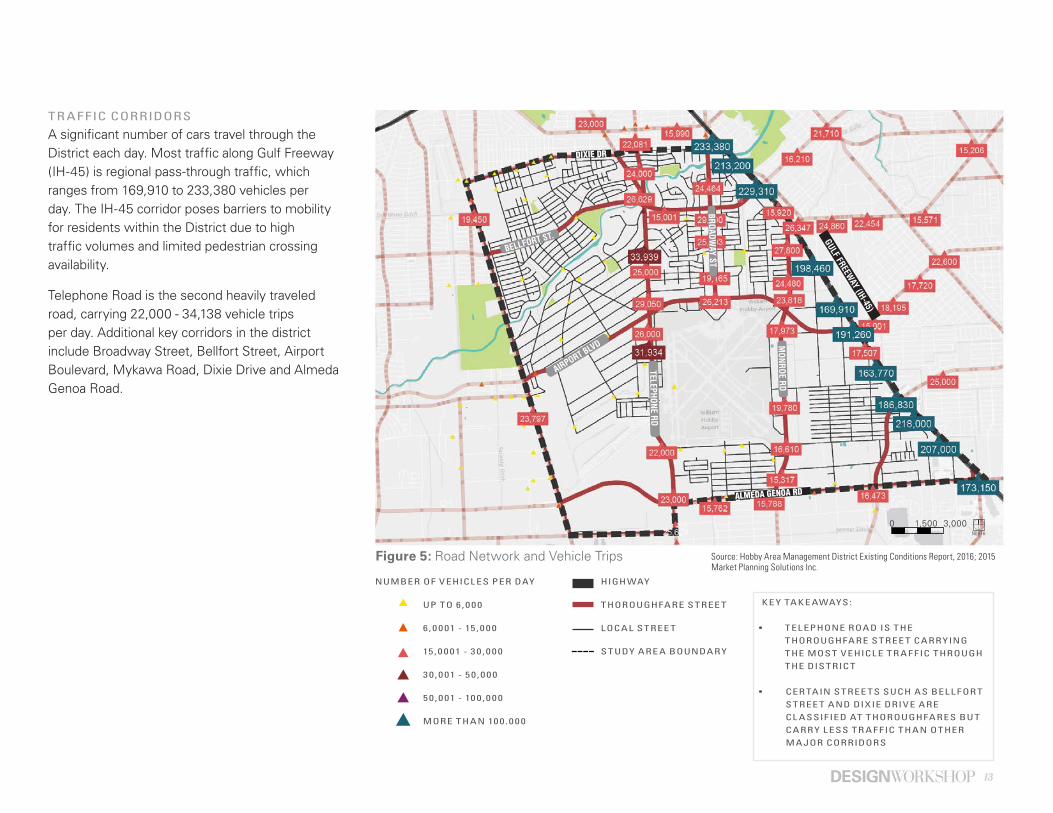
Figure 5: Road Network and Vehicle Trips
TR AFFIC CORRIDORS
A significant number of cars travel through the District each day. Most traffic along Gulf Freeway (IH-45) is regional pass-through traffic, which ranges from 169,910 to 233,380 vehicles per day. The IH-45 corridor poses barriers to mobility for residents within the District due to high traffic volumes and limited pedestrian crossing availability.
Telephone Road is the second heavily traveled road, carrying 22,000 - 34,138 vehicle trips per day. Additional key corridors in the district include Broadway Street, Bellfort Street, Airport Boulevard, Mykawa Road, Dixie Drive and Almeda Genoa Road.
Source: Hobby Area Management District Existing Conditions Report, 2016; 2015 Market Planning Solutions Inc.
HIGHWAY
THOROUGHFARE STREE T
LOCAL STREE T
STUDY ARE A BOUNDARY
0 1,500 3,000NORTH
DIXIE DR
GULF FREEWAY (IH-45)
BROADWAY ST
TELEPHONE RD
MONROE RD
BELLFORT ST.
AIRPORT BLVD
ALMEDA GENOA RD
K E Y TAK E AWAYS:
• TEL EPHONE ROAD IS THE THOROUGHFARE STREE T CARRYING THE MOST VEHICL E TR A F FIC THROUGH THE DISTRIC T
• CER TAIN STREE TS SUCH AS BEL L FOR T STREE T AND DIXIE DRIVE ARE CL ASSIFIED AT THOROUGHFARES BUT CARRY L ESS TR A F FIC THAN OTHER MA JOR CORRIDORS
14 | Needs Assessment
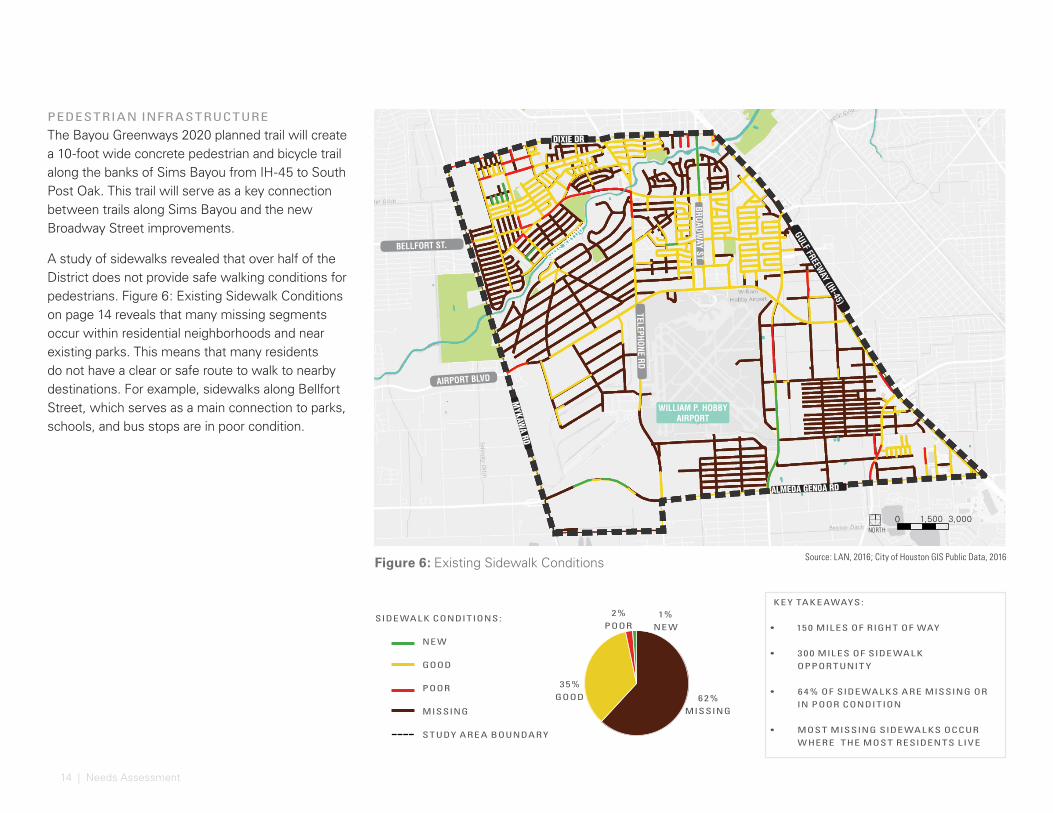
Figure 6: Existing Sidewalk Conditions Source: LAN, 2016; City of Houston GIS Public Data, 2016
PEDESTRIAN INFR ASTRUCTURE
The Bayou Greenways 2020 planned trail will create a 10-foot wide concrete pedestrian and bicycle trail along the banks of Sims Bayou from IH-45 to South Post Oak. This trail will serve as a key connection between trails along Sims Bayou and the new Broadway Street improvements.
A study of sidewalks revealed that over half of the District does not provide safe walking conditions for pedestrians. Figure 6: Existing Sidewalk Conditions on page 14 reveals that many missing segments occur within residential neighborhoods and near existing parks. This means that many residents do not have a clear or safe route to walk to nearby destinations. For example, sidewalks along Bellfort Street, which serves as a main connection to parks, schools, and bus stops are in poor condition.
0 1,500 3,000
BROADWAY ST
TELEPHONE RD
BELLFORT ST.
AIRPORT BLVD
SIMS BAY
OU
WILLIAM P. HOBBY AIRPORT
DIXIE DR
GULF FREEWAY (IH-45)
MYKAW
A RD
ALMEDA GENOA RD
SIDE WAL K CONDITIONS:
NE W
GOOD
POOR
MISSING
STUDY ARE A BOUNDARY
NORTH
62% MISSING
3 5% GOOD
2% POOR
1% NE W
K E Y TAK E AWAYS:
• 15 0 MIL ES OF RIGHT OF WAY
• 3 0 0 MIL ES OF SIDE WAL K OPPOR TUNIT Y
• 6 4% OF SIDE WAL KS ARE MISSING OR IN POOR CONDITION
• MOST MISSING SIDE WAL KS OCCUR W HERE THE MOST RESIDENTS L IVE
15
7
7
7
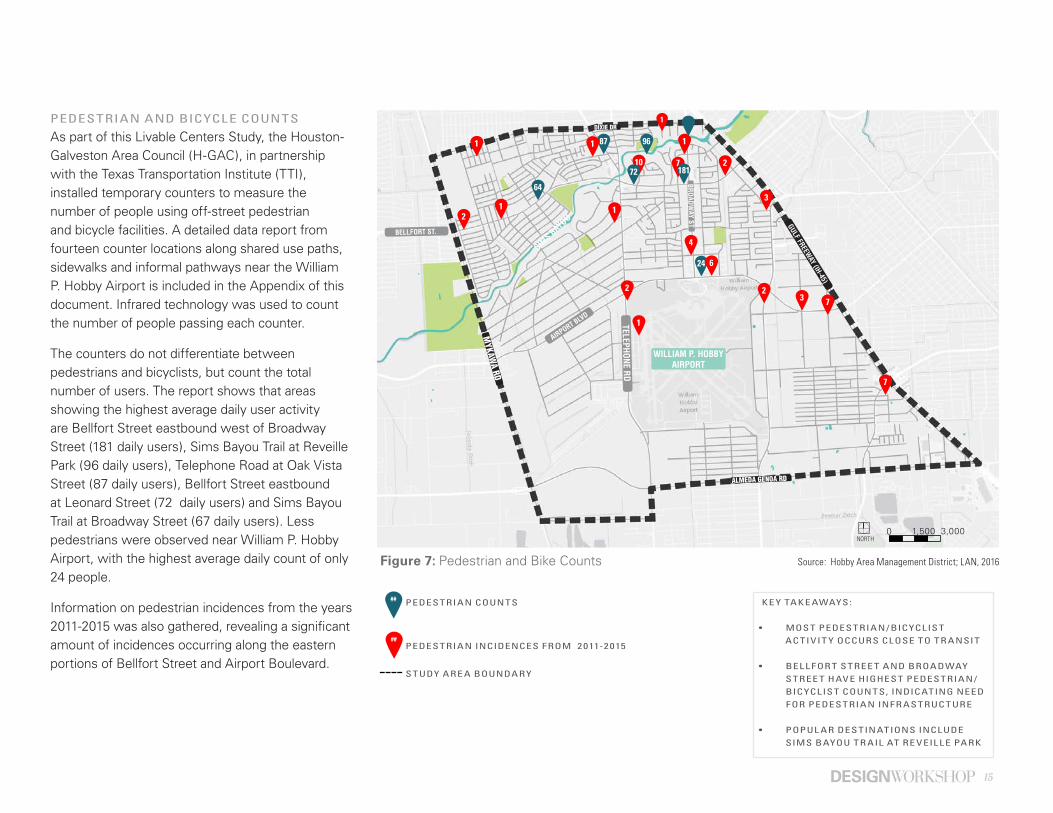
Figure 7: Pedestrian and Bike Counts
181
9687
64
24
2
2
3
3
4
6
2 2
1
1
1
1
1
1
1072
67
##
##
1
K E Y TAK E AWAYS:
• MOST PEDESTRIAN / BICYCLIST AC TIVIT Y OCCURS CLOSE TO TR ANSIT
• BEL L FOR T STREE T AND BROADWAY STREE T HAVE HIGHEST PEDESTRIAN /BICYCLIST COUNTS, INDICATING NEED FOR PEDESTRIAN INFR ASTRUC TURE
• POPUL AR DESTINATIONS INCLUDE SIMS BAYOU TR AIL AT RE VEIL L E PARK
PEDESTRIAN AND BICYCLE COUNTS
As part of this Livable Centers Study, the Houston-Galveston Area Council (H-GAC), in partnership with the Texas Transportation Institute (TTI), installed temporary counters to measure the number of people using off-street pedestrian and bicycle facilities. A detailed data report from fourteen counter locations along shared use paths, sidewalks and informal pathways near the William P. Hobby Airport is included in the Appendix of this document. Infrared technology was used to count the number of people passing each counter.
The counters do not differentiate between pedestrians and bicyclists, but count the total number of users. The report shows that areas showing the highest average daily user activity are Bellfort Street eastbound west of Broadway Street (181 daily users), Sims Bayou Trail at Reveille Park (96 daily users), Telephone Road at Oak Vista Street (87 daily users), Bellfort Street eastbound at Leonard Street (72 daily users) and Sims Bayou Trail at Broadway Street (67 daily users). Less pedestrians were observed near William P. Hobby Airport, with the highest average daily count of only 24 people.
Information on pedestrian incidences from the years 2011-2015 was also gathered, revealing a significant amount of incidences occurring along the eastern portions of Bellfort Street and Airport Boulevard.
NORTH
Source: Hobby Area Management District; LAN, 2016
BROADWAY ST
0 1,500 3,000
DIXIE DR
GULF FREEWAY (IH-45)
MYKAW
A RD
TELEPHONE RD
BELLFORT ST.
AIRPORT BLVD
ALMEDA GENOA RD
SIMS BAY
OU
WILLIAM P. HOBBY AIRPORT
PEDESTRIAN COUNTS
PEDESTRIAN INCIDENCES F ROM 2 011-2 015
STUDY ARE A BOUNDARY
16 | Needs Assessment
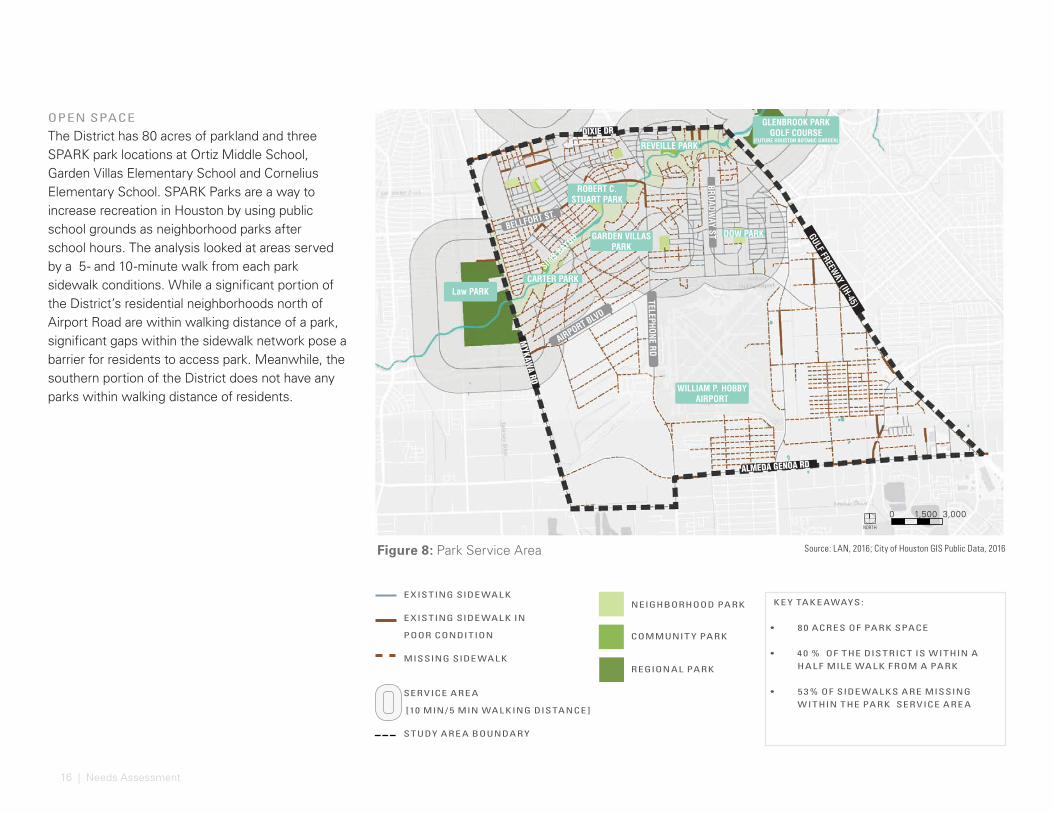
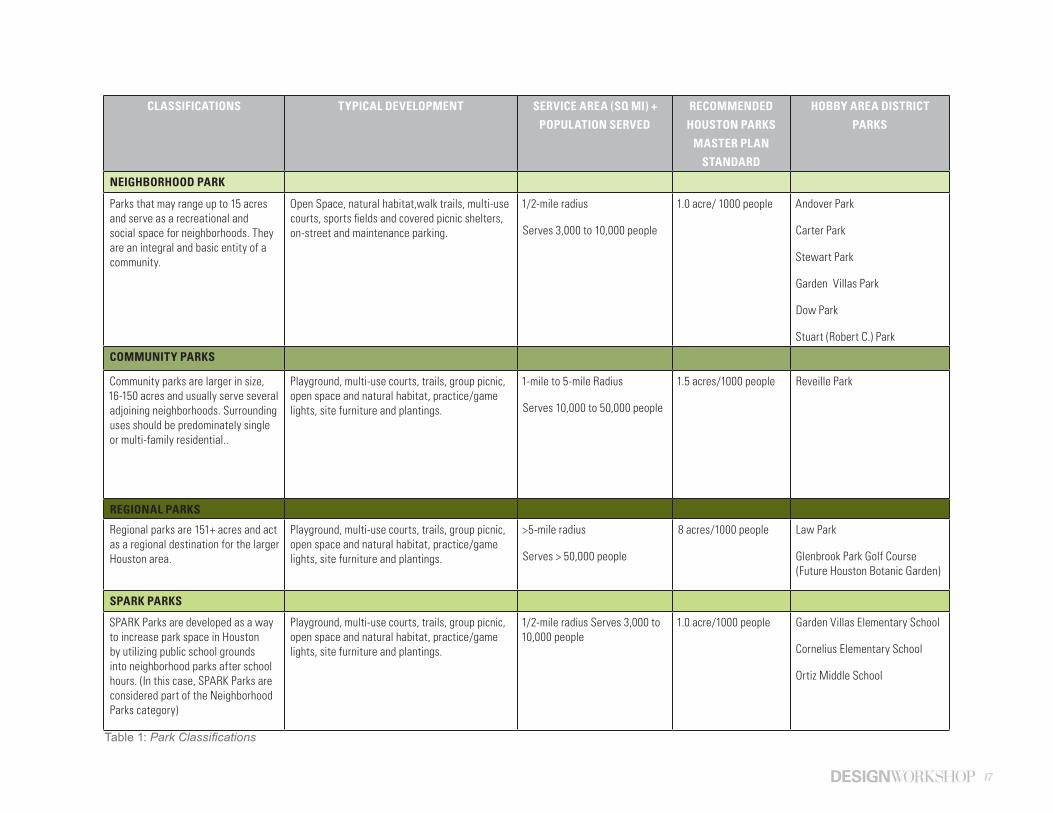
Figure 8: Park Service Area
OPEN SPACE
The District has 80 acres of parkland and three SPARK park locations at Ortiz Middle School, Garden Villas Elementary School and Cornelius Elementary School. SPARK Parks are a way to increase recreation in Houston by using public school grounds as neighborhood parks after school hours. The analysis looked at areas served by a 5- and 10-minute walk from each park sidewalk conditions. While a significant portion of the District’s residential neighborhoods north of Airport Road are within walking distance of a park, significant gaps within the sidewalk network pose a barrier for residents to access park. Meanwhile, the southern portion of the District does not have any parks within walking distance of residents.
E XISTING SIDE WAL K
E XISTING SIDE WAL K IN
POOR CONDITION
MISSING SIDE WAL K
SERVICE ARE A
[10 MIN / 5 MIN WAL KING DISTANCE ]
STUDY ARE A BOUNDARY
Source: LAN, 2016; City of Houston GIS Public Data, 2016
NEIGHBORHOOD PARK
COMMUNIT Y PARK
REGIONAL PARK
K E Y TAK E AWAYS:
• 8 0 ACRES OF PARK SPACE
• 4 0 % OF THE DISTRIC T IS WITHIN A HAL F MIL E WAL K F ROM A PARK
• 5 3 % OF SIDE WAL KS ARE MISSING WITHIN THE PARK SERVICE ARE A
GLENBROOK PARK GOLF COURSE
(FUTURE HOUSTON BOTANIC GARDEN)
0 1,500 3,000
DOW PARK
WILLIAM P. HOBBY AIRPORT
HOUSTON BOTANIC GARDEN
GARDEN VILLAS PARK
REVEILLE PARK
CARTER PARKLaw PARK
ROBERT C. STUART PARK
DIXIE DR
GULF FREEWAY (IH-45)
MYKAW
A RD
BROADWAY ST
TELEPHONE RD
BELLFORT ST.
AIRPORT BLVD
ALMEDA GENOA RD
SIMS BAY
OU
NORTH
17
CLASSIFICATIONS TYPICAL DEVELOPMENT SERVICE AREA (SQ MI) +
POPULATION SERVED
RECOMMENDED
HOUSTON PARKS
MASTER PLAN
STANDARD
HOBBY AREA DISTRICT
PARKS
NEIGHBORHOOD PARK
Parks that may range up to 15 acres and serve as a recreational and social space for neighborhoods. They are an integral and basic entity of a community.
Open Space, natural habitat,walk trails, multi-use courts, sports fields and covered picnic shelters, on-street and maintenance parking.
1/2-mile radius
Serves 3,000 to 10,000 people
1.0 acre/ 1000 people Andover Park
Carter Park
Stewart Park
Garden Villas Park
Dow Park
Stuart (Robert C.) Park
COMMUNITY PARKS
Community parks are larger in size, 16-150 acres and usually serve several adjoining neighborhoods. Surrounding uses should be predominately single or multi-family residential..
Playground, multi-use courts, trails, group picnic, open space and natural habitat, practice/game lights, site furniture and plantings.
1-mile to 5-mile Radius
Serves 10,000 to 50,000 people
1.5 acres/1000 people Reveille Park
REGIONAL PARKS
Regional parks are 151+ acres and act as a regional destination for the larger Houston area.
Playground, multi-use courts, trails, group picnic, open space and natural habitat, practice/game lights, site furniture and plantings.
>5-mile radius
Serves > 50,000 people
8 acres/1000 people Law Park
Glenbrook Park Golf Course (Future Houston Botanic Garden)
SPARK PARKS
SPARK Parks are developed as a way to increase park space in Houston by utilizing public school grounds into neighborhood parks after school hours. (In this case, SPARK Parks are considered part of the Neighborhood Parks category)
Playground, multi-use courts, trails, group picnic, open space and natural habitat, practice/game lights, site furniture and plantings.
1/2-mile radius Serves 3,000 to 10,000 people
1.0 acre/1000 people Garden Villas Elementary School
Cornelius Elementary School
Ortiz Middle School
Table 1: Park Classifications

18 | Needs Assessment
BICYCLE NE T WORK AND TR AILS
The District has minimal bike infrastructure. The existing signed bike routes lead cyclists down busy roads, many of them showing signs of wear and tear. Routes are not separated from the roadway and do not have striped designated bike lanes or sharrow markings.
The Houston Bike Master Plan has identified streets for future designated bike routes, including well marked, on street shared routes and off street shared use trails. These recommendations can be seen to the right in Figure 9: Bicycle Network.
In addition, the Bayou Greenways 2020 Initiative will add 2.5 miles of shared use path along the northern bank of Sims Bayou. Future shared-use paths will be extended from the Gulf Freeway (IH-45) and the Houston Botanic Garden to Law Park at Maykawa Road.
DOW PARK
WILLIAM P. HOBBY AIRPORT
GARDEN VILLAS PARK
REVEILLE PARK
CARTER PARKLAW PARK
ROBERT C. STUART PARK
DIXIE DR
GULF FREEWAY (IH-45)
MYKAW
A RD
BROADWAY ST
TELEPHONE RD
BELLFORT ST.
AIRPORT BLVD
ALMEDA GENOA RD
SIMS BAY
OU
MON
ROE
ROAD
DRA
INAG
E CH
ANNE
L
Figure 9: Bicycle Network Source: City of Houston Bike Plan ; City of Houston GIS Public Data, 2016
K E Y TAK E AWAYS:
• 9 .7 MIL ES OF E XISTING BUT DANGEROUS AND POORLY MARK ED BIK E ROUTES
• PL ANNED 3 4 .5 MIL ES OF UPDATED BIK E ROUTES
GLENBROOK PARK GOLF COURSE
(FUTURE HOUSTON BOTANIC GARDEN)
E XISTING SIGNED BIK E ROUTE*
E XISTING OF F -STREE T TR AIL
F UTURE OF F -STREE T TR AIL
F UTURE DEDICATED IN STREE T RIGHT OF WAY
F UTURE SHARED ON-STREE T
*SIGNED BIK E ROU T ES DO NOT INCLUDE A S T RIPED BIK E L ANE
19
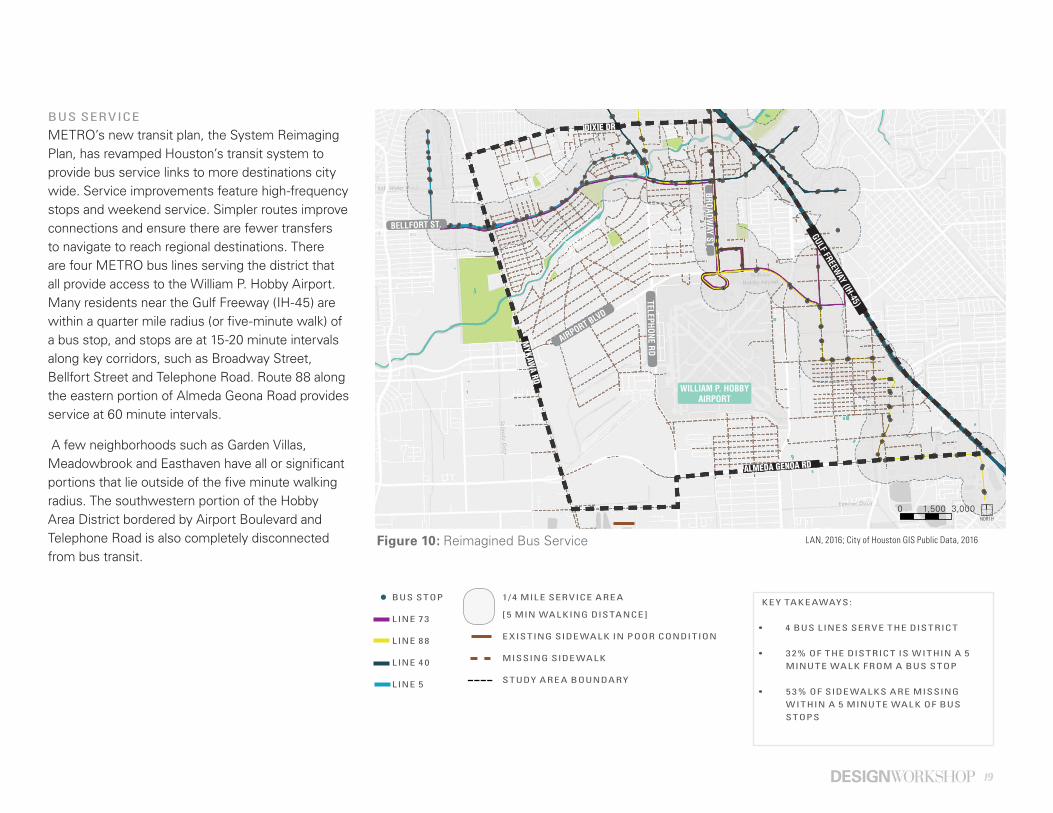
Figure 10: Reimagined Bus Service
BUS SERVICE
METRO’s new transit plan, the System Reimaging Plan, has revamped Houston’s transit system to provide bus service links to more destinations city wide. Service improvements feature high-frequency stops and weekend service. Simpler routes improve connections and ensure there are fewer transfers to navigate to reach regional destinations. There are four METRO bus lines serving the district that all provide access to the William P. Hobby Airport. Many residents near the Gulf Freeway (IH-45) are within a quarter mile radius (or five-minute walk) of a bus stop, and stops are at 15-20 minute intervals along key corridors, such as Broadway Street, Bellfort Street and Telephone Road. Route 88 along the eastern portion of Almeda Geona Road provides service at 60 minute intervals.
A few neighborhoods such as Garden Villas, Meadowbrook and Easthaven have all or significant portions that lie outside of the five minute walking radius. The southwestern portion of the Hobby Area District bordered by Airport Boulevard and Telephone Road is also completely disconnected from bus transit.
K E Y TAK E AWAYS:
• 4 BUS L INES SERVE THE DISTRIC T
• 3 2% OF THE DISTRIC T IS WITHIN A 5 MINUTE WAL K F ROM A BUS STOP
• 5 3 % OF SIDE WAL KS ARE MISSING WITHIN A 5 MINUTE WAL K OF BUS STOPS
1/4 MIL E SERVICE ARE A
[ 5 MIN WAL KING DISTANCE ]
E XISTING SIDE WAL K IN POOR CONDITION
MISSING SIDE WAL K
STUDY ARE A BOUNDARY
BUS STOP
LINE 73
L INE 8 8
L INE 4 0
L INE 5
LAN, 2016; City of Houston GIS Public Data, 2016
0 1,500 3,000
DIXIE DR
GULF FREEWAY (IH-45)
MYKAW
A RD
BROADWAY ST
TELEPHONE RD
BELLFORT ST.
AIRPORT BLVD
ALMEDA GENOA RD
SIMS BAY
OU
WILLIAM P. HOBBY AIRPORT
NORTH
20 | Needs Assessment
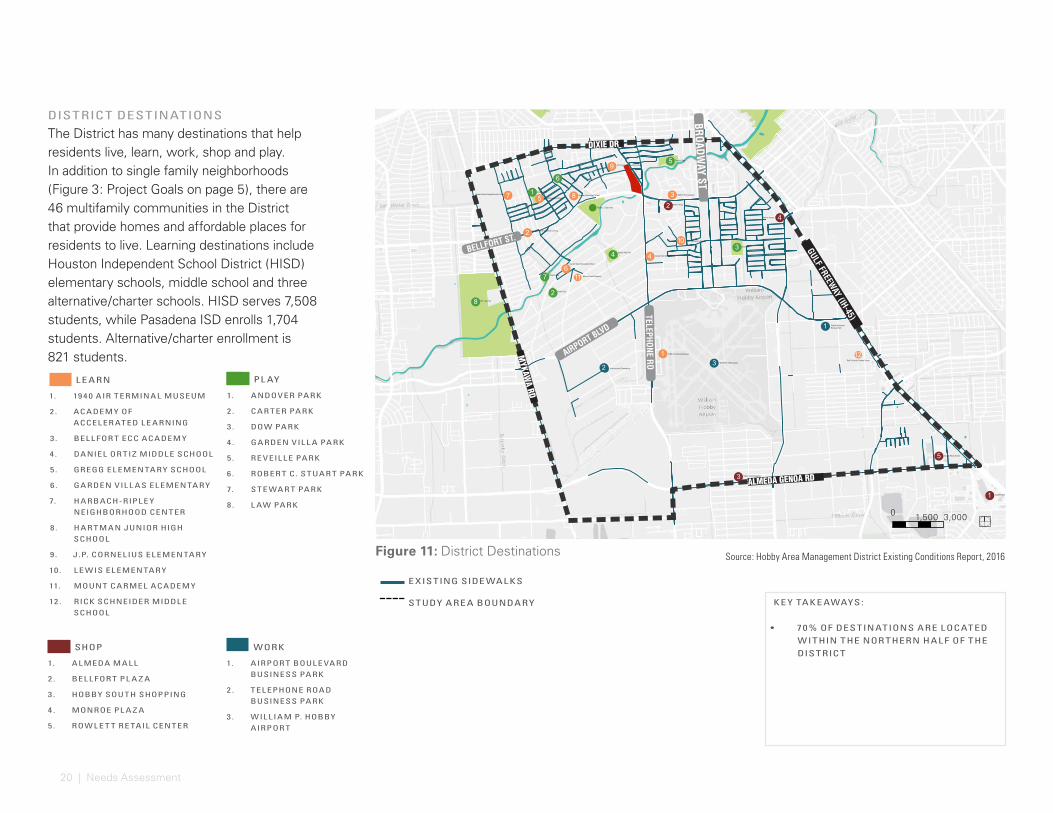
Figure 11: District Destinations
DISTRICT DESTINATIONS
The District has many destinations that help residents live, learn, work, shop and play. In addition to single family neighborhoods (Figure 3: Project Goals on page 5), there are 46 multifamily communities in the District that provide homes and affordable places for residents to live. Learning destinations include Houston Independent School District (HISD) elementary schools, middle school and three alternative/charter schools. HISD serves 7,508 students, while Pasadena ISD enrolls 1,704 students. Alternative/charter enrollment is 821 students.
Lewis Elementary School
Dow Park
Andover Park
Academy of Accelerated Learning
Gregg Elementary SchoolHartman Junior High SchoolHarbach-Ripley Neighborhood Center
Garden Villas Elementary School
Mount Carmel Academy
Garden Villa Park
F.M. Law Park
William P. Hobby Airport
1940 Air Terminal Musuem
Daniel Ortiz Middle School
Bellfort ECC Acadamy
J.P. Cornelius Elementary School
Stewart Park
Carter Park
Hobby South Shopping
Rick Schneider Middle School
Almeda Mall
Rowlett Retail Center
Reveille Park
Industrial and Commercial
Robert C. Stuart Park
Airport Boulevard Business Park
Bellfort Plaza
Monroe Center
1
2
3
4
5
6
7 8
9
11
12
1
2
3
4
5
1
2
34
5
6
7
8
1
2
0 1,500 3,000
3
K E Y TAK E AWAYS:
• 70 % OF DESTINATIONS ARE LOCATED WITHIN THE NOR THERN HAL F OF THE DISTRIC T
PL AY
1. ANDOV ER PA RK
2 . CA R T ER PA RK
3. DOW PA RK
4 . GA RDEN VIL L A PA RK
5. RE V EIL L E PA RK
6. ROBER T C. S T UA R T PA RK
7. S T E WA R T PA RK
8. L AW PA RK
L E ARN
1. 19 4 0 AIR T ERMINA L MUSEUM
2 . ACADEM Y OF ACCEL ER AT ED L E A RNING
3. BEL L FOR T ECC ACADEM Y
4 . DANIEL OR TIZ MIDDL E SCHOOL
5. GREGG EL EMENTA RY SCHOOL
6. GA RDEN VIL L AS EL EMENTA RY
7. HA RBACH-RIPL E Y NEIGHBORHOOD CENT ER
8. HA R T M AN JUNIOR HIGH SCHOOL
9. J.P. CORNELIUS EL EMENTA RY
10. L E WIS EL EMENTA RY
11. MOUNT CA RMEL ACADEM Y
12 . RICK SCHNEIDER MIDDL E SCHOOL
Source: Hobby Area Management District Existing Conditions Report, 2016
SHOP
1. A L MEDA M A L L
2 . BEL L FOR T PL A Z A
3. HOBBY SOU TH SHOPPING
4 . MONROE PL A Z A
5. ROW L E T T RE TAIL CENT ER
WORK
1. AIRPOR T BOUL E VA RD BUSINESS PA RK
2 . T EL EPHONE ROAD BUSINESS PA RK
3. WIL L IA M P. HOBBY AIRPOR T
E XISTING SIDE WAL KS
STUDY ARE A BOUNDARY
ALMEDA GENOA RD
DIXIE DR
GULF FREEWAY (IH-45)
MYKAW
A RD
BROADWAY ST
TELEPHONE RD
BELLFORT ST.
AIRPORT BLVD
10

21
FLOODWAY
10 0 - Y E AR FLOODPL AIN
5 0 0 - Y E AR FLOODPL AIN
PARK
STUDY ARE A BOUNDARY
Figure 12: Flood Prone Areas
ENVIRONMENTAL / FLOODWAY
The 100-year and 500-year floodplains are dominant natural features within the study area. Sims Bayou begins near Missouri City inside Beltway 8 and meanders until it reaches Buffalo Bayou. Along the way, it passes Robert C. Stuart Park and Glenbrook Park Golf Course. Sims Bayou has recently undergone flood control improvements through the Federal Flood Damage Reduction project partnership between the U.S. Army Corps of Engineers and the Harris County Flood Control District.
Source: LAN, 2016; City of Houston GIS Public Data, 2016
0 1,500 3,000NORTH
K E Y TAK E AWAYS:
• 2 MA JOR DR AINAGE CHANNEL S - SIMS BAYOU AND MONROE ROAD
• 10 % OF THE DISTRIC T SITS WITHIN THE 5 0 0 -Y E AR FLOOD PL AIN
DOW PARK
WILLIAM P. HOBBY AIRPORT
GARDEN VILLAS PARK
REVEILLE PARK
CARTER PARKLAW PARK
ROBERT C. STUART PARK
DIXIE DR
GULF FREEWAY (IH-45)
MYKAW
A RD
BROADWAY ST
TELEPHONE RD
BELLFORT ST.
AIRPORT BLVD
ALMEDA GENOA RD
SIMS BAY
OU
MON
ROE
ROAD
DRA
INAG
E CH
ANNE
L
GLENBROOK PARK GOLF COURSE
(FUTURE HOUSTON BOTANIC GARDEN)
22 | Envisioning Healthy Livable Centers
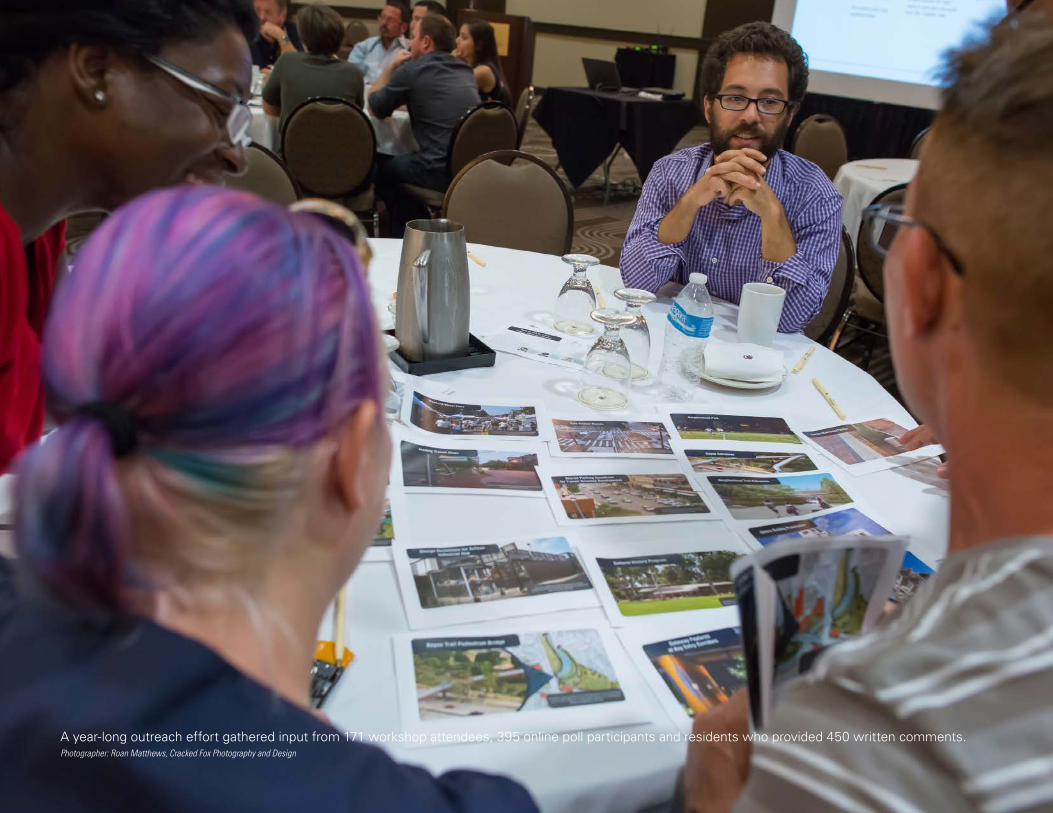
A year-long outreach effort gathered input from 171 workshop attendees, 395 online poll participants and residents who provided 450 written comments.Photographer: Roan Matthews, Cracked Fox Photography and Design
23
Envisioning Livable CentersHow can the District balance population and job growth while maintaining a place in which current and new residents can live, work and play? These challenges can be addressed at a variety of scales through planning and design. This chapter summarizes outcomes of a year long public outreach and visioning effort. The resulting vision and recommendations presented in the following pages is a direct result of community feedback. Each recommendation strives to reflect the community’s desires and provides a vision that guides future investments in a way that supports growth and improves the quality of life for existing residents.
Note: Concept designs are for illustrative purposes only and have not been formally reviewed nor approved by the City. Should these concept designs mature, they will undergo a formalized plan, design and construction process with appropriate permitting.
24 | Envisioning Healthy Livable Centers
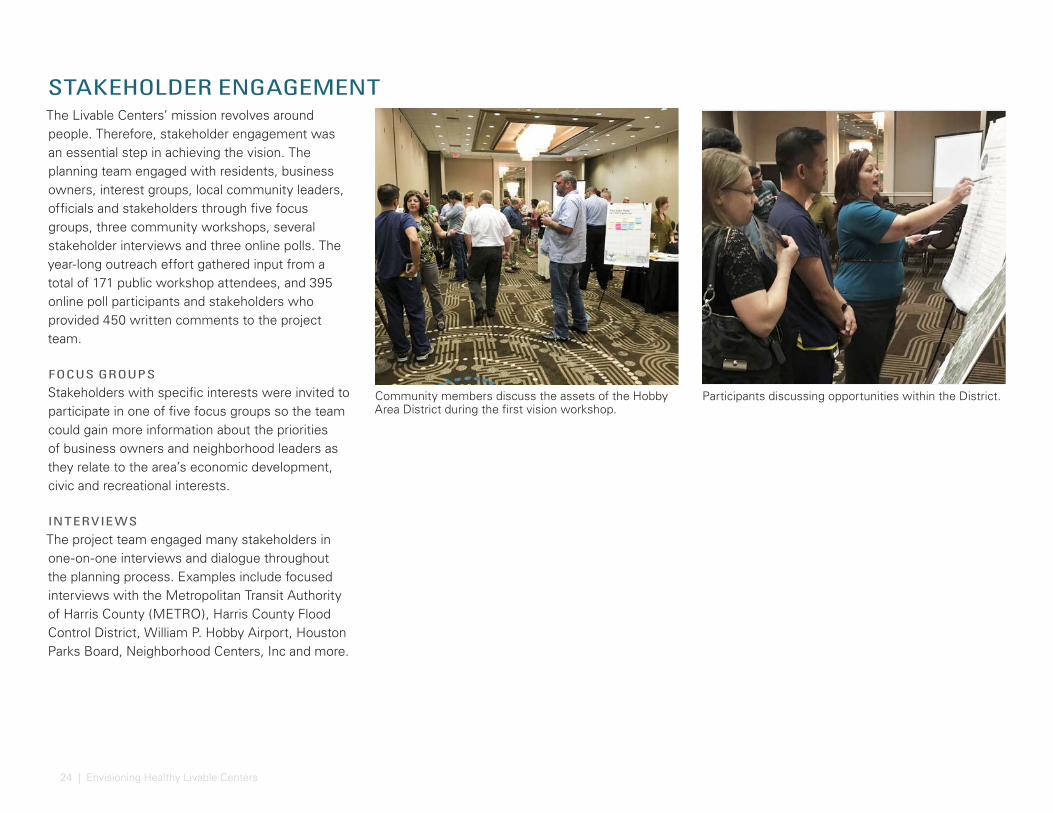
STAKEHOLDER ENGAGEMENTThe Livable Centers’ mission revolves around people. Therefore, stakeholder engagement was an essential step in achieving the vision. The planning team engaged with residents, business owners, interest groups, local community leaders, officials and stakeholders through five focus groups, three community workshops, several stakeholder interviews and three online polls. The year-long outreach effort gathered input from a total of 171 public workshop attendees, and 395 online poll participants and stakeholders who provided 450 written comments to the project team.
FOCUS GROUPS
Stakeholders with specific interests were invited to participate in one of five focus groups so the team could gain more information about the priorities of business owners and neighborhood leaders as they relate to the area’s economic development, civic and recreational interests.
INTERVIE WS
The project team engaged many stakeholders in one-on-one interviews and dialogue throughout the planning process. Examples include focused interviews with the Metropolitan Transit Authority of Harris County (METRO), Harris County Flood Control District, William P. Hobby Airport, Houston Parks Board, Neighborhood Centers, Inc and more.
Community members discuss the assets of the Hobby Area District during the first vision workshop.
Participants discussing opportunities within the District.
25
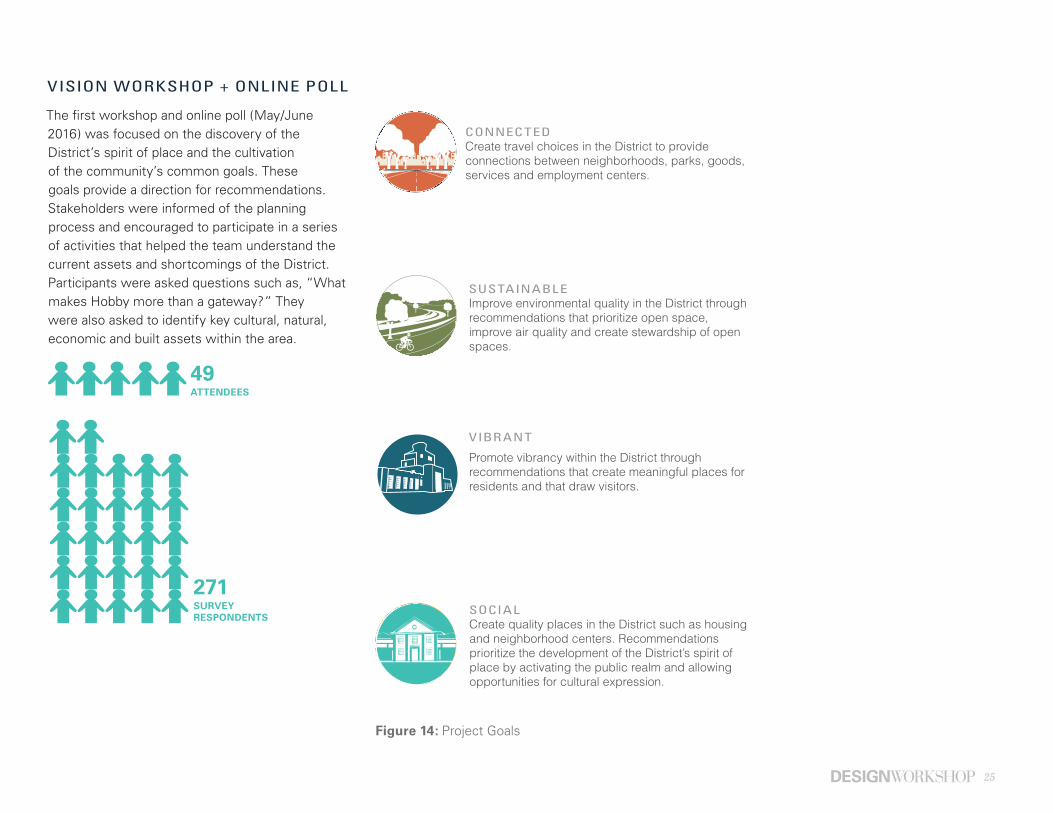
Figure 14: Project Goals
The first workshop and online poll (May/June 2016) was focused on the discovery of the District’s spirit of place and the cultivation of the community’s common goals. These goals provide a direction for recommendations. Stakeholders were informed of the planning process and encouraged to participate in a series of activities that helped the team understand the current assets and shortcomings of the District. Participants were asked questions such as, “What makes Hobby more than a gateway?” They were also asked to identify key cultural, natural, economic and built assets within the area.
VISION WORKSHOP + ONLINE POLL
CONNECTEDCreate travel choices in the District to provide connections between neighborhoods, parks, goods, services and employment centers.
SUSTAINABLEImprove environmental quality in the District through recommendations that prioritize open space, improve air quality and create stewardship of open spaces.
VIBR ANT
Promote vibrancy within the District through recommendations that create meaningful places for residents and that draw visitors.
SOCIALCreate quality places in the District such as housing and neighborhood centers. Recommendations prioritize the development of the District’s spirit of place by activating the public realm and allowing opportunities for cultural expression.
ATTENDEES
49
SURVEY RESPONDENTS
271

26 | Envisioning Healthy Livable Centers
VALUES WORKSHOP + ONLINE POLL
The second workshop (July/August 2016) focused on narrowing the goals identified in the first workshop and discovering the community’s specific needs and desires that would lead to a livable center. The team presented feedback from the previous workshop and the four goals were further broken down into strategies that are easily transferred into implementable steps. These strategies were gleaned from previous conversations with the public.
Figure 15: Keypad Polling Results - Participants picked their top priority within each goal category.
VIBR ANTCELEBRATE HISTORIC ELEMENTS
ESTABLISH MEMORABLE ARRIVAL E XPERIENCES
52%
48%
SOCIALENHANCE SERVICES FOR ALL
CRE ATE HOBBY-CENTRIC PROGRAMMING
PROMOTE HE ALTH AND WELLNESSSUPPORT CULTURAL E XPRESSION
PROVIDE QUALIT Y HOUSING
ACTIVATE SOCIAL CENTERS
21%
21%
19%
16%
13%
10%
SUSTAINABLEAMENITIZE STORMWATER CAPTURE ARE AS
STRENGTHEN THE DISTRICT’S NATURAL BE AUT Y
CRE ATE STE WARDSHIP OF SPACES
35%
35%
30%
CONNECTED
ENHANCE SAFET Y AND SECURIT Y
IMPROVE PEDESTRIAN AND BICYCLE CONNECTIONS
CONSIDER PHYSICAL BARRIERS TO PL ACEMAKING
PROVIDE AT TRACTIVE ALTERNATIVE TRANSPORTATION
31%
26%
22%
21%
ATTENDEES
SURVEY RESPONDENTS
87
65
KE Y PAD POLLING
Participants were asked to provide feedback on concepts, share their top priorities and offer additional ideas. During the workshop the project team used keypad polling as a method for gathering live responses about project values. Participants were given a list of potential implementation strategies relating to each goal category and were asked to pick the one they valued most. Participants were also encouraged to write down additional ideas on comment cards. The results list shown in Figure 15 provided a basis that would transform into recommendations reflecting the true needs of the community.
27
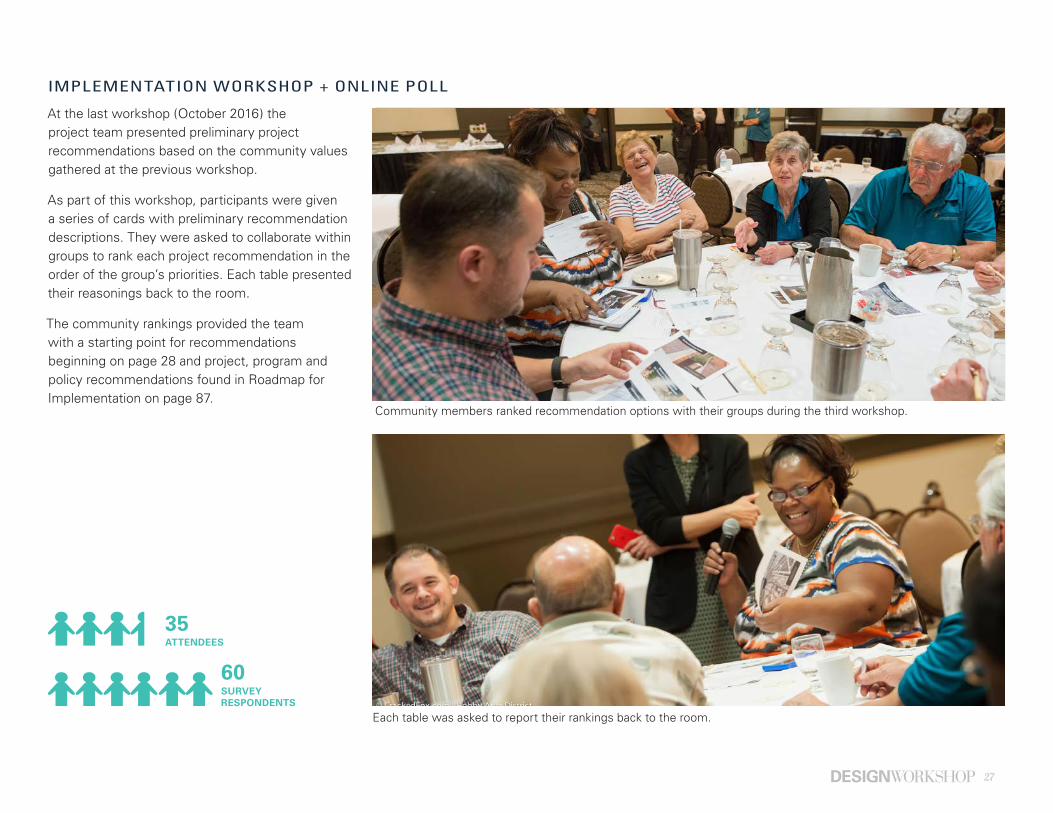
At the last workshop (October 2016) the project team presented preliminary project recommendations based on the community values gathered at the previous workshop.
As part of this workshop, participants were given a series of cards with preliminary recommendation descriptions. They were asked to collaborate within groups to rank each project recommendation in the order of the group’s priorities. Each table presented their reasonings back to the room.
The community rankings provided the team with a starting point for recommendations beginning on page 28 and project, program and policy recommendations found in Roadmap for Implementation on page 87.
IMPLEMENTATION WORKSHOP + ONLINE POLL
Each table was asked to report their rankings back to the room.
SURVEY RESPONDENTS
60
ATTENDEES
35
Community members ranked recommendation options with their groups during the third workshop.
28 | Envisioning Healthy Livable Centers
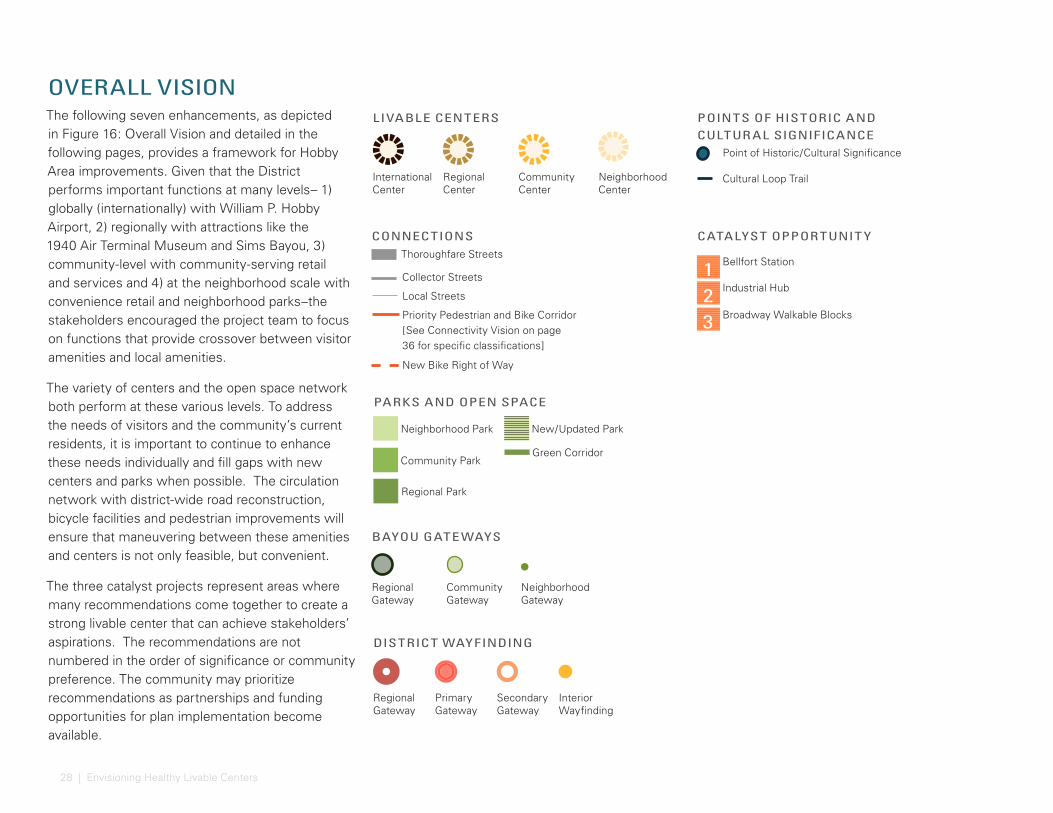
OVERALL VISIONThe following seven enhancements, as depicted in Figure 16: Overall Vision and detailed in the following pages, provides a framework for Hobby Area improvements. Given that the District performs important functions at many levels– 1) globally (internationally) with William P. Hobby Airport, 2) regionally with attractions like the 1940 Air Terminal Museum and Sims Bayou, 3) community-level with community-serving retail and services and 4) at the neighborhood scale with convenience retail and neighborhood parks–the stakeholders encouraged the project team to focus on functions that provide crossover between visitor amenities and local amenities.
The variety of centers and the open space network both perform at these various levels. To address the needs of visitors and the community’s current residents, it is important to continue to enhance these needs individually and fill gaps with new centers and parks when possible. The circulation network with district-wide road reconstruction, bicycle facilities and pedestrian improvements will ensure that maneuvering between these amenities and centers is not only feasible, but convenient.
The three catalyst projects represent areas where many recommendations come together to create a strong livable center that can achieve stakeholders’ aspirations. The recommendations are not numbered in the order of significance or community preference. The community may prioritize recommendations as partnerships and funding opportunities for plan implementation become available.
Community Park
New/Updated Park
PARKS AND OPEN SPACE
Neighborhood Park
Regional Park
Green Corridor
POINTS OF HISTORIC AND CULTUR AL SIGNIFICANCE
Point of Historic/Cultural Significance
Cultural Loop Trail
CATALYST OPPORTUNIT Y
Bellfort Station
Industrial Hub
Broadway Walkable Blocks
123
CONNECTIONS
Local Streets
Collector Streets
Thoroughfare Streets
LIVABLE CENTERS
Regional Center
International Center
Community Center
Neighborhood Center
DISTRICT WAYFINDING
Secondary Gateway
Primary Gateway
Regional Gateway
Interior Wayfinding
BAYOU GATE WAYS
Community Gateway
Regional Gateway
Neighborhood Gateway
Priority Pedestrian and Bike Corridor[See Connectivity Vision on page 36 for specific classifications]
New Bike Right of Way

29
DOW PARK
WILLIAM P. HOBBY AIRPORT
HOUSTON BOTANIC GARDEN
GARDEN VILLAS PARK
REVEILLE PARK
ANDOVER PARK
CARTER PARK
LAW PARK
ROBERT C. STUART
PARK
DIXIE DR
GULF FREEWAY (IH-45)
MYKAW
A RD
BROADWAY ST
TELEPHONE RD
MON
ROE RD
BELLFORT ST.
AIRPORT BLVD
ALMEDA GENOA RD
SIMS BAYOU
STEWART PARK
Figure 16: Overall Vision
2
3
1
30 | Envisioning Healthy Livable Centers
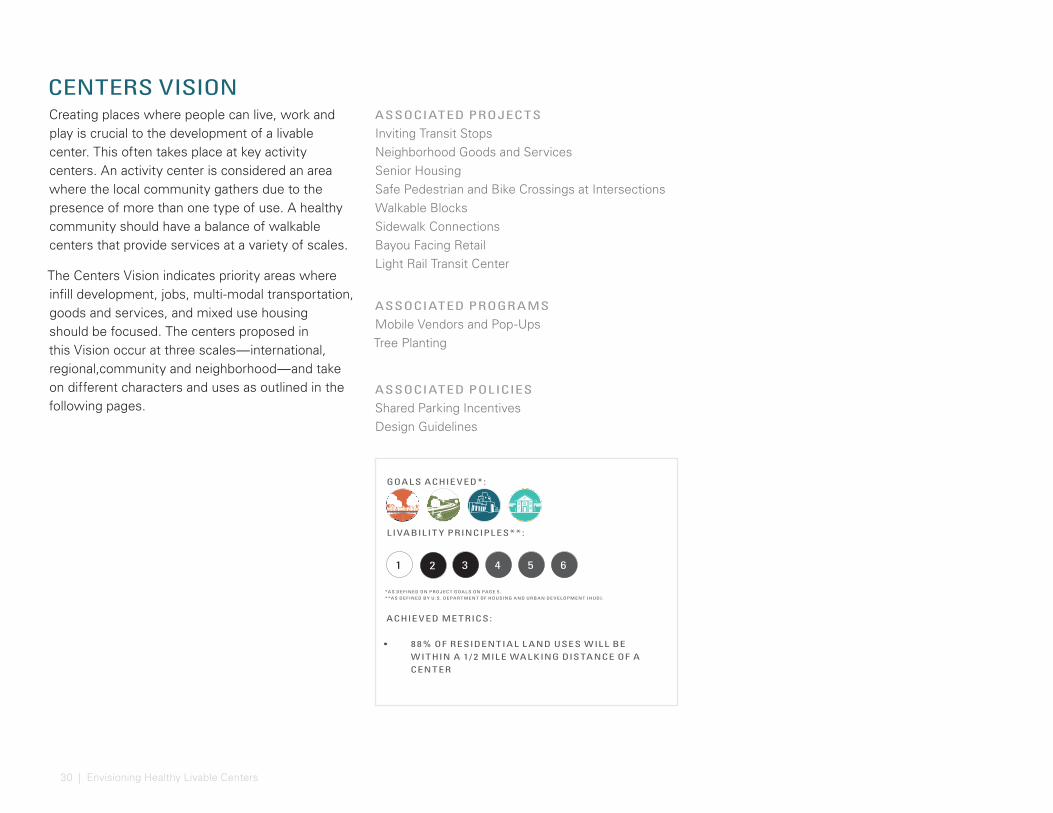
CENTERS VISIONCreating places where people can live, work and play is crucial to the development of a livable center. This often takes place at key activity centers. An activity center is considered an area where the local community gathers due to the presence of more than one type of use. A healthy community should have a balance of walkable centers that provide services at a variety of scales.
The Centers Vision indicates priority areas where infill development, jobs, multi-modal transportation, goods and services, and mixed use housing should be focused. The centers proposed in this Vision occur at three scales—international, regional,community and neighborhood—and take on different characters and uses as outlined in the following pages.
ASSOCIATED PROJECTS
Inviting Transit StopsNeighborhood Goods and ServicesSenior HousingSafe Pedestrian and Bike Crossings at IntersectionsWalkable BlocksSidewalk ConnectionsBayou Facing RetailLight Rail Transit Center
ASSOCIATED PROGR AMS
Mobile Vendors and Pop-UpsTree Planting
ASSOCIATED POLICIES
Shared Parking IncentivesDesign Guidelines
ACHIE VED ME TRICS:
• 8 8 % OF RESIDENTIAL L AND USES WIL L BE WITHIN A 1/ 2 MIL E WAL KING DISTANCE OF A CENTER
GOAL S ACHIE VED* :
L IVABIL IT Y PRINCIPL ES* * :
*AS DEFINED ON PROJEC T GOA L S ON PAGE 5 . * *AS DEFINED BY U.S. DEPA R T MENT OF HOUSING AND URBAN DE V ELOPMENT ( HUD) .
654321
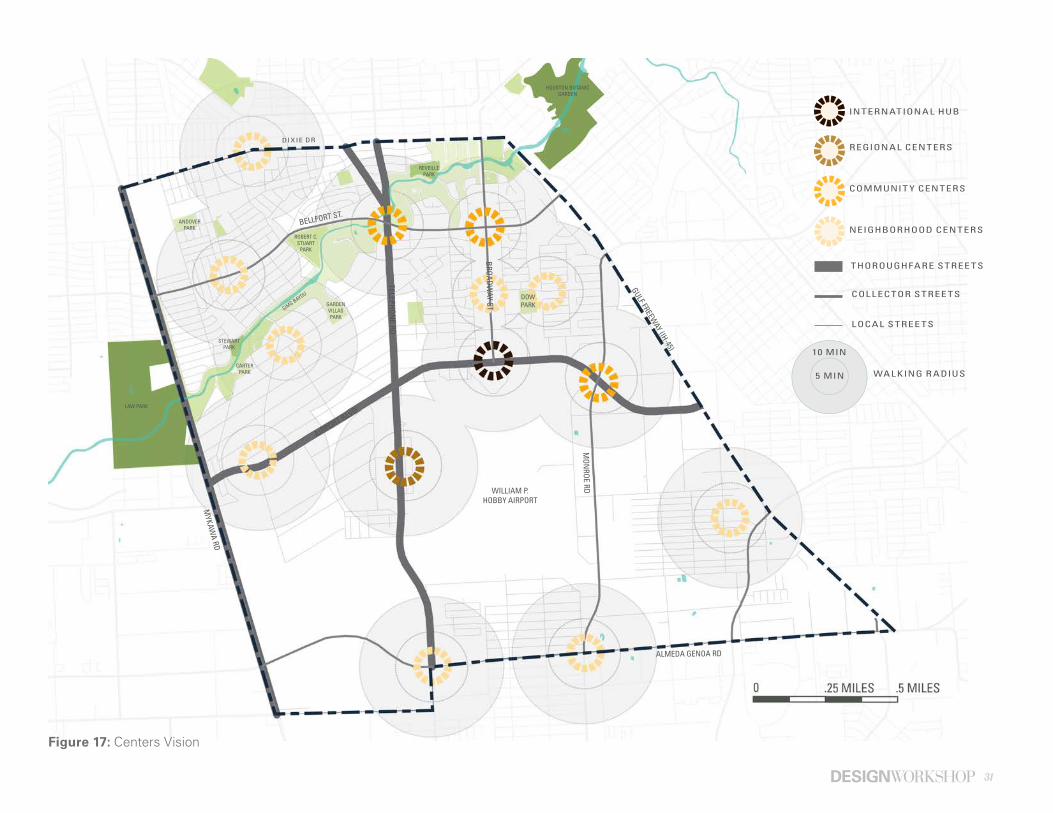
31
REGIONAL CENTERS
INTERNATIONAL HUB
DOW PARK
WILLIAM P. HOBBY AIRPORT
HOUSTON BOTANIC GARDEN
GARDEN VILLAS PARK
REVEILLE PARK
ANDOVER PARK
CARTER PARK
ROBERT C. STUART
PARK
DIXIE DR
GULF FREEWAY (IH-45)
MYKAW
A RD
BROADWAY ST
TELEPHONE RD
MON
ROE RD
BELLFORT ST.
AIRPORT BLVD
ALMEDA GENOA RD
SIMS BAYOU
COMMUNIT Y CENTERS
NEIGHBORHOOD CENTERS
WAL KING R ADIUS5 MIN
10 MINSTEWART
PARK
THOROUGHFARE STREE TS
COL L EC TOR STREE TS
LOCAL S TREE TS
LAW PARK
Figure 17: Centers Vision

32 | Envisioning Healthy Livable Centers
INTERNATIONAL HUB
International Centers attract visitors that are traveling through the region. These are transit hubs that also provide accommodations, such as hotels, business centers, restaurants, convenience stores and other services. Houston has light rail that connects its International Centers, such as Downtown, Uptown, the Museum District and the Texas Medical Center. Today, the Hobby Area serves as an important hub for travelers accessing these International Centers, as William P. Hobby Airport accommodates regional and international visitors, business and industry. Planned expansions to METRORail services in the future provide a great opportunity to solidify the Hobby Area as an international hub that both serves and benefits from Houston’s larger framework of International Centers.
As an international airport, William P. Hobby attracts visitors and travelers to the District.
The Galleria is an example of an international center in Houston. Light rail line carries riders from downtown Houston south to the Texas Medical Center, an international center.
CENTERS

33
Regional Centers function as destinations and draw visitors from the surrounding Houston area. They support a cluster of 30,000 or more square feet of entertainment, dining and shopping experiences sufficiently unique to the Hobby District that they are capable of drawing the interest of people outside of the area.
The plan suggests the development of a Regional Center in the southern portion of the District near the 1940 Air Terminal Museum. With the implementation of the proposed Industrial Hub catalyst and its associated projects, programs and policies, [see page 78] this area has the ability to serve its immediate community through expanded job and entrepreneurial opportunities and nearby workers and residents with a unique and enhanced mix of food and services.
The presence of the iconic 1940 Air Terminal Museum, the unique flexible and industrial character of the immediate area, and the distinctive shops, dining and entertainment opportunities associated with the Industrial Hub could result in a destination that is unique to the Hobby area. Festivals, street fairs, and other regular events add to the excitement of this area as a regional draw.
REGIONAL CENTERS
Pop-up street fairs and farmers markets draw visitors from the Houston region.
The unique typology of flexible warehouse provides a space for creative retail and industry to flourish.
The 1940 Air Terminal Museum acts as the nucleus of a future regional center. Currently, the museum hosts special events that attract aviation fans from around the region.
Source: Google Street View, 2016
34 | Envisioning Healthy Livable Centers
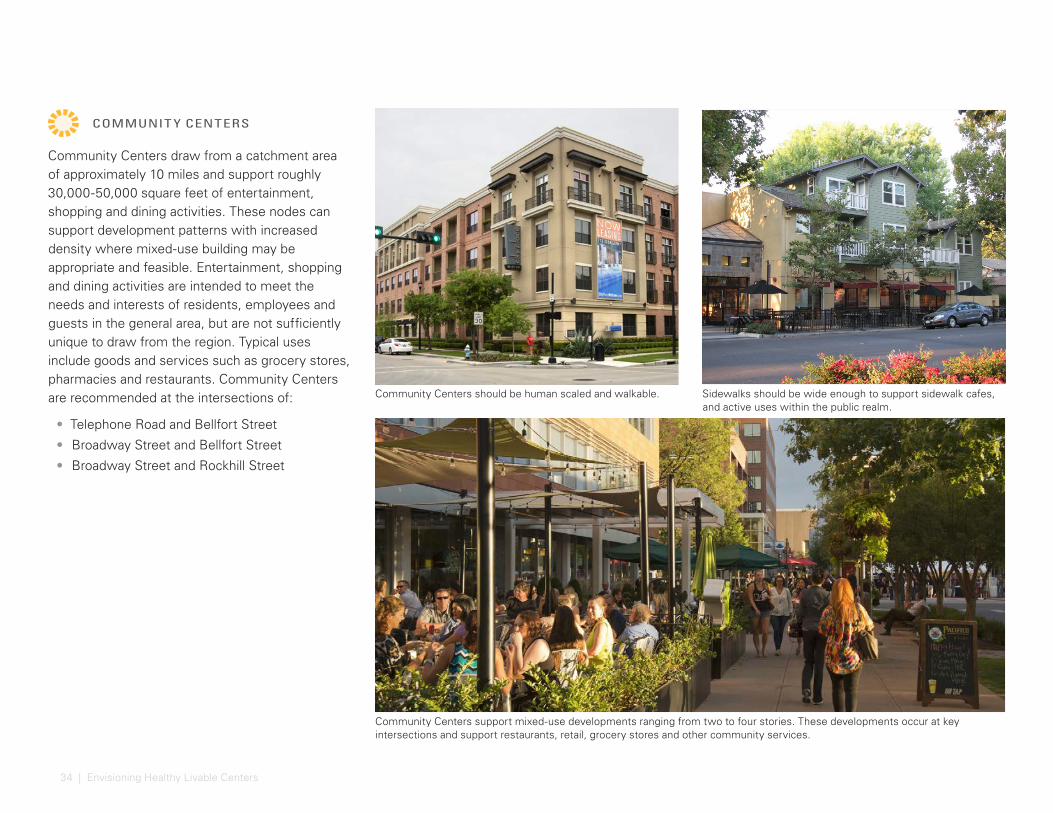
Community Centers draw from a catchment area of approximately 10 miles and support roughly 30,000-50,000 square feet of entertainment, shopping and dining activities. These nodes can support development patterns with increased density where mixed-use building may be appropriate and feasible. Entertainment, shopping and dining activities are intended to meet the needs and interests of residents, employees and guests in the general area, but are not sufficiently unique to draw from the region. Typical uses include goods and services such as grocery stores, pharmacies and restaurants. Community Centers are recommended at the intersections of:
• Telephone Road and Bellfort Street
• Broadway Street and Bellfort Street
• Broadway Street and Rockhill Street
COMMUNIT Y CENTERS
Community Centers support mixed-use developments ranging from two to four stories. These developments occur at key intersections and support restaurants, retail, grocery stores and other community services.
Community Centers should be human scaled and walkable. Sidewalks should be wide enough to support sidewalk cafes, and active uses within the public realm.
35
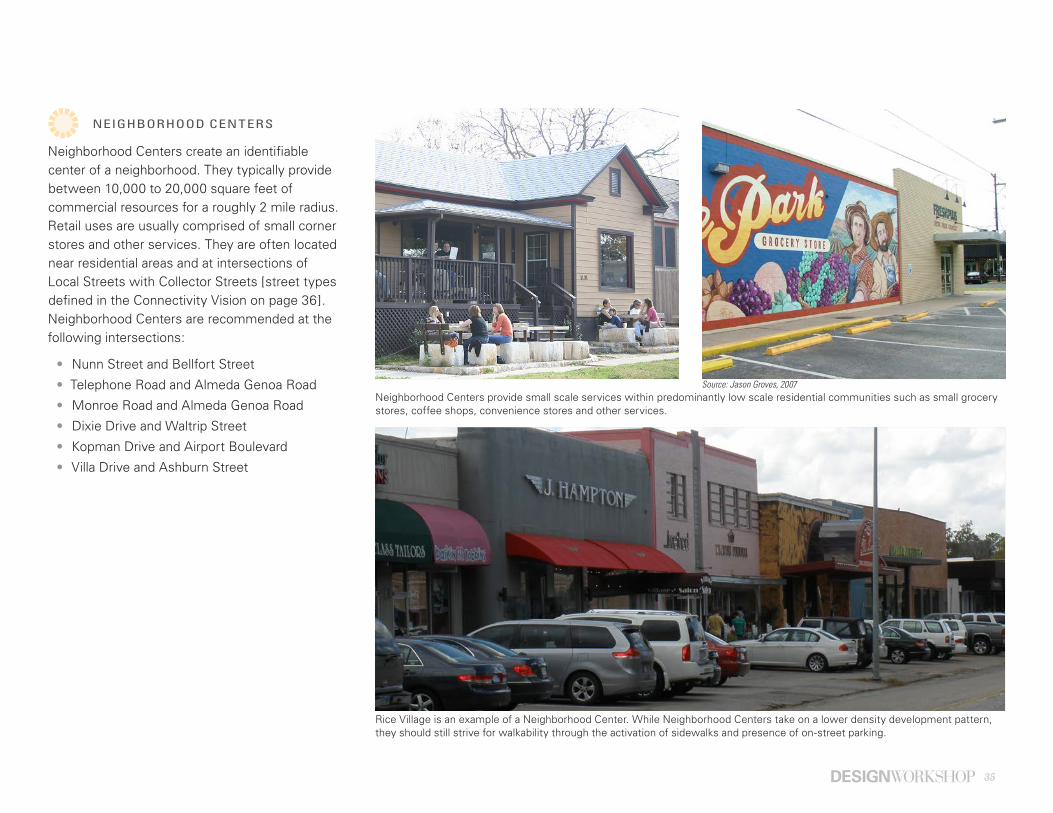
Neighborhood Centers create an identifiable center of a neighborhood. They typically provide between 10,000 to 20,000 square feet of commercial resources for a roughly 2 mile radius. Retail uses are usually comprised of small corner stores and other services. They are often located near residential areas and at intersections of Local Streets with Collector Streets [street types defined in the Connectivity Vision on page 36]. Neighborhood Centers are recommended at the following intersections:
• Nunn Street and Bellfort Street
• Telephone Road and Almeda Genoa Road
• Monroe Road and Almeda Genoa Road
• Dixie Drive and Waltrip Street
• Kopman Drive and Airport Boulevard
• Villa Drive and Ashburn Street
NEIGHBORHOOD CENTERS
Neighborhood Centers provide small scale services within predominantly low scale residential communities such as small grocery stores, coffee shops, convenience stores and other services.
Rice Village is an example of a Neighborhood Center. While Neighborhood Centers take on a lower density development pattern, they should still strive for walkability through the activation of sidewalks and presence of on-street parking.
Source: Jason Groves, 2007
36 | Envisioning Healthy Livable Centers
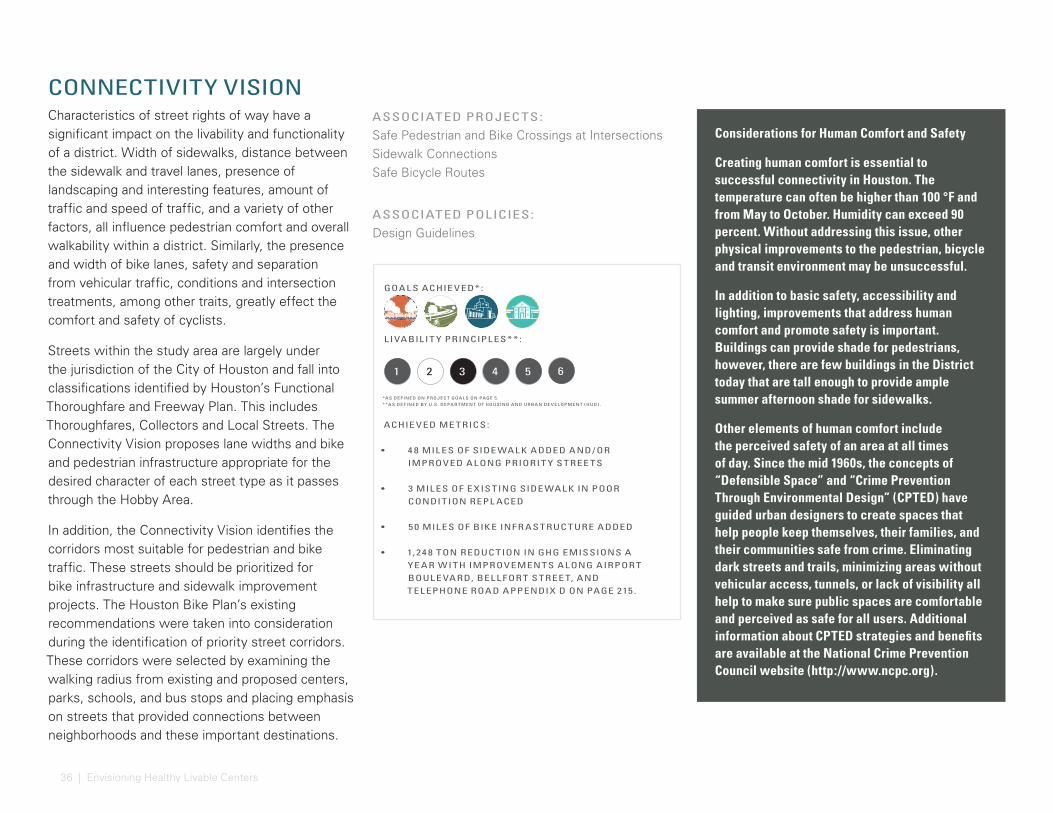
CONNECTIVITY VISIONCharacteristics of street rights of way have a significant impact on the livability and functionality of a district. Width of sidewalks, distance between the sidewalk and travel lanes, presence of landscaping and interesting features, amount of traffic and speed of traffic, and a variety of other factors, all influence pedestrian comfort and overall walkability within a district. Similarly, the presence and width of bike lanes, safety and separation from vehicular traffic, conditions and intersection treatments, among other traits, greatly effect the comfort and safety of cyclists.
Streets within the study area are largely under the jurisdiction of the City of Houston and fall into classifications identified by Houston’s Functional Thoroughfare and Freeway Plan. This includes Thoroughfares, Collectors and Local Streets. The Connectivity Vision proposes lane widths and bike and pedestrian infrastructure appropriate for the desired character of each street type as it passes through the Hobby Area.
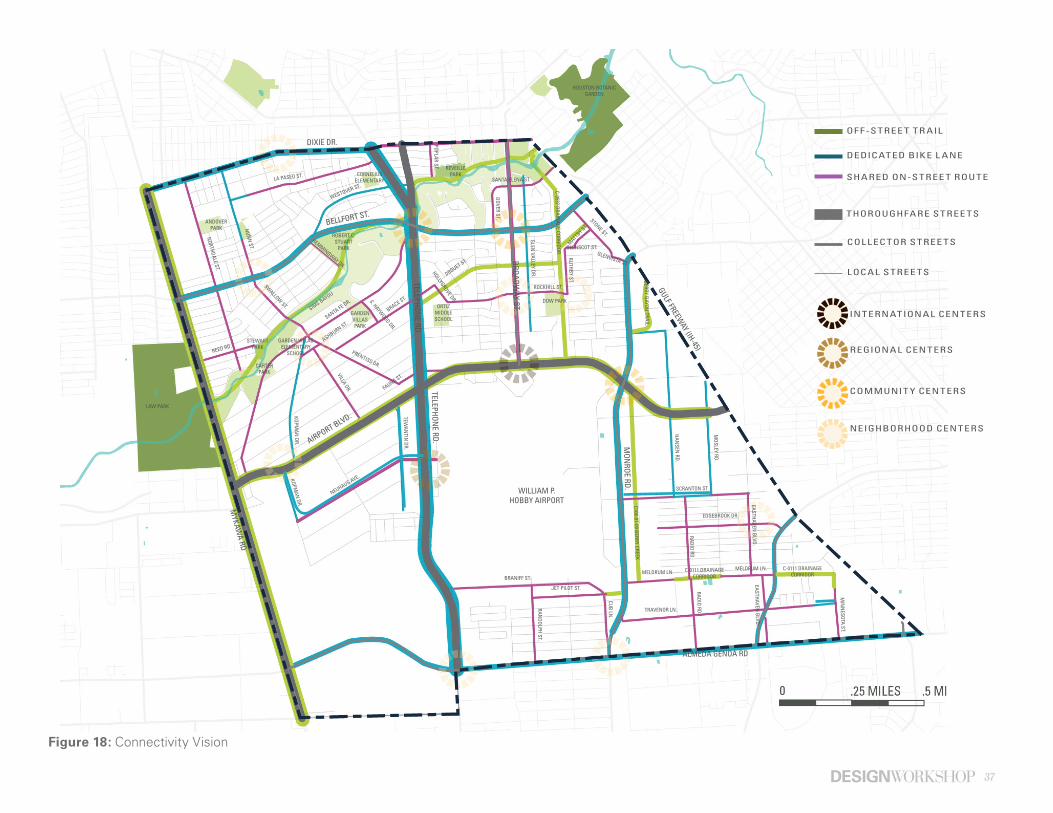
In addition, the Connectivity Vision identifies the corridors most suitable for pedestrian and bike traffic. These streets should be prioritized for bike infrastructure and sidewalk improvement projects. The Houston Bike Plan’s existing recommendations were taken into consideration during the identification of priority street corridors. These corridors were selected by examining the walking radius from existing and proposed centers, parks, schools, and bus stops and placing emphasis on streets that provided connections between neighborhoods and these important destinations.
ASSOCIATED PROJECTS:
Safe Pedestrian and Bike Crossings at IntersectionsSidewalk ConnectionsSafe Bicycle Routes
ASSOCIATED POLICIES:
Design Guidelines
ACHIE VED ME TRICS:
• 4 8 MIL ES OF SIDE WAL K ADDED AND / OR IMPROVED ALONG PRIORIT Y STREE TS
• 3 MIL ES OF E XISTING SIDE WAL K IN POOR CONDITION REPL ACED
• 5 0 MIL ES OF BIK E INF R ASTRUC TURE ADDED
• 1, 24 8 TON REDUC TION IN GHG EMISSIONS A Y E AR WITH IMPROVEMENTS ALONG AIRPOR T BOUL E VARD, BEL L FOR T STREE T, AND TEL EPHONE ROAD APPENDIX D ON PAGE 215 .
GOAL S ACHIE VED* :
L IVABIL IT Y PRINCIPL ES* * :
*AS DEFINED ON PROJEC T GOA L S ON PAGE 5 . * *AS DEFINED BY U.S. DEPA R T MENT OF HOUSING AND URBAN DE V ELOPMENT ( HUD) .
1 65432
Considerations for Human Comfort and Safety
Creating human comfort is essential to successful connectivity in Houston. The temperature can often be higher than 100 °F and from May to October. Humidity can exceed 90 percent. Without addressing this issue, other physical improvements to the pedestrian, bicycle and transit environment may be unsuccessful.
In addition to basic safety, accessibility and lighting, improvements that address human comfort and promote safety is important. Buildings can provide shade for pedestrians, however, there are few buildings in the District today that are tall enough to provide ample summer afternoon shade for sidewalks.
Other elements of human comfort include the perceived safety of an area at all times of day. Since the mid 1960s, the concepts of “Defensible Space” and “Crime Prevention Through Environmental Design” (CPTED) have guided urban designers to create spaces that help people keep themselves, their families, and their communities safe from crime. Eliminating dark streets and trails, minimizing areas without vehicular access, tunnels, or lack of visibility all help to make sure public spaces are comfortable and perceived as safe for all users. Additional information about CPTED strategies and benefits are available at the National Crime Prevention Council website (http://www.ncpc.org).
37
REGIONAL CENTERS
INTERNATIONAL CENTERS
COMMUNIT Y CENTERS
NEIGHBORHOOD CENTERS
COL L EC TOR STREE TS
LOCAL S TREE TS
THOROUGHFARE STREE TSM
INN
ESOTA ST.
Figure 18: Connectivity Vision
OF F -STREE T TR AIL
DEDICATED BIK E L ANE
SHARED ON-STREE T ROUTE
DOW PARK
CORNELIUS ELEMENTARY
ORTIZMIDDLESCHOOL
GARDEN VILLAS ELEMENTARY
SCHOOL
WILLIAM P. HOBBY AIRPORT
HOUSTON BOTANIC GARDEN
GARDEN VILLAS PARK
REVEILLE PARK
ANDOVER PARK
NORTHDALE ST.
NUN
N ST.
SWALLOW ST.
VILLA DR.
HOLLYGROVE DR.S. HAYWOOD DR.
STONE ST.
GLENVISTA ST.
TEWAN
TIN DR.
KOPMAN
DR.
PRENTISS DR.
KOPMAN
DR.
NEUHAUS AVE.
SCRANTON ST.
EDGEBROOK DR.
HANSEN
RD.
RADIO RD.
EASTHAVEN BLVD.
EASTHAVEN BLVD.
RADIO RD.
MOSLEY RD.
BRANIFF ST.
JET PILOT ST.
TRAVENOR LN.
MELDRUM LN. C-0111 DRAINAGE CORRIDOR
C-0111 DRAINAGE CORRIDOR
MELDRUM LN.
CUB LN.
RANDOLPH ST.
REED RD.
WESTOVER ST.LA PASEO ST.
SANTA FE DR.
ASHBURN ST.
ROCKHILL ST.
SANTA ELENA ST.
BRACE ST.
FAUNA ST.
DROUET ST.
GLENSCOT ST.
MATTBY ST.
GLEN VALLEY DR.
BERRY BAYOU TRAIL
DOVER ST.
POPLAR ST.
RUTHBY ST.
C106-01-00 BERRY CREEK
C-0537 DRAINAGE CORRIDOR
HEMMINGWAY DR.
CARTER PARK
STEWART PARK
ROBERT C. STUART
PARK
DIXIE DR.
GULF FREEWAY (IH-45)
MYKAW
A RD
BROADWAY ST.
TELEPHONE RD.
TELEPHONE RD.
MON
ROE RD.
BELLFORT ST.
AIRPORT BLVD.
ALMEDA GENOA RD
SIMS BAYOU
LAW PARK
38 | Envisioning Healthy Livable Centers
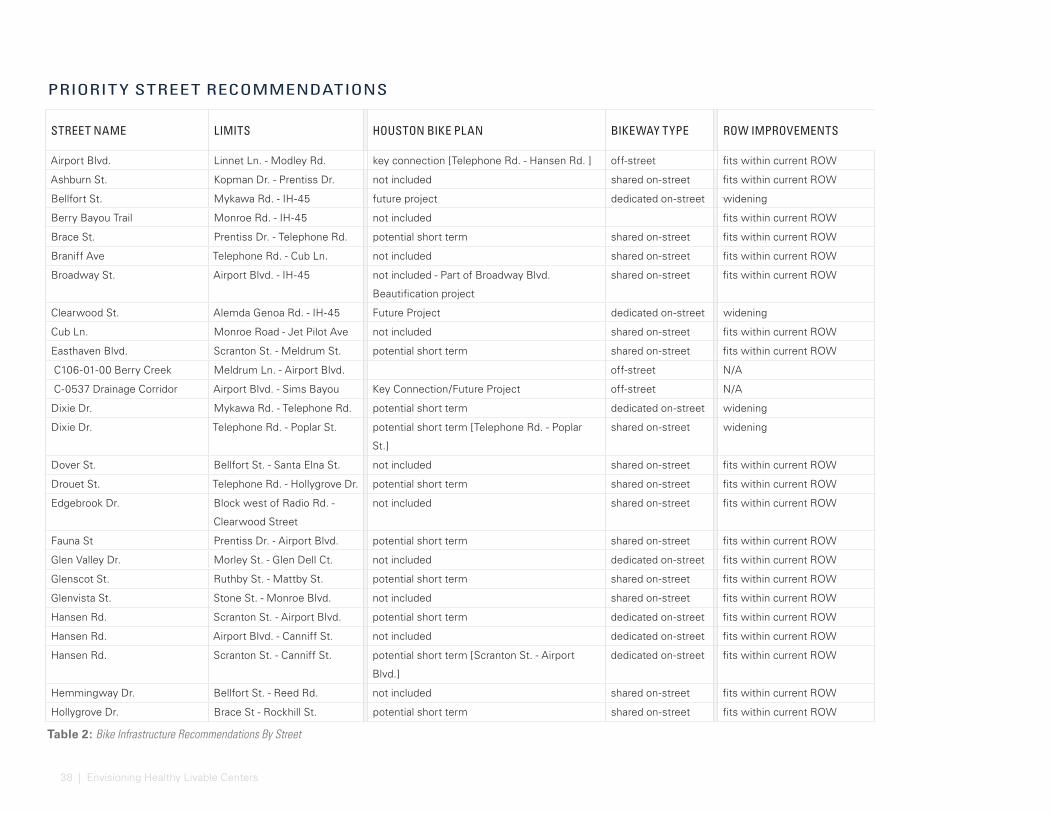
STREET NAME LIMITS HOUSTON BIKE PLAN BIKEWAY TYPE ROW IMPROVEMENTS
Airport Blvd. Linnet Ln. - Modley Rd. key connection [Telephone Rd. - Hansen Rd. ] off-street fits within current ROW
Ashburn St. Kopman Dr. - Prentiss Dr. not included shared on-street fits within current ROW
Bellfort St. Mykawa Rd. - IH-45 future project dedicated on-street widening
Berry Bayou Trail Monroe Rd. - IH-45 not included fits within current ROW
Brace St. Prentiss Dr. - Telephone Rd. potential short term shared on-street fits within current ROW
Braniff Ave Telephone Rd. - Cub Ln. not included shared on-street fits within current ROW
Broadway St. Airport Blvd. - IH-45 not included - Part of Broadway Blvd.
Beautification project
shared on-street fits within current ROW
Clearwood St. Alemda Genoa Rd. - IH-45 Future Project dedicated on-street widening
Cub Ln. Monroe Road - Jet Pilot Ave not included shared on-street fits within current ROW
Easthaven Blvd. Scranton St. - Meldrum St. potential short term shared on-street fits within current ROW
C106-01-00 Berry Creek Meldrum Ln. - Airport Blvd. off-street N/A
C-0537 Drainage Corridor Airport Blvd. - Sims Bayou Key Connection/Future Project off-street N/A
Dixie Dr. Mykawa Rd. - Telephone Rd. potential short term dedicated on-street widening
Dixie Dr. Telephone Rd. - Poplar St. potential short term [Telephone Rd. - Poplar
St.]
shared on-street widening
Dover St. Bellfort St. - Santa Elna St. not included shared on-street fits within current ROW
Drouet St. Telephone Rd. - Hollygrove Dr. potential short term shared on-street fits within current ROW
Edgebrook Dr. Block west of Radio Rd. -
Clearwood Street
not included shared on-street fits within current ROW
Fauna St Prentiss Dr. - Airport Blvd. potential short term shared on-street fits within current ROW
Glen Valley Dr. Morley St. - Glen Dell Ct. not included dedicated on-street fits within current ROW
Glenscot St. Ruthby St. - Mattby St. potential short term shared on-street fits within current ROW
Glenvista St. Stone St. - Monroe Blvd. not included shared on-street fits within current ROW
Hansen Rd. Scranton St. - Airport Blvd. potential short term dedicated on-street fits within current ROW
Hansen Rd. Airport Blvd. - Canniff St. not included dedicated on-street fits within current ROW
Hansen Rd. Scranton St. - Canniff St. potential short term [Scranton St. - Airport
Blvd.]
dedicated on-street fits within current ROW
Hemmingway Dr. Bellfort St. - Reed Rd. not included shared on-street fits within current ROW
Hollygrove Dr. Brace St - Rockhill St. potential short term shared on-street fits within current ROW
PRIORIT Y STREET RECOMMENDATIONS
Table 2: Bike Infrastructure Recommendations By Street
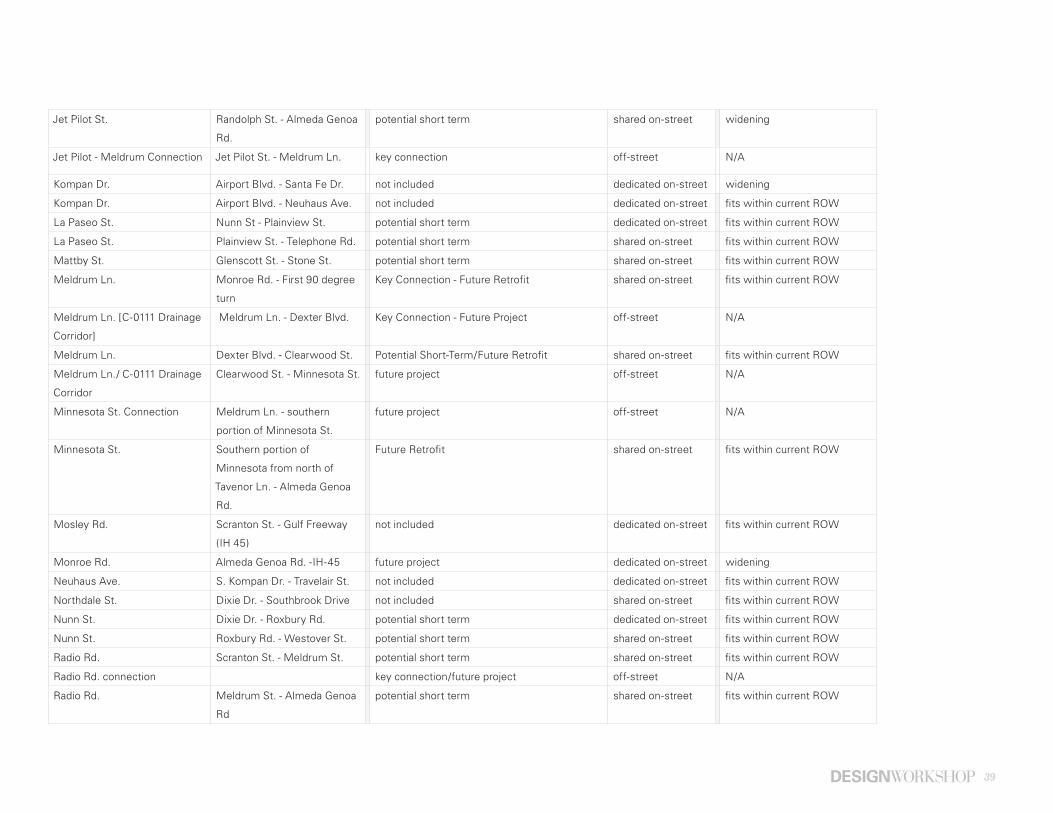
39
Jet Pilot St. Randolph St. - Almeda Genoa
Rd.
potential short term shared on-street widening
Jet Pilot - Meldrum Connection Jet Pilot St. - Meldrum Ln. key connection off-street N/A
Kompan Dr. Airport Blvd. - Santa Fe Dr. not included dedicated on-street widening
Kompan Dr. Airport Blvd. - Neuhaus Ave. not included dedicated on-street fits within current ROW
La Paseo St. Nunn St - Plainview St. potential short term dedicated on-street fits within current ROW
La Paseo St. Plainview St. - Telephone Rd. potential short term shared on-street fits within current ROW
Mattby St. Glenscott St. - Stone St. potential short term shared on-street fits within current ROW
Meldrum Ln. Monroe Rd. - First 90 degree
turn
Key Connection - Future Retrofit shared on-street fits within current ROW
Meldrum Ln. [C-0111 Drainage
Corridor]
Meldrum Ln. - Dexter Blvd. Key Connection - Future Project off-street N/A
Meldrum Ln. Dexter Blvd. - Clearwood St. Potential Short-Term/Future Retrofit shared on-street fits within current ROW
Meldrum Ln./ C-0111 Drainage
Corridor
Clearwood St. - Minnesota St. future project off-street N/A
Minnesota St. Connection Meldrum Ln. - southern
portion of Minnesota St.
future project off-street N/A
Minnesota St. Southern portion of
Minnesota from north of
Tavenor Ln. - Almeda Genoa
Rd.
Future Retrofit shared on-street fits within current ROW
Mosley Rd. Scranton St. - Gulf Freeway
(IH 45)
not included dedicated on-street fits within current ROW
Monroe Rd. Almeda Genoa Rd. -IH-45 future project dedicated on-street widening
Neuhaus Ave. S. Kompan Dr. - Travelair St. not included dedicated on-street fits within current ROW
Northdale St. Dixie Dr. - Southbrook Drive not included shared on-street fits within current ROW
Nunn St. Dixie Dr. - Roxbury Rd. potential short term dedicated on-street fits within current ROW
Nunn St. Roxbury Rd. - Westover St. potential short term shared on-street fits within current ROW
Radio Rd. Scranton St. - Meldrum St. potential short term shared on-street fits within current ROW
Radio Rd. connection key connection/future project off-street N/A
Radio Rd. Meldrum St. - Almeda Genoa
Rd
potential short term shared on-street fits within current ROW
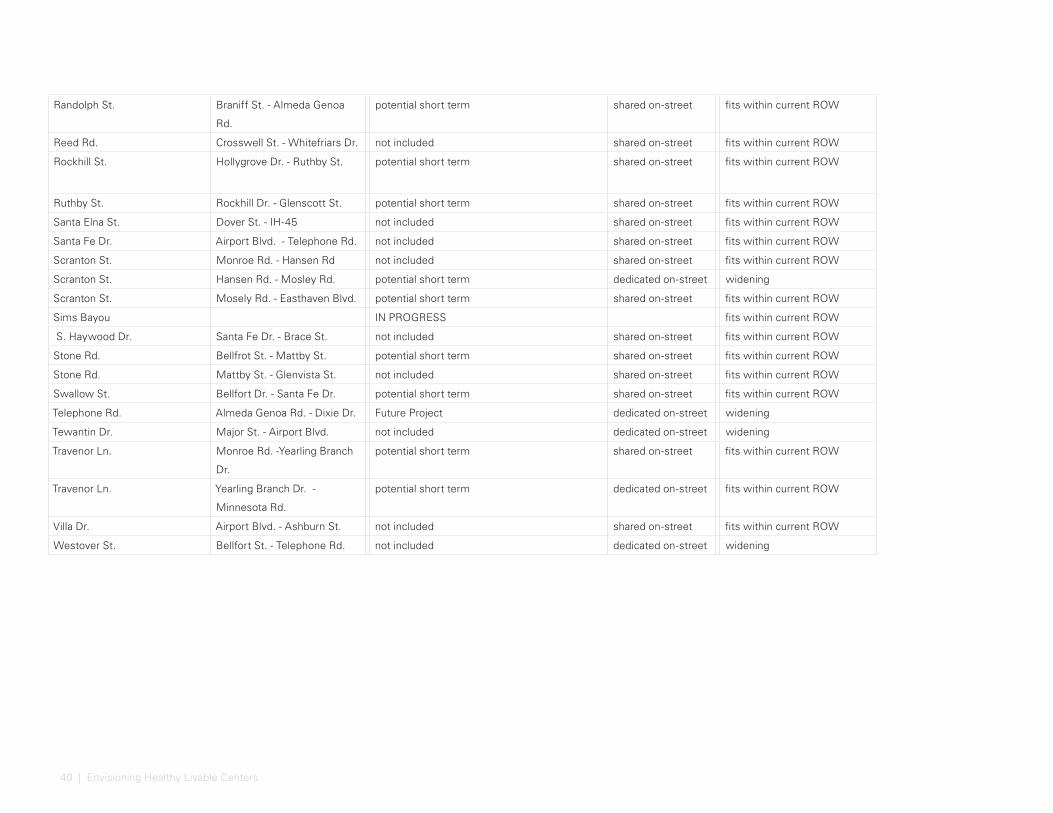
40 | Envisioning Healthy Livable Centers
Randolph St. Braniff St. - Almeda Genoa
Rd.
potential short term shared on-street fits within current ROW
Reed Rd. Crosswell St. - Whitefriars Dr. not included shared on-street fits within current ROW
Rockhill St. Hollygrove Dr. - Ruthby St. potential short term shared on-street fits within current ROW
Ruthby St. Rockhill Dr. - Glenscott St. potential short term shared on-street fits within current ROW
Santa Elna St. Dover St. - IH-45 not included shared on-street fits within current ROW
Santa Fe Dr. Airport Blvd. - Telephone Rd. not included shared on-street fits within current ROW
Scranton St. Monroe Rd. - Hansen Rd not included shared on-street fits within current ROW
Scranton St. Hansen Rd. - Mosley Rd. potential short term dedicated on-street widening
Scranton St. Mosely Rd. - Easthaven Blvd. potential short term shared on-street fits within current ROW
Sims Bayou IN PROGRESS fits within current ROW
S. Haywood Dr. Santa Fe Dr. - Brace St. not included shared on-street fits within current ROW
Stone Rd. Bellfrot St. - Mattby St. potential short term shared on-street fits within current ROW
Stone Rd. Mattby St. - Glenvista St. not included shared on-street fits within current ROW
Swallow St. Bellfort Dr. - Santa Fe Dr. potential short term shared on-street fits within current ROW
Telephone Rd. Almeda Genoa Rd. - Dixie Dr. Future Project dedicated on-street widening
Tewantin Dr. Major St. - Airport Blvd. not included dedicated on-street widening
Travenor Ln. Monroe Rd. -Yearling Branch
Dr.
potential short term shared on-street fits within current ROW
Travenor Ln. Yearling Branch Dr. -
Minnesota Rd.
potential short term dedicated on-street fits within current ROW
Villa Dr. Airport Blvd. - Ashburn St. not included shared on-street fits within current ROW
Westover St. Bellfort St. - Telephone Rd. not included dedicated on-street widening
41
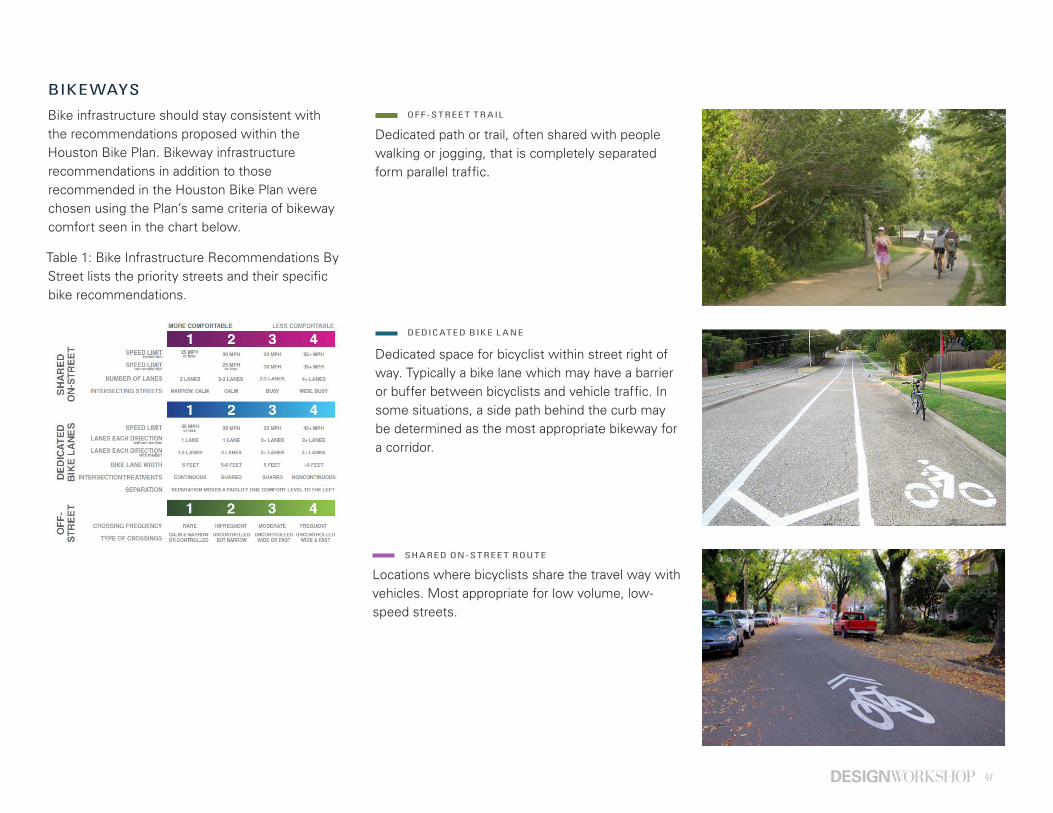
OF F -STREE T TR AIL
DEDICATED BIK E L ANE
SHARED ON-STREE T ROUTE
Locations where bicyclists share the travel way with vehicles. Most appropriate for low volume, low-speed streets.
Dedicated space for bicyclist within street right of way. Typically a bike lane which may have a barrier or buffer between bicyclists and vehicle traffic. In some situations, a side path behind the curb may be determined as the most appropriate bikeway for a corridor.
Dedicated path or trail, often shared with people walking or jogging, that is completely separated form parallel traffic.
Bike infrastructure should stay consistent with the recommendations proposed within the Houston Bike Plan. Bikeway infrastructure recommendations in addition to those recommended in the Houston Bike Plan were chosen using the Plan’s same criteria of bikeway comfort seen in the chart below.
Table 1: Bike Infrastructure Recommendations By Street lists the priority streets and their specific bike recommendations.
BIKEWAYS
42 | Envisioning Healthy Livable Centers
THOROUGHFARE STREE TS
Thoroughfares accumulate traffic from Collector Streets and other Thoroughfares for distribution to the freeway system. These streets are typically four to six lanes, sometimes with medians and turn lanes. They carry medium to high volume traffic and provide access to commercial, mixed use and residential areas.
SIDE WALKS:
Sidewalks should be set back from the curb and buffered with planting strips to separate pedestrians from high speed traffic. These roads are often difficult to cross and intersections should include applications that improve the safety and visibility of crossings such as signalized crossings, and raised pedestrian platforms.
As future development occurs along Thoroughfares, curb cuts should be minimized and joint access agreements encouraged.
BIKE L ANES:
Bike lanes along these streets should be buffered or separated cycle tracks whenever possible. At a minimum they should be striped and a minimum width of 6-feet.
TR ANSIT:
Future alternative transit and rail is most appropriate along Thoroughfares. Their typically large right of way and presence of center medians provides flexile space for the addition of rail.
THOROUGHFARE STREE TS:• Airport Boulevard
• Reveille Street
• Telephone Road
• Almeda Genoa Road east of Telephone Road
• Clearwood Street
• Monroe Road
• Mykawa Road
• Orem Drive
STREET HIERARCHY
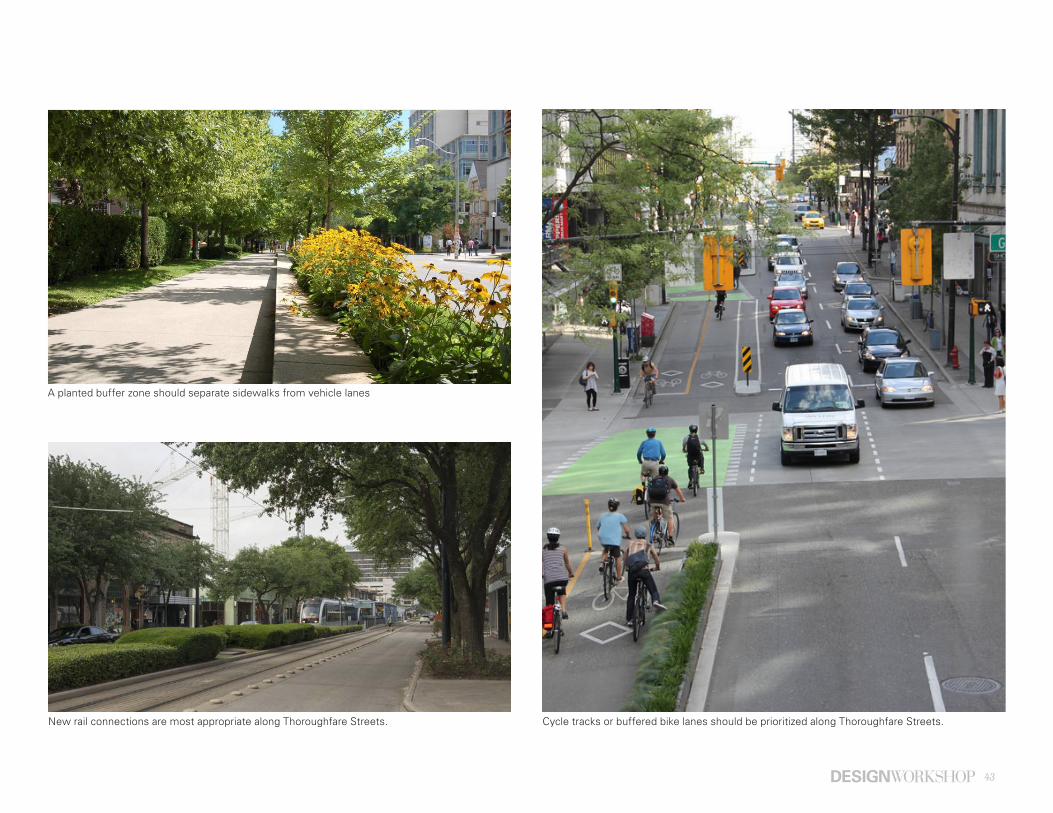
43
New rail connections are most appropriate along Thoroughfare Streets. Cycle tracks or buffered bike lanes should be prioritized along Thoroughfare Streets.
A planted buffer zone should separate sidewalks from vehicle lanes
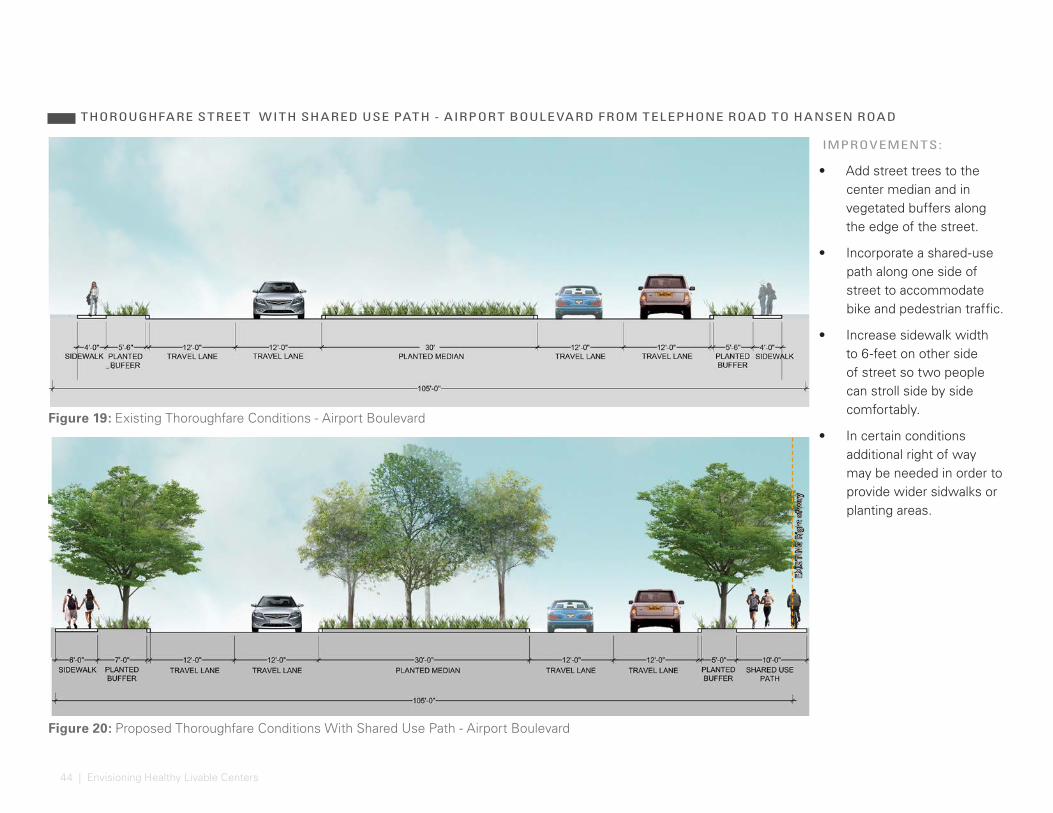
44 | Envisioning Healthy Livable Centers
Figure 19: Existing Thoroughfare Conditions - Airport Boulevard
Figure 20: Proposed Thoroughfare Conditions With Shared Use Path - Airport Boulevard
THOROUGHFARE STREE T WITH SHARED USE PATH - AIRPORT BOULE VARD FROM TELEPHONE ROAD TO HANSEN ROAD
IMPROVEMENTS:
• Add street trees to the center median and in vegetated buffers along the edge of the street.
• Incorporate a shared-use path along one side of street to accommodate bike and pedestrian traffic.
• Increase sidewalk width to 6-feet on other side of street so two people can stroll side by side comfortably.
• In certain conditions additional right of way may be needed in order to provide wider sidwalks or planting areas.
EX
ISTI
NG
Rig
ht o
f w
ay
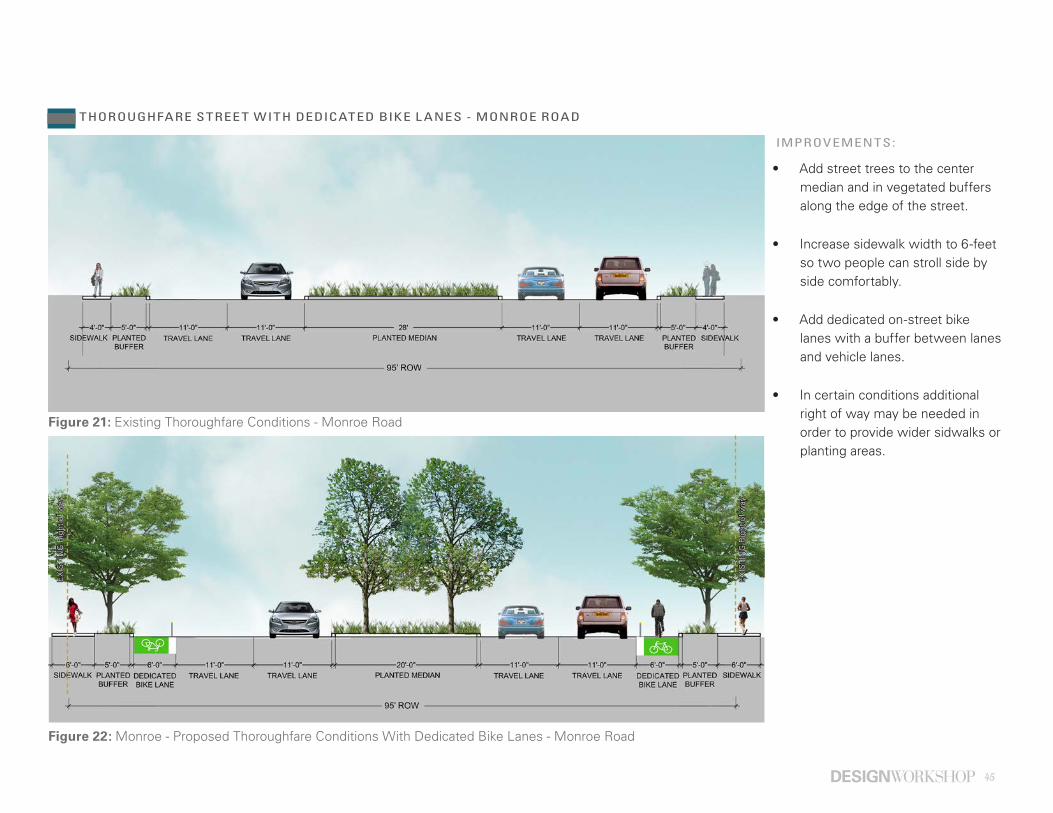
45
Figure 21: Existing Thoroughfare Conditions - Monroe Road
Figure 22: Monroe - Proposed Thoroughfare Conditions With Dedicated Bike Lanes - Monroe Road
THOROUGHFARE STREE T WITH DEDICATED BIKE L ANES - MONROE ROAD
IMPROVEMENTS:
• Add street trees to the center median and in vegetated buffers along the edge of the street.
• Increase sidewalk width to 6-feet so two people can stroll side by side comfortably.
• Add dedicated on-street bike lanes with a buffer between lanes and vehicle lanes.
• In certain conditions additional right of way may be needed in order to provide wider sidwalks or planting areas.
EX
ISTI
NG
Rig
ht o
f w
ay
EX
ISTI
NG
Rig
ht o
f w
ay
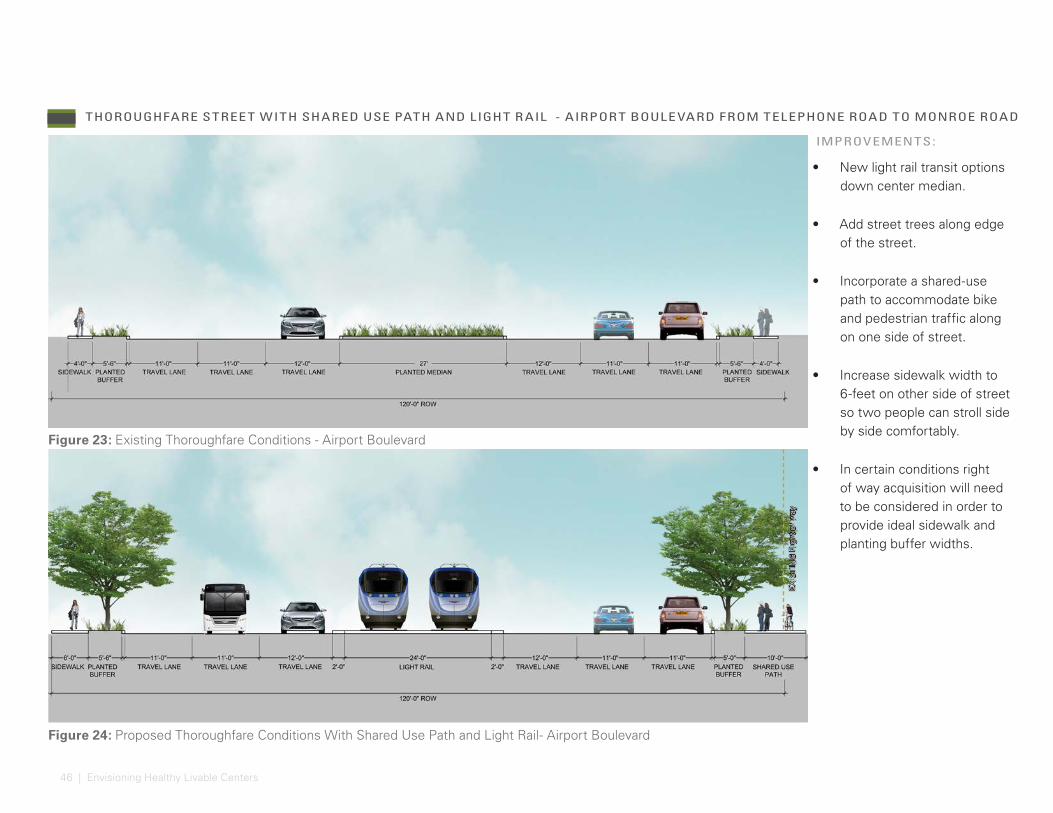
46 | Envisioning Healthy Livable Centers
Figure 23: Existing Thoroughfare Conditions - Airport Boulevard
Figure 24: Proposed Thoroughfare Conditions With Shared Use Path and Light Rail- Airport Boulevard
THOROUGHFARE STREE T WITH SHARED USE PATH AND LIGHT R AIL - AIRPORT BOULE VARD FROM TELEPHONE ROAD TO MONROE ROAD
IMPROVEMENTS:
• New light rail transit options down center median.
• Add street trees along edge of the street.
• Incorporate a shared-use path to accommodate bike and pedestrian traffic along on one side of street.
• Increase sidewalk width to 6-feet on other side of street so two people can stroll side by side comfortably.
• In certain conditions right of way acquisition will need to be considered in order to provide ideal sidewalk and planting buffer widths.
EX
ISTI
NG
Rig
ht o
f w
ay
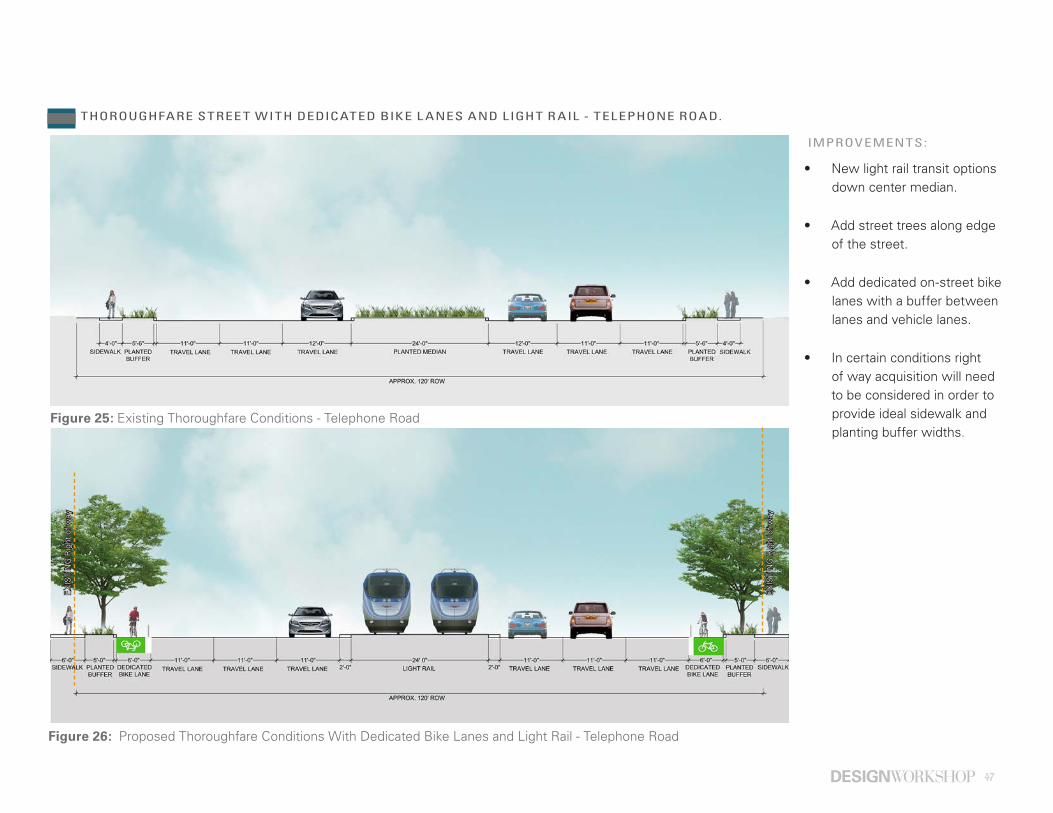
47
Figure 25: Existing Thoroughfare Conditions - Telephone Road
Figure 26: Proposed Thoroughfare Conditions With Dedicated Bike Lanes and Light Rail - Telephone Road
THOROUGHFARE STREE T WITH DEDICATED BIKE L ANES AND LIGHT R AIL - TELEPHONE ROAD.
IMPROVEMENTS:
• New light rail transit options down center median.
• Add street trees along edge of the street.
• Add dedicated on-street bike lanes with a buffer between lanes and vehicle lanes.
• In certain conditions right of way acquisition will need to be considered in order to provide ideal sidewalk and planting buffer widths.
EX
ISTI
NG
Rig
ht o
f w
ay
EX
ISTI
NG
Rig
ht o
f w
ay

48 | Envisioning Healthy Livable Centers
Collector Streets accumulate traffic from Local Streets for distribution to the Thoroughfare Streets. They typically provide access to commercial, mixed use and medium to high density residential areas. They are usually two to three lanes and carry cars at speeds from 25-35 mph. These streets are safer to navigate as pedestrians and should offer high quality pedestrian and bike infrastructure to encourage walking and cycling.
SIDE WALKS:
Similar to Thoroughfare Streets, sidewalks along Collector Streets should be set back from the curb and buffered from vehicle traffic with a planted buffer or pedestrian amenity zone.
When adjacent to retail, sidewalks should be a minimum of 12-feet with 6-feet devoted to active uses such as sidewalk cafes.
Smaller collectors are suitable for driveway access; however, joint access is still preferred to preserve sidewalk safety and walkability.
BIKE L ANES:
Collector Streets are more suitable for striped on-street bike lanes, however efforts should be made to buffer lanes with a planting strip or bollards whenever possible.
PUBLIC TR ANSIT:
Bus transit is the most appropriate form of alternative public transit along Collector Streets. Bus pull out areas can be incorporated when the
COLLECTOR STREE TS
right of way allows. Stops should include bus shelters, benches, trash receptacles, lighting and signage with bus schedules. All stops should be ADA accessible.
MAJOR COLLECTOR STREE TS:• Dixie Drive (Major Collector)
• Bellfort Street
• Broadway Street
• Almeda Genoa Road west of Telephone Road
This plan suggests the reclassification of Bellfort Street from its current classification as Thoroughfare Street to a Collector Street due to its lower traffic volume and connection to many parks and key centers. Providing safe pedestrian and bike conditions along this street will encourage residents to walk and cycle to these destinations.
Broadway Street’s classification should also be reconsidered due to its unique character as the District’s prominent retail corridor and ongoing updates through the Broadway Beautification project, which is striving to improve its overall walkability.
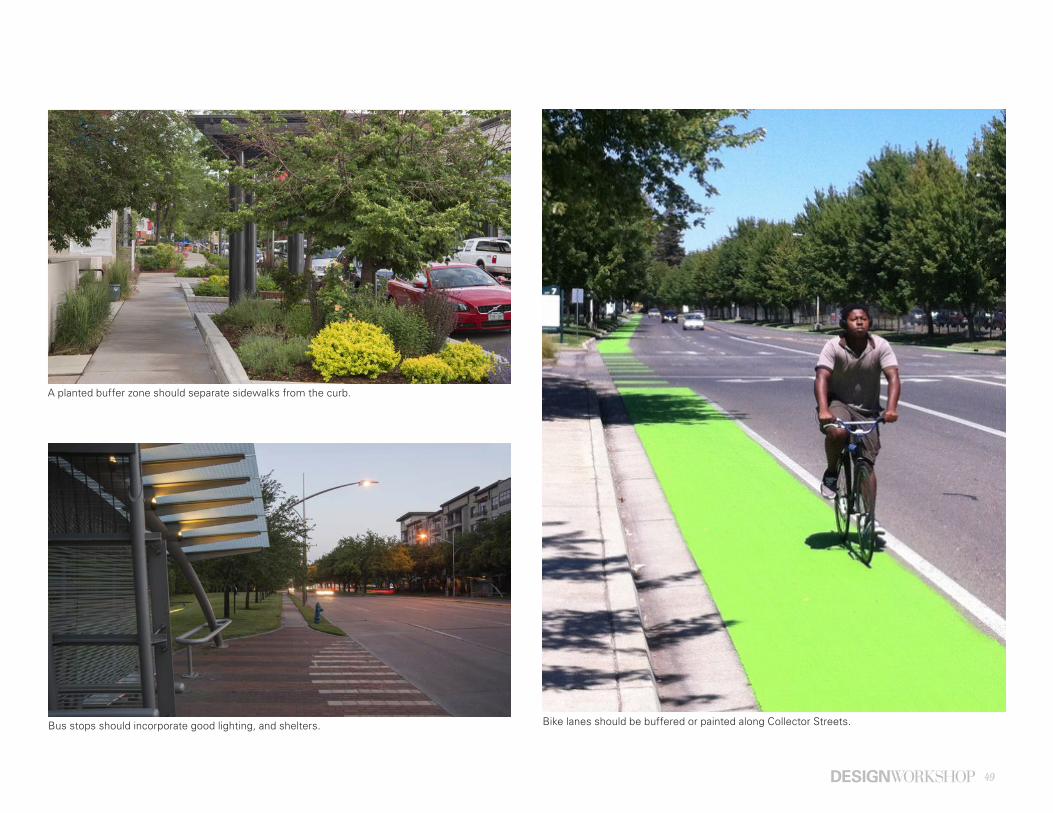
49
Bus stops should incorporate good lighting, and shelters. Bike lanes should be buffered or painted along Collector Streets.
A planted buffer zone should separate sidewalks from the curb.
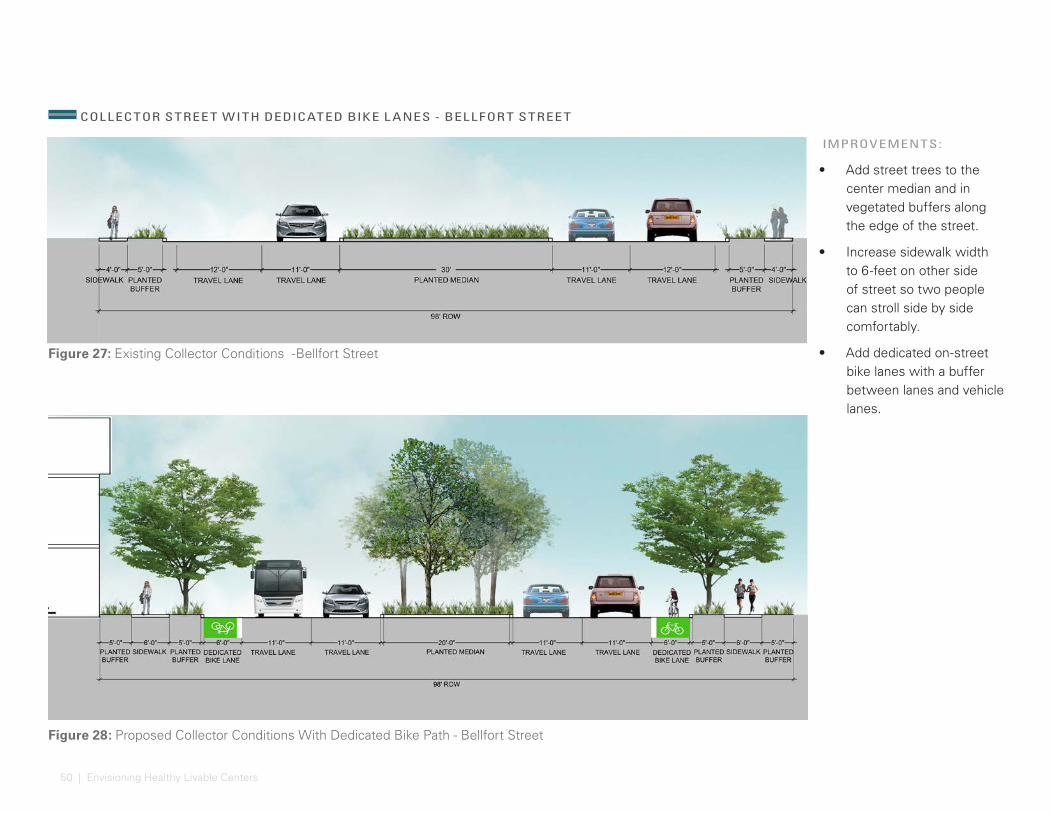
50 | Envisioning Healthy Livable Centers
Figure 27: Existing Collector Conditions -Bellfort Street
Figure 28: Proposed Collector Conditions With Dedicated Bike Path - Bellfort Street
COLLECTOR STREE T WITH DEDICATED BIKE L ANES - BELLFORT STREE T
IMPROVEMENTS:
• Add street trees to the center median and in vegetated buffers along the edge of the street.
• Increase sidewalk width to 6-feet on other side of street so two people can stroll side by side comfortably.
• Add dedicated on-street bike lanes with a buffer between lanes and vehicle lanes.

51
Figure 29: Existing Collector Conditions - Dixie Drive from Mykawa Road to Telephone Road
Figure 30: Dixie Drive from Mykawa Road to Telephone Road - Alternate A Figure 31: Dixie Drive from Mykawa Road to Telephone Road - Alternate B
COLLECTOR STREE T WITH DEDICATED BIKE L ANES - DIXIE DRIVE FROM MYK AWA ROAD TO TELEPHONE ROAD
IMPROVEMENTS:
• Adjacent properties currently encroach on the right of way along this portion of Dixie Drive. Alternative A accommodates this encroachment by reducing the number of vehicle lanes from two in each direction to one in each direction with a center turn lane. Alternative B considers an alternative solution that requires acquiring the right of way back from adjacent properties.
• Both alternatives recommend the incorporation of dedicated on-street bike lanes.
• Street trees should be planted within a 5-foot vegetated buffer along both edges of the street to improve tree canopy coverage.
EN
CR
OA
CH
ING
PR
OP
ER
TIE
S
EN
CR
OA
CH
ING
PR
OP
ER
TIE
S
EN
CR
OA
CH
ING
PR
OP
ER
TIE
S
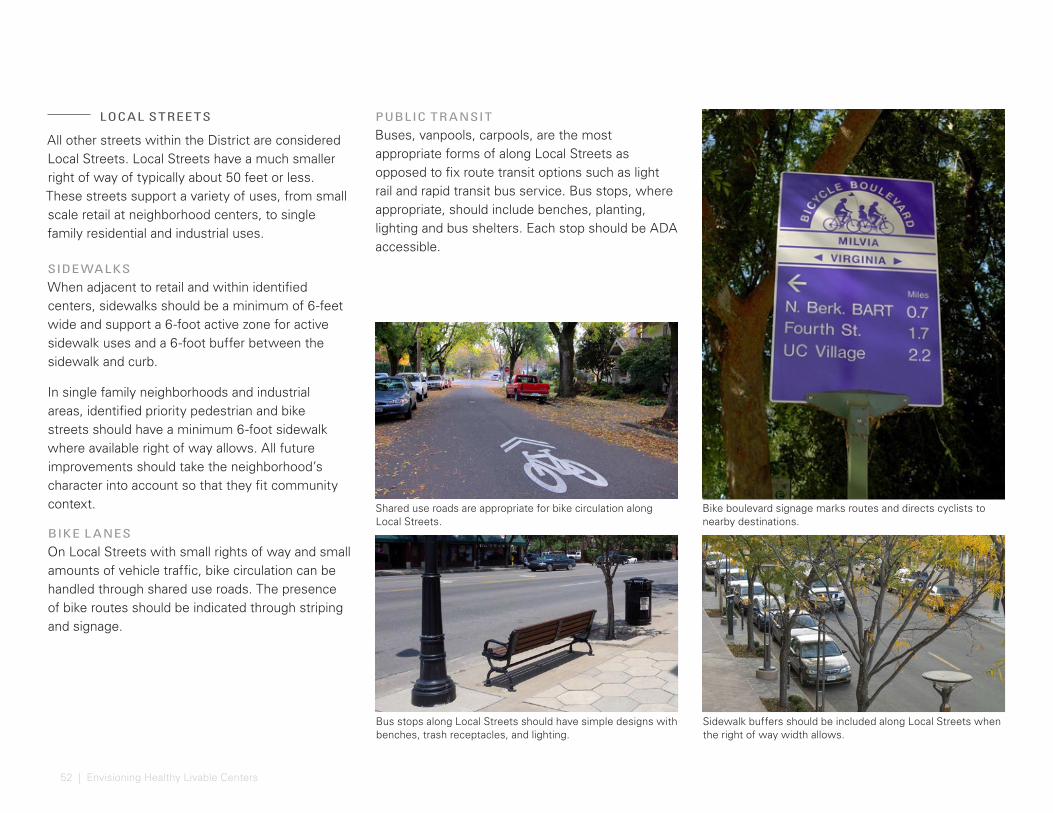
52 | Envisioning Healthy Livable Centers
All other streets within the District are considered Local Streets. Local Streets have a much smaller right of way of typically about 50 feet or less. These streets support a variety of uses, from small scale retail at neighborhood centers, to single family residential and industrial uses.
SIDE WALKS
When adjacent to retail and within identified centers, sidewalks should be a minimum of 6-feet wide and support a 6-foot active zone for active sidewalk uses and a 6-foot buffer between the sidewalk and curb.
In single family neighborhoods and industrial areas, identified priority pedestrian and bike streets should have a minimum 6-foot sidewalk where available right of way allows. All future improvements should take the neighborhood’s character into account so that they fit community context.
BIKE L ANES
On Local Streets with small rights of way and small amounts of vehicle traffic, bike circulation can be handled through shared use roads. The presence of bike routes should be indicated through striping and signage.
LOCAL STREE TS
Bus stops along Local Streets should have simple designs with benches, trash receptacles, and lighting.
Shared use roads are appropriate for bike circulation along Local Streets.
Sidewalk buffers should be included along Local Streets when the right of way width allows.
Bike boulevard signage marks routes and directs cyclists to nearby destinations.
PUBLIC TR ANSIT
Buses, vanpools, carpools, are the most appropriate forms of along Local Streets as opposed to fix route transit options such as light rail and rapid transit bus service. Bus stops, where appropriate, should include benches, planting, lighting and bus shelters. Each stop should be ADA accessible.

53
Figure 32: Existing Local Street Conditions - Dixie Drive from Telephone Road to IH 45
Figure 33: Proposed Local Street With Shared On-Street Bikeways - Dixie Drive from Telephone Rod to IH-45
LOCAL STREE T WITH SHARED ON-STREE T BIKE WAYS - DIXIE DRIVE FROM TELEPHONE ROAD TO IH-45
IMPROVEMENTS:
• Local streets support mostly residential uses and carry fewer cars at slower speeds, making them the ideal streets for shared on-street bike infrastructure. The City of Houston requires a minimum of 14-foot lanes to accommodate a shared bike and vehicle lane (sharrow). When the right of way allows for the preservation of parking and 14-foot lanes, sharrows should be incorporated. In the cases where the right of way does not provide enough space, streets should be marked as a bike boulevard with signs and pavement markings. These treatments heighten driver awareness of cyclists as well as cyclists’ feelings of safety.
• Street trees should be planted along the street edge where

54 | Envisioning Healthy Livable Centers
A comprehensive open space system provides residents with better access to parks. Parks improve community health by providing spaces for physical activity and neighborhood gathering.
The Houston Parks Master Plan identified a need for updates to existing parks and a need for an additional 45 acres of Neighborhood Parks within the District. This Vision recommends three new locations for Neighborhood Parks at the intersections of Telephone Road and Bellfort Street, and a vacant parcel of land near Monroe Road and Meldrum Lane, and in between Lockheed and Travelair Streets. The addition of these parks would increase the amount of open space available to residents within the southern portion of the District.
The vision also recommends the construction of approximately 9 miles of new trails in addition to the 2.5 miles of planned trail projects along Sims Bayou. This would bring the total number of trails up to approximately 12.5 miles within the District boundaries.
As a method of increasing open space accessibility, the vision establishes a hierarchy of bayou and recreational trail gateways. The Houston Bike Plan1 also recommends pedestrian bridge connections across Sims Bayou at Leonora and Northdale Streets. Detailed gateway elements are outlined in the following pages of the Open Space Vision Plan.
1 Houston Bike Plan, page 6-77.
OPEN SPACE VISIONASSOCIATED PROJECTS:
Bayou EntrancesEnhance Existing Parks New ParksDrainage Channel and Utility Right of Way Connections
ASSOCIATED PROGR AMS:
Tree Planting
ACHIE VED ME TRICS:
• 10 ACRES OF PARK SPACE ADDED
• 6 4% OF THE DISTRIC T IS NOW WITHIN A HAL F MIL E WAL K F ROM A PARK [24% INCRE ASE ]
• 3 7 MIL ES OF SIDE WAL K ADDED OR UPDATED WITHIN PARK 1/ 2 MIL E SERVICE ARE A
GOAL S ACHIE VED* :
L IVABIL IT Y PRINCIPL ES* * :
*AS DEFINED ON PROJEC T GOA L S ON PAGE 5 . * *AS DEFINED BY U.S. DEPA R T MENT OF HOUSING AND URBAN DE V ELOPMENT ( HUD) .
654321
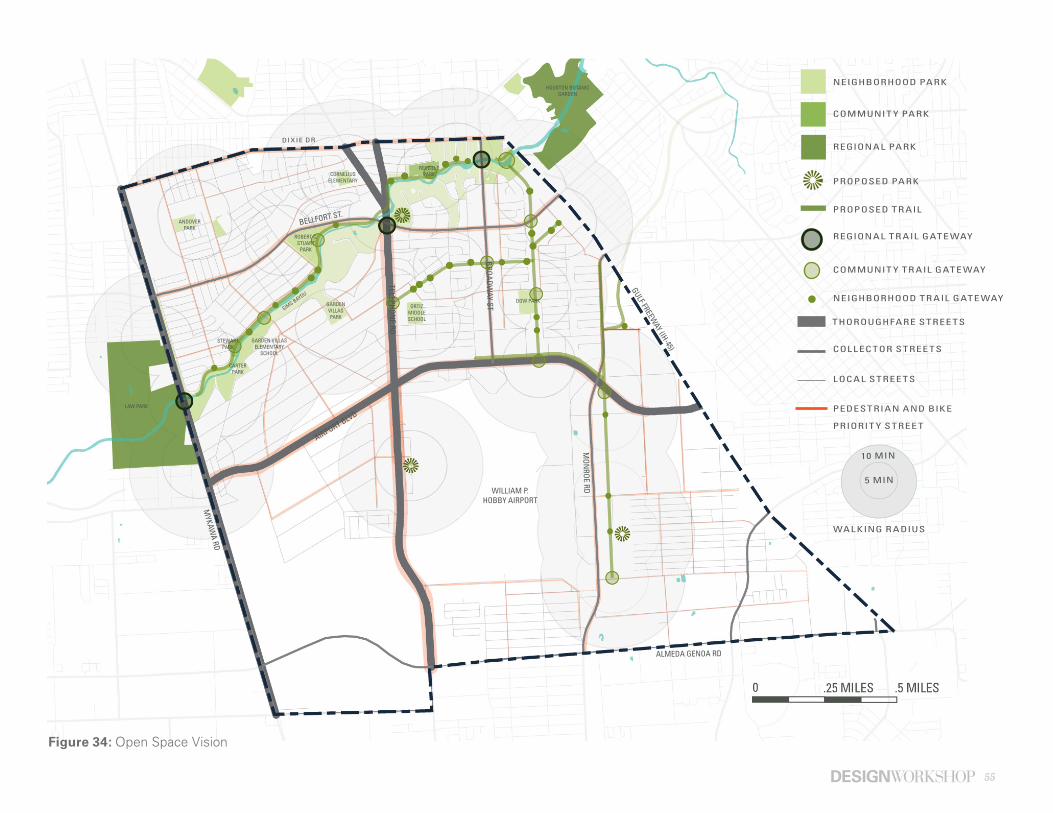
55
NEIGHBORHOOD PARK
COMMUNIT Y PARK
REGIONAL PARK
PROPOSED PARK
PROPOSED TR AIL
DOW PARK
CORNELIUS ELEMENTARY
ORTIZMIDDLESCHOOL
GARDEN VILLAS ELEMENTARY
SCHOOL
WILLIAM P. HOBBY AIRPORT
HOUSTON BOTANIC GARDEN
GARDEN VILLAS PARK
REVEILLE PARK
ANDOVER PARK
CARTER PARK
STEWART PARK
ROBERT C. STUART
PARK
DIXIE DR
GULF FREEWAY (IH-45)
MYKAW
A RD
BROADWAY ST
TELEPHONE RD
MON
ROE RD
BELLFORT ST.
AIRPORT BLVD
ALMEDA GENOA RD
SIMS BAYOU
WAL KING R ADIUS
5 MIN
10 MIN
REGIONAL TR AIL GATE WAY
COMMUNIT Y TR AIL GATE WAY
NEIGHBORHOOD TR AIL GATE WAY
COL L EC TOR STREE TS
LOCAL S TREE TS
LAW PARK
Figure 34: Open Space Vision
PEDESTRIAN AND BIK E
PRIORIT Y STREE T
THOROUGHFARE STREE TS
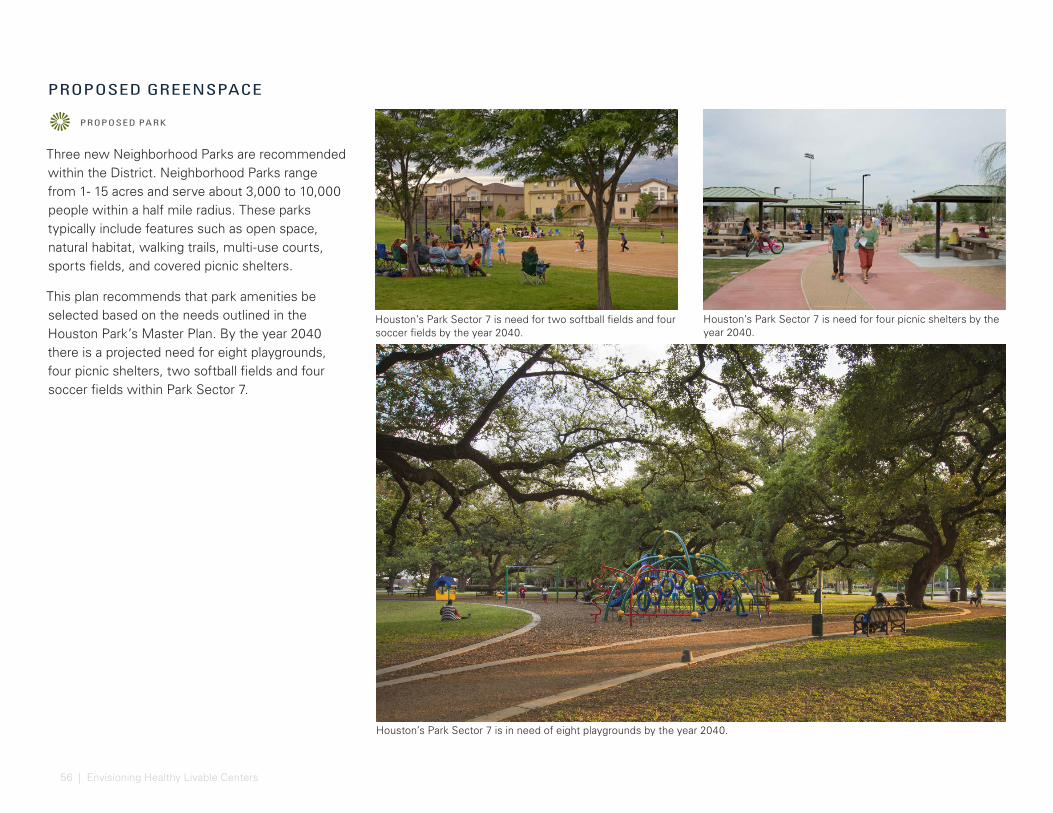
56 | Envisioning Healthy Livable Centers
PROPOSED PARK
Houston’s Park Sector 7 is in need of eight playgrounds by the year 2040.
Houston’s Park Sector 7 is need for two softball fields and four soccer fields by the year 2040.
Houston’s Park Sector 7 is need for four picnic shelters by the year 2040.
Three new Neighborhood Parks are recommended within the District. Neighborhood Parks range from 1- 15 acres and serve about 3,000 to 10,000 people within a half mile radius. These parks typically include features such as open space, natural habitat, walking trails, multi-use courts, sports fields, and covered picnic shelters.
This plan recommends that park amenities be selected based on the needs outlined in the Houston Park’s Master Plan. By the year 2040 there is a projected need for eight playgrounds, four picnic shelters, two softball fields and four soccer fields within Park Sector 7.
PROPOSED GREENSPACE
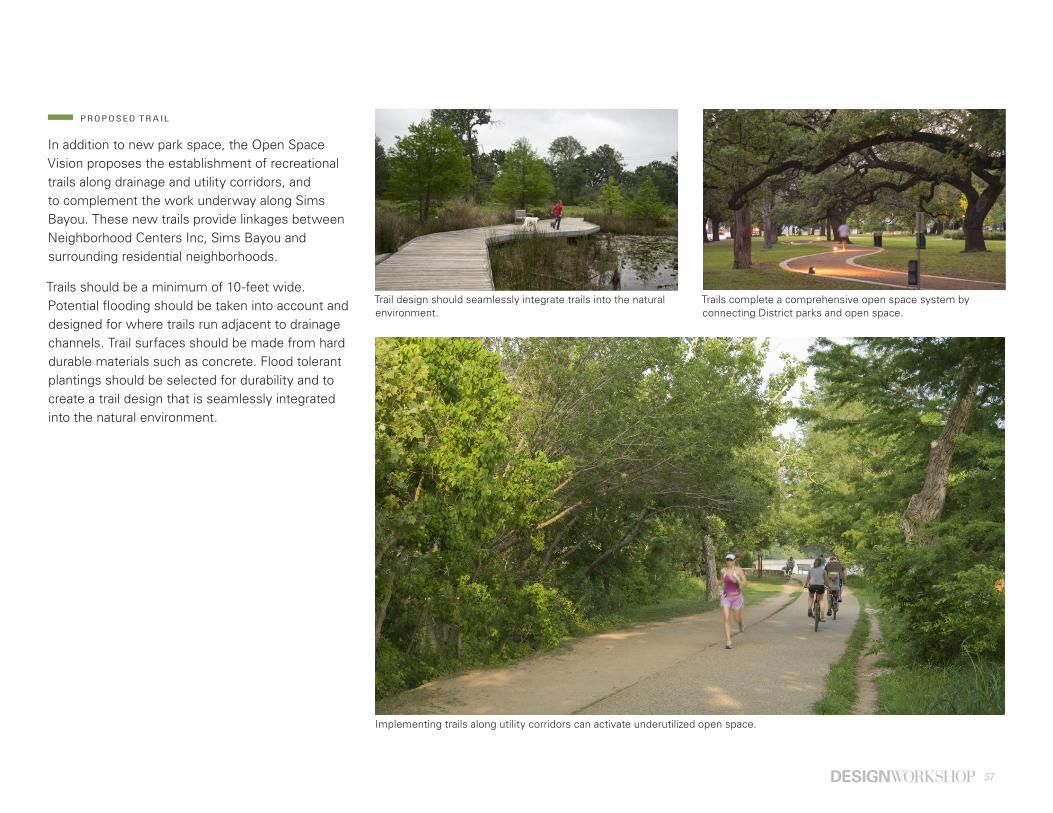
57
PROPOSED TR AIL
Trail design should seamlessly integrate trails into the natural environment.
Trails complete a comprehensive open space system by connecting District parks and open space.
Implementing trails along utility corridors can activate underutilized open space.
In addition to new park space, the Open Space Vision proposes the establishment of recreational trails along drainage and utility corridors, and to complement the work underway along Sims Bayou. These new trails provide linkages between Neighborhood Centers Inc, Sims Bayou and surrounding residential neighborhoods.
Trails should be a minimum of 10-feet wide. Potential flooding should be taken into account and designed for where trails run adjacent to drainage channels. Trail surfaces should be made from hard durable materials such as concrete. Flood tolerant plantings should be selected for durability and to create a trail design that is seamlessly integrated into the natural environment.
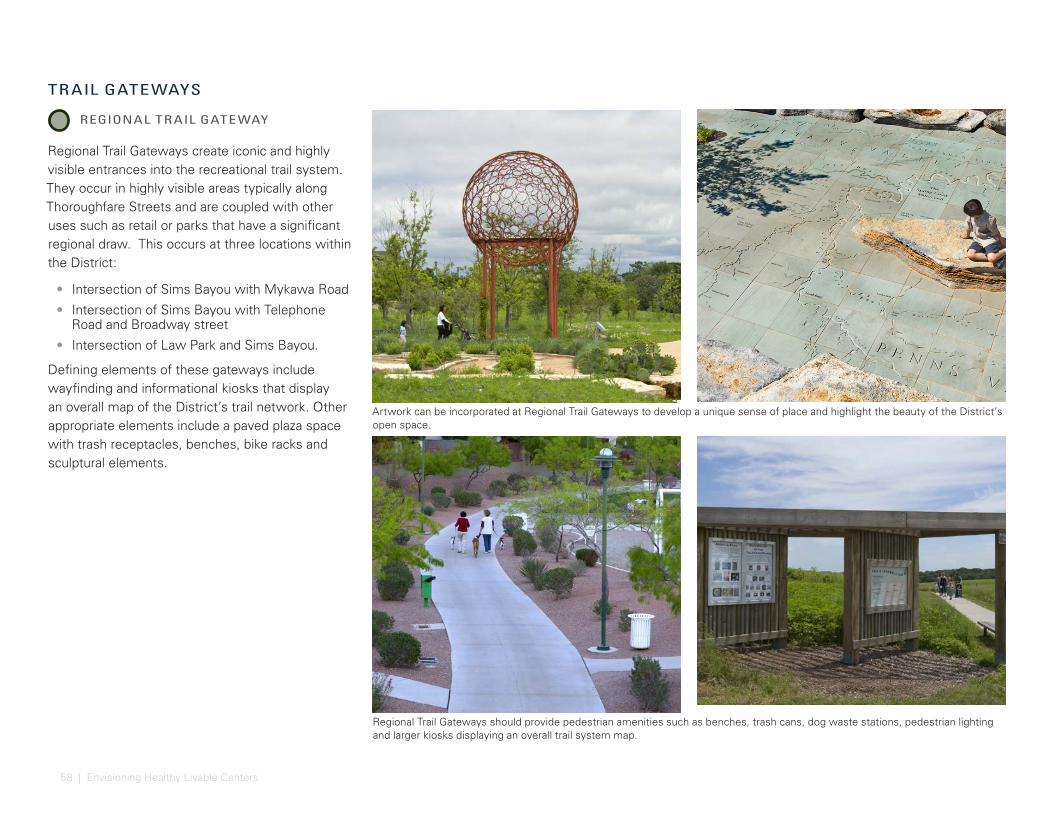
58 | Envisioning Healthy Livable Centers
Artwork can be incorporated at Regional Trail Gateways to develop a unique sense of place and highlight the beauty of the District’s open space.
Regional Trail Gateways create iconic and highly visible entrances into the recreational trail system. They occur in highly visible areas typically along Thoroughfare Streets and are coupled with other uses such as retail or parks that have a significant regional draw. This occurs at three locations within the District:
• Intersection of Sims Bayou with Mykawa Road
• Intersection of Sims Bayou with Telephone Road and Broadway street
• Intersection of Law Park and Sims Bayou.
Defining elements of these gateways include wayfinding and informational kiosks that display an overall map of the District’s trail network. Other appropriate elements include a paved plaza space with trash receptacles, benches, bike racks and sculptural elements.
REGIONAL TR AIL GATE WAY
Regional Trail Gateways should provide pedestrian amenities such as benches, trash cans, dog waste stations, pedestrian lighting and larger kiosks displaying an overall trail system map.
TRAIL GATEWAYS
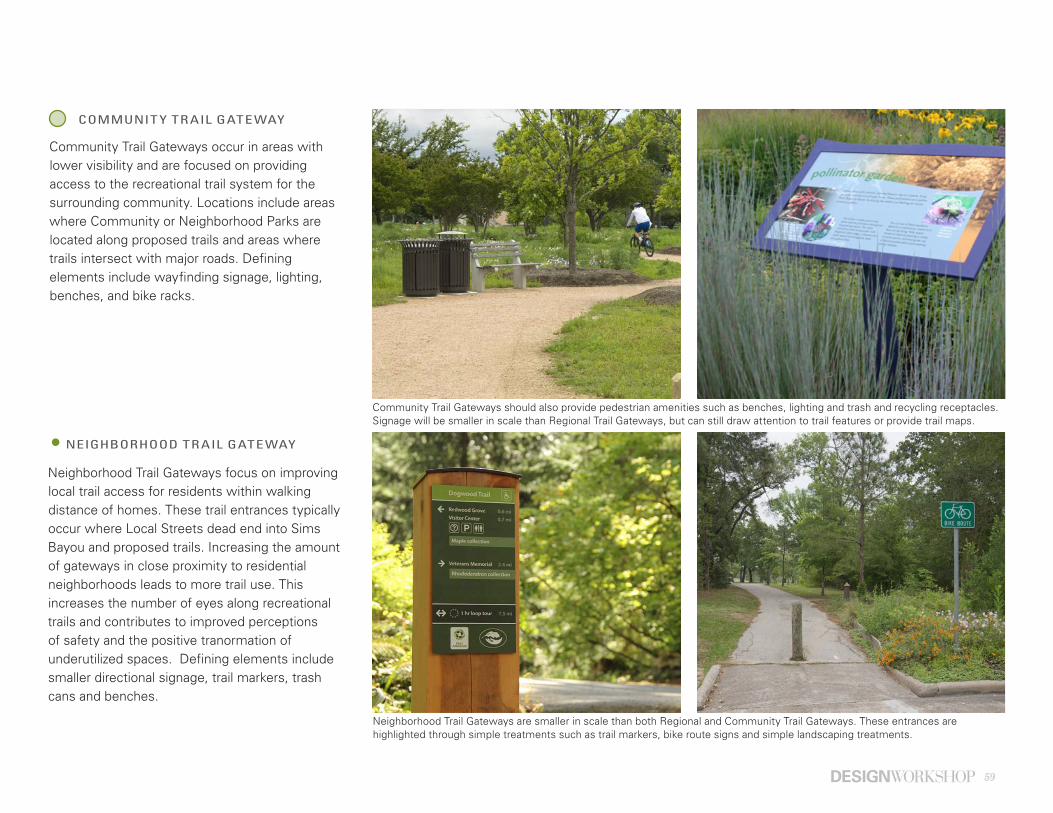
59
Community Trail Gateways occur in areas with lower visibility and are focused on providing access to the recreational trail system for the surrounding community. Locations include areas where Community or Neighborhood Parks are located along proposed trails and areas where trails intersect with major roads. Defining elements include wayfinding signage, lighting, benches, and bike racks.
Neighborhood Trail Gateways focus on improving local trail access for residents within walking distance of homes. These trail entrances typically occur where Local Streets dead end into Sims Bayou and proposed trails. Increasing the amount of gateways in close proximity to residential neighborhoods leads to more trail use. This increases the number of eyes along recreational trails and contributes to improved perceptions of safety and the positive tranormation of underutilized spaces. Defining elements include smaller directional signage, trail markers, trash cans and benches.
COMMUNIT Y TR AIL GATE WAY
NEIGHBORHOOD TR AIL GATE WAY
Community Trail Gateways should also provide pedestrian amenities such as benches, lighting and trash and recycling receptacles. Signage will be smaller in scale than Regional Trail Gateways, but can still draw attention to trail features or provide trail maps.
Neighborhood Trail Gateways are smaller in scale than both Regional and Community Trail Gateways. These entrances are highlighted through simple treatments such as trail markers, bike route signs and simple landscaping treatments.

60 | Envisioning Healthy Livable Centers
CULTURAL IDENTITY VISIONDrawing attention to significant historic and cultural features and establishing consistent treatments to the public realm along corridors can contribute in a unified identity for the district.
Historic and culturally significant features should be preserved and highlighted throughout the District. A comprehensive signage and wayfinding program will draw attention to these features while providing a draw for tourism. Culturally significant features within the District include but are not limited to the following:
• Glenbrook Valley’s Mid-Century Modern Homes
• Broadway Corridor
• William P. Hobby Airport
• 1940 Air Terminal Museum
• Mt. Carmel Academy
• Garden Villas Elementary School
• Sims Bayou
• Robert C. Stuart Park
• Telephone Road
There should be continued discussions with the community and the Hobby Area Management District to identify additional points of significance.
ASSOCIATED PROJECTS:
Bayou Trail ArtHistoric Building PreservationMultipurpose Warehouse Spaces
ASSOCIATED PROGR AMS:
Cultural History Program
ACHIE VED ME TRICS:
• 9 HIGHLIGHTED POINTS OF HISTORICAL AND CULTUR AL SIGNIFICANCE
GOAL S ACHIE VED* :
L IVABIL IT Y PRINCIPL ES* * :
*AS DEFINED ON PROJEC T GOA L S ON PAGE 5 . * *AS DEFINED BY U.S. DEPA R T MENT OF HOUSING AND URBAN DE V ELOPMENT ( HUD) .
654321

61
DOW PARK
CORNELIUS ELEMENTARY
ORTIZMIDDLESCHOOL
GARDEN VILLAS ELEMENTARY
SCHOOL
WILLIAM P. HOBBY AIRPORT
HOUSTON BOTANIC GARDEN
GARDEN VILLAS PARK
REVEILLE PARK
ANDOVER PARK
CARTER PARK
STEWART PARK
ROBERT C. STUART
PARK
DIXIE DR
GULF FREEWAY (IH-45)
MYKAW
A RD
BROADWAY ST
TELEPHONE RD
MON
ROE RD
BELLFORT ST.
AIRPORT BLVD
ALMEDA GENOA RD
SIMS BAYOU
PEDESTRIAN AND BIK E PRIORIT Y STREE T
CULTUR AL LOOP
FE ATURE OF HISTORIC OR CULTUR AL IMPOR TANCE
LAW PARK
Figure 35: Cultural Identity Vision
PROPOSED TR AIL
WAL KING R ADIUS
5 MIN
10 MIN
PROPOSED PARK
COL L EC TOR STREE TS
LOCAL S TREE TS
THOROUGHFARE STREE TS
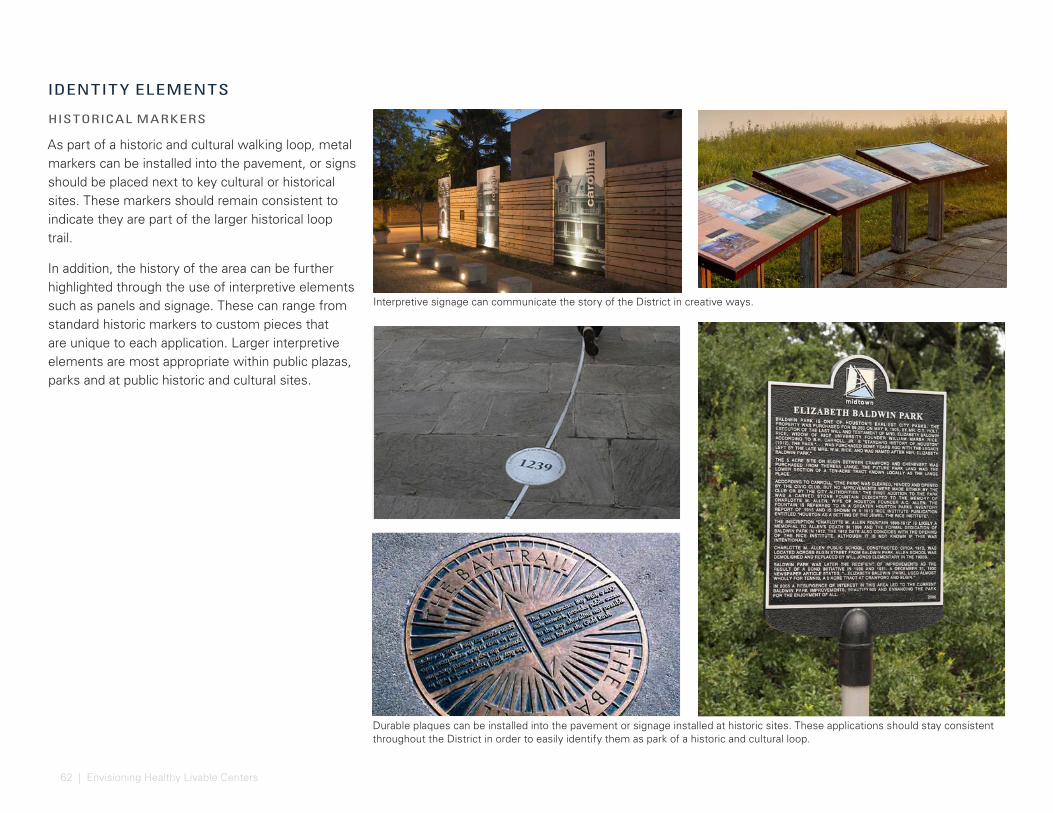
62 | Envisioning Healthy Livable Centers
HISTORICAL MARKERS
As part of a historic and cultural walking loop, metal markers can be installed into the pavement, or signs should be placed next to key cultural or historical sites. These markers should remain consistent to indicate they are part of the larger historical loop trail.
In addition, the history of the area can be further highlighted through the use of interpretive elements such as panels and signage. These can range from standard historic markers to custom pieces that are unique to each application. Larger interpretive elements are most appropriate within public plazas, parks and at public historic and cultural sites.
Interpretive signage can communicate the story of the District in creative ways.
Durable plaques can be installed into the pavement or signage installed at historic sites. These applications should stay consistent throughout the District in order to easily identify them as park of a historic and cultural loop.
IDENTIT Y ELEMENTS

63
Updated landscaping along center medians improve the aesthetic quality of District streets.
ID markers can be incorporated along other major corridors within the District to highlight key areas and centers.
DISTRICT IDENTIT Y
Common signage, ID markers, unique bus shelters, paving patterns, and consistent character of pedestrian amenities can be used to create a unified identity for the District. The Hobby Area Management District is currently designing and implementing many of these elements with first area of implementation along Broadway Street.
Signage toppers and custom signage branding can be applied to all street signs throughout the district. Special paving patterns and a consistent selection of pedestrian amenities are appropriate applications for Thoroughfare and Collector Streets such as:
• Mykawa Road
• Telephone Road
• Monroe Road
• Dixie Drive
• Bellfort Street
• Airport Boulevard
• Almeda Genoa Road
ID markers are most appropriate along major corridors and in areas with commercial use as a means of highlighting areas of significance. Within the District this would occur along Airport Boulevard between Telephone Road and IH-45, and along Broadway Street.
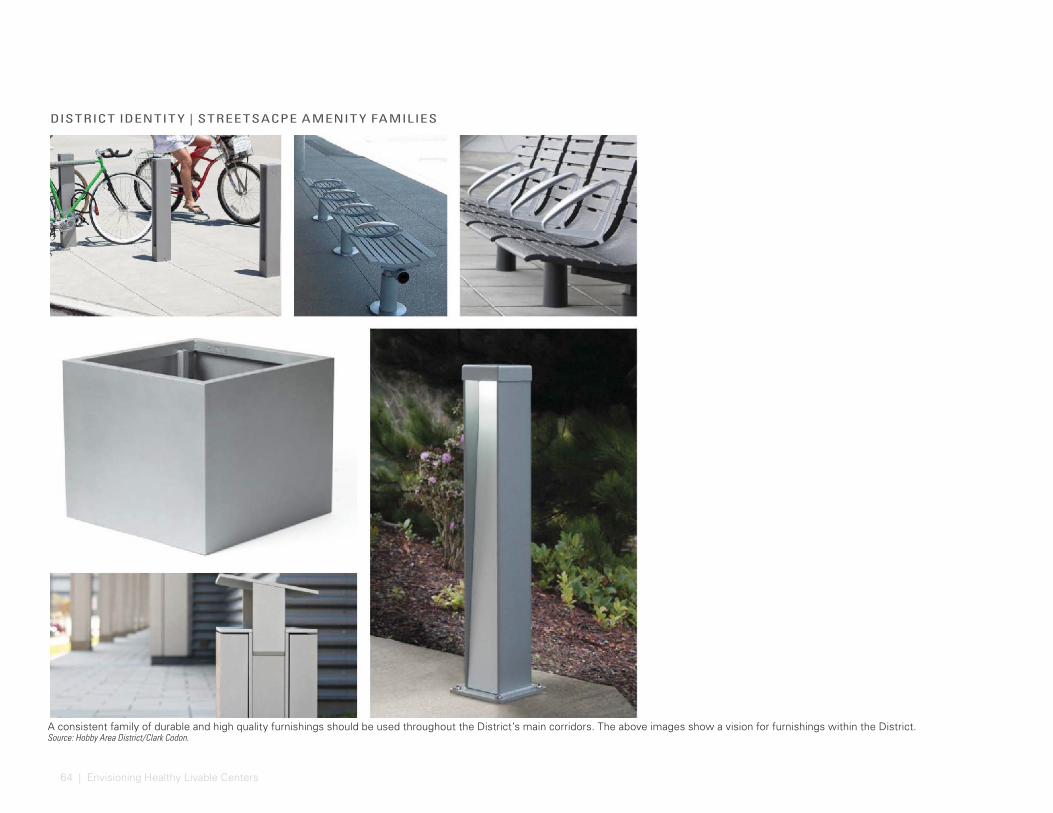
64 | Envisioning Healthy Livable Centers
DISTRICT IDENTIT Y | STREE TSACPE AMENIT Y FAMILIES
A consistent family of durable and high quality furnishings should be used throughout the District’s main corridors. The above images show a vision for furnishings within the District. Source: Hobby Area District/Clark Codon.
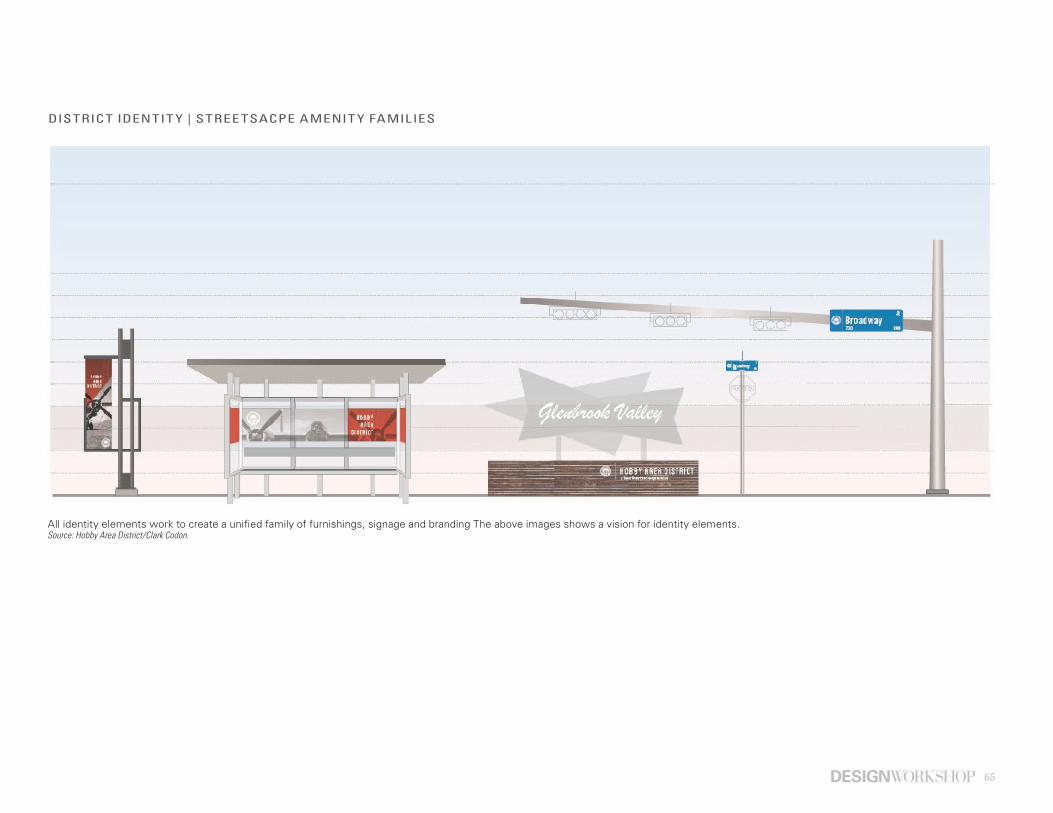
65
DISTRICT IDENTIT Y | STREE TSACPE AMENIT Y FAMILIES
All identity elements work to create a unified family of furnishings, signage and branding The above images shows a vision for identity elements.Source: Hobby Area District/Clark Codon.
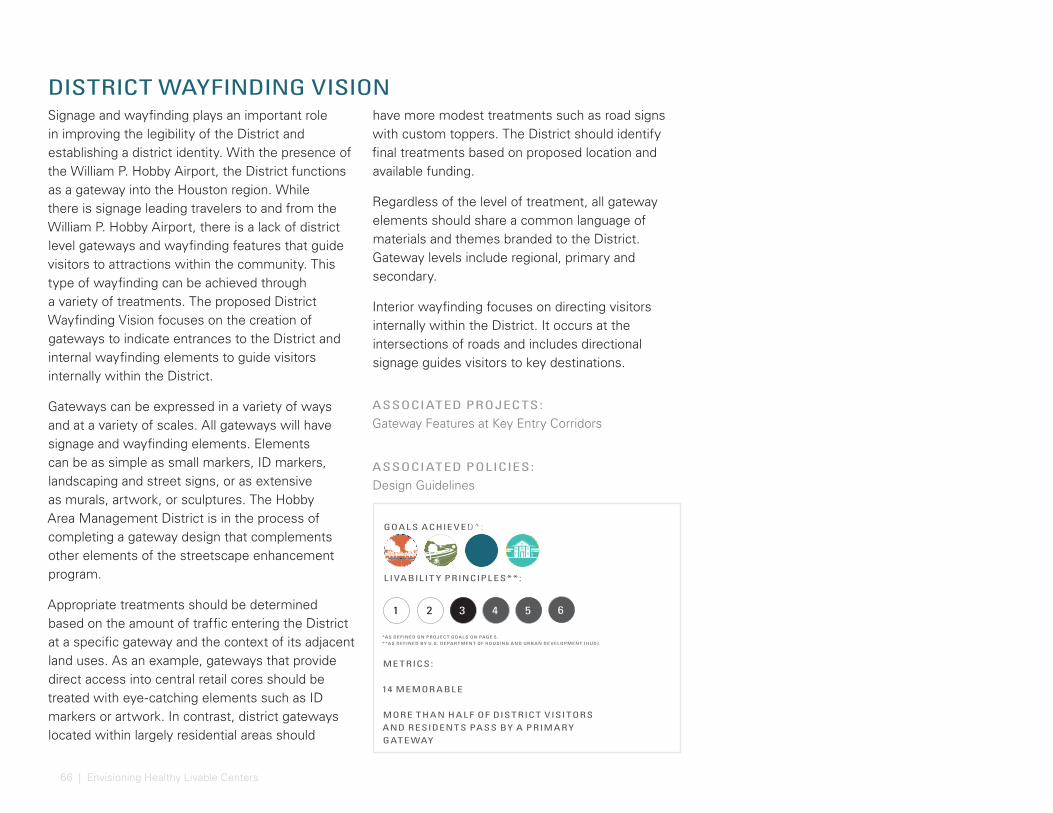
66 | Envisioning Healthy Livable Centers
DISTRICT WAYFINDING VISIONSignage and wayfinding plays an important role in improving the legibility of the District and establishing a district identity. With the presence of the William P. Hobby Airport, the District functions as a gateway into the Houston region. While there is signage leading travelers to and from the William P. Hobby Airport, there is a lack of district level gateways and wayfinding features that guide visitors to attractions within the community. This type of wayfinding can be achieved through a variety of treatments. The proposed District Wayfinding Vision focuses on the creation of gateways to indicate entrances to the District and internal wayfinding elements to guide visitors internally within the District.
Gateways can be expressed in a variety of ways and at a variety of scales. All gateways will have signage and wayfinding elements. Elements can be as simple as small markers, ID markers, landscaping and street signs, or as extensive as murals, artwork, or sculptures. The Hobby Area Management District is in the process of completing a gateway design that complements other elements of the streetscape enhancement program.
Appropriate treatments should be determined based on the amount of traffic entering the District at a specific gateway and the context of its adjacent land uses. As an example, gateways that provide direct access into central retail cores should be treated with eye-catching elements such as ID markers or artwork. In contrast, district gateways located within largely residential areas should
have more modest treatments such as road signs with custom toppers. The District should identify final treatments based on proposed location and available funding.
Regardless of the level of treatment, all gateway elements should share a common language of materials and themes branded to the District. Gateway levels include regional, primary and secondary.
Interior wayfinding focuses on directing visitors internally within the District. It occurs at the intersections of roads and includes directional signage guides visitors to key destinations.
ASSOCIATED PROJECTS:
Gateway Features at Key Entry Corridors
ASSOCIATED POLICIES:
Design Guidelines
ME TRICS:
14 MEMOR ABL E
MORE THAN HAL F OF DISTRIC T VISITORS AND RESIDENTS PASS BY A PRIMARY GATE WAY
GOAL S ACHIE VED* :
L IVABIL IT Y PRINCIPL ES* * :
*AS DEFINED ON PROJEC T GOA L S ON PAGE 5 . * *AS DEFINED BY U.S. DEPA R T MENT OF HOUSING AND URBAN DE V ELOPMENT ( HUD) .
654321
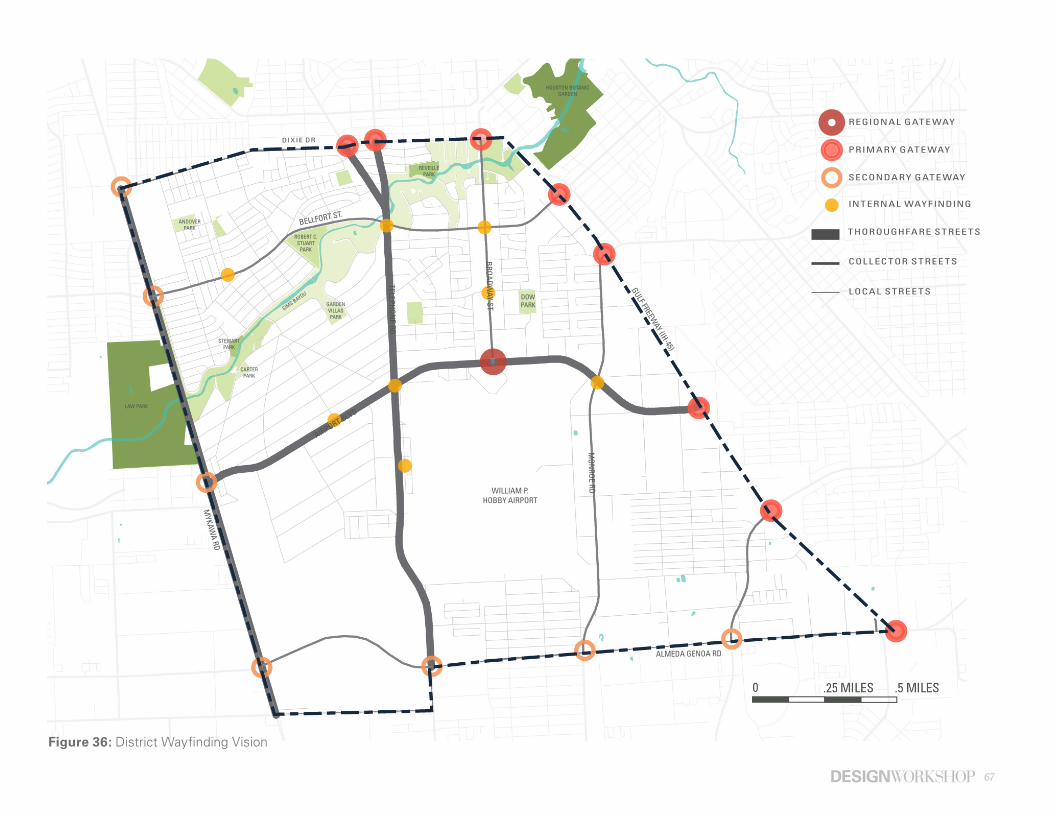
67
DOW PARK
WILLIAM P. HOBBY AIRPORT
HOUSTON BOTANIC GARDEN
GARDEN VILLAS PARK
REVEILLE PARK
ANDOVER PARK
CARTER PARK
ROBERT C. STUART
PARK
DIXIE DR
GULF FREEWAY (IH-45)
MYKAW
A RD
BROADWAY ST
TELEPHONE RD
MON
ROE RD
BELLFORT ST.
AIRPORT BLVD
ALMEDA GENOA RD
SIMS BAYOU
REGIONAL GATE WAY
PRIMARY GATE WAY
SECONDARY GATE WAY
INTERNAL WAY FINDING
STEWART PARK
COL L EC TOR STREE TS
LOCAL S TREE TS
LAW PARK
Figure 36: District Wayfinding Vision
THOROUGHFARE STREE TS
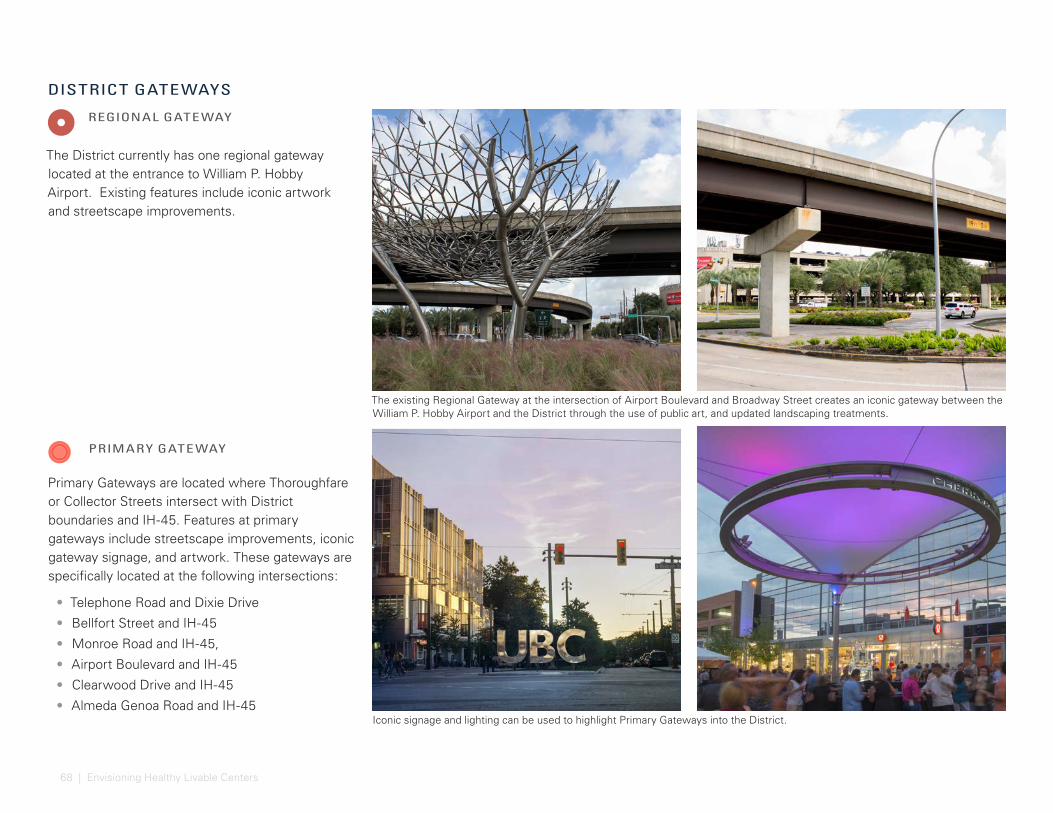
68 | Envisioning Healthy Livable Centers
The District currently has one regional gateway located at the entrance to William P. Hobby Airport. Existing features include iconic artwork and streetscape improvements.
Primary Gateways are located where Thoroughfare or Collector Streets intersect with District boundaries and IH-45. Features at primary gateways include streetscape improvements, iconic gateway signage, and artwork. These gateways are specifically located at the following intersections:
• Telephone Road and Dixie Drive
• Bellfort Street and IH-45
• Monroe Road and IH-45,
• Airport Boulevard and IH-45
• Clearwood Drive and IH-45
• Almeda Genoa Road and IH-45
REGIONAL GATE WAY
PRIMARY GATE WAY
The existing Regional Gateway at the intersection of Airport Boulevard and Broadway Street creates an iconic gateway between the William P. Hobby Airport and the District through the use of public art, and updated landscaping treatments.
Iconic signage and lighting can be used to highlight Primary Gateways into the District.
DISTRICT GATEWAYS
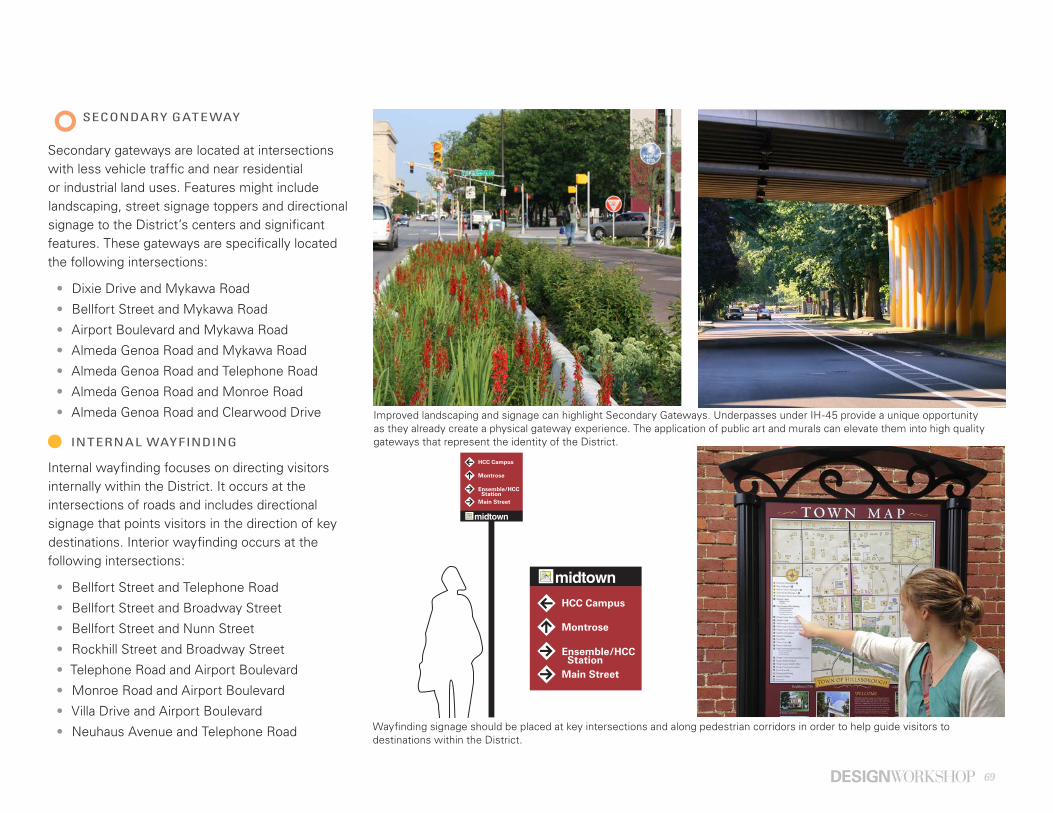
69
®
Main Street
Ensemble/HCC Station
HCC Campus
Montrose
®
Main Street
Ensemble/HCC Station
HCC Campus
Montrose
Secondary gateways are located at intersections with less vehicle traffic and near residential or industrial land uses. Features might include landscaping, street signage toppers and directional signage to the District’s centers and significant features. These gateways are specifically located the following intersections:
• Dixie Drive and Mykawa Road
• Bellfort Street and Mykawa Road
• Airport Boulevard and Mykawa Road
• Almeda Genoa Road and Mykawa Road
• Almeda Genoa Road and Telephone Road
• Almeda Genoa Road and Monroe Road
• Almeda Genoa Road and Clearwood Drive
Internal wayfinding focuses on directing visitors internally within the District. It occurs at the intersections of roads and includes directional signage that points visitors in the direction of key destinations. Interior wayfinding occurs at the following intersections:
• Bellfort Street and Telephone Road
• Bellfort Street and Broadway Street
• Bellfort Street and Nunn Street
• Rockhill Street and Broadway Street
• Telephone Road and Airport Boulevard
• Monroe Road and Airport Boulevard
• Villa Drive and Airport Boulevard
• Neuhaus Avenue and Telephone Road
INTERNAL WAYFINDING
SECONDARY GATE WAY
Improved landscaping and signage can highlight Secondary Gateways. Underpasses under IH-45 provide a unique opportunity as they already create a physical gateway experience. The application of public art and murals can elevate them into high quality gateways that represent the identity of the District.
Wayfinding signage should be placed at key intersections and along pedestrian corridors in order to help guide visitors to destinations within the District.

70 | Envisioning Healthy Livable Centers
DISTRICT IDENTIT Y | ID MARKER PANELS
A family of gateway signage and ID markers communicate a consistent brand for an area. The above graphics a vision for ID markers and panels within the District. Source: Hobby Area District/Clark Codon.
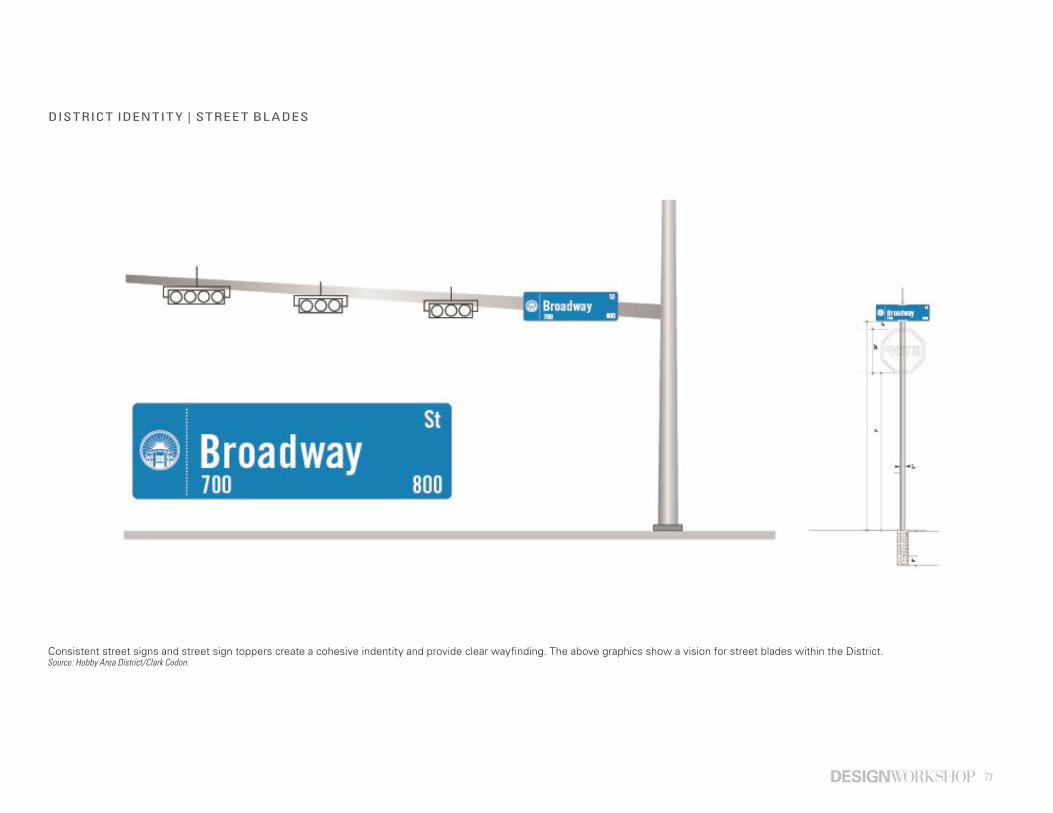
71
DISTRICT IDENTIT Y | STREE T BL ADES
Consistent street signs and street sign toppers create a cohesive indentity and provide clear wayfinding. The above graphics show a vision for street blades within the District. Source: Hobby Area District/Clark Codon.
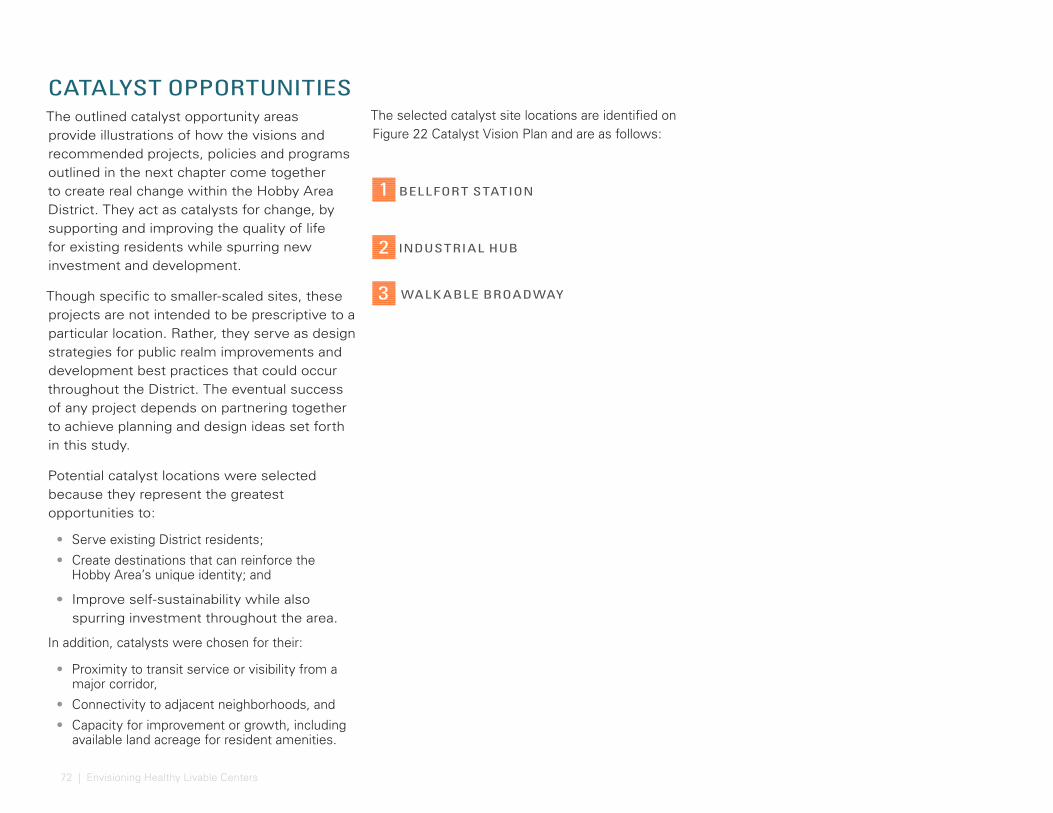
72 | Envisioning Healthy Livable Centers
CATALYST OPPORTUNITIESThe outlined catalyst opportunity areas provide illustrations of how the visions and recommended projects, policies and programs outlined in the next chapter come together to create real change within the Hobby Area District. They act as catalysts for change, by supporting and improving the quality of life for existing residents while spurring new investment and development.
Though specific to smaller-scaled sites, these projects are not intended to be prescriptive to a particular location. Rather, they serve as design strategies for public realm improvements and development best practices that could occur throughout the District. The eventual success of any project depends on partnering together to achieve planning and design ideas set forth in this study.
Potential catalyst locations were selected because they represent the greatest opportunities to:
• Serve existing District residents;
• Create destinations that can reinforce the Hobby Area’s unique identity; and
• Improve self-sustainability while also spurring investment throughout the area.
In addition, catalysts were chosen for their:
• Proximity to transit service or visibility from a major corridor,
• Connectivity to adjacent neighborhoods, and
• Capacity for improvement or growth, including available land acreage for resident amenities.
The selected catalyst site locations are identified on Figure 22 Catalyst Vision Plan and are as follows:
1
2
3
BELLFORT STATION
INDUSTRIAL HUB
WALK ABLE BROADWAY
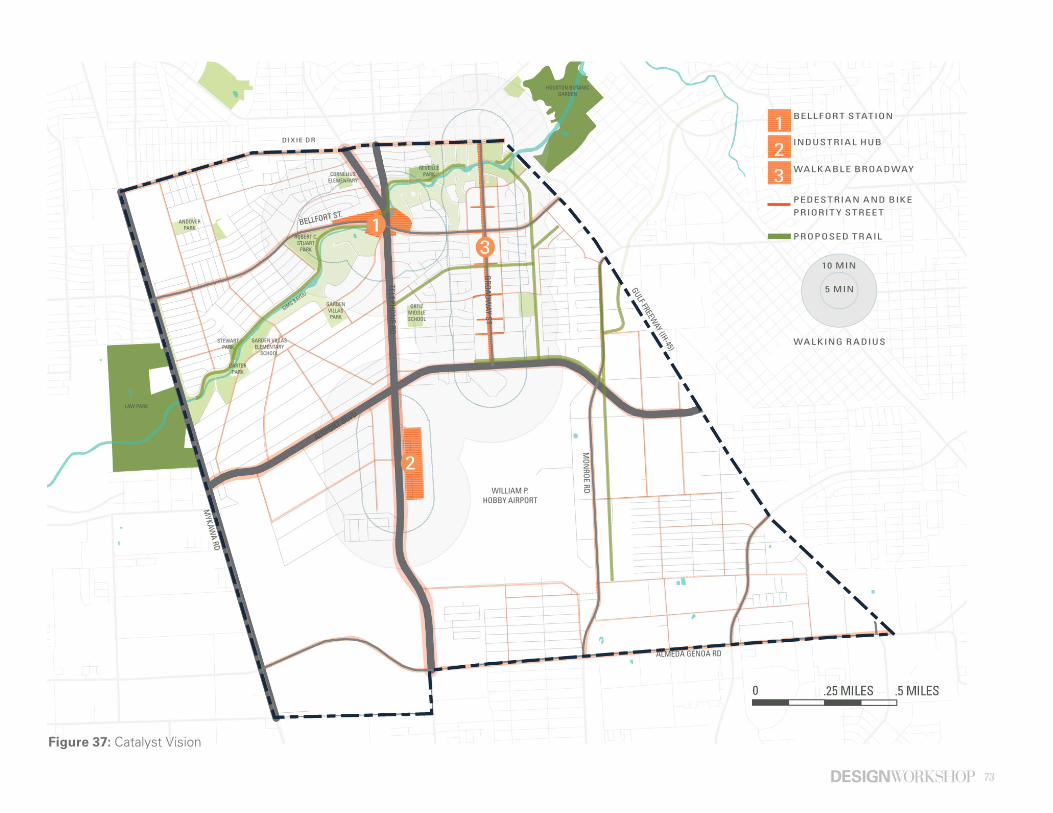
73
CORNELIUS ELEMENTARY
ORTIZMIDDLESCHOOL
GARDEN VILLAS ELEMENTARY
SCHOOL
WILLIAM P. HOBBY AIRPORT
HOUSTON BOTANIC GARDEN
GARDEN VILLAS PARK
REVEILLE PARK
ANDOVER PARK
CARTER PARK
STEWART PARK
ROBERT C. STUART
PARK
DIXIE DR
GULF FREEWAY (IH-45)
MYKAW
A RD
BROADWAY ST
TELEPHONE RD
MON
ROE RD
BELLFORT ST.
AIRPORT BLVD
ALMEDA GENOA RD
SIMS BAYOU
WAL KING R ADIUS
5 MIN
10 MIN
BEL L FOR T STATION
INDUSTRIAL HUB
WAL K ABL E BROADWAY
123
1
LAW PARK
Figure 37: Catalyst Vision
2
PEDESTRIAN AND BIK E PRIORIT Y STREE T
PROPOSED TR AIL
3
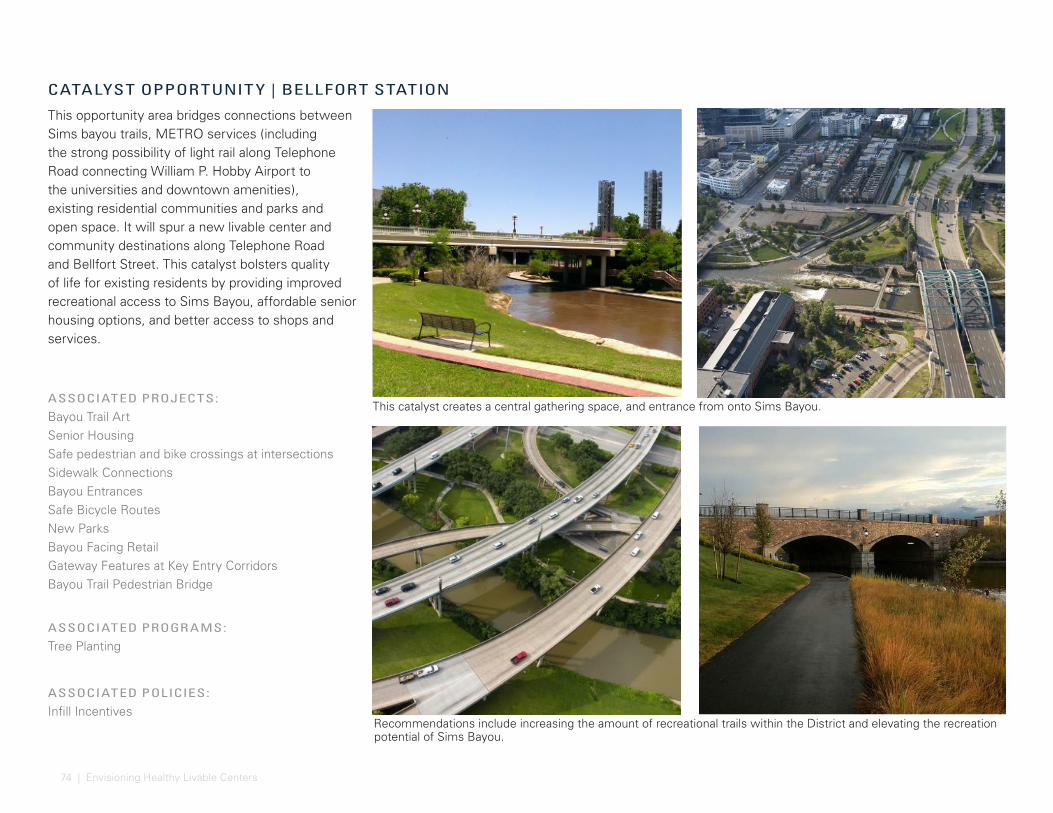
74 | Envisioning Healthy Livable Centers
This opportunity area bridges connections between Sims bayou trails, METRO services (including the strong possibility of light rail along Telephone Road connecting William P. Hobby Airport to the universities and downtown amenities), existing residential communities and parks and open space. It will spur a new livable center and community destinations along Telephone Road and Bellfort Street. This catalyst bolsters quality of life for existing residents by providing improved recreational access to Sims Bayou, affordable senior housing options, and better access to shops and services.
This catalyst creates a central gathering space, and entrance from onto Sims Bayou.
CATALYST OPPORTUNIT Y | BELLFORT STATION
Recommendations include increasing the amount of recreational trails within the District and elevating the recreation potential of Sims Bayou.
ASSOCIATED PROJECTS:
Bayou Trail ArtSenior HousingSafe pedestrian and bike crossings at intersectionsSidewalk ConnectionsBayou EntrancesSafe Bicycle RoutesNew ParksBayou Facing RetailGateway Features at Key Entry CorridorsBayou Trail Pedestrian Bridge
ASSOCIATED PROGR AMS:
Tree Planting
ASSOCIATED POLICIES:
Infill Incentives
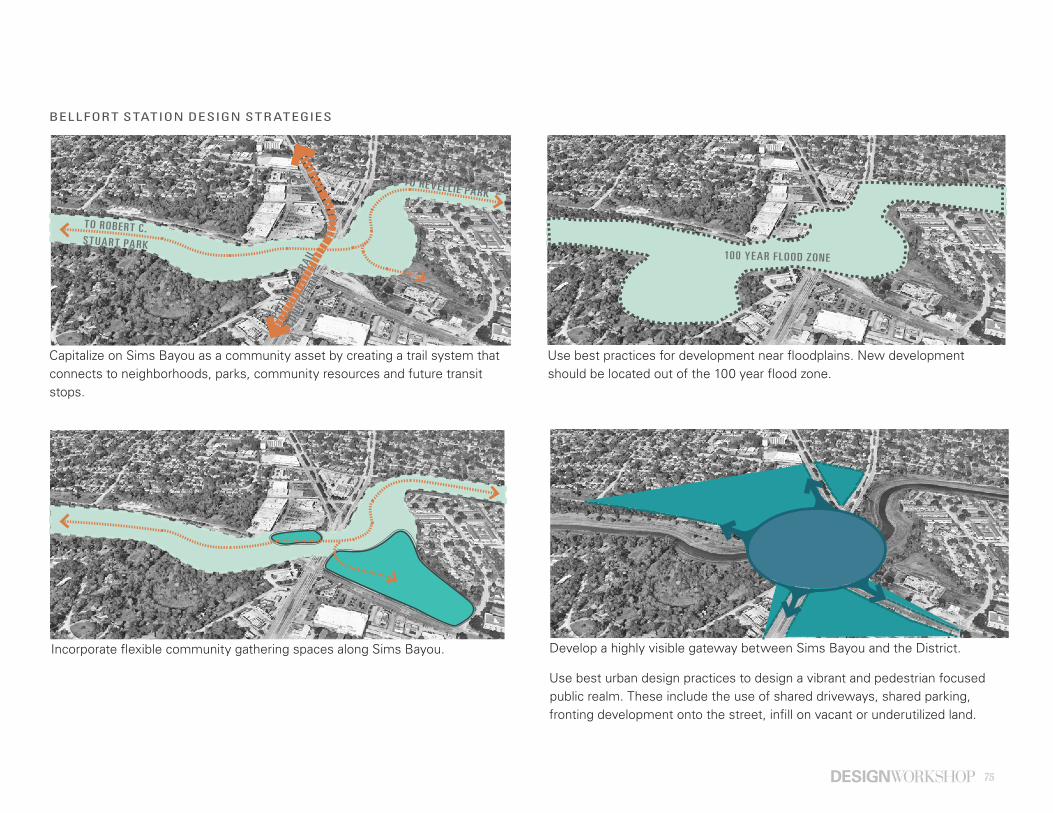
75
TO ROBERT C . STUART PARK
TO REVELL IE PARK
POTE
NTIA
L RA
IL
CONN
ECT I
ON
100 YEAR FLOOD ZONE
Capitalize on Sims Bayou as a community asset by creating a trail system that connects to neighborhoods, parks, community resources and future transit stops.
Use best practices for development near floodplains. New development should be located out of the 100 year flood zone.
Develop a highly visible gateway between Sims Bayou and the District.
Use best urban design practices to design a vibrant and pedestrian focused public realm. These include the use of shared driveways, shared parking, fronting development onto the street, infill on vacant or underutilized land.
Incorporate flexible community gathering spaces along Sims Bayou.
BELLFORT STATION DESIGN STR ATEGIES

76 | Envisioning Healthy Livable Centers
TE
LE
PH
ON
E R
D.
RE
VE
ILL
E S
T.
BELLFORT ST.SIMS B
AYOUBELLFORT ST.
1
2
2
3
3
1
4
5
6
6
7
5
7
8Senior housing/retirement community townhomes
Safe crossings to Sims Bayou with upgrades to sidewalks, planting, curbs and a new signalized crossing at Bellfort and Lancaster Street
Trail along the north bank of Sims Bayou with public art, seating areas, trees and landscaping
Retail renovation facing on Sims Bayou
Flexible plaza space that creates a gateway onto the Sims Bayou greenway
Bridge across Sims Bayou with artistic landing plazasImproved intersection with safe pedestrian crossings and new retail at corners
New neighborhood park with sports fields, trails to Sims Bayou and gathering spaces
Multi-family housing
Retail
Senior housing/townhomes
Community
3
84
22
Figure 38: Telephone Road Conceptual Plan
9
9 Potential light rail along Telephone Road connecting William P. Hobby Airport to universities and downtown amenities
Note: Concept designs are for illustrative purposes only and have not been formally reviewed nor approved by the City. Should these concept designs mature, they will undergo a formalized plan, design and construction process with appropriate permitting.
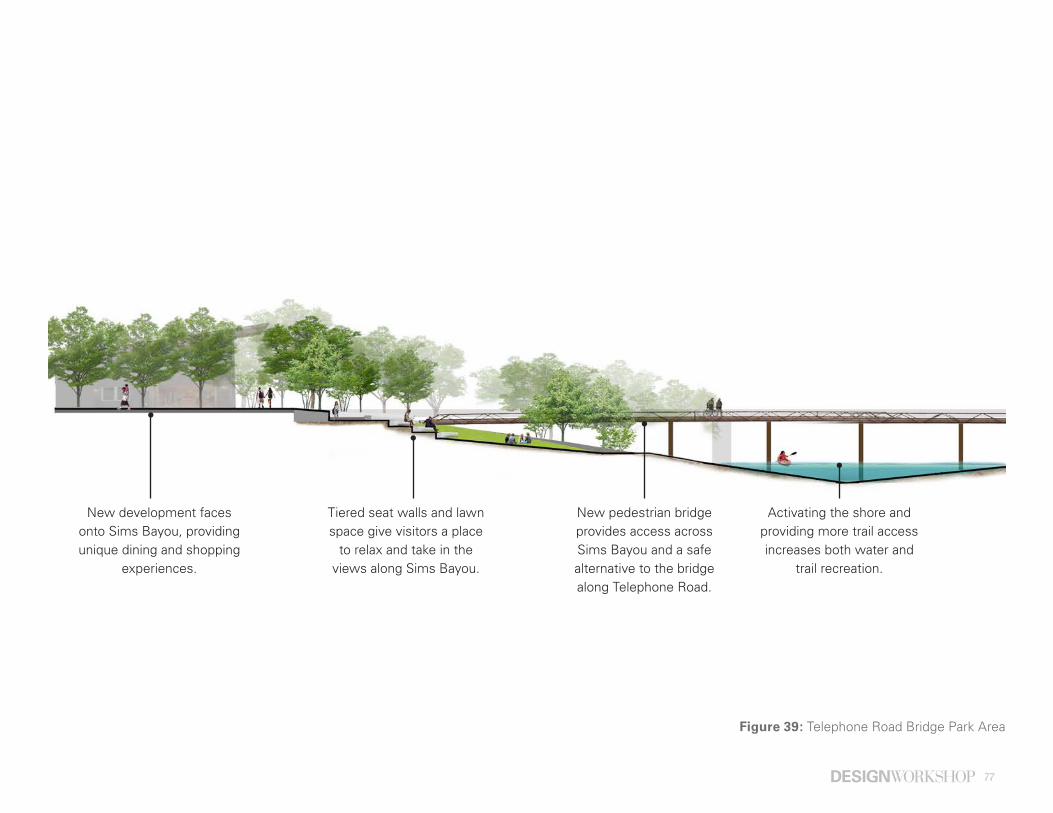
77
New development faces onto Sims Bayou, providing unique dining and shopping
experiences.
Tiered seat walls and lawn space give visitors a place
to relax and take in the views along Sims Bayou.
New pedestrian bridge provides access across Sims Bayou and a safe alternative to the bridge along Telephone Road.
Activating the shore and providing more trail access increases both water and
trail recreation.
Figure 39: Telephone Road Bridge Park Area

78 | Envisioning Healthy Livable Centers
The Industrial Hub is located within an existing street grid along Telephone Road at Neuhaus Lane. The area’s current walkable size blocks, warehouse facilities, and the 1940 Air Terminal Museum provide the recipe for the development of a unique destination.
This catalyst provides important entrepreneurial and workforce development opportunities for current District residents. Recommended programs leverage job skills and educational training partners, such as Neighborhood Centers Inc, with re-imagined light industrial warehouse facilities. These spaces become a place for smaller-scaled industrial uses, such as metalworking, industrial design, product fabrication or distilleries.
In addition, the existing 1940 Air Terminal Museum located within the hub already provides a regional attraction. It could benefit from an area to stage buses and host outdoor events. The presence of new coffee shops and eateries nearby turns this entire hub into a destination that encourages visitors to linger and enjoy.
Weekend street fairs bring the area to life. Recommendations preserve warehouse spaces and encourage the presence of creative industries.
A new park creates a grander entrance into the 1940 Air Terminal Museum.
CATALYST OPPORTUNIT Y | INDUSTRIAL HUB
Source: Google Street View, 2016.
ASSOCIATED PROJECTS:
Neighborhood goods and servicesHistoric Building PreservationMultipurpose Warehouse SpacesSafe pedestrian and bike crossings at intersectionsStreetscape Improvements within Industrial HubSidewalk Connections1940 Airport Terminal Museum Entry Plaza and ParkNew Parks
ASSOCIATED PROGR AMS:
Mobile Vendors and Pop-UpsWeekend Street FairsCultural History Program
ASSOCIATED POLICIES:
Shared Parking IncentivesDesign GuidelinesInfill Incentives
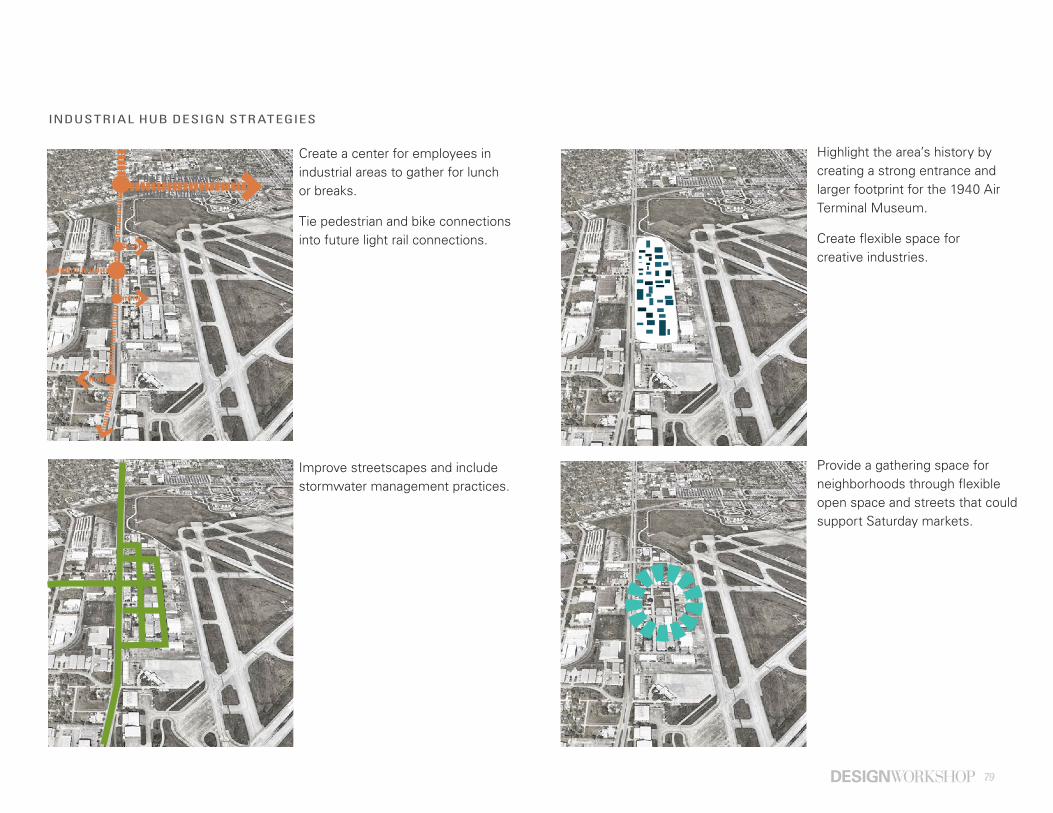
79
Create a center for employees in industrial areas to gather for lunch or breaks.
Tie pedestrian and bike connections into future light rail connections.
Improve streetscapes and include stormwater management practices.
Highlight the area’s history by creating a strong entrance and larger footprint for the 1940 Air Terminal Museum.
Create flexible space for creative industries.
Provide a gathering space for neighborhoods through flexible open space and streets that could support Saturday markets.
INDUSTRIAL HUB DESIGN STR ATEGIES
POTENTIAL RAIL
CONNECT ION

80 | Envisioning Healthy Livable Centers
1
1
2
2
3
3
4
4
Retail
Warehouse/Light Industrial
Outdoor plaza park looks onto 1940 Airport Terminal Museum
Retail space along Neuhaus Avenue welcomes visitors and creates opportunities for new jobs
Streetscape improvements along Telephone Road includes sidewalk repairs, planting, curb repairs, utility modifications, signage and crosswalks
Basic streetscape improvements such as landscaping, sidewalks and striping along smaller blocks
NEUHAUS AVE.
WILLIAM P. HOBBY AIRPORT
1940 AIRPORT TERMINAL MUSEUM
L ARSON
NELMS ST.
MAJOR ST.
CONVAIR
TE
LE
PH
ON
E R
D.
TR
AV
EL
AIR
ST
.
LO
CK
HE
ED
AV
E.
Figure 40: Industrial Hub Conceptual Plan Note: Concept designs are for illustrative purposes only and have not been formally reviewed nor approved by the City. Should these concept designs mature, they will undergo a formalized plan, design and construction process with appropriate permitting.
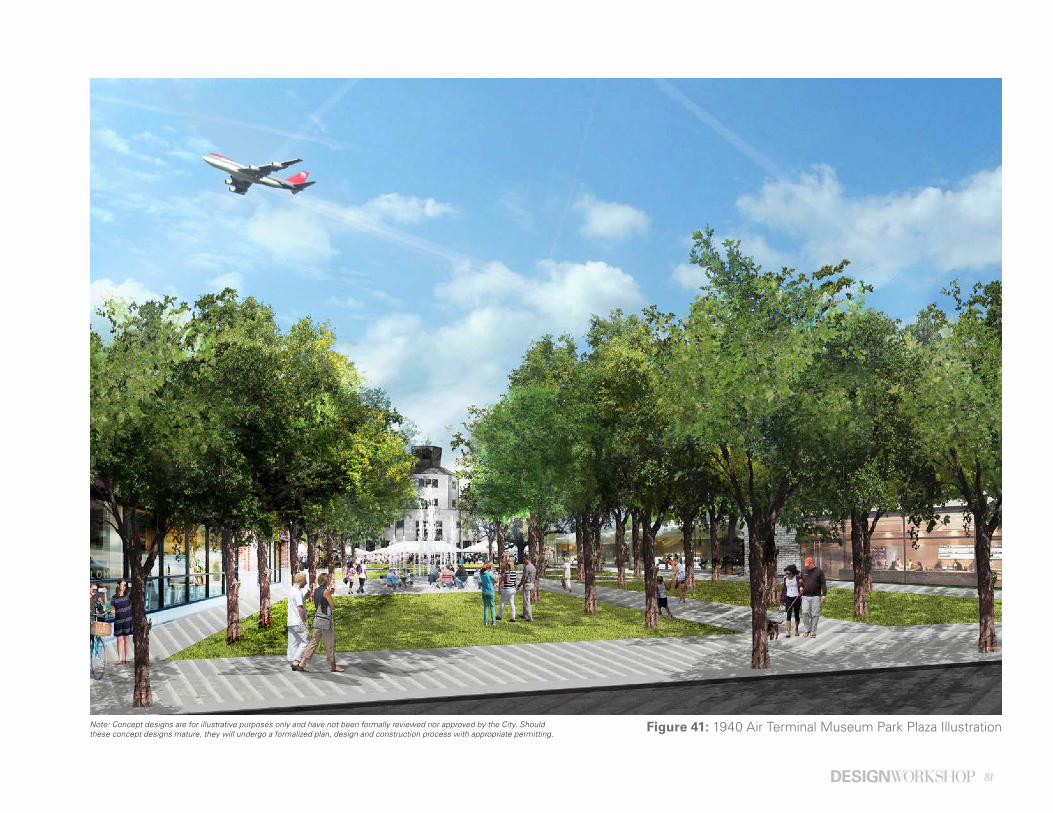
81
Figure 41: 1940 Air Terminal Museum Park Plaza IllustrationNote: Concept designs are for illustrative purposes only and have not been formally reviewed nor approved by the City. Should these concept designs mature, they will undergo a formalized plan, design and construction process with appropriate permitting.
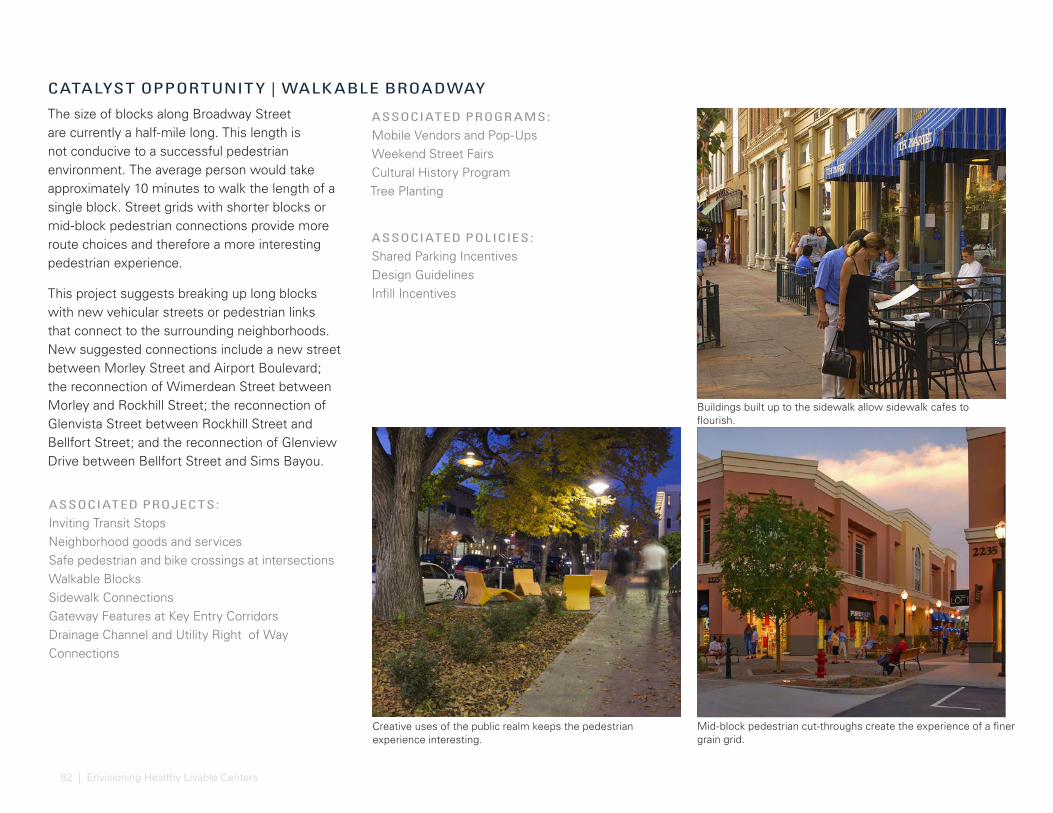
82 | Envisioning Healthy Livable Centers
The size of blocks along Broadway Street are currently a half-mile long. This length is not conducive to a successful pedestrian environment. The average person would take approximately 10 minutes to walk the length of a single block. Street grids with shorter blocks or mid-block pedestrian connections provide more route choices and therefore a more interesting pedestrian experience.
This project suggests breaking up long blocks with new vehicular streets or pedestrian links that connect to the surrounding neighborhoods. New suggested connections include a new street between Morley Street and Airport Boulevard; the reconnection of Wimerdean Street between Morley and Rockhill Street; the reconnection of Glenvista Street between Rockhill Street and Bellfort Street; and the reconnection of Glenview Drive between Bellfort Street and Sims Bayou.
CATALYST OPPORTUNIT Y | WALK ABLE BROADWAY
Mid-block pedestrian cut-throughs create the experience of a finer grain grid.
Creative uses of the public realm keeps the pedestrian experience interesting.
Buildings built up to the sidewalk allow sidewalk cafes to flourish.
ASSOCIATED PROJECTS:
Inviting Transit StopsNeighborhood goods and servicesSafe pedestrian and bike crossings at intersectionsWalkable BlocksSidewalk ConnectionsGateway Features at Key Entry CorridorsDrainage Channel and Utility Right of Way Connections
ASSOCIATED PROGR AMS:
Mobile Vendors and Pop-UpsWeekend Street FairsCultural History ProgramTree Planting
ASSOCIATED POLICIES:
Shared Parking IncentivesDesign GuidelinesInfill Incentives
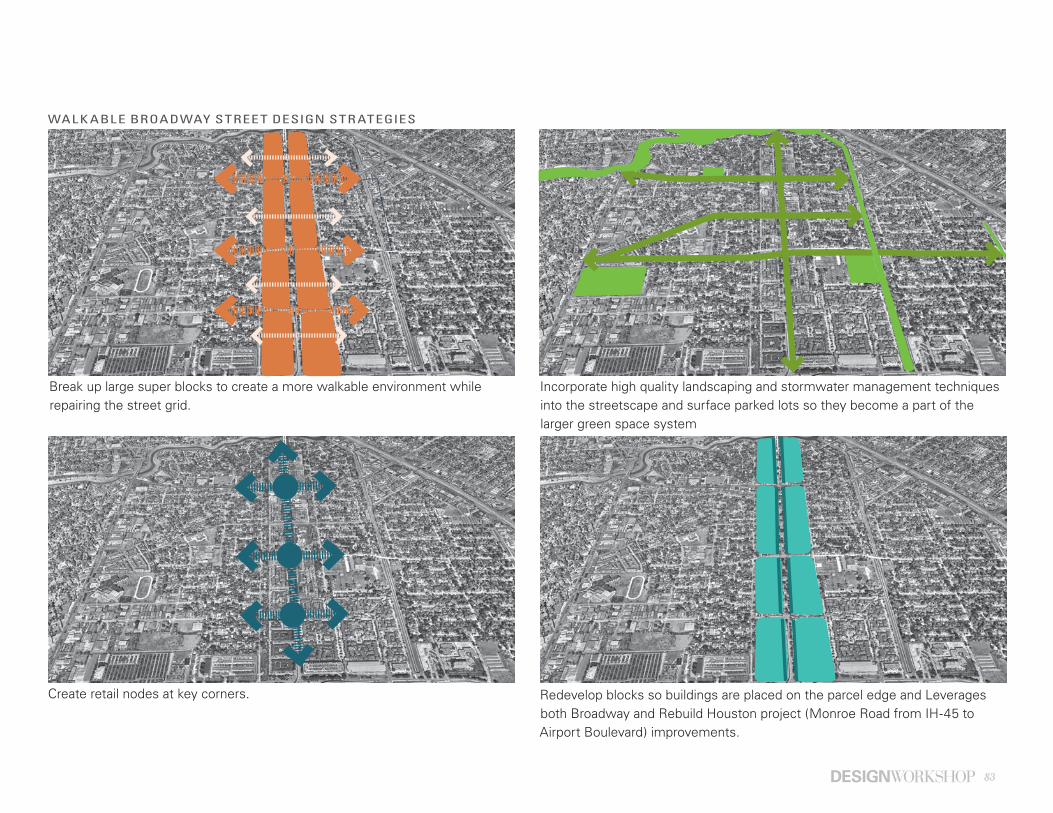
83
Break up large super blocks to create a more walkable environment while repairing the street grid.
Incorporate high quality landscaping and stormwater management techniques into the streetscape and surface parked lots so they become a part of the larger green space system
Redevelop blocks so buildings are placed on the parcel edge and Leverages both Broadway and Rebuild Houston project (Monroe Road from IH-45 to Airport Boulevard) improvements.
Create retail nodes at key corners.
1/2 MILE BLOCKS
WALK ABLE BROADWAY STREE T DESIGN STR ATEGIES
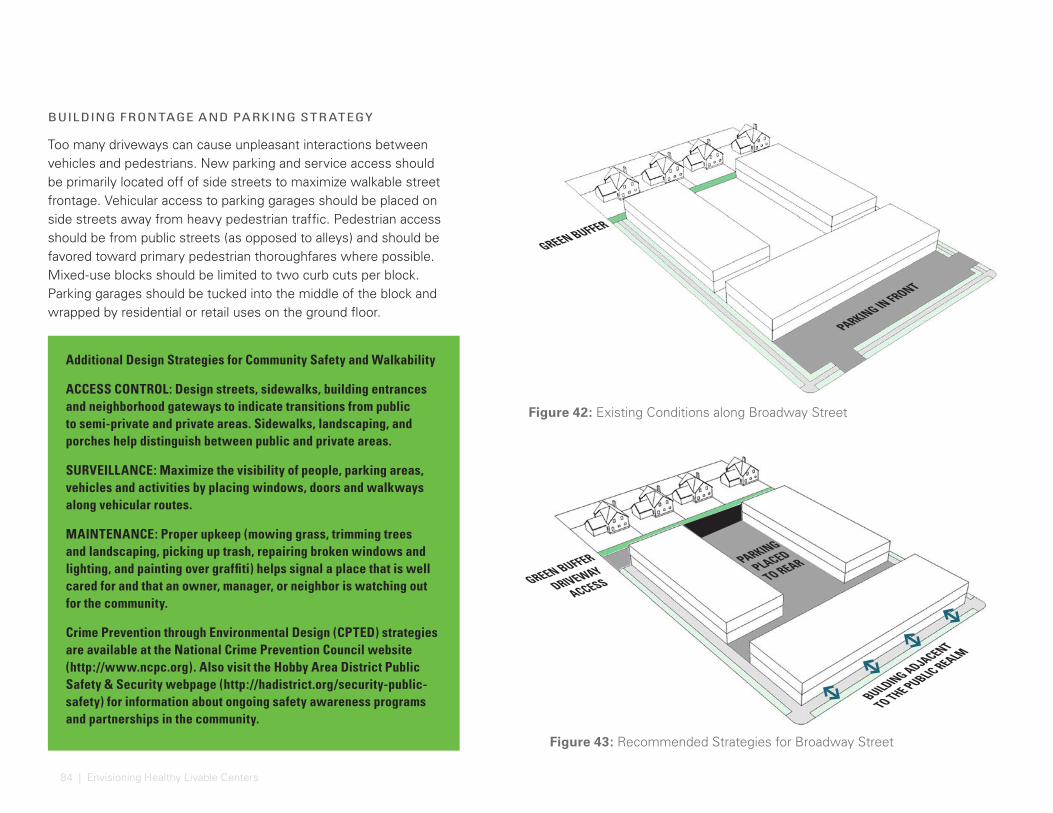
84 | Envisioning Healthy Livable Centers
GREEN BUFFER
DRIVEWAY
ACCESS
BUILDING ADJACENT
TO THE PUBLIC REALM
GREEN BUFFER
PARKING IN FRONT
PARKING
PLACED
TO REAR
Figure 42: Existing Conditions along Broadway Street
Figure 43: Recommended Strategies for Broadway Street
BUILDING FRONTAGE AND PARKING STR ATEGY
Too many driveways can cause unpleasant interactions between vehicles and pedestrians. New parking and service access should be primarily located off of side streets to maximize walkable street frontage. Vehicular access to parking garages should be placed on side streets away from heavy pedestrian traffic. Pedestrian access should be from public streets (as opposed to alleys) and should be favored toward primary pedestrian thoroughfares where possible. Mixed-use blocks should be limited to two curb cuts per block. Parking garages should be tucked into the middle of the block and wrapped by residential or retail uses on the ground floor.
Additional Design Strategies for Community Safety and Walkability
ACCESS CONTROL: Design streets, sidewalks, building entrances and neighborhood gateways to indicate transitions from public to semi-private and private areas. Sidewalks, landscaping, and porches help distinguish between public and private areas.
SURVEILLANCE: Maximize the visibility of people, parking areas, vehicles and activities by placing windows, doors and walkways along vehicular routes.
MAINTENANCE: Proper upkeep (mowing grass, trimming trees and landscaping, picking up trash, repairing broken windows and lighting, and painting over graffiti) helps signal a place that is well cared for and that an owner, manager, or neighbor is watching out for the community.
Crime Prevention through Environmental Design (CPTED) strategies are available at the National Crime Prevention Council website (http://www.ncpc.org). Also visit the Hobby Area District Public Safety & Security webpage (http://hadistrict.org/security-public-safety) for information about ongoing safety awareness programs and partnerships in the community.
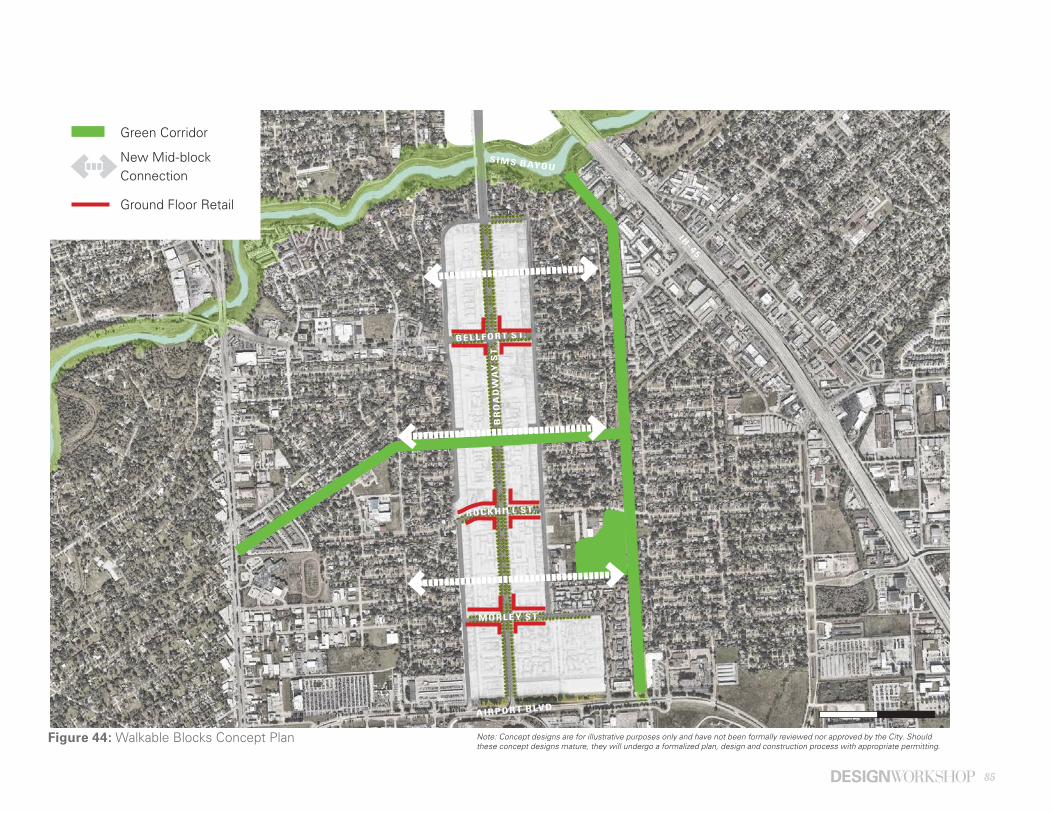
85
Figure 44: Walkable Blocks Concept Plan
BR
OA
DW
AY
ST
.
A IRPORT BLVD.
MORLEY ST.
ROCKHILL ST.
BELLFORT ST.
SIMS BAYOU
IH-45
Green Corridor
New Mid-block Connection
Ground Floor Retail
Note: Concept designs are for illustrative purposes only and have not been formally reviewed nor approved by the City. Should these concept designs mature, they will undergo a formalized plan, design and construction process with appropriate permitting.
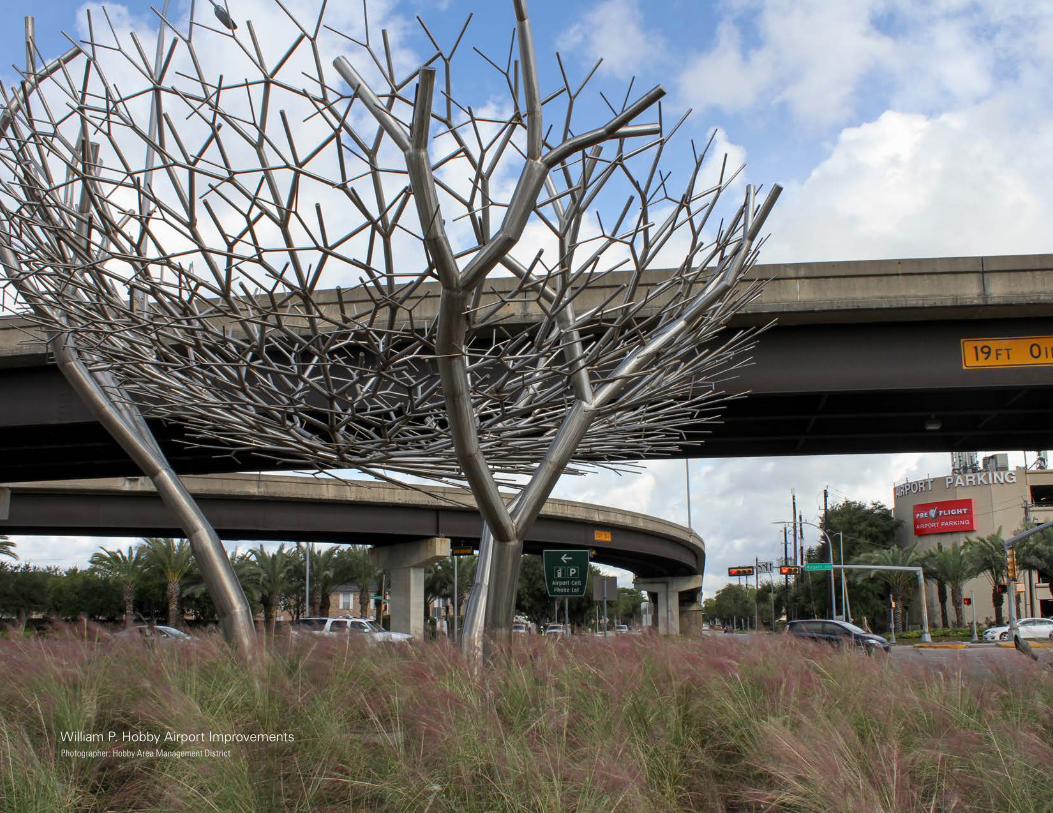
86 | Roadmap for Implementation
William P. Hobby Airport ImprovementsPhotographer: Hobby Area Management District
87
Roadmap for ImplementationThis chapter provides a road map towards implementation of the vision identified by Hobby stakeholders during a year-long outreach process. In order to help local agencies and community activists invest in new ways to improve their community, this chapter divides strategies for change into three categories - instant implementation, mid- range and long- range visions. Funding and implementation strategies for each are discussed, but it is important to note that creating vibrant places does not have to begin with expensive infrastructure investments. Simple and creative placemaking efforts can spark interest and spur catalytic change throughout the District.
Note: Concept designs are for illustrative purposes only and have not been formally reviewed nor approved by the City. Should these concept designs mature, they will undergo a formalized plan, design and construction process with appropriate permitting.
88 | Roadmap for Implementation
PROJECTS, POLICIES AND PROGR AMS
Implementation strategies provide a road map for success. With an emphasis on the planning and regulatory framework, incentives and financial tools and capital improvements, they provide the necessary actions that will advance the long-term vision of the plan.
Each strategy includes a list of next steps, estimated costs, potential funding sources and partners. The recommendations will be useful in guiding programs, setting priorities for policy updates and identifying funding tools for project implementation. Over time, this part of the document should be revisited and updated to ensure that strategies remain relevant and current to evolving community needs.
IMPLEMENTATION STRATEGIESPHASING OVERVIE W
Implementing the Hobby Livable Centers Study vision for a healthy and vibrant district will require a systematic and thoughtful phasing approach. Figures 50, 55 and 56 provide an overview of these recommendations and rank them by ease of implementation. The success of this effort will rely on the support and coordination between a variety of stakeholders. Before physical implementation can begin, initial efforts must focus on the development of partnerships and the securing of potential funding sources.
89
LEADERSMANAGEMENT DISTRICT
Management districts are special districts created by the Texas legislature, empowered to promote, develop, encourage and maintain employment, commerce, transportation, tourism, art and recreation within their boundaries. The District oversees grants and finances operations by issuing bonds or other obligations, which are payable through taxes, assessments, impact fees and other means. It manages core public service areas of Environmental and Urban Design, Business Development, Transportation and Public Safety.
The Hobby Area Management District will carry forth the vision set in this Livable Centers study. It sets an annual action plan, raises and leverages funds and assigns tasks. Through regular meetings, the District and various committees will establish plans to further prioritize projects and work alongside partner agencies to ensure that the vision and momentum for livable centers in the District are carried forward into implementation.
TA X INCREMENT REINVESTMENT ZONE
In 2014, Houston’s City Council approved an expansion of Tax Increment Reinvestment Zone No. 8 into a substantial area of the District. This expansion from the Gulfgate Mall area extends south to William P. Hobby Airport and southwest along Mykawa Road. Tax Increment Reinvestment Zones typically fund capital projects intended for public use and access. This can range from infrastructure and transportation facilities to amenities such as parks and public cultural venues. The recent expansion of Tax Increment Reinvestment Zone No. 8 is expected to help initiatives that connect trails along Sims Bayou, add green space, beautify Sims Bayou, improve major roadway corridors, assist with infrastructure and potentially impact improvements to the new location for the Houston Botanic Garden.
CIT Y OF HOUSTON
City departments can work with property owners and developers to issue project approvals, identify incentives, and lift restrictive development requirements inhibiting implementation of this plan. The Parks and Recreation Department, Houston Parks Board and Harris County Flood Control District can collaborate to acquire, upgrade and maintain parks to improve the public realm in the District, particularly in the southern part of the study area where access to parks is lacking. The Housing and Community Development Department can assist in funding for the capital improvements, economic development, social services and housing and other neighborhood revitalization activities in qualifying areas.
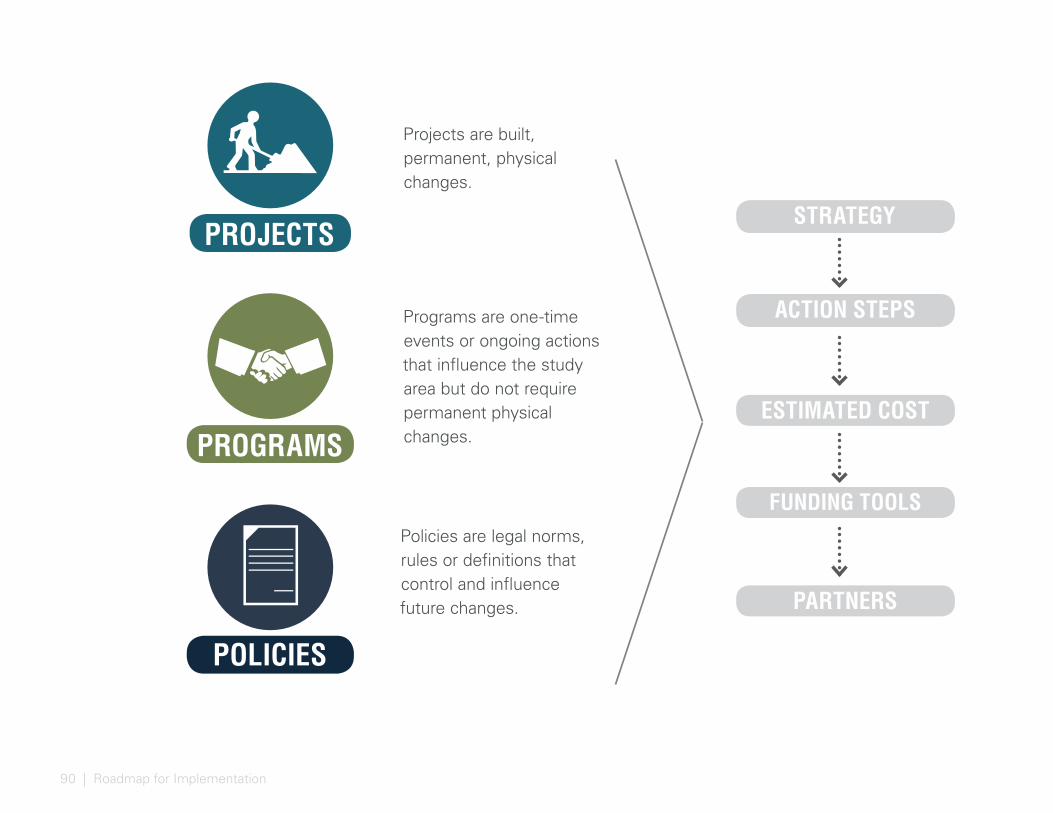
90 | Roadmap for Implementation
PROJECTS
Projects are built, permanent, physical changes.
POLICIES
Policies are legal norms, rules or definitions that control and influence future changes.
Programs are one-time events or ongoing actions that influence the study area but do not require permanent physical changes.PROGRAMS
STRATEGY
ACTION STEPS
ESTIMATED COST
FUNDING TOOLS
PARTNERS
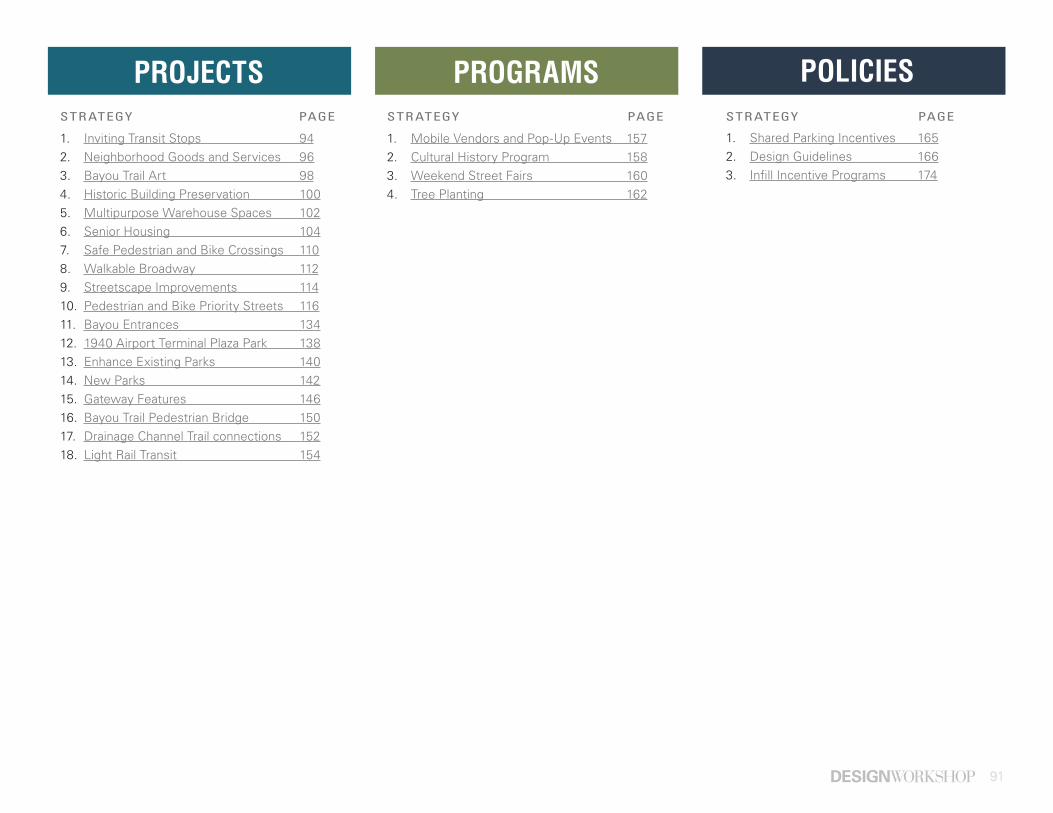
91
1. Inviting Transit Stops 942. Neighborhood Goods and Services 963. Bayou Trail Art 984. Historic Building Preservation 1005. Multipurpose Warehouse Spaces 1026. Senior Housing 1047. Safe Pedestrian and Bike Crossings 1108. Walkable Broadway 1129. Streetscape Improvements 11410. Pedestrian and Bike Priority Streets 11611. Bayou Entrances 13412. 1940 Airport Terminal Plaza Park 13813. Enhance Existing Parks 14014. New Parks 14215. Gateway Features 14616. Bayou Trail Pedestrian Bridge 15017. Drainage Channel Trail connections 15218. Light Rail Transit 154
1. Mobile Vendors and Pop-Up Events 1572. Cultural History Program 1583. Weekend Street Fairs 1604. Tree Planting 162
1. Shared Parking Incentives 1652. Design Guidelines 1663. Infill Incentive Programs 174
PROJECTS POLICIESPROGRAMSPAGESTR ATEGYPAGESTR ATEGYPAGESTR ATEGY
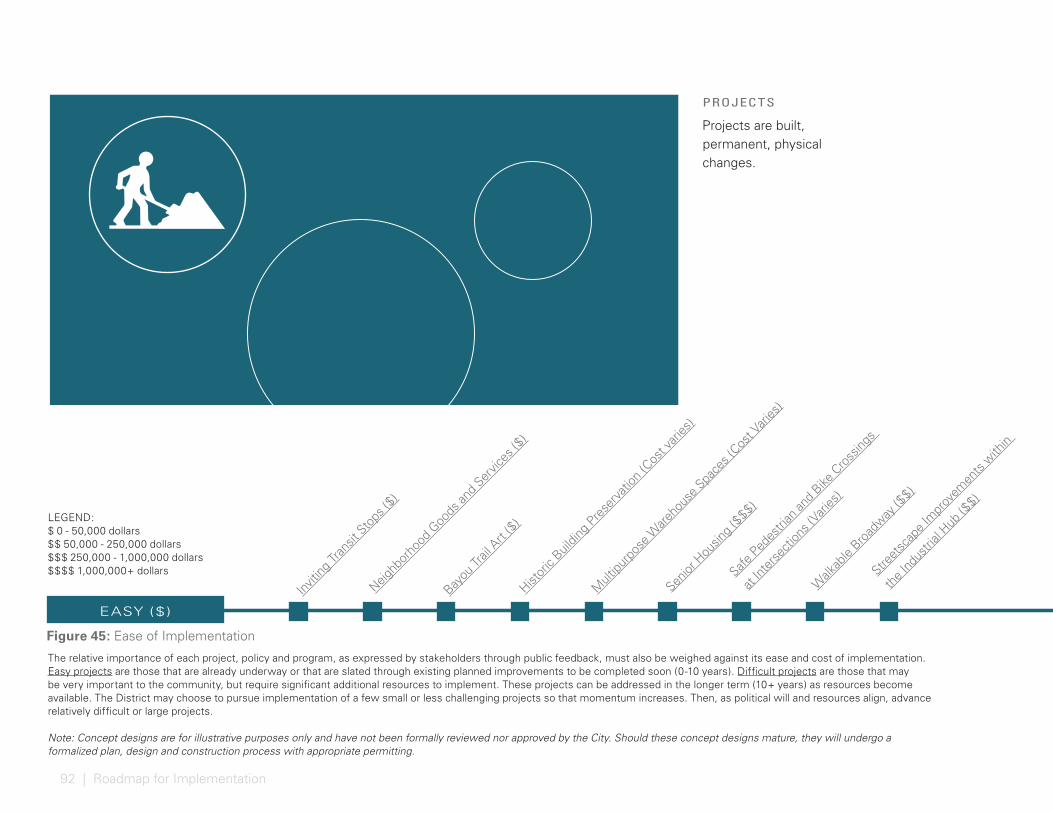
92 | Roadmap for Implementation
PROJECTS
Projects are built, permanent, physical changes.
Neighb
orho
od G
oods
and S
ervic
es ($
)
Histor
ic Buil
ding P
rese
rvati
on (C
ost v
aries
)
Invitin
g Tran
sit S
tops
($)
Street
scap
e Im
prov
emen
ts with
in
the I
ndus
trial
Hub ($
$)
Mult
ipurp
ose W
areho
use S
pace
s (Cos
t Vari
es)
Senior
Hou
sing (
$$$)
Bayou
Trail
Art
($)
Walk
able
Broad
way ($
$)
Safe P
edes
trian
and B
ike C
ross
ings
at Int
erse
ction
s (Vari
es)
Figure 45: Ease of Implementation
The relative importance of each project, policy and program, as expressed by stakeholders through public feedback, must also be weighed against its ease and cost of implementation. Easy projects are those that are already underway or that are slated through existing planned improvements to be completed soon (0-10 years). Difficult projects are those that may be very important to the community, but require significant additional resources to implement. These projects can be addressed in the longer term (10+ years) as resources become available. The District may choose to pursue implementation of a few small or less challenging projects so that momentum increases. Then, as political will and resources align, advance relatively difficult or large projects.
Note: Concept designs are for illustrative purposes only and have not been formally reviewed nor approved by the City. Should these concept designs mature, they will undergo a formalized plan, design and construction process with appropriate permitting.
LEGEND:$ 0 - 50,000 dollars $$ 50,000 - 250,000 dollars$$$ 250,000 - 1,000,000 dollars$$$$ 1,000,000+ dollars
EASY ($ )
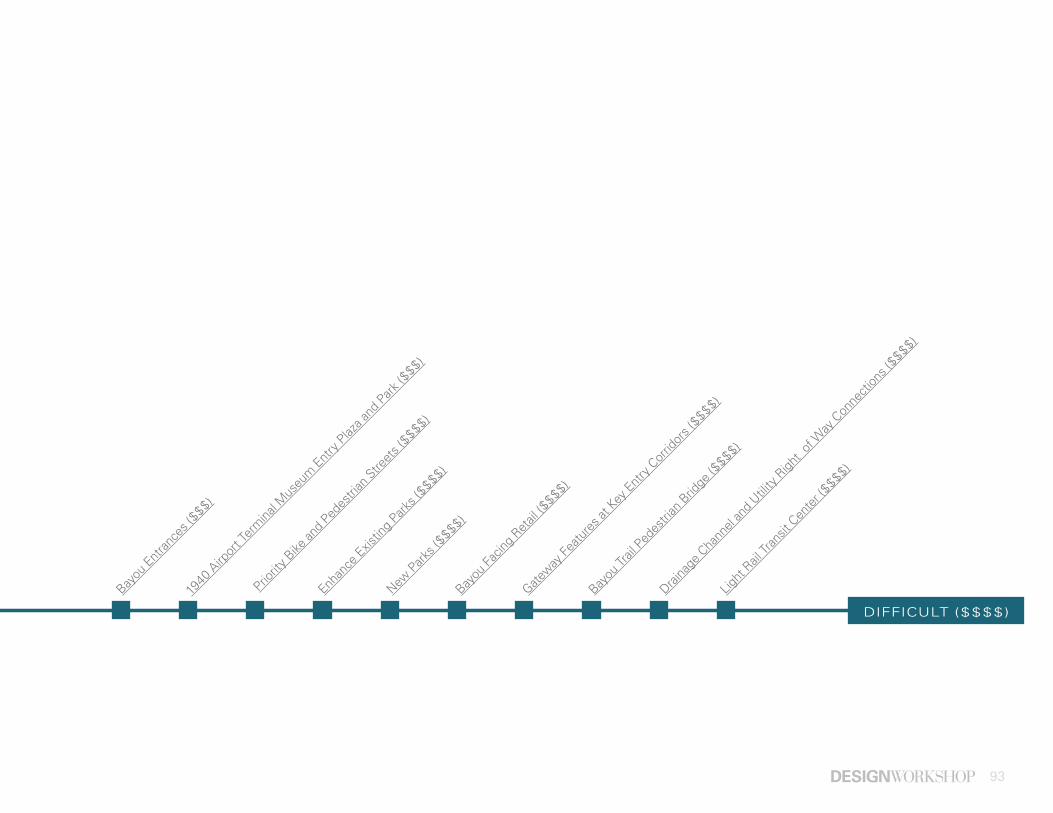
93
Priorit
y Bike
and P
edes
trian
Stre
ets (
$$$$)
Bayou
Ent
rance
s ($$$)
Enhan
ce E
xistin
g Park
s ($$$$)
1940
Airp
ort T
erm
inal M
useu
m E
ntry
Plaz
a and
Park
($$$)
New P
arks (
$$$$)
Light
Rail
Tran
sit C
ente
r ($$$$)
Bayou
Facin
g Ret
ail ($
$$$)
Gateway
Featu
res a
t Key
Ent
ry C
orrid
ors (
$$$$)
Bayou
Trail
Ped
estri
an B
ridge
($$$$)
Draina
ge C
hann
el an
d Utili
ty R
ight
of W
ay C
onne
ction
s ($$$$)
DIFFICULT ($$$$)
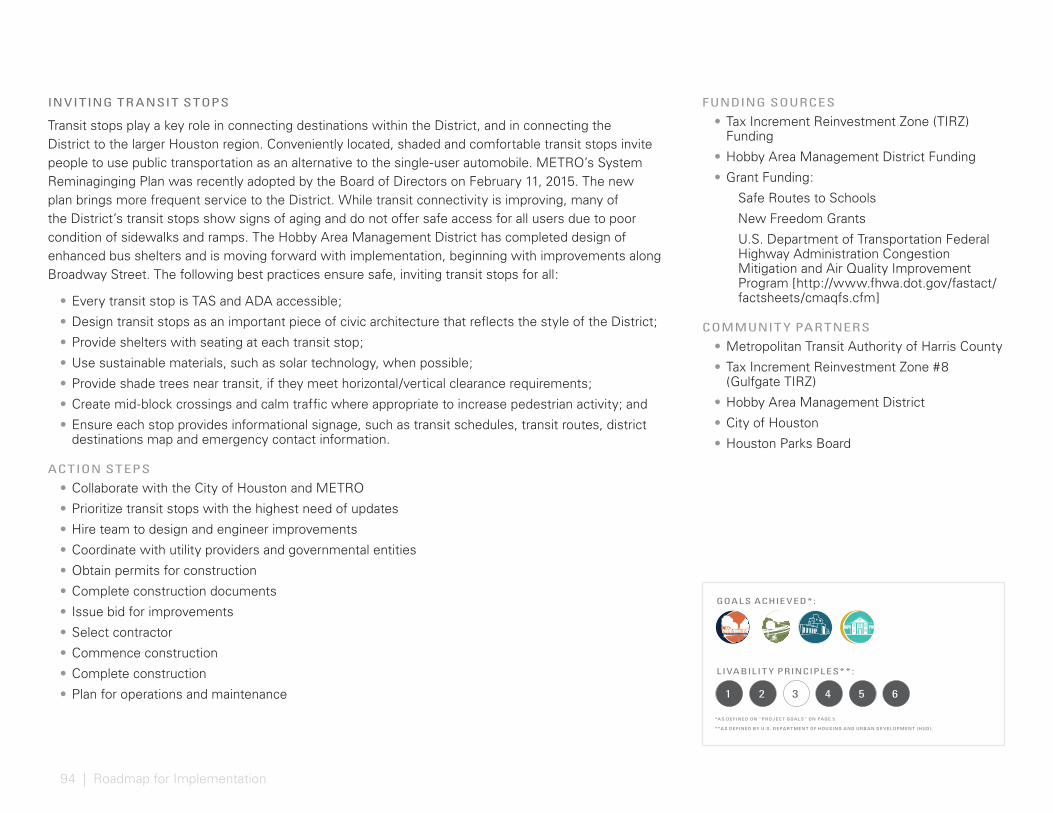
94 | Roadmap for Implementation
INVITING TR ANSIT STOPS
Transit stops play a key role in connecting destinations within the District, and in connecting the District to the larger Houston region. Conveniently located, shaded and comfortable transit stops invite people to use public transportation as an alternative to the single-user automobile. METRO’s System Reminaginging Plan was recently adopted by the Board of Directors on February 11, 2015. The new plan brings more frequent service to the District. While transit connectivity is improving, many of the District’s transit stops show signs of aging and do not offer safe access for all users due to poor condition of sidewalks and ramps. The Hobby Area Management District has completed design of enhanced bus shelters and is moving forward with implementation, beginning with improvements along Broadway Street. The following best practices ensure safe, inviting transit stops for all:
• Every transit stop is TAS and ADA accessible;
• Design transit stops as an important piece of civic architecture that reflects the style of the District;
• Provide shelters with seating at each transit stop;
• Use sustainable materials, such as solar technology, when possible;
• Provide shade trees near transit, if they meet horizontal/vertical clearance requirements;
• Create mid-block crossings and calm traffic where appropriate to increase pedestrian activity; and
• Ensure each stop provides informational signage, such as transit schedules, transit routes, district destinations map and emergency contact information.
ACTION STEPS
• Collaborate with the City of Houston and METRO
• Prioritize transit stops with the highest need of updates
• Hire team to design and engineer improvements
• Coordinate with utility providers and governmental entities
• Obtain permits for construction
• Complete construction documents
• Issue bid for improvements
• Select contractor
• Commence construction
• Complete construction
• Plan for operations and maintenance
FUNDING SOURCES
• Tax Increment Reinvestment Zone (TIRZ) Funding
• Hobby Area Management District Funding
• Grant Funding:
Safe Routes to Schools
New Freedom Grants
U.S. Department of Transportation Federal Highway Administration Congestion Mitigation and Air Quality Improvement Program [http://www.fhwa.dot.gov/fastact/factsheets/cmaqfs.cfm]
COMMUNIT Y PARTNERS
• Metropolitan Transit Authority of Harris County
• Tax Increment Reinvestment Zone #8 (Gulfgate TIRZ)
• Hobby Area Management District
• City of Houston
• Houston Parks Board
GOAL S ACHIE VED* :
L IVABIL IT Y PRINCIPL ES* * :
*AS DEFINED ON “PROJEC T GOA L S” ON PAGE 5 .
* *AS DEFINED BY U.S. DEPA R T MENT OF HOUSING AND URBAN DE V ELOPMENT ( HUD) .
1 65432
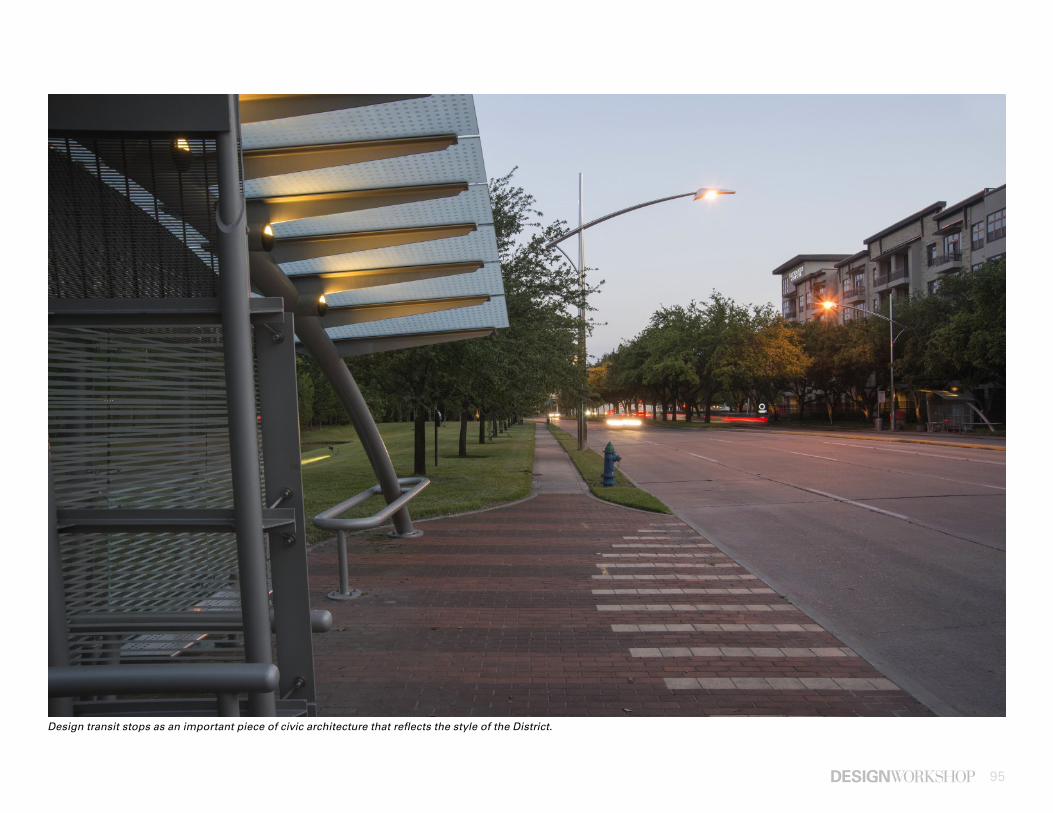
95
Design transit stops as an important piece of civic architecture that reflects the style of the District.
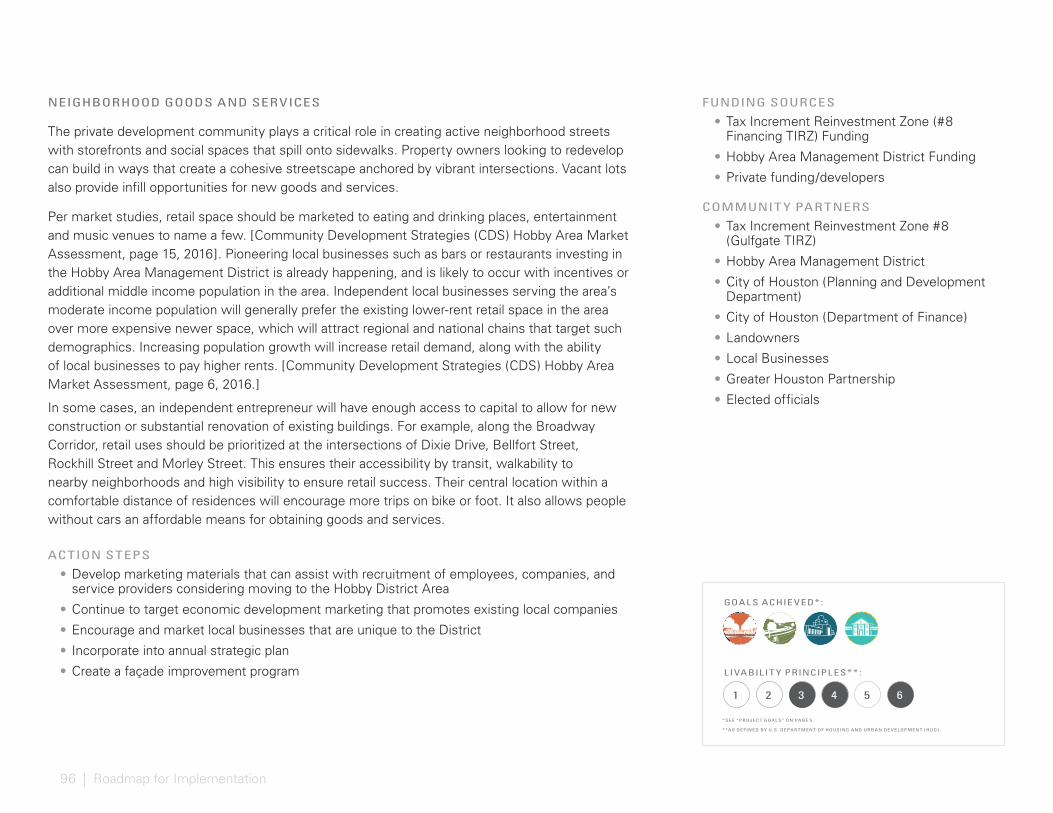
96 | Roadmap for Implementation
NEIGHBORHOOD GOODS AND SERVICES
The private development community plays a critical role in creating active neighborhood streets with storefronts and social spaces that spill onto sidewalks. Property owners looking to redevelop can build in ways that create a cohesive streetscape anchored by vibrant intersections. Vacant lots also provide infill opportunities for new goods and services.
Per market studies, retail space should be marketed to eating and drinking places, entertainment and music venues to name a few. [Community Development Strategies (CDS) Hobby Area Market Assessment, page 15, 2016]. Pioneering local businesses such as bars or restaurants investing in the Hobby Area Management District is already happening, and is likely to occur with incentives or additional middle income population in the area. Independent local businesses serving the area’s moderate income population will generally prefer the existing lower-rent retail space in the area over more expensive newer space, which will attract regional and national chains that target such demographics. Increasing population growth will increase retail demand, along with the ability of local businesses to pay higher rents. [Community Development Strategies (CDS) Hobby Area Market Assessment, page 6, 2016.]
In some cases, an independent entrepreneur will have enough access to capital to allow for new construction or substantial renovation of existing buildings. For example, along the Broadway Corridor, retail uses should be prioritized at the intersections of Dixie Drive, Bellfort Street, Rockhill Street and Morley Street. This ensures their accessibility by transit, walkability to nearby neighborhoods and high visibility to ensure retail success. Their central location within a comfortable distance of residences will encourage more trips on bike or foot. It also allows people without cars an affordable means for obtaining goods and services.
ACTION STEPS
• Develop marketing materials that can assist with recruitment of employees, companies, and service providers considering moving to the Hobby District Area
• Continue to target economic development marketing that promotes existing local companies
• Encourage and market local businesses that are unique to the District
• Incorporate into annual strategic plan
• Create a façade improvement program
FUNDING SOURCES
• Tax Increment Reinvestment Zone (#8 Financing TIRZ) Funding
• Hobby Area Management District Funding
• Private funding/developers
COMMUNIT Y PARTNERS
• Tax Increment Reinvestment Zone #8 (Gulfgate TIRZ)
• Hobby Area Management District
• City of Houston (Planning and Development Department)
• City of Houston (Department of Finance)
• Landowners
• Local Businesses
• Greater Houston Partnership
• Elected officials
GOAL S ACHIE VED* :
L IVABIL IT Y PRINCIPL ES* * :
*SEE “PROJEC T GOA L S” ON PAGE 5 .
* *AS DEFINED BY U.S. DEPA R T MENT OF HOUSING AND URBAN DE V ELOPMENT ( HUD) .
1 65432
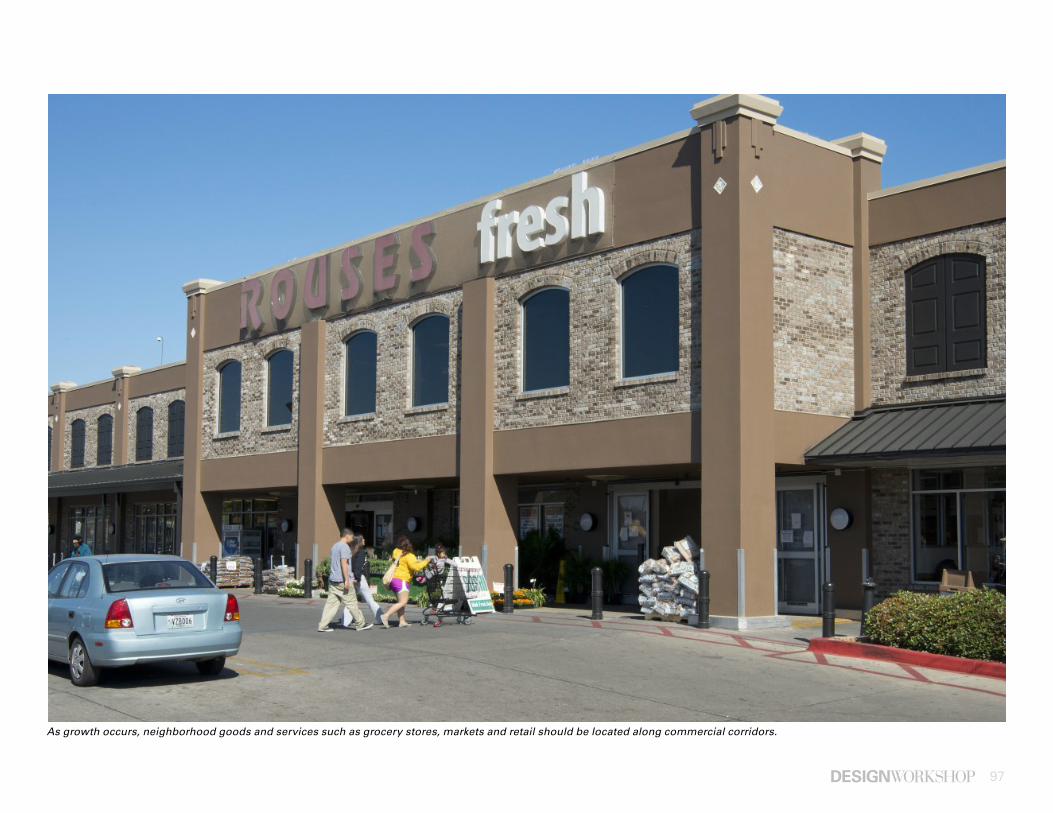
97
As growth occurs, neighborhood goods and services such as grocery stores, markets and retail should be located along commercial corridors.
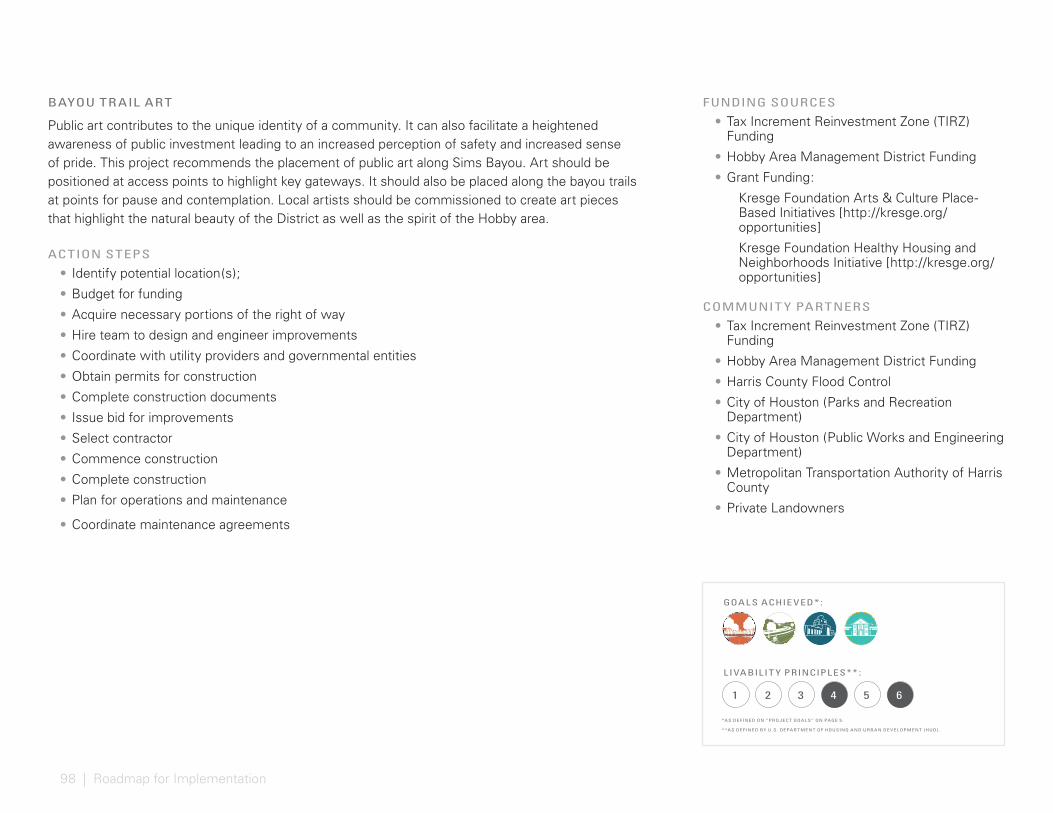
98 | Roadmap for Implementation
FUNDING SOURCES
• Tax Increment Reinvestment Zone (TIRZ) Funding
• Hobby Area Management District Funding
• Grant Funding:
Kresge Foundation Arts & Culture Place-Based Initiatives [http://kresge.org/opportunities]
Kresge Foundation Healthy Housing and Neighborhoods Initiative [http://kresge.org/opportunities]
COMMUNIT Y PARTNERS
• Tax Increment Reinvestment Zone (TIRZ) Funding
• Hobby Area Management District Funding
• Harris County Flood Control
• City of Houston (Parks and Recreation Department)
• City of Houston (Public Works and Engineering Department)
• Metropolitan Transportation Authority of Harris County
• Private Landowners
BAYOU TR AIL ART
Public art contributes to the unique identity of a community. It can also facilitate a heightened awareness of public investment leading to an increased perception of safety and increased sense of pride. This project recommends the placement of public art along Sims Bayou. Art should be positioned at access points to highlight key gateways. It should also be placed along the bayou trails at points for pause and contemplation. Local artists should be commissioned to create art pieces that highlight the natural beauty of the District as well as the spirit of the Hobby area.
ACTION STEPS
• Identify potential location(s);
• Budget for funding
• Acquire necessary portions of the right of way
• Hire team to design and engineer improvements
• Coordinate with utility providers and governmental entities
• Obtain permits for construction
• Complete construction documents
• Issue bid for improvements
• Select contractor
• Commence construction
• Complete construction
• Plan for operations and maintenance
• Coordinate maintenance agreements
GOAL S ACHIE VED* :
L IVABIL IT Y PRINCIPL ES* * :
*AS DEFINED ON “PROJEC T GOA L S” ON PAGE 5 .
* *AS DEFINED BY U.S. DEPA R T MENT OF HOUSING AND URBAN DE V ELOPMENT ( HUD) .
1 65432
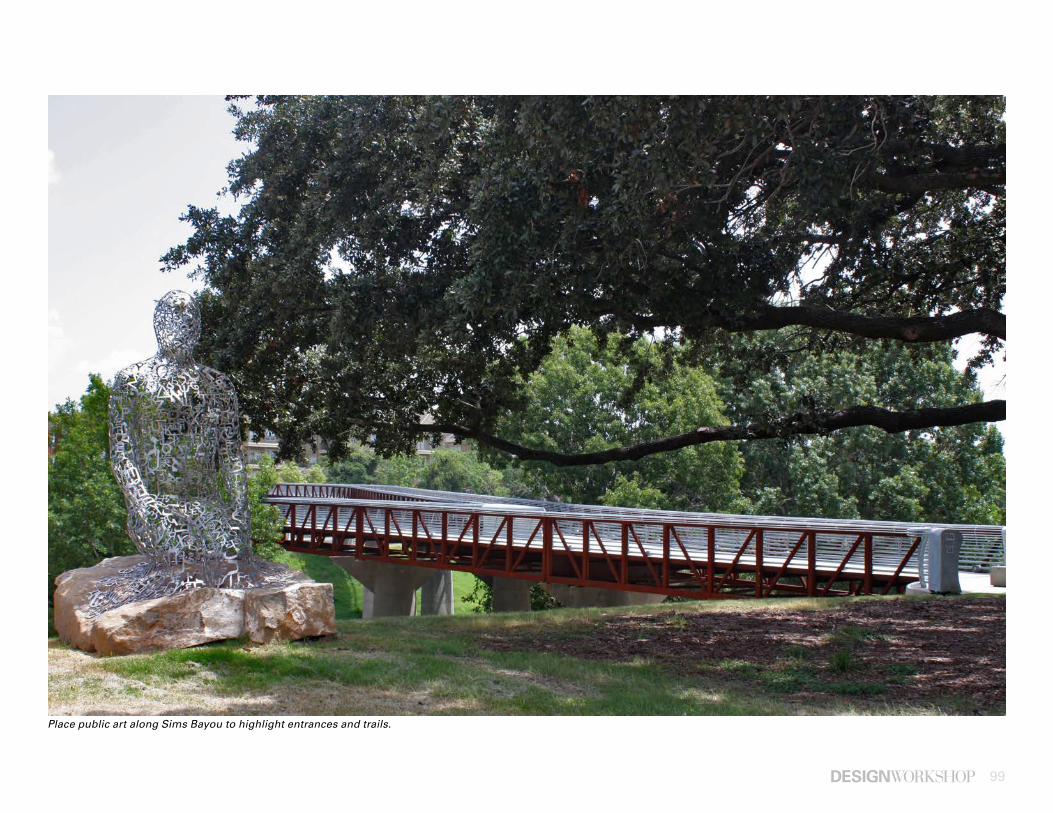
99
Place public art along Sims Bayou to highlight entrances and trails.

100 | Roadmap for Implementation
HISTORIC BUILDING PRESERVATION
Along with the desire to preserve places that signify home, an important element of the human experience is the desire to be on the move and to see new things. Hobby’s rich heritage that began the jet setting aviation culture of Houston sets it apart from all other districts in the city. Its artistic, art-deco buildings and architecture serves as nostalgic reminders of past eras from which the culture and surrounding settlements of Houston evolved. The 1940 Air Terminal Museum, original 1927 building adjacent to the present William P. Hobby Airport and historic Glenbrook Valley neighborhood, are invaluable heritage sites that generate ecotourism and economic growth. These link the District to additional city-wide art and culture epicenters nearby, such as the Museum District and Theater District.
Walking is increasingly recognized as important travel option in cities and neighborhoods and a goal of the Livable Centers program. Attractive, safe, pedestrian-scaled, and lively building façades contribute directly to the use of the sidewalks and public spaces. Both transportation and historic preservation have contributed to livability and quality of life. By their very nature, preservation projects help engage citizens, private groups and local agencies in activities having educational and health enhancing benefits for all. The restoration of historic building façades can assure the full benefits of streetscape enhancement projects, including increased pedestrian access and economic reinvestment.
In 2010 The City of Houston amended the Historic Preservation Ordinance to provide methods to maintain historic landmarks, districts and buildings. The online Historic Preservation Manual (www.houstontx.ov/planning/HistoricPres/HistoricPreservationManual) offers information on planning projects, modifying or maintaining landmarks and historic districts, approving historic property enhancement through the Certificate of Appropriateness process, information on the area’s historic districts and landmarks, and definitions of terms relating to historic preservation.
Existing preservation efforts within the District include the historic designation of the 1940 Municipal Air Terminal building which houses the 1940 Air Terminal Museum, and the Glenbrook Valley historic neighborhood. Landmark and Protected Landmark designations allow for both recognition and protection of individual historic structures; Historic District designations help neighborhoods by classifying a specific area of a community as historically and significantly important. Charged with administering the ordinance is the Houston Archaeological and Historical Commission (HAHC).
• Partner with the City of Houston’s Historic Landmark Designation program to ensure commercial and residential buildings designated as a “Landmark” or a “Protected Landmark” are eligible for tax abatements [http://www.houstontx.gov/planning/HistoricPres/hist-incentives-broch.pdf ] and discounts on permit fees.
101
FUNDING SOURCES
• Tax Increment Reinvestment Zone (TIRZ) Funding
• Hobby Area Management District Funding
COMMUNIT Y PARTNERS
• Tax Increment Reinvestment Zone #8 (Gulfgate TIRZ)
• Hobby Area Management District
• City of Houston (Planning and Development Department)
• City of Houston (Mayor’s Office of Cultural Affairs)
• Houston’s Historic Neighborhood Resources
• Preservation Houston
The HAHC is responsible for reviewing and nominating all designations as well as Certificates of Appropriateness (COA), a process required for all projects that seek to alter the exterior appearance of a city designated historic property.
• For projects within Glenbrook Valley, building elements that are compatible with the historic architectural styles for the neighborhood can be found at [http://www.houstontx.gov/planning/HistoricPres/HistoricPreservationManual/historic_districts/glenbrook_features.html].
Additional program resources that can be shared to achieve goals for preservation are provided below.
• Preservation Houston’s Historic Neighborhood Resources (HNR) program: For new projects, outside of a designated district, the committee can share resources through the Houston’s Historic Neighborhood Resources program. HNR helps organizations and individual owners of historic properties navigate the landmark designation process. Assistance through the program includes help with City of Houston landmark, protected landmark and historic district applications, National Register nominations, set back and prevailing lot size petitions, design guidelines and Texas historical marker applications. HNR can also help owners understand how to best meet criteria for owner-designation [http://www.preservationhouston.org/taa/guide/].
• The City of Houston assists Property Owners of Historic Buildings through Historic Structures Tax Exemption. This grants a tax exemption to qualified property owners who improve designated historic properties. The exemption applies for five (5) years when granted by the City. If combined with other tax entities, the exemption period may apply for up to ten (10) years. The City of Houston also offers a Single Family Home Repair Program (“SFHRP”) that improves curb appeal and may be used on the exterior rehabilitation of historic owner-occupied homes.
• Houston Habitat for Humanity and the Community Covenant CDC (Community Development Corporation) are additional programs that assist with refurbishing homes or structures.
ACTION STEPS
• Promote preservation in Glenbrook Valley (already designated), along Telephone Road (expressed by community as opportunity for future efforts), and within the Industrial Hub to promote the 1940 Airport Terminal Museum.
• Perform a feasibility assessment that inventories building conditions of homes and businesses in the District and determines near term preservation projects
• Establish a detailed schedule and coordinate key recommendations from feasibility assessment with ongoing capital improvement projects and beautification efforts underway.
• Set-aside TIRZ funding for projects. The Tax Increment Reinvestment Zone #8 (Gulfgate TIRZ) can apply the value of future tax revenues to the cost of current improvements that promote historic preservation within the TIRZ. Incremental tax revenues generated in the TIRZ can fund infrastructure, acquisition and historic preservation activities.
• Add links to the Historic Preservation Manual and Department of Planning and Development Historic Preservation page and the Historic Preservation Manual on the Hobby Area District Website.
GOAL S ACHIE VED* :
L IVABIL IT Y PRINCIPL ES* * :
*SEE “PROJEC T GOA L S” ON PAGE 5 .
* *AS DEFINED BY U.S. DEPA R T MENT OF HOUSING AND URBAN DE V ELOPMENT ( HUD) .
1 65432
102 | Roadmap for Implementation
MULTIPURPOSE WAREHOUSE SPACES
Buildings contribute to the District’s sense of place and offer unique spaces for stores, restaurants, offices, housing and other uses. Vacant storefronts are unattractive places for visitors and potential entrepreneurs.
This project recommends the rehabilitation and infill of multipurpose warehouse spaces within the Industrial Hub catalyst site. The reuse of existing warehouses provides a lower cost investment solution for businesses. In addition, the easy adaptation of warehouses makes these spaces ideal for entrepreneurial/maker spaces, job training, small businesses, artist studios, breweries and other creative/startup industries.
Flexible warehouse spaces, when paired with simple solutions for active streetscapes, can generate immediate excitement in the area. Simple solutions are adding potted trees, flowers and greenery along the street edge, placing accent lights on buildings to create an appealing nightime ambiance, or installing furniture, such as benches or bike rikes that improve appeal and walkability. All of these ingredients work together to encourage people to bike to the area for dining, recreation and shopping, thereby reducing the number of automobile trips and the need for additional parking.
ACTION STEPS
• Identify property owners with warehouse buildings
• Collaborate on the design of improvements
FUNDING SOURCES
• Tax Increment Reinvestment Zone (TIRZ) Funding
• Hobby Area Management District Funding
• Private Property Owner and Development Interest Funding
• Gulf Coast Economic Development District (GCEDD) Business Loan Fund [http://www.h-gac.com/community/gcedd/business-loan-fund.aspx ]. Helps finance new or expanding small businesses when traditional funding isn’t available or isn’t enough. Grant funding may be used for assets and buildings, inventory, supplies, fixtures, furniture, equipment and working capital.
• Grant Funding:
• Community Enhancement Grants [http://www.h-gac.com/community/enhancement-grants/]. The grant program helps organizations enhance public spaces, such as gateways, parks, waterfronts and business districts. Projects in 2016 included historical murals, seating and beautification, building refurbishment, lighting and sidewalks.
GOAL S ACHIE VED* :
L IVABIL IT Y PRINCIPL ES* * :
*SEE “PROJEC T GOA L S” ON PAGE 5 .
* *AS DEFINED BY U.S. DEPA R T MENT OF HOUSING AND URBAN DE V ELOPMENT ( HUD) .
COMMUNIT Y PARTNERS
• Tax Increment Reinvestment Zone #8 (Gulfgate TIRZ)
• Hobby Area Management District
• City of Houston (Planning and Development Department)
• City of Houston (Department of Finance)
• Property owners
1 65432
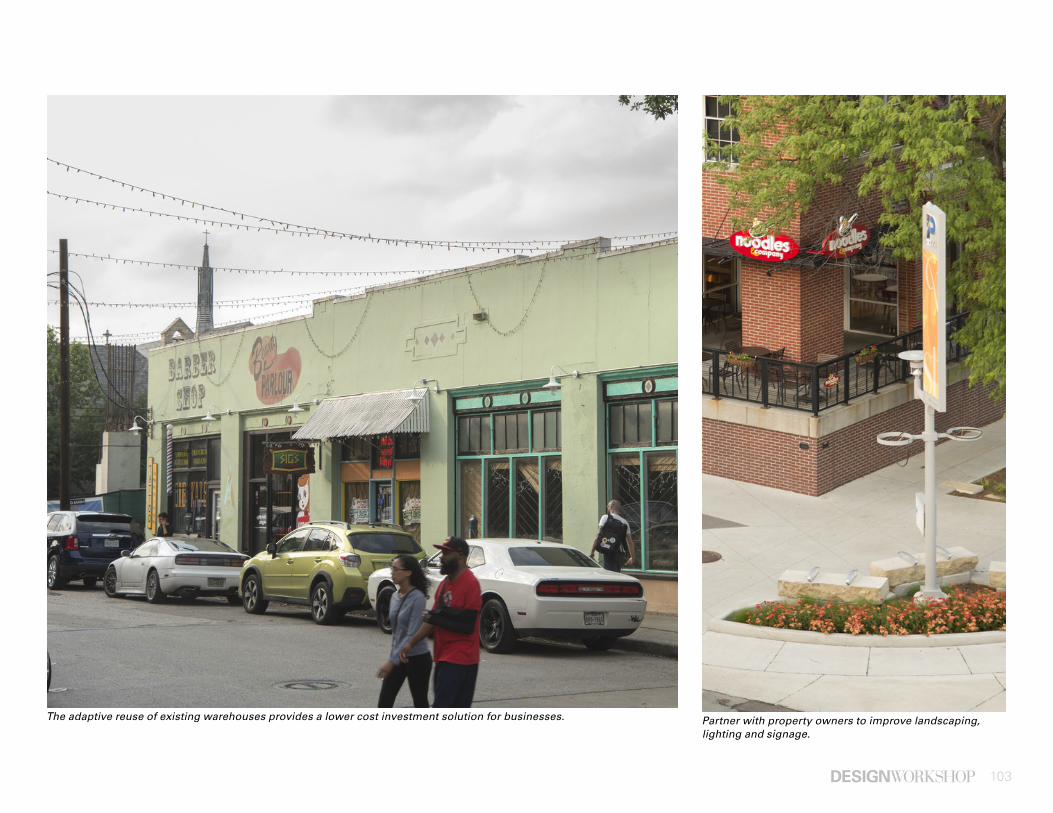
103
Partner with property owners to improve landscaping, lighting and signage.
The adaptive reuse of existing warehouses provides a lower cost investment solution for businesses.
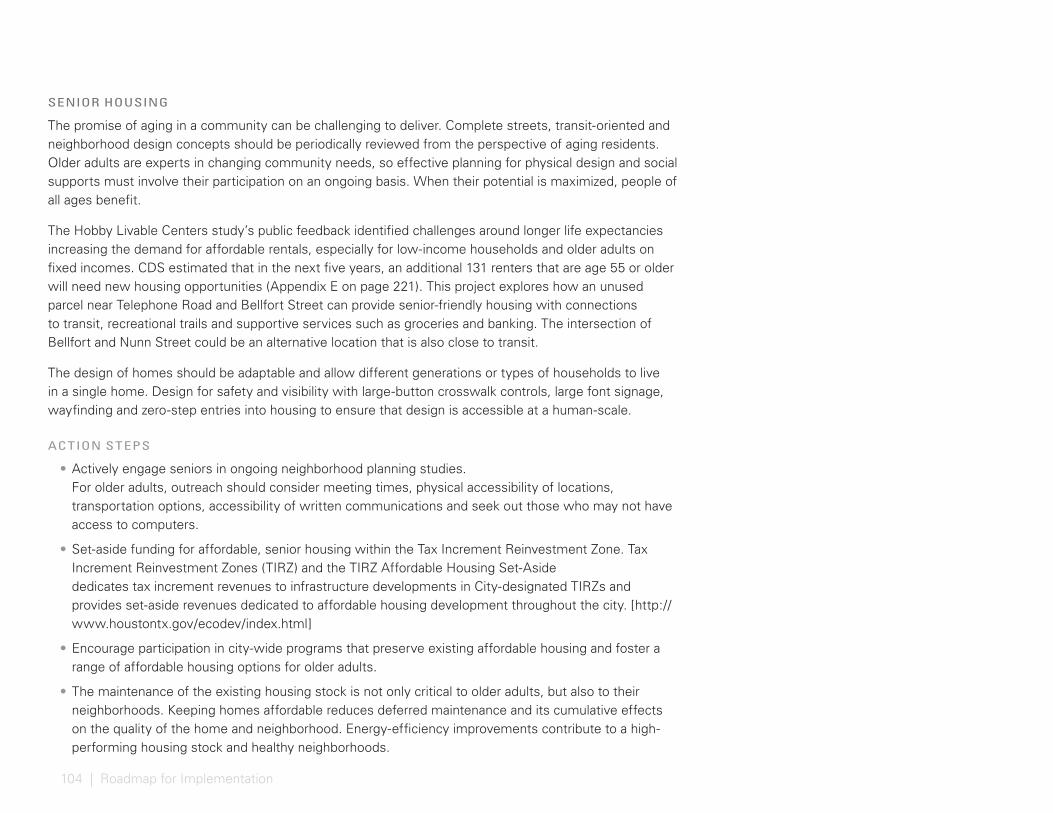
104 | Roadmap for Implementation
SENIOR HOUSING
The promise of aging in a community can be challenging to deliver. Complete streets, transit-oriented and neighborhood design concepts should be periodically reviewed from the perspective of aging residents. Older adults are experts in changing community needs, so effective planning for physical design and social supports must involve their participation on an ongoing basis. When their potential is maximized, people of all ages benefit.
The Hobby Livable Centers study’s public feedback identified challenges around longer life expectancies increasing the demand for affordable rentals, especially for low-income households and older adults on fixed incomes. CDS estimated that in the next five years, an additional 131 renters that are age 55 or older will need new housing opportunities (Appendix E on page 221). This project explores how an unused parcel near Telephone Road and Bellfort Street can provide senior-friendly housing with connections to transit, recreational trails and supportive services such as groceries and banking. The intersection of Bellfort and Nunn Street could be an alternative location that is also close to transit.
The design of homes should be adaptable and allow different generations or types of households to live in a single home. Design for safety and visibility with large-button crosswalk controls, large font signage, wayfinding and zero-step entries into housing to ensure that design is accessible at a human-scale.
ACTION STEPS
• Actively engage seniors in ongoing neighborhood planning studies. For older adults, outreach should consider meeting times, physical accessibility of locations, transportation options, accessibility of written communications and seek out those who may not have access to computers.
• Set-aside funding for affordable, senior housing within the Tax Increment Reinvestment Zone. Tax Increment Reinvestment Zones (TIRZ) and the TIRZ Affordable Housing Set-Aside dedicates tax increment revenues to infrastructure developments in City-designated TIRZs and provides set-aside revenues dedicated to affordable housing development throughout the city. [http://www.houstontx.gov/ecodev/index.html]
• Encourage participation in city-wide programs that preserve existing affordable housing and foster a range of affordable housing options for older adults.
• The maintenance of the existing housing stock is not only critical to older adults, but also to their neighborhoods. Keeping homes affordable reduces deferred maintenance and its cumulative effects on the quality of the home and neighborhood. Energy-efficiency improvements contribute to a high-performing housing stock and healthy neighborhoods.
105
In dense, built locations, preserving existing affordable rental housing offers cost advantages over new construction, especially if funding for new subsidized housing is limited. City of Houston Housing and Community Development provides several programs that promote affordability, safety, accessibility, and that foster sustainable maintenance and upkeep activities for homes and apartments. The following pages include a “toolbox” of potential resources such as tax incentives and bonds that the District can leverage in addition to TIRZ set-aside dollars.
FUNDING SOURCES
ENTITLEMENT GR ANTS
There are four HUD entitlement grants administered by HCDD that finance annual objectives associated with HUD activities, including the Community Development Block Grant (CDBG), the HOME Investment Partnerships (HOME) Program, the Emergency Solutions Grant (ESG) and Housing Opportunities for Persons with AIDS (HOPWA). Of note, ESG and HOPWA are primarily supportive service grants awarded through a competitive process to social service agencies. However, two of the grants, CDBG and HOME may be utilized as a form of gap financing for housing. HCDD’s Multifamily Housing Program activities are funded at various times throughout the year through a Request for Proposal (RFP) process.
• The Community Development Block Grant (CDBG) Program finances a variety of activities including housing, public facilities and improvements, public services, and economic development assistance activities. These activities support the City’s low- and moderate-income neighborhoods and residents.
• The HOME Investment Partnerships (HOME) Program promotes public/private partnerships as a vehicle for expanding the stock of affordable housing, both single and multifamily, for the homeowner and rental markets. HOME Program funds support homebuyer assistance and single and multifamily development/rehabilitation/repair activities.
HOUSTON HOUSING AUTHORIT Y
The Houston Housing Authority (HHA) receives federal funding to provide quality affordable housing options in Houston. The HHA is the local administrator of the federal Low-Rent Public Housing Program and the Housing Choice Voucher Program (HCV) (formerly Section 8), as well as other housing, homeownership, and self- sufficiency programs for low- and extremely low-income families, seniors, and persons with disabilities within the City of Houston.
106 | Roadmap for Implementation
TA X INCENTIVES & BOND PROGR AMS
In addition to federal entitlement grants, other sources of funds are available to the District for through Housing and Community Development incentives for new multifamily residential mixed-use developments. HCDD’s programs work cooperatively with other tax-related incentives to facilitate affordable housing options and create jobs. Descriptions of each program follow.
• Local Tax, Bond, and Development Incentives
Chapter 380 of the State of Texas Local Government Code allows Texas cities to make loans or grants of city funds to developers or investors as well as provide certain city staff and services, at minimum or no charge, to help stimulate economic development. [http://www.houstontx.gov/ecodev/380agreements.html]
• Tax Abatement Ordinance
Provides abatement of property tax for up to 10 years for owners of businesses that make new capital investments and commitments to job creation. [http://www.houstontx.gov/ecodev/tax_abatements.html]
• Private Activity Bonds and Mortgage Revenue Bond Program
Through Houston Housing Finance Corporation, local bond financing of single family and multifamily developments is available to partners in the private sector. The primary purpose of these programs is to encourage the development of affordable housing using below-market financing and tax exempt incentives. [http://houstonhfc.com/MFP.html]
• Developer Participation Contract (70-30 DPCs)
Mainly for water and wastewater infrastructure construction in new residential subdivisions. The Department of Public Works and Engineering is responsible for reimbursements involving water and wastewater funds. If applied for, some developers may receive funds from the Department of Housing and Community Development for Storm Sewer infrastructure construction on affordable housing development. The cap on reimbursements for these type projects is $1,000,000 and includes construction and engineering costs. [http://documents.publicworks.houstontx.gov/]
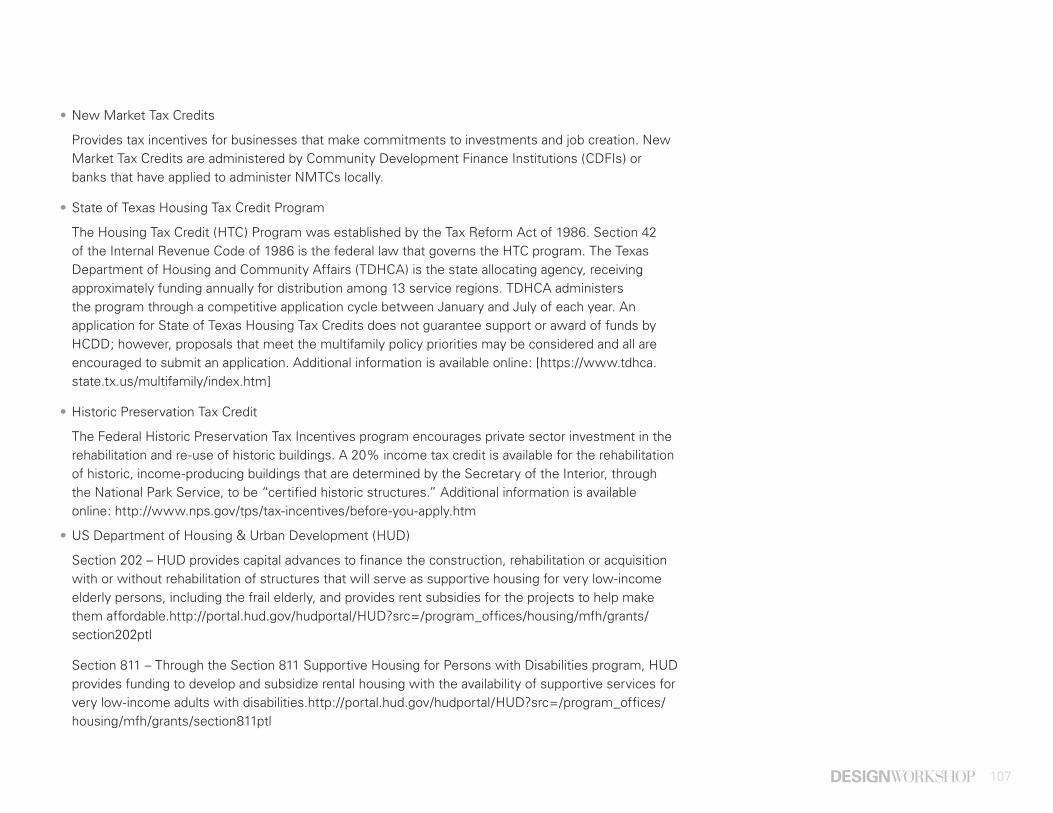
107
• New Market Tax Credits
Provides tax incentives for businesses that make commitments to investments and job creation. New Market Tax Credits are administered by Community Development Finance Institutions (CDFIs) or banks that have applied to administer NMTCs locally.
• State of Texas Housing Tax Credit Program
The Housing Tax Credit (HTC) Program was established by the Tax Reform Act of 1986. Section 42 of the Internal Revenue Code of 1986 is the federal law that governs the HTC program. The Texas Department of Housing and Community Affairs (TDHCA) is the state allocating agency, receiving approximately funding annually for distribution among 13 service regions. TDHCA administers the program through a competitive application cycle between January and July of each year. An application for State of Texas Housing Tax Credits does not guarantee support or award of funds by HCDD; however, proposals that meet the multifamily policy priorities may be considered and all are encouraged to submit an application. Additional information is available online: [https://www.tdhca.state.tx.us/multifamily/index.htm]
• Historic Preservation Tax Credit
The Federal Historic Preservation Tax Incentives program encourages private sector investment in the rehabilitation and re-use of historic buildings. A 20% income tax credit is available for the rehabilitation of historic, income-producing buildings that are determined by the Secretary of the Interior, through the National Park Service, to be “certified historic structures.” Additional information is available online: http://www.nps.gov/tps/tax-incentives/before-you-apply.htm
• US Department of Housing & Urban Development (HUD)
Section 202 – HUD provides capital advances to finance the construction, rehabilitation or acquisition with or without rehabilitation of structures that will serve as supportive housing for very low-income elderly persons, including the frail elderly, and provides rent subsidies for the projects to help make them affordable.http://portal.hud.gov/hudportal/HUD?src=/program_offices/housing/mfh/grants/section202ptl
Section 811 – Through the Section 811 Supportive Housing for Persons with Disabilities program, HUD provides funding to develop and subsidize rental housing with the availability of supportive services for very low-income adults with disabilities.http://portal.hud.gov/hudportal/HUD?src=/program_offices/housing/mfh/grants/section811ptl

108 | Roadmap for Implementation
GOAL S ACHIE VED* :
L IVABIL IT Y PRINCIPL ES* * :
*SEE “PROJEC T GOA L S” ON PAGE 5 .
* *AS DEFINED BY U.S. DEPA R T MENT OF HOUSING AND URBAN DE V ELOPMENT ( HUD) .
1 2 3 4 5 6
COMMUNIT Y PARTNERS
• Tax Increment Reinvestment Zone #8 (Gulfgate TIRZ)
• Hobby Area Management District
• Metropolitan Transportation Authority of Harris County
• City of Houston (Planning and Development Department)
• City of Houston (Housing and Community Development)
• Private Landowners
• Housing Authorities
• AARP
• Houston/HC Continuum of Care
• Coordinated Housing Solutions
• Greater Houston Builders Association (GHBA)
• Local Initiatives Support Corporation (LISC) of Greater Houston http://www.lisc.org/houston/
• Texas State Affordable Housing Corporation http://www.tsahc.org/developers/loan-products
• Texas Association of Affordable Housing Providers http://taahp.org/
• Texas Association of Local Housing Finance Agencies http://talhfa.org/
STATE-FUNDED BOND PROGR AMS
• State of Texas Bond Program
As an issuer for the Texas Private Activity Bond program, the Texas Department of Housing and Community Affairs (TDHCA) issues tax-exempt and taxable multifamily mortgage revenue bonds to finance the acquisition, rehabilitation, or development of affordable rental housing units. Approximately $447 million is available statewide. HCDD does not directly participate in selection or award of the State multifamily mortgage revenue bonds, but may provide gap financing to proposals through its HOME Investment Partnerships Program, Community Development Block Grant, or local revenue programs. TDHCA administers the program as a “first-come, first-served” program throughout the year. As with other housing programs, affordability periods, rent limits, and income limits will apply to recipients receiving State bond funds. Additional information is available online: http://www.tdhca.state.tx.us/multifamily/bond/index.htm
• Tax-Exempt Bonds, TSAHC
The Texas State Affordable Housing Corporation (TSAHC) is a 501(c)(3) nonprofit organization that was created by the Texas Legislature in 1994 to serve as a self-sustaining, statewide affordable housing provider. TSAHC’s multifamily tax-exempt bond issuance program was established in 2001 and has since provided more than $600 million in financing to help build or preserve affordable housing in Texas. As one of only two authorized statewide issuers of housing bonds, TSAHC receives 10% of the statewide volume cap for multifamily private activity bonds and has unlimited authority to issue 501c3 bonds for rental housing projects. Developers may submit proposals at any time: http://www.tsahc.org/developers/tax-exempt-bonds
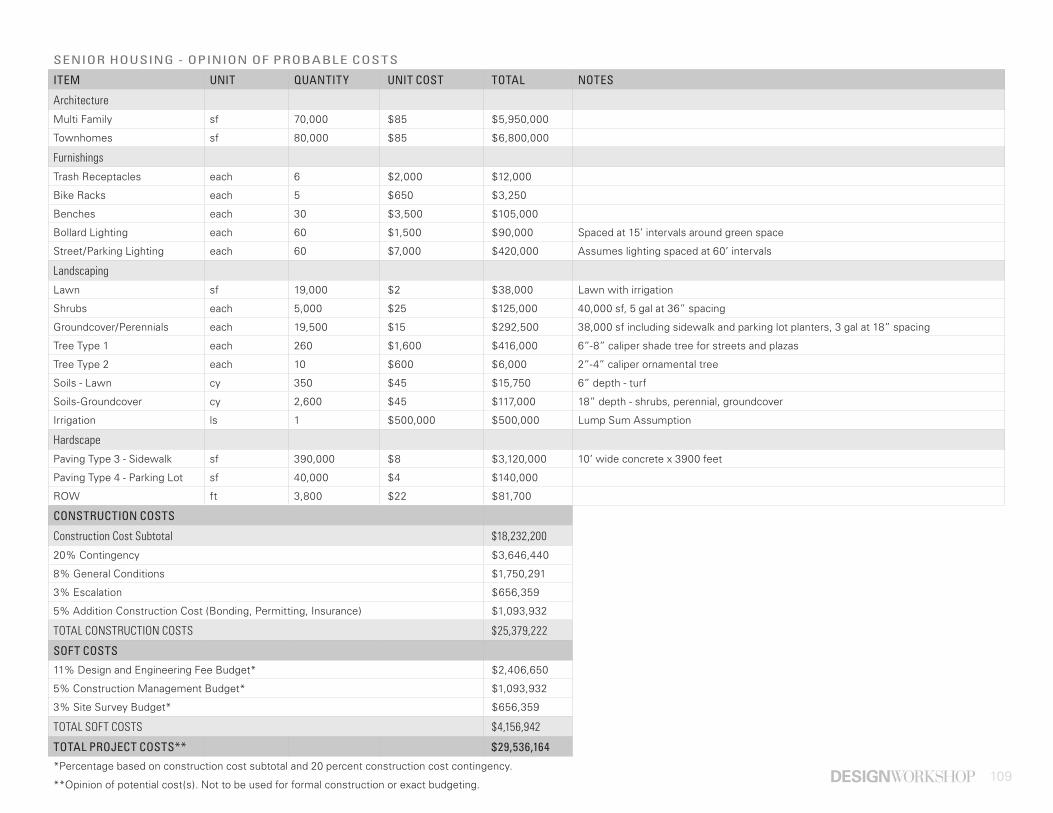
109
SENIOR HOUSING - OPINION OF PROBABLE COSTS
ITEM UNIT QUANTITY UNIT COST TOTAL NOTES
Architecture
Multi Family sf 70,000 $85 $5,950,000
Townhomes sf 80,000 $85 $6,800,000
Furnishings
Trash Receptacles each 6 $2,000 $12,000
Bike Racks each 5 $650 $3,250
Benches each 30 $3,500 $105,000
Bollard Lighting each 60 $1,500 $90,000 Spaced at 15’ intervals around green space
Street/Parking Lighting each 60 $7,000 $420,000 Assumes lighting spaced at 60’ intervals
Landscaping
Lawn sf 19,000 $2 $38,000 Lawn with irrigation
Shrubs each 5,000 $25 $125,000 40,000 sf, 5 gal at 36” spacing
Groundcover/Perennials each 19,500 $15 $292,500 38,000 sf including sidewalk and parking lot planters, 3 gal at 18” spacing
Tree Type 1 each 260 $1,600 $416,000 6”-8” caliper shade tree for streets and plazas
Tree Type 2 each 10 $600 $6,000 2”-4” caliper ornamental tree
Soils - Lawn cy 350 $45 $15,750 6” depth - turf
Soils-Groundcover cy 2,600 $45 $117,000 18” depth - shrubs, perennial, groundcover
Irrigation ls 1 $500,000 $500,000 Lump Sum Assumption
Hardscape
Paving Type 3 - Sidewalk sf 390,000 $8 $3,120,000 10’ wide concrete x 3900 feet
Paving Type 4 - Parking Lot sf 40,000 $4 $140,000
ROW ft 3,800 $22 $81,700
CONSTRUCTION COSTS
Construction Cost Subtotal $18,232,200
20% Contingency $3,646,440
8% General Conditions $1,750,291
3% Escalation $656,359
5% Addition Construction Cost (Bonding, Permitting, Insurance) $1,093,932
TOTAL CONSTRUCTION COSTS $25,379,222
SOFT COSTS
11% Design and Engineering Fee Budget* $2,406,650
5% Construction Management Budget* $1,093,932
3% Site Survey Budget* $656,359
TOTAL SOFT COSTS $4,156,942
TOTAL PROJECT COSTS** $29,536,164
*Percentage based on construction cost subtotal and 20 percent construction cost contingency.
**Opinion of potential cost(s). Not to be used for formal construction or exact budgeting.
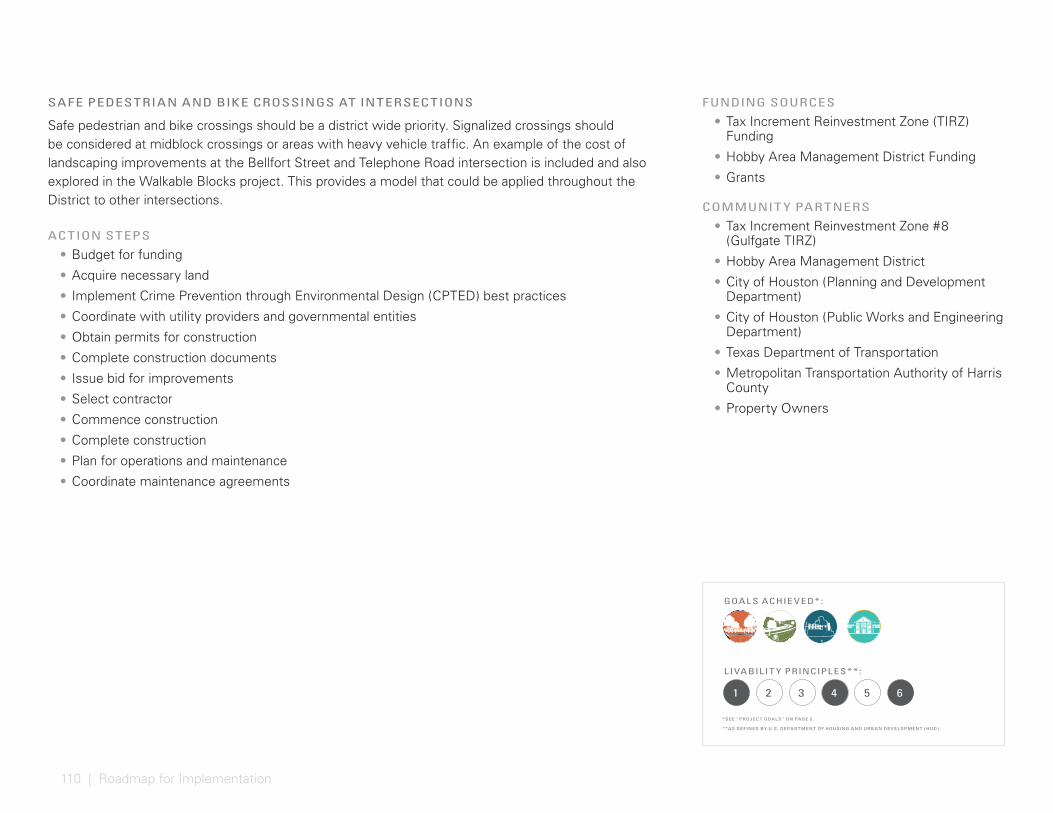
110 | Roadmap for Implementation
SAFE PEDESTRIAN AND BIKE CROSSINGS AT INTERSECTIONS
Safe pedestrian and bike crossings should be a district wide priority. Signalized crossings should be considered at midblock crossings or areas with heavy vehicle traffic. An example of the cost of landscaping improvements at the Bellfort Street and Telephone Road intersection is included and also explored in the Walkable Blocks project. This provides a model that could be applied throughout the District to other intersections.
ACTION STEPS
• Budget for funding
• Acquire necessary land
• Implement Crime Prevention through Environmental Design (CPTED) best practices
• Coordinate with utility providers and governmental entities
• Obtain permits for construction
• Complete construction documents
• Issue bid for improvements
• Select contractor
• Commence construction
• Complete construction
• Plan for operations and maintenance
• Coordinate maintenance agreements
FUNDING SOURCES
• Tax Increment Reinvestment Zone (TIRZ) Funding
• Hobby Area Management District Funding
• Grants
COMMUNIT Y PARTNERS
• Tax Increment Reinvestment Zone #8 (Gulfgate TIRZ)
• Hobby Area Management District
• City of Houston (Planning and Development Department)
• City of Houston (Public Works and Engineering Department)
• Texas Department of Transportation
• Metropolitan Transportation Authority of Harris County
• Property Owners
GOAL S ACHIE VED* :
L IVABIL IT Y PRINCIPL ES* * :
*SEE “PROJEC T GOA L S” ON PAGE 5 .
* *AS DEFINED BY U.S. DEPA R T MENT OF HOUSING AND URBAN DE V ELOPMENT ( HUD) .
1 65432

111
Bulb out at intersections reduce crossing distance
Flashing beacons draw attention to crossing pedestrian traffic Pavers make sidewalks stand out to drivers
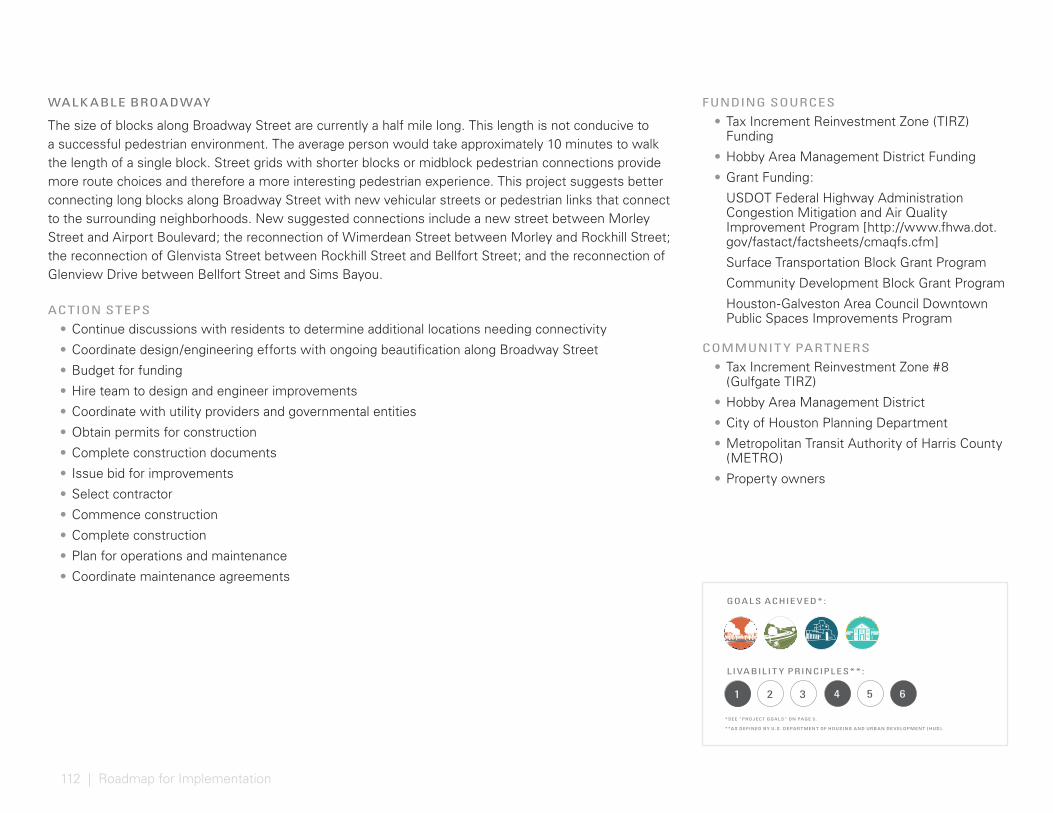
112 | Roadmap for Implementation
FUNDING SOURCES
• Tax Increment Reinvestment Zone (TIRZ) Funding
• Hobby Area Management District Funding
• Grant Funding:
USDOT Federal Highway Administration Congestion Mitigation and Air Quality Improvement Program [http://www.fhwa.dot.gov/fastact/factsheets/cmaqfs.cfm]
Surface Transportation Block Grant Program
Community Development Block Grant Program
Houston-Galveston Area Council Downtown Public Spaces Improvements Program
COMMUNIT Y PARTNERS
• Tax Increment Reinvestment Zone #8 (Gulfgate TIRZ)
• Hobby Area Management District
• City of Houston Planning Department
• Metropolitan Transit Authority of Harris County (METRO)
• Property owners
WALK ABLE BROADWAY
The size of blocks along Broadway Street are currently a half mile long. This length is not conducive to a successful pedestrian environment. The average person would take approximately 10 minutes to walk the length of a single block. Street grids with shorter blocks or midblock pedestrian connections provide more route choices and therefore a more interesting pedestrian experience. This project suggests better connecting long blocks along Broadway Street with new vehicular streets or pedestrian links that connect to the surrounding neighborhoods. New suggested connections include a new street between Morley Street and Airport Boulevard; the reconnection of Wimerdean Street between Morley and Rockhill Street; the reconnection of Glenvista Street between Rockhill Street and Bellfort Street; and the reconnection of Glenview Drive between Bellfort Street and Sims Bayou.
ACTION STEPS
• Continue discussions with residents to determine additional locations needing connectivity
• Coordinate design/engineering efforts with ongoing beautification along Broadway Street
• Budget for funding
• Hire team to design and engineer improvements
• Coordinate with utility providers and governmental entities
• Obtain permits for construction
• Complete construction documents
• Issue bid for improvements
• Select contractor
• Commence construction
• Complete construction
• Plan for operations and maintenance
• Coordinate maintenance agreements
GOAL S ACHIE VED* :
L IVABIL IT Y PRINCIPL ES* * :
*SEE “PROJEC T GOA L S” ON PAGE 5 .
* *AS DEFINED BY U.S. DEPA R T MENT OF HOUSING AND URBAN DE V ELOPMENT ( HUD) .
1 65432
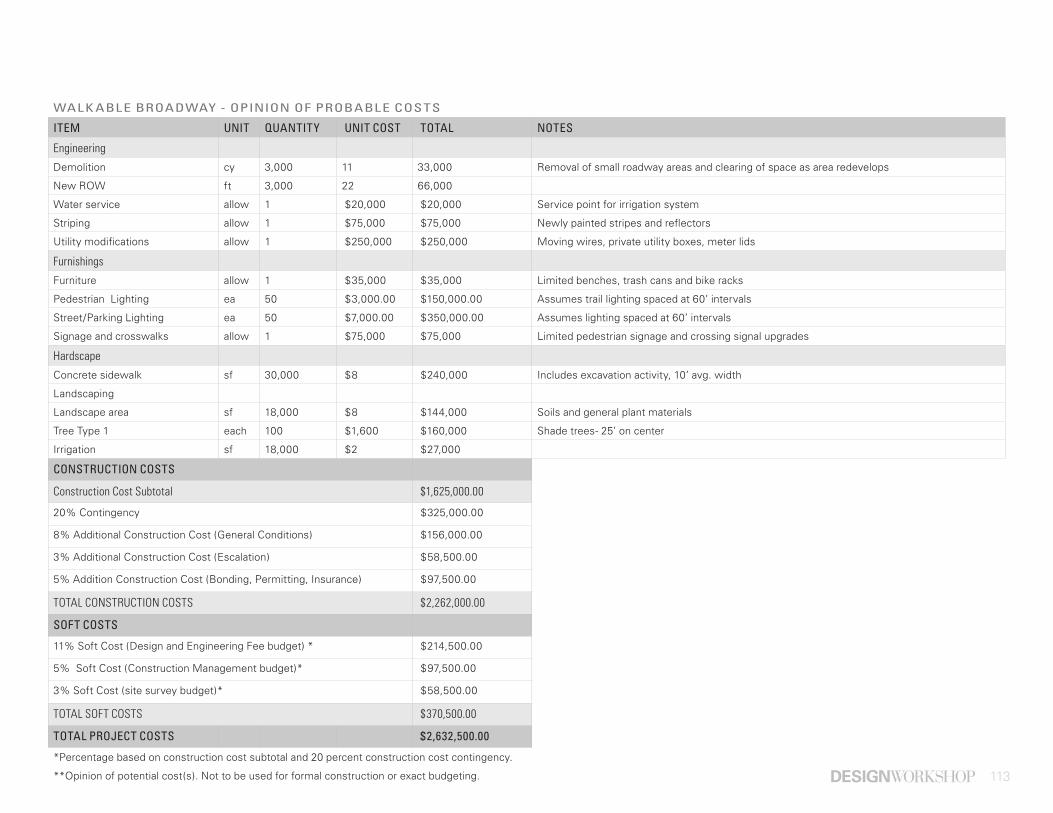
113
WALK ABLE BROADWAY - OPINION OF PROBABLE COSTS
ITEM UNIT QUANTITY UNIT COST TOTAL NOTES
Engineering
Demolition cy 3,000 11 33,000 Removal of small roadway areas and clearing of space as area redevelops
New ROW ft 3,000 22 66,000
Water service allow 1 $20,000 $20,000 Service point for irrigation system
Striping allow 1 $75,000 $75,000 Newly painted stripes and reflectors
Utility modifications allow 1 $250,000 $250,000 Moving wires, private utility boxes, meter lids
Furnishings
Furniture allow 1 $35,000 $35,000 Limited benches, trash cans and bike racks
Pedestrian Lighting ea 50 $3,000.00 $150,000.00 Assumes trail lighting spaced at 60’ intervals
Street/Parking Lighting ea 50 $7,000.00 $350,000.00 Assumes lighting spaced at 60’ intervals
Signage and crosswalks allow 1 $75,000 $75,000 Limited pedestrian signage and crossing signal upgrades
Hardscape
Concrete sidewalk sf 30,000 $8 $240,000 Includes excavation activity, 10’ avg. width
Landscaping
Landscape area sf 18,000 $8 $144,000 Soils and general plant materials
Tree Type 1 each 100 $1,600 $160,000 Shade trees- 25’ on center
Irrigation sf 18,000 $2 $27,000
CONSTRUCTION COSTS
Construction Cost Subtotal $1,625,000.00
20% Contingency $325,000.00
8% Additional Construction Cost (General Conditions) $156,000.00
3% Additional Construction Cost (Escalation) $58,500.00
5% Addition Construction Cost (Bonding, Permitting, Insurance) $97,500.00
TOTAL CONSTRUCTION COSTS $2,262,000.00
SOFT COSTS
11% Soft Cost (Design and Engineering Fee budget) * $214,500.00
5% Soft Cost (Construction Management budget)* $97,500.00
3% Soft Cost (site survey budget)* $58,500.00
TOTAL SOFT COSTS $370,500.00
TOTAL PROJECT COSTS $2,632,500.00
*Percentage based on construction cost subtotal and 20 percent construction cost contingency.
**Opinion of potential cost(s). Not to be used for formal construction or exact budgeting.
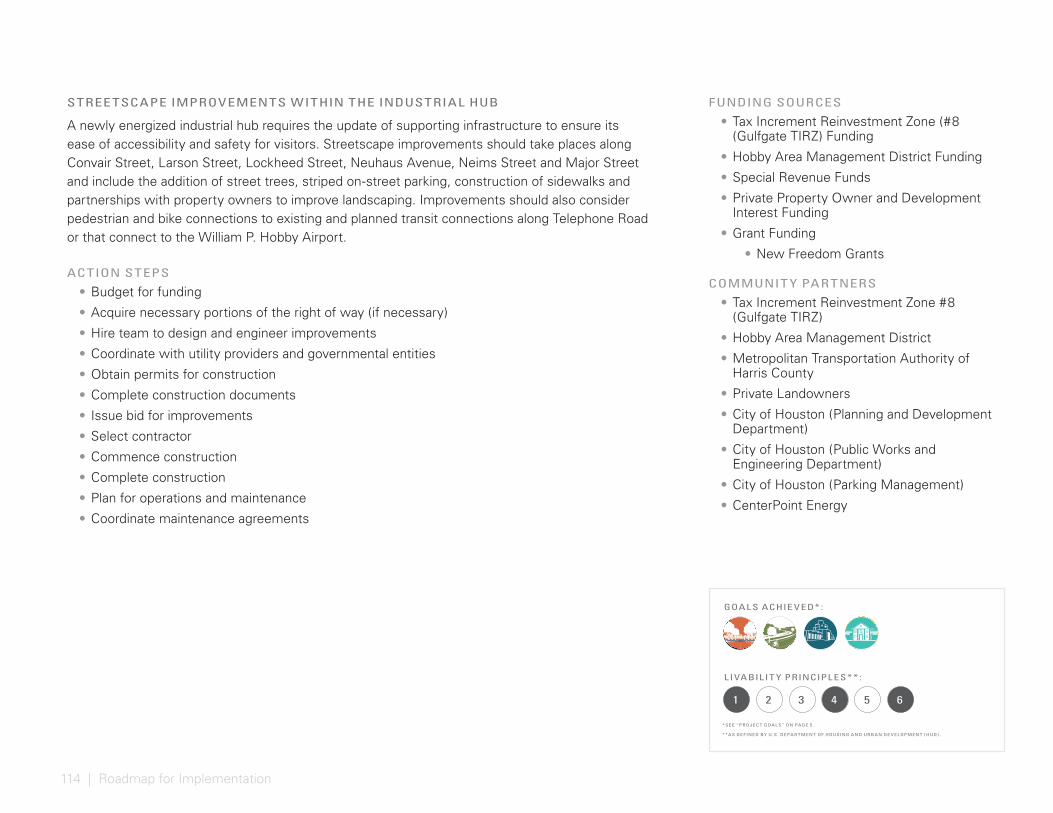
114 | Roadmap for Implementation
STREE TSCAPE IMPROVEMENTS WITHIN THE INDUSTRIAL HUB
A newly energized industrial hub requires the update of supporting infrastructure to ensure its ease of accessibility and safety for visitors. Streetscape improvements should take places along Convair Street, Larson Street, Lockheed Street, Neuhaus Avenue, Neims Street and Major Street and include the addition of street trees, striped on-street parking, construction of sidewalks and partnerships with property owners to improve landscaping. Improvements should also consider pedestrian and bike connections to existing and planned transit connections along Telephone Road or that connect to the William P. Hobby Airport.
ACTION STEPS
• Budget for funding
• Acquire necessary portions of the right of way (if necessary)
• Hire team to design and engineer improvements
• Coordinate with utility providers and governmental entities
• Obtain permits for construction
• Complete construction documents
• Issue bid for improvements
• Select contractor
• Commence construction
• Complete construction
• Plan for operations and maintenance
• Coordinate maintenance agreements
FUNDING SOURCES
• Tax Increment Reinvestment Zone (#8 (Gulfgate TIRZ) Funding
• Hobby Area Management District Funding
• Special Revenue Funds
• Private Property Owner and Development Interest Funding
• Grant Funding
• New Freedom Grants
COMMUNIT Y PARTNERS
• Tax Increment Reinvestment Zone #8 (Gulfgate TIRZ)
• Hobby Area Management District
• Metropolitan Transportation Authority of Harris County
• Private Landowners
• City of Houston (Planning and Development Department)
• City of Houston (Public Works and Engineering Department)
• City of Houston (Parking Management)
• CenterPoint Energy
GOAL S ACHIE VED* :
L IVABIL IT Y PRINCIPL ES* * :
*SEE “PROJEC T GOA L S” ON PAGE 5 .
* *AS DEFINED BY U.S. DEPA R T MENT OF HOUSING AND URBAN DE V ELOPMENT ( HUD) .
1 65432
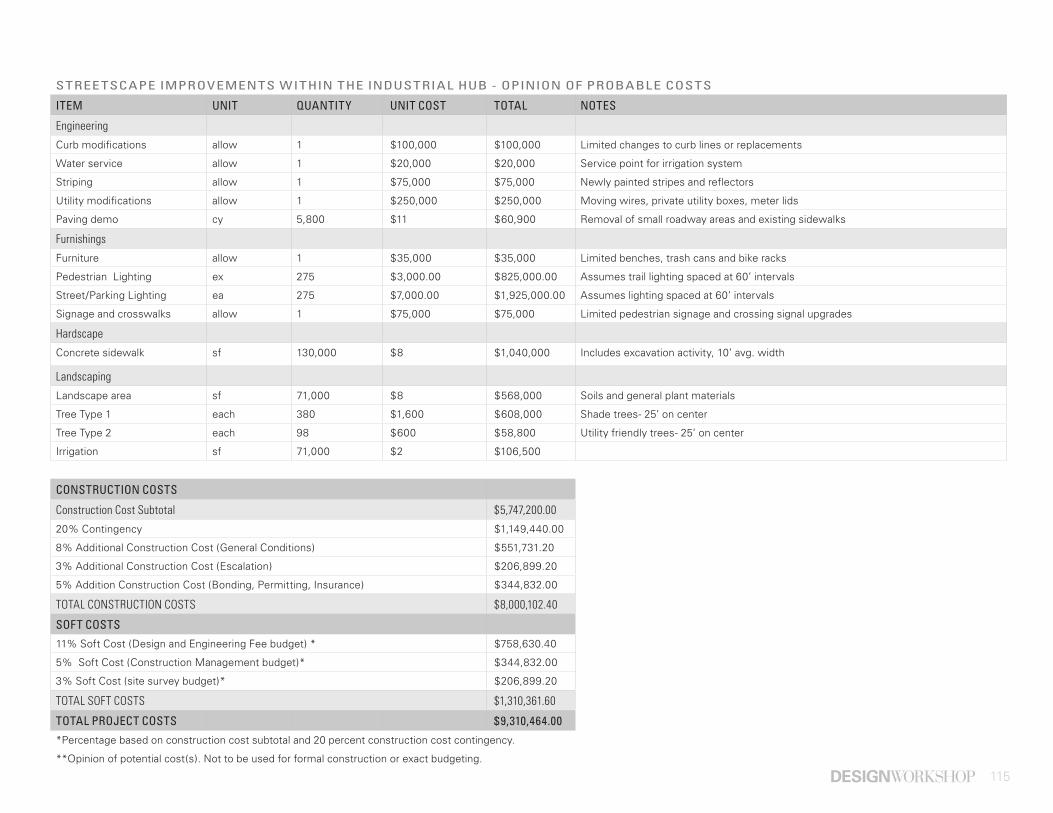
115
STREE TSCAPE IMPROVEMENTS WITHIN THE INDUSTRIAL HUB - OPINION OF PROBABLE COSTS
ITEM UNIT QUANTITY UNIT COST TOTAL NOTES
Engineering
Curb modifications allow 1 $100,000 $100,000 Limited changes to curb lines or replacements
Water service allow 1 $20,000 $20,000 Service point for irrigation system
Striping allow 1 $75,000 $75,000 Newly painted stripes and reflectors
Utility modifications allow 1 $250,000 $250,000 Moving wires, private utility boxes, meter lids
Paving demo cy 5,800 $11 $60,900 Removal of small roadway areas and existing sidewalks
Furnishings
Furniture allow 1 $35,000 $35,000 Limited benches, trash cans and bike racks
Pedestrian Lighting ex 275 $3,000.00 $825,000.00 Assumes trail lighting spaced at 60’ intervals
Street/Parking Lighting ea 275 $7,000.00 $1,925,000.00 Assumes lighting spaced at 60’ intervals
Signage and crosswalks allow 1 $75,000 $75,000 Limited pedestrian signage and crossing signal upgrades
Hardscape
Concrete sidewalk sf 130,000 $8 $1,040,000 Includes excavation activity, 10’ avg. width
Landscaping
Landscape area sf 71,000 $8 $568,000 Soils and general plant materials
Tree Type 1 each 380 $1,600 $608,000 Shade trees- 25’ on center
Tree Type 2 each 98 $600 $58,800 Utility friendly trees- 25’ on center
Irrigation sf 71,000 $2 $106,500
CONSTRUCTION COSTS
Construction Cost Subtotal $5,747,200.00
20% Contingency $1,149,440.00
8% Additional Construction Cost (General Conditions) $551,731.20
3% Additional Construction Cost (Escalation) $206,899.20
5% Addition Construction Cost (Bonding, Permitting, Insurance) $344,832.00
TOTAL CONSTRUCTION COSTS $8,000,102.40
SOFT COSTS
11% Soft Cost (Design and Engineering Fee budget) * $758,630.40
5% Soft Cost (Construction Management budget)* $344,832.00
3% Soft Cost (site survey budget)* $206,899.20
TOTAL SOFT COSTS $1,310,361.60
TOTAL PROJECT COSTS $9,310,464.00
*Percentage based on construction cost subtotal and 20 percent construction cost contingency.
**Opinion of potential cost(s). Not to be used for formal construction or exact budgeting.

116 | Roadmap for Implementation
PEDESTRIAN AND BIKE PRIORIT Y STREE TS
Providing safe and accessible infrastructure for both pedestrians and cyclists is key in creating a livable center. New bike infrastructure and improvements to sidewalks should be prioritized along corridors that connect Hobby residents and visitors from one recreational, cultural, job or residential destination to another. The streets identified in Figure 18: Connectivity Vision on page 37 should receive priority urban design and investment in order to create safe connections from existing and future amenities. Please note that proposed facilities take the Houston Bike Plan into consideration. The process to incorporate additional suggestions for each facility type is pending development and will be considered by the City of Houston Bikeways Program in the coming years.
Filling in gaps where sidewalks are missing and replacing sidewalks in poor condition should be first priority. Updates should also consider the following design principles:
1. Connect livable centers to each other;
2. Improve pedestrian amenities such as increased shade, seating and continuous sidewalks;
3. Incorporate artistic elements into the streetscape;
4. Provide directional signage to parking, cultural and entertainment destinations;
5. Incorporate information kiosks and ID markers to promote arts and cultural events;
6. Provide unique lighting elements to enhance the street experience during evening hours; and
7. Support local residents and workers by incorporating custom designed urban infrastructure such as light poles, benches, tree grates, bicycle racks and utility screens.
Bike lane improvements should be considered strategically in conjunction with street reconstruction efforts. Priority should be given to projects within the Houston Bike Plan, on streets that provide connections between neighborhoods and key nodes and where improvements fit within the current right of way.
FUNDING SOURCES
• Tax Increment Reinvestment Zone (TIRZ) Funding
• Hobby Area Management District Funding
• General Obligation bonds
• General Fund
• Special Revenue Funds
• Grant Funding
• Safe Routes to Schools
• New Freedom Grants
COMMUNIT Y PARTNERS
• Tax Increment Reinvestment Zone #8 (Gulfgate TIRZ)
• Hobby Area Management District
• City of Houston (Planning and Development Department)
• City of Houston (Parks and Recreation Department)
• City of Houston (Public Works and Engineering Department)
• Houston Flood Control District
• Metropolitan Transportation Authority of Harris County
GOAL S ACHIE VED* :
L IVABIL IT Y PRINCIPL ES* * :
*SEE “PROJEC T GOA L S” ON PAGE 5 .
* *AS DEFINED BY U.S. DEPA R T MENT OF HOUSING AND URBAN DE V ELOPMENT ( HUD) .
1 65432
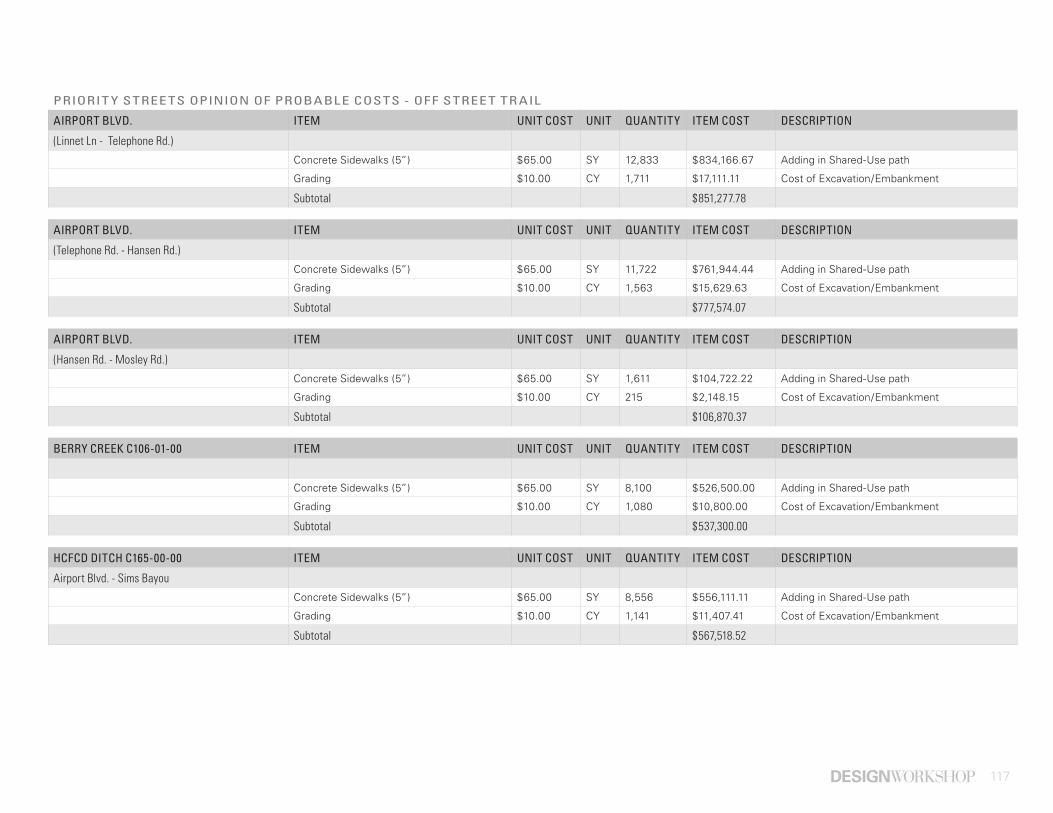
117
PRIORIT Y STREE TS OPINION OF PROBABLE COSTS - OFF STREE T TR AIL
AIRPORT BLVD. ITEM UNIT COST UNIT QUANTITY ITEM COST DESCRIPTION
(Linnet Ln - Telephone Rd.)
Concrete Sidewalks (5”) $65.00 SY 12,833 $834,166.67 Adding in Shared-Use path
Grading $10.00 CY 1,711 $17,111.11 Cost of Excavation/Embankment
Subtotal $851,277.78
AIRPORT BLVD. ITEM UNIT COST UNIT QUANTITY ITEM COST DESCRIPTION
(Telephone Rd. - Hansen Rd.)
Concrete Sidewalks (5”) $65.00 SY 11,722 $761,944.44 Adding in Shared-Use path
Grading $10.00 CY 1,563 $15,629.63 Cost of Excavation/Embankment
Subtotal $777,574.07
AIRPORT BLVD. ITEM UNIT COST UNIT QUANTITY ITEM COST DESCRIPTION
(Hansen Rd. - Mosley Rd.)
Concrete Sidewalks (5”) $65.00 SY 1,611 $104,722.22 Adding in Shared-Use path
Grading $10.00 CY 215 $2,148.15 Cost of Excavation/Embankment
Subtotal $106,870.37
BERRY CREEK C106-01-00 ITEM UNIT COST UNIT QUANTITY ITEM COST DESCRIPTION
Concrete Sidewalks (5”) $65.00 SY 8,100 $526,500.00 Adding in Shared-Use path
Grading $10.00 CY 1,080 $10,800.00 Cost of Excavation/Embankment
Subtotal $537,300.00
HCFCD DITCH C165-00-00 ITEM UNIT COST UNIT QUANTITY ITEM COST DESCRIPTION
Airport Blvd. - Sims Bayou
Concrete Sidewalks (5”) $65.00 SY 8,556 $556,111.11 Adding in Shared-Use path
Grading $10.00 CY 1,141 $11,407.41 Cost of Excavation/Embankment
Subtotal $567,518.52
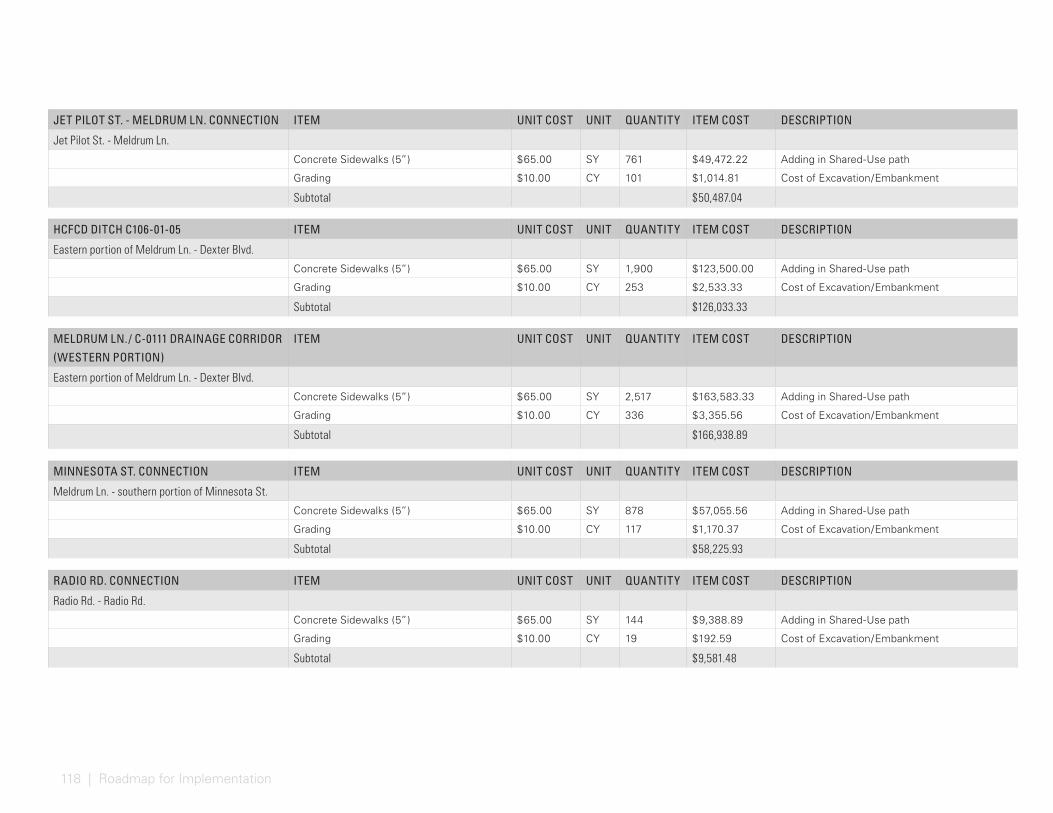
118 | Roadmap for Implementation
JET PILOT ST. - MELDRUM LN. CONNECTION ITEM UNIT COST UNIT QUANTITY ITEM COST DESCRIPTION
Jet Pilot St. - Meldrum Ln.
Concrete Sidewalks (5”) $65.00 SY 761 $49,472.22 Adding in Shared-Use path
Grading $10.00 CY 101 $1,014.81 Cost of Excavation/Embankment
Subtotal $50,487.04
HCFCD DITCH C106-01-05 ITEM UNIT COST UNIT QUANTITY ITEM COST DESCRIPTION
Eastern portion of Meldrum Ln. - Dexter Blvd.
Concrete Sidewalks (5”) $65.00 SY 1,900 $123,500.00 Adding in Shared-Use path
Grading $10.00 CY 253 $2,533.33 Cost of Excavation/Embankment
Subtotal $126,033.33
MELDRUM LN./ C-0111 DRAINAGE CORRIDOR
(WESTERN PORTION)
ITEM UNIT COST UNIT QUANTITY ITEM COST DESCRIPTION
Eastern portion of Meldrum Ln. - Dexter Blvd.
Concrete Sidewalks (5”) $65.00 SY 2,517 $163,583.33 Adding in Shared-Use path
Grading $10.00 CY 336 $3,355.56 Cost of Excavation/Embankment
Subtotal $166,938.89
MINNESOTA ST. CONNECTION ITEM UNIT COST UNIT QUANTITY ITEM COST DESCRIPTION
Meldrum Ln. - southern portion of Minnesota St.
Concrete Sidewalks (5”) $65.00 SY 878 $57,055.56 Adding in Shared-Use path
Grading $10.00 CY 117 $1,170.37 Cost of Excavation/Embankment
Subtotal $58,225.93
RADIO RD. CONNECTION ITEM UNIT COST UNIT QUANTITY ITEM COST DESCRIPTION
Radio Rd. - Radio Rd.
Concrete Sidewalks (5”) $65.00 SY 144 $9,388.89 Adding in Shared-Use path
Grading $10.00 CY 19 $192.59 Cost of Excavation/Embankment
Subtotal $9,581.48
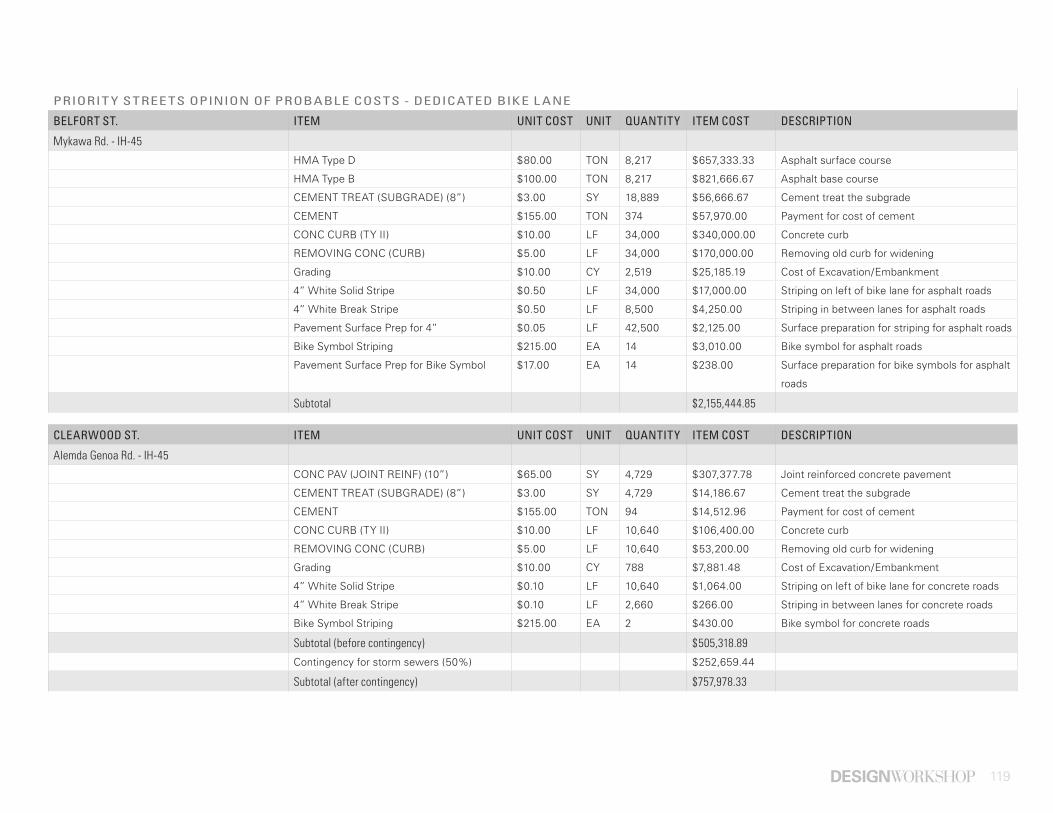
119
PRIORIT Y STREE TS OPINION OF PROBABLE COSTS - DEDICATED BIKE L ANE
BELFORT ST. ITEM UNIT COST UNIT QUANTITY ITEM COST DESCRIPTION
Mykawa Rd. - IH-45
HMA Type D $80.00 TON 8,217 $657,333.33 Asphalt surface course
HMA Type B $100.00 TON 8,217 $821,666.67 Asphalt base course
CEMENT TREAT (SUBGRADE) (8”) $3.00 SY 18,889 $56,666.67 Cement treat the subgrade
CEMENT $155.00 TON 374 $57,970.00 Payment for cost of cement
CONC CURB (TY II) $10.00 LF 34,000 $340,000.00 Concrete curb
REMOVING CONC (CURB) $5.00 LF 34,000 $170,000.00 Removing old curb for widening
Grading $10.00 CY 2,519 $25,185.19 Cost of Excavation/Embankment
4” White Solid Stripe $0.50 LF 34,000 $17,000.00 Striping on left of bike lane for asphalt roads
4” White Break Stripe $0.50 LF 8,500 $4,250.00 Striping in between lanes for asphalt roads
Pavement Surface Prep for 4” $0.05 LF 42,500 $2,125.00 Surface preparation for striping for asphalt roads
Bike Symbol Striping $215.00 EA 14 $3,010.00 Bike symbol for asphalt roads
Pavement Surface Prep for Bike Symbol $17.00 EA 14 $238.00 Surface preparation for bike symbols for asphalt
roads
Subtotal $2,155,444.85
CLEARWOOD ST. ITEM UNIT COST UNIT QUANTITY ITEM COST DESCRIPTION
Alemda Genoa Rd. - IH-45
CONC PAV (JOINT REINF) (10”) $65.00 SY 4,729 $307,377.78 Joint reinforced concrete pavement
CEMENT TREAT (SUBGRADE) (8”) $3.00 SY 4,729 $14,186.67 Cement treat the subgrade
CEMENT $155.00 TON 94 $14,512.96 Payment for cost of cement
CONC CURB (TY II) $10.00 LF 10,640 $106,400.00 Concrete curb
REMOVING CONC (CURB) $5.00 LF 10,640 $53,200.00 Removing old curb for widening
Grading $10.00 CY 788 $7,881.48 Cost of Excavation/Embankment
4” White Solid Stripe $0.10 LF 10,640 $1,064.00 Striping on left of bike lane for concrete roads
4” White Break Stripe $0.10 LF 2,660 $266.00 Striping in between lanes for concrete roads
Bike Symbol Striping $215.00 EA 2 $430.00 Bike symbol for concrete roads
Subtotal (before contingency) $505,318.89
Contingency for storm sewers (50%) $252,659.44
Subtotal (after contingency) $757,978.33
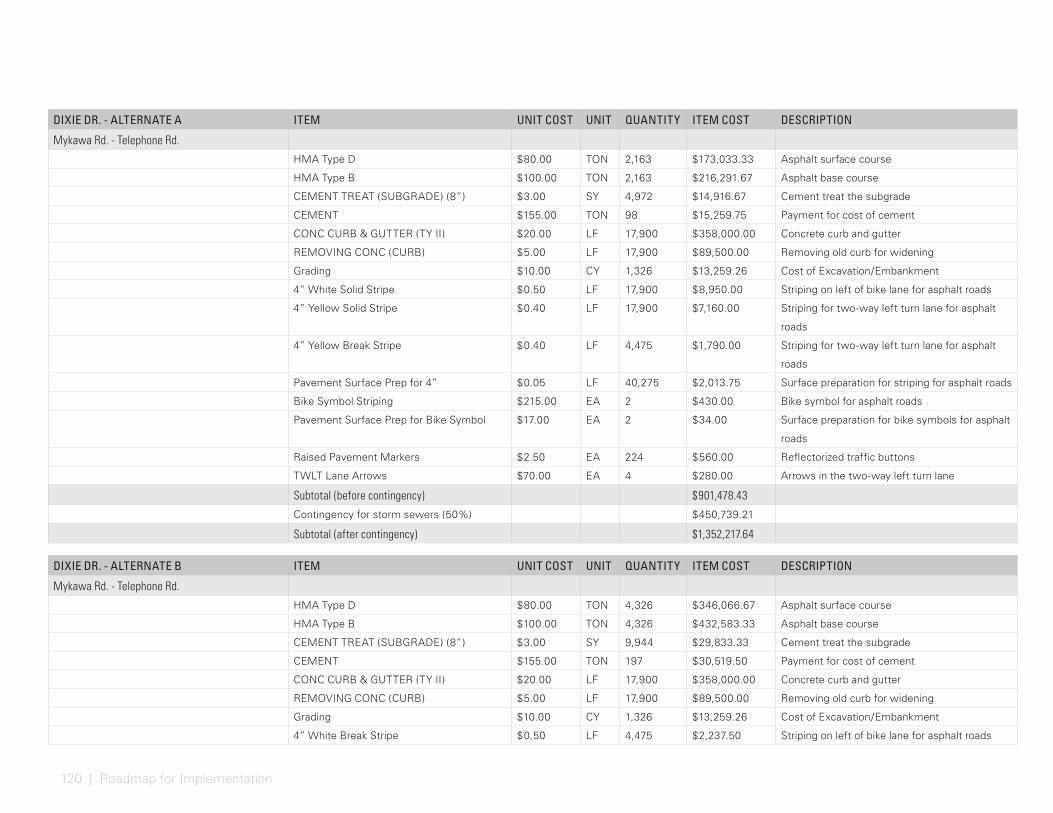
120 | Roadmap for Implementation
DIXIE DR. - ALTERNATE A ITEM UNIT COST UNIT QUANTITY ITEM COST DESCRIPTION
Mykawa Rd. - Telephone Rd.
HMA Type D $80.00 TON 2,163 $173,033.33 Asphalt surface course
HMA Type B $100.00 TON 2,163 $216,291.67 Asphalt base course
CEMENT TREAT (SUBGRADE) (8”) $3.00 SY 4,972 $14,916.67 Cement treat the subgrade
CEMENT $155.00 TON 98 $15,259.75 Payment for cost of cement
CONC CURB & GUTTER (TY II) $20.00 LF 17,900 $358,000.00 Concrete curb and gutter
REMOVING CONC (CURB) $5.00 LF 17,900 $89,500.00 Removing old curb for widening
Grading $10.00 CY 1,326 $13,259.26 Cost of Excavation/Embankment
4” White Solid Stripe $0.50 LF 17,900 $8,950.00 Striping on left of bike lane for asphalt roads
4” Yellow Solid Stripe $0.40 LF 17,900 $7,160.00 Striping for two-way left turn lane for asphalt
roads
4” Yellow Break Stripe $0.40 LF 4,475 $1,790.00 Striping for two-way left turn lane for asphalt
roads
Pavement Surface Prep for 4” $0.05 LF 40,275 $2,013.75 Surface preparation for striping for asphalt roads
Bike Symbol Striping $215.00 EA 2 $430.00 Bike symbol for asphalt roads
Pavement Surface Prep for Bike Symbol $17.00 EA 2 $34.00 Surface preparation for bike symbols for asphalt
roads
Raised Pavement Markers $2.50 EA 224 $560.00 Reflectorized traffic buttons
TWLT Lane Arrows $70.00 EA 4 $280.00 Arrows in the two-way left turn lane
Subtotal (before contingency) $901,478.43
Contingency for storm sewers (50%) $450,739.21
Subtotal (after contingency) $1,352,217.64
DIXIE DR. - ALTERNATE B ITEM UNIT COST UNIT QUANTITY ITEM COST DESCRIPTION
Mykawa Rd. - Telephone Rd.
HMA Type D $80.00 TON 4,326 $346,066.67 Asphalt surface course
HMA Type B $100.00 TON 4,326 $432,583.33 Asphalt base course
CEMENT TREAT (SUBGRADE) (8”) $3.00 SY 9,944 $29,833.33 Cement treat the subgrade
CEMENT $155.00 TON 197 $30,519.50 Payment for cost of cement
CONC CURB & GUTTER (TY II) $20.00 LF 17,900 $358,000.00 Concrete curb and gutter
REMOVING CONC (CURB) $5.00 LF 17,900 $89,500.00 Removing old curb for widening
Grading $10.00 CY 1,326 $13,259.26 Cost of Excavation/Embankment
4” White Break Stripe $0.50 LF 4,475 $2,237.50 Striping on left of bike lane for asphalt roads
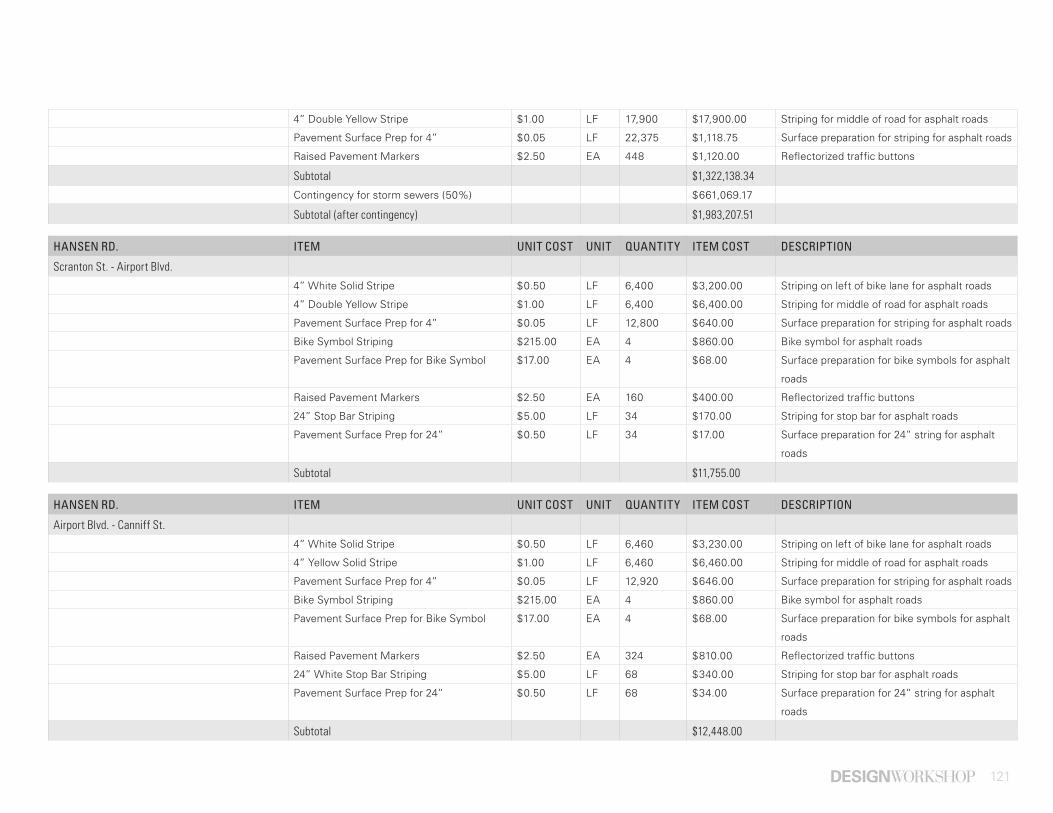
121
4” Double Yellow Stripe $1.00 LF 17,900 $17,900.00 Striping for middle of road for asphalt roads
Pavement Surface Prep for 4” $0.05 LF 22,375 $1,118.75 Surface preparation for striping for asphalt roads
Raised Pavement Markers $2.50 EA 448 $1,120.00 Reflectorized traffic buttons
Subtotal $1,322,138.34
Contingency for storm sewers (50%) $661,069.17
Subtotal (after contingency) $1,983,207.51
HANSEN RD. ITEM UNIT COST UNIT QUANTITY ITEM COST DESCRIPTION
Scranton St. - Airport Blvd.
4” White Solid Stripe $0.50 LF 6,400 $3,200.00 Striping on left of bike lane for asphalt roads
4” Double Yellow Stripe $1.00 LF 6,400 $6,400.00 Striping for middle of road for asphalt roads
Pavement Surface Prep for 4” $0.05 LF 12,800 $640.00 Surface preparation for striping for asphalt roads
Bike Symbol Striping $215.00 EA 4 $860.00 Bike symbol for asphalt roads
Pavement Surface Prep for Bike Symbol $17.00 EA 4 $68.00 Surface preparation for bike symbols for asphalt
roads
Raised Pavement Markers $2.50 EA 160 $400.00 Reflectorized traffic buttons
24” Stop Bar Striping $5.00 LF 34 $170.00 Striping for stop bar for asphalt roads
Pavement Surface Prep for 24” $0.50 LF 34 $17.00 Surface preparation for 24” string for asphalt
roads
Subtotal $11,755.00
HANSEN RD. ITEM UNIT COST UNIT QUANTITY ITEM COST DESCRIPTION
Airport Blvd. - Canniff St.
4” White Solid Stripe $0.50 LF 6,460 $3,230.00 Striping on left of bike lane for asphalt roads
4” Yellow Solid Stripe $1.00 LF 6,460 $6,460.00 Striping for middle of road for asphalt roads
Pavement Surface Prep for 4” $0.05 LF 12,920 $646.00 Surface preparation for striping for asphalt roads
Bike Symbol Striping $215.00 EA 4 $860.00 Bike symbol for asphalt roads
Pavement Surface Prep for Bike Symbol $17.00 EA 4 $68.00 Surface preparation for bike symbols for asphalt
roads
Raised Pavement Markers $2.50 EA 324 $810.00 Reflectorized traffic buttons
24” White Stop Bar Striping $5.00 LF 68 $340.00 Striping for stop bar for asphalt roads
Pavement Surface Prep for 24” $0.50 LF 68 $34.00 Surface preparation for 24” string for asphalt
roads
Subtotal $12,448.00
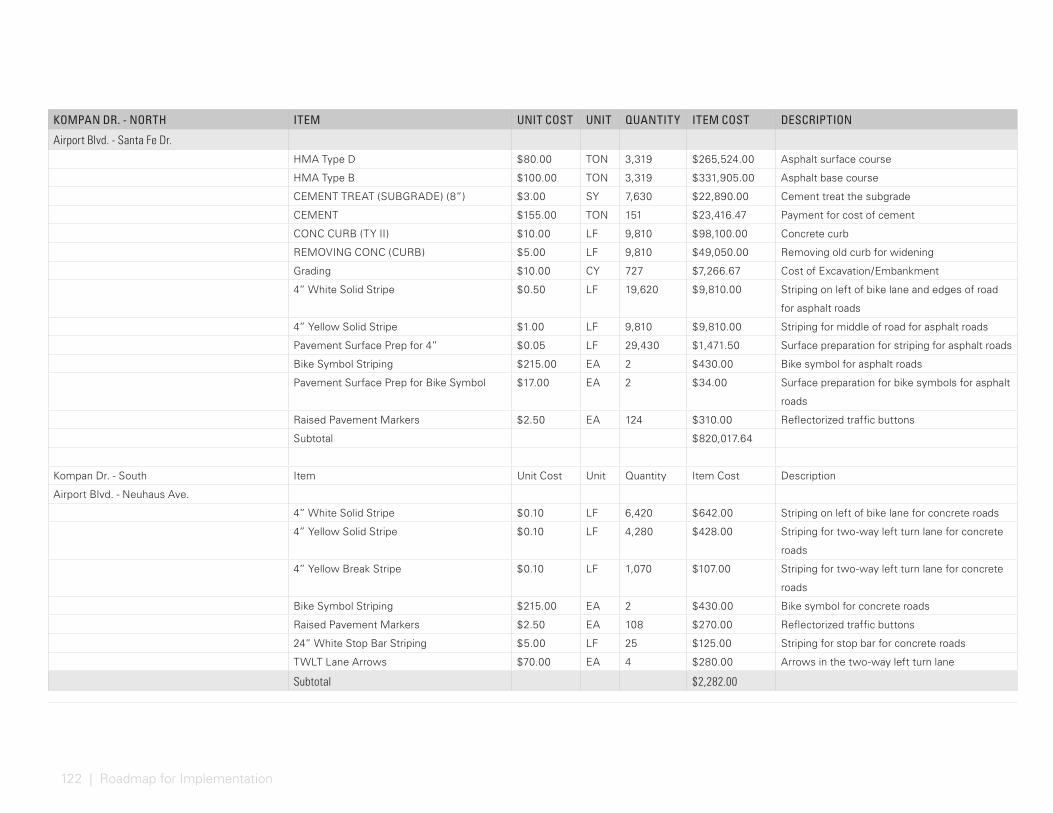
122 | Roadmap for Implementation
KOMPAN DR. - NORTH ITEM UNIT COST UNIT QUANTITY ITEM COST DESCRIPTION
Airport Blvd. - Santa Fe Dr.
HMA Type D $80.00 TON 3,319 $265,524.00 Asphalt surface course
HMA Type B $100.00 TON 3,319 $331,905.00 Asphalt base course
CEMENT TREAT (SUBGRADE) (8”) $3.00 SY 7,630 $22,890.00 Cement treat the subgrade
CEMENT $155.00 TON 151 $23,416.47 Payment for cost of cement
CONC CURB (TY II) $10.00 LF 9,810 $98,100.00 Concrete curb
REMOVING CONC (CURB) $5.00 LF 9,810 $49,050.00 Removing old curb for widening
Grading $10.00 CY 727 $7,266.67 Cost of Excavation/Embankment
4” White Solid Stripe $0.50 LF 19,620 $9,810.00 Striping on left of bike lane and edges of road
for asphalt roads
4” Yellow Solid Stripe $1.00 LF 9,810 $9,810.00 Striping for middle of road for asphalt roads
Pavement Surface Prep for 4” $0.05 LF 29,430 $1,471.50 Surface preparation for striping for asphalt roads
Bike Symbol Striping $215.00 EA 2 $430.00 Bike symbol for asphalt roads
Pavement Surface Prep for Bike Symbol $17.00 EA 2 $34.00 Surface preparation for bike symbols for asphalt
roads
Raised Pavement Markers $2.50 EA 124 $310.00 Reflectorized traffic buttons
Subtotal $820,017.64
Kompan Dr. - South Item Unit Cost Unit Quantity Item Cost Description
Airport Blvd. - Neuhaus Ave.
4” White Solid Stripe $0.10 LF 6,420 $642.00 Striping on left of bike lane for concrete roads
4” Yellow Solid Stripe $0.10 LF 4,280 $428.00 Striping for two-way left turn lane for concrete
roads
4” Yellow Break Stripe $0.10 LF 1,070 $107.00 Striping for two-way left turn lane for concrete
roads
Bike Symbol Striping $215.00 EA 2 $430.00 Bike symbol for concrete roads
Raised Pavement Markers $2.50 EA 108 $270.00 Reflectorized traffic buttons
24” White Stop Bar Striping $5.00 LF 25 $125.00 Striping for stop bar for concrete roads
TWLT Lane Arrows $70.00 EA 4 $280.00 Arrows in the two-way left turn lane
Subtotal $2,282.00
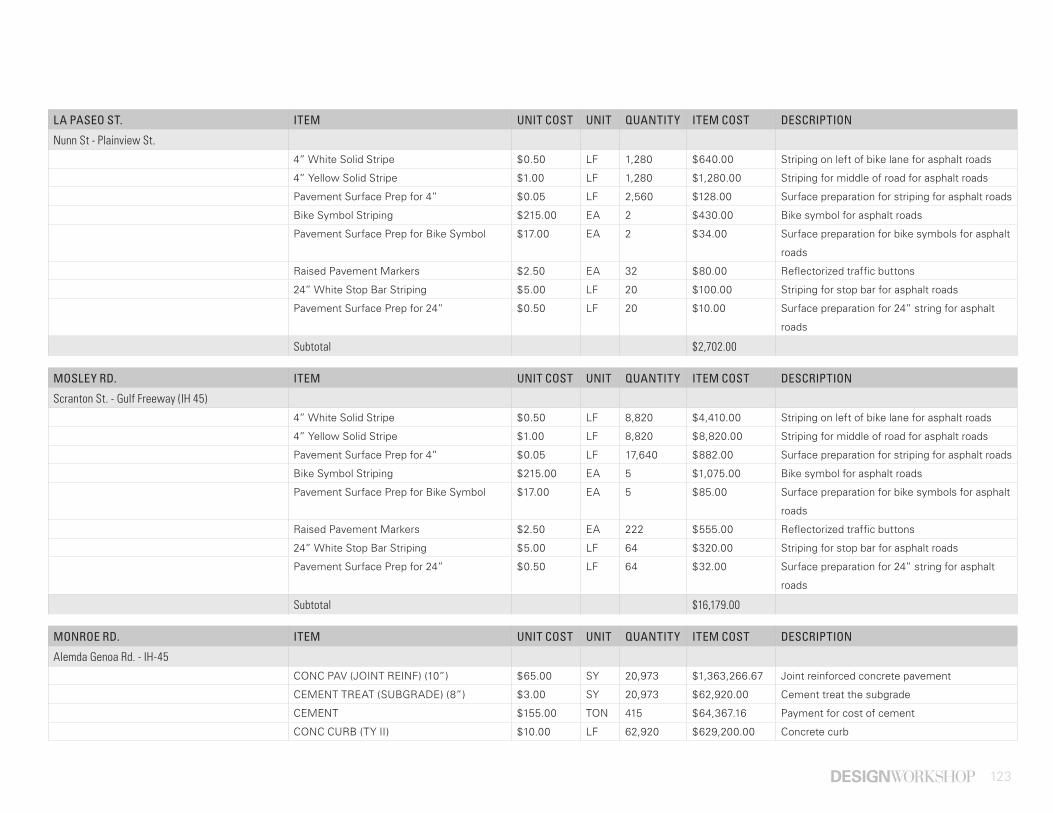
123
LA PASEO ST. ITEM UNIT COST UNIT QUANTITY ITEM COST DESCRIPTION
Nunn St - Plainview St.
4” White Solid Stripe $0.50 LF 1,280 $640.00 Striping on left of bike lane for asphalt roads
4” Yellow Solid Stripe $1.00 LF 1,280 $1,280.00 Striping for middle of road for asphalt roads
Pavement Surface Prep for 4” $0.05 LF 2,560 $128.00 Surface preparation for striping for asphalt roads
Bike Symbol Striping $215.00 EA 2 $430.00 Bike symbol for asphalt roads
Pavement Surface Prep for Bike Symbol $17.00 EA 2 $34.00 Surface preparation for bike symbols for asphalt
roads
Raised Pavement Markers $2.50 EA 32 $80.00 Reflectorized traffic buttons
24” White Stop Bar Striping $5.00 LF 20 $100.00 Striping for stop bar for asphalt roads
Pavement Surface Prep for 24” $0.50 LF 20 $10.00 Surface preparation for 24” string for asphalt
roads
Subtotal $2,702.00
MOSLEY RD. ITEM UNIT COST UNIT QUANTITY ITEM COST DESCRIPTION
Scranton St. - Gulf Freeway (IH 45)
4” White Solid Stripe $0.50 LF 8,820 $4,410.00 Striping on left of bike lane for asphalt roads
4” Yellow Solid Stripe $1.00 LF 8,820 $8,820.00 Striping for middle of road for asphalt roads
Pavement Surface Prep for 4” $0.05 LF 17,640 $882.00 Surface preparation for striping for asphalt roads
Bike Symbol Striping $215.00 EA 5 $1,075.00 Bike symbol for asphalt roads
Pavement Surface Prep for Bike Symbol $17.00 EA 5 $85.00 Surface preparation for bike symbols for asphalt
roads
Raised Pavement Markers $2.50 EA 222 $555.00 Reflectorized traffic buttons
24” White Stop Bar Striping $5.00 LF 64 $320.00 Striping for stop bar for asphalt roads
Pavement Surface Prep for 24” $0.50 LF 64 $32.00 Surface preparation for 24” string for asphalt
roads
Subtotal $16,179.00
MONROE RD. ITEM UNIT COST UNIT QUANTITY ITEM COST DESCRIPTION
Alemda Genoa Rd. - IH-45
CONC PAV (JOINT REINF) (10”) $65.00 SY 20,973 $1,363,266.67 Joint reinforced concrete pavement
CEMENT TREAT (SUBGRADE) (8”) $3.00 SY 20,973 $62,920.00 Cement treat the subgrade
CEMENT $155.00 TON 415 $64,367.16 Payment for cost of cement
CONC CURB (TY II) $10.00 LF 62,920 $629,200.00 Concrete curb
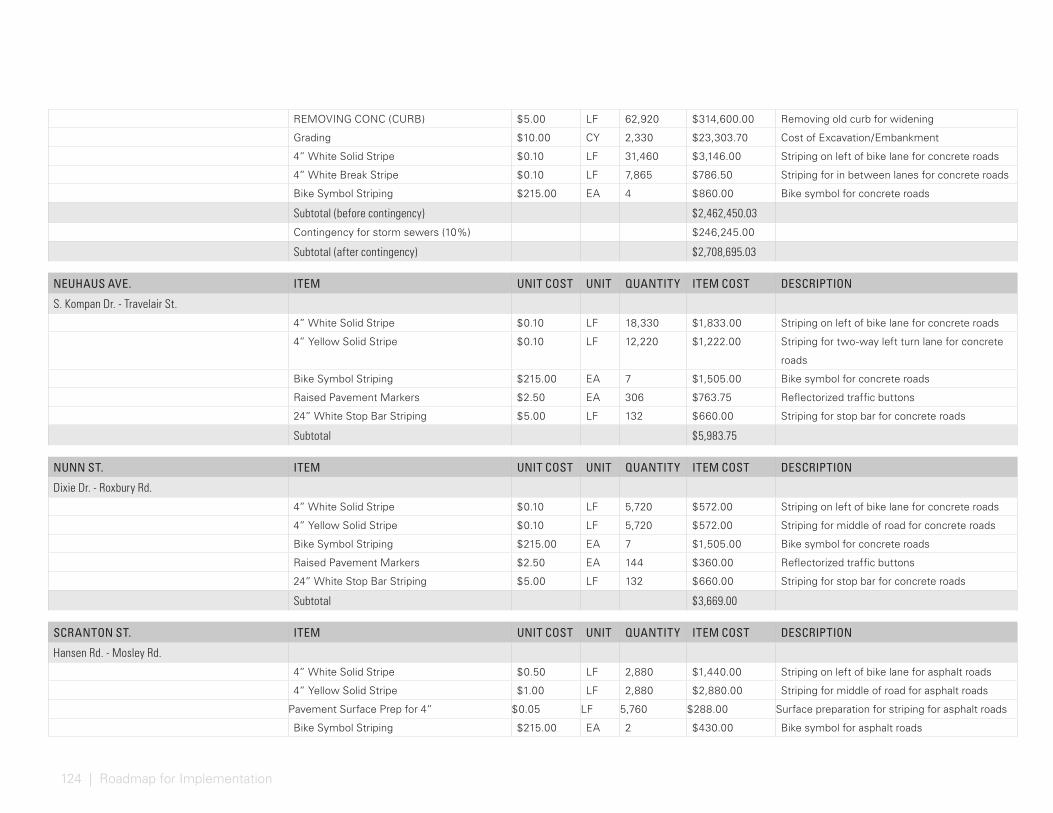
124 | Roadmap for Implementation
REMOVING CONC (CURB) $5.00 LF 62,920 $314,600.00 Removing old curb for widening
Grading $10.00 CY 2,330 $23,303.70 Cost of Excavation/Embankment
4” White Solid Stripe $0.10 LF 31,460 $3,146.00 Striping on left of bike lane for concrete roads
4” White Break Stripe $0.10 LF 7,865 $786.50 Striping for in between lanes for concrete roads
Bike Symbol Striping $215.00 EA 4 $860.00 Bike symbol for concrete roads
Subtotal (before contingency) $2,462,450.03
Contingency for storm sewers (10%) $246,245.00
Subtotal (after contingency) $2,708,695.03
NEUHAUS AVE. ITEM UNIT COST UNIT QUANTITY ITEM COST DESCRIPTION
S. Kompan Dr. - Travelair St.
4” White Solid Stripe $0.10 LF 18,330 $1,833.00 Striping on left of bike lane for concrete roads
4” Yellow Solid Stripe $0.10 LF 12,220 $1,222.00 Striping for two-way left turn lane for concrete
roads
Bike Symbol Striping $215.00 EA 7 $1,505.00 Bike symbol for concrete roads
Raised Pavement Markers $2.50 EA 306 $763.75 Reflectorized traffic buttons
24” White Stop Bar Striping $5.00 LF 132 $660.00 Striping for stop bar for concrete roads
Subtotal $5,983.75
NUNN ST. ITEM UNIT COST UNIT QUANTITY ITEM COST DESCRIPTION
Dixie Dr. - Roxbury Rd.
4” White Solid Stripe $0.10 LF 5,720 $572.00 Striping on left of bike lane for concrete roads
4” Yellow Solid Stripe $0.10 LF 5,720 $572.00 Striping for middle of road for concrete roads
Bike Symbol Striping $215.00 EA 7 $1,505.00 Bike symbol for concrete roads
Raised Pavement Markers $2.50 EA 144 $360.00 Reflectorized traffic buttons
24” White Stop Bar Striping $5.00 LF 132 $660.00 Striping for stop bar for concrete roads
Subtotal $3,669.00
SCRANTON ST. ITEM UNIT COST UNIT QUANTITY ITEM COST DESCRIPTION
Hansen Rd. - Mosley Rd.
4” White Solid Stripe $0.50 LF 2,880 $1,440.00 Striping on left of bike lane for asphalt roads
4” Yellow Solid Stripe $1.00 LF 2,880 $2,880.00 Striping for middle of road for asphalt roads
Pavement Surface Prep for 4” $0.05 LF 5,760 $288.00 Surface preparation for striping for asphalt roads
Bike Symbol Striping $215.00 EA 2 $430.00 Bike symbol for asphalt roads
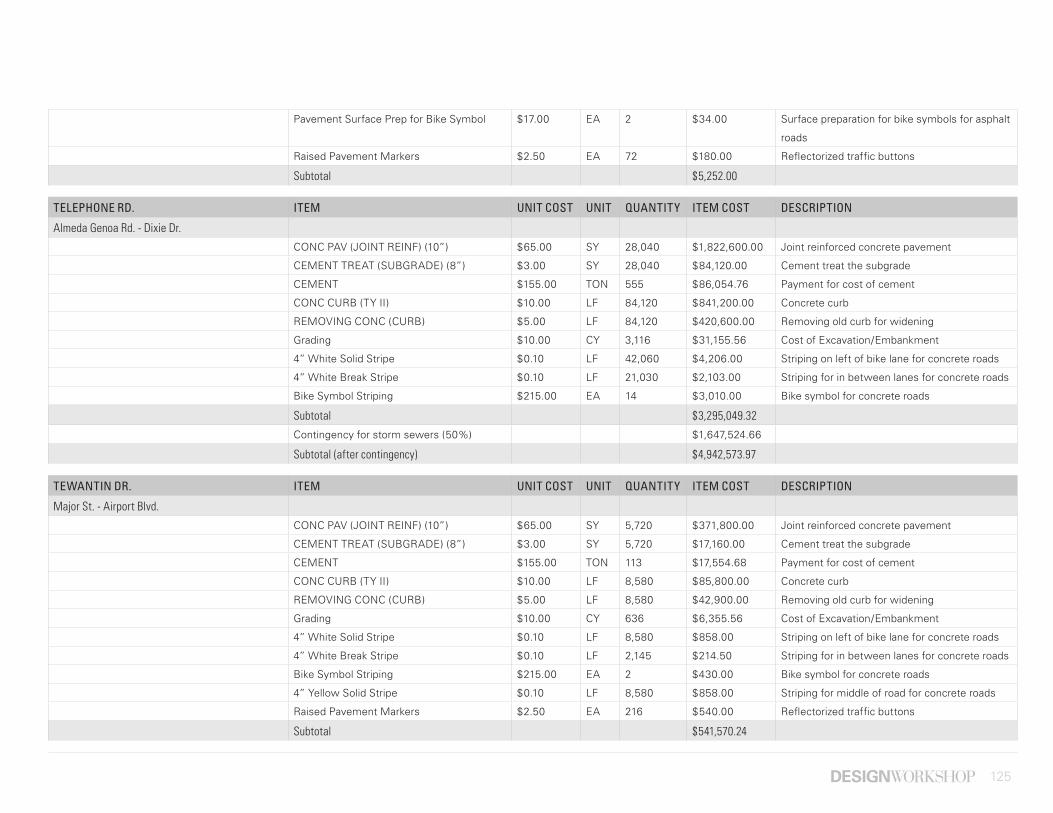
125
Pavement Surface Prep for Bike Symbol $17.00 EA 2 $34.00 Surface preparation for bike symbols for asphalt
roads
Raised Pavement Markers $2.50 EA 72 $180.00 Reflectorized traffic buttons
Subtotal $5,252.00
TELEPHONE RD. ITEM UNIT COST UNIT QUANTITY ITEM COST DESCRIPTION
Almeda Genoa Rd. - Dixie Dr.
CONC PAV (JOINT REINF) (10”) $65.00 SY 28,040 $1,822,600.00 Joint reinforced concrete pavement
CEMENT TREAT (SUBGRADE) (8”) $3.00 SY 28,040 $84,120.00 Cement treat the subgrade
CEMENT $155.00 TON 555 $86,054.76 Payment for cost of cement
CONC CURB (TY II) $10.00 LF 84,120 $841,200.00 Concrete curb
REMOVING CONC (CURB) $5.00 LF 84,120 $420,600.00 Removing old curb for widening
Grading $10.00 CY 3,116 $31,155.56 Cost of Excavation/Embankment
4” White Solid Stripe $0.10 LF 42,060 $4,206.00 Striping on left of bike lane for concrete roads
4” White Break Stripe $0.10 LF 21,030 $2,103.00 Striping for in between lanes for concrete roads
Bike Symbol Striping $215.00 EA 14 $3,010.00 Bike symbol for concrete roads
Subtotal $3,295,049.32
Contingency for storm sewers (50%) $1,647,524.66
Subtotal (after contingency) $4,942,573.97
TEWANTIN DR. ITEM UNIT COST UNIT QUANTITY ITEM COST DESCRIPTION
Major St. - Airport Blvd.
CONC PAV (JOINT REINF) (10”) $65.00 SY 5,720 $371,800.00 Joint reinforced concrete pavement
CEMENT TREAT (SUBGRADE) (8”) $3.00 SY 5,720 $17,160.00 Cement treat the subgrade
CEMENT $155.00 TON 113 $17,554.68 Payment for cost of cement
CONC CURB (TY II) $10.00 LF 8,580 $85,800.00 Concrete curb
REMOVING CONC (CURB) $5.00 LF 8,580 $42,900.00 Removing old curb for widening
Grading $10.00 CY 636 $6,355.56 Cost of Excavation/Embankment
4” White Solid Stripe $0.10 LF 8,580 $858.00 Striping on left of bike lane for concrete roads
4” White Break Stripe $0.10 LF 2,145 $214.50 Striping for in between lanes for concrete roads
Bike Symbol Striping $215.00 EA 2 $430.00 Bike symbol for concrete roads
4” Yellow Solid Stripe $0.10 LF 8,580 $858.00 Striping for middle of road for concrete roads
Raised Pavement Markers $2.50 EA 216 $540.00 Reflectorized traffic buttons
Subtotal $541,570.24
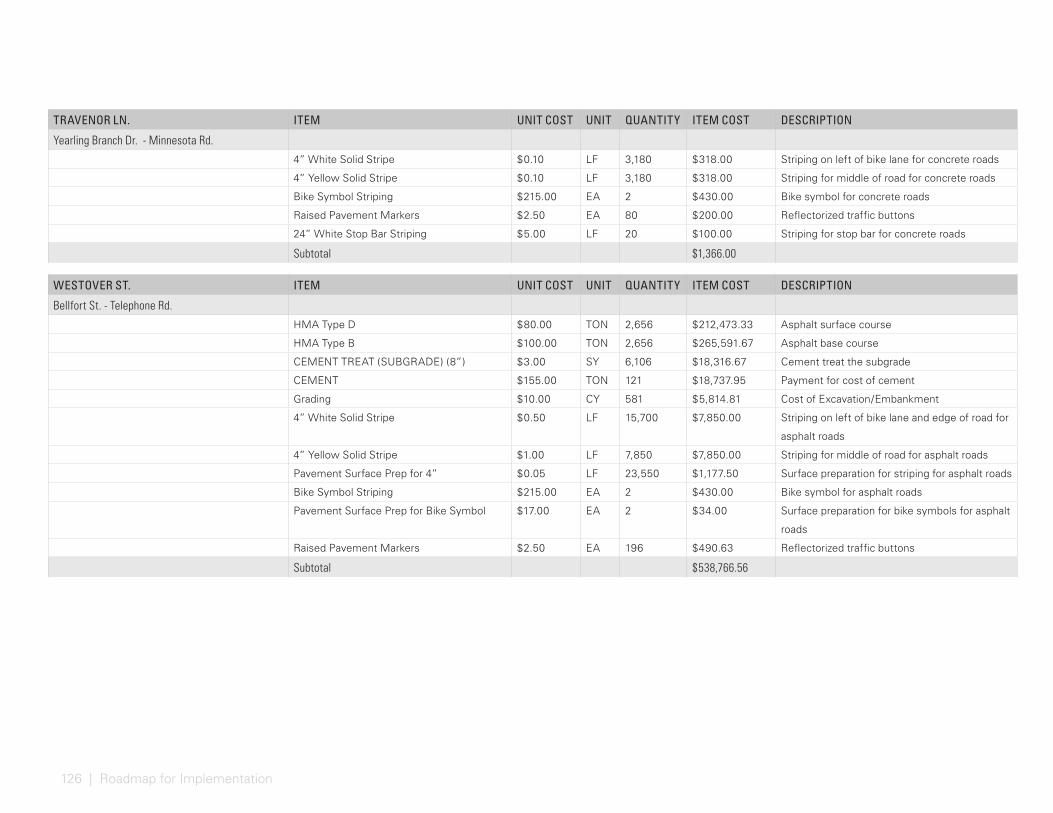
126 | Roadmap for Implementation
TRAVENOR LN. ITEM UNIT COST UNIT QUANTITY ITEM COST DESCRIPTION
Yearling Branch Dr. - Minnesota Rd.
4” White Solid Stripe $0.10 LF 3,180 $318.00 Striping on left of bike lane for concrete roads
4” Yellow Solid Stripe $0.10 LF 3,180 $318.00 Striping for middle of road for concrete roads
Bike Symbol Striping $215.00 EA 2 $430.00 Bike symbol for concrete roads
Raised Pavement Markers $2.50 EA 80 $200.00 Reflectorized traffic buttons
24” White Stop Bar Striping $5.00 LF 20 $100.00 Striping for stop bar for concrete roads
Subtotal $1,366.00
WESTOVER ST. ITEM UNIT COST UNIT QUANTITY ITEM COST DESCRIPTION
Bellfort St. - Telephone Rd.
HMA Type D $80.00 TON 2,656 $212,473.33 Asphalt surface course
HMA Type B $100.00 TON 2,656 $265,591.67 Asphalt base course
CEMENT TREAT (SUBGRADE) (8”) $3.00 SY 6,106 $18,316.67 Cement treat the subgrade
CEMENT $155.00 TON 121 $18,737.95 Payment for cost of cement
Grading $10.00 CY 581 $5,814.81 Cost of Excavation/Embankment
4” White Solid Stripe $0.50 LF 15,700 $7,850.00 Striping on left of bike lane and edge of road for
asphalt roads
4” Yellow Solid Stripe $1.00 LF 7,850 $7,850.00 Striping for middle of road for asphalt roads
Pavement Surface Prep for 4” $0.05 LF 23,550 $1,177.50 Surface preparation for striping for asphalt roads
Bike Symbol Striping $215.00 EA 2 $430.00 Bike symbol for asphalt roads
Pavement Surface Prep for Bike Symbol $17.00 EA 2 $34.00 Surface preparation for bike symbols for asphalt
roads
Raised Pavement Markers $2.50 EA 196 $490.63 Reflectorized traffic buttons
Subtotal $538,766.56
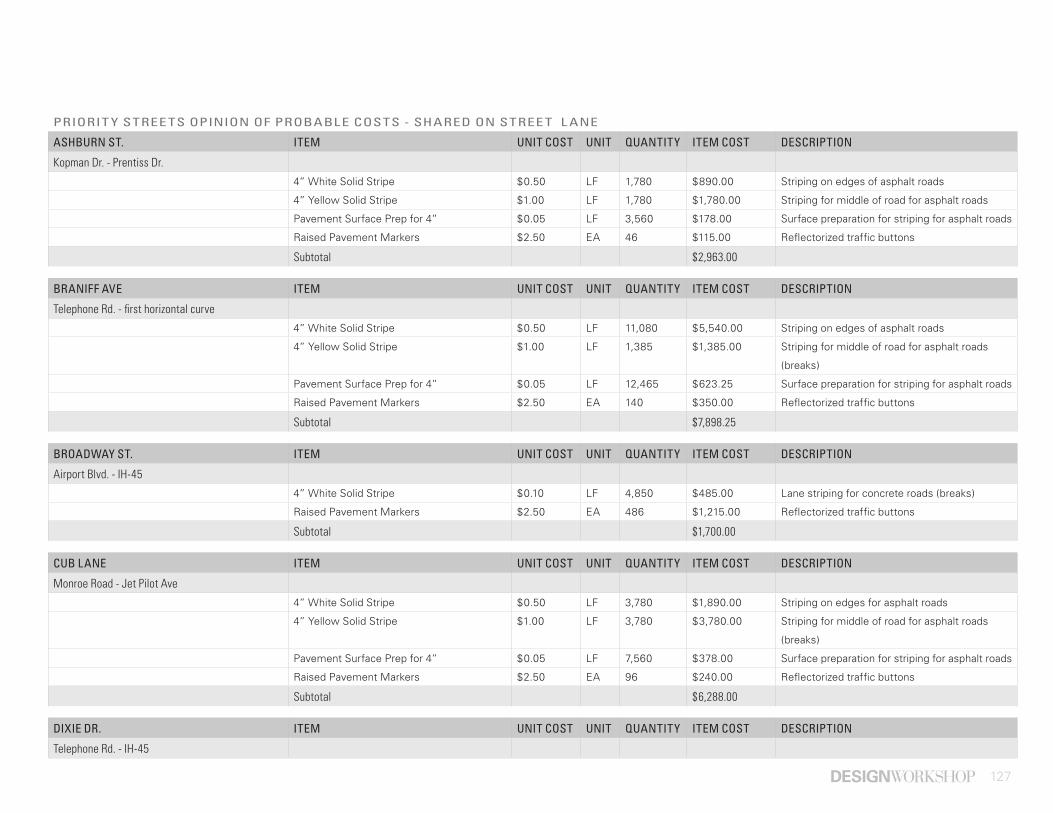
127
PRIORIT Y STREE TS OPINION OF PROBABLE COSTS - SHARED ON STREE T L ANE
ASHBURN ST. ITEM UNIT COST UNIT QUANTITY ITEM COST DESCRIPTION
Kopman Dr. - Prentiss Dr.
4” White Solid Stripe $0.50 LF 1,780 $890.00 Striping on edges of asphalt roads
4” Yellow Solid Stripe $1.00 LF 1,780 $1,780.00 Striping for middle of road for asphalt roads
Pavement Surface Prep for 4” $0.05 LF 3,560 $178.00 Surface preparation for striping for asphalt roads
Raised Pavement Markers $2.50 EA 46 $115.00 Reflectorized traffic buttons
Subtotal $2,963.00
BRANIFF AVE ITEM UNIT COST UNIT QUANTITY ITEM COST DESCRIPTION
Telephone Rd. - first horizontal curve
4” White Solid Stripe $0.50 LF 11,080 $5,540.00 Striping on edges of asphalt roads
4” Yellow Solid Stripe $1.00 LF 1,385 $1,385.00 Striping for middle of road for asphalt roads
(breaks)
Pavement Surface Prep for 4” $0.05 LF 12,465 $623.25 Surface preparation for striping for asphalt roads
Raised Pavement Markers $2.50 EA 140 $350.00 Reflectorized traffic buttons
Subtotal $7,898.25
BROADWAY ST. ITEM UNIT COST UNIT QUANTITY ITEM COST DESCRIPTION
Airport Blvd. - IH-45
4” White Solid Stripe $0.10 LF 4,850 $485.00 Lane striping for concrete roads (breaks)
Raised Pavement Markers $2.50 EA 486 $1,215.00 Reflectorized traffic buttons
Subtotal $1,700.00
CUB LANE ITEM UNIT COST UNIT QUANTITY ITEM COST DESCRIPTION
Monroe Road - Jet Pilot Ave
4” White Solid Stripe $0.50 LF 3,780 $1,890.00 Striping on edges for asphalt roads
4” Yellow Solid Stripe $1.00 LF 3,780 $3,780.00 Striping for middle of road for asphalt roads
(breaks)
Pavement Surface Prep for 4” $0.05 LF 7,560 $378.00 Surface preparation for striping for asphalt roads
Raised Pavement Markers $2.50 EA 96 $240.00 Reflectorized traffic buttons
Subtotal $6,288.00
DIXIE DR. ITEM UNIT COST UNIT QUANTITY ITEM COST DESCRIPTION
Telephone Rd. - IH-45

128 | Roadmap for Implementation
4” White Solid Stripe $0.50 LF 5,950 $2,975.00 Striping on edges of asphalt roads
4” Yellow Solid Stripe $1.00 LF 5,950 $5,950.00 Striping for middle of road for asphalt roads
(breaks)
Pavement Surface Prep for 4” $0.05 LF 11,900 $595.00 Surface preparation for striping for asphalt roads
Raised Pavement Markers $2.50 EA 148 $370.00 Reflectorized traffic buttons
Subtotal $9,890.00
EASTHAVEN BLVD. ITEM UNIT COST UNIT QUANTITY ITEM COST DESCRIPTION
Scranton St. - Meldrum St.
4” White Solid Stripe $0.50 LF 6,500 $3,250.00 Striping on edges for asphalt roads
4” Yellow Solid Stripe $1.00 LF 6,500 $6,500.00 Striping for middle of road for asphalt roads
Pavement Surface Prep for 4” $0.05 LF 13,000 $650.00 Surface preparation for striping for asphalt roads
Raised Pavement Markers $2.50 EA 164 $410.00 Reflectorized traffic buttons
Subtotal $10,810.00
DROUET ST. ITEM UNIT COST UNIT QUANTITY ITEM COST DESCRIPTION
Telephone Rd. - Hollygrove Dr.
4” Yellow Solid Stripe $1.00 LF 1,800 $1,800.00 Striping for middle of road for asphalt roads
(breaks)
Pavement Surface Prep for 4” $0.05 LF 1,800 $90.00 Surface preparation for striping for asphalt roads
Raised Pavement Markers $2.50 EA 46 $115.00 Reflectorized traffic buttons
Subtotal $2,005.00
FAUNA ST ITEM UNIT COST UNIT QUANTITY ITEM COST DESCRIPTION
Prentiss Dr. - Airport Blvd.
4” White Solid Stripe $0.50 LF 3,900 $1,950.00 Striping on edges of asphalt roads
4” Yellow Solid Stripe $1.00 LF 3,900 $3,900.00 Striping for middle of road for asphalt roads
Pavement Surface Prep for 4” $0.05 LF 7,800 $390.00 Surface preparation for striping for asphalt roads
Raised Pavement Markers $2.50 EA 98 $245.00 Reflectorized traffic buttons
Subtotal $6,485.00
GLEN VALLEY DR. ITEM UNIT COST UNIT QUANTITY ITEM COST DESCRIPTION
Morley St. - Glen Dell Ct.
4” Yellow Solid Stripe $0.10 LF 12,220 $1,222.00 Striping for middle of road for concrete roads
Raised Pavement Markers $2.50 EA 306 $765.00 Reflectorized traffic buttons
Subtotal $1,987.00

129
GLENVISTA ST. ITEM UNIT COST UNIT QUANTITY ITEM COST DESCRIPTION
Stone St. - Monroe Blvd.
4” Yellow Solid Stripe $0.10 LF 1,080 $108.00 Striping for middle of road for concrete roads
Raised Pavement Markers $2.50 EA 28 $70.00 Reflectorized traffic buttons
Subtotal $178.00
LA PASEO ST. ITEM UNIT COST UNIT QUANTITY ITEM COST DESCRIPTION
Plainview St. - Telephone Rd.
4” Yellow Solid Stripe $1.00 LF 10,500 $10,500.00 Striping for middle of road for asphalt roads
Pavement Surface Prep for 4” $0.05 LF 10,500 $525.00 Surface preparation for striping for asphalt roads
Raised Pavement Markers $2.50 EA 264 $660.00 Reflectorized traffic buttons
Subtotal $11,685.00
MELDRUM LN. (EASTERN PORTION) ITEM UNIT COST UNIT QUANTITY ITEM COST DESCRIPTION
Monroe Rd. - first curve
4” White Solid Stripe $0.50 LF 4,220 $2,110.00 Striping on edges of asphalt roads
4” Yellow Solid Stripe $1.00 LF 4,220 $4,220.00 Striping for middle of road for asphalt roads
Pavement Surface Prep for 4” $0.05 LF 8,440 $422.00 Surface preparation for striping for asphalt roads
Raised Pavement Markers $2.50 EA 106 $265.00 Reflectorized traffic buttons
Subtotal $7,017.00
MELDRUM LN. (WESTERN PORTION) ITEM UNIT COST UNIT QUANTITY ITEM COST DESCRIPTION
Dexter Blvd. - Clearwood St.
4” White Solid Stripe $0.50 LF 4,000 $2,000.00 Striping on edges of asphalt roads
4” Yellow Solid Stripe $1.00 LF 4,000 $4,000.00 Striping for middle of road for asphalt roads
Pavement Surface Prep for 4” $0.05 LF 8,000 $400.00 Surface preparation for striping for asphalt roads
Raised Pavement Markers $2.50 EA 100 $250.00 Reflectorized traffic buttons
Subtotal $6,650.00
MINNESOTA ST. ITEM UNIT COST UNIT QUANTITY ITEM COST DESCRIPTION
Southern portion of Minnesota from north of
Tavenor Ln. - Almeda Genoa Rd.
4” White Solid Stripe $0.50 LF 3,540 $1,770.00 Striping on edges of asphalt roads
4” Yellow Solid Stripe $1.00 LF 3,540 $3,540.00 Striping for middle of road for asphalt roads
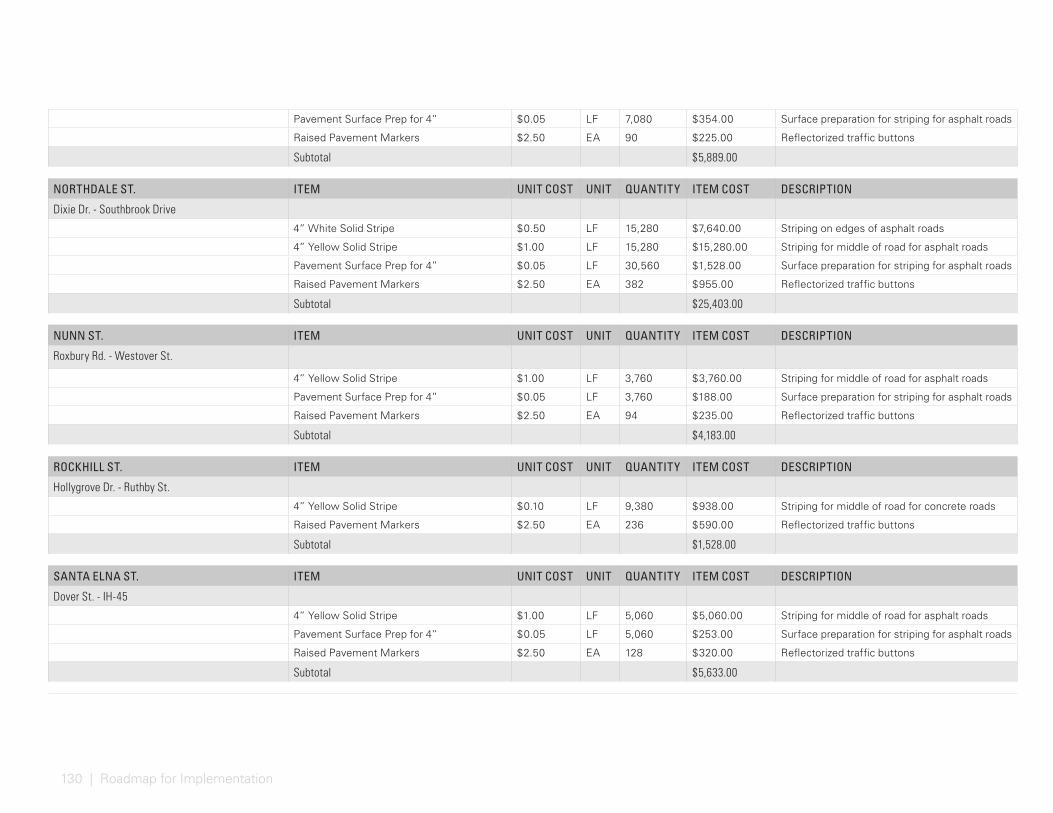
130 | Roadmap for Implementation
Pavement Surface Prep for 4” $0.05 LF 7,080 $354.00 Surface preparation for striping for asphalt roads
Raised Pavement Markers $2.50 EA 90 $225.00 Reflectorized traffic buttons
Subtotal $5,889.00
NORTHDALE ST. ITEM UNIT COST UNIT QUANTITY ITEM COST DESCRIPTION
Dixie Dr. - Southbrook Drive
4” White Solid Stripe $0.50 LF 15,280 $7,640.00 Striping on edges of asphalt roads
4” Yellow Solid Stripe $1.00 LF 15,280 $15,280.00 Striping for middle of road for asphalt roads
Pavement Surface Prep for 4” $0.05 LF 30,560 $1,528.00 Surface preparation for striping for asphalt roads
Raised Pavement Markers $2.50 EA 382 $955.00 Reflectorized traffic buttons
Subtotal $25,403.00
NUNN ST. ITEM UNIT COST UNIT QUANTITY ITEM COST DESCRIPTION
Roxbury Rd. - Westover St.
4” Yellow Solid Stripe $1.00 LF 3,760 $3,760.00 Striping for middle of road for asphalt roads
Pavement Surface Prep for 4” $0.05 LF 3,760 $188.00 Surface preparation for striping for asphalt roads
Raised Pavement Markers $2.50 EA 94 $235.00 Reflectorized traffic buttons
Subtotal $4,183.00
ROCKHILL ST. ITEM UNIT COST UNIT QUANTITY ITEM COST DESCRIPTION
Hollygrove Dr. - Ruthby St.
4” Yellow Solid Stripe $0.10 LF 9,380 $938.00 Striping for middle of road for concrete roads
Raised Pavement Markers $2.50 EA 236 $590.00 Reflectorized traffic buttons
Subtotal $1,528.00
SANTA ELNA ST. ITEM UNIT COST UNIT QUANTITY ITEM COST DESCRIPTION
Dover St. - IH-45
4” Yellow Solid Stripe $1.00 LF 5,060 $5,060.00 Striping for middle of road for asphalt roads
Pavement Surface Prep for 4” $0.05 LF 5,060 $253.00 Surface preparation for striping for asphalt roads
Raised Pavement Markers $2.50 EA 128 $320.00 Reflectorized traffic buttons
Subtotal $5,633.00

131
SANTA FE DR. ITEM UNIT COST UNIT QUANTITY ITEM COST DESCRIPTION
Airport Blvd. - Telephone Rd.
4” White Solid Stripe $0.50 LF 24,740 $12,370.00 Striping on edges of asphalt roads
4” Yellow Solid Stripe $1.00 LF 24,740 $24,740.00 Striping for middle of road for asphalt roads
Pavement Surface Prep for 4” $0.05 LF 49,480 $2,474.00 Surface preparation for striping for asphalt roads
Raised Pavement Markers $2.50 EA 620 $1,550.00 Reflectorized traffic buttons
Subtotal $41,134.00
SCRANTON ST. ITEM UNIT COST UNIT QUANTITY ITEM COST DESCRIPTION
Monroe Rd. - Hansen Rd
4” Yellow Solid Stripe $1.00 LF 4,200 $4,200.00 Striping for middle of road for asphalt roads
Pavement Surface Prep for 4” $0.05 LF 4,200 $210.00 Surface preparation for striping for asphalt roads
Raised Pavement Markers $2.50 EA 106 $265.00 Reflectorized traffic buttons
Subtotal $4,675.00
SCRANTON ST. ITEM UNIT COST UNIT QUANTITY ITEM COST DESCRIPTION
Mosely Rd. - Easthaven Blvd.
4” Yellow Solid Stripe $1.00 LF 2,910 $2,910.00 Striping for middle of road for asphalt roads
Pavement Surface Prep for 4” $0.05 LF 2,910 $145.50 Surface preparation for striping for asphalt roads
Raised Pavement Markers $2.50 EA 74 $185.00 Reflectorized traffic buttons
Subtotal $3,240.50
STONE RD. ITEM UNIT COST UNIT QUANTITY ITEM COST DESCRIPTION
Bellfrot St. - Mattby St.
4” Yellow Solid Stripe $0.10 LF 2,100 $210.00 Striping for middle of road for concrete roads
Raised Pavement Markers $2.50 EA 54 $135.00 Reflectorized traffic buttons
Subtotal $345.00
STONE RD. ITEM UNIT COST UNIT QUANTITY ITEM COST DESCRIPTION
Mattby St. - Glenvista St.
4” Yellow Solid Stripe $0.10 LF 2,780 $278.00 Striping for middle of road for concrete roads
Raised Pavement Markers $2.50 EA 70 $175.00 Reflectorized traffic buttons
Subtotal $453.00
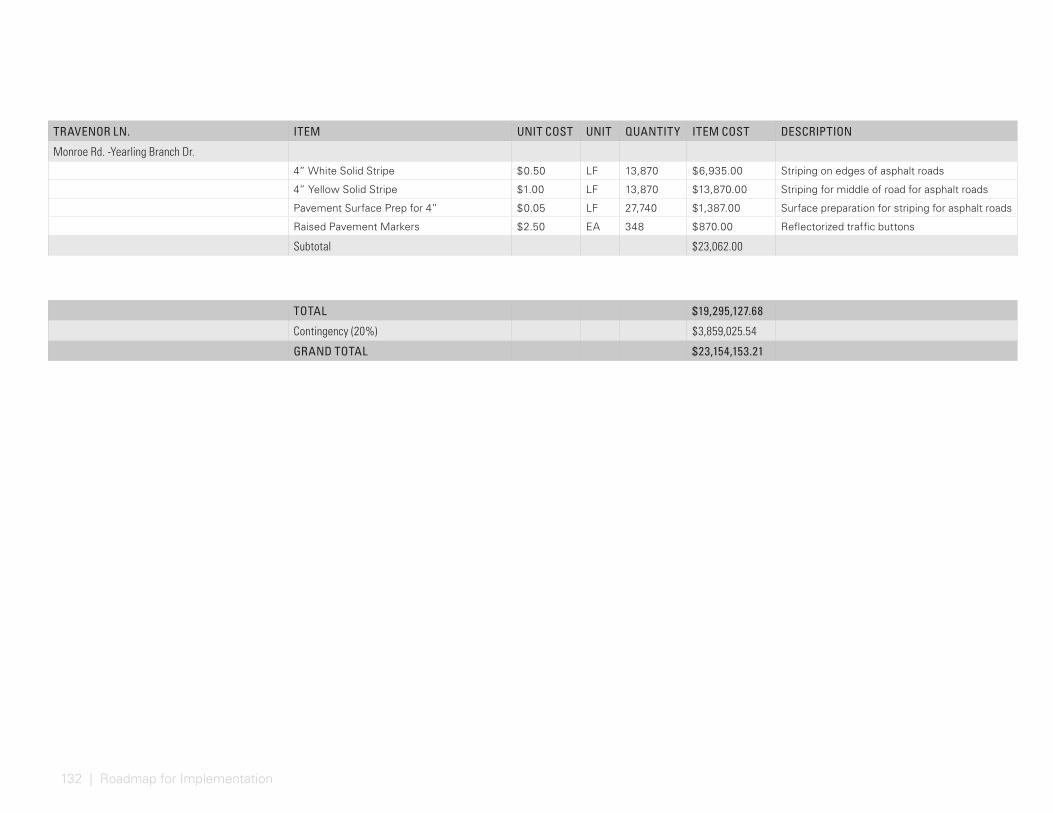
132 | Roadmap for Implementation
TRAVENOR LN. ITEM UNIT COST UNIT QUANTITY ITEM COST DESCRIPTION
Monroe Rd. -Yearling Branch Dr.
4” White Solid Stripe $0.50 LF 13,870 $6,935.00 Striping on edges of asphalt roads
4” Yellow Solid Stripe $1.00 LF 13,870 $13,870.00 Striping for middle of road for asphalt roads
Pavement Surface Prep for 4” $0.05 LF 27,740 $1,387.00 Surface preparation for striping for asphalt roads
Raised Pavement Markers $2.50 EA 348 $870.00 Reflectorized traffic buttons
Subtotal $23,062.00
TOTAL $19,295,127.68
Contingency (20%) $3,859,025.54
GRAND TOTAL $23,154,153.21

133
PAGE INTENTIONALLY LEF T BL ANK

134 | Roadmap for Implementation
BAYOU ENTR ANCES
Increasing access points along the Sims Bayou trail system improves connections between this recreational resource and the surrounding neighborhoods (See Figure 36: Open Space Vision on page 55). Visible public access points should be located at the intersection of Bellfort Street and Telephone Road and Bellfort Street and Broadway. Neighborhood access points should be inserted in between major entrances at the termination of stub streets and cul-de-sacs to promote “eyes on the bayou”. More trail entrances increase accessibility to this valuable recreational amenity and improve safety by eliminating long sections of trail that are physically or visually isolated from public roadways. Bayou entrances should incorporate clear wayfinding signage and iconic landscaping which highlights entrances from the street. Entrance treatments should stay consistent throughout the Hobby Area to develop a cohesive identity.
ACTION STEPS
• Coordinate with City of Houston to achieve recommendations of the Houston Bike Plan
• Identify potential location(s)
• Budget for funding
• Acquire necessary land for access
• Hire team to design and engineer improvements
• Coordinate with utility providers and governmental entities
• Obtain permits for construction
• Complete construction documents
• Issue bid for improvements
• Select contractor
• Commence construction
• Complete construction
• Plan for operations and maintenance
• Coordinate maintenance agreements
FUNDING SOURCES
• Tax Increment Reinvestment Zone (TIRZ) Funding
• Hobby Area Management District Funding
• Grant Funding
• Texas Parks and Wildlife Department National Recreational Trails Fund [http://tpwd.texas.gov/business/grants/recreation-grants/recreational-trails-grants]. Funds can be spent on motorized or non-motorized recreational trail projects, construction of new recreational trails, to improve existing trails, to develop trailheads or trailside facilities and to acquire trail corridors.
• Community Trees Grant Program [http://www.h-gac.com/community/enhancement-grants/community-trees-grants.aspx ] provides matching funds to purchase trees for community-based plantings in parks, public gathering places and community gateways.
COMMUNIT Y PARTNERS
• Tax Increment Reinvestment Zone #8 (Gulfgate TIRZ)
• Hobby Area Management District
• City of Houston
GOAL S ACHIE VED* :
L IVABIL IT Y PRINCIPL ES* * :
*SEE “PROJEC T GOA L S” ON PAGE 5 .
* *AS DEFINED BY U.S. DEPA R T MENT OF HOUSING AND URBAN DE V ELOPMENT ( HUD) .
1 65432
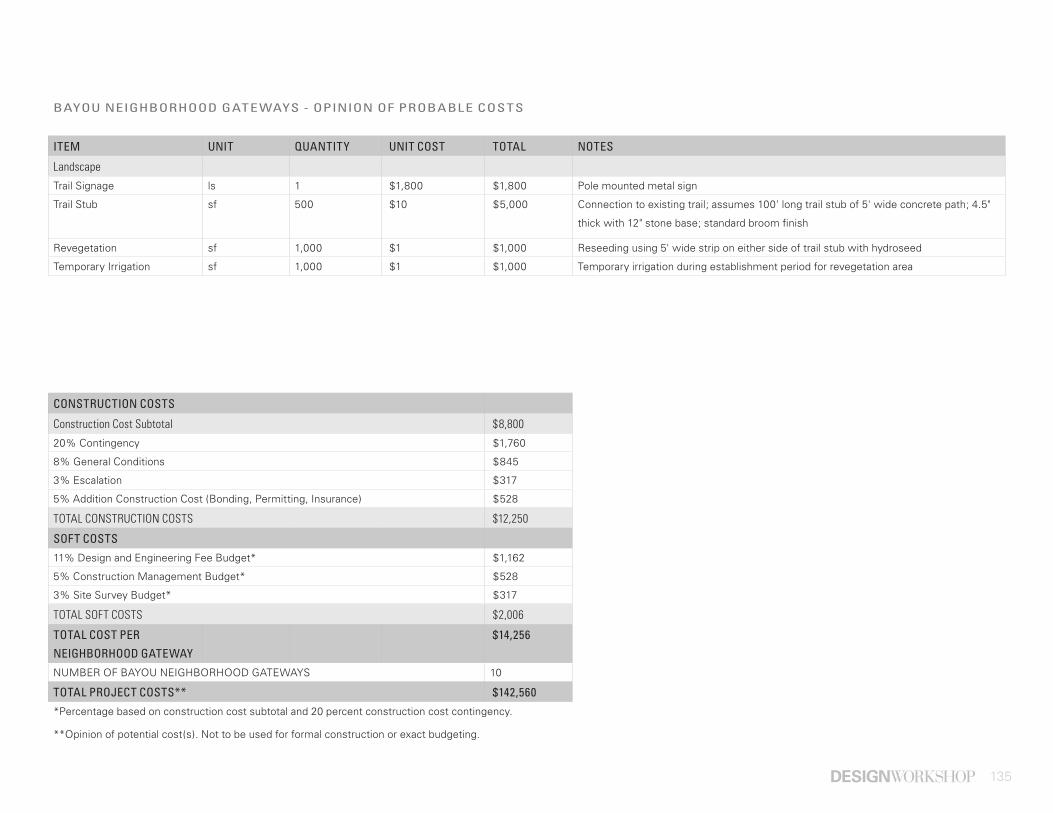
135
BAYOU NEIGHBORHOOD GATE WAYS - OPINION OF PROBABLE COSTS
ITEM UNIT QUANTITY UNIT COST TOTAL NOTES
Landscape
Trail Signage ls 1 $1,800 $1,800 Pole mounted metal sign
Trail Stub sf 500 $10 $5,000 Connection to existing trail; assumes 100' long trail stub of 5' wide concrete path; 4.5"
thick with 12" stone base; standard broom finish
Revegetation sf 1,000 $1 $1,000 Reseeding using 5' wide strip on either side of trail stub with hydroseed
Temporary Irrigation sf 1,000 $1 $1,000 Temporary irrigation during establishment period for revegetation area
CONSTRUCTION COSTS
Construction Cost Subtotal $8,800
20% Contingency $1,760
8% General Conditions $845
3% Escalation $317
5% Addition Construction Cost (Bonding, Permitting, Insurance) $528
TOTAL CONSTRUCTION COSTS $12,250
SOFT COSTS
11% Design and Engineering Fee Budget* $1,162
5% Construction Management Budget* $528
3% Site Survey Budget* $317
TOTAL SOFT COSTS $2,006
TOTAL COST PER
NEIGHBORHOOD GATEWAY
$14,256
NUMBER OF BAYOU NEIGHBORHOOD GATEWAYS 10
TOTAL PROJECT COSTS** $142,560
*Percentage based on construction cost subtotal and 20 percent construction cost contingency.
**Opinion of potential cost(s). Not to be used for formal construction or exact budgeting.
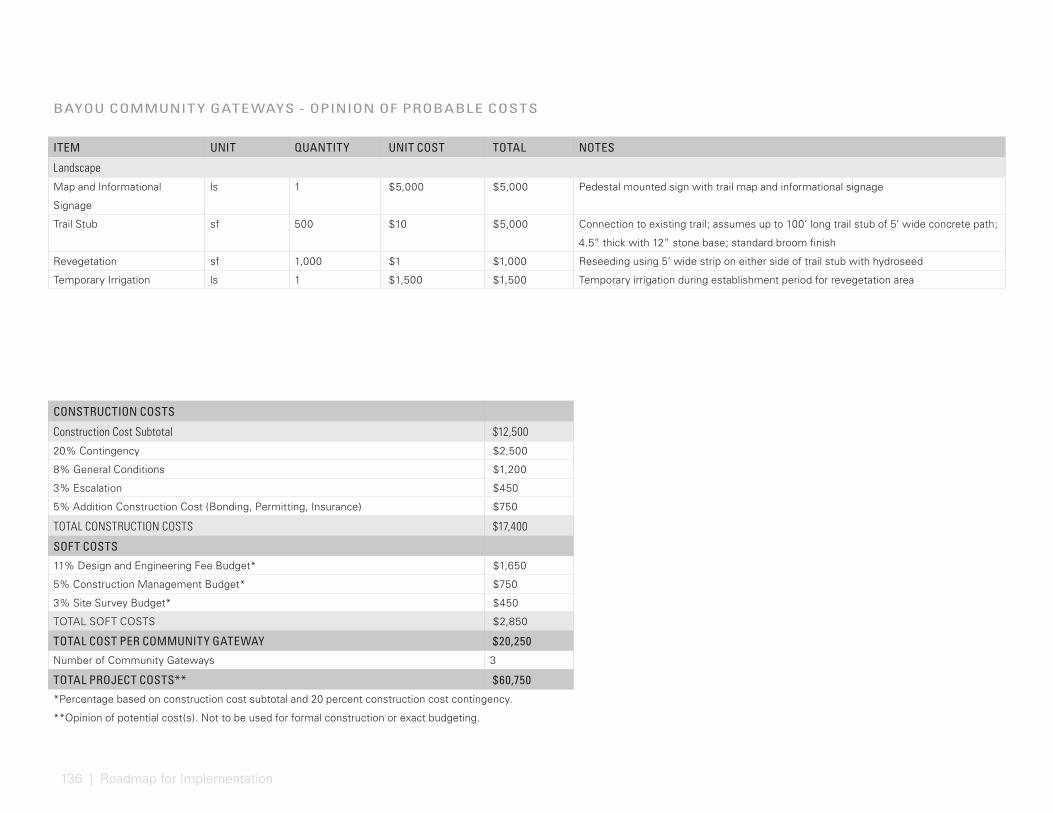
136 | Roadmap for Implementation
BAYOU COMMUNIT Y GATE WAYS - OPINION OF PROBABLE COSTS
ITEM UNIT QUANTITY UNIT COST TOTAL NOTES
Landscape
Map and Informational
Signage
ls 1 $5,000 $5,000 Pedestal mounted sign with trail map and informational signage
Trail Stub sf 500 $10 $5,000 Connection to existing trail; assumes up to 100’ long trail stub of 5’ wide concrete path;
4.5” thick with 12” stone base; standard broom finish
Revegetation sf 1,000 $1 $1,000 Reseeding using 5’ wide strip on either side of trail stub with hydroseed
Temporary Irrigation ls 1 $1,500 $1,500 Temporary irrigation during establishment period for revegetation area
CONSTRUCTION COSTS
Construction Cost Subtotal $12,500
20% Contingency $2,500
8% General Conditions $1,200
3% Escalation $450
5% Addition Construction Cost (Bonding, Permitting, Insurance) $750
TOTAL CONSTRUCTION COSTS $17,400
SOFT COSTS
11% Design and Engineering Fee Budget* $1,650
5% Construction Management Budget* $750
3% Site Survey Budget* $450
TOTAL SOFT COSTS $2,850
TOTAL COST PER COMMUNITY GATEWAY $20,250
Number of Community Gateways 3
TOTAL PROJECT COSTS** $60,750
*Percentage based on construction cost subtotal and 20 percent construction cost contingency.
**Opinion of potential cost(s). Not to be used for formal construction or exact budgeting.
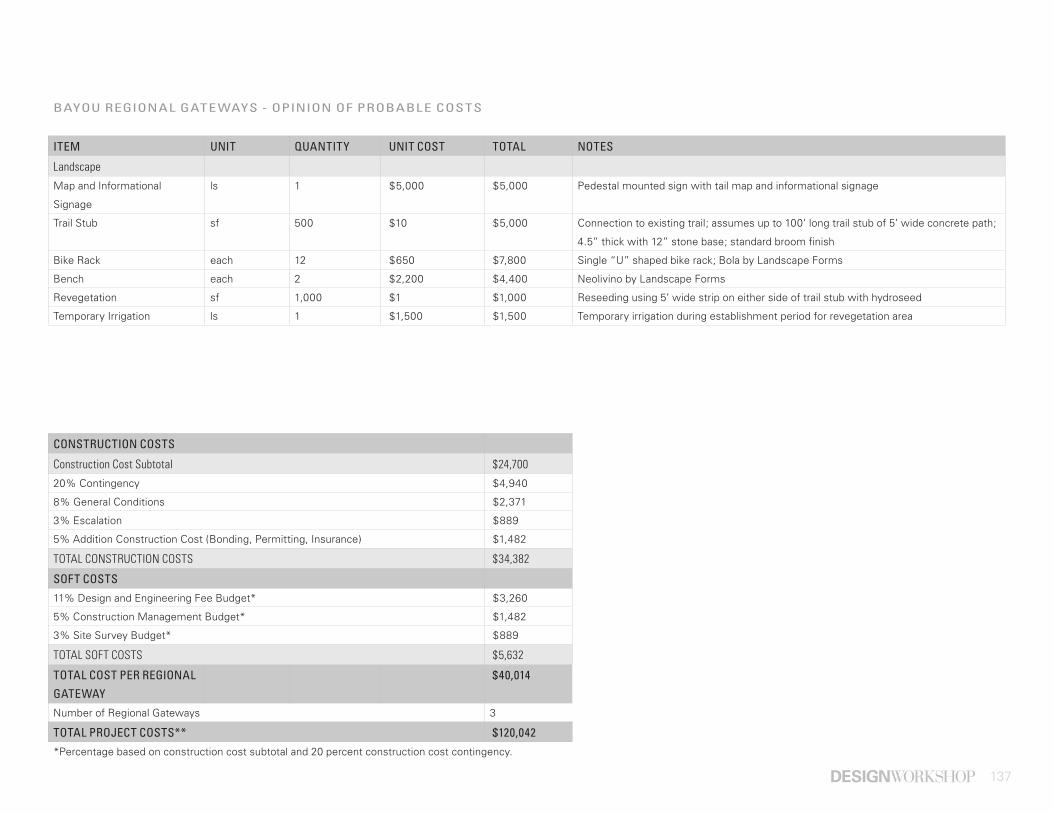
137
BAYOU REGIONAL GATE WAYS - OPINION OF PROBABLE COSTS
ITEM UNIT QUANTITY UNIT COST TOTAL NOTES
Landscape
Map and Informational
Signage
ls 1 $5,000 $5,000 Pedestal mounted sign with tail map and informational signage
Trail Stub sf 500 $10 $5,000 Connection to existing trail; assumes up to 100’ long trail stub of 5’ wide concrete path;
4.5” thick with 12” stone base; standard broom finish
Bike Rack each 12 $650 $7,800 Single “U” shaped bike rack; Bola by Landscape Forms
Bench each 2 $2,200 $4,400 Neolivino by Landscape Forms
Revegetation sf 1,000 $1 $1,000 Reseeding using 5’ wide strip on either side of trail stub with hydroseed
Temporary Irrigation ls 1 $1,500 $1,500 Temporary irrigation during establishment period for revegetation area
CONSTRUCTION COSTS
Construction Cost Subtotal $24,700
20% Contingency $4,940
8% General Conditions $2,371
3% Escalation $889
5% Addition Construction Cost (Bonding, Permitting, Insurance) $1,482
TOTAL CONSTRUCTION COSTS $34,382
SOFT COSTS
11% Design and Engineering Fee Budget* $3,260
5% Construction Management Budget* $1,482
3% Site Survey Budget* $889
TOTAL SOFT COSTS $5,632
TOTAL COST PER REGIONAL
GATEWAY
$40,014
Number of Regional Gateways 3
TOTAL PROJECT COSTS** $120,042
*Percentage based on construction cost subtotal and 20 percent construction cost contingency.

138 | Roadmap for Implementation
19 4 0 AIRPORT TERMINAL MUSEUM PL A Z A PARK
The iconic 1940 Air Terminal Museum has expressed interest in a public space to direct groups of visitors. A new plaza and landscape could celebrate the building’s grandeur while providing a high quality outdoor space for both nearby residents and visitors to congregate for staging purposes, casual picnic lunches and community events.
ACTION STEPS
• Coordinate with the City of Houston, property owners and the Airport Terminal Museum
• Budget for funding
• Hire team to design and engineer improvements
• Coordinate with utility providers and governmental entities
• Obtain permits for construction
• Complete construction documents
• Issue bid for improvements
• Select contractor
• Commence construction
• Complete construction
• Plan for operations and maintenance
• Coordinate maintenance agreements
GOAL S ACHIE VED* :
L IVABIL IT Y PRINCIPL ES* * :
*SEE “PROJEC T GOA L S” ON PAGE 5 .
* *AS DEFINED BY U.S. DEPA R T MENT OF HOUSING AND URBAN DE V ELOPMENT ( HUD) .
1 65432
FUNDING SOURCES
• Tax Increment Reinvestment Zone (TIRZ) Funding
• Hobby Area Management District Funding
• Grant Funding
• Private Funding
COMMUNIT Y PARTNERS
• Tax Increment Reinvestment Zone #8 (Gulfgate TIRZ)
• Hobby Area Management District
• City of Houston (Planning and Development Department)
• City of Houston (Public Works and Engineering Department)
• City of Houston (Parking Management)
• Private Landowners
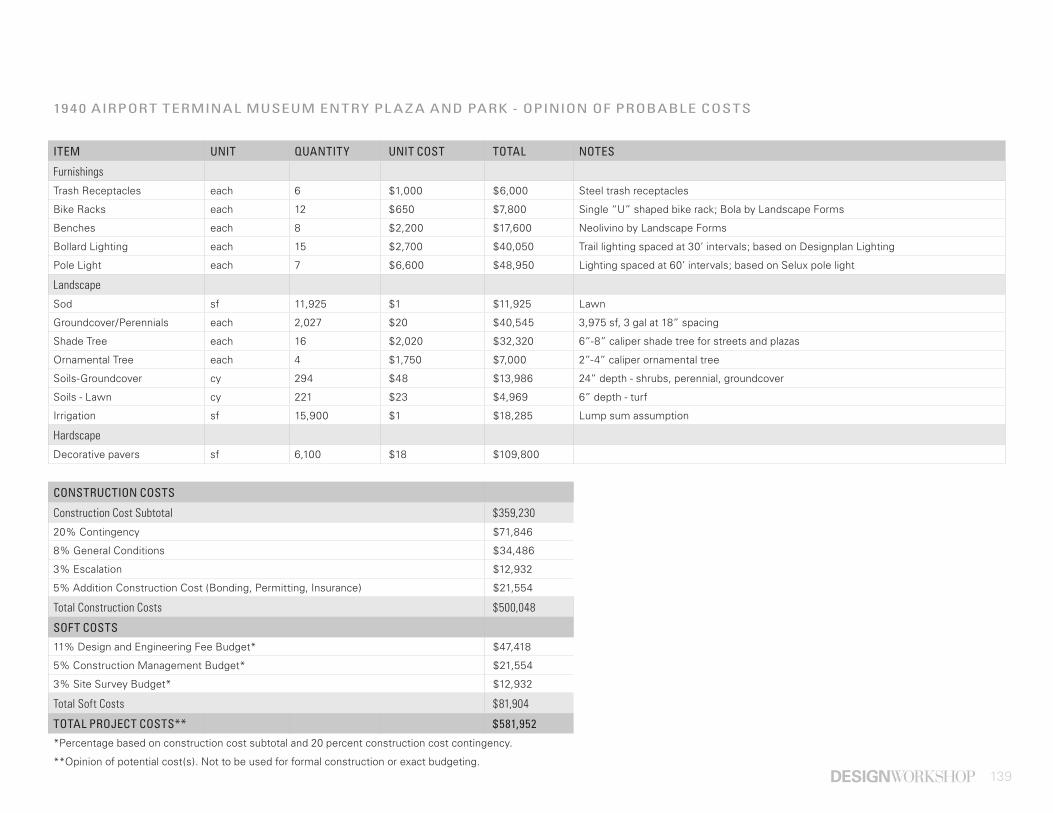
139
194 0 AIRPORT TERMINAL MUSEUM ENTRY PL A Z A AND PARK - OPINION OF PROBABLE COSTS
ITEM UNIT QUANTITY UNIT COST TOTAL NOTES
Furnishings
Trash Receptacles each 6 $1,000 $6,000 Steel trash receptacles
Bike Racks each 12 $650 $7,800 Single “U” shaped bike rack; Bola by Landscape Forms
Benches each 8 $2,200 $17,600 Neolivino by Landscape Forms
Bollard Lighting each 15 $2,700 $40,050 Trail lighting spaced at 30’ intervals; based on Designplan Lighting
Pole Light each 7 $6,600 $48,950 Lighting spaced at 60’ intervals; based on Selux pole light
Landscape
Sod sf 11,925 $1 $11,925 Lawn
Groundcover/Perennials each 2,027 $20 $40,545 3,975 sf, 3 gal at 18” spacing
Shade Tree each 16 $2,020 $32,320 6”-8” caliper shade tree for streets and plazas
Ornamental Tree each 4 $1,750 $7,000 2”-4” caliper ornamental tree
Soils-Groundcover cy 294 $48 $13,986 24” depth - shrubs, perennial, groundcover
Soils - Lawn cy 221 $23 $4,969 6” depth - turf
Irrigation sf 15,900 $1 $18,285 Lump sum assumption
Hardscape
Decorative pavers sf 6,100 $18 $109,800
CONSTRUCTION COSTS
Construction Cost Subtotal $359,230
20% Contingency $71,846
8% General Conditions $34,486
3% Escalation $12,932
5% Addition Construction Cost (Bonding, Permitting, Insurance) $21,554
Total Construction Costs $500,048
SOFT COSTS
11% Design and Engineering Fee Budget* $47,418
5% Construction Management Budget* $21,554
3% Site Survey Budget* $12,932
Total Soft Costs $81,904
TOTAL PROJECT COSTS** $581,952
*Percentage based on construction cost subtotal and 20 percent construction cost contingency.
**Opinion of potential cost(s). Not to be used for formal construction or exact budgeting.
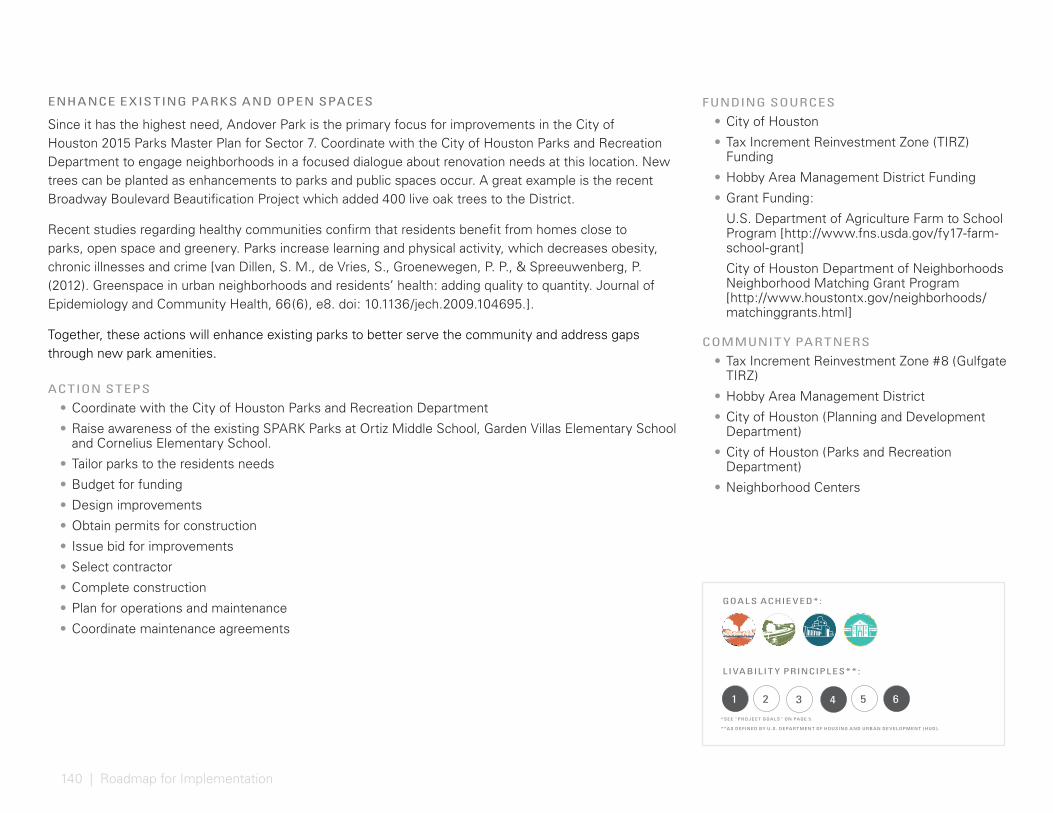
140 | Roadmap for Implementation
ENHANCE E XISTING PARKS AND OPEN SPACES
Since it has the highest need, Andover Park is the primary focus for improvements in the City of Houston 2015 Parks Master Plan for Sector 7. Coordinate with the City of Houston Parks and Recreation Department to engage neighborhoods in a focused dialogue about renovation needs at this location. New trees can be planted as enhancements to parks and public spaces occur. A great example is the recent Broadway Boulevard Beautification Project which added 400 live oak trees to the District.
Recent studies regarding healthy communities confirm that residents benefit from homes close to parks, open space and greenery. Parks increase learning and physical activity, which decreases obesity, chronic illnesses and crime [van Dillen, S. M., de Vries, S., Groenewegen, P. P., & Spreeuwenberg, P. (2012). Greenspace in urban neighborhoods and residents’ health: adding quality to quantity. Journal of Epidemiology and Community Health, 66(6), e8. doi: 10.1136/jech.2009.104695.].
Together, these actions will enhance existing parks to better serve the community and address gaps through new park amenities.
ACTION STEPS
• Coordinate with the City of Houston Parks and Recreation Department
• Raise awareness of the existing SPARK Parks at Ortiz Middle School, Garden Villas Elementary School and Cornelius Elementary School.
• Tailor parks to the residents needs
• Budget for funding
• Design improvements
• Obtain permits for construction
• Issue bid for improvements
• Select contractor
• Complete construction
• Plan for operations and maintenance
• Coordinate maintenance agreements
FUNDING SOURCES
• City of Houston
• Tax Increment Reinvestment Zone (TIRZ) Funding
• Hobby Area Management District Funding
• Grant Funding:
U.S. Department of Agriculture Farm to School Program [http://www.fns.usda.gov/fy17-farm-school-grant]
City of Houston Department of Neighborhoods Neighborhood Matching Grant Program [http://www.houstontx.gov/neighborhoods/matchinggrants.html]
COMMUNIT Y PARTNERS
• Tax Increment Reinvestment Zone #8 (Gulfgate TIRZ)
• Hobby Area Management District
• City of Houston (Planning and Development Department)
• City of Houston (Parks and Recreation Department)
• Neighborhood Centers
GOAL S ACHIE VED* :
L IVABIL IT Y PRINCIPL ES* * :
*SEE “PROJEC T GOA L S” ON PAGE 5 .
* *AS DEFINED BY U.S. DEPA R T MENT OF HOUSING AND URBAN DE V ELOPMENT ( HUD) .
1 2 3 4 5 6
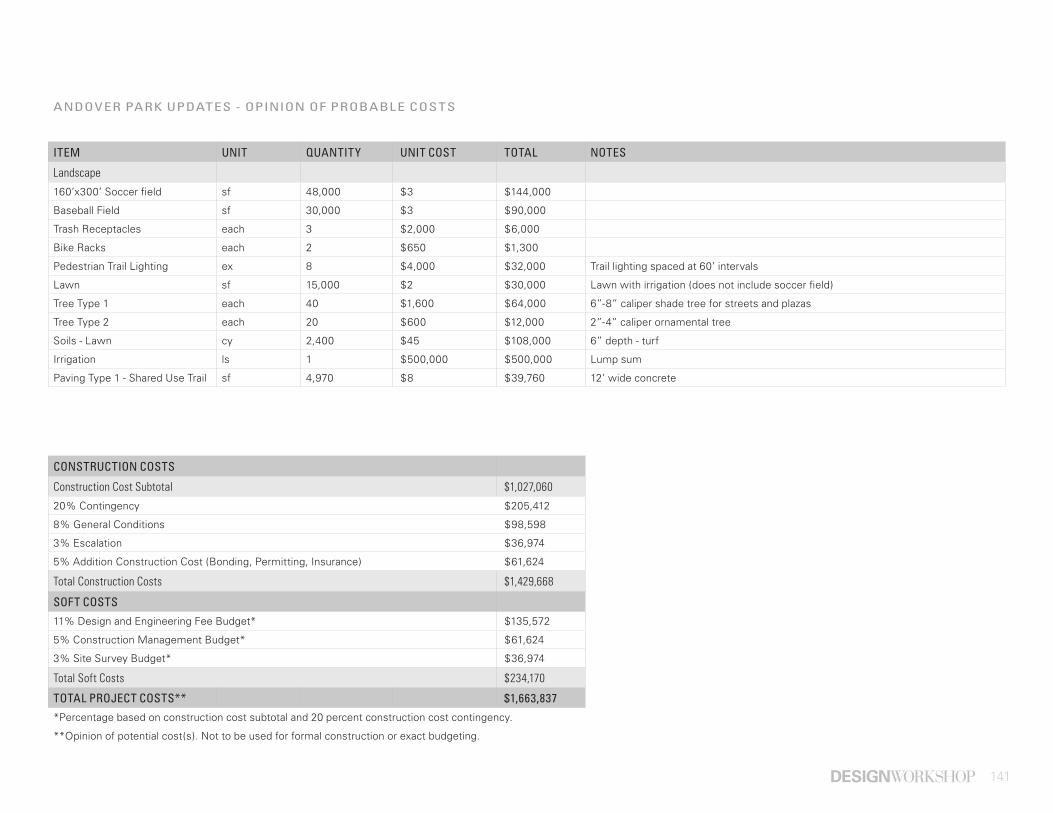
141
ANDOVER PARK UPDATES - OPINION OF PROBABLE COSTS
ITEM UNIT QUANTITY UNIT COST TOTAL NOTES
Landscape
160’x300’ Soccer field sf 48,000 $3 $144,000
Baseball Field sf 30,000 $3 $90,000
Trash Receptacles each 3 $2,000 $6,000
Bike Racks each 2 $650 $1,300
Pedestrian Trail Lighting ex 8 $4,000 $32,000 Trail lighting spaced at 60’ intervals
Lawn sf 15,000 $2 $30,000 Lawn with irrigation (does not include soccer field)
Tree Type 1 each 40 $1,600 $64,000 6”-8” caliper shade tree for streets and plazas
Tree Type 2 each 20 $600 $12,000 2”-4” caliper ornamental tree
Soils - Lawn cy 2,400 $45 $108,000 6” depth - turf
Irrigation ls 1 $500,000 $500,000 Lump sum
Paving Type 1 - Shared Use Trail sf 4,970 $8 $39,760 12’ wide concrete
CONSTRUCTION COSTS
Construction Cost Subtotal $1,027,060
20% Contingency $205,412
8% General Conditions $98,598
3% Escalation $36,974
5% Addition Construction Cost (Bonding, Permitting, Insurance) $61,624
Total Construction Costs $1,429,668
SOFT COSTS
11% Design and Engineering Fee Budget* $135,572
5% Construction Management Budget* $61,624
3% Site Survey Budget* $36,974
Total Soft Costs $234,170
TOTAL PROJECT COSTS** $1,663,837
*Percentage based on construction cost subtotal and 20 percent construction cost contingency.
**Opinion of potential cost(s). Not to be used for formal construction or exact budgeting.
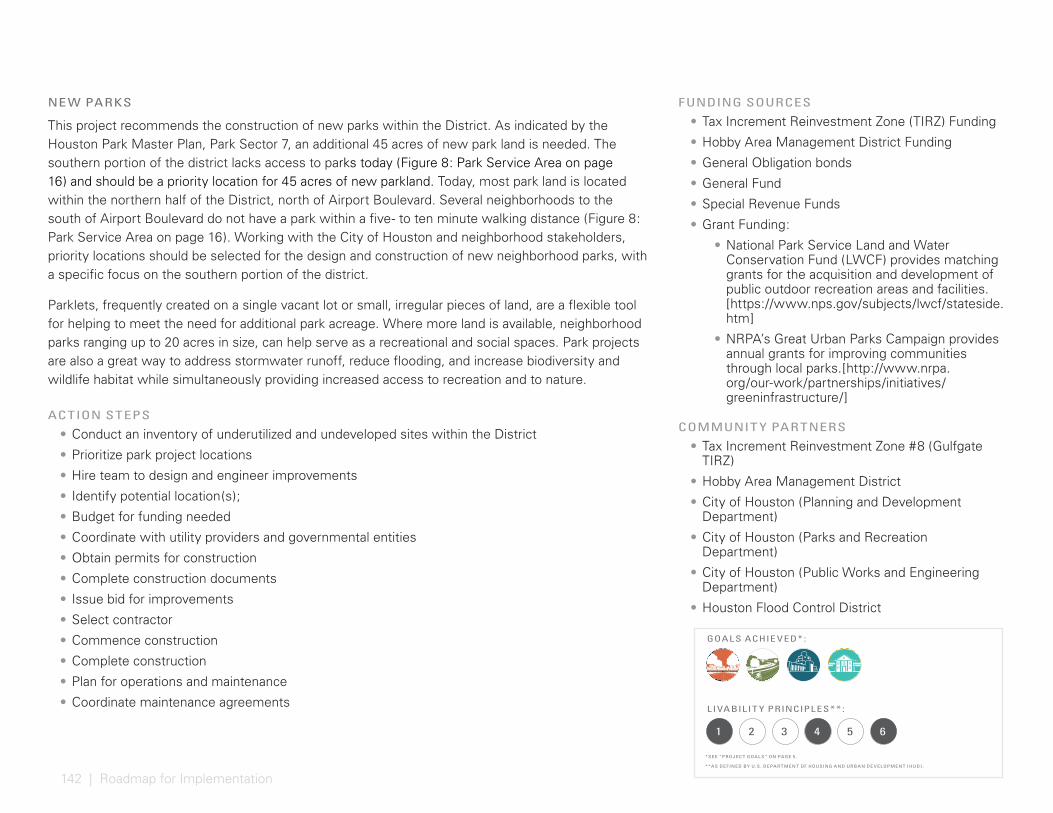
142 | Roadmap for Implementation
NE W PARKS
This project recommends the construction of new parks within the District. As indicated by the Houston Park Master Plan, Park Sector 7, an additional 45 acres of new park land is needed. The southern portion of the district lacks access to parks today (Figure 8: Park Service Area on page 16) and should be a priority location for 45 acres of new parkland. Today, most park land is located within the northern half of the District, north of Airport Boulevard. Several neighborhoods to the south of Airport Boulevard do not have a park within a five- to ten minute walking distance (Figure 8: Park Service Area on page 16). Working with the City of Houston and neighborhood stakeholders, priority locations should be selected for the design and construction of new neighborhood parks, with a specific focus on the southern portion of the district.
Parklets, frequently created on a single vacant lot or small, irregular pieces of land, are a flexible tool for helping to meet the need for additional park acreage. Where more land is available, neighborhood parks ranging up to 20 acres in size, can help serve as a recreational and social spaces. Park projects are also a great way to address stormwater runoff, reduce flooding, and increase biodiversity and wildlife habitat while simultaneously providing increased access to recreation and to nature.
ACTION STEPS
• Conduct an inventory of underutilized and undeveloped sites within the District
• Prioritize park project locations
• Hire team to design and engineer improvements
• Identify potential location(s);
• Budget for funding needed
• Coordinate with utility providers and governmental entities
• Obtain permits for construction
• Complete construction documents
• Issue bid for improvements
• Select contractor
• Commence construction
• Complete construction
• Plan for operations and maintenance
• Coordinate maintenance agreements
FUNDING SOURCES
• Tax Increment Reinvestment Zone (TIRZ) Funding
• Hobby Area Management District Funding
• General Obligation bonds
• General Fund
• Special Revenue Funds
• Grant Funding:
• National Park Service Land and Water Conservation Fund (LWCF) provides matching grants for the acquisition and development of public outdoor recreation areas and facilities. [https://www.nps.gov/subjects/lwcf/stateside.htm]
• NRPA’s Great Urban Parks Campaign provides annual grants for improving communities through local parks.[http://www.nrpa.org/our-work/partnerships/initiatives/greeninfrastructure/]
COMMUNIT Y PARTNERS
• Tax Increment Reinvestment Zone #8 (Gulfgate TIRZ)
• Hobby Area Management District
• City of Houston (Planning and Development Department)
• City of Houston (Parks and Recreation Department)
• City of Houston (Public Works and Engineering Department)
• Houston Flood Control District
GOAL S ACHIE VED* :
L IVABIL IT Y PRINCIPL ES* * :
*SEE “PROJEC T GOA L S” ON PAGE 5 .
* *AS DEFINED BY U.S. DEPA R T MENT OF HOUSING AND URBAN DE V ELOPMENT ( HUD) .
1 65432
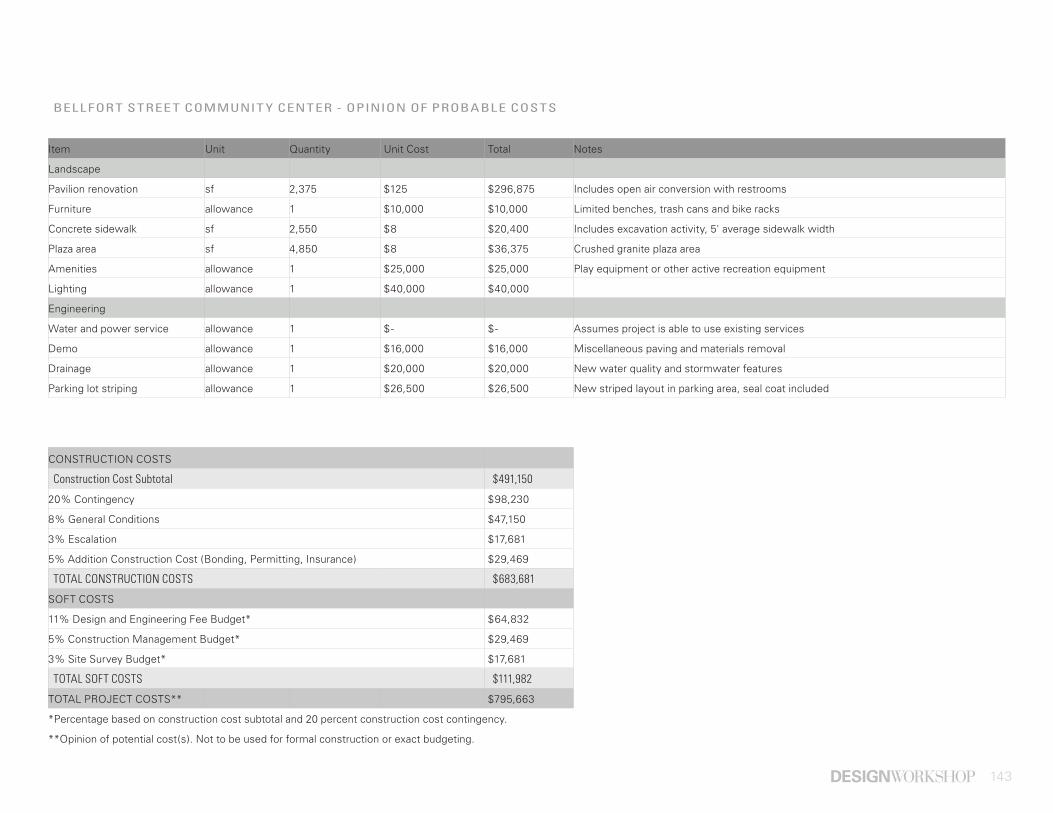
143
BELLFORT STREE T COMMUNIT Y CENTER - OPINION OF PROBABLE COSTS
Item Unit Quantity Unit Cost Total Notes
Landscape
Pavilion renovation sf 2,375 $125 $296,875 Includes open air conversion with restrooms
Furniture allowance 1 $10,000 $10,000 Limited benches, trash cans and bike racks
Concrete sidewalk sf 2,550 $8 $20,400 Includes excavation activity, 5' average sidewalk width
Plaza area sf 4,850 $8 $36,375 Crushed granite plaza area
Amenities allowance 1 $25,000 $25,000 Play equipment or other active recreation equipment
Lighting allowance 1 $40,000 $40,000
Engineering
Water and power service allowance 1 $- $ - Assumes project is able to use existing services
Demo allowance 1 $16,000 $16,000 Miscellaneous paving and materials removal
Drainage allowance 1 $20,000 $20,000 New water quality and stormwater features
Parking lot striping allowance 1 $26,500 $26,500 New striped layout in parking area, seal coat included
CONSTRUCTION COSTS
Construction Cost Subtotal $491,150
20% Contingency $98,230
8% General Conditions $47,150
3% Escalation $17,681
5% Addition Construction Cost (Bonding, Permitting, Insurance) $29,469
TOTAL CONSTRUCTION COSTS $683,681
SOFT COSTS
11% Design and Engineering Fee Budget* $64,832
5% Construction Management Budget* $29,469
3% Site Survey Budget* $17,681
TOTAL SOFT COSTS $111,982
TOTAL PROJECT COSTS** $795,663
*Percentage based on construction cost subtotal and 20 percent construction cost contingency.
**Opinion of potential cost(s). Not to be used for formal construction or exact budgeting.
144 | Roadmap for Implementation
BAYOU FACING RE TAIL
A retail plaza will provide a destination center and catalyst for activity along the Sims Bayou trail system. Transparent facades will allow restaurants and retail to interact with flexible plaza spaces and trails along the bayou’s banks. Commercial development would house space for restaurants and retail establishments, drawing visitors to the area. This effort could incorporate new retail, renovated retail, a new plaza connected by sidewalks, landscaping and utility work.
ACTION STEPS
• Identify potential location(s)
• Identify property owners
• Budget for funding
• Hire team to design and engineer improvements
• Obtain permits for construction
• Complete construction documents
• Issue bid for improvements
• Select contractor
• Commence construction
• Complete construction
• Plan for operations and maintenance
FUNDING SOURCES
• Private Developers
• Tax Increment Reinvestment Zone (#8 (Gulfgate TIRZ) Funding
• Hobby Area Management District Funding
• Economic Development funds
COMMUNIT Y PARTNERS
• Tax Increment Reinvestment Zone #8 (Gulfgate TIRZ)
• Hobby Area Management District
• City of Houston (Planning and Development Department)
• City of Houston (Public Works and Engineering Department)
• City of Houston (Parking Management Department)
• Harris County Flood Control District
GOAL S ACHIE VED* :
L IVABIL IT Y PRINCIPL ES* * :
*SEE “PROJEC T GOA L S” ON PAGE 5 .
* *AS DEFINED BY U.S. DEPA R T MENT OF HOUSING AND URBAN DE V ELOPMENT ( HUD) .
1 65432
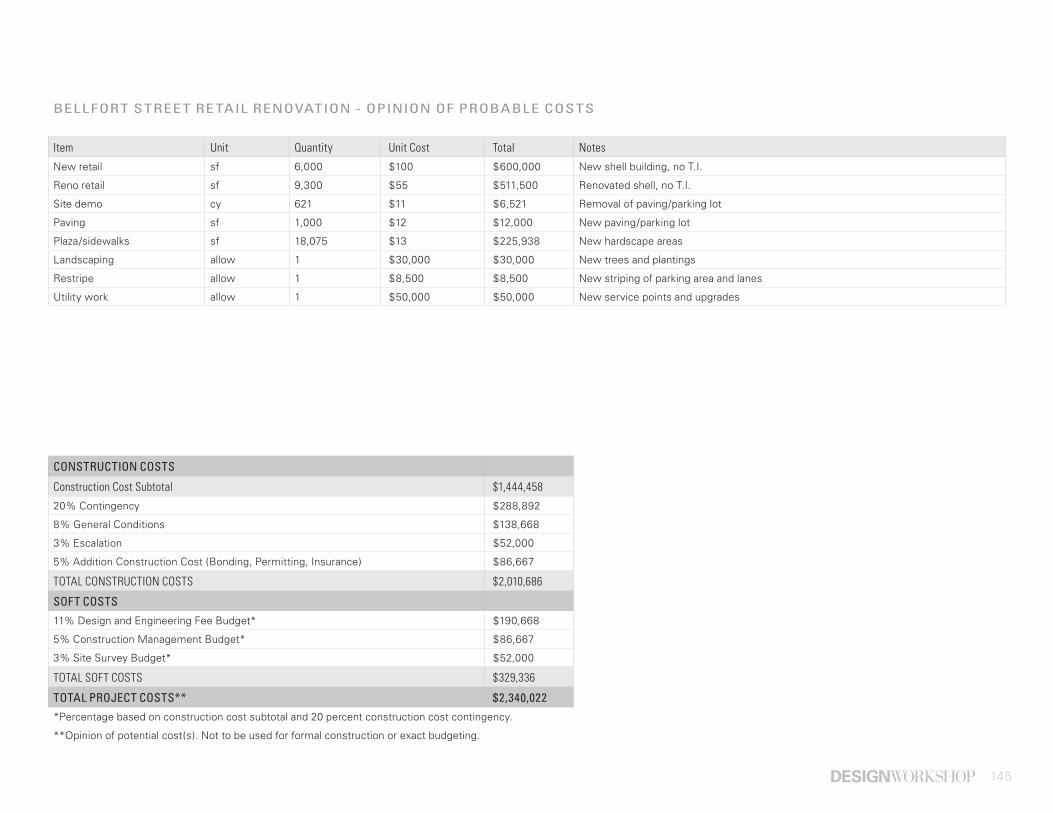
145
BELLFORT STREET RETAIL RENOVATION - OPINION OF PROBABLE COSTS
Item Unit Quantity Unit Cost Total Notes
New retail sf 6,000 $100 $600,000 New shell building, no T.I.
Reno retail sf 9,300 $55 $511,500 Renovated shell, no T.I.
Site demo cy 621 $11 $6,521 Removal of paving/parking lot
Paving sf 1,000 $12 $12,000 New paving/parking lot
Plaza/sidewalks sf 18,075 $13 $225,938 New hardscape areas
Landscaping allow 1 $30,000 $30,000 New trees and plantings
Restripe allow 1 $8,500 $8,500 New striping of parking area and lanes
Utility work allow 1 $50,000 $50,000 New service points and upgrades
CONSTRUCTION COSTS
Construction Cost Subtotal $1,444,458
20% Contingency $288,892
8% General Conditions $138,668
3% Escalation $52,000
5% Addition Construction Cost (Bonding, Permitting, Insurance) $86,667
TOTAL CONSTRUCTION COSTS $2,010,686
SOFT COSTS
11% Design and Engineering Fee Budget* $190,668
5% Construction Management Budget* $86,667
3% Site Survey Budget* $52,000
TOTAL SOFT COSTS $329,336
TOTAL PROJECT COSTS** $2,340,022
*Percentage based on construction cost subtotal and 20 percent construction cost contingency.
**Opinion of potential cost(s). Not to be used for formal construction or exact budgeting.
146 | Roadmap for Implementation
GATE WAY FE ATURES AT KE Y ENTRY CORRIDORS
This project provides ceremonial entrances at Telephone Road and Dixie Drive, IH-45 and Broadway Street, IH-45 and Airport Boulevard, and Mykawa Road and Bellfort Street. Gateways inform visitors that they have arrived at an important place. Design elements could include gateway signage, district identity signage, artistic elements, rocks, water features or native planting.
ACTION STEPS
• Budget for funding
• Acquire necessary portions of the right of way
• Hire team to design and engineer improvements
• Coordinate with utility providers and governmental entities
• Obtain permits for construction
• Complete construction documents
• Issue bid for improvements
• Select contractor
• Commence construction
• Complete construction
• Plan for operations and maintenance
• Coordinate maintenance agreements
FUNDING SOURCES
• Tax Increment Reinvestment Zone (TIRZ) Funding
• Hobby Area Management District Funding
COMMUNIT Y PARTNERS
• Tax Increment Reinvestment Zone #8 (Gulfgate TIRZ)
• Hobby Area Management District
• City of Houston
• Texas Department of Transportation
• Scenic Houston
GOAL S ACHIE VED* :
L IVABIL IT Y PRINCIPL ES* * :
*SEE “PROJEC T GOA L S” ON PAGE 5 .
* *AS DEFINED BY U.S. DEPA R T MENT OF HOUSING AND URBAN DE V ELOPMENT ( HUD) .
1 65432

147
PRIMARY GATE WAYS - OPINION OF PROBABLE COSTS
ITEM UNIT QUANTITY UNIT COST TOTAL NOTES
Gateway Features
Artwork/Sculptural Signage Allowance ls 1 $200,000 $200,000 Artwork or sculptural signage that signifies the entrance into the Hobby Area
District. Cast varies based on project budget
Signage ea 2 $1,500 $3,000 Vehicle and pedestrian wayfinding signage directing visitors to key destinations
Hobby Sign Toppers ls 2 $1,000 $2,000 Assumes sign toppers for major streets
Landscape
Revegetation sf 8,000 $1 $8,000 Revegetation along central medians at gateway locations
Soils-Groundcover cy 600 $48 $28,500 24” depth - shrubs, perennial, groundcover
Temporary Irrigation ls 1 $1,500 $1,500 Temporary irrigation during establishment period for revegetation area
CONSTRUCTION COSTS
Construction Cost Subtotal $243,000
20% Contingency $48,600
8% General Conditions $23,328
3% Escalation $8,748
5% Addition Construction Cost (Bonding, Permitting, Insurance) $14,580
TOTAL CONSTRUCTION COSTS $338,256
SOFT COSTS
11% Design and Engineering Fee Budget* $32,076
5% Construction Management Budget* $14,580
3% Site Survey Budget* $8,748
TOTAL SOFT COSTS $55,404
TOTAL COSTS PER PRIMARY GATEWAY $393,660
NUMBER OF PRIMARY GATEWAYS 8
TOTAL PROJECT COSTS** 3,149,280 *Percentage based on construction cost subtotal and 20 percent construction cost contingency.
**Opinion of potential cost(s). Not to be used for formal construction or exact budgeting.
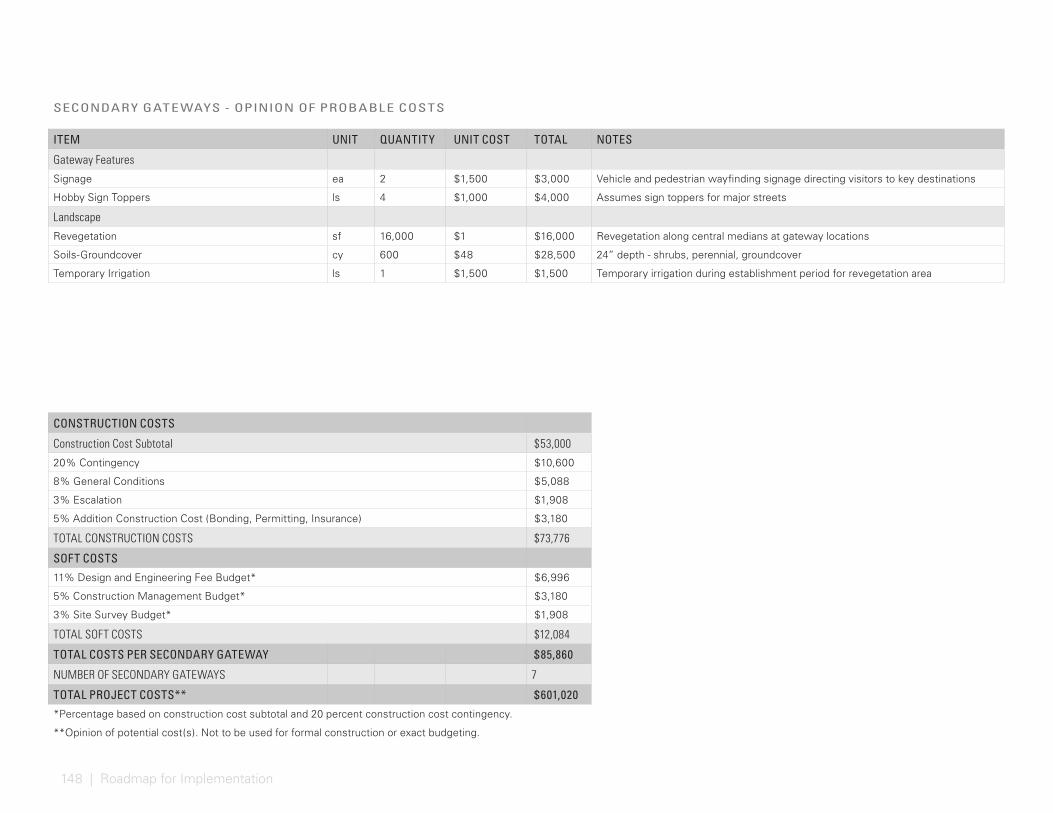
148 | Roadmap for Implementation
SECONDARY GATE WAYS - OPINION OF PROBABLE COSTS
ITEM UNIT QUANTITY UNIT COST TOTAL NOTES
Gateway Features
Signage ea 2 $1,500 $3,000 Vehicle and pedestrian wayfinding signage directing visitors to key destinations
Hobby Sign Toppers ls 4 $1,000 $4,000 Assumes sign toppers for major streets
Landscape
Revegetation sf 16,000 $1 $16,000 Revegetation along central medians at gateway locations
Soils-Groundcover cy 600 $48 $28,500 24” depth - shrubs, perennial, groundcover
Temporary Irrigation ls 1 $1,500 $1,500 Temporary irrigation during establishment period for revegetation area
CONSTRUCTION COSTS
Construction Cost Subtotal $53,000
20% Contingency $10,600
8% General Conditions $5,088
3% Escalation $1,908
5% Addition Construction Cost (Bonding, Permitting, Insurance) $3,180
TOTAL CONSTRUCTION COSTS $73,776
SOFT COSTS
11% Design and Engineering Fee Budget* $6,996
5% Construction Management Budget* $3,180
3% Site Survey Budget* $1,908
TOTAL SOFT COSTS $12,084
TOTAL COSTS PER SECONDARY GATEWAY $85,860
NUMBER OF SECONDARY GATEWAYS 7
TOTAL PROJECT COSTS** $601,020
*Percentage based on construction cost subtotal and 20 percent construction cost contingency.
**Opinion of potential cost(s). Not to be used for formal construction or exact budgeting.

149
INTERNAL WAYFINDING - OPINION OF PROBABLE COSTS
ITEM UNIT QUANTITY UNIT COST TOTAL NOTES
Gateway Features
Signage ea 4 $1,500 $6,000 Vehicle and pedestrian wayfinding signage directing visitors to key destinations
Hobby Sign Toppers ls 4 $1,000 $4,000 Assumes sign toppers for major streets
Landscape
Revegetation sf 16,000 $1 $16,000 Revegetation along central medians at gateway locations
Soils-Groundcover cy 600 $48 $28,500 24” depth - shrubs, perennial, groundcover
Temporary Irrigation ls 1 $1,500 $1,500 Temporary irrigation during establishment period for revegetation area
CONSTRUCTION COSTS
Construction Cost Subtotal $56,000
20% Contingency $11,200
8% General Conditions $5,376
3% Escalation $2,016
5% Addition Construction Cost (Bonding, Permitting, Insurance) $3,360
TOTAL CONSTRUCTION COSTS $77,952
SOFT COSTS
11% Design and Engineering Fee Budget* $7,392
5% Construction Management Budget* $3,360
3% Site Survey Budget* $2,016
TOTAL SOFT COSTS $12,768
TOTAL COSTS PER SECONDARY GATEWAY $90,720
NUMBER OF SECONDARY GATEWAYS 7
TOTAL PROJECT COSTS** $635,040
*Percentage based on construction cost subtotal and 20 percent construction cost contingency.
**Opinion of potential cost(s). Not to be used for formal construction or exact budgeting.
150 | Roadmap for Implementation
BAYOU TR AIL PEDESTRIAN BRIDGE
Currently there are only three bayou crossings in the three-mile distance between Mykawa Road and IH-45. Each of these crossings offers a 6- foot- wide sidewalk positioned directly adjacent to vehicular traffic; therefore, there is a need for a safe and comfortable crossing across Sims Bayou. This project proposes such a crossing at Telephone Road which would provide a central link between the north and south sides of the Sims Bayou trail system and connect neighborhoods to transit, trails, schools, shopping and parks. Additional pedestrian bridges should be explored at other locations where roads intersect the bayou such as Broadway Street and Mykawa Road.
ACTION STEPS
• Budget for funding
• Acquire necessary portions of the right of way
• Hire team to design and engineer improvements
• Coordinate with utility providers and governmental entities
• Obtain permits for construction
• Complete construction documents
• Issue bid for improvements
• Select contractor
• Commence construction
• Complete construction
• Plan for operations and maintenance
• Coordinate maintenance agreements
FUNDING SOURCES
• Tax Increment Reinvestment Zone (TIRZ) Funding
• Hobby Area Management District Funding
• Surface Transportation Block Grant Program
• Community Development Block Grant Program
• Private Property Owner and Development Interest Funding
COMMUNIT Y PARTNERS
• Tax Increment Reinvestment Zone #8 (Gulfgate TIRZ)
• Hobby Area Management District
• City of Houston (Planning and Development Department)
• City of Houston (Parks and Recreation Department)
• City of Houston (Public Works and Engineering Department)
• Harris County Flood Control District
GOAL S ACHIE VED* :
L IVABIL IT Y PRINCIPL ES* * :
*SEE “PROJEC T GOA L S” ON PAGE 5 .
* *AS DEFINED BY U.S. DEPA R T MENT OF HOUSING AND URBAN DE V ELOPMENT ( HUD) .
1 65432

151
BAYOU TR AIL PEDESTRIAN BRIDGE - OPINION OF PROBABLE COSTS
ITEM UNIT QUANTITY UNIT COST TOTAL NOTES
Engineering
Pedestrian bridge lf 235 $2,000 $470,000 Install prefab bridge and abutments, Excel Bridge Manufacturing
Mass grading allow 1 $25,000 $25,000
Electrical service allow 1 $10,000 $10,000 Assumed new meter drop down from overhead pole
Landscaping
Revegetation sf 39,800 $5 $199,000 Limited plantings and hydroseed
Fine grading allow 1 $16,000 $16,000
Lighting allow 1 $28,000 $28,000 Pole and area lighting around bridge and walkways
Tree Type 1 each 30 $1,600 $48,000 6”-8” caliper shade tree for streets and plazas
Tree Type 2 each 10 $600 $6,000 2”-4” caliper ornamental tree
Irrigation sf 39,800 $2 $59,700 Basic potable - can be combined with com center if desired
Hardscape/sidewalk sf 9,350 $8 $74,800 Concrete paving
Site amenities allow 1 $80,000 $80,000 Limited furniture and seating, park node elements
CONSTRUCTION COSTS
Construction Cost Subtotal $1,016,500
20% Contingency $203,300
8% General Conditions $97,584
3% Escalation $36,594
5% Addition Construction Cost (Bonding, Permitting, Insurance) $60,990
TOTAL CONSTRUCTION COSTS $1,414,968
SOFT COSTS
11% Design and Engineering Fee Budget* $134,178
5% Construction Management Budget* $60,990
3% Site Survey Budget* $36,594
TOTAL SOFT COSTS $231,762
TOTAL PROJECT COSTS** $1,646,730
*Percentage based on construction cost subtotal and 20 percent construction cost contingency.
**Opinion of potential cost(s). Not to be used for formal construction or exact budgeting.
152 | Roadmap for Implementation
DR AINAGE CHANNEL AND UTILIT Y RIGHT OF WAY TR AIL CONNECTIONS
Two drainage corridors run north-south between Airport Boulevard and the Hobby Area’s bayou system. Future studies in collaboration with Harris County Flood Control District should examine the feasibility of transforming these channels into natural community assets that better mitigate flooding challenges. Many residents voiced that these channels are currently undesirable spaces. However, transformation of these drainage corridors could provide a linear parkway system with direct access into Sims Bayou. This would put over 800 single family homes within a 5-minute walk of recreational trails with direct bayou access.
A central utility right of way runs east-west through the Broadway Street corridor and ends in the western most drainage channel. The transformation of this right of way into a trail could extend designated pedestrian and bike access from Lewis Elementary School within walking distance of an extensive trail system. Recommended programming for these spaces include gardens, trails and directional signage.
ACTION STEPS
• Budget for a future study in collaboration with Harris County Flood Control District
• Apply for grant funding
• Acquire necessary right of way
• Coordinate maintenance agreements
GOAL S ACHIE VED* :
L IVABIL IT Y PRINCIPL ES* * :
*SEE “PROJEC T GOA L S” ON PAGE 5 .
* *AS DEFINED BY U.S. DEPA R T MENT OF HOUSING AND URBAN DE V ELOPMENT ( HUD) .
1 6542 3
FUNDING SOURCES
• Tax Increment Reinvestment Zone (TIRZ) Funding
• Hobby Area Management District Funding
• Grants
• Safe Routes to Schools
• Texas Parks and Wildlife Recreational Trails Grants [https://tpwd.texas.gov/business/grants/recreation-grants/recreational-trails-grants]
• Transportation Alternatives Program (TAP) Moving Ahead for Progress (MAP) Funding
COMMUNIT Y PARTNERS
• Tax Increment Reinvestment Zone #8 (Gulfgate TIRZ)
• Hobby Area Management District
• Harris County Flood Control District
• City of Houston
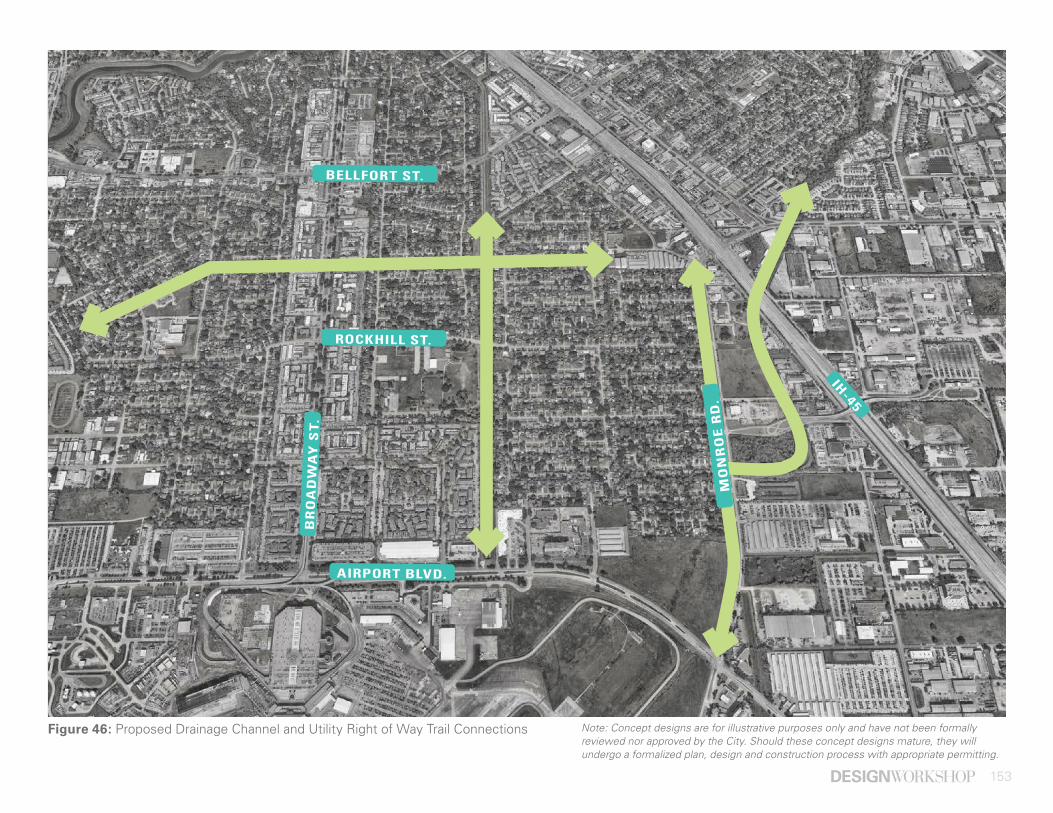
153
Figure 46: Proposed Drainage Channel and Utility Right of Way Trail Connections
BR
OA
DW
AY
ST
.
MO
NR
OE
RD
.
AIRPORT BLVD.
ROCKHILL ST.
IH-45
BELLFORT ST.
Note: Concept designs are for illustrative purposes only and have not been formally reviewed nor approved by the City. Should these concept designs mature, they will undergo a formalized plan, design and construction process with appropriate permitting.
154 | Roadmap for Implementation
LIGHT R AIL TR ANSIT NE AR WILLIAM P. HOBBY AIRPORT
There are currently five bus routes serving the area, all of which connect the William P. Hobby Airport to Houston. If a visitor was to travel from the airport to Downtown Houston by public transportation today it would take them approximately an hour with multiple bus transfers to arrive at their downtown destination. In comparison, a taxi would take approximately 20 minutes. The current model increases reliance on cars and decreases the ease of accessibility for individuals without access to a vehicle.
This project recommends linking together transit options such as future MetroRail service, bus service and non-auto forms of transportation such as pedestrians, bicycles and visitors arriving at the William P. Hobby Airport. This elevates the status of William P. Hobby Airport as a gateway into Houston and also improves mobility for residents within the District.
ACTION STEPS
• Continue regional rail studies with the City of Houston, Metropolitan Transit Authority of Harris County, Houston-Galveston Area Council and Texas Department of Transportation
• Identify potential location(s)
• Hire team to design and engineer improvements
• Coordinate with utility providers and governmental entities
• Obtain permits for construction
• Complete construction documents
• Issue bid for improvements
• Select contractor
• Commence construction
• Complete construction
• Plan for operations and maintenance
• Coordinate maintenance agreements
FUNDING SOURCES
• Tax Increment Reinvestment Zone (TIRZ) Funding#8 Financing - used to generate funds for any major capital projects
• Hobby Area Management District Funding
• General Fund
• General Obligation bonds
• Special Revenue Funds
• Grants
COMMUNIT Y PARTNERS
• Tax Increment Reinvestment Zone #8 (Gulfgate TIRZ)
• Hobby Area Management District
• Houston-Galveston Area Council
• City of Houston
• Metropolitan Transit Authority of Harris County
• Utility providers
• Adjacent property owners
• Adjacent Tax Increment Reinvestment
• William P. Hobby Airport
• Scenic Houston
GOAL S ACHIE VED* :
L IVABIL IT Y PRINCIPL ES* * :
*SEE “PROJEC T GOA L S” ON PAGE 5 .
* *AS DEFINED BY U.S. DEPA R T MENT OF HOUSING AND URBAN DE V ELOPMENT ( HUD) .
1 65432
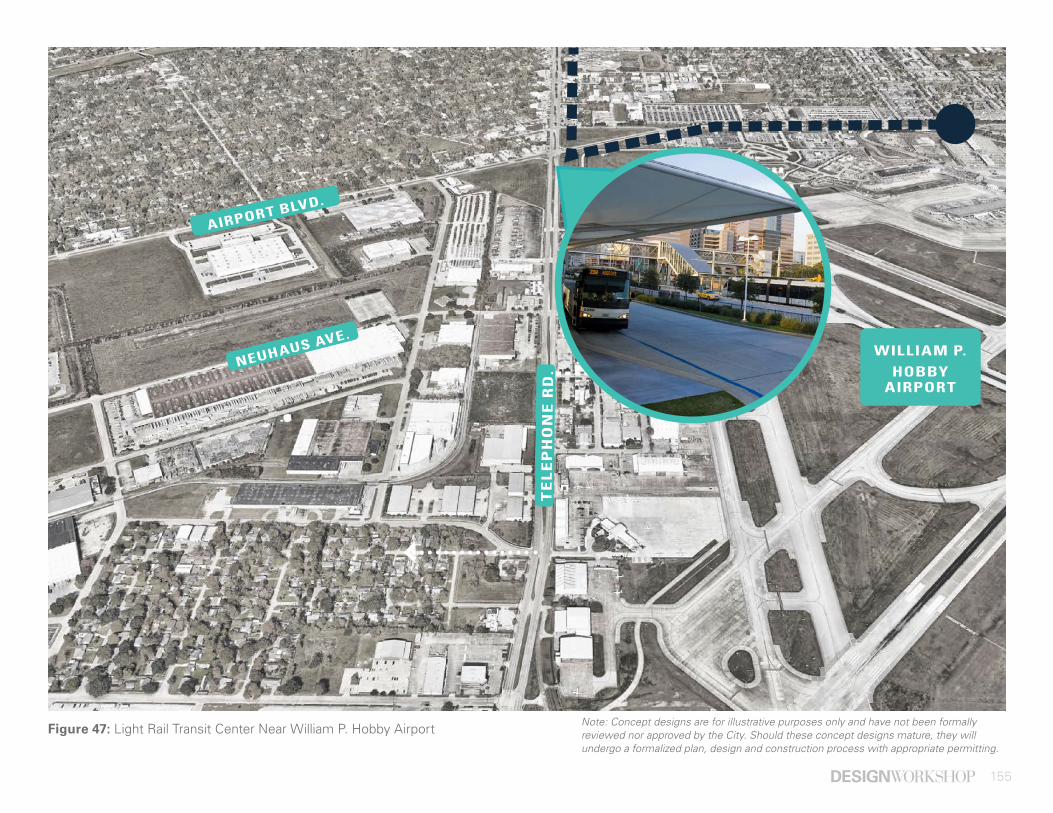
155
Figure 47: Light Rail Transit Center Near William P. Hobby Airport
TE
LE
PH
ON
E R
D.NEUHAUS AVE.
AIRPORT BLVD.
WILLIAM P. HOBBY
AIRPORT
Note: Concept designs are for illustrative purposes only and have not been formally reviewed nor approved by the City. Should these concept designs mature, they will undergo a formalized plan, design and construction process with appropriate permitting.
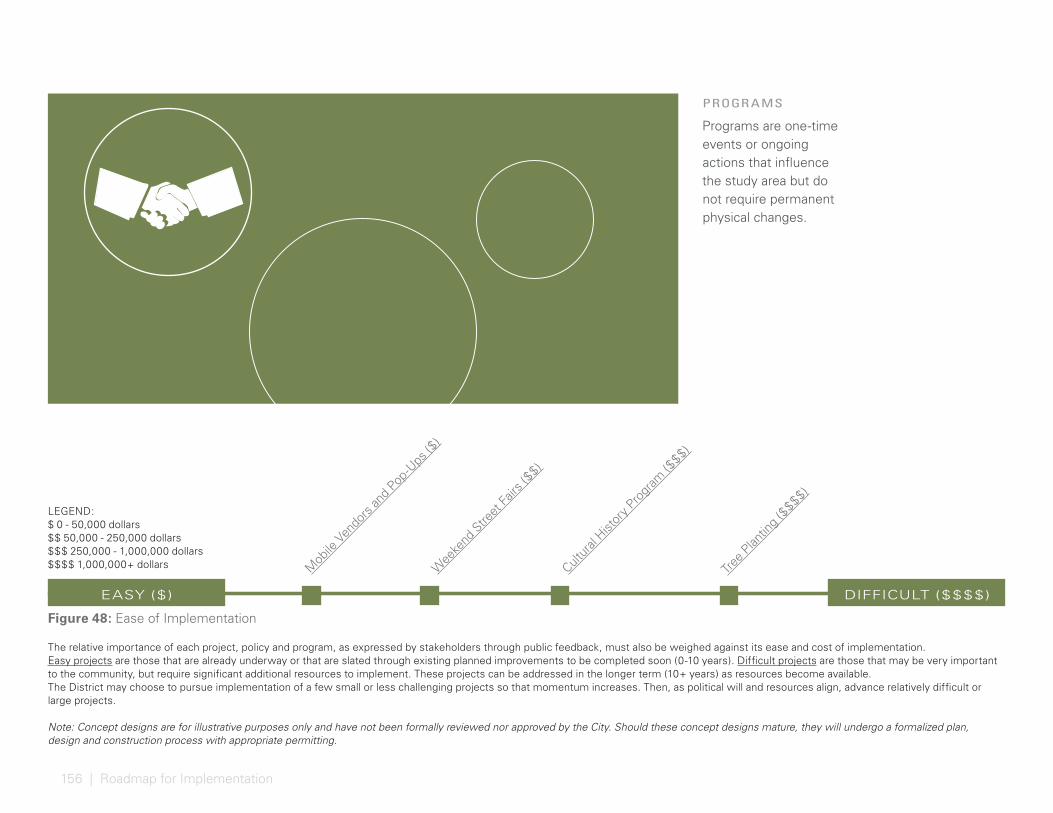
156 | Roadmap for Implementation
PROGR AMS
Programs are one-time events or ongoing actions that influence the study area but do not require permanent physical changes.
Mob
ile V
endo
rs an
d Pop
-Ups
($)
Wee
kend
Stre
et Fa
irs ($
$)
Cultur
al Hist
ory P
rogr
am ($
$$)
Tree P
lantin
g ($$$$)
EASY ($ )
The relative importance of each project, policy and program, as expressed by stakeholders through public feedback, must also be weighed against its ease and cost of implementation. Easy projects are those that are already underway or that are slated through existing planned improvements to be completed soon (0-10 years). Difficult projects are those that may be very important to the community, but require significant additional resources to implement. These projects can be addressed in the longer term (10+ years) as resources become available. The District may choose to pursue implementation of a few small or less challenging projects so that momentum increases. Then, as political will and resources align, advance relatively difficult or large projects.
Note: Concept designs are for illustrative purposes only and have not been formally reviewed nor approved by the City. Should these concept designs mature, they will undergo a formalized plan, design and construction process with appropriate permitting.
Figure 48: Ease of Implementation
DIFFICULT ($$$$)
LEGEND:$ 0 - 50,000 dollars $$ 50,000 - 250,000 dollars$$$ 250,000 - 1,000,000 dollars$$$$ 1,000,000+ dollars
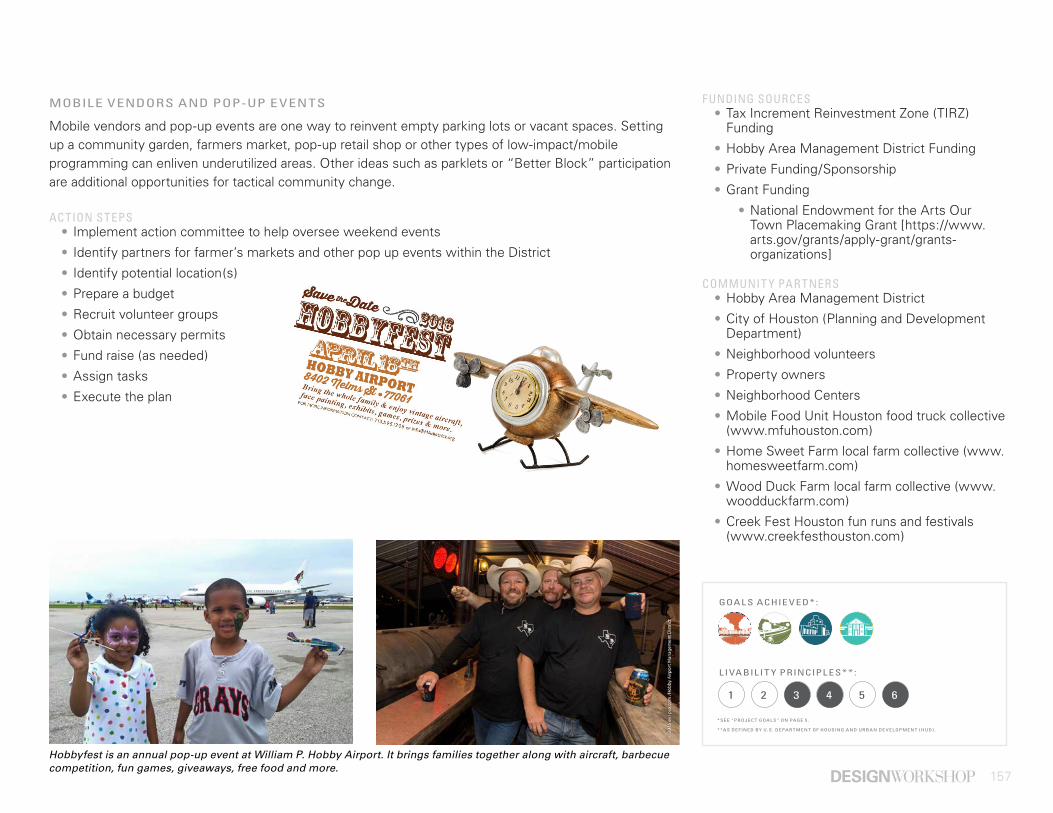
157
MOBILE VENDORS AND POP-UP E VENTS
Mobile vendors and pop-up events are one way to reinvent empty parking lots or vacant spaces. Setting up a community garden, farmers market, pop-up retail shop or other types of low-impact/mobile programming can enliven underutilized areas. Other ideas such as parklets or “Better Block” participation are additional opportunities for tactical community change.
ACTION STEPS• Implement action committee to help oversee weekend events
• Identify partners for farmer’s markets and other pop up events within the District
• Identify potential location(s)
• Prepare a budget
• Recruit volunteer groups
• Obtain necessary permits
• Fund raise (as needed)
• Assign tasks
• Execute the plan
FUNDING SOURCES• Tax Increment Reinvestment Zone (TIRZ)
Funding
• Hobby Area Management District Funding
• Private Funding/Sponsorship
• Grant Funding
• National Endowment for the Arts Our Town Placemaking Grant [https://www.arts.gov/grants/apply-grant/grants-organizations]
COMMUNIT Y PARTNERS• Hobby Area Management District
• City of Houston (Planning and Development Department)
• Neighborhood volunteers
• Property owners
• Neighborhood Centers
• Mobile Food Unit Houston food truck collective (www.mfuhouston.com)
• Home Sweet Farm local farm collective (www.homesweetfarm.com)
• Wood Duck Farm local farm collective (www.woodduckfarm.com)
• Creek Fest Houston fun runs and festivals (www.creekfesthouston.com)
Hobbyfest is an annual pop-up event at William P. Hobby Airport. It brings families together along with aircraft, barbecue competition, fun games, giveaways, free food and more.
GOAL S ACHIE VED* :
L IVABIL IT Y PRINCIPL ES* * :
*SEE “PROJEC T GOA L S” ON PAGE 5 .
* *AS DEFINED BY U.S. DEPA R T MENT OF HOUSING AND URBAN DE V ELOPMENT ( HUD) .
6432 51
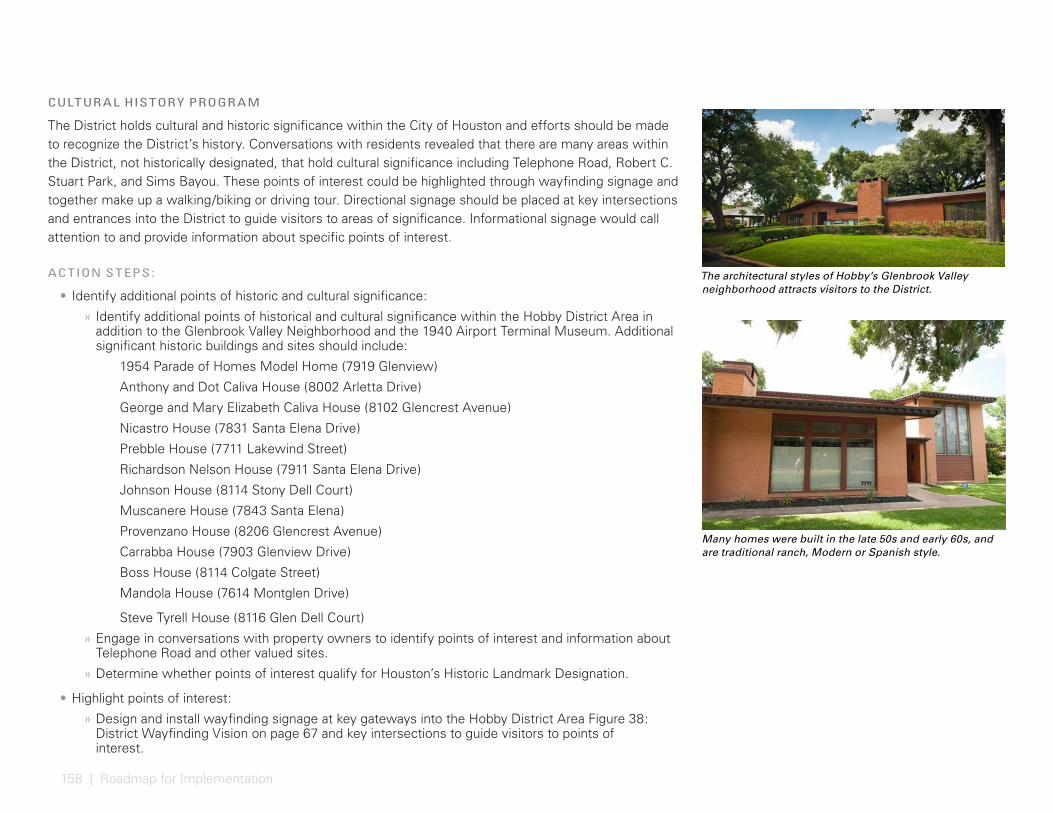
158 | Roadmap for Implementation
CULTUR AL HISTORY PROGR AM
The District holds cultural and historic significance within the City of Houston and efforts should be made to recognize the District’s history. Conversations with residents revealed that there are many areas within the District, not historically designated, that hold cultural significance including Telephone Road, Robert C. Stuart Park, and Sims Bayou. These points of interest could be highlighted through wayfinding signage and together make up a walking/biking or driving tour. Directional signage should be placed at key intersections and entrances into the District to guide visitors to areas of significance. Informational signage would call attention to and provide information about specific points of interest.
ACTION STEPS:
• Identify additional points of historic and cultural significance:
» Identify additional points of historical and cultural significance within the Hobby District Area in addition to the Glenbrook Valley Neighborhood and the 1940 Airport Terminal Museum. Additional significant historic buildings and sites should include:
1954 Parade of Homes Model Home (7919 Glenview)
Anthony and Dot Caliva House (8002 Arletta Drive)
George and Mary Elizabeth Caliva House (8102 Glencrest Avenue)
Nicastro House (7831 Santa Elena Drive)
Prebble House (7711 Lakewind Street)
Richardson Nelson House (7911 Santa Elena Drive)
Johnson House (8114 Stony Dell Court)
Muscanere House (7843 Santa Elena)
Provenzano House (8206 Glencrest Avenue)
Carrabba House (7903 Glenview Drive)
Boss House (8114 Colgate Street)
Mandola House (7614 Montglen Drive)
Steve Tyrell House (8116 Glen Dell Court)
» Engage in conversations with property owners to identify points of interest and information about Telephone Road and other valued sites.
» Determine whether points of interest qualify for Houston’s Historic Landmark Designation.
• Highlight points of interest:
» Design and install wayfinding signage at key gateways into the Hobby District Area Figure 38: District Wayfinding Vision on page 67 and key intersections to guide visitors to points of interest.
The architectural styles of Hobby’s Glenbrook Valley neighborhood attracts visitors to the District.
Many homes were built in the late 50s and early 60s, and are traditional ranch, Modern or Spanish style.

159
» Design and install informational signage at specific points of interest.
» Develop interpretive materials, such as a map or online app, that ties these locations together and helps residents and visitors navigate to them.
» Partner with Preservation Houston and the Houston Arts Alliance to feature District cultural and historic destinations on their Architecture Walks Program tours.
• Hold cultural events:
» Host festivals that highlight the 1940 Airport Terminal Museum as a launching point for cultural tourism related to the District.
» Host festivals that highlight natural amenities such as Robert C. Stuart Park and Sims Bayou.
• Work with other organizations to create, fund and implement a district-wide arts/cultural tourism plan that meets the District’s needs, while also furthering the goals of the recently updated Arts & Cultural Plan by the Mayor’s Office of Cultural Affairs [http://www.houstontx.gov/culturalaffairs/Houston_Culture_Plan_2015.pdf]
• Coordinate with the Texas Commission on the Arts to see if the Hobby Area qualifies for destination as an Arts and Entertainment District. The Cultural District designation qualifies the District and nonprofit groups within it to apply for state and national project grants. To receive grant funding, an arts strategic plan is preferred so that funders can see how projects fit into the overall vision and furthers community-supported goals. If the District qualifies:
» Engage the arts and business communities in collaborative efforts that include events, educational workshops, public art projects and programming.
» Delineate the District’s gateways with public art that brands the Hobby Area District in compliance with the mission, and leverage the cultural arts designation and visitor attendance to increase awareness of the District as a culturally significant destination.
» Coordinate formal review processes for the District to recruit, accept, review and implement temporary and permanent public art and civic art programs.
» Respond to residential and business owners’ ongoing requests for quality opportunities for artists.
» Work with the Environmental and Urban Design Committee to annually review the cultural arts master plan and coordinate with the District’s service plan to determine which projects to undertake.
» Based on the timeline and estimated budget for each recommendation, conclude the annual budget needed for the district to achieve strategies and make recommendations to the Board for approval.
» Conduct a monthly budget review to monitor and adjust spending and fundraising needs.
» Coordinate with partner organizations to identify additional funding for strategies that are not funded by the District.
» Maintain the Hobby Area District’s destination by the Texas commission on the Arts as a Cultural Arts & Entertainment District.
FUNDING SOURCES:
• Tax Increment Reinvestment Zone (TIRZ) Funding
• Hobby Area Management District Funding
• General Obligation bonds
• General Fund
• Special Revenue Funds
• Grants
COMMUNIT Y PARTNERS:
• Tax Increment Reinvestment Zone #8 (Gulfgate TIRZ)
• Hobby Area Management District
• City of Houston Planning and Development - Historic Preservation
• Current property owners
• Houston-Galveston Area Council
• Hobby Area Management District
GOAL S ACHIE VED* :
L IVABIL IT Y PRINCIPL ES* * :
*SEE “PROJEC T GOA L S” ON PAGE 5 .
* *AS DEFINED BY U.S. DEPA R T MENT OF HOUSING AND URBAN DE V ELOPMENT ( HUD) .
5 642 31

160 | Roadmap for Implementation
WEEKEND STREE T FAIRS
Partner with local organizations to host weekend street fairs along the streets within the Industrial Hub. The community has expressed a desire for a central market place. The Industrial Hub offers a tight-knit grid that is ideal for pedestrian-only street fairs on the weekend. This provides the opportunity for entrepreneurs and retailers to share their goods and services.
ACTION STEPS:
• Implement action committee to help oversee a weekend street fair;
• Identify potential location(s);
• Identify partners (property owners and associated groups);
• Prepare a budget;
• Recruit volunteer groups;
• Obtain appropriate permits;
• Fund raise (as needed);
• Assign tasks; and
• Execute the plan.
FUNDING SOURCES
• Hobby Area Management District Funding
• Local non-profits
• Local business and farmers market organizations
• Private funding
COMMUNIT Y PARTNERS
• Hobby Area Management District
• City of Houston (permitting)
• Neighborhood volunteers
• Local organizations of entrepreneurs, farmers and industrial trades
• Property owners
GOAL S ACHIE VED* :
L IVABIL IT Y PRINCIPL ES* * :
*SEE “PROJEC T GOA L S” ON PAGE 5 .
* *AS DEFINED BY U.S. DEPA R T MENT OF HOUSING AND URBAN DE V ELOPMENT ( HUD) .
654321
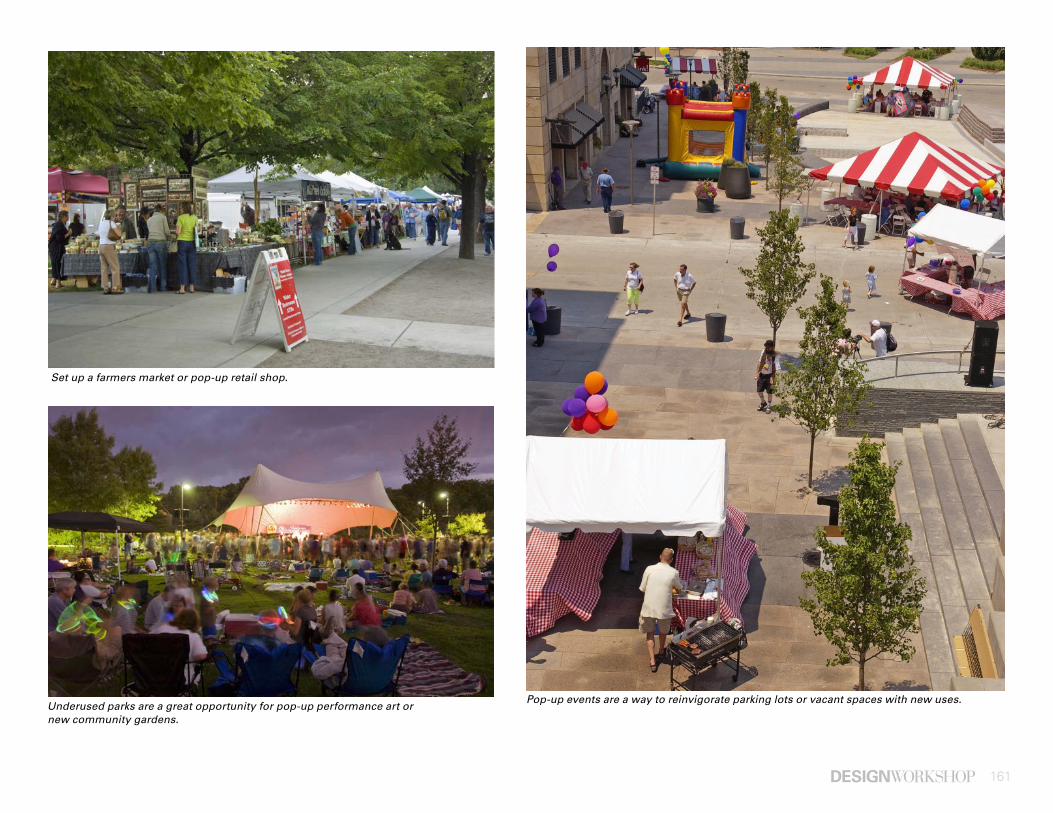
161
Pop-up events are a way to reinvigorate parking lots or vacant spaces with new uses.
Set up a farmers market or pop-up retail shop.
Underused parks are a great opportunity for pop-up performance art or new community gardens.
162 | Roadmap for Implementation
TREE PL ANTING
The NeighborWoods Program, a private/public volunteer initiative aimed at providing Houston neighborhoods with beautiful trees, is a resource for residents to help plant trees free of charge. Coordinating increased tree canopy cover along rights of way and streetscapes requires additional resources and planning to achieve. As an example, a recent large-scale planting efforts within the District included the planting of over 400 live oaks along Broadway as part of the Broadway Boulevard Beautification Project. The development of a district-wide tree inventory and management plan could focus similar efforts along other key corridors within the District.
ACTION STEPS
• Complete a district-wide inventory of existing trees to determine areas with the largest need
• Identify and prioritize areas within the Hobby Area District with the largest need for tree canopy
• Collaborate with the City of Houston and TxDOT regarding funding, implementation an maintenance
FUNDING SOURCES
• Tax Increment Reinvestment Zone (TIRZ) Funding
• Hobby Area Management District Funding
• General Obligation bonds
• General Fund
• Special Revenue Funds
• Grants
• U.S. Environmental Protection Agency Environmental Education Grants [https://www.epa.gov/education/environmental-education-ee-grants]
• Houston Endowment [http://www.houstonendowment.org/GrantGuidelines/ApplicationTypes.aspx]
• Arbor Day Foundation TD Green Streets Grant Program
COMMUNIT Y PARTNERS
• Tax Increment Reinvestment Zone #8 (Gulfgate TIRZ)
• Hobby Area Management District
• Schools and other Institutions(Institution)
• City of Houston (Planning and Development Department)
• City of Houston (Parks and Recreation Department)
• City of Houston (Public Works and Engineering Department)
• City of Houston (Million Trees + Houston Mayor’s Imitative)
• Houston-Galveston Area Council
• Texas Department of Transportation
• Non-profit - Trees for Houston [http://www.treesforhouston.org/]
• Scenic Houston
GOAL S ACHIE VED* :
L IVABIL IT Y PRINCIPL ES* * :
*SEE “PROJEC T GOA L S” ON PAGE 5 .
* *AS DEFINED BY U.S. DEPA R T MENT OF HOUSING AND URBAN DE V ELOPMENT ( HUD) .
1 65432
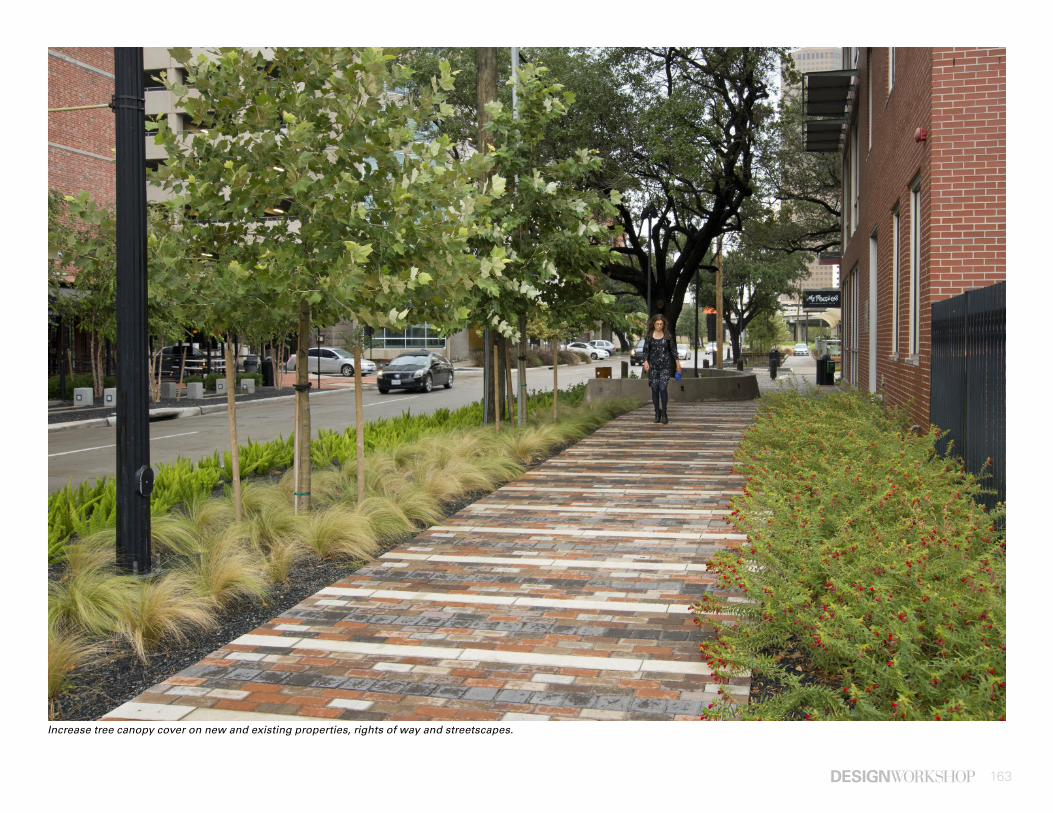
163
Increase tree canopy cover on new and existing properties, rights of way and streetscapes.
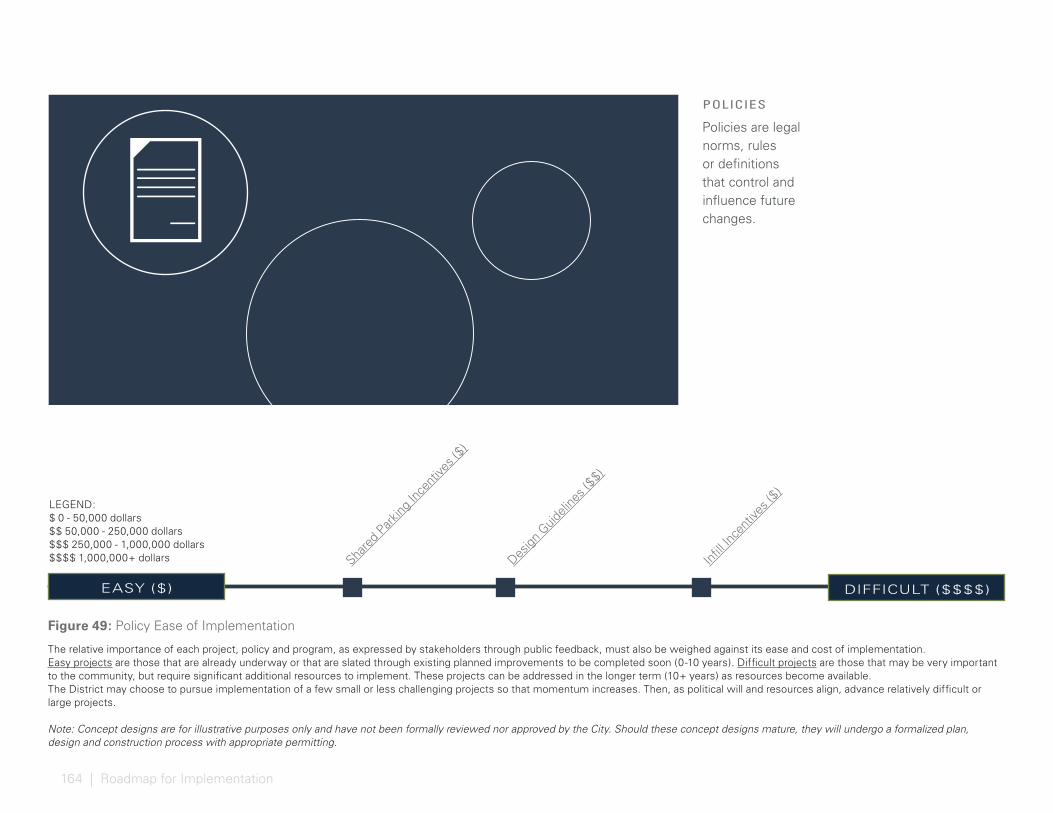
164 | Roadmap for Implementation
POLICIES
Policies are legal norms, rules or definitions that control and influence future changes.
Share
d Park
ing In
cent
ives (
$)
Design
Guid
eline
s ($$)
Infill I
ncen
tives
($)
EASY ($ )
The relative importance of each project, policy and program, as expressed by stakeholders through public feedback, must also be weighed against its ease and cost of implementation. Easy projects are those that are already underway or that are slated through existing planned improvements to be completed soon (0-10 years). Difficult projects are those that may be very important to the community, but require significant additional resources to implement. These projects can be addressed in the longer term (10+ years) as resources become available. The District may choose to pursue implementation of a few small or less challenging projects so that momentum increases. Then, as political will and resources align, advance relatively difficult or large projects.
Note: Concept designs are for illustrative purposes only and have not been formally reviewed nor approved by the City. Should these concept designs mature, they will undergo a formalized plan, design and construction process with appropriate permitting.
Figure 49: Policy Ease of Implementation
DIFFICULT ($$$$)
LEGEND:$ 0 - 50,000 dollars $$ 50,000 - 250,000 dollars$$$ 250,000 - 1,000,000 dollars$$$$ 1,000,000+ dollars
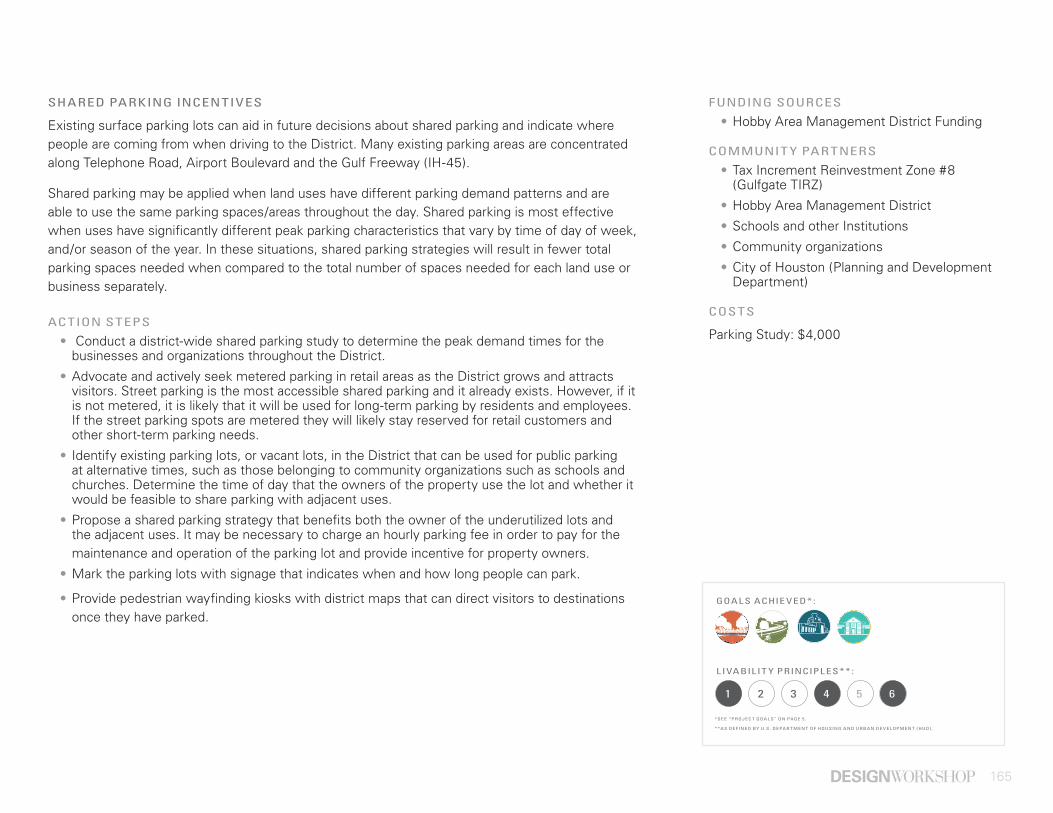
165
SHARED PARKING INCENTIVES
Existing surface parking lots can aid in future decisions about shared parking and indicate where people are coming from when driving to the District. Many existing parking areas are concentrated along Telephone Road, Airport Boulevard and the Gulf Freeway (IH-45).
Shared parking may be applied when land uses have different parking demand patterns and are able to use the same parking spaces/areas throughout the day. Shared parking is most effective when uses have significantly different peak parking characteristics that vary by time of day of week, and/or season of the year. In these situations, shared parking strategies will result in fewer total parking spaces needed when compared to the total number of spaces needed for each land use or business separately.
ACTION STEPS
• Conduct a district-wide shared parking study to determine the peak demand times for the businesses and organizations throughout the District.
• Advocate and actively seek metered parking in retail areas as the District grows and attracts visitors. Street parking is the most accessible shared parking and it already exists. However, if it is not metered, it is likely that it will be used for long-term parking by residents and employees. If the street parking spots are metered they will likely stay reserved for retail customers and other short-term parking needs.
• Identify existing parking lots, or vacant lots, in the District that can be used for public parking at alternative times, such as those belonging to community organizations such as schools and churches. Determine the time of day that the owners of the property use the lot and whether it would be feasible to share parking with adjacent uses.
• Propose a shared parking strategy that benefits both the owner of the underutilized lots and the adjacent uses. It may be necessary to charge an hourly parking fee in order to pay for the maintenance and operation of the parking lot and provide incentive for property owners.
• Mark the parking lots with signage that indicates when and how long people can park.
• Provide pedestrian wayfinding kiosks with district maps that can direct visitors to destinations once they have parked.
FUNDING SOURCES
• Hobby Area Management District Funding
COMMUNIT Y PARTNERS
• Tax Increment Reinvestment Zone #8 (Gulfgate TIRZ)
• Hobby Area Management District
• Schools and other Institutions
• Community organizations
• City of Houston (Planning and Development Department)
COSTS
Parking Study: $4,000
GOAL S ACHIE VED* :
L IVABIL IT Y PRINCIPL ES* * :
*SEE “PROJEC T GOA L S” ON PAGE 5 .
* *AS DEFINED BY U.S. DEPA R T MENT OF HOUSING AND URBAN DE V ELOPMENT ( HUD) .
1 65432
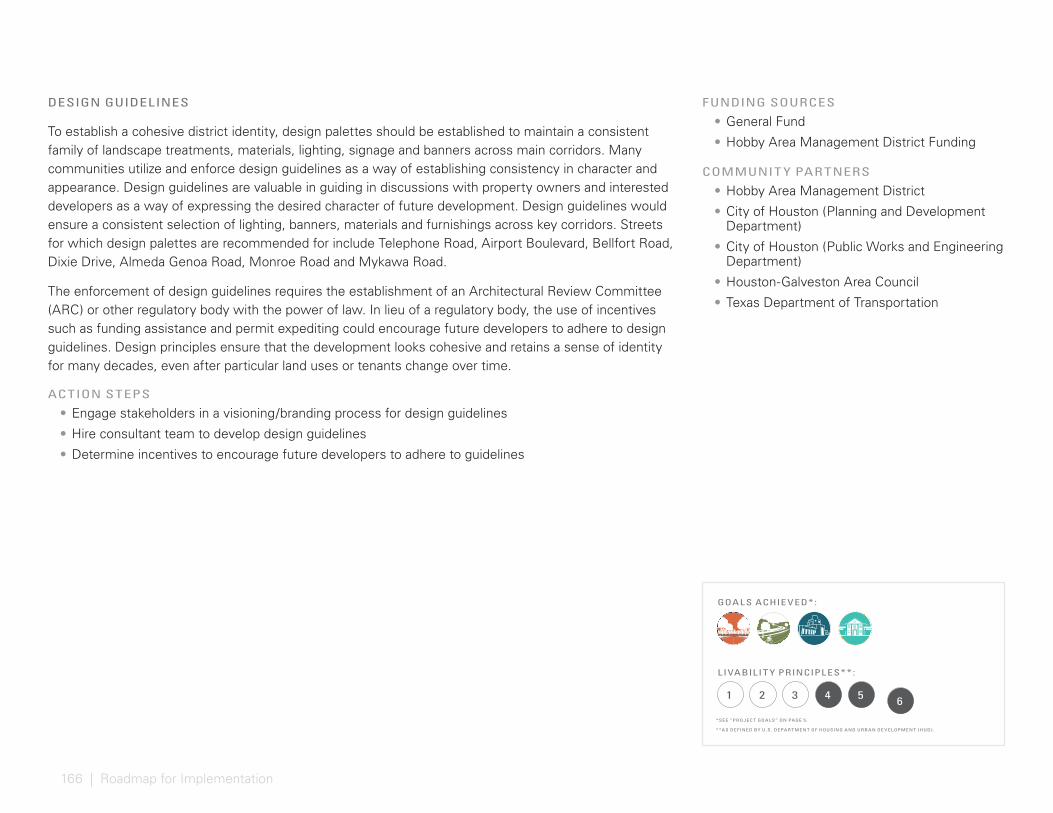
166 | Roadmap for Implementation
DESIGN GUIDELINES
To establish a cohesive district identity, design palettes should be established to maintain a consistent family of landscape treatments, materials, lighting, signage and banners across main corridors. Many communities utilize and enforce design guidelines as a way of establishing consistency in character and appearance. Design guidelines are valuable in guiding in discussions with property owners and interested developers as a way of expressing the desired character of future development. Design guidelines would ensure a consistent selection of lighting, banners, materials and furnishings across key corridors. Streets for which design palettes are recommended for include Telephone Road, Airport Boulevard, Bellfort Road, Dixie Drive, Almeda Genoa Road, Monroe Road and Mykawa Road.
The enforcement of design guidelines requires the establishment of an Architectural Review Committee (ARC) or other regulatory body with the power of law. In lieu of a regulatory body, the use of incentives such as funding assistance and permit expediting could encourage future developers to adhere to design guidelines. Design principles ensure that the development looks cohesive and retains a sense of identity for many decades, even after particular land uses or tenants change over time.
ACTION STEPS
• Engage stakeholders in a visioning/branding process for design guidelines
• Hire consultant team to develop design guidelines
• Determine incentives to encourage future developers to adhere to guidelines
FUNDING SOURCES
• General Fund
• Hobby Area Management District Funding
COMMUNIT Y PARTNERS
• Hobby Area Management District
• City of Houston (Planning and Development Department)
• City of Houston (Public Works and Engineering Department)
• Houston-Galveston Area Council
• Texas Department of Transportation
GOAL S ACHIE VED* :
L IVABIL IT Y PRINCIPL ES* * :
*SEE “PROJEC T GOA L S” ON PAGE 5 .
* *AS DEFINED BY U.S. DEPA R T MENT OF HOUSING AND URBAN DE V ELOPMENT ( HUD) .
1 65432

167
E X AMPLE DESIGN PRINCIPLES
MASSING
Varied roof planes and building heights break down the overall scale and massing of large full-block developments. Buildings should step back on the upper stories in order to minimize their appearance from the pedestrians. There should be a consistency to the building fabric that allows for highlighting exceptional moments. A turret, spire or tower may exceed maximum height of a building to accentuate signature places. Parking garages should be wrapped with building program where possible to ensure a vibrant public realm.
FAÇADE
The façade of the buildings will be a key determinant of the atmosphere created by new development. The façade should create unique interest with varying depth, height and materials. A playful combination of storefronts and street-level façades should bring hierarchy by drawing attention to important areas such as the shopping street while still creating wholesome experiences on the other street typologies. Encourage the use of materials or vegetation that create dynamic façades and screen raw parking structures. Parking garage façade elements, such as metal panels, create interest beyond the exposed structure of the garage. Parking garage screening elements also help to shield nearby windows from headlights in the evenings.
PUBLIC RE ALM
The character of the streetscape and built environment is greatly impacted by buildings and how they front the street. Arcades, display windows, entry areas, patios, awnings and other such design features should make up the majority of the ground floor façade. Retail frontages should employ a majority of clear glass to provide transparency between street and retail. This should also be tempered by overhangs or other elements that help mitigate the hot Texas climate.
PRIVATE SPACES
Private landscaped areas should have large shade trees with a minimum caliper of four inches. Paving materials should be warm toned, natural materials such as stone and brick. Surface parking lots shall be screened from all adjacent public streets and neighboring sites. Parking spaces shall not exceed 10 spaces in a row without being interrupted by a landscaped island. Loading, service and trash storage areas shall be screened from all public roadways. All roof mounted mechanical elements must be screened from view from the public right of way and neighboring properties.
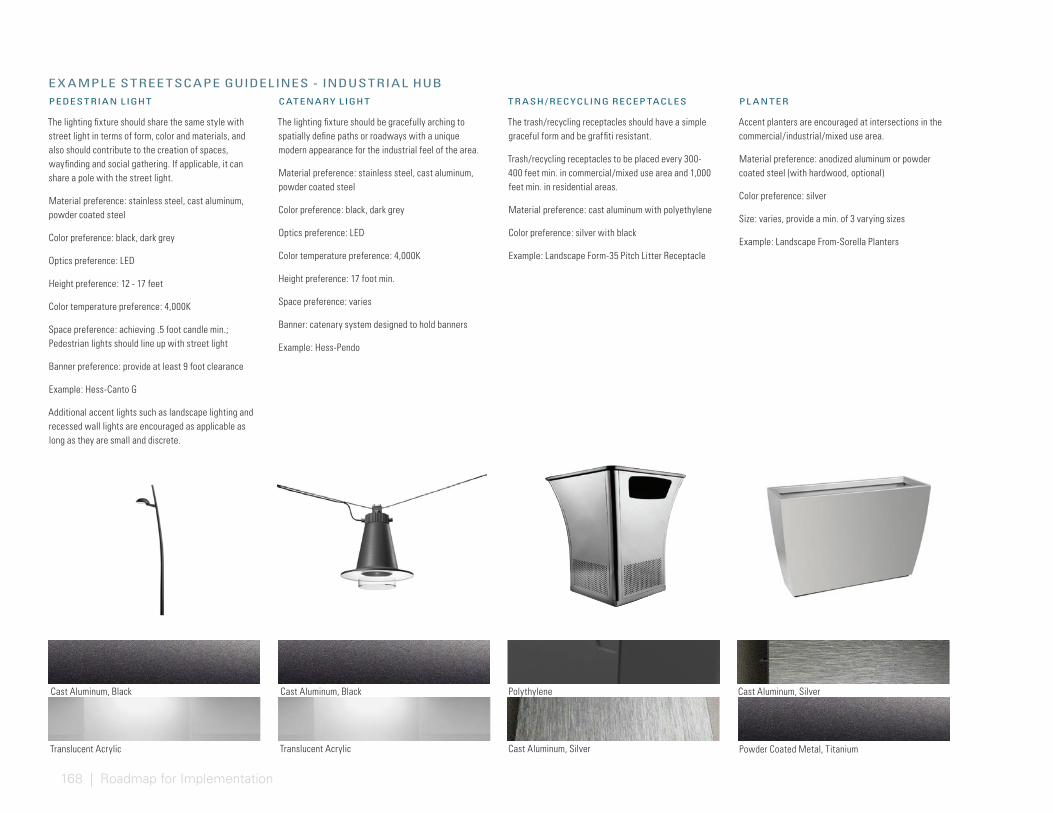
168 | Roadmap for Implementation
PEDESTRIAN L IGHT CATENARY L IGHT PL ANTER
The lighting fixture should be gracefully arching to spatially define paths or roadways with a unique modern appearance for the industrial feel of the area.
Material preference: stainless steel, cast aluminum, powder coated steel
Color preference: black, dark grey
Optics preference: LED
Color temperature preference: 4,000K
Height preference: 17 foot min.
Space preference: varies
Banner: catenary system designed to hold banners
Example: Hess-Pendo
Cast Aluminum, Black Cast Aluminum, Black
Translucent Acrylic Translucent Acrylic
Polythylene
Cast Aluminum, Silver
Cast Aluminum, Silver
The trash/recycling receptacles should have a simple graceful form and be graffiti resistant.
Trash/recycling receptacles to be placed every 300-400 feet min. in commercial/mixed use area and 1,000 feet min. in residential areas.
Material preference: cast aluminum with polyethylene
Color preference: silver with black
Example: Landscape Form-35 Pitch Litter Receptacle
Accent planters are encouraged at intersections in the commercial/industrial/mixed use area.
Material preference: anodized aluminum or powder coated steel (with hardwood, optional)
Color preference: silver
Size: varies, provide a min. of 3 varying sizes
Example: Landscape From-Sorella Planters
The lighting fixture should share the same style with street light in terms of form, color and materials, and also should contribute to the creation of spaces, wayfinding and social gathering. If applicable, it can share a pole with the street light.
Material preference: stainless steel, cast aluminum, powder coated steel
Color preference: black, dark grey
Optics preference: LED
Height preference: 12 - 17 feet
Color temperature preference: 4,000K
Space preference: achieving .5 foot candle min.; Pedestrian lights should line up with street light
Banner preference: provide at least 9 foot clearance
Example: Hess-Canto G
Additional accent lights such as landscape lighting and recessed wall lights are encouraged as applicable as long as they are small and discrete.
TR ASH / RECYCLING RECEP TACL ES
Powder Coated Metal, Titanium
E X AMPLE STREE TSCAPE GUIDELINES - INDUSTRIAL HUB

169
BENCH BIKE R ACK PL ANTING
Cast Aluminum, Silver
Cast Aluminum, Silver
Broom Finish Concrete
Concrete PaverThermal wood
Benches should ensure the human comfort, heat resistance, with a modern appearance.
Material preference: anodized aluminum or powder coated steel with thermal wood
Color preference: silver
Backed: varies
Arms: varies
Spacing: Every 400-600 feet maximum in commercial/industrial/mixed use areas. Not required in residential areas except in gathering areas.
Example: Landscape From-MultipliCITY Bench
Bike racks should share the same form language and material palette with benches.
Material preference: anodized aluminum or powder coated steel (with hardwood, optional)
Color preference: silver
Example: Landscape From-MultipliCITY Bench
HARDSCAPE
Sidewalk: concrete (brush broom, sandblasted or acid wash) or pavers. Avoid large monotonous paving areas. Break up with material, texture, color or scoring banding.
Artistic paving patterns are encouraged at pedestrian area of intersection or highly active areas to highlight the culture or history of the place.
All surface materials should be durable and slip resistant.
Material preference: concrete or clay pavers (promenade, multi-use path), grey standard concrete(sidewalk), permeable concrete or clay paver optional
Color preference: 20% dark grey and 80% light grey with color accents
Example: Concrete Collaborative-trails
In general, planting design should perform as the primary backbone of the District by using showy texture species and focusing on facilitating stormwater management.
Tree planting design should be formal and be applied at regular intervals with street lights, in order to create a continuous canopy and memorable boulevard experience.
Shade tree spacing preference: 20 - 30 feet O.C. 4 feet from back of curb min.; species preference: White Oak, Mexican Sycamore, Cedar Elm; min. soil volume per tree: 600 cubic feet.
Ornamental tree spacing preference: 15 foot min.; species: Mexican Buckeye, Rusty Blackhaw Vibrunum; min. soil volume per tree: 400 cubic feet.
Rain garden tree spacing preference: 20 feet min.; species: Bold Cypress, American Sycamore; min. soil volume per tree: 600 cubic feet.
Understory planting design: create edge, back drop; do not exceed 30 inches in height; should be colorful, seasonal, habitat benefit and variety of texture to create visual interests.
Maintenance: low maintenance
Sample species: Maiden Grass, White Azalea, Yarrow, Coneflower, Iris, Gulf Muhly, Bull Muhly, Fountain Grass, Spirea, Daylilly, Black Eyed Susan, Sage, Mexican Feather Grass, Cardinal Flower, Sotol, Yucca, Turk’s Cap, Pigeonberry, Mistflower
Gulf Muhly
Maiden Grass
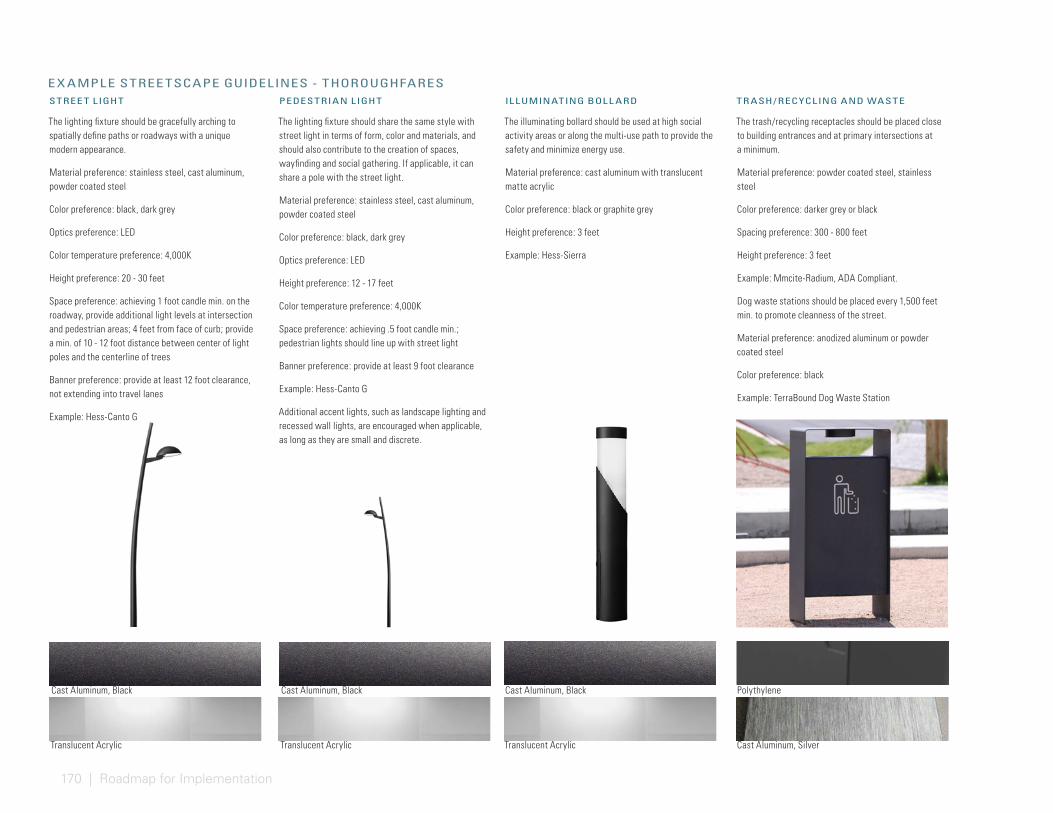
170 | Roadmap for Implementation
STREE T L IGHT PEDESTRIAN L IGHT IL LUMINATING BOL L ARD
The lighting fixture should be gracefully arching to spatially define paths or roadways with a unique modern appearance.
Material preference: stainless steel, cast aluminum, powder coated steel
Color preference: black, dark grey
Optics preference: LED
Color temperature preference: 4,000K
Height preference: 20 - 30 feet
Space preference: achieving 1 foot candle min. on the roadway, provide additional light levels at intersection and pedestrian areas; 4 feet from face of curb; provide a min. of 10 - 12 foot distance between center of light poles and the centerline of trees
Banner preference: provide at least 12 foot clearance, not extending into travel lanes
Example: Hess-Canto G
The lighting fixture should share the same style with street light in terms of form, color and materials, and should also contribute to the creation of spaces, wayfinding and social gathering. If applicable, it can share a pole with the street light.
Material preference: stainless steel, cast aluminum, powder coated steel
Color preference: black, dark grey
Optics preference: LED
Height preference: 12 - 17 feet
Color temperature preference: 4,000K
Space preference: achieving .5 foot candle min.; pedestrian lights should line up with street light
Banner preference: provide at least 9 foot clearance
Example: Hess-Canto G
Additional accent lights, such as landscape lighting and recessed wall lights, are encouraged when applicable, as long as they are small and discrete.
Cast Aluminum, Black Cast Aluminum, Black
Translucent Acrylic Translucent Acrylic Translucent Acrylic
Cast Aluminum, Black
The illuminating bollard should be used at high social activity areas or along the multi-use path to provide the safety and minimize energy use.
Material preference: cast aluminum with translucent matte acrylic
Color preference: black or graphite grey
Height preference: 3 feet
Example: Hess-Sierra
E X AMPLE STREE TSCAPE GUIDELINES - THOROUGHFARESTR ASH / RECYCLING AND WASTE
Polythylene
Cast Aluminum, Silver
The trash/recycling receptacles should be placed close to building entrances and at primary intersections at a minimum.
Material preference: powder coated steel, stainless steel
Color preference: darker grey or black
Spacing preference: 300 - 800 feet
Height preference: 3 feet
Example: Mmcite-Radium, ADA Compliant.
Dog waste stations should be placed every 1,500 feet min. to promote cleanness of the street.
Material preference: anodized aluminum or powder coated steel
Color preference: black
Example: TerraBound Dog Waste Station
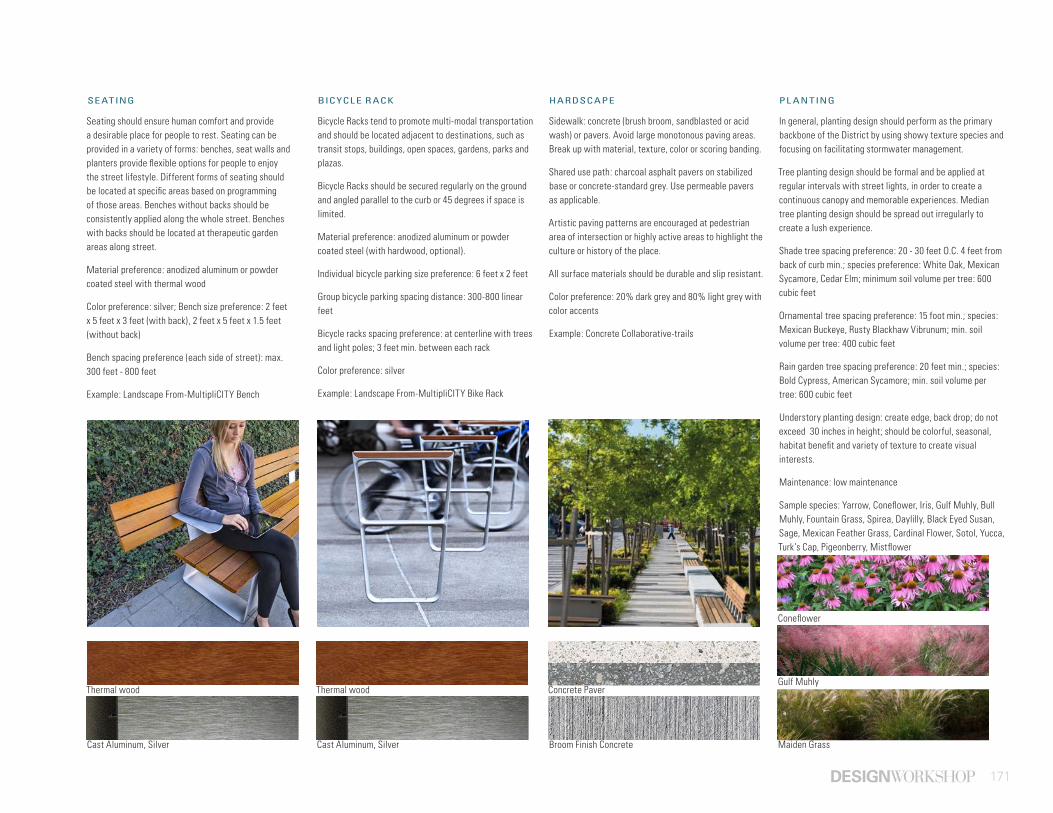
171
SE ATING BICYCL E R ACK HARDSCAPE PL ANTING
Cast Aluminum, Silver Cast Aluminum, Silver Broom Finish Concrete
Concrete PaverGulf Muhly
Maiden Grass
Thermal wood Thermal wood
Seating should ensure human comfort and provide a desirable place for people to rest. Seating can be provided in a variety of forms: benches, seat walls and planters provide flexible options for people to enjoy the street lifestyle. Different forms of seating should be located at specific areas based on programming of those areas. Benches without backs should be consistently applied along the whole street. Benches with backs should be located at therapeutic garden areas along street.
Material preference: anodized aluminum or powder coated steel with thermal wood
Color preference: silver; Bench size preference: 2 feet x 5 feet x 3 feet (with back), 2 feet x 5 feet x 1.5 feet (without back)
Bench spacing preference (each side of street): max. 300 feet - 800 feet
Example: Landscape From-MultipliCITY Bench
Bicycle Racks tend to promote multi-modal transportation and should be located adjacent to destinations, such as transit stops, buildings, open spaces, gardens, parks and plazas.
Bicycle Racks should be secured regularly on the ground and angled parallel to the curb or 45 degrees if space is limited.
Material preference: anodized aluminum or powder coated steel (with hardwood, optional).
Individual bicycle parking size preference: 6 feet x 2 feet
Group bicycle parking spacing distance: 300-800 linear feet
Bicycle racks spacing preference: at centerline with trees and light poles; 3 feet min. between each rack
Color preference: silver
Example: Landscape From-MultipliCITY Bike Rack
Sidewalk: concrete (brush broom, sandblasted or acid wash) or pavers. Avoid large monotonous paving areas. Break up with material, texture, color or scoring banding.
Shared use path: charcoal asphalt pavers on stabilized base or concrete-standard grey. Use permeable pavers as applicable.
Artistic paving patterns are encouraged at pedestrian area of intersection or highly active areas to highlight the culture or history of the place.
All surface materials should be durable and slip resistant.
Color preference: 20% dark grey and 80% light grey with color accents
Example: Concrete Collaborative-trails
In general, planting design should perform as the primary backbone of the District by using showy texture species and focusing on facilitating stormwater management.
Tree planting design should be formal and be applied at regular intervals with street lights, in order to create a continuous canopy and memorable experiences. Median tree planting design should be spread out irregularly to create a lush experience.
Shade tree spacing preference: 20 - 30 feet O.C. 4 feet from back of curb min.; species preference: White Oak, Mexican Sycamore, Cedar Elm; minimum soil volume per tree: 600 cubic feet
Ornamental tree spacing preference: 15 foot min.; species: Mexican Buckeye, Rusty Blackhaw Vibrunum; min. soil volume per tree: 400 cubic feet
Rain garden tree spacing preference: 20 feet min.; species: Bold Cypress, American Sycamore; min. soil volume per tree: 600 cubic feet
Understory planting design: create edge, back drop; do not exceed 30 inches in height; should be colorful, seasonal, habitat benefit and variety of texture to create visual interests.
Maintenance: low maintenance
Sample species: Yarrow, Coneflower, Iris, Gulf Muhly, Bull Muhly, Fountain Grass, Spirea, Daylilly, Black Eyed Susan, Sage, Mexican Feather Grass, Cardinal Flower, Sotol, Yucca, Turk’s Cap, Pigeonberry, Mistflower
Coneflower
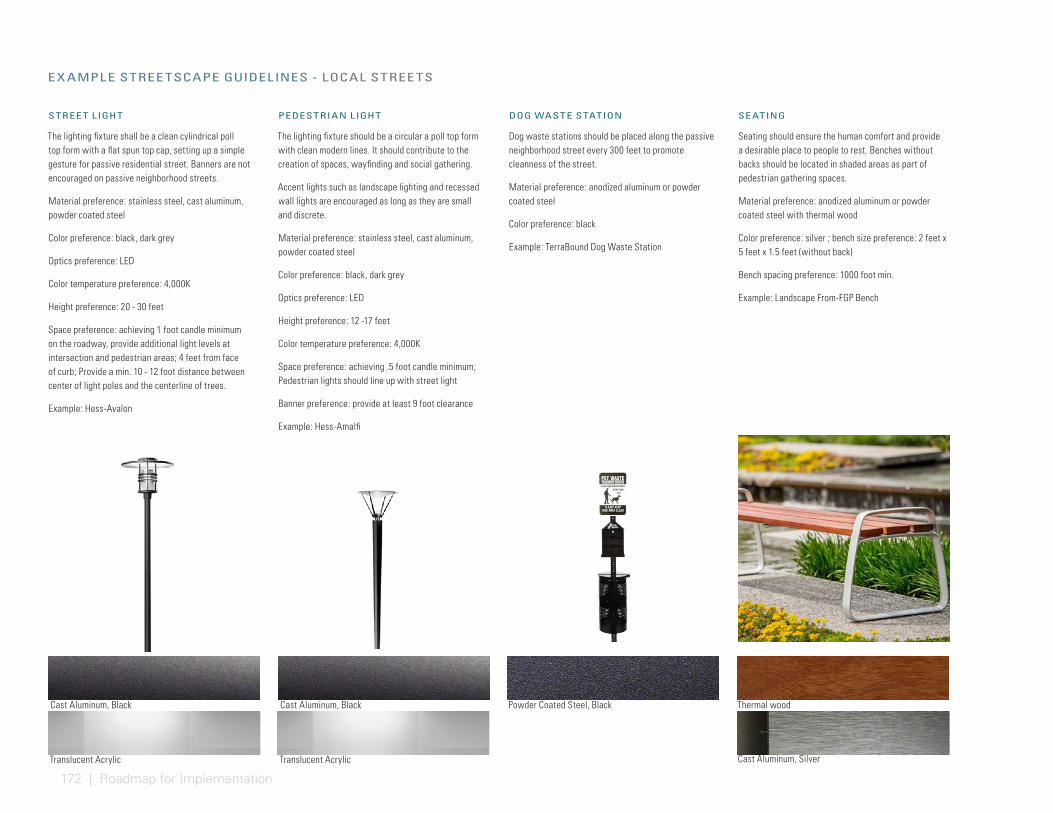
172 | Roadmap for Implementation
STREE T L IGHT SE ATINGDOG WASTE STATION
Cast Aluminum, Black Cast Aluminum, Black
Translucent Acrylic Translucent Acrylic Cast Aluminum, Silver
Thermal woodPowder Coated Steel, Black
Seating should ensure the human comfort and provide a desirable place to people to rest. Benches without backs should be located in shaded areas as part of pedestrian gathering spaces.
Material preference: anodized aluminum or powder coated steel with thermal wood
Color preference: silver ; bench size preference: 2 feet x 5 feet x 1.5 feet (without back)
Bench spacing preference: 1000 foot min.
Example: Landscape From-FGP Bench
Dog waste stations should be placed along the passive neighborhood street every 300 feet to promote cleanness of the street.
Material preference: anodized aluminum or powder coated steel
Color preference: black
Example: TerraBound Dog Waste Station
The lighting fixture shall be a clean cylindrical poll top form with a flat spun top cap, setting up a simple gesture for passive residential street. Banners are not encouraged on passive neighborhood streets.
Material preference: stainless steel, cast aluminum, powder coated steel
Color preference: black, dark grey
Optics preference: LED
Color temperature preference: 4,000K
Height preference: 20 - 30 feet
Space preference: achieving 1 foot candle minimum on the roadway, provide additional light levels at intersection and pedestrian areas; 4 feet from face of curb; Provide a min. 10 - 12 foot distance between center of light poles and the centerline of trees.
Example: Hess-Avalon
The lighting fixture should be a circular a poll top form with clean modern lines. It should contribute to the creation of spaces, wayfinding and social gathering.
Accent lights such as landscape lighting and recessed wall lights are encouraged as long as they are small and discrete.
Material preference: stainless steel, cast aluminum, powder coated steel
Color preference: black, dark grey
Optics preference: LED
Height preference: 12 -17 feet
Color temperature preference: 4,000K
Space preference: achieving .5 foot candle minimum; Pedestrian lights should line up with street light
Banner preference: provide at least 9 foot clearance
Example: Hess-Amalfi
PEDESTRIAN L IGHT
E X AMPLE STREE TSCAPE GUIDELINES - LOCAL STREE TS
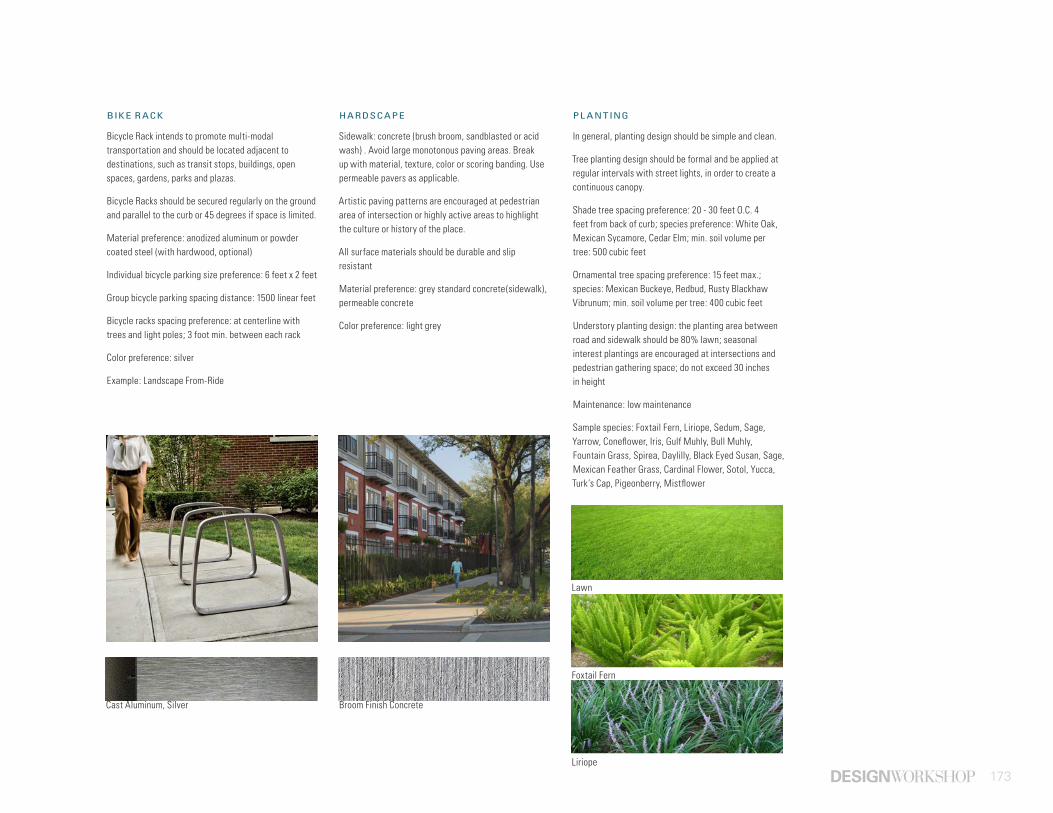
173
BIKE R ACK HARDSCAPE PL ANTING
Cast Aluminum, Silver Broom Finish Concrete
Foxtail Fern
Lawn
Liriope
Bicycle Rack intends to promote multi-modal transportation and should be located adjacent to destinations, such as transit stops, buildings, open spaces, gardens, parks and plazas.
Bicycle Racks should be secured regularly on the ground and parallel to the curb or 45 degrees if space is limited.
Material preference: anodized aluminum or powder coated steel (with hardwood, optional)
Individual bicycle parking size preference: 6 feet x 2 feet
Group bicycle parking spacing distance: 1500 linear feet
Bicycle racks spacing preference: at centerline with trees and light poles; 3 foot min. between each rack
Color preference: silver
Example: Landscape From-Ride
Sidewalk: concrete (brush broom, sandblasted or acid wash) . Avoid large monotonous paving areas. Break up with material, texture, color or scoring banding. Use permeable pavers as applicable.
Artistic paving patterns are encouraged at pedestrian area of intersection or highly active areas to highlight the culture or history of the place.
All surface materials should be durable and slip resistant
Material preference: grey standard concrete(sidewalk), permeable concrete
Color preference: light grey
In general, planting design should be simple and clean.
Tree planting design should be formal and be applied at regular intervals with street lights, in order to create a continuous canopy.
Shade tree spacing preference: 20 - 30 feet O.C. 4 feet from back of curb; species preference: White Oak, Mexican Sycamore, Cedar Elm; min. soil volume per tree: 500 cubic feet
Ornamental tree spacing preference: 15 feet max.; species: Mexican Buckeye, Redbud, Rusty Blackhaw Vibrunum; min. soil volume per tree: 400 cubic feet
Understory planting design: the planting area between road and sidewalk should be 80% lawn; seasonal interest plantings are encouraged at intersections and pedestrian gathering space; do not exceed 30 inches in height
Maintenance: low maintenance
Sample species: Foxtail Fern, Liriope, Sedum, Sage, Yarrow, Coneflower, Iris, Gulf Muhly, Bull Muhly, Fountain Grass, Spirea, Daylilly, Black Eyed Susan, Sage, Mexican Feather Grass, Cardinal Flower, Sotol, Yucca, Turk’s Cap, Pigeonberry, Mistflower
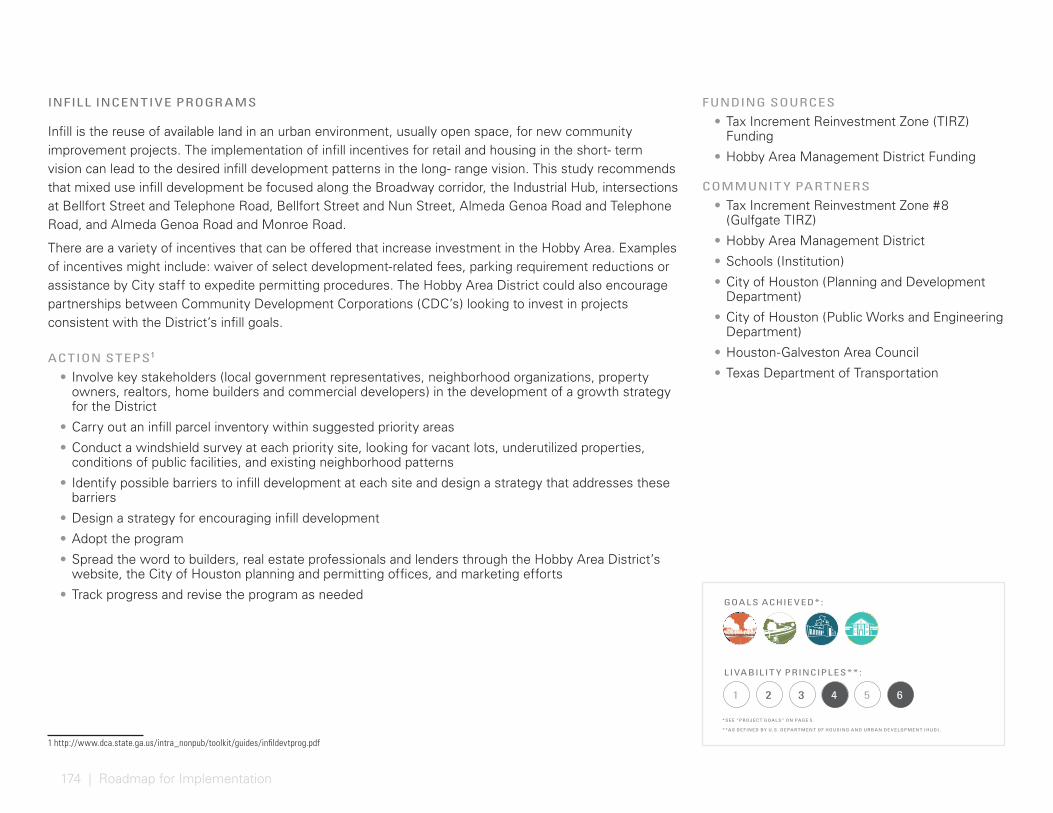
174 | Roadmap for Implementation
INFILL INCENTIVE PROGR AMS
Infill is the reuse of available land in an urban environment, usually open space, for new community improvement projects. The implementation of infill incentives for retail and housing in the short- term vision can lead to the desired infill development patterns in the long- range vision. This study recommends that mixed use infill development be focused along the Broadway corridor, the Industrial Hub, intersections at Bellfort Street and Telephone Road, Bellfort Street and Nun Street, Almeda Genoa Road and Telephone Road, and Almeda Genoa Road and Monroe Road.
There are a variety of incentives that can be offered that increase investment in the Hobby Area. Examples of incentives might include: waiver of select development-related fees, parking requirement reductions or assistance by City staff to expedite permitting procedures. The Hobby Area District could also encourage partnerships between Community Development Corporations (CDC’s) looking to invest in projects consistent with the District’s infill goals.
ACTION STEPS1 • Involve key stakeholders (local government representatives, neighborhood organizations, property
owners, realtors, home builders and commercial developers) in the development of a growth strategy for the District
• Carry out an infill parcel inventory within suggested priority areas
• Conduct a windshield survey at each priority site, looking for vacant lots, underutilized properties, conditions of public facilities, and existing neighborhood patterns
• Identify possible barriers to infill development at each site and design a strategy that addresses these barriers
• Design a strategy for encouraging infill development
• Adopt the program
• Spread the word to builders, real estate professionals and lenders through the Hobby Area District’s website, the City of Houston planning and permitting offices, and marketing efforts
• Track progress and revise the program as needed
1 http://www.dca.state.ga.us/intra_nonpub/toolkit/guides/infildevtprog.pdf
FUNDING SOURCES
• Tax Increment Reinvestment Zone (TIRZ) Funding
• Hobby Area Management District Funding
COMMUNIT Y PARTNERS
• Tax Increment Reinvestment Zone #8 (Gulfgate TIRZ)
• Hobby Area Management District
• Schools (Institution)
• City of Houston (Planning and Development Department)
• City of Houston (Public Works and Engineering Department)
• Houston-Galveston Area Council
• Texas Department of Transportation
GOAL S ACHIE VED* :
L IVABIL IT Y PRINCIPL ES* * :
*SEE “PROJEC T GOA L S” ON PAGE 5 .
* *AS DEFINED BY U.S. DEPA R T MENT OF HOUSING AND URBAN DE V ELOPMENT ( HUD) .
1 65432
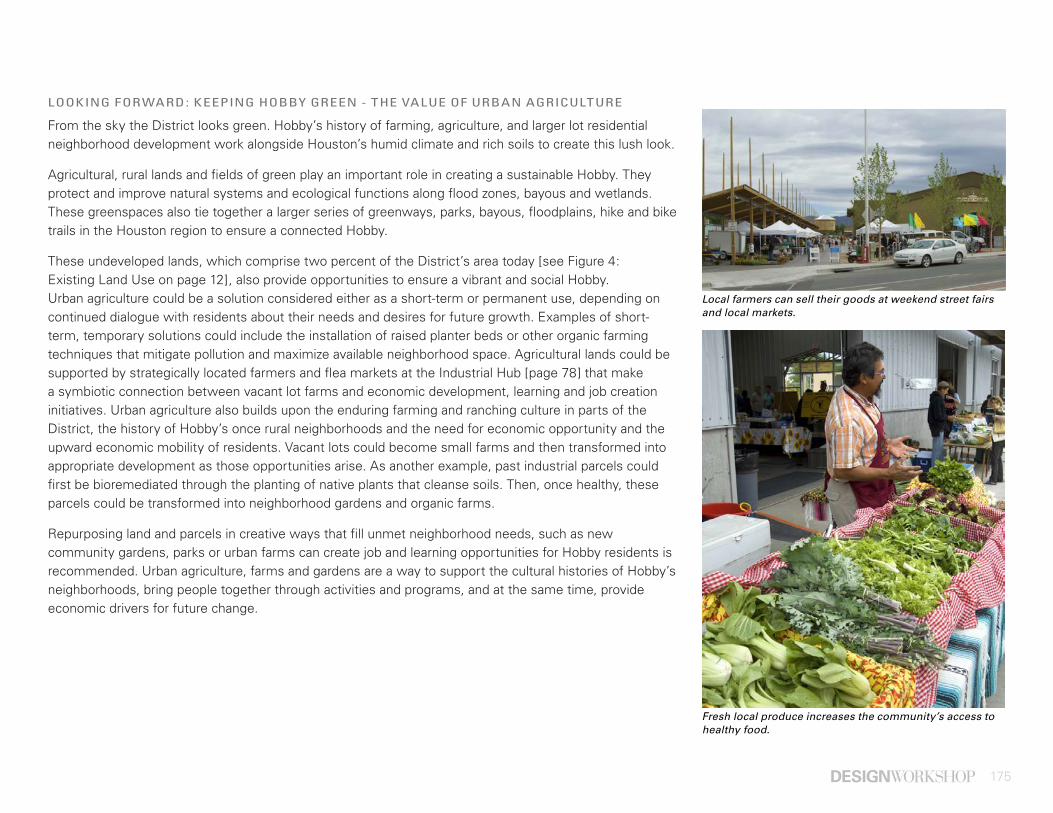
175
LOOKING FORWARD: KEEPING HOBBY GREEN - THE VALUE OF URBAN AGRICULTURE
From the sky the District looks green. Hobby’s history of farming, agriculture, and larger lot residential neighborhood development work alongside Houston’s humid climate and rich soils to create this lush look.
Agricultural, rural lands and fields of green play an important role in creating a sustainable Hobby. They protect and improve natural systems and ecological functions along flood zones, bayous and wetlands. These greenspaces also tie together a larger series of greenways, parks, bayous, floodplains, hike and bike trails in the Houston region to ensure a connected Hobby.
These undeveloped lands, which comprise two percent of the District’s area today [see Figure 4: Existing Land Use on page 12], also provide opportunities to ensure a vibrant and social Hobby. Urban agriculture could be a solution considered either as a short-term or permanent use, depending on continued dialogue with residents about their needs and desires for future growth. Examples of short-term, temporary solutions could include the installation of raised planter beds or other organic farming techniques that mitigate pollution and maximize available neighborhood space. Agricultural lands could be supported by strategically located farmers and flea markets at the Industrial Hub [page 78] that make a symbiotic connection between vacant lot farms and economic development, learning and job creation initiatives. Urban agriculture also builds upon the enduring farming and ranching culture in parts of the District, the history of Hobby’s once rural neighborhoods and the need for economic opportunity and the upward economic mobility of residents. Vacant lots could become small farms and then transformed into appropriate development as those opportunities arise. As another example, past industrial parcels could first be bioremediated through the planting of native plants that cleanse soils. Then, once healthy, these parcels could be transformed into neighborhood gardens and organic farms.
Repurposing land and parcels in creative ways that fill unmet neighborhood needs, such as new community gardens, parks or urban farms can create job and learning opportunities for Hobby residents is recommended. Urban agriculture, farms and gardens are a way to support the cultural histories of Hobby’s neighborhoods, bring people together through activities and programs, and at the same time, provide economic drivers for future change.
Local farmers can sell their goods at weekend street fairs and local markets.
Fresh local produce increases the community’s access to healthy food.
176 | Roadmap for Implementation
CONCLUSIONSENGAGE THE COMMUNIT YTo achieve the future vision for the District, interested parties and neighborhoods must come together and serve as change agents. Change agents focus their energies on achieving the Hobby Livable Centers Study vision and make efforts to achieve each and every project. Part of this effort will be to continue dialogue with key stakeholders about how to best achieve solutions in their neighborhood. All change agents can engage political leaders in actively supporting the vision and implementation projects.
IMPROVE THE PUBLIC REALMIt is also important to have key organizations, such as the Hobby Area Management District, continually pushing for the implementation of ideas detailed in the plan. Coordinate incremental improvements throughout the District with the goals of the plan. The Tax Increment Reinvestment Zone #8 (Gulfgate TIRZ) and Hobby Area Management District are the most localized and best suited to be the champion for improvements to the public realm, working in partnership with the City of Houston and H-GAC, however, everyone has a role as a change agent in the process.
• Developers, property owners and local agencies can continue to explore potential public-private partnerships that contribute to revitalization efforts in the District.
• New developments can coordinate public realm plans with the recommendations of the Hobby Livable Centers Study to create coordinated streetscape improvements throughout the district.
• Local businesses and property owners can complete street-front building improvements to improve the public realm along sidewalks.
• The Tax Increment Reinvestment Zone #8 (Gulfgate TIRZ) can coordinate local businesses, developers, local government agencies, and the Management District to help manage parking as future growth and catalytic development occurs. It can also identify additional H-GAC and TxDOT funding and programming opportunities to support implementation projects.
• City departments can work with developers to issue project approvals, identify incentives, and lift restrictive development requirements inhibiting implementation of this plan.
• The Parks and Recreation Department, Houston Parks Board and Harris County Flood Control District can work collaboratively to acquire, upgrade and maintain parks to improve the public realm in the District, particularly in the southern part of the study area where access to parks is lacking.
• The Management District can continue to coordinate with Police Department to increase actual and perceived safety in the study area.

177
BUILD CATALYST PROJECTSAs an additional method for effecting change, catalyst projects should be selected and developed within the District. The purpose of a catalyst project is to present a vision of how the recommended projects, policies and programs work together to create change. As the District continues to see growth these areas provide a precedent for how development might occur in a way that supports Livable Centers goals. The catalyst sites presented in this plan were selected for their overall development potential and serve as typologies represen-tative of redevelopment that could occur within the District. The development of the future envisioned catalyst sites should also consider market feasibility, and strategic placement for attracted investment and accessibility to the surrounding community.
MARKET THE DISTRICTThe recommendations outlined work together to create a vibrant, lively and desirable district for people to live and businesses to invest. In addition to the District’s current cultural and recreational assets the plan primes the District for private investment. Marketing efforts and partnerships should be made to communicate the growing opportunities within the District.

178 | Roadmap for Implementation
DW LEGACY DESIGN®
We believe that when environment, economics, art and community are combined in harmony with the dictates of the land and needs
of society, magical places result — sustainable places of timeless beauty, significant value and enduring quality, places that lift the spirit.
Design Workshop is dedicated to creating Legacy projects: for our clients, for society and for the well-being of our planet.
ASHEVILLE • ASPEN • AUSTIN • CHICAGO • DENVER • DUBAI • HOUSTON • LAKE TAHOE • LOS ANGELES • SHANGHAI
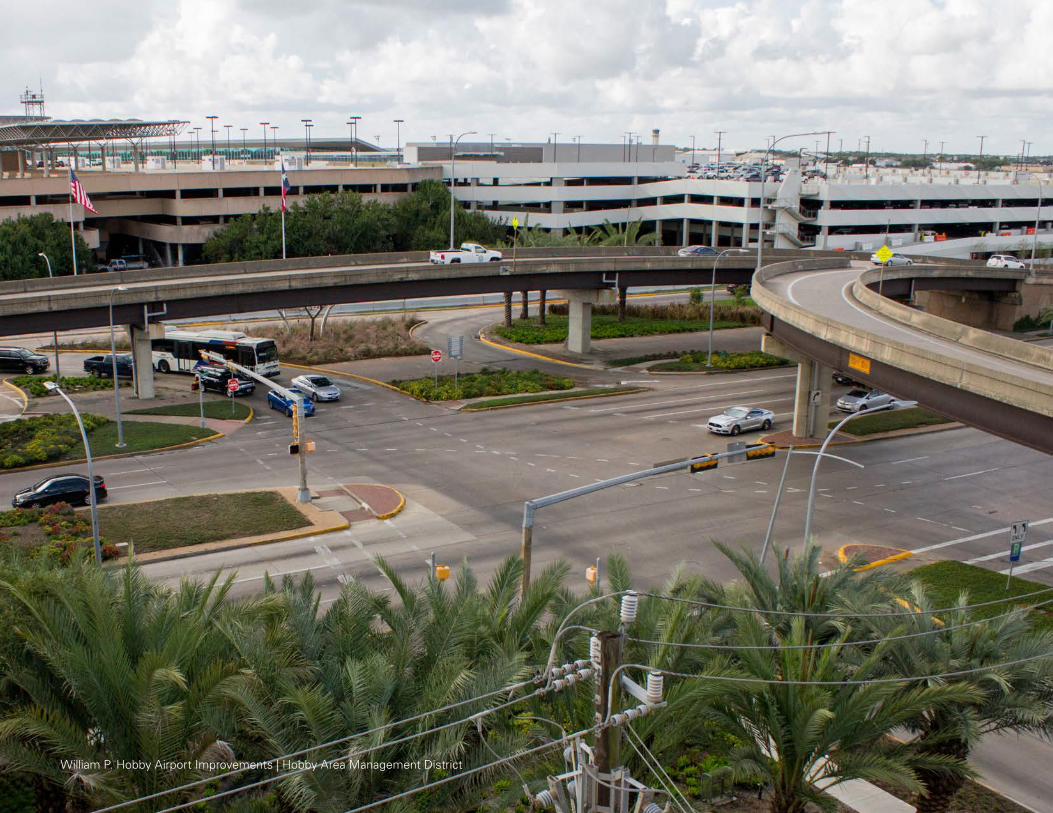
179 | AppendixWilliam P. Hobby Airport Improvements | Hobby Area Management District

180
Appendix

181 | Appendix
APPENDIX AVISION ONLINE POLL
Value Percent Count Percent
1 Live in Hobby area 185 77.7%
2 Live nearby 37 15.5%
3 Work here 19 8.0%
4 Property owner 113 47.5%
5 Business owner 7 2.9%
6 Commute through 27 11.3%
7Use civic amenities(parks, churches, library,etc.)
85 35.7%
8Other – please providecomment(s)
15 6.3%
- Total 488 205.0%
Minimum Maximum Mean Variance Std. Dev. Respondents
1 8 3.44 5.75 2.4 238
Before we begin the online survey, please tell us your connection to the Hobby area(choose all that apply):
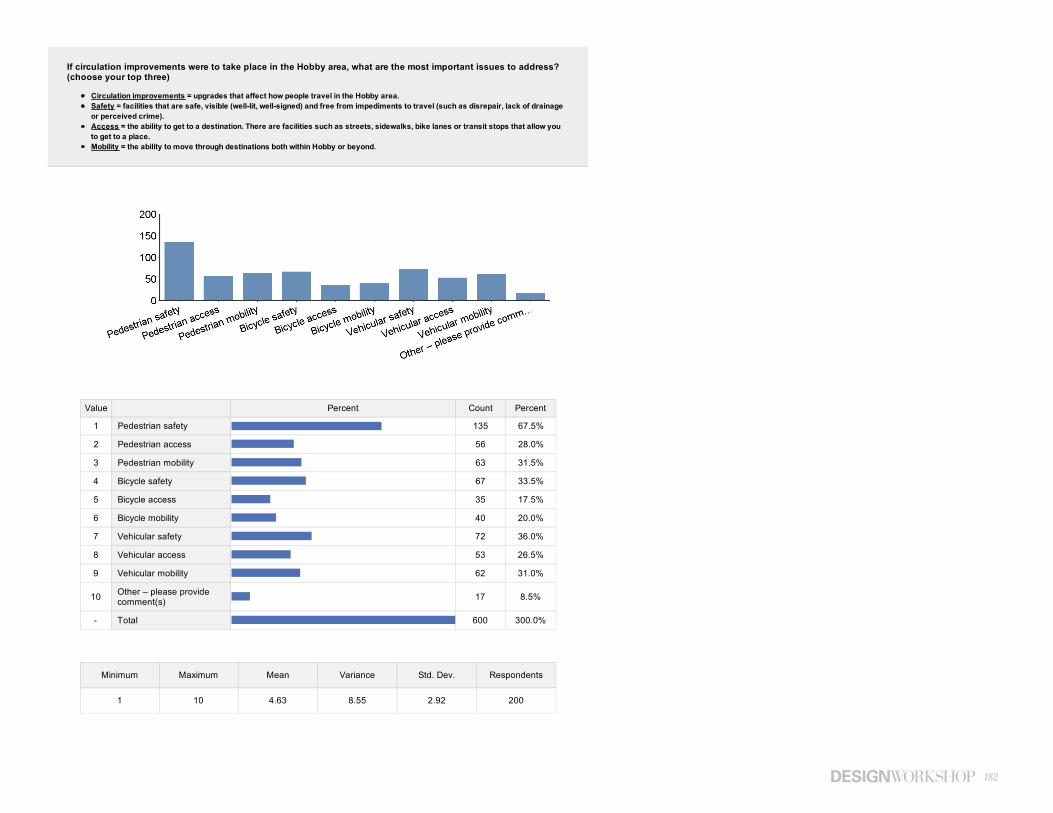
182
Value Percent Count Percent
1 Pedestrian safety 135 67.5%
2 Pedestrian access 56 28.0%
3 Pedestrian mobility 63 31.5%
4 Bicycle safety 67 33.5%
5 Bicycle access 35 17.5%
6 Bicycle mobility 40 20.0%
7 Vehicular safety 72 36.0%
8 Vehicular access 53 26.5%
9 Vehicular mobility 62 31.0%
10Other – please providecomment(s)
17 8.5%
- Total 600 300.0%
Minimum Maximum Mean Variance Std. Dev. Respondents
1 10 4.63 8.55 2.92 200
If circulation improvements were to take place in the Hobby area, what are the most important issues to address?(choose your top three)
Circulation improvements = upgrades that affect how people travel in the Hobby area.
Safety = facilities that are safe, visible (well-lit, well-signed) and free from impediments to travel (such as disrepair, lack of drainage
or perceived crime).
Access = the ability to get to a destination. There are facilities such as streets, sidewalks, bike lanes or transit stops that allow you
to get to a place.
Mobility = the ability to move through destinations both within Hobby or beyond.
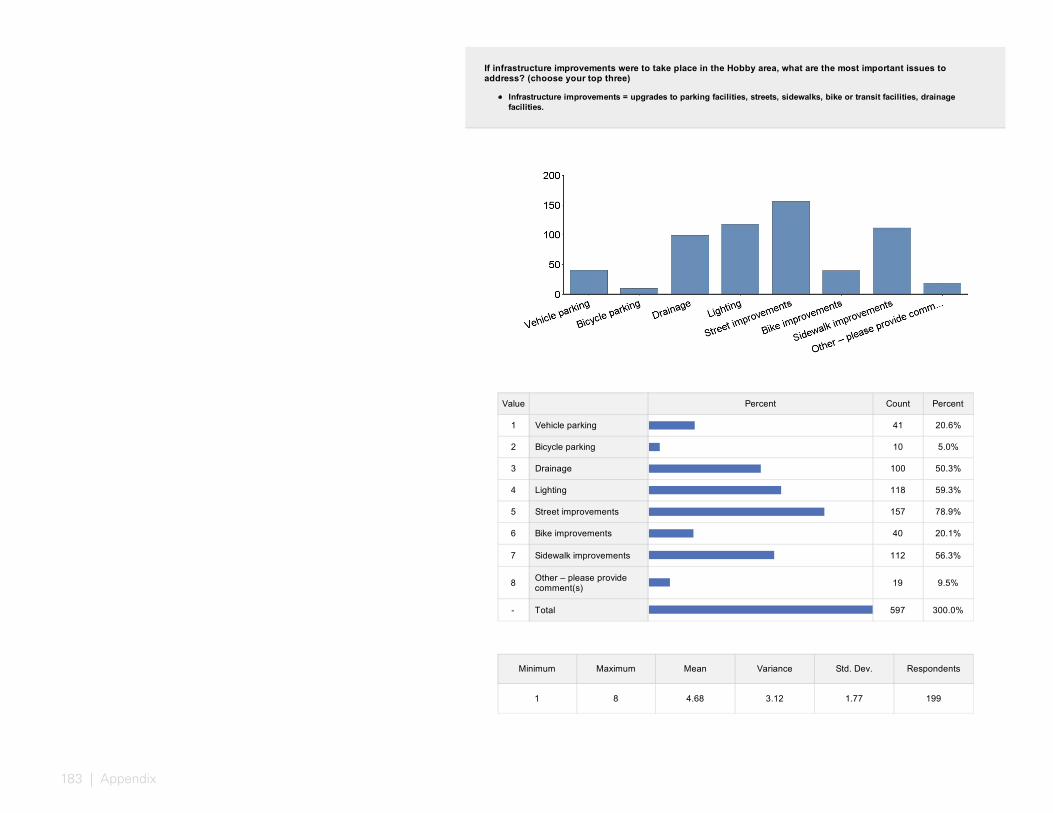
183 | Appendix
Value Percent Count Percent
1 Vehicle parking 41 20.6%
2 Bicycle parking 10 5.0%
3 Drainage 100 50.3%
4 Lighting 118 59.3%
5 Street improvements 157 78.9%
6 Bike improvements 40 20.1%
7 Sidewalk improvements 112 56.3%
8Other – please providecomment(s)
19 9.5%
- Total 597 300.0%
Minimum Maximum Mean Variance Std. Dev. Respondents
1 8 4.68 3.12 1.77 199
If infrastructure improvements were to take place in the Hobby area, what are the most important issues toaddress? (choose your top three)
Infrastructure improvements = upgrades to parking facilities, streets, sidewalks, bike or transit facilities, drainage
facilities.
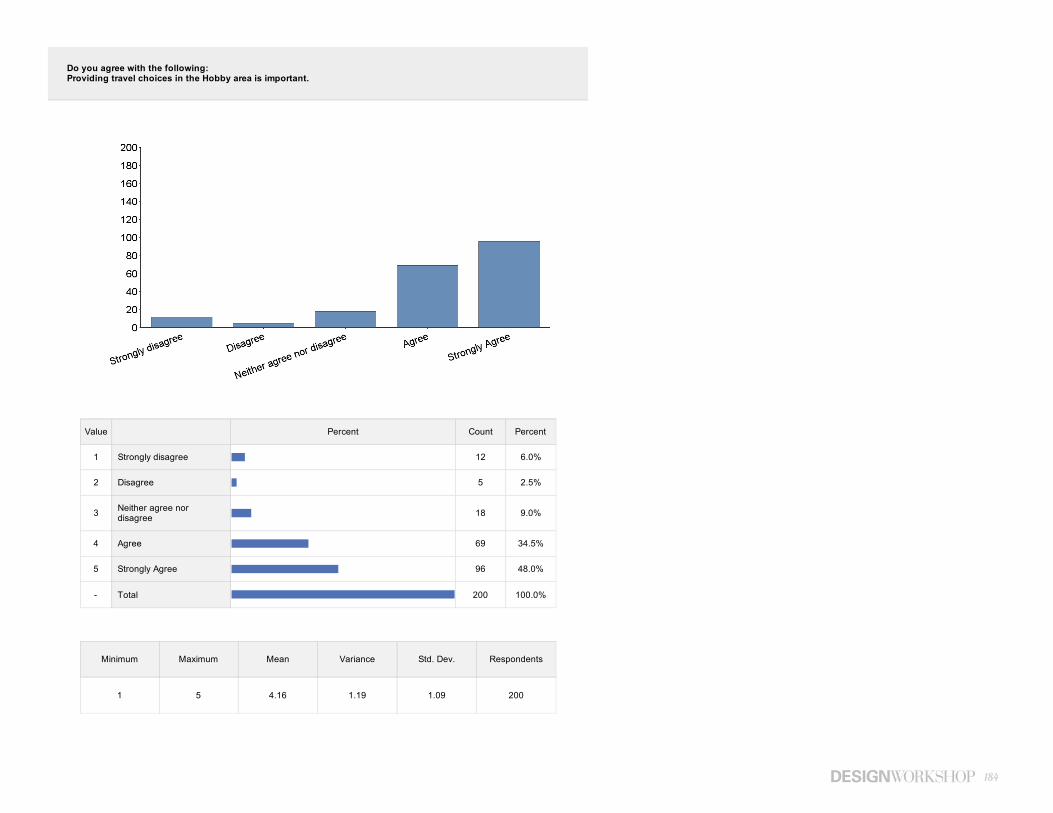
184
Value Percent Count Percent
1 Strongly disagree 12 6.0%
2 Disagree 5 2.5%
3Neither agree nordisagree
18 9.0%
4 Agree 69 34.5%
5 Strongly Agree 96 48.0%
- Total 200 100.0%
Minimum Maximum Mean Variance Std. Dev. Respondents
1 5 4.16 1.19 1.09 200
Do you agree with the following: Providing travel choices in the Hobby area is important.

185 | Appendix
Value Percent Count Percent
1 Shopping opportunities 170 85.0%
2 Work opportunities 75 37.5%
3 Play opportunities 133 66.5%
4 Learning opportunities 72 36.0%
5 Worship opportunities 21 10.5%
6 Dining opportunities 165 82.5%
7Other – please providecomment(s)
24 12.0%
- Total 660 330.0%
Minimum Maximum Mean Variance Std. Dev. Respondents
1 7 3.44 4.03 2.01 200
What types of additional activities or amenities would you like to see in the Hobby area?(choose all that apply)
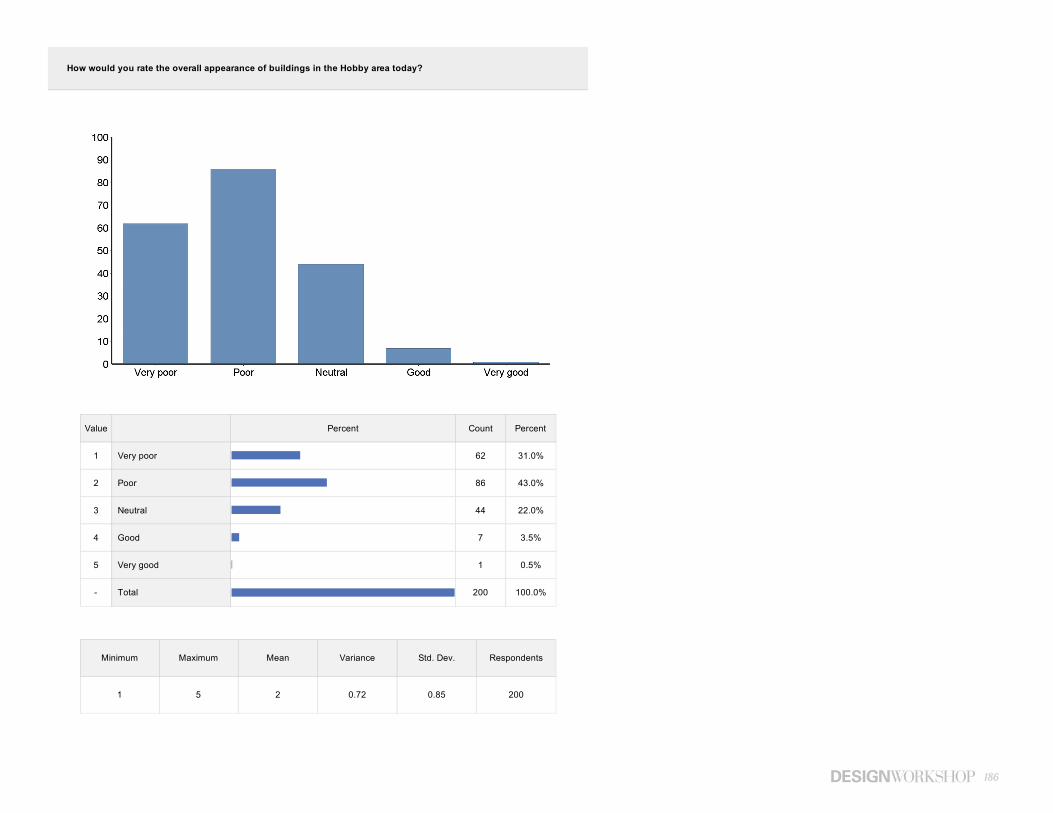
186
Value Percent Count Percent
1 Very poor 62 31.0%
2 Poor 86 43.0%
3 Neutral 44 22.0%
4 Good 7 3.5%
5 Very good 1 0.5%
- Total 200 100.0%
Minimum Maximum Mean Variance Std. Dev. Respondents
1 5 2 0.72 0.85 200
How would you rate the overall appearance of buildings in the Hobby area today?
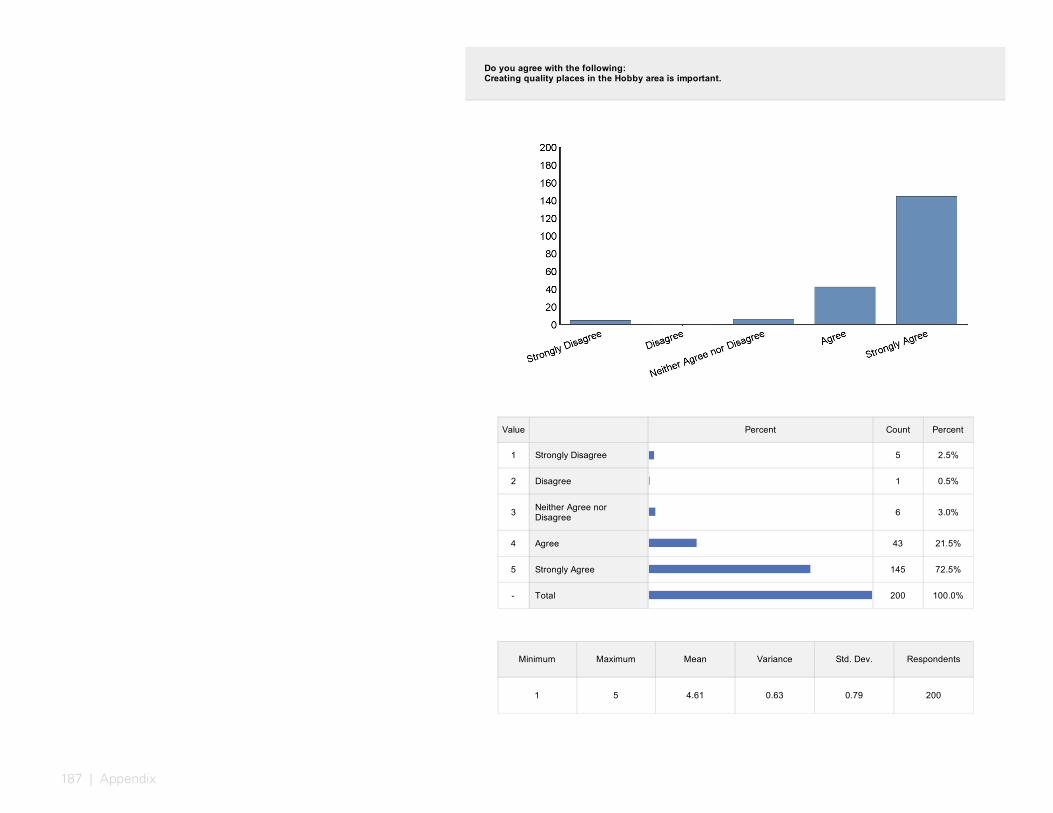
187 | Appendix
Value Percent Count Percent
1 Strongly Disagree 5 2.5%
2 Disagree 1 0.5%
3Neither Agree norDisagree
6 3.0%
4 Agree 43 21.5%
5 Strongly Agree 145 72.5%
- Total 200 100.0%
Minimum Maximum Mean Variance Std. Dev. Respondents
1 5 4.61 0.63 0.79 200
Do you agree with the following:Creating quality places in the Hobby area is important.
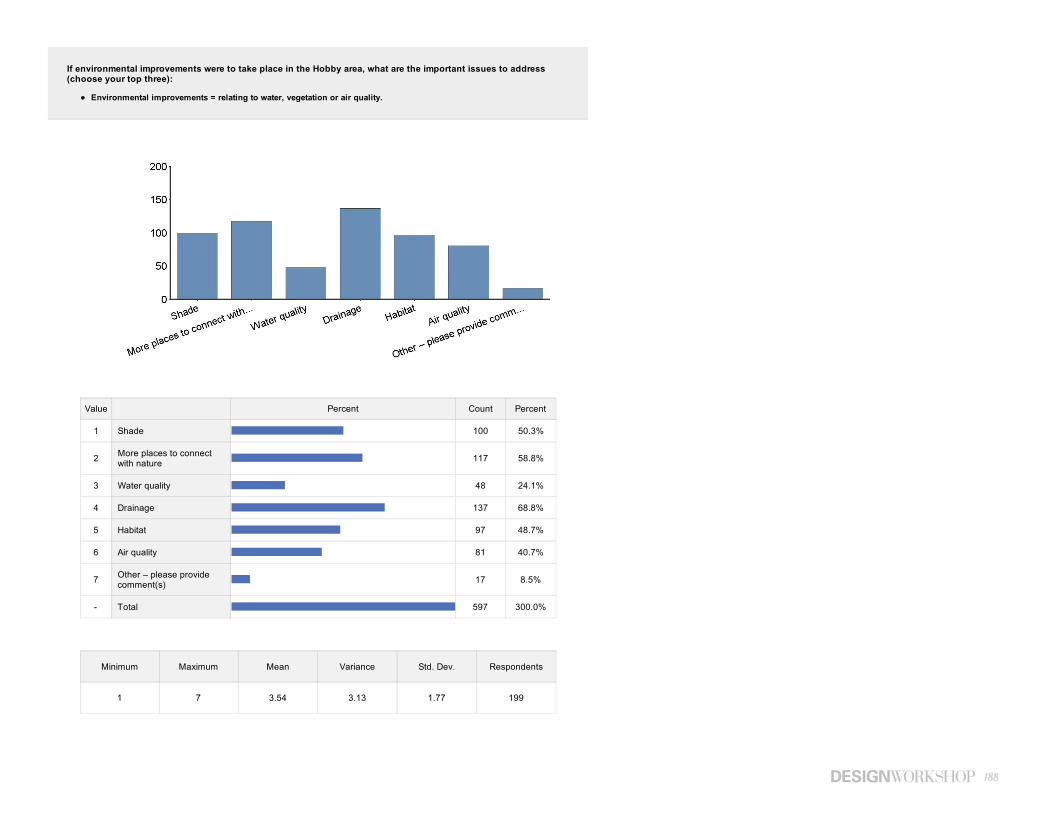
188
Value Percent Count Percent
1 Shade 100 50.3%
2More places to connectwith nature
117 58.8%
3 Water quality 48 24.1%
4 Drainage 137 68.8%
5 Habitat 97 48.7%
6 Air quality 81 40.7%
7Other – please providecomment(s)
17 8.5%
- Total 597 300.0%
Minimum Maximum Mean Variance Std. Dev. Respondents
1 7 3.54 3.13 1.77 199
If environmental improvements were to take place in the Hobby area, what are the important issues to address(choose your top three):
Environmental improvements = relating to water, vegetation or air quality.
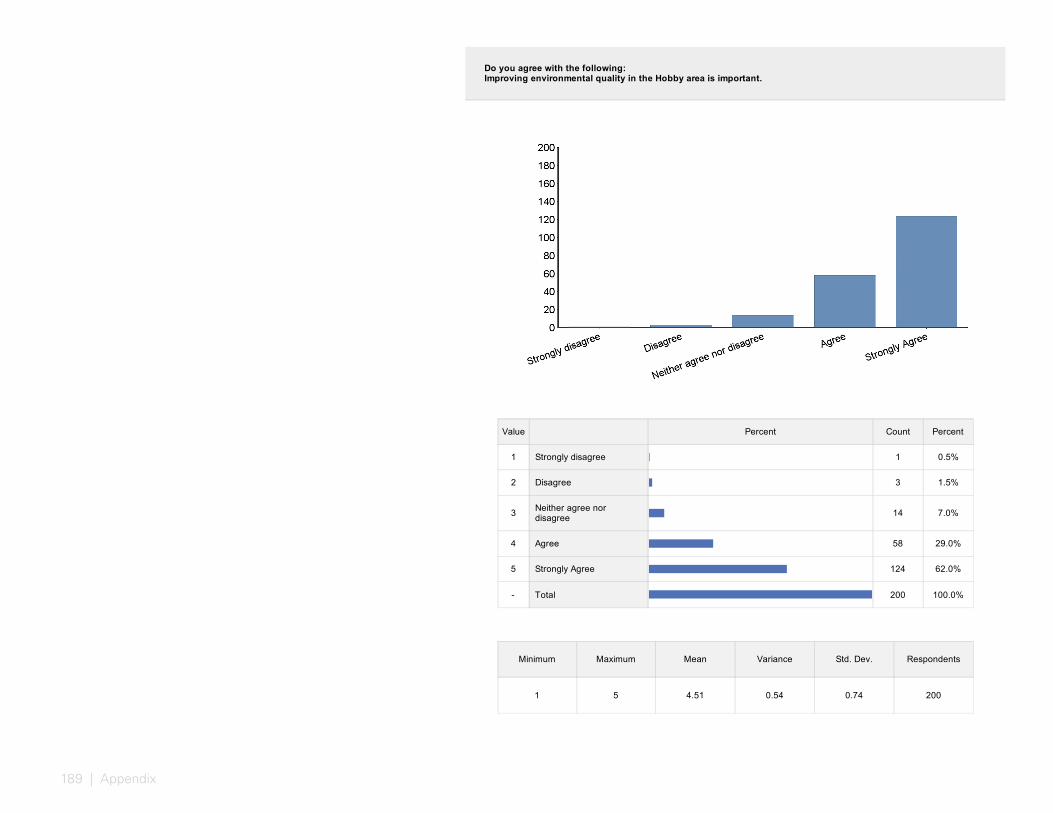
189 | Appendix
Value Percent Count Percent
1 Strongly disagree 1 0.5%
2 Disagree 3 1.5%
3Neither agree nordisagree
14 7.0%
4 Agree 58 29.0%
5 Strongly Agree 124 62.0%
- Total 200 100.0%
Minimum Maximum Mean Variance Std. Dev. Respondents
1 5 4.51 0.54 0.74 200
Do you agree with the following:Improving environmental quality in the Hobby area is important.
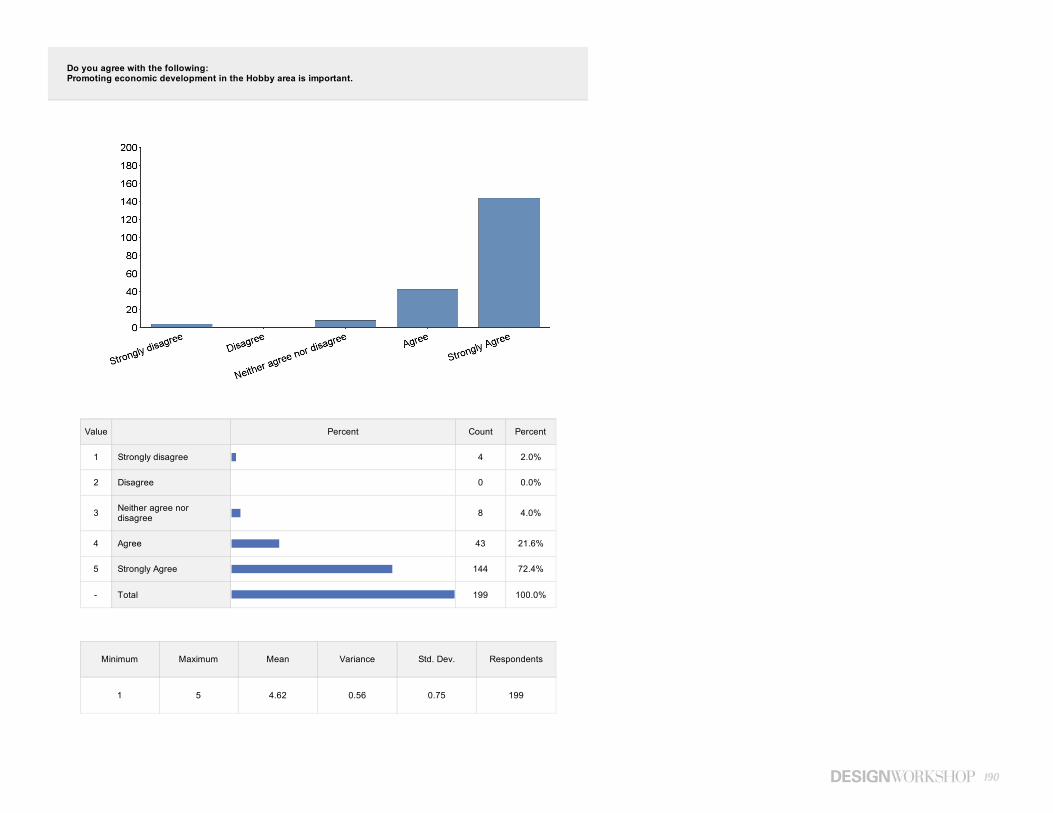
190
Value Percent Count Percent
1 Strongly disagree 4 2.0%
2 Disagree 0 0.0%
3Neither agree nordisagree
8 4.0%
4 Agree 43 21.6%
5 Strongly Agree 144 72.4%
- Total 199 100.0%
Minimum Maximum Mean Variance Std. Dev. Respondents
1 5 4.62 0.56 0.75 199
Do you agree with the following:Promoting economic development in the Hobby area is important.

191 | Appendix
Value Percent Count Percent
1Provide travel choices inthe Hobby area
15 7.5%
2Create quality places inthe Hobby area
92 46.0%
3Improve environmentalquality in the Hobby area
22 11.0%
4Promote economicdevelopment in the Hobbyarea
57 28.5%
5Other – please providecomment(s)
14 7.0%
- Total 200 100.0%
Minimum Maximum Mean Variance Std. Dev. Respondents
1 5 2.82 1.3 1.14 200
I believe the most important goal to focus on is (choose one)…
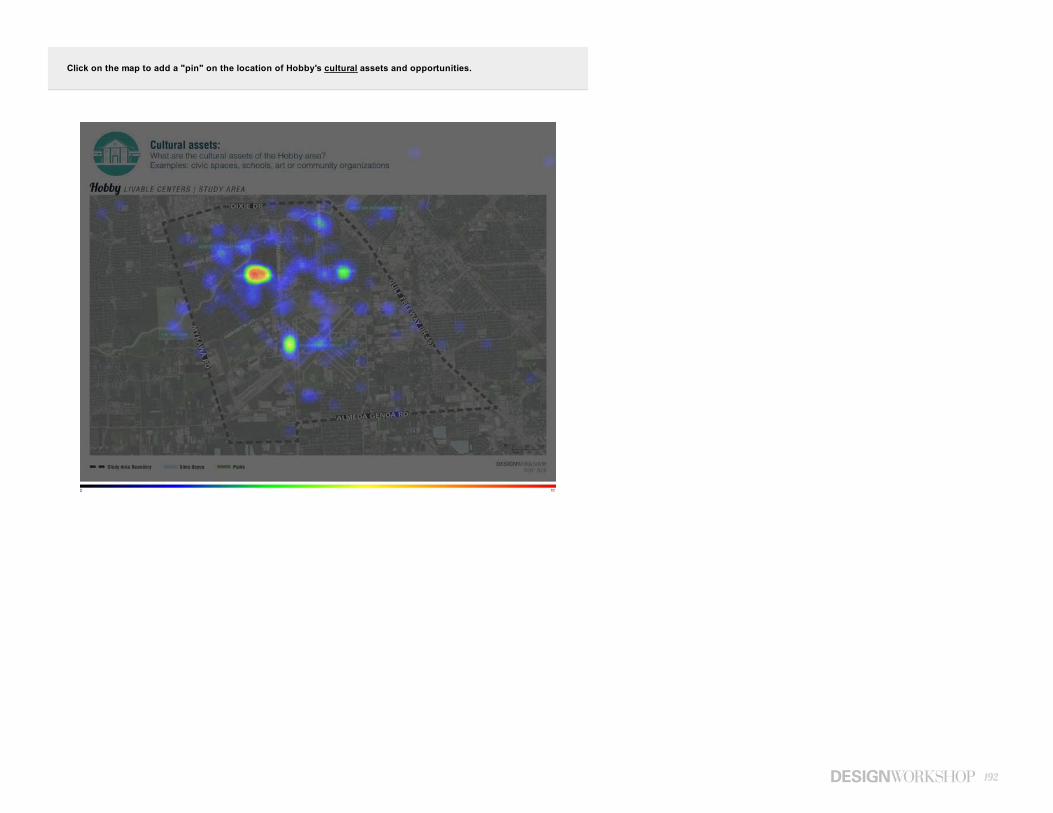
192
Click on the map to add a "pin" on the location of Hobby's cultural assets and opportunities.
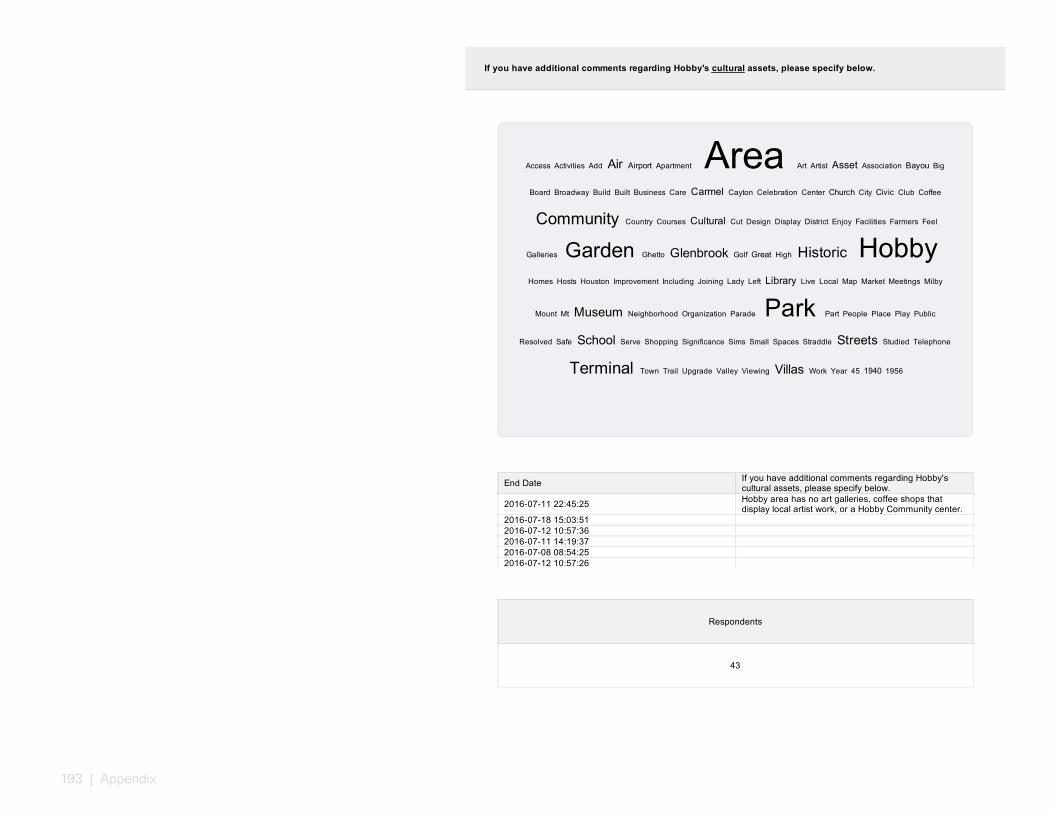
193 | Appendix
End DateIf you have additional comments regarding Hobby'scultural assets, please specify below.
2016-07-11 22:45:25Hobby area has no art galleries, coffee shops thatdisplay local artist work, or a Hobby Community center.
2016-07-18 15:03:51
2016-07-12 10:57:36
2016-07-11 14:19:37
2016-07-08 08:54:25
2016-07-12 10:57:26
2016-07-11 15:50:55
2016-07-11 16:27:08
2016-07-02 17:25:41
2016-07-02 19:49:59
2016-07-01 21:28:54
2016-07-01 12:21:20
2016-07-02 11:10:01
2016-07-01 22:09:16
Respondents
43
Access Activities Add Air Airport Apartment Area Art Artist Asset Association Bayou Big
Board Broadway Build Built Business Care Carmel Cayton Celebration Center Church City Civic Club Coffee
Community Country Courses Cultural Cut Design Display District Enjoy Facilities Farmers Feel
Galleries Garden Ghetto Glenbrook Golf Great High Historic HobbyHomes Hosts Houston Improvement Including Joining Lady Left Library Live Local Map Market Meetings Milby
Mount Mt Museum Neighborhood Organization Parade Park Part People Place Play Public
Resolved Safe School Serve Shopping Significance Sims Small Spaces Straddle Streets Studied Telephone
Terminal Town Trail Upgrade Valley Viewing Villas Work Year 45 1940 1956
If you have additional comments regarding Hobby's cultural assets, please specify below.
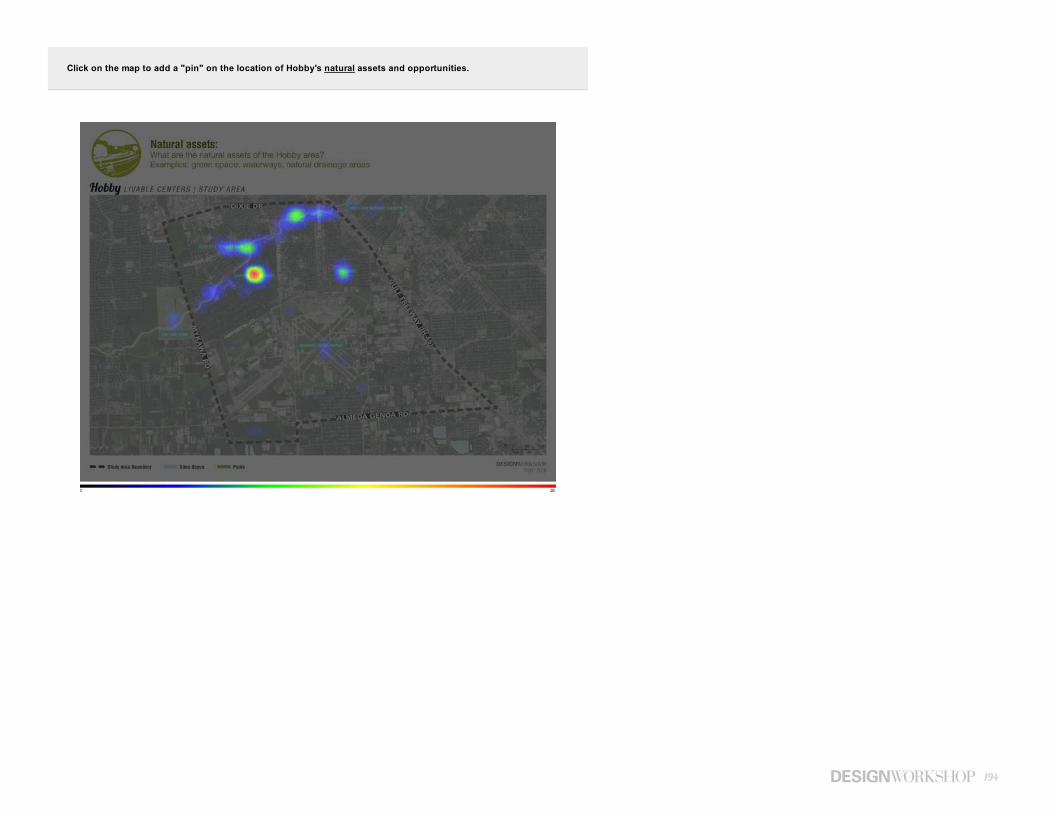
194
Click on the map to add a "pin" on the location of Hobby's natural assets and opportunities.
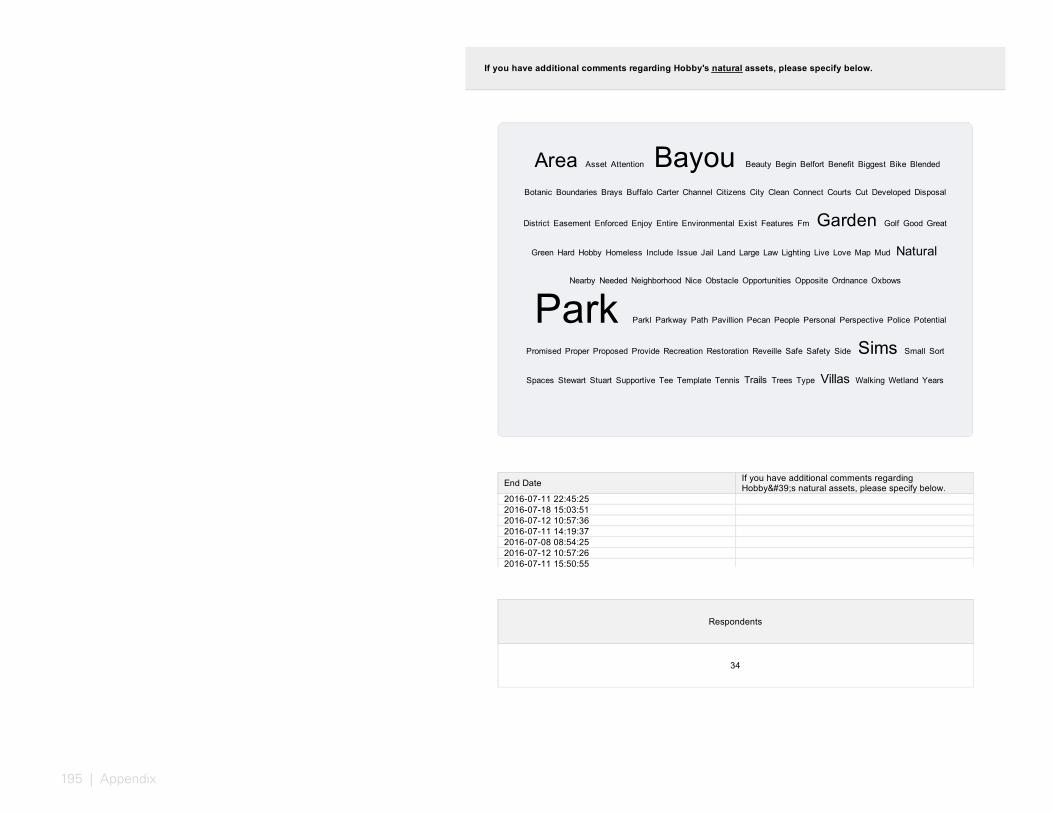
195 | Appendix
End DateIf you have additional comments regardingHobby's natural assets, please specify below.
2016-07-11 22:45:25
2016-07-18 15:03:51
2016-07-12 10:57:36
2016-07-11 14:19:37
2016-07-08 08:54:25
2016-07-12 10:57:26
2016-07-11 15:50:55
2016-07-11 16:27:08
2016-07-02 17:25:41
2016-07-02 19:49:59
2016-07-01 21:28:54
2016-07-01 12:21:20
2016-07-02 11:10:01
2016-07-01 22:09:16
Respondents
34
Area Asset Attention Bayou Beauty Begin Belfort Benefit Biggest Bike Blended
Botanic Boundaries Brays Buffalo Carter Channel Citizens City Clean Connect Courts Cut Developed Disposal
District Easement Enforced Enjoy Entire Environmental Exist Features Fm Garden Golf Good Great
Green Hard Hobby Homeless Include Issue Jail Land Large Law Lighting Live Love Map Mud Natural
Nearby Needed Neighborhood Nice Obstacle Opportunities Opposite Ordnance Oxbows
Park Parkl Parkway Path Pavillion Pecan People Personal Perspective Police Potential
Promised Proper Proposed Provide Recreation Restoration Reveille Safe Safety Side Sims Small Sort
Spaces Stewart Stuart Supportive Tee Template Tennis Trails Trees Type Villas Walking Wetland Years
If you have additional comments regarding Hobby's natural assets, please specify below.
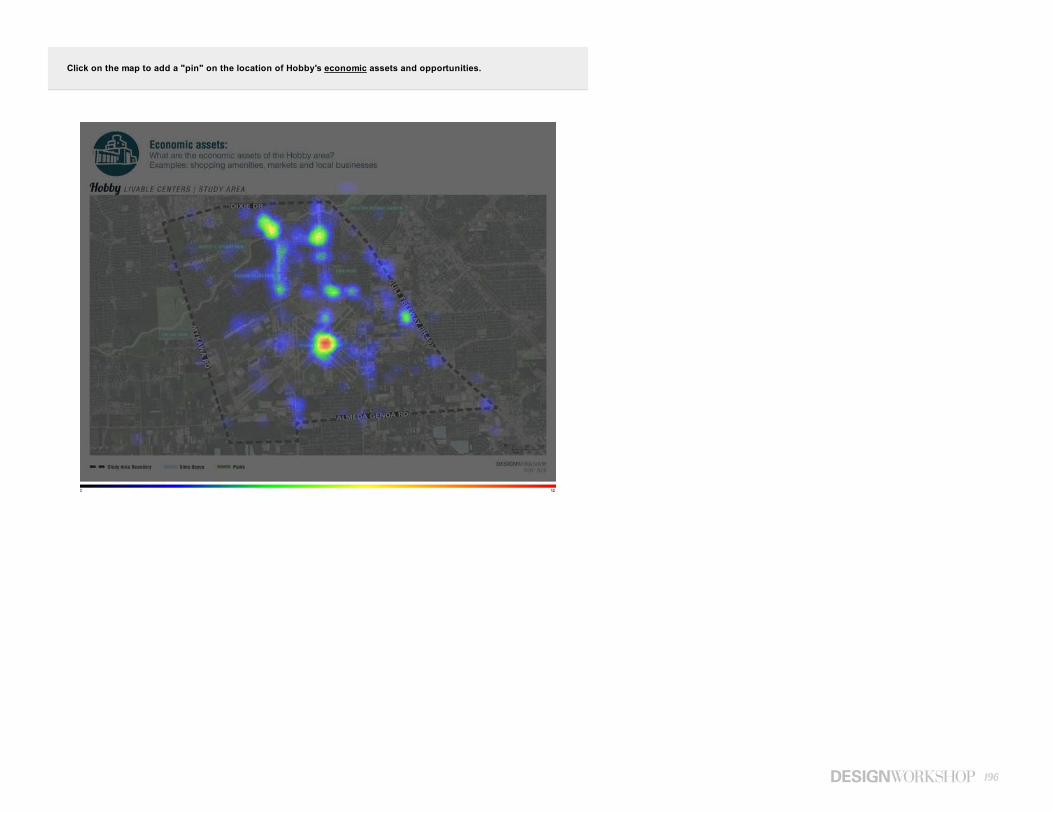
196
Click on the map to add a "pin" on the location of Hobby's economic assets and opportunities.
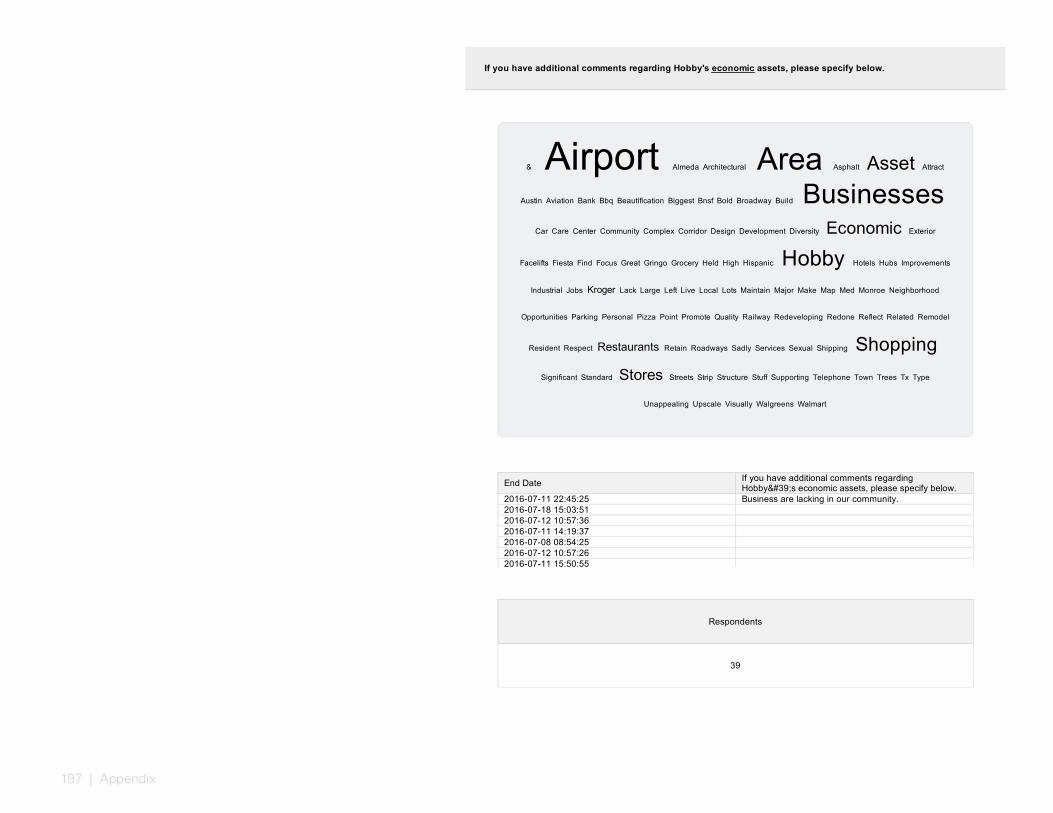
197 | Appendix
End DateIf you have additional comments regardingHobby's economic assets, please specify below.
2016-07-11 22:45:25 Business are lacking in our community.
2016-07-18 15:03:51
2016-07-12 10:57:36
2016-07-11 14:19:37
2016-07-08 08:54:25
2016-07-12 10:57:26
2016-07-11 15:50:55
2016-07-11 16:27:08
2016-07-02 17:25:41
2016-07-02 19:49:59
2016-07-01 21:28:54
2016-07-01 12:21:20
2016-07-02 11:10:01
2016-07-01 22:09:16
Respondents
39
& Airport Almeda Architectural Area Asphalt Asset Attract
Austin Aviation Bank Bbq Beautification Biggest Bnsf Bold Broadway Build BusinessesCar Care Center Community Complex Corridor Design Development Diversity Economic Exterior
Facelifts Fiesta Find Focus Great Gringo Grocery Held High Hispanic Hobby Hotels Hubs Improvements
Industrial Jobs Kroger Lack Large Left Live Local Lots Maintain Major Make Map Med Monroe Neighborhood
Opportunities Parking Personal Pizza Point Promote Quality Railway Redeveloping Redone Reflect Related Remodel
Resident Respect Restaurants Retain Roadways Sadly Services Sexual Shipping Shopping
Significant Standard Stores Streets Strip Structure Stuff Supporting Telephone Town Trees Tx Type
Unappealing Upscale Visually Walgreens Walmart
If you have additional comments regarding Hobby's economic assets, please specify below.
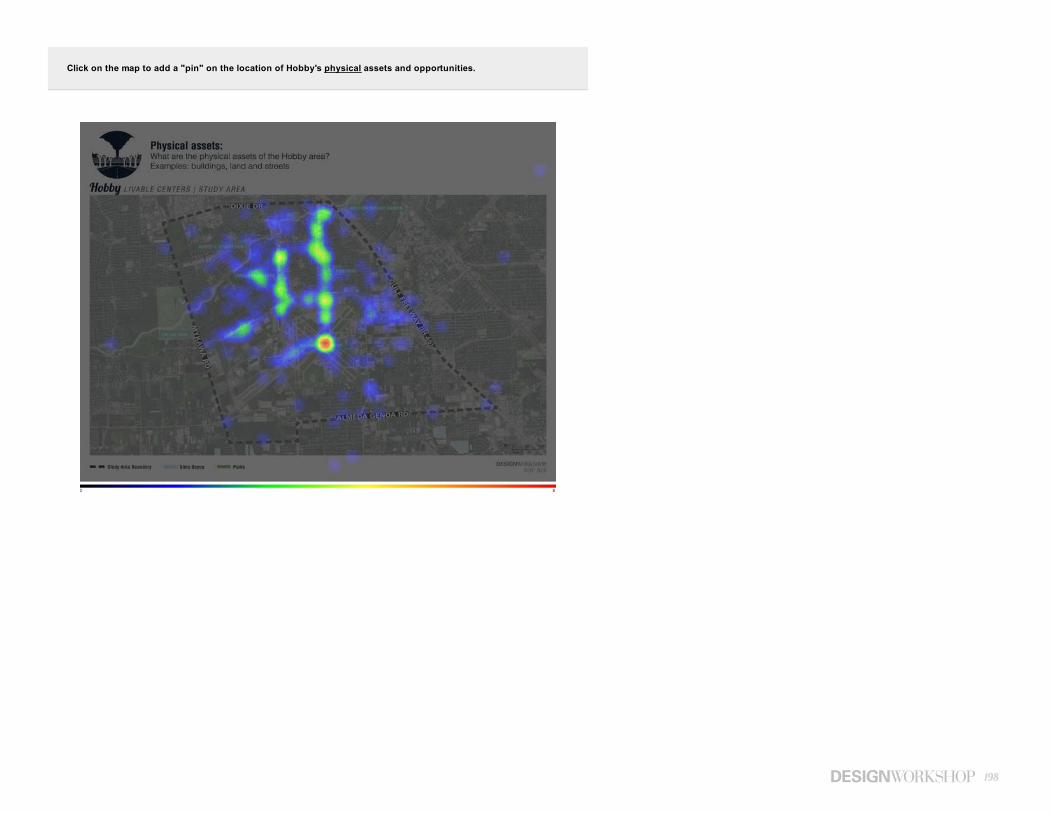
198
Click on the map to add a "pin" on the location of Hobby's physical assets and opportunities.
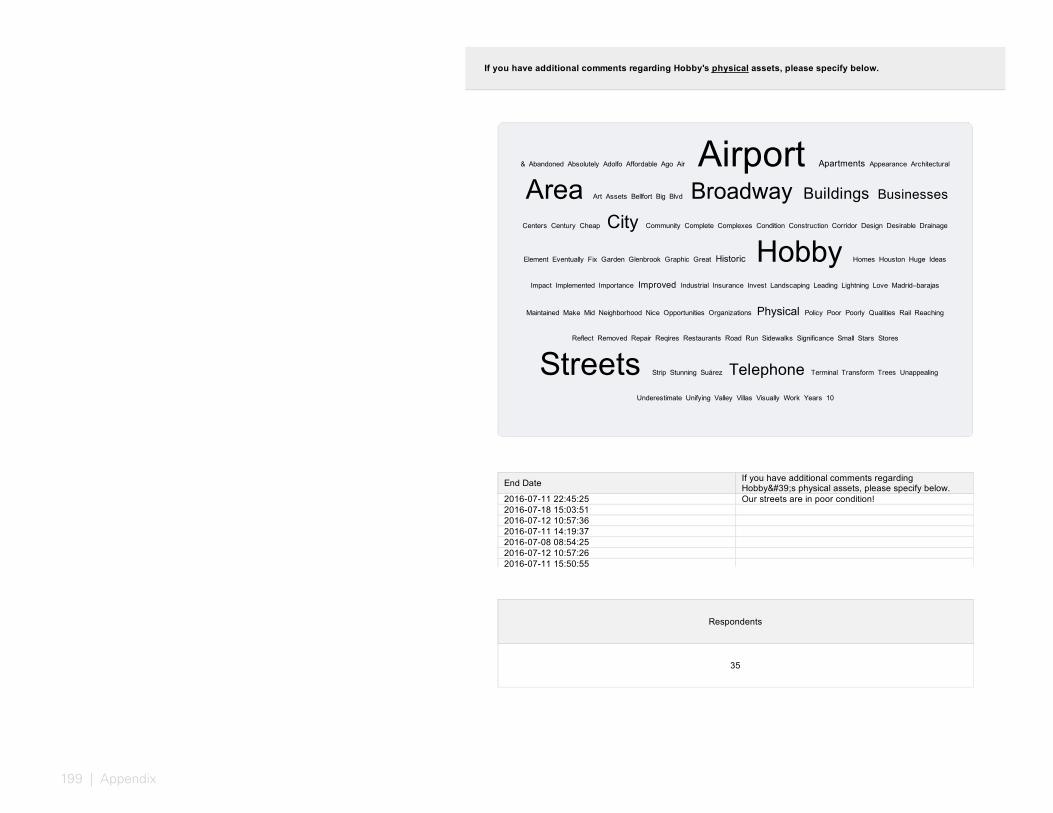
199 | Appendix
End DateIf you have additional comments regardingHobby's physical assets, please specify below.
2016-07-11 22:45:25 Our streets are in poor condition!
2016-07-18 15:03:51
2016-07-12 10:57:36
2016-07-11 14:19:37
2016-07-08 08:54:25
2016-07-12 10:57:26
2016-07-11 15:50:55
2016-07-11 16:27:08
2016-07-02 17:25:41
2016-07-02 19:49:59
2016-07-01 21:28:54
2016-07-01 12:21:20
2016-07-02 11:10:01
2016-07-01 22:09:16
Respondents
35
& Abandoned Absolutely Adolfo Affordable Ago Air Airport Apartments Appearance Architectural
Area Art Assets Bellfort Big Blvd Broadway Buildings Businesses
Centers Century Cheap City Community Complete Complexes Condition Construction Corridor Design Desirable Drainage
Element Eventually Fix Garden Glenbrook Graphic Great Historic Hobby Homes Houston Huge Ideas
Impact Implemented Importance Improved Industrial Insurance Invest Landscaping Leading Lightning Love Madrid–barajas
Maintained Make Mid Neighborhood Nice Opportunities Organizations Physical Policy Poor Poorly Qualities Rail Reaching
Reflect Removed Repair Reqires Restaurants Road Run Sidewalks Significance Small Stars Stores
Streets Strip Stunning Suárez Telephone Terminal Transform Trees Unappealing
Underestimate Unifying Valley Villas Visually Work Years 10
If you have additional comments regarding Hobby's physical assets, please specify below.
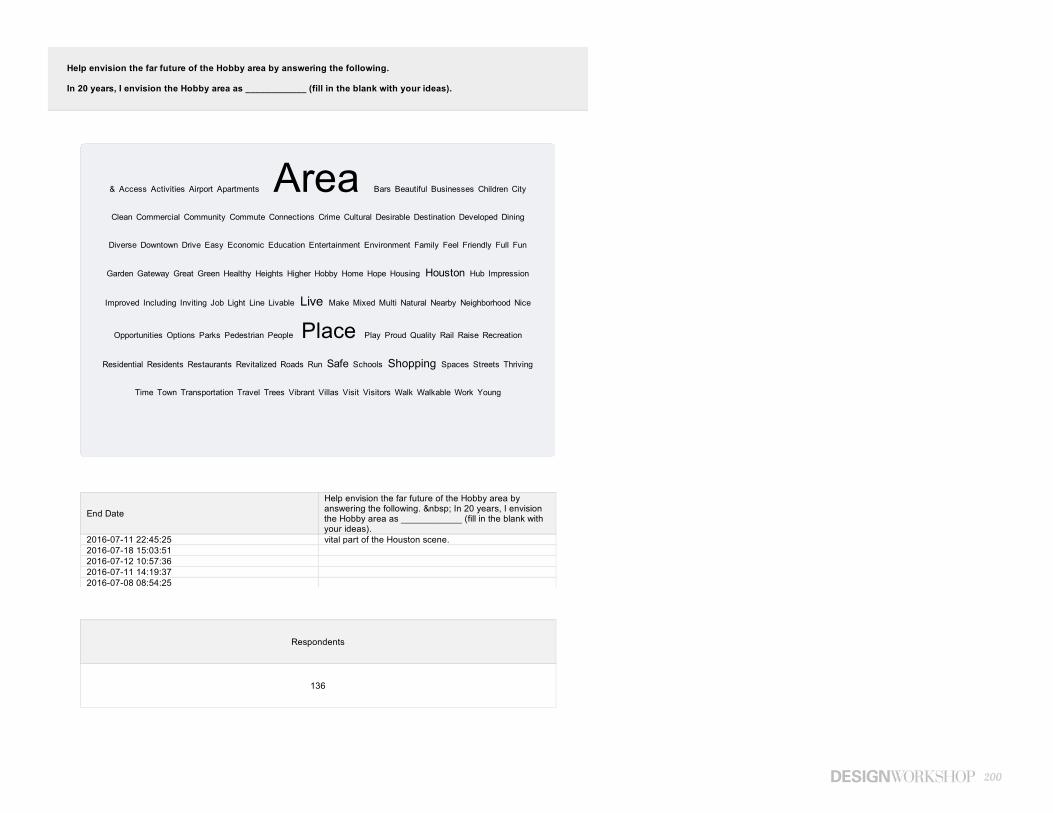
200
End Date
Help envision the far future of the Hobby area byanswering the following. In 20 years, I envisionthe Hobby area as ____________ (fill in the blank withyour ideas).
2016-07-11 22:45:25 vital part of the Houston scene.
2016-07-18 15:03:51
2016-07-12 10:57:36
2016-07-11 14:19:37
2016-07-08 08:54:25
2016-07-12 10:57:26Transportation hub with vibrant economic, commercialand residential activity.
2016-07-11 15:50:55a place with transportation options where you can live,work and play.
2016-07-11 16:27:08
an area inviting and livable for both residents andvisitors alike. The expansion of the airport has anopportunity to bring in new economic opportunities forresidents in the nearby area. There is a greatopportunity for schools and businesses in the area topartner and create pathways to the workforce for youngresidents.
2016-07-02 17:25:41
2016-07-02 19:49:59
2016-07-01 21:28:54
2016-07-01 12:21:20
Respondents
136
& Access Activities Airport Apartments Area Bars Beautiful Businesses Children City
Clean Commercial Community Commute Connections Crime Cultural Desirable Destination Developed Dining
Diverse Downtown Drive Easy Economic Education Entertainment Environment Family Feel Friendly Full Fun
Garden Gateway Great Green Healthy Heights Higher Hobby Home Hope Housing Houston Hub Impression
Improved Including Inviting Job Light Line Livable Live Make Mixed Multi Natural Nearby Neighborhood Nice
Opportunities Options Parks Pedestrian People Place Play Proud Quality Rail Raise Recreation
Residential Residents Restaurants Revitalized Roads Run Safe Schools Shopping Spaces Streets Thriving
Time Town Transportation Travel Trees Vibrant Villas Visit Visitors Walk Walkable Work Young
Help envision the far future of the Hobby area by answering the following. In 20 years, I envision the Hobby area as ____________ (fill in the blank with your ideas).

201 | Appendix
Value Percent Count Percent
1 Strongly agree 38 23.8%
2 Agree 76 47.5%
3 Neutral 30 18.8%
4 Disagree 4 2.5%
5Strongly disagree –please providecomment(s)
12 7.5%
- Total 160 100.0%
Minimum Maximum Mean Variance Std. Dev. Respondents
1 5 2.23 1.16 1.08 160
Although I may not agree with everything stated in this online poll, I feel that the overall process for the HobbyArea Livable Centers Study is headed in the right direction.

202
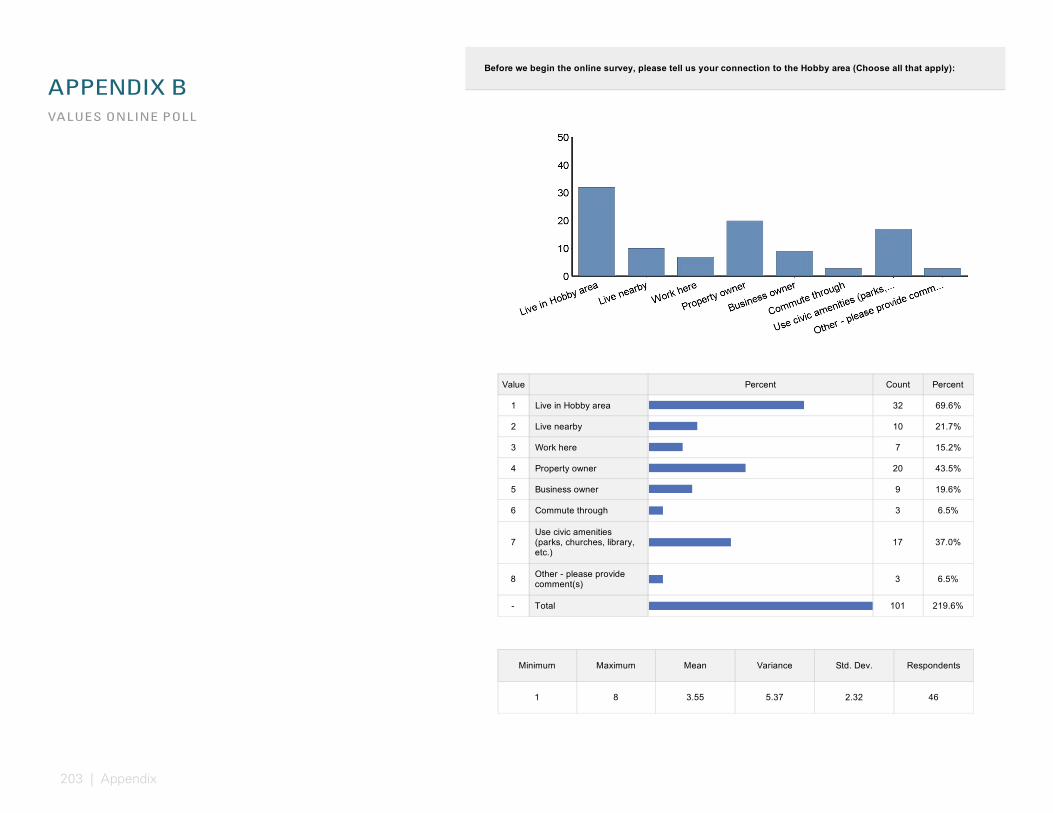
203 | Appendix
APPENDIX BVALUES ONLINE POLL
Value Percent Count Percent
1 Live in Hobby area 32 69.6%
2 Live nearby 10 21.7%
3 Work here 7 15.2%
4 Property owner 20 43.5%
5 Business owner 9 19.6%
6 Commute through 3 6.5%
7Use civic amenities(parks, churches, library,etc.)
17 37.0%
8Other - please providecomment(s)
3 6.5%
- Total 101 219.6%
Minimum Maximum Mean Variance Std. Dev. Respondents
1 8 3.55 5.37 2.32 46
Before we begin the online survey, please tell us your connection to the Hobby area (Choose all that apply):
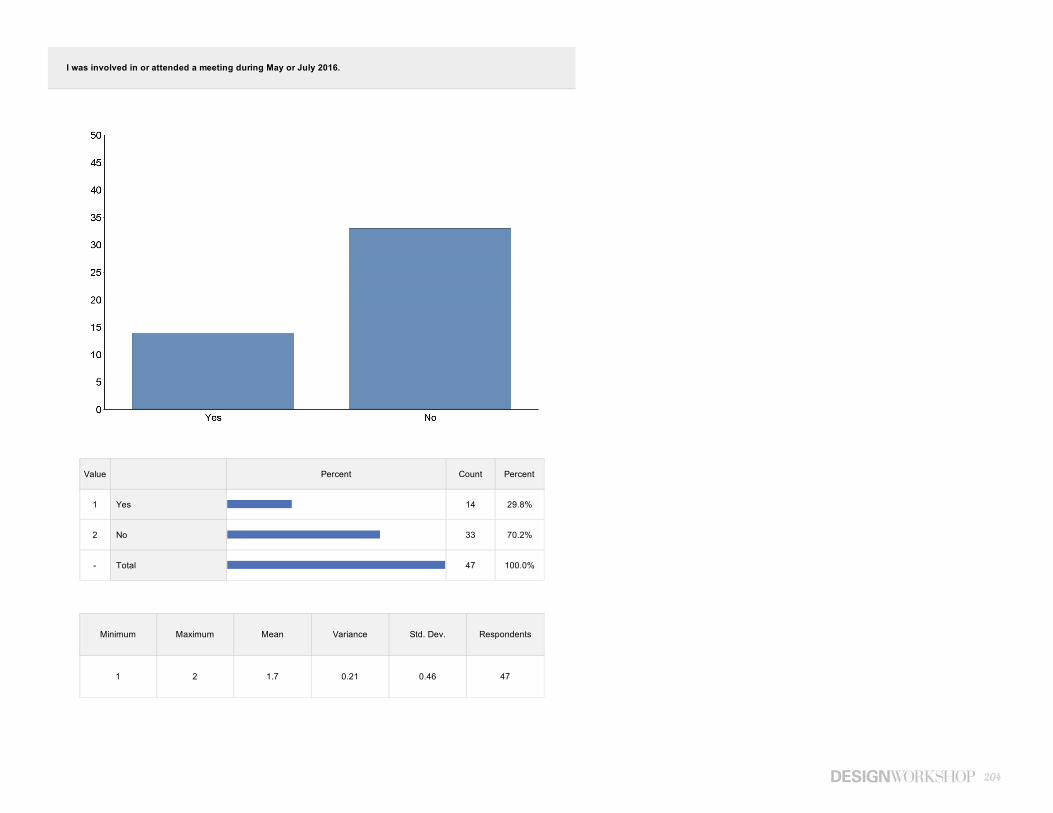
204
Value Percent Count Percent
1 Yes 14 29.8%
2 No 33 70.2%
- Total 47 100.0%
Minimum Maximum Mean Variance Std. Dev. Respondents
1 2 1.7 0.21 0.46 47
I was involved in or attended a meeting during May or July 2016.
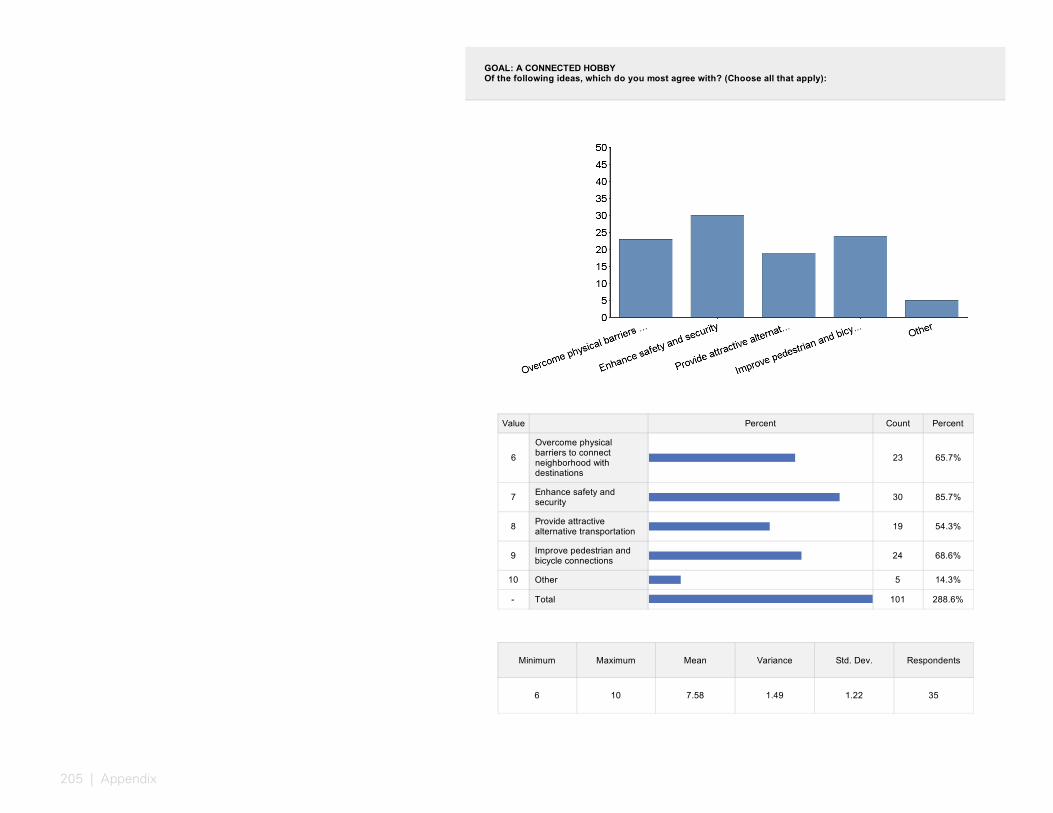
205 | Appendix
Value Percent Count Percent
6
Overcome physicalbarriers to connectneighborhood withdestinations
23 65.7%
7Enhance safety andsecurity
30 85.7%
8Provide attractivealternative transportation
19 54.3%
9Improve pedestrian andbicycle connections
24 68.6%
10 Other 5 14.3%
- Total 101 288.6%
Minimum Maximum Mean Variance Std. Dev. Respondents
6 10 7.58 1.49 1.22 35
GOAL: A CONNECTED HOBBYOf the following ideas, which do you most agree with? (Choose all that apply):
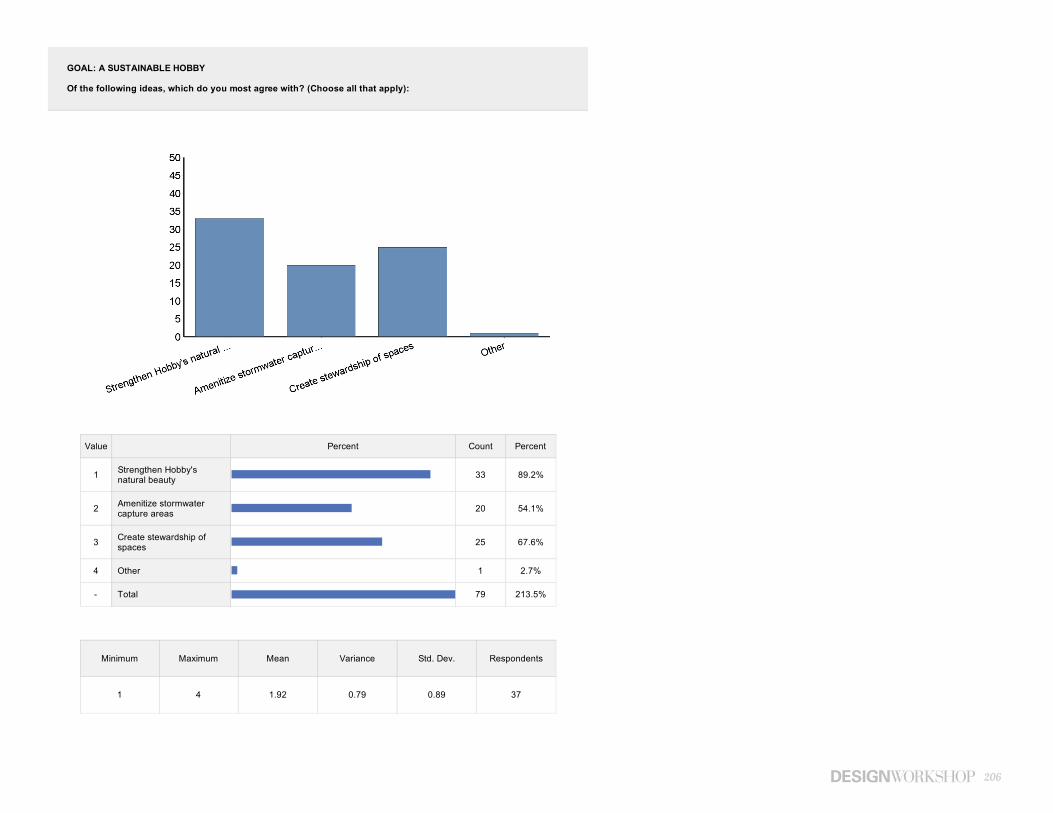
206
Value Percent Count Percent
1Strengthen Hobby'snatural beauty
33 89.2%
2Amenitize stormwatercapture areas
20 54.1%
3Create stewardship ofspaces
25 67.6%
4 Other 1 2.7%
- Total 79 213.5%
Minimum Maximum Mean Variance Std. Dev. Respondents
1 4 1.92 0.79 0.89 37
GOAL: A SUSTAINABLE HOBBY
Of the following ideas, which do you most agree with? (Choose all that apply):
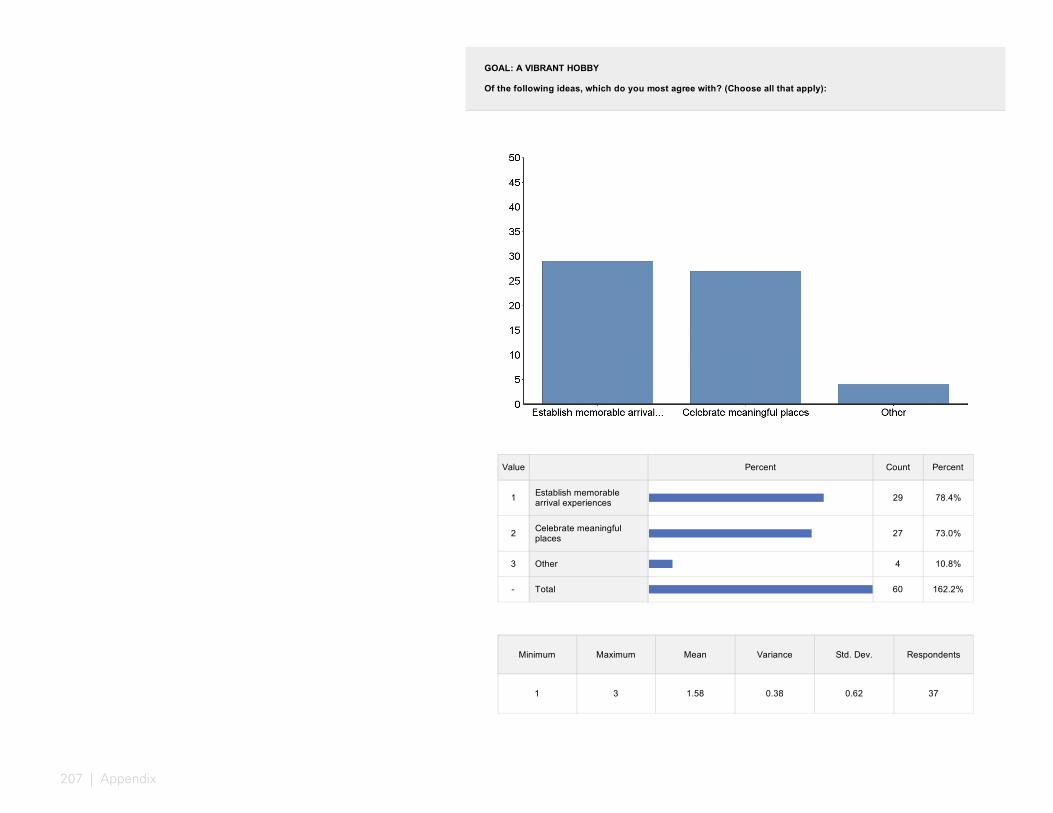
207 | Appendix
Value Percent Count Percent
1Establish memorablearrival experiences
29 78.4%
2Celebrate meaningfulplaces
27 73.0%
3 Other 4 10.8%
- Total 60 162.2%
Minimum Maximum Mean Variance Std. Dev. Respondents
1 3 1.58 0.38 0.62 37
GOAL: A VIBRANT HOBBY
Of the following ideas, which do you most agree with? (Choose all that apply):
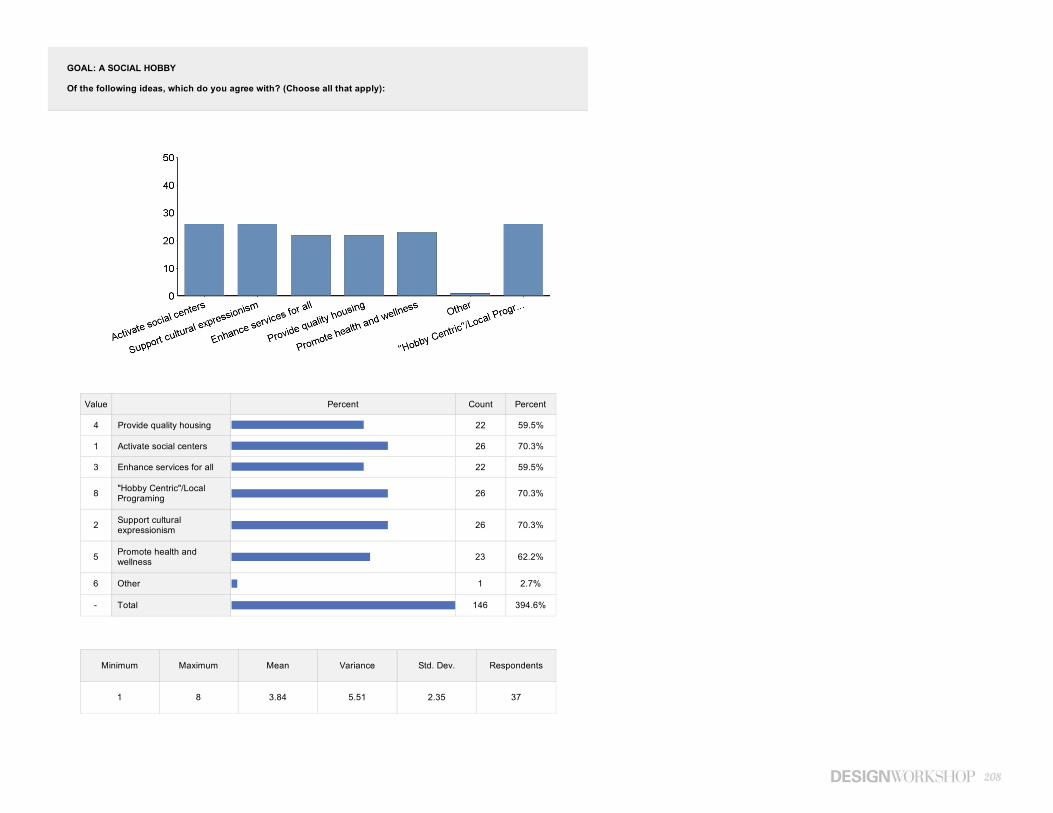
208
Value Percent Count Percent
4 Provide quality housing 22 59.5%
1 Activate social centers 26 70.3%
3 Enhance services for all 22 59.5%
8"Hobby Centric"/LocalPrograming
26 70.3%
2Support culturalexpressionism
26 70.3%
5Promote health andwellness
23 62.2%
6 Other 1 2.7%
- Total 146 394.6%
Minimum Maximum Mean Variance Std. Dev. Respondents
1 8 3.84 5.51 2.35 37
GOAL: A SOCIAL HOBBY
Of the following ideas, which do you agree with? (Choose all that apply):

209 | Appendix
APPENDIX CIMPLEMENTATION ONLINE POLL
Minimum Maximum Mean Variance Std. Dev. Respondents
Gateway features at keyentry corridors
1 3 1.25 0.39 0.62 12
Historic buildingpreservation
1 3 1.33 0.42 0.65 12
Bayou entrances 1 1 1 0 0 12
Senior housing 1 3 1.42 0.45 0.67 12
Bayou trail art 1 1 1 0 0 12
Bayou retail 1 2 1.25 0.2 0.45 12
Bayou events plaza
1 3 1.33 0.42 0.65 12
Neighborhood trailentrances
1 3 1.42 0.63 0.79 12
Neighborhood park 1 3 1.25 0.39 0.62 12
Bayou trail pedestrianbridge
1 3 1.42 0.45 0.67 12
1940 Air TerminalMuseum entry plaza andpark
1 2 1.08 0.08 0.29 12
Streetscapeimprovements within theArtisan Industrial Hub
1 2 1.08 0.08 0.29 12
Safe crossing forbicyclists and pedestriansat Neuhaus Avenue
1 3 1.5 0.45 0.67 12
Walkable blocks alongBroadway Street
1 2 1.08 0.08 0.29 12
Neighborhood goods andservices
1 3 1.33 0.42 0.65 12
Light rail transit centernear William P. HobbyAirport project
1 3 1.33 0.61 0.78 12
Safe bicycle routes 1 3 1.5 0.64 0.8 12
Shade tree planting 1 2 1.08 0.08 0.29 12
Inviting transit stops 1 3 1.42 0.45 0.67 12
Enhance existing parksand open spaces
1 3 1.17 0.33 0.58 12
Utility and drainage canalvision I-45 to AirportBoulevard
1 2 1.42 0.27 0.51 12
Utility and drainage canalvision Meldrum Lane
1 2 1.33 0.24 0.49 12
Review each project and select "yes" for your favorites. After you haveselected favorites, we will ask you to prioritize them.
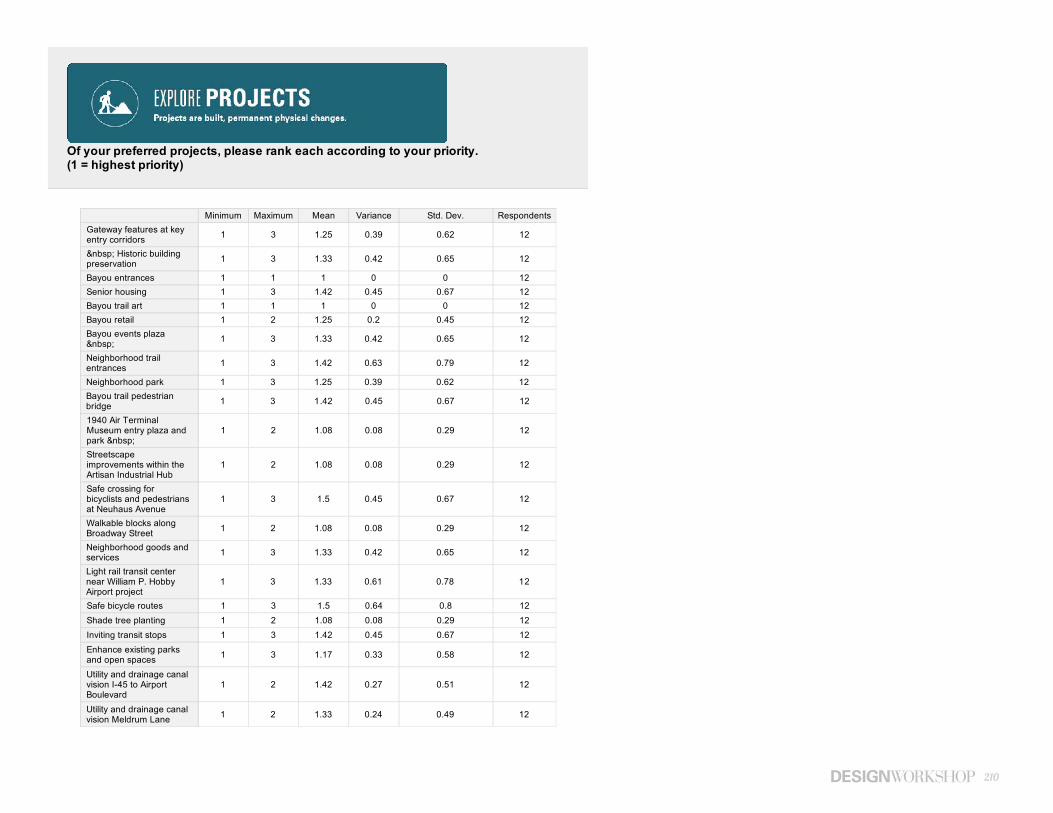
210
Minimum Maximum Mean Variance Std. Dev. Respondents
Gateway features at keyentry corridors
1 3 1.25 0.39 0.62 12
Historic buildingpreservation
1 3 1.33 0.42 0.65 12
Bayou entrances 1 1 1 0 0 12
Senior housing 1 3 1.42 0.45 0.67 12
Bayou trail art 1 1 1 0 0 12
Bayou retail 1 2 1.25 0.2 0.45 12
Bayou events plaza
1 3 1.33 0.42 0.65 12
Neighborhood trailentrances
1 3 1.42 0.63 0.79 12
Neighborhood park 1 3 1.25 0.39 0.62 12
Bayou trail pedestrianbridge
1 3 1.42 0.45 0.67 12
1940 Air TerminalMuseum entry plaza andpark
1 2 1.08 0.08 0.29 12
Streetscapeimprovements within theArtisan Industrial Hub
1 2 1.08 0.08 0.29 12
Safe crossing forbicyclists and pedestriansat Neuhaus Avenue
1 3 1.5 0.45 0.67 12
Walkable blocks alongBroadway Street
1 2 1.08 0.08 0.29 12
Neighborhood goods andservices
1 3 1.33 0.42 0.65 12
Light rail transit centernear William P. HobbyAirport project
1 3 1.33 0.61 0.78 12
Safe bicycle routes 1 3 1.5 0.64 0.8 12
Shade tree planting 1 2 1.08 0.08 0.29 12
Inviting transit stops 1 3 1.42 0.45 0.67 12
Enhance existing parksand open spaces
1 3 1.17 0.33 0.58 12
Utility and drainage canalvision I-45 to AirportBoulevard
1 2 1.42 0.27 0.51 12
Utility and drainage canalvision Meldrum Lane
1 2 1.33 0.24 0.49 12
Of your preferred projects, please rank each according to your priority.(1 = highest priority)
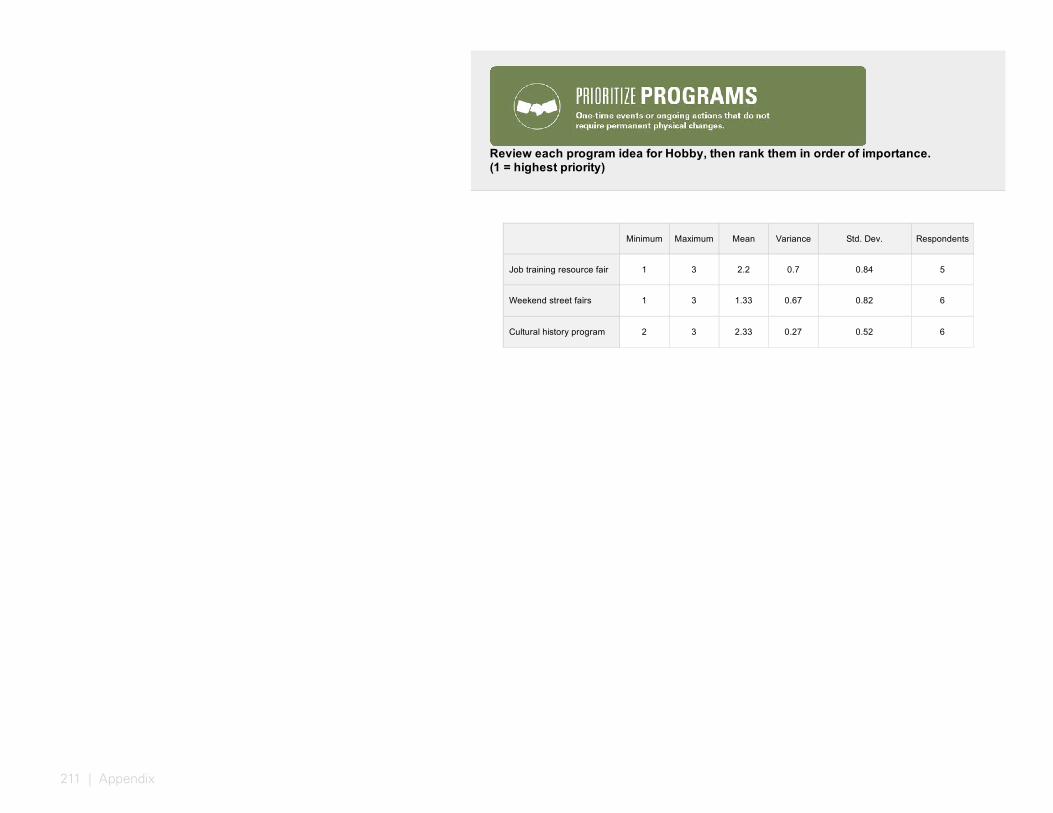
211 | Appendix
Minimum Maximum Mean Variance Std. Dev. Respondents
Job training resource fair 1 3 2.2 0.7 0.84 5
Weekend street fairs 1 3 1.33 0.67 0.82 6
Cultural history program 2 3 2.33 0.27 0.52 6
Review each program idea for Hobby, then rank them in order of importance.(1 = highest priority)
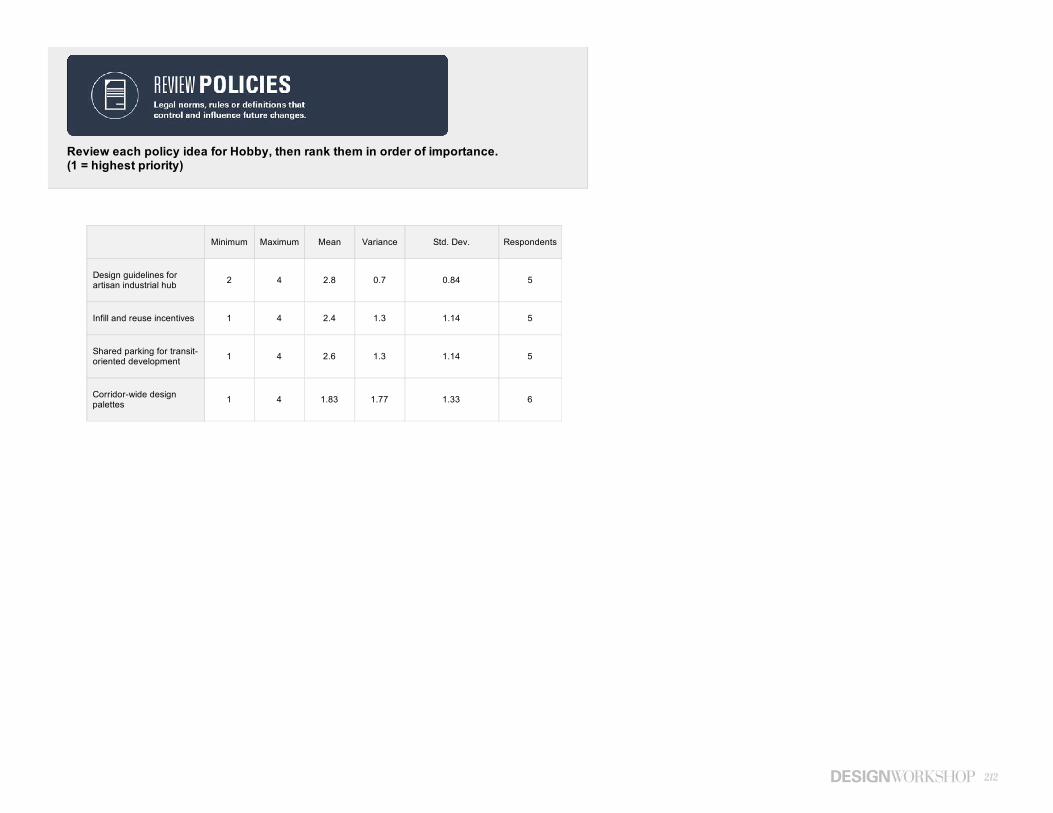
212
Minimum Maximum Mean Variance Std. Dev. Respondents
Design guidelines forartisan industrial hub
2 4 2.8 0.7 0.84 5
Infill and reuse incentives 1 4 2.4 1.3 1.14 5
Shared parking for transit-oriented development
1 4 2.6 1.3 1.14 5
Corridor-wide designpalettes
1 4 1.83 1.77 1.33 6
Review each policy idea for Hobby, then rank them in order of importance. (1 = highest priority)
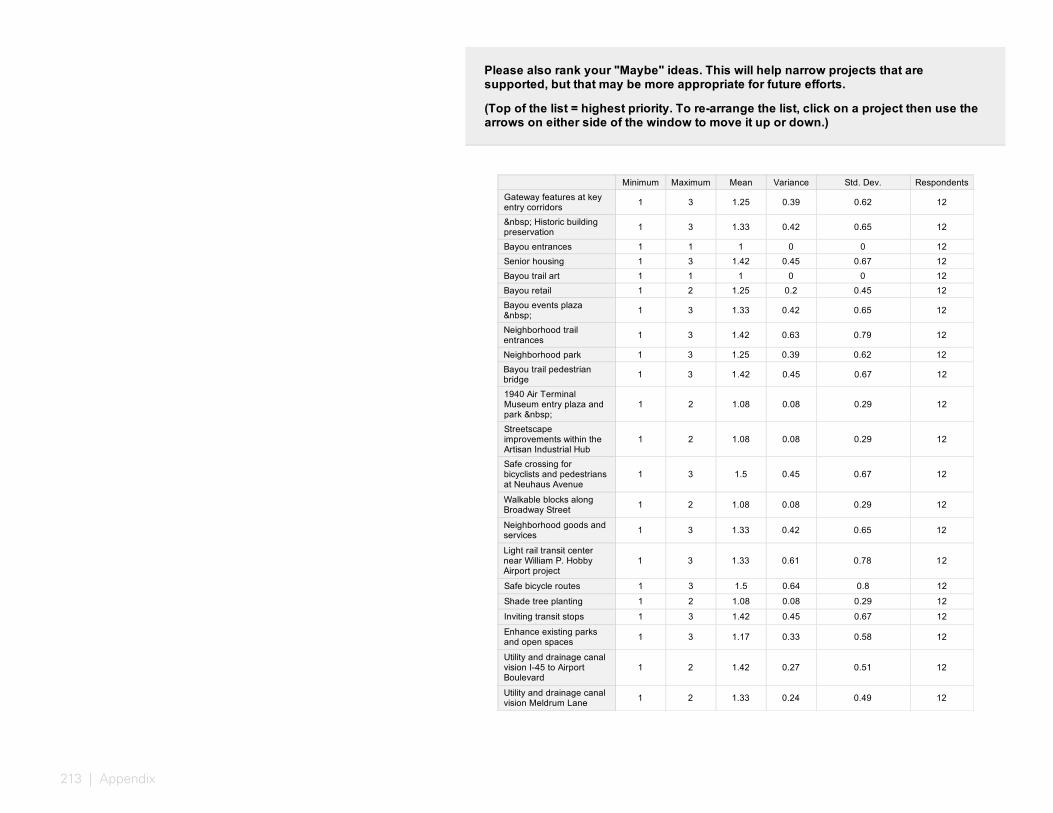
213 | Appendix
Minimum Maximum Mean Variance Std. Dev. Respondents
Gateway features at keyentry corridors
1 3 1.25 0.39 0.62 12
Historic buildingpreservation
1 3 1.33 0.42 0.65 12
Bayou entrances 1 1 1 0 0 12
Senior housing 1 3 1.42 0.45 0.67 12
Bayou trail art 1 1 1 0 0 12
Bayou retail 1 2 1.25 0.2 0.45 12
Bayou events plaza
1 3 1.33 0.42 0.65 12
Neighborhood trailentrances
1 3 1.42 0.63 0.79 12
Neighborhood park 1 3 1.25 0.39 0.62 12
Bayou trail pedestrianbridge
1 3 1.42 0.45 0.67 12
1940 Air TerminalMuseum entry plaza andpark
1 2 1.08 0.08 0.29 12
Streetscapeimprovements within theArtisan Industrial Hub
1 2 1.08 0.08 0.29 12
Safe crossing forbicyclists and pedestriansat Neuhaus Avenue
1 3 1.5 0.45 0.67 12
Walkable blocks alongBroadway Street
1 2 1.08 0.08 0.29 12
Neighborhood goods andservices
1 3 1.33 0.42 0.65 12
Light rail transit centernear William P. HobbyAirport project
1 3 1.33 0.61 0.78 12
Safe bicycle routes 1 3 1.5 0.64 0.8 12
Shade tree planting 1 2 1.08 0.08 0.29 12
Inviting transit stops 1 3 1.42 0.45 0.67 12
Enhance existing parksand open spaces
1 3 1.17 0.33 0.58 12
Utility and drainage canalvision I-45 to AirportBoulevard
1 2 1.42 0.27 0.51 12
Utility and drainage canalvision Meldrum Lane
1 2 1.33 0.24 0.49 12
Please also rank your "Maybe" ideas. This will help narrow projects that aresupported, but that may be more appropriate for future efforts.
(Top of the list = highest priority. To re-arrange the list, click on a project then use thearrows on either side of the window to move it up or down.)

214
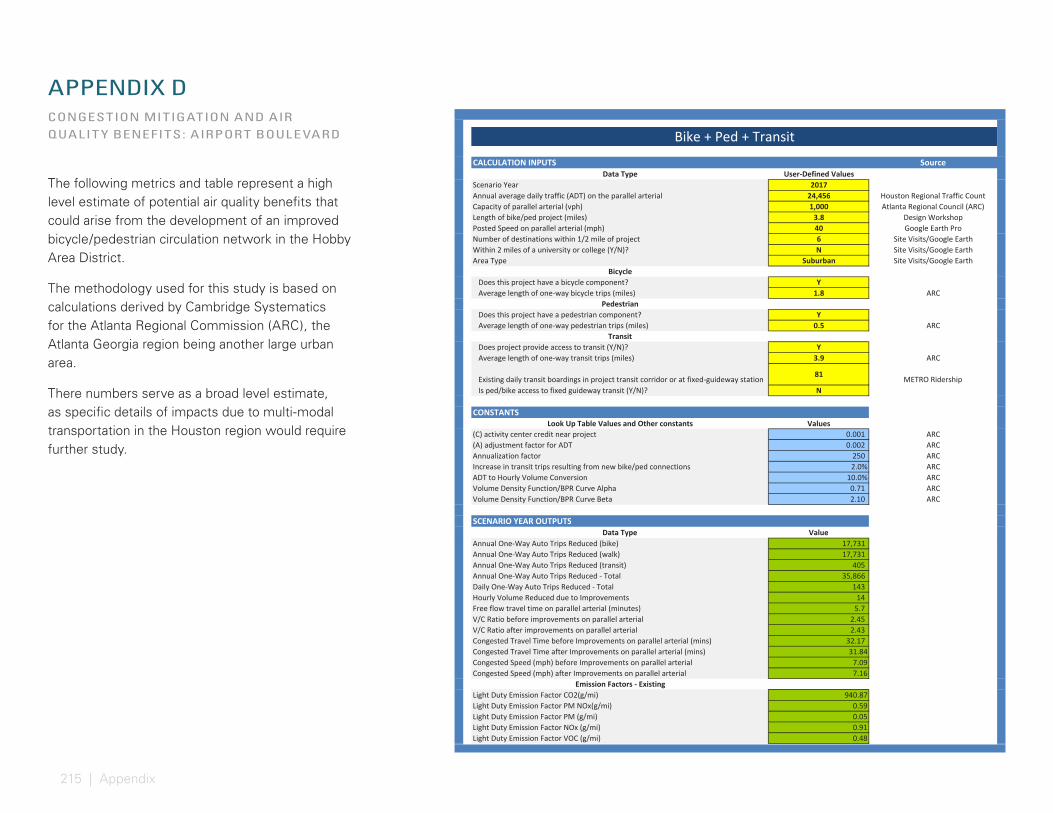
215 | Appendix
SourceData Type User‐Defined Values
Scenario Year 2017Annual average daily traffic (ADT) on the parallel arterial 24,456 Houston Regional Traffic CountCapacity of parallel arterial (vph) 1,000 Atlanta Regional Council (ARC)Length of bike/ped project (miles) 3.8 Design WorkshopPosted Speed on parallel arterial (mph) 40 Google Earth ProNumber of destinations within 1/2 mile of project 6 Site Visits/Google EarthWithin 2 miles of a university or college (Y/N)? N Site Visits/Google EarthArea Type Suburban Site Visits/Google Earth
BicycleDoes this project have a bicycle component? YAverage length of one‐way bicycle trips (miles) 1.8 ARC
PedestrianDoes this project have a pedestrian component? YAverage length of one‐way pedestrian trips (miles) 0.5 ARC
TransitDoes project provide access to transit (Y/N)? YAverage length of one‐way transit trips (miles) 3.9 ARC
Existing daily transit boardings in project transit corridor or at fixed‐guideway station 81 METRO RidershipIs ped/bike access to fixed guideway transit (Y/N)? N
Look Up Table Values and Other constants Values(C) activity center credit near project 0.001 ARC(A) adjustment factor for ADT 0.002 ARCAnnualization factor 250 ARCIncrease in transit trips resulting from new bike/ped connections 2.0% ARCADT to Hourly Volume Conversion 10.0% ARCVolume Density Function/BPR Curve Alpha 0.71 ARCVolume Density Function/BPR Curve Beta 2.10 ARC
Data Type ValueAnnual One‐Way Auto Trips Reduced (bike) 17,731 Annual One‐Way Auto Trips Reduced (walk) 17,731 Annual One‐Way Auto Trips Reduced (transit) 405 Annual One‐Way Auto Trips Reduced ‐ Total 35,866 Daily One‐Way Auto Trips Reduced ‐ Total 143 Hourly Volume Reduced due to Improvements 14 Free flow travel time on parallel arterial (minutes) 5.7V/C Ratio before improvements on parallel arterial 2.45V/C Ratio after improvements on parallel arterial 2.43Congested Travel Time before Improvements on parallel arterial (mins) 32.17Congested Travel Time after Improvements on parallel arterial (mins) 31.84Congested Speed (mph) before Improvements on parallel arterial 7.09Congested Speed (mph) after Improvements on parallel arterial 7.16
Emission Factors ‐ ExistingLight Duty Emission Factor CO2(g/mi) 940.87Light Duty Emission Factor PM NOx(g/mi) 0.59Light Duty Emission Factor PM (g/mi) 0.05Light Duty Emission Factor NOx (g/mi) 0.91Light Duty Emission Factor VOC (g/mi) 0.48
Emission Factors ‐ ImprovedLight Duty Emission Factor CO2(g/mi) 934.60Light Duty Emission Factor PM NOx(g/mi) 0.59Light Duty Emission Factor PM (g/mi) 0.05Light Duty Emission Factor NOx (g/mi) 0.91Light Duty Emission Factor VOC (g/mi) 0.47
Emissions ‐ ExistingLight Duty Emissions CO2(g) 21,859,445,177.89Light Duty Emissions PM NOx(g) 13,732,141.94Light Duty Emissions PM (g) 1,133,189.79Light Duty Emissions NOx (g) 21,241,743.24
CALCULATION INPUTS
CONSTANTS
SCENARIO YEAR OUTPUTS
Bike + Ped + Transit
APPENDIX DCONGESTION MITIGATION AND AIR QUALIT Y BENEFITS: AIRPORT BOULE VARD
The following metrics and table represent a high level estimate of potential air quality benefits that could arise from the development of an improved bicycle/pedestrian circulation network in the Hobby Area District.
The methodology used for this study is based on calculations derived by Cambridge Systematics for the Atlanta Regional Commission (ARC), the Atlanta Georgia region being another large urban area.
There numbers serve as a broad level estimate, as specific details of impacts due to multi-modal transportation in the Houston region would require further study.
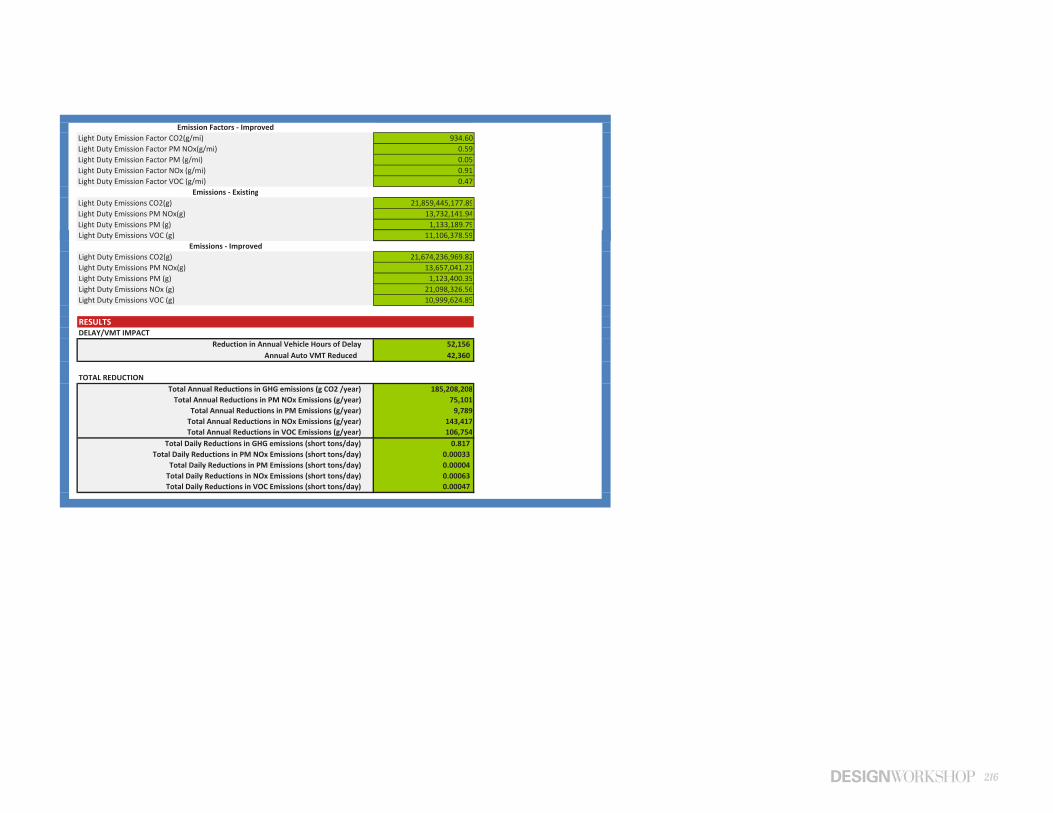
216
SourceData Type User‐Defined Values
Scenario Year 2017Annual average daily traffic (ADT) on the parallel arterial 24,456 Houston Regional Traffic CountCapacity of parallel arterial (vph) 1,000 Atlanta Regional Council (ARC)Length of bike/ped project (miles) 3.8 Design WorkshopPosted Speed on parallel arterial (mph) 40 Google Earth ProNumber of destinations within 1/2 mile of project 6 Site Visits/Google EarthWithin 2 miles of a university or college (Y/N)? N Site Visits/Google EarthArea Type Suburban Site Visits/Google Earth
BicycleDoes this project have a bicycle component? YAverage length of one‐way bicycle trips (miles) 1.8 ARC
PedestrianDoes this project have a pedestrian component? YAverage length of one‐way pedestrian trips (miles) 0.5 ARC
TransitDoes project provide access to transit (Y/N)? YAverage length of one‐way transit trips (miles) 3.9 ARC
Existing daily transit boardings in project transit corridor or at fixed‐guideway station 81 METRO RidershipIs ped/bike access to fixed guideway transit (Y/N)? N
Look Up Table Values and Other constants Values(C) activity center credit near project 0.001 ARC(A) adjustment factor for ADT 0.002 ARCAnnualization factor 250 ARCIncrease in transit trips resulting from new bike/ped connections 2.0% ARCADT to Hourly Volume Conversion 10.0% ARCVolume Density Function/BPR Curve Alpha 0.71 ARCVolume Density Function/BPR Curve Beta 2.10 ARC
Data Type ValueAnnual One‐Way Auto Trips Reduced (bike) 17,731 Annual One‐Way Auto Trips Reduced (walk) 17,731 Annual One‐Way Auto Trips Reduced (transit) 405 Annual One‐Way Auto Trips Reduced ‐ Total 35,866 Daily One‐Way Auto Trips Reduced ‐ Total 143 Hourly Volume Reduced due to Improvements 14 Free flow travel time on parallel arterial (minutes) 5.7V/C Ratio before improvements on parallel arterial 2.45V/C Ratio after improvements on parallel arterial 2.43Congested Travel Time before Improvements on parallel arterial (mins) 32.17Congested Travel Time after Improvements on parallel arterial (mins) 31.84Congested Speed (mph) before Improvements on parallel arterial 7.09Congested Speed (mph) after Improvements on parallel arterial 7.16
Emission Factors ‐ ExistingLight Duty Emission Factor CO2(g/mi) 940.87Light Duty Emission Factor PM NOx(g/mi) 0.59Light Duty Emission Factor PM (g/mi) 0.05Light Duty Emission Factor NOx (g/mi) 0.91Light Duty Emission Factor VOC (g/mi) 0.48
Emission Factors ‐ ImprovedLight Duty Emission Factor CO2(g/mi) 934.60Light Duty Emission Factor PM NOx(g/mi) 0.59Light Duty Emission Factor PM (g/mi) 0.05Light Duty Emission Factor NOx (g/mi) 0.91Light Duty Emission Factor VOC (g/mi) 0.47
Emissions ‐ ExistingLight Duty Emissions CO2(g) 21,859,445,177.89Light Duty Emissions PM NOx(g) 13,732,141.94Light Duty Emissions PM (g) 1,133,189.79Light Duty Emissions NOx (g) 21,241,743.24
CALCULATION INPUTS
CONSTANTS
SCENARIO YEAR OUTPUTS
Bike + Ped + Transit
Light Duty Emissions VOC (g) 11,106,378.59Emissions ‐ Improved
Light Duty Emissions CO2(g) 21,674,236,969.82Light Duty Emissions PM NOx(g) 13,657,041.21Light Duty Emissions PM (g) 1,123,400.35Light Duty Emissions NOx (g) 21,098,326.56Light Duty Emissions VOC (g) 10,999,624.85
DELAY/VMT IMPACTReduction in Annual Vehicle Hours of Delay 52,156
Annual Auto VMT Reduced 42,360
TOTAL REDUCTIONTotal Annual Reductions in GHG emissions (g CO2 /year) 185,208,208Total Annual Reductions in PM NOx Emissions (g/year) 75,101
Total Annual Reductions in PM Emissions (g/year) 9,789Total Annual Reductions in NOx Emissions (g/year) 143,417Total Annual Reductions in VOC Emissions (g/year) 106,754
Total Daily Reductions in GHG emissions (short tons/day) 0.817Total Daily Reductions in PM NOx Emissions (short tons/day) 0.00033
Total Daily Reductions in PM Emissions (short tons/day) 0.00004Total Daily Reductions in NOx Emissions (short tons/day) 0.00063Total Daily Reductions in VOC Emissions (short tons/day) 0.00047
RESULTS
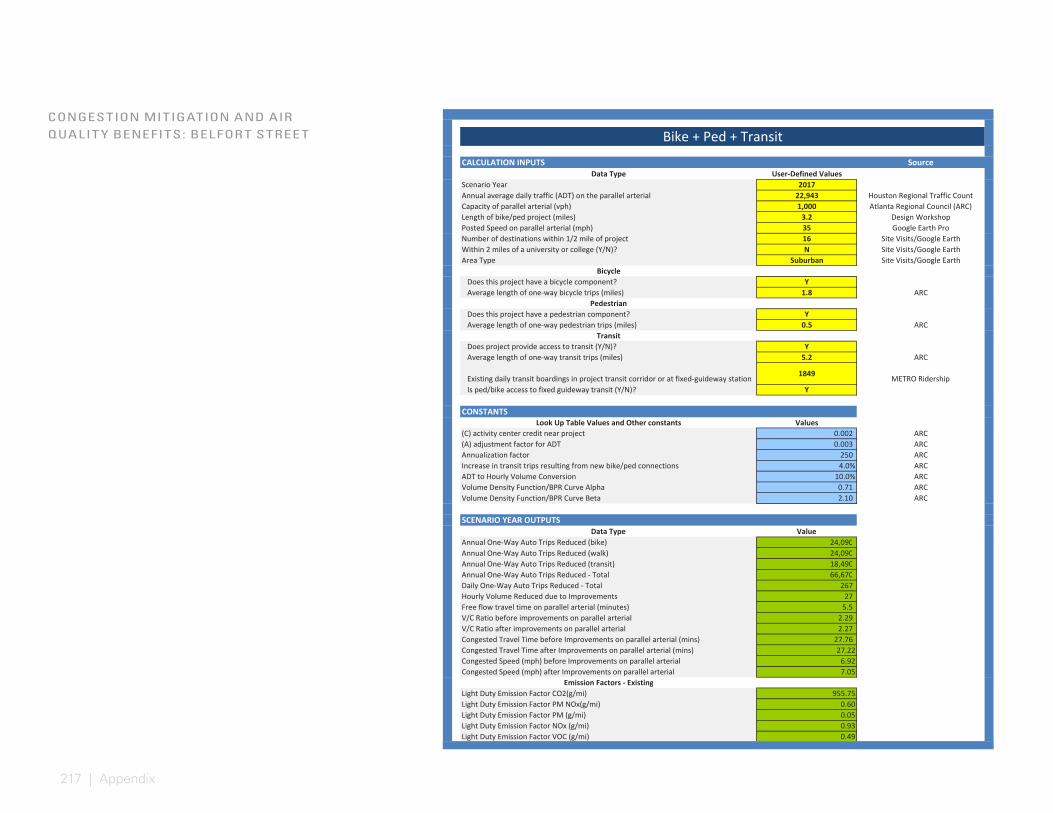
217 | Appendix
SourceData Type User‐Defined Values
Scenario Year 2017Annual average daily traffic (ADT) on the parallel arterial 22,943 Houston Regional Traffic CountCapacity of parallel arterial (vph) 1,000 Atlanta Regional Council (ARC)Length of bike/ped project (miles) 3.2 Design WorkshopPosted Speed on parallel arterial (mph) 35 Google Earth ProNumber of destinations within 1/2 mile of project 16 Site Visits/Google EarthWithin 2 miles of a university or college (Y/N)? N Site Visits/Google EarthArea Type Suburban Site Visits/Google Earth
BicycleDoes this project have a bicycle component? YAverage length of one‐way bicycle trips (miles) 1.8 ARC
PedestrianDoes this project have a pedestrian component? YAverage length of one‐way pedestrian trips (miles) 0.5 ARC
TransitDoes project provide access to transit (Y/N)? YAverage length of one‐way transit trips (miles) 5.2 ARC
Existing daily transit boardings in project transit corridor or at fixed‐guideway station 1849 METRO RidershipIs ped/bike access to fixed guideway transit (Y/N)? Y
Look Up Table Values and Other constants Values(C) activity center credit near project 0.002 ARC(A) adjustment factor for ADT 0.003 ARCAnnualization factor 250 ARCIncrease in transit trips resulting from new bike/ped connections 4.0% ARCADT to Hourly Volume Conversion 10.0% ARCVolume Density Function/BPR Curve Alpha 0.71 ARCVolume Density Function/BPR Curve Beta 2.10 ARC
Data Type ValueAnnual One‐Way Auto Trips Reduced (bike) 24,090 Annual One‐Way Auto Trips Reduced (walk) 24,090 Annual One‐Way Auto Trips Reduced (transit) 18,490 Annual One‐Way Auto Trips Reduced ‐ Total 66,670 Daily One‐Way Auto Trips Reduced ‐ Total 267 Hourly Volume Reduced due to Improvements 27 Free flow travel time on parallel arterial (minutes) 5.5V/C Ratio before improvements on parallel arterial 2.29V/C Ratio after improvements on parallel arterial 2.27Congested Travel Time before Improvements on parallel arterial (mins) 27.76Congested Travel Time after Improvements on parallel arterial (mins) 27.22Congested Speed (mph) before Improvements on parallel arterial 6.92Congested Speed (mph) after Improvements on parallel arterial 7.05
Emission Factors ‐ ExistingLight Duty Emission Factor CO2(g/mi) 955.75Light Duty Emission Factor PM NOx(g/mi) 0.60Light Duty Emission Factor PM (g/mi) 0.05Light Duty Emission Factor NOx (g/mi) 0.93Light Duty Emission Factor VOC (g/mi) 0.49
Emission Factors ‐ ImprovedLight Duty Emission Factor CO2(g/mi) 943.86Light Duty Emission Factor PM NOx(g/mi) 0.59Light Duty Emission Factor PM (g/mi) 0.05Light Duty Emission Factor NOx (g/mi) 0.92Light Duty Emission Factor VOC (g/mi) 0.48
Emissions ‐ ExistingLight Duty Emissions CO2(g) 17,542,256,277.03Light Duty Emissions PM NOx(g) 10,942,568.33Light Duty Emissions PM (g) 909,741.25Light Duty Emissions NOx (g) 16,977,853.03
CALCULATION INPUTS
CONSTANTS
SCENARIO YEAR OUTPUTS
Bike + Ped + TransitCONGESTION MITIGATION AND AIR QUALIT Y BENEFITS: BELFORT STREE T

218
SourceData Type User‐Defined Values
Scenario Year 2017Annual average daily traffic (ADT) on the parallel arterial 22,943 Houston Regional Traffic CountCapacity of parallel arterial (vph) 1,000 Atlanta Regional Council (ARC)Length of bike/ped project (miles) 3.2 Design WorkshopPosted Speed on parallel arterial (mph) 35 Google Earth ProNumber of destinations within 1/2 mile of project 16 Site Visits/Google EarthWithin 2 miles of a university or college (Y/N)? N Site Visits/Google EarthArea Type Suburban Site Visits/Google Earth
BicycleDoes this project have a bicycle component? YAverage length of one‐way bicycle trips (miles) 1.8 ARC
PedestrianDoes this project have a pedestrian component? YAverage length of one‐way pedestrian trips (miles) 0.5 ARC
TransitDoes project provide access to transit (Y/N)? YAverage length of one‐way transit trips (miles) 5.2 ARC
Existing daily transit boardings in project transit corridor or at fixed‐guideway station 1849 METRO RidershipIs ped/bike access to fixed guideway transit (Y/N)? Y
Look Up Table Values and Other constants Values(C) activity center credit near project 0.002 ARC(A) adjustment factor for ADT 0.003 ARCAnnualization factor 250 ARCIncrease in transit trips resulting from new bike/ped connections 4.0% ARCADT to Hourly Volume Conversion 10.0% ARCVolume Density Function/BPR Curve Alpha 0.71 ARCVolume Density Function/BPR Curve Beta 2.10 ARC
Data Type ValueAnnual One‐Way Auto Trips Reduced (bike) 24,090 Annual One‐Way Auto Trips Reduced (walk) 24,090 Annual One‐Way Auto Trips Reduced (transit) 18,490 Annual One‐Way Auto Trips Reduced ‐ Total 66,670 Daily One‐Way Auto Trips Reduced ‐ Total 267 Hourly Volume Reduced due to Improvements 27 Free flow travel time on parallel arterial (minutes) 5.5V/C Ratio before improvements on parallel arterial 2.29V/C Ratio after improvements on parallel arterial 2.27Congested Travel Time before Improvements on parallel arterial (mins) 27.76Congested Travel Time after Improvements on parallel arterial (mins) 27.22Congested Speed (mph) before Improvements on parallel arterial 6.92Congested Speed (mph) after Improvements on parallel arterial 7.05
Emission Factors ‐ ExistingLight Duty Emission Factor CO2(g/mi) 955.75Light Duty Emission Factor PM NOx(g/mi) 0.60Light Duty Emission Factor PM (g/mi) 0.05Light Duty Emission Factor NOx (g/mi) 0.93Light Duty Emission Factor VOC (g/mi) 0.49
Emission Factors ‐ ImprovedLight Duty Emission Factor CO2(g/mi) 943.86Light Duty Emission Factor PM NOx(g/mi) 0.59Light Duty Emission Factor PM (g/mi) 0.05Light Duty Emission Factor NOx (g/mi) 0.92Light Duty Emission Factor VOC (g/mi) 0.48
Emissions ‐ ExistingLight Duty Emissions CO2(g) 17,542,256,277.03Light Duty Emissions PM NOx(g) 10,942,568.33Light Duty Emissions PM (g) 909,741.25Light Duty Emissions NOx (g) 16,977,853.03
CALCULATION INPUTS
CONSTANTS
SCENARIO YEAR OUTPUTS
Bike + Ped + Transit
Light Duty Emissions VOC (g) 8,936,671.02Emissions ‐ Improved
Light Duty Emissions CO2(g) 17,180,929,322.71Light Duty Emissions PM NOx(g) 10,777,652.79Light Duty Emissions PM (g) 890,726.81Light Duty Emissions NOx (g) 16,681,750.22Light Duty Emissions VOC (g) 8,734,046.94
DELAY/VMT IMPACTReduction in Annual Vehicle Hours of Delay 81,899
Annual Auto VMT Reduced 151,555
TOTAL REDUCTIONTotal Annual Reductions in GHG emissions (g CO2 /year) 361,326,954Total Annual Reductions in PM NOx Emissions (g/year) 164,916
Total Annual Reductions in PM Emissions (g/year) 19,014Total Annual Reductions in NOx Emissions (g/year) 296,103Total Annual Reductions in VOC Emissions (g/year) 202,624
Total Daily Reductions in GHG emissions (short tons/day) 1.593Total Daily Reductions in PM NOx Emissions (short tons/day) 0.00073
Total Daily Reductions in PM Emissions (short tons/day) 0.00008Total Daily Reductions in NOx Emissions (short tons/day) 0.00131Total Daily Reductions in VOC Emissions (short tons/day) 0.00089
RESULTS
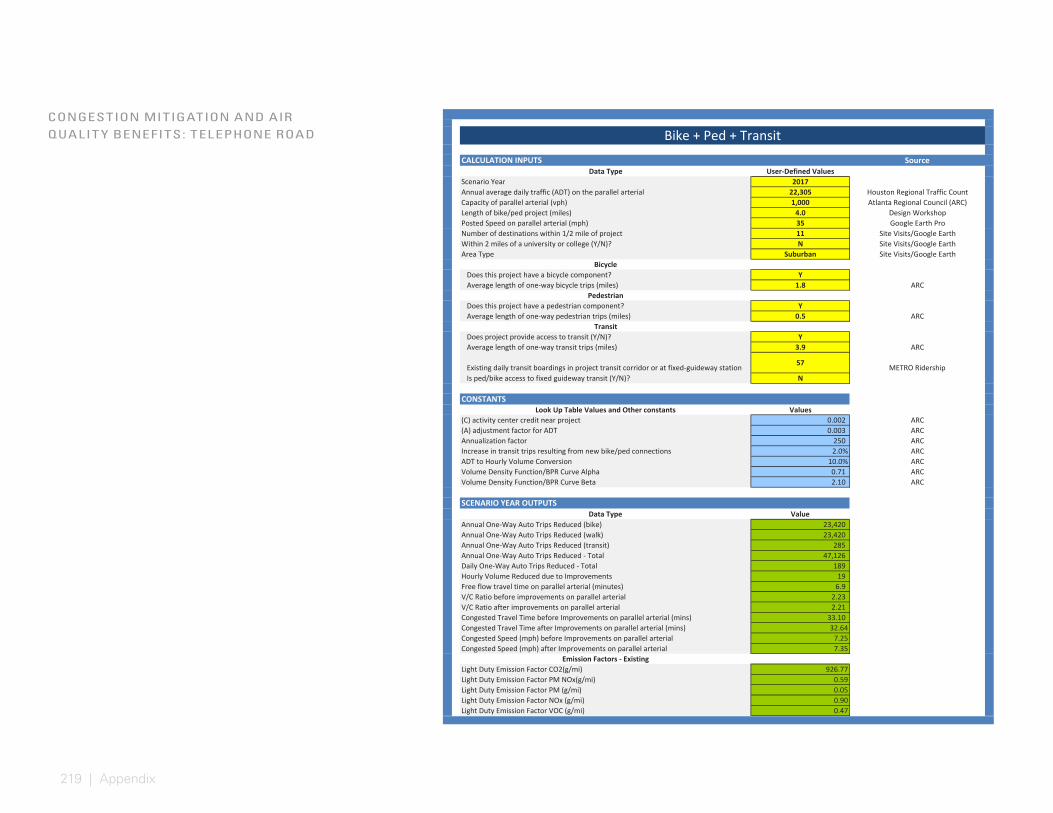
219 | Appendix
SourceData Type User‐Defined Values
Scenario Year 2017Annual average daily traffic (ADT) on the parallel arterial 22,305 Houston Regional Traffic CountCapacity of parallel arterial (vph) 1,000 Atlanta Regional Council (ARC)Length of bike/ped project (miles) 4.0 Design WorkshopPosted Speed on parallel arterial (mph) 35 Google Earth ProNumber of destinations within 1/2 mile of project 11 Site Visits/Google EarthWithin 2 miles of a university or college (Y/N)? N Site Visits/Google EarthArea Type Suburban Site Visits/Google Earth
BicycleDoes this project have a bicycle component? YAverage length of one‐way bicycle trips (miles) 1.8 ARC
PedestrianDoes this project have a pedestrian component? YAverage length of one‐way pedestrian trips (miles) 0.5 ARC
TransitDoes project provide access to transit (Y/N)? YAverage length of one‐way transit trips (miles) 3.9 ARC
Existing daily transit boardings in project transit corridor or at fixed‐guideway station 57 METRO RidershipIs ped/bike access to fixed guideway transit (Y/N)? N
Look Up Table Values and Other constants Values(C) activity center credit near project 0.002 ARC(A) adjustment factor for ADT 0.003 ARCAnnualization factor 250 ARCIncrease in transit trips resulting from new bike/ped connections 2.0% ARCADT to Hourly Volume Conversion 10.0% ARCVolume Density Function/BPR Curve Alpha 0.71 ARCVolume Density Function/BPR Curve Beta 2.10 ARC
Data Type ValueAnnual One‐Way Auto Trips Reduced (bike) 23,420 Annual One‐Way Auto Trips Reduced (walk) 23,420 Annual One‐Way Auto Trips Reduced (transit) 285 Annual One‐Way Auto Trips Reduced ‐ Total 47,126 Daily One‐Way Auto Trips Reduced ‐ Total 189 Hourly Volume Reduced due to Improvements 19 Free flow travel time on parallel arterial (minutes) 6.9V/C Ratio before improvements on parallel arterial 2.23V/C Ratio after improvements on parallel arterial 2.21Congested Travel Time before Improvements on parallel arterial (mins) 33.10Congested Travel Time after Improvements on parallel arterial (mins) 32.64Congested Speed (mph) before Improvements on parallel arterial 7.25Congested Speed (mph) after Improvements on parallel arterial 7.35
Emission Factors ‐ ExistingLight Duty Emission Factor CO2(g/mi) 926.77Light Duty Emission Factor PM NOx(g/mi) 0.59Light Duty Emission Factor PM (g/mi) 0.05Light Duty Emission Factor NOx (g/mi) 0.90Light Duty Emission Factor VOC (g/mi) 0.47
Emission Factors ‐ ImprovedLight Duty Emission Factor CO2(g/mi) 917.84Light Duty Emission Factor PM NOx(g/mi) 0.58Light Duty Emission Factor PM (g/mi) 0.05Light Duty Emission Factor NOx (g/mi) 0.90Light Duty Emission Factor VOC (g/mi) 0.46
Emissions ‐ ExistingLight Duty Emissions CO2(g) 20,671,530,081.37Light Duty Emissions PM NOx(g) 13,075,166.45Light Duty Emissions PM (g) 1,071,200.99Light Duty Emissions NOx (g) 20,166,521.24Light Duty Emissions VOC (g) 10,475,435.37
Emissions ‐ Improved
CALCULATION INPUTS
CONSTANTS
SCENARIO YEAR OUTPUTS
Bike + Ped + TransitCONGESTION MITIGATION AND AIR QUALIT Y BENEFITS: TELEPHONE ROAD
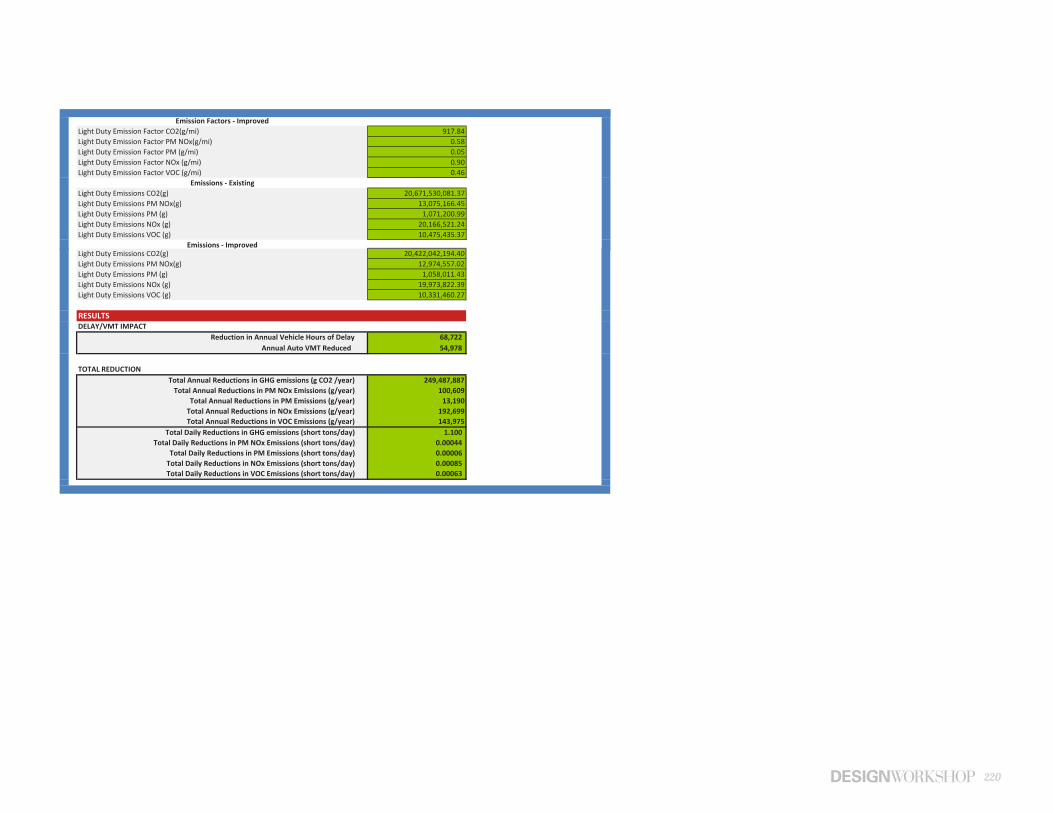
220
SourceData Type User‐Defined Values
Scenario Year 2017Annual average daily traffic (ADT) on the parallel arterial 22,305 Houston Regional Traffic CountCapacity of parallel arterial (vph) 1,000 Atlanta Regional Council (ARC)Length of bike/ped project (miles) 4.0 Design WorkshopPosted Speed on parallel arterial (mph) 35 Google Earth ProNumber of destinations within 1/2 mile of project 11 Site Visits/Google EarthWithin 2 miles of a university or college (Y/N)? N Site Visits/Google EarthArea Type Suburban Site Visits/Google Earth
BicycleDoes this project have a bicycle component? YAverage length of one‐way bicycle trips (miles) 1.8 ARC
PedestrianDoes this project have a pedestrian component? YAverage length of one‐way pedestrian trips (miles) 0.5 ARC
TransitDoes project provide access to transit (Y/N)? YAverage length of one‐way transit trips (miles) 3.9 ARC
Existing daily transit boardings in project transit corridor or at fixed‐guideway station 57 METRO RidershipIs ped/bike access to fixed guideway transit (Y/N)? N
Look Up Table Values and Other constants Values(C) activity center credit near project 0.002 ARC(A) adjustment factor for ADT 0.003 ARCAnnualization factor 250 ARCIncrease in transit trips resulting from new bike/ped connections 2.0% ARCADT to Hourly Volume Conversion 10.0% ARCVolume Density Function/BPR Curve Alpha 0.71 ARCVolume Density Function/BPR Curve Beta 2.10 ARC
Data Type ValueAnnual One‐Way Auto Trips Reduced (bike) 23,420 Annual One‐Way Auto Trips Reduced (walk) 23,420 Annual One‐Way Auto Trips Reduced (transit) 285 Annual One‐Way Auto Trips Reduced ‐ Total 47,126 Daily One‐Way Auto Trips Reduced ‐ Total 189 Hourly Volume Reduced due to Improvements 19 Free flow travel time on parallel arterial (minutes) 6.9V/C Ratio before improvements on parallel arterial 2.23V/C Ratio after improvements on parallel arterial 2.21Congested Travel Time before Improvements on parallel arterial (mins) 33.10Congested Travel Time after Improvements on parallel arterial (mins) 32.64Congested Speed (mph) before Improvements on parallel arterial 7.25Congested Speed (mph) after Improvements on parallel arterial 7.35
Emission Factors ‐ ExistingLight Duty Emission Factor CO2(g/mi) 926.77Light Duty Emission Factor PM NOx(g/mi) 0.59Light Duty Emission Factor PM (g/mi) 0.05Light Duty Emission Factor NOx (g/mi) 0.90Light Duty Emission Factor VOC (g/mi) 0.47
Emission Factors ‐ ImprovedLight Duty Emission Factor CO2(g/mi) 917.84Light Duty Emission Factor PM NOx(g/mi) 0.58Light Duty Emission Factor PM (g/mi) 0.05Light Duty Emission Factor NOx (g/mi) 0.90Light Duty Emission Factor VOC (g/mi) 0.46
Emissions ‐ ExistingLight Duty Emissions CO2(g) 20,671,530,081.37Light Duty Emissions PM NOx(g) 13,075,166.45Light Duty Emissions PM (g) 1,071,200.99Light Duty Emissions NOx (g) 20,166,521.24Light Duty Emissions VOC (g) 10,475,435.37
Emissions ‐ Improved
CALCULATION INPUTS
CONSTANTS
SCENARIO YEAR OUTPUTS
Bike + Ped + Transit
Light Duty Emissions CO2(g) 20,422,042,194.40Light Duty Emissions PM NOx(g) 12,974,557.02Light Duty Emissions PM (g) 1,058,011.43Light Duty Emissions NOx (g) 19,973,822.39Light Duty Emissions VOC (g) 10,331,460.27
DELAY/VMT IMPACTReduction in Annual Vehicle Hours of Delay 68,722
Annual Auto VMT Reduced 54,978
TOTAL REDUCTIONTotal Annual Reductions in GHG emissions (g CO2 /year) 249,487,887Total Annual Reductions in PM NOx Emissions (g/year) 100,609
Total Annual Reductions in PM Emissions (g/year) 13,190Total Annual Reductions in NOx Emissions (g/year) 192,699Total Annual Reductions in VOC Emissions (g/year) 143,975
Total Daily Reductions in GHG emissions (short tons/day) 1.100Total Daily Reductions in PM NOx Emissions (short tons/day) 0.00044
Total Daily Reductions in PM Emissions (short tons/day) 0.00006Total Daily Reductions in NOx Emissions (short tons/day) 0.00085Total Daily Reductions in VOC Emissions (short tons/day) 0.00063
RESULTS
221 | Appendix
HOBBY AREA LIVABLE CENTERMARKET ASSESSMENT
PREPARED FOR:PREPARED BY:
CDS HOBBY ARE A LIVABLE CENTER MARKE T ASSESSMENT
APPENDIX E
222
HOBBY AREA LIVABLE CENTER MARKET ASSESSMENT
Prepared for:
Hobby Area Management District
Prepared by:
CDS Community Development Strategies
1001 S. Dairy Ashford, Suite 450
Houston, TX 77077
(713) 465-8866
www.cdsmr.com
223 | Appendix
HOBBY AREA LIVABLE CENTER MARKET ASSESSMENT
i
TABLE OF CONTENTSIntroduction ..................................................................................................................................................... 1
Hobby Area Management District (Study Area) ................................................................................................................... 1 Purpose of the District ................................................................................................................................................... 3
Hobby Area Management District Competitive Market Area (CMA) ................................................................................... 4 Hobby Area Management Area Characteristics ................................................................................................................... 5
William P. Hobby Airport ............................................................................................................................................... 5 Schools ........................................................................................................................................................................... 5 Redevelopment ............................................................................................................................................................. 6 Land Uses ....................................................................................................................................................................... 6 Study Area Land Values ................................................................................................................................................. 7 Study Area Improvement Values ................................................................................................................................... 8
Summary of Findings ........................................................................................................................................ 9 Demographic and Economic Analysis ................................................................................................................................... 9 Single Family Housing Market .............................................................................................................................................. 9
Competitive Market Area Housing .............................................................................................................................. 10 Study Area Housing Market ......................................................................................................................................... 10 Potential Demand – Single Family Housing ................................................................................................................. 11
Multifamily Housing Market ............................................................................................................................................... 11 CMA Multifamily Housing Market ............................................................................................................................... 11 Study Area Multifamily Housing Market ..................................................................................................................... 12 Potential Demand – Multifamily Housing ................................................................................................................... 12
Senior Housing .................................................................................................................................................................... 13 Potential Demand – Senior Housing ............................................................................................................................ 13
Retail Market ...................................................................................................................................................................... 13 CMA Retail Market ...................................................................................................................................................... 13 Study Area Retail ......................................................................................................................................................... 14 Potential Demand – Retail Space ................................................................................................................................ 14
Office Market ...................................................................................................................................................................... 14 CMA Office Market ...................................................................................................................................................... 14 Study Area Office Market ............................................................................................................................................ 15 Potential Demand – Office Space ................................................................................................................................ 15
Hospitality Market .............................................................................................................................................................. 15 CMA Hotel Market ....................................................................................................................................................... 15 Study Area Hotel Market ............................................................................................................................................. 16 Potential Demand – Hospitality ................................................................................................................................... 16
Industrial Market ................................................................................................................................................................ 16 CMA Industrial Market ................................................................................................................................................ 16 Study Area Industrial Market ...................................................................................................................................... 17 Potential Demand – Industrial Space .......................................................................................................................... 17
Demographic and Economic Analysis ..............................................................................................................19 Population Characteristics .................................................................................................................................................. 19
Historical Population Growth and Current Estimates ................................................................................................. 19 Household Size ............................................................................................................................................................ 20 Educational Attainment ............................................................................................................................................... 21 Household Income ....................................................................................................................................................... 21 Poverty Status ............................................................................................................................................................. 22
Long Term Area Projections ............................................................................................................................................... 22 Employment and Economy ................................................................................................................................................. 24
224
HOBBY AREA LIVABLE CENTER MARKET ASSESSMENT
ii
Employment by Occupation and Classification ........................................................................................................... 24 Employment Inflow and Outflow ................................................................................................................................ 26
Single Family Housing .....................................................................................................................................27 Overall Houston Market ..................................................................................................................................................... 27 CMA Single Family Housing Market .................................................................................................................................... 30
Resale Market .............................................................................................................................................................. 31 New Home Construction ............................................................................................................................................. 31
Study Area Single Family Housing Market .......................................................................................................................... 32 New Home Development ............................................................................................................................................ 33 Study Area Subdivisions .............................................................................................................................................. 34 Glenbrook Valley Historic District ................................................................................................................................ 34 Examples of Current Single Family Listings in the Study Area ..................................................................................... 35 Study Area Sales Trends ................................................................................................................................................ 2
Potential Demand – Single Family Housing .......................................................................................................................... 4 Multifamily Housing ......................................................................................................................................... 5
CMA Multifamily Housing Market ........................................................................................................................................ 7 Occupancy ..................................................................................................................................................................... 8 Rental Rates ................................................................................................................................................................... 8 Absorption ..................................................................................................................................................................... 9
Study Area Multifamily Housing Market .............................................................................................................................. 9 Market Performance ................................................................................................................................................... 10
Potential Demand – Multifamily Housing ........................................................................................................................... 11 Senior Housing ................................................................................................................................................13
CMA Senior Housing Inventory ................................................................................................................................... 13 Senior Apartments with Amenities ............................................................................................................................. 13 Study Area Senior Demographics ................................................................................................................................ 14
Potential Demand – Senior Housing ................................................................................................................................... 16 Retail Space ....................................................................................................................................................18
Overall Houston Market ..................................................................................................................................................... 18 Near Southeast Sub-market ........................................................................................................................................ 19
CMA Retail Market ............................................................................................................................................................. 20 Inventory ..................................................................................................................................................................... 20 CMA Performance ....................................................................................................................................................... 20 CMA Consumer Buying Power ..................................................................................................................................... 21 CMA Retail Sales Trends .............................................................................................................................................. 22 Retail Surplus/Leakage ................................................................................................................................................ 22
Study Area Retail ................................................................................................................................................................ 23 Retail Supply ................................................................................................................................................................ 24 Study Area Performance ............................................................................................................................................. 25
Potential Demand – Retail Space ....................................................................................................................................... 25 Catalyst Project Opportunity .............................................................................................................................................. 29
Office Space ....................................................................................................................................................31 Overall Houston Office Market ........................................................................................................................................... 31
Gulf Freeway/Pasadena Sub-market ........................................................................................................................... 33 CMA Office Market ............................................................................................................................................................. 33
CMA Performance ....................................................................................................................................................... 34 Study Area Office Market ................................................................................................................................................... 35
Performance Trends .................................................................................................................................................... 35 Potential Demand – Office Space ....................................................................................................................................... 36
Hospitality ......................................................................................................................................................38 CMA Hospitality Market ..................................................................................................................................................... 38 Potential Demand – Hospitality .......................................................................................................................................... 40
225 | Appendix
HOBBY AREA LIVABLE CENTER MARKET ASSESSMENT
iii
Industrial Space ..............................................................................................................................................42 CMA Industrial Market ....................................................................................................................................................... 42 Study Area Industrial Market .............................................................................................................................................. 43
Types of Industrial ....................................................................................................................................................... 43 Industrial Market Performance Trends ....................................................................................................................... 43
Potential Demand – Industrial Space ................................................................................................................................. 44 APPENDIX: ......................................................................................................................................................47
FIGURES Figure 1: Map of Hobby Area Management District .................................................................................................................... 1 Figure 2: Images of the Hobby Management District .................................................................................................................. 2 Figure 3: Map of the Competitive Market Area ........................................................................................................................... 4 Figure 4: Aerial Images of the Hobby Airport .............................................................................................................................. 5 Figure 5: Land Uses in the Hobby Area Management District ..................................................................................................... 6 Figure 6: Land Values in the Hobby Area Management District .................................................................................................. 7 Figure 7: Improvement Values in the Hobby Area Management District ................................................................................... 8 Figure 8: Traffic Analysis Zones Covering the CMA.................................................................................................................... 23 Figure 9: Where Workers in the CMA Reside, Where Residents in the CMA Work .................................................................. 26 Figure 10: Single Family Home Sales in Houston ....................................................................................................................... 27 Figure 11: Single Family Average Home Price & Single Family Median Home Price in Houston ............................................... 28 Figure 12: Townhouse / Condominium Sales in Houston .......................................................................................................... 29 Figure 13: Examples of Single Family Housing in the Study Area .............................................................................................. 33 Figure 14: Map of Study Area Subdivisions ............................................................................................................................... 34 Figure 15: Examples of Current Single Family Listings in the Study Area .................................................................................. 35 Figure 16: Study Area Single Family Homes Days on Market ...................................................................................................... 3 Figure 17: Study Area Single Family Homes Sales Price ............................................................................................................... 3 Figure 18: Study Area Single Family Homes Average Sales Price per Square Foot ...................................................................... 3 Figure 19: Houston Multifamily Trends ....................................................................................................................................... 5 Figure 20: Map of Multifamily Housing Locations in the CMA .................................................................................................... 7 Figure 21: Trend of Occupancy Rates for Multifamily Housing in the CMA by Class ................................................................... 8 Figure 22: Trend of Rental Rates for Multifamily Housing in the CMA by Class .......................................................................... 8 Figure 23: Map of Multifamily Housing Locations in the Study Area .......................................................................................... 9 Figure 24: Multifamily Rental Trends in the Study Area ............................................................................................................ 10 Figure 25: Images of Multifamily Housing in the Study Area .................................................................................................... 11 Figure 26: Magnolia Place and Sterling Court, Left to Right ...................................................................................................... 13 Figure 27: Telephone Road and Villas on Winkler, Left to Right ............................................................................................... 14 Figure 28: Study Area Senior Population, 2016 ......................................................................................................................... 14 Figure 29: Houston Area Retail Inventory, Absorption, and Occupancy Rate ........................................................................... 18 Figure 30: Map of CMA Retail .................................................................................................................................................... 20 Figure 31: Retail Market Trends in the CMA ............................................................................................................................. 21 Figure 32: Retail Locations in the Study Area ............................................................................................................................ 24 Figure 33: Retail Market Trends in the Study Area .................................................................................................................... 25 Figure 34: Images of Retail Locations in the CMA ..................................................................................................................... 28 Figure 35: Examples of Small Retail / Restaurant Projects ........................................................................................................ 29
226
HOBBY AREA LIVABLE CENTER MARKET ASSESSMENT
iv
Figure 36: Houston Office Market Trends ................................................................................................................................. 31 Figure 37: Office Locations in the CMA ..................................................................................................................................... 33 Figure 38: Office Market Trends in the CMA ............................................................................................................................. 34 Figure 39: Office Locations in the Study Area ............................................................................................................................ 35 Figure 40: Office Market Trends in the Study Area ................................................................................................................... 36 Figure 41: Employment Forecasts by TAZ for the CMA ............................................................................................................. 37 Figure 42: Study Area Office Demand ........................................................................................................................................ 37 Figure 43: Hospitality Market Trends ........................................................................................................................................ 38 Figure 44: Hospitality Supply and Occupancy in the Bay Area / Hobby Airport Region ............................................................ 39 Figure 45: Industrial Market Trends in the CMA ....................................................................................................................... 43 Figure 46: Properties Currently for Sale or Lease in the Hobby Management District ............................................................. 46
TABLES
Table 1: Average of CDS and HGAC Forecasts - CMA .................................................................................................................. 9 Table 2: Housing Market CMA Home Sales ............................................................................................................................... 10 Table 3: Study Area Housing Market Home Sales ...................................................................................................................... 10 Table 4: Study Area Single Family Demand ............................................................................................................................... 11 Table 5: Study Area Multifamily ................................................................................................................................................ 12 Table 6: Study Area Multifamily Demand Projections Based on Forecasts ............................................................................... 12 Table 7: Study Area Adult Living Demand Projections ............................................................................................................... 13 Table 8: Study Area Office Demand ........................................................................................................................................... 15 Table 9: Study Area Hotel Demand Projections ......................................................................................................................... 16 Table 10: Study Area Hotel Demand Projections ....................................................................................................................... 17 Table 11: Population and Households, 2000 to 2021 ................................................................................................................ 19 Table 12: Population by Age, 2010 to 2016 ............................................................................................................................... 20 Table 13: Household Size, 2016 ................................................................................................................................................. 20 Table 14: Educational Attainment of Population 25+ Years Old, 2016 ...................................................................................... 21 Table 15: Household Income Groups, 2000 to 2016 ................................................................................................................. 21 Table 16: Poverty Status, 2016 .................................................................................................................................................. 22 Table 17: Short Term Study Area and CMA Projections Based on US Census Trends ............................................................... 23 Table 18: Longer Term CMA Projections from the H-GAC ......................................................................................................... 24 Table 19: Longer Term CMA Projections from CDS ................................................................................................................... 24 Table 20: Average CDS and HGAC Projections for the CMA ...................................................................................................... 24 Table 21: Employment by Occupation, 2016 ............................................................................................................................. 25 Table 22: Employment Inflow and Outflow, 2014 ..................................................................................................................... 26 Table 23: CMA Housing Statistics .............................................................................................................................................. 30 Table 24: CMA Home Sales over $200,000, 2010-2016 ............................................................................................................. 31 Table 25: CMA Active Home Listings ......................................................................................................................................... 31 Table 26: Housing Statistics for the Study Araa ......................................................................................................................... 32 Table 27: Glenbrook Valley Sales Trends, 2010-2016 ................................................................................................................ 35 Table 28: Study Area Housing Market Home Sales...................................................................................................................... 2 Table 29: Study Area Home Sales over $200,000, 2010 - 2016 ................................................................................................... 2 Table 30: Study Area Active Home Listings .................................................................................................................................. 2
227 | Appendix
HOBBY AREA LIVABLE CENTER MARKET ASSESSMENT
v
Table 31: Average CDS and HGAC Projections for the CMA ........................................................................................................ 4 Table 32: CMA Single Family Demand ......................................................................................................................................... 4 Table 33: Study Area Single Family Demand ............................................................................................................................... 4 Table 34: Current Multifamily Rental Stats for Houston Area Neighborhoods ........................................................................... 6 Table 35: Multifamily Inventory and Trends in the CMA ............................................................................................................. 7 Table 36: Trend of Absorption Rates for Multifamily Housing in the CMA by Class .................................................................... 9 Table 37: Multifamily Inventory and Trends in the Study Area ................................................................................................. 10 Table 38: Average CDS and HGAC Projections for the CMA ...................................................................................................... 11 Table 39: CMA Multifamily Demand Projections Based Forecasts ............................................................................................ 12 Table 40: Study Area Multifamily Demand Projections Based on Forecasts ............................................................................. 12 Table 41: Senior Housing in the CMA ........................................................................................................................................ 13 Table 42: Senior Household Income by Age, 2016 .................................................................................................................... 15 Table 43: Senior Population by Gender, 2016 ........................................................................................................................... 15 Table 44: Senior Owner Occupied Housing by Units by Value .................................................................................................. 16 Table 45: Potential HH Renters by Income Qualifications ......................................................................................................... 17 Table 46: Houston Area Retail Market Trends ........................................................................................................................... 19 Table 47: Household Effective Buying Income for the CMA ...................................................................................................... 21 Table 48: Actual Retail Sales in the CMA, 2012 to 2015 ............................................................................................................ 22 Table 49: Comparison of Actual Sales with Expected Household Expenditures for the CMA, 2014 ......................................... 22 Table 50: Top 10 PRIZM Segments of the Population in the Study Area ................................................................................... 23 Table 51: Supportable New Retail Space in the CMA ................................................................................................................ 26 Table 52: Supportable New Retail Space in the Study Area ...................................................................................................... 27 Table 53: Estimated Annual Spending on Eating & Drinking by Residents, Employees, and Visitors ........................................ 30 Table 54: Amount of Supportable Retail Space from 10% of Capturable Eating and Drinking Spending .................................. 30 Table 55: Current Office Market Stats for Houston Area Neighborhoods ................................................................................. 32 Table 56: Average CDS and HGAC Projections for the CMA ...................................................................................................... 36 Table 57: Hotels in the CMA by Zip Code .................................................................................................................................. 39 Table 58: Hotel Room Density Comparison for the CMA .......................................................................................................... 41 Table 59: Hotel Demand Projections for the CMA..................................................................................................................... 41 Table 60: Future Industrial Demand .......................................................................................................................................... 45 Table 61: Current Inventory of Multifamily Housing in the Study Area .................................................................................... 47 Table 62: Current Inventory of Retail Locations in the Study Area............................................................................................ 48 Table 63: Current Inventory of Office Locations in the Study Area ........................................................................................... 54
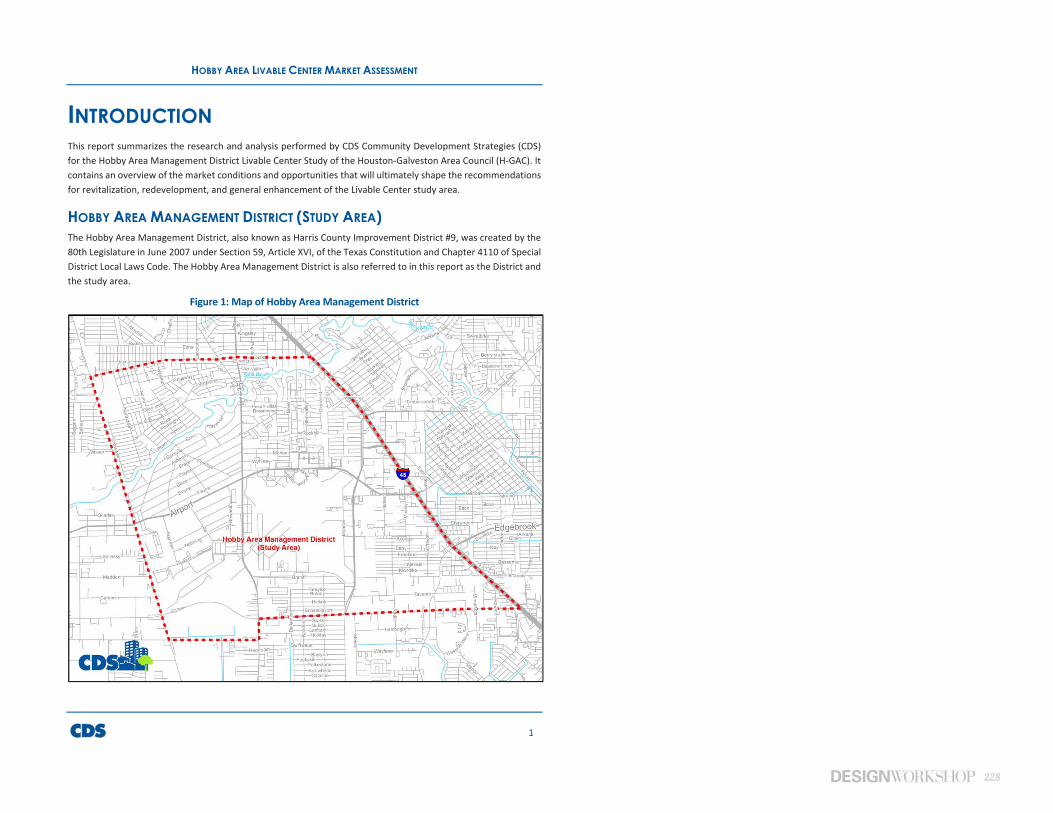
228
HOBBY AREA LIVABLE CENTER MARKET ASSESSMENT
1
INTRODUCTIONThis report summarizes the research and analysis performed by CDS Community Development Strategies (CDS) for the Hobby Area Management District Livable Center Study of the Houston-Galveston Area Council (H-GAC). It contains an overview of the market conditions and opportunities that will ultimately shape the recommendations for revitalization, redevelopment, and general enhancement of the Livable Center study area.
HOBBY AREA MANAGEMENT DISTRICT (STUDY AREA)The Hobby Area Management District, also known as Harris County Improvement District #9, was created by the 80th Legislature in June 2007 under Section 59, Article XVI, of the Texas Constitution and Chapter 4110 of Special District Local Laws Code. The Hobby Area Management District is also referred to in this report as the District and the study area.
Figure 1: Map of Hobby Area Management District
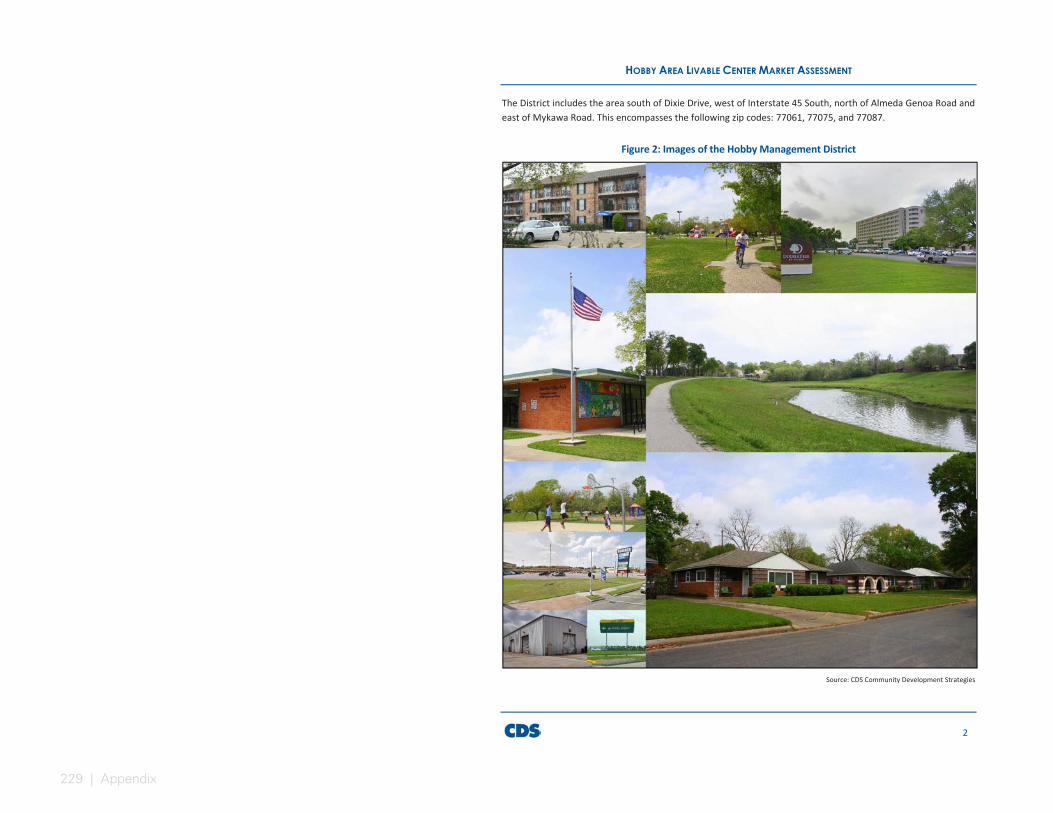
229 | Appendix
HOBBY AREA LIVABLE CENTER MARKET ASSESSMENT
2
The District includes the area south of Dixie Drive, west of Interstate 45 South, north of Almeda Genoa Road and east of Mykawa Road. This encompasses the following zip codes: 77061, 77075, and 77087.
Figure 2: Images of the Hobby Management District
Source: CDS Community Development Strategies
230
HOBBY AREA LIVABLE CENTER MARKET ASSESSMENT
3
Purpose of the District The vision of the District according to the 10-Year Service, Improvement and Assessment Plan (2008-2017) is to strengthen the Hobby Area Management District’s local economy; enhance property values; and, improve the quality of life for both the business and residential communities utilizing urban development techniques that have already been implemented in other Management Districts in Harris County.
The thrust of the District is to promote a sense of place – a concept of identity that calls attention to the area’s unique attributes and their special value to the Greater Houston Metropolitan Region. By emphasizing these attributes, the District serves as a powerful advocate on matters regarding transportation, public safety, environmental planning, and business development.
Throughout this effort, our mission is to provide positive returns on our constituents’ investments, generating higher property values and a better quality of life. Our Ten-Year Plan provides a base level of services and improvements designed to achieve this by making the District safer, more attractive, and more competitive. Moreover, the plan will adapt to changing conditions and demands within the District and the community at large.
In creating a management district, property owners seek to:
Organize themselves to pursue a common vision.
Create capital investment, services, and improvements and supplement them where needed.
Render continuous, focused, and professional management of the area’s needs.
Provide cost-effective funding mechanisms for improvements.
Maintain the District as a superior place to live, work, shop, and invest.
The District’s Board of Directors will pursue these goals through a variety of programs and projects that are outlined in the next section. Projects for the first ten years will be focused on four areas:
1. Security and Public Safety
2. Business Development
3. Transportation Planning
4. Visual Improvements and Cultural Promotion
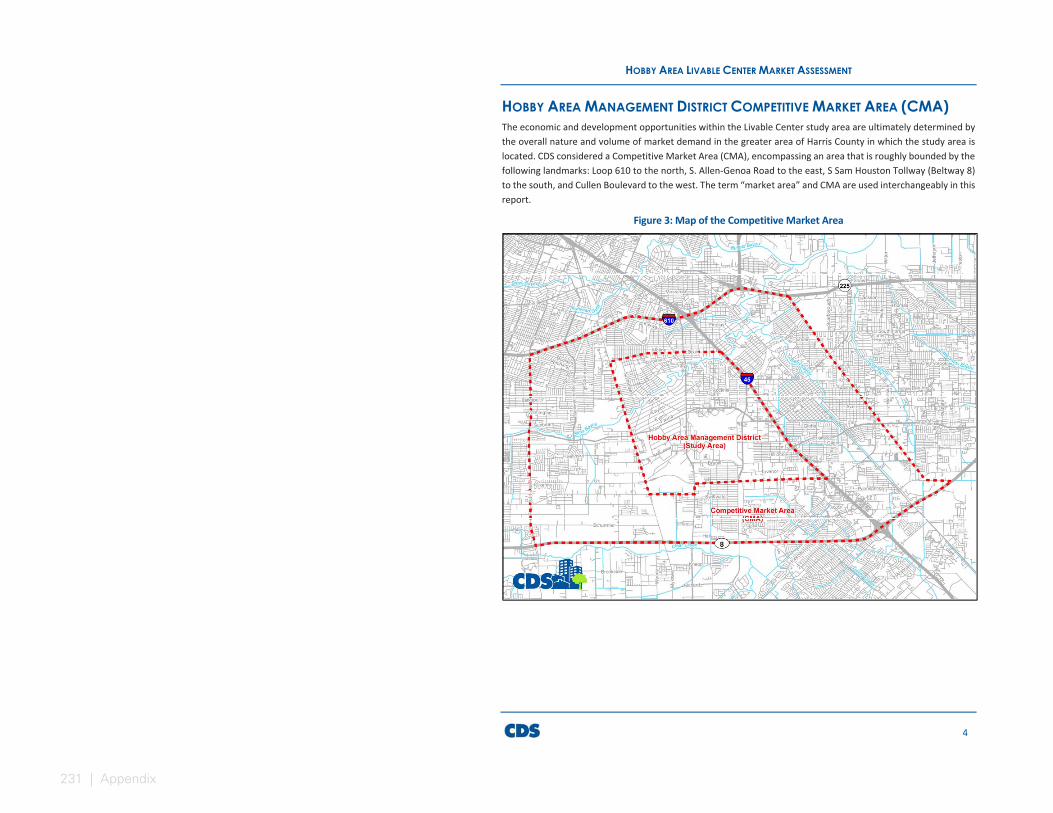
231 | Appendix
HOBBY AREA LIVABLE CENTER MARKET ASSESSMENT
4
HOBBY AREA MANAGEMENT DISTRICT COMPETITIVE MARKET AREA (CMA)The economic and development opportunities within the Livable Center study area are ultimately determined by the overall nature and volume of market demand in the greater area of Harris County in which the study area is located. CDS considered a Competitive Market Area (CMA), encompassing an area that is roughly bounded by the following landmarks: Loop 610 to the north, S. Allen-Genoa Road to the east, S Sam Houston Tollway (Beltway 8) to the south, and Cullen Boulevard to the west. The term “market area” and CMA are used interchangeably in this report.
Figure 3: Map of the Competitive Market Area

232
HOBBY AREA LIVABLE CENTER MARKET ASSESSMENT
5
HOBBY AREA MANAGEMENT AREA CHARACTERISTICS
William P. Hobby Airport William P. Hobby International Airport is a commercial & general aviation airport located about seven miles SE of downtown Houston, just west of the Gulf Freeway (US Highway - Interstate 45). With four runways and a yearly estimate of 10-million passengers, Hobby Airport is Houston's second busiest airport, after Bush Intercontinental Airport, ranked 34th in the USA for passenger traffic. In 1969, the first sections of the new Houston Intercontinental Airport (IAH) were completed, and Hobby's scheduled passenger traffic was relocated to IAH. Hobby Airport continued to serve private aviation as a "general aviation airport", which included FBO operations, corporate flights, flight training, & air-cargo operations. In 1971, Southwest Airlines reinstituted scheduled domestic passenger traffic at Hobby airport. As IAH became more crowded, other airlines also began operations at Hobby. Twelve commercial airlines currently serve Hobby Airport. The airport covers 1,304 acres which comprises a large portion of the Hobby Area Management District.
Figure 4: Aerial Images of the Hobby Airport
Source: Google Earth
SchoolsThe Houston Independent School District comprises to District with the exception of one elementary and one middle school located in Pasadena ISD and three alternative/charter schools. HISD enrollment in the District includes 7,508 students; Pasadena ISD enrollment is 1,704 and alternative/charter enrollment is 821 students.
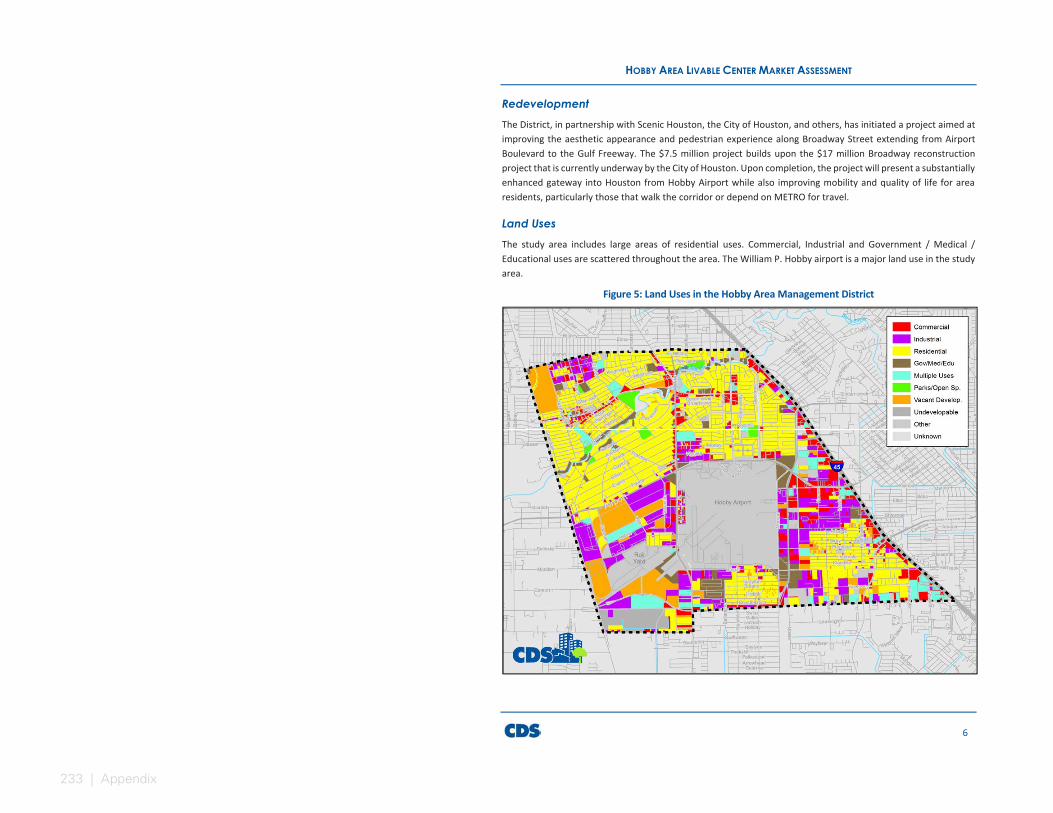
233 | Appendix
HOBBY AREA LIVABLE CENTER MARKET ASSESSMENT
6
RedevelopmentThe District, in partnership with Scenic Houston, the City of Houston, and others, has initiated a project aimed at improving the aesthetic appearance and pedestrian experience along Broadway Street extending from Airport Boulevard to the Gulf Freeway. The $7.5 million project builds upon the $17 million Broadway reconstruction project that is currently underway by the City of Houston. Upon completion, the project will present a substantially enhanced gateway into Houston from Hobby Airport while also improving mobility and quality of life for area residents, particularly those that walk the corridor or depend on METRO for travel.
Land Uses The study area includes large areas of residential uses. Commercial, Industrial and Government / Medical / Educational uses are scattered throughout the area. The William P. Hobby airport is a major land use in the study area.
Figure 5: Land Uses in the Hobby Area Management District
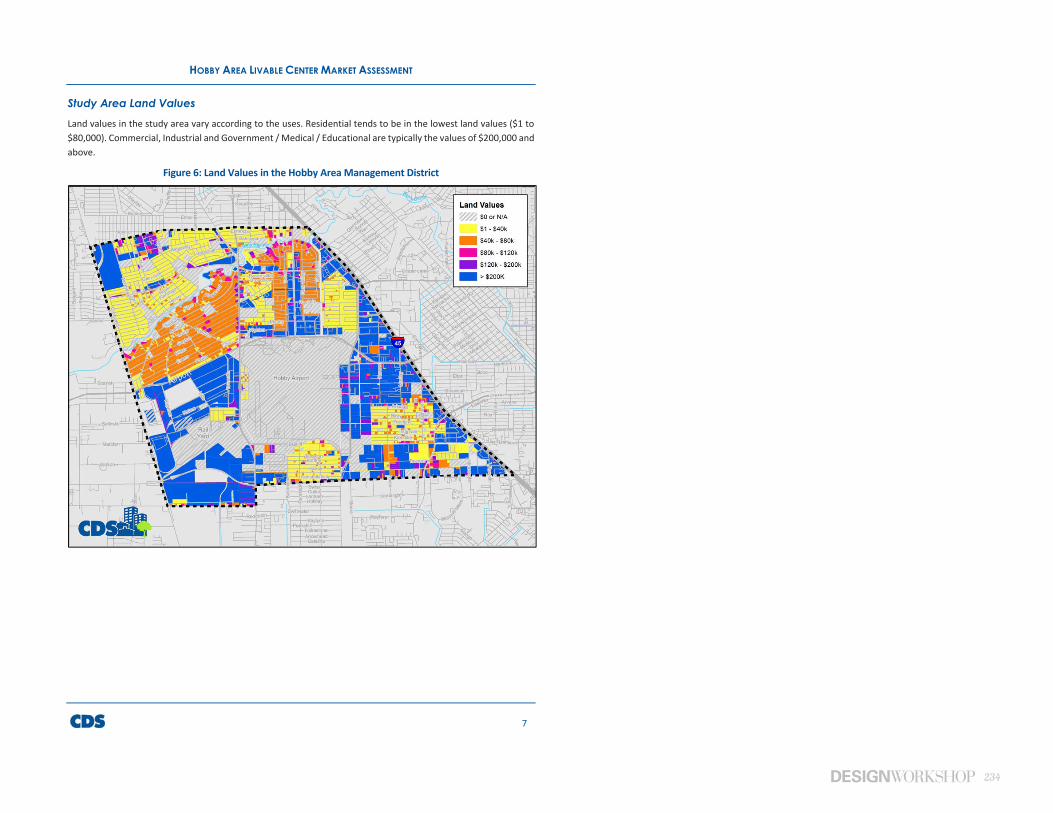
234
HOBBY AREA LIVABLE CENTER MARKET ASSESSMENT
7
Study Area Land Values Land values in the study area vary according to the uses. Residential tends to be in the lowest land values ($1 to $80,000). Commercial, Industrial and Government / Medical / Educational are typically the values of $200,000 and above.
Figure 6: Land Values in the Hobby Area Management District
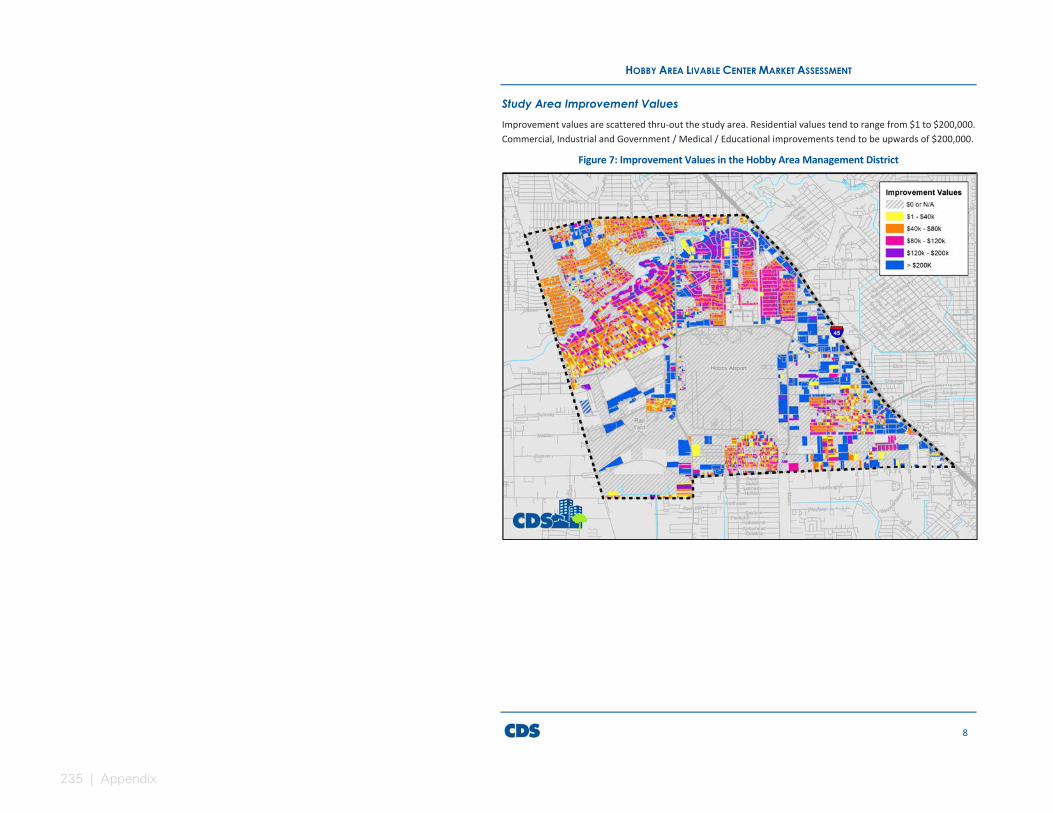
235 | Appendix
HOBBY AREA LIVABLE CENTER MARKET ASSESSMENT
8
Study Area Improvement Values Improvement values are scattered thru-out the study area. Residential values tend to range from $1 to $200,000. Commercial, Industrial and Government / Medical / Educational improvements tend to be upwards of $200,000.
Figure 7: Improvement Values in the Hobby Area Management District

236
HOBBY AREA LIVABLE CENTER MARKET ASSESSMENT
9
SUMMARY OF FINDINGSDEMOGRAPHIC AND ECONOMIC ANALYSIS The Competitive Market Area (CMA) includes 77033, 77048, 77061 77075, 77087, 77017, 77587, and a large
portion of 77034, and a small portion of 77504. The Study Area is defined largely by zip 77061 with a small portion of 77087 and 77075. The study area includes 51,917 persons while the CMA has a population of 237,434 Since 2010, estimates for the study area show a marginal population increase of 5.4%. Over the same time
period from 2010 to 2016, the CMA has seen steady growth at 6.5% while the City experienced strong growth at 10.2%.
The CMA saw decreases in several age groups from 2010 to 2016; the largest decreases were in ages 18 to 20 and 45 to 54. The study area experienced decreases in almost half of all age groups. The highest percentage of decline in the study area took place in the age groups of 21 to 24, followed by 18 to 20. The largest increase was in ages 65 to 74 in the study area.
The study area has 69.8% Hispanic or Latino population Average Household size is 3.1 in the study area and 3.2 in the CMA Educational attainment in the study area and CMA shows a higher portion of lower educated individuals in
households as compared to the City of Houston. The average income in the study area is $49,010; in the CMA, $52,255. According to 2016 estimates, the study area has a slightly higher percentage of families in poverty (26.49%),
when compared with the CMA and the City. The 2020 projections from the H-GAC and CDS projections estimate that the population in the CMA will
increase by roughly 4.5%.
Table 1: Average of CDS and HGAC Forecasts - CMA
AVERAGE 2015 2020 2025 2030 2035 2040 Population 240,398 251,114 267,737 277,881 281,888 290,372 Households 74,554 77,744 83,001 86,900 89,494 93,243 Employment 80,530 83,479 87,336 90,259 93,343 95,828
The CMA has 99,290 employed, or 41.8% of the population; there are 33.46% white collar and 43.46% blue collar workers in the study area.
SINGLE FAMILY HOUSING MARKET According to the latest monthly report prepared by the Houston Association of Realtors (HAR), March single-
family home sales declined 2.2 percent versus March 2015, with a total of 6,001 sales compared to 6,137 a year earlier.
The single-family home average price declined 1.6 percent to $272,658.
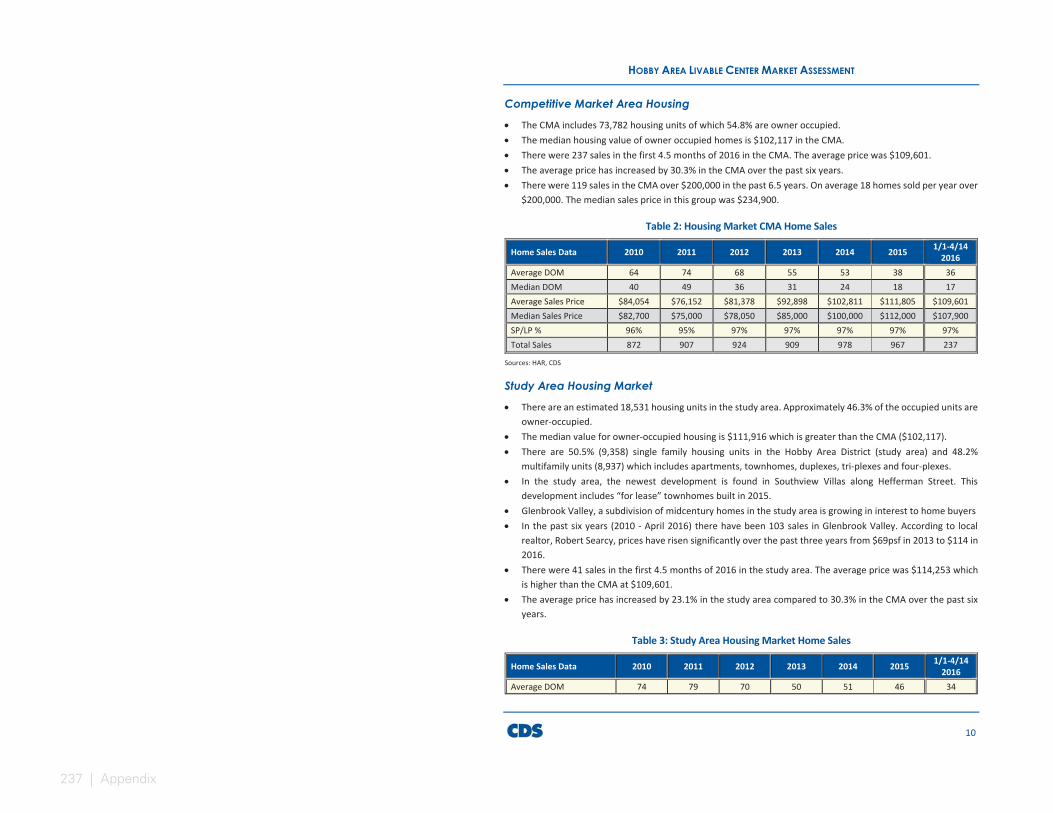
237 | Appendix
HOBBY AREA LIVABLE CENTER MARKET ASSESSMENT
10
Competitive Market Area Housing
The CMA includes 73,782 housing units of which 54.8% are owner occupied. The median housing value of owner occupied homes is $102,117 in the CMA. There were 237 sales in the first 4.5 months of 2016 in the CMA. The average price was $109,601. The average price has increased by 30.3% in the CMA over the past six years. There were 119 sales in the CMA over $200,000 in the past 6.5 years. On average 18 homes sold per year over
$200,000. The median sales price in this group was $234,900.
Table 2: Housing Market CMA Home Sales
Home Sales Data 2010 2011 2012 2013 2014 2015 1/1-4/14 2016
Average DOM 64 74 68 55 53 38 36 Median DOM 40 49 36 31 24 18 17 Average Sales Price $84,054 $76,152 $81,378 $92,898 $102,811 $111,805 $109,601 Median Sales Price $82,700 $75,000 $78,050 $85,000 $100,000 $112,000 $107,900 SP/LP % 96% 95% 97% 97% 97% 97% 97% Total Sales 872 907 924 909 978 967 237
Sources: HAR, CDS
Study Area Housing Market
There are an estimated 18,531 housing units in the study area. Approximately 46.3% of the occupied units are owner-occupied.
The median value for owner-occupied housing is $111,916 which is greater than the CMA ($102,117). There are 50.5% (9,358) single family housing units in the Hobby Area District (study area) and 48.2%
multifamily units (8,937) which includes apartments, townhomes, duplexes, tri-plexes and four-plexes. In the study area, the newest development is found in Southview Villas along Hefferman Street. This
development includes “for lease” townhomes built in 2015. Glenbrook Valley, a subdivision of midcentury homes in the study area is growing in interest to home buyers In the past six years (2010 - April 2016) there have been 103 sales in Glenbrook Valley. According to local
realtor, Robert Searcy, prices have risen significantly over the past three years from $69psf in 2013 to $114 in 2016.
There were 41 sales in the first 4.5 months of 2016 in the study area. The average price was $114,253 which is higher than the CMA at $109,601.
The average price has increased by 23.1% in the study area compared to 30.3% in the CMA over the past six years.
Table 3: Study Area Housing Market Home Sales
Home Sales Data 2010 2011 2012 2013 2014 2015 1/1-4/14 2016
Average DOM 74 79 70 50 51 46 34
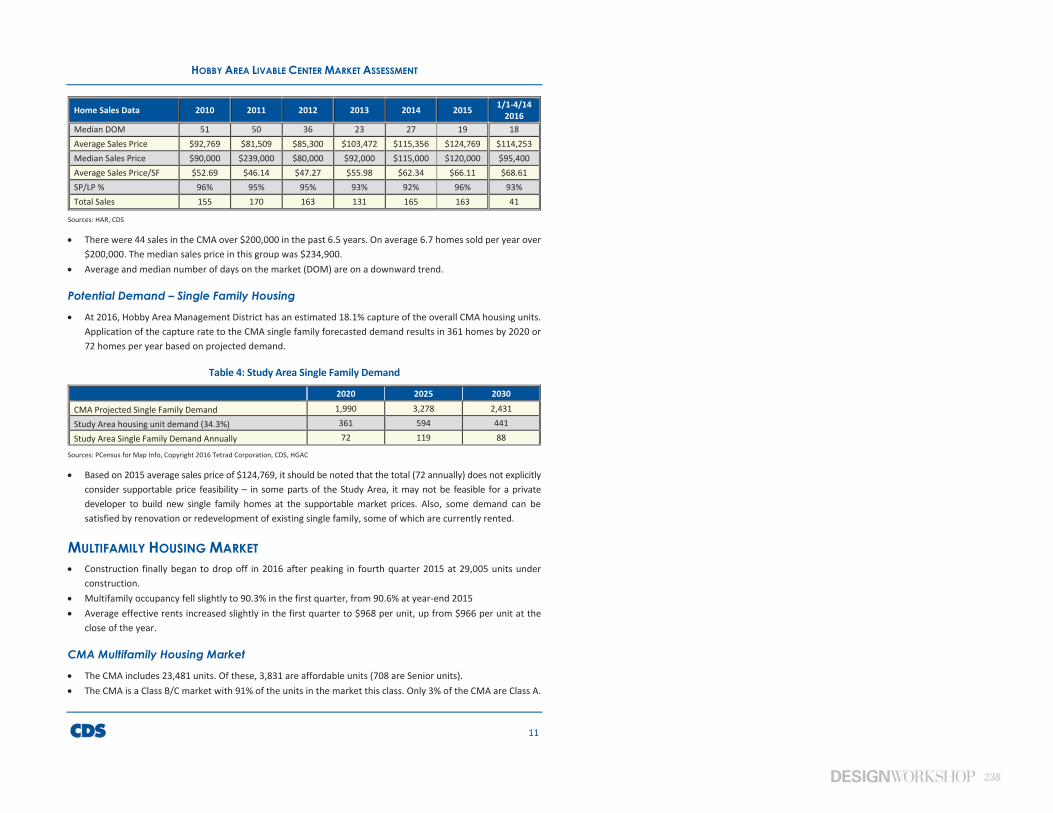
238
HOBBY AREA LIVABLE CENTER MARKET ASSESSMENT
11
Home Sales Data 2010 2011 2012 2013 2014 2015 1/1-4/14 2016
Median DOM 51 50 36 23 27 19 18 Average Sales Price $92,769 $81,509 $85,300 $103,472 $115,356 $124,769 $114,253 Median Sales Price $90,000 $239,000 $80,000 $92,000 $115,000 $120,000 $95,400 Average Sales Price/SF $52.69 $46.14 $47.27 $55.98 $62.34 $66.11 $68.61 SP/LP % 96% 95% 95% 93% 92% 96% 93% Total Sales 155 170 163 131 165 163 41
Sources: HAR, CDS
There were 44 sales in the CMA over $200,000 in the past 6.5 years. On average 6.7 homes sold per year over $200,000. The median sales price in this group was $234,900.
Average and median number of days on the market (DOM) are on a downward trend.
Potential Demand – Single Family Housing
At 2016, Hobby Area Management District has an estimated 18.1% capture of the overall CMA housing units. Application of the capture rate to the CMA single family forecasted demand results in 361 homes by 2020 or 72 homes per year based on projected demand.
Table 4: Study Area Single Family Demand
2020 2025 2030
CMA Projected Single Family Demand 1,990 3,278 2,431 Study Area housing unit demand (34.3%) 361 594 441 Study Area Single Family Demand Annually 72 119 88
Sources: PCensus for Map Info, Copyright 2016 Tetrad Corporation, CDS, HGAC
Based on 2015 average sales price of $124,769, it should be noted that the total (72 annually) does not explicitly consider supportable price feasibility – in some parts of the Study Area, it may not be feasible for a private developer to build new single family homes at the supportable market prices. Also, some demand can be satisfied by renovation or redevelopment of existing single family, some of which are currently rented.
MULTIFAMILY HOUSING MARKET Construction finally began to drop off in 2016 after peaking in fourth quarter 2015 at 29,005 units under
construction. Multifamily occupancy fell slightly to 90.3% in the first quarter, from 90.6% at year-end 2015 Average effective rents increased slightly in the first quarter to $968 per unit, up from $966 per unit at the
close of the year.
CMA Multifamily Housing Market
The CMA includes 23,481 units. Of these, 3,831 are affordable units (708 are Senior units). The CMA is a Class B/C market with 91% of the units in the market this class. Only 3% of the CMA are Class A.

239 | Appendix
HOBBY AREA LIVABLE CENTER MARKET ASSESSMENT
12
Currently occupancy is at 88.7% overall. Average rental rates are $0.90 per square foot On average 170 units have been absorbed annually since 2009.
Study Area Multifamily Housing Market
There are 8,064 units in 46 properties in the study area. There are 616 affordable units (340 are Senior units). The current lease rates are on average at $0.92psf. Absorption has been fairly positive over the past five years.
Table 5: Study Area Multifamily
A B C Overall Total # Projects 1 12 42 55 Total # Units 276 3,866 3,922 8,064 Total # Units 1BR 2,689 1,804 4,493 Total # Units 2BR 60 1,171 1,671 2902 Total # Units 3BR 138 1 84 223 Avg SF 1214 759 760 911 Avg Physical Vacancy 1.5% 5.75% 6.91% 4.72% Avg Market Rent/SF $0.69** $0.92 $0.91 $0.92 Avg Market Rent/Unit $826** $698 $634 $666.00
**Class A units are tax credit. Sources: CoStar and CDS
Potential Demand – Multifamily Housing
At 2016 (estimate) Hobby Area Management District included 30.76% of the overall CMA housing units. Application of the capture rate to the CMA multifamily demand results in 344 apartments by 2020 or 69 homes per year.
Table 6: Study Area Multifamily Demand Projections Based on Forecasts
2020 2025 2030 CMA Projected Multifamily Demand 1,119 1,844 1,368 Study Area Multifamily demand (30.76%) 344 567 421 Study Area Multifamily Annual Demand 69 113 84
Sources: PCensus for Map Info, Copyright 2016 Tetrad Corporation, CDS, HGAC
Rents are estimated to be $0.88 psf - a developer will probably find this rental rate is not feasible for new construction
Affordable units are achieving higher rents on a per sf basis in this market, however the district is not wanting additional low income units at this time
Given the number of existing apartments in the Study Area and rental rates, CDS does not recommend conventional market rate apartments at this time.
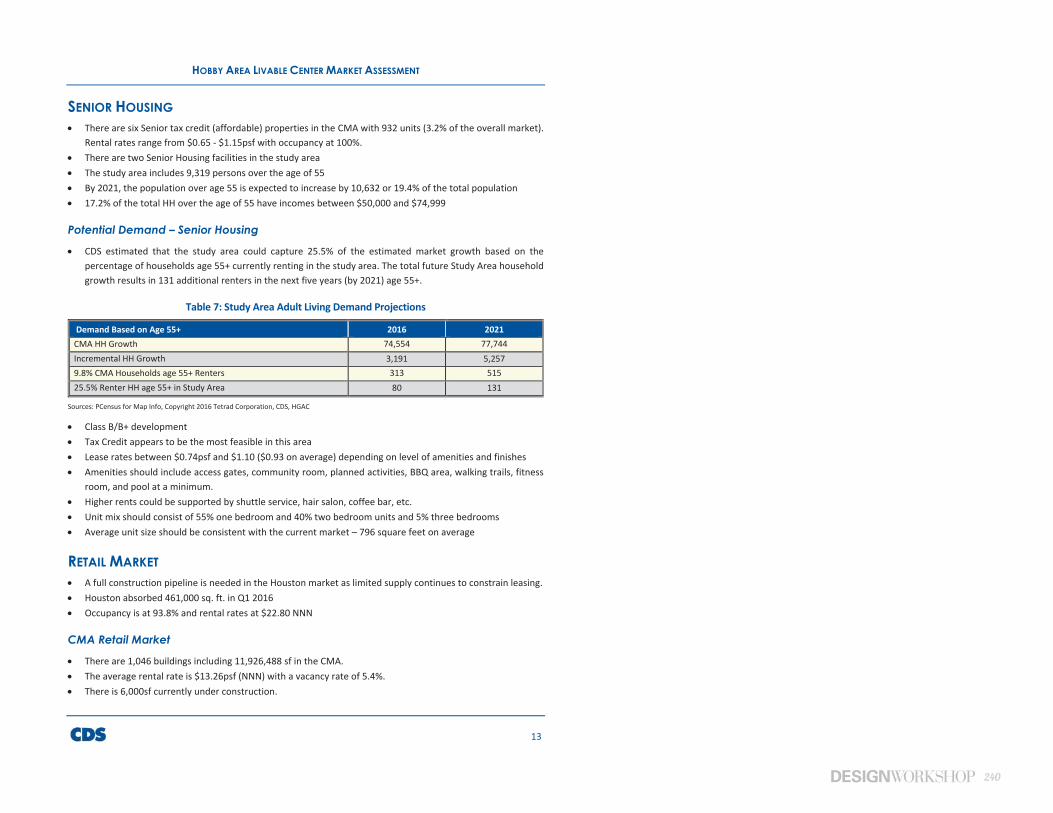
240
HOBBY AREA LIVABLE CENTER MARKET ASSESSMENT
13
SENIOR HOUSING There are six Senior tax credit (affordable) properties in the CMA with 932 units (3.2% of the overall market).
Rental rates range from $0.65 - $1.15psf with occupancy at 100%. There are two Senior Housing facilities in the study area The study area includes 9,319 persons over the age of 55 By 2021, the population over age 55 is expected to increase by 10,632 or 19.4% of the total population 17.2% of the total HH over the age of 55 have incomes between $50,000 and $74,999
Potential Demand – Senior Housing
CDS estimated that the study area could capture 25.5% of the estimated market growth based on the percentage of households age 55+ currently renting in the study area. The total future Study Area household growth results in 131 additional renters in the next five years (by 2021) age 55+.
Table 7: Study Area Adult Living Demand Projections
Demand Based on Age 55+ 2016 2021 CMA HH Growth 74,554 77,744 Incremental HH Growth 3,191 5,257 9.8% CMA Households age 55+ Renters 313 515 25.5% Renter HH age 55+ in Study Area 80 131
Sources: PCensus for Map Info, Copyright 2016 Tetrad Corporation, CDS, HGAC
Class B/B+ development Tax Credit appears to be the most feasible in this area Lease rates between $0.74psf and $1.10 ($0.93 on average) depending on level of amenities and finishes Amenities should include access gates, community room, planned activities, BBQ area, walking trails, fitness
room, and pool at a minimum. Higher rents could be supported by shuttle service, hair salon, coffee bar, etc. Unit mix should consist of 55% one bedroom and 40% two bedroom units and 5% three bedrooms Average unit size should be consistent with the current market – 796 square feet on average
RETAIL MARKET A full construction pipeline is needed in the Houston market as limited supply continues to constrain leasing. Houston absorbed 461,000 sq. ft. in Q1 2016 Occupancy is at 93.8% and rental rates at $22.80 NNN
CMA Retail Market
There are 1,046 buildings including 11,926,488 sf in the CMA. The average rental rate is $13.26psf (NNN) with a vacancy rate of 5.4%. There is 6,000sf currently under construction.
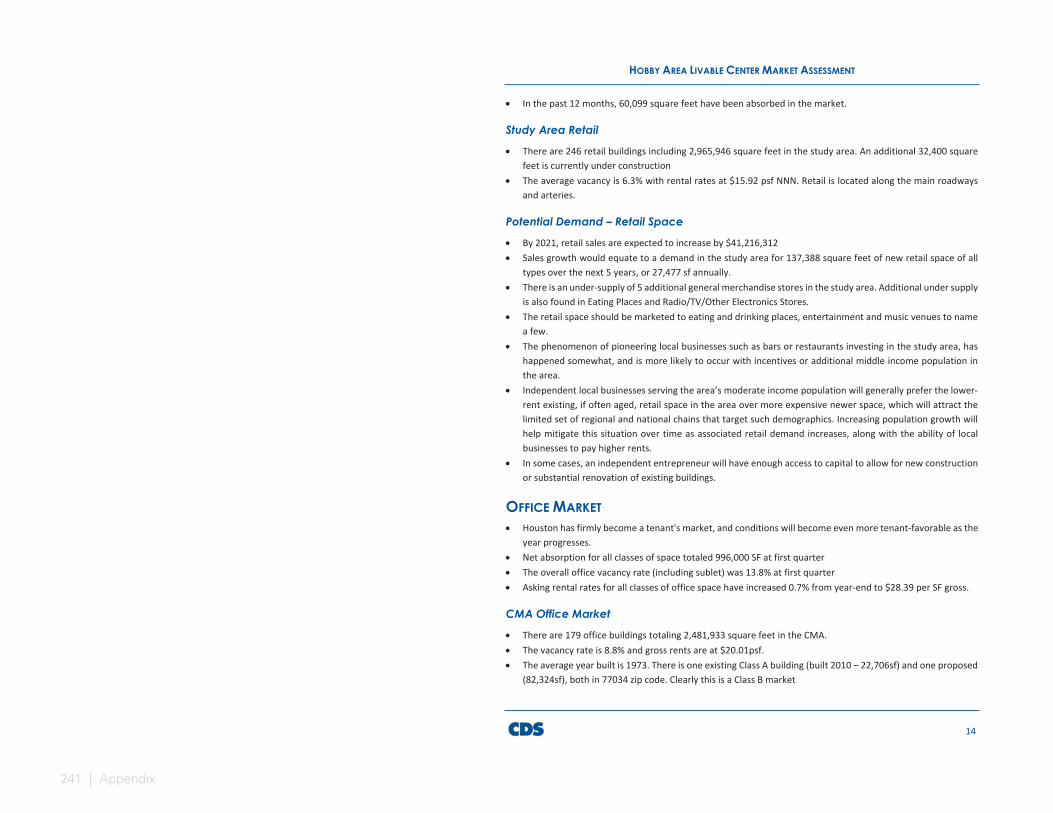
241 | Appendix
HOBBY AREA LIVABLE CENTER MARKET ASSESSMENT
14
In the past 12 months, 60,099 square feet have been absorbed in the market.
Study Area Retail
There are 246 retail buildings including 2,965,946 square feet in the study area. An additional 32,400 square feet is currently under construction
The average vacancy is 6.3% with rental rates at $15.92 psf NNN. Retail is located along the main roadways and arteries.
Potential Demand – Retail Space
By 2021, retail sales are expected to increase by $41,216,312 Sales growth would equate to a demand in the study area for 137,388 square feet of new retail space of all
types over the next 5 years, or 27,477 sf annually. There is an under-supply of 5 additional general merchandise stores in the study area. Additional under supply
is also found in Eating Places and Radio/TV/Other Electronics Stores. The retail space should be marketed to eating and drinking places, entertainment and music venues to name
a few. The phenomenon of pioneering local businesses such as bars or restaurants investing in the study area, has
happened somewhat, and is more likely to occur with incentives or additional middle income population in the area.
Independent local businesses serving the area’s moderate income population will generally prefer the lower-rent existing, if often aged, retail space in the area over more expensive newer space, which will attract the limited set of regional and national chains that target such demographics. Increasing population growth will help mitigate this situation over time as associated retail demand increases, along with the ability of local businesses to pay higher rents.
In some cases, an independent entrepreneur will have enough access to capital to allow for new construction or substantial renovation of existing buildings.
OFFICE MARKET Houston has firmly become a tenant's market, and conditions will become even more tenant-favorable as the
year progresses. Net absorption for all classes of space totaled 996,000 SF at first quarter The overall office vacancy rate (including sublet) was 13.8% at first quarter Asking rental rates for all classes of office space have increased 0.7% from year-end to $28.39 per SF gross.
CMA Office Market
There are 179 office buildings totaling 2,481,933 square feet in the CMA. The vacancy rate is 8.8% and gross rents are at $20.01psf. The average year built is 1973. There is one existing Class A building (built 2010 – 22,706sf) and one proposed
(82,324sf), both in 77034 zip code. Clearly this is a Class B market
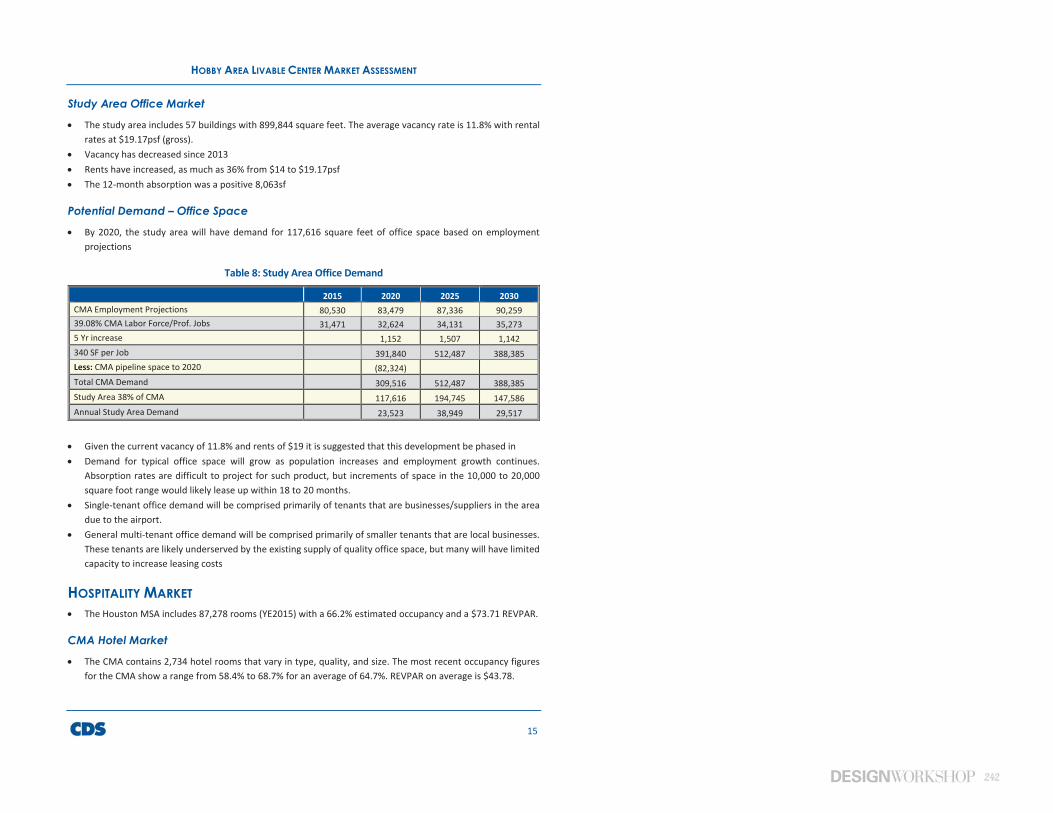
242
HOBBY AREA LIVABLE CENTER MARKET ASSESSMENT
15
Study Area Office Market
The study area includes 57 buildings with 899,844 square feet. The average vacancy rate is 11.8% with rental rates at $19.17psf (gross).
Vacancy has decreased since 2013 Rents have increased, as much as 36% from $14 to $19.17psf The 12-month absorption was a positive 8,063sf
Potential Demand – Office Space
By 2020, the study area will have demand for 117,616 square feet of office space based on employment projections
Table 8: Study Area Office Demand
2015 2020 2025 2030 CMA Employment Projections 80,530 83,479 87,336 90,259 39.08% CMA Labor Force/Prof. Jobs 31,471 32,624 34,131 35,273 5 Yr increase 1,152 1,507 1,142 340 SF per Job 391,840 512,487 388,385 Less: CMA pipeline space to 2020 (82,324) Total CMA Demand 309,516 512,487 388,385 Study Area 38% of CMA 117,616 194,745 147,586 Annual Study Area Demand 23,523 38,949 29,517
Given the current vacancy of 11.8% and rents of $19 it is suggested that this development be phased in Demand for typical office space will grow as population increases and employment growth continues.
Absorption rates are difficult to project for such product, but increments of space in the 10,000 to 20,000 square foot range would likely lease up within 18 to 20 months.
Single-tenant office demand will be comprised primarily of tenants that are businesses/suppliers in the area due to the airport.
General multi-tenant office demand will be comprised primarily of smaller tenants that are local businesses. These tenants are likely underserved by the existing supply of quality office space, but many will have limited capacity to increase leasing costs
HOSPITALITY MARKET The Houston MSA includes 87,278 rooms (YE2015) with a 66.2% estimated occupancy and a $73.71 REVPAR.
CMA Hotel Market
The CMA contains 2,734 hotel rooms that vary in type, quality, and size. The most recent occupancy figures for the CMA show a range from 58.4% to 68.7% for an average of 64.7%. REVPAR on average is $43.78.
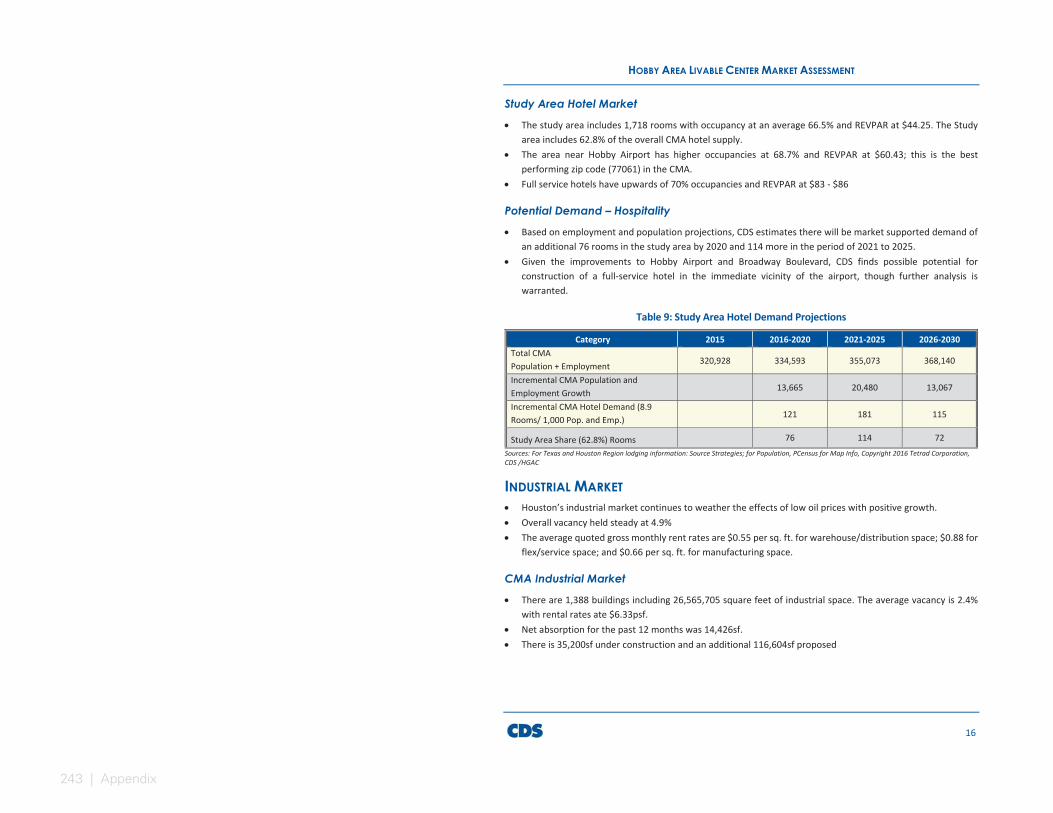
243 | Appendix
HOBBY AREA LIVABLE CENTER MARKET ASSESSMENT
16
Study Area Hotel Market
The study area includes 1,718 rooms with occupancy at an average 66.5% and REVPAR at $44.25. The Study area includes 62.8% of the overall CMA hotel supply.
The area near Hobby Airport has higher occupancies at 68.7% and REVPAR at $60.43; this is the best performing zip code (77061) in the CMA.
Full service hotels have upwards of 70% occupancies and REVPAR at $83 - $86
Potential Demand – Hospitality
Based on employment and population projections, CDS estimates there will be market supported demand of an additional 76 rooms in the study area by 2020 and 114 more in the period of 2021 to 2025.
Given the improvements to Hobby Airport and Broadway Boulevard, CDS finds possible potential for construction of a full-service hotel in the immediate vicinity of the airport, though further analysis is warranted.
Table 9: Study Area Hotel Demand Projections
Category 2015 2016-2020 2021-2025 2026-2030 Total CMA Population + Employment 320,928 334,593 355,073 368,140
Incremental CMA Population and Employment Growth 13,665 20,480 13,067
Incremental CMA Hotel Demand (8.9 Rooms/ 1,000 Pop. and Emp.) 121 181 115
Study Area Share (62.8%) Rooms 76 114 72 Sources: For Texas and Houston Region lodging information: Source Strategies; for Population, PCensus for Map Info, Copyright 2016 Tetrad Corporation, CDS /HGAC
INDUSTRIAL MARKET Houston’s industrial market continues to weather the effects of low oil prices with positive growth. Overall vacancy held steady at 4.9% The average quoted gross monthly rent rates are $0.55 per sq. ft. for warehouse/distribution space; $0.88 for
flex/service space; and $0.66 per sq. ft. for manufacturing space.
CMA Industrial Market
There are 1,388 buildings including 26,565,705 square feet of industrial space. The average vacancy is 2.4% with rental rates ate $6.33psf.
Net absorption for the past 12 months was 14,426sf. There is 35,200sf under construction and an additional 116,604sf proposed
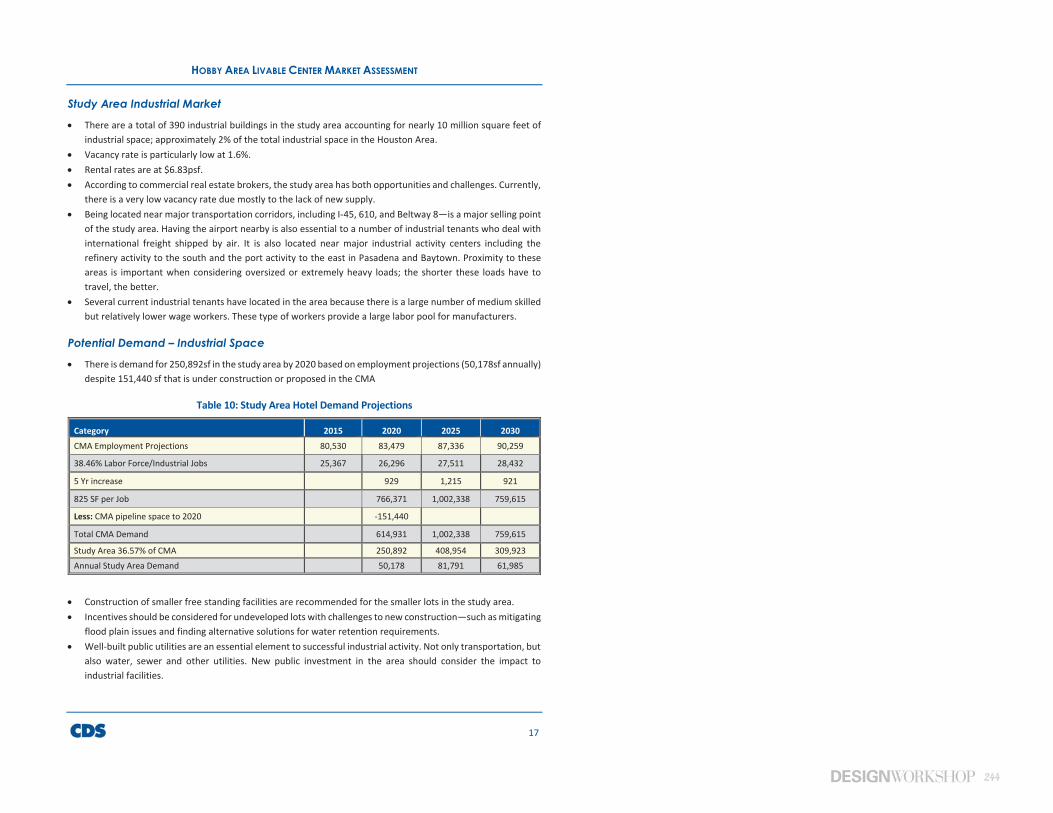
244
HOBBY AREA LIVABLE CENTER MARKET ASSESSMENT
17
Study Area Industrial Market
There are a total of 390 industrial buildings in the study area accounting for nearly 10 million square feet of industrial space; approximately 2% of the total industrial space in the Houston Area.
Vacancy rate is particularly low at 1.6%. Rental rates are at $6.83psf. According to commercial real estate brokers, the study area has both opportunities and challenges. Currently,
there is a very low vacancy rate due mostly to the lack of new supply. Being located near major transportation corridors, including I-45, 610, and Beltway 8—is a major selling point
of the study area. Having the airport nearby is also essential to a number of industrial tenants who deal with international freight shipped by air. It is also located near major industrial activity centers including the refinery activity to the south and the port activity to the east in Pasadena and Baytown. Proximity to these areas is important when considering oversized or extremely heavy loads; the shorter these loads have to travel, the better.
Several current industrial tenants have located in the area because there is a large number of medium skilled but relatively lower wage workers. These type of workers provide a large labor pool for manufacturers.
Potential Demand – Industrial Space
There is demand for 250,892sf in the study area by 2020 based on employment projections (50,178sf annually) despite 151,440 sf that is under construction or proposed in the CMA
Table 10: Study Area Hotel Demand Projections
Category 2015 2020 2025 2030 CMA Employment Projections 80,530 83,479 87,336 90,259
38.46% Labor Force/Industrial Jobs 25,367 26,296 27,511 28,432
5 Yr increase 929 1,215 921
825 SF per Job 766,371 1,002,338 759,615
Less: CMA pipeline space to 2020 -151,440
Total CMA Demand 614,931 1,002,338 759,615
Study Area 36.57% of CMA 250,892 408,954 309,923 Annual Study Area Demand 50,178 81,791 61,985
Construction of smaller free standing facilities are recommended for the smaller lots in the study area. Incentives should be considered for undeveloped lots with challenges to new construction—such as mitigating
flood plain issues and finding alternative solutions for water retention requirements. Well-built public utilities are an essential element to successful industrial activity. Not only transportation, but
also water, sewer and other utilities. New public investment in the area should consider the impact to industrial facilities.
245 | Appendix
HOBBY AREA LIVABLE CENTER MARKET ASSESSMENT
18
Optimal routes designating for trucking traffic are needed to promote growth and minimize the externalities to non-industrial users.
There is potential to encourage manufacturing in the area, which would increase employment and daytime population, having a positive impact on other land uses such as retail and residential.
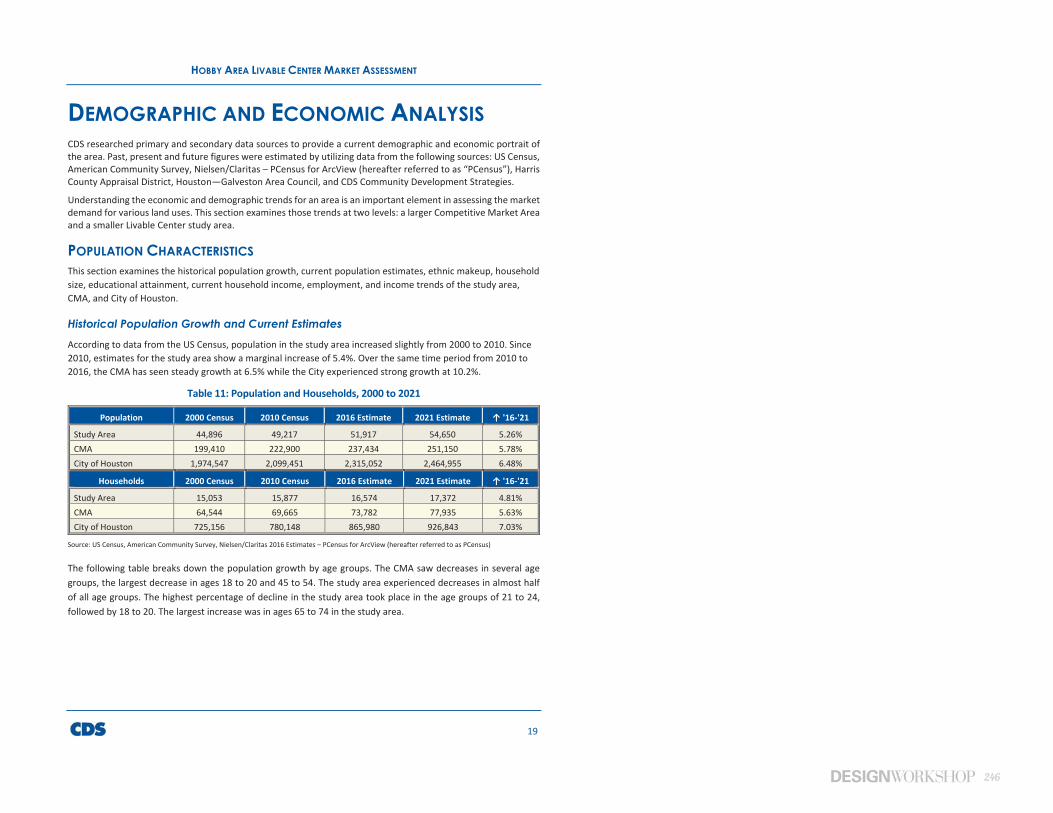
246
HOBBY AREA LIVABLE CENTER MARKET ASSESSMENT
19
DEMOGRAPHIC AND ECONOMIC ANALYSISCDS researched primary and secondary data sources to provide a current demographic and economic portrait of the area. Past, present and future figures were estimated by utilizing data from the following sources: US Census, American Community Survey, Nielsen/Claritas – PCensus for ArcView (hereafter referred to as “PCensus”), Harris County Appraisal District, Houston—Galveston Area Council, and CDS Community Development Strategies.
Understanding the economic and demographic trends for an area is an important element in assessing the market demand for various land uses. This section examines those trends at two levels: a larger Competitive Market Area and a smaller Livable Center study area.
POPULATION CHARACTERISTICSThis section examines the historical population growth, current population estimates, ethnic makeup, household size, educational attainment, current household income, employment, and income trends of the study area, CMA, and City of Houston.
Historical Population Growth and Current Estimates According to data from the US Census, population in the study area increased slightly from 2000 to 2010. Since 2010, estimates for the study area show a marginal increase of 5.4%. Over the same time period from 2010 to 2016, the CMA has seen steady growth at 6.5% while the City experienced strong growth at 10.2%.
Table 11: Population and Households, 2000 to 2021
Population 2000 Census 2010 Census 2016 Estimate 2021 Estimate ↑ '16-'21
Study Area 44,896 49,217 51,917 54,650 5.26% CMA 199,410 222,900 237,434 251,150 5.78% City of Houston 1,974,547 2,099,451 2,315,052 2,464,955 6.48%
Households 2000 Census 2010 Census 2016 Estimate 2021 Estimate ↑ '16-'21
Study Area 15,053 15,877 16,574 17,372 4.81% CMA 64,544 69,665 73,782 77,935 5.63% City of Houston 725,156 780,148 865,980 926,843 7.03%
Source: US Census, American Community Survey, Nielsen/Claritas 2016 Estimates – PCensus for ArcView (hereafter referred to as PCensus)
The following table breaks down the population growth by age groups. The CMA saw decreases in several age groups, the largest decrease in ages 18 to 20 and 45 to 54. The study area experienced decreases in almost half of all age groups. The highest percentage of decline in the study area took place in the age groups of 21 to 24, followed by 18 to 20. The largest increase was in ages 65 to 74 in the study area.
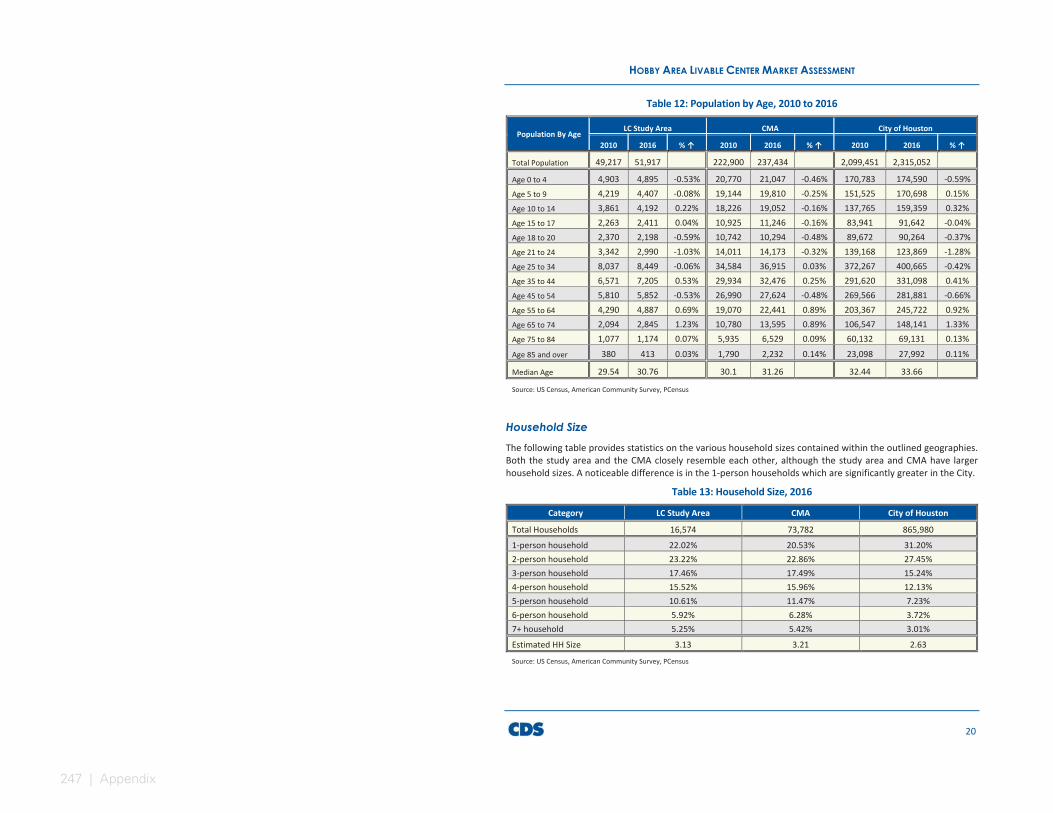
247 | Appendix
HOBBY AREA LIVABLE CENTER MARKET ASSESSMENT
20
Table 12: Population by Age, 2010 to 2016
Population By Age LC Study Area CMA City of Houston
2010 2016 % ↑ 2010 2016 % ↑ 2010 2016 % ↑
Total Population 49,217 51,917 222,900 237,434 2,099,451 2,315,052
Age 0 to 4 4,903 4,895 -0.53% 20,770 21,047 -0.46% 170,783 174,590 -0.59% Age 5 to 9 4,219 4,407 -0.08% 19,144 19,810 -0.25% 151,525 170,698 0.15% Age 10 to 14 3,861 4,192 0.22% 18,226 19,052 -0.16% 137,765 159,359 0.32% Age 15 to 17 2,263 2,411 0.04% 10,925 11,246 -0.16% 83,941 91,642 -0.04% Age 18 to 20 2,370 2,198 -0.59% 10,742 10,294 -0.48% 89,672 90,264 -0.37% Age 21 to 24 3,342 2,990 -1.03% 14,011 14,173 -0.32% 139,168 123,869 -1.28% Age 25 to 34 8,037 8,449 -0.06% 34,584 36,915 0.03% 372,267 400,665 -0.42% Age 35 to 44 6,571 7,205 0.53% 29,934 32,476 0.25% 291,620 331,098 0.41% Age 45 to 54 5,810 5,852 -0.53% 26,990 27,624 -0.48% 269,566 281,881 -0.66% Age 55 to 64 4,290 4,887 0.69% 19,070 22,441 0.89% 203,367 245,722 0.92% Age 65 to 74 2,094 2,845 1.23% 10,780 13,595 0.89% 106,547 148,141 1.33% Age 75 to 84 1,077 1,174 0.07% 5,935 6,529 0.09% 60,132 69,131 0.13% Age 85 and over 380 413 0.03% 1,790 2,232 0.14% 23,098 27,992 0.11%
Median Age 29.54 30.76 30.1 31.26 32.44 33.66
Source: US Census, American Community Survey, PCensus
Household Size The following table provides statistics on the various household sizes contained within the outlined geographies. Both the study area and the CMA closely resemble each other, although the study area and CMA have larger household sizes. A noticeable difference is in the 1-person households which are significantly greater in the City.
Table 13: Household Size, 2016
Category LC Study Area CMA City of Houston
Total Households 16,574 73,782 865,980 1-person household 22.02% 20.53% 31.20% 2-person household 23.22% 22.86% 27.45% 3-person household 17.46% 17.49% 15.24% 4-person household 15.52% 15.96% 12.13% 5-person household 10.61% 11.47% 7.23% 6-person household 5.92% 6.28% 3.72% 7+ household 5.25% 5.42% 3.01% Estimated HH Size 3.13 3.21 2.63
Source: US Census, American Community Survey, PCensus
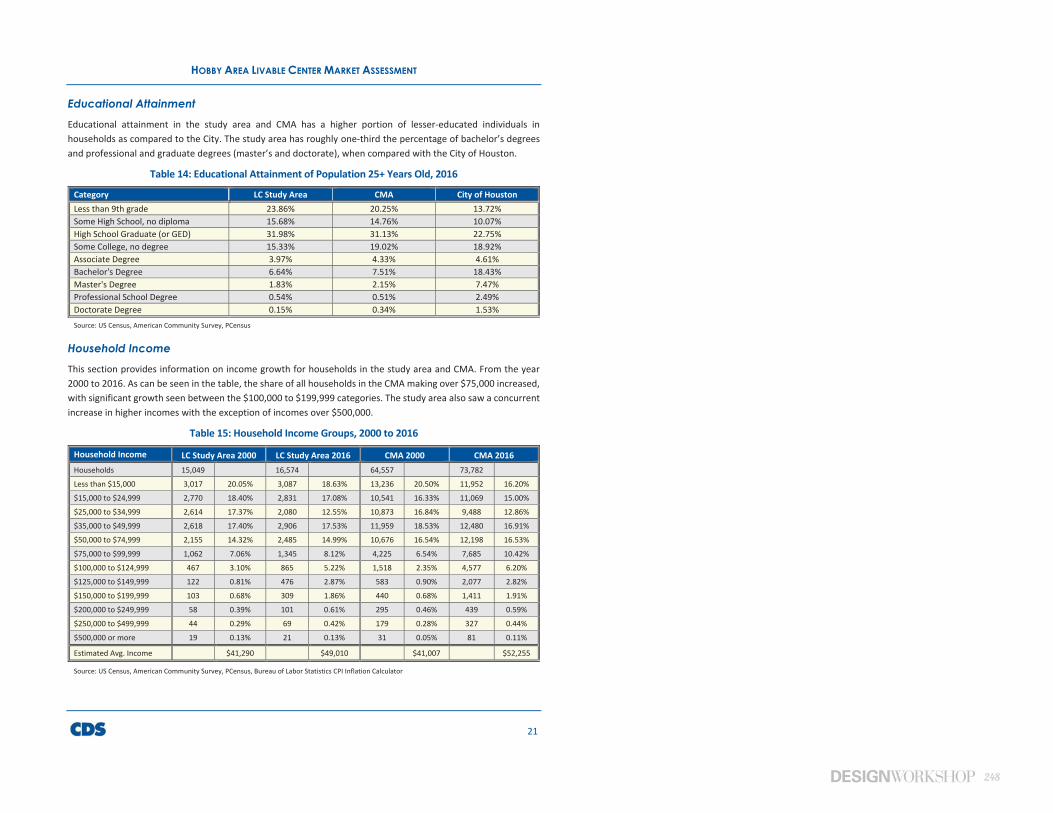
248
HOBBY AREA LIVABLE CENTER MARKET ASSESSMENT
21
Educational Attainment Educational attainment in the study area and CMA has a higher portion of lesser-educated individuals in households as compared to the City. The study area has roughly one-third the percentage of bachelor’s degrees and professional and graduate degrees (master’s and doctorate), when compared with the City of Houston.
Table 14: Educational Attainment of Population 25+ Years Old, 2016
Category LC Study Area CMA City of Houston Less than 9th grade 23.86% 20.25% 13.72% Some High School, no diploma 15.68% 14.76% 10.07% High School Graduate (or GED) 31.98% 31.13% 22.75% Some College, no degree 15.33% 19.02% 18.92% Associate Degree 3.97% 4.33% 4.61% Bachelor's Degree 6.64% 7.51% 18.43% Master's Degree 1.83% 2.15% 7.47% Professional School Degree 0.54% 0.51% 2.49% Doctorate Degree 0.15% 0.34% 1.53% Source: US Census, American Community Survey, PCensus
Household Income This section provides information on income growth for households in the study area and CMA. From the year 2000 to 2016. As can be seen in the table, the share of all households in the CMA making over $75,000 increased, with significant growth seen between the $100,000 to $199,999 categories. The study area also saw a concurrent increase in higher incomes with the exception of incomes over $500,000.
Table 15: Household Income Groups, 2000 to 2016
Household Income LC Study Area 2000 LC Study Area 2016 CMA 2000 CMA 2016 Households 15,049 16,574 64,557 73,782 Less than $15,000 3,017 20.05% 3,087 18.63% 13,236 20.50% 11,952 16.20% $15,000 to $24,999 2,770 18.40% 2,831 17.08% 10,541 16.33% 11,069 15.00% $25,000 to $34,999 2,614 17.37% 2,080 12.55% 10,873 16.84% 9,488 12.86% $35,000 to $49,999 2,618 17.40% 2,906 17.53% 11,959 18.53% 12,480 16.91% $50,000 to $74,999 2,155 14.32% 2,485 14.99% 10,676 16.54% 12,198 16.53% $75,000 to $99,999 1,062 7.06% 1,345 8.12% 4,225 6.54% 7,685 10.42% $100,000 to $124,999 467 3.10% 865 5.22% 1,518 2.35% 4,577 6.20% $125,000 to $149,999 122 0.81% 476 2.87% 583 0.90% 2,077 2.82% $150,000 to $199,999 103 0.68% 309 1.86% 440 0.68% 1,411 1.91% $200,000 to $249,999 58 0.39% 101 0.61% 295 0.46% 439 0.59% $250,000 to $499,999 44 0.29% 69 0.42% 179 0.28% 327 0.44% $500,000 or more 19 0.13% 21 0.13% 31 0.05% 81 0.11%
Estimated Avg. Income $41,290 $49,010 $41,007 $52,255
Source: US Census, American Community Survey, PCensus, Bureau of Labor Statistics CPI Inflation Calculator
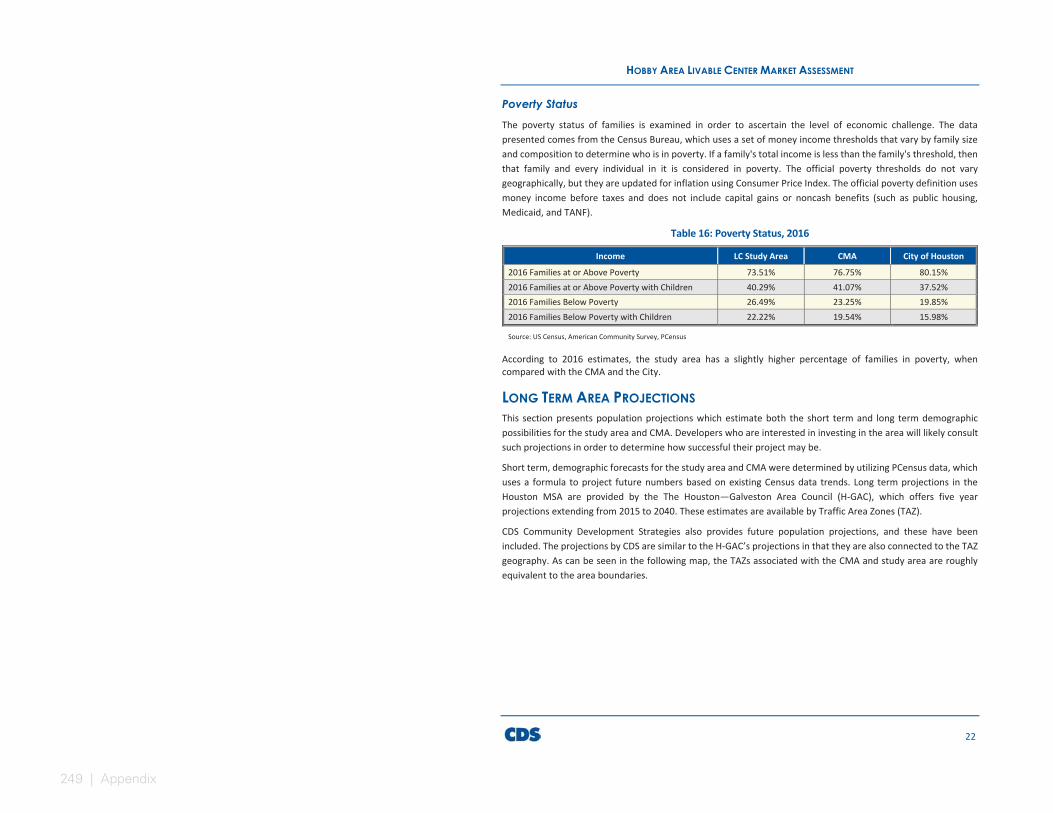
249 | Appendix
HOBBY AREA LIVABLE CENTER MARKET ASSESSMENT
22
Poverty Status The poverty status of families is examined in order to ascertain the level of economic challenge. The data presented comes from the Census Bureau, which uses a set of money income thresholds that vary by family size and composition to determine who is in poverty. If a family's total income is less than the family's threshold, then that family and every individual in it is considered in poverty. The official poverty thresholds do not vary geographically, but they are updated for inflation using Consumer Price Index. The official poverty definition uses money income before taxes and does not include capital gains or noncash benefits (such as public housing, Medicaid, and TANF).
Table 16: Poverty Status, 2016
Income LC Study Area CMA City of Houston
2016 Families at or Above Poverty 73.51% 76.75% 80.15% 2016 Families at or Above Poverty with Children 40.29% 41.07% 37.52% 2016 Families Below Poverty 26.49% 23.25% 19.85% 2016 Families Below Poverty with Children 22.22% 19.54% 15.98%
Source: US Census, American Community Survey, PCensus
According to 2016 estimates, the study area has a slightly higher percentage of families in poverty, when compared with the CMA and the City.
LONG TERM AREA PROJECTIONS This section presents population projections which estimate both the short term and long term demographic possibilities for the study area and CMA. Developers who are interested in investing in the area will likely consult such projections in order to determine how successful their project may be.
Short term, demographic forecasts for the study area and CMA were determined by utilizing PCensus data, which uses a formula to project future numbers based on existing Census data trends. Long term projections in the Houston MSA are provided by the The Houston—Galveston Area Council (H-GAC), which offers five year projections extending from 2015 to 2040. These estimates are available by Traffic Area Zones (TAZ).
CDS Community Development Strategies also provides future population projections, and these have been included. The projections by CDS are similar to the H-GAC’s projections in that they are also connected to the TAZ geography. As can be seen in the following map, the TAZs associated with the CMA and study area are roughly equivalent to the area boundaries.

250
HOBBY AREA LIVABLE CENTER MARKET ASSESSMENT
23
Figure 8: Traffic Analysis Zones Covering the CMA
The following three tables display short term study area and CMA projections based on Census trends, as well as longer term study area and CMA projections provided by the H-GAC and CDS Community Development Strategies.
Table 17: Short Term Study Area and CMA Projections Based on US Census Trends
Population 2000 Census 2010 Census 2016 Estimate 2021 Estimate
Study Area 44,896 49,217 51,917 54,650
CMA 199,410 222,900 237,434 251,150
Households 2000 Census 2010 Census 2016 Estimate 2021 Estimate
Study Area 15,053 15,877 16,574 17,372
CMA 64,544 69,665 73,782 77,935
Source: US Census, American Community Survey, PCensus
The short term projections based on US Census trends estimate that from the year 2016 to 2021 the study area population will grow at 4.8% while the CMA will grow at 5.7%. This equates to roughly 798 new individuals in the
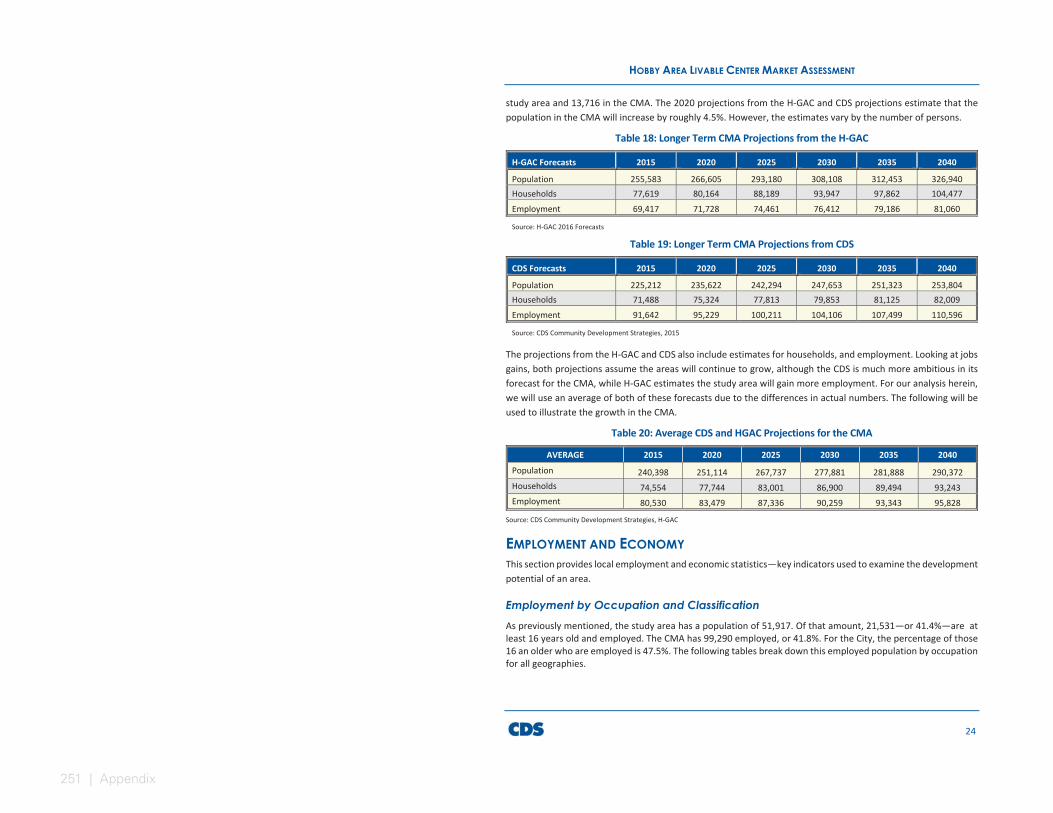
251 | Appendix
HOBBY AREA LIVABLE CENTER MARKET ASSESSMENT
24
study area and 13,716 in the CMA. The 2020 projections from the H-GAC and CDS projections estimate that the population in the CMA will increase by roughly 4.5%. However, the estimates vary by the number of persons.
Table 18: Longer Term CMA Projections from the H-GAC
H-GAC Forecasts 2015 2020 2025 2030 2035 2040
Population 255,583 266,605 293,180 308,108 312,453 326,940 Households 77,619 80,164 88,189 93,947 97,862 104,477 Employment 69,417 71,728 74,461 76,412 79,186 81,060
Source: H-GAC 2016 Forecasts
Table 19: Longer Term CMA Projections from CDS
CDS Forecasts 2015 2020 2025 2030 2035 2040
Population 225,212 235,622 242,294 247,653 251,323 253,804 Households 71,488 75,324 77,813 79,853 81,125 82,009 Employment 91,642 95,229 100,211 104,106 107,499 110,596
Source: CDS Community Development Strategies, 2015
The projections from the H-GAC and CDS also include estimates for households, and employment. Looking at jobs gains, both projections assume the areas will continue to grow, although the CDS is much more ambitious in its forecast for the CMA, while H-GAC estimates the study area will gain more employment. For our analysis herein, we will use an average of both of these forecasts due to the differences in actual numbers. The following will be used to illustrate the growth in the CMA.
Table 20: Average CDS and HGAC Projections for the CMA
AVERAGE 2015 2020 2025 2030 2035 2040 Population 240,398 251,114 267,737 277,881 281,888 290,372 Households 74,554 77,744 83,001 86,900 89,494 93,243 Employment 80,530 83,479 87,336 90,259 93,343 95,828
Source: CDS Community Development Strategies, H-GAC
EMPLOYMENT AND ECONOMYThis section provides local employment and economic statistics—key indicators used to examine the development potential of an area.
Employment by Occupation and Classification As previously mentioned, the study area has a population of 51,917. Of that amount, 21,531—or 41.4%—are at least 16 years old and employed. The CMA has 99,290 employed, or 41.8%. For the City, the percentage of those 16 an older who are employed is 47.5%. The following tables break down this employed population by occupation for all geographies.
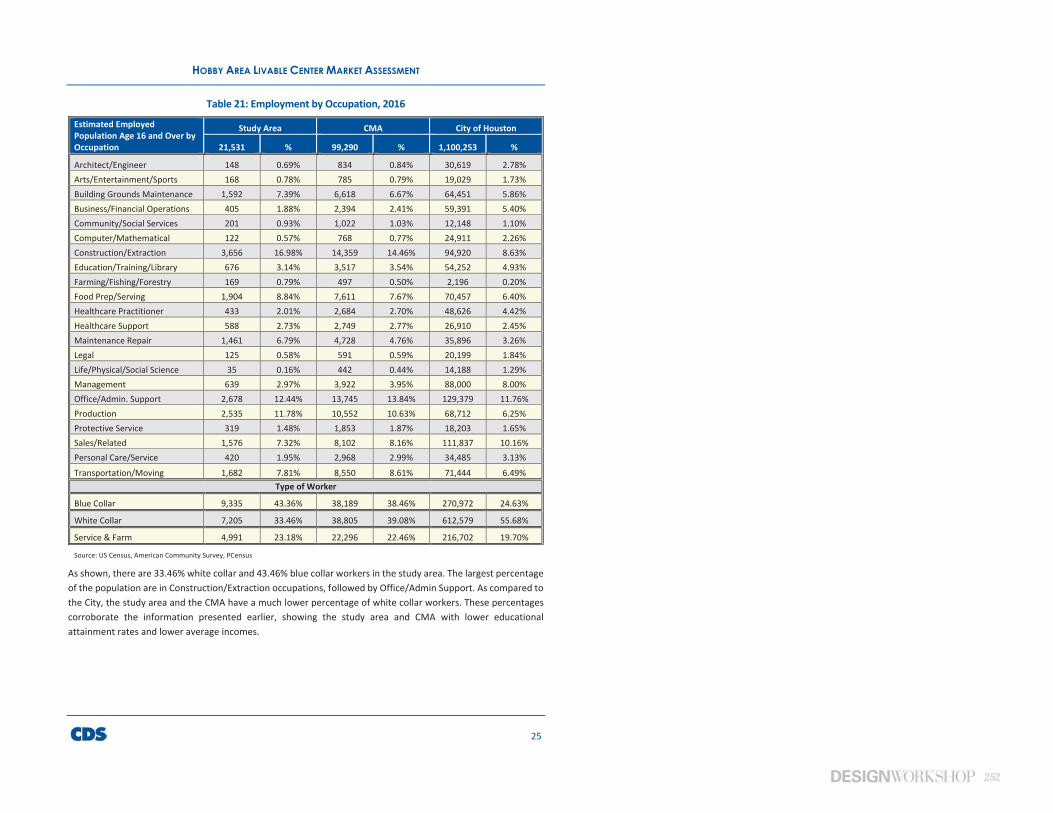
252
HOBBY AREA LIVABLE CENTER MARKET ASSESSMENT
25
Table 21: Employment by Occupation, 2016
Estimated Employed Population Age 16 and Over by Occupation
Study Area CMA City of Houston
21,531 % 99,290 % 1,100,253 %
Architect/Engineer 148 0.69% 834 0.84% 30,619 2.78% Arts/Entertainment/Sports 168 0.78% 785 0.79% 19,029 1.73% Building Grounds Maintenance 1,592 7.39% 6,618 6.67% 64,451 5.86% Business/Financial Operations 405 1.88% 2,394 2.41% 59,391 5.40% Community/Social Services 201 0.93% 1,022 1.03% 12,148 1.10% Computer/Mathematical 122 0.57% 768 0.77% 24,911 2.26% Construction/Extraction 3,656 16.98% 14,359 14.46% 94,920 8.63% Education/Training/Library 676 3.14% 3,517 3.54% 54,252 4.93% Farming/Fishing/Forestry 169 0.79% 497 0.50% 2,196 0.20% Food Prep/Serving 1,904 8.84% 7,611 7.67% 70,457 6.40% Healthcare Practitioner 433 2.01% 2,684 2.70% 48,626 4.42% Healthcare Support 588 2.73% 2,749 2.77% 26,910 2.45% Maintenance Repair 1,461 6.79% 4,728 4.76% 35,896 3.26% Legal 125 0.58% 591 0.59% 20,199 1.84% Life/Physical/Social Science 35 0.16% 442 0.44% 14,188 1.29% Management 639 2.97% 3,922 3.95% 88,000 8.00% Office/Admin. Support 2,678 12.44% 13,745 13.84% 129,379 11.76% Production 2,535 11.78% 10,552 10.63% 68,712 6.25% Protective Service 319 1.48% 1,853 1.87% 18,203 1.65% Sales/Related 1,576 7.32% 8,102 8.16% 111,837 10.16% Personal Care/Service 420 1.95% 2,968 2.99% 34,485 3.13% Transportation/Moving 1,682 7.81% 8,550 8.61% 71,444 6.49%
Type of Worker
Blue Collar 9,335 43.36% 38,189 38.46% 270,972 24.63%
White Collar 7,205 33.46% 38,805 39.08% 612,579 55.68%
Service & Farm 4,991 23.18% 22,296 22.46% 216,702 19.70%
Source: US Census, American Community Survey, PCensus
As shown, there are 33.46% white collar and 43.46% blue collar workers in the study area. The largest percentage of the population are in Construction/Extraction occupations, followed by Office/Admin Support. As compared to the City, the study area and the CMA have a much lower percentage of white collar workers. These percentages corroborate the information presented earlier, showing the study area and CMA with lower educational attainment rates and lower average incomes.

253 | Appendix
HOBBY AREA LIVABLE CENTER MARKET ASSESSMENT
26
Employment Inflow and Outflow To better understand local demand for various land uses, it is helpful to take a look at the jobs data provided by the Longitudinal Employer-Household Dynamic (LEHD), which is part of the US Census Bureau. While the most recent data available is from 2014 (and differs slightly from the employment estimates provided previously), it is still helpful in understanding present day commuting patterns.
Table 22: Employment Inflow and Outflow, 2014
Employment Inflow/Outflow Study Area CMA
# % # % Employed in the Area 23,405 100.0% 70,140 100.0% Employed in the Area but Living Outside 22,387 95.7% 60,440 86.2% Employed in the Area and Living Inside 1,018 4.3% 9,700 13.8% Living in the Area and Employed 17,217 100.0% 89,580 100.0% Living in the Area but Employed Outside 16,199 94.1% 79,880 89.2% Living in the Area and Employed Inside 1,018 5.9% 9,700 10.8%
Source: US Census Longitudinal Employer-Household Dynamics, 2014 Note: 2014 is latest data available from the Census LEHD
The following figure utilizes LEHD data to provide a visualization of where workers in the CMA reside, and where residents in the CMA work. As can be seen, workers come from all parts of the Houston area, but a relatively large percentage (13.8%) are employed in the CMA and living inside.
Figure 9: Where Workers in the CMA Reside, Where Residents in the CMA Work
Source: US Census, LEHD 2014, CDS
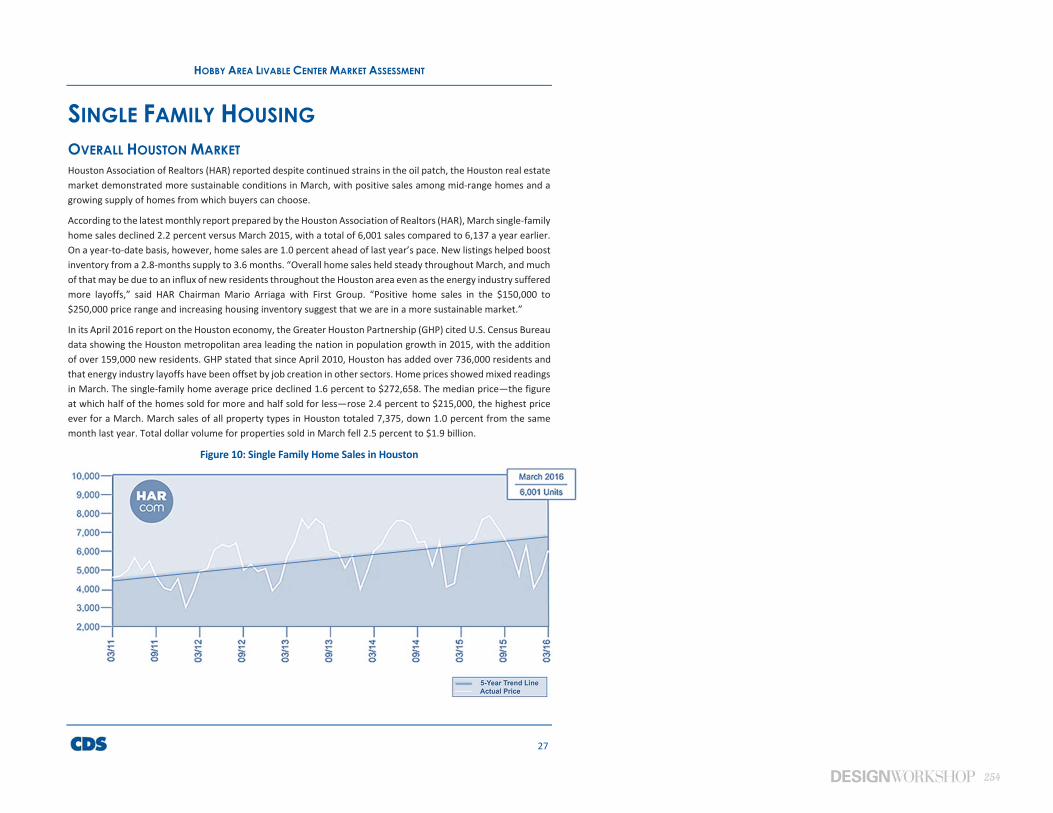
254
HOBBY AREA LIVABLE CENTER MARKET ASSESSMENT
27
SINGLE FAMILY HOUSINGOVERALL HOUSTON MARKETHouston Association of Realtors (HAR) reported despite continued strains in the oil patch, the Houston real estate market demonstrated more sustainable conditions in March, with positive sales among mid-range homes and a growing supply of homes from which buyers can choose.
According to the latest monthly report prepared by the Houston Association of Realtors (HAR), March single-family home sales declined 2.2 percent versus March 2015, with a total of 6,001 sales compared to 6,137 a year earlier. On a year-to-date basis, however, home sales are 1.0 percent ahead of last year’s pace. New listings helped boost inventory from a 2.8-months supply to 3.6 months. “Overall home sales held steady throughout March, and much of that may be due to an influx of new residents throughout the Houston area even as the energy industry suffered more layoffs,” said HAR Chairman Mario Arriaga with First Group. “Positive home sales in the $150,000 to $250,000 price range and increasing housing inventory suggest that we are in a more sustainable market.”
In its April 2016 report on the Houston economy, the Greater Houston Partnership (GHP) cited U.S. Census Bureau data showing the Houston metropolitan area leading the nation in population growth in 2015, with the addition of over 159,000 new residents. GHP stated that since April 2010, Houston has added over 736,000 residents and that energy industry layoffs have been offset by job creation in other sectors. Home prices showed mixed readings in March. The single-family home average price declined 1.6 percent to $272,658. The median price—the figure at which half of the homes sold for more and half sold for less—rose 2.4 percent to $215,000, the highest price ever for a March. March sales of all property types in Houston totaled 7,375, down 1.0 percent from the same month last year. Total dollar volume for properties sold in March fell 2.5 percent to $1.9 billion.
Figure 10: Single Family Home Sales in Houston
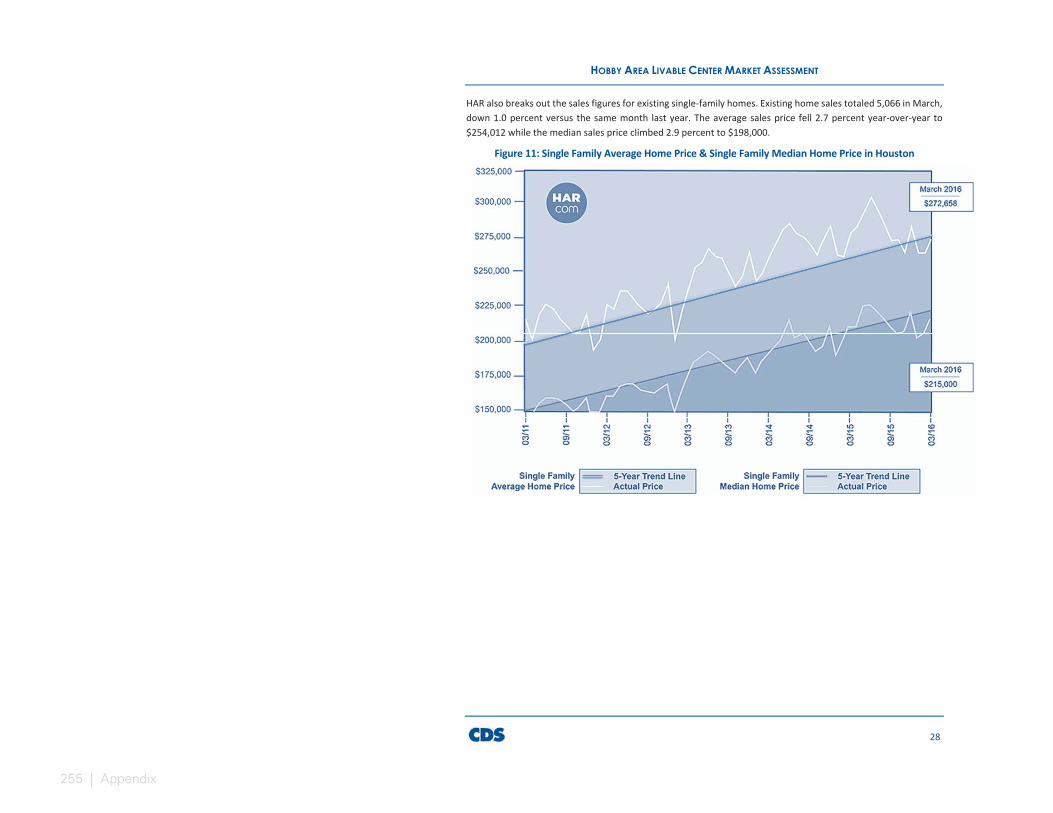
255 | Appendix
HOBBY AREA LIVABLE CENTER MARKET ASSESSMENT
28
HAR also breaks out the sales figures for existing single-family homes. Existing home sales totaled 5,066 in March, down 1.0 percent versus the same month last year. The average sales price fell 2.7 percent year-over-year to $254,012 while the median sales price climbed 2.9 percent to $198,000.
Figure 11: Single Family Average Home Price & Single Family Median Home Price in Houston
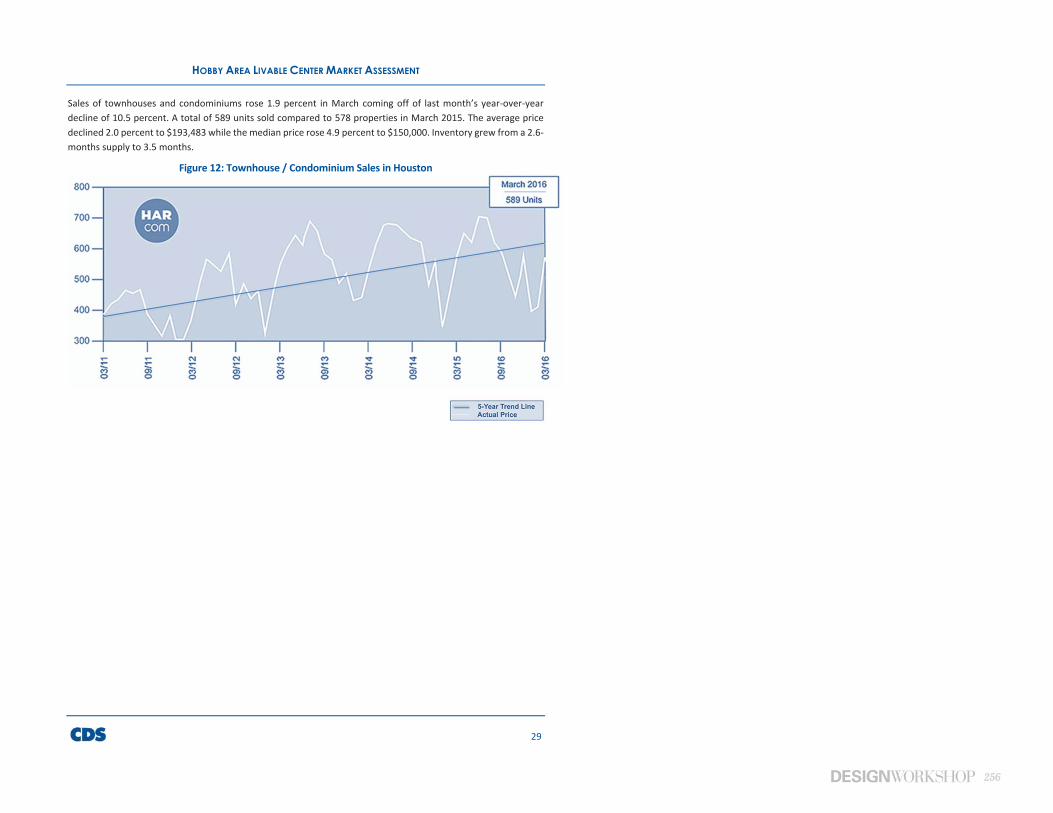
256
HOBBY AREA LIVABLE CENTER MARKET ASSESSMENT
29
Sales of townhouses and condominiums rose 1.9 percent in March coming off of last month’s year-over-year decline of 10.5 percent. A total of 589 units sold compared to 578 properties in March 2015. The average price declined 2.0 percent to $193,483 while the median price rose 4.9 percent to $150,000. Inventory grew from a 2.6-months supply to 3.5 months.
Figure 12: Townhouse / Condominium Sales in Houston
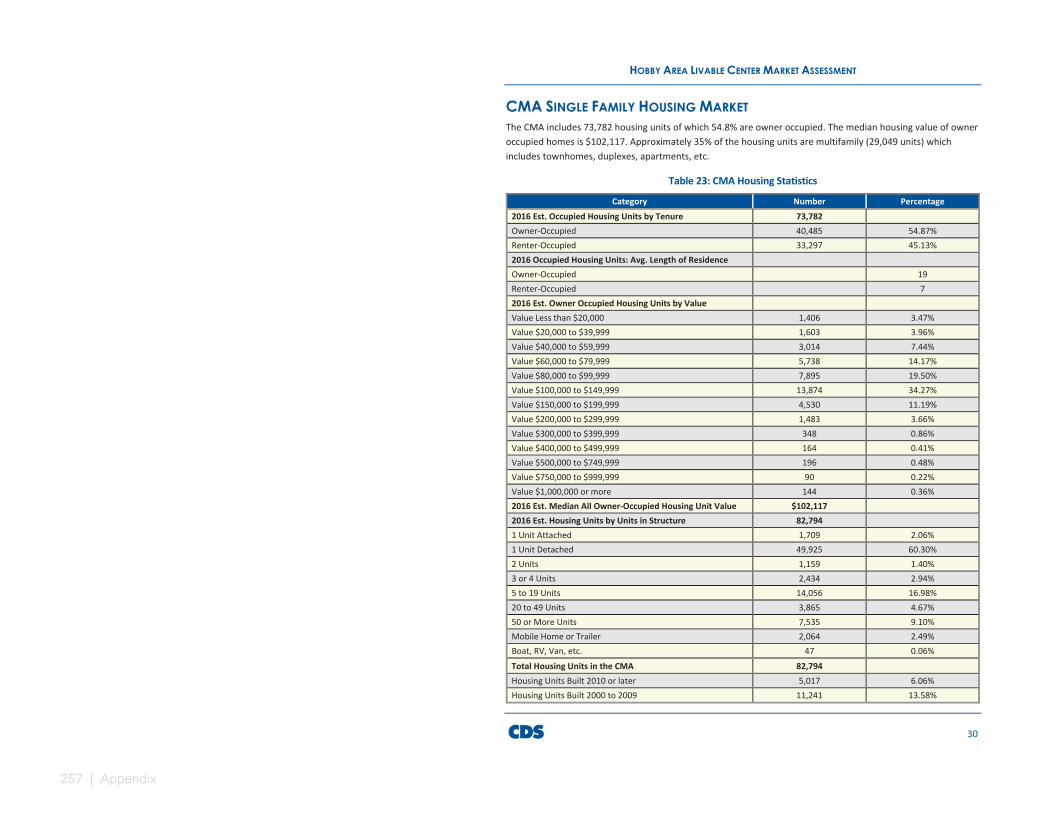
257 | Appendix
HOBBY AREA LIVABLE CENTER MARKET ASSESSMENT
30
CMA SINGLE FAMILY HOUSING MARKETThe CMA includes 73,782 housing units of which 54.8% are owner occupied. The median housing value of owner occupied homes is $102,117. Approximately 35% of the housing units are multifamily (29,049 units) which includes townhomes, duplexes, apartments, etc.
Table 23: CMA Housing Statistics
Category Number Percentage 2016 Est. Occupied Housing Units by Tenure 73,782 Owner-Occupied 40,485 54.87% Renter-Occupied 33,297 45.13% 2016 Occupied Housing Units: Avg. Length of Residence Owner-Occupied 19 Renter-Occupied 7 2016 Est. Owner Occupied Housing Units by Value Value Less than $20,000 1,406 3.47% Value $20,000 to $39,999 1,603 3.96% Value $40,000 to $59,999 3,014 7.44% Value $60,000 to $79,999 5,738 14.17% Value $80,000 to $99,999 7,895 19.50% Value $100,000 to $149,999 13,874 34.27% Value $150,000 to $199,999 4,530 11.19% Value $200,000 to $299,999 1,483 3.66% Value $300,000 to $399,999 348 0.86% Value $400,000 to $499,999 164 0.41% Value $500,000 to $749,999 196 0.48% Value $750,000 to $999,999 90 0.22% Value $1,000,000 or more 144 0.36% 2016 Est. Median All Owner-Occupied Housing Unit Value $102,117 2016 Est. Housing Units by Units in Structure 82,794 1 Unit Attached 1,709 2.06% 1 Unit Detached 49,925 60.30% 2 Units 1,159 1.40% 3 or 4 Units 2,434 2.94% 5 to 19 Units 14,056 16.98% 20 to 49 Units 3,865 4.67% 50 or More Units 7,535 9.10% Mobile Home or Trailer 2,064 2.49% Boat, RV, Van, etc. 47 0.06% Total Housing Units in the CMA 82,794 Housing Units Built 2010 or later 5,017 6.06% Housing Units Built 2000 to 2009 11,241 13.58%

258
HOBBY AREA LIVABLE CENTER MARKET ASSESSMENT
31
Category Number Percentage Housing Units Built 1990 to 1999 4,069 4.91% Housing Units Built 1980 to 1989 6,547 7.91% Housing Units Built 1970 to 1979 17,407 21.02% Housing Units Built 1960 to 1969 13,173 15.91% Housing Units Built 1950 to 1959 17,906 21.63% Housing Units Built 1940 to 1949 5,105 6.17% Housing Units Built 1939 or Earlier 2,329 2.81% Dominant Year Structure Built 1972
Source: US Census, American Community Survey, PCensus
Resale Market There were 237 sales in the first 4.5 months of 2016 in the CMA. The average price was $109,601. The average price has increased by 30.3% in the CMA over the past six years. There were 119 sales in the CMA over $200,000 in the past 6.5 years. On average 18 homes sold per year over $200,000. The median sales price in this group was $234,900. Currently there are 154 homes “For Sale” in the CMA with an average listing price of $157,501 which is significantly above the average sales price of $109,601.
Table 24: CMA Home Sales over $200,000, 2010-2016
119 Total Sales Sale Price SP/LP % DOM
Min $200,000 73% 0
Average $276,163 96% 100
Max $1,899,900 115% 1036
Median $234,900 97% 50
Source: Houston Association of Realtors (HAR)
Table 25: CMA Active Home Listings
154 Total Listings List Price DOM
Min $30,000 1
Average $157,501 81
Max $745,000 1143
Median $139,999 64
Source: Houston Association of Realtors (HAR)
New Home Construction There appears to be new construction just south of the study area in the CMA on Fabiola Drive. The new homes are located in Las Alamedas subdivision off Edgebrook/Clearwood. The homes range in price from $169,900 to $204,999 (2181 sf to 2311sf). There are 20 lots in the subdivision. One home has been sold and two are under contract at the time of this report. The homes are located in the Pasadena ISD.

259 | Appendix
HOBBY AREA LIVABLE CENTER MARKET ASSESSMENT
32
STUDY AREA SINGLE FAMILY HOUSING MARKETThere are an estimated 18,531 housing units in the study area currently including single family and multifamily. Approximately 46.3% of the occupied units are owner-occupied. The median value for owner-occupied housing is $111,916 which is greater than the CMA ($102,117). There are 50.5% single family housing units in the Hobby Area District (study area) and 48.2% multifamily units (8,937) which includes apartments, townhomes, duplexes, tri-plexes and four-plexes. The largest share of the housing structures were built between 1970 and 1979. 76.6% of the structures were built before 1980. Only 4.6% have been built in the past six years.
Table 26: Housing Statistics for the Study Araa
Category Number Percentage 2016 Est. Occupied Housing Units by Tenure 16,574
Owner-Occupied 7,677 46.32% Renter-Occupied 8,897 53.68%
2016 Occupied Housing Units: Avg. Length of Residence Owner-Occupied 18 Renter-Occupied 7
2016 Est. Owner Occupied Housing Units by Value 7,677 Value Less than $20,000 264 3.43% Value $20,000 to $39,999 268 3.49% Value $40,000 to $59,999 366 4.77% Value $60,000 to $79,999 873 11.37% Value $80,000 to $99,999 1,426 18.58% Value $100,000 to $149,999 2,693 35.08% Value $150,000 to $199,999 1,125 14.66% Value $200,000 to $299,999 427 5.57% Value $300,000 to $399,999 129 1.68% Value $400,000 to $499,999 58 0.76% Value $500,000 to $749,999 34 0.44% Value $750,000 to $999,999 12 0.16% Value $1,000,000 or more 1 0.02%
2016 Est. Median All Owner-Occupied Housing Unit Value $111,916
2016 Est. Housing Units by Units in Structure 18,531 1 Unit Attached 211 1.14% 1 Unit Detached 9,147 49.36% 2 Units 198 1.07% 3 or 4 Units 748 4.04% 5 to 19 Units 3,814 20.58% 20 to 49 Units 1,197 6.46% 50 or More Units 2,980 16.08% Mobile Home or Trailer 216 1.17% Boat, RV, Van, etc. 20 0.11%
Dominant structure type 1 Unit Detached
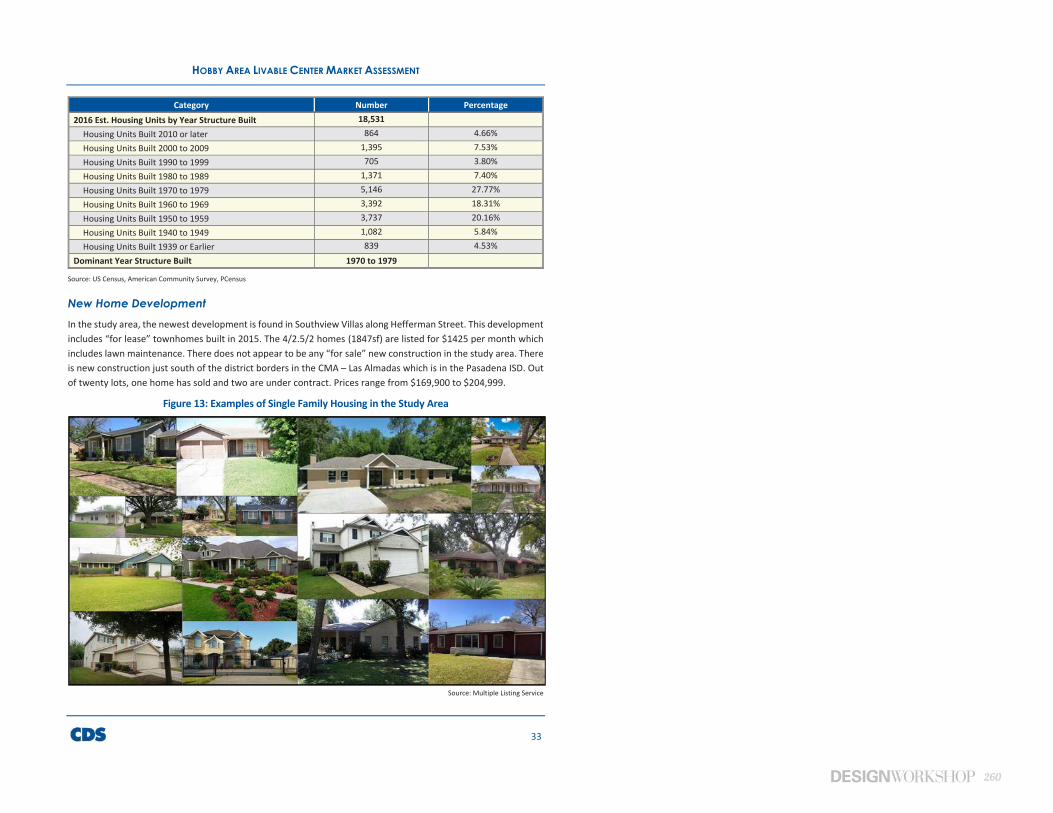
260
HOBBY AREA LIVABLE CENTER MARKET ASSESSMENT
33
Category Number Percentage 2016 Est. Housing Units by Year Structure Built 18,531
Housing Units Built 2010 or later 864 4.66% Housing Units Built 2000 to 2009 1,395 7.53% Housing Units Built 1990 to 1999 705 3.80% Housing Units Built 1980 to 1989 1,371 7.40% Housing Units Built 1970 to 1979 5,146 27.77% Housing Units Built 1960 to 1969 3,392 18.31% Housing Units Built 1950 to 1959 3,737 20.16% Housing Units Built 1940 to 1949 1,082 5.84% Housing Units Built 1939 or Earlier 839 4.53%
Dominant Year Structure Built 1970 to 1979
Source: US Census, American Community Survey, PCensus
New Home Development In the study area, the newest development is found in Southview Villas along Hefferman Street. This development includes “for lease” townhomes built in 2015. The 4/2.5/2 homes (1847sf) are listed for $1425 per month which includes lawn maintenance. There does not appear to be any “for sale” new construction in the study area. There is new construction just south of the district borders in the CMA – Las Almadas which is in the Pasadena ISD. Out of twenty lots, one home has sold and two are under contract. Prices range from $169,900 to $204,999.
Figure 13: Examples of Single Family Housing in the Study Area
Source: Multiple Listing Service
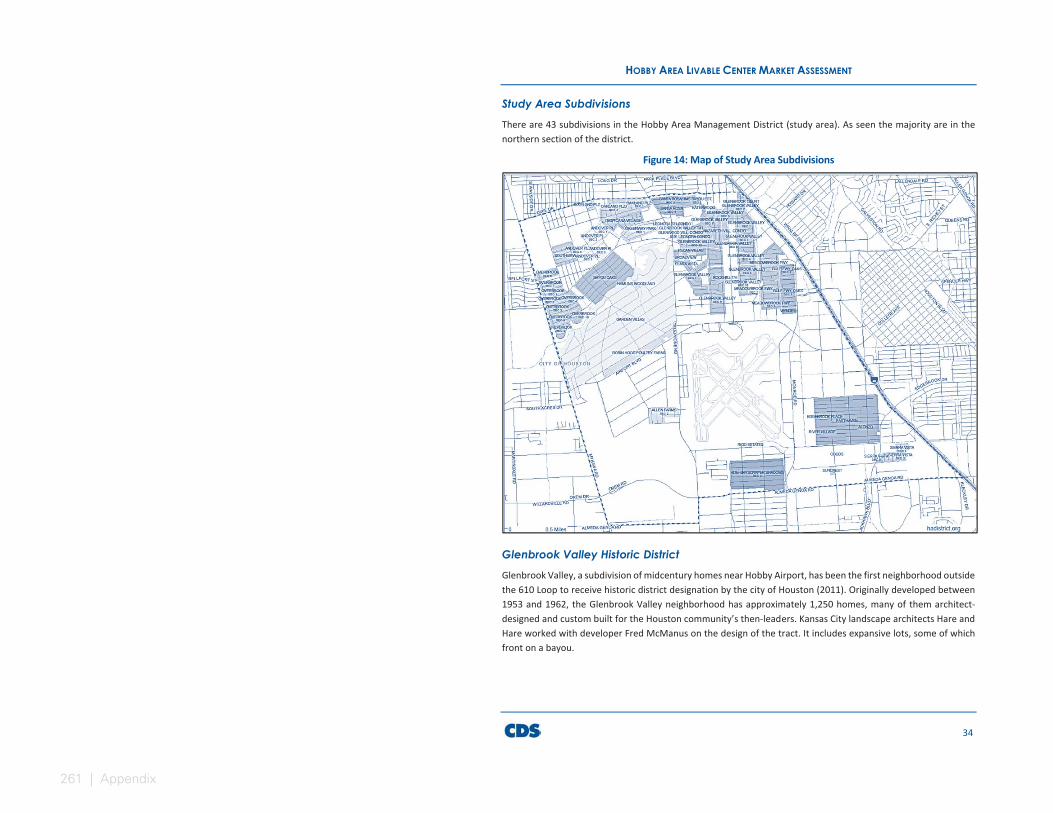
261 | Appendix
HOBBY AREA LIVABLE CENTER MARKET ASSESSMENT
34
Study Area Subdivisions There are 43 subdivisions in the Hobby Area Management District (study area). As seen the majority are in the northern section of the district.
Figure 14: Map of Study Area Subdivisions
Glenbrook Valley Historic District Glenbrook Valley, a subdivision of midcentury homes near Hobby Airport, has been the first neighborhood outside the 610 Loop to receive historic district designation by the city of Houston (2011). Originally developed between 1953 and 1962, the Glenbrook Valley neighborhood has approximately 1,250 homes, many of them architect-designed and custom built for the Houston community’s then-leaders. Kansas City landscape architects Hare and Hare worked with developer Fred McManus on the design of the tract. It includes expansive lots, some of which front on a bayou.
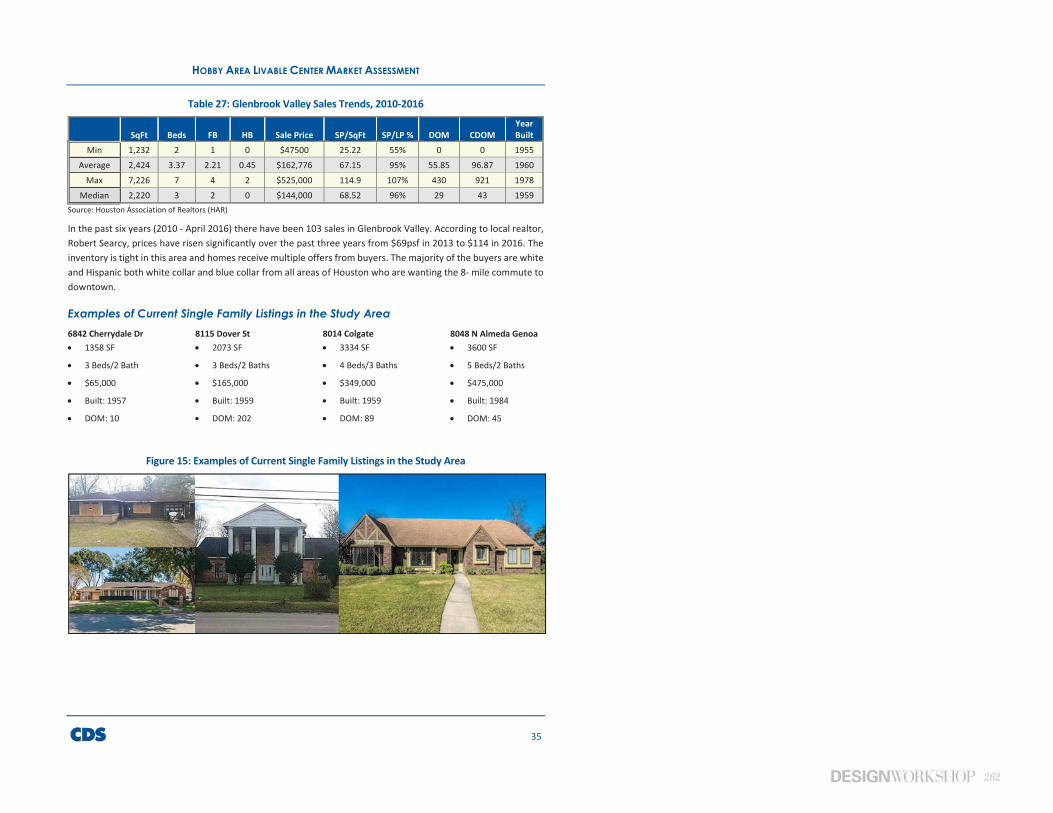
262
HOBBY AREA LIVABLE CENTER MARKET ASSESSMENT
35
Table 27: Glenbrook Valley Sales Trends, 2010-2016
SqFt Beds FB HB Sale Price SP/SqFt SP/LP % DOM CDOM Year Built
Min 1,232 2 1 0 $47500 25.22 55% 0 0 1955 Average 2,424 3.37 2.21 0.45 $162,776 67.15 95% 55.85 96.87 1960
Max 7,226 7 4 2 $525,000 114.9 107% 430 921 1978 Median 2,220 3 2 0 $144,000 68.52 96% 29 43 1959
Source: Houston Association of Realtors (HAR)
In the past six years (2010 - April 2016) there have been 103 sales in Glenbrook Valley. According to local realtor, Robert Searcy, prices have risen significantly over the past three years from $69psf in 2013 to $114 in 2016. The inventory is tight in this area and homes receive multiple offers from buyers. The majority of the buyers are white and Hispanic both white collar and blue collar from all areas of Houston who are wanting the 8- mile commute to downtown.
Examples of Current Single Family Listings in the Study Area 6842 Cherrydale Dr 1358 SF
3 Beds/2 Bath
$65,000
Built: 1957
DOM: 10
8115 Dover St 2073 SF
3 Beds/2 Baths
$165,000
Built: 1959
DOM: 202
8014 Colgate 3334 SF
4 Beds/3 Baths
$349,000
Built: 1959
DOM: 89
8048 N Almeda Genoa 3600 SF
5 Beds/2 Baths
$475,000
Built: 1984
DOM: 45
Figure 15: Examples of Current Single Family Listings in the Study Area

263 | Appendix
HOBBY AREA LIVABLE CENTER MARKET ASSESSMENT
2
Study Area Sales Trends There were 41 sales in the first 4.5 months of 2016 in the study area. The average price was $114,253 which is higher than the CMA at $109,601. The average price has increased by 23.1% in the study area compared to 30.3% in the CMA over the past six years. There were 44 sales in the CMA over $200,000 in the past 6.5 years. On average 6.7 homes sold per year over $200,000. The median sales price in this group was $234,900. Currently there are 30 homes “For Sale” in the study area with an average listing price of $83.53 psf ($211,890) which is significantly above the average sales price of $114,253.
Table 28: Study Area Housing Market Home Sales
Home Sales Data 2010 2011 2012 2013 2014 2015 1/1-4/14 2016
Average DOM 74 79 70 50 51 46 34 Median DOM 51 50 36 23 27 19 18 Average Sales Price $92,769 $81,509 $85,300 $103,472 $115,356 $124,769 $114,253 Median Sales Price $90,000 $239,000 $80,000 $92,000 $115,000 $120,000 $95,400 Average Sales Price/SF $52.69 $46.14 $47.27 $55.98 $62.34 $66.11 $68.61 SP/LP % 96% 95% 95% 93% 92% 96% 93% Total Sales 155 170 163 131 165 163 41
Source: Houston Association of Realtors (HAR)
Table 29: Study Area Home Sales over $200,000, 2010 - 2016
44 Total Sales Sale Price SP/LP % DOM SF $/SF
Min $200,000 82% 0 1,866 $49.40
Average $262,980 96% 61 3,375 $76.98
Max $525,000 115% 381 7,226 $127.40
Median $234,900 95% 22 3,141 $80.14 Source: Houston Association of Realtors (HAR)
Table 30: Study Area Active Home Listings
30 Total Listings List Price DOM SF $/SF
Min $49,999 3 820 $39.59
Average $193,506 42 2209 $83.53
Max $349,000 82 3334 $104.68
Median $164,750 56 1997 $82.21 Source: Houston Association of Realtors (HAR) The MAX value includes a package of 5 homes for $745,000 which has been removed from the table above so as not to skew the values.
Average and median number of days on the market (DOM) are on a downward trend. Median DOM went from 51 to 46 over the past five years. The average DOM is slightly higher but went from 74 days in 2010 to 46 in 2015. Home prices in the study area have continued to increase since 2010. Average home prices have risen by 23% in the past six years while median prices have increased by 6%. Price per square foot followed a similar trajectory, going from the 2010 low of $52/sf to the 2015 high of $68/sf.
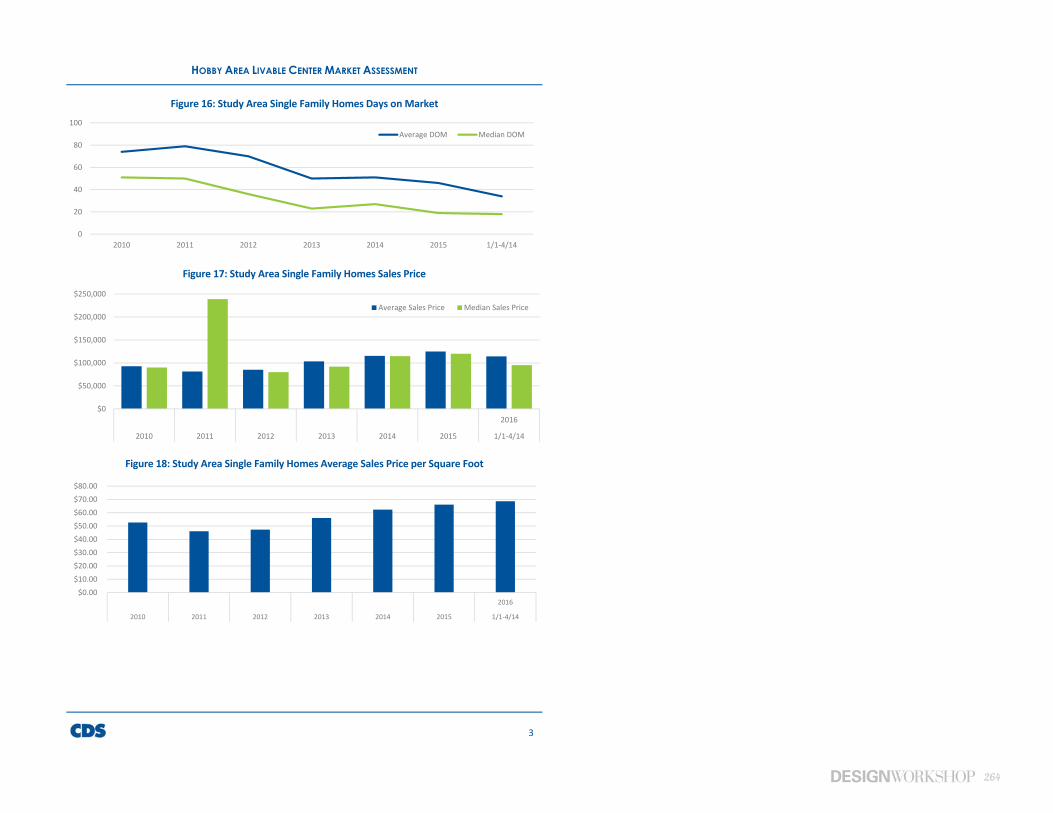
264
HOBBY AREA LIVABLE CENTER MARKET ASSESSMENT
3
Figure 16: Study Area Single Family Homes Days on Market
Figure 17: Study Area Single Family Homes Sales Price
Figure 18: Study Area Single Family Homes Average Sales Price per Square Foot
0
20
40
60
80
100
2010 2011 2012 2013 2014 2015 1/1-4/14
Average DOM Median DOM
$0
$50,000
$100,000
$150,000
$200,000
$250,000
2016
2010 2011 2012 2013 2014 2015 1/1-4/14
Average Sales Price Median Sales Price
$0.00$10.00$20.00$30.00$40.00$50.00$60.00$70.00$80.00
2016
2010 2011 2012 2013 2014 2015 1/1-4/14
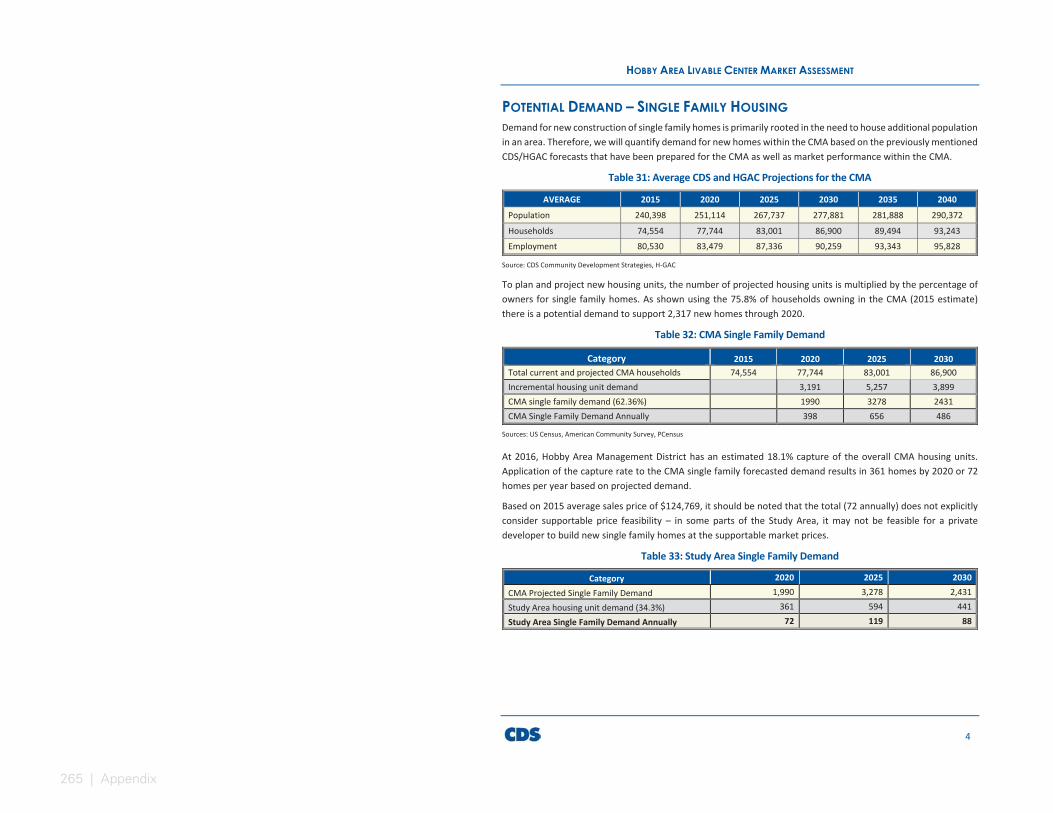
265 | Appendix
HOBBY AREA LIVABLE CENTER MARKET ASSESSMENT
4
POTENTIAL DEMAND – SINGLE FAMILY HOUSINGDemand for new construction of single family homes is primarily rooted in the need to house additional population in an area. Therefore, we will quantify demand for new homes within the CMA based on the previously mentioned CDS/HGAC forecasts that have been prepared for the CMA as well as market performance within the CMA.
Table 31: Average CDS and HGAC Projections for the CMA
AVERAGE 2015 2020 2025 2030 2035 2040 Population 240,398 251,114 267,737 277,881 281,888 290,372 Households 74,554 77,744 83,001 86,900 89,494 93,243 Employment 80,530 83,479 87,336 90,259 93,343 95,828
Source: CDS Community Development Strategies, H-GAC
To plan and project new housing units, the number of projected housing units is multiplied by the percentage of owners for single family homes. As shown using the 75.8% of households owning in the CMA (2015 estimate) there is a potential demand to support 2,317 new homes through 2020.
Table 32: CMA Single Family Demand
Category 2015 2020 2025 2030 Total current and projected CMA households 74,554 77,744 83,001 86,900 Incremental housing unit demand 3,191 5,257 3,899 CMA single family demand (62.36%) 1990 3278 2431 CMA Single Family Demand Annually 398 656 486
Sources: US Census, American Community Survey, PCensus
At 2016, Hobby Area Management District has an estimated 18.1% capture of the overall CMA housing units. Application of the capture rate to the CMA single family forecasted demand results in 361 homes by 2020 or 72 homes per year based on projected demand.
Based on 2015 average sales price of $124,769, it should be noted that the total (72 annually) does not explicitly consider supportable price feasibility – in some parts of the Study Area, it may not be feasible for a private developer to build new single family homes at the supportable market prices.
Table 33: Study Area Single Family Demand
Category 2020 2025 2030 CMA Projected Single Family Demand 1,990 3,278 2,431 Study Area housing unit demand (34.3%) 361 594 441 Study Area Single Family Demand Annually 72 119 88
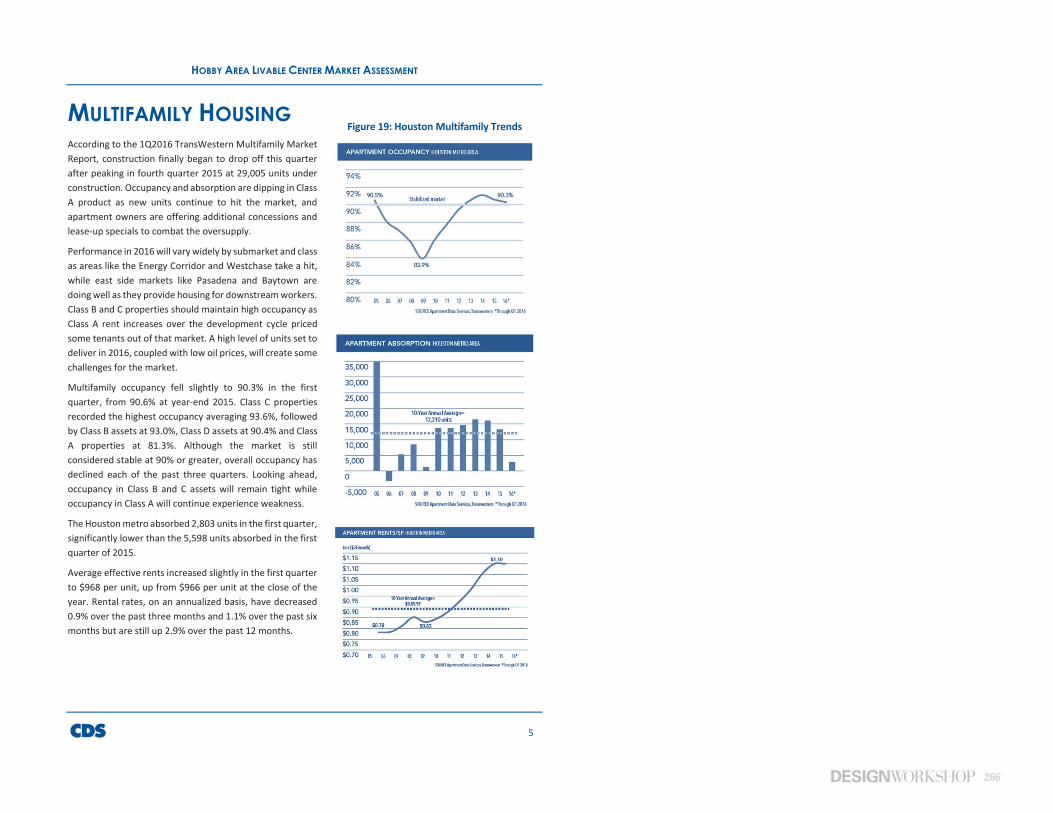
266
HOBBY AREA LIVABLE CENTER MARKET ASSESSMENT
5
MULTIFAMILY HOUSINGAccording to the 1Q2016 TransWestern Multifamily Market Report, construction finally began to drop off this quarter after peaking in fourth quarter 2015 at 29,005 units under construction. Occupancy and absorption are dipping in Class A product as new units continue to hit the market, and apartment owners are offering additional concessions and lease-up specials to combat the oversupply.
Performance in 2016 will vary widely by submarket and class as areas like the Energy Corridor and Westchase take a hit, while east side markets like Pasadena and Baytown are doing well as they provide housing for downstream workers. Class B and C properties should maintain high occupancy as Class A rent increases over the development cycle priced some tenants out of that market. A high level of units set to deliver in 2016, coupled with low oil prices, will create some challenges for the market.
Multifamily occupancy fell slightly to 90.3% in the first quarter, from 90.6% at year-end 2015. Class C properties recorded the highest occupancy averaging 93.6%, followed by Class B assets at 93.0%, Class D assets at 90.4% and Class A properties at 81.3%. Although the market is still considered stable at 90% or greater, overall occupancy has declined each of the past three quarters. Looking ahead, occupancy in Class B and C assets will remain tight while occupancy in Class A will continue experience weakness.
The Houston metro absorbed 2,803 units in the first quarter, significantly lower than the 5,598 units absorbed in the first quarter of 2015.
Average effective rents increased slightly in the first quarter to $968 per unit, up from $966 per unit at the close of the year. Rental rates, on an annualized basis, have decreased 0.9% over the past three months and 1.1% over the past six months but are still up 2.9% over the past 12 months.
Figure 19: Houston Multifamily Trends
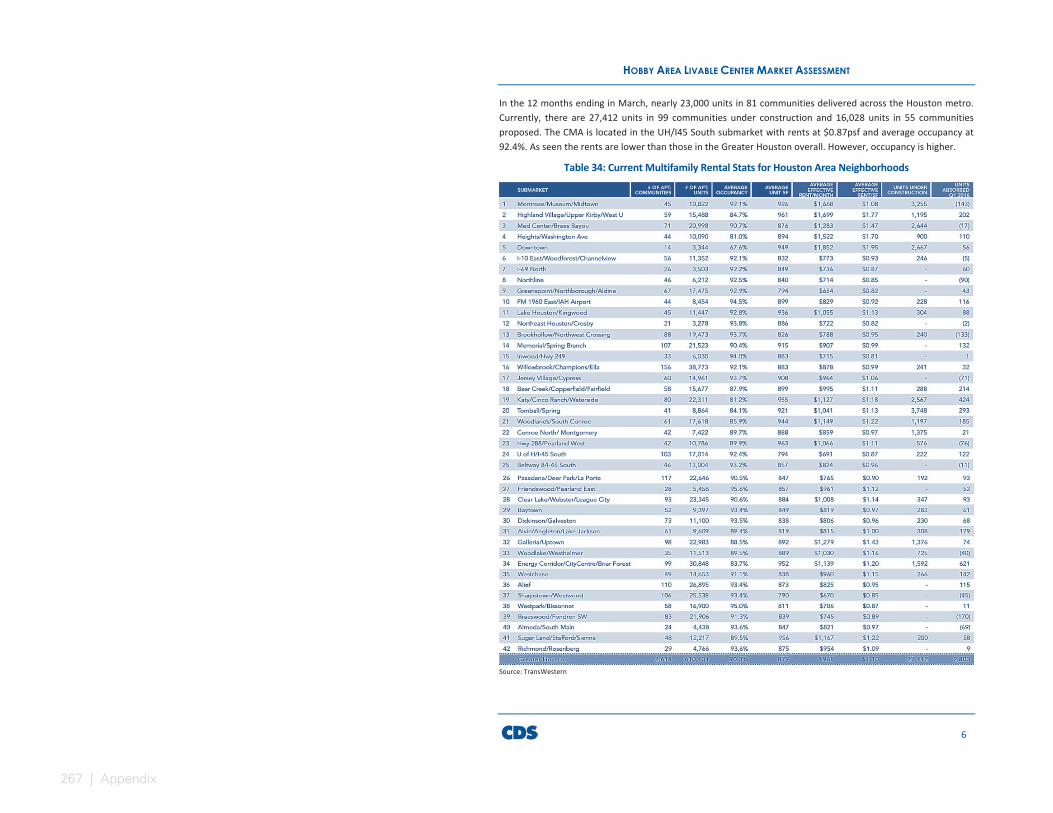
267 | Appendix
HOBBY AREA LIVABLE CENTER MARKET ASSESSMENT
6
In the 12 months ending in March, nearly 23,000 units in 81 communities delivered across the Houston metro. Currently, there are 27,412 units in 99 communities under construction and 16,028 units in 55 communities proposed. The CMA is located in the UH/I45 South submarket with rents at $0.87psf and average occupancy at 92.4%. As seen the rents are lower than those in the Greater Houston overall. However, occupancy is higher.
Table 34: Current Multifamily Rental Stats for Houston Area Neighborhoods
Source: TransWestern
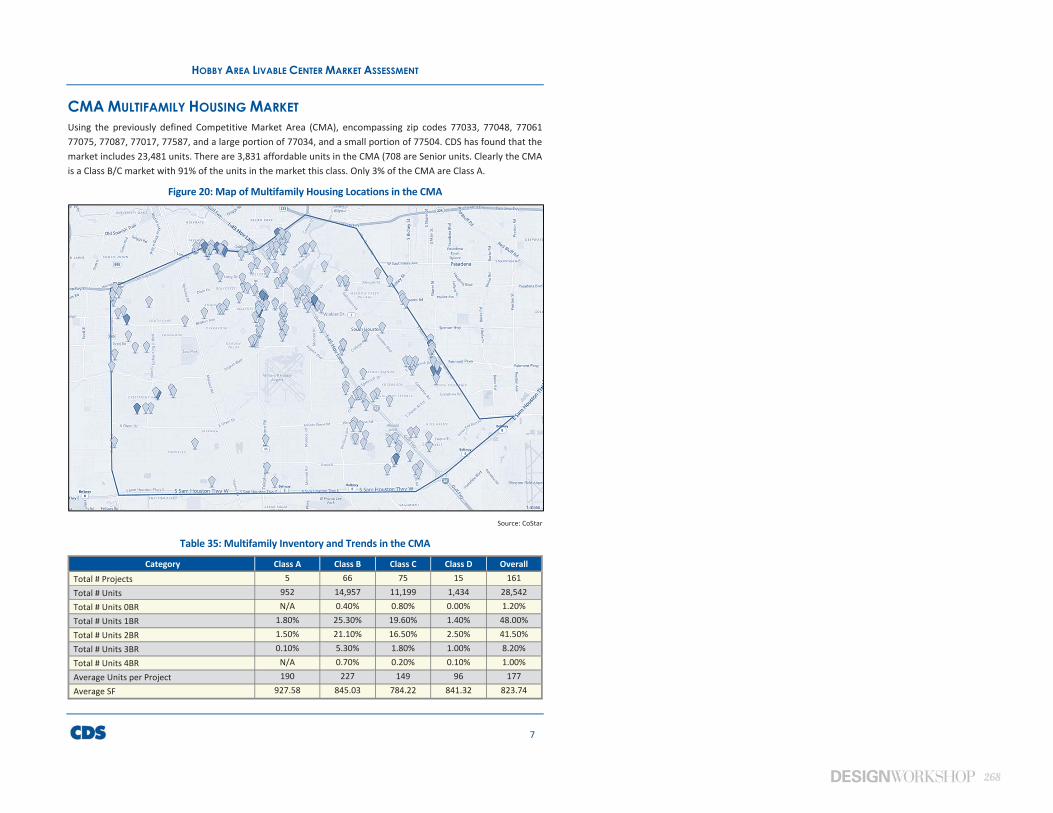
268
HOBBY AREA LIVABLE CENTER MARKET ASSESSMENT
7
CMA MULTIFAMILY HOUSING MARKETUsing the previously defined Competitive Market Area (CMA), encompassing zip codes 77033, 77048, 77061 77075, 77087, 77017, 77587, and a large portion of 77034, and a small portion of 77504. CDS has found that the market includes 23,481 units. There are 3,831 affordable units in the CMA (708 are Senior units. Clearly the CMA is a Class B/C market with 91% of the units in the market this class. Only 3% of the CMA are Class A.
Figure 20: Map of Multifamily Housing Locations in the CMA
Source: CoStar
Table 35: Multifamily Inventory and Trends in the CMA
Category Class A Class B Class C Class D Overall Total # Projects 5 66 75 15 161 Total # Units 952 14,957 11,199 1,434 28,542 Total # Units 0BR N/A 0.40% 0.80% 0.00% 1.20% Total # Units 1BR 1.80% 25.30% 19.60% 1.40% 48.00% Total # Units 2BR 1.50% 21.10% 16.50% 2.50% 41.50% Total # Units 3BR 0.10% 5.30% 1.80% 1.00% 8.20% Total # Units 4BR N/A 0.70% 0.20% 0.10% 1.00% Average Units per Project 190 227 149 96 177 Average SF 927.58 845.03 784.22 841.32 823.74
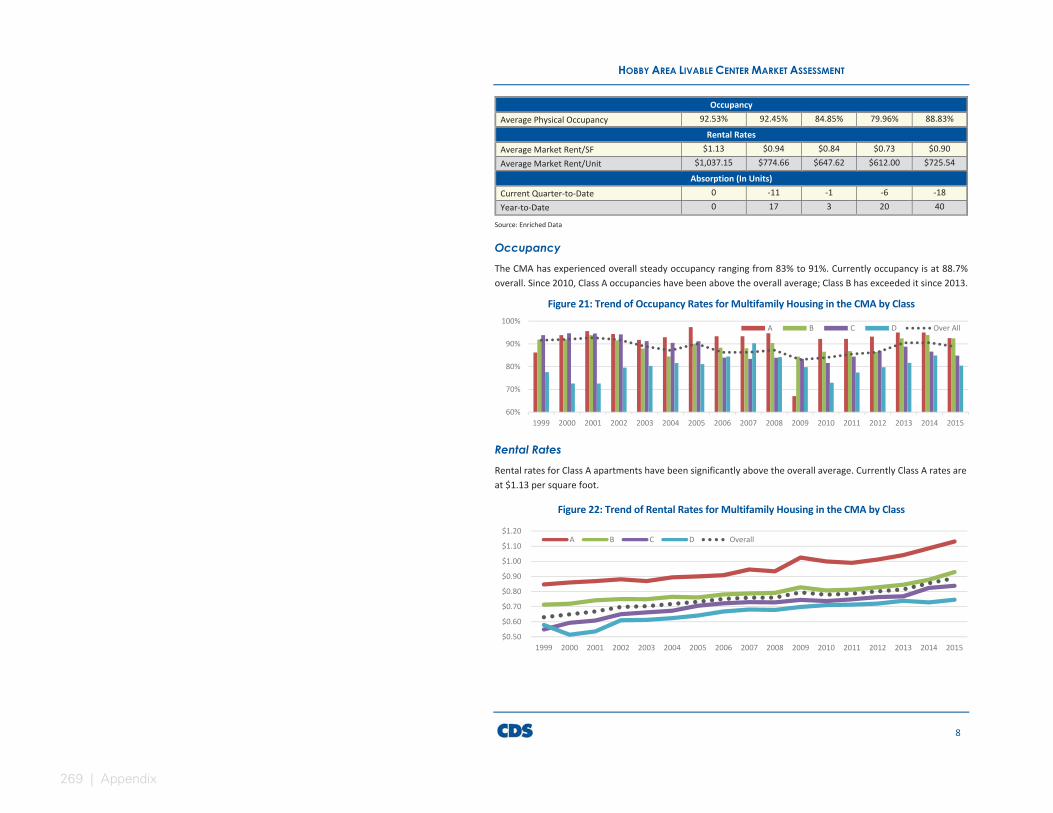
269 | Appendix
HOBBY AREA LIVABLE CENTER MARKET ASSESSMENT
8
Occupancy Average Physical Occupancy 92.53% 92.45% 84.85% 79.96% 88.83%
Rental Rates Average Market Rent/SF $1.13 $0.94 $0.84 $0.73 $0.90 Average Market Rent/Unit $1,037.15 $774.66 $647.62 $612.00 $725.54
Absorption (In Units) Current Quarter-to-Date 0 -11 -1 -6 -18 Year-to-Date 0 17 3 20 40
Source: Enriched Data
OccupancyThe CMA has experienced overall steady occupancy ranging from 83% to 91%. Currently occupancy is at 88.7% overall. Since 2010, Class A occupancies have been above the overall average; Class B has exceeded it since 2013.
Figure 21: Trend of Occupancy Rates for Multifamily Housing in the CMA by Class
Rental Rates Rental rates for Class A apartments have been significantly above the overall average. Currently Class A rates are at $1.13 per square foot.
Figure 22: Trend of Rental Rates for Multifamily Housing in the CMA by Class
60%
70%
80%
90%
100%
1999 2000 2001 2002 2003 2004 2005 2006 2007 2008 2009 2010 2011 2012 2013 2014 2015
A B C D Over All
$0.50
$0.60
$0.70
$0.80
$0.90
$1.00
$1.10
$1.20
1999 2000 2001 2002 2003 2004 2005 2006 2007 2008 2009 2010 2011 2012 2013 2014 2015
A B C D Overall

270
HOBBY AREA LIVABLE CENTER MARKET ASSESSMENT
9
AbsorptionOverall absorption in the CMA has been a positive 1,360. On average 170 units have been absorbed annually since 2009.
Table 36: Trend of Absorption Rates for Multifamily Housing in the CMA by Class
STUDY AREA MULTIFAMILY HOUSING MARKETThe study area is defined largely by zip 77061 with a small portion of 77087 and 77075. According to CoStar there are 8,064 units in 46 properties in the study area. The majority of the units are located in the northern portion of the study area and along I-45. There are 616 affordable units in the study area (340 are Senior units).
Figure 23: Map of Multifamily Housing Locations in the Study Area
Source: CoStar
-500-250
0250500750
1000
2009 2010 2011 2012 2013 2014 2015 2016 *
A B C D
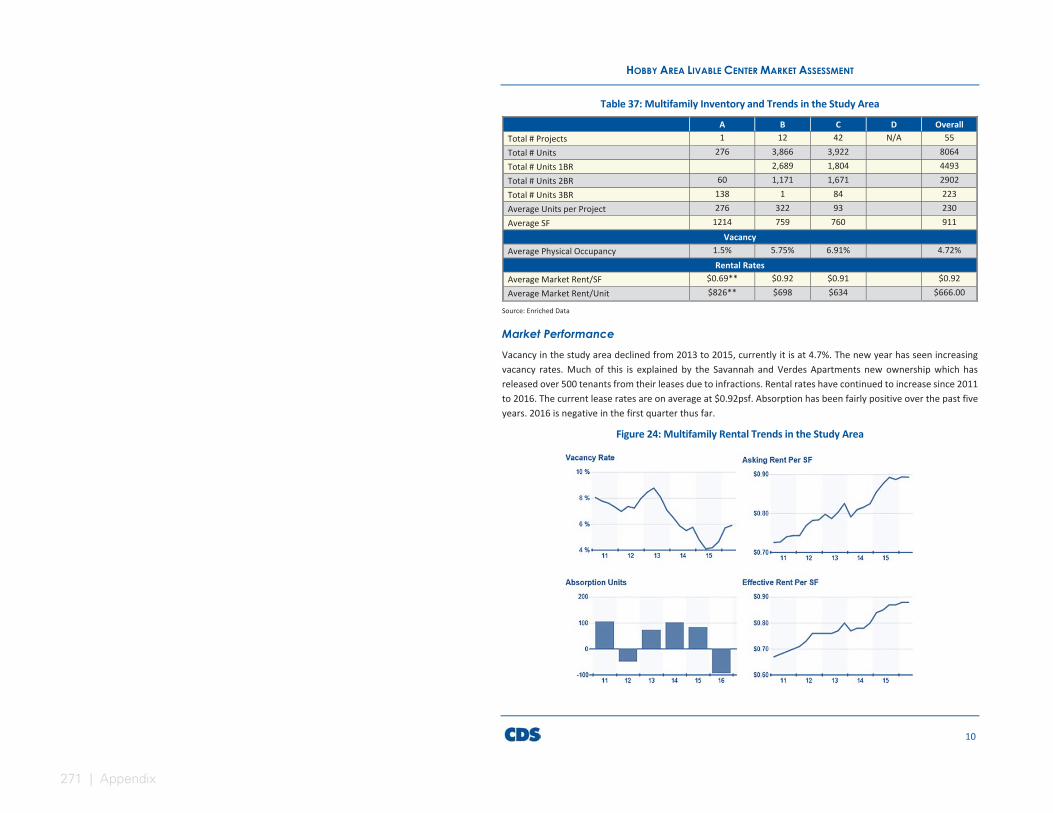
271 | Appendix
HOBBY AREA LIVABLE CENTER MARKET ASSESSMENT
10
Table 37: Multifamily Inventory and Trends in the Study Area
A B C D Overall Total # Projects 1 12 42 N/A 55 Total # Units 276 3,866 3,922 8064 Total # Units 1BR 2,689 1,804 4493 Total # Units 2BR 60 1,171 1,671 2902 Total # Units 3BR 138 1 84 223 Average Units per Project 276 322 93 230 Average SF 1214 759 760 911
Vacancy Average Physical Occupancy 1.5% 5.75% 6.91% 4.72%
Rental Rates Average Market Rent/SF $0.69** $0.92 $0.91 $0.92 Average Market Rent/Unit $826** $698 $634 $666.00
Source: Enriched Data
Market Performance Vacancy in the study area declined from 2013 to 2015, currently it is at 4.7%. The new year has seen increasing vacancy rates. Much of this is explained by the Savannah and Verdes Apartments new ownership which has released over 500 tenants from their leases due to infractions. Rental rates have continued to increase since 2011 to 2016. The current lease rates are on average at $0.92psf. Absorption has been fairly positive over the past five years. 2016 is negative in the first quarter thus far.
Figure 24: Multifamily Rental Trends in the Study Area
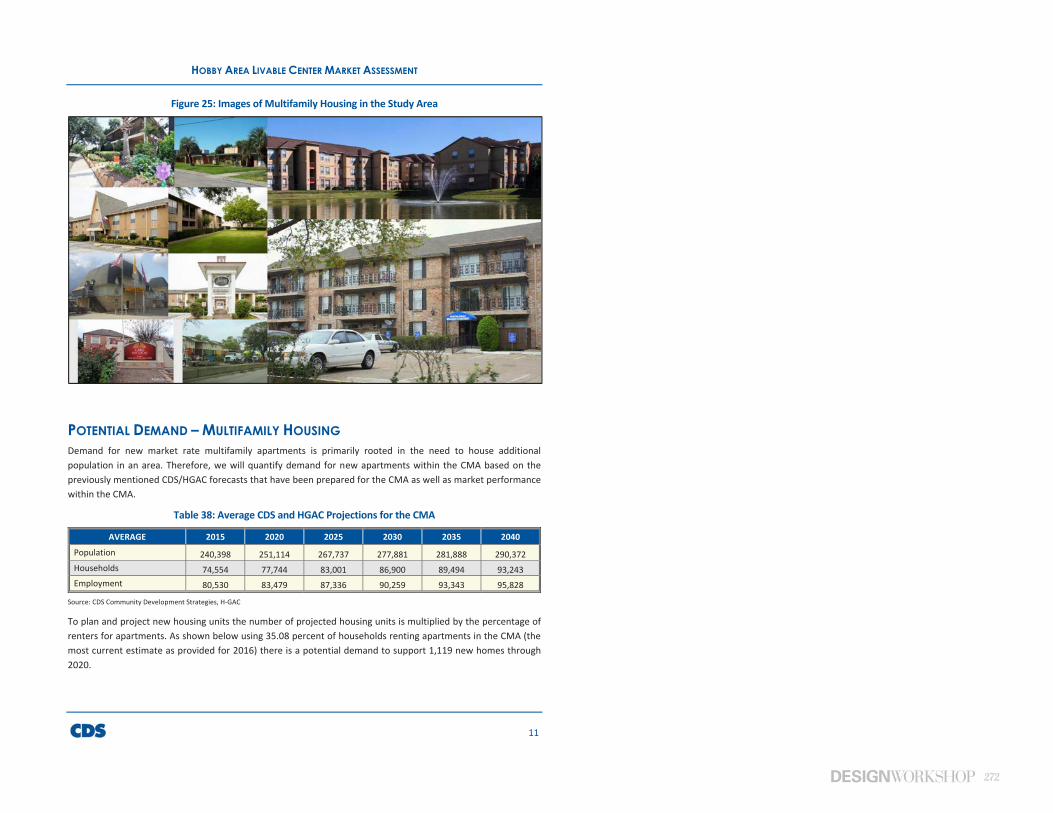
272
HOBBY AREA LIVABLE CENTER MARKET ASSESSMENT
11
Figure 25: Images of Multifamily Housing in the Study Area
POTENTIAL DEMAND – MULTIFAMILY HOUSINGDemand for new market rate multifamily apartments is primarily rooted in the need to house additional population in an area. Therefore, we will quantify demand for new apartments within the CMA based on the previously mentioned CDS/HGAC forecasts that have been prepared for the CMA as well as market performance within the CMA.
Table 38: Average CDS and HGAC Projections for the CMA
AVERAGE 2015 2020 2025 2030 2035 2040 Population 240,398 251,114 267,737 277,881 281,888 290,372 Households 74,554 77,744 83,001 86,900 89,494 93,243 Employment 80,530 83,479 87,336 90,259 93,343 95,828
Source: CDS Community Development Strategies, H-GAC
To plan and project new housing units the number of projected housing units is multiplied by the percentage of renters for apartments. As shown below using 35.08 percent of households renting apartments in the CMA (the most current estimate as provided for 2016) there is a potential demand to support 1,119 new homes through 2020.
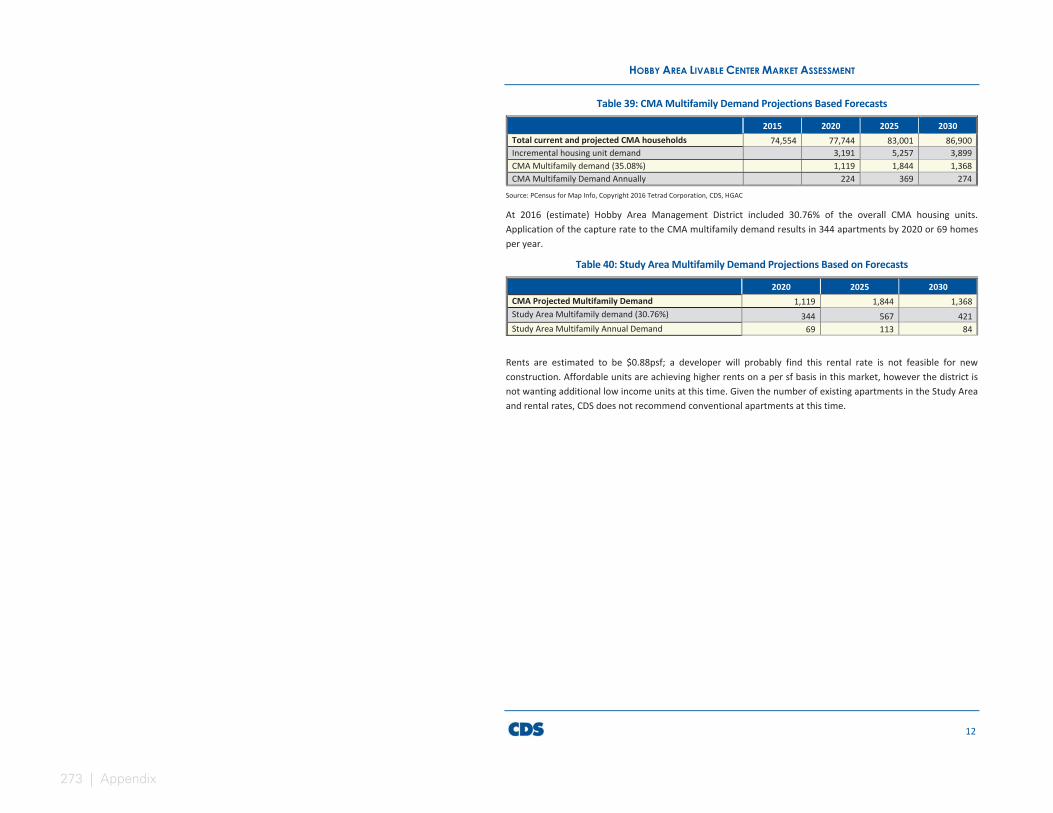
273 | Appendix
HOBBY AREA LIVABLE CENTER MARKET ASSESSMENT
12
Table 39: CMA Multifamily Demand Projections Based Forecasts
2015 2020 2025 2030 Total current and projected CMA households 74,554 77,744 83,001 86,900 Incremental housing unit demand 3,191 5,257 3,899 CMA Multifamily demand (35.08%) 1,119 1,844 1,368 CMA Multifamily Demand Annually 224 369 274
Source: PCensus for Map Info, Copyright 2016 Tetrad Corporation, CDS, HGAC
At 2016 (estimate) Hobby Area Management District included 30.76% of the overall CMA housing units. Application of the capture rate to the CMA multifamily demand results in 344 apartments by 2020 or 69 homes per year.
Table 40: Study Area Multifamily Demand Projections Based on Forecasts
2020 2025 2030 CMA Projected Multifamily Demand 1,119 1,844 1,368 Study Area Multifamily demand (30.76%) 344 567 421 Study Area Multifamily Annual Demand 69 113 84
Rents are estimated to be $0.88psf; a developer will probably find this rental rate is not feasible for new construction. Affordable units are achieving higher rents on a per sf basis in this market, however the district is not wanting additional low income units at this time. Given the number of existing apartments in the Study Area and rental rates, CDS does not recommend conventional apartments at this time.
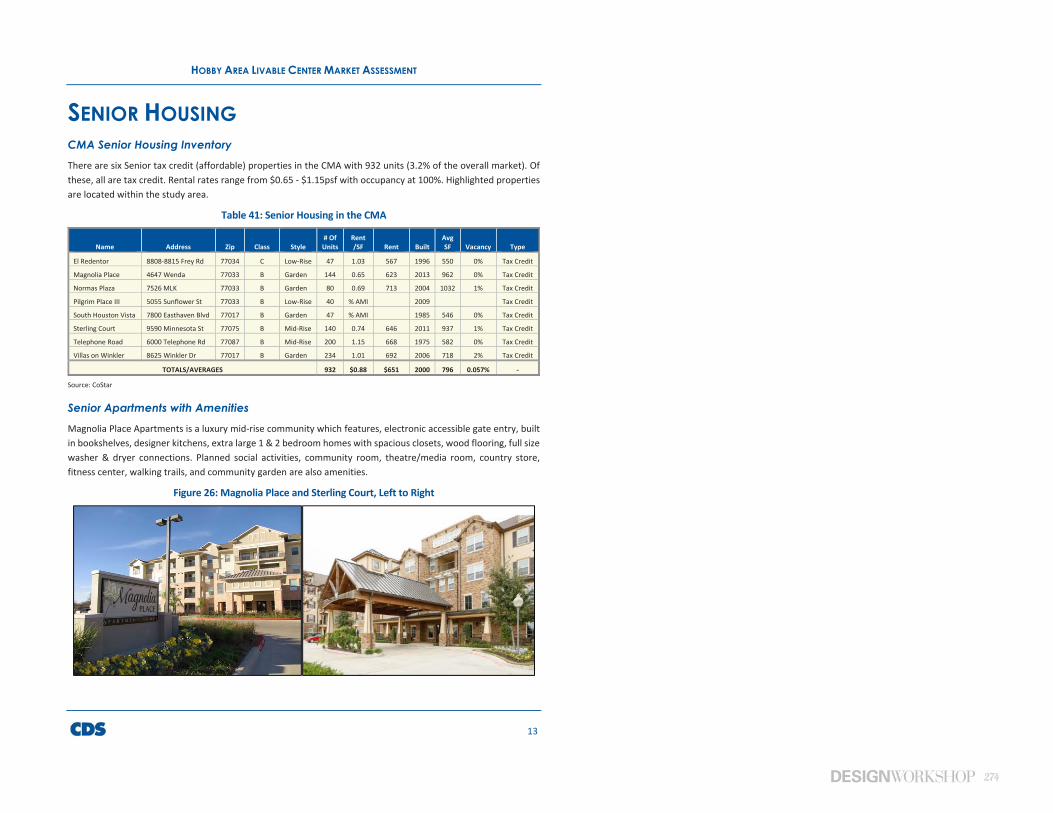
274
HOBBY AREA LIVABLE CENTER MARKET ASSESSMENT
13
SENIOR HOUSINGCMA Senior Housing Inventory There are six Senior tax credit (affordable) properties in the CMA with 932 units (3.2% of the overall market). Of these, all are tax credit. Rental rates range from $0.65 - $1.15psf with occupancy at 100%. Highlighted properties are located within the study area.
Table 41: Senior Housing in the CMA
Name Address Zip Class Style # Of
Units Rent /SF Rent Built
Avg SF Vacancy Type
El Redentor 8808-8815 Frey Rd 77034 C Low-Rise 47 1.03 567 1996 550 0% Tax Credit
Magnolia Place 4647 Wenda 77033 B Garden 144 0.65 623 2013 962 0% Tax Credit
Normas Plaza 7526 MLK 77033 B Garden 80 0.69 713 2004 1032 1% Tax Credit
Pilgrim Place III 5055 Sunflower St 77033 B Low-Rise 40 % AMI 2009 Tax Credit
South Houston Vista 7800 Easthaven Blvd 77017 B Garden 47 % AMI 1985 546 0% Tax Credit
Sterling Court 9590 Minnesota St 77075 B Mid-Rise 140 0.74 646 2011 937 1% Tax Credit
Telephone Road 6000 Telephone Rd 77087 B Mid-Rise 200 1.15 668 1975 582 0% Tax Credit
Villas on Winkler 8625 Winkler Dr 77017 B Garden 234 1.01 692 2006 718 2% Tax Credit
TOTALS/AVERAGES 932 $0.88 $651 2000 796 0.057% -
Source: CoStar
Senior Apartments with Amenities Magnolia Place Apartments is a luxury mid-rise community which features, electronic accessible gate entry, built in bookshelves, designer kitchens, extra large 1 & 2 bedroom homes with spacious closets, wood flooring, full size washer & dryer connections. Planned social activities, community room, theatre/media room, country store, fitness center, walking trails, and community garden are also amenities.
Figure 26: Magnolia Place and Sterling Court, Left to Right
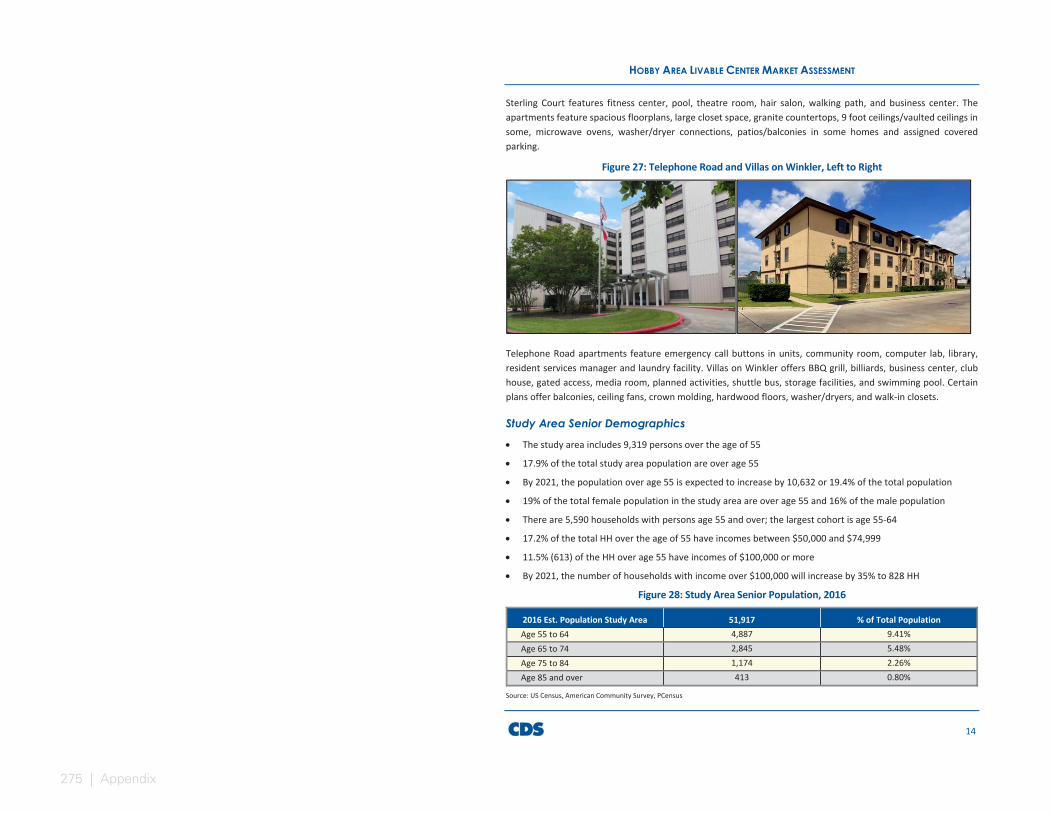
275 | Appendix
HOBBY AREA LIVABLE CENTER MARKET ASSESSMENT
14
Sterling Court features fitness center, pool, theatre room, hair salon, walking path, and business center. The apartments feature spacious floorplans, large closet space, granite countertops, 9 foot ceilings/vaulted ceilings in some, microwave ovens, washer/dryer connections, patios/balconies in some homes and assigned covered parking.
Figure 27: Telephone Road and Villas on Winkler, Left to Right
Telephone Road apartments feature emergency call buttons in units, community room, computer lab, library, resident services manager and laundry facility. Villas on Winkler offers BBQ grill, billiards, business center, club house, gated access, media room, planned activities, shuttle bus, storage facilities, and swimming pool. Certain plans offer balconies, ceiling fans, crown molding, hardwood floors, washer/dryers, and walk-in closets.
Study Area Senior Demographics
The study area includes 9,319 persons over the age of 55
17.9% of the total study area population are over age 55
By 2021, the population over age 55 is expected to increase by 10,632 or 19.4% of the total population
19% of the total female population in the study area are over age 55 and 16% of the male population
There are 5,590 households with persons age 55 and over; the largest cohort is age 55-64
17.2% of the total HH over the age of 55 have incomes between $50,000 and $74,999
11.5% (613) of the HH over age 55 have incomes of $100,000 or more
By 2021, the number of households with income over $100,000 will increase by 35% to 828 HH
Figure 28: Study Area Senior Population, 2016
2016 Est. Population Study Area 51,917 % of Total Population Age 55 to 64 4,887 9.41% Age 65 to 74 2,845 5.48% Age 75 to 84 1,174 2.26% Age 85 and over 413 0.80%
Source: US Census, American Community Survey, PCensus
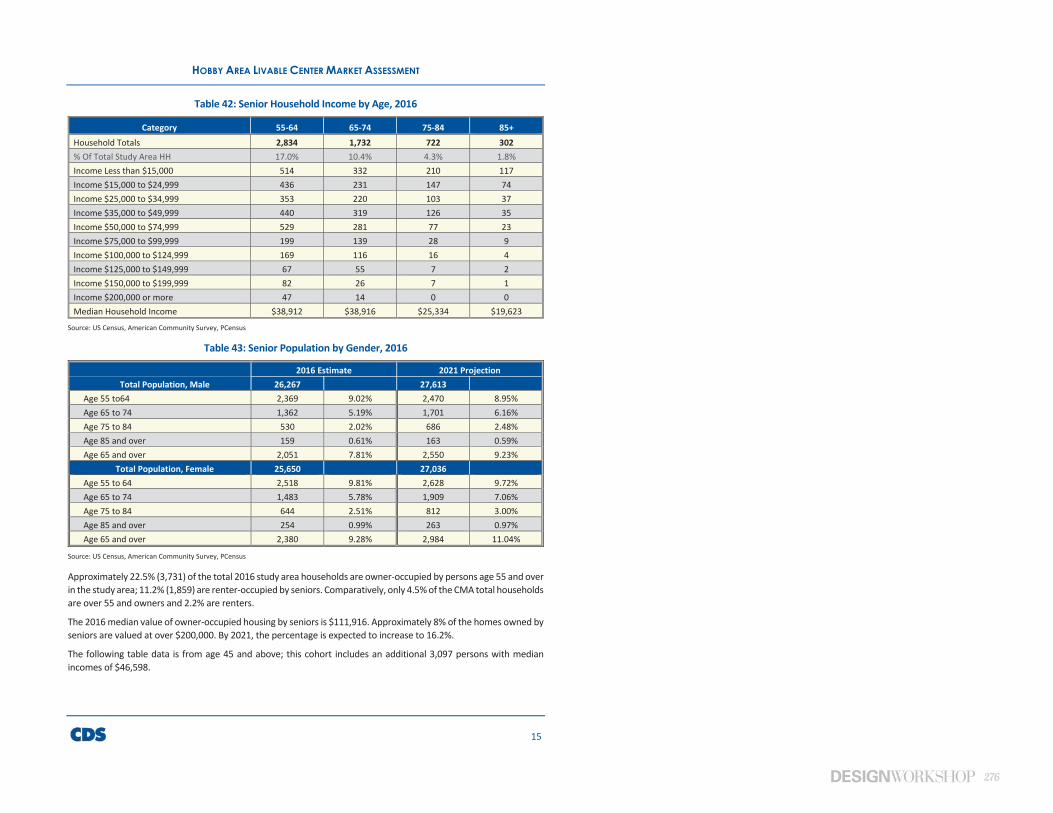
276
HOBBY AREA LIVABLE CENTER MARKET ASSESSMENT
15
Table 42: Senior Household Income by Age, 2016
Category 55-64 65-74 75-84 85+ Household Totals 2,834 1,732 722 302 % Of Total Study Area HH 17.0% 10.4% 4.3% 1.8% Income Less than $15,000 514 332 210 117 Income $15,000 to $24,999 436 231 147 74 Income $25,000 to $34,999 353 220 103 37 Income $35,000 to $49,999 440 319 126 35 Income $50,000 to $74,999 529 281 77 23 Income $75,000 to $99,999 199 139 28 9 Income $100,000 to $124,999 169 116 16 4 Income $125,000 to $149,999 67 55 7 2 Income $150,000 to $199,999 82 26 7 1 Income $200,000 or more 47 14 0 0 Median Household Income $38,912 $38,916 $25,334 $19,623
Source: US Census, American Community Survey, PCensus
Table 43: Senior Population by Gender, 2016
2016 Estimate 2021 Projection Total Population, Male 26,267 27,613
Age 55 to64 2,369 9.02% 2,470 8.95% Age 65 to 74 1,362 5.19% 1,701 6.16% Age 75 to 84 530 2.02% 686 2.48% Age 85 and over 159 0.61% 163 0.59% Age 65 and over 2,051 7.81% 2,550 9.23%
Total Population, Female 25,650 27,036 Age 55 to 64 2,518 9.81% 2,628 9.72% Age 65 to 74 1,483 5.78% 1,909 7.06% Age 75 to 84 644 2.51% 812 3.00% Age 85 and over 254 0.99% 263 0.97% Age 65 and over 2,380 9.28% 2,984 11.04%
Source: US Census, American Community Survey, PCensus
Approximately 22.5% (3,731) of the total 2016 study area households are owner-occupied by persons age 55 and over in the study area; 11.2% (1,859) are renter-occupied by seniors. Comparatively, only 4.5% of the CMA total households are over 55 and owners and 2.2% are renters.
The 2016 median value of owner-occupied housing by seniors is $111,916. Approximately 8% of the homes owned by seniors are valued at over $200,000. By 2021, the percentage is expected to increase to 16.2%.
The following table data is from age 45 and above; this cohort includes an additional 3,097 persons with median incomes of $46,598.
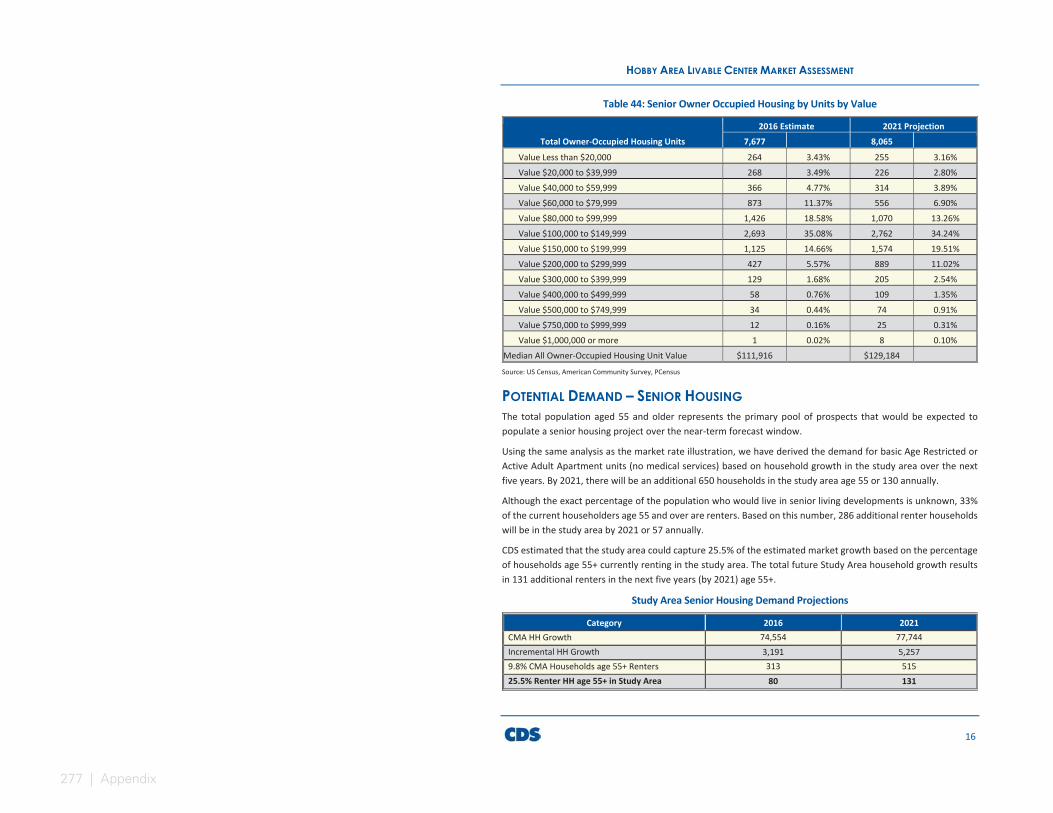
277 | Appendix
HOBBY AREA LIVABLE CENTER MARKET ASSESSMENT
16
Table 44: Senior Owner Occupied Housing by Units by Value
Total Owner-Occupied Housing Units
2016 Estimate 2021 Projection 7,677 8,065
Value Less than $20,000 264 3.43% 255 3.16% Value $20,000 to $39,999 268 3.49% 226 2.80% Value $40,000 to $59,999 366 4.77% 314 3.89% Value $60,000 to $79,999 873 11.37% 556 6.90% Value $80,000 to $99,999 1,426 18.58% 1,070 13.26% Value $100,000 to $149,999 2,693 35.08% 2,762 34.24% Value $150,000 to $199,999 1,125 14.66% 1,574 19.51% Value $200,000 to $299,999 427 5.57% 889 11.02% Value $300,000 to $399,999 129 1.68% 205 2.54% Value $400,000 to $499,999 58 0.76% 109 1.35% Value $500,000 to $749,999 34 0.44% 74 0.91% Value $750,000 to $999,999 12 0.16% 25 0.31% Value $1,000,000 or more 1 0.02% 8 0.10%
Median All Owner-Occupied Housing Unit Value $111,916 $129,184
Source: US Census, American Community Survey, PCensus
POTENTIAL DEMAND – SENIOR HOUSINGThe total population aged 55 and older represents the primary pool of prospects that would be expected to populate a senior housing project over the near-term forecast window.
Using the same analysis as the market rate illustration, we have derived the demand for basic Age Restricted or Active Adult Apartment units (no medical services) based on household growth in the study area over the next five years. By 2021, there will be an additional 650 households in the study area age 55 or 130 annually.
Although the exact percentage of the population who would live in senior living developments is unknown, 33% of the current householders age 55 and over are renters. Based on this number, 286 additional renter households will be in the study area by 2021 or 57 annually.
CDS estimated that the study area could capture 25.5% of the estimated market growth based on the percentage of households age 55+ currently renting in the study area. The total future Study Area household growth results in 131 additional renters in the next five years (by 2021) age 55+.
Study Area Senior Housing Demand Projections
Category 2016 2021 CMA HH Growth 74,554 77,744 Incremental HH Growth 3,191 5,257 9.8% CMA Households age 55+ Renters 313 515 25.5% Renter HH age 55+ in Study Area 80 131
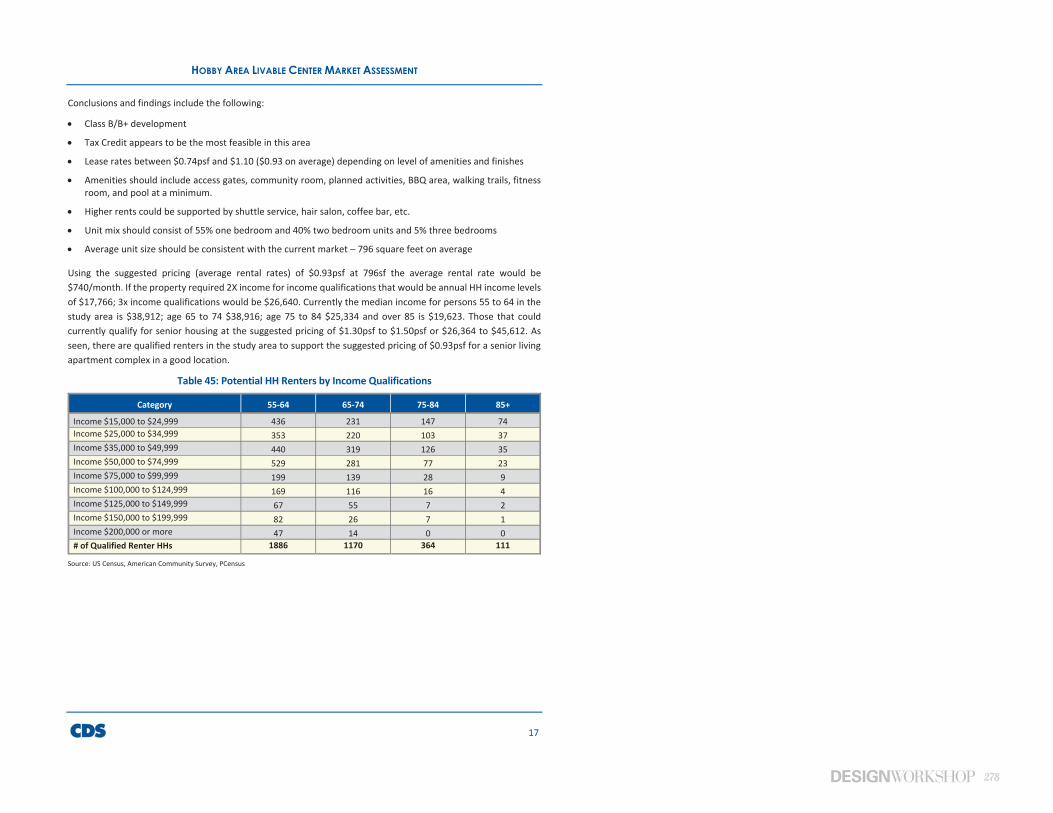
278
HOBBY AREA LIVABLE CENTER MARKET ASSESSMENT
17
Conclusions and findings include the following:
Class B/B+ development
Tax Credit appears to be the most feasible in this area
Lease rates between $0.74psf and $1.10 ($0.93 on average) depending on level of amenities and finishes
Amenities should include access gates, community room, planned activities, BBQ area, walking trails, fitness room, and pool at a minimum.
Higher rents could be supported by shuttle service, hair salon, coffee bar, etc.
Unit mix should consist of 55% one bedroom and 40% two bedroom units and 5% three bedrooms
Average unit size should be consistent with the current market – 796 square feet on average
Using the suggested pricing (average rental rates) of $0.93psf at 796sf the average rental rate would be $740/month. If the property required 2X income for income qualifications that would be annual HH income levels of $17,766; 3x income qualifications would be $26,640. Currently the median income for persons 55 to 64 in the study area is $38,912; age 65 to 74 $38,916; age 75 to 84 $25,334 and over 85 is $19,623. Those that could currently qualify for senior housing at the suggested pricing of $1.30psf to $1.50psf or $26,364 to $45,612. As seen, there are qualified renters in the study area to support the suggested pricing of $0.93psf for a senior living apartment complex in a good location.
Table 45: Potential HH Renters by Income Qualifications
Category 55-64 65-74 75-84 85+
Income $15,000 to $24,999 436 231 147 74 Income $25,000 to $34,999 353 220 103 37 Income $35,000 to $49,999 440 319 126 35 Income $50,000 to $74,999 529 281 77 23 Income $75,000 to $99,999 199 139 28 9 Income $100,000 to $124,999 169 116 16 4 Income $125,000 to $149,999 67 55 7 2 Income $150,000 to $199,999 82 26 7 1 Income $200,000 or more 47 14 0 0 # of Qualified Renter HHs 1886 1170 364 111
Source: US Census, American Community Survey, PCensus
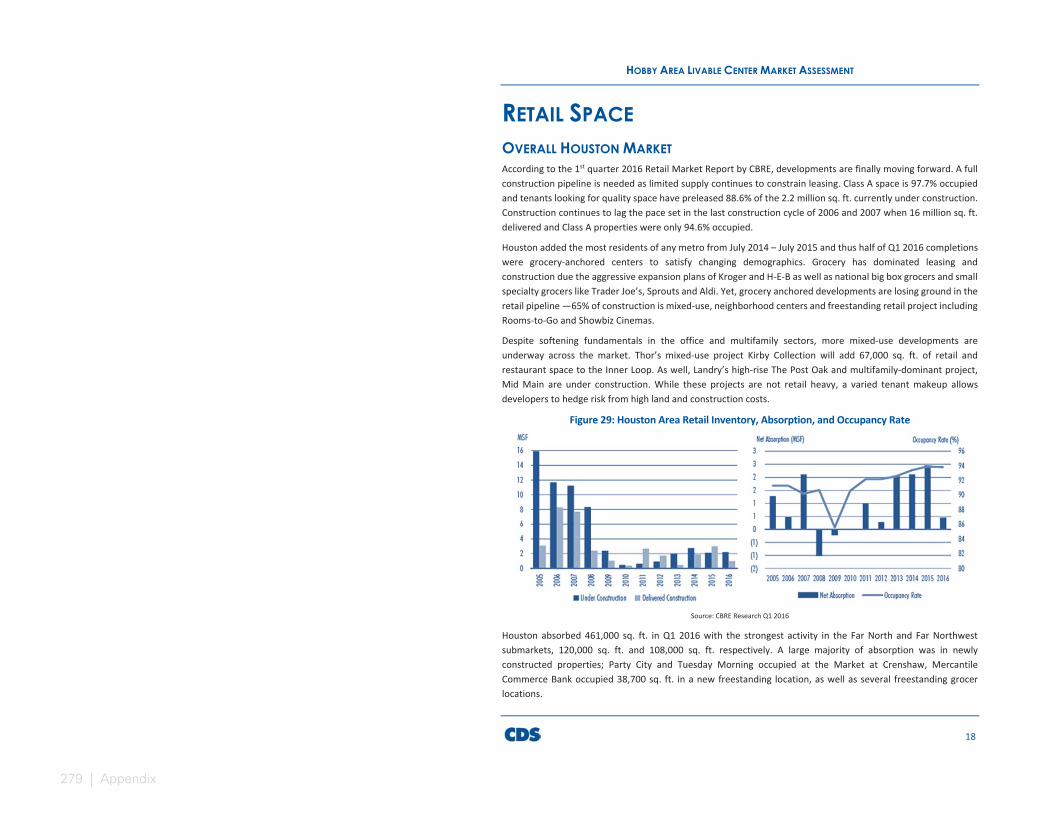
279 | Appendix
HOBBY AREA LIVABLE CENTER MARKET ASSESSMENT
18
RETAIL SPACEOVERALL HOUSTON MARKETAccording to the 1st quarter 2016 Retail Market Report by CBRE, developments are finally moving forward. A full construction pipeline is needed as limited supply continues to constrain leasing. Class A space is 97.7% occupied and tenants looking for quality space have preleased 88.6% of the 2.2 million sq. ft. currently under construction. Construction continues to lag the pace set in the last construction cycle of 2006 and 2007 when 16 million sq. ft. delivered and Class A properties were only 94.6% occupied.
Houston added the most residents of any metro from July 2014 – July 2015 and thus half of Q1 2016 completions were grocery-anchored centers to satisfy changing demographics. Grocery has dominated leasing and construction due the aggressive expansion plans of Kroger and H-E-B as well as national big box grocers and small specialty grocers like Trader Joe’s, Sprouts and Aldi. Yet, grocery anchored developments are losing ground in the retail pipeline —65% of construction is mixed-use, neighborhood centers and freestanding retail project including Rooms-to-Go and Showbiz Cinemas.
Despite softening fundamentals in the office and multifamily sectors, more mixed-use developments are underway across the market. Thor’s mixed-use project Kirby Collection will add 67,000 sq. ft. of retail and restaurant space to the Inner Loop. As well, Landry’s high-rise The Post Oak and multifamily-dominant project, Mid Main are under construction. While these projects are not retail heavy, a varied tenant makeup allows developers to hedge risk from high land and construction costs.
Figure 29: Houston Area Retail Inventory, Absorption, and Occupancy Rate
Source: CBRE Research Q1 2016
Houston absorbed 461,000 sq. ft. in Q1 2016 with the strongest activity in the Far North and Far Northwest submarkets, 120,000 sq. ft. and 108,000 sq. ft. respectively. A large majority of absorption was in newly constructed properties; Party City and Tuesday Morning occupied at the Market at Crenshaw, Mercantile Commerce Bank occupied 38,700 sq. ft. in a new freestanding location, as well as several freestanding grocer locations.

280
HOBBY AREA LIVABLE CENTER MARKET ASSESSMENT
19
Landlords continue to achieve high rents while offering fewer leasing concessions. Tenants can expect sustained rents except properties within the Inner Loop and Galleria trade areas which have some of the highest asking rents in the city. Yet, as a swath of new construction emerges in the suburban submarkets like the Far Northwest, rates will naturally increase. Big box spaces are asking between the upper $20s and low $30s. The largest rate hikes in Q1 2016 where in the Near West and Far Southwest increasing $0.50 and $0.25 respectively.
Depressed oil prices have taken a toll on the overall Houston economy, yet the outlook is tempers with signs of improvement in 12-24 months. The Texas Workforce Commission revised 2015 employment growth down to 15,200 jobs added reflecting steeper losses in the energy sector. However, forecasts for job growth in 2016 haven’t changed and indicate a slow, yet still positive, year for job gains in 2016.
Table 46: Houston Area Retail Market Trends
Near Southeast Sub-market The CMA is located in the Near Southeast and a South sub-markets (CBRE) which encompasses a much larger area as well. The sub-markets include 144 and 158 retail centers respectively (18,003,905 sf combined). The vacancy rate is 8.4% with rental rates at $22.50psf (NNN) in the Near Southeast. The South sub-market vacancy is much lower at 5.9% and rental rates at $18.25psf NNN. Comparatively, the overall Houston market is at 6.2% vacancy and $22.80psf (NNN) rents. The study area mostly falls within the Near Southeast sub-market.
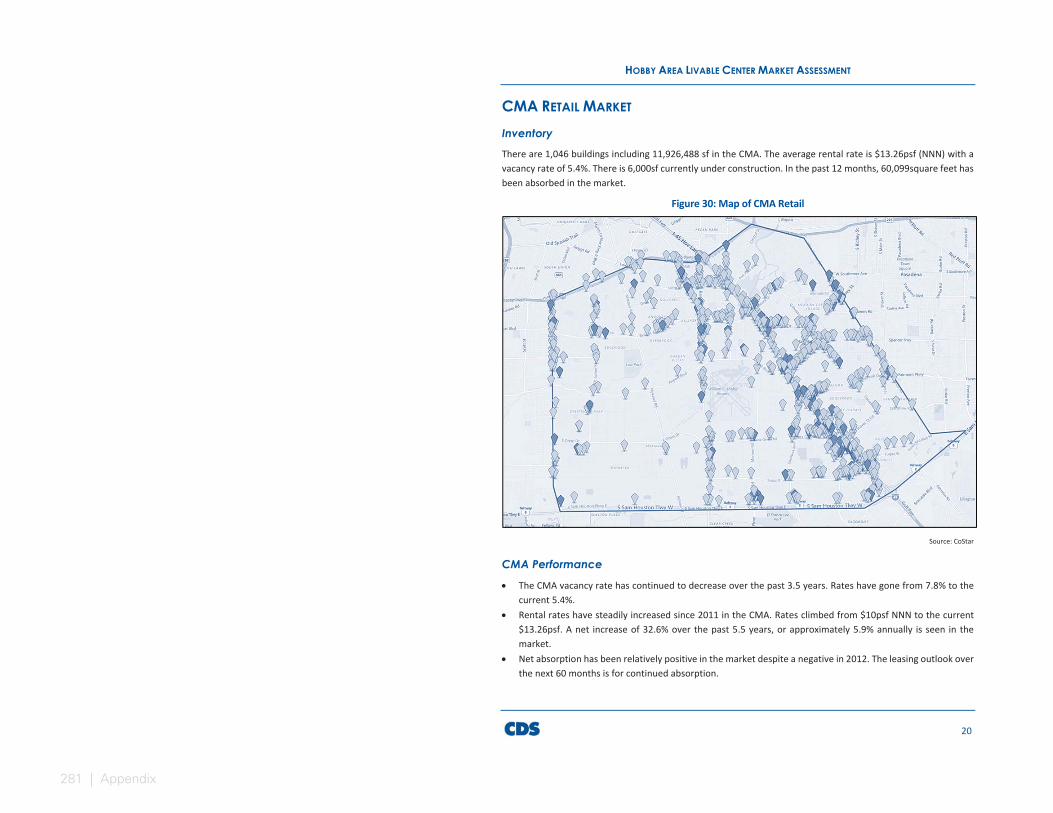
281 | Appendix
HOBBY AREA LIVABLE CENTER MARKET ASSESSMENT
20
CMA RETAIL MARKET
InventoryThere are 1,046 buildings including 11,926,488 sf in the CMA. The average rental rate is $13.26psf (NNN) with a vacancy rate of 5.4%. There is 6,000sf currently under construction. In the past 12 months, 60,099square feet has been absorbed in the market.
Figure 30: Map of CMA Retail
Source: CoStar
CMA Performance
The CMA vacancy rate has continued to decrease over the past 3.5 years. Rates have gone from 7.8% to the current 5.4%.
Rental rates have steadily increased since 2011 in the CMA. Rates climbed from $10psf NNN to the current $13.26psf. A net increase of 32.6% over the past 5.5 years, or approximately 5.9% annually is seen in the market.
Net absorption has been relatively positive in the market despite a negative in 2012. The leasing outlook over the next 60 months is for continued absorption.
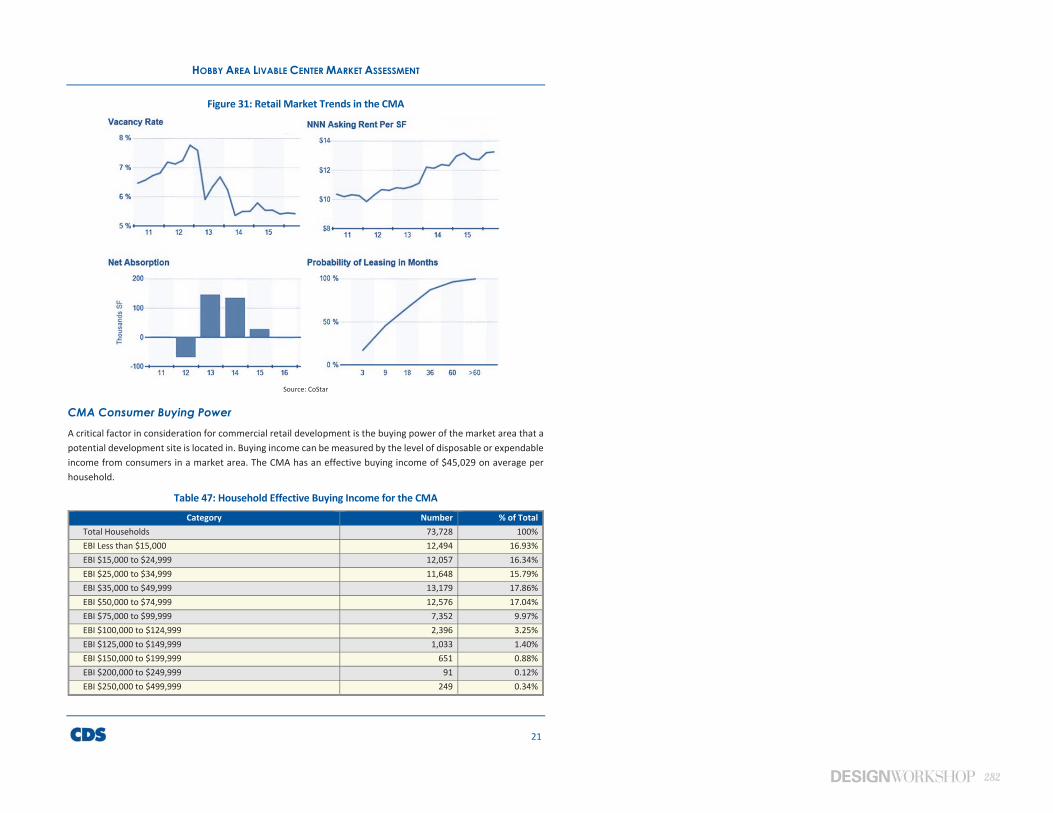
282
HOBBY AREA LIVABLE CENTER MARKET ASSESSMENT
21
Figure 31: Retail Market Trends in the CMA
Source: CoStar
CMA Consumer Buying Power A critical factor in consideration for commercial retail development is the buying power of the market area that a potential development site is located in. Buying income can be measured by the level of disposable or expendable income from consumers in a market area. The CMA has an effective buying income of $45,029 on average per household.
Table 47: Household Effective Buying Income for the CMA
Category Number % of Total Total Households 73,728 100% EBI Less than $15,000 12,494 16.93% EBI $15,000 to $24,999 12,057 16.34% EBI $25,000 to $34,999 11,648 15.79% EBI $35,000 to $49,999 13,179 17.86% EBI $50,000 to $74,999 12,576 17.04% EBI $75,000 to $99,999 7,352 9.97% EBI $100,000 to $124,999 2,396 3.25% EBI $125,000 to $149,999 1,033 1.40% EBI $150,000 to $199,999 651 0.88% EBI $200,000 to $249,999 91 0.12% EBI $250,000 to $499,999 249 0.34%
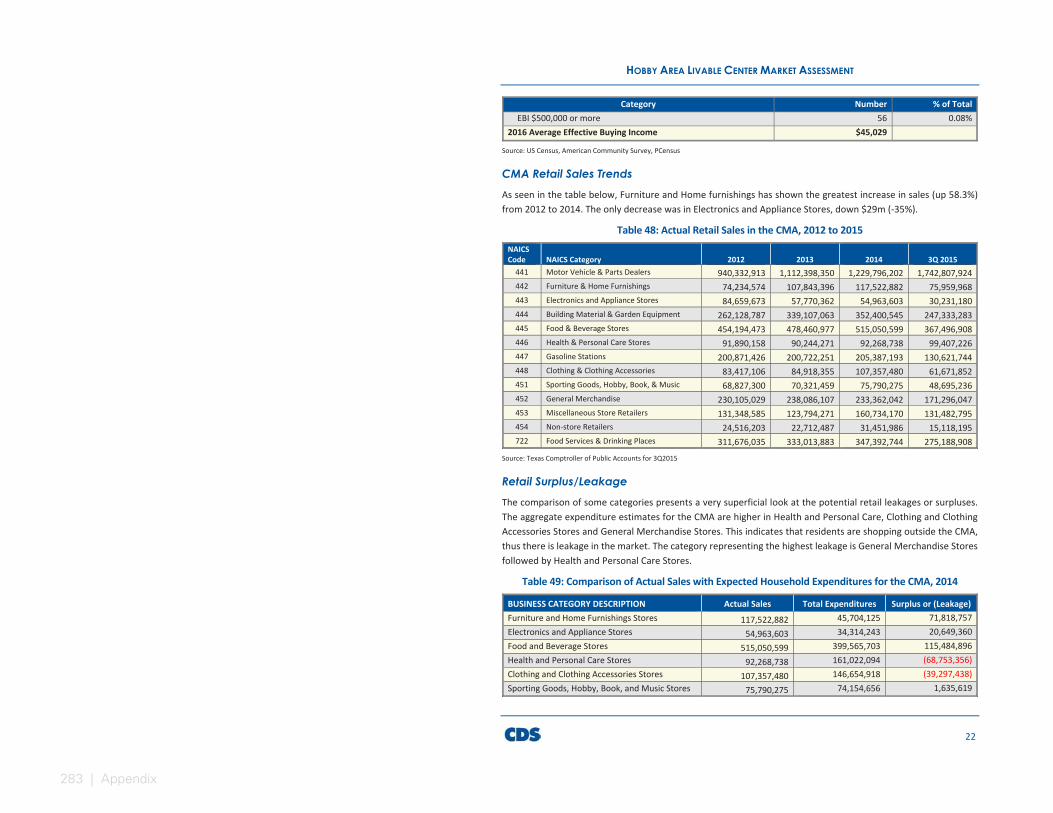
283 | Appendix
HOBBY AREA LIVABLE CENTER MARKET ASSESSMENT
22
Category Number % of Total EBI $500,000 or more 56 0.08%
2016 Average Effective Buying Income $45,029
Source: US Census, American Community Survey, PCensus
CMA Retail Sales Trends As seen in the table below, Furniture and Home furnishings has shown the greatest increase in sales (up 58.3%) from 2012 to 2014. The only decrease was in Electronics and Appliance Stores, down $29m (-35%).
Table 48: Actual Retail Sales in the CMA, 2012 to 2015 NAICS Code NAICS Category 2012 2013 2014 3Q 2015
441 Motor Vehicle & Parts Dealers 940,332,913 1,112,398,350 1,229,796,202 1,742,807,924 442 Furniture & Home Furnishings 74,234,574 107,843,396 117,522,882 75,959,968 443 Electronics and Appliance Stores 84,659,673 57,770,362 54,963,603 30,231,180 444 Building Material & Garden Equipment 262,128,787 339,107,063 352,400,545 247,333,283 445 Food & Beverage Stores 454,194,473 478,460,977 515,050,599 367,496,908 446 Health & Personal Care Stores 91,890,158 90,244,271 92,268,738 99,407,226 447 Gasoline Stations 200,871,426 200,722,251 205,387,193 130,621,744 448 Clothing & Clothing Accessories 83,417,106 84,918,355 107,357,480 61,671,852 451 Sporting Goods, Hobby, Book, & Music 68,827,300 70,321,459 75,790,275 48,695,236 452 General Merchandise 230,105,029 238,086,107 233,362,042 171,296,047 453 Miscellaneous Store Retailers 131,348,585 123,794,271 160,734,170 131,482,795 454 Non-store Retailers 24,516,203 22,712,487 31,451,986 15,118,195 722 Food Services & Drinking Places 311,676,035 333,013,883 347,392,744 275,188,908
Source: Texas Comptroller of Public Accounts for 3Q2015
Retail Surplus/Leakage The comparison of some categories presents a very superficial look at the potential retail leakages or surpluses. The aggregate expenditure estimates for the CMA are higher in Health and Personal Care, Clothing and Clothing Accessories Stores and General Merchandise Stores. This indicates that residents are shopping outside the CMA, thus there is leakage in the market. The category representing the highest leakage is General Merchandise Stores followed by Health and Personal Care Stores.
Table 49: Comparison of Actual Sales with Expected Household Expenditures for the CMA, 2014
BUSINESS CATEGORY DESCRIPTION Actual Sales Total Expenditures Surplus or (Leakage) Furniture and Home Furnishings Stores 117,522,882 45,704,125 71,818,757 Electronics and Appliance Stores 54,963,603 34,314,243 20,649,360 Food and Beverage Stores 515,050,599 399,565,703 115,484,896 Health and Personal Care Stores 92,268,738 161,022,094 (68,753,356) Clothing and Clothing Accessories Stores 107,357,480 146,654,918 (39,297,438) Sporting Goods, Hobby, Book, and Music Stores 75,790,275 74,154,656 1,635,619
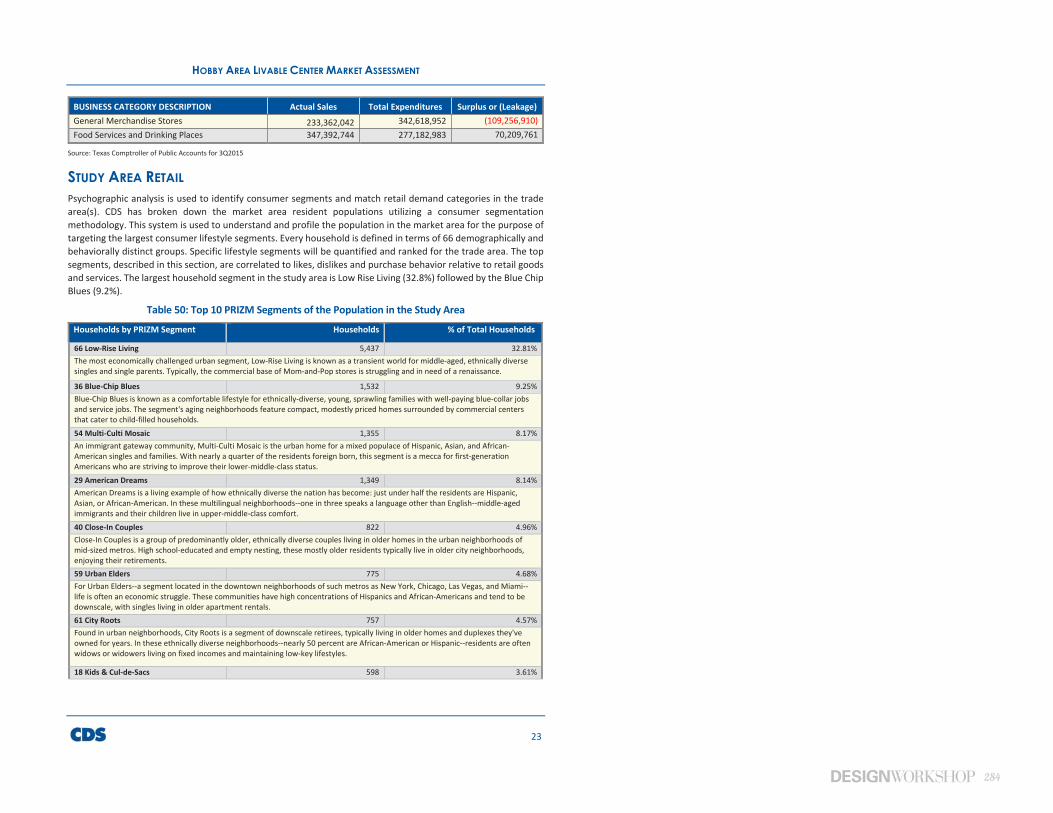
284
HOBBY AREA LIVABLE CENTER MARKET ASSESSMENT
23
BUSINESS CATEGORY DESCRIPTION Actual Sales Total Expenditures Surplus or (Leakage) General Merchandise Stores 233,362,042 342,618,952 (109,256,910) Food Services and Drinking Places 347,392,744 277,182,983 70,209,761
Source: Texas Comptroller of Public Accounts for 3Q2015
STUDY AREA RETAILPsychographic analysis is used to identify consumer segments and match retail demand categories in the trade area(s). CDS has broken down the market area resident populations utilizing a consumer segmentation methodology. This system is used to understand and profile the population in the market area for the purpose of targeting the largest consumer lifestyle segments. Every household is defined in terms of 66 demographically and behaviorally distinct groups. Specific lifestyle segments will be quantified and ranked for the trade area. The top segments, described in this section, are correlated to likes, dislikes and purchase behavior relative to retail goods and services. The largest household segment in the study area is Low Rise Living (32.8%) followed by the Blue Chip Blues (9.2%).
Table 50: Top 10 PRIZM Segments of the Population in the Study Area
Households by PRIZM Segment Households % of Total Households
66 Low-Rise Living 5,437 32.81% The most economically challenged urban segment, Low-Rise Living is known as a transient world for middle-aged, ethnically diverse singles and single parents. Typically, the commercial base of Mom-and-Pop stores is struggling and in need of a renaissance.
36 Blue-Chip Blues 1,532 9.25% Blue-Chip Blues is known as a comfortable lifestyle for ethnically-diverse, young, sprawling families with well-paying blue-collar jobs and service jobs. The segment's aging neighborhoods feature compact, modestly priced homes surrounded by commercial centers that cater to child-filled households. 54 Multi-Culti Mosaic 1,355 8.17% An immigrant gateway community, Multi-Culti Mosaic is the urban home for a mixed populace of Hispanic, Asian, and African-American singles and families. With nearly a quarter of the residents foreign born, this segment is a mecca for first-generation Americans who are striving to improve their lower-middle-class status. 29 American Dreams 1,349 8.14% American Dreams is a living example of how ethnically diverse the nation has become: just under half the residents are Hispanic, Asian, or African-American. In these multilingual neighborhoods--one in three speaks a language other than English--middle-aged immigrants and their children live in upper-middle-class comfort. 40 Close-In Couples 822 4.96% Close-In Couples is a group of predominantly older, ethnically diverse couples living in older homes in the urban neighborhoods of mid-sized metros. High school-educated and empty nesting, these mostly older residents typically live in older city neighborhoods, enjoying their retirements. 59 Urban Elders 775 4.68% For Urban Elders--a segment located in the downtown neighborhoods of such metros as New York, Chicago, Las Vegas, and Miami--life is often an economic struggle. These communities have high concentrations of Hispanics and African-Americans and tend to be downscale, with singles living in older apartment rentals. 61 City Roots 757 4.57% Found in urban neighborhoods, City Roots is a segment of downscale retirees, typically living in older homes and duplexes they've owned for years. In these ethnically diverse neighborhoods--nearly 50 percent are African-American or Hispanic--residents are often widows or widowers living on fixed incomes and maintaining low-key lifestyles.
18 Kids & Cul-de-Sacs 598 3.61%

285 | Appendix
HOBBY AREA LIVABLE CENTER MARKET ASSESSMENT
24
Households by PRIZM Segment Households % of Total Households
Upper-middle-class, suburban, married couples with children--that's the skinny on Kids & Cul-de-Sacs, an enviable lifestyle of large families in recently built subdivisions. With a high rate of Hispanic and Asian Americans, this segment is a refuge for college-educated, white-collar professionals with administrative jobs and upper-middle-class incomes. Their nexus of education, affluence, and children translates into large outlays for child-centered products and services. 52 Suburban Pioneers 598 3.61% Suburban Pioneers represents one of the nation's eclectic lifestyles, a mix of singles, recent divorcees, and single parents who have moved into older, inner-ring suburbs. They live in aging homes and garden-style apartment buildings, where the jobs are scarce and the money is tight. But what unites these residents--a diverse mix of Whites, Asians, Hispanics, and African-Americans--is a working-class sensibility and an appreciation for their off-the-beaten-track neighborhoods. 26 The Cosmopolitans 584 3.53% Educated, upper-midscale, and ethnically diverse, The Cosmopolitans are urbane couples in America's fast-growing cities. Concentrated in a handful of metros--such as Las Vegas, Miami, and Albuquerque--these households feature older, empty-nesting homeowners. A vibrant social scene surrounds their older homes and apartments, and residents love the nightlife and enjoy leisure-intensive lifestyles.
Source: US Census, American Community Survey, PCensus
Retail Supply There are 246 retail buildings including 2,965,946 square feet in the study area. The average vacancy is 6.3% with rental rates at $15.92psf NNN. Retail is located along the main roadways and arteries.
Figure 32: Retail Locations in the Study Area
Source: CoStar
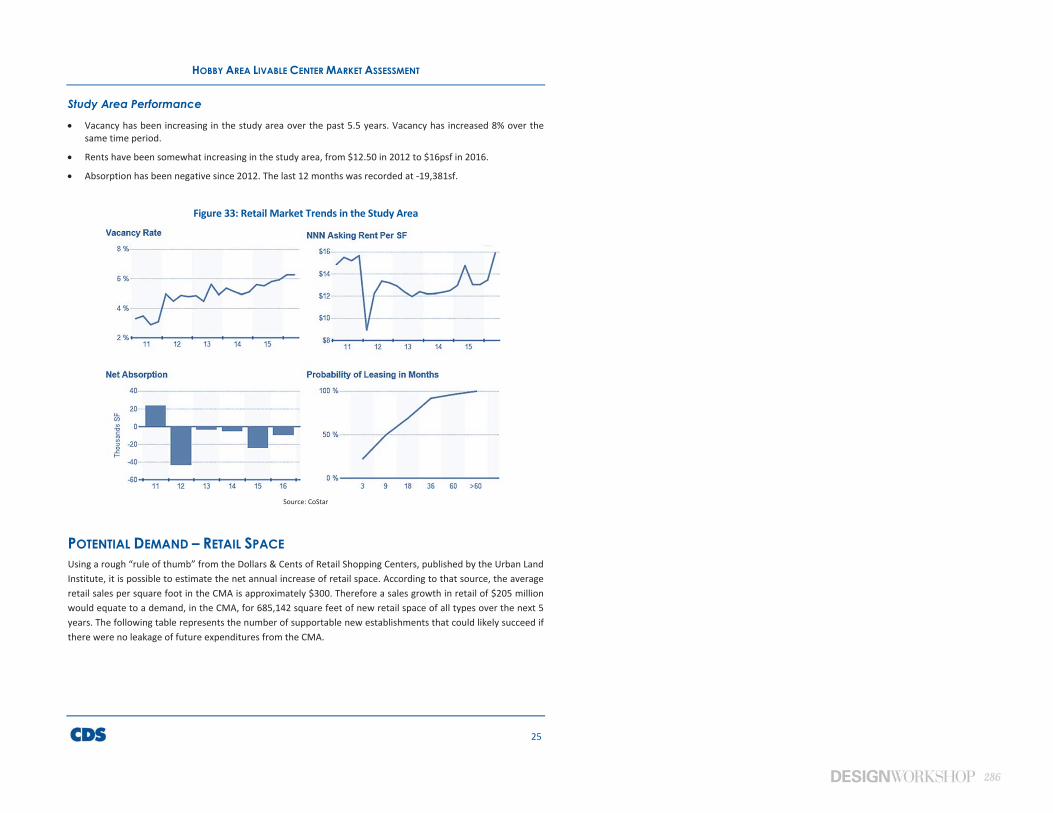
286
HOBBY AREA LIVABLE CENTER MARKET ASSESSMENT
25
Study Area Performance
Vacancy has been increasing in the study area over the past 5.5 years. Vacancy has increased 8% over the same time period.
Rents have been somewhat increasing in the study area, from $12.50 in 2012 to $16psf in 2016.
Absorption has been negative since 2012. The last 12 months was recorded at -19,381sf.
Figure 33: Retail Market Trends in the Study Area
Source: CoStar
POTENTIAL DEMAND – RETAIL SPACEUsing a rough “rule of thumb” from the Dollars & Cents of Retail Shopping Centers, published by the Urban Land Institute, it is possible to estimate the net annual increase of retail space. According to that source, the average retail sales per square foot in the CMA is approximately $300. Therefore a sales growth in retail of $205 million would equate to a demand, in the CMA, for 685,142 square feet of new retail space of all types over the next 5 years. The following table represents the number of supportable new establishments that could likely succeed if there were no leakage of future expenditures from the CMA.
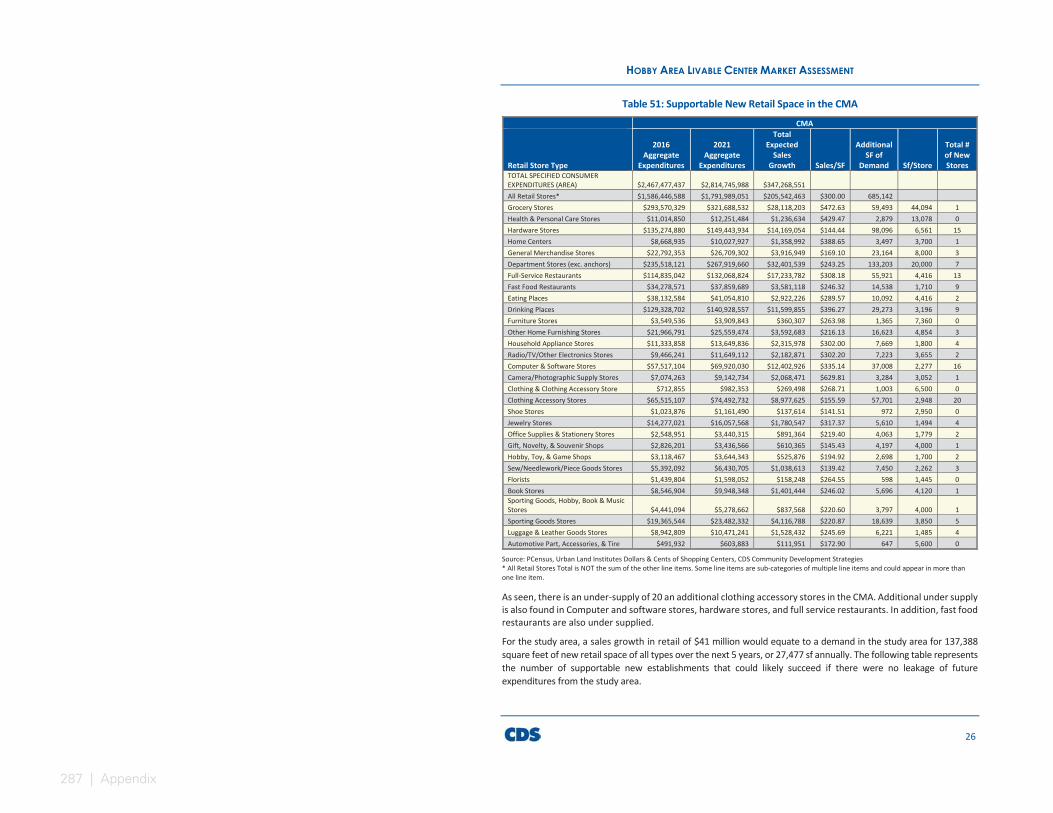
287 | Appendix
HOBBY AREA LIVABLE CENTER MARKET ASSESSMENT
26
Table 51: Supportable New Retail Space in the CMA CMA
Retail Store Type
2016 Aggregate
Expenditures
2021 Aggregate
Expenditures
Total Expected
Sales Growth Sales/SF
Additional SF of
Demand Sf/Store
Total # of New Stores
TOTAL SPECIFIED CONSUMER EXPENDITURES (AREA) $2,467,477,437 $2,814,745,988 $347,268,551 All Retail Stores* $1,586,446,588 $1,791,989,051 $205,542,463 $300.00 685,142 Grocery Stores $293,570,329 $321,688,532 $28,118,203 $472.63 59,493 44,094 1 Health & Personal Care Stores $11,014,850 $12,251,484 $1,236,634 $429.47 2,879 13,078 0 Hardware Stores $135,274,880 $149,443,934 $14,169,054 $144.44 98,096 6,561 15 Home Centers $8,668,935 $10,027,927 $1,358,992 $388.65 3,497 3,700 1 General Merchandise Stores $22,792,353 $26,709,302 $3,916,949 $169.10 23,164 8,000 3 Department Stores (exc. anchors) $235,518,121 $267,919,660 $32,401,539 $243.25 133,203 20,000 7 Full-Service Restaurants $114,835,042 $132,068,824 $17,233,782 $308.18 55,921 4,416 13 Fast Food Restaurants $34,278,571 $37,859,689 $3,581,118 $246.32 14,538 1,710 9 Eating Places $38,132,584 $41,054,810 $2,922,226 $289.57 10,092 4,416 2 Drinking Places $129,328,702 $140,928,557 $11,599,855 $396.27 29,273 3,196 9 Furniture Stores $3,549,536 $3,909,843 $360,307 $263.98 1,365 7,360 0 Other Home Furnishing Stores $21,966,791 $25,559,474 $3,592,683 $216.13 16,623 4,854 3 Household Appliance Stores $11,333,858 $13,649,836 $2,315,978 $302.00 7,669 1,800 4 Radio/TV/Other Electronics Stores $9,466,241 $11,649,112 $2,182,871 $302.20 7,223 3,655 2 Computer & Software Stores $57,517,104 $69,920,030 $12,402,926 $335.14 37,008 2,277 16 Camera/Photographic Supply Stores $7,074,263 $9,142,734 $2,068,471 $629.81 3,284 3,052 1 Clothing & Clothing Accessory Store $712,855 $982,353 $269,498 $268.71 1,003 6,500 0 Clothing Accessory Stores $65,515,107 $74,492,732 $8,977,625 $155.59 57,701 2,948 20 Shoe Stores $1,023,876 $1,161,490 $137,614 $141.51 972 2,950 0 Jewelry Stores $14,277,021 $16,057,568 $1,780,547 $317.37 5,610 1,494 4 Office Supplies & Stationery Stores $2,548,951 $3,440,315 $891,364 $219.40 4,063 1,779 2 Gift, Novelty, & Souvenir Shops $2,826,201 $3,436,566 $610,365 $145.43 4,197 4,000 1 Hobby, Toy, & Game Shops $3,118,467 $3,644,343 $525,876 $194.92 2,698 1,700 2 Sew/Needlework/Piece Goods Stores $5,392,092 $6,430,705 $1,038,613 $139.42 7,450 2,262 3 Florists $1,439,804 $1,598,052 $158,248 $264.55 598 1,445 0 Book Stores $8,546,904 $9,948,348 $1,401,444 $246.02 5,696 4,120 1 Sporting Goods, Hobby, Book & Music Stores $4,441,094 $5,278,662 $837,568 $220.60 3,797 4,000 1 Sporting Goods Stores $19,365,544 $23,482,332 $4,116,788 $220.87 18,639 3,850 5 Luggage & Leather Goods Stores $8,942,809 $10,471,241 $1,528,432 $245.69 6,221 1,485 4 Automotive Part, Accessories, & Tire $491,932 $603,883 $111,951 $172.90 647 5,600 0
Source: PCensus, Urban Land Institutes Dollars & Cents of Shopping Centers, CDS Community Development Strategies * All Retail Stores Total is NOT the sum of the other line items. Some line items are sub-categories of multiple line items and could appear in more than one line item.
As seen, there is an under-supply of 20 an additional clothing accessory stores in the CMA. Additional under supply is also found in Computer and software stores, hardware stores, and full service restaurants. In addition, fast food restaurants are also under supplied.
For the study area, a sales growth in retail of $41 million would equate to a demand in the study area for 137,388 square feet of new retail space of all types over the next 5 years, or 27,477 sf annually. The following table represents the number of supportable new establishments that could likely succeed if there were no leakage of future expenditures from the study area.

288
HOBBY AREA LIVABLE CENTER MARKET ASSESSMENT
27
Table 52: Supportable New Retail Space in the Study Area
Study Area
Retail Store Type
2016 Aggregate
Expenditures
2021 Aggregate
Expenditures
Total Expected
Sales Growth Sales/SF
Additional SF of
Demand Sf/Store
Total # of New Stores
TOTAL SPECIFIED CONSUMER EXPENDITURES (AREA) $526,722,833 $596,292,570 $69,569,737 All Retail Stores* $339,989,289 $381,205,601 $41,216,312 $300.00 137388 Grocery Stores $63,900,088 $69,682,204 $5,782,116 $472.63 12234 44094 0
Health & Personal Care Stores $28,340,109 $31,331,885 $2,991,776 $429.47 6966 13078 1
Hardware Stores $1,717,520 $1,971,358 $253,838 $144.44 1757 6561 0
Home Centers $4,536,246 $5,282,399 $746,153 $388.65 1920 3700 1
General Merchandise Stores $50,546,559 $57,162,518 $6,615,959 $169.10 39125 8000 5
Department Stores (exc. anchors) $24,538,021 $28,044,265 $3,506,244 $243.25 14414 20000 1
Full-Service Restaurants $7,389,944 $8,109,309 $719,365 $308.18 2334 4416 1
Fast Food Restaurants $8,440,977 $9,008,955 $567,978 $246.32 2306 1710 1
Eating Places $28,285,253 $30,589,664 $2,304,411 $289.57 7958 4416 2
Drinking Places $754,973 $824,527 $69,554 $396.27 176 3196 0
Furniture Stores $4,726,751 $5,448,475 $721,724 $263.98 2734 7360 0
Other Home Furnishing Stores $2,326,250 $2,784,202 $457,952 $216.13 2119 4854 0
Household Appliance Stores $2,000,315 $2,437,893 $437,578 $302.00 1449 1800 1
Radio/TV/Other Electronics Stores $12,522,930 $15,084,953 $2,562,023 $302.20 8478 3655 2
Computer & Software Stores $1,526,773 $1,955,190 $428,417 $335.14 1278 2277 1
Camera/Photographic Supply Stores $151,530 $206,304 $54,774 $629.81 87 3052 0
Clothing & Clothing Accessory Store $14,135,605 $15,922,332 $1,786,727 $268.71 6649 6500 1
Clothing Accessory Stores $221,311 $248,332 $27,021 $155.59 174 2948 0
Shoe Stores $3,123,785 $3,481,525 $357,740 $141.51 2528 2950 1
Jewelry Stores $521,799 $698,992 $177,193 $317.37 558 1494 0
Office Supplies & Stationery Stores $601,288 $726,298 $125,010 $219.40 570 1779 0
Gift, Novelty, & Souvenir Shops $664,380 $771,641 $107,261 $145.43 738 4000 0
Hobby, Toy, & Game Shops $1,164,883 $1,379,190 $214,307 $194.92 1099 1700 1
Sew/Needlework/Piece Goods $306,990 $337,837 $30,847 $139.42 221 2262 0
Florists $1,683,987 $1,943,599 $259,612 $264.55 981 1445 1
Book Stores $954,945 $1,118,020 $163,075 $246.02 663 4120 0 Sporting Goods, Hobby, Book & Music Stores
$4,166,759 $4,995,650 $828,891 $220.60
3757 4000
1
Sporting Goods Stores $1,920,403 $2,219,745 $299,342 $220.87 1355 3850 0
Luggage & Leather Goods Stores $104,004 $126,634 $22,630 $245.69 92 1485 0
Automotive Part, Accessories & Tire $8,020,158 $8,768,196 $748,038 $172.90 4326 5600 1
Source: PCensus, Urban Land Institutes Dollars & Cents of Shopping Centers, CDS Community Development Strategies * All Retail Stores Total is NOT the sum of the other line items. Some line items are sub-categories of multiple line items and could appear in more than one line item.
As seen, there is an under-supply of 5 additional general merchandise stores in the study area. Additional under-supply is also found in Eating Places and Radio/TV/Other Electronics Stores. The demographics of the market area, while showing some signs of evolving toward a higher income population with more disposable income, may help support a major change in the area’s retail profile.

289 | Appendix
HOBBY AREA LIVABLE CENTER MARKET ASSESSMENT
28
Conclusions and findings include the following:
Independent local businesses serving the area’s moderate income population generally prefer the older, lower rent retail space in the area over more expensive newer space. However regional and national chains with recognizable brands are less likely to be interested in class B and particularly class C retail space. Increasing population growth will help mitigate this situation over time by attracting retail developers who will respond to this demand by proving class A space, through redevelopment of older spaces or adding new development.
The overall aesthetics of an area are very important to retailers. Making public investments in an area can encourage more retail interest, which can spur retail property owners to renovate properties in order to compete for new tenants. Retail realtors, brokers, and stakeholders in the area who were interviewed mentioned several types of improvements that could be made including landscaping, median improvements, additional sidewalks, and increasing lighting along commercial corridors. A program to discourage graffiti and bandit signs was also requested.
A major retail hub in the study area (pictured in the lower left of the following figure) is Glenbrook Square located on Telephone Road. This retail center was built in 1970 and contains nearly 70,000 square feet of well maintained class B space. Although the center has experienced some tenant turnover, it has maintained the same anchor since its initial construction (Kroger). The property is currently owned and managed by Weingarten Realty but was listed for sale last year and is reportedly under contract. The potential new owners are reportedly committed to the success of the site, suggesting a renovation of the property may be forthcoming.
Figure 34: Images of Retail Locations in the CMA
Source: Google Street View

290
HOBBY AREA LIVABLE CENTER MARKET ASSESSMENT
29
CATALYST PROJECT OPPORTUNITYAs previously noted, additional retail space marketed to restaurants, bars, and entertainment venues would be expected to do well. This is related in part to the relatively high number of people who are employed in the area, as well as to the number of travelers and hotel guests associated with the airport. In addition, new retail space devoted to restaurants, bars, and entertainment can serve as a catalyst for further new development in the area. The key to such a catalyst project would be to provide retail space that is unique and attractive, prioritizing independent retailers (over chains) and providing a neighborhood experience with rear placed parking and patio seating. Experience has shown that this type of retail has a greater chance of attracting those who are visiting the area and looking for a unique dining/entertainment experience.
The following figure depicts three locations in the Houston area that could serve as examples. On the left is a very popular, small retail center in a residential section of Montrose. This retail center has three tenant spaces totaling 6,000 square feet, with minimal but attractive landscaping and space in the front for patio seating. The top right is the Karbach Brewing Co. facility near the Northwest Mall at Hwy 290 and Loop 610. This facility is mostly utilized for brewing and is therefore rightly located among other industrial facilities. But the brewery tours and the restaurant with patio seating attracts many visitors. The bottom right is Bernie’s Backyard, located just off I-45 near Hwy 99. This location has an indoor bar and a large outdoor patio area with parking for several mobile eateries. It is known to many as a food truck park. All three of these locations attract many visitors and even host events, both private and public.
Figure 35: Examples of Small Retail / Restaurant Projects
Source: HTownChowDown.com, Google Street View
Beyond the anecdotal reports that a similar kind of establishment would do well, estimates of capturable spending are provided in this section. The estimates presented previously show projected increases in resident spending. These estimates suggest growing demand in the study area for eating/drinking places, as well as other types of
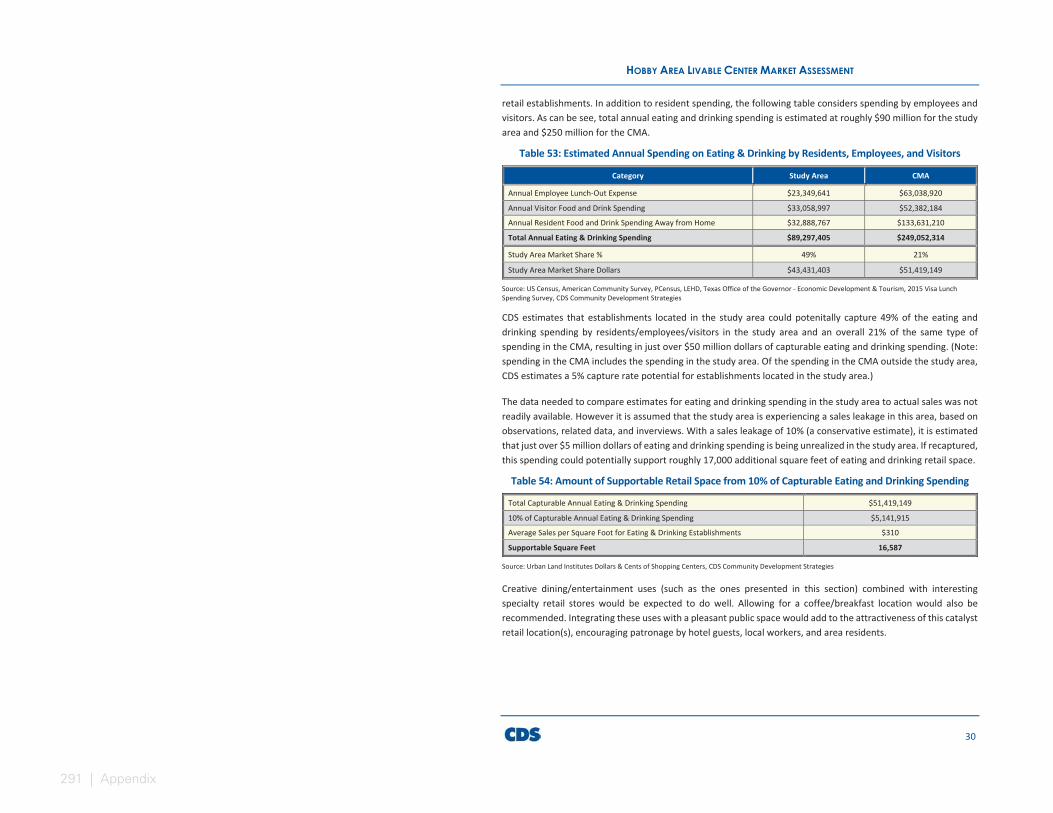
291 | Appendix
HOBBY AREA LIVABLE CENTER MARKET ASSESSMENT
30
retail establishments. In addition to resident spending, the following table considers spending by employees and visitors. As can be see, total annual eating and drinking spending is estimated at roughly $90 million for the study area and $250 million for the CMA.
Table 53: Estimated Annual Spending on Eating & Drinking by Residents, Employees, and Visitors
Category Study Area CMA
Annual Employee Lunch-Out Expense $23,349,641 $63,038,920
Annual Visitor Food and Drink Spending $33,058,997 $52,382,184
Annual Resident Food and Drink Spending Away from Home $32,888,767 $133,631,210
Total Annual Eating & Drinking Spending $89,297,405 $249,052,314
Study Area Market Share % 49% 21%
Study Area Market Share Dollars $43,431,403 $51,419,149
Source: US Census, American Community Survey, PCensus, LEHD, Texas Office of the Governor - Economic Development & Tourism, 2015 Visa Lunch Spending Survey, CDS Community Development Strategies
CDS estimates that establishments located in the study area could potenitally capture 49% of the eating and drinking spending by residents/employees/visitors in the study area and an overall 21% of the same type of spending in the CMA, resulting in just over $50 million dollars of capturable eating and drinking spending. (Note: spending in the CMA includes the spending in the study area. Of the spending in the CMA outside the study area, CDS estimates a 5% capture rate potential for establishments located in the study area.)
The data needed to compare estimates for eating and drinking spending in the study area to actual sales was not readily available. However it is assumed that the study area is experiencing a sales leakage in this area, based on observations, related data, and inverviews. With a sales leakage of 10% (a conservative estimate), it is estimated that just over $5 million dollars of eating and drinking spending is being unrealized in the study area. If recaptured, this spending could potentially support roughly 17,000 additional square feet of eating and drinking retail space.
Table 54: Amount of Supportable Retail Space from 10% of Capturable Eating and Drinking Spending
Total Capturable Annual Eating & Drinking Spending $51,419,149
10% of Capturable Annual Eating & Drinking Spending $5,141,915
Average Sales per Square Foot for Eating & Drinking Establishments $310
Supportable Square Feet 16,587
Source: Urban Land Institutes Dollars & Cents of Shopping Centers, CDS Community Development Strategies
Creative dining/entertainment uses (such as the ones presented in this section) combined with interesting specialty retail stores would be expected to do well. Allowing for a coffee/breakfast location would also be recommended. Integrating these uses with a pleasant public space would add to the attractiveness of this catalyst retail location(s), encouraging patronage by hotel guests, local workers, and area residents.
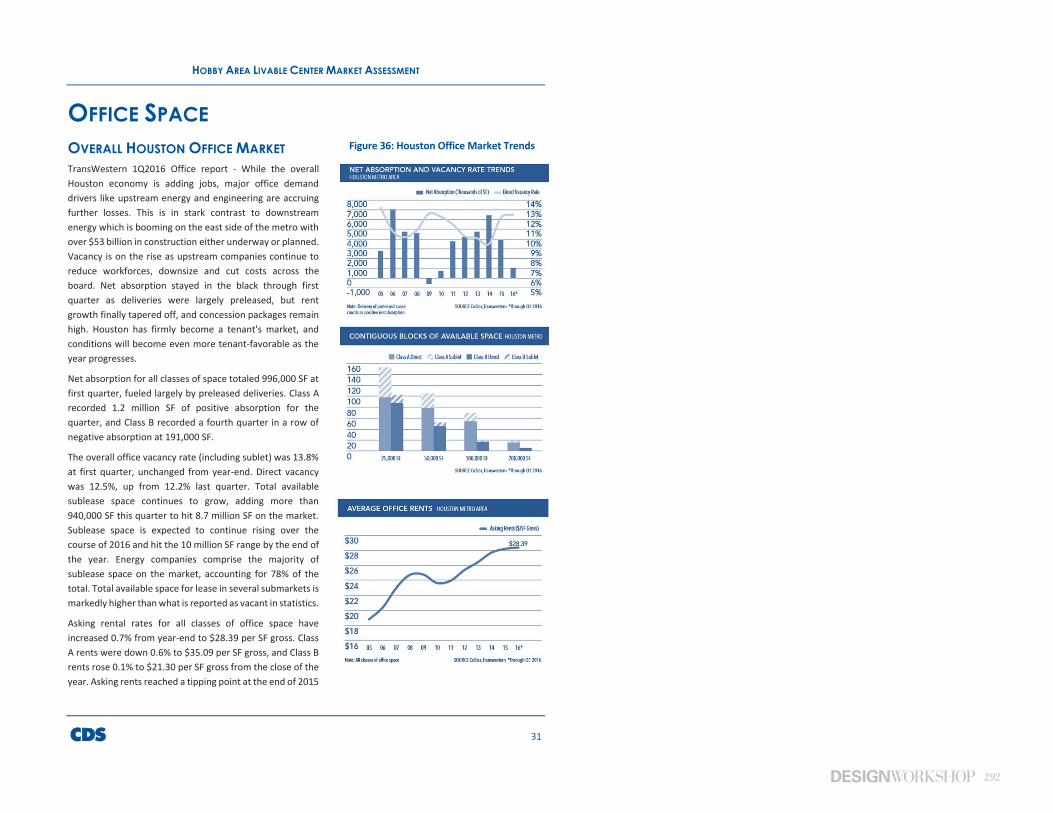
292
HOBBY AREA LIVABLE CENTER MARKET ASSESSMENT
31
OFFICE SPACEOVERALL HOUSTON OFFICE MARKETTransWestern 1Q2016 Office report - While the overall Houston economy is adding jobs, major office demand drivers like upstream energy and engineering are accruing further losses. This is in stark contrast to downstream energy which is booming on the east side of the metro with over $53 billion in construction either underway or planned. Vacancy is on the rise as upstream companies continue to reduce workforces, downsize and cut costs across the board. Net absorption stayed in the black through first quarter as deliveries were largely preleased, but rent growth finally tapered off, and concession packages remain high. Houston has firmly become a tenant's market, and conditions will become even more tenant-favorable as the year progresses.
Net absorption for all classes of space totaled 996,000 SF at first quarter, fueled largely by preleased deliveries. Class A recorded 1.2 million SF of positive absorption for the quarter, and Class B recorded a fourth quarter in a row of negative absorption at 191,000 SF.
The overall office vacancy rate (including sublet) was 13.8% at first quarter, unchanged from year-end. Direct vacancy was 12.5%, up from 12.2% last quarter. Total available sublease space continues to grow, adding more than 940,000 SF this quarter to hit 8.7 million SF on the market. Sublease space is expected to continue rising over the course of 2016 and hit the 10 million SF range by the end of the year. Energy companies comprise the majority of sublease space on the market, accounting for 78% of the total. Total available space for lease in several submarkets is markedly higher than what is reported as vacant in statistics.
Asking rental rates for all classes of office space have increased 0.7% from year-end to $28.39 per SF gross. Class A rents were down 0.6% to $35.09 per SF gross, and Class B rents rose 0.1% to $21.30 per SF gross from the close of the year. Asking rents reached a tipping point at the end of 2015
Figure 36: Houston Office Market Trends
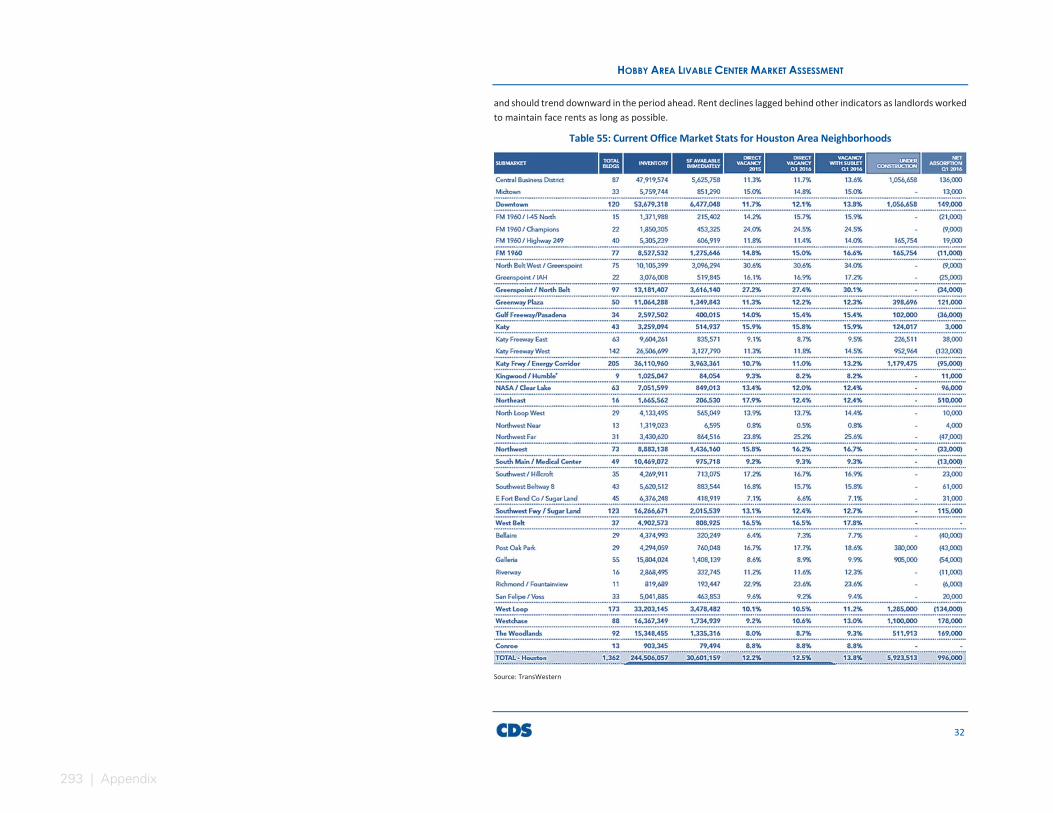
293 | Appendix
HOBBY AREA LIVABLE CENTER MARKET ASSESSMENT
32
and should trend downward in the period ahead. Rent declines lagged behind other indicators as landlords worked to maintain face rents as long as possible.
Table 55: Current Office Market Stats for Houston Area Neighborhoods
Source: TransWestern
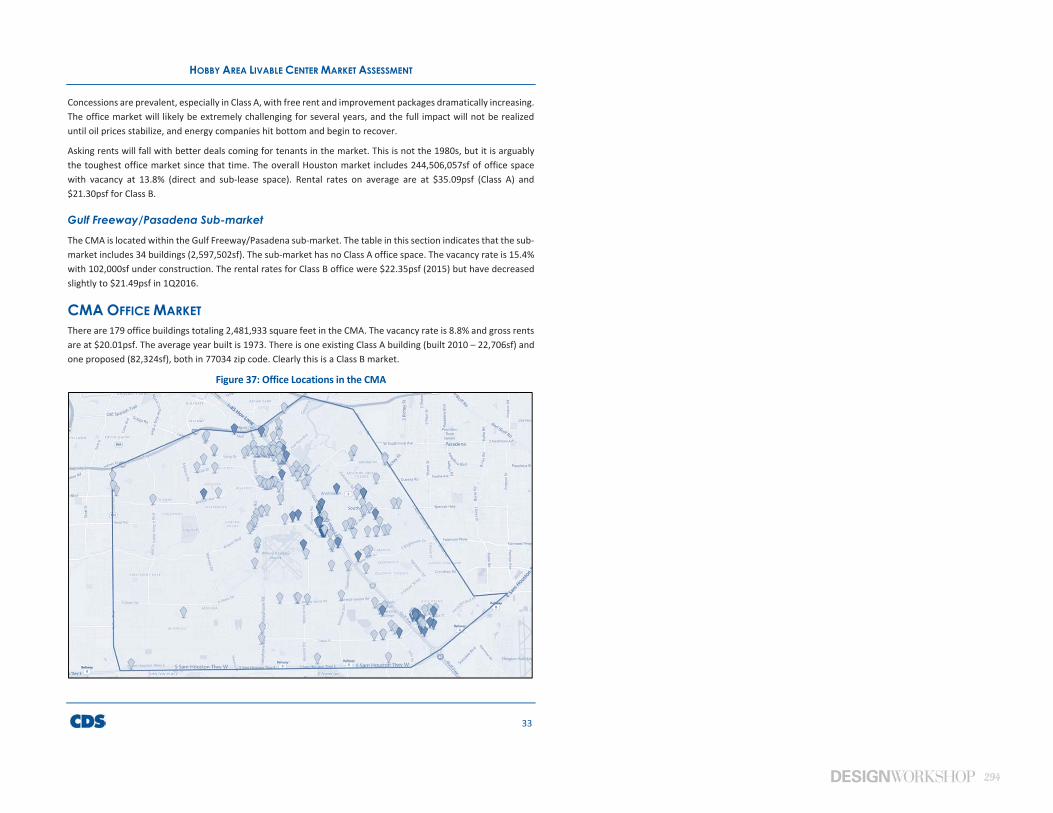
294
HOBBY AREA LIVABLE CENTER MARKET ASSESSMENT
33
Concessions are prevalent, especially in Class A, with free rent and improvement packages dramatically increasing. The office market will likely be extremely challenging for several years, and the full impact will not be realized until oil prices stabilize, and energy companies hit bottom and begin to recover.
Asking rents will fall with better deals coming for tenants in the market. This is not the 1980s, but it is arguably the toughest office market since that time. The overall Houston market includes 244,506,057sf of office space with vacancy at 13.8% (direct and sub-lease space). Rental rates on average are at $35.09psf (Class A) and $21.30psf for Class B.
Gulf Freeway/Pasadena Sub-market The CMA is located within the Gulf Freeway/Pasadena sub-market. The table in this section indicates that the sub-market includes 34 buildings (2,597,502sf). The sub-market has no Class A office space. The vacancy rate is 15.4% with 102,000sf under construction. The rental rates for Class B office were $22.35psf (2015) but have decreased slightly to $21.49psf in 1Q2016.
CMA OFFICE MARKETThere are 179 office buildings totaling 2,481,933 square feet in the CMA. The vacancy rate is 8.8% and gross rents are at $20.01psf. The average year built is 1973. There is one existing Class A building (built 2010 – 22,706sf) and one proposed (82,324sf), both in 77034 zip code. Clearly this is a Class B market.
Figure 37: Office Locations in the CMA
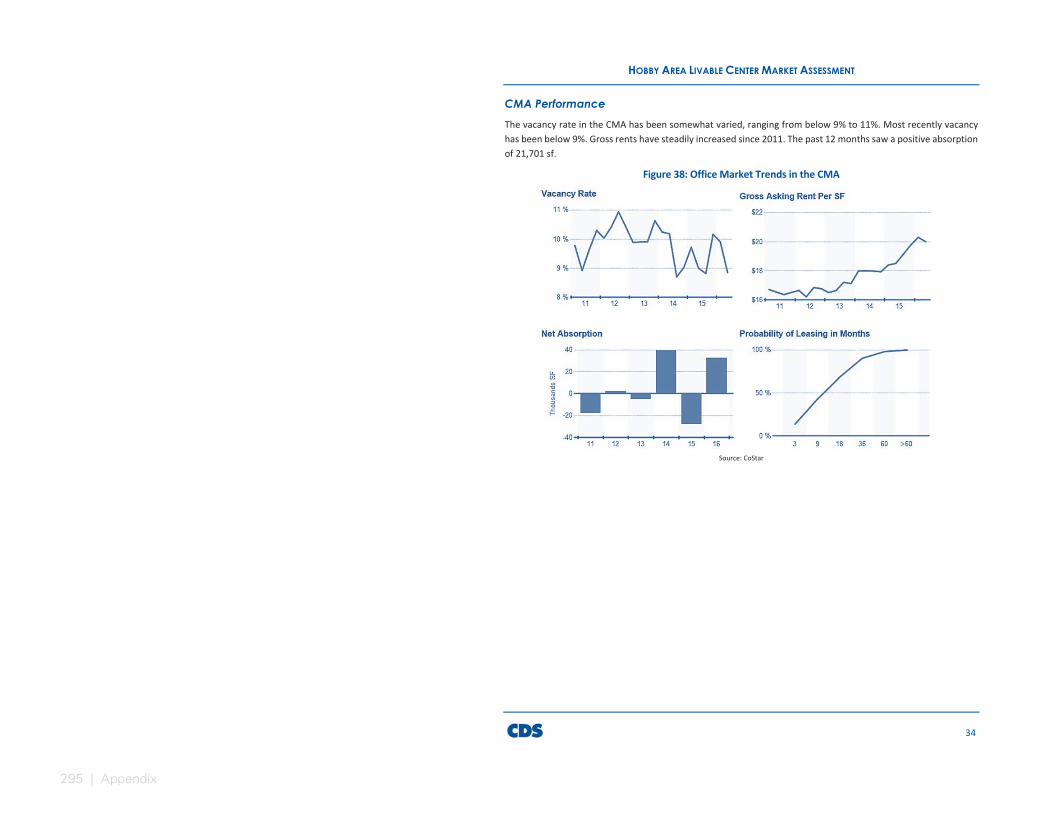
295 | Appendix
HOBBY AREA LIVABLE CENTER MARKET ASSESSMENT
34
CMA Performance The vacancy rate in the CMA has been somewhat varied, ranging from below 9% to 11%. Most recently vacancy has been below 9%. Gross rents have steadily increased since 2011. The past 12 months saw a positive absorption of 21,701 sf.
Figure 38: Office Market Trends in the CMA
Source: CoStar
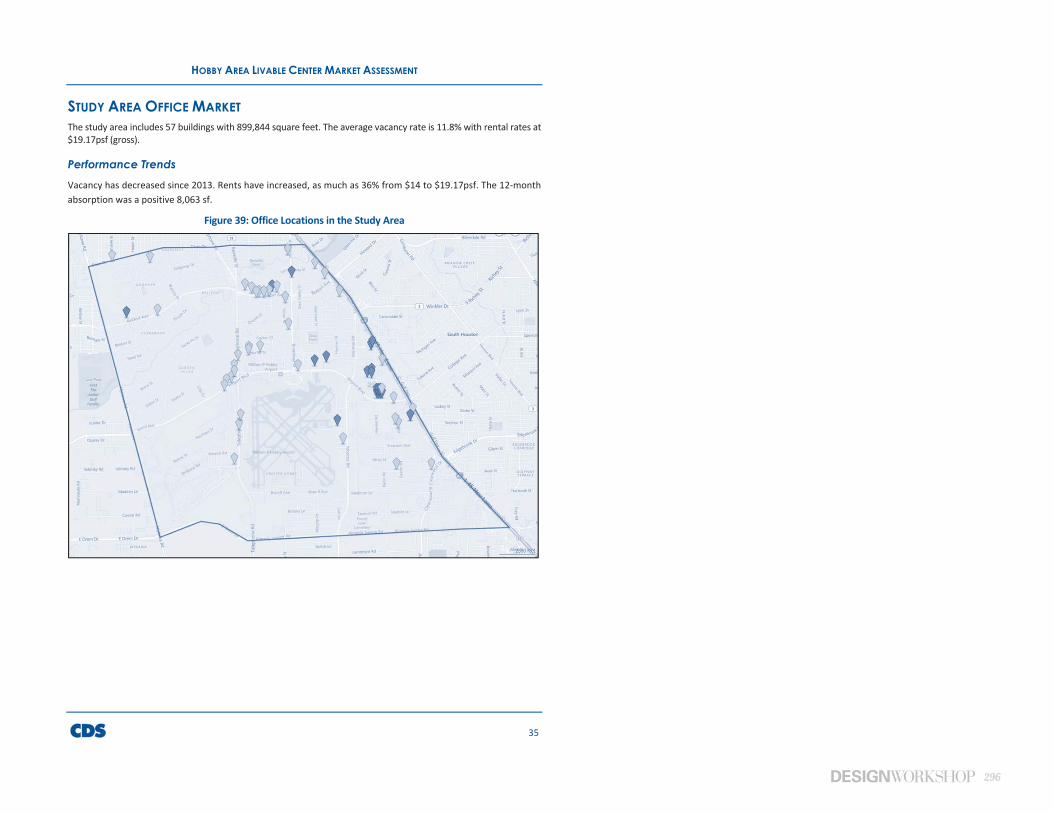
296
HOBBY AREA LIVABLE CENTER MARKET ASSESSMENT
35
STUDY AREA OFFICE MARKETThe study area includes 57 buildings with 899,844 square feet. The average vacancy rate is 11.8% with rental rates at $19.17psf (gross).
Performance Trends Vacancy has decreased since 2013. Rents have increased, as much as 36% from $14 to $19.17psf. The 12-month absorption was a positive 8,063 sf.
Figure 39: Office Locations in the Study Area
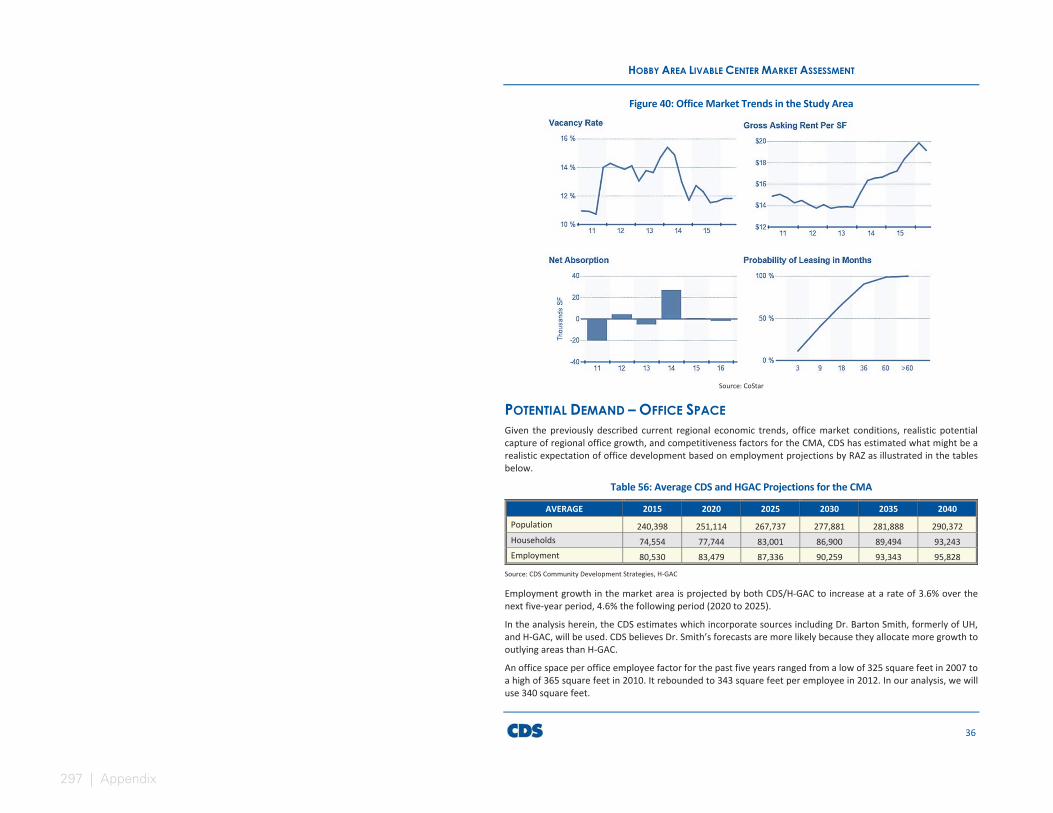
297 | Appendix
HOBBY AREA LIVABLE CENTER MARKET ASSESSMENT
36
Figure 40: Office Market Trends in the Study Area
Source: CoStar
POTENTIAL DEMAND – OFFICE SPACEGiven the previously described current regional economic trends, office market conditions, realistic potential capture of regional office growth, and competitiveness factors for the CMA, CDS has estimated what might be a realistic expectation of office development based on employment projections by RAZ as illustrated in the tables below.
Table 56: Average CDS and HGAC Projections for the CMA
AVERAGE 2015 2020 2025 2030 2035 2040 Population 240,398 251,114 267,737 277,881 281,888 290,372 Households 74,554 77,744 83,001 86,900 89,494 93,243 Employment 80,530 83,479 87,336 90,259 93,343 95,828
Source: CDS Community Development Strategies, H-GAC
Employment growth in the market area is projected by both CDS/H-GAC to increase at a rate of 3.6% over the next five-year period, 4.6% the following period (2020 to 2025).
In the analysis herein, the CDS estimates which incorporate sources including Dr. Barton Smith, formerly of UH, and H-GAC, will be used. CDS believes Dr. Smith’s forecasts are more likely because they allocate more growth to outlying areas than H-GAC.
An office space per office employee factor for the past five years ranged from a low of 325 square feet in 2007 to a high of 365 square feet in 2010. It rebounded to 343 square feet per employee in 2012. In our analysis, we will use 340 square feet.
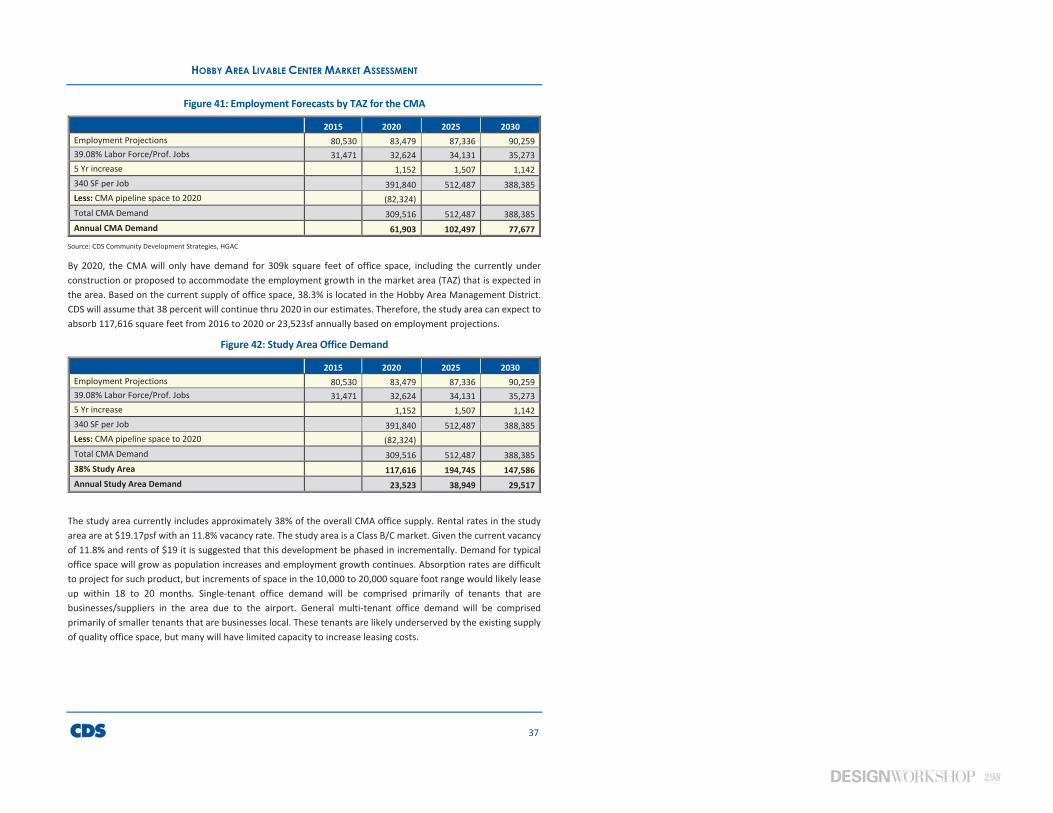
298
HOBBY AREA LIVABLE CENTER MARKET ASSESSMENT
37
Figure 41: Employment Forecasts by TAZ for the CMA
2015 2020 2025 2030 Employment Projections 80,530 83,479 87,336 90,259 39.08% Labor Force/Prof. Jobs 31,471 32,624 34,131 35,273 5 Yr increase 1,152 1,507 1,142 340 SF per Job 391,840 512,487 388,385 Less: CMA pipeline space to 2020 (82,324) Total CMA Demand 309,516 512,487 388,385 Annual CMA Demand 61,903 102,497 77,677
Source: CDS Community Development Strategies, HGAC
By 2020, the CMA will only have demand for 309k square feet of office space, including the currently under construction or proposed to accommodate the employment growth in the market area (TAZ) that is expected in the area. Based on the current supply of office space, 38.3% is located in the Hobby Area Management District. CDS will assume that 38 percent will continue thru 2020 in our estimates. Therefore, the study area can expect to absorb 117,616 square feet from 2016 to 2020 or 23,523sf annually based on employment projections.
Figure 42: Study Area Office Demand
2015 2020 2025 2030 Employment Projections 80,530 83,479 87,336 90,259 39.08% Labor Force/Prof. Jobs 31,471 32,624 34,131 35,273 5 Yr increase 1,152 1,507 1,142 340 SF per Job 391,840 512,487 388,385 Less: CMA pipeline space to 2020 (82,324) Total CMA Demand 309,516 512,487 388,385 38% Study Area 117,616 194,745 147,586 Annual Study Area Demand 23,523 38,949 29,517
The study area currently includes approximately 38% of the overall CMA office supply. Rental rates in the study area are at $19.17psf with an 11.8% vacancy rate. The study area is a Class B/C market. Given the current vacancy of 11.8% and rents of $19 it is suggested that this development be phased in incrementally. Demand for typical office space will grow as population increases and employment growth continues. Absorption rates are difficult to project for such product, but increments of space in the 10,000 to 20,000 square foot range would likely lease up within 18 to 20 months. Single-tenant office demand will be comprised primarily of tenants that are businesses/suppliers in the area due to the airport. General multi-tenant office demand will be comprised primarily of smaller tenants that are businesses local. These tenants are likely underserved by the existing supply of quality office space, but many will have limited capacity to increase leasing costs.
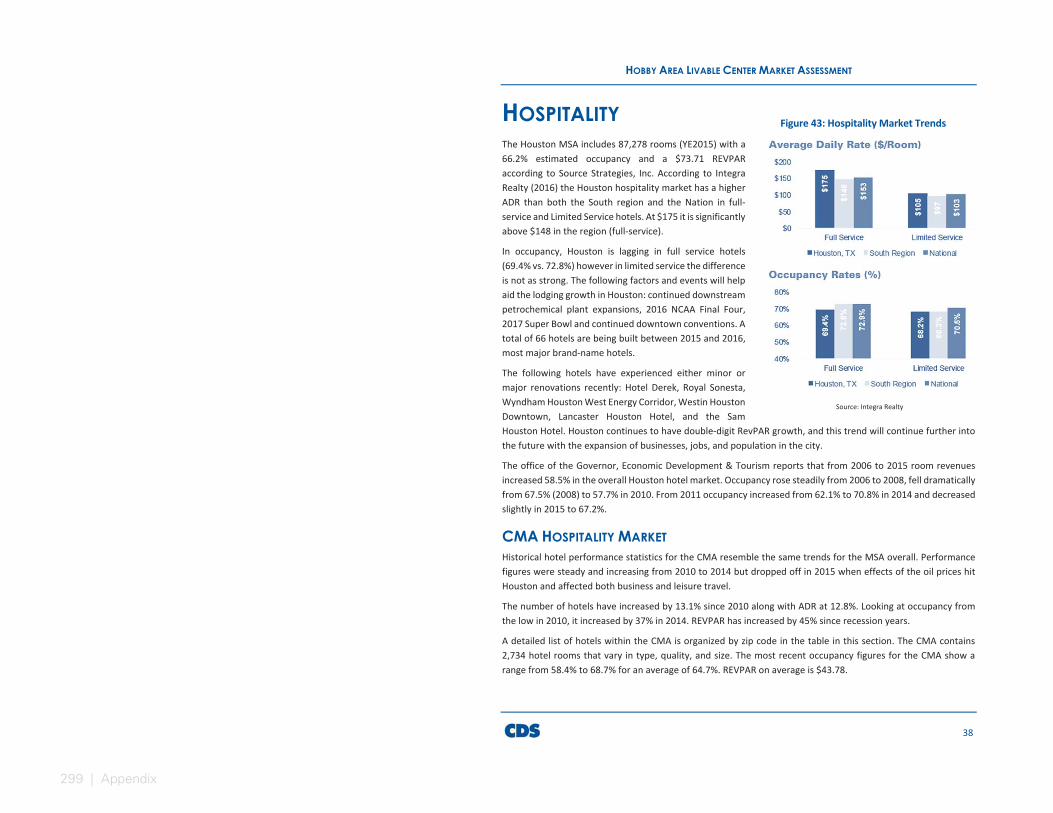
299 | Appendix
HOBBY AREA LIVABLE CENTER MARKET ASSESSMENT
38
HOSPITALITYThe Houston MSA includes 87,278 rooms (YE2015) with a 66.2% estimated occupancy and a $73.71 REVPAR according to Source Strategies, Inc. According to Integra Realty (2016) the Houston hospitality market has a higher ADR than both the South region and the Nation in full-service and Limited Service hotels. At $175 it is significantly above $148 in the region (full-service).
In occupancy, Houston is lagging in full service hotels (69.4% vs. 72.8%) however in limited service the difference is not as strong. The following factors and events will help aid the lodging growth in Houston: continued downstream petrochemical plant expansions, 2016 NCAA Final Four, 2017 Super Bowl and continued downtown conventions. A total of 66 hotels are being built between 2015 and 2016, most major brand-name hotels.
The following hotels have experienced either minor or major renovations recently: Hotel Derek, Royal Sonesta, Wyndham Houston West Energy Corridor, Westin Houston Downtown, Lancaster Houston Hotel, and the Sam Houston Hotel. Houston continues to have double-digit RevPAR growth, and this trend will continue further into the future with the expansion of businesses, jobs, and population in the city.
The office of the Governor, Economic Development & Tourism reports that from 2006 to 2015 room revenues increased 58.5% in the overall Houston hotel market. Occupancy rose steadily from 2006 to 2008, fell dramatically from 67.5% (2008) to 57.7% in 2010. From 2011 occupancy increased from 62.1% to 70.8% in 2014 and decreased slightly in 2015 to 67.2%.
CMA HOSPITALITY MARKETHistorical hotel performance statistics for the CMA resemble the same trends for the MSA overall. Performance figures were steady and increasing from 2010 to 2014 but dropped off in 2015 when effects of the oil prices hit Houston and affected both business and leisure travel.
The number of hotels have increased by 13.1% since 2010 along with ADR at 12.8%. Looking at occupancy from the low in 2010, it increased by 37% in 2014. REVPAR has increased by 45% since recession years.
A detailed list of hotels within the CMA is organized by zip code in the table in this section. The CMA contains 2,734 hotel rooms that vary in type, quality, and size. The most recent occupancy figures for the CMA show a range from 58.4% to 68.7% for an average of 64.7%. REVPAR on average is $43.78.
Figure 43: Hospitality Market Trends
Source: Integra Realty
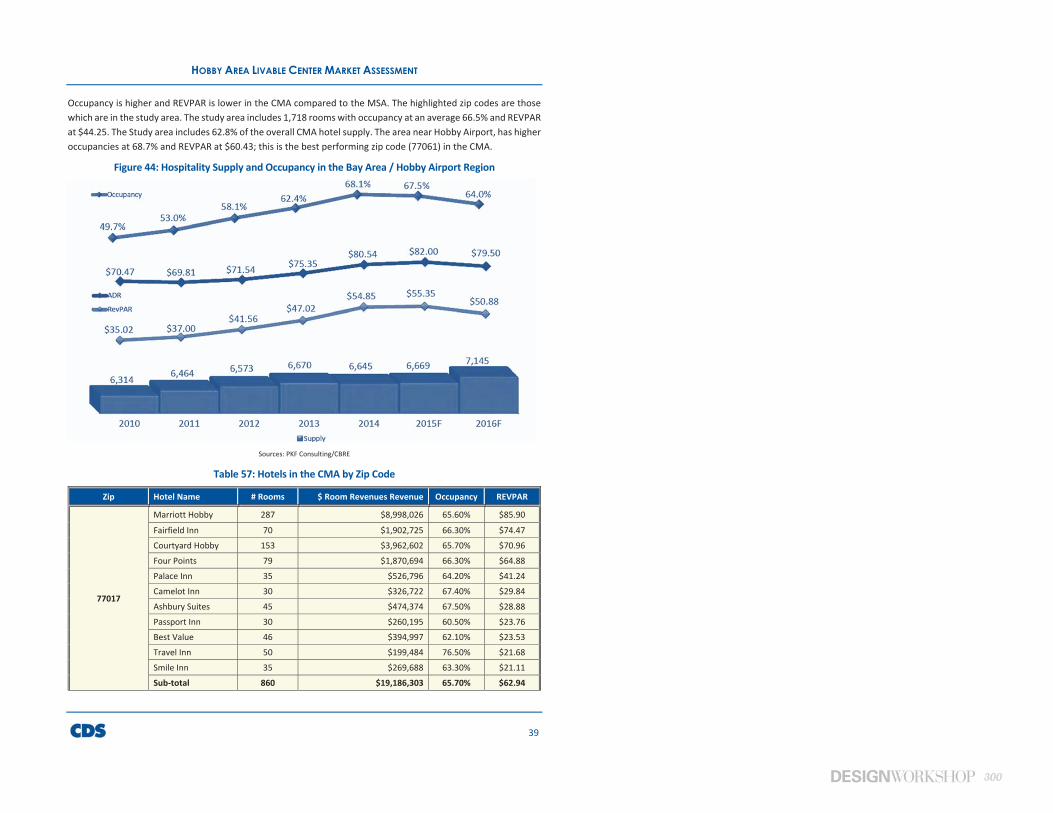
300
HOBBY AREA LIVABLE CENTER MARKET ASSESSMENT
39
Occupancy is higher and REVPAR is lower in the CMA compared to the MSA. The highlighted zip codes are those which are in the study area. The study area includes 1,718 rooms with occupancy at an average 66.5% and REVPAR at $44.25. The Study area includes 62.8% of the overall CMA hotel supply. The area near Hobby Airport, has higher occupancies at 68.7% and REVPAR at $60.43; this is the best performing zip code (77061) in the CMA.
Figure 44: Hospitality Supply and Occupancy in the Bay Area / Hobby Airport Region
Sources: PKF Consulting/CBRE
Table 57: Hotels in the CMA by Zip Code
Zip Hotel Name # Rooms $ Room Revenues Revenue Occupancy REVPAR
77017
Marriott Hobby 287 $8,998,026 65.60% $85.90 Fairfield Inn 70 $1,902,725 66.30% $74.47 Courtyard Hobby 153 $3,962,602 65.70% $70.96 Four Points 79 $1,870,694 66.30% $64.88 Palace Inn 35 $526,796 64.20% $41.24 Camelot Inn 30 $326,722 67.40% $29.84 Ashbury Suites 45 $474,374 67.50% $28.88 Passport Inn 30 $260,195 60.50% $23.76 Best Value 46 $394,997 62.10% $23.53 Travel Inn 50 $199,484 76.50% $21.68 Smile Inn 35 $269,688 63.30% $21.11 Sub-total 860 $19,186,303 65.70% $62.94
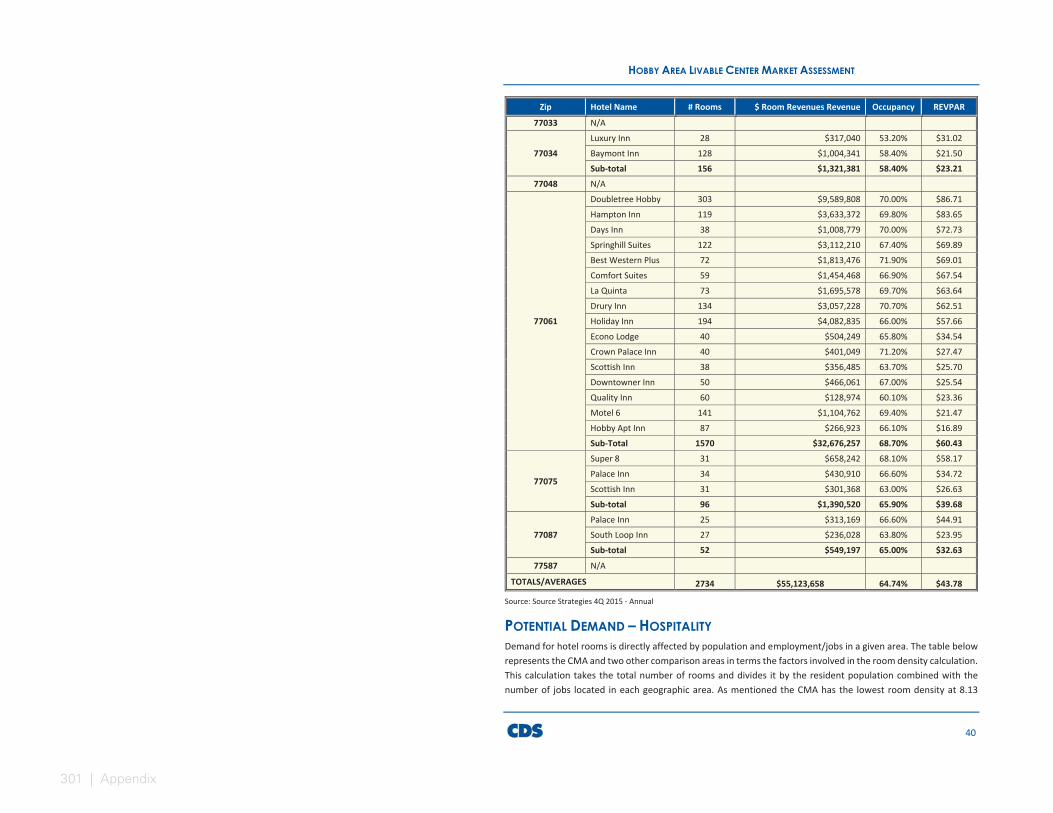
301 | Appendix
HOBBY AREA LIVABLE CENTER MARKET ASSESSMENT
40
Zip Hotel Name # Rooms $ Room Revenues Revenue Occupancy REVPAR
77033 N/A
77034 Luxury Inn 28 $317,040 53.20% $31.02 Baymont Inn 128 $1,004,341 58.40% $21.50 Sub-total 156 $1,321,381 58.40% $23.21
77048 N/A
77061
Doubletree Hobby 303 $9,589,808 70.00% $86.71 Hampton Inn 119 $3,633,372 69.80% $83.65 Days Inn 38 $1,008,779 70.00% $72.73 Springhill Suites 122 $3,112,210 67.40% $69.89 Best Western Plus 72 $1,813,476 71.90% $69.01 Comfort Suites 59 $1,454,468 66.90% $67.54 La Quinta 73 $1,695,578 69.70% $63.64 Drury Inn 134 $3,057,228 70.70% $62.51 Holiday Inn 194 $4,082,835 66.00% $57.66 Econo Lodge 40 $504,249 65.80% $34.54 Crown Palace Inn 40 $401,049 71.20% $27.47 Scottish Inn 38 $356,485 63.70% $25.70 Downtowner Inn 50 $466,061 67.00% $25.54 Quality Inn 60 $128,974 60.10% $23.36 Motel 6 141 $1,104,762 69.40% $21.47 Hobby Apt Inn 87 $266,923 66.10% $16.89 Sub-Total 1570 $32,676,257 68.70% $60.43
77075
Super 8 31 $658,242 68.10% $58.17 Palace Inn 34 $430,910 66.60% $34.72 Scottish Inn 31 $301,368 63.00% $26.63 Sub-total 96 $1,390,520 65.90% $39.68
77087 Palace Inn 25 $313,169 66.60% $44.91 South Loop Inn 27 $236,028 63.80% $23.95 Sub-total 52 $549,197 65.00% $32.63
77587 N/A
TOTALS/AVERAGES 2734 $55,123,658 64.74% $43.78
Source: Source Strategies 4Q 2015 - Annual
POTENTIAL DEMAND – HOSPITALITYDemand for hotel rooms is directly affected by population and employment/jobs in a given area. The table below represents the CMA and two other comparison areas in terms the factors involved in the room density calculation. This calculation takes the total number of rooms and divides it by the resident population combined with the number of jobs located in each geographic area. As mentioned the CMA has the lowest room density at 8.13
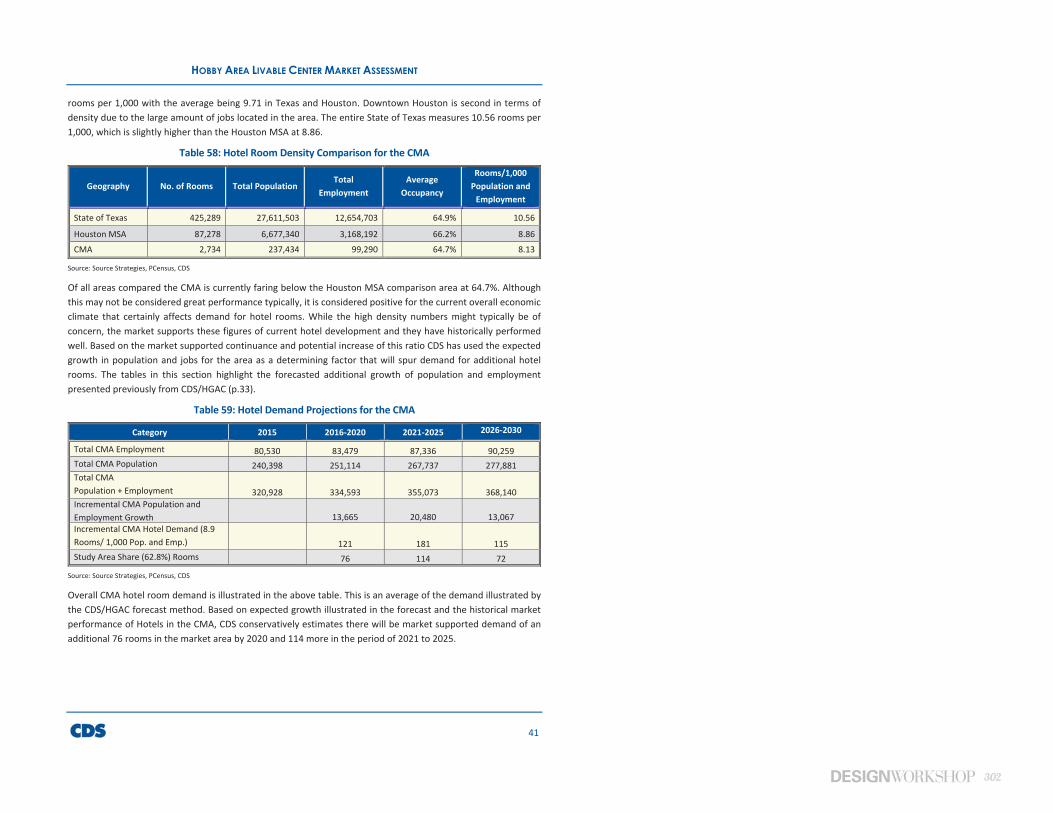
302
HOBBY AREA LIVABLE CENTER MARKET ASSESSMENT
41
rooms per 1,000 with the average being 9.71 in Texas and Houston. Downtown Houston is second in terms of density due to the large amount of jobs located in the area. The entire State of Texas measures 10.56 rooms per 1,000, which is slightly higher than the Houston MSA at 8.86.
Table 58: Hotel Room Density Comparison for the CMA
Geography No. of Rooms Total Population Total
Employment Average
Occupancy
Rooms/1,000 Population and
Employment
State of Texas 425,289 27,611,503 12,654,703 64.9% 10.56
Houston MSA 87,278 6,677,340 3,168,192 66.2% 8.86 CMA 2,734 237,434 99,290 64.7% 8.13
Source: Source Strategies, PCensus, CDS
Of all areas compared the CMA is currently faring below the Houston MSA comparison area at 64.7%. Although this may not be considered great performance typically, it is considered positive for the current overall economic climate that certainly affects demand for hotel rooms. While the high density numbers might typically be of concern, the market supports these figures of current hotel development and they have historically performed well. Based on the market supported continuance and potential increase of this ratio CDS has used the expected growth in population and jobs for the area as a determining factor that will spur demand for additional hotel rooms. The tables in this section highlight the forecasted additional growth of population and employment presented previously from CDS/HGAC (p.33).
Table 59: Hotel Demand Projections for the CMA
Category 2015 2016-2020 2021-2025 2026-2030
Total CMA Employment 80,530 83,479 87,336 90,259 Total CMA Population 240,398 251,114 267,737 277,881 Total CMA Population + Employment 320,928 334,593 355,073 368,140 Incremental CMA Population and Employment Growth 13,665 20,480 13,067 Incremental CMA Hotel Demand (8.9 Rooms/ 1,000 Pop. and Emp.) 121 181 115 Study Area Share (62.8%) Rooms 76 114 72
Source: Source Strategies, PCensus, CDS
Overall CMA hotel room demand is illustrated in the above table. This is an average of the demand illustrated by the CDS/HGAC forecast method. Based on expected growth illustrated in the forecast and the historical market performance of Hotels in the CMA, CDS conservatively estimates there will be market supported demand of an additional 76 rooms in the market area by 2020 and 114 more in the period of 2021 to 2025.
303 | Appendix
HOBBY AREA LIVABLE CENTER MARKET ASSESSMENT
42
INDUSTRIAL SPACEHouston’s industrial market continues to weather the effects of low oil prices with positive growth. Demand is strong, particularly in the Southeast submarket, and the flexibility offered in leasing terms and space use has been instrumental in preserving the market’s strength (CBRE Q12016). Tenants and landlords in Houston’s industrial market have responded to the changing economic environment via two trends: increases in shorter-term leases and an increased availability of sublease space.
Sublease space availability was a defining trend this quarter. Compared to a year ago, total industrial sublease availability surged over 1.6 million sq. ft. to 3.5 million sq. ft. —the largest amount on record and well above the five-year average of 2.4 million sq. ft. Although at an all-time high, current available sublease still represents only a small portion of all available space despite growing by 562,986 sq. ft. this quarter—the largest increase observed since Q2 2009.
Houston’s overall vacancy held steady at 4.9% as leasing velocity slowed in select submarkets. Tenants are carrying on with calculated leasing decisions, yet demand is strongest in third party logistics and warehousing demand. Rental rates have remained relatively unchanged in Q1 2016 where the current citywide industrial average asking gross rate per sq. ft. is $0.70 per month. The average quoted gross monthly rent rates are $0.55 per sq. ft. for warehouse/distribution space; $0.88 for flex/service space; and $0.66 per sq. ft. for manufacturing space.
A 1 million sq. ft. increase in construction starts was observed quarter-over-quarter, as 13 new projects broke ground representing just over 2.1 million sq. ft. of space. Although oil price volatility has heavily impacted demand for office space, overall industrial demand has yet to be derailed despite the rise in sublet availability. The continuing expansion of the downstream petrochemical industry remains a significant driver of area growth. Additionally, strong performance by the retail market and the resulting growth in consumer’s disposable income via low gasoline prices has further bolstered demand, keeping distribution users active in the market.
Both the CMA and study area are in the South sub-market. The South includes 43,535,972 square feet with a vacancy rate of 3% and asking rents at $0.67psf (gross). Comparatively, the overall Houston market includes 496,656,625 square feet with a 4.9% vacancy and rates at $0.72psf. The South sub-market has the lowest vacancy in Houston and the 3rd lowest rental rates. The South, Southeast and North submarkets all saw modest to moderate negative absorption
CMA INDUSTRIAL MARKETThere are 1,388 buildings including 26,565,705 square feet of industrial space in the CMA. The average vacancy is 2.4% with rental rates ate $6.33psf. Net absorption for the past 12 months was 14,426sf. There is 35,200sf under construction and 116,640sf proposed (2 buildings).
Vacancy in the CMA has been somewhat volatile over the past five years, although they have remained fairly low. Rates have gone from 1.5% to 4% with the largest jump up in 2013. Asking rents have been steadily rising from $4.75psf up to $7.00psf. Most recently, rates have decreased to $6.33psf. Absorption has been relatively positive over the past five years overall. The performance trends of the CMA can be seen in the following figure.
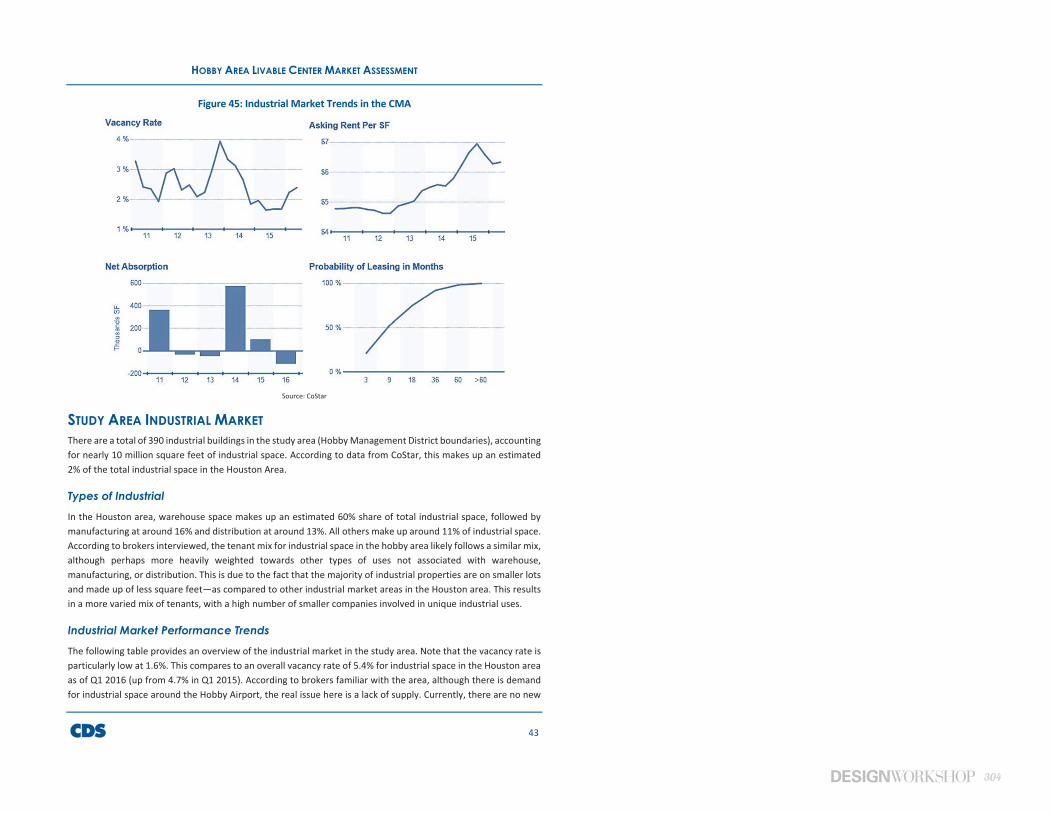
304
HOBBY AREA LIVABLE CENTER MARKET ASSESSMENT
43
Figure 45: Industrial Market Trends in the CMA
Source: CoStar
STUDY AREA INDUSTRIAL MARKETThere are a total of 390 industrial buildings in the study area (Hobby Management District boundaries), accounting for nearly 10 million square feet of industrial space. According to data from CoStar, this makes up an estimated 2% of the total industrial space in the Houston Area.
Types of Industrial In the Houston area, warehouse space makes up an estimated 60% share of total industrial space, followed by manufacturing at around 16% and distribution at around 13%. All others make up around 11% of industrial space. According to brokers interviewed, the tenant mix for industrial space in the hobby area likely follows a similar mix, although perhaps more heavily weighted towards other types of uses not associated with warehouse, manufacturing, or distribution. This is due to the fact that the majority of industrial properties are on smaller lots and made up of less square feet—as compared to other industrial market areas in the Houston area. This results in a more varied mix of tenants, with a high number of smaller companies involved in unique industrial uses.
Industrial Market Performance Trends The following table provides an overview of the industrial market in the study area. Note that the vacancy rate is particularly low at 1.6%. This compares to an overall vacancy rate of 5.4% for industrial space in the Houston area as of Q1 2016 (up from 4.7% in Q1 2015). According to brokers familiar with the area, although there is demand for industrial space around the Hobby Airport, the real issue here is a lack of supply. Currently, there are no new
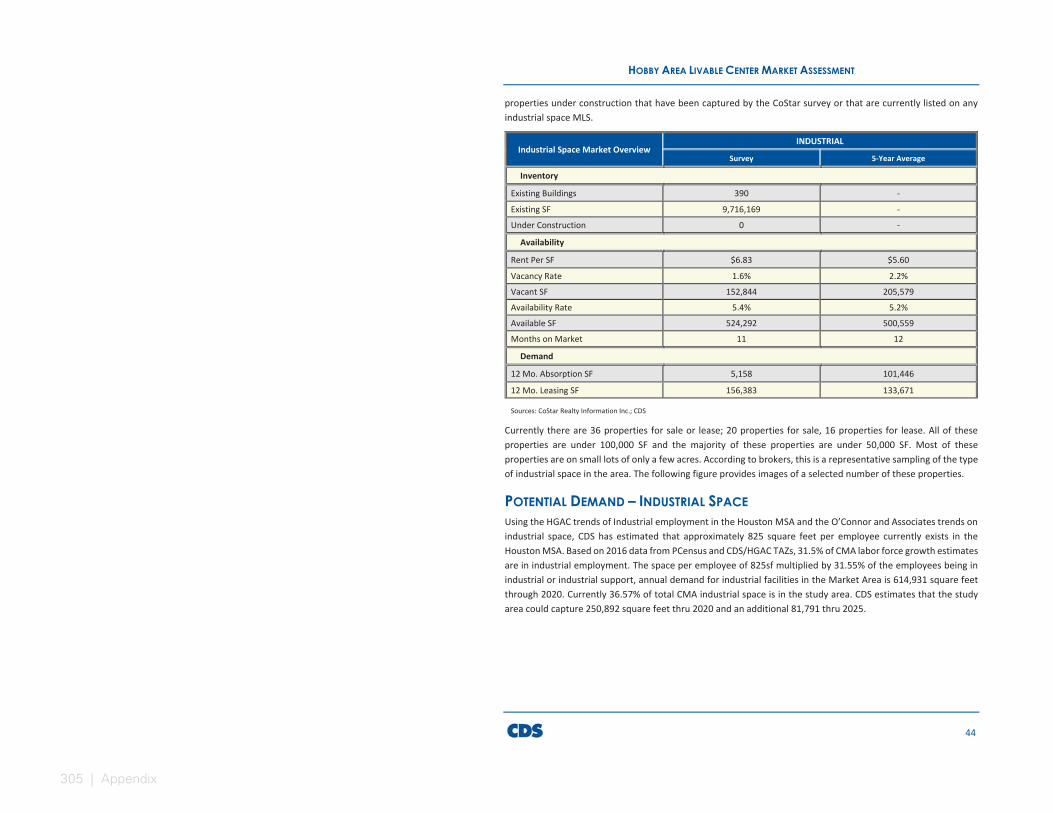
305 | Appendix
HOBBY AREA LIVABLE CENTER MARKET ASSESSMENT
44
properties under construction that have been captured by the CoStar survey or that are currently listed on any industrial space MLS.
Industrial Space Market Overview INDUSTRIAL
Survey 5-Year Average
Inventory
Existing Buildings 390 -
Existing SF 9,716,169 -
Under Construction 0 -
Availability
Rent Per SF $6.83 $5.60
Vacancy Rate 1.6% 2.2%
Vacant SF 152,844 205,579
Availability Rate 5.4% 5.2%
Available SF 524,292 500,559
Months on Market 11 12
Demand
12 Mo. Absorption SF 5,158 101,446
12 Mo. Leasing SF 156,383 133,671
Sources: CoStar Realty Information Inc.; CDS
Currently there are 36 properties for sale or lease; 20 properties for sale, 16 properties for lease. All of these properties are under 100,000 SF and the majority of these properties are under 50,000 SF. Most of these properties are on small lots of only a few acres. According to brokers, this is a representative sampling of the type of industrial space in the area. The following figure provides images of a selected number of these properties.
POTENTIAL DEMAND – INDUSTRIAL SPACEUsing the HGAC trends of Industrial employment in the Houston MSA and the O’Connor and Associates trends on industrial space, CDS has estimated that approximately 825 square feet per employee currently exists in the Houston MSA. Based on 2016 data from PCensus and CDS/HGAC TAZs, 31.5% of CMA labor force growth estimates are in industrial employment. The space per employee of 825sf multiplied by 31.55% of the employees being in industrial or industrial support, annual demand for industrial facilities in the Market Area is 614,931 square feet through 2020. Currently 36.57% of total CMA industrial space is in the study area. CDS estimates that the study area could capture 250,892 square feet thru 2020 and an additional 81,791 thru 2025.

306
HOBBY AREA LIVABLE CENTER MARKET ASSESSMENT
45
Table 60: Future Industrial Demand
2015 2020 2025 2030 CMA Employment Projections 80,530 83,479 87,336 90,259 31.5% Labor Force/Industrial Jobs 25,367 26,296 27,511 28,432 5 Yr increase 929 1,215 921
825 SF per Job 766,371 1,002,338 759,615
Less: CMA pipeline space to 2020 -151,440
Total CMA Demand 614,931 1,002,338 759,615
Study Area 36.57% of CMA 250,892 408,954 309,923
Annual Study Area Demand 50,178 81,791 61,985 Sources: HGAC, CDS, PCensus for MapInfo
Conclusions and findings include the following:
According to commercial real estate brokers who specialize in the Houston industrial market and are familiar with the Hobby area, the study area has both opportunities and challenges. Currently, there is a very low vacancy rate due mostly to the lack of new supply. However, the area has some inherit benefits. It is located near major transportation corridors, including I-45, 610, and Beltway 8. It is also located near major industrial activity centers including the refinery activity to the south—but especially the port activity to the east in Pasadena and Baytown. The following are a list of observations including, including both challenges and opportunities:
The area contains a lot of smaller, free standing industrial buildings. This is different than other parts of Houston where large industrial multi-tenant complexes can be subdivided in ways to accommodate larger tenants. These smaller buildings on smaller lots make it challenging to welcome larger companies, but serve smaller companies very well.
New supply has been lacking in this area for multiple reasons. The perception of this area is that of higher-than-average crime rates; local roads are older, comparatively narrow, and occasionally in disrepair; and a lack of large undeveloped lots with challenges to new construction—such as flood plain restrictions and water retention requirements.
The Hobby area could be an area that can benefit from the increased port activity. A foreign trade zone (or other special taxing designation), alleviating restrictions, and additional transportation benefit may help to offset the current challenges.
Well-built public utilities are an essential element to successful industrial activity. Not only transportation, but also water, sewer and other utilities. Reportedly, some industrial development/redevelopment in this area has had challenges with meeting fire safety requirements related to sprinkler systems. Water lines did not have the flow capacity to handle sprinkler systems that met code. An on-site water storage tank had to be built for development to proceed. Not only would this have increased cost but it would have taken up valuable space. This reportedly made the projects in question not viable. Public utilities can be a difficult challenge to solve, but infrastructure improvements will be necessary if industrial reinvestment is to occur in this area on a large scale.
On that note, the level of industrial activity in the area has made other land uses take notice of the trucking traffic. There has been discussion about restricting traffic on local streets to benefit residential and retail land
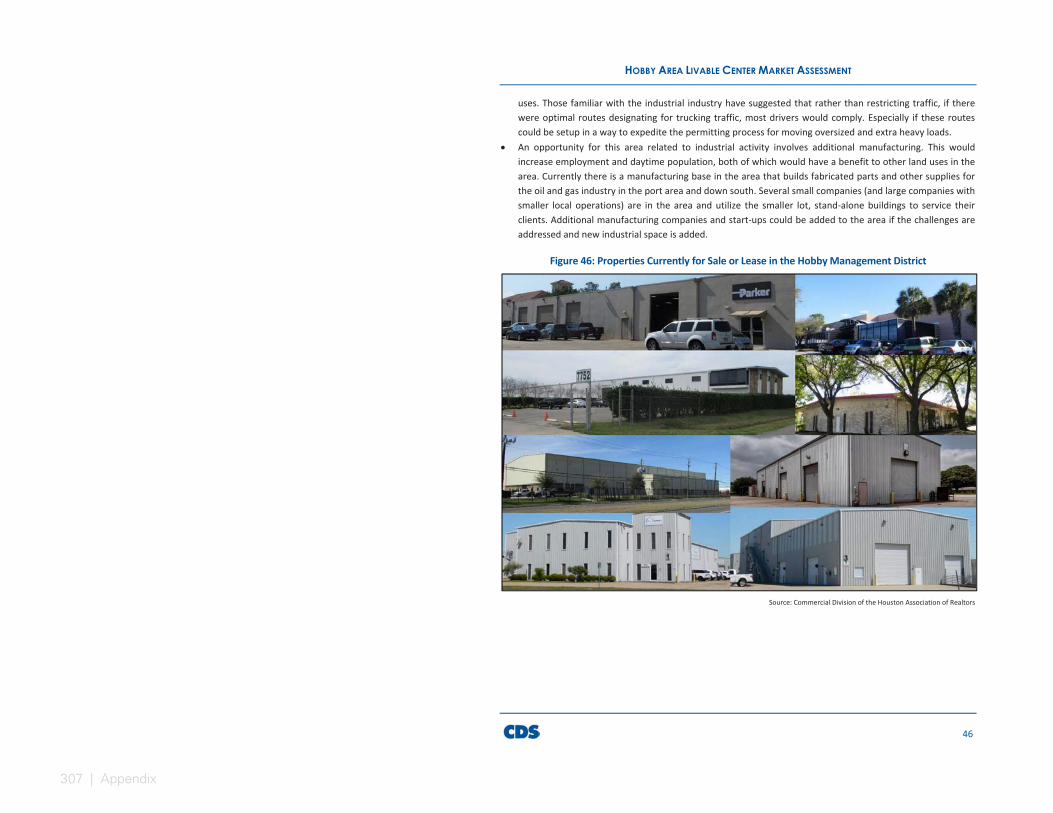
307 | Appendix
HOBBY AREA LIVABLE CENTER MARKET ASSESSMENT
46
uses. Those familiar with the industrial industry have suggested that rather than restricting traffic, if there were optimal routes designating for trucking traffic, most drivers would comply. Especially if these routes could be setup in a way to expedite the permitting process for moving oversized and extra heavy loads.
An opportunity for this area related to industrial activity involves additional manufacturing. This would increase employment and daytime population, both of which would have a benefit to other land uses in the area. Currently there is a manufacturing base in the area that builds fabricated parts and other supplies for the oil and gas industry in the port area and down south. Several small companies (and large companies with smaller local operations) are in the area and utilize the smaller lot, stand-alone buildings to service their clients. Additional manufacturing companies and start-ups could be added to the area if the challenges are addressed and new industrial space is added.
Figure 46: Properties Currently for Sale or Lease in the Hobby Management District
Source: Commercial Division of the Houston Association of Realtors
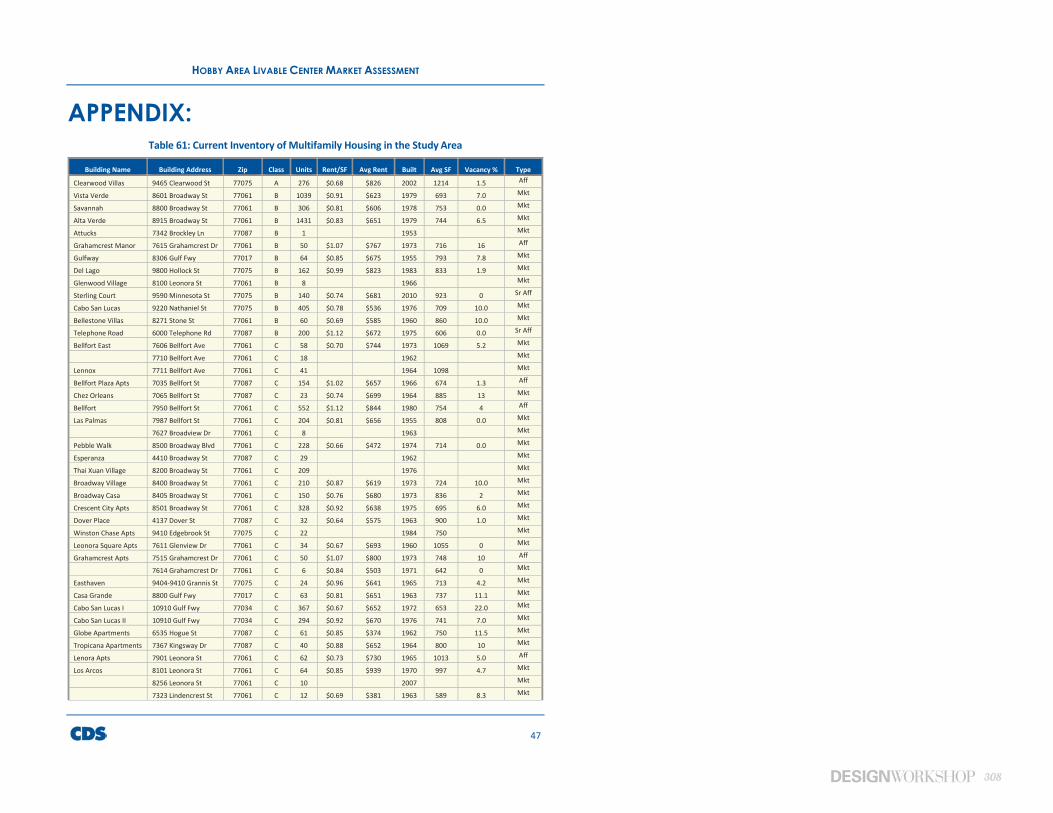
308
HOBBY AREA LIVABLE CENTER MARKET ASSESSMENT
47
APPENDIX:Table 61: Current Inventory of Multifamily Housing in the Study Area
Building Name Building Address Zip Class Units Rent/SF Avg Rent Built Avg SF Vacancy % Type
Clearwood Villas 9465 Clearwood St 77075 A 276 $0.68 $826 2002 1214 1.5 Aff
Vista Verde 8601 Broadway St 77061 B 1039 $0.91 $623 1979 693 7.0 Mkt
Savannah 8800 Broadway St 77061 B 306 $0.81 $606 1978 753 0.0 Mkt
Alta Verde 8915 Broadway St 77061 B 1431 $0.83 $651 1979 744 6.5 Mkt
Attucks 7342 Brockley Ln 77087 B 1 1953 Mkt
Grahamcrest Manor 7615 Grahamcrest Dr 77061 B 50 $1.07 $767 1973 716 16 Aff
Gulfway 8306 Gulf Fwy 77017 B 64 $0.85 $675 1955 793 7.8 Mkt
Del Lago 9800 Hollock St 77075 B 162 $0.99 $823 1983 833 1.9 Mkt
Glenwood Village 8100 Leonora St 77061 B 8 1966 Mkt
Sterling Court 9590 Minnesota St 77075 B 140 $0.74 $681 2010 923 0 Sr Aff
Cabo San Lucas 9220 Nathaniel St 77075 B 405 $0.78 $536 1976 709 10.0 Mkt
Bellestone Villas 8271 Stone St 77061 B 60 $0.69 $585 1960 860 10.0 Mkt
Telephone Road 6000 Telephone Rd 77087 B 200 $1.12 $672 1975 606 0.0 Sr Aff
Bellfort East 7606 Bellfort Ave 77061 C 58 $0.70 $744 1973 1069 5.2 Mkt
7710 Bellfort Ave 77061 C 18 1962 Mkt
Lennox 7711 Bellfort Ave 77061 C 41 1964 1098 Mkt
Bellfort Plaza Apts 7035 Bellfort St 77087 C 154 $1.02 $657 1966 674 1.3 Aff
Chez Orleans 7065 Bellfort St 77087 C 23 $0.74 $699 1964 885 13 Mkt
Bellfort 7950 Bellfort St 77061 C 552 $1.12 $844 1980 754 4 Aff
Las Palmas 7987 Bellfort St 77061 C 204 $0.81 $656 1955 808 0.0 Mkt
7627 Broadview Dr 77061 C 8 1963 Mkt
Pebble Walk 8500 Broadway Blvd 77061 C 228 $0.66 $472 1974 714 0.0 Mkt
Esperanza 4410 Broadway St 77087 C 29 1962 Mkt
Thai Xuan Village 8200 Broadway St 77061 C 209 1976 Mkt
Broadway Village 8400 Broadway St 77061 C 210 $0.87 $619 1973 724 10.0 Mkt
Broadway Casa 8405 Broadway St 77061 C 150 $0.76 $680 1973 836 2 Mkt
Crescent City Apts 8501 Broadway St 77061 C 328 $0.92 $638 1975 695 6.0 Mkt
Dover Place 4137 Dover St 77087 C 32 $0.64 $575 1963 900 1.0 Mkt
Winston Chase Apts 9410 Edgebrook St 77075 C 22 1984 750 Mkt
Leonora Square Apts 7611 Glenview Dr 77061 C 34 $0.67 $693 1960 1055 0 Mkt
Grahamcrest Apts 7515 Grahamcrest Dr 77061 C 50 $1.07 $800 1973 748 10 Aff
7614 Grahamcrest Dr 77061 C 6 $0.84 $503 1971 642 0 Mkt
Easthaven 9404-9410 Grannis St 77075 C 24 $0.96 $641 1965 713 4.2 Mkt
Casa Grande 8800 Gulf Fwy 77017 C 63 $0.81 $651 1963 737 11.1 Mkt
Cabo San Lucas I 10910 Gulf Fwy 77034 C 367 $0.67 $652 1972 653 22.0 Mkt
Cabo San Lucas II 10910 Gulf Fwy 77034 C 294 $0.92 $670 1976 741 7.0 Mkt
Globe Apartments 6535 Hogue St 77087 C 61 $0.85 $374 1962 750 11.5 Mkt
Tropicana Apartments 7367 Kingsway Dr 77087 C 40 $0.88 $652 1964 800 10 Mkt
Lenora Apts 7901 Leonora St 77061 C 62 $0.73 $730 1965 1013 5.0 Aff
Los Arcos 8101 Leonora St 77061 C 64 $0.85 $939 1970 997 4.7 Mkt
8256 Leonora St 77061 C 10 2007 Mkt
7323 Lindencrest St 77061 C 12 $0.69 $381 1963 589 8.3 Mkt
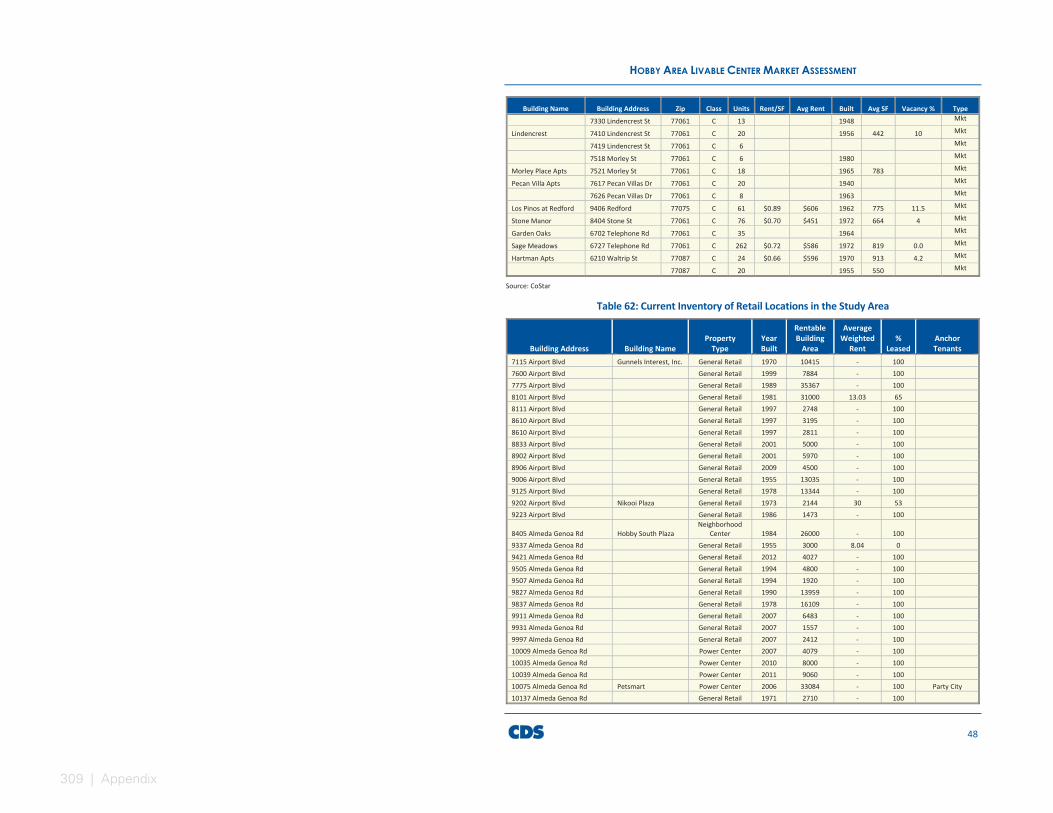
309 | Appendix
HOBBY AREA LIVABLE CENTER MARKET ASSESSMENT
48
Building Name Building Address Zip Class Units Rent/SF Avg Rent Built Avg SF Vacancy % Type 7330 Lindencrest St 77061 C 13 1948 Mkt
Lindencrest 7410 Lindencrest St 77061 C 20 1956 442 10 Mkt
7419 Lindencrest St 77061 C 6 Mkt
7518 Morley St 77061 C 6 1980 Mkt
Morley Place Apts 7521 Morley St 77061 C 18 1965 783 Mkt
Pecan Villa Apts 7617 Pecan Villas Dr 77061 C 20 1940 Mkt
7626 Pecan Villas Dr 77061 C 8 1963 Mkt
Los Pinos at Redford 9406 Redford 77075 C 61 $0.89 $606 1962 775 11.5 Mkt
Stone Manor 8404 Stone St 77061 C 76 $0.70 $451 1972 664 4 Mkt
Garden Oaks 6702 Telephone Rd 77061 C 35 1964 Mkt
Sage Meadows 6727 Telephone Rd 77061 C 262 $0.72 $586 1972 819 0.0 Mkt
Hartman Apts 6210 Waltrip St 77087 C 24 $0.66 $596 1970 913 4.2 Mkt
77087 C 20 1955 550 Mkt
Source: CoStar
Table 62: Current Inventory of Retail Locations in the Study Area
Building Address Building Name Property
Type Year Built
Rentable Building
Area
Average Weighted
Rent %
Leased Anchor Tenants
7115 Airport Blvd Gunnels Interest, Inc. General Retail 1970 10415 - 100 7600 Airport Blvd General Retail 1999 7884 - 100 7775 Airport Blvd General Retail 1989 35367 - 100 8101 Airport Blvd General Retail 1981 31000 13.03 65 8111 Airport Blvd General Retail 1997 2748 - 100 8610 Airport Blvd General Retail 1997 3195 - 100 8610 Airport Blvd General Retail 1997 2811 - 100 8833 Airport Blvd General Retail 2001 5000 - 100 8902 Airport Blvd General Retail 2001 5970 - 100 8906 Airport Blvd General Retail 2009 4500 - 100 9006 Airport Blvd General Retail 1955 13035 - 100 9125 Airport Blvd General Retail 1978 13344 - 100 9202 Airport Blvd Nikooi Plaza General Retail 1973 2144 30 53 9223 Airport Blvd General Retail 1986 1473 - 100
8405 Almeda Genoa Rd Hobby South Plaza Neighborhood
Center 1984 26000 - 100 9337 Almeda Genoa Rd General Retail 1955 3000 8.04 0 9421 Almeda Genoa Rd General Retail 2012 4027 - 100 9505 Almeda Genoa Rd General Retail 1994 4800 - 100 9507 Almeda Genoa Rd General Retail 1994 1920 - 100 9827 Almeda Genoa Rd General Retail 1990 13959 - 100 9837 Almeda Genoa Rd General Retail 1978 16109 - 100 9911 Almeda Genoa Rd General Retail 2007 6483 - 100 9931 Almeda Genoa Rd General Retail 2007 1557 - 100 9997 Almeda Genoa Rd General Retail 2007 2412 - 100 10009 Almeda Genoa Rd Power Center 2007 4079 - 100 10035 Almeda Genoa Rd Power Center 2010 8000 - 100 10039 Almeda Genoa Rd Power Center 2011 9060 - 100 10075 Almeda Genoa Rd Petsmart Power Center 2006 33084 - 100 Party City 10137 Almeda Genoa Rd General Retail 1971 2710 - 100
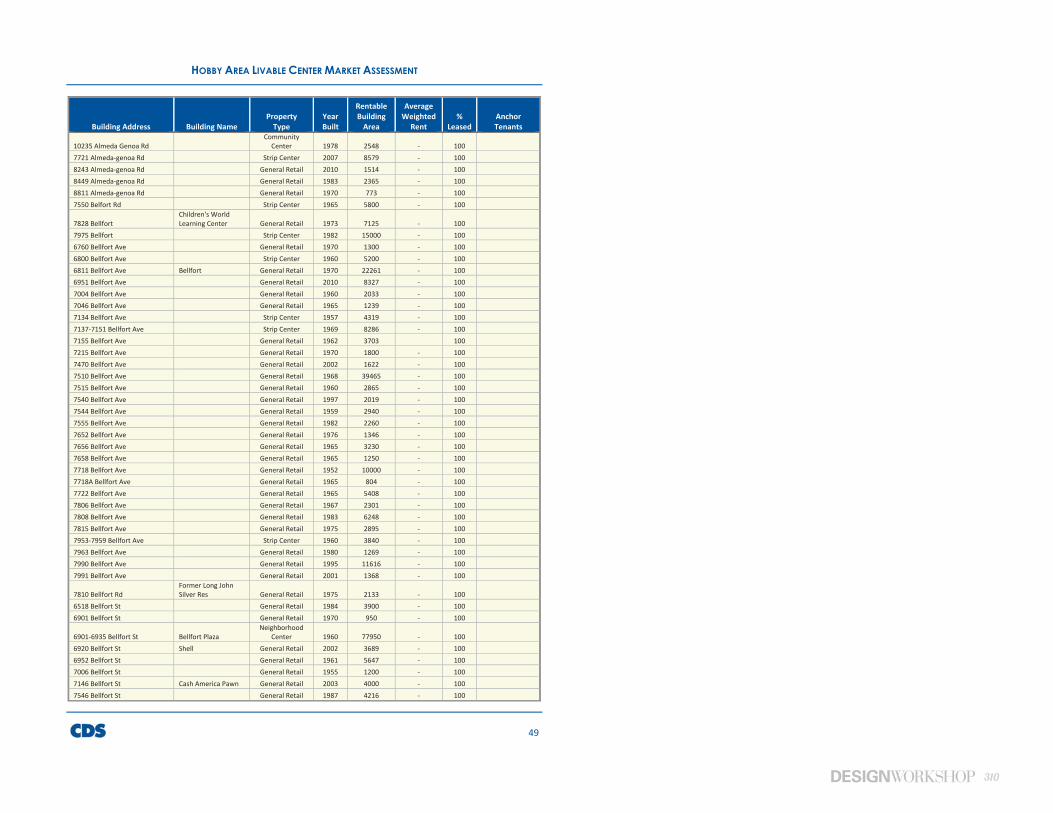
310
HOBBY AREA LIVABLE CENTER MARKET ASSESSMENT
49
Building Address Building Name Property
Type Year Built
Rentable Building
Area
Average Weighted
Rent %
Leased Anchor Tenants
10235 Almeda Genoa Rd Community
Center 1978 2548 - 100 7721 Almeda-genoa Rd Strip Center 2007 8579 - 100 8243 Almeda-genoa Rd General Retail 2010 1514 - 100 8449 Almeda-genoa Rd General Retail 1983 2365 - 100 8811 Almeda-genoa Rd General Retail 1970 773 - 100 7550 Belfort Rd Strip Center 1965 5800 - 100
7828 Bellfort Children's World Learning Center General Retail 1973 7125 - 100
7975 Bellfort Strip Center 1982 15000 - 100 6760 Bellfort Ave General Retail 1970 1300 - 100 6800 Bellfort Ave Strip Center 1960 5200 - 100 6811 Bellfort Ave Bellfort General Retail 1970 22261 - 100 6951 Bellfort Ave General Retail 2010 8327 - 100 7004 Bellfort Ave General Retail 1960 2033 - 100 7046 Bellfort Ave General Retail 1965 1239 - 100 7134 Bellfort Ave Strip Center 1957 4319 - 100 7137-7151 Bellfort Ave Strip Center 1969 8286 - 100 7155 Bellfort Ave General Retail 1962 3703 100 7215 Bellfort Ave General Retail 1970 1800 - 100 7470 Bellfort Ave General Retail 2002 1622 - 100 7510 Bellfort Ave General Retail 1968 39465 - 100 7515 Bellfort Ave General Retail 1960 2865 - 100 7540 Bellfort Ave General Retail 1997 2019 - 100 7544 Bellfort Ave General Retail 1959 2940 - 100 7555 Bellfort Ave General Retail 1982 2260 - 100 7652 Bellfort Ave General Retail 1976 1346 - 100 7656 Bellfort Ave General Retail 1965 3230 - 100 7658 Bellfort Ave General Retail 1965 1250 - 100 7718 Bellfort Ave General Retail 1952 10000 - 100 7718A Bellfort Ave General Retail 1965 804 - 100 7722 Bellfort Ave General Retail 1965 5408 - 100 7806 Bellfort Ave General Retail 1967 2301 - 100 7808 Bellfort Ave General Retail 1983 6248 - 100 7815 Bellfort Ave General Retail 1975 2895 - 100 7953-7959 Bellfort Ave Strip Center 1960 3840 - 100 7963 Bellfort Ave General Retail 1980 1269 - 100 7990 Bellfort Ave General Retail 1995 11616 - 100 7991 Bellfort Ave General Retail 2001 1368 - 100
7810 Bellfort Rd Former Long John Silver Res General Retail 1975 2133 - 100
6518 Bellfort St General Retail 1984 3900 - 100 6901 Bellfort St General Retail 1970 950 - 100
6901-6935 Bellfort St Bellfort Plaza Neighborhood
Center 1960 77950 - 100 6920 Bellfort St Shell General Retail 2002 3689 - 100 6952 Bellfort St General Retail 1961 5647 - 100 7006 Bellfort St General Retail 1955 1200 - 100 7146 Bellfort St Cash America Pawn General Retail 2003 4000 - 100 7546 Bellfort St General Retail 1987 4216 - 100

311 | Appendix
HOBBY AREA LIVABLE CENTER MARKET ASSESSMENT
50
Building Address Building Name Property
Type Year Built
Rentable Building
Area
Average Weighted
Rent %
Leased Anchor Tenants
7640 Bellfort St General Retail 1967 5120 - 100
7700 Bellfort St Lexington Square Shopping Center Strip Center 1962 2900 - 100
7721 Bellfort St Strip Center 1963 7500 - 100 7773 Bellfort St General Retail 1970 4100 - 100
7975 Bellfort St Hobby Bellfort Center
Neighborhood Center 1982 31800 - 100
7990 Bellfort St Pep Boys General Retail 1995 11616 - 100 7994 W Bellfort St General Retail 1998 26325 - 100 Broadway @ Broadway & Bellfort
Park-Way Service Center Strip Center 1966 7000 - 100
8234 Broadway CVS Pharmacy General Retail 2002 12036 - 100
4136 Broadway St Crespo Funeral Home General Retail 1967 17444 - 100
8133 Broadway St General Retail 1975 4488 - 100
8201-8235 Broadway St Neighborhood
Center 1971 74942 - 100 Fallas Paredes, Family Dollar
8235 Broadway St General Retail 1969 2707 - 100 8300-8326 Broadway St Strip Center 1977 28292 - 100 8301 Broadway St Walgreens General Retail 1999 14060 - 100 8325 Broadway St General Retail 1998 5816 - 100 8330 Broadway St General Retail 2008 18125 - 100 8331 Broadway St Popeyes General Retail 1975 1701 - 100 8385 Broadway St General Retail 1970 7441 - 100 8540-8548 Broadway St EZ Pawn Broadway Strip Center 1972 6400 16.2 61 8600-8602 Broadway St Strip Center 1987 7176 - 100 8800 1/2 Broadway St General Retail 1975 5801 - 100 9333 Bryant St General Retail 56711 - 100 8920 Clearwood Dr General Retail 1999 3724 - 100 8927 Clearwood Dr General Retail 1987 2631 - 100 9020 Clearwood Dr O'Reilly Auto Parts General Retail 2011 8870 - 100 9220 Clearwood Dr General Retail 2002 6500 - 100 8925 Clearwood St General Retail 2000 2908 - 100 9010 Clearwood St General Retail 2011 8983 - 100 9220 Clearwood St General Retail 2002 6175 - 100 9430 Clearwood St Clearwood Plaza Strip Center 16600 - 100 9660 Clearwood St General Retail 2012 2102 - 100 9042 Dexter St General Retail 1970 4800 - 100
6500-6502 Dixie Dr Former Richey's Country Cookin' General Retail 1973 8000 - 100
7565 Drouet St General Retail 1976 2673 100 7607 Drouet St General Retail 1730 - 100 9607 Easthaven Blvd General Retail 2002 4893 - 100 8627 Glenvista St General Retail 1970 2400 - 100 8160 Gulf Fwy General Retail 1960 2340 - 100 8202 Gulf Fwy General Retail 1965 4286 - 100 8222 Gulf Fwy General Retail 1965 4481 - 100 8226 Gulf Fwy General Retail 1961 4750 - 100
8310-8338 Gulf Fwy Gulfway Plaza Neighborhood
Center 1967 56302 - 100 8320 Gulf Fwy General Retail 1967 56302 - 100
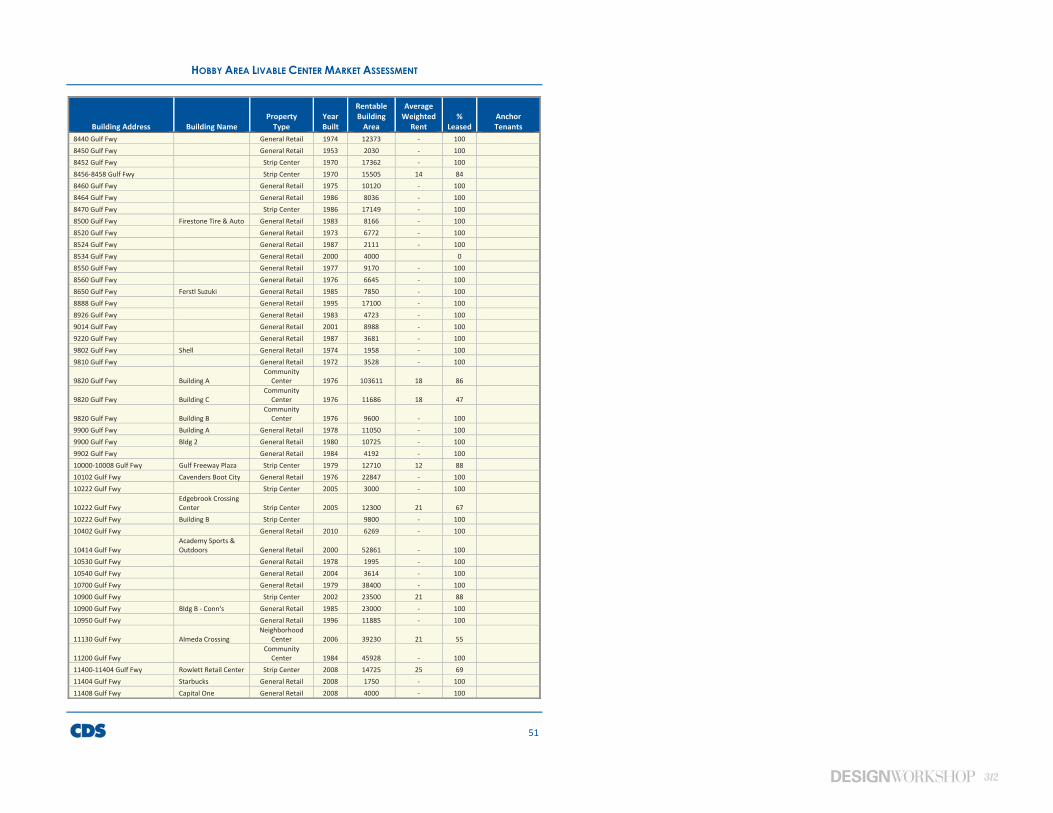
312
HOBBY AREA LIVABLE CENTER MARKET ASSESSMENT
51
Building Address Building Name Property
Type Year Built
Rentable Building
Area
Average Weighted
Rent %
Leased Anchor Tenants
8440 Gulf Fwy General Retail 1974 12373 - 100 8450 Gulf Fwy General Retail 1953 2030 - 100 8452 Gulf Fwy Strip Center 1970 17362 - 100 8456-8458 Gulf Fwy Strip Center 1970 15505 14 84 8460 Gulf Fwy General Retail 1975 10120 - 100 8464 Gulf Fwy General Retail 1986 8036 - 100 8470 Gulf Fwy Strip Center 1986 17149 - 100 8500 Gulf Fwy Firestone Tire & Auto General Retail 1983 8166 - 100 8520 Gulf Fwy General Retail 1973 6772 - 100 8524 Gulf Fwy General Retail 1987 2111 - 100 8534 Gulf Fwy General Retail 2000 4000 0 8550 Gulf Fwy General Retail 1977 9170 - 100 8560 Gulf Fwy General Retail 1976 6645 - 100 8650 Gulf Fwy Ferstl Suzuki General Retail 1985 7850 - 100 8888 Gulf Fwy General Retail 1995 17100 - 100 8926 Gulf Fwy General Retail 1983 4723 - 100 9014 Gulf Fwy General Retail 2001 8988 - 100 9220 Gulf Fwy General Retail 1987 3681 - 100 9802 Gulf Fwy Shell General Retail 1974 1958 - 100 9810 Gulf Fwy General Retail 1972 3528 - 100
9820 Gulf Fwy Building A Community
Center 1976 103611 18 86
9820 Gulf Fwy Building C Community
Center 1976 11686 18 47
9820 Gulf Fwy Building B Community
Center 1976 9600 - 100 9900 Gulf Fwy Building A General Retail 1978 11050 - 100 9900 Gulf Fwy Bldg 2 General Retail 1980 10725 - 100 9902 Gulf Fwy General Retail 1984 4192 - 100 10000-10008 Gulf Fwy Gulf Freeway Plaza Strip Center 1979 12710 12 88 10102 Gulf Fwy Cavenders Boot City General Retail 1976 22847 - 100 10222 Gulf Fwy Strip Center 2005 3000 - 100
10222 Gulf Fwy Edgebrook Crossing Center Strip Center 2005 12300 21 67
10222 Gulf Fwy Building B Strip Center 9800 - 100 10402 Gulf Fwy General Retail 2010 6269 - 100
10414 Gulf Fwy Academy Sports & Outdoors General Retail 2000 52861 - 100
10530 Gulf Fwy General Retail 1978 1995 - 100 10540 Gulf Fwy General Retail 2004 3614 - 100 10700 Gulf Fwy General Retail 1979 38400 - 100 10900 Gulf Fwy Strip Center 2002 23500 21 88 10900 Gulf Fwy Bldg B - Conn's General Retail 1985 23000 - 100 10950 Gulf Fwy General Retail 1996 11885 - 100
11130 Gulf Fwy Almeda Crossing Neighborhood
Center 2006 39230 21 55
11200 Gulf Fwy Community
Center 1984 45928 - 100 11400-11404 Gulf Fwy Rowlett Retail Center Strip Center 2008 14725 25 69 11404 Gulf Fwy Starbucks General Retail 2008 1750 - 100 11408 Gulf Fwy Capital One General Retail 2008 4000 - 100
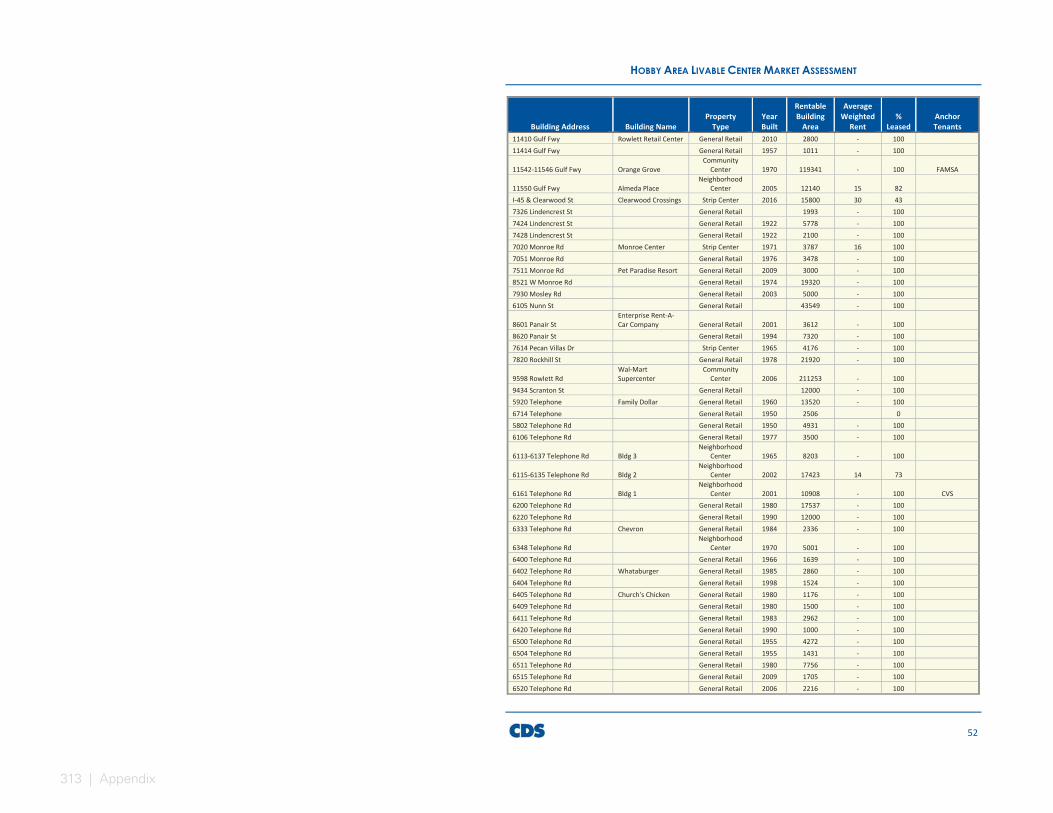
313 | Appendix
HOBBY AREA LIVABLE CENTER MARKET ASSESSMENT
52
Building Address Building Name Property
Type Year Built
Rentable Building
Area
Average Weighted
Rent %
Leased Anchor Tenants
11410 Gulf Fwy Rowlett Retail Center General Retail 2010 2800 - 100 11414 Gulf Fwy General Retail 1957 1011 - 100
11542-11546 Gulf Fwy Orange Grove Community
Center 1970 119341 - 100 FAMSA
11550 Gulf Fwy Almeda Place Neighborhood
Center 2005 12140 15 82 I-45 & Clearwood St Clearwood Crossings Strip Center 2016 15800 30 43 7326 Lindencrest St General Retail 1993 - 100 7424 Lindencrest St General Retail 1922 5778 - 100 7428 Lindencrest St General Retail 1922 2100 - 100 7020 Monroe Rd Monroe Center Strip Center 1971 3787 16 100 7051 Monroe Rd General Retail 1976 3478 - 100 7511 Monroe Rd Pet Paradise Resort General Retail 2009 3000 - 100 8521 W Monroe Rd General Retail 1974 19320 - 100 7930 Mosley Rd General Retail 2003 5000 - 100 6105 Nunn St General Retail 43549 - 100
8601 Panair St Enterprise Rent-A-Car Company General Retail 2001 3612 - 100
8620 Panair St General Retail 1994 7320 - 100 7614 Pecan Villas Dr Strip Center 1965 4176 - 100 7820 Rockhill St General Retail 1978 21920 - 100
9598 Rowlett Rd Wal-Mart Supercenter
Community Center 2006 211253 - 100
9434 Scranton St General Retail 12000 - 100 5920 Telephone Family Dollar General Retail 1960 13520 - 100 6714 Telephone General Retail 1950 2506 0 5802 Telephone Rd General Retail 1950 4931 - 100 6106 Telephone Rd General Retail 1977 3500 - 100
6113-6137 Telephone Rd Bldg 3 Neighborhood
Center 1965 8203 - 100
6115-6135 Telephone Rd Bldg 2 Neighborhood
Center 2002 17423 14 73
6161 Telephone Rd Bldg 1 Neighborhood
Center 2001 10908 - 100 CVS 6200 Telephone Rd General Retail 1980 17537 - 100 6220 Telephone Rd General Retail 1990 12000 - 100 6333 Telephone Rd Chevron General Retail 1984 2336 - 100
6348 Telephone Rd Neighborhood
Center 1970 5001 - 100 6400 Telephone Rd General Retail 1966 1639 - 100 6402 Telephone Rd Whataburger General Retail 1985 2860 - 100 6404 Telephone Rd General Retail 1998 1524 - 100 6405 Telephone Rd Church's Chicken General Retail 1980 1176 - 100 6409 Telephone Rd General Retail 1980 1500 - 100 6411 Telephone Rd General Retail 1983 2962 - 100 6420 Telephone Rd General Retail 1990 1000 - 100 6500 Telephone Rd General Retail 1955 4272 - 100 6504 Telephone Rd General Retail 1955 1431 - 100 6511 Telephone Rd General Retail 1980 7756 - 100 6515 Telephone Rd General Retail 2009 1705 - 100 6520 Telephone Rd General Retail 2006 2216 - 100
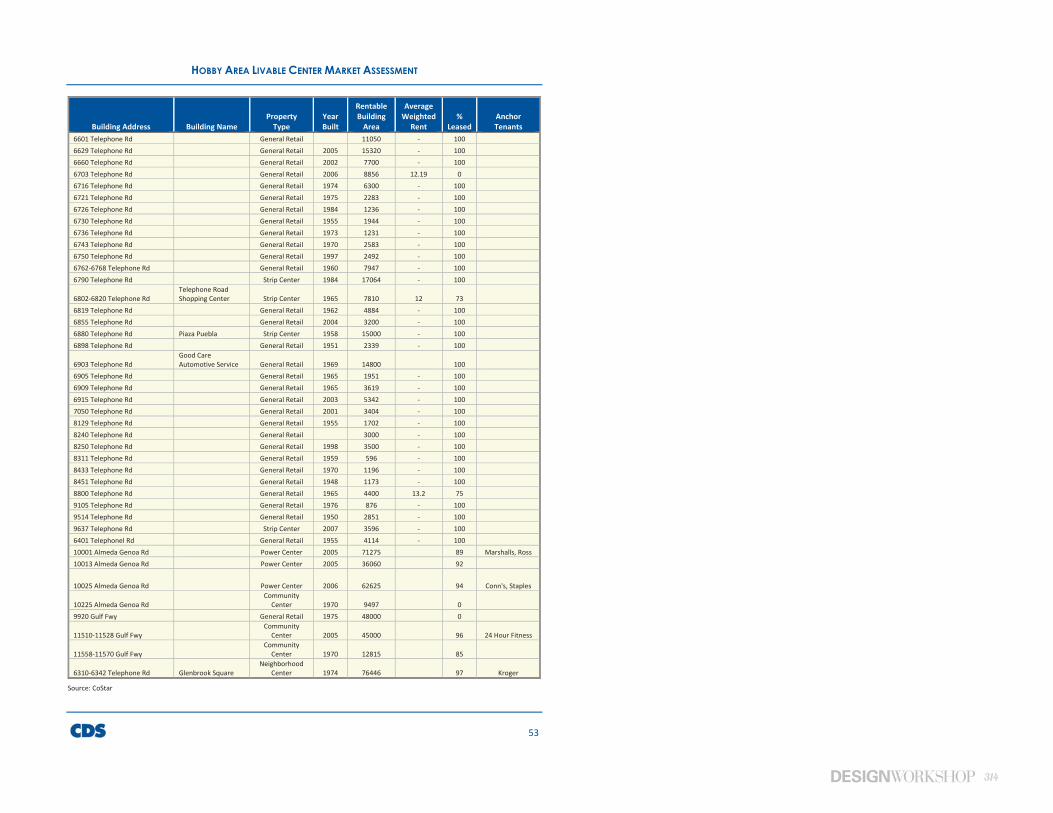
314
HOBBY AREA LIVABLE CENTER MARKET ASSESSMENT
53
Building Address Building Name Property
Type Year Built
Rentable Building
Area
Average Weighted
Rent %
Leased Anchor Tenants
6601 Telephone Rd General Retail 11050 - 100 6629 Telephone Rd General Retail 2005 15320 - 100 6660 Telephone Rd General Retail 2002 7700 - 100 6703 Telephone Rd General Retail 2006 8856 12.19 0 6716 Telephone Rd General Retail 1974 6300 - 100 6721 Telephone Rd General Retail 1975 2283 - 100 6726 Telephone Rd General Retail 1984 1236 - 100 6730 Telephone Rd General Retail 1955 1944 - 100 6736 Telephone Rd General Retail 1973 1231 - 100 6743 Telephone Rd General Retail 1970 2583 - 100 6750 Telephone Rd General Retail 1997 2492 - 100 6762-6768 Telephone Rd General Retail 1960 7947 - 100 6790 Telephone Rd Strip Center 1984 17064 - 100
6802-6820 Telephone Rd Telephone Road Shopping Center Strip Center 1965 7810 12 73
6819 Telephone Rd General Retail 1962 4884 - 100 6855 Telephone Rd General Retail 2004 3200 - 100 6880 Telephone Rd Piaza Puebla Strip Center 1958 15000 - 100 6898 Telephone Rd General Retail 1951 2339 - 100
6903 Telephone Rd Good Care Automotive Service General Retail 1969 14800 100
6905 Telephone Rd General Retail 1965 1951 - 100 6909 Telephone Rd General Retail 1965 3619 - 100 6915 Telephone Rd General Retail 2003 5342 - 100 7050 Telephone Rd General Retail 2001 3404 - 100 8129 Telephone Rd General Retail 1955 1702 - 100 8240 Telephone Rd General Retail 3000 - 100 8250 Telephone Rd General Retail 1998 3500 - 100 8311 Telephone Rd General Retail 1959 596 - 100 8433 Telephone Rd General Retail 1970 1196 - 100 8451 Telephone Rd General Retail 1948 1173 - 100 8800 Telephone Rd General Retail 1965 4400 13.2 75 9105 Telephone Rd General Retail 1976 876 - 100 9514 Telephone Rd General Retail 1950 2851 - 100 9637 Telephone Rd Strip Center 2007 3596 - 100 6401 Telephonel Rd General Retail 1955 4114 - 100 10001 Almeda Genoa Rd Power Center 2005 71275 89 Marshalls, Ross 10013 Almeda Genoa Rd Power Center 2005 36060 92
10025 Almeda Genoa Rd Power Center 2006 62625 94 Conn's, Staples
10225 Almeda Genoa Rd Community
Center 1970 9497 0 9920 Gulf Fwy General Retail 1975 48000 0
11510-11528 Gulf Fwy Community
Center 2005 45000 96 24 Hour Fitness
11558-11570 Gulf Fwy Community
Center 1970 12815 85
6310-6342 Telephone Rd Glenbrook Square Neighborhood
Center 1974 76446 97 Kroger
Source: CoStar
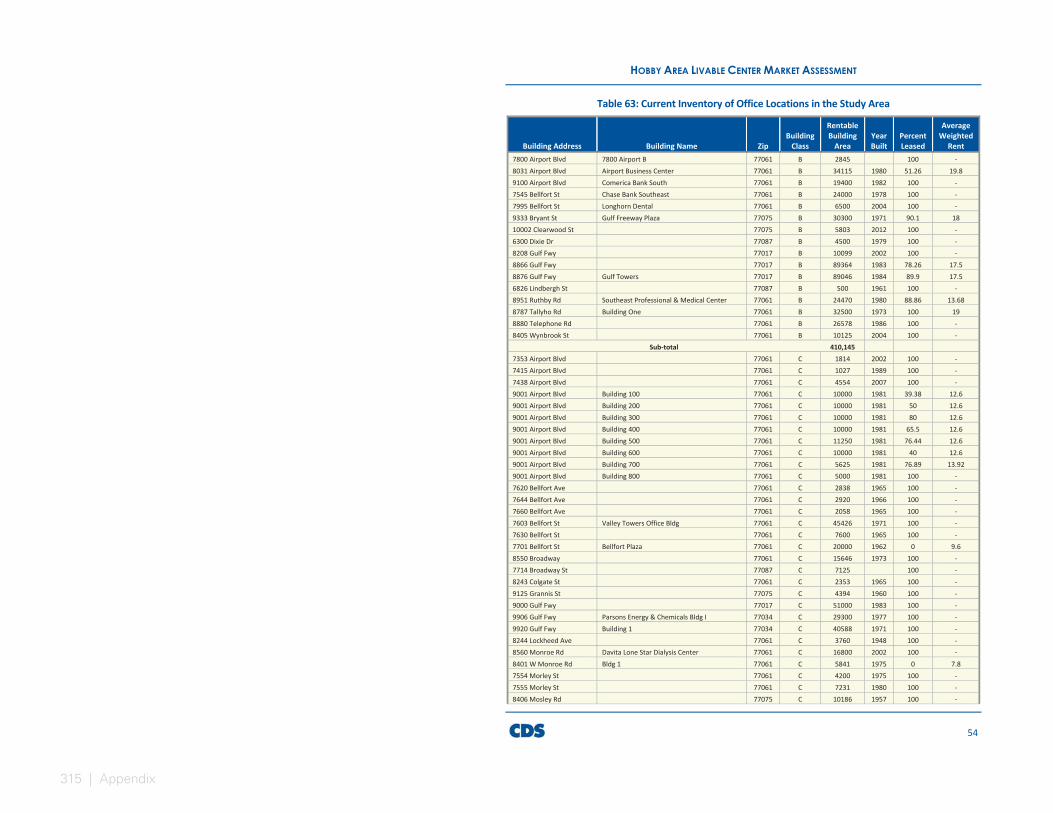
315 | Appendix
HOBBY AREA LIVABLE CENTER MARKET ASSESSMENT
54
Table 63: Current Inventory of Office Locations in the Study Area
Building Address Building Name Zip Building
Class
Rentable Building
Area Year Built
Percent Leased
Average Weighted
Rent 7800 Airport Blvd 7800 Airport B 77061 B 2845 100 - 8031 Airport Blvd Airport Business Center 77061 B 34115 1980 51.26 19.8 9100 Airport Blvd Comerica Bank South 77061 B 19400 1982 100 - 7545 Bellfort St Chase Bank Southeast 77061 B 24000 1978 100 - 7995 Bellfort St Longhorn Dental 77061 B 6500 2004 100 - 9333 Bryant St Gulf Freeway Plaza 77075 B 30300 1971 90.1 18 10002 Clearwood St 77075 B 5803 2012 100 - 6300 Dixie Dr 77087 B 4500 1979 100 - 8208 Gulf Fwy 77017 B 10099 2002 100 - 8866 Gulf Fwy 77017 B 89364 1983 78.26 17.5 8876 Gulf Fwy Gulf Towers 77017 B 89046 1984 89.9 17.5 6826 Lindbergh St 77087 B 500 1961 100 - 8951 Ruthby Rd Southeast Professional & Medical Center 77061 B 24470 1980 88.86 13.68 8787 Tallyho Rd Building One 77061 B 32500 1973 100 19 8880 Telephone Rd 77061 B 26578 1986 100 - 8405 Wynbrook St 77061 B 10125 2004 100 -
Sub-total 410,145 7353 Airport Blvd 77061 C 1814 2002 100 - 7415 Airport Blvd 77061 C 1027 1989 100 - 7438 Airport Blvd 77061 C 4554 2007 100 - 9001 Airport Blvd Building 100 77061 C 10000 1981 39.38 12.6 9001 Airport Blvd Building 200 77061 C 10000 1981 50 12.6 9001 Airport Blvd Building 300 77061 C 10000 1981 80 12.6 9001 Airport Blvd Building 400 77061 C 10000 1981 65.5 12.6 9001 Airport Blvd Building 500 77061 C 11250 1981 76.44 12.6 9001 Airport Blvd Building 600 77061 C 10000 1981 40 12.6 9001 Airport Blvd Building 700 77061 C 5625 1981 76.89 13.92 9001 Airport Blvd Building 800 77061 C 5000 1981 100 - 7620 Bellfort Ave 77061 C 2838 1965 100 - 7644 Bellfort Ave 77061 C 2920 1966 100 - 7660 Bellfort Ave 77061 C 2058 1965 100 - 7603 Bellfort St Valley Towers Office Bldg 77061 C 45426 1971 100 - 7630 Bellfort St 77061 C 7600 1965 100 - 7701 Bellfort St Bellfort Plaza 77061 C 20000 1962 0 9.6 8550 Broadway 77061 C 15646 1973 100 - 7714 Broadway St 77087 C 7125 100 - 8243 Colgate St 77061 C 2353 1965 100 - 9125 Grannis St 77075 C 4394 1960 100 - 9000 Gulf Fwy 77017 C 51000 1983 100 - 9906 Gulf Fwy Parsons Energy & Chemicals Bldg I 77034 C 29300 1977 100 - 9920 Gulf Fwy Building 1 77034 C 40588 1971 100 - 8244 Lockheed Ave 77061 C 3760 1948 100 - 8560 Monroe Rd Davita Lone Star Dialysis Center 77061 C 16800 2002 100 - 8401 W Monroe Rd Bldg 1 77061 C 5841 1975 0 7.8 7554 Morley St 77061 C 4200 1975 100 - 7555 Morley St 77061 C 7231 1980 100 - 8406 Mosley Rd 77075 C 10186 1957 100 -
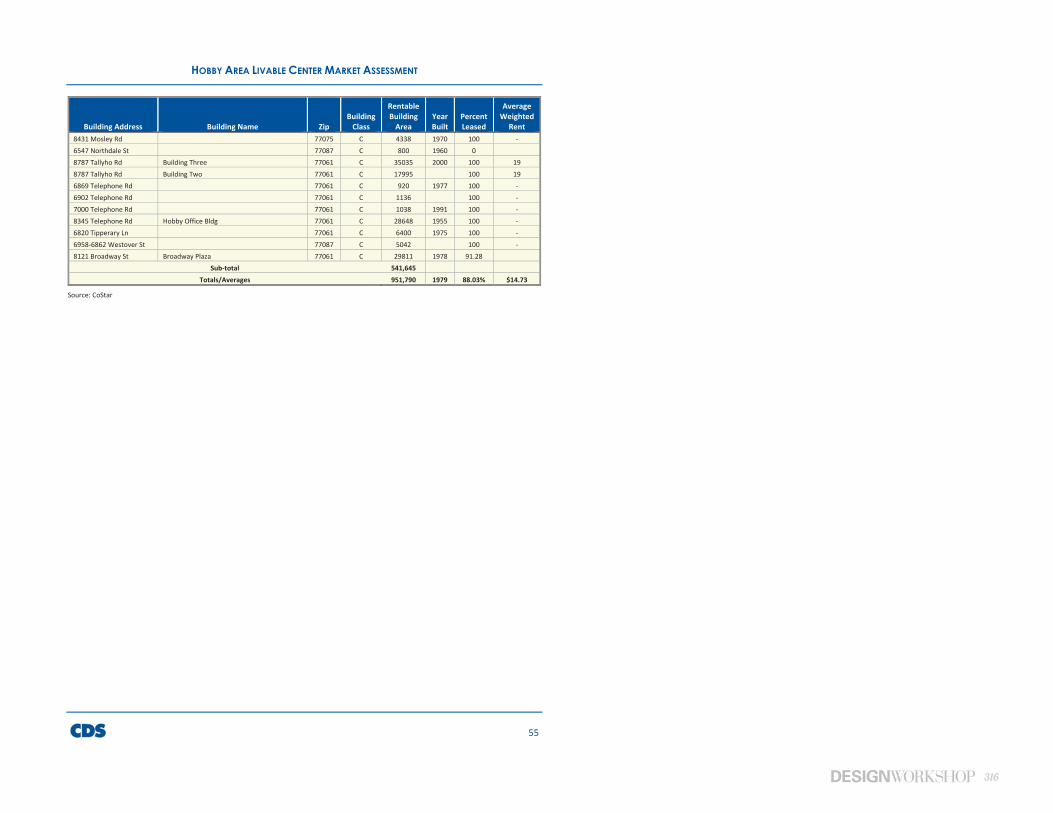
316
HOBBY AREA LIVABLE CENTER MARKET ASSESSMENT
55
Building Address Building Name Zip Building
Class
Rentable Building
Area Year Built
Percent Leased
Average Weighted
Rent 8431 Mosley Rd 77075 C 4338 1970 100 - 6547 Northdale St 77087 C 800 1960 0 8787 Tallyho Rd Building Three 77061 C 35035 2000 100 19 8787 Tallyho Rd Building Two 77061 C 17995 100 19 6869 Telephone Rd 77061 C 920 1977 100 - 6902 Telephone Rd 77061 C 1136 100 - 7000 Telephone Rd 77061 C 1038 1991 100 - 8345 Telephone Rd Hobby Office Bldg 77061 C 28648 1955 100 - 6820 Tipperary Ln 77061 C 6400 1975 100 - 6958-6862 Westover St 77087 C 5042 100 - 8121 Broadway St Broadway Plaza 77061 C 29811 1978 91.28
Sub-total 541,645 Totals/Averages 951,790 1979 88.03% $14.73
Source: CoStar
317 | Appendix
HOBBY AREA LIVABLE CENTER MARKET ASSESSMENT
56
CDS Community Development Strategies 1001 S. Dairy Ashford, Suite 450
Houston, TX 77077
281-582-0855
www.cdsmr.com

318
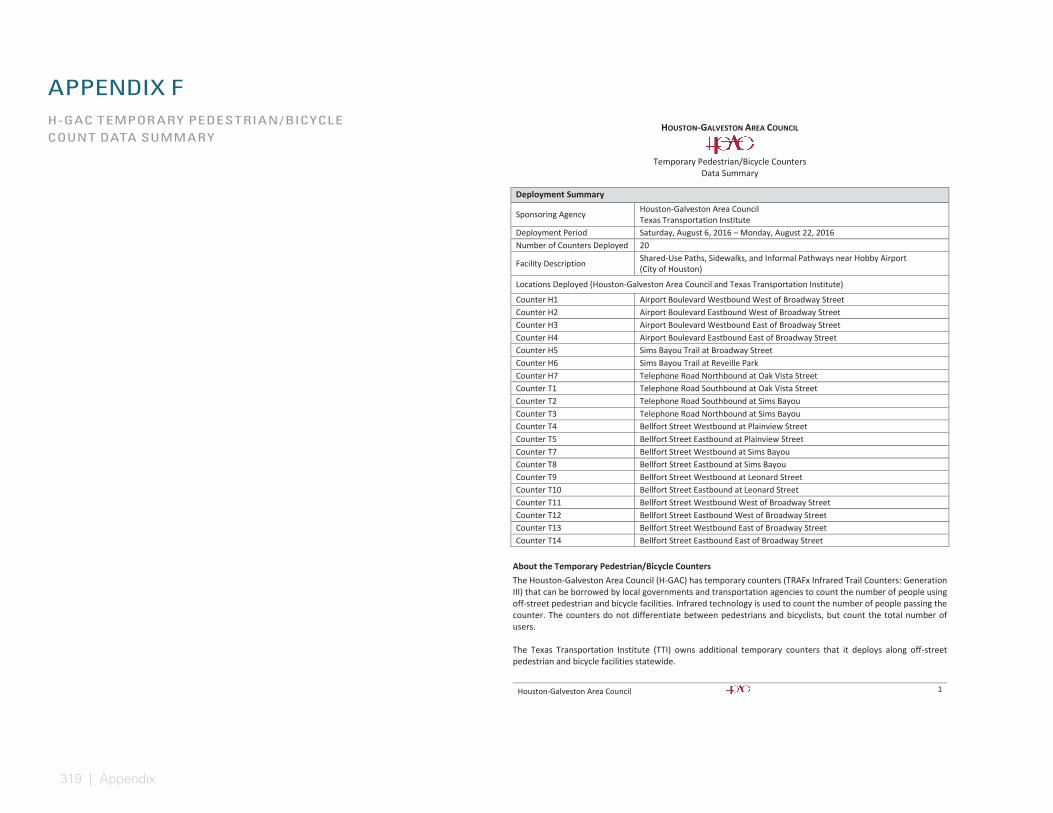
319 | Appendix
Houston-Galveston Area Council 1
HOUSTON-GALVESTON AREA COUNCIL
Temporary Pedestrian/Bicycle Counters
Data Summary
Deployment Summary
Sponsoring Agency Houston-Galveston Area Council Texas Transportation Institute
Deployment Period Saturday, August 6, 2016 – Monday, August 22, 2016 Number of Counters Deployed 20
Facility Description Shared-Use Paths, Sidewalks, and Informal Pathways near Hobby Airport (City of Houston)
Locations Deployed (Houston-Galveston Area Council and Texas Transportation Institute)
Counter H1 Airport Boulevard Westbound West of Broadway Street Counter H2 Airport Boulevard Eastbound West of Broadway Street Counter H3 Airport Boulevard Westbound East of Broadway Street Counter H4 Airport Boulevard Eastbound East of Broadway Street Counter H5 Sims Bayou Trail at Broadway Street Counter H6 Sims Bayou Trail at Reveille Park Counter H7 Telephone Road Northbound at Oak Vista Street Counter T1 Telephone Road Southbound at Oak Vista Street Counter T2 Telephone Road Southbound at Sims Bayou Counter T3 Telephone Road Northbound at Sims Bayou Counter T4 Bellfort Street Westbound at Plainview Street Counter T5 Bellfort Street Eastbound at Plainview Street Counter T7 Bellfort Street Westbound at Sims Bayou Counter T8 Bellfort Street Eastbound at Sims Bayou Counter T9 Bellfort Street Westbound at Leonard Street Counter T10 Bellfort Street Eastbound at Leonard Street Counter T11 Bellfort Street Westbound West of Broadway Street Counter T12 Bellfort Street Eastbound West of Broadway Street Counter T13 Bellfort Street Westbound East of Broadway Street Counter T14 Bellfort Street Eastbound East of Broadway Street
About the Temporary Pedestrian/Bicycle Counters The Houston-Galveston Area Council (H-GAC) has temporary counters (TRAFx Infrared Trail Counters: Generation III) that can be borrowed by local governments and transportation agencies to count the number of people using off-street pedestrian and bicycle facilities. Infrared technology is used to count the number of people passing the counter. The counters do not differentiate between pedestrians and bicyclists, but count the total number of users. The Texas Transportation Institute (TTI) owns additional temporary counters that it deploys along off-street pedestrian and bicycle facilities statewide.
H-GAC TEMPOR ARY PEDESTRIAN /BICYCLE COUNT DATA SUMMARY
APPENDIX F
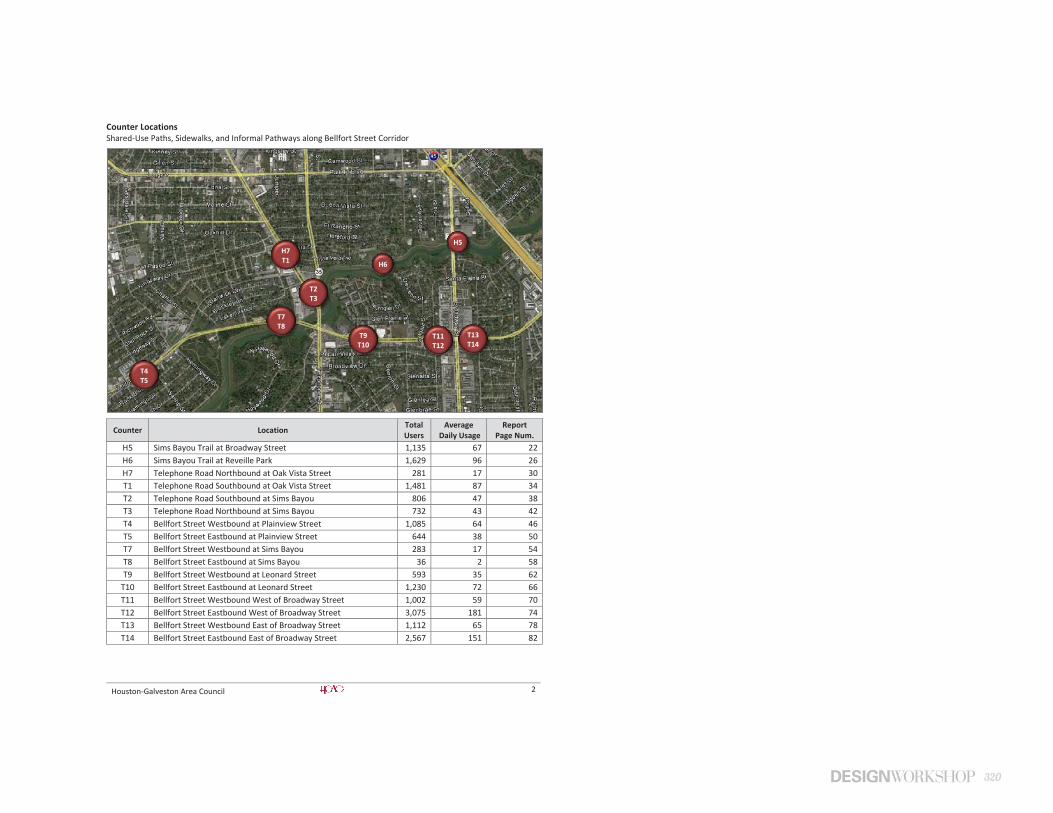
320
Houston-Galveston Area Council 2
Counter Locations Shared-Use Paths, Sidewalks, and Informal Pathways along Bellfort Street Corridor
Counter Location Total Users
Average Daily Usage
Report Page Num.
H5 Sims Bayou Trail at Broadway Street 1,135 67 22 H6 Sims Bayou Trail at Reveille Park 1,629 96 26 H7 Telephone Road Northbound at Oak Vista Street 281 17 30 T1 Telephone Road Southbound at Oak Vista Street 1,481 87 34 T2 Telephone Road Southbound at Sims Bayou 806 47 38 T3 Telephone Road Northbound at Sims Bayou 732 43 42 T4 Bellfort Street Westbound at Plainview Street 1,085 64 46 T5 Bellfort Street Eastbound at Plainview Street 644 38 50 T7 Bellfort Street Westbound at Sims Bayou 283 17 54 T8 Bellfort Street Eastbound at Sims Bayou 36 2 58 T9 Bellfort Street Westbound at Leonard Street 593 35 62
T10 Bellfort Street Eastbound at Leonard Street 1,230 72 66 T11 Bellfort Street Westbound West of Broadway Street 1,002 59 70 T12 Bellfort Street Eastbound West of Broadway Street 3,075 181 74 T13 Bellfort Street Westbound East of Broadway Street 1,112 65 78 T14 Bellfort Street Eastbound East of Broadway Street 2,567 151 82
H7 T1
T7 T8
H5
T4 T5
H6
T2 T3
T11 T12
T13 T14
T9 T10
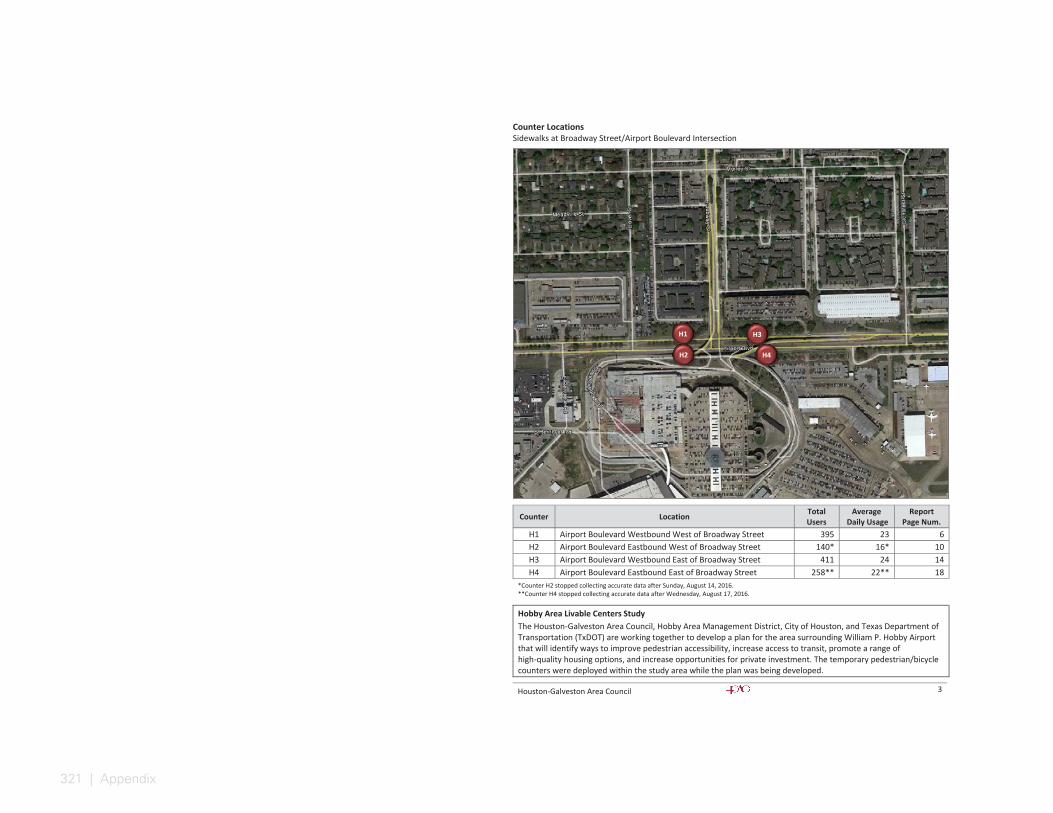
321 | Appendix
Houston-Galveston Area Council 3
Counter Locations Sidewalks at Broadway Street/Airport Boulevard Intersection
Counter Location Total Users
Average Daily Usage
Report Page Num.
H1 Airport Boulevard Westbound West of Broadway Street 395 23 6 H2 Airport Boulevard Eastbound West of Broadway Street 140* 16* 10 H3 Airport Boulevard Westbound East of Broadway Street 411 24 14 H4 Airport Boulevard Eastbound East of Broadway Street 258** 22** 18
*Counter H2 stopped collecting accurate data after Sunday, August 14, 2016. **Counter H4 stopped collecting accurate data after Wednesday, August 17, 2016.
Hobby Area Livable Centers Study The Houston-Galveston Area Council, Hobby Area Management District, City of Houston, and Texas Department of Transportation (TxDOT) are working together to develop a plan for the area surrounding William P. Hobby Airport that will identify ways to improve pedestrian accessibility, increase access to transit, promote a range of high-quality housing options, and increase opportunities for private investment. The temporary pedestrian/bicycle counters were deployed within the study area while the plan was being developed.
H3 H1
H4 H2
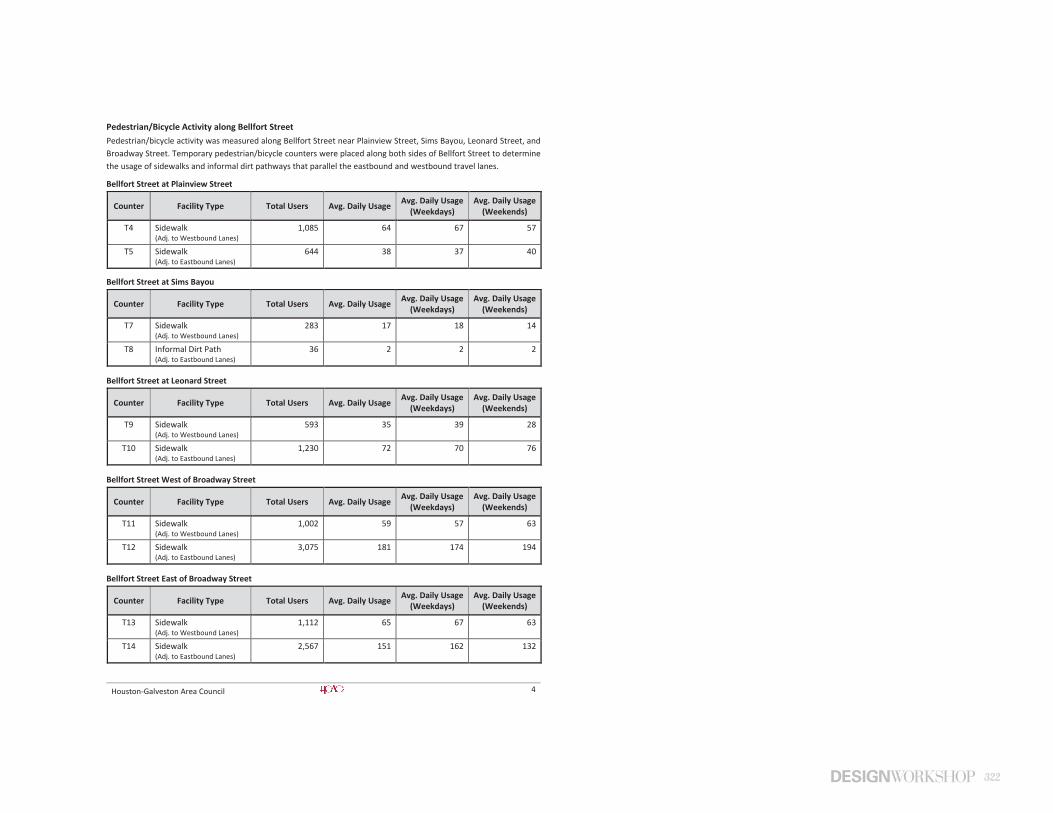
322
Houston-Galveston Area Council 4
Pedestrian/Bicycle Activity along Bellfort Street Pedestrian/bicycle activity was measured along Bellfort Street near Plainview Street, Sims Bayou, Leonard Street, and Broadway Street. Temporary pedestrian/bicycle counters were placed along both sides of Bellfort Street to determine the usage of sidewalks and informal dirt pathways that parallel the eastbound and westbound travel lanes.
Bellfort Street at Plainview Street
Counter Facility Type Total Users Avg. Daily Usage Avg. Daily Usage (Weekdays)
Avg. Daily Usage (Weekends)
T4 Sidewalk (Adj. to Westbound Lanes)
1,085 64 67 57
T5 Sidewalk (Adj. to Eastbound Lanes)
644 38 37 40
Bellfort Street at Sims Bayou
Counter Facility Type Total Users Avg. Daily Usage Avg. Daily Usage (Weekdays)
Avg. Daily Usage (Weekends)
T7 Sidewalk (Adj. to Westbound Lanes)
283 17 18 14
T8 Informal Dirt Path (Adj. to Eastbound Lanes)
36 2 2 2
Bellfort Street at Leonard Street
Counter Facility Type Total Users Avg. Daily Usage Avg. Daily Usage (Weekdays)
Avg. Daily Usage (Weekends)
T9 Sidewalk (Adj. to Westbound Lanes)
593 35 39 28
T10 Sidewalk (Adj. to Eastbound Lanes)
1,230 72 70 76
Bellfort Street West of Broadway Street
Counter Facility Type Total Users Avg. Daily Usage Avg. Daily Usage (Weekdays)
Avg. Daily Usage (Weekends)
T11 Sidewalk (Adj. to Westbound Lanes)
1,002 59 57 63
T12 Sidewalk (Adj. to Eastbound Lanes)
3,075 181 174 194
Bellfort Street East of Broadway Street
Counter Facility Type Total Users Avg. Daily Usage Avg. Daily Usage (Weekdays)
Avg. Daily Usage (Weekends)
T13 Sidewalk (Adj. to Westbound Lanes)
1,112 65 67 63
T14 Sidewalk (Adj. to Eastbound Lanes)
2,567 151 162 132
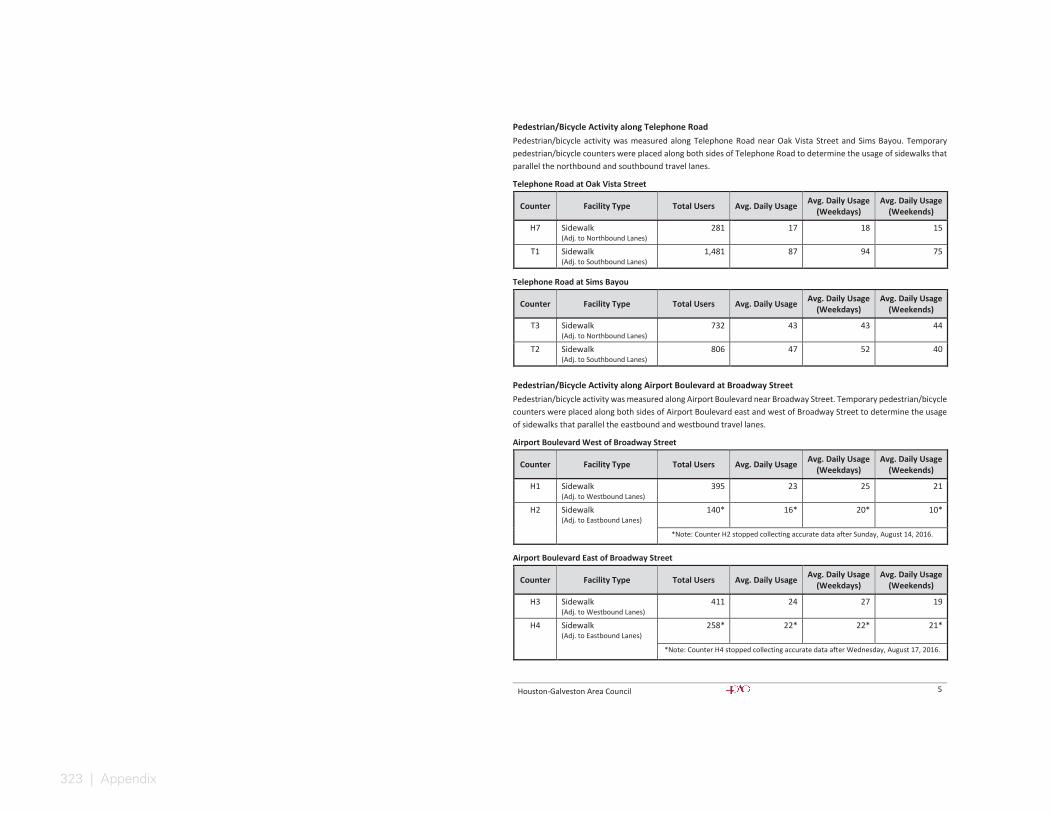
323 | Appendix
Houston-Galveston Area Council 5
Pedestrian/Bicycle Activity along Telephone Road Pedestrian/bicycle activity was measured along Telephone Road near Oak Vista Street and Sims Bayou. Temporary pedestrian/bicycle counters were placed along both sides of Telephone Road to determine the usage of sidewalks that parallel the northbound and southbound travel lanes.
Telephone Road at Oak Vista Street
Counter Facility Type Total Users Avg. Daily Usage Avg. Daily Usage (Weekdays)
Avg. Daily Usage (Weekends)
H7 Sidewalk (Adj. to Northbound Lanes)
281 17 18 15
T1 Sidewalk (Adj. to Southbound Lanes)
1,481 87 94 75
Telephone Road at Sims Bayou
Counter Facility Type Total Users Avg. Daily Usage Avg. Daily Usage (Weekdays)
Avg. Daily Usage (Weekends)
T3 Sidewalk (Adj. to Northbound Lanes)
732 43 43 44
T2 Sidewalk (Adj. to Southbound Lanes)
806 47 52 40
Pedestrian/Bicycle Activity along Airport Boulevard at Broadway Street Pedestrian/bicycle activity was measured along Airport Boulevard near Broadway Street. Temporary pedestrian/bicycle counters were placed along both sides of Airport Boulevard east and west of Broadway Street to determine the usage of sidewalks that parallel the eastbound and westbound travel lanes.
Airport Boulevard West of Broadway Street
Counter Facility Type Total Users Avg. Daily Usage Avg. Daily Usage (Weekdays)
Avg. Daily Usage (Weekends)
H1 Sidewalk (Adj. to Westbound Lanes)
395 23 25 21
H2 Sidewalk (Adj. to Eastbound Lanes)
140* 16* 20* 10*
*Note: Counter H2 stopped collecting accurate data after Sunday, August 14, 2016.
Airport Boulevard East of Broadway Street
Counter Facility Type Total Users Avg. Daily Usage Avg. Daily Usage (Weekdays)
Avg. Daily Usage (Weekends)
H3 Sidewalk (Adj. to Westbound Lanes)
411 24 27 19
H4 Sidewalk (Adj. to Eastbound Lanes)
258* 22* 22* 21*
*Note: Counter H4 stopped collecting accurate data after Wednesday, August 17, 2016.
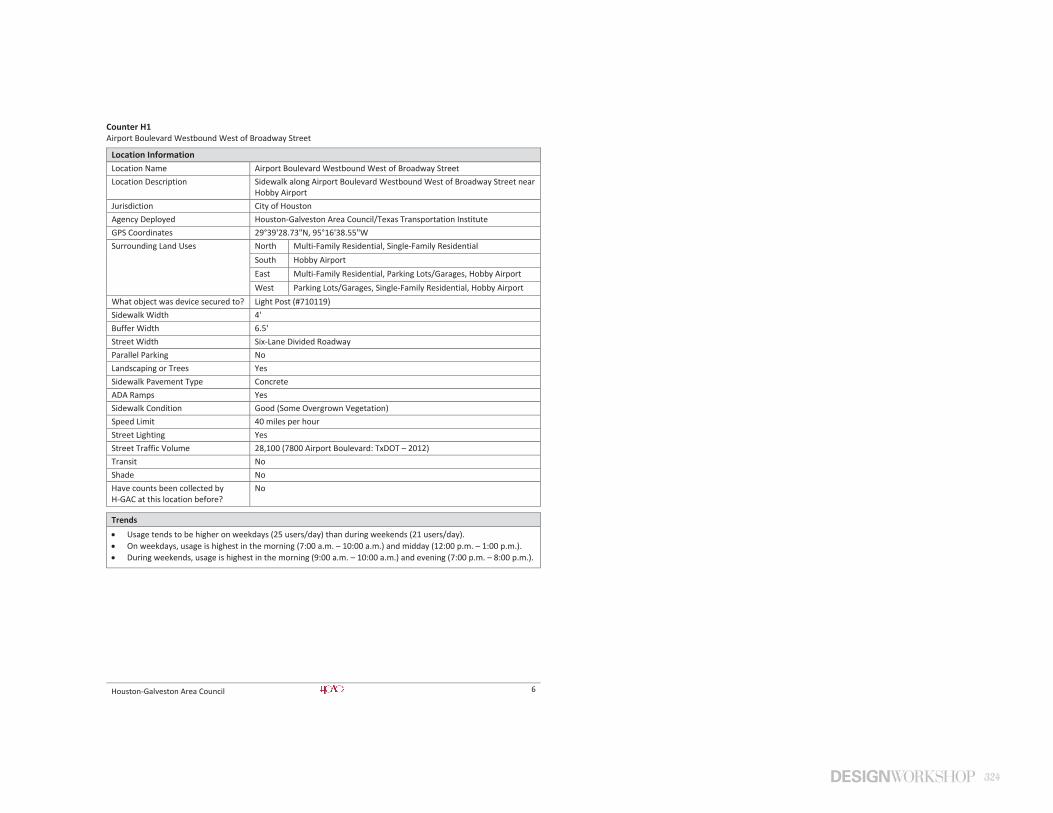
324
Houston-Galveston Area Council 6
Counter H1 Airport Boulevard Westbound West of Broadway Street
Location Information Location Name Airport Boulevard Westbound West of Broadway Street Location Description Sidewalk along Airport Boulevard Westbound West of Broadway Street near
Hobby Airport Jurisdiction City of Houston Agency Deployed Houston-Galveston Area Council/Texas Transportation Institute GPS Coordinates 29°39'28.73"N, 95°16'38.55"W Surrounding Land Uses North Multi-Family Residential, Single-Family Residential
South Hobby Airport East Multi-Family Residential, Parking Lots/Garages, Hobby Airport West Parking Lots/Garages, Single-Family Residential, Hobby Airport
What object was device secured to? Light Post (#710119) Sidewalk Width 4' Buffer Width 6.5' Street Width Six-Lane Divided Roadway Parallel Parking No Landscaping or Trees Yes Sidewalk Pavement Type Concrete ADA Ramps Yes Sidewalk Condition Good (Some Overgrown Vegetation) Speed Limit 40 miles per hour Street Lighting Yes Street Traffic Volume 28,100 (7800 Airport Boulevard: TxDOT – 2012) Transit No Shade No Have counts been collected by H-GAC at this location before?
No
Trends Usage tends to be higher on weekdays (25 users/day) than during weekends (21 users/day). On weekdays, usage is highest in the morning (7:00 a.m. – 10:00 a.m.) and midday (12:00 p.m. – 1:00 p.m.). During weekends, usage is highest in the morning (9:00 a.m. – 10:00 a.m.) and evening (7:00 p.m. – 8:00 p.m.).
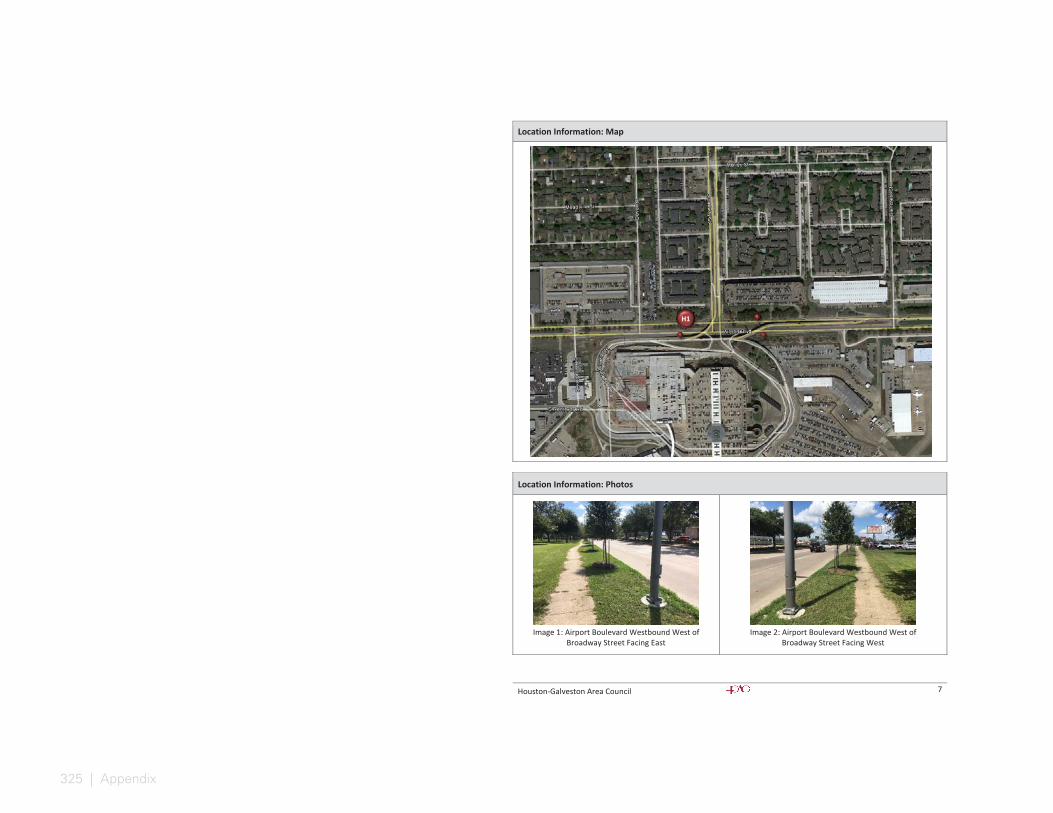
325 | Appendix
Houston-Galveston Area Council 7
Location Information: Map
Location Information: Photos
Image 1: Airport Boulevard Westbound West of
Broadway Street Facing East
Image 2: Airport Boulevard Westbound West of
Broadway Street Facing West
H1
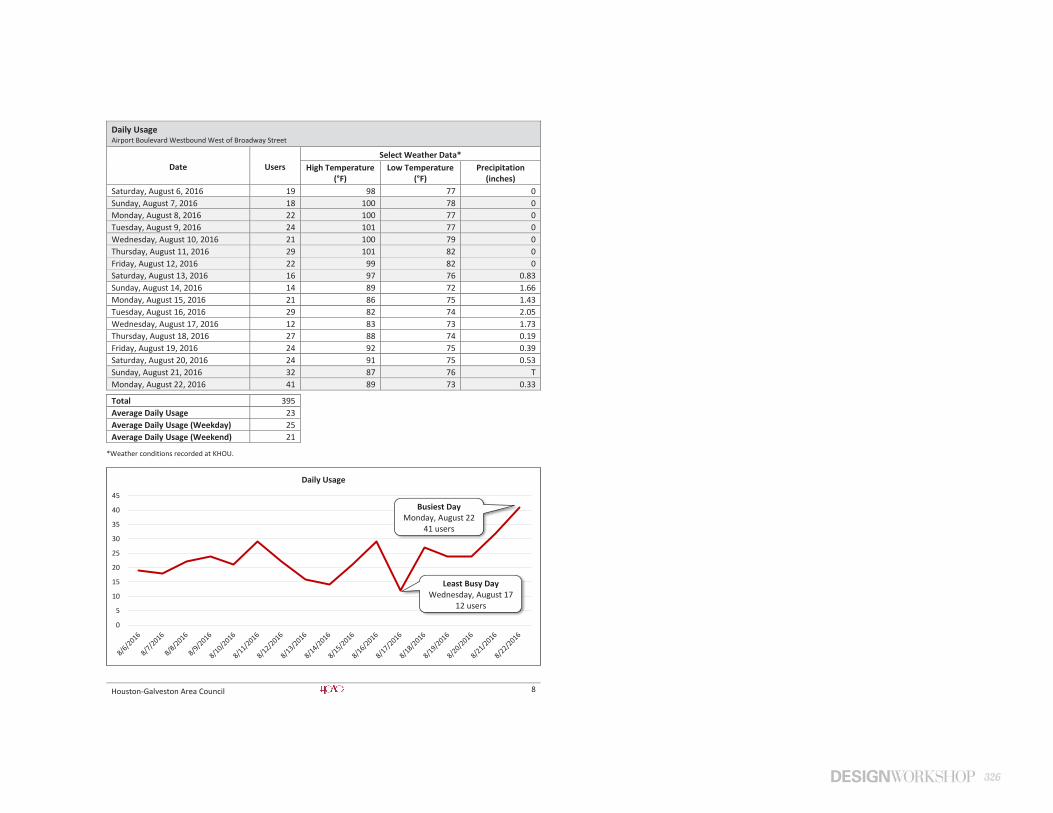
326
Houston-Galveston Area Council 8
Daily Usage Airport Boulevard Westbound West of Broadway Street
Date Users Select Weather Data*
High Temperature (°F)
Low Temperature (°F)
Precipitation (inches)
Saturday, August 6, 2016 19 98 77 0 Sunday, August 7, 2016 18 100 78 0 Monday, August 8, 2016 22 100 77 0 Tuesday, August 9, 2016 24 101 77 0 Wednesday, August 10, 2016 21 100 79 0 Thursday, August 11, 2016 29 101 82 0 Friday, August 12, 2016 22 99 82 0 Saturday, August 13, 2016 16 97 76 0.83 Sunday, August 14, 2016 14 89 72 1.66 Monday, August 15, 2016 21 86 75 1.43 Tuesday, August 16, 2016 29 82 74 2.05 Wednesday, August 17, 2016 12 83 73 1.73 Thursday, August 18, 2016 27 88 74 0.19 Friday, August 19, 2016 24 92 75 0.39 Saturday, August 20, 2016 24 91 75 0.53 Sunday, August 21, 2016 32 87 76 T Monday, August 22, 2016 41 89 73 0.33
Total 395 Average Daily Usage 23 Average Daily Usage (Weekday) 25 Average Daily Usage (Weekend) 21
*Weather conditions recorded at KHOU.
0
5
10
15
20
25
30
35
40
45
Daily Usage
Busiest Day Monday, August 22
41 users
Least Busy Day Wednesday, August 17
12 users
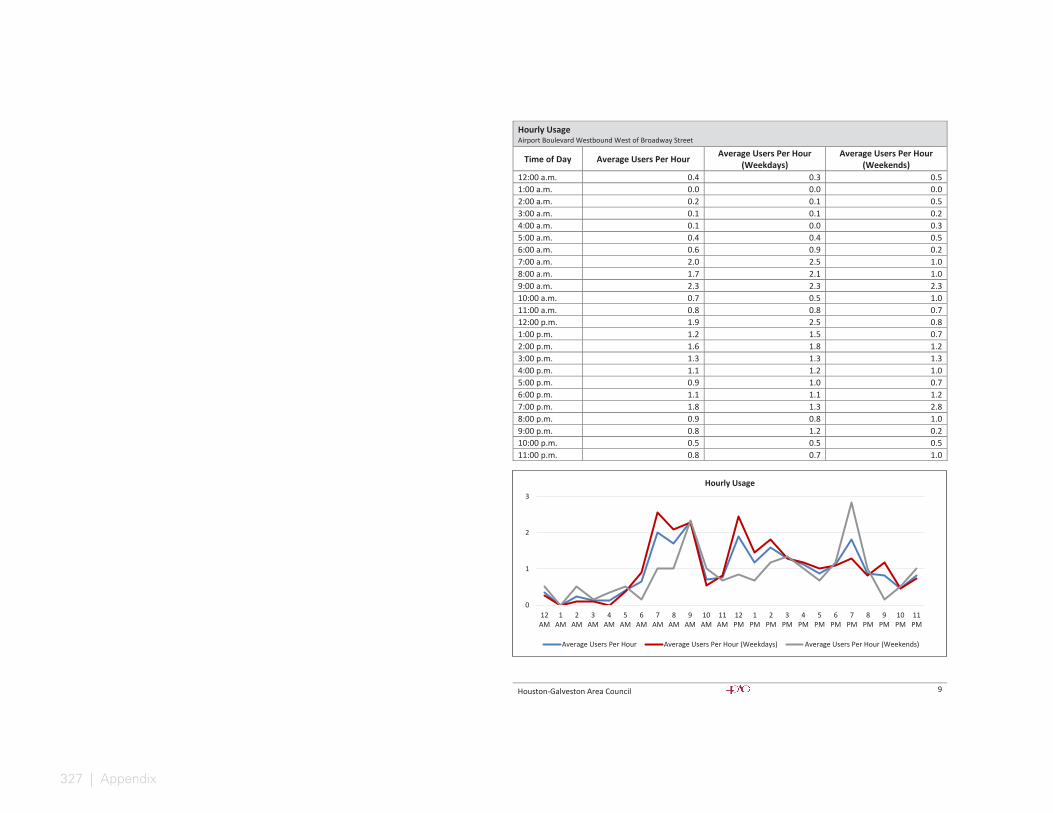
327 | Appendix
Houston-Galveston Area Council 9
Hourly Usage Airport Boulevard Westbound West of Broadway Street
Time of Day Average Users Per Hour Average Users Per Hour (Weekdays)
Average Users Per Hour (Weekends)
12:00 a.m. 0.4 0.3 0.5 1:00 a.m. 0.0 0.0 0.0 2:00 a.m. 0.2 0.1 0.5 3:00 a.m. 0.1 0.1 0.2 4:00 a.m. 0.1 0.0 0.3 5:00 a.m. 0.4 0.4 0.5 6:00 a.m. 0.6 0.9 0.2 7:00 a.m. 2.0 2.5 1.0 8:00 a.m. 1.7 2.1 1.0 9:00 a.m. 2.3 2.3 2.3 10:00 a.m. 0.7 0.5 1.0 11:00 a.m. 0.8 0.8 0.7 12:00 p.m. 1.9 2.5 0.8 1:00 p.m. 1.2 1.5 0.7 2:00 p.m. 1.6 1.8 1.2 3:00 p.m. 1.3 1.3 1.3 4:00 p.m. 1.1 1.2 1.0 5:00 p.m. 0.9 1.0 0.7 6:00 p.m. 1.1 1.1 1.2 7:00 p.m. 1.8 1.3 2.8 8:00 p.m. 0.9 0.8 1.0 9:00 p.m. 0.8 1.2 0.2 10:00 p.m. 0.5 0.5 0.5 11:00 p.m. 0.8 0.7 1.0
0
1
2
3
12AM
1AM
2AM
3AM
4AM
5AM
6AM
7AM
8AM
9AM
10AM
11AM
12PM
1PM
2PM
3PM
4PM
5PM
6PM
7PM
8PM
9PM
10PM
11PM
Hourly Usage
Average Users Per Hour Average Users Per Hour (Weekdays) Average Users Per Hour (Weekends)
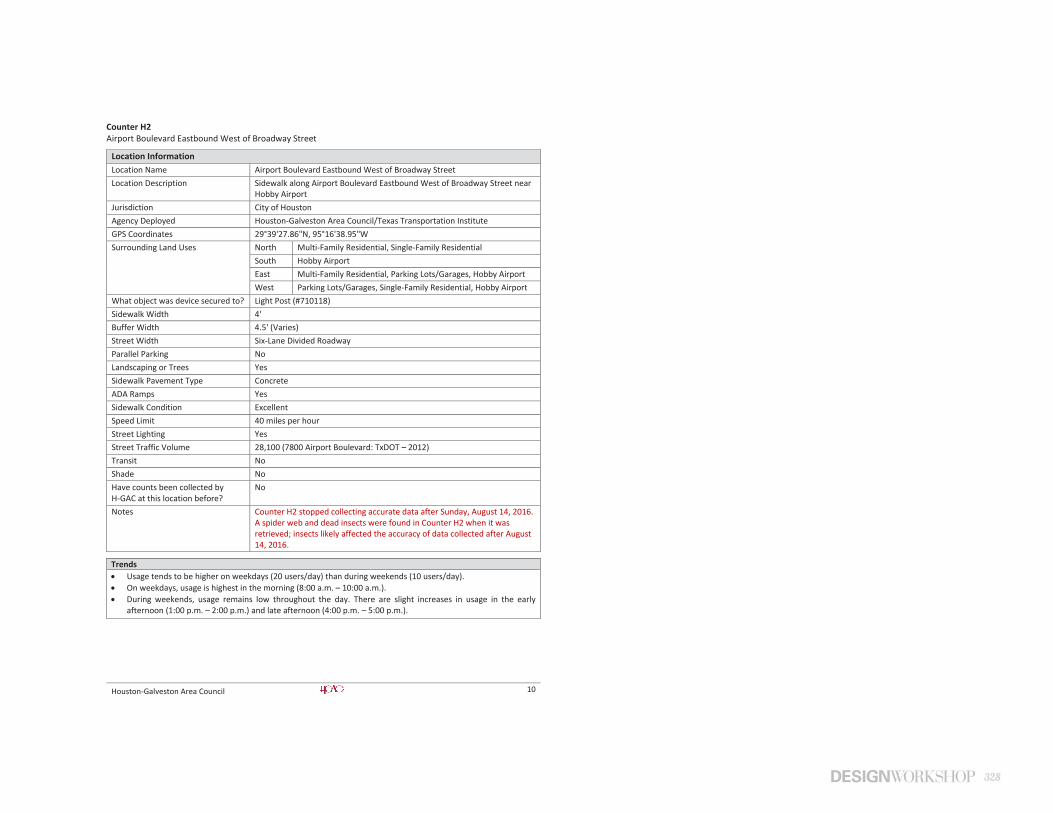
328
Houston-Galveston Area Council 10
Counter H2 Airport Boulevard Eastbound West of Broadway Street
Location Information Location Name Airport Boulevard Eastbound West of Broadway Street Location Description Sidewalk along Airport Boulevard Eastbound West of Broadway Street near
Hobby Airport Jurisdiction City of Houston Agency Deployed Houston-Galveston Area Council/Texas Transportation Institute GPS Coordinates 29°39'27.86"N, 95°16'38.95"W Surrounding Land Uses North Multi-Family Residential, Single-Family Residential
South Hobby Airport East Multi-Family Residential, Parking Lots/Garages, Hobby Airport West Parking Lots/Garages, Single-Family Residential, Hobby Airport
What object was device secured to? Light Post (#710118) Sidewalk Width 4' Buffer Width 4.5' (Varies) Street Width Six-Lane Divided Roadway Parallel Parking No Landscaping or Trees Yes Sidewalk Pavement Type Concrete ADA Ramps Yes Sidewalk Condition Excellent Speed Limit 40 miles per hour Street Lighting Yes Street Traffic Volume 28,100 (7800 Airport Boulevard: TxDOT – 2012) Transit No Shade No Have counts been collected by H-GAC at this location before?
No
Notes Counter H2 stopped collecting accurate data after Sunday, August 14, 2016. A spider web and dead insects were found in Counter H2 when it was retrieved; insects likely affected the accuracy of data collected after August 14, 2016.
Trends Usage tends to be higher on weekdays (20 users/day) than during weekends (10 users/day). On weekdays, usage is highest in the morning (8:00 a.m. – 10:00 a.m.). During weekends, usage remains low throughout the day. There are slight increases in usage in the early
afternoon (1:00 p.m. – 2:00 p.m.) and late afternoon (4:00 p.m. – 5:00 p.m.).
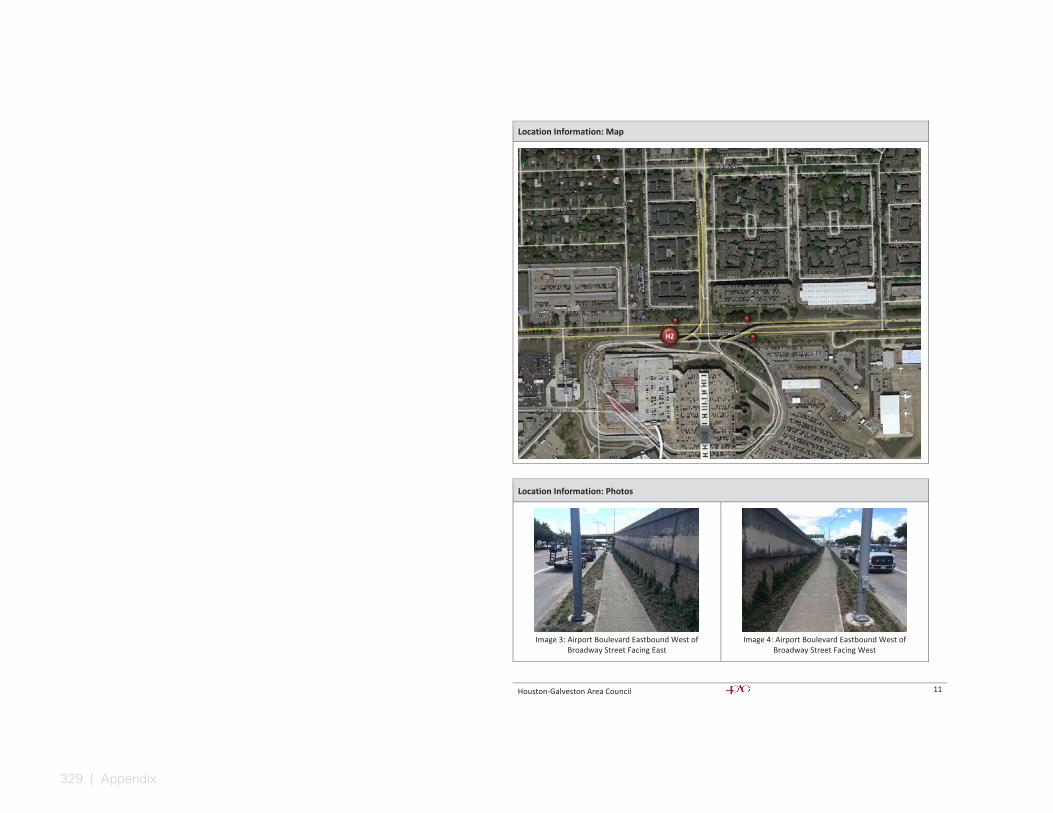
329 | Appendix
Houston-Galveston Area Council 11
Location Information: Map
Location Information: Photos
Image 3: Airport Boulevard Eastbound West of
Broadway Street Facing East
Image 4: Airport Boulevard Eastbound West of
Broadway Street Facing West
H2
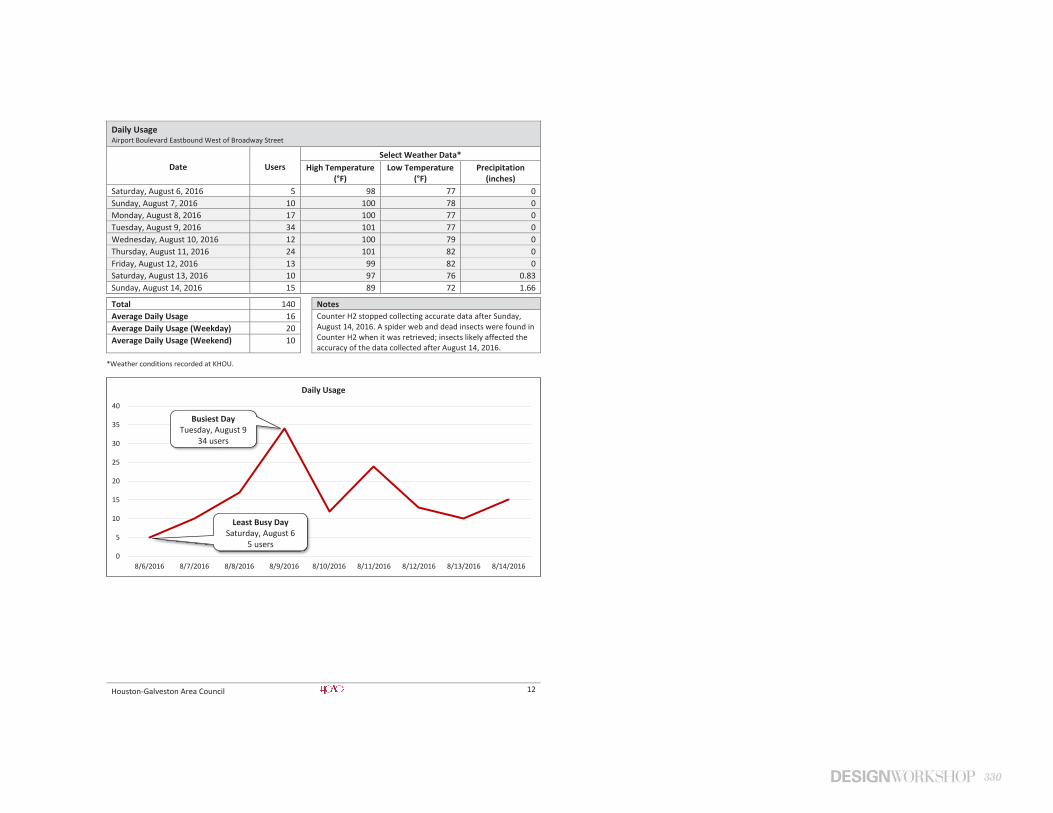
330
Houston-Galveston Area Council 12
Daily Usage Airport Boulevard Eastbound West of Broadway Street
Date Users Select Weather Data*
High Temperature (°F)
Low Temperature (°F)
Precipitation (inches)
Saturday, August 6, 2016 5 98 77 0 Sunday, August 7, 2016 10 100 78 0 Monday, August 8, 2016 17 100 77 0 Tuesday, August 9, 2016 34 101 77 0 Wednesday, August 10, 2016 12 100 79 0 Thursday, August 11, 2016 24 101 82 0 Friday, August 12, 2016 13 99 82 0 Saturday, August 13, 2016 10 97 76 0.83 Sunday, August 14, 2016 15 89 72 1.66
Total 140 Notes Average Daily Usage 16 Counter H2 stopped collecting accurate data after Sunday,
August 14, 2016. A spider web and dead insects were found in Counter H2 when it was retrieved; insects likely affected the accuracy of the data collected after August 14, 2016.
Average Daily Usage (Weekday) 20 Average Daily Usage (Weekend) 10
*Weather conditions recorded at KHOU.
0
5
10
15
20
25
30
35
40
8/6/2016 8/7/2016 8/8/2016 8/9/2016 8/10/2016 8/11/2016 8/12/2016 8/13/2016 8/14/2016
Daily Usage
Busiest Day Tuesday, August 9
34 users
Least Busy Day Saturday, August 6
5 users
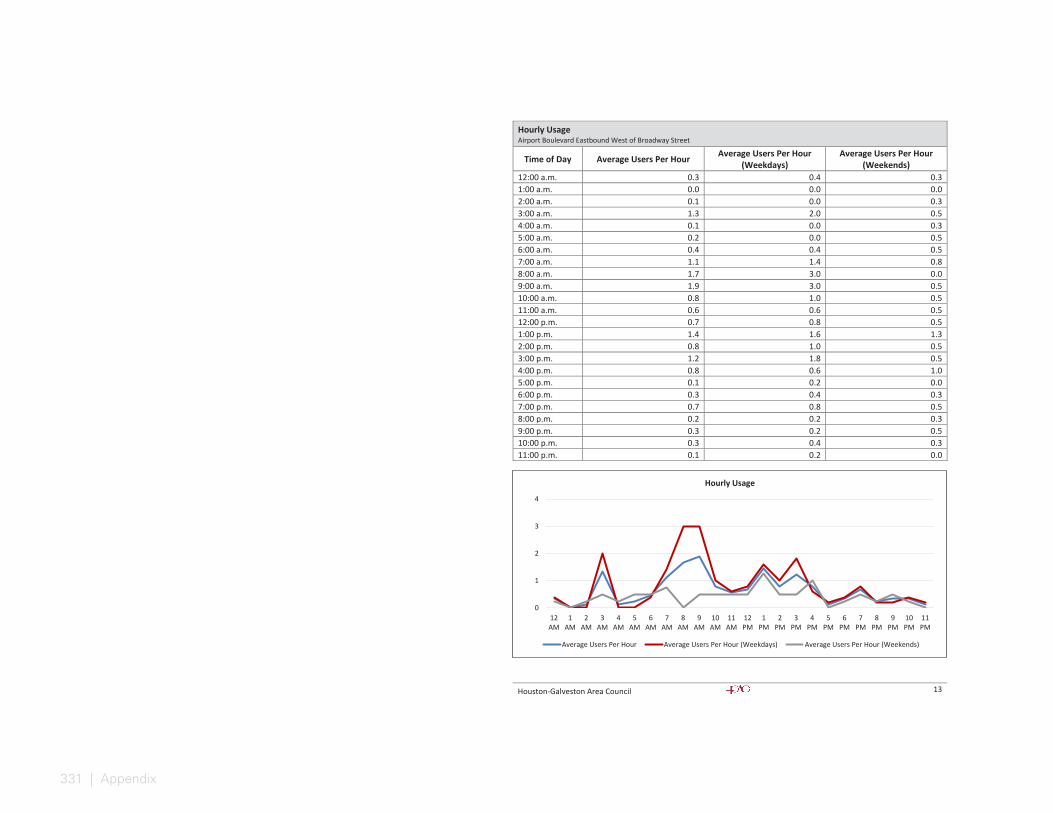
331 | Appendix
Houston-Galveston Area Council 13
Hourly Usage Airport Boulevard Eastbound West of Broadway Street
Time of Day Average Users Per Hour Average Users Per Hour (Weekdays)
Average Users Per Hour (Weekends)
12:00 a.m. 0.3 0.4 0.3 1:00 a.m. 0.0 0.0 0.0 2:00 a.m. 0.1 0.0 0.3 3:00 a.m. 1.3 2.0 0.5 4:00 a.m. 0.1 0.0 0.3 5:00 a.m. 0.2 0.0 0.5 6:00 a.m. 0.4 0.4 0.5 7:00 a.m. 1.1 1.4 0.8 8:00 a.m. 1.7 3.0 0.0 9:00 a.m. 1.9 3.0 0.5 10:00 a.m. 0.8 1.0 0.5 11:00 a.m. 0.6 0.6 0.5 12:00 p.m. 0.7 0.8 0.5 1:00 p.m. 1.4 1.6 1.3 2:00 p.m. 0.8 1.0 0.5 3:00 p.m. 1.2 1.8 0.5 4:00 p.m. 0.8 0.6 1.0 5:00 p.m. 0.1 0.2 0.0 6:00 p.m. 0.3 0.4 0.3 7:00 p.m. 0.7 0.8 0.5 8:00 p.m. 0.2 0.2 0.3 9:00 p.m. 0.3 0.2 0.5 10:00 p.m. 0.3 0.4 0.3 11:00 p.m. 0.1 0.2 0.0
0
1
2
3
4
12AM
1AM
2AM
3AM
4AM
5AM
6AM
7AM
8AM
9AM
10AM
11AM
12PM
1PM
2PM
3PM
4PM
5PM
6PM
7PM
8PM
9PM
10PM
11PM
Hourly Usage
Average Users Per Hour Average Users Per Hour (Weekdays) Average Users Per Hour (Weekends)

332
Houston-Galveston Area Council 14
Counter H3 Airport Boulevard Westbound East of Broadway Street
Location Information Location Name Airport Boulevard Westbound East of Broadway Street Location Description Sidewalk along Airport Boulevard Westbound East of Broadway Street near
Hobby Airport Jurisdiction City of Houston Agency Deployed Houston-Galveston Area Council/Texas Transportation Institute GPS Coordinates 29°39'28.89"N, 95°16'32.75"W Surrounding Land Uses North Parking Lots/Garage, Multi-Family Residential
South Hobby Airport East Parking Lots/Garage, Hobby Airport, Multi-Family Residential West Parking Lots/Garage, Multi-Family Residential, Hobby Airport
What object was device secured to? Sign Post (Warning: Underground Cable) Sidewalk Width 4' Buffer Width 8' Street Width Six-Lane Divided Roadway Parallel Parking No Landscaping or Trees Yes Sidewalk Pavement Type Concrete ADA Ramps Yes Sidewalk Condition Fair (Debris/Mud Covering Sidewalk) Speed Limit 40 miles per hour Street Lighting Yes Street Traffic Volume 28,100 (7800 Airport Boulevard: TxDOT - 2012) Transit No Shade Yes Have counts been collected by H-GAC at this location before?
No
Trends Usage tends to be higher on weekdays (27 users/day) than during weekends (19 users/day). On weekdays, usage is highest in the late afternoon (4:00 p.m. – 5:00 p.m.). During weekends, usage is highest in the evening (5:00 p.m. – 7:00 p.m.).
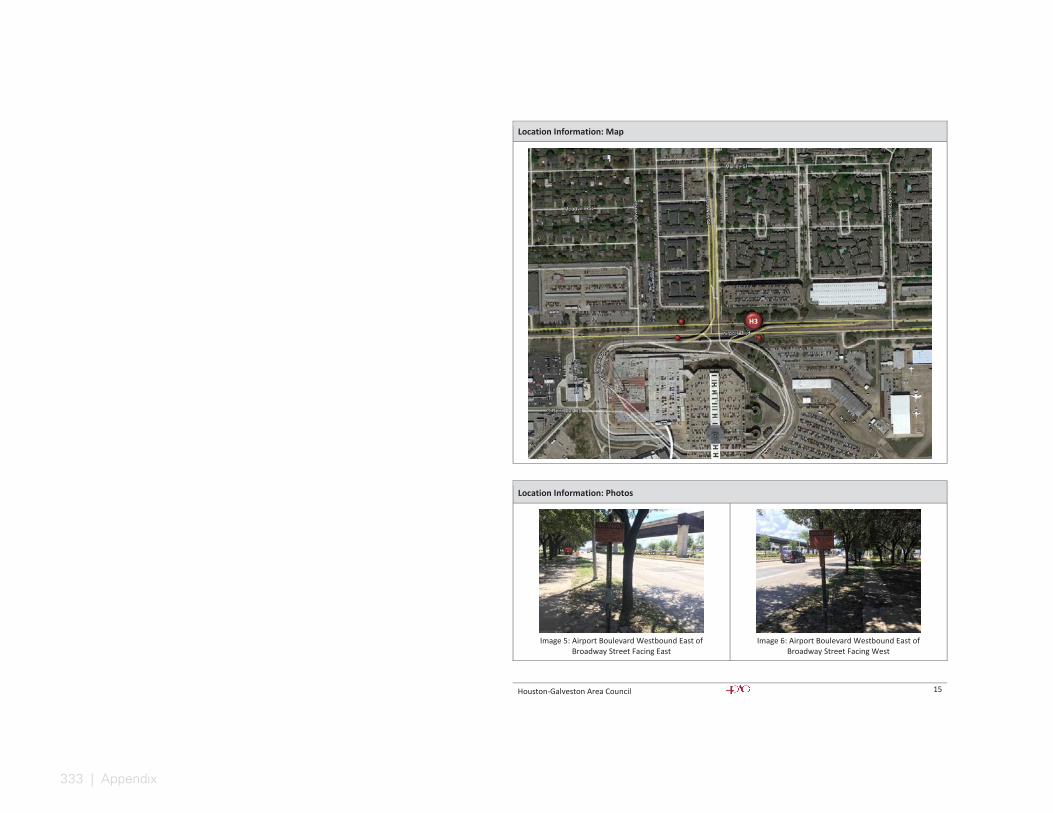
333 | Appendix
Houston-Galveston Area Council 15
Location Information: Map
Location Information: Photos
Image 5: Airport Boulevard Westbound East of
Broadway Street Facing East
Image 6: Airport Boulevard Westbound East of
Broadway Street Facing West
H3
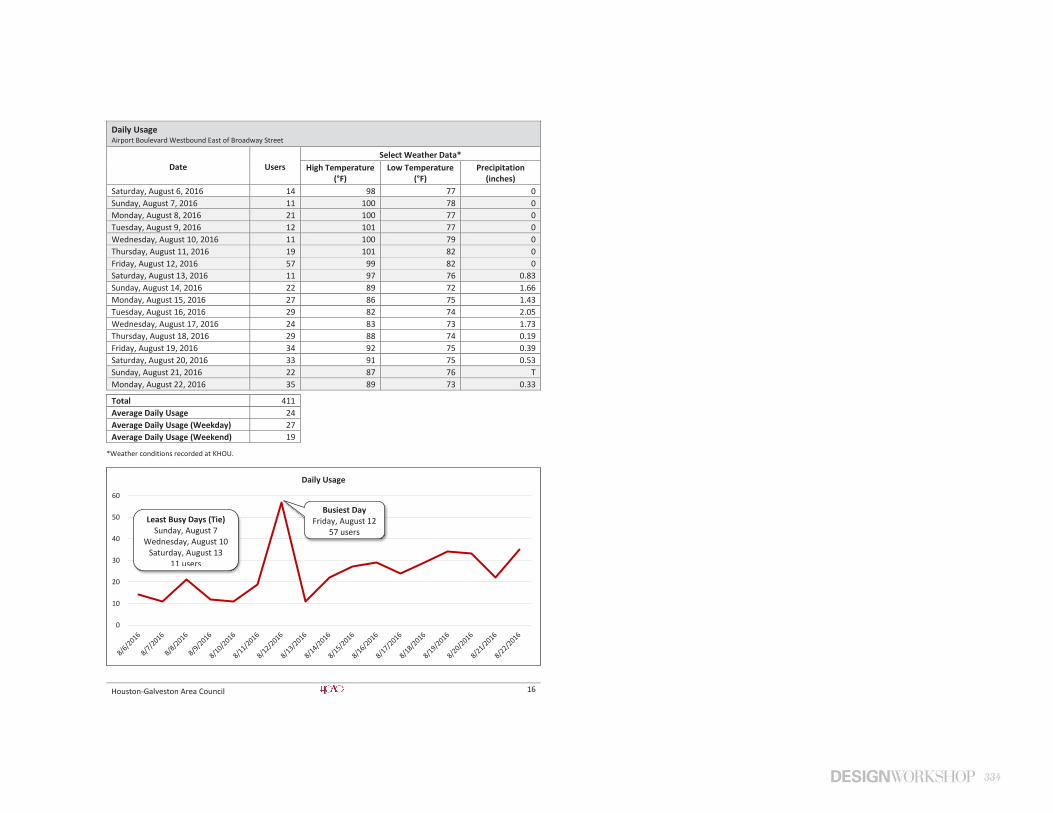
334
Houston-Galveston Area Council 16
Daily Usage Airport Boulevard Westbound East of Broadway Street
Date Users Select Weather Data*
High Temperature (°F)
Low Temperature (°F)
Precipitation (inches)
Saturday, August 6, 2016 14 98 77 0 Sunday, August 7, 2016 11 100 78 0 Monday, August 8, 2016 21 100 77 0 Tuesday, August 9, 2016 12 101 77 0 Wednesday, August 10, 2016 11 100 79 0 Thursday, August 11, 2016 19 101 82 0 Friday, August 12, 2016 57 99 82 0 Saturday, August 13, 2016 11 97 76 0.83 Sunday, August 14, 2016 22 89 72 1.66 Monday, August 15, 2016 27 86 75 1.43 Tuesday, August 16, 2016 29 82 74 2.05 Wednesday, August 17, 2016 24 83 73 1.73 Thursday, August 18, 2016 29 88 74 0.19 Friday, August 19, 2016 34 92 75 0.39 Saturday, August 20, 2016 33 91 75 0.53 Sunday, August 21, 2016 22 87 76 T Monday, August 22, 2016 35 89 73 0.33
Total 411 Average Daily Usage 24 Average Daily Usage (Weekday) 27 Average Daily Usage (Weekend) 19
*Weather conditions recorded at KHOU.
0
10
20
30
40
50
60
Daily Usage
Busiest Day Friday, August 12
57 users
Least Busy Days (Tie) Sunday, August 7
Wednesday, August 10 Saturday, August 13
11 users

335 | Appendix
Houston-Galveston Area Council 17
Hourly Usage Airport Boulevard Westbound East of Broadway Street
Time of Day Average Users Per Hour Average Users Per Hour (Weekdays)
Average Users Per Hour (Weekends)
12:00 a.m. 0.2 0.1 0.5 1:00 a.m. 0.4 0.4 0.3 2:00 a.m. 0.5 0.4 0.7 3:00 a.m. 0.1 0.2 0.0 4:00 a.m. 0.1 0.1 0.2 5:00 a.m. 0.3 0.4 0.2 6:00 a.m. 1.1 1.1 1.2 7:00 a.m. 1.4 1.9 0.5 8:00 a.m. 1.2 1.4 1.0 9:00 a.m. 1.2 1.4 0.8 10:00 a.m. 1.1 1.4 0.7 11:00 a.m. 0.9 0.8 1.0 12:00 p.m. 0.8 0.9 0.7 1:00 p.m. 1.5 1.8 1.0 2:00 p.m. 2.1 2.3 1.7 3:00 p.m. 0.8 0.6 1.0 4:00 p.m. 2.3 3.1 0.8 5:00 p.m. 1.9 2.0 1.8 6:00 p.m. 1.6 1.8 1.3 7:00 p.m. 1.0 1.2 0.7 8:00 p.m. 1.2 1.4 1.0 9:00 p.m. 1.0 1.1 0.8 10:00 p.m. 0.9 1.1 0.7 11:00 p.m. 0.4 0.5 0.3
0
1
2
3
4
12AM
1AM
2AM
3AM
4AM
5AM
6AM
7AM
8AM
9AM
10AM
11AM
12PM
1PM
2PM
3PM
4PM
5PM
6PM
7PM
8PM
9PM
10PM
11PM
Hourly Usage
Average Users Per Hour Average Users Per Hour (Weekdays) Average Users Per Hour (Weekends)
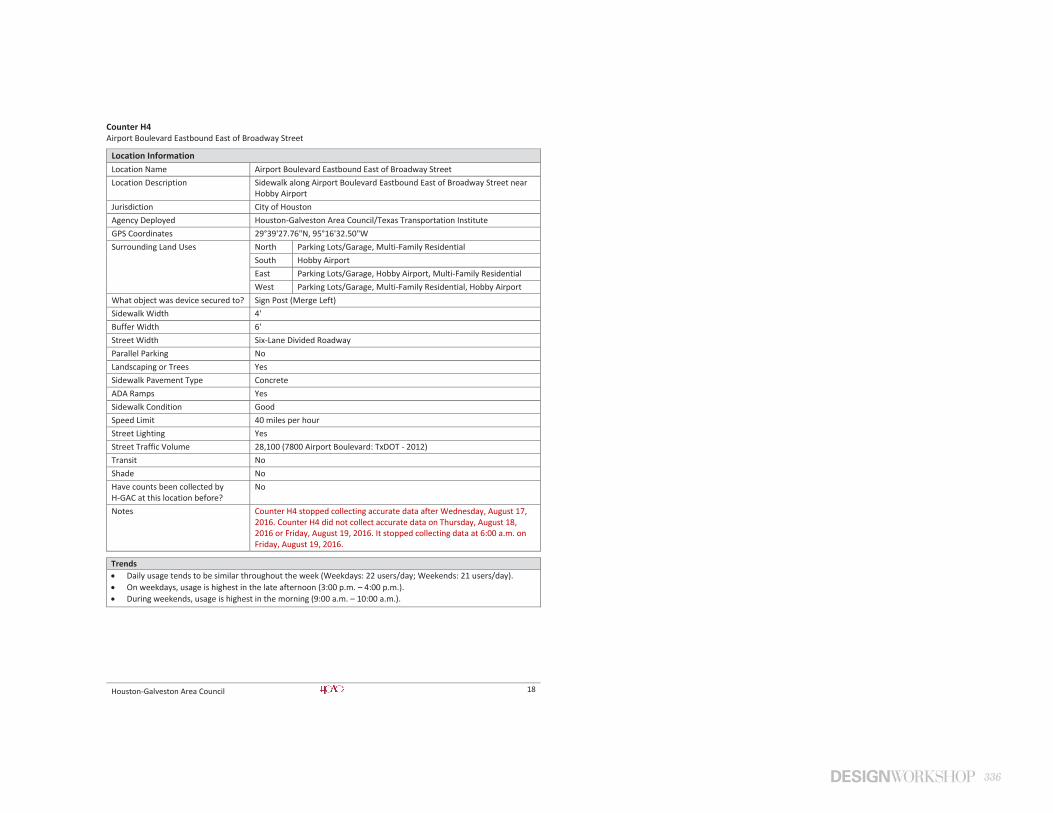
336
Houston-Galveston Area Council 18
Counter H4 Airport Boulevard Eastbound East of Broadway Street
Location Information Location Name Airport Boulevard Eastbound East of Broadway Street Location Description Sidewalk along Airport Boulevard Eastbound East of Broadway Street near
Hobby Airport Jurisdiction City of Houston Agency Deployed Houston-Galveston Area Council/Texas Transportation Institute GPS Coordinates 29°39'27.76"N, 95°16'32.50"W Surrounding Land Uses North Parking Lots/Garage, Multi-Family Residential
South Hobby Airport East Parking Lots/Garage, Hobby Airport, Multi-Family Residential West Parking Lots/Garage, Multi-Family Residential, Hobby Airport
What object was device secured to? Sign Post (Merge Left) Sidewalk Width 4' Buffer Width 6' Street Width Six-Lane Divided Roadway Parallel Parking No Landscaping or Trees Yes Sidewalk Pavement Type Concrete ADA Ramps Yes Sidewalk Condition Good Speed Limit 40 miles per hour Street Lighting Yes Street Traffic Volume 28,100 (7800 Airport Boulevard: TxDOT - 2012) Transit No Shade No Have counts been collected by H-GAC at this location before?
No
Notes Counter H4 stopped collecting accurate data after Wednesday, August 17, 2016. Counter H4 did not collect accurate data on Thursday, August 18, 2016 or Friday, August 19, 2016. It stopped collecting data at 6:00 a.m. on Friday, August 19, 2016.
Trends Daily usage tends to be similar throughout the week (Weekdays: 22 users/day; Weekends: 21 users/day). On weekdays, usage is highest in the late afternoon (3:00 p.m. – 4:00 p.m.). During weekends, usage is highest in the morning (9:00 a.m. – 10:00 a.m.).
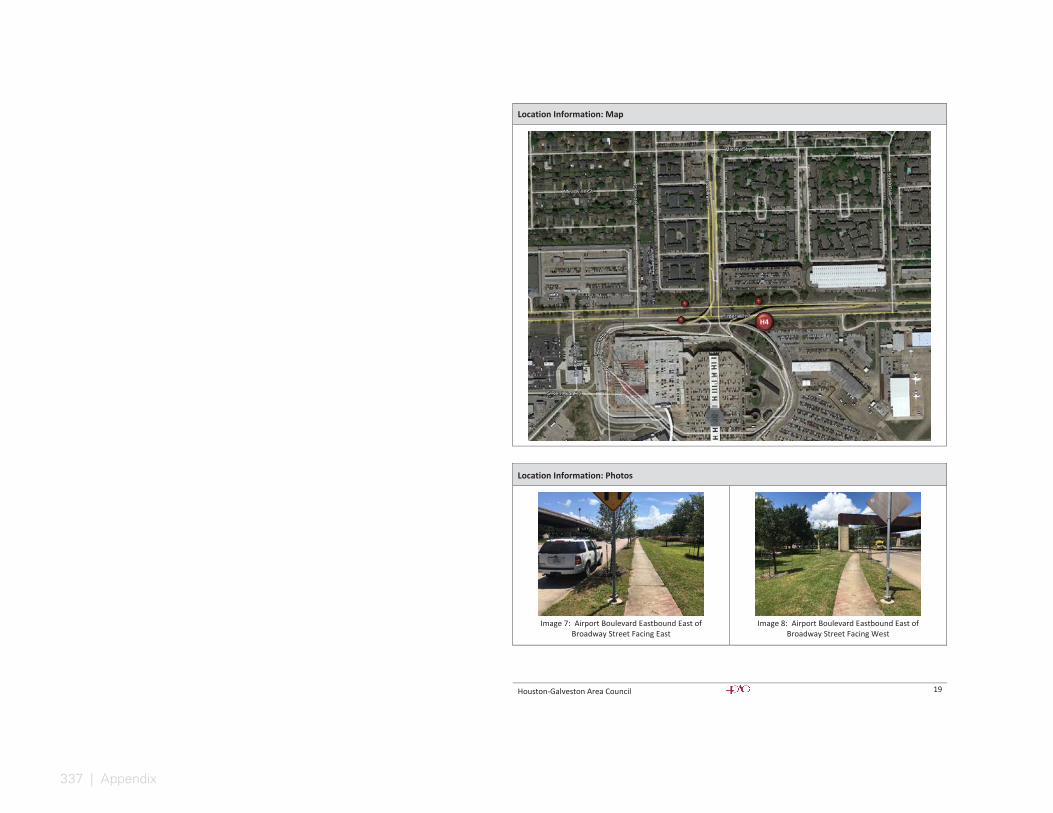
337 | Appendix
Houston-Galveston Area Council 19
Location Information: Map
Location Information: Photos
Image 7: Airport Boulevard Eastbound East of
Broadway Street Facing East
Image 8: Airport Boulevard Eastbound East of
Broadway Street Facing West
H4

338
Houston-Galveston Area Council 20
Daily Usage Airport Boulevard Eastbound East of Broadway Street
Date Users Select Weather Data*
High Temperature (°F)
Low Temperature (°F)
Precipitation (inches)
Saturday, August 6, 2016 26 98 77 0 Sunday, August 7, 2016 22 100 78 0 Monday, August 8, 2016 20 100 77 0 Tuesday, August 9, 2016 21 101 77 0 Wednesday, August 10, 2016 27 100 79 0 Thursday, August 11, 2016 19 101 82 0 Friday, August 12, 2016 23 99 82 0 Saturday, August 13, 2016 13 97 76 0.83 Sunday, August 14, 2016 23 89 72 1.66 Monday, August 15, 2016 28 86 75 1.43 Tuesday, August 16, 2016 19 82 74 2.05 Wednesday, August 17, 2016 17 83 73 1.73
Total 258 Notes Average Daily Usage 22 Counter H4 stopped collecting accurate data after
Wednesday, August 17, 2016. Counter H4 did not collect accurate data on Thursday, August 18, 2016 or Friday, August 19, 2016. It stopped collecting data at 6:00 a.m. on Friday, August 19, 2016.
Average Daily Usage (Weekday) 22 Average Daily Usage (Weekend) 21
*Weather conditions recorded at KHOU.
0
5
10
15
20
25
30
Daily Usage
Busiest Day Monday, August 15
28 users
Least Busy Day Sunday, August 13
13 users
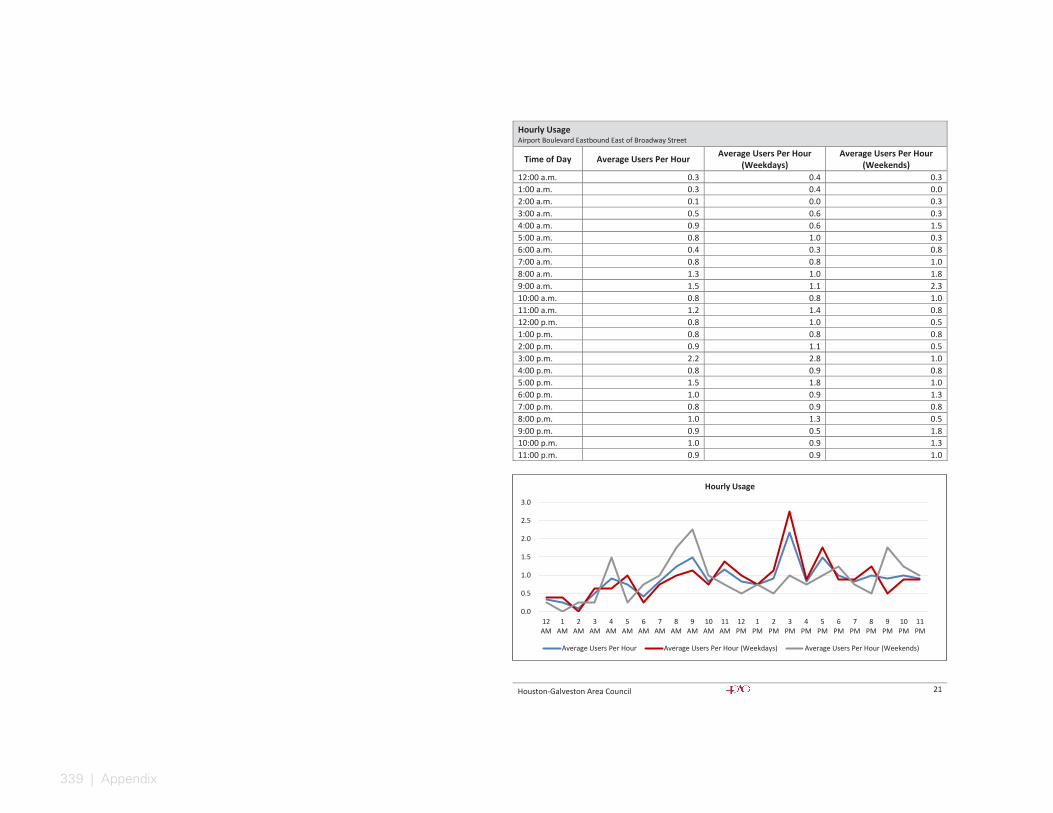
339 | Appendix
Houston-Galveston Area Council 21
Hourly Usage Airport Boulevard Eastbound East of Broadway Street
Time of Day Average Users Per Hour Average Users Per Hour (Weekdays)
Average Users Per Hour (Weekends)
12:00 a.m. 0.3 0.4 0.3 1:00 a.m. 0.3 0.4 0.0 2:00 a.m. 0.1 0.0 0.3 3:00 a.m. 0.5 0.6 0.3 4:00 a.m. 0.9 0.6 1.5 5:00 a.m. 0.8 1.0 0.3 6:00 a.m. 0.4 0.3 0.8 7:00 a.m. 0.8 0.8 1.0 8:00 a.m. 1.3 1.0 1.8 9:00 a.m. 1.5 1.1 2.3 10:00 a.m. 0.8 0.8 1.0 11:00 a.m. 1.2 1.4 0.8 12:00 p.m. 0.8 1.0 0.5 1:00 p.m. 0.8 0.8 0.8 2:00 p.m. 0.9 1.1 0.5 3:00 p.m. 2.2 2.8 1.0 4:00 p.m. 0.8 0.9 0.8 5:00 p.m. 1.5 1.8 1.0 6:00 p.m. 1.0 0.9 1.3 7:00 p.m. 0.8 0.9 0.8 8:00 p.m. 1.0 1.3 0.5 9:00 p.m. 0.9 0.5 1.8 10:00 p.m. 1.0 0.9 1.3 11:00 p.m. 0.9 0.9 1.0
0.0
0.5
1.0
1.5
2.0
2.5
3.0
12AM
1AM
2AM
3AM
4AM
5AM
6AM
7AM
8AM
9AM
10AM
11AM
12PM
1PM
2PM
3PM
4PM
5PM
6PM
7PM
8PM
9PM
10PM
11PM
Hourly Usage
Average Users Per Hour Average Users Per Hour (Weekdays) Average Users Per Hour (Weekends)
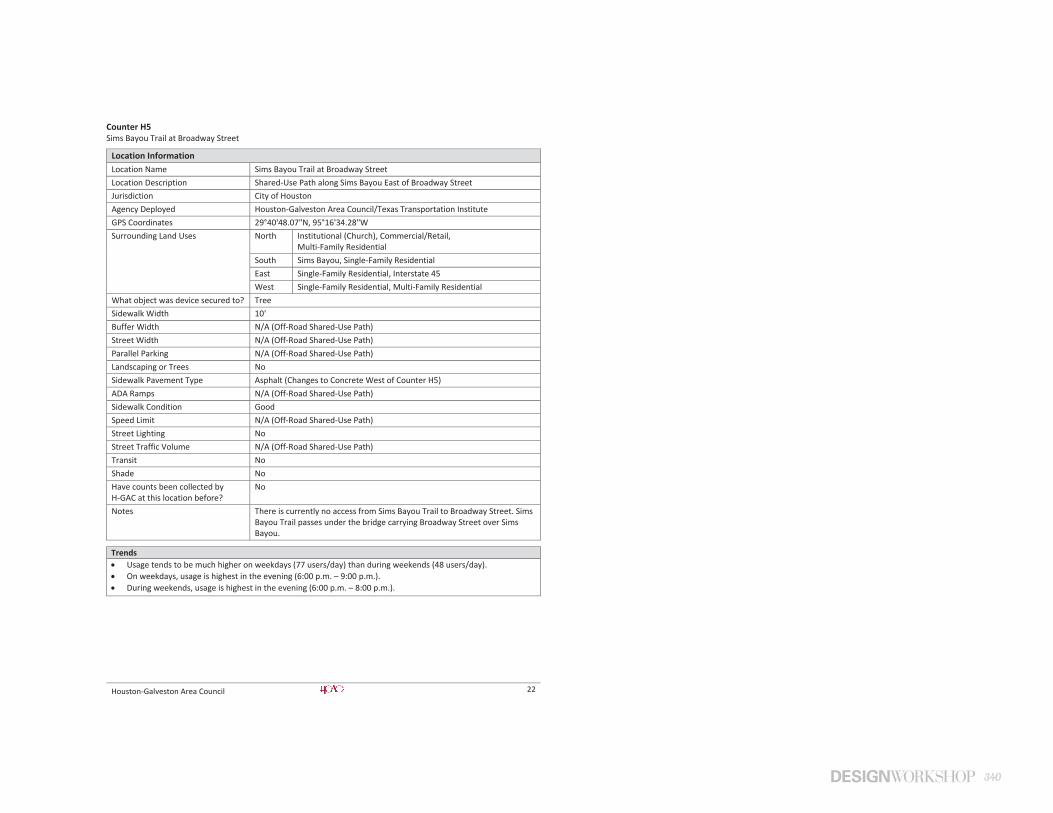
340
Houston-Galveston Area Council 22
Counter H5 Sims Bayou Trail at Broadway Street
Location Information Location Name Sims Bayou Trail at Broadway Street Location Description Shared-Use Path along Sims Bayou East of Broadway Street Jurisdiction City of Houston Agency Deployed Houston-Galveston Area Council/Texas Transportation Institute GPS Coordinates 29°40'48.07"N, 95°16'34.28"W Surrounding Land Uses North Institutional (Church), Commercial/Retail,
Multi-Family Residential South Sims Bayou, Single-Family Residential East Single-Family Residential, Interstate 45 West Single-Family Residential, Multi-Family Residential
What object was device secured to? Tree Sidewalk Width 10' Buffer Width N/A (Off-Road Shared-Use Path) Street Width N/A (Off-Road Shared-Use Path) Parallel Parking N/A (Off-Road Shared-Use Path) Landscaping or Trees No Sidewalk Pavement Type Asphalt (Changes to Concrete West of Counter H5) ADA Ramps N/A (Off-Road Shared-Use Path) Sidewalk Condition Good Speed Limit N/A (Off-Road Shared-Use Path) Street Lighting No Street Traffic Volume N/A (Off-Road Shared-Use Path) Transit No Shade No Have counts been collected by H-GAC at this location before?
No
Notes There is currently no access from Sims Bayou Trail to Broadway Street. Sims Bayou Trail passes under the bridge carrying Broadway Street over Sims Bayou.
Trends Usage tends to be much higher on weekdays (77 users/day) than during weekends (48 users/day). On weekdays, usage is highest in the evening (6:00 p.m. – 9:00 p.m.). During weekends, usage is highest in the evening (6:00 p.m. – 8:00 p.m.).

341 | Appendix
Houston-Galveston Area Council 23
Location Information: Photos
Image 9: Sims Bayou Trail at Broadway Street
Facing East
Image 10: Sims Bayou Trail at Broadway Street
Facing West
Location Information: Map
H5 4
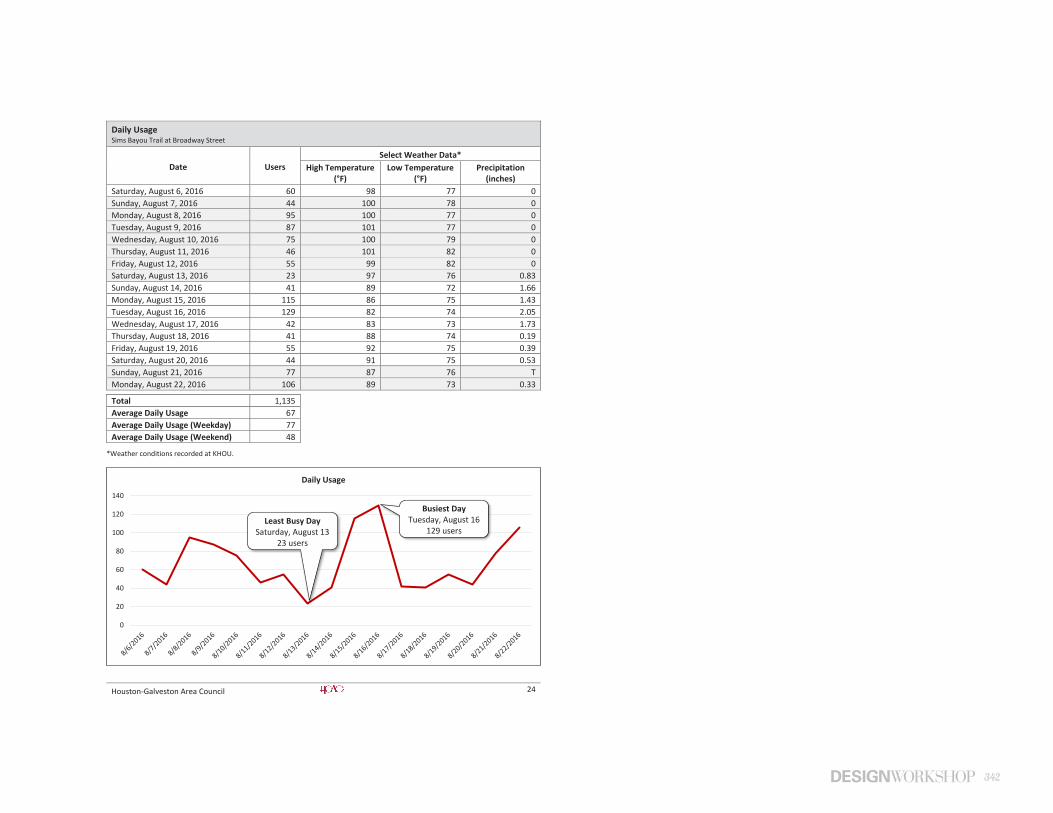
342
Houston-Galveston Area Council 24
Daily Usage Sims Bayou Trail at Broadway Street
Date Users Select Weather Data*
High Temperature (°F)
Low Temperature (°F)
Precipitation (inches)
Saturday, August 6, 2016 60 98 77 0 Sunday, August 7, 2016 44 100 78 0 Monday, August 8, 2016 95 100 77 0 Tuesday, August 9, 2016 87 101 77 0 Wednesday, August 10, 2016 75 100 79 0 Thursday, August 11, 2016 46 101 82 0 Friday, August 12, 2016 55 99 82 0 Saturday, August 13, 2016 23 97 76 0.83 Sunday, August 14, 2016 41 89 72 1.66 Monday, August 15, 2016 115 86 75 1.43 Tuesday, August 16, 2016 129 82 74 2.05 Wednesday, August 17, 2016 42 83 73 1.73 Thursday, August 18, 2016 41 88 74 0.19 Friday, August 19, 2016 55 92 75 0.39 Saturday, August 20, 2016 44 91 75 0.53 Sunday, August 21, 2016 77 87 76 T Monday, August 22, 2016 106 89 73 0.33
Total 1,135 Average Daily Usage 67 Average Daily Usage (Weekday) 77 Average Daily Usage (Weekend) 48
*Weather conditions recorded at KHOU.
0
20
40
60
80
100
120
140
Daily Usage
Busiest Day Tuesday, August 16
129 users
Least Busy Day Saturday, August 13
23 users
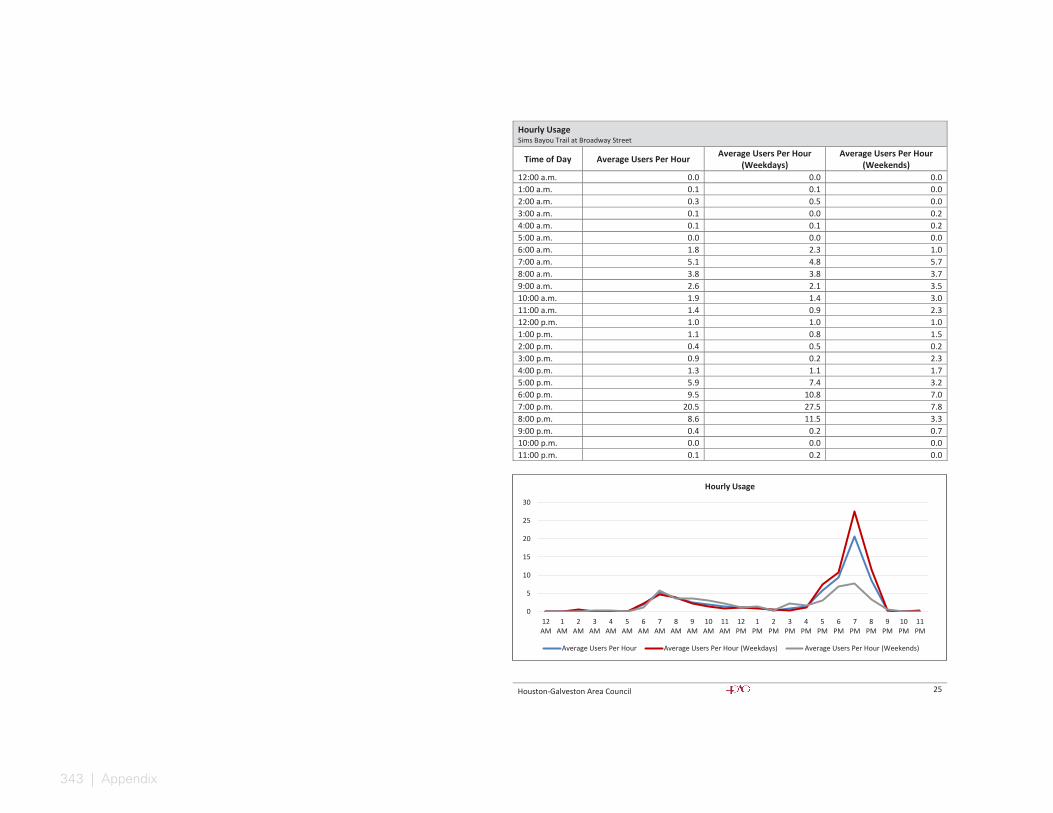
343 | Appendix
Houston-Galveston Area Council 25
Hourly Usage Sims Bayou Trail at Broadway Street
Time of Day Average Users Per Hour Average Users Per Hour (Weekdays)
Average Users Per Hour (Weekends)
12:00 a.m. 0.0 0.0 0.0 1:00 a.m. 0.1 0.1 0.0 2:00 a.m. 0.3 0.5 0.0 3:00 a.m. 0.1 0.0 0.2 4:00 a.m. 0.1 0.1 0.2 5:00 a.m. 0.0 0.0 0.0 6:00 a.m. 1.8 2.3 1.0 7:00 a.m. 5.1 4.8 5.7 8:00 a.m. 3.8 3.8 3.7 9:00 a.m. 2.6 2.1 3.5 10:00 a.m. 1.9 1.4 3.0 11:00 a.m. 1.4 0.9 2.3 12:00 p.m. 1.0 1.0 1.0 1:00 p.m. 1.1 0.8 1.5 2:00 p.m. 0.4 0.5 0.2 3:00 p.m. 0.9 0.2 2.3 4:00 p.m. 1.3 1.1 1.7 5:00 p.m. 5.9 7.4 3.2 6:00 p.m. 9.5 10.8 7.0 7:00 p.m. 20.5 27.5 7.8 8:00 p.m. 8.6 11.5 3.3 9:00 p.m. 0.4 0.2 0.7 10:00 p.m. 0.0 0.0 0.0 11:00 p.m. 0.1 0.2 0.0
0
5
10
15
20
25
30
12AM
1AM
2AM
3AM
4AM
5AM
6AM
7AM
8AM
9AM
10AM
11AM
12PM
1PM
2PM
3PM
4PM
5PM
6PM
7PM
8PM
9PM
10PM
11PM
Hourly Usage
Average Users Per Hour Average Users Per Hour (Weekdays) Average Users Per Hour (Weekends)
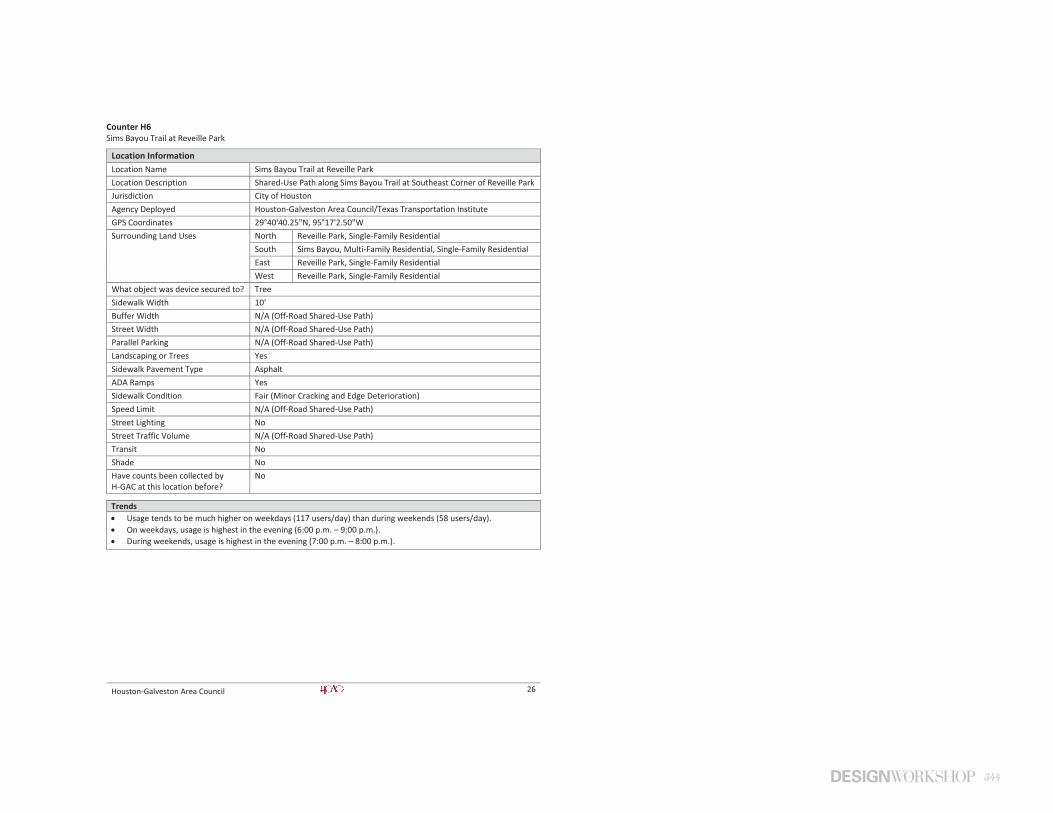
344
Houston-Galveston Area Council 26
Counter H6 Sims Bayou Trail at Reveille Park
Location Information Location Name Sims Bayou Trail at Reveille Park Location Description Shared-Use Path along Sims Bayou Trail at Southeast Corner of Reveille Park Jurisdiction City of Houston Agency Deployed Houston-Galveston Area Council/Texas Transportation Institute GPS Coordinates 29°40'40.25"N, 95°17'2.50"W Surrounding Land Uses North Reveille Park, Single-Family Residential
South Sims Bayou, Multi-Family Residential, Single-Family Residential East Reveille Park, Single-Family Residential West Reveille Park, Single-Family Residential
What object was device secured to? Tree Sidewalk Width 10' Buffer Width N/A (Off-Road Shared-Use Path) Street Width N/A (Off-Road Shared-Use Path) Parallel Parking N/A (Off-Road Shared-Use Path) Landscaping or Trees Yes Sidewalk Pavement Type Asphalt ADA Ramps Yes Sidewalk Condition Fair (Minor Cracking and Edge Deterioration) Speed Limit N/A (Off-Road Shared-Use Path) Street Lighting No Street Traffic Volume N/A (Off-Road Shared-Use Path) Transit No Shade No Have counts been collected by H-GAC at this location before?
No
Trends Usage tends to be much higher on weekdays (117 users/day) than during weekends (58 users/day). On weekdays, usage is highest in the evening (6:00 p.m. – 9:00 p.m.). During weekends, usage is highest in the evening (7:00 p.m. – 8:00 p.m.).

345 | Appendix
Houston-Galveston Area Council 27
Location Information: Map
Location Information: Photos
Image 11: Sims Bayou Trail at Reveille Park Facing East
Image 12: Sims Bayou Trail at Reveille Park Facing West
H6
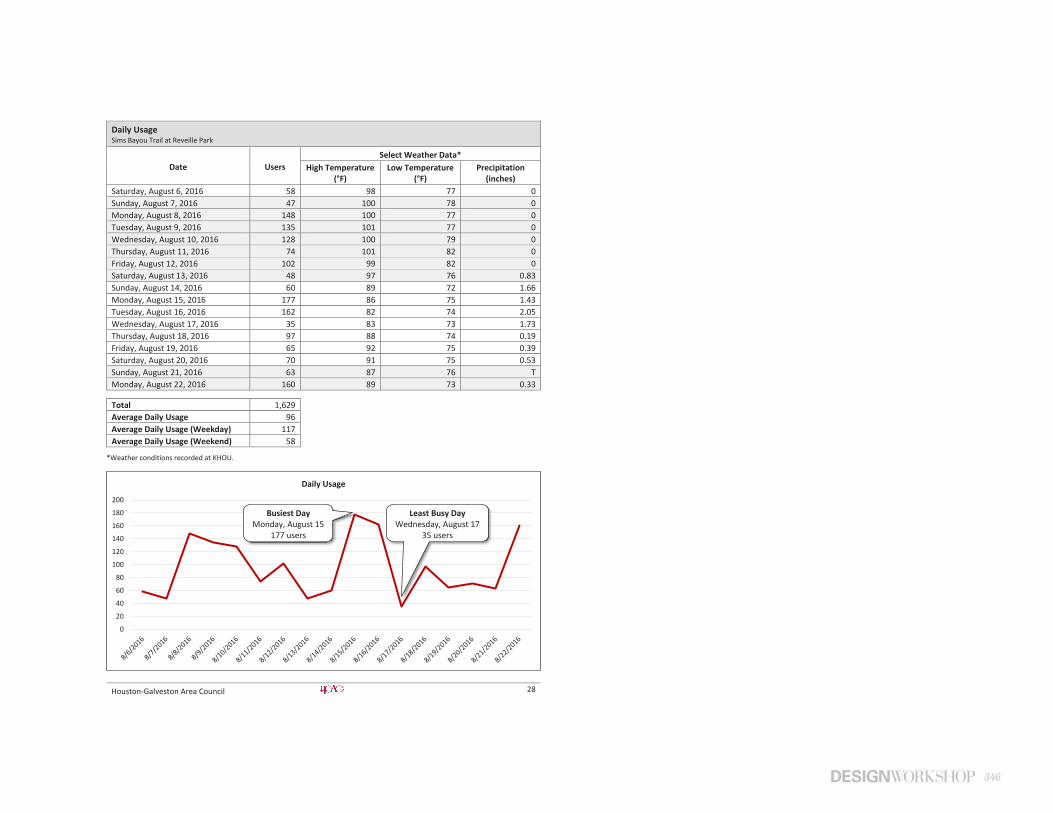
346
Houston-Galveston Area Council 28
Daily Usage Sims Bayou Trail at Reveille Park
Date Users Select Weather Data*
High Temperature (°F)
Low Temperature (°F)
Precipitation (inches)
Saturday, August 6, 2016 58 98 77 0 Sunday, August 7, 2016 47 100 78 0 Monday, August 8, 2016 148 100 77 0 Tuesday, August 9, 2016 135 101 77 0 Wednesday, August 10, 2016 128 100 79 0 Thursday, August 11, 2016 74 101 82 0 Friday, August 12, 2016 102 99 82 0 Saturday, August 13, 2016 48 97 76 0.83 Sunday, August 14, 2016 60 89 72 1.66 Monday, August 15, 2016 177 86 75 1.43 Tuesday, August 16, 2016 162 82 74 2.05 Wednesday, August 17, 2016 35 83 73 1.73 Thursday, August 18, 2016 97 88 74 0.19 Friday, August 19, 2016 65 92 75 0.39 Saturday, August 20, 2016 70 91 75 0.53 Sunday, August 21, 2016 63 87 76 T Monday, August 22, 2016 160 89 73 0.33
Total 1,629 Average Daily Usage 96 Average Daily Usage (Weekday) 117 Average Daily Usage (Weekend) 58
*Weather conditions recorded at KHOU.
0
20
40
60
80
100
120
140
160
180
200
Daily Usage
Busiest Day Monday, August 15
177 users
Least Busy Day Wednesday, August 17
35 users
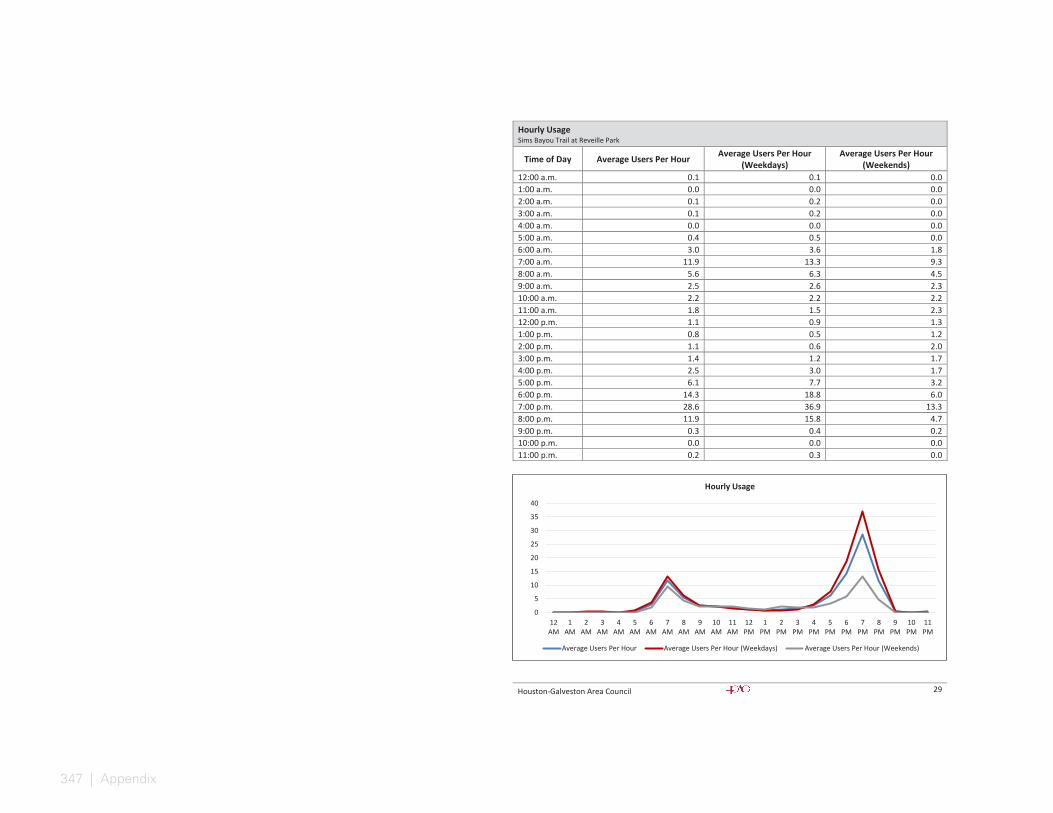
347 | Appendix
Houston-Galveston Area Council 29
Hourly Usage Sims Bayou Trail at Reveille Park
Time of Day Average Users Per Hour Average Users Per Hour (Weekdays)
Average Users Per Hour (Weekends)
12:00 a.m. 0.1 0.1 0.0 1:00 a.m. 0.0 0.0 0.0 2:00 a.m. 0.1 0.2 0.0 3:00 a.m. 0.1 0.2 0.0 4:00 a.m. 0.0 0.0 0.0 5:00 a.m. 0.4 0.5 0.0 6:00 a.m. 3.0 3.6 1.8 7:00 a.m. 11.9 13.3 9.3 8:00 a.m. 5.6 6.3 4.5 9:00 a.m. 2.5 2.6 2.3 10:00 a.m. 2.2 2.2 2.2 11:00 a.m. 1.8 1.5 2.3 12:00 p.m. 1.1 0.9 1.3 1:00 p.m. 0.8 0.5 1.2 2:00 p.m. 1.1 0.6 2.0 3:00 p.m. 1.4 1.2 1.7 4:00 p.m. 2.5 3.0 1.7 5:00 p.m. 6.1 7.7 3.2 6:00 p.m. 14.3 18.8 6.0 7:00 p.m. 28.6 36.9 13.3 8:00 p.m. 11.9 15.8 4.7 9:00 p.m. 0.3 0.4 0.2 10:00 p.m. 0.0 0.0 0.0 11:00 p.m. 0.2 0.3 0.0
0
5
10
15
20
25
30
35
40
12AM
1AM
2AM
3AM
4AM
5AM
6AM
7AM
8AM
9AM
10AM
11AM
12PM
1PM
2PM
3PM
4PM
5PM
6PM
7PM
8PM
9PM
10PM
11PM
Hourly Usage
Average Users Per Hour Average Users Per Hour (Weekdays) Average Users Per Hour (Weekends)

348
Houston-Galveston Area Council 30
Counter H7 Telephone Road Northbound at Oak Vista Street
Location Information Location Name Telephone Road Northbound at Oak Vista Street Location Description Sidewalk along Telephone Road Northbound between Oak Vista Street and
Vista Verde Street Jurisdiction City of Houston Agency Deployed Houston-Galveston Area Council/Texas Transportation Institute GPS Coordinates 29°40'44.13"N, 95°17'31.24"W Surrounding Land Uses North Single-Family Residential, Commercial/Retail
South Single-Family Residential, Industrial, Commercial/Retail East Single-Family Residential West Multi-Family Residential, Commercial/Retail,
JP Cornelius Elementary School, Single-Family Residential What object was device secured to? Light Post (#490367) Sidewalk Width 4' Buffer Width 4' Street Width Six-Lane Divided Roadway Parallel Parking No Landscaping or Trees No Sidewalk Pavement Type Concrete ADA Ramps Yes Sidewalk Condition Fair (Overgrown Vegetation) Speed Limit 35 miles per hour Street Lighting Yes Street Traffic Volume 26,629 (5906 Telephone Road: City of Houston – 2009) Transit Yes
(METRO Bus Stop 30' North at Telephone Road Northbound/Oak Vista Street)
Shade No Have counts been collected by H-GAC at this location before?
No
Trends Usage tends to be slightly higher on weekdays (18 users/day) than during weekends (15 users/day). On weekdays, usage stays relatively steady throughout daylight hours. During weekends, usage increases slightly in the late afternoon (3:00 p.m. – 5:00 p.m.).
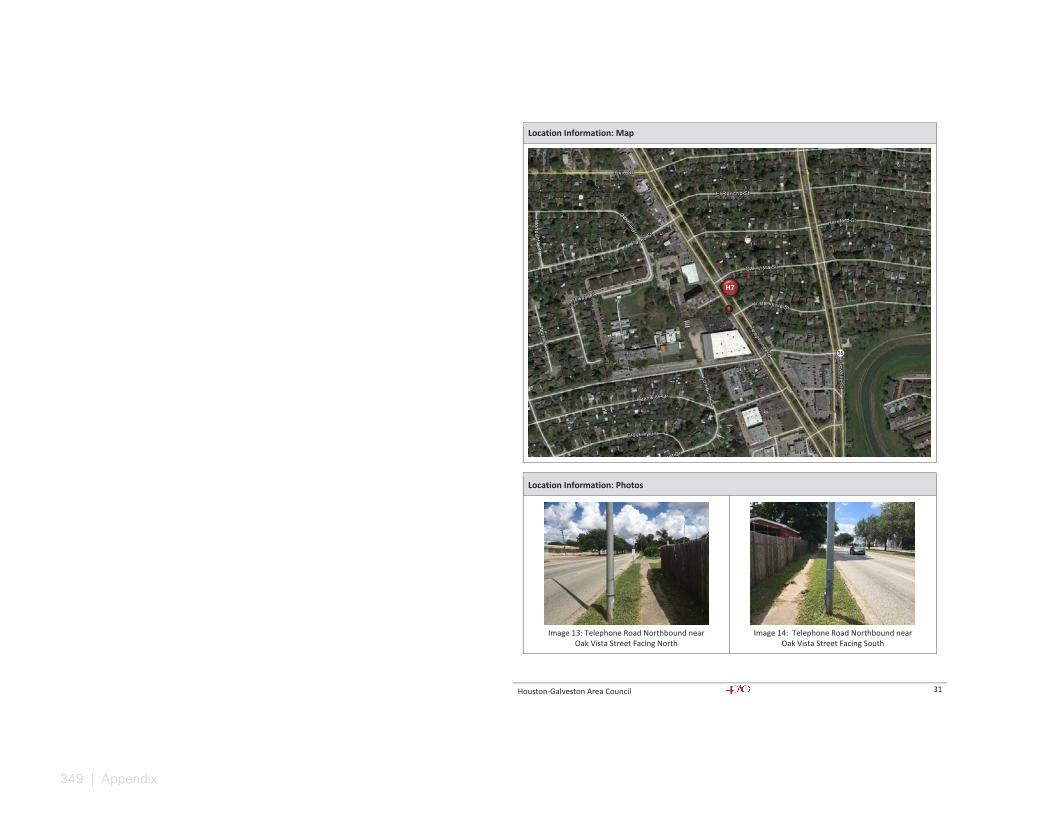
349 | Appendix
Houston-Galveston Area Council 31
Location Information: Map
Location Information: Photos
Image 13: Telephone Road Northbound near
Oak Vista Street Facing North
Image 14: Telephone Road Northbound near
Oak Vista Street Facing South
H7 4
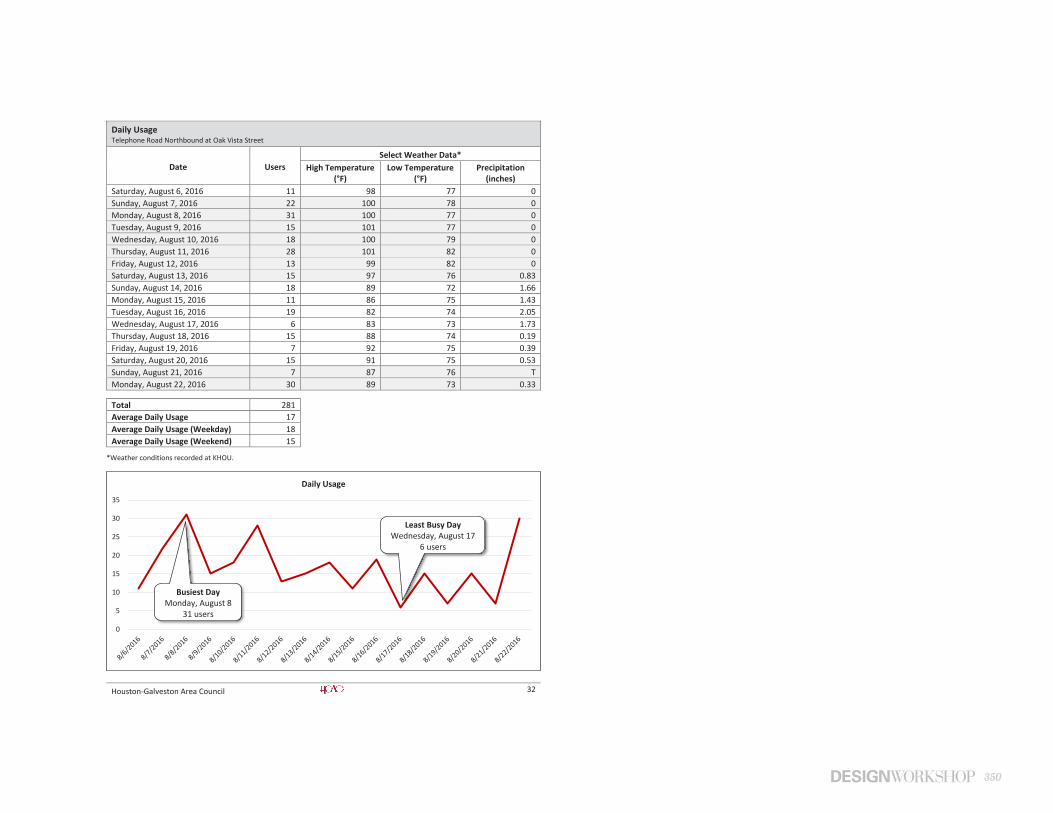
350
Houston-Galveston Area Council 32
Daily Usage Telephone Road Northbound at Oak Vista Street
Date Users Select Weather Data*
High Temperature (°F)
Low Temperature (°F)
Precipitation (inches)
Saturday, August 6, 2016 11 98 77 0 Sunday, August 7, 2016 22 100 78 0 Monday, August 8, 2016 31 100 77 0 Tuesday, August 9, 2016 15 101 77 0 Wednesday, August 10, 2016 18 100 79 0 Thursday, August 11, 2016 28 101 82 0 Friday, August 12, 2016 13 99 82 0 Saturday, August 13, 2016 15 97 76 0.83 Sunday, August 14, 2016 18 89 72 1.66 Monday, August 15, 2016 11 86 75 1.43 Tuesday, August 16, 2016 19 82 74 2.05 Wednesday, August 17, 2016 6 83 73 1.73 Thursday, August 18, 2016 15 88 74 0.19 Friday, August 19, 2016 7 92 75 0.39 Saturday, August 20, 2016 15 91 75 0.53 Sunday, August 21, 2016 7 87 76 T Monday, August 22, 2016 30 89 73 0.33
Total 281 Average Daily Usage 17 Average Daily Usage (Weekday) 18 Average Daily Usage (Weekend) 15
*Weather conditions recorded at KHOU.
0
5
10
15
20
25
30
35
Daily Usage
Busiest Day Monday, August 8
31 users
Least Busy Day Wednesday, August 17
6 users
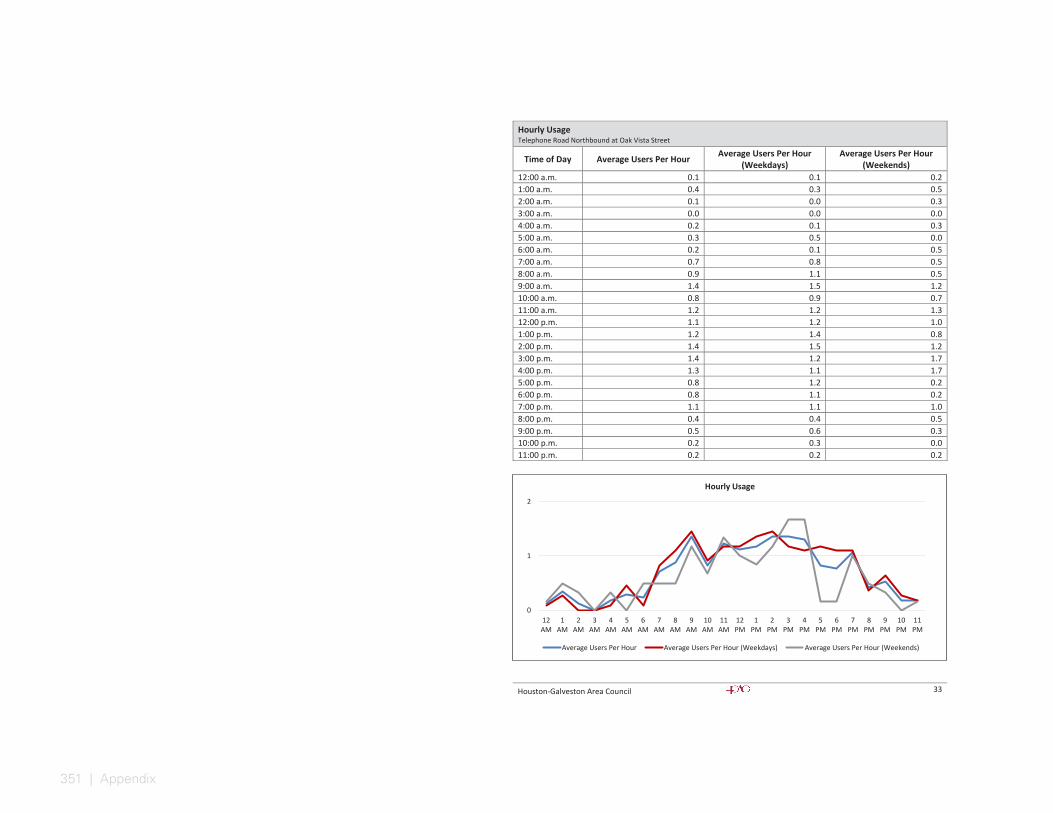
351 | Appendix
Houston-Galveston Area Council 33
Hourly Usage Telephone Road Northbound at Oak Vista Street
Time of Day Average Users Per Hour Average Users Per Hour (Weekdays)
Average Users Per Hour (Weekends)
12:00 a.m. 0.1 0.1 0.2 1:00 a.m. 0.4 0.3 0.5 2:00 a.m. 0.1 0.0 0.3 3:00 a.m. 0.0 0.0 0.0 4:00 a.m. 0.2 0.1 0.3 5:00 a.m. 0.3 0.5 0.0 6:00 a.m. 0.2 0.1 0.5 7:00 a.m. 0.7 0.8 0.5 8:00 a.m. 0.9 1.1 0.5 9:00 a.m. 1.4 1.5 1.2 10:00 a.m. 0.8 0.9 0.7 11:00 a.m. 1.2 1.2 1.3 12:00 p.m. 1.1 1.2 1.0 1:00 p.m. 1.2 1.4 0.8 2:00 p.m. 1.4 1.5 1.2 3:00 p.m. 1.4 1.2 1.7 4:00 p.m. 1.3 1.1 1.7 5:00 p.m. 0.8 1.2 0.2 6:00 p.m. 0.8 1.1 0.2 7:00 p.m. 1.1 1.1 1.0 8:00 p.m. 0.4 0.4 0.5 9:00 p.m. 0.5 0.6 0.3 10:00 p.m. 0.2 0.3 0.0 11:00 p.m. 0.2 0.2 0.2
0
1
2
12AM
1AM
2AM
3AM
4AM
5AM
6AM
7AM
8AM
9AM
10AM
11AM
12PM
1PM
2PM
3PM
4PM
5PM
6PM
7PM
8PM
9PM
10PM
11PM
Hourly Usage
Average Users Per Hour Average Users Per Hour (Weekdays) Average Users Per Hour (Weekends)
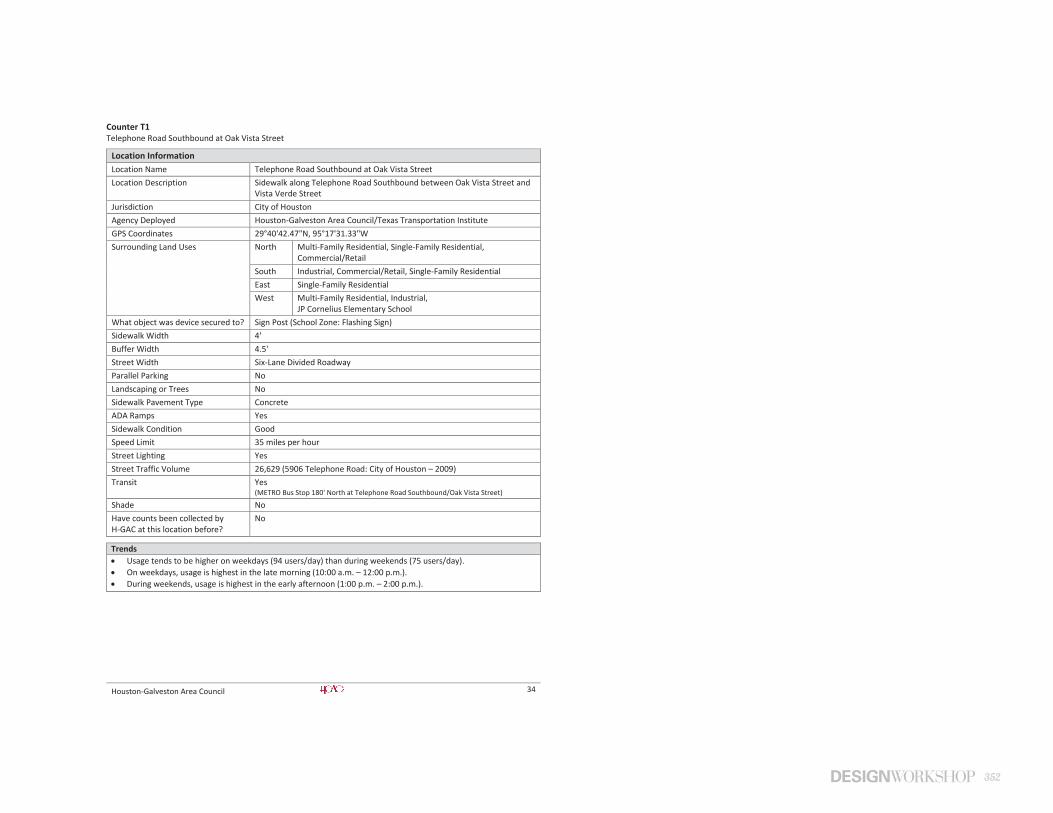
352
Houston-Galveston Area Council 34
Counter T1 Telephone Road Southbound at Oak Vista Street
Location Information Location Name Telephone Road Southbound at Oak Vista Street Location Description Sidewalk along Telephone Road Southbound between Oak Vista Street and
Vista Verde Street Jurisdiction City of Houston Agency Deployed Houston-Galveston Area Council/Texas Transportation Institute GPS Coordinates 29°40'42.47"N, 95°17'31.33"W Surrounding Land Uses North Multi-Family Residential, Single-Family Residential,
Commercial/Retail South Industrial, Commercial/Retail, Single-Family Residential East Single-Family Residential West Multi-Family Residential, Industrial,
JP Cornelius Elementary School What object was device secured to? Sign Post (School Zone: Flashing Sign) Sidewalk Width 4' Buffer Width 4.5' Street Width Six-Lane Divided Roadway Parallel Parking No Landscaping or Trees No Sidewalk Pavement Type Concrete ADA Ramps Yes Sidewalk Condition Good Speed Limit 35 miles per hour Street Lighting Yes Street Traffic Volume 26,629 (5906 Telephone Road: City of Houston – 2009) Transit Yes
(METRO Bus Stop 180' North at Telephone Road Southbound/Oak Vista Street) Shade No Have counts been collected by H-GAC at this location before?
No
Trends Usage tends to be higher on weekdays (94 users/day) than during weekends (75 users/day). On weekdays, usage is highest in the late morning (10:00 a.m. – 12:00 p.m.). During weekends, usage is highest in the early afternoon (1:00 p.m. – 2:00 p.m.).
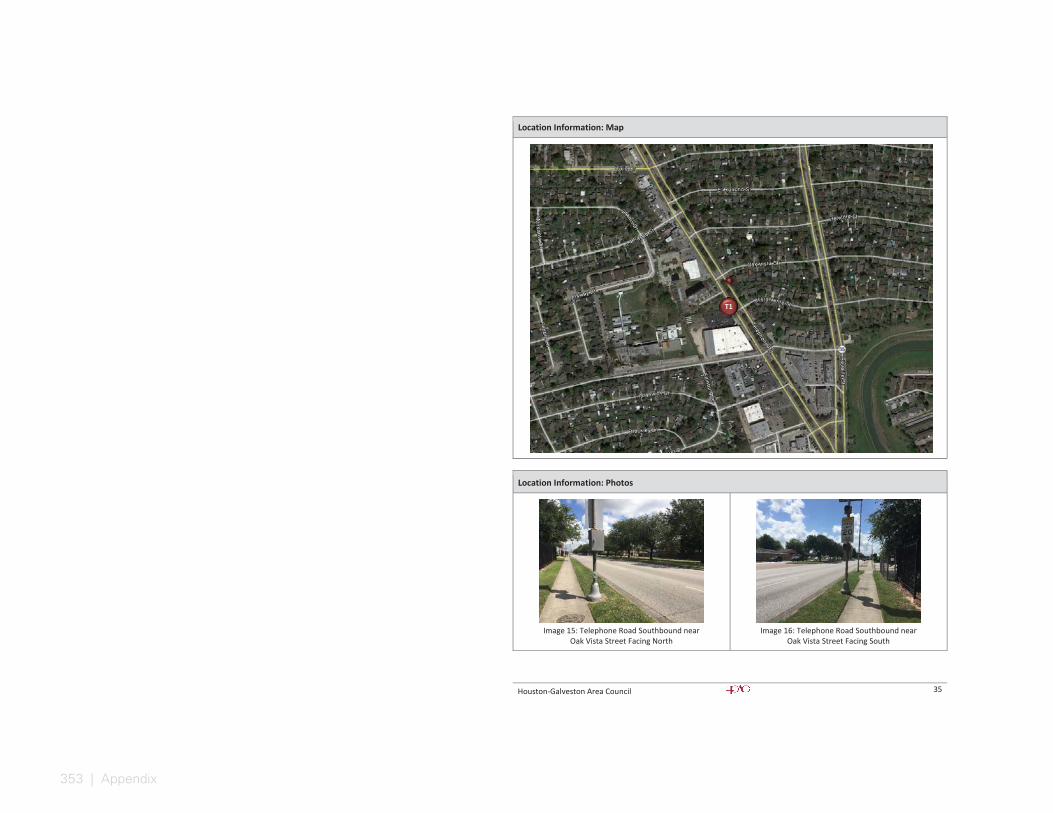
353 | Appendix
Houston-Galveston Area Council 35
Location Information: Map
Location Information: Photos
Image 15: Telephone Road Southbound near
Oak Vista Street Facing North
Image 16: Telephone Road Southbound near
Oak Vista Street Facing South
T1 4
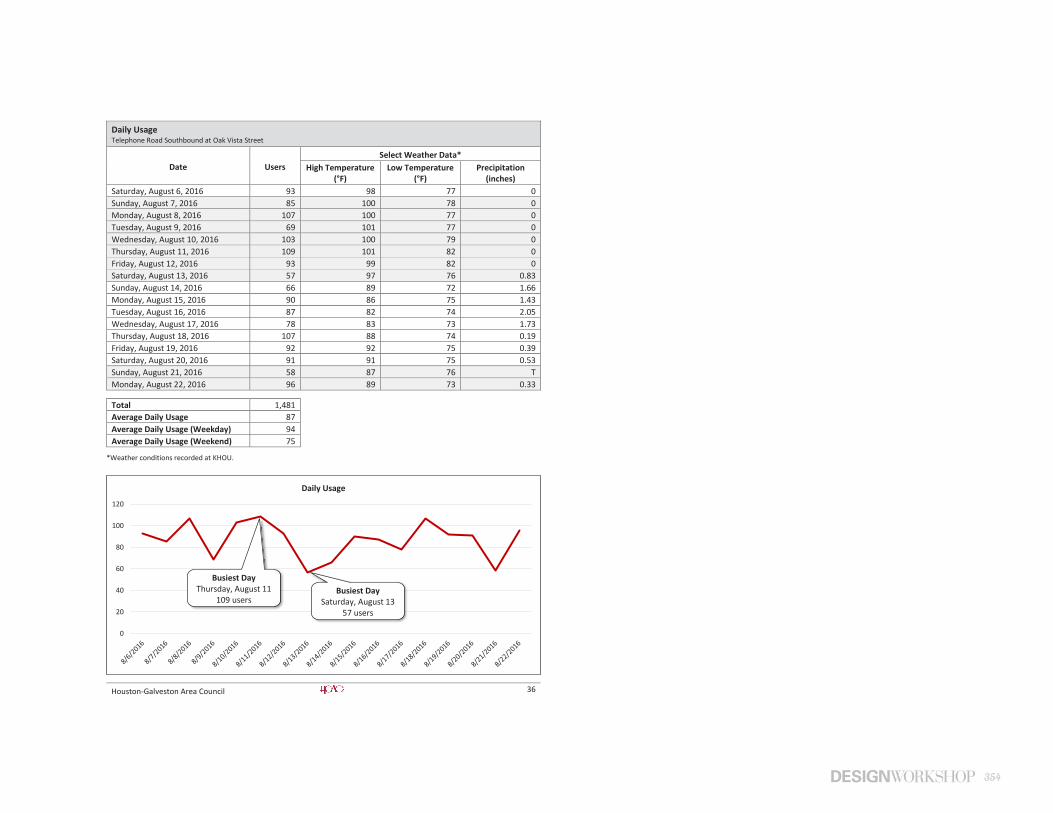
354
Houston-Galveston Area Council 36
Daily Usage Telephone Road Southbound at Oak Vista Street
Date Users Select Weather Data*
High Temperature (°F)
Low Temperature (°F)
Precipitation (inches)
Saturday, August 6, 2016 93 98 77 0 Sunday, August 7, 2016 85 100 78 0 Monday, August 8, 2016 107 100 77 0 Tuesday, August 9, 2016 69 101 77 0 Wednesday, August 10, 2016 103 100 79 0 Thursday, August 11, 2016 109 101 82 0 Friday, August 12, 2016 93 99 82 0 Saturday, August 13, 2016 57 97 76 0.83 Sunday, August 14, 2016 66 89 72 1.66 Monday, August 15, 2016 90 86 75 1.43 Tuesday, August 16, 2016 87 82 74 2.05 Wednesday, August 17, 2016 78 83 73 1.73 Thursday, August 18, 2016 107 88 74 0.19 Friday, August 19, 2016 92 92 75 0.39 Saturday, August 20, 2016 91 91 75 0.53 Sunday, August 21, 2016 58 87 76 T Monday, August 22, 2016 96 89 73 0.33
Total 1,481 Average Daily Usage 87 Average Daily Usage (Weekday) 94 Average Daily Usage (Weekend) 75
*Weather conditions recorded at KHOU.
0
20
40
60
80
100
120
Daily Usage
Busiest Day Thursday, August 11
109 users
Busiest Day Saturday, August 13
57 users
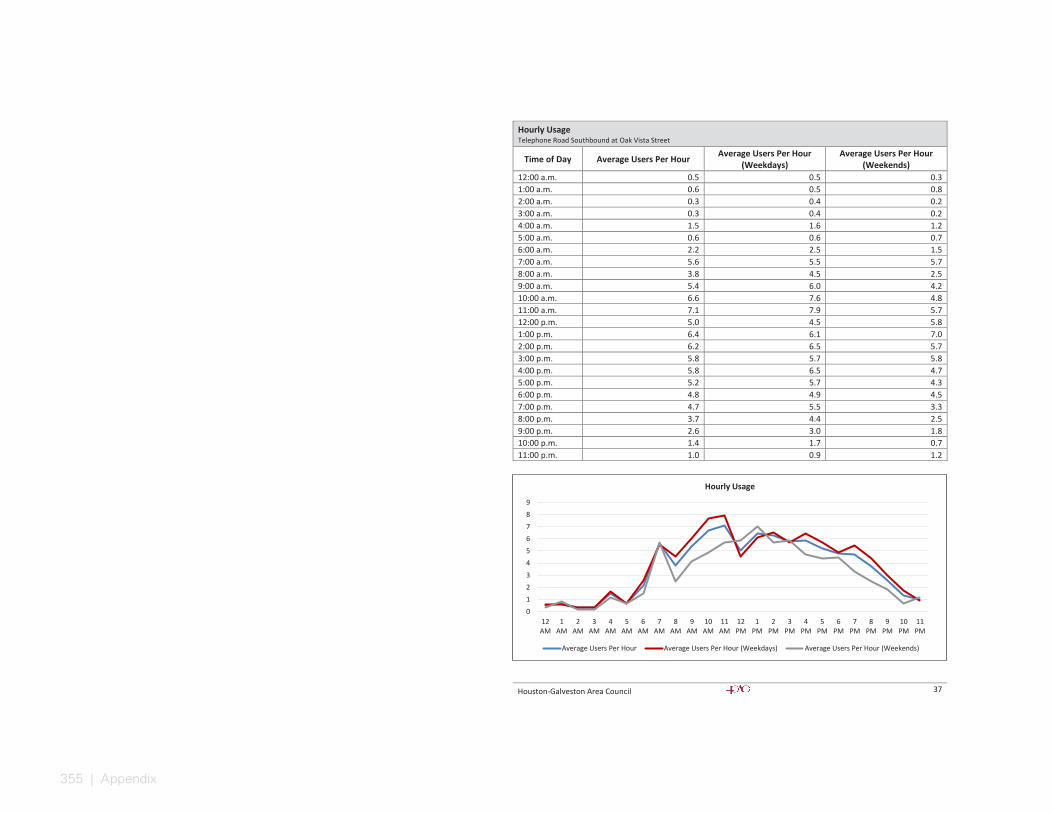
355 | Appendix
Houston-Galveston Area Council 37
Hourly Usage Telephone Road Southbound at Oak Vista Street
Time of Day Average Users Per Hour Average Users Per Hour (Weekdays)
Average Users Per Hour (Weekends)
12:00 a.m. 0.5 0.5 0.3 1:00 a.m. 0.6 0.5 0.8 2:00 a.m. 0.3 0.4 0.2 3:00 a.m. 0.3 0.4 0.2 4:00 a.m. 1.5 1.6 1.2 5:00 a.m. 0.6 0.6 0.7 6:00 a.m. 2.2 2.5 1.5 7:00 a.m. 5.6 5.5 5.7 8:00 a.m. 3.8 4.5 2.5 9:00 a.m. 5.4 6.0 4.2 10:00 a.m. 6.6 7.6 4.8 11:00 a.m. 7.1 7.9 5.7 12:00 p.m. 5.0 4.5 5.8 1:00 p.m. 6.4 6.1 7.0 2:00 p.m. 6.2 6.5 5.7 3:00 p.m. 5.8 5.7 5.8 4:00 p.m. 5.8 6.5 4.7 5:00 p.m. 5.2 5.7 4.3 6:00 p.m. 4.8 4.9 4.5 7:00 p.m. 4.7 5.5 3.3 8:00 p.m. 3.7 4.4 2.5 9:00 p.m. 2.6 3.0 1.8 10:00 p.m. 1.4 1.7 0.7 11:00 p.m. 1.0 0.9 1.2
0123456789
12AM
1AM
2AM
3AM
4AM
5AM
6AM
7AM
8AM
9AM
10AM
11AM
12PM
1PM
2PM
3PM
4PM
5PM
6PM
7PM
8PM
9PM
10PM
11PM
Hourly Usage
Average Users Per Hour Average Users Per Hour (Weekdays) Average Users Per Hour (Weekends)

356
Houston-Galveston Area Council 38
Counter T2 Telephone Road Southbound at Sims Bayou
Location Information Location Name Telephone Road Southbound at Sims Bayou Location Description Sidewalk along Telephone Road Southbound North of Sims Bayou Bridge Jurisdiction City of Houston Agency Deployed Houston-Galveston Area Council/Texas Transportation Institute GPS Coordinates 29°40'28.80"N, 95°17'21.97"W Surrounding Land Uses North Commercial/Retail
South Sims Bayou, Commercial/Retail East Vacant Land, Sims Bayou West Commercial/Retail, Vacant Land, Single-Family Residential
What object was device secured to? Sign Post (Monroe Park and Ride and I-45 Express Lane) Sidewalk Width 4' Buffer Width 4' Street Width Six- to Eight-Lane Roadway (Multiple Roads Intersect near Counter T2) Parallel Parking No Landscaping or Trees No Sidewalk Pavement Type Concrete ADA Ramps Yes Sidewalk Condition Good Speed Limit 35 miles per hour Street Lighting Yes Street Traffic Volume 22,090 (6300 Telephone Road: TxDOT – 2012) Transit Yes
(METRO Bus Stop 350' North at Telephone Road Southbound/Glenbrook Square Shopping Center Entrance)
Shade No Have counts been collected by H-GAC at this location before?
No
Trends Usage tends to be higher on weekdays (52 users/day) than during weekends (40 users/day). On weekdays, usage is highest in the morning (8:00 a.m. – 9:00 a.m.) and mid-afternoon (2:00 p.m. – 3:00 p.m.).
On several weekdays (especially Mondays), there were spikes in usage: o Monday, August 8, 2016 (8:00 a.m. – 9:00 a.m.): 20 users o Monday, August 15, 2016 (8:00 a.m. – 9:00 a.m.): 19 users o Tuesday, August 16, 2016 (2:00 p.m. – 3:00 p.m.): 28 users o Monday, August 22, 2016 (10:00 a.m. – 11:00 a.m.): 27 users
During weekends, usage is highest midday (11:00 a.m. – 12:00 p.m.).
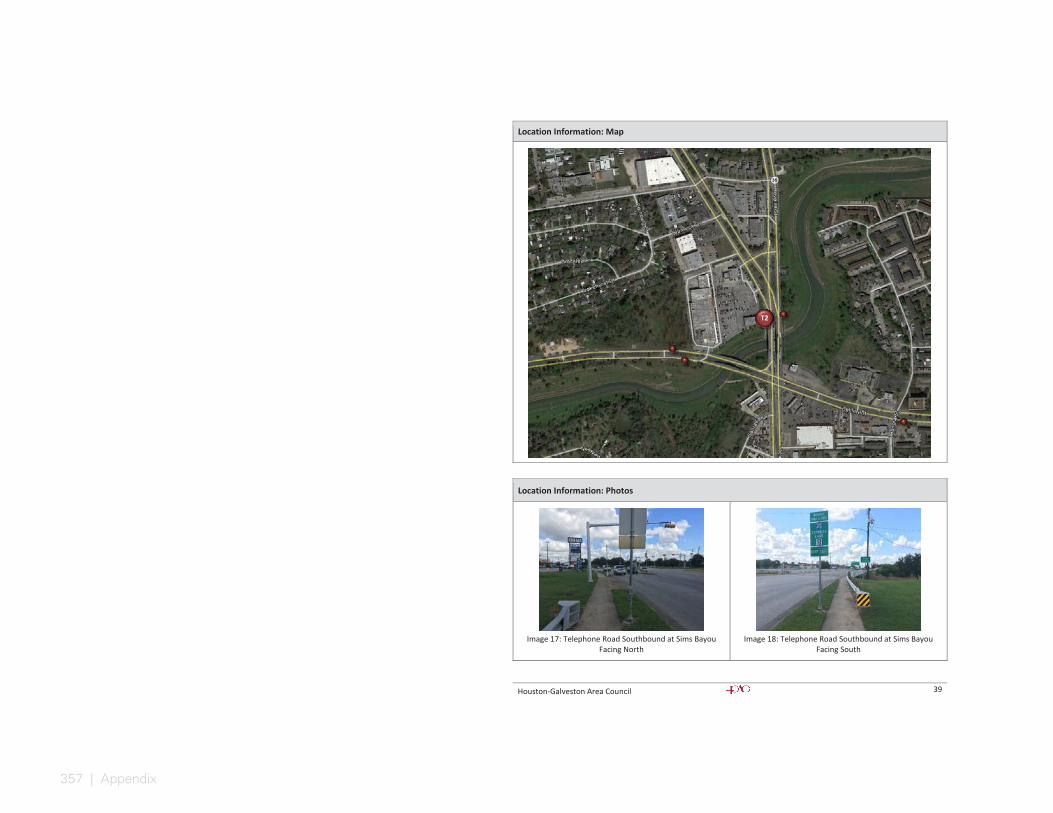
357 | Appendix
Houston-Galveston Area Council 39
Location Information: Map
Location Information: Photos
Image 17: Telephone Road Southbound at Sims Bayou
Facing North
Image 18: Telephone Road Southbound at Sims Bayou
Facing South
T2 4
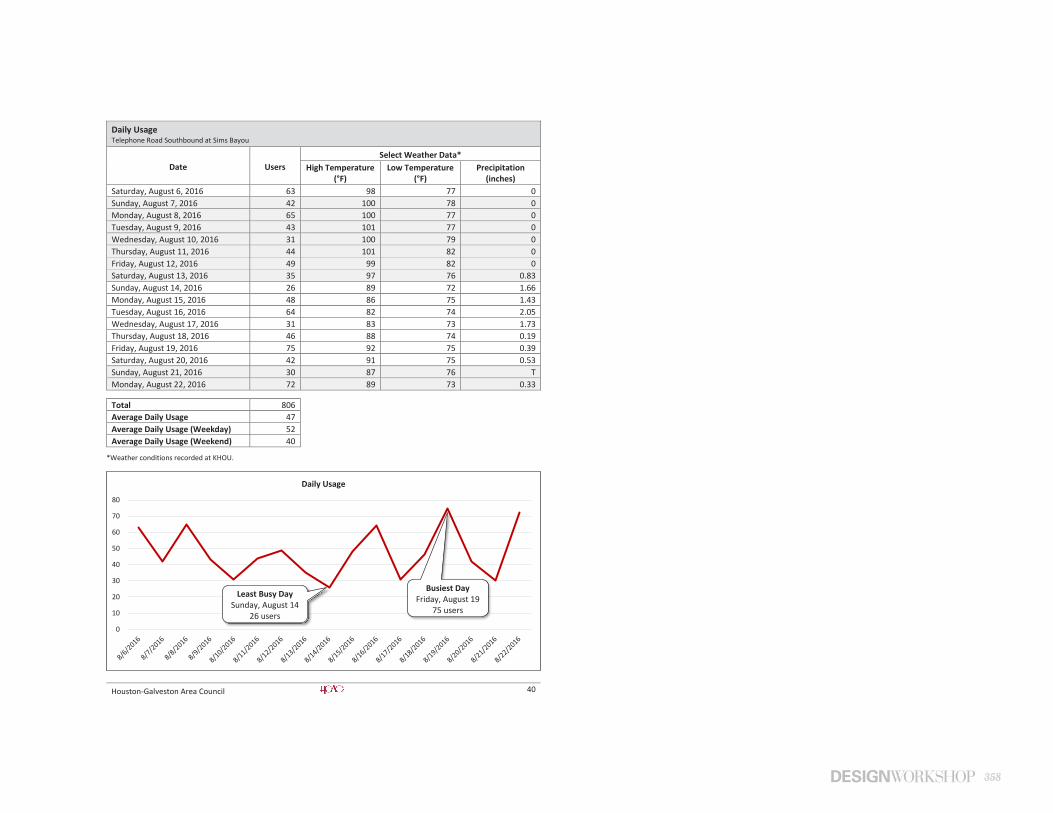
358
Houston-Galveston Area Council 40
Daily Usage Telephone Road Southbound at Sims Bayou
Date Users Select Weather Data*
High Temperature (°F)
Low Temperature (°F)
Precipitation (inches)
Saturday, August 6, 2016 63 98 77 0 Sunday, August 7, 2016 42 100 78 0 Monday, August 8, 2016 65 100 77 0 Tuesday, August 9, 2016 43 101 77 0 Wednesday, August 10, 2016 31 100 79 0 Thursday, August 11, 2016 44 101 82 0 Friday, August 12, 2016 49 99 82 0 Saturday, August 13, 2016 35 97 76 0.83 Sunday, August 14, 2016 26 89 72 1.66 Monday, August 15, 2016 48 86 75 1.43 Tuesday, August 16, 2016 64 82 74 2.05 Wednesday, August 17, 2016 31 83 73 1.73 Thursday, August 18, 2016 46 88 74 0.19 Friday, August 19, 2016 75 92 75 0.39 Saturday, August 20, 2016 42 91 75 0.53 Sunday, August 21, 2016 30 87 76 T Monday, August 22, 2016 72 89 73 0.33
Total 806 Average Daily Usage 47 Average Daily Usage (Weekday) 52 Average Daily Usage (Weekend) 40
*Weather conditions recorded at KHOU.
0
10
20
30
40
50
60
70
80
Daily Usage
Busiest Day Friday, August 19
75 users
Least Busy Day Sunday, August 14
26 users
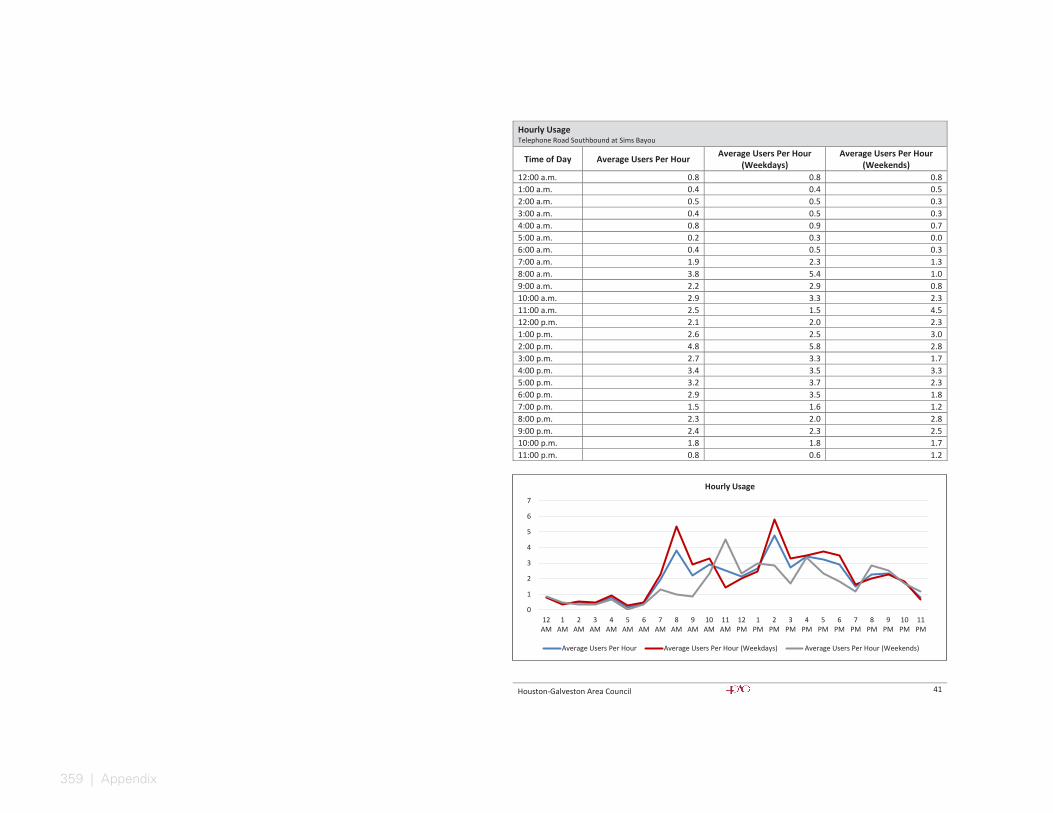
359 | Appendix
Houston-Galveston Area Council 41
Hourly Usage Telephone Road Southbound at Sims Bayou
Time of Day Average Users Per Hour Average Users Per Hour (Weekdays)
Average Users Per Hour (Weekends)
12:00 a.m. 0.8 0.8 0.8 1:00 a.m. 0.4 0.4 0.5 2:00 a.m. 0.5 0.5 0.3 3:00 a.m. 0.4 0.5 0.3 4:00 a.m. 0.8 0.9 0.7 5:00 a.m. 0.2 0.3 0.0 6:00 a.m. 0.4 0.5 0.3 7:00 a.m. 1.9 2.3 1.3 8:00 a.m. 3.8 5.4 1.0 9:00 a.m. 2.2 2.9 0.8 10:00 a.m. 2.9 3.3 2.3 11:00 a.m. 2.5 1.5 4.5 12:00 p.m. 2.1 2.0 2.3 1:00 p.m. 2.6 2.5 3.0 2:00 p.m. 4.8 5.8 2.8 3:00 p.m. 2.7 3.3 1.7 4:00 p.m. 3.4 3.5 3.3 5:00 p.m. 3.2 3.7 2.3 6:00 p.m. 2.9 3.5 1.8 7:00 p.m. 1.5 1.6 1.2 8:00 p.m. 2.3 2.0 2.8 9:00 p.m. 2.4 2.3 2.5 10:00 p.m. 1.8 1.8 1.7 11:00 p.m. 0.8 0.6 1.2
0
1
2
3
4
5
6
7
12AM
1AM
2AM
3AM
4AM
5AM
6AM
7AM
8AM
9AM
10AM
11AM
12PM
1PM
2PM
3PM
4PM
5PM
6PM
7PM
8PM
9PM
10PM
11PM
Hourly Usage
Average Users Per Hour Average Users Per Hour (Weekdays) Average Users Per Hour (Weekends)

360
Houston-Galveston Area Council 42
Counter T3 Telephone Road Northbound at Sims Bayou
Location Information Location Name Telephone Road Northbound at Sims Bayou Location Description Sidewalk along Telephone Road Northbound North of Sims Bayou Bridge Jurisdiction City of Houston Agency Deployed Houston-Galveston Area Council/Texas Transportation Institute GPS Coordinates 29°40'29.85"N, 95°17'20.69"W Surrounding Land Uses North Commercial/Retail, Open Space, Sims Bayou
South Sims Bayou, Commercial/Retail East Vacant Land, Sims Bayou West Commercial/Retail, Vacant Land, Single-Family Residential
What object was device secured to? Utility Pole Sidewalk Width 4' Buffer Width 4' Street Width Six- to Eight-Lane Roadway (Multiple Roads Intersect near Counter T2) Parallel Parking No Landscaping or Trees Yes Sidewalk Pavement Type Concrete ADA Ramps Yes Sidewalk Condition Fair (Some Unevenness) Speed Limit 35 miles per hour Street Lighting Yes Street Traffic Volume 22,090 (6300 Telephone Road: TxDOT - 2012) Transit Yes
(METRO Bus Stop 250' North along Reveille Street Northbound) Shade Intermittent Have counts been collected by H-GAC at this location before?
No
Trends Daily usage tends to be similar throughout the week (Weekdays: 43 users/day; Weekends: 44 users/day). On weekdays, usage is highest in the early afternoon (1:00 p.m. – 2:00 p.m.) and late afternoon (4:00 p.m. –
5:00 p.m.). During weekends, usage is highest in the mid-afternoon (2:00 p.m. – 4:00 p.m.).
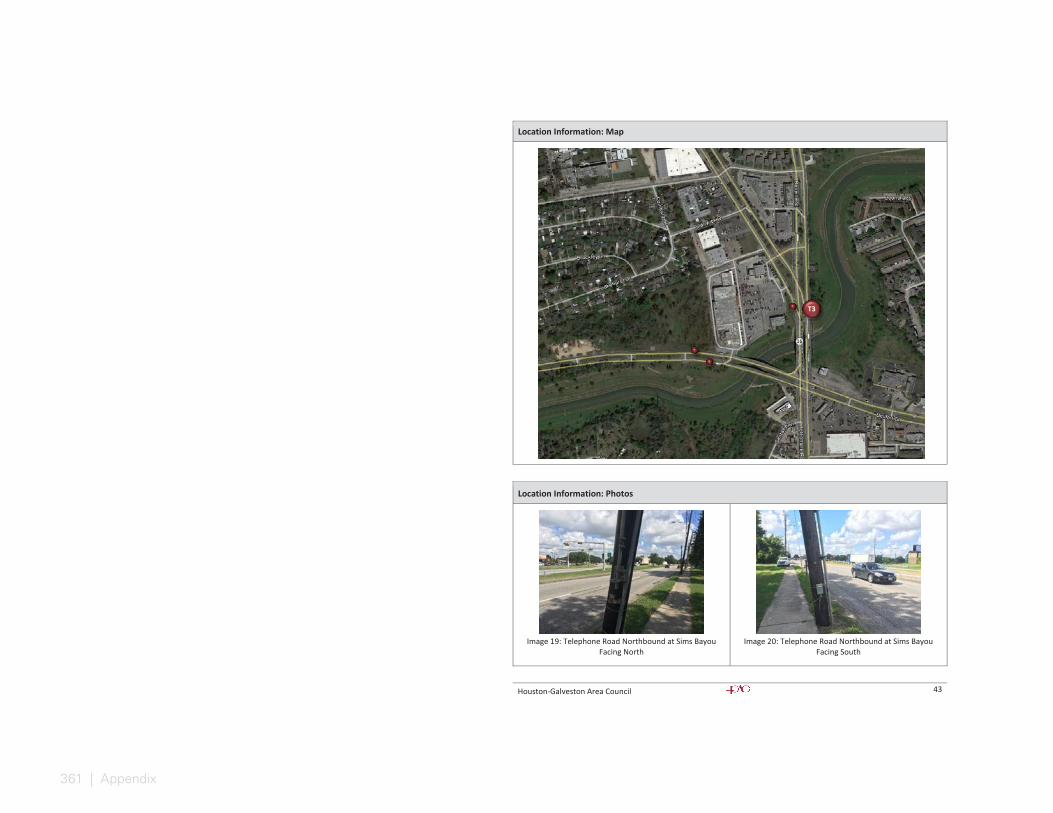
361 | Appendix
Houston-Galveston Area Council 43
Location Information: Map
Location Information: Photos
Image 19: Telephone Road Northbound at Sims Bayou
Facing North
Image 20: Telephone Road Northbound at Sims Bayou
Facing South
T3 4
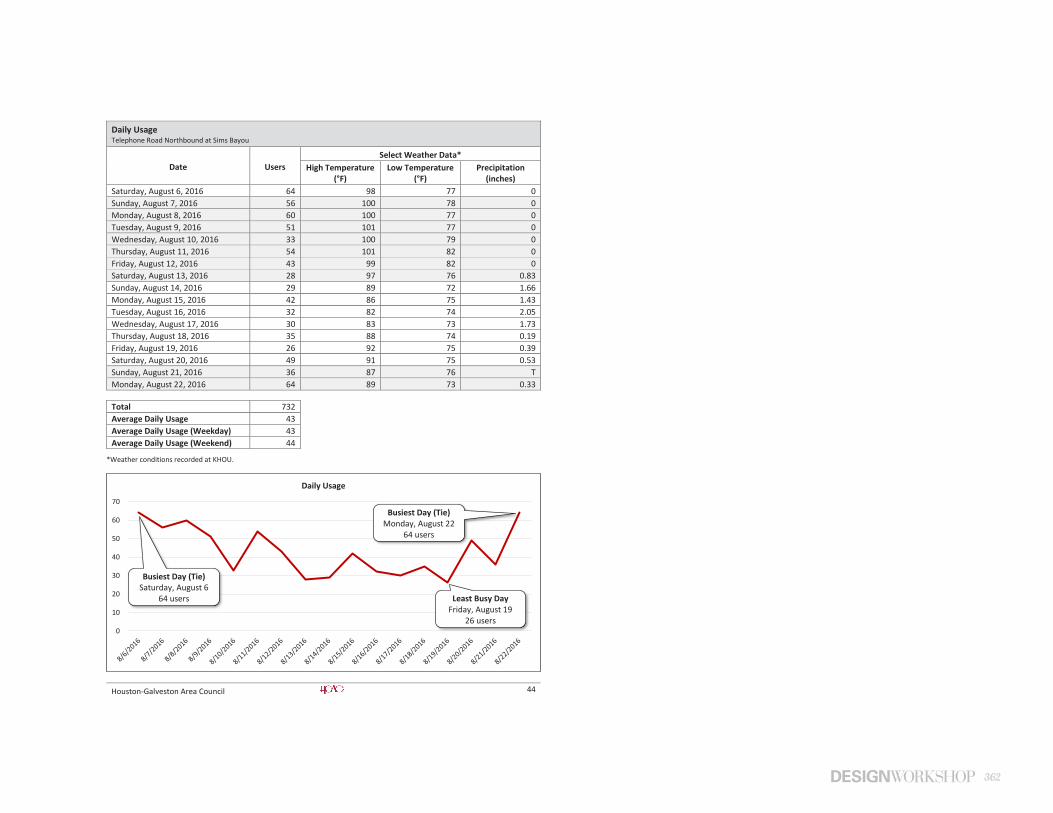
362
Houston-Galveston Area Council 44
Daily Usage Telephone Road Northbound at Sims Bayou
Date Users Select Weather Data*
High Temperature (°F)
Low Temperature (°F)
Precipitation (inches)
Saturday, August 6, 2016 64 98 77 0 Sunday, August 7, 2016 56 100 78 0 Monday, August 8, 2016 60 100 77 0 Tuesday, August 9, 2016 51 101 77 0 Wednesday, August 10, 2016 33 100 79 0 Thursday, August 11, 2016 54 101 82 0 Friday, August 12, 2016 43 99 82 0 Saturday, August 13, 2016 28 97 76 0.83 Sunday, August 14, 2016 29 89 72 1.66 Monday, August 15, 2016 42 86 75 1.43 Tuesday, August 16, 2016 32 82 74 2.05 Wednesday, August 17, 2016 30 83 73 1.73 Thursday, August 18, 2016 35 88 74 0.19 Friday, August 19, 2016 26 92 75 0.39 Saturday, August 20, 2016 49 91 75 0.53 Sunday, August 21, 2016 36 87 76 T Monday, August 22, 2016 64 89 73 0.33
Total 732 Average Daily Usage 43 Average Daily Usage (Weekday) 43 Average Daily Usage (Weekend) 44
*Weather conditions recorded at KHOU.
0
10
20
30
40
50
60
70
Daily Usage
Busiest Day (Tie) Saturday, August 6
64 users
Least Busy Day Friday, August 19
26 users
Busiest Day (Tie) Monday, August 22
64 users
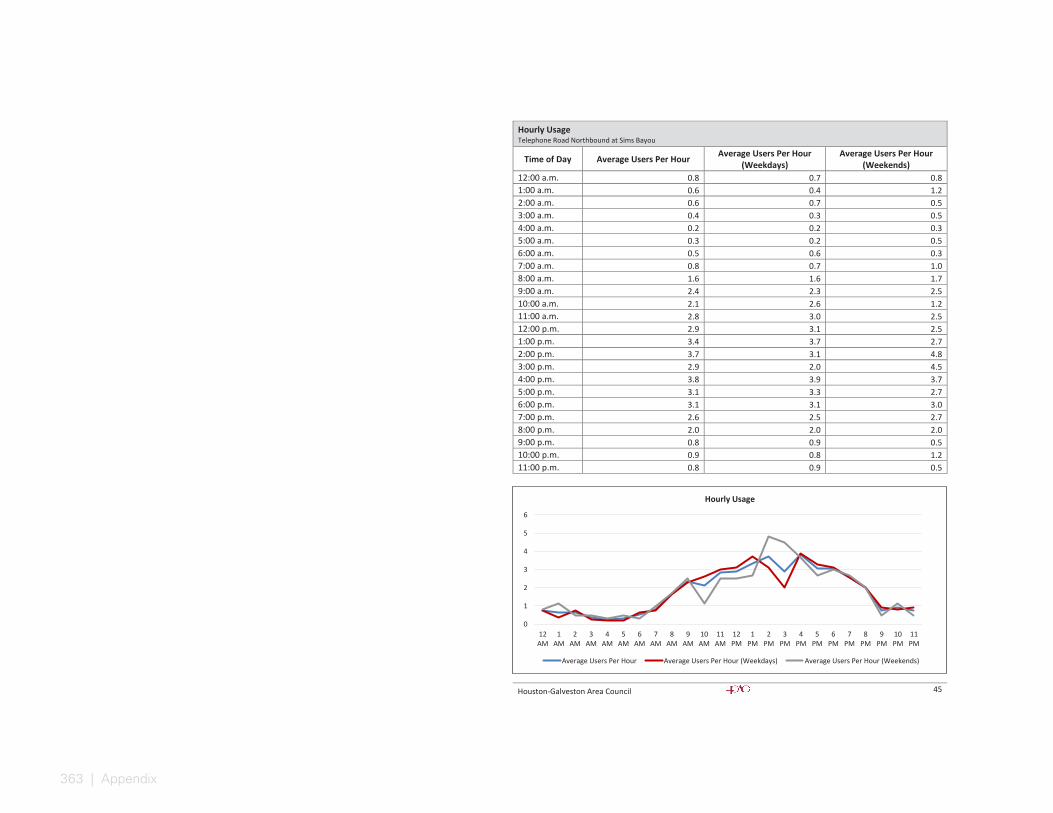
363 | Appendix
Houston-Galveston Area Council 45
Hourly Usage Telephone Road Northbound at Sims Bayou
Time of Day Average Users Per Hour Average Users Per Hour (Weekdays)
Average Users Per Hour (Weekends)
12:00 a.m. 0.8 0.7 0.8 1:00 a.m. 0.6 0.4 1.2 2:00 a.m. 0.6 0.7 0.5 3:00 a.m. 0.4 0.3 0.5 4:00 a.m. 0.2 0.2 0.3 5:00 a.m. 0.3 0.2 0.5 6:00 a.m. 0.5 0.6 0.3 7:00 a.m. 0.8 0.7 1.0 8:00 a.m. 1.6 1.6 1.7 9:00 a.m. 2.4 2.3 2.5 10:00 a.m. 2.1 2.6 1.2 11:00 a.m. 2.8 3.0 2.5 12:00 p.m. 2.9 3.1 2.5 1:00 p.m. 3.4 3.7 2.7 2:00 p.m. 3.7 3.1 4.8 3:00 p.m. 2.9 2.0 4.5 4:00 p.m. 3.8 3.9 3.7 5:00 p.m. 3.1 3.3 2.7 6:00 p.m. 3.1 3.1 3.0 7:00 p.m. 2.6 2.5 2.7 8:00 p.m. 2.0 2.0 2.0 9:00 p.m. 0.8 0.9 0.5 10:00 p.m. 0.9 0.8 1.2 11:00 p.m. 0.8 0.9 0.5
0
1
2
3
4
5
6
12AM
1AM
2AM
3AM
4AM
5AM
6AM
7AM
8AM
9AM
10AM
11AM
12PM
1PM
2PM
3PM
4PM
5PM
6PM
7PM
8PM
9PM
10PM
11PM
Hourly Usage
Average Users Per Hour Average Users Per Hour (Weekdays) Average Users Per Hour (Weekends)

364
Houston-Galveston Area Council 46
Counter T4 Bellfort Street Westbound at Plainview Street
Location Information Location Name Bellfort Street Westbound at Plainview Street Location Description Sidewalk along Bellfort Street Westbound West of Plainview Street Jurisdiction City of Houston Agency Deployed Houston-Galveston Area Council/Texas Transportation Institute GPS Coordinates 29°40'11.01"N, 95°18'17.86"W Surrounding Land Uses North Multi-Family Residential, Commercial/Retail,
Single-Family Residential South Commercial/Retail, Single-Family Residential East Commercial/Retail, Single-Family Residential West Multi-Family Residential, Commercial/Retail, Vacant Land,
Single-Family Residential What object was device secured to? Sign Post (Bicycles: Share the Road) Sidewalk Width 4' Buffer Width 5' Street Width Four-Lane Divided Roadway Parallel Parking No Landscaping or Trees No Sidewalk Pavement Type Concrete ADA Ramps Yes Sidewalk Condition Good Speed Limit 35 miles per hour Street Lighting Yes Street Traffic Volume 13,762 (7065 Bellfort Street: City of Houston – 2009) Transit Yes
(METRO Bus Stop 100' East at Bellfort Street Westbound/Plainview Street) Shade No Have counts been collected by H-GAC at this location before?
No
Trends Usage tends to be higher on weekdays (67 users/day) than during weekends (57 users/day). On weekdays, usage is highest in the morning (8:00 a.m. – 9:00 a.m.) and evening (5:00 p.m. – 6:00 p.m.). During weekends, usage tends to be highest in the early afternoon (1:00 p.m. – 2:00 p.m.).
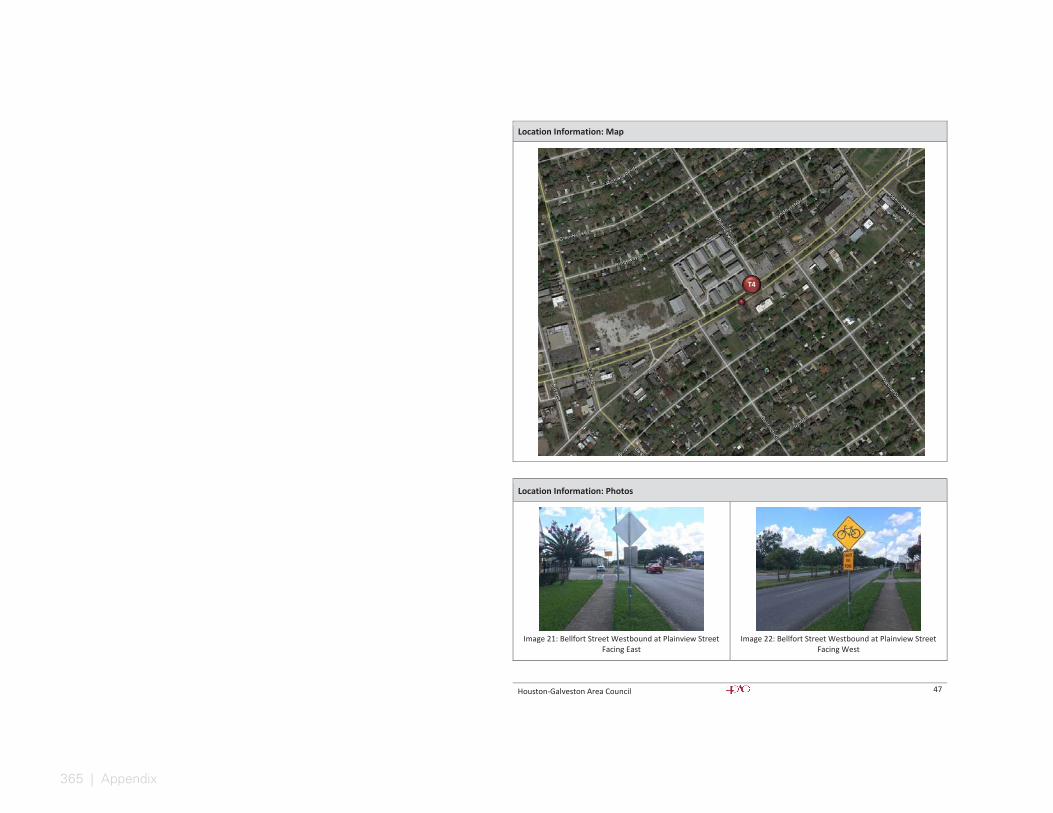
365 | Appendix
Houston-Galveston Area Council 47
Location Information: Map
Location Information: Photos
Image 21: Bellfort Street Westbound at Plainview Street
Facing East
Image 22: Bellfort Street Westbound at Plainview Street
Facing West
T4 4
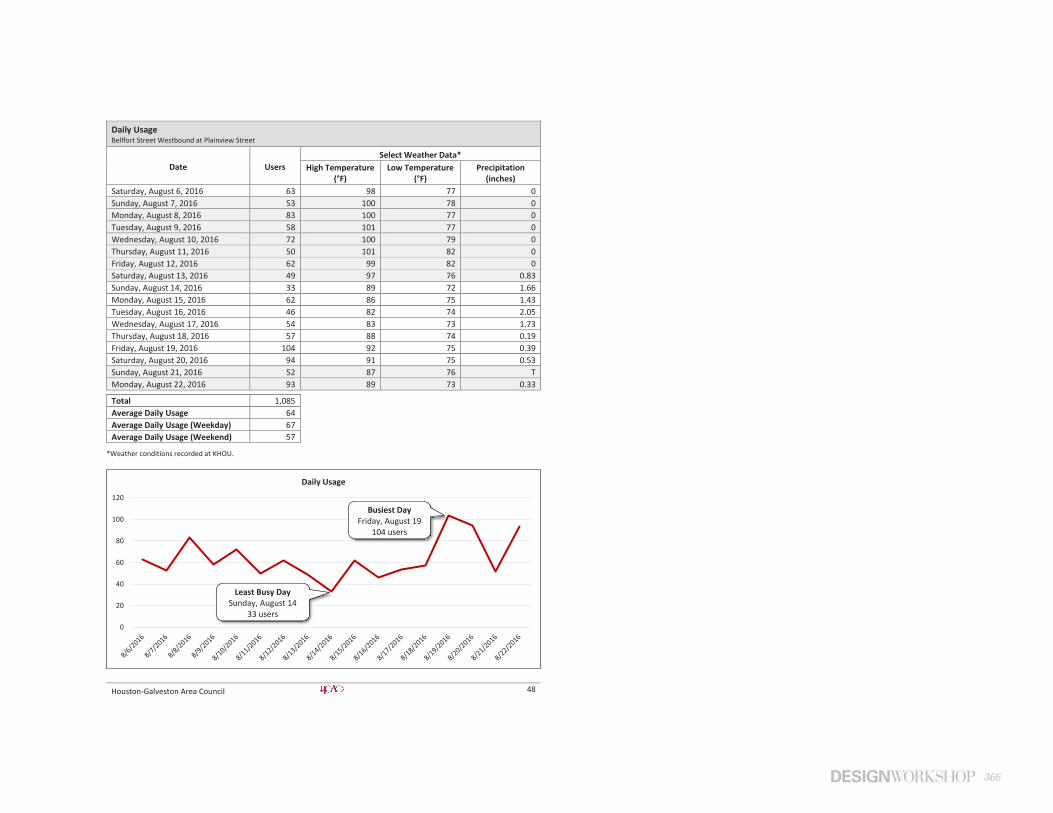
366
Houston-Galveston Area Council 48
Daily Usage Bellfort Street Westbound at Plainview Street
Date Users Select Weather Data*
High Temperature (°F)
Low Temperature (°F)
Precipitation (inches)
Saturday, August 6, 2016 63 98 77 0 Sunday, August 7, 2016 53 100 78 0 Monday, August 8, 2016 83 100 77 0 Tuesday, August 9, 2016 58 101 77 0 Wednesday, August 10, 2016 72 100 79 0 Thursday, August 11, 2016 50 101 82 0 Friday, August 12, 2016 62 99 82 0 Saturday, August 13, 2016 49 97 76 0.83 Sunday, August 14, 2016 33 89 72 1.66 Monday, August 15, 2016 62 86 75 1.43 Tuesday, August 16, 2016 46 82 74 2.05 Wednesday, August 17, 2016 54 83 73 1.73 Thursday, August 18, 2016 57 88 74 0.19 Friday, August 19, 2016 104 92 75 0.39 Saturday, August 20, 2016 94 91 75 0.53 Sunday, August 21, 2016 52 87 76 T Monday, August 22, 2016 93 89 73 0.33
Total 1,085 Average Daily Usage 64 Average Daily Usage (Weekday) 67 Average Daily Usage (Weekend) 57
*Weather conditions recorded at KHOU.
0
20
40
60
80
100
120
Daily Usage
Busiest Day Friday, August 19
104 users
Least Busy Day Sunday, August 14
33 users
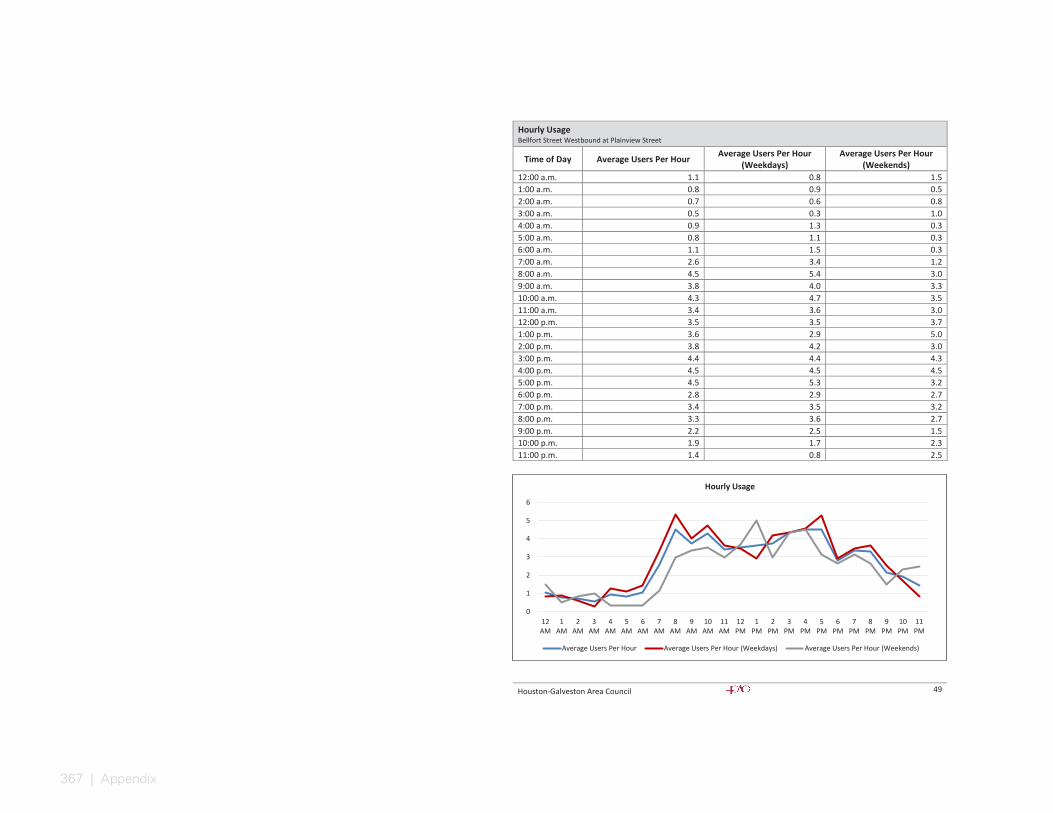
367 | Appendix
Houston-Galveston Area Council 49
Hourly Usage Bellfort Street Westbound at Plainview Street
Time of Day Average Users Per Hour Average Users Per Hour (Weekdays)
Average Users Per Hour (Weekends)
12:00 a.m. 1.1 0.8 1.5 1:00 a.m. 0.8 0.9 0.5 2:00 a.m. 0.7 0.6 0.8 3:00 a.m. 0.5 0.3 1.0 4:00 a.m. 0.9 1.3 0.3 5:00 a.m. 0.8 1.1 0.3 6:00 a.m. 1.1 1.5 0.3 7:00 a.m. 2.6 3.4 1.2 8:00 a.m. 4.5 5.4 3.0 9:00 a.m. 3.8 4.0 3.3 10:00 a.m. 4.3 4.7 3.5 11:00 a.m. 3.4 3.6 3.0 12:00 p.m. 3.5 3.5 3.7 1:00 p.m. 3.6 2.9 5.0 2:00 p.m. 3.8 4.2 3.0 3:00 p.m. 4.4 4.4 4.3 4:00 p.m. 4.5 4.5 4.5 5:00 p.m. 4.5 5.3 3.2 6:00 p.m. 2.8 2.9 2.7 7:00 p.m. 3.4 3.5 3.2 8:00 p.m. 3.3 3.6 2.7 9:00 p.m. 2.2 2.5 1.5 10:00 p.m. 1.9 1.7 2.3 11:00 p.m. 1.4 0.8 2.5
0
1
2
3
4
5
6
12AM
1AM
2AM
3AM
4AM
5AM
6AM
7AM
8AM
9AM
10AM
11AM
12PM
1PM
2PM
3PM
4PM
5PM
6PM
7PM
8PM
9PM
10PM
11PM
Hourly Usage
Average Users Per Hour Average Users Per Hour (Weekdays) Average Users Per Hour (Weekends)
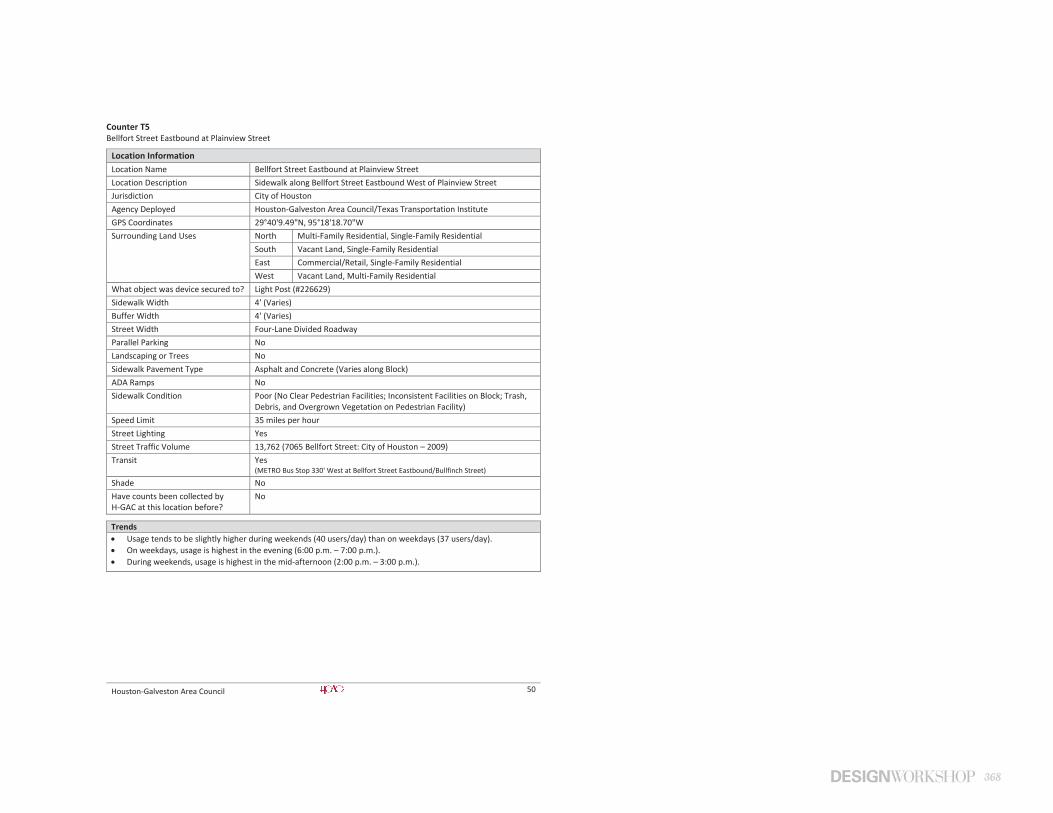
368
Houston-Galveston Area Council 50
Counter T5 Bellfort Street Eastbound at Plainview Street
Location Information Location Name Bellfort Street Eastbound at Plainview Street Location Description Sidewalk along Bellfort Street Eastbound West of Plainview Street Jurisdiction City of Houston Agency Deployed Houston-Galveston Area Council/Texas Transportation Institute GPS Coordinates 29°40'9.49"N, 95°18'18.70"W Surrounding Land Uses North Multi-Family Residential, Single-Family Residential
South Vacant Land, Single-Family Residential East Commercial/Retail, Single-Family Residential West Vacant Land, Multi-Family Residential
What object was device secured to? Light Post (#226629) Sidewalk Width 4' (Varies) Buffer Width 4' (Varies) Street Width Four-Lane Divided Roadway Parallel Parking No Landscaping or Trees No Sidewalk Pavement Type Asphalt and Concrete (Varies along Block) ADA Ramps No Sidewalk Condition Poor (No Clear Pedestrian Facilities; Inconsistent Facilities on Block; Trash,
Debris, and Overgrown Vegetation on Pedestrian Facility) Speed Limit 35 miles per hour Street Lighting Yes Street Traffic Volume 13,762 (7065 Bellfort Street: City of Houston – 2009) Transit Yes
(METRO Bus Stop 330' West at Bellfort Street Eastbound/Bullfinch Street) Shade No Have counts been collected by H-GAC at this location before?
No
Trends Usage tends to be slightly higher during weekends (40 users/day) than on weekdays (37 users/day). On weekdays, usage is highest in the evening (6:00 p.m. – 7:00 p.m.). During weekends, usage is highest in the mid-afternoon (2:00 p.m. – 3:00 p.m.).
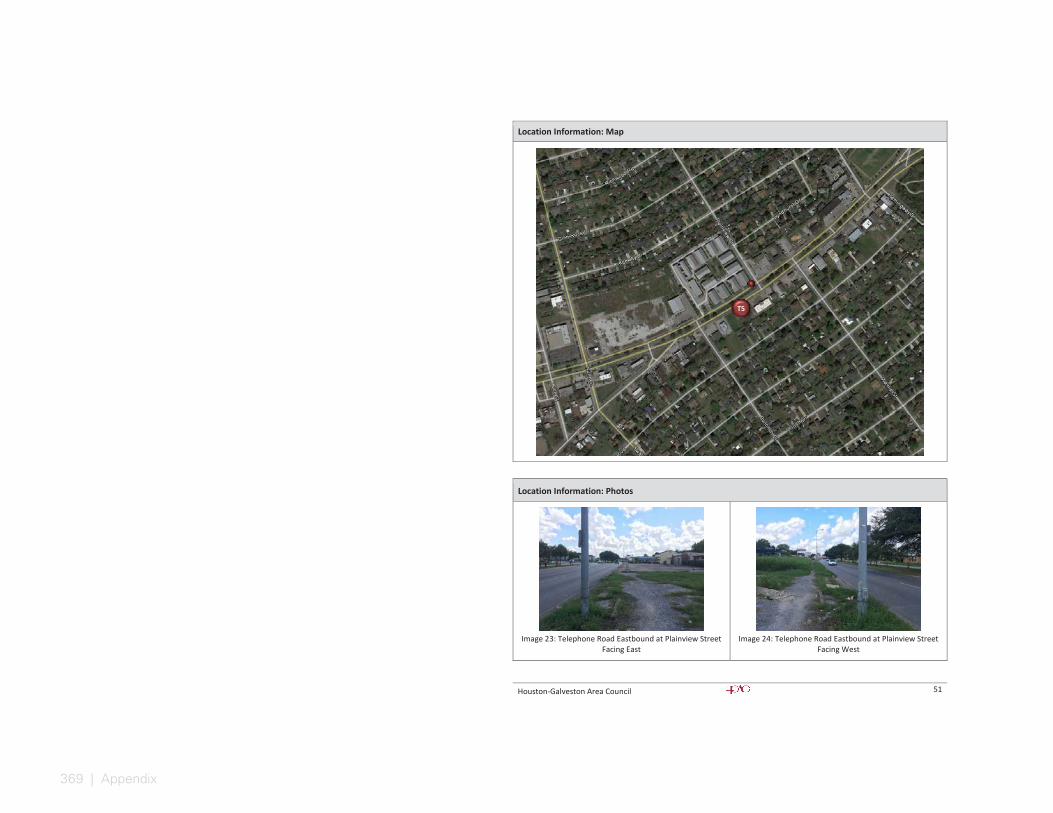
369 | Appendix
Houston-Galveston Area Council 51
Location Information: Map
Location Information: Photos
Image 23: Telephone Road Eastbound at Plainview Street
Facing East
Image 24: Telephone Road Eastbound at Plainview Street
Facing West
T5
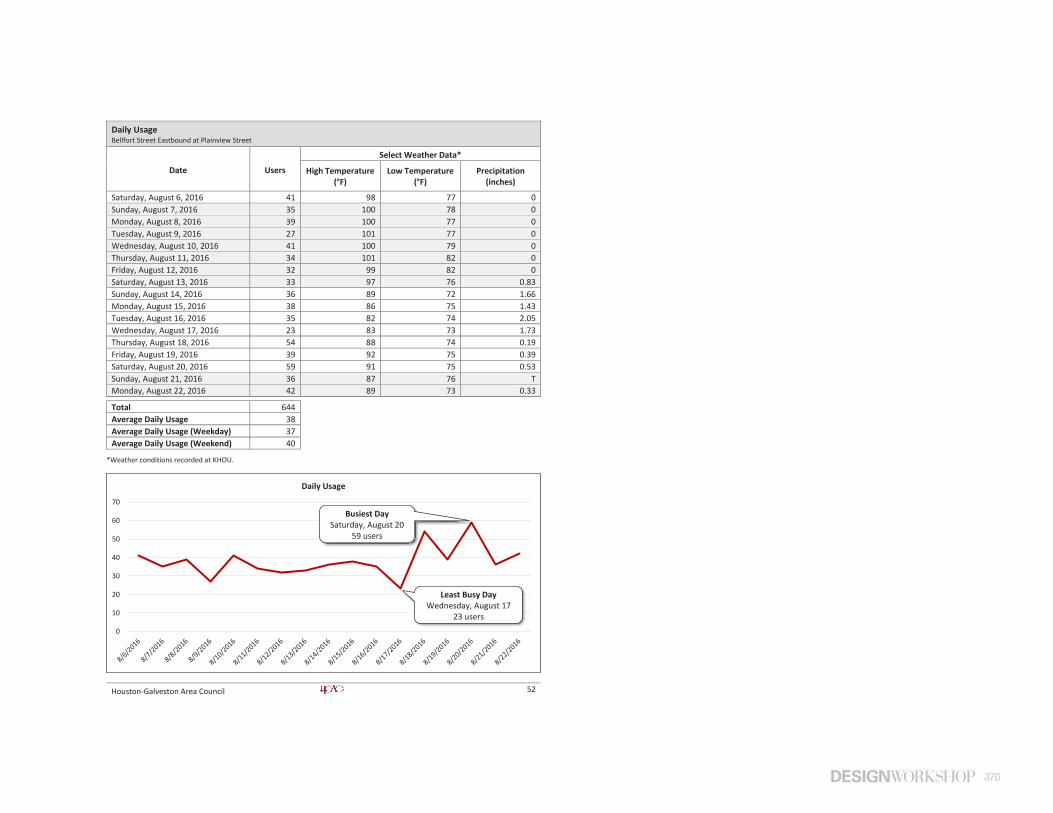
370
Houston-Galveston Area Council 52
Daily Usage Bellfort Street Eastbound at Plainview Street
Date Users
Select Weather Data*
High Temperature (°F)
Low Temperature (°F)
Precipitation (inches)
Saturday, August 6, 2016 41 98 77 0 Sunday, August 7, 2016 35 100 78 0 Monday, August 8, 2016 39 100 77 0 Tuesday, August 9, 2016 27 101 77 0 Wednesday, August 10, 2016 41 100 79 0 Thursday, August 11, 2016 34 101 82 0 Friday, August 12, 2016 32 99 82 0 Saturday, August 13, 2016 33 97 76 0.83 Sunday, August 14, 2016 36 89 72 1.66 Monday, August 15, 2016 38 86 75 1.43 Tuesday, August 16, 2016 35 82 74 2.05 Wednesday, August 17, 2016 23 83 73 1.73 Thursday, August 18, 2016 54 88 74 0.19 Friday, August 19, 2016 39 92 75 0.39 Saturday, August 20, 2016 59 91 75 0.53 Sunday, August 21, 2016 36 87 76 T Monday, August 22, 2016 42 89 73 0.33
Total 644 Average Daily Usage 38 Average Daily Usage (Weekday) 37 Average Daily Usage (Weekend) 40
*Weather conditions recorded at KHOU.
0
10
20
30
40
50
60
70
Daily Usage
Busiest Day Saturday, August 20
59 users
Least Busy Day Wednesday, August 17
23 users
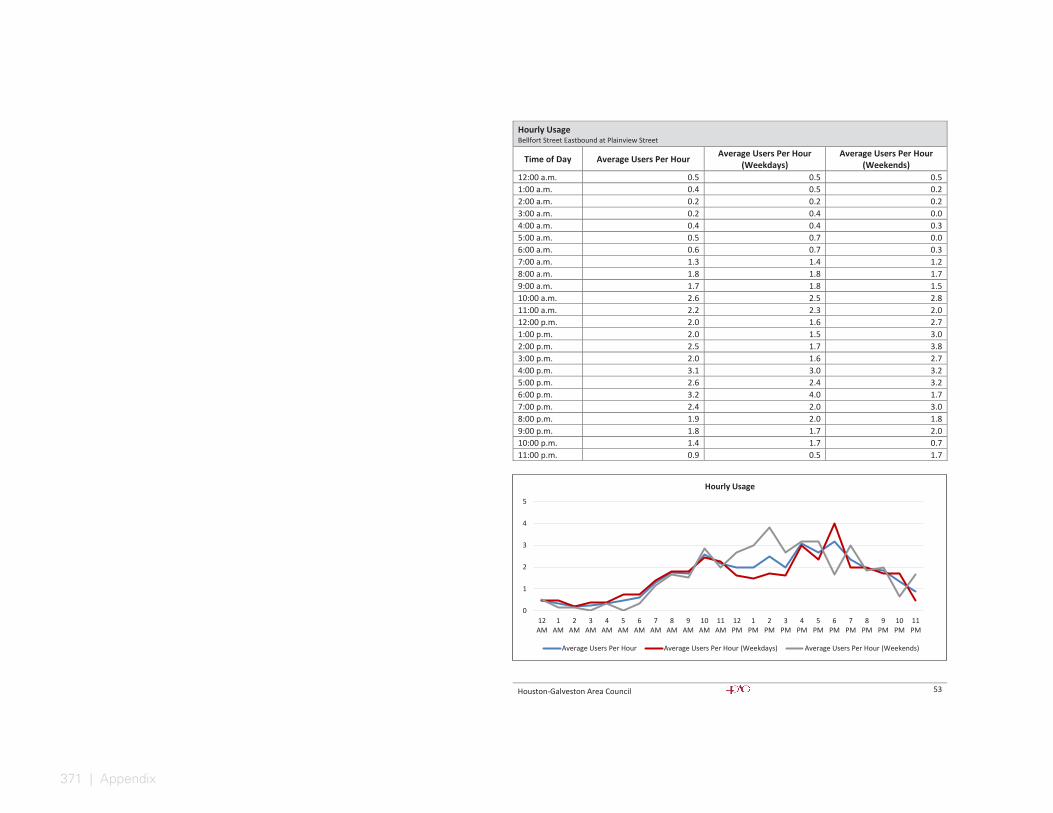
371 | Appendix
Houston-Galveston Area Council 53
Hourly Usage Bellfort Street Eastbound at Plainview Street
Time of Day Average Users Per Hour Average Users Per Hour (Weekdays)
Average Users Per Hour (Weekends)
12:00 a.m. 0.5 0.5 0.5 1:00 a.m. 0.4 0.5 0.2 2:00 a.m. 0.2 0.2 0.2 3:00 a.m. 0.2 0.4 0.0 4:00 a.m. 0.4 0.4 0.3 5:00 a.m. 0.5 0.7 0.0 6:00 a.m. 0.6 0.7 0.3 7:00 a.m. 1.3 1.4 1.2 8:00 a.m. 1.8 1.8 1.7 9:00 a.m. 1.7 1.8 1.5 10:00 a.m. 2.6 2.5 2.8 11:00 a.m. 2.2 2.3 2.0 12:00 p.m. 2.0 1.6 2.7 1:00 p.m. 2.0 1.5 3.0 2:00 p.m. 2.5 1.7 3.8 3:00 p.m. 2.0 1.6 2.7 4:00 p.m. 3.1 3.0 3.2 5:00 p.m. 2.6 2.4 3.2 6:00 p.m. 3.2 4.0 1.7 7:00 p.m. 2.4 2.0 3.0 8:00 p.m. 1.9 2.0 1.8 9:00 p.m. 1.8 1.7 2.0 10:00 p.m. 1.4 1.7 0.7 11:00 p.m. 0.9 0.5 1.7
0
1
2
3
4
5
12AM
1AM
2AM
3AM
4AM
5AM
6AM
7AM
8AM
9AM
10AM
11AM
12PM
1PM
2PM
3PM
4PM
5PM
6PM
7PM
8PM
9PM
10PM
11PM
Hourly Usage
Average Users Per Hour Average Users Per Hour (Weekdays) Average Users Per Hour (Weekends)
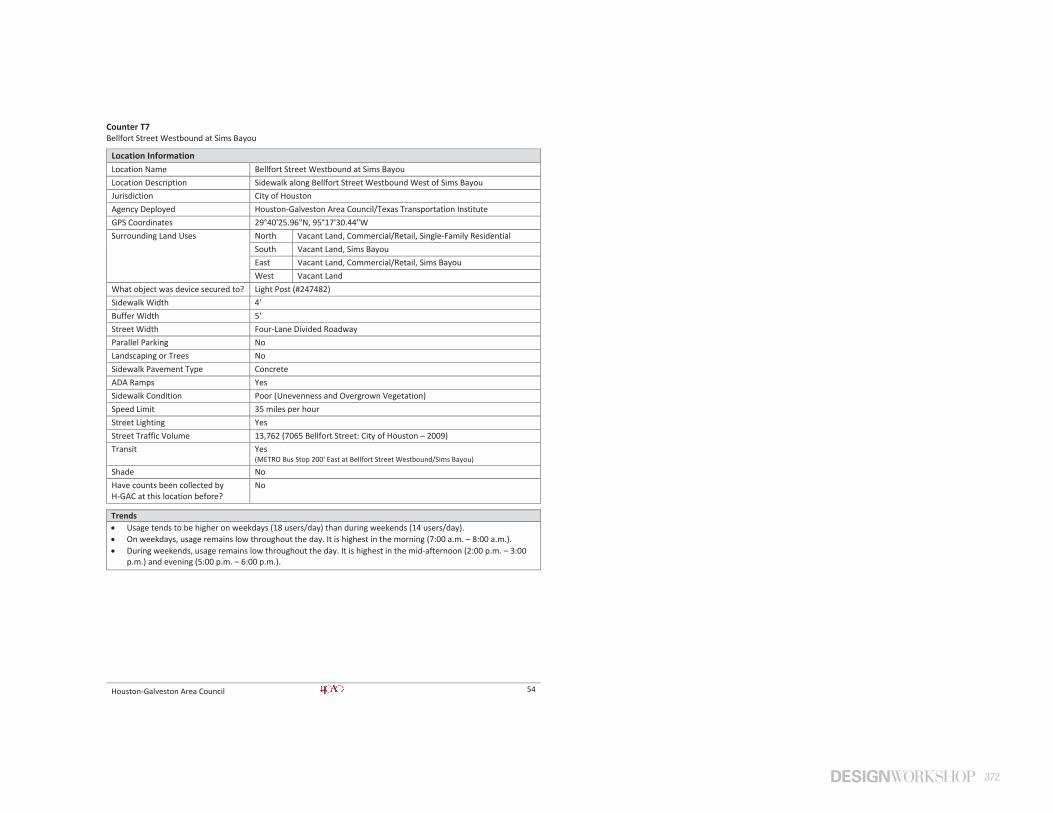
372
Houston-Galveston Area Council 54
Counter T7 Bellfort Street Westbound at Sims Bayou
Location Information Location Name Bellfort Street Westbound at Sims Bayou Location Description Sidewalk along Bellfort Street Westbound West of Sims Bayou Jurisdiction City of Houston Agency Deployed Houston-Galveston Area Council/Texas Transportation Institute GPS Coordinates 29°40'25.96"N, 95°17'30.44"W Surrounding Land Uses North Vacant Land, Commercial/Retail, Single-Family Residential
South Vacant Land, Sims Bayou East Vacant Land, Commercial/Retail, Sims Bayou West Vacant Land
What object was device secured to? Light Post (#247482) Sidewalk Width 4' Buffer Width 5' Street Width Four-Lane Divided Roadway Parallel Parking No Landscaping or Trees No Sidewalk Pavement Type Concrete ADA Ramps Yes Sidewalk Condition Poor (Unevenness and Overgrown Vegetation) Speed Limit 35 miles per hour Street Lighting Yes Street Traffic Volume 13,762 (7065 Bellfort Street: City of Houston – 2009) Transit Yes
(METRO Bus Stop 200' East at Bellfort Street Westbound/Sims Bayou) Shade No Have counts been collected by H-GAC at this location before?
No
Trends Usage tends to be higher on weekdays (18 users/day) than during weekends (14 users/day). On weekdays, usage remains low throughout the day. It is highest in the morning (7:00 a.m. – 8:00 a.m.). During weekends, usage remains low throughout the day. It is highest in the mid-afternoon (2:00 p.m. – 3:00
p.m.) and evening (5:00 p.m. – 6:00 p.m.).
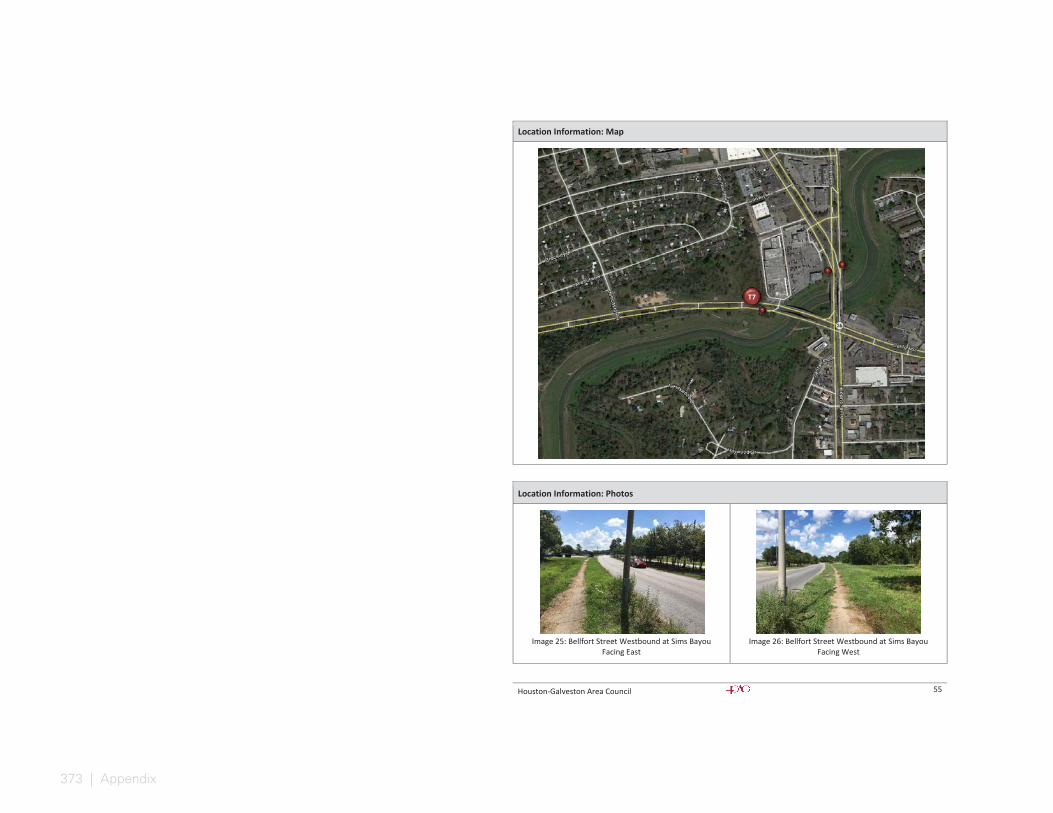
373 | Appendix
Houston-Galveston Area Council 55
Location Information: Map
Location Information: Photos
Image 25: Bellfort Street Westbound at Sims Bayou
Facing East
Image 26: Bellfort Street Westbound at Sims Bayou
Facing West
T7
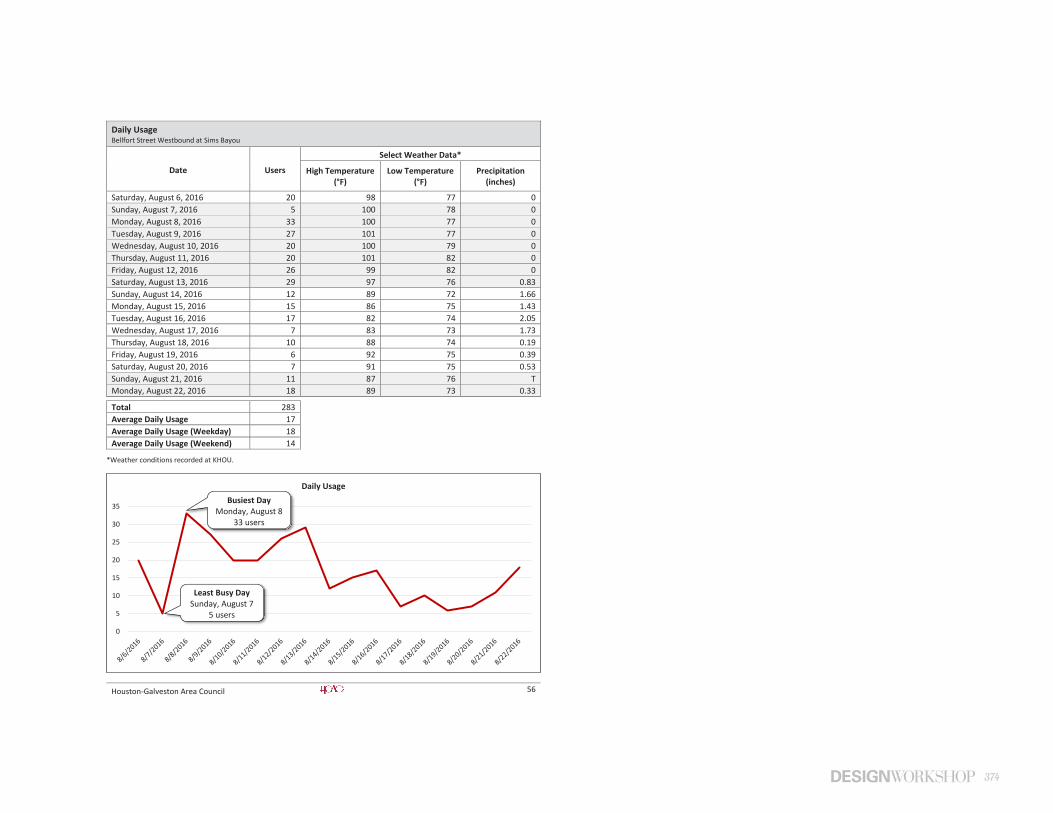
374
Houston-Galveston Area Council 56
Daily Usage Bellfort Street Westbound at Sims Bayou
Date Users
Select Weather Data*
High Temperature (°F)
Low Temperature (°F)
Precipitation (inches)
Saturday, August 6, 2016 20 98 77 0 Sunday, August 7, 2016 5 100 78 0 Monday, August 8, 2016 33 100 77 0 Tuesday, August 9, 2016 27 101 77 0 Wednesday, August 10, 2016 20 100 79 0 Thursday, August 11, 2016 20 101 82 0 Friday, August 12, 2016 26 99 82 0 Saturday, August 13, 2016 29 97 76 0.83 Sunday, August 14, 2016 12 89 72 1.66 Monday, August 15, 2016 15 86 75 1.43 Tuesday, August 16, 2016 17 82 74 2.05 Wednesday, August 17, 2016 7 83 73 1.73 Thursday, August 18, 2016 10 88 74 0.19 Friday, August 19, 2016 6 92 75 0.39 Saturday, August 20, 2016 7 91 75 0.53 Sunday, August 21, 2016 11 87 76 T Monday, August 22, 2016 18 89 73 0.33
Total 283 Average Daily Usage 17 Average Daily Usage (Weekday) 18 Average Daily Usage (Weekend) 14
*Weather conditions recorded at KHOU.
0
5
10
15
20
25
30
35
Daily UsageBusiest Day
Monday, August 8 33 users
Least Busy Day Sunday, August 7
5 users
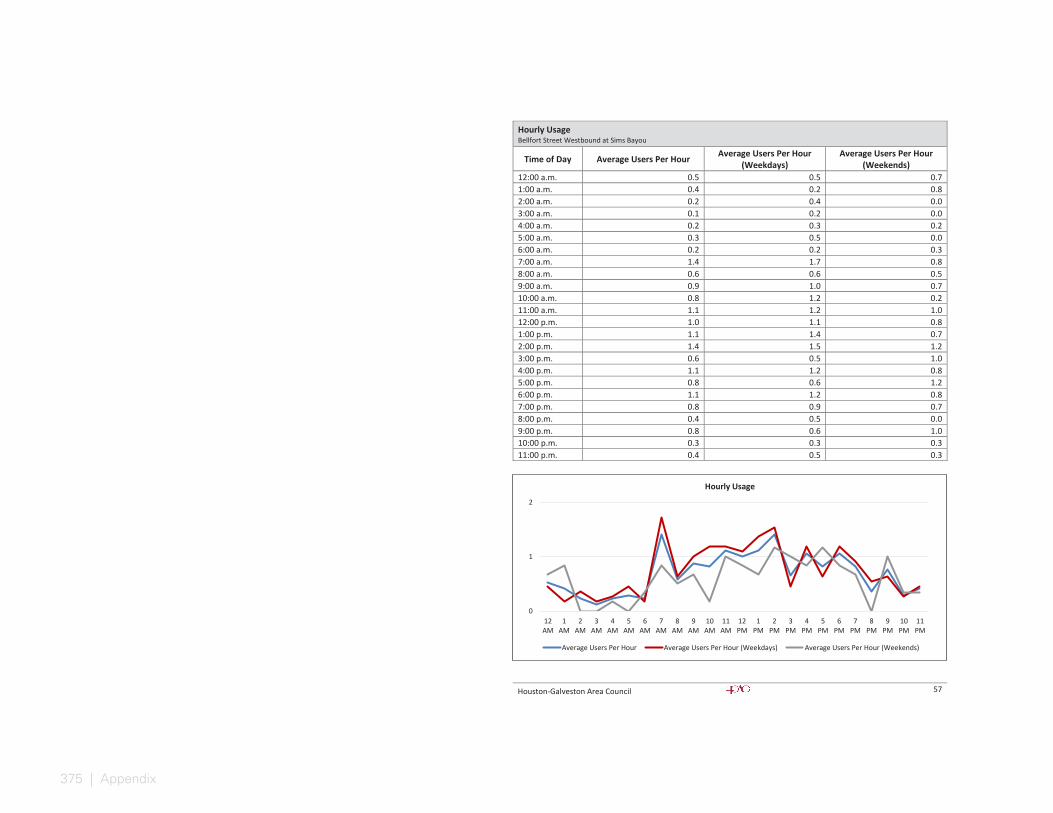
375 | Appendix
Houston-Galveston Area Council 57
Hourly Usage Bellfort Street Westbound at Sims Bayou
Time of Day Average Users Per Hour Average Users Per Hour (Weekdays)
Average Users Per Hour (Weekends)
12:00 a.m. 0.5 0.5 0.7 1:00 a.m. 0.4 0.2 0.8 2:00 a.m. 0.2 0.4 0.0 3:00 a.m. 0.1 0.2 0.0 4:00 a.m. 0.2 0.3 0.2 5:00 a.m. 0.3 0.5 0.0 6:00 a.m. 0.2 0.2 0.3 7:00 a.m. 1.4 1.7 0.8 8:00 a.m. 0.6 0.6 0.5 9:00 a.m. 0.9 1.0 0.7 10:00 a.m. 0.8 1.2 0.2 11:00 a.m. 1.1 1.2 1.0 12:00 p.m. 1.0 1.1 0.8 1:00 p.m. 1.1 1.4 0.7 2:00 p.m. 1.4 1.5 1.2 3:00 p.m. 0.6 0.5 1.0 4:00 p.m. 1.1 1.2 0.8 5:00 p.m. 0.8 0.6 1.2 6:00 p.m. 1.1 1.2 0.8 7:00 p.m. 0.8 0.9 0.7 8:00 p.m. 0.4 0.5 0.0 9:00 p.m. 0.8 0.6 1.0 10:00 p.m. 0.3 0.3 0.3 11:00 p.m. 0.4 0.5 0.3
0
1
2
12AM
1AM
2AM
3AM
4AM
5AM
6AM
7AM
8AM
9AM
10AM
11AM
12PM
1PM
2PM
3PM
4PM
5PM
6PM
7PM
8PM
9PM
10PM
11PM
Hourly Usage
Average Users Per Hour Average Users Per Hour (Weekdays) Average Users Per Hour (Weekends)
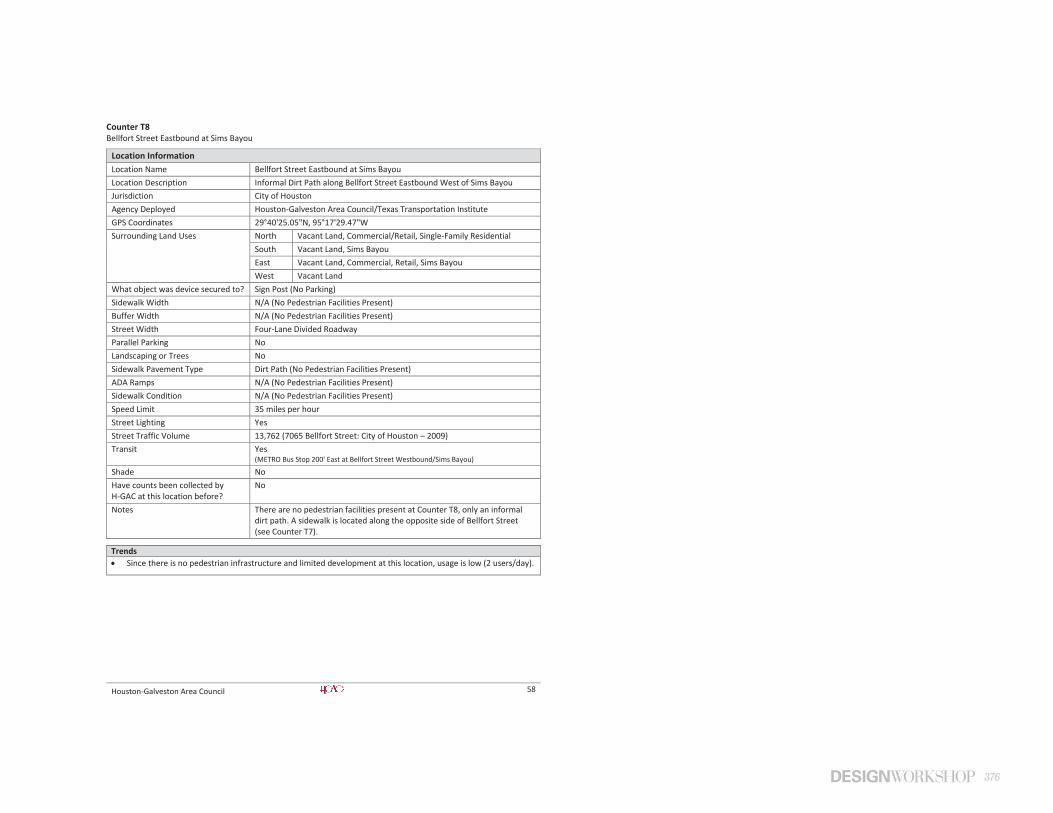
376
Houston-Galveston Area Council 58
Counter T8 Bellfort Street Eastbound at Sims Bayou
Location Information Location Name Bellfort Street Eastbound at Sims Bayou Location Description Informal Dirt Path along Bellfort Street Eastbound West of Sims Bayou Jurisdiction City of Houston Agency Deployed Houston-Galveston Area Council/Texas Transportation Institute GPS Coordinates 29°40'25.05"N, 95°17'29.47"W Surrounding Land Uses North Vacant Land, Commercial/Retail, Single-Family Residential
South Vacant Land, Sims Bayou East Vacant Land, Commercial, Retail, Sims Bayou West Vacant Land
What object was device secured to? Sign Post (No Parking) Sidewalk Width N/A (No Pedestrian Facilities Present) Buffer Width N/A (No Pedestrian Facilities Present) Street Width Four-Lane Divided Roadway Parallel Parking No Landscaping or Trees No Sidewalk Pavement Type Dirt Path (No Pedestrian Facilities Present) ADA Ramps N/A (No Pedestrian Facilities Present) Sidewalk Condition N/A (No Pedestrian Facilities Present) Speed Limit 35 miles per hour Street Lighting Yes Street Traffic Volume 13,762 (7065 Bellfort Street: City of Houston – 2009) Transit Yes
(METRO Bus Stop 200' East at Bellfort Street Westbound/Sims Bayou) Shade No Have counts been collected by H-GAC at this location before?
No
Notes There are no pedestrian facilities present at Counter T8, only an informal dirt path. A sidewalk is located along the opposite side of Bellfort Street (see Counter T7).
Trends Since there is no pedestrian infrastructure and limited development at this location, usage is low (2 users/day).
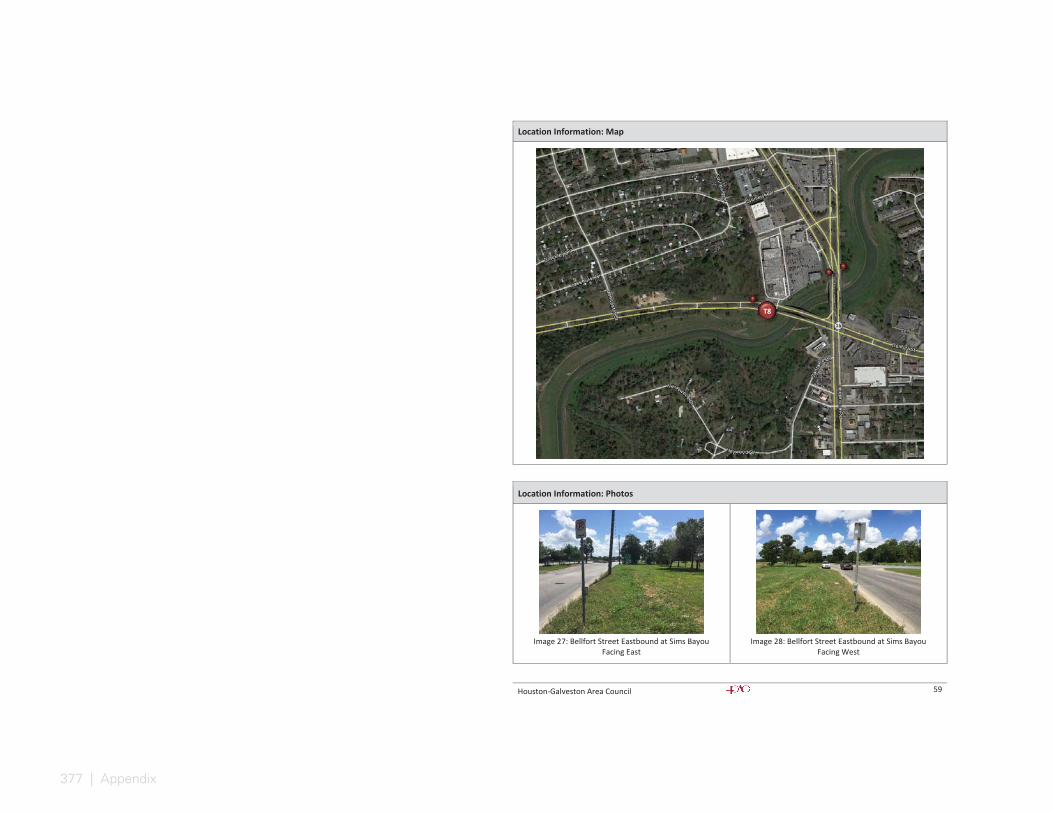
377 | Appendix
Houston-Galveston Area Council 59
Location Information: Map
Location Information: Photos
Image 27: Bellfort Street Eastbound at Sims Bayou
Facing East
Image 28: Bellfort Street Eastbound at Sims Bayou
Facing West
T8
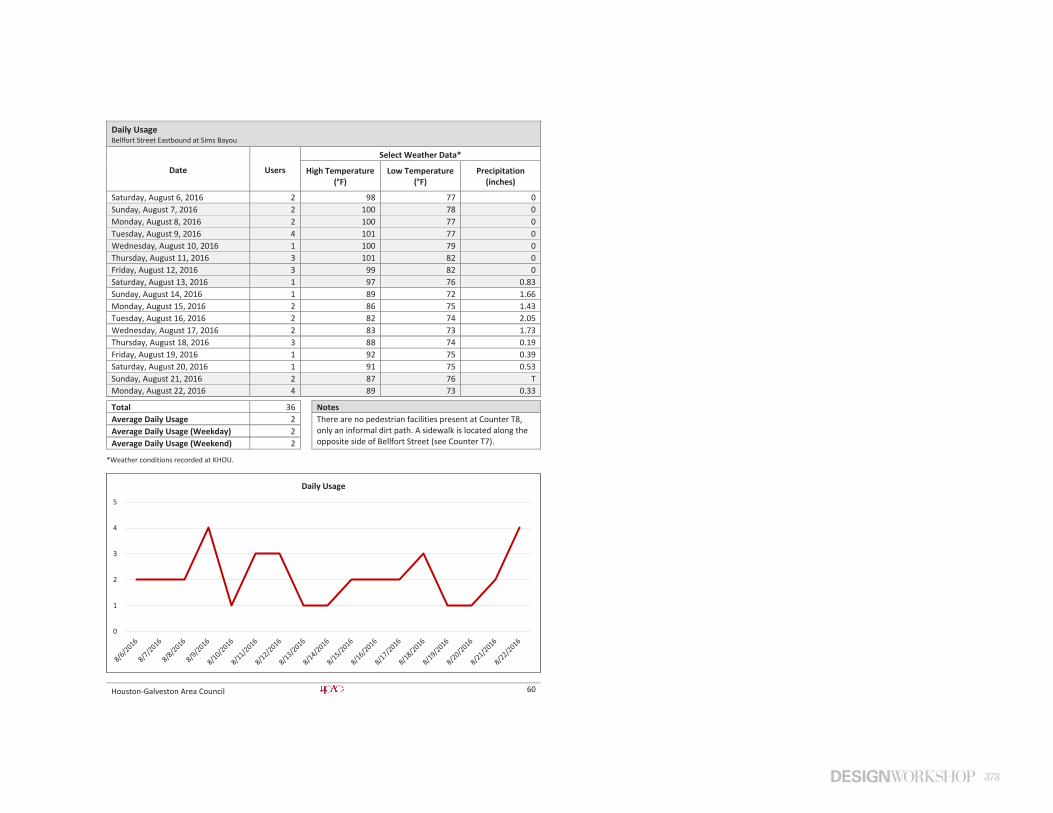
378
Houston-Galveston Area Council 60
Daily Usage Bellfort Street Eastbound at Sims Bayou
Date Users
Select Weather Data*
High Temperature (°F)
Low Temperature (°F)
Precipitation (inches)
Saturday, August 6, 2016 2 98 77 0 Sunday, August 7, 2016 2 100 78 0 Monday, August 8, 2016 2 100 77 0 Tuesday, August 9, 2016 4 101 77 0 Wednesday, August 10, 2016 1 100 79 0 Thursday, August 11, 2016 3 101 82 0 Friday, August 12, 2016 3 99 82 0 Saturday, August 13, 2016 1 97 76 0.83 Sunday, August 14, 2016 1 89 72 1.66 Monday, August 15, 2016 2 86 75 1.43 Tuesday, August 16, 2016 2 82 74 2.05 Wednesday, August 17, 2016 2 83 73 1.73 Thursday, August 18, 2016 3 88 74 0.19 Friday, August 19, 2016 1 92 75 0.39 Saturday, August 20, 2016 1 91 75 0.53 Sunday, August 21, 2016 2 87 76 T Monday, August 22, 2016 4 89 73 0.33
Total 36 Notes Average Daily Usage 2 There are no pedestrian facilities present at Counter T8,
only an informal dirt path. A sidewalk is located along the opposite side of Bellfort Street (see Counter T7).
Average Daily Usage (Weekday) 2 Average Daily Usage (Weekend) 2
*Weather conditions recorded at KHOU.
0
1
2
3
4
5
Daily Usage
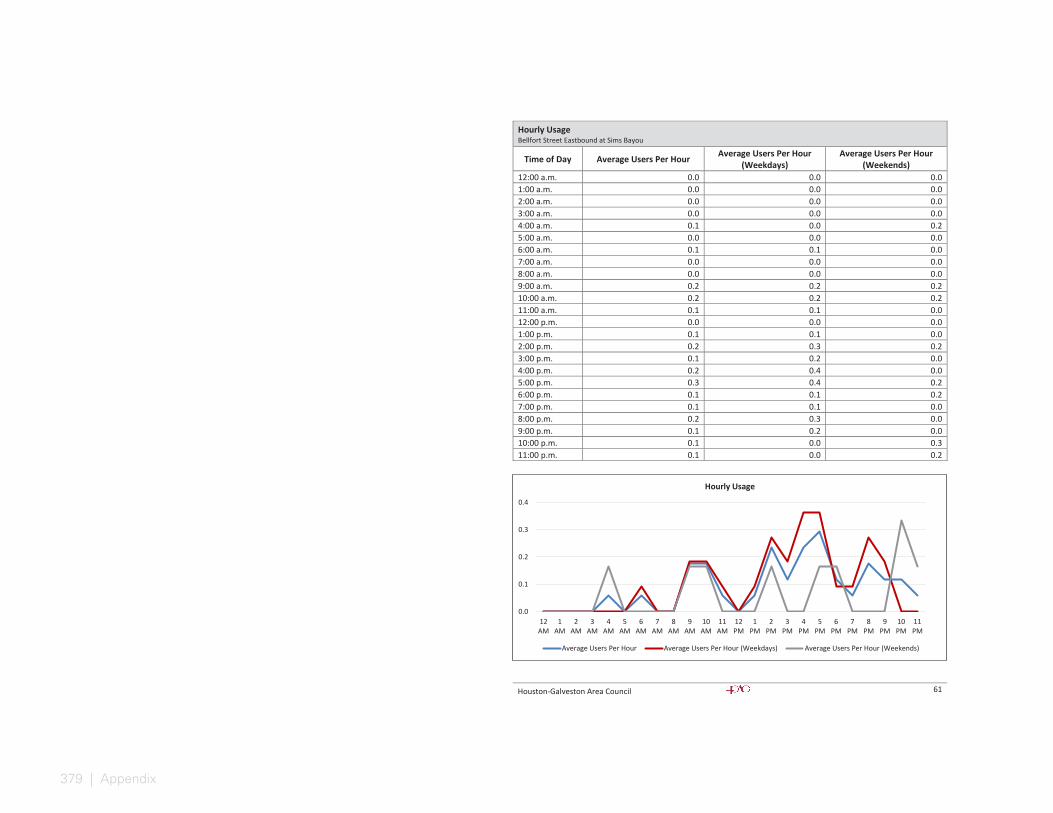
379 | Appendix
Houston-Galveston Area Council 61
Hourly Usage Bellfort Street Eastbound at Sims Bayou
Time of Day Average Users Per Hour Average Users Per Hour (Weekdays)
Average Users Per Hour (Weekends)
12:00 a.m. 0.0 0.0 0.0 1:00 a.m. 0.0 0.0 0.0 2:00 a.m. 0.0 0.0 0.0 3:00 a.m. 0.0 0.0 0.0 4:00 a.m. 0.1 0.0 0.2 5:00 a.m. 0.0 0.0 0.0 6:00 a.m. 0.1 0.1 0.0 7:00 a.m. 0.0 0.0 0.0 8:00 a.m. 0.0 0.0 0.0 9:00 a.m. 0.2 0.2 0.2 10:00 a.m. 0.2 0.2 0.2 11:00 a.m. 0.1 0.1 0.0 12:00 p.m. 0.0 0.0 0.0 1:00 p.m. 0.1 0.1 0.0 2:00 p.m. 0.2 0.3 0.2 3:00 p.m. 0.1 0.2 0.0 4:00 p.m. 0.2 0.4 0.0 5:00 p.m. 0.3 0.4 0.2 6:00 p.m. 0.1 0.1 0.2 7:00 p.m. 0.1 0.1 0.0 8:00 p.m. 0.2 0.3 0.0 9:00 p.m. 0.1 0.2 0.0 10:00 p.m. 0.1 0.0 0.3 11:00 p.m. 0.1 0.0 0.2
0.0
0.1
0.2
0.3
0.4
12AM
1AM
2AM
3AM
4AM
5AM
6AM
7AM
8AM
9AM
10AM
11AM
12PM
1PM
2PM
3PM
4PM
5PM
6PM
7PM
8PM
9PM
10PM
11PM
Hourly Usage
Average Users Per Hour Average Users Per Hour (Weekdays) Average Users Per Hour (Weekends)
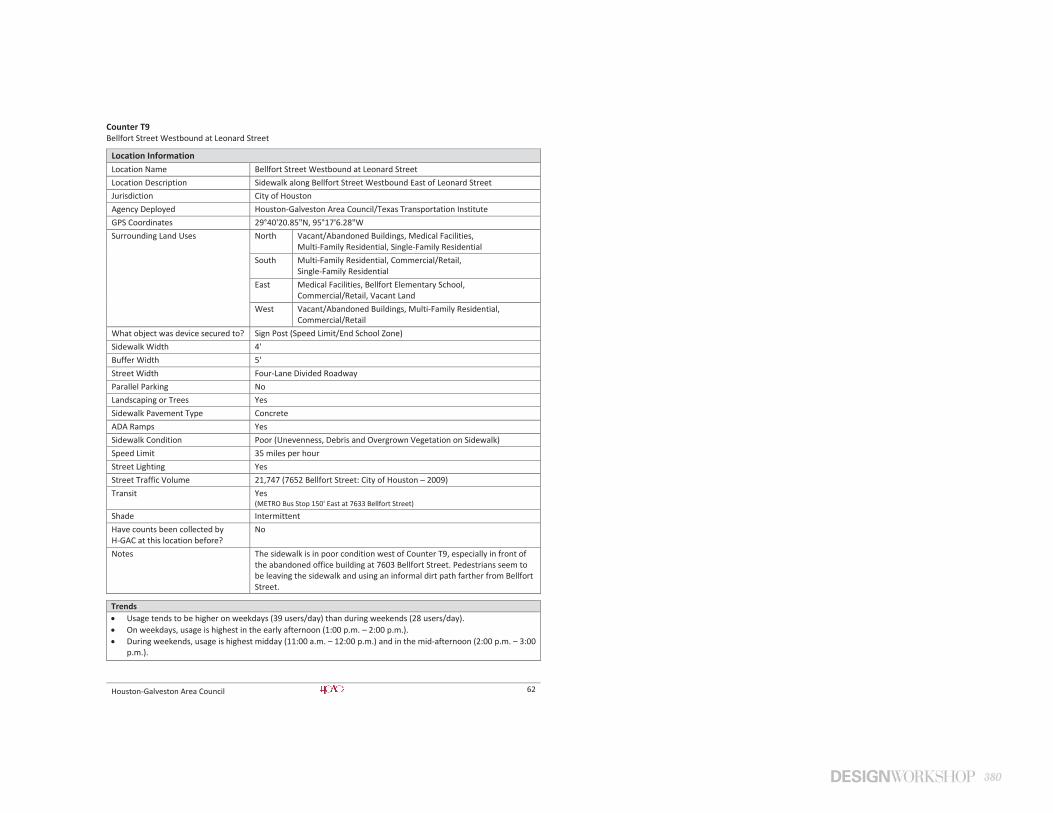
380
Houston-Galveston Area Council 62
Counter T9 Bellfort Street Westbound at Leonard Street
Location Information Location Name Bellfort Street Westbound at Leonard Street Location Description Sidewalk along Bellfort Street Westbound East of Leonard Street Jurisdiction City of Houston Agency Deployed Houston-Galveston Area Council/Texas Transportation Institute GPS Coordinates 29°40'20.85"N, 95°17'6.28"W Surrounding Land Uses North Vacant/Abandoned Buildings, Medical Facilities,
Multi-Family Residential, Single-Family Residential South Multi-Family Residential, Commercial/Retail,
Single-Family Residential East Medical Facilities, Bellfort Elementary School,
Commercial/Retail, Vacant Land West Vacant/Abandoned Buildings, Multi-Family Residential,
Commercial/Retail What object was device secured to? Sign Post (Speed Limit/End School Zone) Sidewalk Width 4' Buffer Width 5' Street Width Four-Lane Divided Roadway Parallel Parking No Landscaping or Trees Yes Sidewalk Pavement Type Concrete ADA Ramps Yes Sidewalk Condition Poor (Unevenness, Debris and Overgrown Vegetation on Sidewalk) Speed Limit 35 miles per hour Street Lighting Yes Street Traffic Volume 21,747 (7652 Bellfort Street: City of Houston – 2009) Transit Yes
(METRO Bus Stop 150' East at 7633 Bellfort Street) Shade Intermittent Have counts been collected by H-GAC at this location before?
No
Notes The sidewalk is in poor condition west of Counter T9, especially in front of the abandoned office building at 7603 Bellfort Street. Pedestrians seem to be leaving the sidewalk and using an informal dirt path farther from Bellfort Street.
Trends Usage tends to be higher on weekdays (39 users/day) than during weekends (28 users/day). On weekdays, usage is highest in the early afternoon (1:00 p.m. – 2:00 p.m.). During weekends, usage is highest midday (11:00 a.m. – 12:00 p.m.) and in the mid-afternoon (2:00 p.m. – 3:00
p.m.).

381 | Appendix
Houston-Galveston Area Council 63
Location Information: Map
Location Information: Photos
Image 29: Bellfort Street Westbound near Leonard Street
Facing East
Image 30: Bellfort Street Westbound near Leonard Street
Facing West
T9
Sidewalk west of Counter T9 is covered with mud.

382
Houston-Galveston Area Council 64
Daily Usage Bellfort Street Westbound at Leonard Street
Date Users
Select Weather Data*
High Temperature (°F)
Low Temperature (°F)
Precipitation (inches)
Saturday, August 6, 2016 27 98 77 0 Sunday, August 7, 2016 29 100 78 0 Monday, August 8, 2016 58 100 77 0 Tuesday, August 9, 2016 40 101 77 0 Wednesday, August 10, 2016 46 100 79 0 Thursday, August 11, 2016 43 101 82 0 Friday, August 12, 2016 43 99 82 0 Saturday, August 13, 2016 33 97 76 0.83 Sunday, August 14, 2016 24 89 72 1.66 Monday, August 15, 2016 30 86 75 1.43 Tuesday, August 16, 2016 24 82 74 2.05 Wednesday, August 17, 2016 30 83 73 1.73 Thursday, August 18, 2016 32 88 74 0.19 Friday, August 19, 2016 20 92 75 0.39 Saturday, August 20, 2016 30 91 75 0.53 Sunday, August 21, 2016 25 87 76 T Monday, August 22, 2016 59 89 73 0.33
Total 593 Average Daily Usage 35 Average Daily Usage (Weekday) 39 Average Daily Usage (Weekend) 28
*Weather conditions recorded at KHOU.
0
10
20
30
40
50
60
70
Daily Usage
Busiest Day Monday, August 22
59 users
Least Busy Day Friday, August 19
20 users
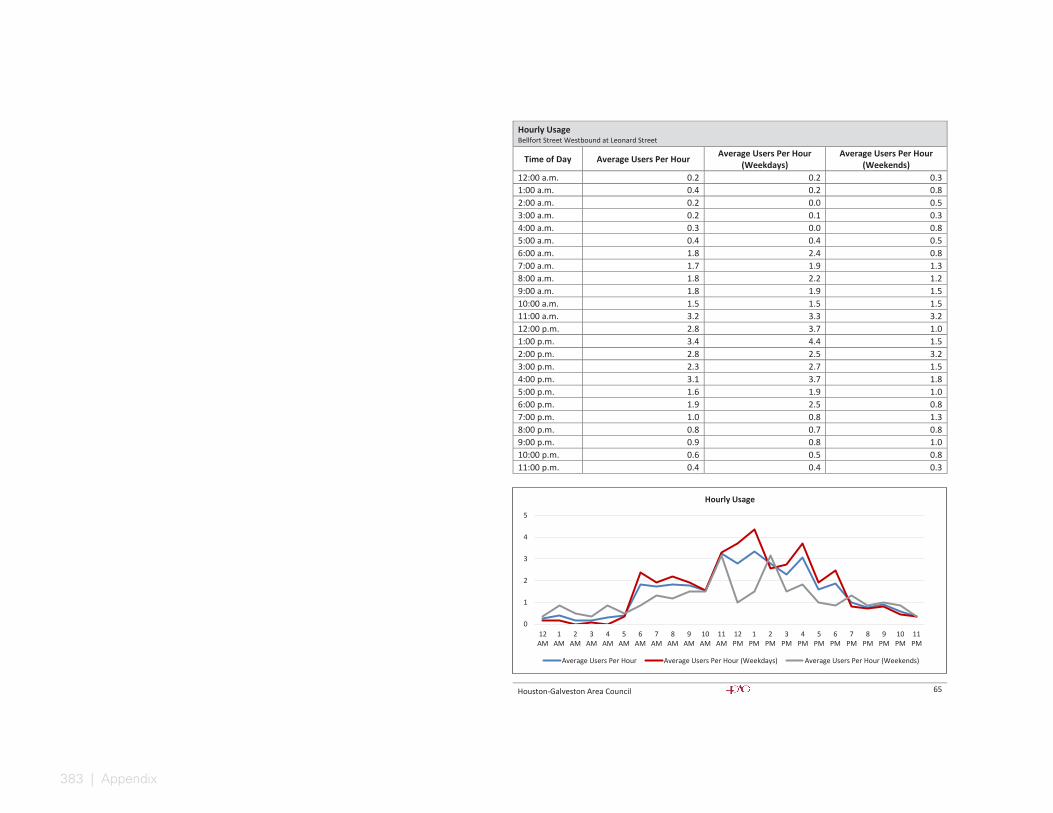
383 | Appendix
Houston-Galveston Area Council 65
Hourly Usage Bellfort Street Westbound at Leonard Street
Time of Day Average Users Per Hour Average Users Per Hour (Weekdays)
Average Users Per Hour (Weekends)
12:00 a.m. 0.2 0.2 0.3 1:00 a.m. 0.4 0.2 0.8 2:00 a.m. 0.2 0.0 0.5 3:00 a.m. 0.2 0.1 0.3 4:00 a.m. 0.3 0.0 0.8 5:00 a.m. 0.4 0.4 0.5 6:00 a.m. 1.8 2.4 0.8 7:00 a.m. 1.7 1.9 1.3 8:00 a.m. 1.8 2.2 1.2 9:00 a.m. 1.8 1.9 1.5 10:00 a.m. 1.5 1.5 1.5 11:00 a.m. 3.2 3.3 3.2 12:00 p.m. 2.8 3.7 1.0 1:00 p.m. 3.4 4.4 1.5 2:00 p.m. 2.8 2.5 3.2 3:00 p.m. 2.3 2.7 1.5 4:00 p.m. 3.1 3.7 1.8 5:00 p.m. 1.6 1.9 1.0 6:00 p.m. 1.9 2.5 0.8 7:00 p.m. 1.0 0.8 1.3 8:00 p.m. 0.8 0.7 0.8 9:00 p.m. 0.9 0.8 1.0 10:00 p.m. 0.6 0.5 0.8 11:00 p.m. 0.4 0.4 0.3
0
1
2
3
4
5
12AM
1AM
2AM
3AM
4AM
5AM
6AM
7AM
8AM
9AM
10AM
11AM
12PM
1PM
2PM
3PM
4PM
5PM
6PM
7PM
8PM
9PM
10PM
11PM
Hourly Usage
Average Users Per Hour Average Users Per Hour (Weekdays) Average Users Per Hour (Weekends)
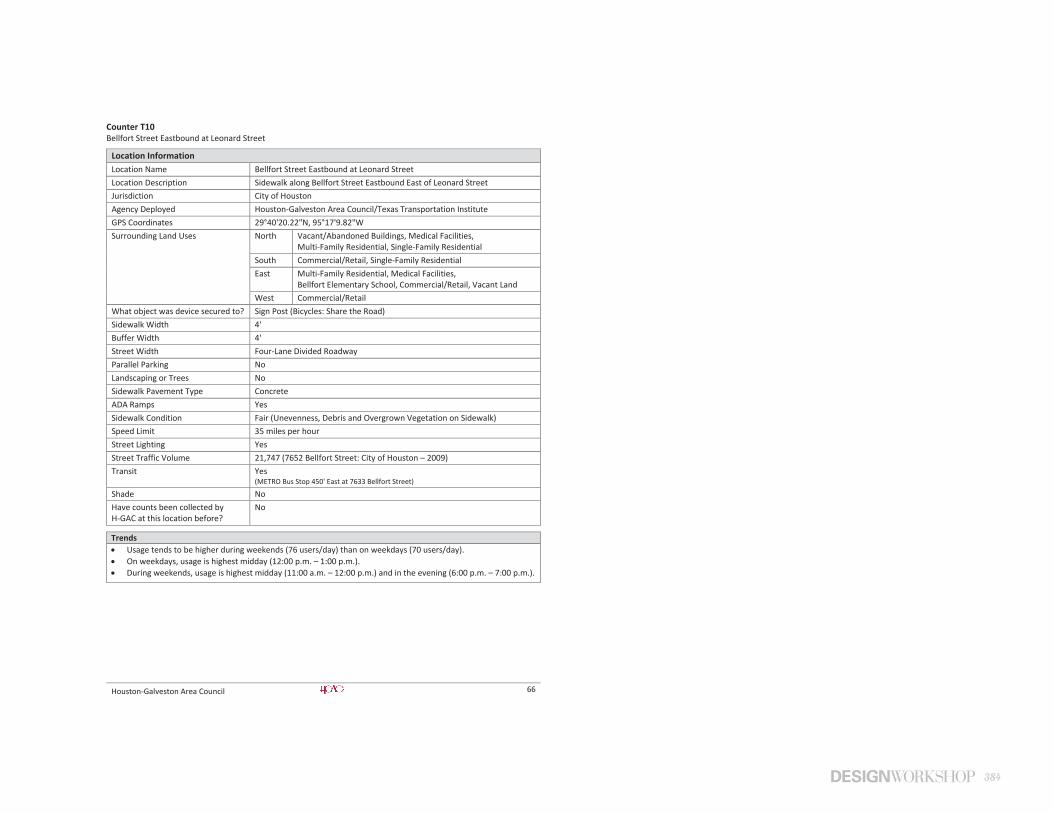
384
Houston-Galveston Area Council 66
Counter T10 Bellfort Street Eastbound at Leonard Street
Location Information Location Name Bellfort Street Eastbound at Leonard Street Location Description Sidewalk along Bellfort Street Eastbound East of Leonard Street Jurisdiction City of Houston Agency Deployed Houston-Galveston Area Council/Texas Transportation Institute GPS Coordinates 29°40'20.22"N, 95°17'9.82"W Surrounding Land Uses North Vacant/Abandoned Buildings, Medical Facilities,
Multi-Family Residential, Single-Family Residential South Commercial/Retail, Single-Family Residential East Multi-Family Residential, Medical Facilities,
Bellfort Elementary School, Commercial/Retail, Vacant Land West Commercial/Retail
What object was device secured to? Sign Post (Bicycles: Share the Road) Sidewalk Width 4' Buffer Width 4' Street Width Four-Lane Divided Roadway Parallel Parking No Landscaping or Trees No Sidewalk Pavement Type Concrete ADA Ramps Yes Sidewalk Condition Fair (Unevenness, Debris and Overgrown Vegetation on Sidewalk) Speed Limit 35 miles per hour Street Lighting Yes Street Traffic Volume 21,747 (7652 Bellfort Street: City of Houston – 2009) Transit Yes
(METRO Bus Stop 450' East at 7633 Bellfort Street) Shade No Have counts been collected by H-GAC at this location before?
No
Trends Usage tends to be higher during weekends (76 users/day) than on weekdays (70 users/day). On weekdays, usage is highest midday (12:00 p.m. – 1:00 p.m.). During weekends, usage is highest midday (11:00 a.m. – 12:00 p.m.) and in the evening (6:00 p.m. – 7:00 p.m.).

385 | Appendix
Houston-Galveston Area Council 67
Location Information: Map
Location Information: Photos
Image 31: Bellfort Street Eastbound near Leonard Street
Facing East
Image 32: Bellfort Street Eastbound near Leonard Street
Facing West
T10
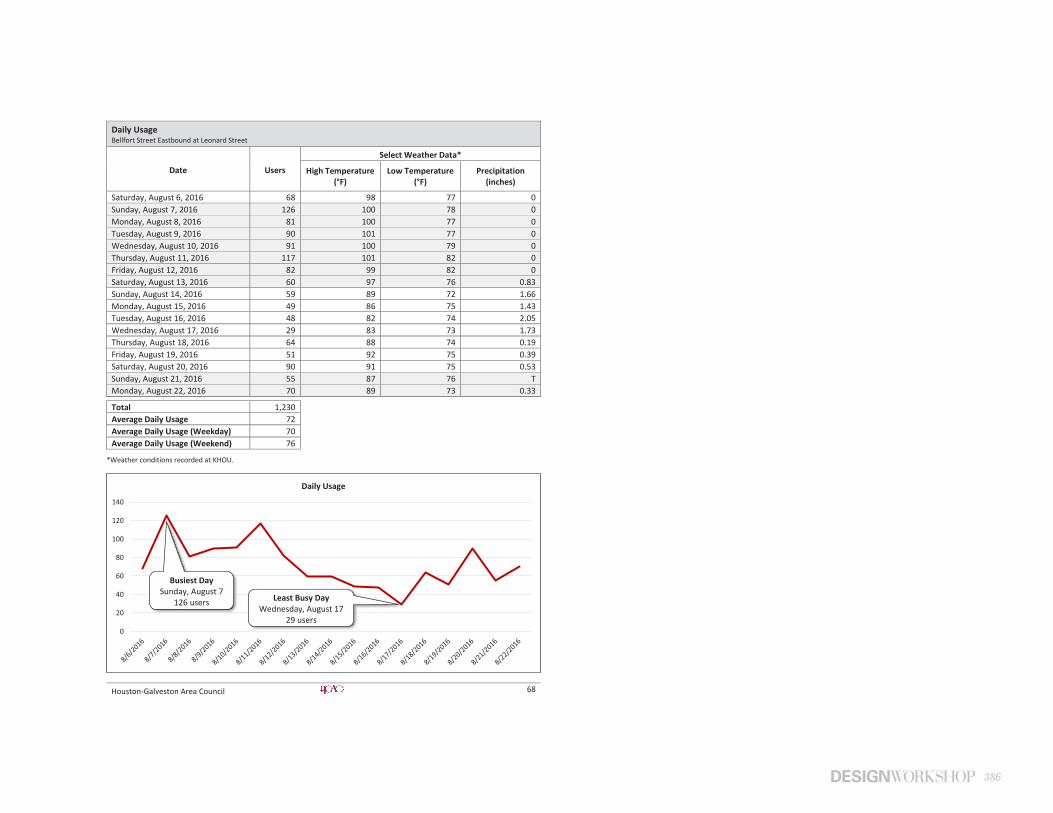
386
Houston-Galveston Area Council 68
Daily Usage Bellfort Street Eastbound at Leonard Street
Date Users
Select Weather Data*
High Temperature (°F)
Low Temperature (°F)
Precipitation (inches)
Saturday, August 6, 2016 68 98 77 0 Sunday, August 7, 2016 126 100 78 0 Monday, August 8, 2016 81 100 77 0 Tuesday, August 9, 2016 90 101 77 0 Wednesday, August 10, 2016 91 100 79 0 Thursday, August 11, 2016 117 101 82 0 Friday, August 12, 2016 82 99 82 0 Saturday, August 13, 2016 60 97 76 0.83 Sunday, August 14, 2016 59 89 72 1.66 Monday, August 15, 2016 49 86 75 1.43 Tuesday, August 16, 2016 48 82 74 2.05 Wednesday, August 17, 2016 29 83 73 1.73 Thursday, August 18, 2016 64 88 74 0.19 Friday, August 19, 2016 51 92 75 0.39 Saturday, August 20, 2016 90 91 75 0.53 Sunday, August 21, 2016 55 87 76 T Monday, August 22, 2016 70 89 73 0.33
Total 1,230 Average Daily Usage 72 Average Daily Usage (Weekday) 70 Average Daily Usage (Weekend) 76
*Weather conditions recorded at KHOU.
0
20
40
60
80
100
120
140
Daily Usage
Busiest Day Sunday, August 7
126 users
Least Busy Day Wednesday, August 17
29 users

387 | Appendix
Houston-Galveston Area Council 69
Hourly Usage Bellfort Street Eastbound at Leonard Street
Time of Day Average Users Per Hour Average Users Per Hour (Weekdays)
Average Users Per Hour (Weekends)
12:00 a.m. 1.0 1.3 0.5 1:00 a.m. 1.7 1.5 2.2 2:00 a.m. 0.6 0.4 1.0 3:00 a.m. 0.9 0.7 1.2 4:00 a.m. 0.4 0.5 0.0 5:00 a.m. 0.6 0.6 0.7 6:00 a.m. 1.6 1.6 1.5 7:00 a.m. 2.8 2.7 3.0 8:00 a.m. 2.1 2.7 0.8 9:00 a.m. 3.1 2.9 3.5 10:00 a.m. 3.6 3.6 3.5 11:00 a.m. 4.3 3.2 6.3 12:00 p.m. 5.9 6.5 5.0 1:00 p.m. 4.5 4.3 5.0 2:00 p.m. 4.2 3.9 4.7 3:00 p.m. 4.2 3.9 4.7 4:00 p.m. 4.9 4.5 5.5 5:00 p.m. 5.1 4.9 5.3 6:00 p.m. 5.2 4.5 6.7 7:00 p.m. 4.4 4.5 4.0 8:00 p.m. 4.6 4.8 4.2 9:00 p.m. 4.3 4.9 3.2 10:00 p.m. 1.4 1.0 2.2 11:00 p.m. 1.1 0.6 1.8
0
1
2
3
4
5
6
7
12AM
1AM
2AM
3AM
4AM
5AM
6AM
7AM
8AM
9AM
10AM
11AM
12PM
1PM
2PM
3PM
4PM
5PM
6PM
7PM
8PM
9PM
10PM
11PM
Hourly Usage
Average Users Per Hour Average Users Per Hour (Weekdays) Average Users Per Hour (Weekends)
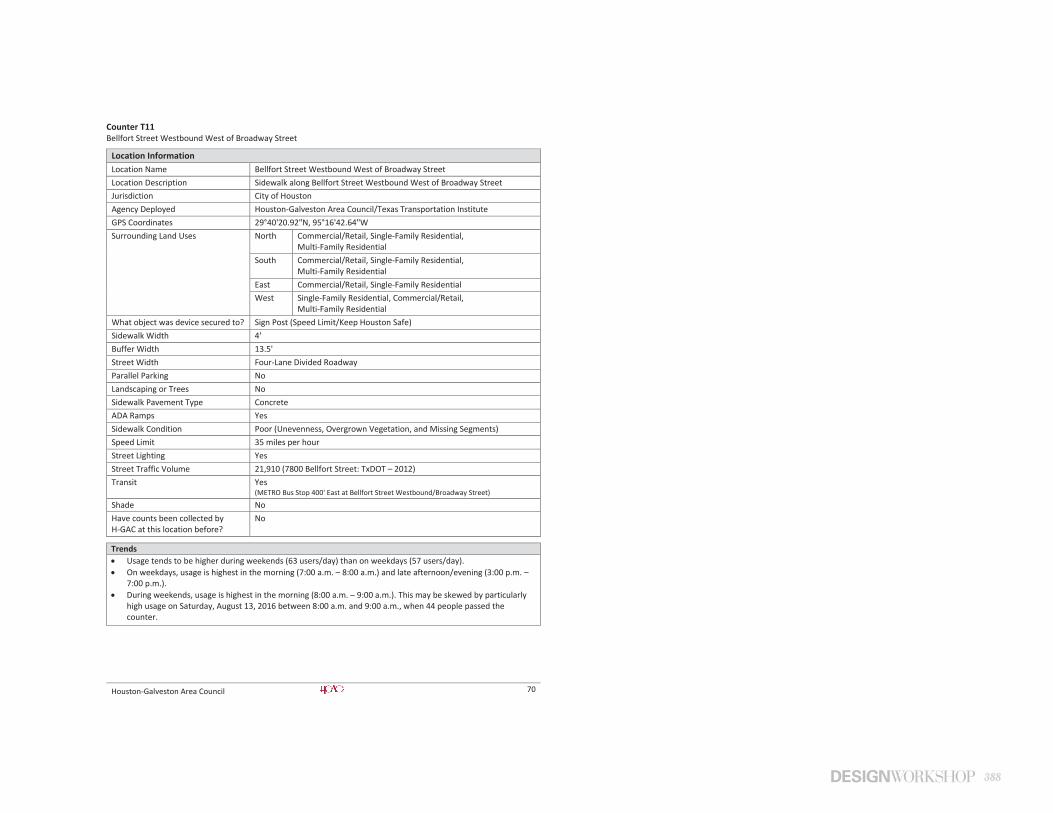
388
Houston-Galveston Area Council 70
Counter T11 Bellfort Street Westbound West of Broadway Street
Location Information Location Name Bellfort Street Westbound West of Broadway Street Location Description Sidewalk along Bellfort Street Westbound West of Broadway Street Jurisdiction City of Houston Agency Deployed Houston-Galveston Area Council/Texas Transportation Institute GPS Coordinates 29°40'20.92"N, 95°16'42.64"W Surrounding Land Uses North Commercial/Retail, Single-Family Residential,
Multi-Family Residential South Commercial/Retail, Single-Family Residential,
Multi-Family Residential East Commercial/Retail, Single-Family Residential West Single-Family Residential, Commercial/Retail,
Multi-Family Residential What object was device secured to? Sign Post (Speed Limit/Keep Houston Safe) Sidewalk Width 4' Buffer Width 13.5' Street Width Four-Lane Divided Roadway Parallel Parking No Landscaping or Trees No Sidewalk Pavement Type Concrete ADA Ramps Yes Sidewalk Condition Poor (Unevenness, Overgrown Vegetation, and Missing Segments) Speed Limit 35 miles per hour Street Lighting Yes Street Traffic Volume 21,910 (7800 Bellfort Street: TxDOT – 2012) Transit Yes
(METRO Bus Stop 400' East at Bellfort Street Westbound/Broadway Street) Shade No Have counts been collected by H-GAC at this location before?
No
Trends Usage tends to be higher during weekends (63 users/day) than on weekdays (57 users/day). On weekdays, usage is highest in the morning (7:00 a.m. – 8:00 a.m.) and late afternoon/evening (3:00 p.m. –
7:00 p.m.). During weekends, usage is highest in the morning (8:00 a.m. – 9:00 a.m.). This may be skewed by particularly
high usage on Saturday, August 13, 2016 between 8:00 a.m. and 9:00 a.m., when 44 people passed the counter.
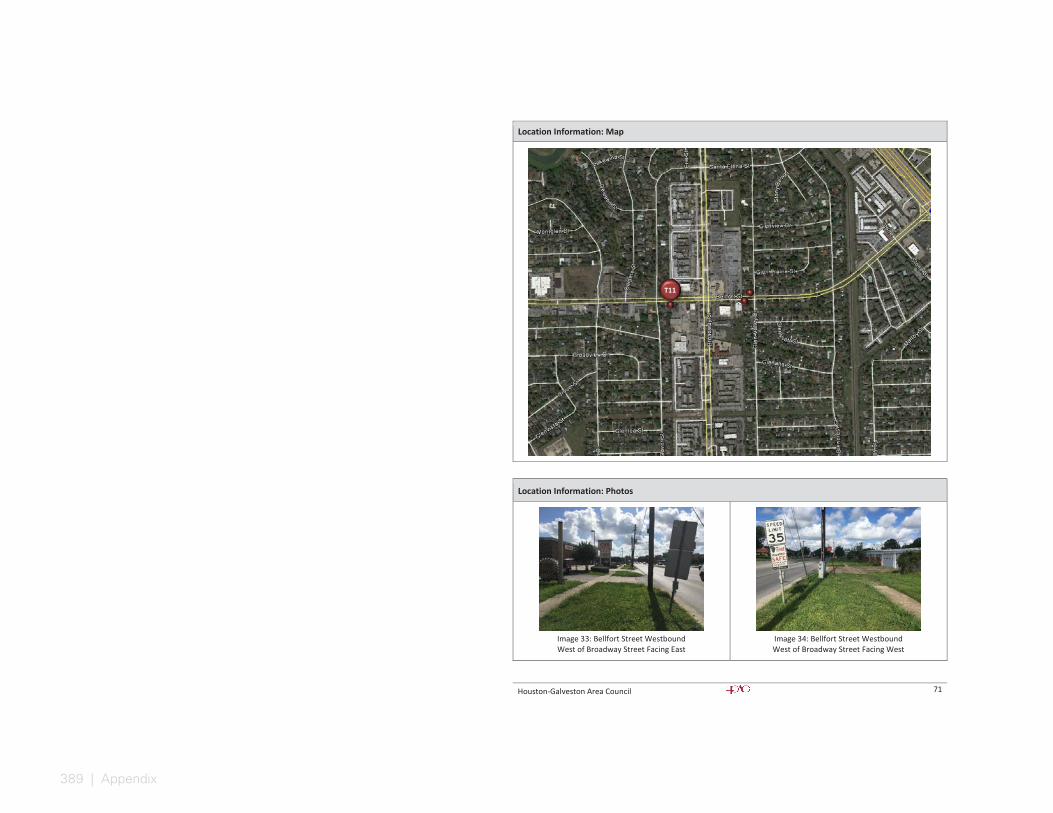
389 | Appendix
Houston-Galveston Area Council 71
Location Information: Map
Location Information: Photos
Image 33: Bellfort Street Westbound West of Broadway Street Facing East
Image 34: Bellfort Street Westbound West of Broadway Street Facing West
T11
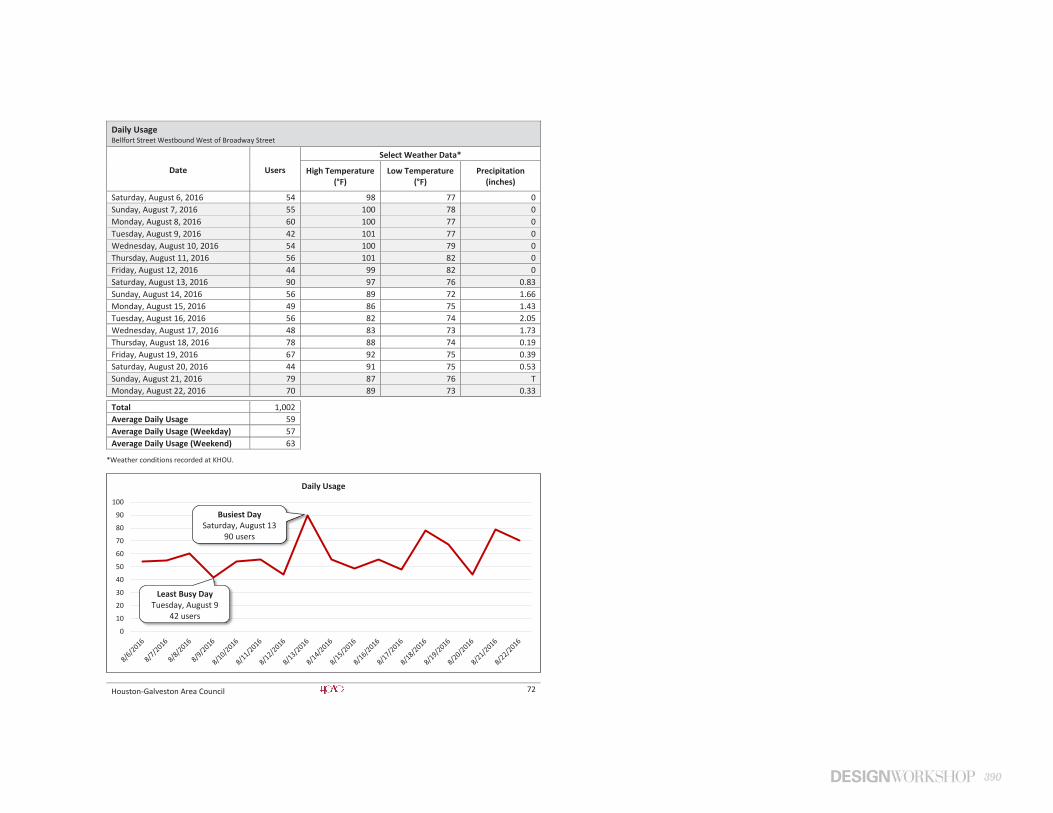
390
Houston-Galveston Area Council 72
Daily Usage Bellfort Street Westbound West of Broadway Street
Date Users
Select Weather Data*
High Temperature (°F)
Low Temperature (°F)
Precipitation (inches)
Saturday, August 6, 2016 54 98 77 0 Sunday, August 7, 2016 55 100 78 0 Monday, August 8, 2016 60 100 77 0 Tuesday, August 9, 2016 42 101 77 0 Wednesday, August 10, 2016 54 100 79 0 Thursday, August 11, 2016 56 101 82 0 Friday, August 12, 2016 44 99 82 0 Saturday, August 13, 2016 90 97 76 0.83 Sunday, August 14, 2016 56 89 72 1.66 Monday, August 15, 2016 49 86 75 1.43 Tuesday, August 16, 2016 56 82 74 2.05 Wednesday, August 17, 2016 48 83 73 1.73 Thursday, August 18, 2016 78 88 74 0.19 Friday, August 19, 2016 67 92 75 0.39 Saturday, August 20, 2016 44 91 75 0.53 Sunday, August 21, 2016 79 87 76 T Monday, August 22, 2016 70 89 73 0.33
Total 1,002 Average Daily Usage 59 Average Daily Usage (Weekday) 57 Average Daily Usage (Weekend) 63
*Weather conditions recorded at KHOU.
0
10
20
30
40
50
60
70
80
90
100
Daily Usage
Busiest Day Saturday, August 13
90 users
Least Busy Day Tuesday, August 9
42 users
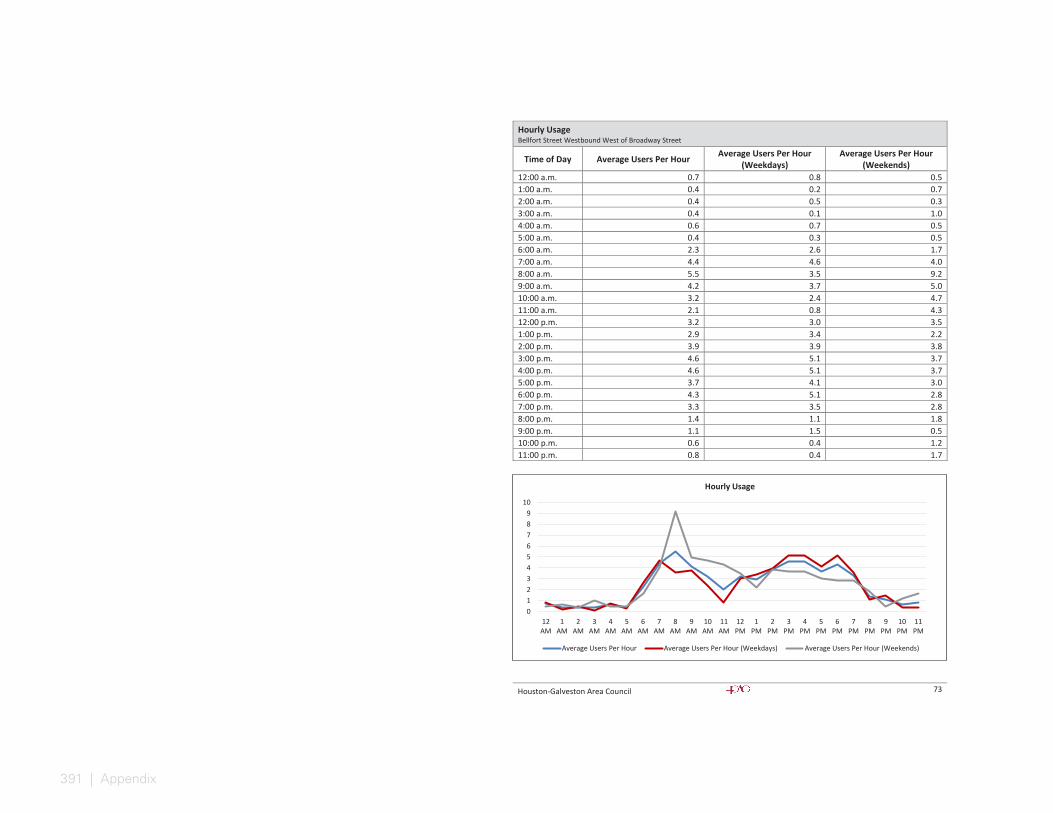
391 | Appendix
Houston-Galveston Area Council 73
Hourly Usage Bellfort Street Westbound West of Broadway Street
Time of Day Average Users Per Hour Average Users Per Hour (Weekdays)
Average Users Per Hour (Weekends)
12:00 a.m. 0.7 0.8 0.5 1:00 a.m. 0.4 0.2 0.7 2:00 a.m. 0.4 0.5 0.3 3:00 a.m. 0.4 0.1 1.0 4:00 a.m. 0.6 0.7 0.5 5:00 a.m. 0.4 0.3 0.5 6:00 a.m. 2.3 2.6 1.7 7:00 a.m. 4.4 4.6 4.0 8:00 a.m. 5.5 3.5 9.2 9:00 a.m. 4.2 3.7 5.0 10:00 a.m. 3.2 2.4 4.7 11:00 a.m. 2.1 0.8 4.3 12:00 p.m. 3.2 3.0 3.5 1:00 p.m. 2.9 3.4 2.2 2:00 p.m. 3.9 3.9 3.8 3:00 p.m. 4.6 5.1 3.7 4:00 p.m. 4.6 5.1 3.7 5:00 p.m. 3.7 4.1 3.0 6:00 p.m. 4.3 5.1 2.8 7:00 p.m. 3.3 3.5 2.8 8:00 p.m. 1.4 1.1 1.8 9:00 p.m. 1.1 1.5 0.5 10:00 p.m. 0.6 0.4 1.2 11:00 p.m. 0.8 0.4 1.7
0123456789
10
12AM
1AM
2AM
3AM
4AM
5AM
6AM
7AM
8AM
9AM
10AM
11AM
12PM
1PM
2PM
3PM
4PM
5PM
6PM
7PM
8PM
9PM
10PM
11PM
Hourly Usage
Average Users Per Hour Average Users Per Hour (Weekdays) Average Users Per Hour (Weekends)
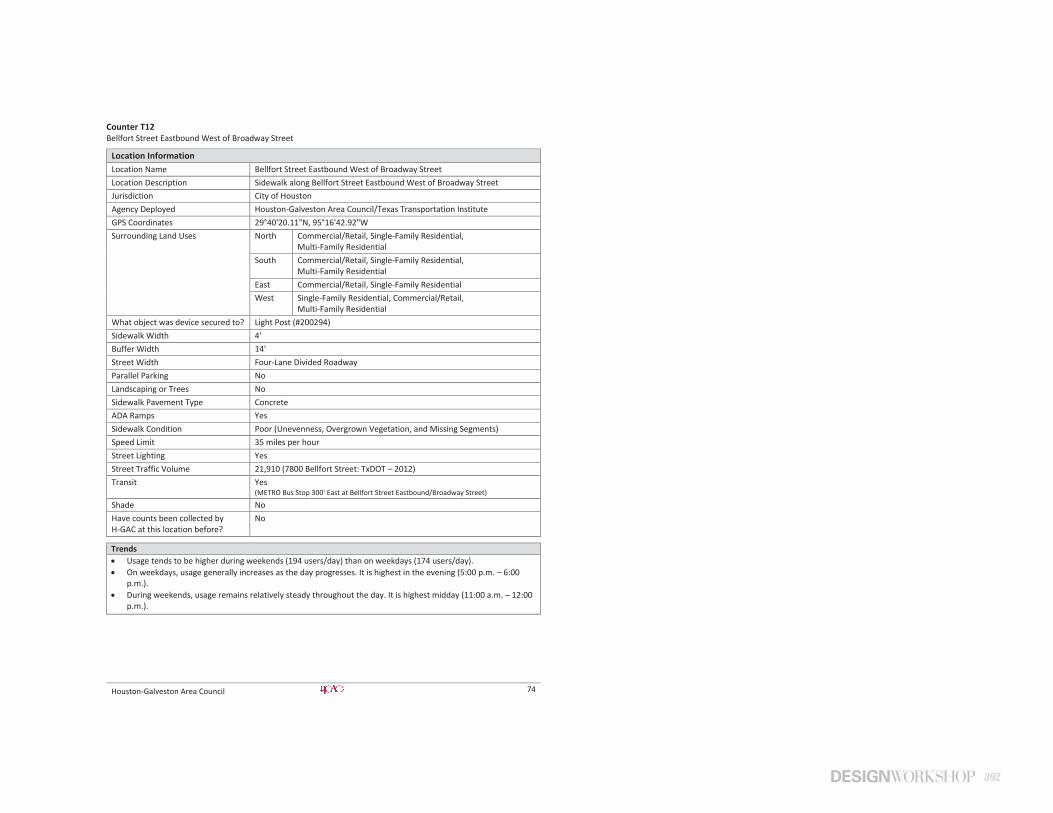
392
Houston-Galveston Area Council 74
Counter T12 Bellfort Street Eastbound West of Broadway Street
Location Information Location Name Bellfort Street Eastbound West of Broadway Street Location Description Sidewalk along Bellfort Street Eastbound West of Broadway Street Jurisdiction City of Houston Agency Deployed Houston-Galveston Area Council/Texas Transportation Institute GPS Coordinates 29°40'20.11"N, 95°16'42.92"W Surrounding Land Uses North Commercial/Retail, Single-Family Residential,
Multi-Family Residential South Commercial/Retail, Single-Family Residential,
Multi-Family Residential East Commercial/Retail, Single-Family Residential West Single-Family Residential, Commercial/Retail,
Multi-Family Residential What object was device secured to? Light Post (#200294) Sidewalk Width 4' Buffer Width 14' Street Width Four-Lane Divided Roadway Parallel Parking No Landscaping or Trees No Sidewalk Pavement Type Concrete ADA Ramps Yes Sidewalk Condition Poor (Unevenness, Overgrown Vegetation, and Missing Segments) Speed Limit 35 miles per hour Street Lighting Yes Street Traffic Volume 21,910 (7800 Bellfort Street: TxDOT – 2012) Transit Yes
(METRO Bus Stop 300' East at Bellfort Street Eastbound/Broadway Street) Shade No Have counts been collected by H-GAC at this location before?
No
Trends Usage tends to be higher during weekends (194 users/day) than on weekdays (174 users/day). On weekdays, usage generally increases as the day progresses. It is highest in the evening (5:00 p.m. – 6:00
p.m.). During weekends, usage remains relatively steady throughout the day. It is highest midday (11:00 a.m. – 12:00
p.m.).
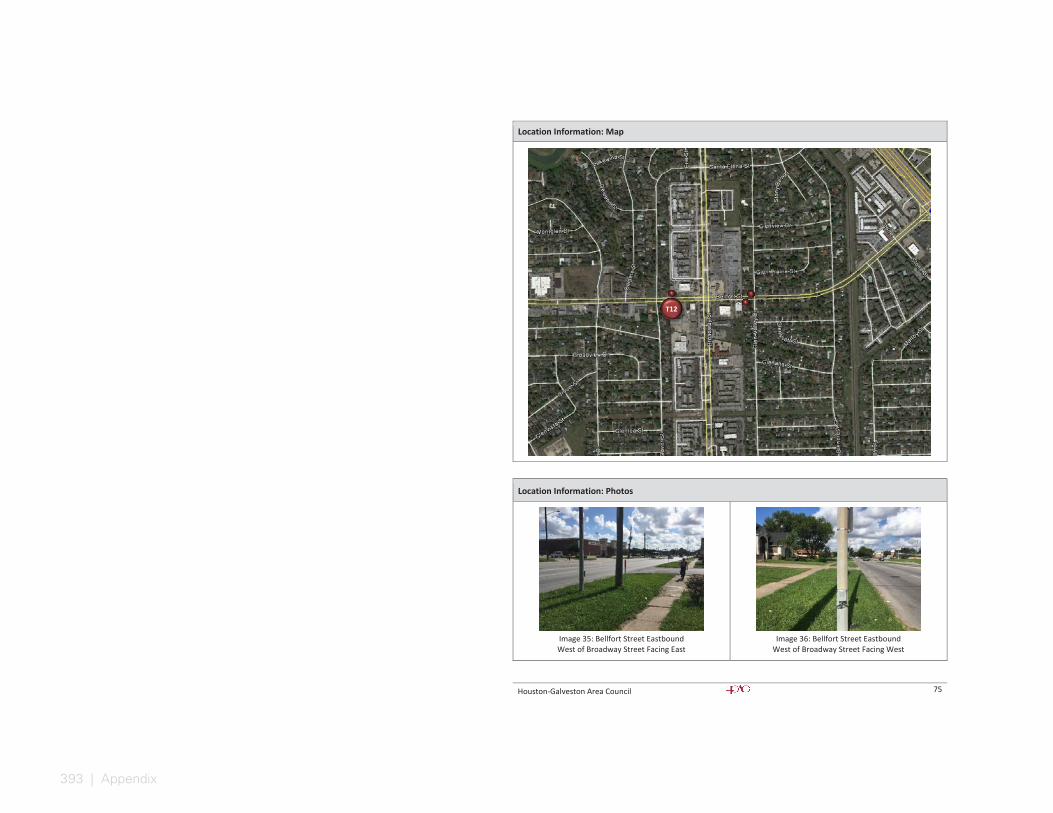
393 | Appendix
Houston-Galveston Area Council 75
Location Information: Map
Location Information: Photos
Image 35: Bellfort Street Eastbound West of Broadway Street Facing East
Image 36: Bellfort Street Eastbound
West of Broadway Street Facing West
T12
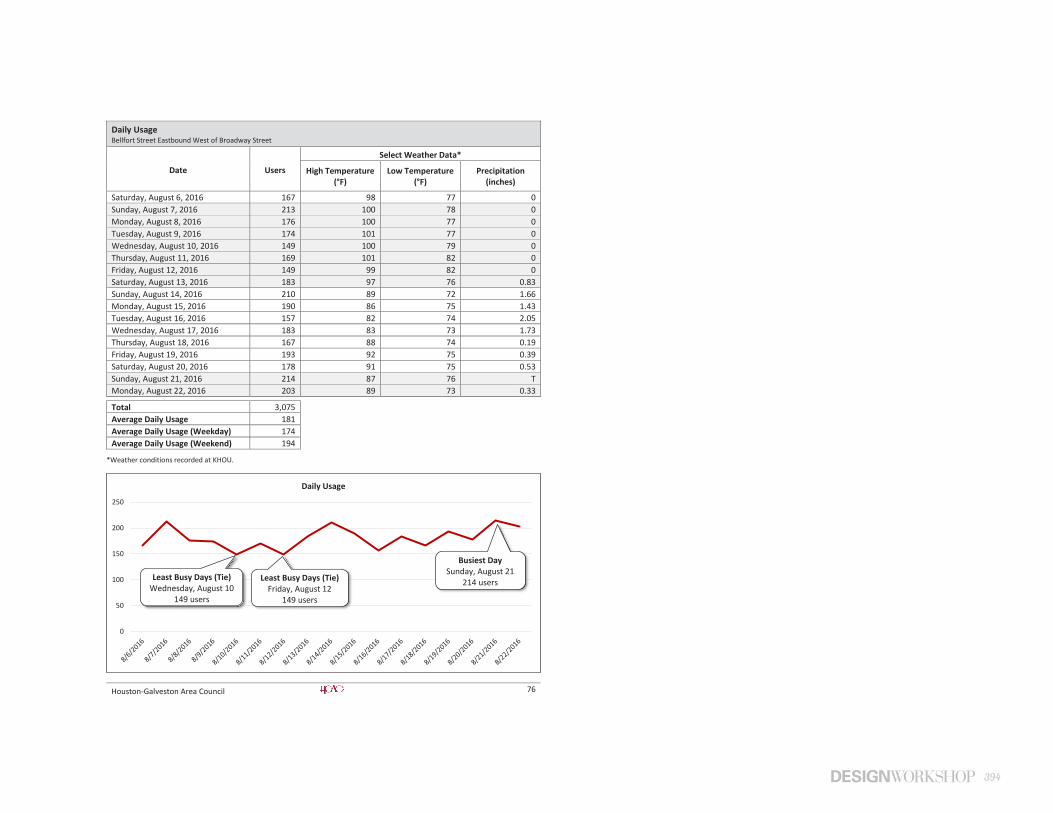
394
Houston-Galveston Area Council 76
Daily Usage Bellfort Street Eastbound West of Broadway Street
Date Users
Select Weather Data*
High Temperature (°F)
Low Temperature (°F)
Precipitation (inches)
Saturday, August 6, 2016 167 98 77 0 Sunday, August 7, 2016 213 100 78 0 Monday, August 8, 2016 176 100 77 0 Tuesday, August 9, 2016 174 101 77 0 Wednesday, August 10, 2016 149 100 79 0 Thursday, August 11, 2016 169 101 82 0 Friday, August 12, 2016 149 99 82 0 Saturday, August 13, 2016 183 97 76 0.83 Sunday, August 14, 2016 210 89 72 1.66 Monday, August 15, 2016 190 86 75 1.43 Tuesday, August 16, 2016 157 82 74 2.05 Wednesday, August 17, 2016 183 83 73 1.73 Thursday, August 18, 2016 167 88 74 0.19 Friday, August 19, 2016 193 92 75 0.39 Saturday, August 20, 2016 178 91 75 0.53 Sunday, August 21, 2016 214 87 76 T Monday, August 22, 2016 203 89 73 0.33
Total 3,075 Average Daily Usage 181 Average Daily Usage (Weekday) 174 Average Daily Usage (Weekend) 194
*Weather conditions recorded at KHOU.
0
50
100
150
200
250
Daily Usage
Busiest Day Sunday, August 21
214 users
Least Busy Days (Tie) Friday, August 12
149 users
Least Busy Days (Tie) Wednesday, August 10
149 users

395 | Appendix
Houston-Galveston Area Council 77
Hourly Usage Bellfort Street Eastbound West of Broadway Street
Time of Day Average Users Per Hour Average Users Per Hour (Weekdays)
Average Users Per Hour (Weekends)
12:00 a.m. 3.7 3.2 4.7 1:00 a.m. 5.3 3.9 7.8 2:00 a.m. 2.5 2.0 3.3 3:00 a.m. 2.2 1.8 3.0 4:00 a.m. 2.0 1.6 2.7 5:00 a.m. 4.2 3.8 5.0 6:00 a.m. 3.5 3.7 3.2 7:00 a.m. 8.5 7.0 11.3 8:00 a.m. 9.4 8.5 11.0 9:00 a.m. 9.8 9.0 11.3 10:00 a.m. 8.9 8.2 10.2 11:00 a.m. 8.5 6.4 12.5 12:00 p.m. 8.5 7.8 9.7 1:00 p.m. 8.8 8.7 8.8 2:00 p.m. 9.9 10.3 9.3 3:00 p.m. 9.9 10.5 9.0 4:00 p.m. 10.0 9.2 11.5 5:00 p.m. 13.7 15.2 11.0 6:00 p.m. 10.9 10.6 11.3 7:00 p.m. 12.5 13.6 10.3 8:00 p.m. 9.5 10.1 8.5 9:00 p.m. 8.8 8.2 10.0 10:00 p.m. 5.5 5.9 4.7 11:00 p.m. 4.2 4.4 4.0
0
2
4
6
8
10
12
14
16
12AM
1AM
2AM
3AM
4AM
5AM
6AM
7AM
8AM
9AM
10AM
11AM
12PM
1PM
2PM
3PM
4PM
5PM
6PM
7PM
8PM
9PM
10PM
11PM
Hourly Usage
Average Users Per Hour Average Users Per Hour (Weekdays) Average Users Per Hour (Weekends)
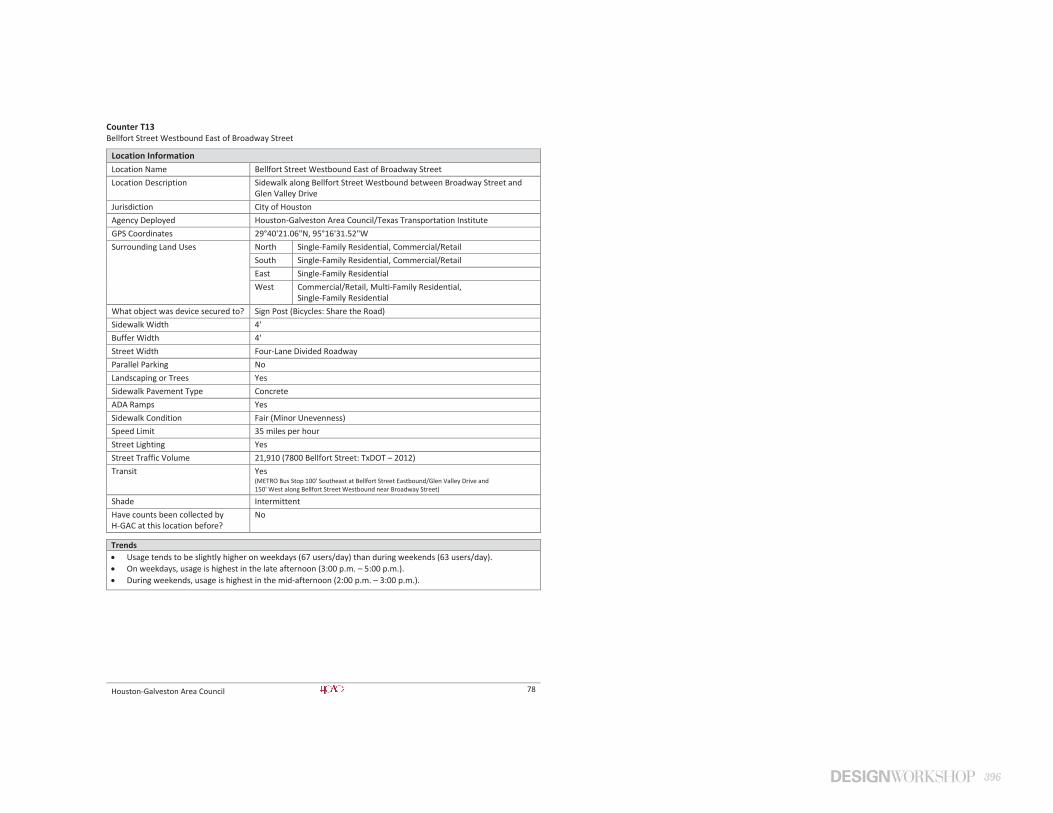
396
Houston-Galveston Area Council 78
Counter T13 Bellfort Street Westbound East of Broadway Street
Location Information Location Name Bellfort Street Westbound East of Broadway Street Location Description Sidewalk along Bellfort Street Westbound between Broadway Street and
Glen Valley Drive Jurisdiction City of Houston Agency Deployed Houston-Galveston Area Council/Texas Transportation Institute GPS Coordinates 29°40'21.06"N, 95°16'31.52"W Surrounding Land Uses North Single-Family Residential, Commercial/Retail
South Single-Family Residential, Commercial/Retail East Single-Family Residential West Commercial/Retail, Multi-Family Residential,
Single-Family Residential What object was device secured to? Sign Post (Bicycles: Share the Road) Sidewalk Width 4' Buffer Width 4' Street Width Four-Lane Divided Roadway Parallel Parking No Landscaping or Trees Yes Sidewalk Pavement Type Concrete ADA Ramps Yes Sidewalk Condition Fair (Minor Unevenness) Speed Limit 35 miles per hour Street Lighting Yes Street Traffic Volume 21,910 (7800 Bellfort Street: TxDOT – 2012) Transit Yes
(METRO Bus Stop 100' Southeast at Bellfort Street Eastbound/Glen Valley Drive and 150' West along Bellfort Street Westbound near Broadway Street)
Shade Intermittent Have counts been collected by H-GAC at this location before?
No
Trends Usage tends to be slightly higher on weekdays (67 users/day) than during weekends (63 users/day). On weekdays, usage is highest in the late afternoon (3:00 p.m. – 5:00 p.m.). During weekends, usage is highest in the mid-afternoon (2:00 p.m. – 3:00 p.m.).
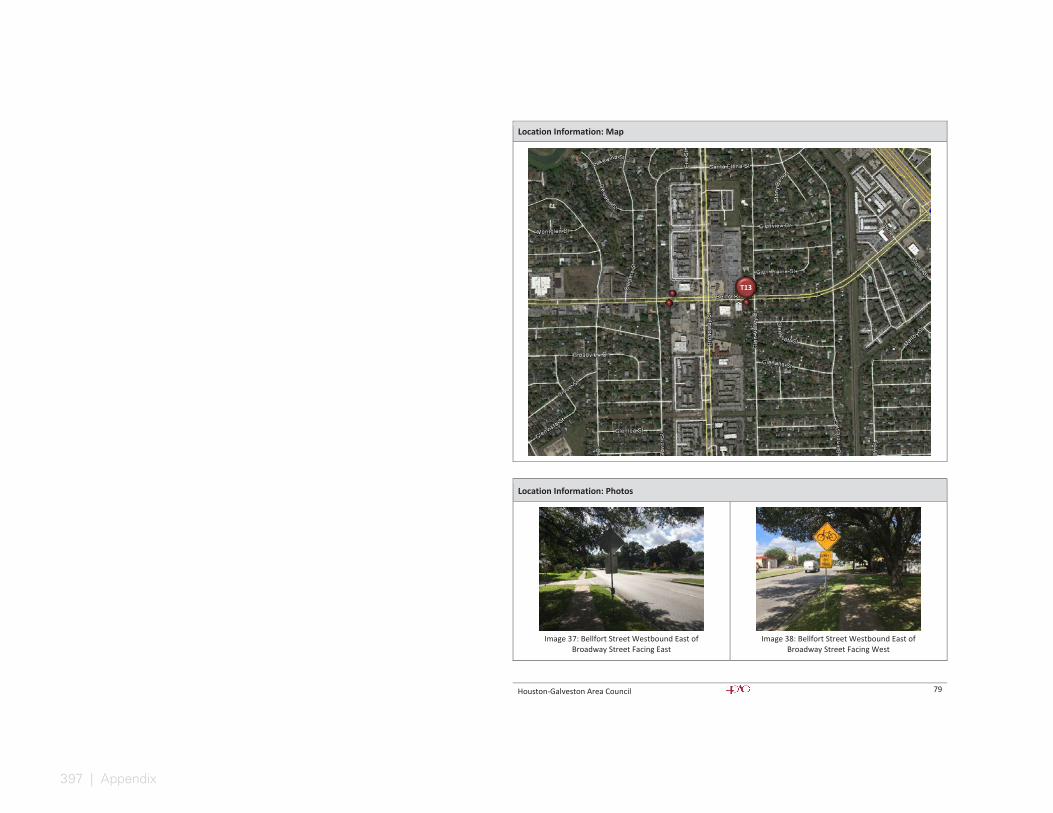
397 | Appendix
Houston-Galveston Area Council 79
Location Information: Map
Location Information: Photos
Image 37: Bellfort Street Westbound East of
Broadway Street Facing East
Image 38: Bellfort Street Westbound East of
Broadway Street Facing West
T13
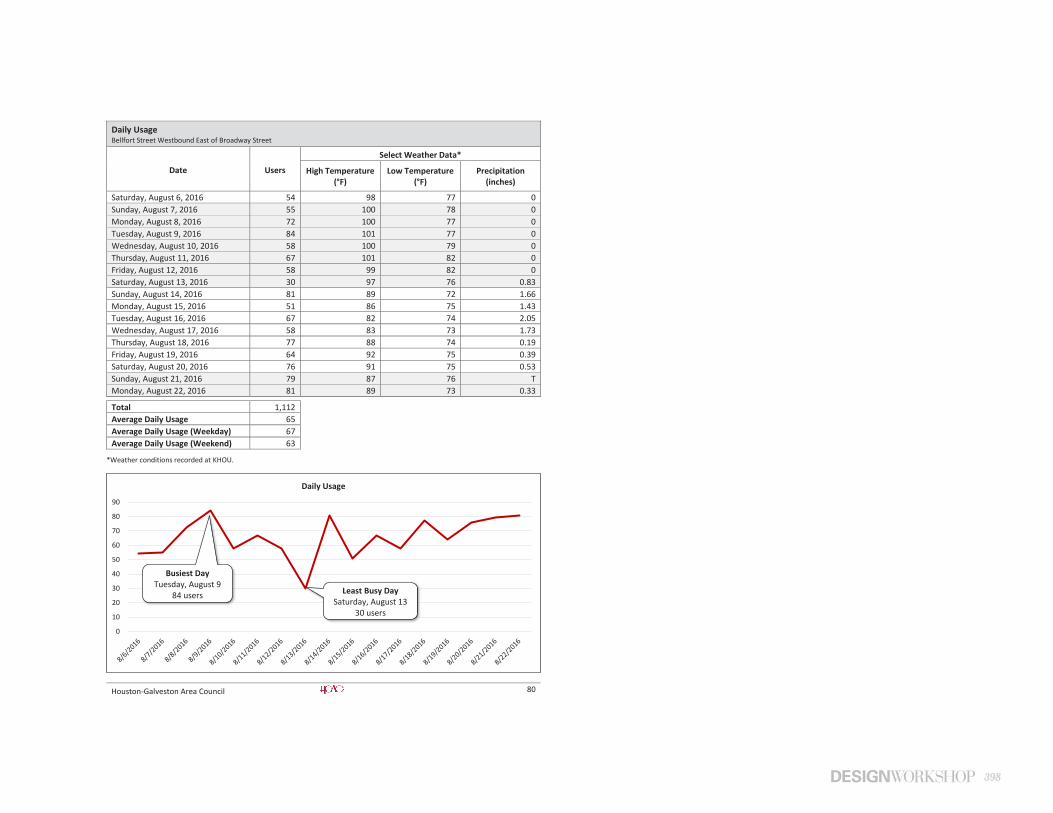
398
Houston-Galveston Area Council 80
Daily Usage Bellfort Street Westbound East of Broadway Street
Date Users
Select Weather Data*
High Temperature (°F)
Low Temperature (°F)
Precipitation (inches)
Saturday, August 6, 2016 54 98 77 0 Sunday, August 7, 2016 55 100 78 0 Monday, August 8, 2016 72 100 77 0 Tuesday, August 9, 2016 84 101 77 0 Wednesday, August 10, 2016 58 100 79 0 Thursday, August 11, 2016 67 101 82 0 Friday, August 12, 2016 58 99 82 0 Saturday, August 13, 2016 30 97 76 0.83 Sunday, August 14, 2016 81 89 72 1.66 Monday, August 15, 2016 51 86 75 1.43 Tuesday, August 16, 2016 67 82 74 2.05 Wednesday, August 17, 2016 58 83 73 1.73 Thursday, August 18, 2016 77 88 74 0.19 Friday, August 19, 2016 64 92 75 0.39 Saturday, August 20, 2016 76 91 75 0.53 Sunday, August 21, 2016 79 87 76 T Monday, August 22, 2016 81 89 73 0.33
Total 1,112 Average Daily Usage 65 Average Daily Usage (Weekday) 67 Average Daily Usage (Weekend) 63
*Weather conditions recorded at KHOU.
0
10
20
30
40
50
60
70
80
90
Daily Usage
Busiest Day Tuesday, August 9
84 users
Least Busy Day Saturday, August 13
30 users
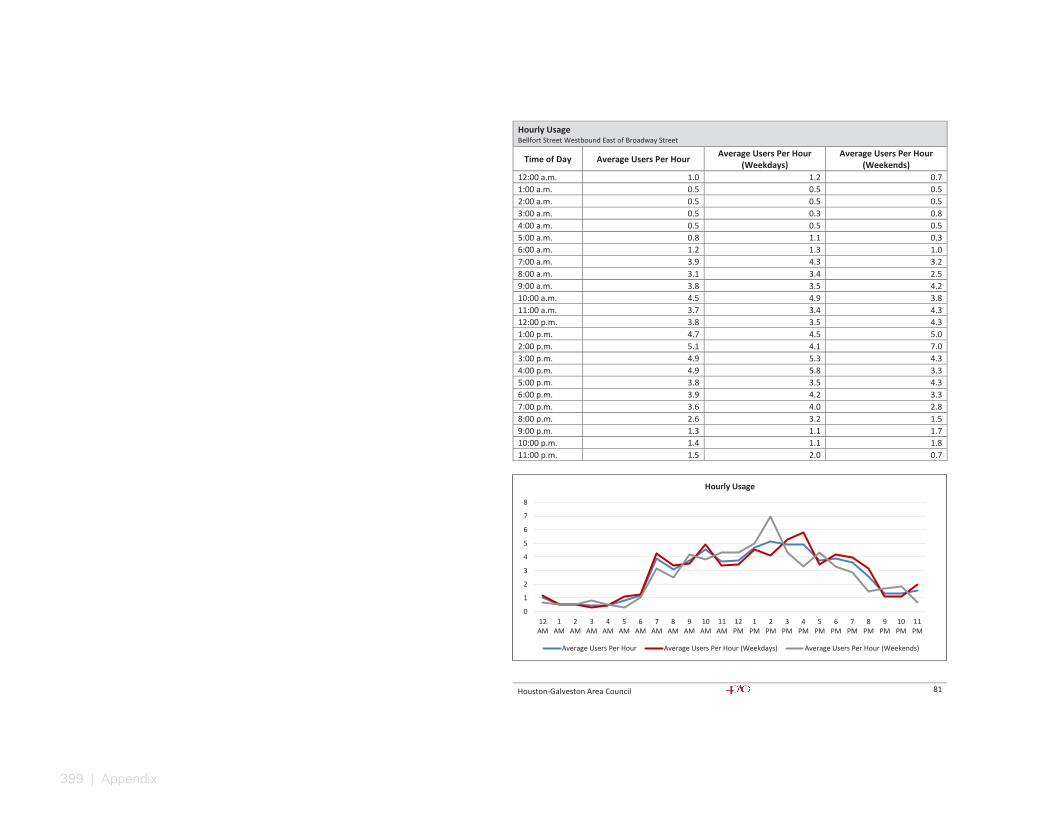
399 | Appendix
Houston-Galveston Area Council 81
Hourly Usage Bellfort Street Westbound East of Broadway Street
Time of Day Average Users Per Hour Average Users Per Hour (Weekdays)
Average Users Per Hour (Weekends)
12:00 a.m. 1.0 1.2 0.7 1:00 a.m. 0.5 0.5 0.5 2:00 a.m. 0.5 0.5 0.5 3:00 a.m. 0.5 0.3 0.8 4:00 a.m. 0.5 0.5 0.5 5:00 a.m. 0.8 1.1 0.3 6:00 a.m. 1.2 1.3 1.0 7:00 a.m. 3.9 4.3 3.2 8:00 a.m. 3.1 3.4 2.5 9:00 a.m. 3.8 3.5 4.2 10:00 a.m. 4.5 4.9 3.8 11:00 a.m. 3.7 3.4 4.3 12:00 p.m. 3.8 3.5 4.3 1:00 p.m. 4.7 4.5 5.0 2:00 p.m. 5.1 4.1 7.0 3:00 p.m. 4.9 5.3 4.3 4:00 p.m. 4.9 5.8 3.3 5:00 p.m. 3.8 3.5 4.3 6:00 p.m. 3.9 4.2 3.3 7:00 p.m. 3.6 4.0 2.8 8:00 p.m. 2.6 3.2 1.5 9:00 p.m. 1.3 1.1 1.7 10:00 p.m. 1.4 1.1 1.8 11:00 p.m. 1.5 2.0 0.7
0
1
2
3
4
5
6
7
8
12AM
1AM
2AM
3AM
4AM
5AM
6AM
7AM
8AM
9AM
10AM
11AM
12PM
1PM
2PM
3PM
4PM
5PM
6PM
7PM
8PM
9PM
10PM
11PM
Hourly Usage
Average Users Per Hour Average Users Per Hour (Weekdays) Average Users Per Hour (Weekends)

400
Houston-Galveston Area Council 82
Counter T14 Bellfort Street Eastbound East of Broadway Street
Location Information Location Name Bellfort Street Eastbound East of Broadway Street Location Description Sidewalk along Bellfort Street Eastbound between Broadway Street and
Glen Valley Drive Jurisdiction City of Houston Agency Deployed Houston-Galveston Area Council/Texas Transportation Institute GPS Coordinates 29°40'20.40"N, 95°16'32.28"W Surrounding Land Uses North Single-Family Residential, Commercial/Retail
South Single-Family Residential, Commercial/Retail East Single-Family Residential West Commercial/Retail, Multi-Family Residential,
Single-Family Residential What object was device secured to? Light Post Sidewalk Width 4' Buffer Width 4.5' Street Width Four-Lane Divided Roadway Parallel Parking No Landscaping or Trees Yes Sidewalk Pavement Type Concrete ADA Ramps Yes Sidewalk Condition Fair (Minor Unevenness and Overgrown Vegetation) Speed Limit 35 miles per hour Street Lighting Yes Street Traffic Volume 21,910 (7800 Bellfort Street: TxDOT – 2012) Transit Yes
(METRO Bus Stop 100' East at Bellfort Street Eastbound/Glen Valley Drive) Shade Intermittent Have counts been collected by H-GAC at this location before?
No
Trends Usage tends to be higher on weekdays (162 users/day) than during weekends (132 users/day). On weekdays, usage is highest in the late afternoon/evening (4:00 p.m. – 6:00 p.m.). There is also a spike in
usage earlier in the morning (8:00 a.m. – 9:00 a.m.). During weekends, usage is highest in the evening (6:00 p.m. – 7:00 p.m.).
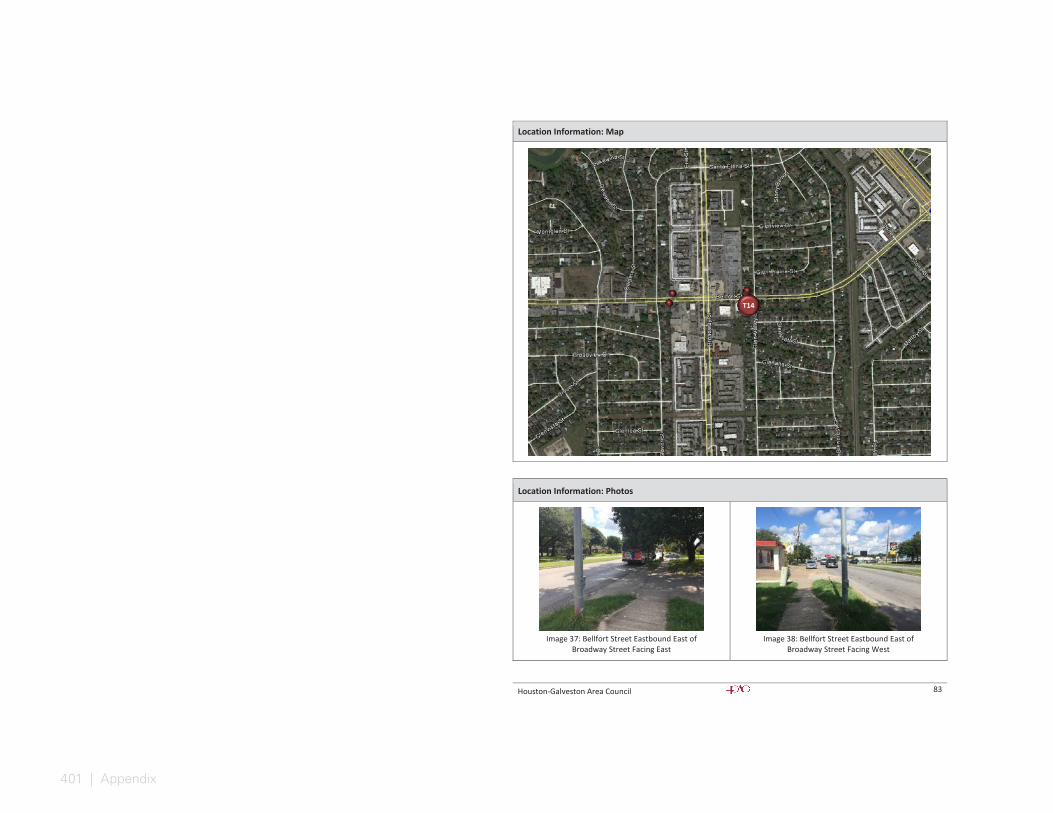
401 | Appendix
Houston-Galveston Area Council 83
Location Information: Map
Location Information: Photos
Image 37: Bellfort Street Eastbound East of
Broadway Street Facing East
Image 38: Bellfort Street Eastbound East of
Broadway Street Facing West
T14
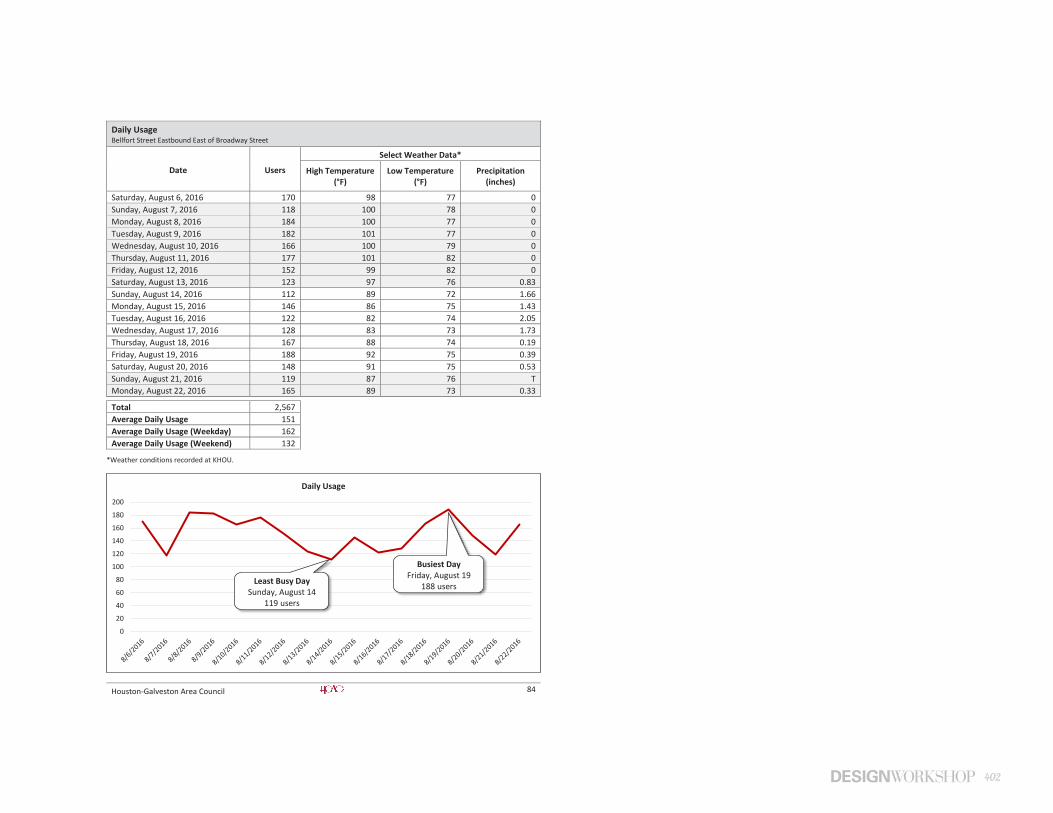
402
Houston-Galveston Area Council 84
Daily Usage Bellfort Street Eastbound East of Broadway Street
Date Users
Select Weather Data*
High Temperature (°F)
Low Temperature (°F)
Precipitation (inches)
Saturday, August 6, 2016 170 98 77 0 Sunday, August 7, 2016 118 100 78 0 Monday, August 8, 2016 184 100 77 0 Tuesday, August 9, 2016 182 101 77 0 Wednesday, August 10, 2016 166 100 79 0 Thursday, August 11, 2016 177 101 82 0 Friday, August 12, 2016 152 99 82 0 Saturday, August 13, 2016 123 97 76 0.83 Sunday, August 14, 2016 112 89 72 1.66 Monday, August 15, 2016 146 86 75 1.43 Tuesday, August 16, 2016 122 82 74 2.05 Wednesday, August 17, 2016 128 83 73 1.73 Thursday, August 18, 2016 167 88 74 0.19 Friday, August 19, 2016 188 92 75 0.39 Saturday, August 20, 2016 148 91 75 0.53 Sunday, August 21, 2016 119 87 76 T Monday, August 22, 2016 165 89 73 0.33
Total 2,567 Average Daily Usage 151 Average Daily Usage (Weekday) 162 Average Daily Usage (Weekend) 132
*Weather conditions recorded at KHOU.
0
20
40
60
80
100
120
140
160
180
200
Daily Usage
Busiest Day Friday, August 19
188 users
Least Busy Day Sunday, August 14
119 users
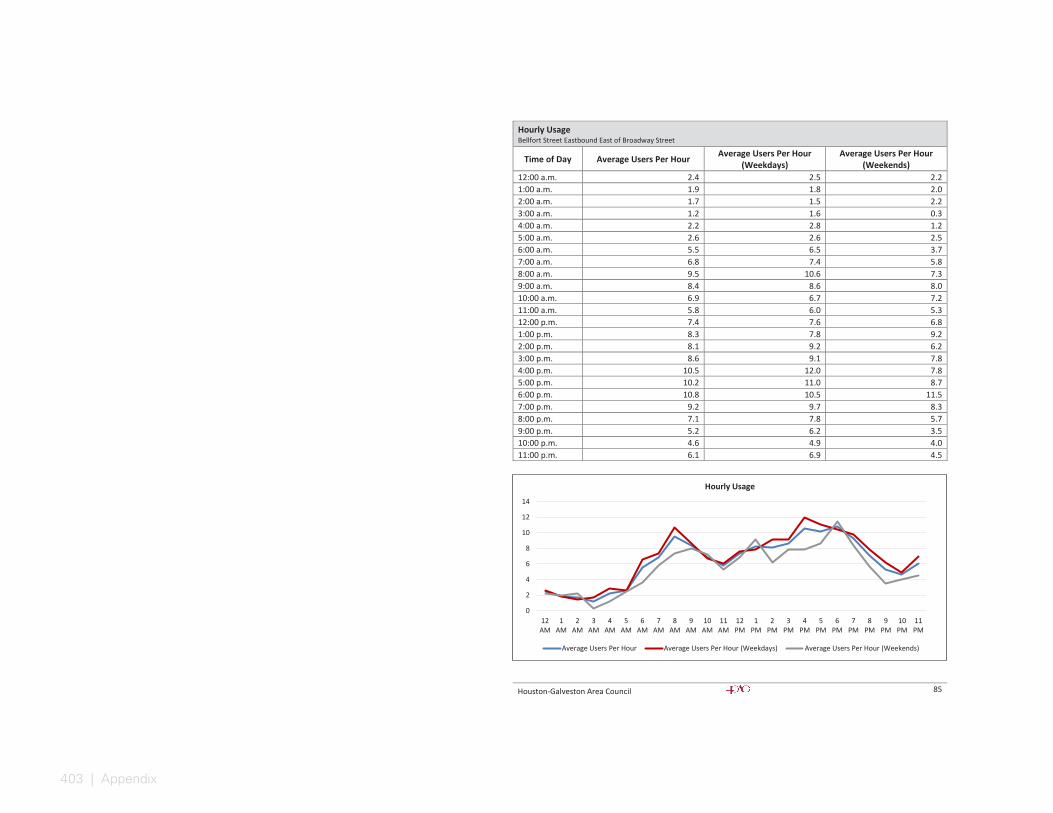
403 | Appendix
Houston-Galveston Area Council 85
Hourly Usage Bellfort Street Eastbound East of Broadway Street
Time of Day Average Users Per Hour Average Users Per Hour (Weekdays)
Average Users Per Hour (Weekends)
12:00 a.m. 2.4 2.5 2.2 1:00 a.m. 1.9 1.8 2.0 2:00 a.m. 1.7 1.5 2.2 3:00 a.m. 1.2 1.6 0.3 4:00 a.m. 2.2 2.8 1.2 5:00 a.m. 2.6 2.6 2.5 6:00 a.m. 5.5 6.5 3.7 7:00 a.m. 6.8 7.4 5.8 8:00 a.m. 9.5 10.6 7.3 9:00 a.m. 8.4 8.6 8.0 10:00 a.m. 6.9 6.7 7.2 11:00 a.m. 5.8 6.0 5.3 12:00 p.m. 7.4 7.6 6.8 1:00 p.m. 8.3 7.8 9.2 2:00 p.m. 8.1 9.2 6.2 3:00 p.m. 8.6 9.1 7.8 4:00 p.m. 10.5 12.0 7.8 5:00 p.m. 10.2 11.0 8.7 6:00 p.m. 10.8 10.5 11.5 7:00 p.m. 9.2 9.7 8.3 8:00 p.m. 7.1 7.8 5.7 9:00 p.m. 5.2 6.2 3.5 10:00 p.m. 4.6 4.9 4.0 11:00 p.m. 6.1 6.9 4.5
0
2
4
6
8
10
12
14
12AM
1AM
2AM
3AM
4AM
5AM
6AM
7AM
8AM
9AM
10AM
11AM
12PM
1PM
2PM
3PM
4PM
5PM
6PM
7PM
8PM
9PM
10PM
11PM
Hourly Usage
Average Users Per Hour Average Users Per Hour (Weekdays) Average Users Per Hour (Weekends)

404
Houston-Galveston Area Council 86
Participants
Houston-Galveston Area Council: Pedestrian-Bicyclist Planning www.h-gac.com/go/pedbike Texas Transportation Institute http://tti.tamu.edu/
DW LEGACY DESIGN®
We believe that when environment, economics, art and community are combined in harmony with the dictates of the land and needs
of society, magical places result — sustainable places of timeless beauty, significant value and enduring quality, places that lift the spirit.
Design Workshop is dedicated to creating Legacy projects: for our clients, for society and for the well-being of our planet.
ASHEVILLE • ASPEN • AUSTIN • CHICAGO • DENVER • DUBAI • HOUSTON • LAKE TAHOE • LOS ANGELES • SHANGHAI