Embed Size (px)
Citation preview

✓ . ' ' \TOWARDS IDENTIFYING THE SKILLS REQUIRED
" FOR THE CHANGING ROLE OF THE SYSTEMS ANALYST
" „ "| ■ • . H.
I-' 0
TREVOR DOUGLAS CROSSMAN
A thesis submitted to the Graduate School of Business Administration,
University of the Witwatersrand, Johannesburg in fulfilment of the
requirements for the Degree of Doctor of Philosophy. ^
JOHANNESBURG 1990
ABSTRACT ■ ^ ..
Information Systems (I.S.) departments are continually challenged to
Identify methods of exploiting advances in comouter-related technology.’ t ('1) 1
The rapid evolution and spread of computing power and the propagation of
new methods of application systems development, have created a j3b
turbulence in the I.S. industry. Efforts to resolve this turbulence
have resulted in significant investments in both hardware and software,
in the creation of new organizational structures and the emergence of
new job responsibilities within I.S. departments. Traditional skills
and job titles show sighs of becoming obsolete. 1
To identify the skills Yequiredby the systems analyst of the!
future, two conceptual models were constructed. The first model Was
built from empirical data Accumulated from the answers to open-ended
questions from 32 experts, and mailed questionnaire replies from 159
practising systems analysts. This model linked the expected
application systems development methods with the systems analyst job
responsibilities within these development methods, and the skills
required to perform these responsibilities effectively. The second
model, based on a literature survey, linked the associations which
future systems analysts are expected to have with their environments,
with the roles they will play within these associations* and the skills
they will require to be effective in these roles. <>
The skills identified in these two models were combined into
generic gr.oUps which suggested a new dispensation of job categories.
The jpb title 'systems analyst' was found, at best, to identify a
function (or role) rather than an individual and, more probably, to be

<> = , ' 0
inappropriate for the future application systems developer.
Identifying these skills and job categories is seen as a necessary
step in determining appropriate recruiting, educational, training and
careor-path planning for those who will be employed in the
computer-based application systems development industry. The ^
conclusions of this research have practical implications for itath,:
academics and practitioners.
t* + m

DECLARATION
I declare that this thesis Is my own, unaided work. It Is being submitted
in fulfilment of the requirements for the degree of Doctor of Philosophy
in the University of .the Witwatersrand, Johannesburg, it has not been'' , r.
submitted before for any degree or examination in this, or any other
university. ,
1 "
TREVOR DOUGLAS CROSSMAN ]j „ „ •
, H i1' ~
DAY OF 1990
PREFACE ' _n ” [ r ..
If the I.S. industry is to «ake the best use of its human resources, it
must have a clear picture of the skills needed for future.' application
systems' development. This is particularly so in South Africa, where
the shortage of appropriate skills is exacerbated by the 'brain-drain'.
The purpose of the present, study was to attempt to identify the skills
profile of the systems analyst of the future and, therefore, help
directly with what Can become a serious problem.
While /iit is recognized that the turbulence in the application'> " I!software development industry is affecting other job categories (e.g.
the programmer and, the I.S. manager)v study concentratedr-’ : ' J> ,
specifically on the systems analyst. There were two reasons for this.
Although the systems analyst is regarded as central to the future
success of application development, there is evidence that the
definition Of'the term is inadequate and unclear. It was decided,
therefore, to concentrate specifically on the changing role of the
systems analyst, and to set the following specific research objectives:
- to provide a clear definition of the systems analyst;
- to identify the skills profile of the systems analyst of the
future; <
- to compare end contrast the opinions concerning future systems
analysts' skills identified through empirical research and a
literature survey.
the exposure which the researcher has had to building systems in
the 1,5 ., iadttsttty,,' to the designing of business information systems
curricula arid lecturing in the academic environment, proved to be
' ' v ' ,' ■ ,
- valuable background experience for the study.
The initial ideas for the research were identified when preparing
the keynote address (entitled 'The Future of the Software Development
Department') for the South African Computer Users of Burroughs Equipment
(SACUBE) Conference in May 1984. As a direct result of the research,
two papers have been published. The material used in the introduction
of the thesis was published in ACM Special Interest Group Computer
Personnel Research (SIGCPR) Quarterly Publication in December 1986 in a
paper entitled 'Reasons for Turbulence in Systems Analysts' Job
Responsibilities' (Crossman, 1986)* The results of the empirical
research were presented at an IFIP/Computef Society of South Africa
International Conference on Information Systems in April 1987. The
paper appeared in the conference proceedings which was published by
North-Holland in 1988 (Crossman, 1988). In addition, a comparison of
the opinions'' of the academic and practitioner experts was presented at
the South African Computer Lecturers Association (SACLA) Conference in
June 1987 in a paper entitled 'A Comparison of Academic and Practitioner
Perceptions of the Changing Role of the Systems Analyst: An Empirical
Study', This paper was published in Quaestiones Informaticae in
December 1987 (Crossntan, 1987).
I wish to express my sincere thanks to all those who assisted me in the
process of researching the Sublet contained in this thesis. 0 In
particular, I would like to thank: „* . . '. ■ i. ■ ' c1,. 1 :/
Prof fj M Duffy for. his patience and guidance in his role as"my/
supervisor.
Prof K Yeomans, Prof P Fatti, Dr P Pirow, Dr L Human and
Dr A Simon for their advice and assistance.
- Dr J Fisher for his role as a trusted advisor, guide and friend.■ ■' \ >. , 1
Dr P Meyer for iter assistance in identifying appropriate
statistical procedures. ,
Dr P Lay and his colleagues at the University of Cape Town for
their criticisms, encouragement and suggestions.
Mrs M Burns who typed the script and Mrs C Robinson who helped■ 1 o . ■
review the material.
ACKNOWLEDGEMENTS -
PREFACE 1 «
c> ■ 1 r-
CHAPTER ONE INTRODUCTION \
1.1 THE MEANING OF 'TURBULENCE1 '
1.2 TURBULENCE IN ORGANIZATIONS
ri 1.2.1 EVIDENCE OF TURBULENCE IN ORGANIZATIONS
1.2.2 IMPACT OF TURBULENCE ON ORGANIZTIONS
1.2.3 ORGANIZATIONS' REACTION TO TURBULENCE
1.3 TURBULENCE IN THE I.S. INDUSTRY
1.3.1 EVIDENCE OF TURBULENCE IN THE I.S. INDUSTRY
1.3.2 IMPACT OF TURBULENCE ON THE I.S. INDUSTRY
° 1.3.2.1 EXTENT OF IMPACT UNCERTAIN |
1.3.2.2 IMPACT ON JOBS AND SKILLS "
1.3.3 I.S. INDUSTRY REACTION TO TURBULENCE
1.4 TURBULENCE AND THIS RESEARCH "
1.5 OBJECTIVES OF THIS RESEARCH .
1.6 THE RESEARCH APPROACH , ?
1.7 VALUE OF THE RESEARCH '
1.7.1 THE SELECTION OF PERSONNEL
1.7.2 THE DESIGN OF EDUCATION PROGRAMMES
1*7.3 IDENTIFYING APPROPRIATE EXPERIENCE
1.7.4 TOWARDS OVERCOMING SKILLS SHORTAGES ' "
1.8 CONTRIBUTION TO KNOWLEDGE
1.8.1 MEETING OBJECTIVES
1.8.2 NEW GENERIC SKILLS CLUSTERS AND JOB TITLES
1.8.3 HYPOTHESIS GENERATED
1.9 OUTLINE OF THESIS STRUCTURE ,
CONTENTS , \
CONTENTS CONTINUED , PAGE
CHAPTER TWO RESEARCH FOUNDATIONS 26
2.1 LITERATURE REVIEW - !' 0 f 26
2.1.1 DEFINITION OF KEY TERMS , 26
- , " 2.1.1.1 THE FUTURE 28
2.1.1.2 SKILL ^ 28
2.1.1.3 MODEL i] ^ 29
2.1.1.4 SYSTEM ANALYST „ 29
2.1.2 „ LITERATURE AS BACKGROUND TO RESEARCH //33
2.1.2.1 THEORETICAL BASIS FOR RESEARCH 34
2.1.2.2 THE EVOLUTION OF SYSTEMS ANALYSIS 37
2.1.2,3 ROOT CAUSES OF TURBULENCE 40/>
— , 2.1,2.3.1 CHANGE IN TECHNOLOGY
2.1<2.3.2 CHANGES IN ENVIRONMENT/
$
TECHNOLOGY RELATIONSHIP
2.1.2.3.3 CHANGES IN VALUED/NEED FOR
44
INFORMATION 46
2.1.2.3.4 CHANGES IN BUILDING METHODS
2.1.2.3.5 NEED TO ADAPT TO REMAIN
47
VIABLE 49
•’;> 2.1.3 INPUT TO THE ROLES/SKILLS MODEL 51
!!.2 PRIOR RESEARCH ' „ 51
2.2.1 DESCRIPTION OF PRIOR RESEARCH 51
2.2.1.1 SUGGESTED UNIVERSITY SYLLABI 52
2.2.1.1.1 THE ACM CURRICULUM 52
>i " 2.2.1.1.2 ThE DPMA CURRICULUM 54
2,2.1.1.3 POLLACK 56
2.2.1.1.4 AUKERMAN ei al.O - "
57
if
ix
CONTENTS CONTINUED PAGE
2.2.1.2 I.S. DEVELOPERS' SKILLS IDENTIFICATION 58
. 2.2.1.2.1 GUIMARAES ° II » 58
, 2.2.1.2.2 CHENEY AND LYONS \ 60
2.2.1.2.3 BENBASAT at al. ] 62A ■ .., '■ ■ if2.2.1.2.4 HAROLD 64
2.2.1.2*5 VITALARI 65
2.2.1.2.6 CROCKER 67
" 2.2.1.2.7 ROON 68
V 2.2.1,2.8 JENKINS 69
2.2.1.2.9 GREEN 70
2.2.1.3. ROLE OF THE SYSTEMS ANALYST IN THEFUTURE 72
2.2.1.3.1. MARTIN 73
,, 2.2.1.3.2 MEISSNER 75
2.2.1.4 RESEARCH IN THE SOUTH AFRICAN CONTEXT 76
2.2,2 SUMMARY OF LIMITATION OF PRIOR RESEARCH 76
2.2.2.1 MOST OF THE WORK DATED 77
2.2*2.2 FUTURE SKILLS SELDOM IDENTIFIED 77
2.2.2.3 SOME FINDINGS SDLC BASED 77
2.2.2.4 CLEAR DEFINITION SOMETIMES OMITTED 77
2.2.2.5 WHOLE SYSTEMS ANALYST'S JOB NOT ALWAYS ' CONSIDERED 77
2.2.2.6 FINDINGS SOMETIMES BASED ON GENERALIZATIONS 78
2.2.2.7 SOME EMPIRICAL WORK WEAK 78
2.3. SUMMARY OF THE CHAPTER 79
I, X
CHAPTER THREE CHARACTERISTICS OF THE RESEARCH
CONTENTS CONTINUED
3.1 ATTRIBUTES OP< THE CORREflT RESEARCH
3.2 THE TESEARCH METHOD " n ..
' 3,2.1> THE RESEARCH PROBLEM, " o
3.2.2 " FACTORS WHICH INFLUENCED THE RESEARCH APPROACH
i 3.2.3 THE NATURE OF THE RESEARCH
3.2.3.1 THE RESEARCH PARADIGM
3.2.3.2 RESEARCH CHARACTERISTICSr '\) 3.2.3.3 V CLASSIFICATION OF THE RESEARCH
, ft- - '3*2.3.4 DESCRIPTION OF THE RESEARCH
3.3 BOUNDARIES OF THE RESEARCH
3.4 ASSUMPTIONS MADE IN THIS STUDY
3.5 LIMITATIONS OF THE RESEARCH
3.6 USE OF A STATISTICS
3.6.1 CHARACTERISTICS AND PARAMETERS OF THE STATISTICAL TESTS ‘
3.6.2 STATISTICAL TESTS AND PROCEDURES
3.6.3 STATISTICAL PACKAGE USED
3.7 SUMMARY (JF THE CHAPTER
CONTENTS CONTINUED o PAGE
CHAPTER FOUR THE EMPIRICAL 5T0i)Y; DATA COLLECTION 103
4.1 INTRODUCTION TO DATA COLLECTION 103
4.2 COLLECTING THE DATA > 104
4.2.1 OBJECTIVE OF THE QUESTIONNAIRE 104
4.2.2 CONSTRUCTING THE QUESTIONNAIRE " , 1 0 4
, 4.2.2.1 COLLECTING EXPERT OPINION 106,
4.2.2.1.1 SAMPLE OF EXPERTS 106
4.2.2.1.2 ROUND ONE 107
J 4.2.2.1.3 ROUND TWO 109
4.2.2.2 STRUCTURE OF THE QUESTIONNAIRE 110
4.2.2.3 THE PILOT STUDY 112
4.2.2.3.1 DESCRIPTION 112
:) 4.2.2.3.2 RESULTS 112
0 4.2c3 DISTRIBUTION OF THE QUESTIONNAIRE 1’lS
4.2.3.1 ESTABLISHING POPULATION OF SYSTEMS ANALYSTS 116
4.2/3.2 ' IDENTIFYING COMPANIES EMPLOYING SYSTEMS ANALYSTS 117
4.2.3*3 IDENTIFYING DISTRIBUTION OF SYSTEMS ANALYSTS ACROSS COMPANIES 119
4.2.3.4 DETERMINING NUMBER OF QUESTIONNAIRES TO DISTRIBUTE 121
4.2.3.5 MAILING THE QUESTIONNAIRES 123
RESPONSE TO THE QUESTIONNAIRES 123
4.2.4.1 THE RESPONSE RATE 123
4.2.4.2 REPRESENTATIVENESS OF RESPONSE • 125
4*2»4»2.1 TELEPHONE CALLS 125
xii />
CONTENTS CONTINUED PAGE
4.2.4.2.2 DEMOGRAPHIC DATA " 126
:/ 4.2.4.2.3 EARLY AND LATE REPLIES 133
4.2.5 CONCLUSIONS ON COLLECTING THF DATA 134
4.3 EVALUATING THE EMPIRICAL PROCEDURES 1350 ' - \ ;■ ,■,
„ 4.3.1 EFFECTIVENESS OF THE QUESTIONNAIRE 135, ■, r. ,■ ( A .
«■ 4.3.1.1 RELIABILITY 136
4.3.1.2 VALIDITY ! 145
4.3.1.3 SUMMARY ON RELIABILITY AND VALIDITY 147
4.3.2 ATTEMPTS TO COUNTER LIMITATIONS OF USING A QUESTIONNAIRE 147
4.3.3 LIMITATIONS OF EMPIRICAL RESEARCH 150
4.4. SUMMARY OF THE CHAPTER 152
CHAPTER FIVE BUILDING THE JOB RESPONSIBIl ;TY\SKILLS MODEL 154
5.1 INTRODUCTION TO ANALYZING THE DATA 154
5.2 COMPARISONS OF RESPONDENTS' OPINIONS 155
5*24 f, OPINIONS ON FUTURE SYSTEMS ANALYSTS' JOBRESPONSIBILITIES ( 157
5.2.1.1 AREAS OF DISAGREEMENT 157
5.2.1.1,1 ALL THE DATA 158
11 5.2.1.1.2 EXPERT OPINIONS 160
5.2.1.1.3 PRACTITIONER EXPERTS AND SYSTEMS ANALYSTS 162
5.2.1.1.4 ACABEMIC EXPERTS AND ' SYSTEMS ANALYSTS 163
• 5.2.1*2 AREAS WHERE NO DISAGREEMENTS COULD BEIDENTIFIED 165 "
5.2.1.3 SUMMARY OF OPINIONS ON JOB.RESPONSIBILITIES 166
Xiii
' " • C1-
5.2.2 OPINIONS ON FUTURE SYSTEMS ANALYSTS' SKILLS 168
5.2.2.1 AREAS OF DISAGREEMENT 169
5.2.2.1.1 ALL THE DATA «• 1j9
5.2.2.1.2 EXPERT OPINION 172
5.2.2.1.3 PRACTITIONER EXPERTS AND SYSTEMS ANALYSTS i; 175
5.2.2.1.4 ACADEMIC EXPERTS AND SYSTEMS„ r ANALYSTS 177
,, 5.2.2.1.5 DATA t-ROM SYSTEMS ANALYSTS 179
5.2.2.1.5 SUMMARY OF DISAGREEMENTS 189
5.2.2.2 AREAS WHERE NO DISAGREEMENTS COULD BE IDENTIFIED j; 189
\ 5.2.2.2.1 SKILLS WHICH HAY NOT BE
CONTENTS CONTINUED PAGE
REQUIRED .■[ r „ 191
5.2.2.2.2 SKILLS WHICH MAY BE RKQUIRED 194
5.2.2.2.3 SKILLS WHICH COULD BE EXPECTEDTO BE REQUIRED , 196
,, 5.2.2.2.4 SUPPORTIVE SKILLS / 199
5.2.2.2.5 SKILLS WHICH COULD REFLECT ACHANGING ROLE 205
ti 5.2.2.2.6 SUMMARY ON SKILLS ON WHICH- NO DISAGREEMENT 21 J.
5.2.2.3 SUMMARY OF RESPONDENTS' OPINION 212
5.3. JOB RESPONSIBILITIES/SKILLS MODEL ' 212
5.3.1 FIRST ATTEMPT AT BUILDING THE MODEL 213
5 . 3 . <! SECOND ATTEMPT AT BUILDING THE MODEL . , 214
5.3.2*1 ESTABLISHING ACTIVITY GROUPS 216
. 5.3.2.1a BASEd O n DEFINITIOM 218
5.3*2.1.2 SUPPORTIVE 223
xiv
.. 5.3.2.1.3 CHANGING RESPONSIBILITIES 228
5.3.2.1.4 SUMMARY ON ACTIVITY GROUPS 234
5.3.2.2 LEVEL THREE OF THE MODEL 235
- 5.3.3 SUMMARY ON BUILDING THE MODEL - 236
5.4 SUMMARY OF THE CHAPTER O , 238
CHAPTER SIX THE?ROLES/SKILLS MODEL ! 240
6.1 ,LEVEL ONE L " 241
CONTENTS CCHTIHUED PhBE
6.1.1 SYSTEMS ANALYSTS' ASSOCIATIONS 241
6.1.2 SUMMARY OF ASSOCIATION 245
6.2 LEVEL TWO, ' 245
6.2.1 INITIAL LIST OF ROLES 247
6.2.2 ROLES LINKED TO ASSOCIATION 247
: 6.2.3 GROUPING OF THE ROLES 249
6.2.3.1 ROLES REQUIRED BY DEFINITION 251
I 6.2.3.2 , SUPPORTIVE ROLES 251
" 6.2.3.3 ROLES INDICATING CHANGE 252h
, 6.2.3.4 LINKING GROUPED ROLES TO OTHERLITERATURE ROLES 252
6.2.4 A ROLES HIERARCHY 253
6.2.4.1 ROLES REQUIRED BY DEFINITION 253
6.2.4.1.1 ANALYST ROLE 253
6.2.4.1.2 ESTIMATOR ROLE 254
^ 6.2.4.1.3 QUALITY ASSURER ROLE 255
6*2.4.2 SUPPORTIVE ROLES 255
' 6.2.4.2.1 CHANGE AGENT ROLE * 255
XV
CONTENTS CONTINUED
6.2.4.2.2 COMMUNICATOR ROLE 256
6.2.4.2.3 FACT FINDER ROLE 256
6.2.4.2.4 INSTRUCTOR ROLE , 267
6.2.4.2.S INTERPERSONAL FACILITATOR ROLE 257
6.2.4.2.6 LEARNER ROLE 258
6,2.4.2,7 NUMERATOR ROLE , 258
6.2.4.2.8 SUBORDINATE AE \.t ' 258
6.2.4.2.9 USER (OF TECHNOLOGY) ROLE 259
ROLES INDICATING CHANGE 259
6.2.4.3.1 CONSULTANT ROLE ( 259
6.2.4.3.Z DATABASE DESIGNER ROLE 2fi0
6.2.4.3.3 DEVELOPER ROLE 261
6.2 .4.3.4 GENERALIST ROLE 261
6*2.4.3.5 IMPLEMENTOR ROLE 262
6.2.4.3.6 PROJECT MANAGER ROLE 262
; 263
|! 264
264
265
266
270
271
274
276
277
6.2.4.3.7 PROTOTYPER ROLE,
6*2.4.3.8 STRATEGIC PLANNER ROLE
6*2.4.3.9 SYSTEMS DESIGNER ROLE
6.2.5 SUMMARY OH ROLES
6.3 LEVEL THREE
6*3.1 ; LINKING ROLES AND SKILLS
\j 6.3.1.1 ANALYST GROUP
jj 6.3.1*2 CHANGE AGENT GROUPi ..I 6.3*1,3 COMMUNICATOR GROUP
6.3.1.4 CONSULTANT GROUP
/U .I XVl
CONTENTS CONTINUED „ PAGE
6.3.1.5 DATABASE DESIGNER GROUP 278
6.3.1.6 DEVELOPER GROUP * f,
ESTIMATOR GROUP; J)
279
J.3.1.7 280
6.3.1.3 FACT FINDER GROUP 281
6.3.1.9i|
GENERALIST GROUP 281
6.3.1.10 IMPLEMENTOR GROUP 282
6.3.1.11 INSTRUCTOR GROUP 283
6.3.1.12 INTERPERSONAL FACILITATOR GROUP . 284
6.3.1.13 LEARNER GROUP 285
6.3.1.14 NUMERATOR GROUP 285
6,3.1.15 PROJECT MANAGER GROUP 286
6.3.1.16 PROTOTYPER GROUP 288
6.3.1.17 QUALITY ASSURER GROUP < 288
6.3,1.18 STRATEGIC PLANNER GROUP ; 289
6*3.1.19 SUBORDINATE GROUP : - 290
6.3.1.20 SYSTEMS DESIGNER GROUP 290
6.3.1.21 TASK PERFORMER GROUP 293
6.3*1.22 USER (OF TECHNOLOGY) GROUP 294
6.3.2 SYNTHESIS OF IDENTIFIED SKILLS 294
6.4 LIMITATIONS OF THE MODEL * 302
6.5 SUMMARY OF THE CHAPTER > 305
CHAPTER SEVEN THE RESEARCH FINDINGS
7*1 INTRODUCTION TO THE CHAPTER
7.2 FORMAT FOR PRESENTING THE FINDINGS
7.2.1 BUILDING THE NEW SKILLS CLUSTERS
xv ii
307
307
307
311
COHTEHTS CONTINUED -
7.2.2 GENERIC CLUSTERS USED IN THIS STUDY
7*3 PRESENTING THE FINDINGS OF THIS STUDY
7*3.1 COMPARISON OF TWO CONCEPTUAL MODELS
ci 7.3.1.1 BUSINESS ACUMEN CLUSTER____
7.3.1.2 CHANGE AGENT CLUSTER
7.3.1.3 COMPUTATIONAL CLUSTER
7.3.1.4 EVALUATIVE CLUSTER
" " • 7.3.1.5 HUMAN ISSUES CLUSTER
(1 7.3.1.6 INVESTIGATIVE CLUSTER
7.3.1.7 PERFORMANCE CLUSTER
n 7.3.1.8 PROJECT MANAGER CLUSTER
7*3*1.3 SAVANT CLUSTER "
7.3.1.10 SYSTEMS ACQUISITION CLUSTER
7,3*1.11 SUMMARY OF COMPARISON V ), ' j" ()'
7.3.2 SKILLS REQUIRED BY THE ‘SYSTEMS ANALYST Of THE FUTURE
7.3,2,1 BUSINESS ACUMEN CLUSTER
" 7.3.2.2 CHANGE AGENT CLUSTER
.. 7.3.2.3 COMPUTATIONAL CLUSTER
7.3.2.4 EVALUATIVE CLUSTER |' ■{(
7.3*2.5 HUMAN ISSUES CLUST«," , ■' //
7.3.2.6 IMVESTTGATlfE iiUJyTER
7.3.2*7 PERFORMANCE CLUSTER
•- 7*3.2.8 PROJECT MANAGER CLUSTER
1*3*2*9 SAVANT CLUSTER
7.3.2.10 SYSTEMS ACQUISITION CLUSTER
\ 7.3.2.U SUMMARY OF [#ITML FINDINGS
}
7A COMMENT ON INITIAL FINDINGS 347
7.4.1 EXTENT TO WHICH FINDINGS CAN BE GENEfW'.IZED ° 347
7.4.2 TITLE 'SYSTEMS ANALYST' INAPPROPRIATE 348
7.4.3 SKILLS PROFILE FOR A ROLE, NOT AN INDIVIDUAL 348
7.4.4 THE NEED FOR FURTHER ANALYSIS OF THE FINDINGS 349
7.5 ANALYZING THE FINDINGS FURTHER 350
7.5.1 THE ANALYTICAL PROCESS , 0 351
7.5.1.1 THOROUGH DIAGNOSIS 352
7.5.1.2 FORMING NATURAL WORK UNITS 352
7.5.1.3- COMBINING TASKS 355
7.5.1.4 VERTICAL LOADING 0 357
7.5.2 THE RESULTS OF THE ANALYSTS 357
7.5.2.1 NEW JOB CATEGORIES 357
< 7.5.2.2 ESSENTIAL SKILLS 358
7.6 FACTORS INFLUENCING SKILLS MIX 359
7.7 SUMMARY OF THE CHAPTER 360\"\ 0
CHAPTER EIGHT CONCLUSION 363
8.1 SUMMARY OF THE RESEARCH ' 364
8.1.1 RESEARCH CHARACTERISTIC , 364
8.1.2 SUMMARY OF RESEARCH OBJECTIVES 364
8.US?" SUMMARY OF RESEARCH FINDINGS 36§
8.2 EVALUATION OF THE RESEARCH , ' 370
8.2.1 CONTRIBUTION TO KNOWLEDGE " 370
8.2.1.1 TURBULENT ENVIRONMENT 371
CONTENTS CONTINUED PASE
Xi X
8.2.1.2 MEFTING OBJECTIVES 372
J ' 8.2.1.3 m UE BEYOND MEETINS OBJECTIVES 375
- 8.2.2 LIMITATIONS OF THE RESEARCH 375
8.2,3 SUMMARY OF VALUE OF RESEARCH 378
8.3 HYPOTHESIS SEKERATED BY THIS RESEARCH 380
8.3.1 HYPOTHESIS ON APTITUDE TESTING 380
8.3.2 HYPOTHESIS ON PERSONALITY PROFILE OF SYSTEMSANALYST , 381
8.3.3 HYPOTHESIS ON SMALL I.S. DEPARTMENTS 381
8.3.4 HYPOTHESIS ON THE FUTURE OF PROGRAMMERS 332
8.3.5 HYPOTHESIS ON JOB TITLES ° 382
/ 8.3.6 HYPOTHESIS CN IMPROVED JOB SATISFACTION 383
8.3J HYPOTHESIS ON EMERGING I.S. DISCIPLINE 384
8.4 FURTHER RESEARCH r" 384
; 8.4.1 REPEAT THE SURVEY 385
8.4.2 IDENTIFY WHAT MAKES A GOOD SYSTEMS ANALYST 385
8.4.3 ESTABLISH APPROPRIATE SKILLS MIX 386
8.4.4 IMPACT OF CULTURE ON PERFORMANCE IN THE I.S.INDUSTRY " 386
REFERENCES j 388, ;/- ’ V . ■ ')
CONTENTS CONTINUED PAGE
&
XX
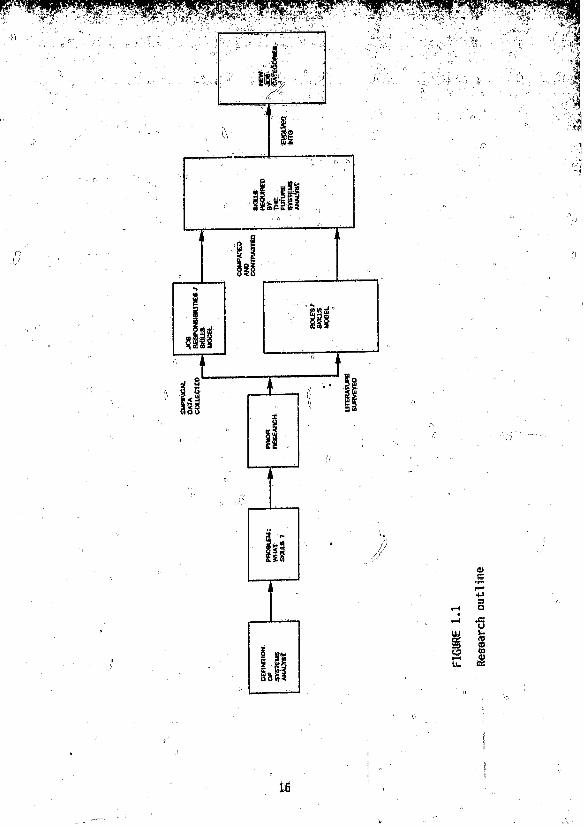
1.1 RESEARCH OUTLINE j; ’ 16♦ , , i i
2.1 THEORETICAL BASIS OF THE RESEARCH 3S
2.2 ROOTS OF TURBULENCE IN THE I.S. ENVIRONMENT 41
2.3 INTEGRATED SOFTWARE ARCHITECTURE 43
2.4 COMPUTER ENVIRONMENT SPECTRUM' 44
2.5 SOURCES OF PRODUCTIVITY 46
2.6 TYPES OF SYSTEMS APPLICATIONS ' 48
4.1 THIS STAGE OF THE RESEARCH IN CONTEXT 103
4.2 STEPS FOLLOWED TO CONDUCT THE EMPIRICAL SURVEY 105
4.3 COMPARISON OF SURVEYS: I.S. PERSONNEL ACROSS 1*5DEPARTMENT SIZES . r 120
4.4 COMPARISON OP SURVEYS: I.S. PERSONNEL ACROSS-REGIONS 127
4.5 COMPARISON OF SURVEYS: MALE AND FEMALE RESPONDENTS 1 128
4.6 COMPARISON OF SURVEYS: HIGHEST ACADEMIC QUALIFICATION 129
4.7 COMPARISON OF SURVEYS: RESPONDENTS* YEARS IN THE „ * COMPUTER INDUSTRY * 130
4.8 COMPARISON OF SURVEYS: SIZE OF INSTALLATIONS 131
4.9 RESPONDENTS' TRENDS TOWARDS PREPAREDNESS 1 ' 139
5.1 0THIS STAGE OF THE RESEARCH IN CONTEXT 154
5.2 STATISTICAL COMPARISON OF EMPIRICAL DATA 156
5.3 FREQUENCY COUNTS} TYPES OP INDUSTRY, STRUCTURED ANALYSIS 182
5.4 FREQUENCY COUNTS: TYPES OF INDUSTRY, EVALUATING PACKAGES li83
5.5 FREQUENCY COUNTS: TYPES OF INDUSTRY, IMPLEMENTING PACKAGES 184
■’ ' ■ ,
ft . , - ■„ mi
FIGURES ■ „ PAGE
FIGURES CONTINUED, , ■ r, - .. J" • .' 1 1
" " " § . .5.6 FREQUENCY COUNTS; AGE IN YEARSt BUILDING COMPETITIVE
POSITIONS
5.7 FREQUENCY COUNTS: AGE IN YEARS, EVALUATING PACKAGES
5.8 FREQUENCY COUNTS: REGION, CHANGE AGENT , „
5.9 FREQUENCY COUNTS: SIZE INSTALLATION, BUSINESS PRACTICES
5.10 CATEGORIES OF SKILLS
5.11 FREQUENCY COUNTS: GROUPS,
5.12 FREQUENCY COUNTS: GROUPS,
5.13 FREQUENCY COUNTS: GROUPS, CONFIGURATIONS
5.14 FREQUENCY COUNTS: GROUPS,
5.15 FREQUENCY COUNTS: GROUPS,
5,16 FREQUENCY COUNTS: GROUPS,
5.17 FREQUENCY COUNTS: GROUPS,
5.18 FREQUENCY COUNTS: GROUPS,
5.19 FREQUENCY COUNTS: GROUPS, AUDITED r
5.20 FREQUENCY COUNTS: GROUPS,
5.21 FREQUENCY COUNTS: GROUPS,
CMCMUTJ FREQUENCY COUNTS; GROUPS,
5.23 FREQUENCY COUNTS: GROUPS,
5.24 FREQUENCY COUNTS: GROUPS,
5.25
5.26
FREQUENCY COUNTS:
FREQUENCY COUNTS:
GROUPS,
GROUPS,
5.27 FREQUENCY COUNTS: GROUPS,
5.28 FREQUENCY COUNTS: GROUPS,
5,2'9 FREQUENCY COUNTS: GROUPS,
O '• '
FORTRAN
ADA
DESIGNING INSTALLATION
DESIGNING, COMPUTER NETWORKS
DETERMINING T.P. REQUIREMENTS
EVALUATING EXISTING PROCEDURES
DETERMINING SYSTEM SECURITY
DETERMINING SYSTEM CONTROLS
BUILDING SYSTEMS WHICH CAN BE ,
FACT FINDING
PROBLEM SOLVING |! '
THINKING LOGICALLY
IDENTIFYING USERS NEEDS
INTERVIEWING'
VERBAL COMMUNICATING
REPORT WRITING „
PRESENTATION PREPARING
0 AND M SKILLS
DEVELOPMENT METHOD
"a V - ' ' ■■ !i . -5.30 FREQUENCY COUNTS: GROUPS, 4GL's 207
5.31 FREQUENCY COUNTS: GROUPS, AUTOMATED DEVELOPMENT 207
5.32 FRiQUENCY COUNTSJ GROUPS, PROGRESS MONITORING , 208
5.33 FREQUENCY COUNTS: GROUPS* ESTIMATING COSTS 209
5.34 FREQUENCY COUNTS: GROUPS, MOTIVATING PEOPLE 209
5.35 FREQUENCY COUNTS: GROUPS, STRATEGIC PLANNING 210
5.36 FREQUENCY COUNTS: GROUPS, LOGICAL DATA MODELS 211
5.37 BUILDING THE JOB RESPONSIBILITIES/SKILLS MODEL ‘ \ "» 215
• ' ... ' ^ - ' ■6.1 THIS STAGE OF THE RESEARCH IN CONTEXT , 240
6.2 THE ROLES/SKILLS MODEL ,' ' - 242
7,1 THIS STAGE OF THE RESEARCH IN CONTEXT 3G9
7.| STEPS TAKEN TO IDENTIFY NEW GENERIC SKILLS CLUSTERS 310
7.3 PROCEDURE FOR COMPARING THE FINDINGS OF THE TWO MODELS 327
7.4 THIS STAGE OF THE RESEARCH IN CONTEXT 351
7.5 THE FINAL CONCEPTUAL MODEL 362
FIGURES CONTXHtlfeD \ RAGE
’0.
jodii
TABLES ^ " 3- PAGE
2.10
SYSTEMS ANALYSTS1 ACTIVITIES 31
2.2 SUMMARY OF WEAKNESSES OF PRIOR RESEARCH, ' v "
• 78
«4>1 ‘
n . " .
DETAILS OF EXPERT PARTICIPATION 108
-■ 4.2 FUTURE SYSTEMS ANALYST SKILLS '. 113 a
4.3 DIMENSIONS DROPPED AFTER THE PILOT STUDY 114 '
4.4 NUMBER OF ANALYSTS IN SOUTH AFRICAN^COMPUTER INDUSTRY 117
4.5
■ . n - t 'SAMPLE POPULATION OF COMPANIES AND NUMBER OF QUESTIONNAIRES MAILED t> " o o 122
4.6 DETAILS OF RESPONSES RECEIVED 1 124
4.7 SOME PUBLISHED RESPONSE RATES 124
4.8- COMPARISON OF EARI.Y AND LA'IE RESPONDENTS 134
4.9 CORRELATIONS BETWEEN SKILLS AND JOB RESPONSIBILITIES 141
4.iO CORRELATIONS BETWEEN JOB RESPONSIBILITIES AND SKILLS 142
4.11 CORRELATIONS BETWEEN GROUPS OF SKILLS 143
4,12 ABSENCE OF CORRELATIONS BETWEEN SKILLS AND JOB RESPONSIBILITIES 144
5.1 JOB RESPONSIBILITIES: DISAGREEMENT (n = 101)
5.2 JOB RESPONSIBILITIES! BROAD RANGE OF OPINION (n * 32)
5.3 JOB RESPONSIBILITIES! DISAGREEMENT (n = 182)
5.4 JOB RESPONSIBILITIES: DISAGREEMENT (n = 168)
5.5 JOB RESPONSIBILITIES: NO DISAGREEMENT (n = 191)
5.6 SKILLS; DISAGREEMENT (n » 191) ,Vi
5.7 SKILLS: BROAD RANGE OF OPINION (M = 32)
5.8 SKILLS: DISAGREEMENT (n * 32) °
5.9 SKILLS: DISAGREEMENT (n * 182)
xxiv
159
161
163
164,T
167 -
170
173
174 „
176
TABLES CONTINUED °
5.10 SKILLS: DISAGREEMENT (n - 168)
5.11 SKILLS:- DISAGREEMENT (n = 159) , _
^ 5.12 SKILLS: NO DISAGREEMENT (n = 191)
„ 5.13 ACTIVITIES: 'COST-ANALYZING SYSTEMS' AS A BASE
5.14 ACTIVITIES: 'USING FORMAL ANALYSIS PROCEDURES' AS A 2ASE
5.15 ACTIVITIES: ’COWDUCTING FEASIBILITY STUDIES' AS A BASE
5.16 ACTIVITIES: 'TRAINING USERS' AS A BASE .
5.17 ACTIVITIES: 'IDENTIFYING USERS' NEEDS' AS A BASE
5.18 ACTIVITIES: 'INCREASING BUSINESS SKILLS' AS A BASE
5.19 ACTIVITIES: 'IMPLEMENTING OFFICE PROCEDURES' AS A BASE
5.20 ACTIVITIES: 'VERBAL COMMUNICATING' AS A BASE-
5.21 ACTIVITIES: 'DECISION MAKING' AS A BASE
5.22 ACTIVITIES: 'INFORMATION GATHERING' AS A BASE
5.23 ACTIVITIES: 'WORKING IN AND THROUGH A PROJECT TEAM'AS A BASE ,
5.24 ACTIVITIES: 'PROBLEM SOLVING' AS A BASE
5.25 ACTIVITIES: 'TEACHING' AS A BASE
5.26 ACTIVITIES: 'SELECTING,PACKAGES' AS A BASE “
5.27 ACTIVITIES: 'BUILDING SYSTEMS WHICH CAN"BE AUDITED'AS A BASE _
5.28 ACTIVITIES: 'DETERMINING CORPORATE DATA REQUIREMENTS'AS A BASE
5.29 ACTIVITIES: 'DESIGNING SYSTEMS' AS A BASE
5.30 ACTIVITIES: 'MONITORING SYSTEMS DEVELOPMENT' AS A BASE
5.31 ACTIVITIES: 'MANAGING/MOTIVATING PEOPLE' AS A BASE
5.32 LEVEL TWO OF JOB RESPONSIBILITIES/SKILLS MODEL
5.33 LEVEL THREE OF JOB RESPONSIBILITIES/SKILLS MODEL
TABLES CONTINUED'
6.1 LEVEL ONE OF THE ROLES/SKILLS MODEL '
6.2 ROLES/f-:mmmir link i!
6(3 LEVEL TWO OF THE ROLES/SKILLS MODEL
6.4 LEVS. THREE OF THE ROLES/SKILLS MODEL
6.5 OPPOSING IDEAS ON CERTAIN SKILLSi' r- . ■ 0
7.1 OCCUPATIONAL CATEGORIES SIGNIFICANT TO THE SYSTEMS ANALYST
7.2 OCCUPATIONAL CATEGORIES LINKED TO DEFINITIONS OF „ ANALYSTS .
7.3~ CLASSIFICATION OF SKILLS BY FACTOR ANALYSIS
7.4 ESSENTIAL SKILLS "
7.5 SKILLS IN DIFFERENT STRATEGIC RELEVANCE ENVIRONMENTS \

APPENDICES■ ' ...1 ; " /; 'V,
APPENDIX .'A' U TTPR AND QUESTIONS TO EXPERTS
' *B' |U FINITIONS TO EXPERTS AND PRACTISING SYSTEMS
'O' FRfQilNCY COiNTS 0F REPLIES PROM EXPgRTS
'D* LETTER TO PILOT STUDY PARTICIPANTS
'£' LETTER TO SENIOR PERSONNEL OF I.S. DEPARTMENTS'
»F* LETTER'1 TO SYSTEM! ANALYSTS - '
'S' UNCOMPLETED Q«ESTl(Aifi£
'H' FREQUENCY COUNTS OF REPLIES TO JOB RESPONSIBILITY QUESTION (SECTION 4 OF THE QUESTIONNAIRE)
0 'I' FREQUENCY COUNTS OF REPLIES TO SKILLS QUESTION(SECTION 5 OF THE QUESTIONNAIRE) '
*J’ KEY TO APPENDICES 'K‘ AND 'L*
'K' DESCRIPTIVE STATISTICS OF SECTIONS 4 AND 5 0F^ THE QUESTIC.'iNAIRE
■L* INTER-ITEM CORRELATIONS OF SECTIONS 2, 3, 4, AND ..... 5 OF THE QUESTIONNAIRE „
403
410
413
423
425
426
427
447
450
454
463
466
PAGE
xxvii
.7
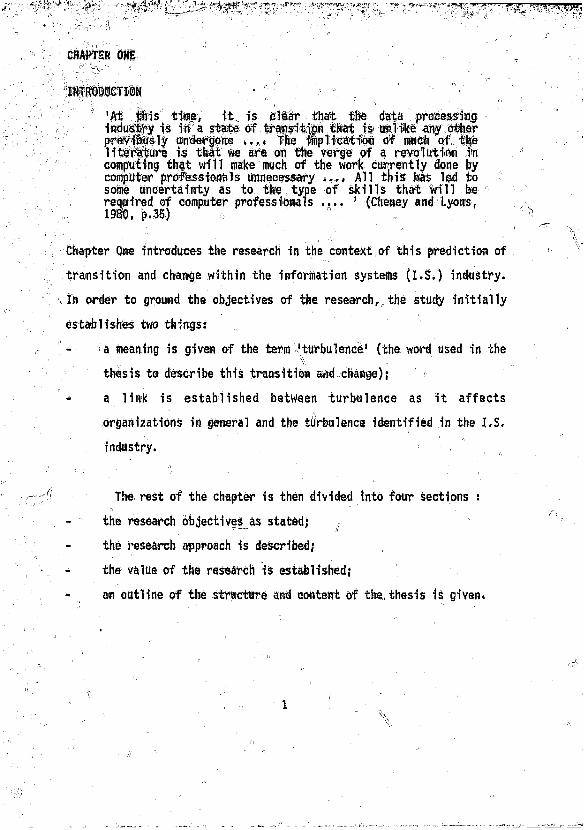
INTRODUCTION • " r
'At* this time, it, is clear that the data processing industry is in a state of transition that is unlike any other previously undergone »... The implication of much of the literature is that we are on the verge of a revolution tn computing that will make much of the work currently done by computer professionals unnecessary *»». All this has led to some uncertainty as to the type of skills that Will be required of computer professionals .... * (Cheney and Lyons,1980, p.35) r ,
Chapter One introduces the research in the context of this prediction of
transition and change within the information systems (I.S.) industry.
In order to ground the objectives of the research, the study initially
establishes two things:
- >a meaning is given of the ter'm 'ttlrbulenee' (the word used in the1 \ 1
thesis to describe this transition add change),*
- a link is established between turbulence as it affects
organizations in general and the turbulence identified In the I.S.
industry.
The rest of the chapter is then divided into four sections :
- the research objectives as stated; (/
- the research approach is described;
- the value of the research is established;
- an outline of the structure and content of the, thesis is given.
CHAPTER ONE
‘-■b
1
1.1 MEANING OF THE TERM- 'TURBULENCE'
Rather than attempt to provide an unambiguous definition of the term• \. ' . ■ • • .■» > ■ 1 ' ft ' , , ' ' ' ' ' '
'turbulence', it is suggpsted that the meaning of the word be dprived
from two sources. Firstly, following a study on the effects of
organizational decline and turbulence, the word 'fluctuation' is
presented as a synonym for * fcuirrbfci 1 eti'ce! (C&neron, Kim and Whetten,
1987, p. 223). t \
The second source is found later in the same article where
the authors state that in a turbulent environment :
'»».* changijs come from anywhere without fiotiee, and produce consequences unanticipated by those initiating the changes and those experiencing their consequences (Cameron atal., 1987, p.225).
These sources provide a lead which suggests that one of the
ways of giving meaning to the term 'turbulence* is to identify the
degree of movement in an organization which is in a fluctuating state.
There is another quotation which supports this views
'Business organizations are facing a change more extensive, more far-reaching in its implications, ana more fundamental in Its transforming quality than anything since th<s:i Modern1 industrial system took shape .... These chawes tioae ffoir> several sources: the .labor force, patterns 'of world trade, technology, and political sensibilities .... fcte rMflges at*e profound .... and they are occurring together organizations will heed to learn to operate in a wholly Hew mode.' (Kanter, 1983, pp.37 and 38).
[j Turbulence exists, therefore when changes, faced by an organization
are nontrivial, rapid, discontinuous and difficult to predict. It is
with these connotations that the word is used in this study.
2
1.2 TURBULENCE IN ORGANIZATIONS
Immodest claims about the influence of organisational turbulence were
made in the previous section. In this section these ideas are expanded
to Include typical inJteatbrs of wrbtiTenee in orgfnteatiows, the impact
of this organizational turbulence, and some of the ways organizations
can reactto cope with the turbulence.
1.2.1 EVIDENCE OF TURBULENCE IN ORGANIZATIONS
It is claimed that there are a number of groups of indicators which can
be identified when an organization is in a state of turbulence. One of
" v . I ,these groups centres on the characteristics of management activity
within the organization (e.g. management groping for solutions (Dalton
et al., 1970, p.222); the defence of previous positions (Kottor et al.,
1979, p.380); the defence of status and areas of control (Feldberg,
1975, p.135)f no long-term planning (Cameron at al., 1987, p.227)). A
second group of indicators is associated with organizational problems
and include issues such as role overload, ambiguity and conflict of
responsibilities (Mitchell and Larson, 1987, p.198); politics and power
struggles (Kotter et al., 1979, p.280), and repeated restructuring
(Feldberg, 1975, p.134). There is a third group of indicators suggested
in the literature. This group directly concerns tile company's
employees. In a turbulent environment It can be expected that staff
morale will be low (Dalton et al., 1970, p.217), there will be an
atmosphere of misunderstanding and distrust, with widely differing
assessjnents of the situation (.feottftr el al.» 1979, p.3'80), and people
. will feel inisegiiipe, iPppfol fltyf t»#iT1i«g % etewge (Feldberg, 1975,
- pp.l3V 136). . " ( .
. ' l!" . j' - - l! r\ - , » a
- j! ii1.2.2 IMPACT OF TURBULENCE OH ORGANIZATIONS
- ITurbulence 1s,a major challenge facing niadern organizations (Cameron et
al., 1987, p.225) and its impact is notable. |
'When so great a wave of change crashes into society, traditional raanagment, values,// cultures, orgam'zaftonalprocedures and organizationalf forms become obsolete'. (Sankar, 1988, p. 10). jl
" " ' I f 'Because a number of aspects of the organization that once
fitted the situation and worked well, are no longer appropriate (Kotter,? ; ’ ■ (.
et al., 1979 p.379), many organizations are being challenged to change11 f
in order to survive (Sprague and McNurlln, 1986, p.475).
The change and uncertainty forced on organizations by this
turbulence causes stress among its employees. (Mitchell and Larson,
1987, p.196). , I
1.2.3 ORGANIZATIONAL REACTION TO TURBULENCE
It can be argued that all organisms and systems continually strive to
maintain a state of equilibrium by attempting to counter forces which
cause turbulence (Feldberg, 1975, p.137). Possibly this is why it is
found that managers - rather than workers - are likely to. react to the
condition of organizational turbulence (Cameron et al., 1987, p.234).
Typical management reaction to turbulence includes changing
'®r#M'i^iitoiii1r-l5# i # ® r e 5 tipr'aiie tftd MfcNurTin, 1986, p.47'5), ani
realigning power* sit-atus arid resources .within the organization (Liker e,t
19S-7, p.30). This is why it is often stated that those
organizations which are not able to adapt, face a bleak future (e.g. the
theme of Kanter, 1983). .
- ;i ' ' ■;! ’
1.3 TURBULENCE IN THE I.S. INDUSTRY -
In spite of the recognized a d v a n c e s in the I*S. industry (Davis and
Olson, 1984, p.4), it is possible to identify evidence of turbulence
within this sector. In this section evidence is provided to support the
contention that the I.S. environment is in a considerable state of flux
(Benjamin, 1982, p.11). Direct parallels are drawn between turbulence
in organizations in general, and the fluctuations within the I,S.
discipline. , \
1.3.1 EVIDENCE OF TURBULENCE IN THE I.S. INDUSTRY ,
Not only is there the suggestion that turbulence in the I.S. industry ■ r\' -
can be expected (Straub and Wetherbe, 1989, p.1328), but there is
' evidence within the discipline of some issues typically associated with
organizational turbulence.
' . ' ' *' ' ” / r ; ‘ * * ' \ . I
ROLE (TONFLICT o . ^ y ' * ' |
In a ip/evioyis ,section (section 1.2..X) it w|s established that r o % c |
Goafljct is fiauifd in situation!? of organisational turbulence. T-he |1 . . /I ■■ ' ! tfj
foTldwiftg claiinte have b@en iaie cwcwrfog uncertainty and conflict in |
the rules i n ^ t y X s . industry which help to substantiate the cTaira that
there is turbulence in the industry: °
- the type of skills required in the industry are questioned (Cheney n
and Lyons, 1980, p.35; ADixon end John, 1989* p.2fe))
- the need for new skills not previously deinawjed is identified
(Rockart and Short, 198S, p.iS,* Friedman and Cornford, 1989,n ' - \\ "p. 5 ),* „
- it is claimed that new skills and new titles are needed within the
industry (Lauer and Stettler, 1987, p.8); r
conflicting ideas about staff loyalty have been identified
(Ginzberg and Baroudi, 1988, p.587);
- conflicting ideas for career planning1 Within I.S. are suggested
(Ginzberg and Baroudi, 1988, p.587)?
- it is recognized that it is not easy to ascertain new skill
requirements for the industry (Adler, 1986, p.9).
MULTIPLICITY OF SYSTEM BUILDING APPROACHES AND METHODOLOGIES
In a situation of organizational turbulence it is common to find a
groping for solutions to the problems being faced. There is evidence
that there is considerable groping to find the most appropriate method•° Jf ‘ ij ‘ •
to build computer-based systems. Again this helps to support the- _ ^ {___ Jj ' - , \
suggestion tfiat the industry is in a state of turmoil. For example :
( - ■'!6
« a rethifnk about traditional *jppmxil&& to systems deyeTopje’pt is
suggested (Aukerrnan et al,, 1;989, p..3_0),; ,,, , ,,
- une.Tear opinions have been found about what tools and techniques
to include in systems analyst education and training (Aukerrnan et
al., 1989, p.30); ’
- a confusing array of approaches to systems developient have been
identified (Wobd-Harper «nd Fitzgerald, 1982, p.12 (31
separate methodologies have been identified (Teichroew, 1987))?
- an array of approaches are suggested just to determine system
requirements (Shemer, 1987, p.607);
- it is claimed that multidisciplinary „ and
multidimensional approaches to systems development are needed
(Verrijn-Stuart, 1987, p.103);
- the situation is such that which building method to use is a
significant issue facing I.S. managers (Canning, 1984b, p.3).
MANAGEMENT UNCERTAINTY
Management uncertainty (a further suggestion of a turbulent situation)
is also identified in the following areas:
- I.S. chief executives are found to be managing more than a single
I.S. function (Dixon and John, 1989, p.251);
- a rethink of current managerial approaches is su'rjested (Adler,
198B, p.20); ’ '
- no clear answer was found on who should be the senior I.S.
executive (Dixon and John, 1989, p.253).
NEW PARADIGM c'
Because of the changes being faced 'by the I.5. industry, it is syggpsted
that those training as system developers redress an over-emphasls on
technical issues by having part of their studied based on toaTly new
disciplines. It is suggested that there is a mapping between the
behavioural sciences' paradigm and the software engineering activity
(Beynon-Davies. 1990, p.21).
... ' n '' •
DIFFERING ASSESSMENT OF THE SITUATION
The diverse points of view about the current situation in the
application development industry can be illustrated by the following
disagreements (all of which suggest a state of turmoil in the industry):
- there is no consensus on the definiton of 1 systems analyst1
(Sherner, 1987, p.509 - a fact confirmed by this study (see
sections 1.5 and 2.1.1.4));. // H I t
- it is claimed that the often conflicting literature within the" S - ^
discipline has produced very little insight which provides
direction to practitioners (Rockart and Short, 1989, p.7);
- one study on the future of computer systems development suggested
that in the future the industry could face one of a number of
scenarios - none of which is expected to dominate in all
installations (Friedman and Cornford, 1989, pp.330 - 333).
8
' -U'nless the turbulence fs tinderstootf ufcfVjantfgtfd, the'.V-. ■■+ y ■ ' ' )) V ' '
application of tee^oolpof in the busjnetss em iron0n^ cou-lH .be. yjjaJcened
or riiay even be misplace#* . ' , r
(NOTEt Uadefstdndmg the reasons for^ this turbulence is
regarded as one,of the steps towards being able to
manage within the turbulence. An attempt is wade in
section 2.1.2.3 to identify why the application
development industry is in a state of turmoil.)
1.3.2 impact of the turbulence in the i.s. industry ,
The nature of the change which lies at the root of the turbulence in the
I.S. industry is such that opinions on its predicted continuing impact
on I.S. departments also,cover multiple points of view. Two groupings'
of opinions are identified in this section.
1.3.2.1 THE EXTENT OF THE IMPACT UNCERTAIN
Some writers (e.g. Benjamin, 1982, p.11; Cheney and Lyons, 1980,
p.35) have predicted that the turbulence within the I.S. industry is
likely to be a characteristic of its future. Should this be so, the
reason for uncertainty regarding the full impact of the changing
technology on I.S. departments (found, for example, in Ostle, 1985,
p.534), cart be Understood.
9
1.3.2.2 IMPACT ON JOBS AND SKILLS '
Qther Writers hfcve more definite gin'ions,. - James Marlvin ts qn,e.
claimed that the changes influencing I.S. departments are sueh that
excessive familiarsty with COBOl and conventional program 'development,
methods will be a disadvantage in the future, He made the point that:
'A different Way of thinking is needed.’ (Martin* 1382, p,3$3.)
1.3.3 I.S. INDUSTRY'S REACTION TO TURBULENCE
In an effort to minimise the impact of the turbulence aihd maintain (or
re-introduce) some ftsrm of equilibrium and stability in their work
environment, I,S. departments are being forced to t
- restructure their work-force (Martin, 1982, p.16; Foster and
Flynn, 1984, p*229);
- introduce new job categories (Barr and Kochen, 1986, p.28;
Whiteside, 1985, p.72; Canning, 1985a, p.7); '
- introduce a new range of job skills for systems developers (Bush
and Schkade, 1986, p.24} Barr and Kochen, 1986, |).174;
Canning, 1984b, p.4; Davis D L, 1983, p.16).
This research has been conducted against a back-drop of these changes.
1.4 TURBULENCE AND THIS RESEARCH T
While the turmoil in the I.S. industry is likely to force changes in a
wide range of job categories, this research concentrated on this impact
of the turbulence on the job of the systems analyst. There are four
reasons for this:
10
(i')1 The ’s>#s%|$ analys't is r>egapdetf%y some as’ a key ”fi'gl|re in the
future of applications sy&ems d^velamentv^ilegist,;.Da.g,li ajid
Shenkin, 1983; Thierauf, 1-986, p.4; Jackson, 1986, p.248r; Cushing
and Romney, 1987, p.438); ‘
''9 '' ■ '■ " n ■' " ’(■‘■’-V Predictions suggest that the demand for systems analysts in this
pivotal role will grow in the future, possibly even exponentially
1 (Thierauf, 1986, p.4; NPI, 1983, p,213, Gilchrist et al., 1983,
p.100; Ostle, 1985, p.533);
(iii) There is evidence of concern about the failure of systems analysis
to be consistently effectives ^
'Despite the present widespread use of systems analysts .... and the forecasts that indicate even greater demands will exist in the future, a substantial concern is growing about systems analysts' abilities and their ultimate performance' (Vitalari and Dickson, 1983, p.948). \
This concern is exacerbated by the suggestion that, in the
future, there could be a total change in the systems analyst's job
(Martin, 1982, p.332).
(iv) It is no longer clear what the term 'systems analyst' means. The
actual activities of the systems analyst (see section 2.1.1.4)
tend to vary to the extent that it is difficult to provide a
precise definition of the term (Pope, 1979, p.21; ©rindlay,
1981, p.15; Meissner, 1986, p.6). Two examples illustrate thiss
' (a) Capron defined a systems analyst as 'a person who
understands computer technology and the systems life cycle* '1 . ' . '
and who develops new systems' (Capron, 1986, p.510).
11
■■ " . “ 4 “’’S' • ' ■ ' ? ... < . ■ - ■ >' .. k{#) Gare , and 'StU'b'be define# ’the systems, analyst as 'an
' ‘ ir\4^vidujjfhp performs s,yl|e,ms .analysis durtrig,any, or a ll*
of the life cycle phases o,f a business information system.
A life-cyeTe manager1. (Gore and Stubbe, 1983, p.535).r- .. ... o
In fact, the term has evolved beyond its original meaning
(Chen, 1985, p.38), so a liieral definition of systems analysis is
probably inappropriate* tQ situation Is confused farther by tfMf\! \S- 1 ' ■
use of other job titlesx (e.g* systems designer, analyst,\ 1 •
analyst-programmer) for some ef the systems analyst's activities
(Newman and Rosenberg, 1985, p.394)* Perhaps Croisdale was right
when he wrote, more than a decade ago, that the job title tends to
be so loosely used that It has come to mean all things to all
people (Croisdale, 1975, p.35).
As a result of all this, it is not clear who should be
recruited as systems analysts, nor is there certainty concerning
the appropriate background, education, training or experience to
ensure people can become effective in this position. Unless
these issues are resolved, however, the spectacular advances in ' !(
technology may riot be harnessed by the business sector. Those
organizations which can predict these requirements, will be placed
at a potentially competitive advantage.
1.5 OBJECTIVES OF THIS RESEARCH
This research was undertaken to provide practitioners and academics with
some guidance in this turbulent cotnputer-based application development
©nyirowewt. In general terms, this research was an attempt to identify
the.' s'ski 1 l's' requtiired fibr <the changing role of 't'he system's' analyst.
ComR'arisorts yfgre,ma£l§. between the opinion? of groups y/ho participate'd in<&n»* I K( ^ ' W **|\ * ~
the empirical research (and between the opinions representing the South
African computer Industry as a whole and the opinions documented in the .
literature). This was done to help identify where and why consensus
was not possible on instructing a skills profile of the future systems
analyst. 7 I!
Specifically this research had the following objectives:
(i) To provide a clear definition of SYSTEMS ANALYST. !'1 '! '(ii) To identify the skills profile for the systems analyst of the
■ i|
FUTURE. ?
(iii) To compare and contrast opinions concerning the skills required by■ "n !: ' 'the systems analyst of the future held by groups of participants
~ in the empirical survey. l|
(iv) To compare and contrast opinions concerning the skills required by
the systems analyst of the future identified in the literature
with those held by the participants in the empirical survey.
l.£ THE RESEARCH APPROACH
To meet the stated objectives of the research the following six steps
were taken: \
(i) A clear definition of SYSTEMS ANALYST was given (see section
2.1.1.4).
(ii) The factors which appear to be the roots of the turbulence in the
application development environment were identified (see section
2.1.2.3).
13
(iii) Empirical data was collected using a mailed questionnaire to
detenni^ne the op,Mops -of. the. South African computgp 4wWs>tr$- ,®n
what skills will be required by the systeiK analyst of the future.
These, data were used to; build the first of^the eane&ptual mofiels
used in the research. Because the questionnaire respondents were
asked to identify the skills they regarded as iraportant to the
future systems analysts in the context of the systems analysts1
future job responsibilities, this model was called the job
responsibilities/skills model (see section 5*3.2). (!
{iv) The second Conceptual model was built (by deduction) directly from
the literature survey. Links were identified in the literature
between the roles the systems analyst of tire future was expected
to fulfill and the skills required to perform effectively within
these roles. This model was called the roles/skills model (see
section 6.3). "ti . ■ 1 „
(v) The skills required by the systems analyst of the future were
identified by comparing and contrasting the skills identified in
these two models. These skills were grouped into clusters basedV ' j|, ■ "
on the occupational categories literature (see section 7.3.2).
(vi) The skills clustering exercise suggested that the responsibilities
of the systems analyst could be grouped into a number of new job
categories. To ensure that these new job categories were
independent of any present, or future systems development life
cycle stages, they were identified using a widely used job
diagnostic survey instrument (see section 7.5.2.1).
14
These six StgpS fewe been presented gpapfiieaUy in figiife 1.2
(This figure has been repeated throughout thevtjiesis to, ensure
that the description of each step of the research is assessed in
eowtext.) An expanded description of these ste’ps is g'iven in
chapter 3 in the context of presenting the characteristics of the
-- research.
° ■ ”• '8 \ ' „
1.7 VALUE OF THE RESEARCH " \
If the turbulence in the I.S. industry continues,! and if there is a■ , ■ ' growing need for the systems analyst as the key figure in future
application systems development, then identifying the skills profile for
the future systems analyst has value in the following areas: ;
i . \ V1.7.1 THE SELECTION OF PERSONNEL * V
The traditional career path to systems analysis is through programming
(Caprori, J.986 p.42} Thierauf, 1986, p.4). This in itsfelf may have
merit, but many companies in South Africa employ programmers on the
basis of an aptitude test rating. If the job responsibilities and
required skills of the systems analyst of the future are dissimilar from
those traditionally expected, the selection process for systems
developers may need to change. The industry cannot afford either to
employ people who may not be productive systems analysts, or to exclude
people who may become useful systems analysts (Dickson and Wetherbe,
1985, p.58,). 0 „
1.7.2 THE DgS.IGf) OF EDUCATION PROGRAMS ' . ’ ' ’. . 1 .. -■ . * ■ .. • • ." • *■ . ,
One of -itjie' -appJWehes tv elf^etiVe Jupfi’euTurn design' is /t^; ®i|c’e\
education goal orientated-(Gagne aifd Briggs, 1979)). Unless ’tffe .skill's
required by the systems analyst of the future are identified {i.e, the
goals are known), designing relevant tsrtfery edcteation courses to bai?d
an appropriate body of knowledge for the future systems analyst will be
difficult, if not impossible (see Harold, 1983, p.102; Byrkett and
II "Uckan, 198©; Greenwood, Deveau and Greenwood, 1986, p. 12). . To wait iri
the hope that the turbulence will settle so that the goals of education " ■■ ,vH
will be known, will continue to perpetuate the 'five year gap* between
education and practice identified by Kryt (1983, p.123).
1.7.3 IDENTIFYING APPROPRIATE EXPERIENCE
There is a lack of consensus on how much experience in the user
environment is appropriate for a systems analyst (cf Mann, '1985 and
Chen, 1985). It is possible that once the skills of the systems
analyst of the future are identified, the I.S. industry will find it
necessarty to reassess the experience appropriate for systems analysts.
If the required skills are significantly different from those currently
developed for systems analysis, it may be necessary to introduce
different career paths for personnel who will become systems analysts in'
the future (e.g. much more exposure to the user activity, no time at all
in the programming discipline). -
17
\\
1.7.4 T'OHARDS OVERCOMING SKILL'S SHORTAGE ,
The* shortage of skilled systems analysts is regarded as a widg-4 p,j£ead
problem (Barr and Koehen, 1984, p.164; Marton, 1984, p 211 Grindlay,
1981, p.15; Thlerauf, 1986, pp.3 and 4; Vitalari and Dickson, 1983,
p.948). In South Africa a shortage of 24% p.a. was identified by the
National Productivity Institute in their report on the manpower and
training needs of the South African computer industry (NPI, 1983,
p.213). Although actual numbers vary, the situation in South Africa is
aggravated by the so-called ‘brain-drain1 of I.S, staff to other
countries. One report stated: ,
*.... the brain-drain (of South African computer personnel) is no myth, with at least 25% of computing professionals currently active in the DP industry wanting to leave the country.1 (CSA, 1986, p.l.)
These views are supported by another reports
'The DP industry this year (1986) is unlikely (to) be any better than it was last year and it is expected that a higher number of skilled personnel would be leaving the country .... over the next nine months several hundred DP people would go .... this has led to there being a 20% shortage of skilled computer people in South Africa.' (Computing SA, 12 Jan 1986,P-2.) :
Because the country's total population is small, this presents a
serious problem. Any effort to try to overcome these shortages will
demand exact knowledge of the skills required by the future systems
analyst. There is no room for obsolete skills, or personnel who are
incapable of adapting to new environments and developing new skills.
18
1.8 CONTRIBUTION TO KNOWLEDGE
Tihe research gtade a contraflbiition to knowMge in three broad areas-:
- of meeting the specific objectives set for the research;
(why meeting research objectives has been claimed a® making a
contribution to knowledge will be substantiated in section 1.8.1)■ ■ n
- , as a direct result of identifying the skills required by the, ■■ 1,1 /? - ’
systems analyst of the future, of identifying a set of generic
skills clusters, and possible new job titles which are independent
of any systems development life cycle;)) ■
- of identifying two groups of hypotheses which were generated from
the research.
1.8.1 MEETING OBJECTIVES (see sections 1.5 and 8.2.1.2)
Whether a research programme makes a contribution to knowledge as a
direct result of meeting its objectives obviously will depend on the
nature of the objectives set for the research. The objectives set for
this research (see sectionl.5) were to identify specific groups of
information which, prior to research, had not been published. In
general terms, therefore, the meeting of these objectives could be
regarded as a contribution to knowledge. Specifically how each
objective Was met is detailed below.
(i) A clear definition of ‘systems analyst* was given, based on the
literature (see section 2.1.1.4), and a definition was given
of the role of the systems analyst of the future (see section
7.3.2).
•• ■ '" • ■ V /'-.'■ - ■ ' * ■■ *,*.■ ••* ;• ■.* ■ t1 A *,v * v ‘ / s*' -r
■ ■ -. " ; :' •■„ V,,■ ■ • " . - -■ . • ‘ “ . . <L .. '■'! ' ■ ■ . !J' % ■” 1(ii) The skills profile *5f the systems analyst of the future was
identiitjsd egi|%;i®g the skills identified in the job, ■ - • o .
Wsponsfi>iHtJ#\si!ffi'|s «fth those of the roles\skills'■ '' ' • ' <C\ ■ ■
model (see section 7.3.1). ;'' i) ' . 11
(iii) The o p i n i o n s Gf the participants in the empirical survey were
r: compared and contrasted in section 5.2. Disagreements were
identified between academic and practitioner experts, the
experts and the practising systems analysts and groups of
, practising systems analysts. >
r Knowledge of these disagreements are of value to each of the
participant groups. It provides feedback to the academics
to enable the* tc evaluate their courses. Managers in theI ■
South African computer industry are given an indication of
possible problem areas in the education, training and career
planning of systems analysts. The system analysts
themselves are given a basis from which to plan their own
career development.
(iv) The comparison of the skills identified through the empirical
research and the literature survey helps to identify any
local peculiarities of the systems analysts1 discipline.
From the results of this research it seemed that the South
African perception of the future systems analyst was that of
a generalist (rather than the categories of specialization
which can be identified in the literature (see sections 7*3.1 -■
and 7.3.2)). In spite of the areas of disagreement,
however, the comparison between the models built in chapter
20
five arid Chapter six gave a clear iinidteatfan of the cha'nging
pole of' th,e systems, analyst (_e.g* in tfre areas- of
fiivestigative> management and systems acquisition
activities), and the essential skills required for the role
of the systems analyst (e.g. skills in business practices,
human issues and acting as a change agent).
1.8.2 NEW GENERIC SKILLS CLUSTERS AND JOB TITLES
To avoid linking the skills required for the future systems analyst to
any perceived systems development life cycle, they were grouped into
clusters based on occupational categories, prior research and a factor
analysis of the empirical data (see sections 7.2.1 and 7.2.2). This
process identified ten skills clusters of
business acumen
change agent
computational
evaluation
human issues
investigative „
performance
project management
savant ‘
systems acquisition.
By using a job diagnostic survey instrument these ten skills
clusters were combined into a new dispensation of job categories which
make the currently used titles.(e.g. programmer, designer,
O
'■ ■ -i " ■ .. ■■;«;■ ■ ...v • " " ■ .'•■* ■ ■ , v.t; ■■/*•':Tfin’ianalyst-progr’ammer, systems analyst) obsolete. Two Uroad job
categories (that of the generalist systems developer, and. various
Special! t categories) were identified (see seetfon 7.5.2.1). The job
categories which are expected to be found in the commercial application
software development industry within these broad categories include
The generalist systems developer
Specialist categories
information architect specialist '
database specialist
prototyper specialist
savant specialist ,
audit specialist. .
1.8.3 HYPOTHESIS GENERATED :
The research was classified as a hypothesis generating field study.
These hypotheses identify those areas where, as a resuU of this study,
further research is required. The hypotheses fall into two groups (see
sections 8,3 and 8.4).
(i) Hypotheses resulting directly from the research and being
associated with issues such as:
- systems analysts ail'd aptitude testing,
- systems analysts' social needs strength,
- systems analysts and small I.S. departments,
- the future of programmers,
- the appropriateness of the title 'systems analyst',
.....■■ r ■ " ■ * & ^ , .r *' - a-:-" ■■■ ;7 --.- ■. . •*■: ■■ f’ - ■■■ ^ 1 • ■
& r - o the impact the suggested jnb categories will have on systems
I; ” analysts1 performance, 1
- the link between the frai»entatiiM of the systems analysts’
jol> and the maturing of tte I.S. industry.
(ii) Hypotheses which may result from further research, which include
topics such ass
- factors which characterize a good systems analyst, '
, - the link between the maturity of an I*S. department and the
skills mix required from the systems developer,
- " the impact of culture on the performance of the systems
developer.
Providing these hypotheses are regarded as a contribution to
knowledge because they identify areas where further order can be
introduced into the turbulent application software development
environment.
1.9 OUTLINE OF THESIS STRUCTURE
' j-j This thesis is divided into eight chapters and appendices. The summary
of each chapter is as follows:
Chapter It This chapter was designed to provide a broad overview
of the study. Evidence was provided of turbulence in the I.S.
industry, the research objectives were established in the context of
this turbulence and an overview was given of the research approach.
. The value of the research, and its contribution to knowledge was given.
Chapter 2; The second chapter is still introductory in nature/
Background to the research is given through a general review of relevant
literature. This rivisto becomes more specific as key terms Used fn
this study are defined. A description aid analysis of prior research ’" - 8 "
is used as a platform on which to set the research objectives.
Chapter 3: The characteristics of the study were identified. 3
- - 0 ■ "The main thrust of the chapter was to indicate why this particular
approach to the research was taken, and how the research can be
classified in terms of the social science paradigm/ The research's .
boundaries, the'assumptions made in the context of the research and the
limitations of the research are identified. The chapter closes with a
description of the use of statistics in this study. ,
Chapter 4: In this chapter the methods used to collect the
empirical data are described. Details are given of the objective,
construction and distribution of the questionnaire. The section
describing the response to the questionnaire makes references to the
appendices where details are provided of all the data collected. The
effectiveness of the questionnaire as a measuring instruiient is assessed
and the limitations of the empirical research are identified.
Chapter 5s The methods used to analyze the empirical data are
outlined in tliis chapter. The job responsibilities/skills model, built
from the empirical data is described in detail.
Chapter 6: Each level of the roles/skills model, whi .’js built
from a detailed literature survey, is described. These J-r Is have
been identified by linking the associations which systems i* n iysts of
the future are expected to have with their environment to t$e roles they
WiVl peed *ta .play within these associations., 'and the sikil|s whieh Wiljl
be needed to perform effectively within these roles. '0 ''
Chapter 7: In this chapter the research findings are presented
and interpreted. The skills required by the systems analyst of the
■ ” ■ -i. ' I ■ ■future are identified 1n„terms of the a° new sat of generic sfcills
" . p clusters* This new clustering has been interpreted as suggesting a new
dispensation of job categories in the I.S. application development
industry. The new job categories ure described in detail.
Chapter 8: Before areas of further research are identified, the
research procedures and findings are summarized and evaluated in terms
of the research objectives set in chapter 2.
1
()
25
, . , ■ ’ , ■ ' ''.' a " Q : _
CHAPTER TWO :
RESEARCH FOUNDATIONS ' ,
The foundation of the research programme given in this chapter is
grouped into two sections:
• Section 2.1 - a literature review appropriate to this study,*
Section 2.2 - a description and analysis of prior research
attempting to identify future systems analysts'
„ , skills;
2.1 LITERATURE REVIEW •
A large amount of literature was reviewed to enable the foundation of
this research programme to be built. Sometimes progress was delayed to
allow for a thorough study of a particular issue. To help clarify some
of the arguments or to reinforce some of the themes of the research,
details of the .literature survey have not been confined to this section.
At times it seemed more appropriate to place the literature review with ijl . ’ 0 ■ .■
the chapter which built on the foundation which the survey established.
In essence, the literature has been used in three ways:
to provide input to the definition of key terms;
- as a background to the research programme;
“ to provide specific input to the building of the roles/skills
model. •
;i 2.1,1. DEFINITION,OF KEY TERMS ‘ '
! Three methods were used to ensure that it was unlikely any substantial
body of literature relevant to the research M s ignored:
- a coiiipat«rizec| search for relevant wateH a V (published bfter 1970)
Was done on the ABI database; "
- appropriate business, educational and computing indices for the
'' . " ' \ ' *-• ■' sane tuMj-spaii, ware seenhcftefV,,.qnHu lly
- the references of related articles in the major computing journals
were searched for material not found by the usual indexing
methods. ,
in each Case focus was placed specifically on empirical,,studies,
but cognisance was taken of conceptual articles which were firmly based
on I.S. literature.
It Is noted that the amount of literature identified which
concentrated on I.S. personnel issues was generally relatively small,
and that which concentrated on future I.S. skill requirements, even
smaller.
fJ The foljr key terms used in this research which needed to be
defined clearly were: j
- the future
- skills
- model ('/
- systems analyst.
27
2.1.1.1 THE FUTURE
Throughout the research, the FUTURE was defined as a period front five to
eight years hence*
2.1.1.2 SKILL ,.
In the literature there appeared to be ah inconsistent usage of the
words SKILL and COMPETENCY, The following points are, therefore, made:
(i) SKILL was often used in the context of a MOTOR SKILL (e.g. typing,
riding a bicycle, playing tennis), or in a specific category of
skills (e*g* mental, social or linguistic skills) (see Sruner,
1973, p.241; Anderson, 1980, p.224; Lovell, 1980, p.74; Knapper
and Cropley, 19S5, p.76}+ Obviously -in this research, the tens
could not be confined to such a narrow meaning.
(ii) While a possible synonym for SKILL could be COMPETENCY, this term
was sometimes given the connotation of an inherent capability.
for example, the term has been defined ass
1.... an area of knowledge and/or skill which art r Individual must possess in order to produce outputs for his/her role*1 (American Society for Training and Development, Competency Questionnaire, 1982);
special characteristics of people who do the best Job.' (Goleman, 1901);
‘.... a condition of being capable.' (Coitins English Dictionary, 1979)*
(iii) To avoid a ftisunderstanding of th« objectives and boundaries of
this research, the word COMPETENCY was specifically avoided.
(1v) Because a SKILL was perceived as an acquired and/or learned
quality (rather than an intrinsic attribute (see Parisian, 1904
p.12)) the definition, used in this research was an adaptation of
that given by Allen, 1974.= A SKILL, was defined as an ability to
perform specialized work with recognized proficiency.
2.1.1.3 MODEL
The conclusions reached in this research were based on the building of
two conceptual models (see chapters 5 and 6). The word. MODEL is used
widely in the literature, for example, in:
human resources management (Peterson and Tracy, 1979, p.107).
statistics (Minium, 1978, p.110). /
economics (Johnson, 1984, p.l).
research (Bailey, 1987, p.317).
Because of the nature of these disciplines, there is the
probability that the word MODEL in these contexts has the connotation of
simulation. This connotation is, inappropriate in this research. The
approach taken here was an adaptation of the Leavitt model quoted in
Davis and Olson (1985, p.354). The word MODEL, therefore, is used to
describe a hierarchy Of interrelationships between components which, in
totality, represent a complex entity (e.g. a profile of the skills
required by the systems analyst of the future (see figures 5.37 and
6.2)). .
2<1.1*41 SYSTEMS ANALYST
It was noted earlier (see section 1.5) that definitions of SYSTEMS
ANALYST tend to be inadequate and unclear. When a working definition
of the term to use in this research was attempted, the following
29
additional problems were identified: n,
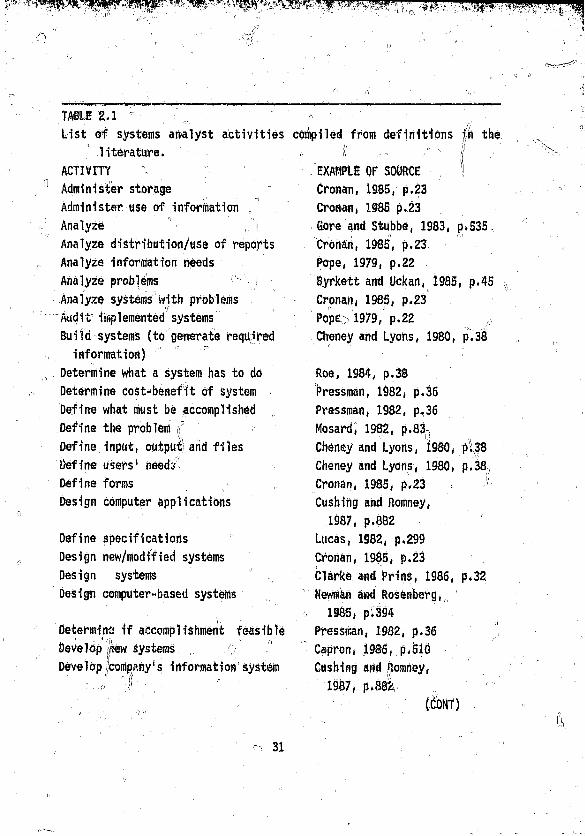
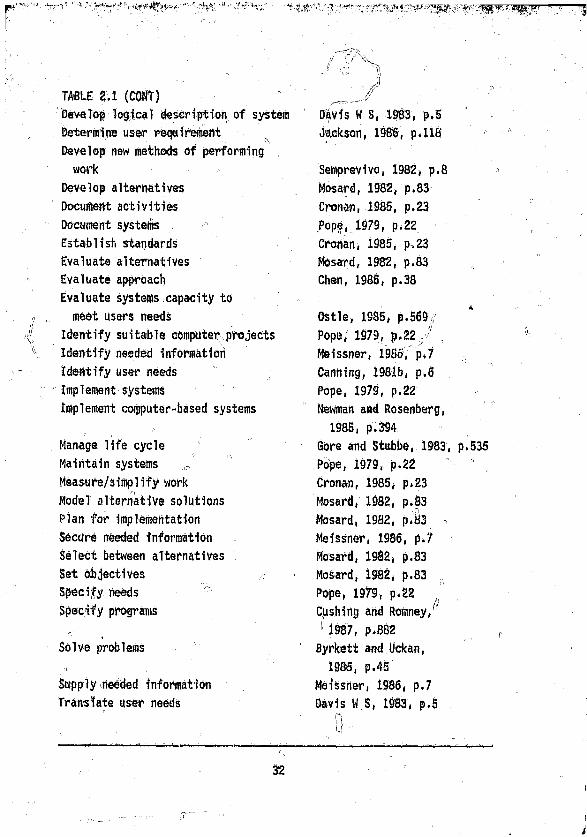
(i) The variety and variability of definitions used preclude the" » °
possibility of finding a widely accepted'definition (see table 2.1
for a list of systems analyst activities which were extracted from
n. documented definitions). ’ r,I' 1 . ’ ' ’’ ’
(ii) Some of the activities identified in the literature as SYSTEMS
Tj^ALYSTS1 responsibilities include functions which could be
regarded as outside the stope of analyzing systems - for example:
rt - building, developing, implementing, maintaining systems')> ' ' . \ \\
CJ (e.g. Cheney and Lyons, 1980, p.38, Capron, 1986, p.510,
Pope, 1979, p.22). vX
- managing systems1 development by setting objectives and
establishing standards (e.g. Mosard, 1982, p.83, Cronan,
1985, p.23), '•s " " ..- n , (■ ■
- fulfilling an administrative role (e.g. Cronan, 19J&, p.23).„ 1 ; I
The use of the term SYSTEMS ANALYST in this research, therefore,
is thei systems developer whose activities are confined to: ■:
Analyzing workflows, organizational policies and practices,V,
Lasting reports and documents of the application under" study},1' *
(see e.g. Gore and Stubbe 1983, p.535, Cronan, 1985, p.23,
Meissner, 1986, p.7).
documenting existing operations and procedures to evaluate them in
order to determine their operational effectiveness (which, in
turn, helps to determine if an alternative approach is necessary);
(see e„g. Canning, 1981b, p,6, Byrkett and Uckan, 1985, p.45, Roe,
1984, p.38),
30
\\
.0 " ■, -<zt \ .
TABLE 2,1 " .
List of systems analyst activities
literature.
ACTIVITY ;
Administer storage
Administer use of information
Analyze r ."*'
Analyze distribution/use of reports
Analyze information needs
Analyze problems '
Analyze systems with problems. ^ . ii
Audit implemented systems
Build systems (to generate required
information)
Determine what a system has to do
Determine cost-benef1t of system
Define what must be accomplished
Define the problem ( ,
Define input, output arid files
Define users' needs'
Define forms „
Design computer applications
Define specifications
Design new/modified systems
Design Systems
Design computer-based systems
Determine if accomplishment feasible
Develop ,iew systems r ,/
Develop company's information system
compiled from definitions fh the
0 i ‘
EXAMPLE OF SOURCE I
Cronan, 1985, p.23
Cronan, 1985 p.23
Sore and Stubbe, 1983, p.535
Cronan, 1985, p.23
Pope, 1979, p.22
Byrkett and Uckan, 1985, p.45 V)
Cronan, 1985, p.23
Pope 1979, p.22 fi
Cheney and Lyons, 1980, p.38
Roe, 1984, p.38
Pressman, 1982, p.36
Pressman, 1982, p.36
Mosard, 1982, p.83
Cheney and Lyons, 1980, p.38
Cheney and Lyons, 1980, p.38
Cronan, 1985, p.23 <
Cushing and Romney,
1987, p.882
Lucas, 1982, p.299
Cronan, 1985, p.23
Clarke and Prins, 1986, p.32
Newman and Rosenberg,
a 1985, p.394
Pressman, 1982, p.36
Capron, 1986, p.510
Cushing and Homney,
1987, p.882
31
i!
TABLE 2.1 (.COW)
Develop logical description of system Davis W S, 1983, p.5
Determine User reqdfewent Jackson, 1986, p.118
Develop new methods of performing ' "
work Seinprevivo, 1982, p.8
Develop alternatives Mosard, 1982, p.83
Document activities Cronan, 1985, p.23
Document systems Pope, 1979, p.22
Establish standards Cronan, 1985, p.23
Evaluate alternatives Mosard, 1982, p.83
Evaluate approach Chen, 1985, p.38
Evaluate systems capacity to
meet users needs Ostle, 1985, p.569 *
Identify suitable computer projects Pope, 1979, p.22
Identify needed information Meissner, 1986, p,7 -
Identify user needs Canning, 1981b, p.6
Implement systems Pope, 1979, p.22
Implement coipputer-based systems ftewman and Rosenbarg,
Manage life cycle
1985, p.394
Gore and Stubbe, 1983, p.535
Maintain systems r, Pope, 1979, p.22
Measure/simplify work Cronan, 1985, p.23
Model alternative solutions Mosard, 1982, p.83
Plan for implementation Mosard, 1982, p.83 ^
Secure needed information Meissner, 1986, p.7
Select between alternatives Mosard, 1982, p.83
Set objectives , Mosard, 1982, p.83 ,,
Specify needs ^ Pope, 1979, p.22
Cushing and Romney,Specify programs
f, ' ’ l! 1987, p.882
Solve problems Byrkett and Uckan,
Supply needed information
1985, p.45
Meissner, 1986, p.7
Translate user needs Davis W S, 1983, p.5
0 . ■
32
- designing new (or modified) approaches which are technically,
economically and operationally feasible; (see e.g. Pressman,
1932, p.36, Cashing and Romney, 1987, p.882, Semprevivo, 1982,
P-8). ^ ' i . ■
- preparing the necessary documentation (structure charts, decision
tables, program specification, etc.), systems test data,
implementation plans (development and conversion) and cost/saving
estimates for the new or revised system; (see e.g. Mosard, 1982,' ' - ,,!)
p.83, Cronan, 1985, p.23, Lucas, 1982, p.299).
- monitoring the development and implementation process; (see e.g.
Gore and Stubbe, 1983, p * 536).
- conducting sessions to evaluate the effectiveness of the
implemented system and reporting findings to management, (see
e.g. Chen, 1985, p.38, Ostle, 1985, p.569). ,
" I2.1.2 THE LITERATURE REVIEWED AS A BACKGROUND TO THE RESEARCH
- >> \\PROGRAMME '
\\ ,
The review of the literature for this study was focused on three major
areas: •
- theories documented in the literature which were used as a
foundation to this study;
- the evolution of the discipline of systems analysis;- X
- the root causes of turbulence in the I.S. industry. |
.. f
33
2.1.2.1 THEORETICAL BASIS FOR THE RESEARCH ,
Details of the theories used in this study have been included in the
thesis in those places where they are used. In this section these
theories are summarized (in the context of the overall research
approach) to help establish the foundation on which the study was based.' rs ■ " .. '
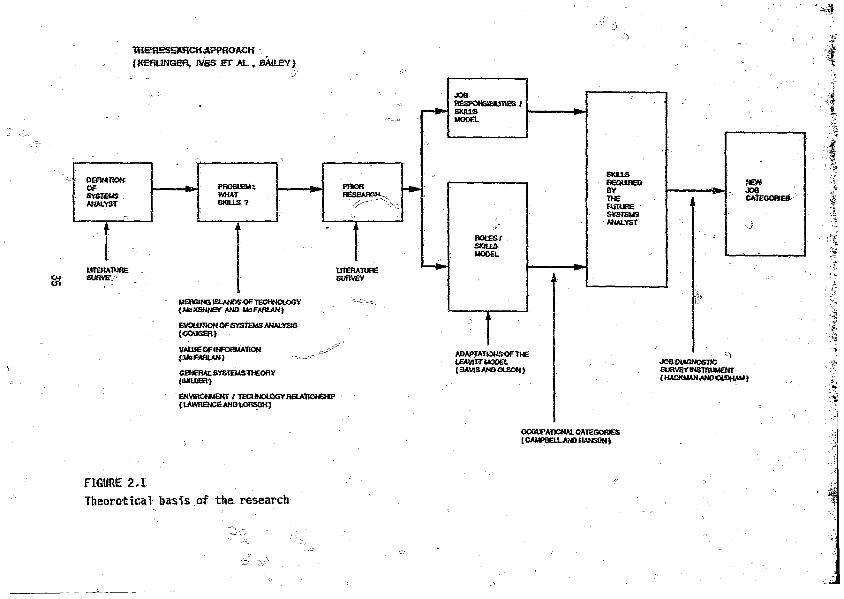
The research approach (described in section 1.6 and presented
diagrammatical ly in figure 1.1) is presented again in figure 2.1,
together with an indication of the context in which the theories were
used.
(i) PROBLEM IDENTIFICATION STAGE
The change in the skills required by the systems analyst of the
future is the result of the interaction of a number of factors
(described in detail in section 2.1.2.3 and presented graphically
in figure 2.2), The liberature base on which need for this
changing skills pattern is built includes: >/
- the impact on the I.S. industry of the merging islands of
technology (McKenney and McFarlan, 1983, p.70)}
- the evolution of the relationship between the environment
(the work environment in particular) and technology
(Lawrence and Lorsch, 1967, p.237);
- the evolution of the systems analyst (Couger, 1973);
changes in the perceived value and potential use of
information (McFarlan, 1983).'
- the elements which constitute a viable/adaptive system
(Miller, 1978)»
THERESEARCH APPROACH
{KERUNGEfl, JVES ET A L ., BAILEY)
DSFWmGftOFSYSTEMSANALYST
w&vwmE&mve;
IMAGING tSUWOS OF TECHNOLOGY < McXSNNEY AND Mc F/UUAHJ
EVQUmo«GF SYSTEM AWAiSSiS (COUGCnj
VAU2COFINFORMAHOK {UcFAfiUK) '
GEWERALSYSTEUS THEORY (M U E l)
B4VJRGNMEMT / TECUNOLQGY RELARONQHtP (IAM1ENCE AND ICflSCH )
FIGURE 2A
Theoretical basts of the research
OCCUPATJGNAL CATEGORIES( CAMPBELL A?CHANS£fO
(11) THE RESEARCH APPROACH ' *—
Details of the research approach ami the reasons for taking the
approach are given in chapter 3. Here it is noted that:
- research procedures to be followed when the researcher has
no control over the environment, is documented in Kerlinger
1974, p.379;
- conceptual studies in the I.S. environment in which there
are no predicted relationships, but where research is
undertaken in one variable group, are described by Ives et
' , al., 1980, p.921; L
- characteristics of research which is undertaken following
the social science paradigm are given by Bailey, 1982.
(iii) BUILDING THE CONCEPTUAL MODELS
The basic concept used in the building of both the conceptual
models in the research was an adaptation of the Leavitt model of
organizational subsystems, quoted by Davis and Olson, 1984, p.355.
(iv) ESTABLISHING THE SKILLS PROFILE OF THE FUTURE SYSTEMS ANALYST
The categories used to combine the future systems analysts1 skills
were established from a method of classifying occupational
categories used by Campbell and Hansen, 1981, p.29.
(V) NEW JOB CATEGORIES <;
The procedure followed to combine the skill requirements of the
systems analyst of the future into work units (and subsequently
new job categories), was based on the use of part of the lob
diagnostic survey instrument of Hackman and Oldham (Huse, 1980,
p.314 artd Couger, 1978, p. 188).
2*1,2,2 THE EVOLUTION OF SYSTEMS ANALYSIS
As the discipline of systems analysis has evolved, not only has it
undergone changes in emphasis and complexity, but attempts have been
made to design appropriate syllabi to neet its changing educational
needs and establish a knowledge base appropriate to its demands, As a
background to identifying the skills required by the systems analyst of
the future, in this section a description is given of:
* changes in emphasis in systems analysis;
- methods of curriculum design and development;
» . steps taken towards developing an epistemology for systems
analysts,
(i) IDENTIFIED CHANGES IN EMPHASIS IB SYSTEMS ANALYSIS
Contemporary systems analysis is defined and described In books
such as Capron {1986)* Gore and Stubbe {1983} and Ostle (1985),
in his detailed description of the evolution of business systems
i analysis techniques, however, Couger (1973} traced the development
of systems analysis from the early 1900's, when the activity was
c,1ose1y associated with industrial engineering and process flow
analysis, through the pre-coiputer era of mechanical data
processing td the current situation of a dose association between
systems analysis and computer-based systems. As this evolution
3?
(fnew job categories), was^based on the use of part of the job
diagnostic survey instrument of Hackman and Oldham (Huse, 1980,
p.314 and Couger, 1978, p.188). '
2.1.2.2 THE EVOLUTION OF SYSTEMS ANALYSIS
ii :As the iiscipline of systems analysis has evolved, not only has it
undergone changes in emphasis and complexity, but attempts have been
made to design appropriate syllabi to meet its changing educational
needs and establish a knowledge base appropriate to its demands. As a
background to identifying the skills required by the systems analyst of
the future, in this section a description is given of:
- changes in emphasis in systems analysis;
- methods of curriculum design and development;
- steps taken towards developing an epistemology for systems
analysts.
(i) IDENTIFIED CHANGES IN EMPHASIS IN SYSTEMS ANALYSIS
Contemporary systems analysis is defined and described in books
such as Capron (1986), Gore and Stubbe (1983) and Ostle (1985).
In his detailed description of the evolution of business systems
analysis techniques, however, Couger (1973) traced the development
of systems analysis from the early 1906's, when the activity was
c.losely associated with industrial engineering and process flow
analysis, through the pre-computer era of mechanical data
processing to the current situation of a close association between
systems analysis and computer-based systems* As this evolution
has taken place, so the nature of the systems analysts' task has
undergone change and the complexity of the activities associated
with the task has increased* This change and increased
complexity has now reached a point where a multiplicity of job
titles is used for people involved in various aspects of systems
analysis (see section 1-3.1). Because these changes can be
identified, further changes in the nature of systems analysis in
the future can be anticipated (see section 7.5.2.1). There is
some evidence that these further changes are no longer part of a
closely related, evolving discipline (Martin, 1982, p.333).
While this study recognizes the roots of current systems analysis,
it does not presuppose rfchat future systems analysis is part of a
continuum. J
APPROPRIATE CURRICULUM DESIGN AND DEVELOPMENT
Although the process of curriculum design, as such, is outside the
scope of this research, it is noted that one of the approaches to
curriculum design is based on the formulation of appropriate
objectives for the course (see Gagne and Briggs, 1974, pp.7 and 8;
Mager, 1962, p.l). Provided these objectives are stated in
■easttrabU terms, they can be used to assess a participant's
achievement. To facilitate,,defining measurable objectives, the
design goals are sometimes classified in terms of a taxonomy (e.g.
see Bloom, 1956, p.12). Such a taxonomy differentiates between
those objectives which focus on recall or recognition of
knowledge, and those associated with synthesis and the evolution
1 . -Vi ' 1 ■ nof concepts. Without having a clear picture of the skills
required by th$ future systems analyst, part of the establishment
of appropriate syllabi for systems analysis education will not be
possible (see section 8.?.3). An assessment of proposed college
curricula (e.g. Nunamaker, 1982; DPMA, 1985), education?1
taxonomies and the needs of the computer industry, Hs_gi en by
Pollack (1981, pp.20-32).
(1ii) EPISTEMOLOGY FOR SYSTEMS ANALYSIS "
Another relevant issue, closely related to the concepts of
curriculum design, is an apparent emphasis in the industry on the
development of systems analysis techniques and methods. These
techniques and methods typically gain acceptance then became
obsolete, with rapid frequency (see Your don, 1986, pp.133 to 136),.
Vitalari suggested that the software development industry needs a
well-formed knowledge base for systems analysts which does not
suffer from the volatility of the techniques and methods, which
tend to receive so much attention. He claimed:
the organization and content of the systems analyst's knowledge base plays a central role in the level of analyst expertise in the analysis domain.' (Vitalari, 1985, p.221).
Identifying the skills of the systems analyst of the future,
tjieirefore, will only make a partial contribution towards meeting
the need which Vitalari identified. It is, however, a further
step towards understanding the evolution of the discipline of
systems analysis.
39
, Cl . * ' '■
<? ' ,s ' .■ - o
2.1.2.3 THE ROOT CAUSES OF TURBULENCE IN THE APPLICATION DEVELOPMENT
INDUSTRY , ". ( ( 0
It has already been established (see section 1.3) that the application
development industry is in a state of turbulence. The reasons for this
turbulence were presented graphically in figure 2.2. The review of tfya
literature became more focused as links were established between the
variables in figure 2.2. As part of the background to this study,
ttrise variables, and the links between them, are described in this'
section.
2.1.2.3.1 CHANGES IN TECHNOLOGY
The contention that man is pushing back the frontiers of knowledge is so
'widely held that it may almost be regarded as axiomatic. Some writers
(e.g. Naisbitt, 1982; Drucker, 1981; Toffler, 1980) have suggested that
human exploration into the unknown is particularly associated with
scientific knowledge and /technology, ~
One of the most dramatic growth areas within this sector is linked
to computer technology. Rapid evolution is taking place in the
interrelated areas of:
hardware,
software, f / ■ “i' '
data, .Q r:
conwunidations (see CaiwiBg, 1984b, p.5). .
40
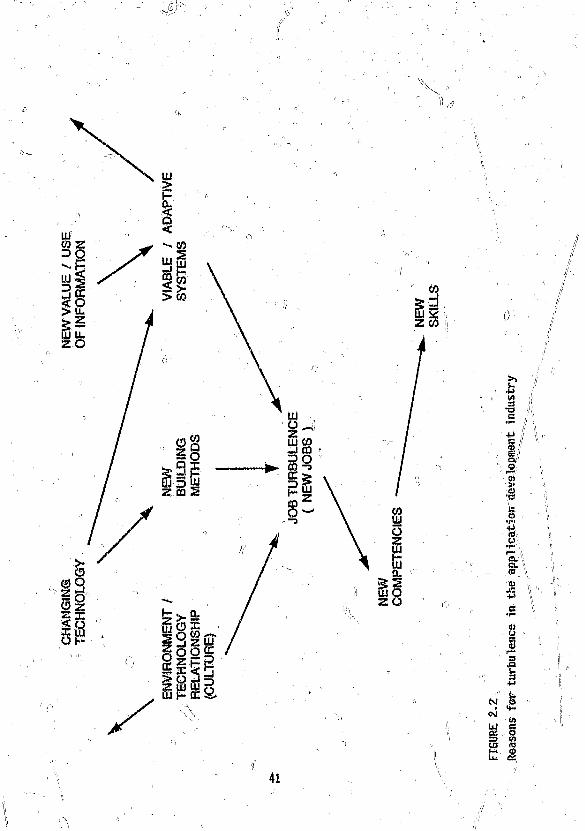
V
M
UJOS©CD
>»U+JV)3C
+* !l i1/Q$5;Sk£fb©•r i■y(Up
CL v©.ro
QJuS3Q>3.QU53•M
I
ifi & O ' W (303QC
41
i\
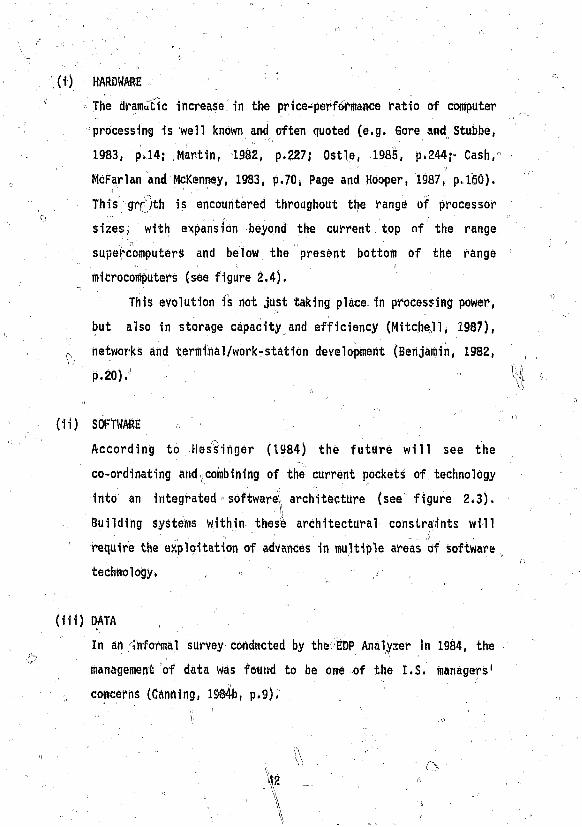
(i) HARDWARE ..
The dramatic increase in the price-performance ratio of computern 1 ' 'processing is well known and often quoted (e.g. Gore and Stubbe,
1983, p.14; Martin, 1982, p.227; Ostle, 1385, p.244;- Cash,1 ' , O'
McFarlan and McKenney, 1983, p.70, Page and Hooper, 1987, p.. 160).
This grr’rth is encountered throughout the range of processor
sizes, with expansion beyond the current top of the range
supercomputers and below the present bottom of the range
microcomputers (see figure 2.4).
This evolution is not just taking place in processing power,
but also in storage capacity and efficiency (Mitchell, 1987),
(- networks and terminal/work-station development (Benjamin, 1982,
p.20).
(ii) SOFTWARE f
According to Hessinger (1984) the future will see the
co-ordinating and combining of the current pockets of technology
into an integrated software architecture (see figure 2.3).si ' '
Building systems within these architectural constraints will
require the exploitation of advances in multiple areas of software
technology. , «
(iii) DATA
In an Informal survey conducted by the EDP Analyser in 1984, the
management of data was found to be one of the I.S. managers1
concerns (Canning, 1984b, p.9).
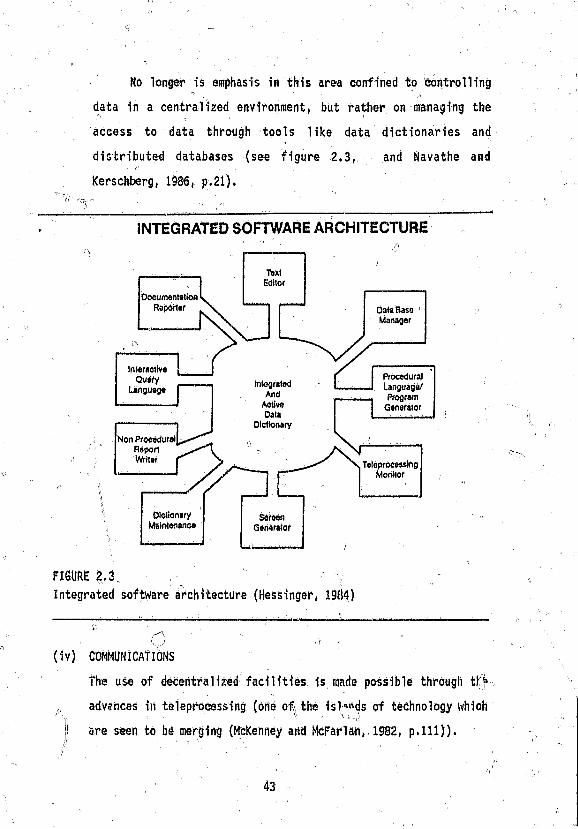
No longer is emphasis in this area confined to controlling
data in a centralized environment, but rather on managing the
access to data through tools like data dictionaries and
distributed databases (see figure 2.3, and Navathe and
Kerschberg, 1986, p.21).
~ INTEGRATED SOFTWARE ARCHITECTURE
FIGURE 2.3 ,
Integrated software architecture (Hessinger, 1904)
' * ,(J i‘t
(iv) COMMUNICATIONS
The use of decentralized facilities is made possible through tl“
„ advances in teleprocessing (bile of* the isj^ds of technology which ’''j! ■ ■ .
j are seen to be merging (McKenney and McFarlan, 1982, p.111)).
43
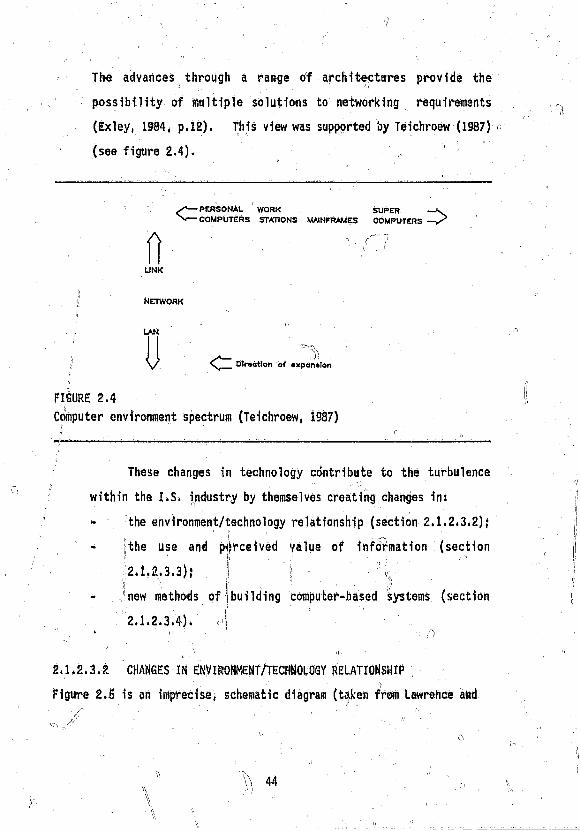
The advances through a range of architectures provide the
possibility of multiple solutions to networking requirements
(Exley, 1984, p.12). This view was supported by Teichroew (1987) »
(see figure 2.4). ‘
S — PERSONAL WORK SUPER— COMPUTERS STATIONS MAINFRAMES COMPUTERS
f l "UNK
Ne t w o r k
. ,)]\ Dlractlon of «xpan»Ion
FIGURE 2.4
Computer environment spectrum (Teichroew, 1987)
These changes in technology contribute to the turbulence
within the I.S. industry by themselves creating changes in:
- the environment/technology relationship (section 2.1.2.3.2)f
- the use and perceived value of information (section
2.I.2.3-3); | 'j! . ,
- new methods of building computer-based systems (section
2.1.2.3.4). A* ’ i' n
2.1*2.3.P. CHANGES IN ENVIRONMENT/TECHNOLOGY RELATIONSHIP
Figure 2.5 is an iniprecisei schematic diagram (tejken from Lawrence and
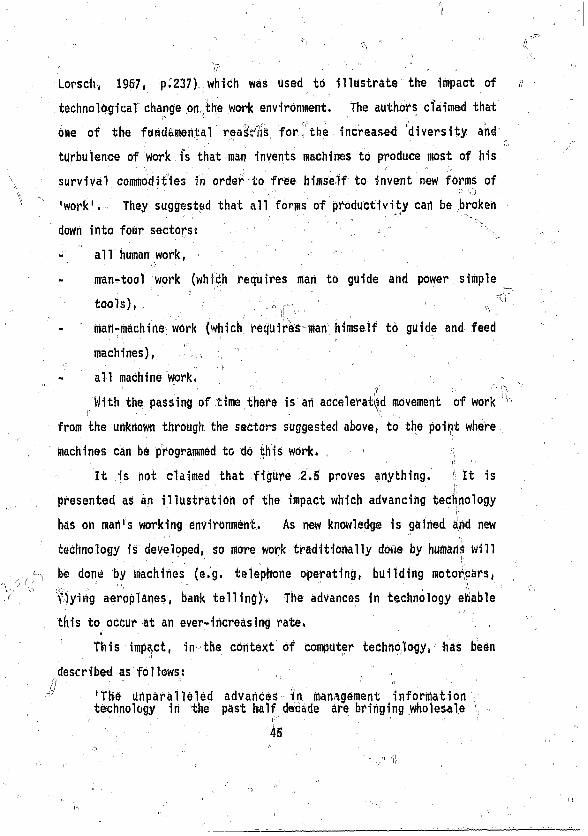
Lorsch, 1967, p.237) which was used to illustrate the impact of
technological change on the work environment. The authors claimed that
one of the fundamental rea'itris for' the increased 'diversity and
turbulence of work is that man invents machines to produce most of his
survival commodities in order to free himself to invent new forms of■ ■ ' ■ 0 f"'
'work'. They suggested that all forms of productivity can be broken
down into four sectors! ,
- all human work,
- man-tool work (which requires man to guide and power simple
tools), , ; y '
- man-machine work (which requires-man himself to guide and feed
machines),
- all machine work.
With the passing of time there is an accelerated movement of work '
from the unknown through the sectors suggested above, to the point where
machines can be programmed to do this work. ,
It is not claimed that figure 2.5 proves anything. ; It is . ' ' ' i;
presented as an illustration of the impact which advancing technology
has on mart's working environment. As new knowledge is gained and new
technology is developed, so more work traditionally done by human:* Will
be done by machines (e.g. telephone operating, building motorcars,n . 1 ' 'v '' ' ■ "flying aeroplanes, bank telling). The advances in technology efiable
this to occur at an ever-increasing rate. „
This impact, in the context of computer technology, has been
described as follows:
'The unparalleled advances i'n management information technology in the past half decade are bringing wholesale
, 45 '
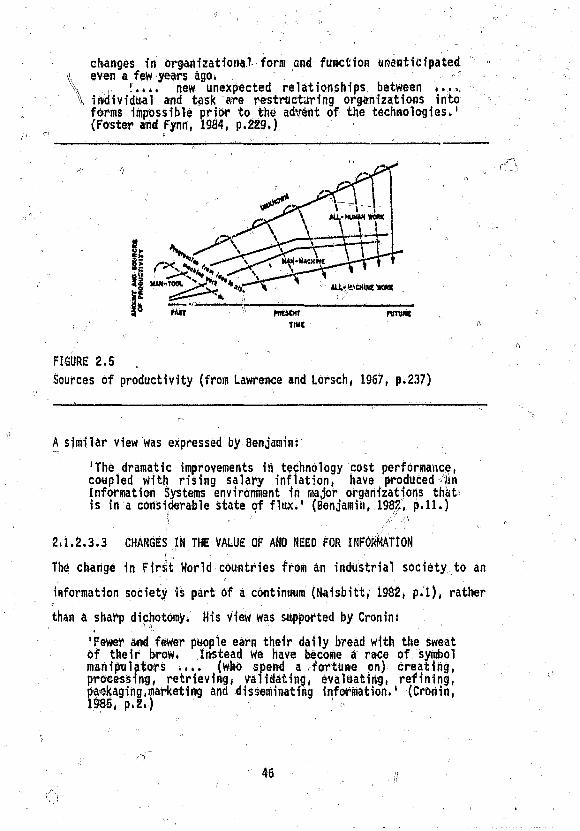
changes in organizational form and function unanticipated even a few years ago.
\ n 1.... new unexpected relationships between .... \ individual and task are restructuring organizations into
forms impossible prior to the advent of the technologies.1 {Foster and Fynn, 1984, p.229.)
FIGURE 2.5 „
Sources of productivity {from Lawrence and Lorsch, 1967, p.237)
A similar view was expressed by Benjamin:
‘The dramatic improvements in technology cost performance, coupled With rising salary inflation, have produced an information Systems environment in major organizations that is in a considerable state of flux.' (Benjamin, 1982, p.11.)
2.1.2.3.3 CHANGES IN THE VALUE OF AND NEED FOR INFORMATION■ f , -•
The change in First World countries from an industrial society to an
information society Is part of a continuum (Naisbitt, 1982, p.l), rather
than a sharp dichotomy. His View was supported by Cronin:. ■’ ■ 1 ‘Fewer and fewer people earn their daily bread with the sweat of their brow. Instead we have become a race of symbol
( manipulators .... (who spend a fortune on) creating, processing, retrieving, validating, evaluating, refining, packaging.marketing and disseminating information.‘ (Cronin,1985, p.2.)
■■ ' - . ' ■*- ■ '■ ■ ■ \ - 'While this move away from the industrial'society focuses sharply
on the value of and need for information, this is a passive standpoint
compared with the aggressive dimension introduced with the idea of using
information as a competitive weapon (McFarlan, 1983; Stodel, 1985;
Yourdon, 1986, p>138; Henderson and Treacy, 1986)* Using information
in this way introduces at least three circumstances which contribute to
the job turbulence in the I.St industry.O ' . 1 '
- new types of systems, with increased complexity and less
structured formats, need to be built (Bahl and Hunt, 1984, p.121;
Friedman and Cornford, 1989, p.339);
- the environment and resources for providing information become
key issues, and stress is increased in the personnel through Whom' s) '■ . >ir' . ■
the information is produced (Ivancevich, Napier and Wetherbe,
1983, p.78).
- old methods of building systems, like following the traditional
systems development life cycle, are becoming obsolete (Bahl and
Hunt, 1984, p.121; Langle, Leitheiser and Naumann, 1984, p.274;
Spock, 1985, p.111).
. ■ * - r< ' -
I ' I r, ■■ ' -2.1.2.3.4 CHANGES IN COMPUTER-BASED SYSTEMS BUILDING METHODS 1
Now systems building methods are widely demanded (e.g. Langle et at*,
1984, p.274; Bahl and Hunt, 1984, p.121; Seagle and Berlardo,
1986, pi12; Dickson and Wetherbe, 1985, p.344; Spock, 1985,• \ / 1 p.Ill)* Three approaches which appear to have gained support
47
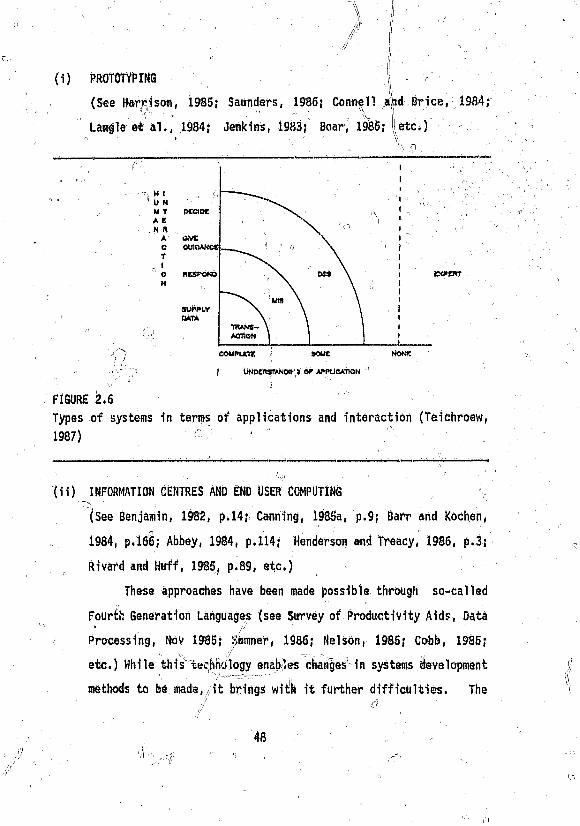
(1) PROTOTYPING
FIGURE 2.6
Types of systems In terms of applications and interaction (Teichroew,
1987) °
INFORMATION CENTRES AND END USER COMPUTING
(See Benjamin, 1982, p.14; Canning, 1985a, p.9; Barr and Kochen,
1984, p.166; Abbey, 1984, p.114; Henderson and Treacy, 1986, p.3;
Rivard arid Huff, 1985, p.89, etc.)
These approaches have been made possible through so-called
Fourth Generation Languages (see Survey of Productivity Aids, Data
Processing, Nov 1985; iiumner, 1986; Nelson, 1985; Cobb, 1985;
etc.) While this iecJvn'Jlogy enables chaiii|e in systems development
methods to be tirade,/it bi-ings wiilk it further difficulties. The
,./ . d '
(i‘ D
48
appropriate method for building each system must be identified (Canning,
1984b, pp.3 and 4; Sweet, 1985a, p.140), as it is unlikely that one
approach will be suitable for all applications. However they are used,
they force changes in the responsibilities of, and the skills required
by software developers. \
(iii) COMPUTER-AIDED SOFTWARE ENGINEERING ,
A third system building riethod which will influence the skills
required by the systems developer (of the future is based on software
tools which combihe word processing with graphics (and sometimes code
generating) facilities, These design tools help ensure that systems
are careful built and thoroughly cross-checked for completeness, while
they provide the facility for design experimentation Without generating
volumes of paperwork. By automating the routine systems development
tasks they allow developers to concentrate on meeting user requirements
without the rigidity of the traditional systems development life,cycle
(Flanagan, 1988, pp,20-63). jj
2.1.2.3.5 THE NEED F0I1 I.S. DEPARTMENTS TO ADAPT TO REMAIN VIABLE
While each of the circumstances mentioned above contributes to the
turbulence in the application development environment, a general system
theory ffi0u<3T'Wjas; used to identify a direct link between evolving
computer technology and the turbulence in job activities in application
systems development* his book ‘Living Systems', J G Milbr made the
" \ ‘ I ■ ■following points: \ > m
(i) In order to survive, a living system (like an organization or a
department within a company) must interact with its environment
(Miller, 1978, p.29).
;(ii) Living systems can only exist in certain environments, so change
] across a relatively narrow range within that environment creates
// stress within the system (Miller, 1978, p.18).
^(iii) Certain processes withi| a living system are necessary for life
and can be ca11ed criticii1 subsystems (Miller, 1978, p.32).
(iv) The development of information and logic processing Machines
provides artifacts on which critical subsystems rely (Miller,
1978, p.33). Of the 19 critical subsystems of an organization
listed by Miller, at least eight of them (40%) have been
identified as having a computer as a possible artifact (Miller,
. 1978, pp.606 and 607).' //
Change, therefore, in computer technology will create change
in the environment and in the artifacts of critical subsystems of'' . 4 'j\ >■
organizations. Once these changes di^tirb the steady state of
the system, stress is produced Within tl.- system. To avoid the
change and associated stress caused by moving the system away from
a desired steady state, the system may alter itself to remain
viable. Vickers (quoted by Miller, 1978, p.37) suggested that an-i ° . P , '•
organization may learn new skills or reorganize itself to help " v !' 1 !|
ensure its survival. In this way, changing computer technologyi . 1
is forcing I.S. departments to adapt by reorganizing and
developing new skills. Unless this is done, departments run the
risk of not remaining Viable (see figure 2.2) ,
2.1.3 INPUT TO THE ROLES/SKILLS MODEL „
One of the two conceptual models &f future systems analysts' skills
built in this study was constructed purely from a detailed review of the
literature. In the first of three steps taken to build the
roles/skills model, all the associations were identified which the
future systems analysts are expected to have with their environments
(see section 6.1.1). In the/second step, the roles which a future
systems analyst will be expected to perform within these associations
were determined (see section 6.2.3). Finally the skills required to
function effectively within these rotes were linked to the roles. This
was'regarded as the roles/skills model (see figure 6.2).
For logistic reasons the specific literature review which was
required to build this model is detailed in chapter 6.
' !l i s
2.2 PRIOR RESEARCH ,,
Recognizing and evaluating important ^rior research is both part of the
background to the current study and, in a sense, part of the literature
survey. Before identifying their limitations in the context of
building a skillsrprofile for the future systems analyst, a brief
description will be given of relevant prior research.
' ' " V ■ „ ! - ,2.2.1 DESCRIPTION OF PRIOR RESEARCH ” j - „ \
Although little work in the sphere of actually identifying the skills
profile of the future systems Analyst was identified in the literature,
there was evidence of notable rosearch which had been done in related
areas. To assess the impact of each of these studies on the current
research, they were grouped into the following categories:
- studies which suggested the structure of university syllabi;
- efforts to identify the skills required by I.S. developers;
- attempts to identify the role of the systems analyst in the future
of I.S. development;
- research in the South African context..
After describing each study briefly, the contribution it made to
the current research will be identified and any limitation in the
context of identifying the skills profile of the systems analyst of the
future, will be noted. Jr- j; •,
2.2.1.1 SUGGESTED UNIVERSITY SYLLABI
These studies were included in this section because the expected
activities (and, therefore, expected skills) of the I.S. developers
appeared to have been one of the inputs in determining the various
syllabi. Three curricula were identified in this groups
- the ACM curriculum,;
- the DPM/ curriculum,V. lA ' , "
i , ■ ;) «- a curriculum suggested by T A Pollack.
t; \ "2.2;,1*1.1 " m ACM CURRICULUM (Nwaaaker, Couger and.ittvis,. 1982)
(i)| DESCRIPTION "-4
The curriculum structure was based on the premise that graduates
of the programme would be employed in: rw > ' . . S v ' .
- positions inyclving organizational I.S.fj"
1.1
0
functional areas in organizations
general management positions.
Nunantaker et al. (1982, p.784) wrote:
“The graduate of a professional I.S. program should be equipped to function in an early level position and should also have a basis for continued career growth.'
A list of knowledge and abilities required to work
effectively in I.S. departments was given, and grouped into six
categories of:
people |-)
, models '
systems
computers
organizations „
society ij
(it) LIMITATIONS
In the context of this research the following limitations were
analyst of the future. ! V
The skills listed did not concentrate exclusively on systems 11
identified:
The objective of the study was to make recommendations for
an I«S. curriculum. Obviously, /therefore, its focus was
not; specifically on the skills required by the systems
- Because of the roots of the study and characteristics of the
^ i input documents used, there was the possibility that the
\ , conclusions reached were influenced by the computer science
' paradigm- This paradigm may not be totally appropriate in
the I.S. environment.
- Among the reasons given for attempting to design the 1982
curriculum was that technology had evolved and I.S. analysis
and development processes had improved since the,1970's
. when the previous syllabus was suggested. Further advances
have been made in both technology and development processes
wsince 1982, so perhaps the ".onclusions again need to be
reassessed.
2.2.1.1.2 THE DPMA CURRICULUM (DPMA, 1985)
(i) DESCRIPTION I " ’
The objective of the curriculum was given as: 0
'To develop national educational standards for the discipline of Computeur (sic) Information Systems (C.I.S.) for the time frame 1987-1993.' ,(NOTE The working papers were not paginated.) J)
° ■ / ' '. • t \ VThe version of the curriculum, therefore, was an update of
the 1981 edition (DPMA, 1981). It was compiled following two
national conferences and multiple Regional conferences and
committee meetings. The teaching objectives were established in
the light of technical considerations (broad predictions on the
evolution of computer-based technology), general teaching concepts
(ideas on how to teach this subject) and the general background
■ 54 - ° . • 'A .
I
o need for personnel to qualify as entry-level C.I.S. professionals.
The curriculum was planned for a four year degree.
(ii) CONTRIBUTION , ■
The following positive points Influenced steps taken, and
decisions reached, in the current research:
- The DPMA curriculum was aimed at an appropriate time-frame
and took cognisance of the main thrusts of the evolving
computer technology.
- An opinion-seeking questionnaire was used to solicit
reaction to the proposed syllabus from practitioners and
academics. 11 ,
- In the context of the curriculum, specific skills were
mentioned and used in section 6,3.
(fii) LIMITATIONS ^ ,
As in the case of the ACM curriculum (Nunamaker et al., 1982), the
goal of the DPMA research was to build a curriculum and not
specifically to identify the Skills Of the systems analyst of the
future. Consequently, while the material was used as input to
the roles/skills model built in section 6*3, this inputVa^
inevitably limited.
2.2.1.1.3 BUSINESS INFORMATION SYSTEMS CURRICULUM FOR LARGE COMPUTER
USERS (Pollack, 1981).
(i) DESCRIPTIVE,.} . /
In partial fulfilment of the requirements for a PhD degree,
Pollack presented the rationale, design and assessment of a- I ■ r ■
business I.S. curriculum for large computer users. Besides a
iterature survey, data were collected/from 21 large IBM computer
users in the metropolitan Pittsburgh area to design the proposed
curriculum. An opinion-seeking questionnaire was sent to a small
group of educators, curriculum experts and business personnel to
help evaluate the suggested syllabus. Pollack claimed that the\\ r(,<j curriculum developed in his study was sufficiently solid to be
implemented, tested and refined in/a four year undergraduate
■ /programme. ji
ij(ii) CONTRIBUTION It
II ‘ \Two points are noted in this section:
- This study, like the DPMA, 1985, research, reinforced theV ft -
value of the opinions of I .S. industry practitioners iii
• l| ", establishing the skills required ij- tha industry.
Details of the syllabus content indicated skills which were
required by entry-level I,S. personnel. These Were used in
building the roles/skills model in section 6.3.
(iii) LIMITATIONS j)
Besides having a different objective, the main limitation of
56
Pollack's work was the small sample population used both to design
and evaluate the curriculum. furthermore, it was unfortunate“ -• ft
that the replies to the opinion-seeking questionnaire were
processed in terms of percentages rather than more sophisticated
statistical methods (see Siegel, 1956). f ) ,,
2.2.1.1.4 ° THE SELECTION Of SYSTEMS ANALYSIS AND DESIGN TOOLS, AND
TECHNIQUES (Aukerrnan, Schooley, Nord and Nord, 1969). „
(i) DESCRIPTION
In this article a case was Bade for educational institutions not
only to be leaders in innovation, but that educators also attempt
to prepare students to perform tasks effectively and efficiently
by using the methods and procedures currently being used in
industry. The article reports on a study which was designed to
provide information which might lead to a more efficient way to
construct a learning environment for the education of systems
analysts. Questionnaires were sent to selected systpms analysts
and selected academics to ask them to rate a list of 35 analysis
and design techniques, and to rank the importance of 6 possible
systems analyst job functions. Responses were received from 98
academics (47% return rate) and 183 systems saa’iysts (37% return
rate). ~ V:
(ii) CONTRIBUTION ('" ■ ■ ^ , r ' \ ■
This article contributed in two ways to the approach taken in this
r, study: . < - ’ 1 P ;i ^ ’
' ' - V .
’ n 57 .
- Title authors provide a list of analysis and design techniques" u 1 '' - <’
which systems analysts can be expected to Use (see section
- 7.3.2.10). ' '
- The job functions listed in the article support the
; definition of systems analysis used in this research (see
section 2.1.1*4). _
(iii) LIMITATIONS n .
. . . " '■ Q " " ' \\It 0 Unfortunately this article presents the findings of the
researchers from a shallow base. No indication is given on how
the questionnaire was constructed, on how the sampling was done,
on the statistical procedures used to identify the differences of
opinion and, only two references were made to the literature.
These limitations detract from the value of the report as a
contribution to the current study
. ' ‘ i . i‘ '
2.2.1.2 I.S. DEVELOPERS' SKILL IDENTIFICATION
A number of studies have been conducted which attempt to identify the
skills required by various categories of personnel in the I.S. industry.
Eight studies are evaluated in this section!, .
2.2.1.2.1 GUIMARDS (1980) '
(i) DESCRIPTION
T.his research appeared to have the objective of identifying
systems analyst skills without grouping them into mutually
exclusive categories with some identifiable linear relationship.
Guitnaraes claimed there were at least two basic differences
58
between his approach and other attempted skills definitions.
These were:
- firstly, he uniquely used the phases of an application life ’
cycle as the basis for grouping skills; ,
- furthermore, within each phase he identified a hierarchy of „
| appropriate skills, with the subordinate Skills established \
as the functional prerequisites of the higher level, target
skills* -
(ii) CONTRIBUTION " ° X ~
There were four specific contributions which Guimaraes1 work made
to this research: 'X .
- Stimulus was given to this research through the ides that J
greater computer utilization is prevented primarily through '
a shortage of properly trained staff rather than
deficiencies in equipment performance. „ r
- Guimaraes suggested that the complexity and variety of(< ‘‘ ' "
activities performed under the title ‘systems analysis and
design1 no longer allow for a 1do-it-al1 systems analyst1.
. This suggested that 'systems analysis' is a role which may
be performed by more than one person. This idea was used
in section 7.4.3. '
- The concept of grouping skills together in hierarchies was
used throughout chapters 5 and 6 of this study.
- Specific skills mentioned in Guimaraes1 paper were used to
build the roles/skills Model in section 6.3.it ■ "
■ v 59 „ -
(ii'i) LIMITATIONS „■s . ft
The following limitations of Guimaraes1 work were noted:
- Because -the systems development life cycle is likely to be
changed by the evolving technology (see section 2.1.2.3.1),
it was unfortunate that this formed the basis for his skills
groupings.'V-'1 -
- Guimaraes did not test his findings with any empirical
_ research. Doing this Would have added a dimension of
credibility to his results.
- No attempt was made in Guimaraes' work to define 'a skill'.
Sometimes he used a compound word 'competency/skill', but he
also used 'knowledge of' as if it were a skill (e.g.
, knowledge of general systtirs theory or charting techniques
or file oriented languages).
2*2.1.2.2 CHENEY AND LYONS (1980)
(i) DESCRIPTION
The study by Cheney and Lyons identified some of the employment
trends and skill requirements in the I.S. industry. They
reported on the perceptions of 45 I.S. managers from 32 large U.S.
organizations. Data on workforce projections and perceived job
skills required by programmers, systems analysts and DP Managers
Here gathered via personal interviews and questionnaires. Part
of their study involved the ranking of specific skill areas in
terms of the systems analyst's job* <
1 ' o r~-' ' ". w
60
(it) CONTRIBUTION I
The following points from Cheney,-and Lyons were used in this
research:
- They made the point that the I.S. industry is going through
a transition which may result in much Of the work currently
being done by computer professionals, becoming unnecessary.
- They claimed that if more certainty could be established in
the type of skills required by the I.S. industry, this would
aid staffing positions in the future (see section 1.7.4).
- Although reference was made to the ACM clustering of I.S.
skills, the authors showed the value of exploring other
patterns of skills groupings (see section 7.2.1).
- Specific skills identified in their work were used in
building the roles/skills model in section 6.3.■ ' I > ; ' "
_ ~ Cheney and Lyons also demonstrated the value of using the
?. opinions of practitioner's in identifying i.S. skills' , 1 i , ' 1 • •
requirements.
' ' ' J)
(iii) LIMITATIONS '
The limitations of their study were found in four areas:
- The sample size of 1.5. managers on which the conclusions
were drawn was small. Although the authors argued to the.. . i1/ ■
, contrary, this could have biased their findings.
- The statistids used to process the opinions of the
irespqnddifits would have been nidrs appropriate for interval
rather than ordinal data (see section 3.6.1).
' , ' ■ 61 ■" . . ■ ' ’ '
- - ' ■■ b , -
- this study was completed in 1980, so it could be argued that
the experiment needs to be repeated to ensure that the
- „ findings have root baen invalidated by recent changes in the
application systems development environment (see section
2.1.2.3). ^
- No indication was given of the source of the list of skills
Which the participants in their study were asked to rank.
> There is the possibility that significant skills were
omitted from this list.i
1.2.3 BEN8ASAT, DEXTER AND MANTHA (1980)
DESCRIPTION
While a number of hypotheses were tested by Benbasat et al., the
objective of their study (called 'retrospective reconstruction' by
Vitalari, 1985, p.221) was to identify skills perceived as useful
by I.S. managers and systems analysts in I.S. departments at
different levels of maturity. The list of skills sent to the
participating companies was based on the 1972 ACM curriculum.
Incorporated in this list were changes recommended by the MIS
Research Center, University of Minnesota. The augmented list was
regrouped into 'generalist' and 'specialist1 categories. Data
from the 35 respondents to the questionnaire were Used to test the
hypotheses. The researchers concluded that, irrespective of the
I.S. department's level of maturity, generalist skills were
perceived to be moire useful than specialist skills.
62
The research of Benbasat et al. influenced the current research: ' ' . ' „ '> fi ■ ' in three specific ways:
-- Thera was further evidence of the value of using mailed
questionnaires to collect the opinions of I.S. practitioners
concerning skills required in the computer industry. f . ■ . a
- The researchers used the concept of sending questionnaires
to a senior member of staff in an I.S. department, with a
request to distribute the questionnaires to systems analysts
within the department for completion. This approach was
used in this research (see section 4.2.3).
- The concept of a 'performance1 skills cluster quoted from a
report by the University of Minnesota MIS Research Center,
was used in chapters 5 and 6 of this research.
- These researchers identified a method to differentiate
between more or less mature I.S. departments (and found
that a relationship appeared to exist between
o genera-Iht/special ist skills and these levels of maturity).
This method w&s used when identifying factors which
influence the skills mix required by future systems analysts
(see section 7.5.2.1).
" ’ I ■ ’ '1 11
(iii) LIMITATIONS
Three limitations of the research by Benbasat et al. wereIi 1 '
identified: .. , f)
- Although the response fate to their mailed questionnaire was
(11) CONTRIBUTION n
63
high (66%), the sample si ire was small.
- The ordinal data collected in response to the questionnaire
was processed using parametric statistical procedures (see
section 3.6.1). 0
- The findings were based on data collected before 1980. In
the light of changes in the I.S. environment in the past
decade (See section 1.3.2), a case could be made for not
relying too heavily on their results until the experiment is
repeated in a contemporary setting.
2.2.1.2.4 HAROLD (1983)
(i) DESCRIPTION ;
Harold asserted that although the body of knowledge relevant to
some categories of I.S. personnel (viz. I.S. manager and senior
programmer) were well represented in term of examinations offered
by Various certification programmes, this was not so for the
systems analyst. ,
As a preamble to a questionnaire on the subject, therefore,
Harold outlined the history of initial steps taken towards
finalizing a systems analyst certification programme. He
included details of the current (1983) position of this programme
and provided an outline of its committee's recommendations.
(ii) CONTRIBUTION
The contribution which this article by ftarold made towards this
research falls into three areas. These-are:
II .... ,
64
- - He reinforced the evidence that a lack of consensus exists
on the body of knowledge fundamental to the systems analyst.
- He emphasized the importance of snaking a clear distinction
between ‘knowledge’ and ’ability/skill1.
- Ho detailed specific skills required by the systems
analyst, particularly those that are systems development
life cycle and development methodology independent.
(iii) LIMITATIONS' r
Obviously the value of Harold's work will be limited until the
findings of the questionnaire he distributed are known.
2,2.1.2.5 VITALARI (1985)
(i) DESCRIPTION
Vitalari investigated the characteristics of the practicing system
analyst's knowledge base* He claimed his approach differed from
previous studies in two ways, These differences are:
- the, study focused on the knowledge used by systems analysts
in the requirements 4eteriniȣtion phase of systems
development (and did not attempt to identify general skills
required throughout the systems development life cycle);
- the view of the systems analyst's knowledge base was
. assembled from an evoked set of knowledge categories, taken
from the problem solving transcripts of the 18 experienced
systems analysts who participated in the study.
Although Vitalari admitted that the results of his research
- „ Vs '■ Qwere exploratory and must be regarded as preliminary, his findings
provided: o
- a list of knowledge categories^ which both high- and
low-rated systems analysts used in solving problems;
-i an indication of some differences between high- and
low-rated systems analysts in terms of their attitudes to
their application development environment.
(iii) CONTRIBUTION
In spite of its totally different objective, Vitalari's research
made a contribution to the current study in the following areas:
- he criticised lists of skills which have not been based on
empirical data;
- he provided an evaluation of earlier work done in the area
of systems analysis skill identification.
(iii) LIMITATIONS
Besides the obvious limitation that Vi talar (attempted to identify
a systems analyst's knowledge-base and not a set of systems
analyst skills, his work has limited value in the context of this
research, because:
y it concentrated on current (1985) systems analysis
. activities;
- it was confined to the requirements definition stage
of systems development. -
2.2.1.2.6 CKOCKi-R (1984)
(i) DESCRIPTION »• '
Cwker's study wac concerned with the work experience received by
Icing systems, Analysts (in the U«K.) and the formal training
tMf were given. After attempting to gain the support of the
computer -installation managers, Crocker asked them to distribute
questionnaires on the subject to their systems analysts. The
■'fj questionnaire comprised a list of 110 skills drawn from the
literature or>/systems analyst training, skilly and techniques*’ - ■■ ■/' ,J) "
Those participating Were asked to indicate which of these skills
, they had used during the previous two years. Eventually 52
organizations returned a total of 256 completed questionnaires
(34,6% response ral;s). These data were analyzed using simple
percentages, because the responses did not meet the criterion of
being statistically random.,
From these replies Crocker found that 24 skills from the
list were used by a minimum of 40% of the respondents.
(ii) CONTRIBUTION \
Obviously the skills which Crocker identified as relevant to
systems analysis were used as input to the roles/skills model in
section 6*3. The description of the purpose of systems analysis
ajid the stages of systems analysis, helped in defining systems
analysis by establishing the boundaries 6f the task (see section
2.I.1.4).
67
(i i i) LIMITATIONS "
In the context of this current research, Crocker's study had the-
following limitations: /
- the terms 1 systems analyst' and 'skill' were not clearly
defined;
- the study Was confined to skills used to perform current
(and not future) systems analysis; -
- processing the data only in terms of percentages detracted
from the value of the study;
- there was no clear indication of the extent to which the
identified skills were required; r, „
- when compared with other lists of systems analyst's skills,
,‘P significant groups of skills were missing from Crocker's
U study (see section S.3.1). !
, \ \ V ; - „ ■
1 2.2.1.2.7 BOON (1986)
(i) DESCRIPTION ^
The objectives of Roon's paper were to:
- sketch the changing I.S. environment;
- attempt to identify the education, training and skills
required in this changing environment;
j,- identify ways of providing Interesting career paths to I.S. j ■ ii ri . personnel which would limit skill obsdlescencei' •> u'.d 5
1 Roon predicted a shift in the knowledge required in the I.S.
industry away from purely technical areas, to basindjs orientated
areas. If the prediction proves to be correct, it if 11 result in
an increased demand for I.S. personnel with commercially-based
skills.
° " /' - . ■ ,
(ii) CONTRIBUTION
The value of Roan's paper was that he confirmed the increasing
significance of a commercial background for future systems
analysts.
(ill) LIMITATIONS . , •
The subjective conclusions to which Roon came tended to be
non-specific and were not supported By any empiricavxtesting.’ ''' .•<
- - \ ^
2^2.1.2.8 JENKINS (1986)
(i) DESCRIPTION
The purpose of Jenkins' study was to identify the subject areas
and1 amount of training needed for an entry-level position as a
'business systems analyst'. He made two approaches to a sample
population of 400 I.S. personnel. The participants were
requested to evaluate the importance of a list of 33 skills and
knowledge requirements to entry-level business systems analysts.
A total of 191 replies was received to the first
questionnaire and 125 replies to the second questionnaire. The
skills identified from these responses were grouped into three
categories: 1 /
- proficient
- knowledgeable
69
(ii) CONTRIBUTION
The specific skills mentioned in this study were used in the
building of the roles/skills model (see section 6.3).
,, ^ " >!
(i i1) LIMITATIONS ,
In the context of this research, Jenkins' study had the following
limitations:
- there was no indication of how the participants were
■ selected; { ', ■ ' V Vj ,) r.
- his study was an attempt to identify only current,
entry-level business systems analyst skills;
- although mode scores were used in presenting the results of• ' ! i ■
the study, the data were analyzed using only frequency
counts and percentages, which tended to make the research
appear superficial.
Z.2.1.2.9 GREEN (1989) .y
(1) DESCRIPTION
The research is based on the supposition that the systems
development effort depends to a large extent on how well systems
analysts and users work together. Problems are likely to occur if
expectations on either side are not met. Beliefs about what
constitute systems analysts' responsibilities during systems
development, and what motivates them to perform the tasks
associated with -these responsibilities, can contribute to
unfulfilled expectations and degraded systems development success.
The purpose of this study was to try to identify if there are
perceptual differences between systems analysts and users about
how systems analysts perforin their jobs. "After conducting two
pilot studies, a questionnaire was constructed which provided the
respondents the opportunity to rank the importance of 21 systems
analyst skills, and 20 possible job roles. These questionnaires
were distributed to 70 companies which agreed to participate iii
the study, with a view to ascertaining both users' and systems, [j '
analysts' opinions. A total of 872 replies were received frow 62
companies (471 from systems analysts and 401 from users). These
data were processed in this research.
Significant differences were observed in the perceptions of the
two groups. It could be demonstrated that the users placed more
emphasis on the technical skills of the systems analyst, while
from their perception, the analysts placed a higher value on the
need for interpersonal skills. „
CONTRIBUTION
Through his research, Green adds credence to a number of
approaches on which this research wau based. In summary fora,
these are: ^
- establishing a link between the systems analysts' roles and
skills, u concept used in the building of the second
conceptual model in this study (see section 6.3);
- providing specific input to the systems analyses' roles
identified in the literature; Jhr'j ')' ■ ' Y ' y ■
- providing a list of 21 appropriate systems analysts' skills
and a definition of each ski 111 listed; ,,I - ■ '
- providing an example of research which was based on data- I ■ r—
collected from an unknown sample of systems analysts (se- /
section 4.2*3.4). 5
" ' !(iii) LIMITATIONS
Obviously the main limitation Cf Green's research, in the context
of this study, was that, the objectives set for his study focused
on the current situation and the relationship between users and
systems analysts. His findings, therefore, had to be adapted to a
study of future systems analyst skill requirements.
A second perceived Weakness was Green's use of statistics. It is. --{K.
surprising to find that mean (and not median) icores were used to
compare the opinions of the users and the systems analysts on each
dimension in the questionnaire (see section 3.6.1.1). ,
2.2.1,3 ROLE OF THE SYSTEMS ANALYST IN THE FUTURE
Two articles are grouped in this section. Both provided input to this
research but, unfortunately, both tended to be superficial*
/ i
? 2,1.3.1 MARTIN (1983)c "/ "
(i) DESCRIPTION
A theme recurring throughout Martin's book,was that a higher level
of automation Is needed in developing I.S. applications. Because
the technology is available to achieve this, major changes are
being experienced in a broad spectrum of I.S. job categories.
Referring specifically to systems analysts, Martin wrote:
•Perhaps the most important point to make is that in : most corporations there needs to be a total change in -
< many svstems'-onalysts1 jobs.1 (Martin, 1983, p.332).
This change, Martin claimed, demands a frame of mind that is
\ freed fro* the techniques of tt»r$«st» It requires constant
i search fo!’ better ways of building systems. Besides identifying
aspects which influence what he described as the new role of the
systems analyst, Martin listed a range of specialist job
categories which he claimed would develop within this role.
(i
(11) CONTRIBUTION
In some ways this book (and especially the chapter on the changing
role of the systems analyst) can be regarded as the catalyst which
motivated this current research. It was felt that the following
Claims made by Martin needed to be tested? ».
•* that many systems analysts' jobs will change completely?
- that the systems analyst will have a new role in application
systems development; . • '
* that systems analysis is a role and not a person; ,
73
- that the systems analysis role will be sub-divided intc
Multiple specializations.
Each of these claims was confirmed by this research (see
sections 7.4, 7.5 and 8.2.1.2).
The specific systems analyst skills mentioned by Martin were
used in building the third level of the roles/skills model in
section 6.3. What Was of more value;, however, was his perception
of the specific roles \tf,ich a systems analyst was expected to
fill. Martin's ideas in this area were used in the building of
the second level of the roles/skills model (see section 6.3).
(ii) LIMITATIONS
In his predictions oh the changing role of the systems analyst
Martin tended to argue from the specific to the general* This
led to his making certain apparently unsubstantiated statements
(ekg. 'Often, the Information Centre approach is applied on too
limited a scale.' (Martin, 1983, p.332), or ’When -applications can
be implemented rapidly, much of the need to study them
disappears.' (Martin, 1983, p.335). So, while in this chapter-
Martin made one of the few documented attempts to identify the
changing role of the systems analyst, the new job responsibilities
he envisaged were not carefully defined, nor were his opinions
rigorously tested.
74
2.2.1.3*2 MEISSNER (1986) , _
(1) DESCRIPTION - r ",
In spite of the title given to this article, the changing role of
the systems analyst was mentioned only towards -the end of the
article, and then not totally in context. The objective of
writing the article was neither stated nor clear.
(11) CONTRIBUTION
Meissner added momentum to the idea that systems analysis consists
of multiple roles which could be performed by more than one
individual* He emphasised the significance of careful thought
processes as a systems analysis activity and the importance of a
good rapport with the user of the system as an integral part of
successful systems development. The systems analyst's roles which
he identified were used in building the second, level of the
roles/skills model in section 6*3. '
(iii) LIMITATIONS ,
The title of Meissner's article was misleading in that only a
Small section had a direct relationship to the changing role of■ ' J'S - - ■
the sy«*“"* Analyst. The value of his other perceptions to the
I.S. industry'wsre limited and usually without rigorous supp<St%fve
evidence (e.g. 'The most effective role for us as systems analysts
is to bs an enab'ier.1 (Meissner, 1986, p*14), 'The real basis for
professionalism is not data, expertise, titles or degrees. It is
wisdom, not knowledge.' (Meissner, 1986, p.13).
2.2.1.4 RESEARCH IN THE SOUTH AFRICAN CONTEXT >
The only study in the South African context which could be regarded as
relevant to the current research was work done by the National
Productivity Institute (NPI) for the Computer Society of South Africa in
1982/3 on the manpower training and development needs of the South
African computer industry (NPI, 1983). | .
This report added momentum to this study by identifying the
shortage of systems analysts in South African organizations and the need
to correct this situation.
Although the authors of the report recognized that the mix of
skills required by the (systems) analyst is changing, two points were
rioted:
(i) The reason for this change was cited as the increased use of
on-line systems. This has been identified as only a small part• \\ .
of the changing I.S. environment (see section 1.3.2).
(ii) As a consequence of the constraints of the terms of reference of
the NPI project, their recommendations did not include any details
of-systems analysts' skill requirements.
2.2.2 SUMMARY OF LIMITATIONS OF PRIOR RESEARCH
In the context of identifying the skills profile of the systems analyst
of the future, prior research in this and closely related areas, was
found to have the following limitations:
76
2.2.2.1 MOST OF THE WORK WAS DATED ^ *
Some of the studies were done in the late 1970's and early 1980's and,
Consequently, now tend to be dated (e.g. Nunamaker et al., 1982} Cheney
and Lyons, 1980; Benbasat et al. 1980.)
2.2.2.2 FUTURE SKILLS WERE SELDOM IDENTIFIED
The objective of some of the prior research was to identify CURRENT (and
not FUTURE) systems analysts' skills (e.g. Vitalari, 1985; Crocker,
1984} Jenkins, 1986; Green, 1989). , ,
" ' |!
2.2.2.3 SOME FINDINGS WERE SYSTEMS DEVELOPMENT LIFE CYCLE BASED•( '' '
Some of the prior research grouped systems analysts' skills into
categories based on the traditional systems development life cycles
(e.g. Vitalari, 1985; Guimaraes, 1980).
2.2.2.4 CLEAR DEFINITIONS WERE SOMETIMES LACKING ,
Terms central to the research (e.g. 'skill', 1 systems analyst') were not
always clearly defined. This led, for example, to the use of the
phrase 'knowledge-of' as if it meant 'skill' (see Guimaraes, 1980;
Crocker, 1984.)
f\ " '
2.2.2.5 THE WHOLE SYSTEMS ANALYST JOB WAS NOT ALWAYS RESEARCHED
Vitalari (198S) confined his research to just the requirements
definit|on tasks of systems analysis.
77
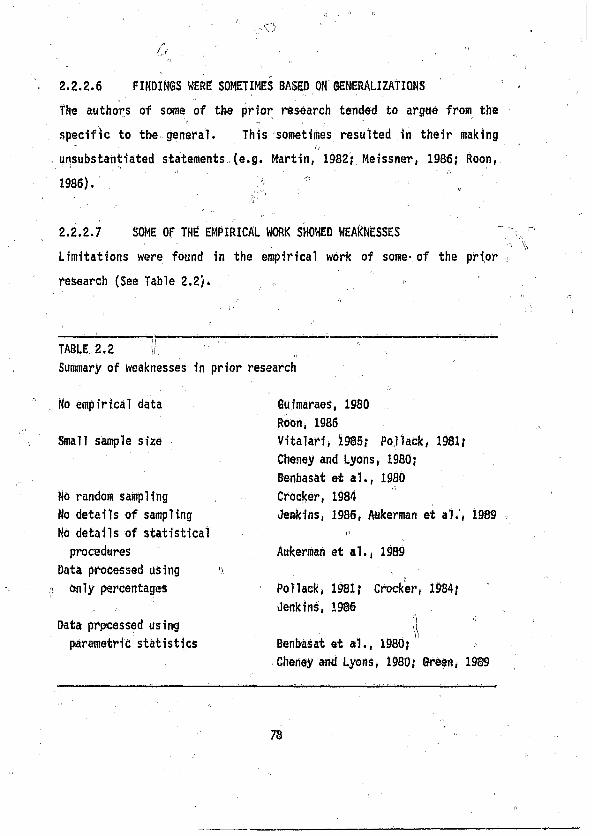
2.2.2.6 FINDINGS WERE SOMETIMES BASED ON GENERALIZATIONS ’
The authors of some of the prior research tended to argue from the
specific to the general. This sometimes resulted in their making * . ' ' 0
unsubstantiated statements (e.g. Martin, 1982? Meissner, 1986; Roon,
1986). a /
2.2.2.7 SOME OF THE EMPIRICAL WORK SHOWED WEAKNESSES
Limitations were found in the empirical work of some- of the prior
research (See Table 2.2). : «
TABLE, 2.2 (I.
Summary of weaknesses in prior research
No empirical data
Small sample size
No random sampling
No details of sampling
No details of statistical
procedures
Data processed using
only percentages
Data processed using
parametric statistics
Guimaraes, 1980
Roon, 1986
Vitalari, 1985? Pollack, 1981;
Cheney and Lyons, 1980;
Benbasat et al., 1980
Crocker, 1984
Jenkins, 1986, Aukerman et ah, 1989
Aukerman et al., 1989
Pollack, 1981} Crocker, 1984}
Jenkins, 1986
Benbasat et al., 1980;
Cheney and Lyons, 1980; Green, 1989
78
These limitations in the context of this study provided a- n . , \j ■■
foundation for establishing the characteristics of this research
programme (see section 3.1). ,
2.3 SUMMARY OF THE CHAPTER
The objective of this chapter was to establish the foundations of the
research. .. - -
The first section of the chapter was a review of the literature
which Was presented so that! r
* the theories used as a basis for the research approach, and for
various procedures followed at stages within the approach, could
be identified in context}
- the evolution of the systems analyst task could be followed to
that point when the current turbulence in the systems development
environment demands further changes in the discipline;
- the causes of the turbulence, and the inter-relationships between
these causes, could be identified.
The second section of the chapter Was an evaluation of prior
research, in terms of the objectives set for the study. This section
shows clearly that this research is built on work done in similar areas.
The characteristics of the research approach (detailed in the next'! P'1
chapter) are Influenced directly by the perceived limitations of
previous studies.
CHAPTER THREE ° ^
CHARACTERISTICS OF THE RESEARCH . '
In this chapter a comprehensive account is given of the research methods
used in this study. Based on the perceived attributes of the research,
the reasons for the approach taken are identified and the research is
classified in terms of the Ives, Hamilton and Davis model (1980, p.921).
The boundaries, assumptions and limitations of the research are stated
and the chapter closes with1 a description of the use of statistics at
various stages in the study. . • - ,
3.1 THE ATTRIBUTES OF THE CURRENT RESEARCH
In order to build on the foundations laid by prior research in this and
closely related areas, but to prevent their limitation in terms of the
objectives of this study (see section lv5), this research needed the
following attributes:
- all significant terms had to be clearly defined; 1
-1 focus had to be on the total spectrum of systems analyst job
responsibilities; „
- the skills profile to be identified had to be for the systems
analyst of the future; 1
- the conclusions had to be based on representative, empirical data;
the grouping of required skills had to be independe
traditional systems development life cycles.
it of
3.2 THE RESEARCH METHOD '
The method used to arrive at the conclusions of this research are
described in this section.
3.2.1 THE RESEARCH PROBLEM
The application development industry is in a state of turbulence.
Multiple issues are influencing the type of computer-based application
systems which need to be built and the way that the i\ysterns can be built
(see section 2.1.2.3). Part of this turbulenceJ^changing the role
that the systems analyst is playing in the systems development process> \ -
(see section 1.4). It is suspected that as a direct consequence of
this role changing, the future systems analyst will require a new set of
skills. Against this backgroundr this research was aimed at
identifying the skills profile of the systems analyst of the future.
3.2.2 FACTORS WHICH INFLUENCED THE RESEARCH APPROACH
The approach taken in this study did not follow the pattern of building
an hypothesis from an in-depth literature survey which could be tested
by collecting and analyzing empirical data (e.g. Campbell, 1954, pp.8
and 86). The reasons for this were embedded in the research itself.
The research strategy which had to be taken, therefore, was dictated
entirely by the purpose of the study (see Benbasat, 1983, p.52). This
section identifies those factors which influenced the research strategy,
(i) A STUDY OF THE FUTURE
Because the research attempted to identify the skills required by
the systems analyst of the future, obviously no control could be
3.2 THE RESEARCH METHOD > ( : \
The method used to arrive at the conclusions of this research are■/
described in this section. „
• ' ■ / ' ' " "
3.2.1 THE RESEARCH PROBLE^ a ,". 1/ '
The application developnient|?industry is in a state of turbulence.
Multiple issues are influencing the type of computer-based application
systems which need to be built and the way that the systems can be built
(see section 2.1.2.3). Part of this turbulence is changing the role
t.iat the systems analyst is playing in the systems development process
(see section 1.4). It is suspected that as a direct consequence of, r(i'
this role changing, the future systems analyst will require a new set of
skills. Against;) this background, this research was aimed at
identifying the skills profile of the systems analyst of the future.
3.2.2 FACTORS WHICH INFLUENCED THE RESEARCH APPROACH .
The approach taken in this study did not follow the pattern of building, ' ’ 0 V1 '
an hypothesis from an in-depth literature survey which could be tested
by collecting and analyzing empirical data (e.g. Campbell, 1954, pp.8
and 86). The reasons for this were embedded in the research itself.
The research strategy which had to be taken, therefore, Was dictated
entirely by the purpose of the study (see Benbasat, 1983, p.52). This
section identifies those factors which influenced the research strategy,
(i) A STUDY OF THE FUTURE
Because the research attempted to identify the skills required by
the systems analyst of the future, obviously no control could be
81
exercised'over the environment being studied. This automatically
excluded the possibility of experimental manipulation which is
required in a research which monitors the change of an independent
variable. B
IDENTIFYING FUTURE SYSTEMS ANALYSTS' SKILLS
This descriptive research, which Was conceptual and abstract in
nature, did not attempt to test any specific hypotheses or
establish any relationships between variable groups: in the I.S.
environment. Its purpose was an attempt to build the skills
profile of the systems analyst of the future based on the opinions
documented in the literature, and the opinions of those involved
in the application software development industry (see Kryt, 1983,
p.124). " .
(j ' .' ft
WIDE RANGE OF OPINION . ,
Opinions on what skills will be required by the systems analyst of
the future were expected to differ widely (an expectation which
proved to be correct (see section 5.2.2.1.2)). Because the
conclusions of the research were' based on people's opinions in
this regard, two specific objectives were set:
- data collected would not be accepted at face value;
- steps should be included in the research process which would
help to ensure no significant opinions were overlooked.
To meet these objectives, all Opinions identified were
tested through comparisons* This Was achieved by building two
82

conceptual skills models independently of one another (chapters 5
and 6). The conclusions of the research were reached by
aitelfamating the skills identified in these two models (section
- 7-3-2)- ' J , ~ ... , ■ ' .
r ' ' ' ■ h
(iv) POSSIBLE UNIQUE OPINIONS IN THE SOUTH AFRICAN COMPUTER INDUSTRY ;
To enhance the value of the study, a research objective was set to
compare and contrast the opinions of those who participated in the
empirical study (all members of the South African computer
industry) with the opinions documented in the literature, which is
primarily not South African. Any significant differences of
opinion would be an indication to the South African industry to be
aware of: -
- a possible lack of foresight;
- the possibility that conditions in the local application
• development environment could make the direct importing of
technology into that environment inappropriate.
For these reasons the empirical research was done as
independently as possible from the survey of the literature.
Certainly no attempt was made to reflect opinions identified in
the literature in the dimensions of the questionnaire.
3.2.3 THE NATURE OF THE RESEARCH ,
The nature of the study is set by identifying the paradigm underlying
the research, by establishing the characteristics of'the research and by
classifying the research approach * ■ ,
83
3.2.3.1 THE RESEARCH PARADIGM■ ft ■
Because the study precluded the possibility of exercising any control
over the environment being studied, this research could not follow the
well-defined steps of a scientist conducting a laboratory experiment.
The paradigm used as a foundation of this study was therefore borrowed
from the organizational and social sciences (see e.g. Bailey, 1982 and
Smith, 1981). By taking a lead from Kerlinger (1974, p.379), it was
possible to identify common elements between this research and an ex
post facto study (with the obvious difference that the environment could
not be controlled, not because the phenomenon being studied had already
occurred, but because it has not yet happened).
3.2.3.2 RESEARCH CHARACTERISTICS
As a direct result of the paradigm which formed a base to the study, it
could be established that the research had the following
characteristics:
(i) DUAL OBJECTIVES
The research approach of the organizational science, has received
criticism from some quartern. The following assertion is an
example of this criticism:
'.... the conventional notions of methodological and scientific rigor that have directed research in the organizational sciences have been deficient as guidance mechanisms .... (therefore, the) standards of research rigor, although important to a field's credibility, need to be supplemented by another set of standards relating to the practical relevance or utility of
. research.' (Thomas and Tymon, 1982, pp.345 and 346.)
To help void this criticism, dual objectives were set for
this study. These objectives were: •
- to ensure that methodological rigor was followed (e.g. in
the sampling procedures, statistical processing and use of
deductive reasoning);
- to ensure that the research was practically relevant in
terms of its value to the practitioner in the I.S. industry.
The dual objectives, (one methodological and scientific, the
other practical) made a major contribution to establishing the
nature of the research.
(NOTE: The detailed objectives of the research were stated in
section 1.5.)
(ii) FIELD STUDY
Much of the data used'to establish the findings of tne research
were empirical, collected using a mailed questionnaire (see
chapter 4). The questionnaire was used to attempt to establish
the opinions of members of the I.S. industry on the skills
required by the, systems analyst of the future. This type of
research is what has been called a FIELD STUDY (Kerlinger, 1973,
p.406), or a DESCRIPTIVE STUDY (Bailey, 1982, p.38). Its
\ exploratory nature is characterized by an attempt to identify what
the situation is (or what it is likely to become). In common
with this category of research, no effort was made to identify or
predict relationships between any entities identified either in
the present or future I.S. environment." /' " l
" 8S • *
(111) HYPOTHESIS GENERATING
For the most part, there were no prior hypotheses to be tested in
this research, nor were there validated measures which enabled
specific constructs to be exa-nined. This research was,
therefore, hypothesis generating rather than hypothesis testing in
nature (see Baroudi and Ginzberg, 1986, p.547), and established a
base for further systematic research into the skills required for ^
future application systems development (see section 8.3).
3.2.3.3 CLASSIFICATION OF THE RESEARCH
While the course of the research action, therefore, had to be different
in execution (and interpretation) from that of a scientist who
experiments, a similar approach was documented by Kryt (1983), and in
certain respects, Pollack (1981).
The specific characteristics which influenced the classification
of the research in respect of the model suggested by Ives, Hamilton and
Davis (1980), were:
- it did not involve the use of dependent and independent variables?-, *•
- it did not involve a specific research hypothesis (or hypothesis
testing)}
- it tended to be descriptive in nature. '
These are the characteristics of research which has been
classified Into the Type la category (Ives, et al., 1980, pp. 921 and
922). ' '''
86
3.2.3.4 DESCRIPTION OF THE RESEARCH
3*2.3.4.1 INITIAL STEPS , ,, °' i f ■ /
The initial steps in the research'required tk&Jcem 'system analyst' to
be defined ,t the evidence and reasons,for the skills profile of the
systems analyst of the future to be questioned to be established. The
skills required by future systems analyst were identified by building
two models and combining tl’e skills identified in each.
3.2.3.4.2 THE JOB RESPONSIBILITIES/SKILLS MODEL
The first model to identify the skills required by the systems analyst
of the future was built from empirical data collecced by means of a
mailed questionnaire.
(i) EXPERT OPINION
To ensure the questionnaire dimensions were empirically derived,
the participation of a group of experts in the building and
implementation of I.S. Was solicited. These experts included
both practitioners and academics. Without prior kno% edqe of the
study or its purpose, the experts were sent three open-ended
questions on the skills required by the systems analyst of the
future. To ensure that the most value was gained from their
opinions, the replies received from this first approach were
formatted into a set of structured answers to the original three
0 questions, The same experts were approached again.
This second approach had two objectives. Firstly, to ask//
th'j participants to indicate the degree to which they thought each
dimension was an appropriate answer to the original questions.
The second objective Was to ask the experts if - in their0opinion
- any possible answer to the questions had been overlooked during
the first round of opinion seeking. The replies to this second
approach to the experts were used to build a questionnaire which
was distributed to a large sample of practicing systems analysts.
" n r>'(ii) THE QUESTIONNAIRE
Using the replies from the experts, a questionnaire was
constructed with the following format:
: Section 1 - an indication of the respondent's current job
responsibilities,
- „ Section 2 - a self-assessment of current skills.
Section 3 - a question on methods of building application
software in the future.
Section 4 - a question on the systems analyst's job
responsibilities in the future.
Section 5 - a question on the skills required by the systems
analyst of the future.
Section 6 - a self-assessment of the respondents'
preparedness for working as a systems analyst in the future.
Section 7 - demographic data. ( )
(See section 4.2.2.2.) , „
As a result of a pilot study, changes were made to the
Wording in certain sections of the questionnaire. These changes
made the questionnaire easier to understand and simpler to
88
■ ' ' ■ I J• complete. —
The reliability and validity of the measuring instrument
were established primarily through the logical method of
constructing-the questionnaire, a form of the test-retest approach
and, after the replies were received, by calculating inter-item
correlations (see section 4.3.1).
(iii) SAMPLE
No register of practising systems analysts in South Africa exists. ^ 1 //
Groups of questionnaires were therefore distributed to the I.S., . II 1 • '
departments of a randomly selected sample of companies. These
companies were representative of industry type, installation size
" ' ' ■■ I; - 'and geographic regions. Senior members of the I.S. departments
in these companies ware asked to distribute the questionnaires to
practising systems analysts in their companies.
, ■ jl -
(iv) PROCESSING THE REPLIES 0
The replies received from the practising systems analysts were
processed in three ways:
(a) To establish the representativeness of the respondent
population, the demographic data from the replies were
compared to the demographic data of the replies to an
5 independently conducted survey.
(b) Respondents' opinions were compared to identify areas of
agreement and disagreement. Attempts were made to
establish possible reasons for disagreement.
(c) Areas of agreement were used to build the job-responsi-
, bilities/skills model. This model was one of the inputs
used to identify the skills required by the systems analyst
of the future. ,- ^ ^ : ■. ■■ ■ , - ,
3,2.3.4*3 THE ROLES/SKILLS MODEL r
From surveying the literature it oecame apparent, that systems analysts
are expected to function within different roles (e.g. a problem solver,
a systems specifier, a project team member (see section 6.2.2)). In
order to identify each of these roles, a record was kept of the
relationships, or associations which systems analysts have as part of
their Working environment (e.g. with their managers, users, colleagues).
This list of associations was regarded as the first level of the
roles/skills model (see section 6.1).
The second level of the model was built by deduction. Each
systems analyst role identified in the literature was associated with
one or more of the level 1 associations (e.g. as a fact finter, the
systems analyst will need to be an interviewer, a diplomat^ and an
observer (see tablo 6.2)).
Each skill identified during the literature survey was linked to
the roles in the second level of the model. Then, if necessary, any
further skills required for the systems analyst to perform effectively
within the roles were deduced. This list of skills constituted the
third level of the roles/skills model. ,
There was obviously redundancy and overlapping when these. . ■ . a
associations, roles and skills, were linked. No effort was made at this
90
stage to resolve this, as it was regarded as a step towards ensuring
that no future systems analysts' skill had been overlooked.
'' ■ ‘ , )/ ,3.2.3.4.4 COMBINING THE TWO MODELS ' „ '‘ "r\ -J)
The ski ,!s required by the systems analyst of the future were identified
in section 7.3.2 by combining the job responsibilities/skills model and
the roles/skills model. To minimize duplication and superfluity, and
to help to avoid any omissions, the following steps were taken:
(i) A group of occupational categories used to assist students to
choose appropriate careers was identified in the literature (see
table 7.1).
(ii) By Unking these occupational categories with the verbs taken from
the literature definitions of systems analysis, it was established
that these occupational categories were significant to systems
« analyst activities (see table 7.2). 1
(iii) A factor analysis of the empirical data added credence to the idea
that systems analysis can be defined in t&rms of the occupational
categories (see table 7.3), a
(iv) The skills clustering of previously published research was
compared and contrasted with these categories to identify a group
of ten generic skills clusters (see section 7.2.2).
(v) All the skills iijentified in this study were combined and
classified into these ten categories (see section 7.3.2).
3.2.3.4.5 RESEARCH CONCLUSIONS
Because it appeared unlikely that any single individual would have
91
■' \v/ _ " v
competence in so broad a spectrum of skills, this grouping of skills led
to the identification of a possible new dispensation of job categories
in the 1.5, development industry. Within these job categories
generalist, specialist and essential skills were identified (see section
7.5.2).’
, o '
3.3 BOUNDARIES OF THIS RESEaO H 0
This research specifically excluded the following:
(i) personality Tr aits >
> No attempt was made in this Study to identify any personality
traits or inherent personal capabilities which way be required by
the systems analyst of the future.
(H) KNOWLEDGE BASE•
5 It is acknowledged that skills cannot exist in isolation and that
the effective systems analyst requires a base of knowledge from
which to work (see Vitalari, 1985). No attempt was made,
however, to contribute to the epistemology of systems analysis.
•O ■(iii) EFFECTIVE PERFORMANCE
There was little evidence in the literature of a clear
understanding of the underlying behaviours which harness systems
analyst skills into effective performance (Vitalari and Dickson,
1983 p.949). This research was not an attempt to contribute in
any way to the development of this theme. y
92
(iv) EDUCATION AND TRAINING n
’ While the results of this research will have a direct influence on.. 1 O
what constitutes appropriate training and education for the future
systems analyst, designing such schedules was outside the scope of
0 this study.
3.4 ASSUMPTIONS MADE IN THIS STUDY
The assumptions on Which the research was based included:
- that the respondents to the questionnaire (and, for that matter,
the authors whose work was used) understood the basic terminology
and used words consistently,'
- that the participants in the empirical research would and could
express their considered opinions;
- that the technological forecast on future methods of systems
development were sufficiently accurate not to invalidate the
skills profile based on that forecast;
- that the nature of the work done in small I.S. departments (i.e.
less than ten employees) is inconsistent with the main thrust of
I.S. activity (see section 4.2.3.2).
3.5 LIMITATIONS OF THE RESEARCH
Besides the shortcomings which related directly to the building of the
conceptual models (which are detailed in the chapters describing the * . , . ^
building of the models (see sections 4.3*3 and 6.4)), it was recognized
that this fes'eafch had the following limitationss „
' - - .(i) Hone of the opinions used to build either conceptual model could
be verified by observation. r The study, therefore, was based on
the beliefs of a Small group of practitioners, academics and
researchers. These beliefs and opinions could not be verified or
substantiated by Monitoring the actual performance of systems- 0 ,
analysts (see Vitalari, 1985, p.223).
(ii) The research did not attempt to link the skills identified as
necessary for the future systems analyst with how these skills
would be used by a person who could be ranked as a 'good' systems
analyst. Any attempt to establish an association between these
skills and a level of performance excellence, was excluded from
„ the study.
(iii) Although a stringent effort was made to base the study in
documented theories and prior research, both the building of the
, conceptual models (in chapters 5 and 6) and the establishing of
the skills profile of the future systems analyst (section 7.3.2)
ran the risk of being open to subjective interpretation*
Respondents to the questionnaire and researchers could have been
working from different mental sets. in fact, this limitation
could explain some of the broad spectrum of opinions identified in
both the empirical work and the 1 iterature survey (see Mitchell,
1984, p.70). , ' \
(iv) A significant technological advartce (or a combination of advances)
in the application systems development environment could sharply
compress the estimated timescales in the research. Were the. ■ ' ii
technological advances sufficiently spectacular, some (or perhaps,
- 94 "
0 ' r ,
/;■■ ,i
all) the findings of the research could be invalidated.
3.6 " USE OF STATISTICS
In this section characteristics and parameters of the statistical tests
are identified, and the statistical tests and procedures are described.
The data processed Were the opinions collected in response to the
questionnaire (see chapter 5 and-appendix * L*).
3.6.1 CHARACTERISTICS AND PARAMETERS OF STATISTICAL TESTS
Based on the nature of the data collected, the details of why the
particular statistical tests weve done are provided in this section.
3.6.1.1 TYPE OF TESTS USED
Because the opinions of respondents were reflected on a descriptively
anchored five point Likert-type scale (sett section 4.2.2.2), the data
collected via the questionnaires Were regarded as ordinal in nature
(Siegel, 1956, p.24; Bailey, 1982, p.365; Blalock, i960, p.13). ,
To ensure that the statistical tests used are as powerful as
possible, there is a school of thought which supports the use of
parametric statistical procedures on ordinal data. Typical of this
school is the opinion of Baroudi and Orlikowski. They write:
'•.*.* researchers are encouraged to use the parametric test most appropriate for their Study and resort to non-parametric procedures only in the rare cases of assumption violation1. (Baroudi and Orlikowski, 1989, p.89).
Examples of parametric statistics being used on ordinal data were
found in a wide spectrum of related literature (e.g. Harty, Adkins and
n - [> ' ' -
Sherwood, 1984, p.304? Alavi, 1985, p.174; Ivancevich, 1983, p.802;
> Perez and Schuter, 1982, p.163; Parisian, 1984, pp.46-64).
In this research, however, a more conservative approach was taken.
Following the lead given by a number of authorities, (e.g. Siegel, 1956,
p.26; Blalock, I960, p.188; Drury, 1983, p.63; Alavi, 1984b, p.561;
Bailey, 1982, p.402)* noil-parametric tests Were used to analyze the
ordinal data. This decision had the added advantage of not requiring
assumptions to be made about the homogeneity of variance or normality of
the sample population (see Freund and Williams, 1977, p.361).
3.6.1.2 RELATIONSHIP BETWEEN SAMPLES
In every case that a comparison between group opinions was made, it was
based on the assumption that the groups represented independent samples.
This Was concluded because: |
(i) each sample was drawn at random from different populations;
(ii) there was no evidence that thd samples were related or matched;
(iii) in each case the sample populations were of different sizes.■ ’ > 0(See Siegel, 1956, pp.61 and 95.)
\ „ ' "
3.6.1.3 ' TIES IN THE DATA "p
Some sources claim the presence of a high proportion of ties in the data
result in certain non-parametric tests being invalidated (e.g.
Mann-Whitney U Test (Blalock, 1960, p.201) and Spearman Rank Correlation
(Blalock, I960, p.321). In this research the opinion followed is one
expressed by Siegel. When describing an example of the use of the
O' _ , , ..
Mann-Whitney U Tesit, he writes: ,, V'
'As this example demonstrates, ties (in the data) have ,only a 0 Slight effect. Even when a large portion of the scores are < ’ tied .... the effect is practically negligible.' (Siegel,
' - 1956, p.125).
In spite of the ties in the data, therefore, opinions were
compared using the Mann-Whitney and Kruskal-Wallis tests (see section
5.2).
3.6.1.4 TWO-TAILED TESTS
Because identifying the direction of the differences of opinion was not
of primary concern, in each case two-tailed tests were used (see Siegel,
1956, p.13).
3.6.1*5 , LEVEL OF SIGNIFICANCE
It was noted that there is a restraint on setting the level of
significance too low because the smaller the probability of rejecting
the true hypothesis, the larger the probability of accepting a false
hypothesis, particularly if the sample size is small (see Freund and
Williams, 1977, p.284). To limit any differences detected as being due
to chance to less than 5 times in a 100, the level of significance for
most statistical procedures was set at 0,05. Sometimes it was
necessary to conduct repeated tests on the same data (e.g. when
comparing the opinions of the groups within the sample population).
When this was necessary, it was acknowledged, in spite of Views to the
contrary (e.g. Johnson, 1984, p.502), that the probability of detecting
differences due to chance would increase, so the level of sipificanee
(I
was decreased accordingly, usually to 0,01 (Brownlee, 1965, p.300 and■ M ,
pp.316-318). '
3.6.1.6 DEGREES OF FREEDOM
In each case, the degrees of freedom for the test being conducted Was
taken from the output of the statistical package used (see section
3.6.3)." ■ o . . -
3.6.2 STATISTICAL TESTS ANE) PROCEDURES ' •
Statistics were used in this research in four ways:
(i) Descriptive statistics were used to indicate the location and
spread of the data.
" V' ■■ ”(ii) Statistics were used :o compare the opinions of the experts add
the practicing systems analysts. These comparisons were made per
dimension per question in the questionnaire (see section 5.2).
In each case, the degree of confidence with which the opinicns of
the individual groups could be regarded as representing the
opinion of the sample population, was determined. Consequently,
each person's opinion on each item Was used to determine the
extent to which the groups disagreed on each issue (Alavi, 1984b,i'Y'
p.560).
(iii) The reliability and validity of the questionnaire as a measuring
instrument was tested by calculating inter-item correlations*
(iv) As part of the process of identifying a new set of generic skills
Clusters, factor analysis was used as a descriptive tool.
3.6.2.1 DESCRIPTIVE STATISTICS 1
Besides providing full details of the raw data collected in response to
the questionnaire (see appendices *H1 and 'I'), descriptive statistics
were used to provide an indication of the dispersion of opinions
expressed in the responses. These descriptive statistics included:
- frequency counts,,i-3
- median, upper and lower quartile scores,
- percentage based frequency tables.
Descriptive statistics from all the responses to sections 4 and 5
of the questionnaire are given in appendix 1K ' while important
comparisons and distributions are included in various places in the text
(e.g. tables 5.5 and 5.12). No attempt has been made in the percentage
based frequency tables to ensure that the count sums to exactly 100%.
The figures presented were taken directly from the output from the
statistical package (see section 3.6.3).
3.6.2.2 testing of opinions
The opinions of groups of respondents to the questionnaires were
compared and contrasted. This analysis of variance was done for each
dimension of the questionnaire. For each test:
THE NULL HYPOTHESIS (h o ) was that there was no difference of
opinion between the sample groups (i.e. the groups could not be said to
disagree);
THE ALTERNATE HYPOTHESIS (HI), therefore, was that a difference of
opinion could be identified, and that the groups could be said to
\disagree. , - " - I
Two separate tests Were used to test the hypotheses (and in each
case the characteristics and parameters described in section 3.6.2.1o . '
n 1 . , 'applied).
- The Mann-Whitney U Test was used in each case when the opinion of
2 groups were being compared (Siegel, 1956, p ,116; Vitalari and
Dickson, 1983, p.951? Alavi, 1984b, p.561). ,
- Because of its versatility and that it does not require equal
sample sizes (and in spite of its recognized limitations (see e.g.
Miller, 1981, p.168)), the Kruskal-Wallis Test was used to compare
the opinions of more than two groups in the sample population
(Siegel, 1956, p.184).
3.6.2.3 INTER-ITEM CORRELATIONS
An inter-item correlation was done between all the variables in sections
2, 3* 4 and 5 of the questionnaire (see appendix ’L1). These
correlations were used to demonstrate the reliability and validity of
the questionnaire as a measuring instrumen tee section 4.3.1). The
strength of the relationship between these items of data were indicated
by using Kendall's Tau B (Blalock, i960, p.321; Bohrnstedt and Knoke,
1982, p.296; Hamilton and Ives, 1980, p.10; McKeen, 1983, p.56;
McCall, 1970, p.314; Danziger and Kraemer, 1986, p.231).
3.6.2.4 FACTOR ANALYSIS
It is acknowledged that factor analysis is a parametric stal isti al
process (based on the calculation of r^), and it is conceded that in
this study the sample size (n » 159) tended to be small in relation to
the number of variables processed (m = 58). There is, however,
evidence in the literature of this technique being used in similar
circumstances purely as a descriptive technique, with no inferential
connotations (see e.g. Bailey, 1982, p.353; Ives, Olson and Baroudi,
1983, p.789 and Mahamood, 1987, p.310). A description of exactly how
the technique was used to support a process of identifying new systems
analysts' skills into clusters which are independent from a traditional
or a perceived systems development life cycle, is given in step 3 of
section 7.2.1.
3.6.3 STATISTICAL PACKAGE .
All statistical calculations were computed on an IBM mainframe using
Release 5 of SAS Institute Incorporated's Statistical Analysis System.
3.7 SUMMARY OF THE CHAPTER " 11 ■
In this Chapter the characteristics of the research programme were given
to provide a comprehensive account of the research methods used in this
study.
The attributes of the research were established by building on the
foundations of prior research done in this area and other closely
related areas.
1 The research problem was clearly stated to emphasize the
importance, to practitioners and academics, of knowing the skills
profile of the systems analyst of the future.
fhe factors which determined the research approach were identified
and their influence on the choice of research strategy were noted.
These factors were ultimately the reason for choosing a researchv ; ■'
paradigm from the social sciences and the characteristics of the
research were a direct result of this choice.
Although the research did not follow the familiar pattern of
hypothesis testing, it was possible to classify the study into the Type
la category of the Ives, Hamilton and Davis model (a category into which
29,6% of the research they identified could be placed (Ives, Hamilton
and Davis, 1980, p.921)).
The next section of the chapter was details of the steps followed
to build the two conceptual models and the process followed to identify
the skills profile of the future systems analyst. This was followed by
a description of the steps taken to group these skills into clusters
which are independent of a systems development life cycle.
The chapter clpsed with details of how statistics were used to
analyze the empirical data collected during the study and to support
some of the deductive reasoning in the research. " r
/I 'II !
102
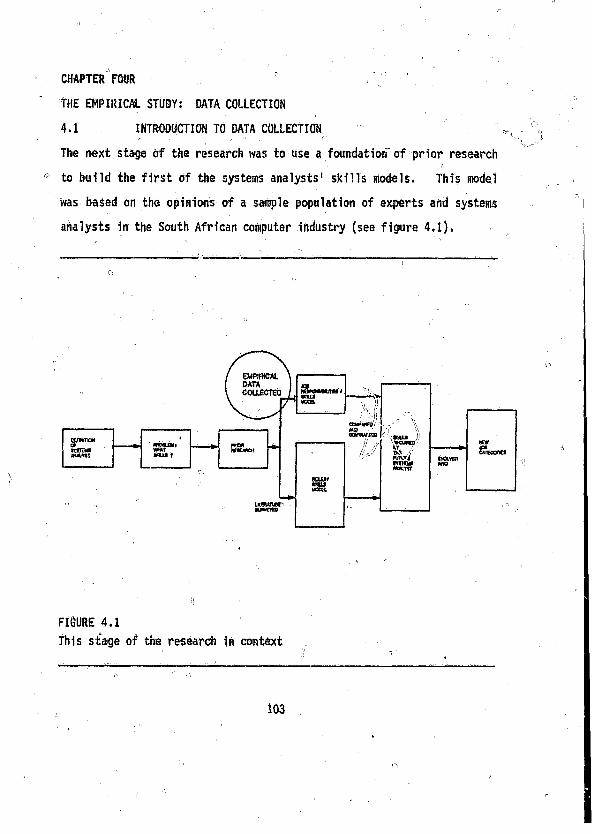
CHAPTER FOUR
THE EMPIRICAL STUDY: DATA COLLECTION
4,1 INTRODUCTION TO DATA COLLECTION
The next stage of the research was to use a foundation of prior research
to build the first of the systems analysts' skills models. This model
Was based on the opinions of a sample population of experts and systems
analysts in the South African computer industry (see figure 4.1).
FIGURE 4.1
This stage of the research in contextiT
103
("1
' . ■ ■ ' ' nDetails will fse given of how the questionnaire was built and
distributed to the saniple population. An effort will be made to
establish the degree of confidence with which the opinions used to build
this model can be regarded as representative* ;
The chapter has two sections.;
- collecting the data,O '
- evaluating the data collection procedures used.
4.2 COLLECTING THE DATA -
The empirical data used in this research was collected using mailed
questionnaires. This section describes:
- the objective of the questionnaire,
- the steps followed in the construction of the questionnaire,
- the structure of the questionnaire,
- the distribution of the questionnaire, ,
- the response to the questionnaire.
The steps followed to conduct this empirical survey^ai-e presented
diagranimatically in figure 4,2.
4.2.1 OBJECTIVE OF THE QUESTIONNAIRE ,
The objective of the questionnaire was to gather the opin.-tons of a large
population of practising systems analysts on the skills required by the
systems analysts of the future.
4.2.2 ‘ CONSTRUCTION OF THE QUESTIONNAIRE
Because the directions Which can be taken in a rapidly evolVi \
' . )< $104 0
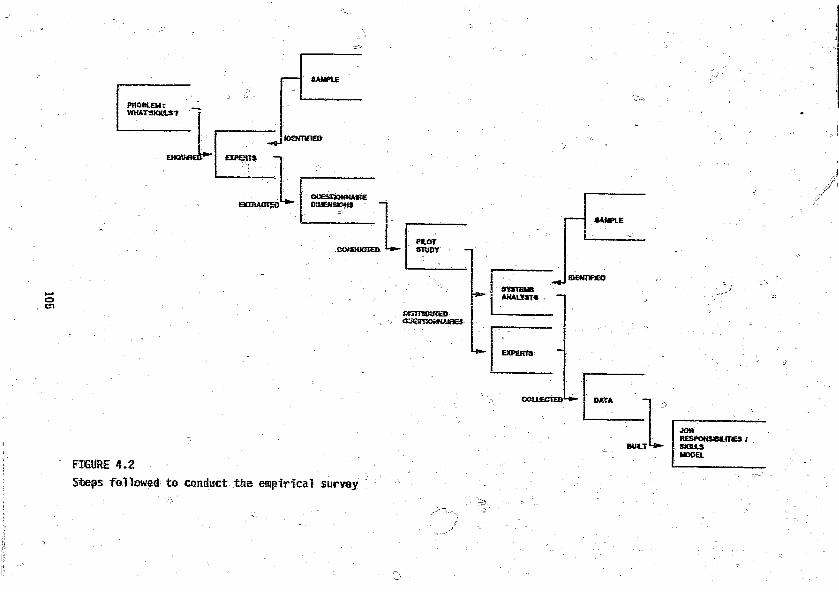
SAMPLE
PflOBLEUtWHATSKJLL37
ENOSmED^" opens —I
FJCIBACTEQOUEStlQMNMREOiUEKStOKS
OCl
FIGURE 4.2
Steps followed to conduct the empirical survey
wtorSTVDV
ftffmCUTEDGSSeJTSOfdKAiaei
sa m p l e
SYSTEMSANALYST*
EXPERTS
COLLECTED DATA
BUtT
JOBRES ONSSajTCS /SX1USMODEL
technological environment are uncertain, widely divergent views
regarding the future skill requirements for systems analysis were
anticipated. In an effort to establish some form of consensus as a
basis for the research (and to avoid personal bias and a single
perception) a small group of experts was approached to provide the
■ dimensions which formed the basic structure of the questionnaire. This
section describes! , ; :
- collecting expert opinion
the structure of the questionnaire
- evaluating the questionnaire in a pilot study.
4.2.2.1 COLLECTION OF EXPERT OPINION
The opinions of a group of experts directly involved in the process of
application software development were gathered to provide the dimensions
of the major part of the questionnaire. This section describes:
- identifying the sample of experts,
- collecting expert opinion: round one,
- collecting expert opinion: found two.
4.2.2.1.1 SAMPLE OF EXPERTS
The initial step in gathering the empirical data was to make contact
with a small group of experts who were; known to be directly involved
in the development of computer-based applications. These experts,
identified in ‘The 1985 South African Who's Who in Computers' (Systems,
May 1985) fell into two categories. .
The first category, the PRACTITIONER experts, were a random
106
selection of those personnel named who indicated that they were involved
in the management of business application software development. A
total of 34 experts was identified in this group.
^ ' r 1 , ■■ . vThe second category;, the ACADEMIC experts, were identified WoiSgcj\
being the leading academics in the field of Business Information Systems
at South African Universities. There were 13 participants in this
group (see table 4.1). !
■■ i
4.2.2.1.2 COLLECTING EXPERT OPINION! ROUND ONE
As a means of diminishing some of the negative psychological factors of
face-to-face discussion (particularly the distorting effect of the■ 1 i • -
majority opinion, dominating personalities and group compulsion (Perez
and Schuter, 1982, p.160), the experts were approached via a mail-shot.
In September 1985 each expert was sent an explanatory letter, a list of
definitions and three open-ended questions about the future role of the
systems analyst in business!) application software development (see
appendices 1 A* and 'B '). ,
To help focus the experts' thoughts on the skills required by the
systems analyst of the future, the three questions were asked in a
specific order. Firstly, the experts were asked to identify the
methods which they thought would be used in the future to develop
computer-based systems, In the second question the experts were asked
to identify the expected job responsibilities of the future systems
analyst. The final question asked the experts to list the necessary
skills which will be required by the systems analyst of the future to
perform these job resportsibilities. {
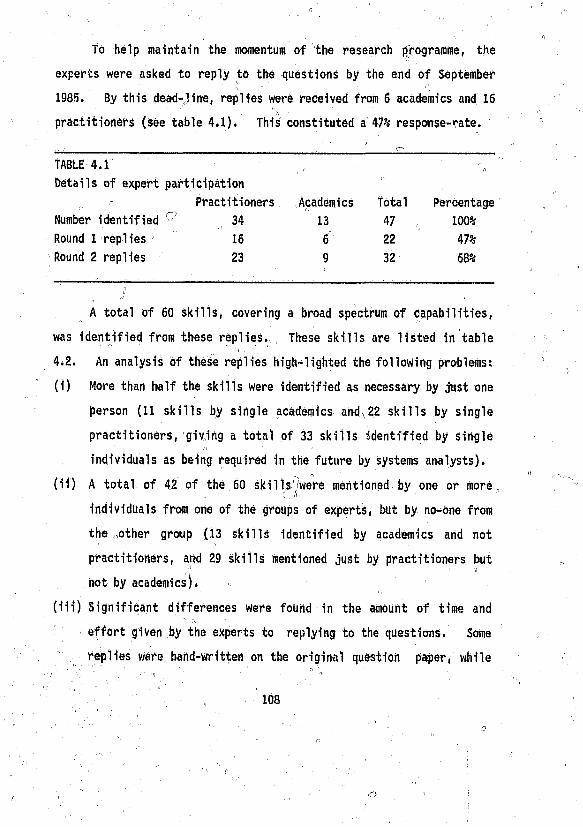
To help maintain the momentum of the research programme, the
experts were asked to reply to the questions by the end of September
1985. By this dead-line, replies were received from 6 academics and 16
practitioners (see table 4.1). This constituted a 47% response-rate.
TABLE 4.1 -■
Details of expert participation
Practitioners Academics Total Percentage
Number identified 3 4 13 4 7 ■,100%
Round 1 replies 16 6 22 47%
Round 2 replies 23 9 32 68%
A total of 60 skills, covering a broad spectrum of capabilities,
was identified from these replies. These skills are listed in table
4.2. An analysis of these replies high-lighted the following problems;
(1) More than half the skills were identified as necessary by just one
person (11 skills by single academics ahd\22 skills by single
practitioners, giving a total of 33 skills identified by single
individuals as being required in the future by systems analysts),
(ii) A total of 42 of the 60 skills were mentioned by one or more,
individuals from one of the groups of experts, but by no-one from
the ,other group (13 skills identified by academics arid not
practitioners, and 29 skills mentioned just by practitioners but
hot by academics).
(Hi) Significant differences were found in the amount of time and
effort given by the experts to replying to the questions. Some
replies wars hand-written on the original question paper, while
108
one reply was the abbreviated minutes of a management meeting
called by the expert to discuss the questions. '
(iv) it was not always cViar whether the experts were using some of the
key words in the study consistently (e.g. it was not certain if
each respondent who suggested that the future systems analyst
should have communication skills would have regarded interviewing,
verbal communicating, report Writing, presentation preparing,I-1 ■ , '
teaching, etc. as being equally important).
(v) There was no way of knowing the strength of the respondents1
/ opinions. It was possible that a skill was identified because it<7was regarded as definitely required, because it may be required or
because it could be good to have it under certain specific
circumstances.
These problems made collating the data without making assumptions,
impossible. It was decided* therefore* to approach the same group of
experts again to ask them to clarify their first set of answers.
4.2.2.1.3 COLLECTING EXPERT OPINION: ROUND TWO
The data collected from the initial approach to the experts was groliped
jlinto the categories used in a similar study (Crocker, 1984, p.68) to
[provide more structured answers to the original questions. The experts
were asked to confirm the significance of each of the possible answers
and, if necessary, to make comments about each question or introduce any
new variable which they felt had been overlooked in the previous round.
The second approach to the originally identified experts was made
with a return date for inid-Noventber 198S. It was encouraging that the
" 109 ° ■ - . '
n
response rate to this second approach to the experts (68%) was higher
than that achieved in the initial approach (see table 4.1). Perhaps the
participants found it easier to respond to the less open-ended
questions. - ' ' n• " lj '
. The frequency counts of the replies received is given |in appendix
’C . The median scores of their opinions on the skills required by
future systems analysts is given in table 4.2.
Tt^se data were used directly in the structuring of the
questionnaire to be sent to a sample group of practising systems•v ■■ j
analysts.
4.2.2.2 STRUCTURE OF THE QUESTIONNAIRE (See appendix 'G1)
The questionnaire was designed to ensure that respondents:
(i) were, in fact, practising systems analysts?
(ii) were given the opportunity to follow a particular train of thought
to focus their attention on the skills required for the future
systems analysts; . "
(iii) were able to record their opinions on a descriptively anchored
five point Likert-type scale (with scores alternating in direction
at least per section);
(iv) where appropriate, were provided with an OTHER category to include
dimensions they felt had been overlooked previously,
The questionnaire had the following seven sections:
Section 1 * this section was designed to identify the respondent's
current job activities. This information was used to ensure thatlj ■’| only data from respondents who were currently practising systems
analysts were included in the research..
Section 2 - The objective of this section was to attempt to identify
the respondent's current systems analysis skills. (The dimensions
In this section were the same as those used in section 5, but the
wording was different, they were presented in a different order
and they were scored randomly in alternate directions).
Section 3 - The question in this section was designed to focus the-
participant's attention on the methods and tools which will be
\\ used in the future development of computer-based application\ \ - V '
systems.
Section 4 - This question asked the respondents to give their opinion
of future systems analyst's possible job responsibilities.
Section 5 - In this section the participants Were asked to give their
opinions on the importance of a range of skills which may be
needed by the systems analyst with the job responsibilities
identified in the previous section.
Section 6 - This single question was an attempt to determine how
prepared the respondents felt they were to perform effectively as
systems analysts in the future.
Section 7 - This section Was designed to capture demographic details
about the participants.
f} * nNOTE °
(i) The dimensions of sections 3, 4 afid 5 were taken directly from the
replies received to the questions put to the experts in the
previous step in the research programme.
<.( ,
111
* ry // a(ii) The categories of organizations used in section 7 were taken from
Miller, 1978, p.602. ,
4.2*2.3 THE PILOT STUDY
452.2 .3 .1 DESCRIPTION OF THE PILOT STUDY
!>jpilot study, mirroring the procedures of the main study, was conducted
during April 1986. The group of 16 people who participated in the
exercise was made up of 7 senior students and ? practitioners from two
different companies. A Verbal explanation of their role in the
research programme was given to the participants. Each participant was
then handed the questionnaire, a covering letter and a list of specific
points to consider when completing the questionnaire (see appendix''D').
Those participating in the pilot study were asked to provide
comment on the following points:
(i) The time it took to complete the questionnaire.
(ii) The effectiveness of the format and wording of the questions in
procuring the required information.
(iii) The problems encountered from reversing the direction of scoring
of dimensions.
4.2.2.3.2 RESULTS OF THE PILOT STUDY
The results of the pilot study showed that the questionnaire was long,
but not too long and that few or no problems were encountered resulting
from the reverse in the direction of scoring of dimensions. (Later both
the findings were found to be questionable. During the main study,
respondents complained of both the questionnaire length and unnecessary
confusion caused by reversing the scoring directions.)
112
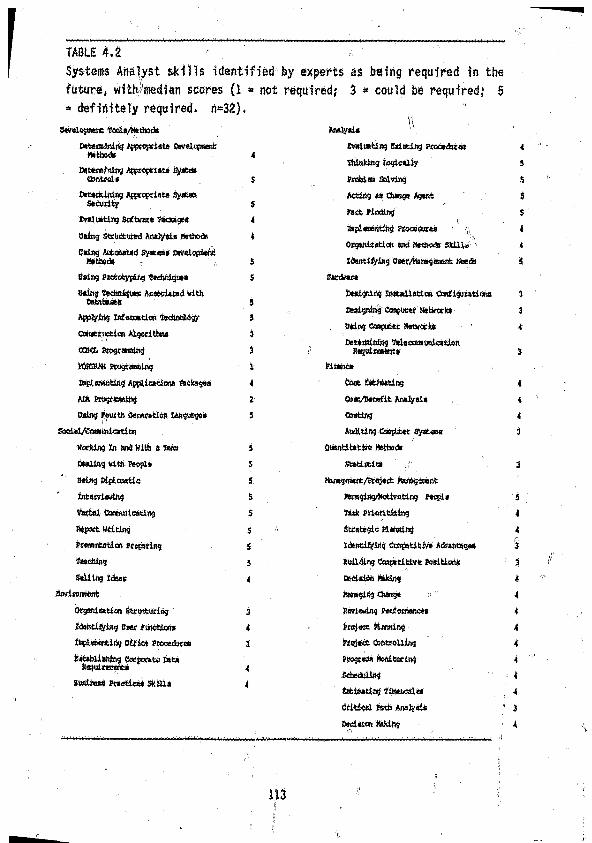
Systems Analyst skills identified by experts as being required in the
future, withmedian scores (I « not required; 3 « could be required; 5
a definitely required* rt*32)*
TABLE 4.2 ,
Dmlosrae:* ?ool«/M8tl»do
DrteasiBiiij Afftoptiate Bwelcpa«t
Mtte d» 4
U«t*rB/ning AffSopriStn Synfccm
CbfitajU 5
Dttwslnlng Afprcprieto System
SMWt% SSwtf mtinj Scc&tic faouges 4
0*Ji»9 SttiKtttwi tos)ytl« lit the ds 4
Oning Aueoutsd Sy*eas Owelopentme»* „ s
Using Prototyping teduiique* 5
Citing flechnjqu* AoaOcUwd withDiMfcafeo 5
Appiyirvj Infanta tion jfcdtfwlogy 5
Cauenctian Algorithm 3
CCBtt Ptogrwning 3
TOMSK) Piogtimslng 1
JSnpltvtiting Appliatiens ft(lc*9*s 4
Mfc Etogrceting 2
Using fottfth Genutation Ungveges 5
&sd.el/Ca®miratit«
Xstking jEn *nd Kith 3 f m 5
BMling with Peopl* $
' Seiug Difltrajtic 5
* Intsrrie/ihg 5
Vaftol Osasmtradng $
' Mpoet Writing $
hUmttiHea WcpJtln? 5
ladling j
ifcUlng tdsic 4
finHtoBtisnt
Qrganiratlcn Strusttttlflg 3
IdsntUSfiag c«r fthcfctei* 4
itftltmmng StttcA PfoosdutM 3
**t»feUsnlng Corporate Cat*Soquirraoiti 4
. suaimw SklUe 4
AlAjy«i« ”
SwalUBtinj existing procedures 4
Sfcinkihj tajie*Aly J
J>robl«t Salving $
Aeting *a Ounge fcgwtt 5
ttst Finding S</
l»pl«*nt;ng ftocs&tres " 4
Organlzatlcti and itechodi SkiXi* ' 4
Identifying aMr/Haragerasnfc lice do 5
8«<ii«r*
E**i$pirt3 Installation Confiscation! 3
Osaigning Ccsputw NetvarW 3
, U«ing Onputec Msrcrte ' 4
Deuasining 1'eleccra uni cation fiBjulrenimt* }
Flnsnc*
Cost CAjMting 4
0 )at/Bene£lt toily»U 4
(Noting 4
AaHtiog Coopaet Syaaas 3
OuantiUtbo Hefei*
SUUteica . 3
Kirag<ranfc/Vcaj«ct Kartig-srent
Msragin^Xotlyating P*qpW 5
W A motifc&tog 4
Steote^e Planning 4
latntuying timtntitir* AdJMtsgaa j
Building Caapseltlve Posit!am ' 3
De&iibn »ldng t
(“.waging Gungs i> ' 4
Rtrrtewing Petfeaatieas 4
frojscc Hanning 4
Prcrjtci amerolU/ig 4
Progress Honltortoj 4
Scheduling 4
Effiitatinj liM todM , 4
Ctiti«itl Psth Anifysl* ' j
Otciucn taking ■ 4o -.
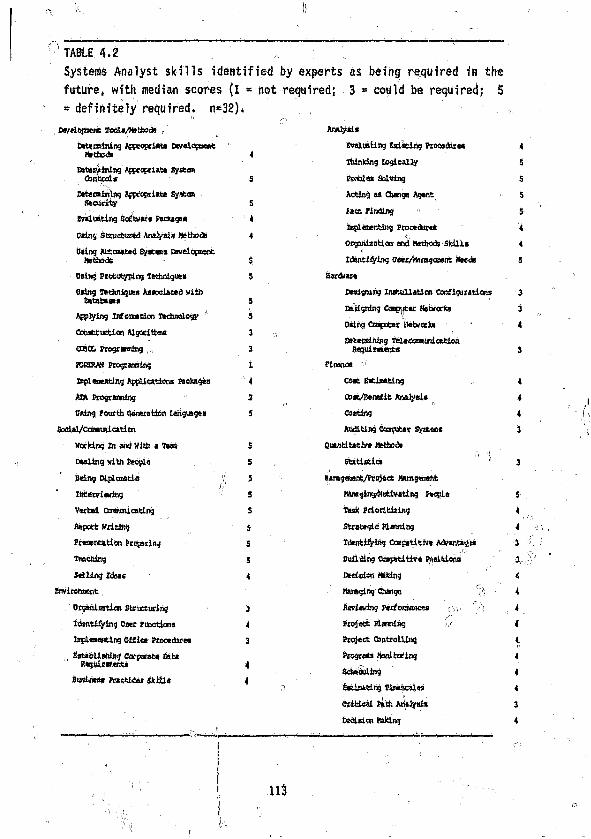
II
TABLE 4.2
Systems Analyst skills identified
future, with median scores (l * not
* definitely required. n*32)»
Dwri6p«enfc ta&t/HsHode t
Dettrainlrvg A{$copci*ta Bevelopatmt Methods ; 4
Doterainlng Afpcoftiate Systan Cbnttol* S
Determining Afftopiiat* SyMat Security 5
Evil gating Scftware Package* 4
D«in<i Structured luofytiH Metbode 4
Doing Alienated Syacaai Develotmnt ftettods 3
' Oaing Pcott*yptng Technique* 5
Bring Teduiiquoi k a n eU ai with tatataaes 5
Afplying Intonation JSduMlcgy '' 5
Conattuction Algocltte* 3
OSBtti Programing , 3
ItSSS/H Programing I
Btplcwnting Applications M etals ! 4
A n Irogriwning 1 2
B*ing fourth Generation Urngu>geo 5
SoclaVcaMinlatitn
Working In and With a Teas 5
Moling yith pedjio 5
Being Bljiaaatic ft 5_ 11'‘ ItlteiviBrtrtg '; 5
Verbal Coittmlcatinq S
Report Writing S
Pcraentatioi prepting 5
Teaching S
Selling Ideas 4
Environment,
Organiraticn .Structuring 3
Ida ntiding Cset Functions 4
Isplemefcing Office Pcocedlrea 3
f Eatabliahing Corporate tnhRequirement* 4
Businent Practicet SkiUa 4
by experts as being required in the
required; 3 = could be required; 5
cAJvOy*i»
Evaluating ^dating Procedire* 4
ihinUng LogicaUy 5
ftrablitt Saving $
Acting at Change Agent S
facc rinding $
Implementing Ptoosdoree 4
OrcpnLraticn and Method* Skills 4
Icfentltylug Doer/Hnragaam; Heeds 5
Bocdoi*
Vetlyunj Dufcallaticn Configuration 3
En Ugning Cop iter Netvcrto 3
Oting Caipjtec lletwcctai ‘ 4
Detensining Teleazmidca fciort Rnguirenerts 3
Pirehoe 1
Coet ettiatting 4
Ooet/BemsEit Awlytde 4
GMting 4
AtidLUng Canutes Syatans 3
OuMtltatipe Mettodi; , )<
StatiBiia 3
Haragmenlj/Plrojoct Kamgwent
Mmgirej/tfotivating f*ople 5
Task Prioritising 4
strategic Hanning 4
Identifying Caapstttiv* ArVantavta 3 ‘
Building CcspstiUve Pnelfcicni 3
DsdnUn HikHtg t
Managing Change , 1 4
Iterfewing Pexfomance* ■: "/} 4
Project naming 4
Prcijoct controlling 4
Progra** Nonitoeing 4
Set* ailing 4
0 £*io»ting ftasicalM 4
Critical Ffcttl AjUfyaia 3
t»clelOT taking 4
113
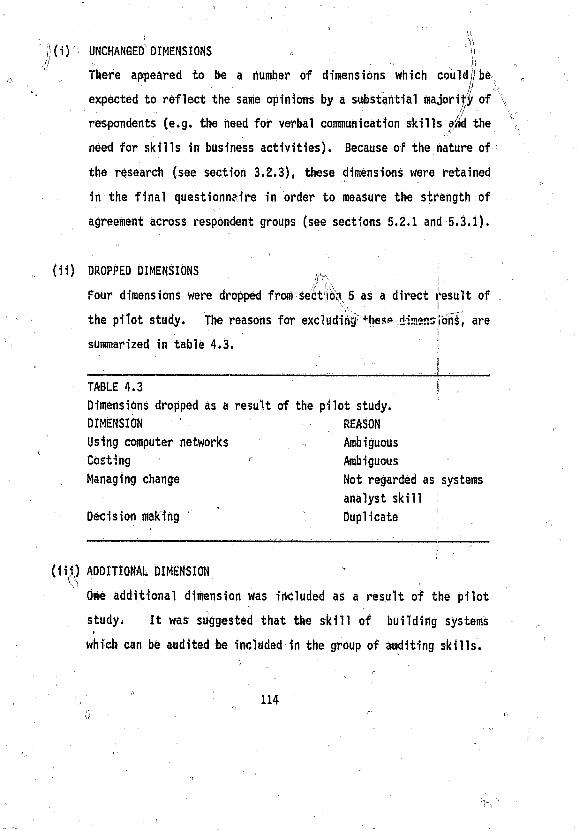
(i) UNCHANGED DIMENSIONS - 1
There appeared to be a number of dimensions which couldl be.
expected to reflect the same opinions by a substantial majority of
respondents (e.g. the need for verbal communication skills avid the
need for skills in business activities). Because of the nature of <
the research (see section 3.2.3), these dimensions were retained
in the final questionnaire in order to measure the strength of
agreement across respondent groups (see sections 5.2.1 and 5.3.1).
(ii) DROPPED DIMENSIONS /fVx
Four dimensions were dropped from sect ion 5 as a direct result of
the pilot study. The reasons for excluding +hesp H^snsions, are
summarized in table 4.3.
result of the pilot study.
REASON
Ambiguous
r Ambiguous
Not regarded as systems
analyst skill
Duplicate
(i ii) ADDITIONAL DIMENSION *
One additional dimension was included as a result of the pilot
study. It was suggested that the skill of building systems
which can be audited be included in the group of auditing skills.
TABLE 4.3
Dimensions dropped as a
DIMENSION ,
Using computer networks
Costing
Managing change
Decision making
114
(iv) REPLACED DIMENSIONS
Those participating in the pilot study suggested that two
dimensions in section S be replaced;
(a) 'Using techniques associated with databases' was changed to
'Designing logical data models'.
(b) 'Applying information technology' Was changed to
'Determining specific users' information requirements'.
The above changes were made to .the questionnaire before it
r, was used in the main study (see appendix 'G'), but the data
' collected in the pilot study were excluded from the sample
of data processed.
4.2.3 DISTRIBUTION OF THE QUESTIONNAIRE
The questionnaires were to be distributed to a sample population of
practising systems analysts. There was, however, a problem. No
register of practising systems analysts existed. To overcome this
problem, a combination of the approaches used by Crocker (1984) and
Benbasat et al (1980) was followed. This approach had five steps.
(i) Ah effort was made to identify the total population of systems
analysts in the South African I.S. industry.
(ii) The total population of companies which employed I.S. personnel
with the responsibility of developing and implementing ■' . r'
commercially orientated computer-based systems, was identified.
(iii) The distribution of systems analysts across these companies was
estimated.
U '
0
115
(iv) The total number of questionnaires to be mailed was determined by
selecting a sample population of companies and varying the number.. " n fl
of questionnaires sent to each group of companies (depending on
the number of I.S. staff employed by the individual companies).
(v) The questionnaires were mailed to senior staff members of the I.S.
departments of companies in the sample population. These senior
personnel were requested to distribute the questionnaires to a
selection of systems analysts in their organizations.
4.2.3.1 ESTABLISHING THE EXISTING POPULATION OF SYSTEMS ANALYSTS
Because no register of practising systems analysts existed, not only
were the names of the people from whom the sample population was to be
drawn unknown, but other sources were needed to establish the total
population of systems analysts.
Two sources were identified which provided an indication of the
approximate size of the existing population of systems analysts in South
Africa. ,,
(i) PE/CPL SALARY SURVEY
Staff shortages identified in the 1984 Salary Survey (P-E, 1984,
p.8) provided, numbers of personnel required by the South African
computer industry in various 'analyst* categories. By combining
these categories (see table 4.4) it could be assumed that the
expected population was approximately 1 800 systems analysts for
1985.
116
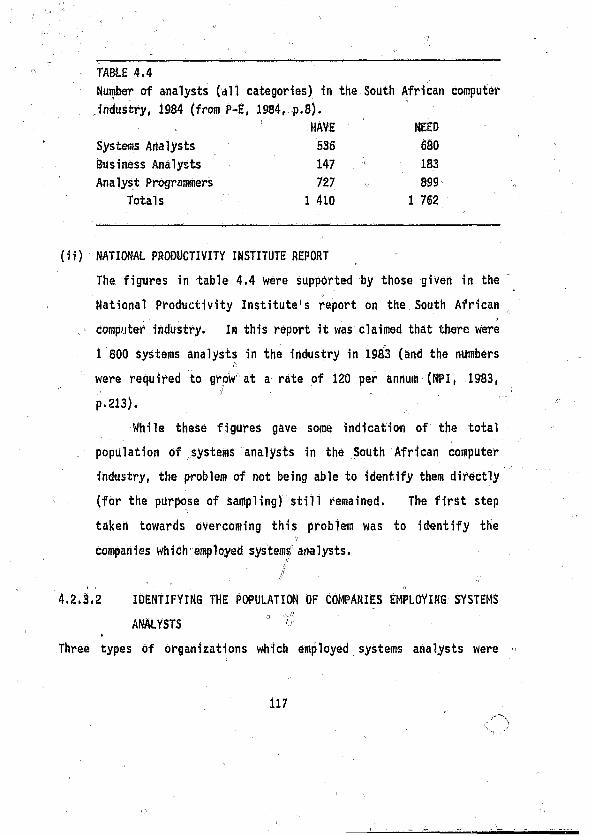
TABLE 4.4
Number of analysts (all categories) in the South African computer
industry, 1984 (from P-E, 1984, p.8).
HAVE NEED
Systems Analysts 536 680
Business Analysts 147 183
Analyst Programmers 727 899
Totals 1 410 1 762
(ii) NATIONAL PRODUCTIVITY INSTITUTE REPORT
The figures in table 4.4 were supported by those given in the
National Productivity Institute's report on the South African
: computer industry. In this report it was claimed that there were
1 800 systems analysts in the industry in 1983 (and the numbers
were required to grow at a rate of 120 per annum (NPI, 1983,
p.213). " _
While these figures gave some indication of the total
population of systems analysts in the South African computer
industry, the problem of not being able to identify them directly
(for the purpose of sampling) still remained, The first step
taken towards overcoming this problem was to identify the
companies which employed systems, analysts.
4.2.3.2 IDENTIFYING THE POPULATION OF COMPANIES EMPLOYING SYSTEMS
ANALYSTS '
Three types of organizations which employed systems analysts were
117
identified in the 1986 Computer Users' Handbook (see table-4.5):
- companies with in-house I.S. departments;
- bureaux and software houses;
- companies offering I.S. consulting services.
It was recognized that this list from the Computer Users' Handbook
was incomplete because information is volunteered to the publishers.
Some organizations, for example those in the government sector, were not
included on the list (see section 4.3*2, Potential Problem 9).
Not all the companies listed in the Computer User's1 Handbook
automatically qualified fov- inclusion in the population from which the
sample was selected* To help ensure that people who participated in
the research were those with the relevant background, job
responsibilities artd insight, the criteria below were used to exclude
certain organizations from the- sample population:
(i) Any company which employed fewer than ten personnel was excluded
(because the possibility existed that the nature of the work done
in these very small environments could be inconsistent with the
main thrust of I.S. activity (see Further Research in section
8.3.3)*
(ii) Both in-house and consultancy groups which did not indicate that
their employees were involved in the development of commercially
orientated applications were excluded (because this research
concentrated on the role of the systems anal^t in the business
environment). „
(ill) Consultancies not offering ‘a complete DP service1 were nui
regarded as part of the sample population (because they might not
118
" 0
have had personnel employed as systems analysts).
> " " '
(1 v) Bureaux and software houses not offering ‘systems analysis and
design facilities' were also excluded from the sample population
P' ' •(because there was the possibility that they did not have people
employed as systems analysts).
As a result of this screening process 287 companies with in-house
I.S. departments, 11 consultancies and 85 bureaux/software houses who
employ systems analysts, were identified (see table 4.5).
^ 1 n4.2.3.3 IDENTIFYING THE DISTRIBUTION OF SYSTEMS ANALYSTS ACROSS
,, COMPANIES
Although the types and number of organizations which employed systems
analysts could be identified (see section 4.2.3.2), still no details
were available on the number of systems analysts who worked in each
group of companies. To overcome this problem a lead was taken from
Crocker. He quoted ’’a study by the Institute of Manpowe- Studies
which:
showed that’ .fie number of systems analysts employed by any individual organization was directly related to their total, establishment for computing personnel1 (Crocker, 1984,P*4).
Based on these findings, it was concluded that the distribution of
Systems analysts across tiie categories of companies would follow the \\ ! } . 1 -
number of I.S. personnel employed within each category. These figures
were available from the 1986 Computer Usv.*s' Handbook. Once the
exclusions (identified in section 4.2.3.2) had been made, it was found
that approximately 80% of the I.S* personnel :ere employed in in-house
- ' , 'p.-. 119 0 ^ -
■ ■ Vi
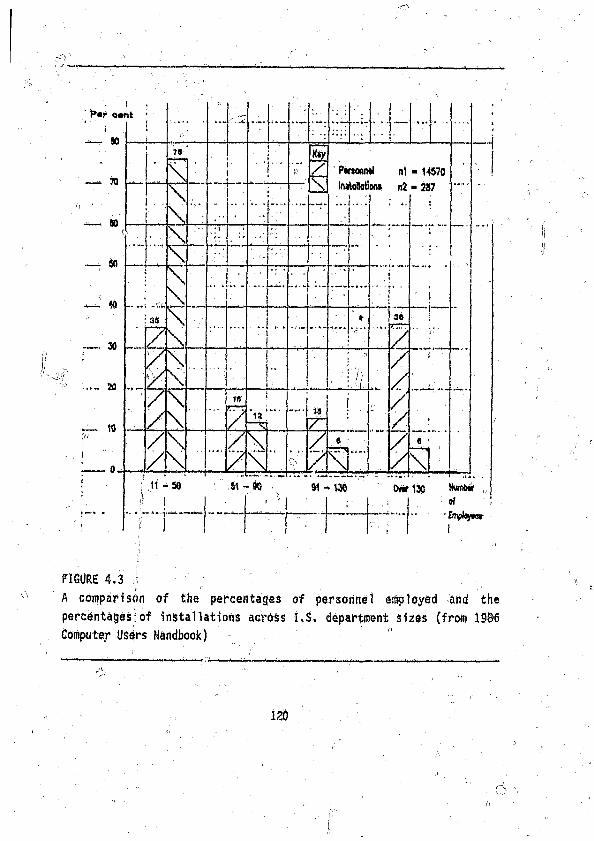
■ I P«r canti
— 80''
JO
80
SO
«
30
20
KS
79
\
N
2 N
\\
tl - so
w
IZ
12
\
Kty
/
\
_U
Pmoonil nl ■ 14570 liwtoMion* n2 - 287
13
JZ1
/sr\
51 -9 0 91 - 1S6
I 36
2 ]
/////
Ov*rl»
~b*IWmbir „
;•» Bnpkytn
FIGURE 4,3
A comparison of the percentages of personnel employed and the
percentages;of installations across i,S, department sizes (fro* 1986
Computer USers Handbook)
120
C>
I*S. departments, about 5% by consultancies and the remaining 15% by
bureaux and software houses (see table 4.5)* It was assumed,
therefore, that the distribution of systems analysts across the
categories of companies would follow approximately the same ratios.
The companies with in-house I,S. departments presented a further
problem. When the number of companies in this category was sub-divided
into groups (according to the number of personnel employed) it was found
that:
- the majority of companies (76%) had relatively small I.S.
departments of between 11 and 50 employees.
- the majority of staff (36%) were employed by the relatively larger
I.S. installations of above 130 employees.
(See figure 4.3.) c,
4.2*3.4 DETERMINING THE NUMBER OF QUESTIONNAIRES TO DISTRIBUTE
It was decided to provide approximately 20% of the practising systems
analysts in South Africa with an opportunity to Supply input to the
research. This required the distribution of approximately 400
questionnaires (see section 4.2.3.1)* To help ensure that the sample
population was representative, the questionnaires ware distributed in
proportion to the number of staff employed by the companies in each
Category identified. (Determining these proportions in terms of the
number of companies in each category would have resulted in a bias in
favour of the systems analysts working in the smaller companies (see
figure 4*1)*)
Because of the disproportionate ratios between the number ctf
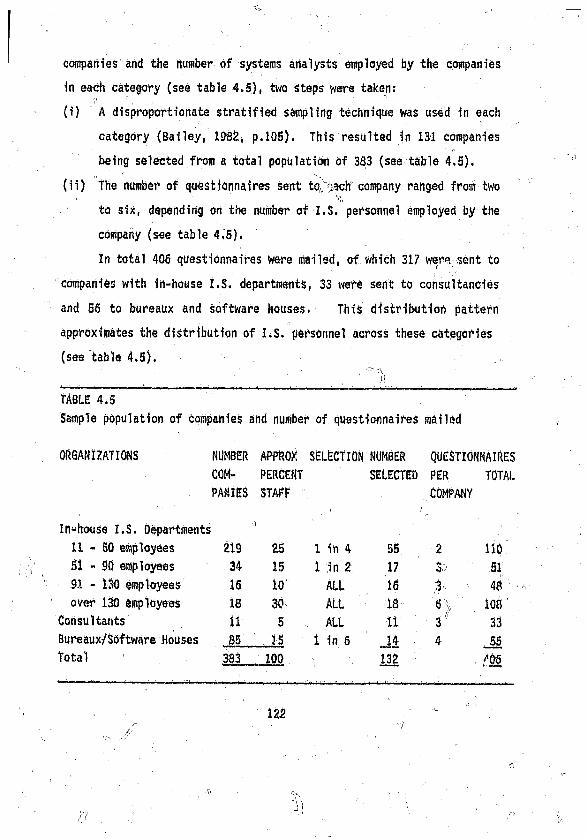
companies and the number of systems analysts employed by the companies
in each category (see table 4.5), two steps were taken:
(i) A disproportionate stratified sampling technique was used in each
category (Bailey, 1982, p.105). This resulted in 131 Companies
being selected from a total population of 383 (see table 4.5).
(ii) The number of questionnaires sent tc ''.3ch company ranged from two
to six, depending on the number of I,S. personnel employed by the
company (see table 4,5),
In total 406 questionnaires were mailed, of which 317 wer^ sent to
companies with in-house I.S. departments, 33 were sent to consultancies
and 56 to bureaux and software houses. This distribution pattern
approximates the distribution of I.S. personnel across these categories
(see table 4*5).
TABLE 4.5
Sample population of companies and number of questionnaires sailed
ORGANIZATIONS NUMBER APPROX SELECTION NUMBER QUESTIONNAIRE
COM PERCENT SELECTED PER tot;
PANIES STAFF COMPANY
In-house I.S. Departments
11 - 50 employees 219 25 1 in 4 55 % 110
51 - 90 employees 34 15 1 in 2 17 %:> 51
91 - 130 employees 16 io ALL 16 . ■ 4$
over 130 employees 18 30 ALL 18' n " 108
Consultants 11 5 ALL 11 3" 33
Bureaux/Software Houses S5 ' .. IS 1 in 6 4 _55
Total 383 100 132
122
4.2(3.5 MAILING THE QUESTIONNAIRES
Questionnaires were mailed in batches to senior personnel in I.S.
departments in the sample population of companies in mid-May 1986. A
covering letter to the senior member: if 'tiff explaining their role in
the distribution of the questionnaires' accompanied each batch (see
appendix Attachad to each questionnaire was another letter
(addressed to the perspective participant) and a self-addressed, stamped
envelope (see appendices SP' and 'S'). The return date for responses
was set for 6 June 1986,
Because the qusstionnaires were designed to ensure anonymity,
respondents who were particularly interested in the research were
1 invited to write under separate cover to indicate that they wished to be
sent details Of interim results.
4.2.4 RESPONSE TO THE QUESTIONNAIRE
The frequency distribution for each dimension of the questions in
section 4 and section 5 of the questionnaire is given in appendix 1K '.
In this section details are given of the response ra^e and the steps
taken to ensure that the data could be regarded as representing the
opinions of the .sample population* i ■ \
" ' \ ' ' '■ " '
4.?,.4.1 THE RESPONSE RATE' , , j ': ;
By the 6 June 1386, 169 questionnaires had been returned. Of these, (V ■ , . " !l
seven were completed by individuals who indicated (irt section I. of the
questionnaire) [chat they were not practising systems analysts, and five- 4 S 1 f ■ . ,; ”
replies were incomplete. All 12 of these replies were excluded from

the sample processed. Later a further six replies were received, but
because processing of the data had commenced, they too were excluded
from the data processed (see table 4.6). , , „
TABLE 4.6
Details of the replies received to the mailed questionnaire
Number of questionnaires distributed 406 (100%)
Replies received ,,
- Incomplete 5
Completed by wrong group 7
Late 6 ,, ’ "
Total replies excluded 18 (4,4%)
Total replies processed - 159 (39,2%)
Total replies received 177 (43,6%)
The effective response rate of 39,2% compared favourably with
those of similar studies (see table 4.7) and Was regarded as adequate
for the exploratory nature of the study.
TABLE 4.7
Published response: rates to tnaited questionnaires 1in siitiilar studies
STUDY NUMBER OF RESPONSE RATE
QUESTIONNAIRES )/DISTRIBUTED
Crocker, 1984, p. 13 739 / 34,6%
Hamilton and Ives, 1983, p.:I 291 37,8%
Rivard and Huff, 1985, p.92 1 074 40%
Sumner,. 1986, p.199[f 5 5
43%
Langte et al., 1984, p.275 C-, 500. j! 14%
124
4.2.4.2 THE REPRESENTATIVENESS OF THE RESPONSE
Although it was recognized that non-respondents inevitably introduce an
element of bias into empirical research (McNeill, 1975, p .37; Behr,
•1983, p. 156)p determining the opinions of the non-respondents of this
questionnaire proved difficult. There Were three reasons for this:
(i) The actual sample of systems analysts was not known (see section
4.2.3); .' - ■ 0
(ii) Each questionnaire was distributed through a third person and any
further approaches to the sample would again have to inconvenience
that third person; v, i
(iii) The replies were anonymous, so the respondents could not be
identified (see Bailey, 1982, p.176).
1 Consequently, testing the extent of the response bias took the r,
following form:
- attempted person-to-person telephone calls;
- a comparison of demographic data from this research with that of
an independently conducted survey; '
- a comparison of the opinions of early and later respondents.
4.2.4.2.1 TELEPHONE CALLS TO NON-RESPONDENTS rt
Efforts were, made to speak to tennon-respondents directly by telephone
(seven in the PWV area, two in Cape Town and one in Durban). After
numerous calls, contact was made with only two non-respondents (both in
the PWV area) both of whom said they forgot reply to the
questionnaire because of pressure of work. The trivial nature of the
evidence collected usiWjthis approach (compared with the effort and
, \ ' ■
125 '
T' ' ■ ■
■ r (\costs involved) resulted in the data collected be;ing dismissed as
inconclusive. No further attempts were made to make direct contact with
the non-respondents. !
- .. ^ ’ ■ ■ ■ V' ' - V I
4.2.4.2.2 COMPARISON OF DEMOGRAPHIC DATA WITH AN INDEPENDENT SURVEY\ n
To help establish that the ri,in-respondents were a random sample
(Shipman, 1981, p.60), some of |h|--dsmographic data of the respondents
to The South African Data Processing Salary Survey (198P) (P-E, 1986)
were compared with tfiat. of the participants in this research. Data
were extracted from the Salary Survey (which a7,so reflected the position
as at mid-year 1986) which referred to all categories of analysts
(including analyst-programmers) to comply with the inclusion/exclusion
rule enforced through section 1 of the questionnaire (see section
4.2.2.2). ]f. L, "
The following comparison of respondents to the two surveys Were
made (see figures 4.4 to 4.8):
- distribution across geoy.-aphic regions;
- ratio of males to females;0 ’ : ...
- years employed in the computer industry;
- hightest academic qualification;
- cumulative size of installations.
(See Behr, 1983, p.156.)
126
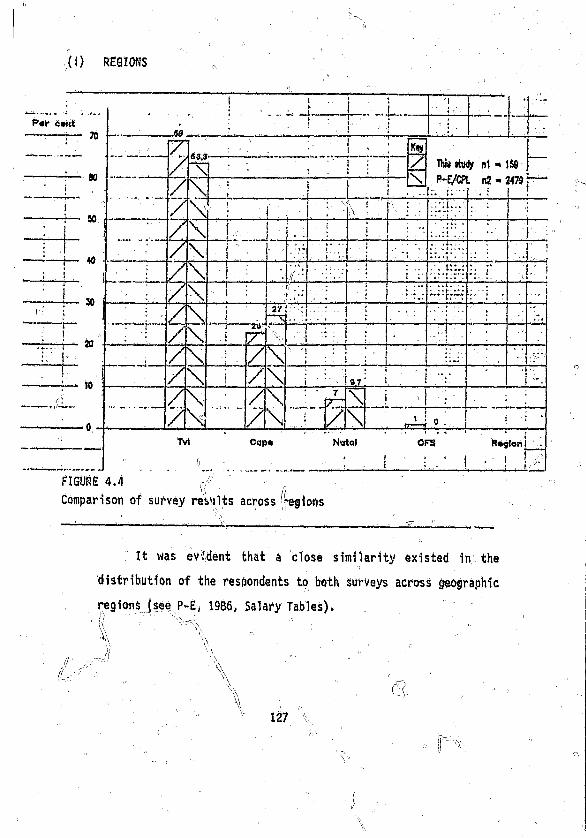
(i) REGIONS
1 -» ... .. ; ... as ..... . . . . . ....
i .. ! ■ ! 1 • - i . '! •i • !.
• j j !/7
63,3 « ; !: ' . • 1-- ------ ”1—• : K*y — / Tbi# atwly ni • 159 —
/7
\ » . ■ !t t 1 _ r-t/wiL (U * £4/3 j--\ i : " “ i" • i * - * ’■ •;j ■
/ \\
i , --U-- iI. • *: ••\:r ■ , i,» :: '
1 1 ' : 7 \ •i(' ■ j j : ;; t ■
- - 7 \t .' 1 : - i; I.:.]..... H.; ....
. — —/ bs\
1} .
27 • ! • 1 ‘ j * ’ ■; k7 nr- ' V. i - i = !/ \ / \ ’ L i :/ \ j / \ - ■ t * • , i ■97 ! -
/7
\N
/7 Z
7
---------
7/ \ i ^ “ : ;7 \ r j ■ I 0 - i J ; ■
Tvl Cap*(j ■ ■
Natal OF5J R*g[onl ■ ... : ..............
FIGURE 4.4 (: „. \\ //
Comparison of survey res'ilts across (regions
It was evident that a close similarity existed in the
distribution of the respondents to both surveys across geographic
regions (see P-E, 1986, Salary Tables).
i \ " ” “ M \ " ' "
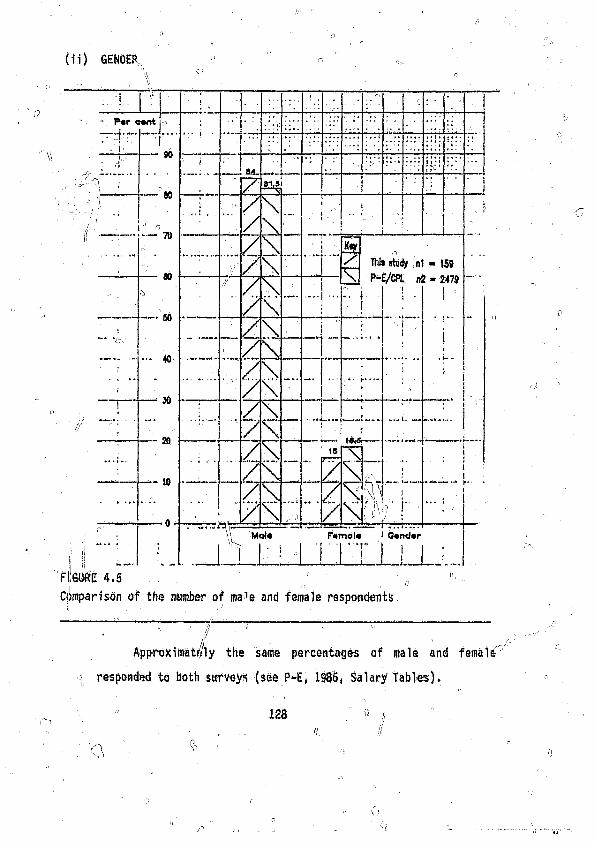
Ii "
<1 - n
(ii) GENDER a
responded to both surveys (see P-E, 1986, Salary Tables).
128 ' ,j "
n ii
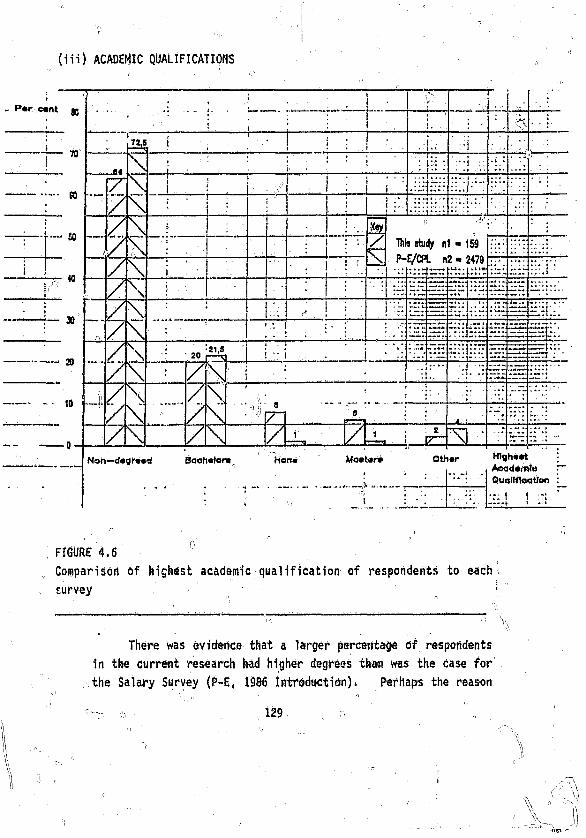
{1i i) ACADEMIC QUALIFICATIONS
P*r c«nt go
70
CO
so
40
X
20
" . . ..... : .... ;....... : . ...r
. ;
" . • . i * . ■ > i - \\ . . 1
i72,5 i . ■ ! ■ ! i
f •1 .i
k - i * * :-i
.. \ ! ‘ " I *
, |i _ ‘ : 1:0 *
, • j-« •:1 *! 1: -i - • -hi
1 : h
/ \
t „
i ' . ! .
■
\
i(I
r /
\ j ‘ %
/
\
...J
t ' : Bib study nl ■ 59
/ \ i ‘ ■'. « '
r-t/u*l n/ ■ I M 'ifell* t m
*.* f *
/ \j ;
r r lS r S i “ ?
/ \: ! ::1 *-r*» f s .
■ ■'ii:k-il.:!
A . / \* z — -
*7*7* — e B - ‘:
/ \ ‘ ‘ 2021,5 r— v
i ■ i! *■ I . .
-“t: — - —~ j * *
\;
/ \ !. ** . .'."ir=z
•*“7“[...rr .
- 4 \
\
/
/
\
N
1 ' i; .. T "
r-r
'Mi9
/6 ; ■■
■ A •-"Hi i; ”
/ \ / \ /1" "■ ... /
. . ; z\ ‘ f‘ :: ••
Non—d»gr*«cl Bachelor* Non* Maatar* Other HlgHMt Acad«i-n!o Qualification
I I __ 1
FIGURE 4.6
Comparison of highest academic qualification of respondents to each
survey
There was evidence that a larger percentage of respondents
in the current research had higher degrees than was the case for
the Salary Survey (P-E, 1986 Introduction). Perhaps the reason
■X „ ,. 129 o ' ■ ' „
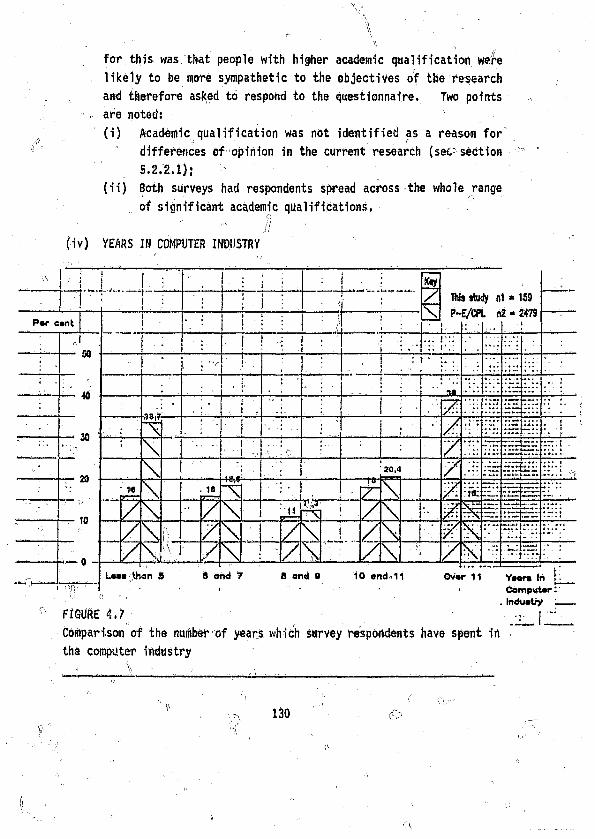
\for this was that people with higher academic qualification were
likely to be more sympathetic to the objectives of the research
, and therefore asked to respond to the questionnaire. Two points
„ are noted!
(i) Academic qualification was not identified as a reason for
differences of opinion in the current research (sec section
5.2.2.1);
(ii) Both surveys had respondents spread across the whole range
of significant academic qualifications.
' It(iv) YEARS IN COMPUTER INDUSTRY
i ii/V "Laaa taan 9 8 dud 7 S and 9 10 and 11
.. i = . ; : i j, ; %
/
X!
..r '"; : i i
; This stuiy nl * 159
Par cank1| , • : I : " *
r -i\ * •
t/v ril nt " W l!
i - ! ! . .... . . .
: . . • : ‘ t * it
" •• •
; . - V
r
“ 40; • I ,
*
R jt *•
\ ; i : * i : \** \ - I
M 0! . . : 1
1 7* t ‘. * t H i .7Z :T:: -
\ 1 * 20,4 / i r F i i " .i« \ 18
\ / \ & : i i : [H I- r r r z "Ii.
10 / \ -/ \ *14
VP i/ \ #
2 * f s : = r
N
k ,!*>
U / \ 7 \ / \ ¥h
• *n f : ! : " !
~ nW !
/ \ | ,-/ \ / \ ' ;:- / . . . . . . . .
Ovar 11 Yadra Iti b_ < Computer
. IndustryFIGURE 4.7
Comparison of the number of years which survey respondents have spent in
ths computer industry
130 <f>
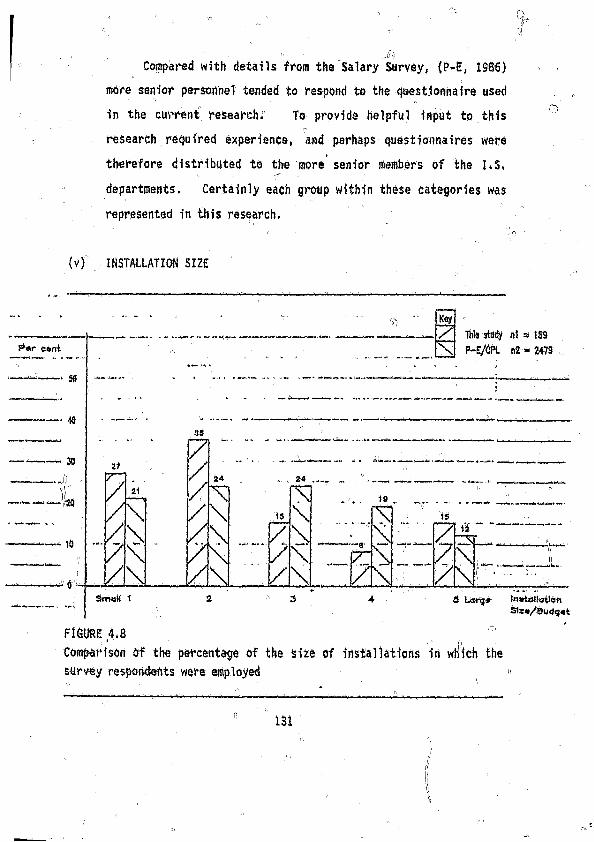
.. .. " J/SsCompared with details from the Salary Survey, (P-E, 1986)
more senior personnel tended to respond to the questionnaire used
in the current research;’ To provide helpful input to this
research required experience, and perhaps questionnaires were
therefore distributed to the more senior members of the 1*5.
departments. Certainly each group within these categories was
represented in this research,
(v) INSTALLATION SIZE
FIGURE 4.8
Comparison of the percentage of the site of installations in which the
survey respondents were employed «
131
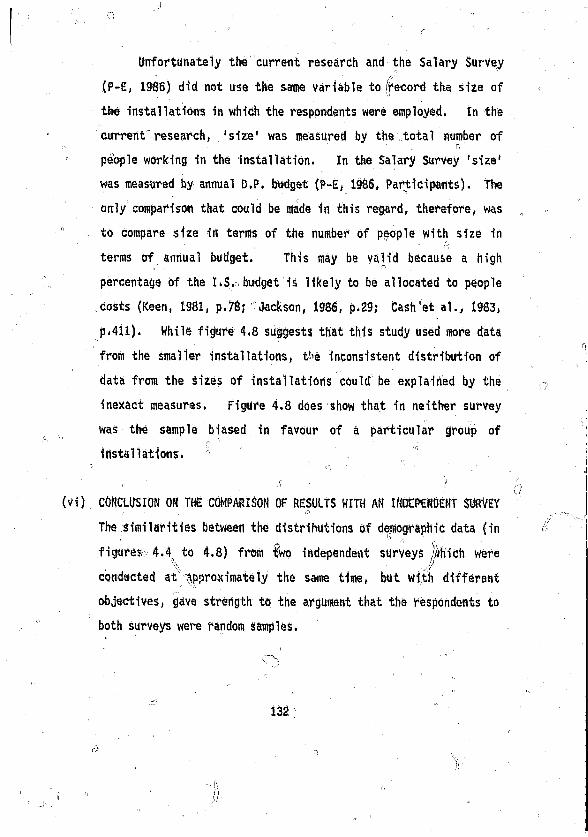
o
Unfortunately the current research and the Salary Survey
(P-E, 1986) did not use the sane variable to record the size of
the installations in which the respondents were employed. In the
current research, 'size' was measured by the total number of
people working in the installation. In the Salary Survey 'size'
was measured by annual D.P. budget (P-E, 1986, Participants). The
only comparison that could be made in this regard* therefore, was
’ to compare size in terms of the number of people with size in
terns of annua! budget. This may be valid because a high
percentage of the I.S. budget is likely to be allocated to people
costs (Keen, 1981, p.78; Jackson, 1986, p.29; Cash et al., 1983,
p.411). While figure 4.8 suggests that this study used more data
from the smaller installations, t’’e inconsistent distribution of
data from the sizes of installations could be explained by the
inexact measures. Figure 4.8 does show that in neither survey
was the sample biased in favour of a particular group of
installations. '
(vi) CONCLUSION ON THE COMPARISON OF RESULTS WITH AN INDEPENDENT SURVEY
The similarities between the distributions of demographic data (in
figures 4.4 to 4,8) from two independent surveys :«hich were^ ■ J/
conducted at approximately the same time, but with different
objectives, give strength to the argument that the respondents to
both surveys were random samples.
. C") 1
132 "
" r, ti
Vi"
I
4.2.4.2.3 ' A COMPARISON OF THE OPINIONS OF EARLY AND LATER RESPONDENTS
Although the view does not appear to be widely held, Goode and Hatt
’ claimed that,„r for most questionnaire-based studies, there aret/ :
differences between those who reply promptly and those who delay their
responses (Goode and Hatt, 1952, p.180). The authors made the
assertion that, if very little difference can be identified between the
opinions of the early and later respondents, it is a fair assumption
that the sampling bias is not great.
The opinions of three groups of respondents (concerning the skills
required by the(systems analysts of the future) were compared using the
{ ■ ' Kruskjal-Wallis test (Siegel, 1956, p.184). The groups were as follows:
GROUP 1 - The 6 respondents whose replies were received first.
GROUP 2 - The 6 respondents whose replies were received
immediately before the cut-off date.
GROUP 3 - The 6 respondents whose replies were received too
late to be included in the data processed.
Table 4.8 provides a rummary of the results. In only two cases■ . \ \\
out of a possible 58 could the null hypothesis that the three groups!' V*1 f’r ,
are from the same sample population, be '.‘ejected (at the 0,50 level).
It was noted that problem solving was one of the skills on which there . 1 r>
was no agreement (in terms of its future importance as a systems analyst
skill) among the whole group of practising systems analysts (see table
5.11). In th<S case Of Ada programming skills, it was noted that this
skill was not regarded as necessary to the future systems analyst, so
any disagreement here can be regarded as spurious (see section 5.2.2.1).
If this is a valid test (the small sample size could have
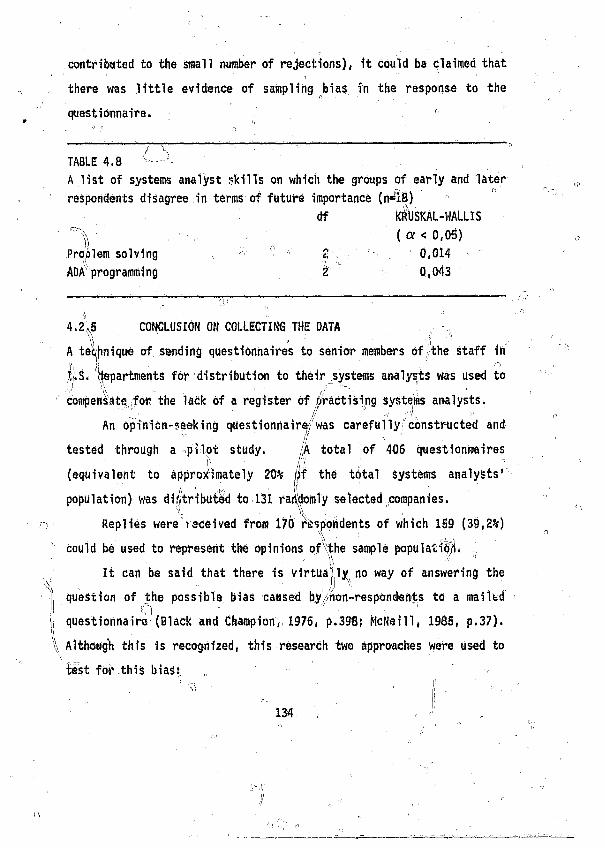
contributed to the Small number of rejections), it could bs claimed that
there was little evidence of sampling bias in the response to the
questionnaire. r
TABLE 4.8 ^ .^
A list of systems analyst skills on which the groups of early and later
respondents disagree in terms of future importance (n=18)
df KRUSKAL-WALLIS
( a < 0,05)
Proolem solving ' 0 Z 0,014
ADA programming 2 0,043
- : - — - -
I > '4.2.5 CONCLUSION ON COLLECTING THE DATA ,
\\ ■■ * ■ ! S ‘A technique of sending questionnaires to senior members of the staff in
||.S. departments for distribution to their systems analysts was used to
compensate for the lack of a register of oractising systems analysts.
An opinion-seeking questionnaire/was carefully constructed and
tested through a pilot study. /A total of 406 questionrraires I' (t I ”
(equivalent to approximately 20% ()f the total systems analysts’
population) was distributed to 131 randomly selected companies.
Replies were received from 170 respondents of which 159 (39,2%). y 1 r , . ( |
could be used to represent the opinions of the sample population.' \\ ''''
It can be said that there is virtually, no way of answering the
question of the possible bias caused by^fion-respondents to a rnailbdCl ■ ” ■ ’1
questionnaire (Black and Champion, 1976, p.398; McNeill, 1985, p.37).
> Although this is recognized, this research two approaches were used to
test for this bias: „
134
(i) Firstly, similarities were established between the demographic
data in this research and that of the 1986 Salary Survey (P-E,
The results suggested that the respondents to both
surveys were representative samples. •
(ii) Secondly, a lack of evidence of a sampling bias was found by
comparing the opinions of early and late respondents. ^
In spite of the relatively low response ral•. therefore, the
opinions of the respondents was claimed to represent the, opinions of the
carefully identified sample. ,
1 )4.3 EVALUATING THE EMPIRICAL RESEARCH PROCEDURES
The limitations of using mailed questionnaires to gather data have been
well documented (Bailey, 1982, p.157; Kerlinger, 1973, p.414; Gcode and
Hatt, 1952, p.132; Jauch, Osborn and Martin, I960, p.520). Tin’s wade
it important to establish confidence in the reliability of the data
collected in this research" (and, therefore, confidence in the
conclusions drawn). To achieve this the following steps were taken:
- the reliability and Validity of the questionnaire as a measuring
instrument Were established,' n
- where possible, efforts were made to counter known limitations,
- where it was not possible to counter known limitations, each
outstanding problem was identified. 1 |
4.3.1 EFFECTIVENESS OF THE QUESTIONNAIRE AS A MEASURING INSTRUMENT
This section establishes th<* contribution which the reliability and
validity of the questionnaire as a measuring instrument wade to the
level! of confidence In the research results.
■ / " " V■■ " 135 " '
4.3.1.1" RELIABILITY * '
Generally the reliability a questionnaire as a measuring instrument
is assessed using;'either the test-retest cycle or the sub-divide
(split-half) test (Ives et al., 1983, p.788, Shaw and Wright, 1967,
p.16). Neither of these approaches was1 used in this research because: r?. ■■ ’ c? 1 - - ' .
(1) Time constraints on the research programme, together with the
method Used to identify the sample population (see section
4.2.3.2), made the use of tho^test-retest approach impossible.
(ii) Bailey made the point that because a questionnaire measures
multiple concepts, the split-half test is difficult, if not
impossible, to administer for the questionnaire as a whole(: '
(Bailey, 1982, p.179). 1
The methods used to establish the reliability of the measuring
instrument in this research, therefore, were to:
- build reliability into the questionnaire at the time at which it
was designed; ; „
- measure the questionnaires1 reliability after the event, through
inter-item correlations.
(i) RELIABILITY AND QUESTIONNAIRE STRUCTURE
A form of the test-retest approach was built into the
questionnaire (see section 4.2.2). Among the questions asked of
the respondents wore:
- an assessment of their current skills as a systems analyst
(section 2 of the questionnaire);
- their opinion of the skills required by the systems analyst
- 136
0 of the future (section 5 of the questionnaire); O
- their assessment of their own preparedness for being a
systems analyst in the future (section 6 of the
questionnaire).
To enhance the reliability of the questionnaire as a
measuring instrument, the following procedure was used to
demonstrate that a relationship existed between these three
variables.
(a) An ,'unpreparedness factor' was determined for each
respondent by identifying each case where the respondent's
perceived current skill l^yel was lower than the, level
which, in his/her opinion, would be required for the systems
analyst of the future.
■ P 'A value was given to this 'unprepare/jness factor' by
assigning 1 point for each level of negative difference
between the current skill level (section 2 score) and the
perceived future skill requirement (section 5 score). So,
if the level of skill required in the future was Seen to be
5 (definitely required) and the respondent assessed his/her
currant, skill level as 3 (average), then the 'unpreparedness
factor' was regarded as 2.
(b) The 'unpreparedness factor' (labelled the ‘perceived skills
factor shortage'), was plotted against tho score of the
respondent's answer to the question on his/her perceived
preparedness for future systems analysis (section 6 score).
Figure 4.9 shows the highest, lowest and median Scores for
137
each group* The results ranged from a median of 12,5 for
those who felt most prepared for the future, to a median of
38,5 for those Who felt they had a significant lack of
required skills.
There are two reasons why the results of the
comparisons illustrated in figure 4.9 must be regarded as
non-absolute. -
REASON 1 - The data used to determine the 'unpreparedness
factor1 was ordinal and, therefore, could not be used for
absolute computations (see section 3.6.1).
REASON 2 - Just how prepared individuals claimed to be for
performing the functions of the systems analyst of the
futum depended on what skills were missing from their
current skills matrix. When determining the
'Unpreparedness factor1, cognisance was taken of the level
of importance each respondent gave to each skill.
Respondents could have set these importance levels
’incorrectly and consequently the results could be
misleading.
Figure 4.9 was used, however, to illustrate nothing more
than a trend. Ir. shows that as -respondents felt they were
nore prepared for the position of a systems analyst in the
future, sb their perceived skills shortages (the figure
4.9 discrepancy between their current skills and the skills
they would require in the future) decreased. This trend
showed that the answers to the questionnaire wat*e, in fact,
138 ,
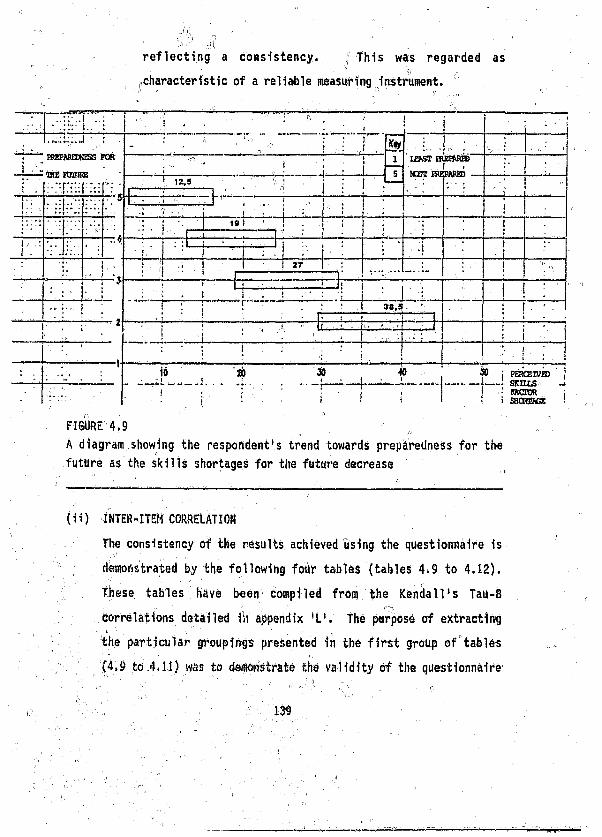
reflecting a consistency. This was regarded as
characteristic of a reliable measuring instrument. J' '' .V
FIGURE 4.9
A diagram showing the respondent's trend towards preparedness for the
future as the skills shortages for the future decrease
(ii) INTER-ITEM CORRELATION
The consistency of the results achieved using the questionnaire is
demonstrated by the following four tables (tables 4.9 to 4.12).
These, tables have been compiled from the Kendall's Tau-B
correlations detailed in appendix 'L'; The purpose of extracting
the particular groupings presented in the first group of tables
"(4.9 to 4,11) was to deionStrate the validity of the questionnaire
' ' .7 1 , ' 1
■ ' . / ■ ; 139
by showing that certain groupings of job responsibilities and
skills (see groupings from the literature survey in section G.3),
do have strong correlations.
Positive correlations were identified between respondents'■'O , ■' s-' • ■
opinion on the value of certain future system analyst job
responsibilities and their associated •skills (table 4.9).
Positive correlation were identified between respondents'
opinion on the value of certain skills which would be used across
multiple job responsibilities by future systems analysts
(table 4.10). -
Correlations were high between groups of future systems
analyst skills which are expected to be closely associated
(table 4.11). ' : ,
The purpose of table 4.12 Was to show that there were no
significant correlations between job responsibilities and skills
which obviously have no expected relationships. While there are
obviously other groupings which could have been chopc.u those
presented here were based on issues such as diverse methods of
acquiring systems, or unrelated job responsibilities and skills
(see section 6.3). „
This information demonstrated that the questionnaire was
measuring the same thing across a diverse sample population.
These results helped to substantiate the claim that the
questionnaire was a reliable measuring instrument. There is no
reason to suspect that the exclusion of th<~ correlation
coefficients of any other combination of variables (complete
details are provided in appendix 'L ') has introduced bias into
this conclusion. • "
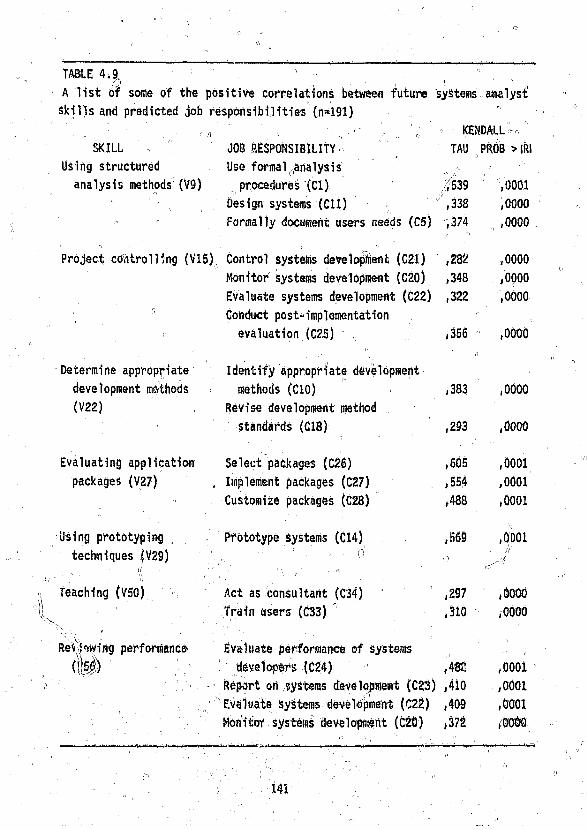
. P ■ " " r' nA list of some of the positive correlations between future systems analyst
TABLE 4.9 '
skills and predicted job responsibilities (n=191)
SKILL
Using structured
analysis methods (V9)
JOB RESPONSIBILITY
Use formal analysis *
procedures (Cl) ,539
Design systems (Cl1) ,338
Formally document users needs (C5) ,374
KENDALL
TAU PROiB > IRI
Project controlling (V‘15) Control systems development (C21) ,282
Monitor systems development (C20) ,348
Evaluate systems development (C22) ,322
" Conduct post-implementation
evaluation (C2.5) ,356
Determine appropriate
development methods
(V22)
,0001,0000
,0000
,0000
,0000,0000
,0000
Identify appropriate development
methods (CIO) ,383 ,0000
Revise development method
standards (C18) ,293 ,0000
Evaluating application
packages (V27)
Select packages (C26)
Implement packages (C27)
Customize packages (C28)
,605
*554
,488
,0001
,0001
,0001
Using prototyping
techniques (V29)
Prototype systems (C14) ,569 ,0001
Teaching (V50) Act as consultant (C34)
Train users (C33)
,297
,310
,0000,0000
Rev {wing perforrtance
( t o ;
Evaluate performance of systems
developers (C24)
Report on systems development
Evaluate systeos (C22)
Monitor systems developmertt (020)
,48”
,410
,409
,372
,0001
,0001
,0001
,0000
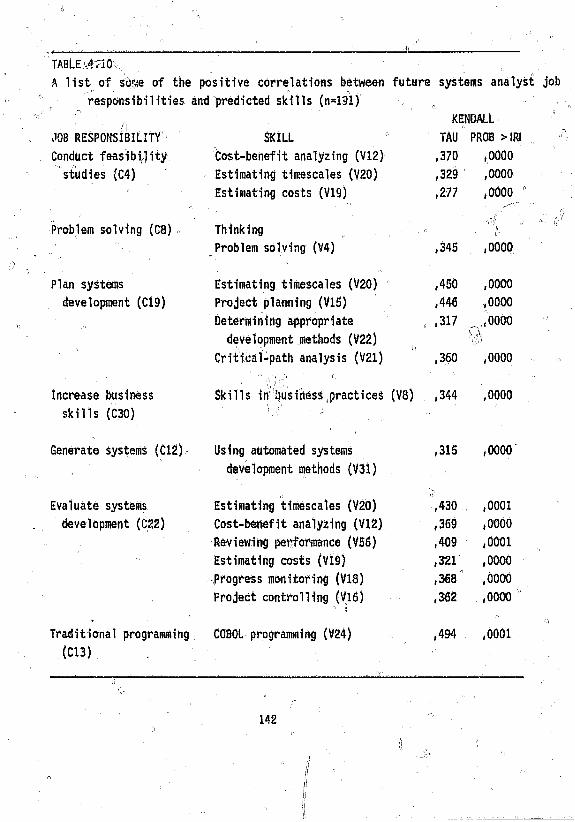
TABLE 4.10
A list of s'owe of the positive correlations between future systems analyst job
responsibilities and predicted skills (n=131) ,
JOB RESPONSIBILITY
Conduct feasibility
studies (C4)
Problem solving (C8)
SKILL
Cost-benefit analyzing (V12)
Estimating timescales (V20)
Estimating costs (V19)
Thinking
Problem solving (V4)
KENDALL
TAU PROS > IRI
,370 ,0000
,329
,277
,0000,0000
■rJi
,345 ,0000
Plan systems Estimating timescales (V20) ,450 ,0000
development (C19) Project planning (VI5) ,446 ,0000
Determin i ng appropr1ate „ ,317 ,0000
development methods (V22) %
Critical-path analysis (V21) ,360 ,0000
Increase business Skills in iiusihess practices (V8) ,344 ,0000
skills (C30)
Generate systems (Cl2) Using automated systems
development methods (V31)
,315 ,0000
Evaluate systems Estimating timescales (V20) ,430 ,0001
development (022) Cost-benefit analyzing (V12) ,369 ,0000
Reviewing performance (V56) ,409 ,0001
Estimating costs (V19) ,321 ,0000
Progress monitoring (V18) ,368 ,0000
Project controlling (V16) ,362 ,0000
Traditional programming COBOL programming (V24) ,494 ,0001
(C13)
142
I
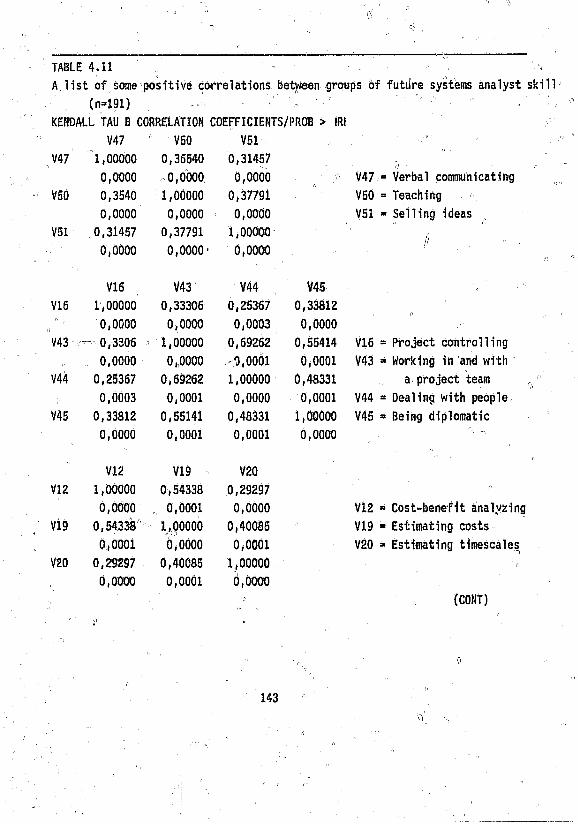
G
TABLE 4.11 ( s
A list of some positive correlations between groups of future systems analyst skill
„ (n=191) . -■■■■ - - "I ' r
KENDALL TAU B CORRELATION COEFFICIENTS/PROB > IRI
V47 c VSO V51
V47 1,00000 0,36540 0,31457 r) -0,0000 0,0000 0,0000 V47 = Verbal communicating
vso 0,3540 1,00000 0,37791 V50 = Teaching
0,0000 0,0000 0,0000 V51 = Selling ideas
V51 0,31457 0,37791 1,00000 [j, ' 0,0000 0,0000 • 0,0000
if - "
V16 V43 V44 V45
VIS 1,00000 0,33306 0,25367 0,33812
0,0000 0,0000 0,0003 0,0000
V43 0,3306 1,00000 0,69262 0,55414 V16 = Project controlling
0,0000 0,(0000 0,0001 0,0001 V43 = Working in and with
V44 0,25367 0,69262 1,00000 0,48331 a project team
0,0003 0,0001 0,0000 0,0001 V44 -• Dealing with people
V45 0,33812 0,55141 0,48331 1,00000 V45 =» Being diplomatic
0,0000 0,0001 0,0001 0,0000
V12 V19 V20
VIE 1,00000 0,54338 0,29297 -•
0,0000 r, 0,0001 0,0000 V12 = Cost-benefit analyzing
V19 0,54338 1,00000 0,40085 V19 = Estimating costs
0,0001 0,0000 0,0001 V20 = Estimating timescales
VZO 0,29297 , 0,40085 1,00000
0,0000 0,0001 0,0000
(COHT)
143
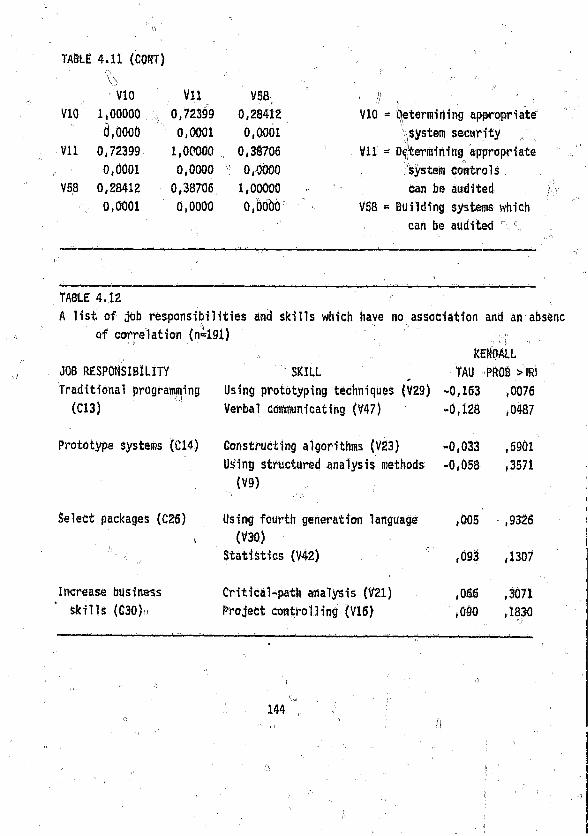
TABLE 4.11 (CONT)r\\>VIO Vll V58
V10 1,00000 ;;- 0,72399 0,28412
0,0000 0,0001 0,0001
Vll 0,72399 1,00000 0,38706
0,0001 0,0000 0 0,0000
V58 0,28412 0,38706 1,00000
0,0001 0,0000 0,0000
' : < VIO = Determining appropriate
system security ,
Vll = Determining appropriate
system controls
can be audited
V58 = Building systems which
can be audited 7
TABLE 4,12 - „
A list of jbb responsibilities and skills which have no association and an absenc
of correlation (n=191) : t
, KENPALL
JOB RESPONSIBILITY SKILL __ TAU PROB >!R)
Traditional programming Using prototyping techniques (V29) -0,163 ,0076
(C13) Verbal communicating (V47) , -0,128 ,0487
Prototype systems (C14) Constructing algorithms (V23)
Using structured analysis methods
(V9)
*•0,033
-0,058
,5901
,3571
Select packages (C26)
, «
Using fourth generation language
(V30)
,005 ,9326
Statistics (V42) ,093 ,1307
increase business Critical-path analysis (V21) ,066 ,3071
skills (C30) Project controlling (V16) ,090 ,1830
A
144
4.3.1.2 VALIDITY
To helpv establish the level pf certainty which can be attributed to the
. conclusions of this research, the questionnaire was assessed as a
• measuring instrument in terms of its:
^ face validity, z'
_ criterion validity, and
,r construct validity.
f (i) FACE VALIDITY (also called CONTENT VALIDITY by Kerlingei 97J,
p.459) '1 ’ -
Face validity results from the careful and systematic building of
the questionnaire (Goode and Hatt, 1952, p.237; Iv.es et
al., 1983, p.788). The extent to which this has been
achieved for any particular measuring instrument is based on
a subjective assessment and excludes the use of statistics
(Nunnally, 1970, p.138). The questionnaire used in this
study was carefully designed and built:
- each section automatically led to the next to help focus the
" respondent's attention on the skills required by the
systems analyst of the future (see section 4.2.2);
„ - the dimensions of each question were derived directly from
information gathered from the practitioner and
| academic experts (see section 4.2.2);
- before the questionnaire was distributed to the practising
"■ systems analysts, each individual question was
n evaluated for content, validity and clarity by those
participating in the pilot study (see section
'. ' ; 145 ' ■
4.2.2.3).
On the strength of these judgemental issues, face validity
was claimed for the questionnaire." , -
(ii) CRITERION VALIDITY ," ' 0 . ,
Because of the exploratory nature of the research (see section
3.2.3) the criterion validity of the questionnaire could not
be established by comparing the results of the survey with
currently known facts (Kerlinger, 1973, p.460). Although a
comparison was made between the skills identified in the
empirical study with those identified through the literature
survey, 2 points must be noted:
(a) The skills identified in, the literature could not bo
regarded as representing the opinions of practising
systems analysts in medium to large I.S. iepartments
in South Africa. Consequently, even if there had
been a high level of agreement, it could riot have been
used to substantiate content validity.
(b) in fact, when this comparison was made, Some areas of
disagreement were identified (see section 7.3.1).
(iii) CONSTRUCT VALIDITY
Bailey claimed that in order to establish this category of
validity is difficult, if not impossible for the
questionnaire as a whole (Bailey, 1982, p.178).• It has been
argued further that:
146
D
a final claim of construct validity cannot be made until the questionnaire and theory (behind it) have been subjected to several alternative forms of testing with consistent findings' (Ives et al., 1983, pp.788 and 789).
Because of the nature of this research,, which was not
testing a specific theory but rather exploring trend (see section
3.2.3), construct validity for the questionnaire could not be
established.
4.3.1.3 SUMMARY OF RELIABILITY AND VALIDITY
Although a final demonstration of the validity of the measuring
instrument is not possible within1 one study, '''the arguments above do
provide evidence for claiming reliability1 and validity' of the
questionnaire. Consequently-The data collected can be used with ' , '
confidence to represent the opinions of the sample population (see
Baroudi and Ginzberg, 1986, p.550).
,/ "
4.3.2 ATTEMPTS TO COUNTER THE LIMITATIONS OF USING A QUESTIONNAIRE
Bailey identified typical sources of error when using questionnaires
(Bailey, 1982, pp.Ill and 112). Based on his ideas, potential problems
of this research are listed below, together with the steps taken to
counter their effect.
POTENTIAL PROBLEM Ii The approach for data may not have been regarded
as legitimate.
COUNTER! All correspondence hsd official letterheads and the return
.. 147
address for the questionnaires was the institution through which the
research was done. , ' '
POTENTIAL PROBLEM 2: The value of the research may,not have been
appreciated by individuals in the sample population.
COUNTER: In the covering letter the respondent's attention was drawn to
the value of the research (see appendix *F ').
POTENTIAL PROBLEM 3: The respondent may have regarded the questions
being asked them as an invasion of their privacy.
COUNTER: The anonymity of the respondent was assured.
POTENTIAL PROBLEM 4*. The questions about the future skills of a systems ' „ ° .. 0 ■
analyst, whose role is changing, may have been regarded as too general
and vague. / ,
COUNTER: Those participating in the pilot study were specifically asked
to assess each question in this context. They reported no problems in
this regard. ’
POTENTIAL PROBLEM 5: The respondents may not have felt that the correct
questions were being,asked. 11
COUNTER: Space was provided on the questionnaire for the respondents to
comment and/or add their own ideas regarding the subject.
POTENTIAL PROBLEM 6: The respondents may have tried to provide the
information they thought was wanted.
COUNTER: Although this problem may not have been countered completely,
no questions were asked which could be regarded as 'sensitive' and the
anonymity of the respondents was assured.
POTENTIAL PROBLEM 7: The respondents may not have wanted to reveal
their ignorance.
COUNTER: In the covering letter and on the questionnaire, it was
pointed out that there were no right or wrong answers but each
individual's opinion was bf value. '■ o ■■ S')
POTENTIAL PROBLEM 8: Data collected through mailed questionnaires is
likely to be corrupted by response bias (particularly the central
tendency and halo effect (see Kerlinger, 1973, pp.548 and 549)).
COUNTER: The questionnaire was constructed so that scores were in
different directions from section to Section (and for random questions
within section 2 (see appendix 'G')),
(NOTE: This scoring in different directions confused some
respondents who needed to correct their answers. One participant
wrote specifically to express his irritation.)
POTENTIAL PROBLEM 9: The sample population did not include systems
analysts working for some government or semi-government organizations
(see section 4.2.3.2).
COUNTER: A small number of random telephone interviews established that
the activities of the systems analysts working on business applications
in these environments were in no way different from those who were
- p ,
■ V
149
-II r.
II
included in the sample population.
4.3.3 LIMITATIONS OF THE EMPIRICAL RESEARCH.'I : jl ,
It is recognized that the following limitations of using a questionnaire
to collect accurate data for this research were not countered:
(i) Apparently a significant amount of research related to the* .
computer industry has been, attempted recently. One expert claimed
that, in his company, requests to / "'■pond to questionnaires aire
received almost weekly (Evans, 1985). There was evidence,■ , j;
therefore, that a situation of survey saturation was possibly
being approached. This could have accounted for a percentage of
non-responsa. '
(ii) Because the exact sample population was not known, direct contact
with participants was problematic. As a direct consequence, for
example, a follow-up of non-respondents, either to encourage them
to reply to the questionnaire (Bailey, 1982, p.171) or to identify
whether they held any opinions which would have influenced the
'<■ conclusions of the research, was sufficiently difficult as to be
abandonedi
(iii) When mailed questionnaires are used to collect data, it is not
possible to probe respondents to identify their answers (Bailey,
1982, p*lS7)* This limitation could have influenced this
research in four ways:
- It was not possible to ensure that the respondents used
j a r g M ; cdtisistently (e.g. words like ‘change agent* and
• deve 1 opnient centre1).
n
ISO
- , It was not possible to establish whether the opinions
expressed by the respondents reflected what they really
thought about the future of systems analysis, rather than- J ■
what they hoped woufd be the future of systems analysis.
- it was not possible to determine how often participants
provided answers which were primarily reactive responses to
the stimulus of the questionnaire, rathcsr than considered
opinions about the future of their industry.
- It was not possible to control the characteristics of the
respondents in terras of such factors as experience,
education or cognitive style - any of which may have
influenced the responses (see section 4.2.3 and section
5.2.2.1.5). "
In a rapidly evolving technological industry it is likely that the
environment in which any one individual is employed will remain
relatively stable for a period of time (etg. while purchased
equipment or tools are being amortized) and then change
dramatically (e.g. when new equipment or tools are acquired).
The perceptions of an individual employee could be influenced
significantly by the current status of the environment in terms of
this technological 'leap-frogging'. It could not be established
whether the respondents had recently undergone, or were just about
to experience a dramatic technological change in their work
environment.
From the replies received, it was possible to identify cases where
the respondent demonstrated the lack of a clear understanding of
the definition of a 'skill'. Although a definition was provided
on the first page of the questionnaire, some respondents indicated
that they thought BEING AWARE OF (e.g. User department politics)
or KNOWLEDGE OF (e.g. office procedures) were required systems
analysis skills (see section 2.1.1.4).
(vi) The opinions held by the participants in the empirical research
were to be compared and contrasted with opinions identified in the , 'n " . 1
__literature survey. Consequently no effort was made to alter the- n r '— ^ M-
'l dimensions of the questionnaire (which was based on expert
‘ ^ opinion), in the light of ideas and opinions expressed in the
') literature. On one hand this was a limitation because the
opinions of the practising systems analysts on the value of
certain skills remained unknown. On the other hand, however, it
made the contrasting of the two conceptual skills models more
pronounced (see section 7.3.1).
4.4 SUMMARY OF THE CHAPTER * ’
This chapter provided details of the procedures followed to collect data
for the building of the empirically based job responsibilities/skills
model.
The objective of the questionnaire, the steps followed in
constnictiitg the questionnaire and the structure of the questionnaire,
were explained.
Details were given of how the sample population were identified,
and of the steps followed to distribute the questionnaire to
approximately 20% of the practising systems analysts in the South
162
African computer industry* ,
The middle sections of the chapter provided details of the
response to the questionnaire. They showed that the 39% response rate
(159 responses were used) could be regarded as representative of the
South African systems analysts.
The chapter closed with an attempt to evaluate the research
procedure in terms of the effectiveness of the questionnaire as a
measuring instrument, and by detailing the steps fallowed to counter the
limitations of using a mailed questionnaire to gatiier the data.
It is conceded that there were limitations associated with the
research procedures followed. Sufficient evidence existud however, to
demonstrate that the data, collected to identify opinions (rather than
absolute exactness), could be used with confidence as the opinions of
the sample. .
! The next chapter describes the way the data were processed to
compare the opinions of groups of respondents and to build the job
responsibilities/skills model.
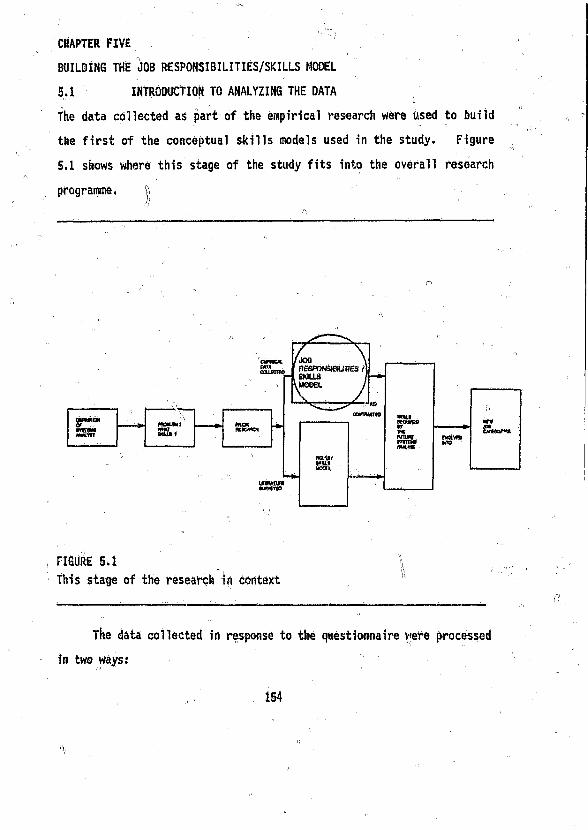
CHAPTER FIVE
BUILDING THE JOB RESPONSIBILITIES/SKILLS MODEL
5.1 INTRODUCTION TO ANALYZING THE DATA
The data collected as part of the empirical research were Used to build
the first of the conceptual skills models used in the study. Figure
5.1 shows where this stage of the study fits into the overall research
programme. |
GVWIOt MCRIWKMQ1WMtVIT *1*1.Mill
FIGURE 5.1
This stage of the research in context
The data collected in response to the questionnaire were processed
in two ways.*
154
(i) The opinions of the three groups of respondents (academic experts,
practitioner experts and practising systems analysts) were
; compared and contrasted. Doing this met one of the objectives of
the research (see section 1.5 and 3.1).
(ii) As the next step towards identifying the skills of the future
systems analyst, the ,data Were used to build the job
responsibilities/skills model. ’
5.2 COMPARISONS OF RESPONDENTS' OPINIONS
In an effort to identify if there were any significant differences
between the perceptions of the skills profile of the future systems
analyst (which could lead, for example, to unset expectations in career
palh planning or on-the-job training) within the South African computer
industry, the opinions of the respondents were compared and contrasted.
These comparisons were done by postulating a number of hypotheses. For
each comparison the null hypothesis was that the respondents could not
be said to disagree on the significance of a particular variable to the
future systems analyst, and the alternate hypothesis was that the groups
of respondents disagreed. These tests were done, firstly, on the
respondents' opinions oh the future job responsibilities of the systems
analysts and then on the Skills required by the systems analyst of the
future (see figure 5.2).
155
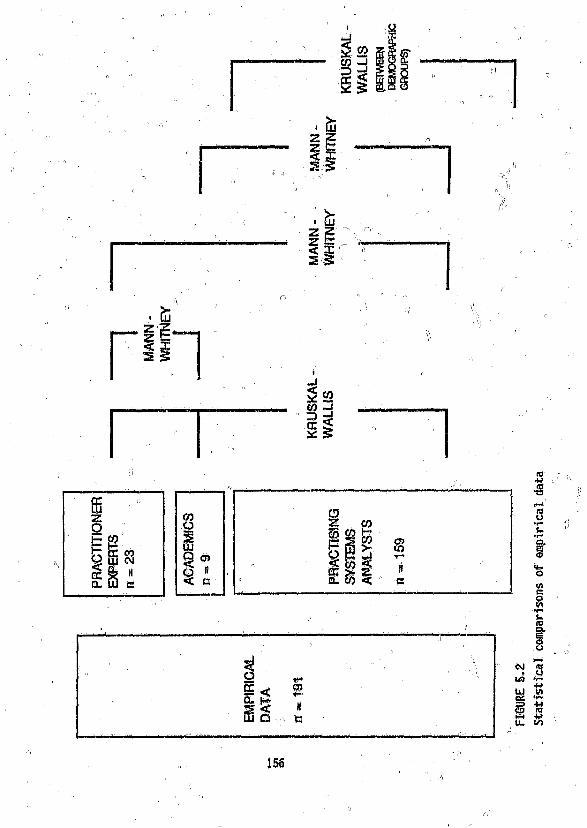
z z<ft
■z z<25'
i [jj
F i n
iCO3ccSt: £
COo■55UJQ CD<C<3 *< e
>* z, t£ m <
mtoT*He
03+#l!0fOo
cu8d>
WSa
•r*
feA3
§
CM m• u
ttf) *r*iUJ V)g£ *r»
s> <£S Stu 00
155
5.2.1 THE RESPONDENTS' OPINION ON THE FUTURE JOB RESPONSIBILITIES
OF THE SYSTEMS ANALYST. 5. \l. r, .
Details of the data collected from the questionnaires are provided in1
appendix 'C1 (the opinions of the experts) and appendix ’H' (the
opinions of the” practising systems analysts), with descriptive
statistics on sections 4 and 5 of the questionnaire being provided in
appendix''K'. In this section the opinions of the sample population
concerning the job responsibilities of the future systems analyst will
be established. ,
Initially statistical tests were used to isolate areas of " " .. - 'I '
disagreement and, where areas of disagreement could not be identified#\
the median scores were used to represent the opinions of the sample
population (Freund and Williams, 1977, p.28).
5.2.1.1 AREAS OF DISAGREEMENT CONCERNING THE FUTURE JOB
RESPONSIBILITIES OF THE SYSTEMS ANALYST
In an effort to isolate the areas of disagreement concerning the future
job responsibilities of the systems analyst, the following steps were
taken:
(i) The sample population was divided into its constituent groups
(practitioner experts, academic experts and practising systems
analysts). 1
(ii) For each dimension: ))'
- HO - ho difference of opinion (groups could not be said to
disagree)
- HI - difference of opinion (groups disagree). 1
157
5,2.1.1.1 THE RESULTS OF TESTS USING ALL THE DATA
(i) STATISTICAL PROCESSES .
r .. ° !- ' j["'
As a dir’ect result of the method of building the questionnaire
(which was constructed after the opinions of the experts had been
identified), eight of the thirty-five dimensions in sections 4
were changed, and the order of presenting the questions was
altered (see section 4.2.2.3). The opinion of each respondent (in
each group of the sample population) to each dimension common to
both questionnaires was processed using the Kf’Uskal-Wallis Test.
Table 5.1 details those dimensions for which the null hypothesis
had to be rejected. Provided the differences in the
questionnaires did not influence the replies, it can be claimed
that in each of these cases there was disagreement on the .relative
importance of the job responsibilities of the systems analyst of
the future. 11 ,
(ii) ANALYSIS OF THE RESULTS OF THE TESTS
From the opinions of the three groups within the sample
population, three specific areas of disagreement were identified:
(a) The significance of the traditional areas of analysis in
future job responsibilities
e.g. conduct feasibility studies,
produce detailed specifications.
(See section 3.6.2.2.)
158
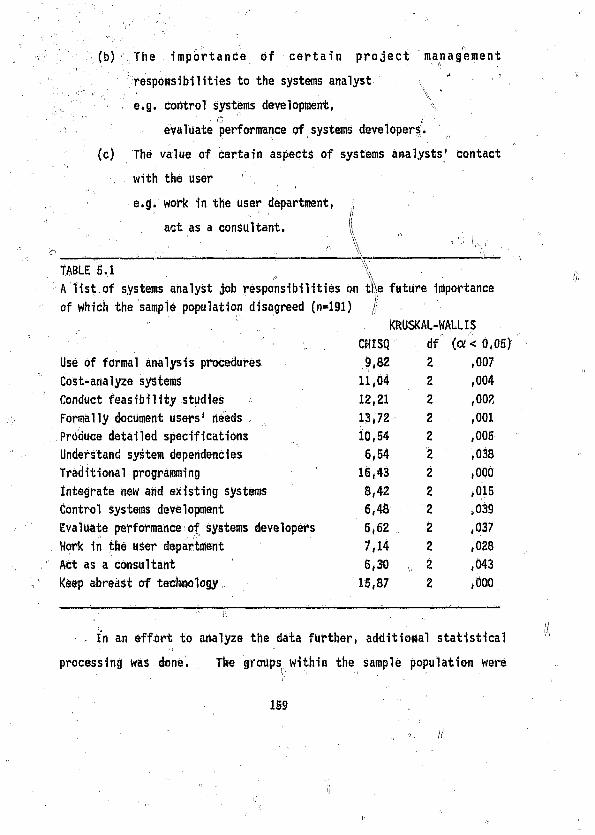
(b) The importance of certain project management
responsibilities to the systems analyst , ' r
e.g. control systems development, \■ . O ' ■■ , -■
evaluate performance of systems developer?.
(c) The value of certain aspects of systems analysts' contact
with the user 1
e.g. work in the user department, ij- , ' ' /1
act as a consultant. I
_ _____________________________________________________- \ "
TABLE 5.1 , \ ,
A list of systems analyst job responsibilities on tMe future importance
of which the sample population disagreed (n=191) //
. ' KRUSKAL-WALLIS
CHISQ df (or< 0,(
Use of formal analysis procedures 9,82 2 ,007
Cost-arialyze systems 11,04 2 ,004
Conduct feasibility studies 12,21 2 ,002
Formally document users1 needs 13,72 2 ,001
Produce detailed specifications 10,54 2 ,005
Understand system dependencies 6,54 2 ,038
Traditional programming 16,43 2 ,000
Integrate new and existing systems 8,42 2 ,015
Control systems development 6,48 2 ,039
Evaluate performance of systems developers 6,62 2 ,037
Work in the user department 7,14 2 ,028
Act as a consultant 6,30 V 2 ,043
Keep abreast of technology 15,87 2 ,000
, ' rt . .
In an effort to analyze the data further, additional statistical
processing was done. The groups within the sample population Were
189
a
, fi •; ”0 ' "
paired, and the opinions of these pairs of groups were compared in order
to identify further areas of disagreement and the directioii of the
disagreement (see figure 5.2). '
■ - ' . '
5*2.1.2 A COMPARISON OF EXPERT OPINION ;
The data collected from the experts is presented in detail in appendix
' C . These data were processed by identifying job responsibilities:
- on which a broad spectrum of opinion was held;
- for which there was statistically supported evidence of
disagreement.
(i) BROAD SPECTRUM OF OPINION ^
Table 5.2'' is a list of job responsibilities on which expert
opinion covered the five categories in the range from ‘very " * ' ’ c‘ '' >
important1 to ‘not important*. This list included
responsibilities from each group of activities which could
constitute the analyst's job. This appeared to be sufficient0 ' ;; , ■
evidence to conclude that experts disagreed among themselves on the
job responsibilities of the future systems analyst,
(ii) STATISTICAL TESTS FOR DISAGREEMENT
For each dimension, the opinion of each respondent in each of the
expert groups was processed using the Mann-Whitney U Test (see
section 3.6.2.2).
For each dimensions
BO - no difference of opinion (groups could not be said to disagree
160
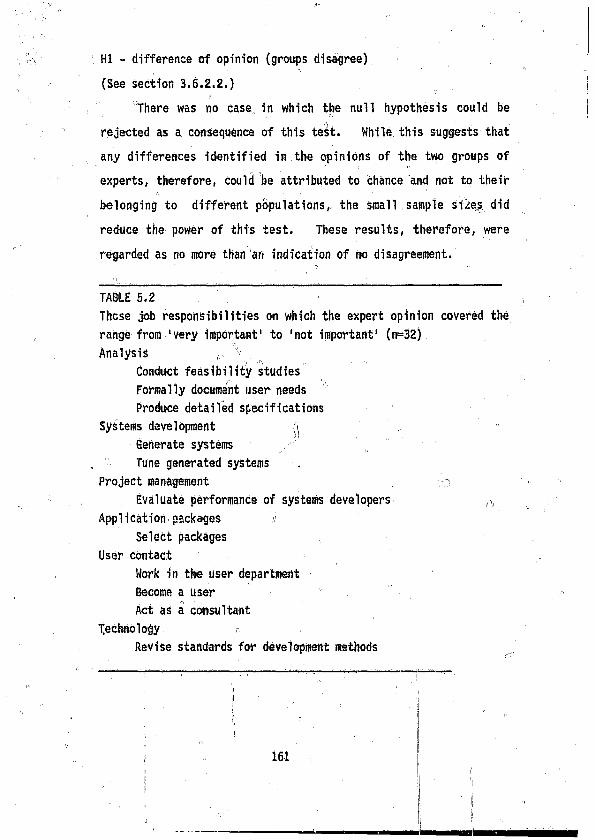
HI - difference of opinion (groups disagree)
(See section 3.6.2.2.)
There was no case in which the null hypothesis could be
rejected as a consequence of this test. While this suggests that
any differences identified in the opinions of the two groups of
experts, therefore, Could be attributed to chance and not to their
belonging to different populations, the small sample si2es. did
reduce the power of this test. These results, therefore, were
regarded as no more than ari indication of no disagreement.
TABLE 5.2
These job responsibilities on which the expert opinion covered the
range from 'very important' to 'not important' (n=32)
Analysis v.
Conduct feasibility studies
Formally document user needs '
Produce detailed specifications
Systems development f j
Generate systems
TUne generated systems .
Project management o
Evaluate performance of systems developers r.
Application packages ;/
Select packages
User contact
Work in the user department
Become a user ,
Act as a consultant
Technology
Revise standards for development methods
161
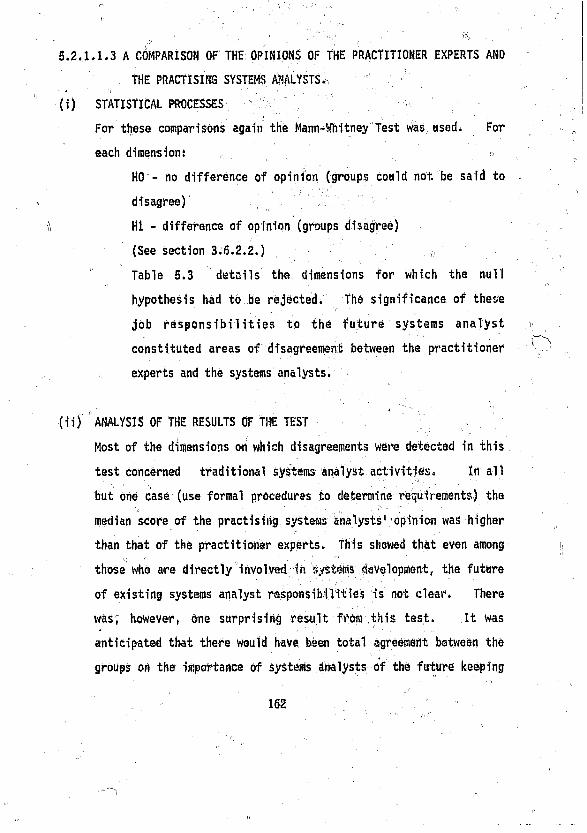
5.2.1.1.3 A COMPARISON OF THE OPINIONS OF THE PRACTITIONER EXPERTS AND
THE PRACTISING SYSTEMS ANALYSTS.,
(i) STATISTICAL PROCESSES
For these comparisons again the Mann-Whitney Test Was used. For
each dimension: „ »
HO - no difference of opinion (groups could not be said to
disagree)
Hi - difference of opinion (groups disagree)
(See section 3.6.2.2.) 0
Table 5.3 details the dimensions for which the null
hypothesis had to be rejected. The significance of these
job responsibilities to the future systems analyst
constituted areas of disagreement between the practitioner
experts and the systems analysts.
(ii) ANALYSIS OF THE RESULTS OF THE TEST
Most of the dimensions on which disagreements were detected in this
test concerned traditional systems analyst activities. In all
but one case (use formal procedures to determine requirements.) the
median score of the practising systems analysts' opinion was higher
than that of the practitioner experts* This showed that even among
those who are directly involved in systems development, the future
of existing systems analyst responsibilities is not clear. There
was, however, one surprising result from this test. It was
anticipated that there would have been total agreement between the
groups oft the ■importance of systems analysts of the future keeping
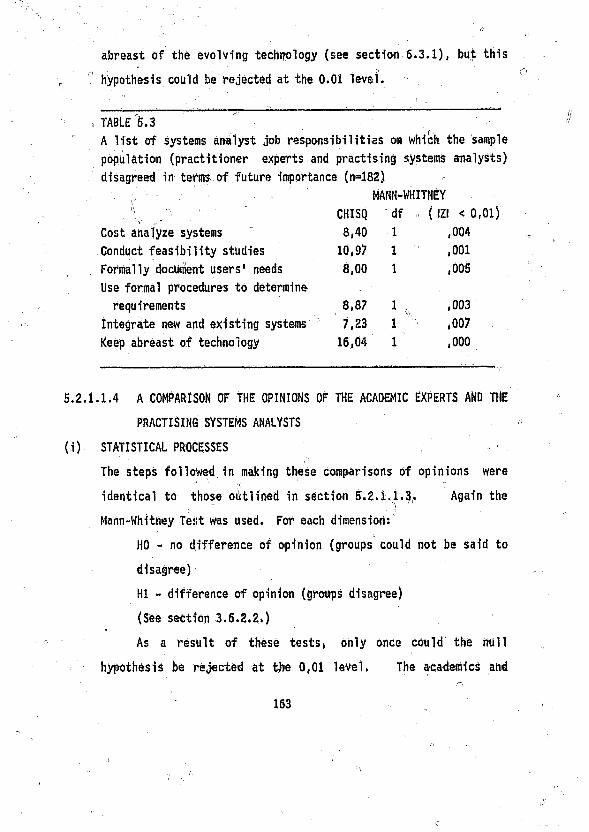
abreast of the evolving technology (see section 6.3.1), but this
hypothesis could be rejected at the 0.01 level.
, TABLE 5.3
A list of systems analyst job responsibilities on which the sample
population (practitioner experts and practising systems analysts)
disagreed in terms of future importance (n=l82)
" MANN-WHITNEY .
■ - CHISQ df ( IZI < 1
Cost analyze systems 8,40 1 ,004
Conduct feasibility studies 10,97 1 ,001
Formally document users' needs 8,00 1 ,005
Use formal procedures to determine -
requirements 8,87 1 ,003
Integrate new and existing systems 7,23 1 ' ' ,007
Keep abreast of technology 16,04 1 ,000
.1.1.4 A COMPARISON OF THE OPINIONS OF THE ACADEMIC EXPERTS AND THE
PRACTISING SYSTEMS ANALYSTS
STATISTICAL PROCESSES ,
The steps followed in making these comparisons of opinions were
identical to those outlined in section 5.2.i.1.3. Again the
Mann-Whitney Test was used. For each dimension:
HO - no difference of opinion (groups could not be said to
disagree)
HI - difference of opinion (groups disagree)
(See section 3.6.2.2,)
As a result of these tests, only once could the null
hypothesis be rejected at the 0,01 level. The academics and
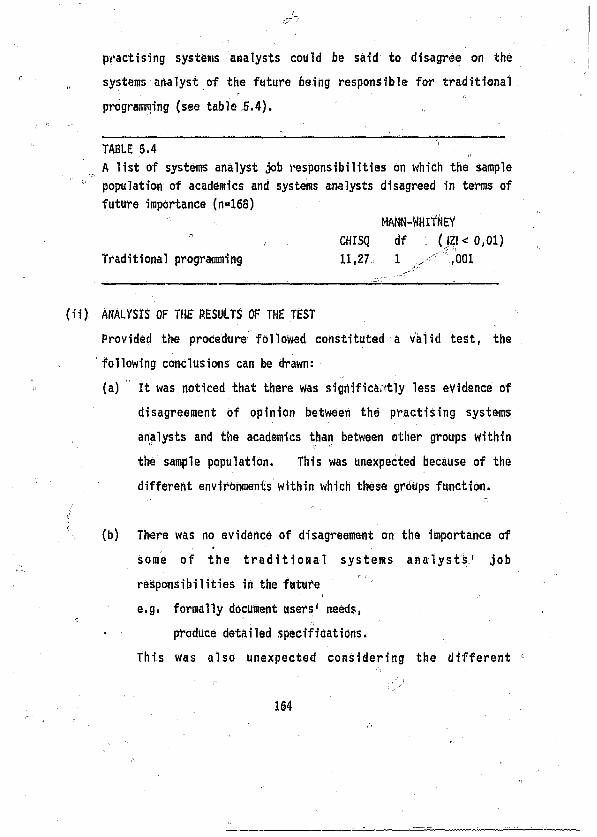
practising systems analysts could be said to disagree on the
systems analyst of the future being responsible for traditional
programming (see table 5.4). „
TABLE 5.4
A list of systems analyst job responsibilities on which the sample
population of academics and systems analysts disagreed in terms of
future importance (n=168)
h a n n-Whitney
” CHISQ df : ( IZI< 0,01)
Traditional programming 11,27 1 ,001
) ANALYSIS OF THE RESULTS OF THE TEST
Provided the procedure followed constituted a valid test, the
following conclusions can be drawn:
(a) It waS noticed that there was significantly less evidence of
disagreement of opinion between the practising systems
analysts and the academics than between other groups within
the sample population* This was Unexpected because of the
different environments within which these groups function.
(b) There was no evidence of disagreement on the importance of
Some of the traditional systems a n a l y s t s 1 job
responsibilities in the future
e.g. formally document users' needs,
• produce detailed specifications.
This was also unexpected considering the different
164
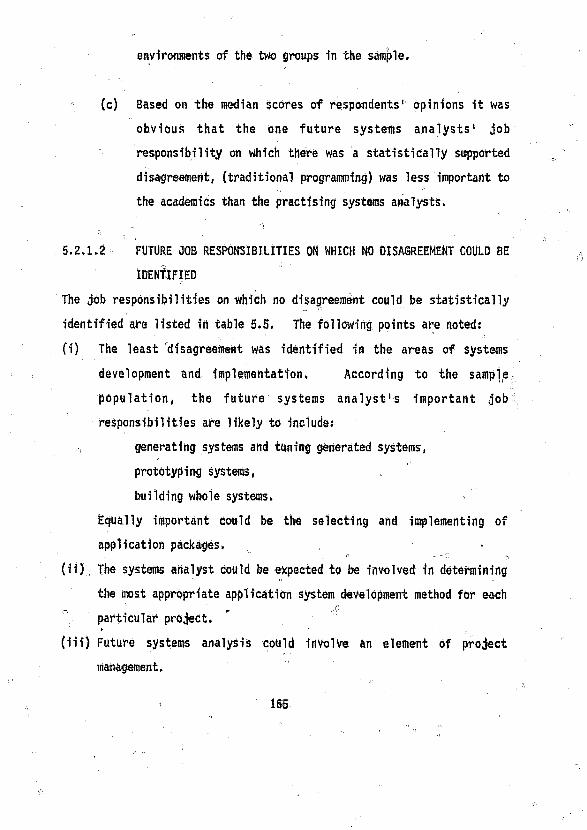
(c) Based on the median scores of respondents1 opinions it was
obvious that the one future systems analysts' job
responsibility on which there was a statistically supported
disagreement, (traditional programming) was less important to
the academics than the practising systems analysts.
5.2,1.2 FUTURE JOB RESPONSIBILITIES ON WHICH NO DISAGREEMENT COULD BE
IDENTIFIED
The job responsibilities on which no disagreement could be statistically
identified are listed ill table 5.5. The following points are noted:
(i) The least disagreement was identified in the areas of systems
development and implementation. According to the sample,
population, the future systems analyst's important job
responsibilities are likely to includes
, generating systems and tuning generated systems,
prototyping systems,
building whole systems.
Equally important Could be the selecting and implementing of
application packages. •
(ii) The systems analyst could be expected to be involved in determining
the most appropriate application system development method for each_ ' ^ js\
particular project.
(iii) Future systems analysis could involve an element of project
management.
environments of the two groups in the sample.
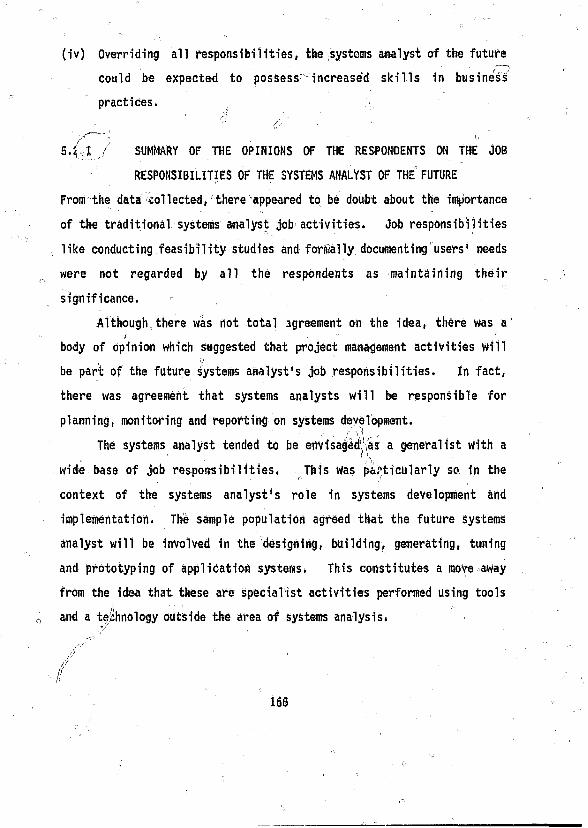
(iv) Overriding all responsibilities, the systems analyst of the futuref.---")
could be expected to possess increased skills in business
practices.
- . ! :' X''”’"" * I'-,
5.2 I / SUMMARY OF THE OPINIONS OF THE RESPONDENTS ON THE JOB
RESPONSIBILITIES OF THE SYSTEMS ANALYST OF THE FUTURE
From the data collected, there appeared to be doubt about the importance
of the traditional systems analyst job activities. Job responsibilities
„ like conducting feasibility studies and formally documenting users' needs
were not regarded by all the respondents as maintaining their
significance.
Although there was not total agreement on the idea, there was a t ' "
body of opinion which suggested that project management activities will )) " .
be part of the future systems analyst's job responsibilities. In fact,
there was agreement that systems analysts will be responsible for
planning, monitoring and reporting on systems development.
The systems analyst tended to be envisaged as a generalist with a
wide base of job responsibilities. This was particularly so in the
context of the systems analyst's role in systems development and
implementation. The sample population agreed that the future systems
analyst will be involved in the designing, building, generating, tuning
and prototyping of application systems. This constitutes a move away
from the idea that these are specialist activities performed using tools
and a technology outside the area of systems analysis,
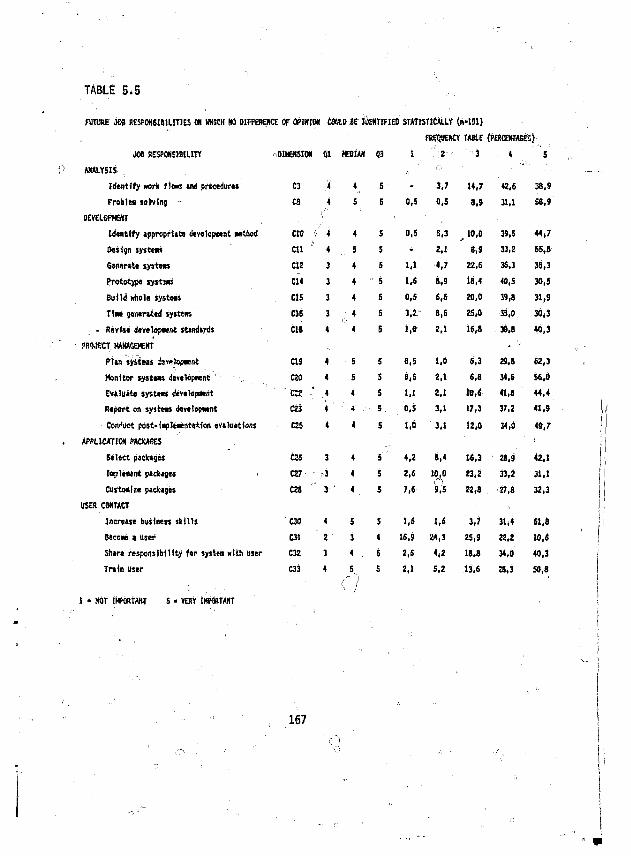
TABLE 5.5
FUTURE JOS RESPONSIBILITIES OH MUCH NO DIFFERENCE OF OPINION COULD 0E IDENTIFIED STATISTICALLY (n-101)
FREtyina m u (percentages}
JOB RESPONSIBILITY
ANALY5IS
DIMENSION 91 KOIAN Q3 : '2"' ■■ 3 4 5
Identify work flew and procedures C3 4 5 - 3,7 14,7 42,6 38,9
Problem solving C3 , 5 5 0,5 0,5 3,9 31,1 S3,9
DEVELOP*NT '
Identify appropriate deyelopmnt w t M CIO 4 5 0,5 5,3 „ 10,0 39,5 44,7
Design ijrstot Cll ' 5 5 - 2,1 8,9 33,2 55,8
Generate system C12 4 5 1,1 4,7 22, 6 36,3 35,3
Prototypo sys t w C M 4 1 5 1.6 8,9 18,4 40,5 30,5
Build whole system CI5 4 5 0,5 S,S 20,0 39,8 31,9
T i n generated system CIS 4 5 3.2 8,5 25,0 ■33,0, 30*3
• Revise developnent standards r
.miECT MANAGEMENT
CIS 4 5 1,0 2,1 16,8 39,8 40,3
P l m syiteai hsmiopmnt C19 5 5 0,5 1,0 6,3 29,8 62,3
Monitor systns developwnt , (20 5 5 0,5 2,1 6,a 34,6 SS,0
Evaluate systen devolopnnt " CC2 ' 4 5 1.1 2,1 10,S 41,8 44,4
Rtport on s y s t m devotopwnt 0 3 4 5 0,5 3,1 17,3 37,2 41,9
Conduct pbst-inplennuiion evaluetlons
APPLICATION PACKAGES
C25 4 S 1,0 3,1 12,0 34,0 49,7
Select packages czs 4 S’J 4,2 8,4 16,3 as,9 42,1
Inptei&ent paokajes ■■ C27 j 4 5 2*6 10,0 23,2 33,2 31,1
Custoalz* packages C2S 4 S 7,6 9,5 22,8 27,8 32,3
USES CONTACT
Increase business skills C30 5 5 1,6 1,6 3,7 31,4 61,8
Beccw a User C31 3 4 16,9 24,3 25,9 22,2 10,6
Share responsibility for systes with user C3Z 4 5 2,6 4,2 18,8 34,0 40,3
Train user
Q
I * HOT IMPORTANT 5 ■ VERY IWOSTAHT
C33 5 5
a
2.1 5,2 13,6 2S,3 50,8
157
While there Was doubt about some of the areas of contact between
systems analysts and the user, (e.g. working in the user department or
acting as consultants to the user)* there was no doubt about the
importance of systems analysts increasing their business skills. Each
group of the sample population rated this as an important future job
responsibility.
If these trends reflect the changing role of the systems analyst,
new skills will have to be developed for the systems analyst to meet'j' 1 ‘ ,
these job responsibilities.
5.2.2 THE RESPONDENTS' OPINION ON THE SKILLS REQUIRED BY THE
SYSTEMS ANALYST OF THE FUTURE
Details of the data collected from the questionnaires is provided in' . v 1 '
appendix 'C' (for opinions of the experts) and appendix 'I' (for [the
opinions of the practising systems analysts), with descriptive statistics
on sections 4 and 5 of the questionnaire being provided in appendix 'K'.■ ■ O '
In this section the opinions of the sample population concerning the
skills required by the future systems analyst will be established.
Again initially, statistical tests were used to isolate areas of
disagreement and, where areas of agreement were identified, the me d i m
scores were used to represent the opinions of the sample population
(Freund and Williams, 1977, p.28).
168
$.2.2.1 AREAS OF DISAGREEMENT CONCERNING THE SKILLS OF THE FUTURE
SYSTEMS ANALYST ,t
In an effort to identify the areas of disagreement concerning the skills
of the future systems analyst, the following Steps were taken:
(i) The sample population was divided into its constituent groups
(practitioner experts, academic experts and practising systems
analysts). ,
(Ii) For each dimension: ’
HO - no difference of opinion (groups could not be said to
disagree)
HI > difference of opinion (groups disagree)
(See section 3.6.2.2.)
5.2.2.1.1 THE RESULTS OF TESTS USING ALL THE DATA
(i) STATISTICAL PROCESSES
As a result of the method of building the questionnaire (which wasI'
constructed after the opinions of the experts had been identified);
nine of the fifty-seven dimensions in sections 5 were changed, and
• the order of presenting the questions was altered (see section
4.2.2.3). The opinion of each respondent (in each group of the
sample population) to each dimension common to both questionnaires
was processed using the Kruskal-Wallis Test. Table 5.6 details
those dimensions for which the null hypothesis had to be rejected.
Provided the differences in the questionnaires did not influence
the replies, it can be claimed that in each of these cases there
was disagreeiiient on the relative importance of the skills required
169
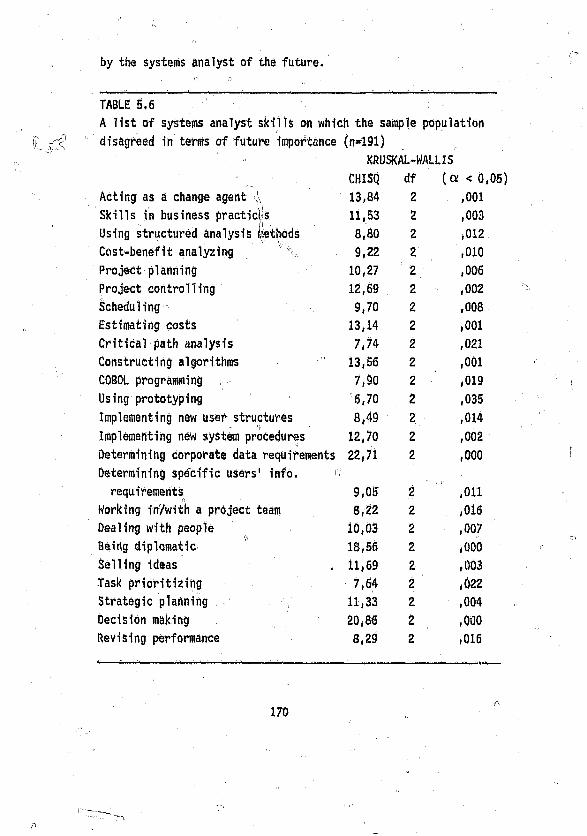
by the systems analyst of the future.
TABLE 5.6
A list of systems analyst skills on which the sample population
disagreed in terns of future importance (n=191)
KRUSKAL-WALLIS
CHISQ df (Q' < 0,05)
Acting as a change agent A 13,84 2 ,001
Skills in business practice's 11,53 2 ,003
Using structured analysis methods 8,80 2 ,012
Cast-benefit analyzing ; 9,22 2 ,010
Project planning 10,27 2 ,006
Project controlling 12,69 2 ,002
Scheduling 9,70 2 ,008
Estimating costs 13,14 2 ,001
Critical path analysis 7,74 2 ,021
Constructing algorithms 13,56 2 ,001
COBOL programming 7,90 2 ,019
Using prototyping 6,70 2 ,035
Implementing new user structures 8,49 2 ,014
Implementing new system procedures 12,70 2 ,002
Determining Corporate data requirements
Determining specific users1 info. >'
22,71 2 ,000
requirements 9,05 2 ,011
Working in/with a project team 8,22 2 ,016
Dealing with people 10,03 2 ,007
Being diplomatic 18,56 2 ,000
Selling ideas , 11,69 2 ,003
Task prioritizing 7,64 2 ,022
Strategic planning , 11,33 2 ,004
Decision making 20,86 2 ,000
Revising performance 8,29 2 ,016
170
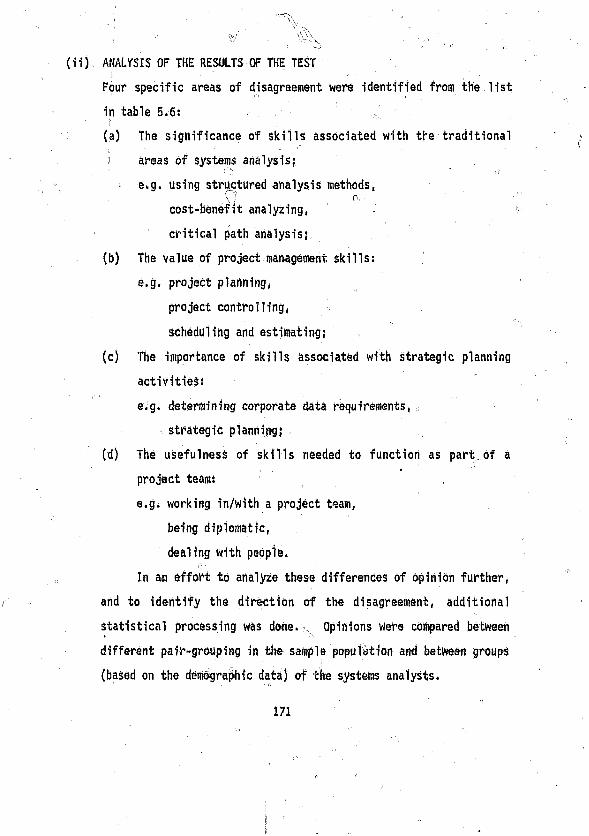
' '"-y "
w \\S\ .,
(ii) ANALYSIS OF THE RESULTS OF THE TEST
Four specific areas of disagreement were identified from the list
in table 5.6:
(a) The significance of skills associated with the traditional
’ areas of systems analysis;
e.g. using structured analysis methods,Q ’ p ■ 1
cost-benefit analyzing,
critical path analysis;
(b) The value of project management skills:
e.g. project planning,
project controlling,
scheduling and estimating;
(c) The importance of skills associated With strategic planning
activities:
e.g. determining corporate data requirements, ,
strategic planning;
(d) The usefulness of skills needed to function as part of a
project team:
e.g. working in/with a project team,
being diplomatic,
dealing with people.
In an effort to analyze these differences of opinion further,
and to identify the direction of the disagreement, additional
statistical processing was done. Opinions were compared between
different pair-grouping in the sample population and between groups
(based on the demographic data) of the systems analysts.
171
5.2.2.1.2 A COMPARISON OF EXPERT OPINION -' . ' ' - . 0
Details of the replies from the experts are given in appendix 'C. In
this section the data are processed in two ways:
- in terms of the breadth of opinion the experts held on the
significance of each skill;
- using statistics to identify areas of actual disagreement.
(i) BROAD SPECTRUM OF OPINION
Table 5.7 is a list of skills on which expert opinion covered the
five categories in the range from ’very .important' to 'not
important'. The diversity of the skills in this list suggested
i that the experts disagreed among themselves On the skills required
by the systems analyst of the future. ;
(ii) TESTING THE LEVEL OF DISAGREEMENT AMONG THE EXPERTS
For each dimension, the opinion of each respondent iii each of the
expert groups was processed using both the Mann-Whitney U Test (see' C'' 1
section 3.6*2.2). Again in each case:
HO - no difference of opinion (groups could not be said to
disagree)
HI - difference of opinion (groups disagree). ,
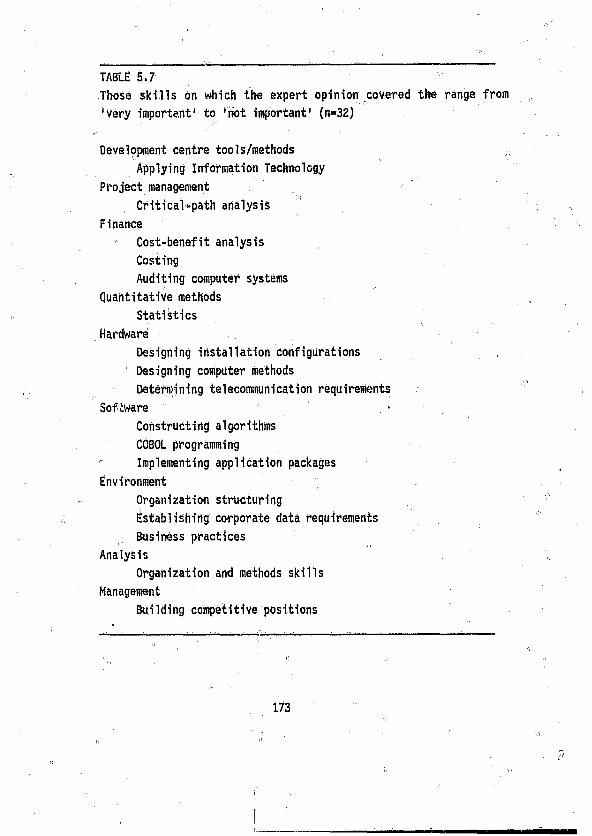
TABLE 5.7
Those skills on which the expert opinion covered the range from
'very important' to 'not important' (n=32)
Development centre tools/methods
Applying Information Technology
Project management .
Cfitical»path analysis
Finance
Cost-benefit analysis
Costing
Auditing computer systems
Quantitative methods
Statistics
Hardware
Designing installation configurations
Designing computer methods
Determining telecommunication requirements
Software •
Constructing algorithms
COBOL programming
n Implementing application packages
Environment
Organization structuring
Establishing corporate data requirements
Business practices
Analysis
Organization and methods skills
Management
Building competitive positions
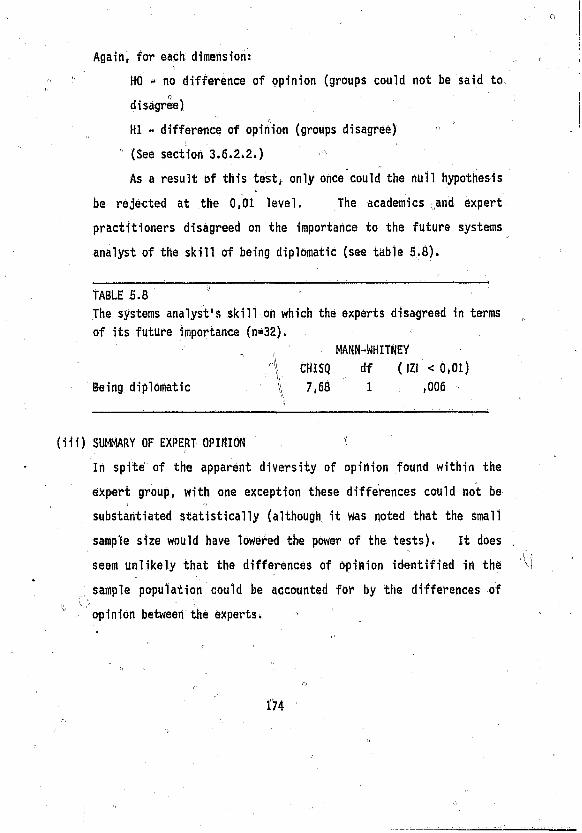
Again, for each dimension:
HO - no difference of opinion (groups could not be said to0
disagree)
Hi - difference of opinion (groups disagree) 1
(See section 3.6.2.2.)
As a result of this test, only once could the null hypothesis
be rejected at the 0,01 level. The academics Mand expert
practitioners disagreed on the importance to the future systems
analyst of the skill of being diplomatic (see table 5.8).
TABLE 5.8 '
The systems analyst's skill on which the experts disagreed in terms
of its future importance (n=32).
, , MANN-WHITNEY
CHISQ df (IZI <0,01)
Being diplomatic \ 7,68 1 ,006
(Hi) SUMMARY OF EXPERT OPINION '
in spite of the apparent diversity of opinion found within the
expert group, with one exception these differences could not be
substantiated statistically (although it was noted that the small
sample size would have lowered the power of the tests). It does
seem unlikely that the differences of Opinion identified in the
sample population could be accounted for by the differences of
opinion between the experts*
174
5.2.2.1.3 A COMPARISON OF THE OPINIONS OF THE PRACTITIONER
EXPERTS AND THE PRACTISING SYSTEMS ANALYSTS
(i) STATISTICAL PROCESSES
For comparison of opinions between these two groups again the
Mann-Whitney Test was used. For each dimension: '
HQ - n o difference of opinion (groups could not be said to
disagree)
HI - difference of opinion (groups disagree)
(See section 3,6.2.2.)
Table 5.9 details those dimensions for which the null
hypothesis had to be rejected. The importance of these skills to
the future systems analyst constituted areas of disagreement
between the practitioners and the systems analysts,
(ii) ANALYSIS OF THE RESULTS OF THE TEST ,
Most of the dimensions on which disagreements were detected in this
test were associated With traditional Systems analyst activities[\ ■' (t "
e.g. cost-benefit analysis, "
scheduling,
implementing office and system procedures.
This was surprising. It was anticipated that the opinions
of those who are directly involved in systems development would
reflect a continued strong need for these skills (see section
6.3.2).
its
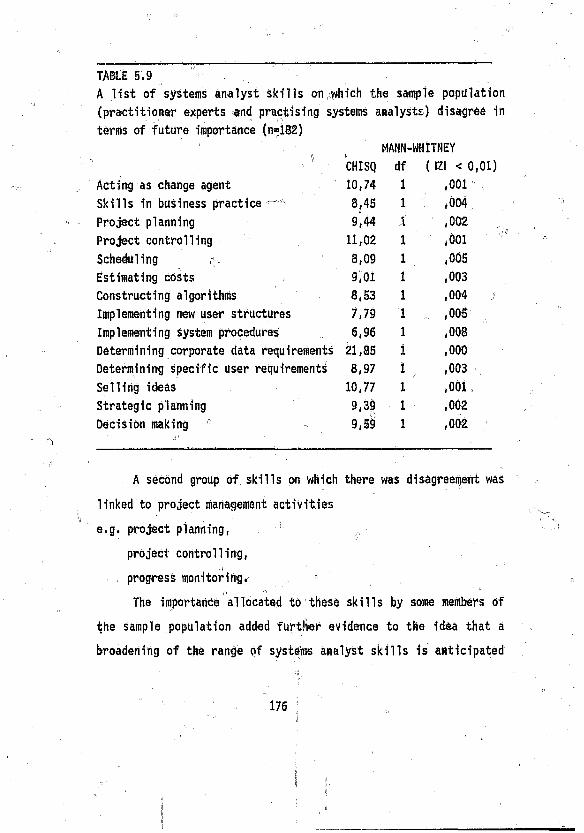
TABLE 5.9 ,
A list of systems analyst skills on which the sample population
(practitioner experts and practising systems analysts) disagree in terms of future importance (n=182)
MANN-WHITNEY
.. ■ . ” CHISQ df ( IZI < 0
Acting as change agent 10,74 1 ,001
Skills in business practice ' > 8,45 1 ,004
Project planning 9,44 ! ,002
Project controlling 11,02 1 ,001
Scheduling , 8,09 1 ,005
Estimating costs 9,01 1 ,003
Constructing algorithms 8,53 1 ,004
Implementing new user structures 7,79 1 . ,005
Implementing system procedures" 6,96 1 ,008
Determining corporate data requirements 21,85 1 ,000
Determining specific user requirements 8,97 1 ,003
Selling ideas 10,77 1 ,001
Strategic planning 9,39 1 ,002
Decision making 7 9,59 1 ,002
A second group of skills on which there was disagreement was
linked to project management activities
e.g. project planning, ’
project controlling,
progress monitoring. „
The importance allocated to these skills by some members of
the sample population added further evidence to the idea that a
broadening of the range of systems analyst skills is anticipated
176
(see section 8.3*1.15).
Again it was noticed that there was disagreement on the
significance of both skills as a change agent and skills in
business practices. This was quite unexpected for two reasons:
(i) both these groups within the sample population were involved
directly in the development of application software, and more
consensus was expected on what are fundamental issues;
(ii) the literature survey showed that both skills are regarded as
important to the future systems analyst (see section 6.3.1.2
and 6.3.1.18).
5.2.2.1.4 A COMPARISON OF THE OPINIONS OF THE ACADEMIC EXPERTS AND THE )) "
PRACTISING SYSTEMS ANALYSTS
(1) STATISTICAL PROCESSES
The steps followed In making this comparison of opinions were
HO - no difference of opinion (groups could not be said to
disagree)
HI - difference of opinion (groups disagree)
(See section 3.6.2.2.)
Table 5.10 details those dimensions for which the null
hypothesis had to be rejected at the 0.01 level. The academic
experts and the practising systems analysts disagreed on the
importance of these skills to the future systems analyst.
identical tc those outlined in section 5.2.2.1.3.
The Mann-Whitney Test was used and for each dimension:
177
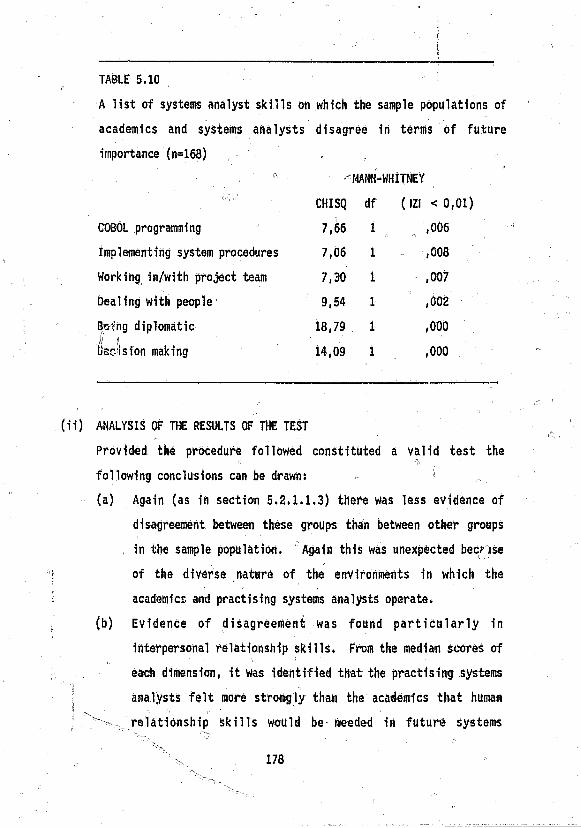
TABLE 5.10 r
A list of systems analyst skills on which the sample populations of
academics and systems analysts disagree in terms of future
importance (n=168) . , ,
' - MANN-WHITNEY
CHISQ df ( IZl < 0,
COBOL programming 7,66 1 ,006
Implementing system procedures 7,06 1 ,008
Working in/with project team 7,30 1 ,007
Dealing with people 9,54 1 ,002
Bovng diplomatic
tied si on making
18,79 1 ,000
14,09 1 ,000
(ii) ANALYSIS OF THE RESULTS OF THE TEST
Provided the procedure followed constituted a valid test the
following conclusions can be drawn:
(a) Again (as in section 5.2.1.1.3) there Was less evidence of
disagreement between these groups than between other groups
in the sample population. Again this was unexpected becnse
of the diverse nature of the environments in which the
academics and practising systems analysts operate.
(b) Evidence of disagreement was found particularly in
interpersonal relationship skills. From the median scores of
each dimension, it was identified that the practising systems
i; analysts felt more strongly than the academics that human
' relationship Skills would be weeded in future systems
178
. .. J,■' a
analysis. This could be the root of the disagreement on the
future value of these skills identified in section S.2.2.1. >J ■
5.2.2.1.5 THE RESULTS OF TESTS USING THE DATA FROM THE SYSTEMS ANALYSTS
(i) STATISTICAL PROCESSES
In an effort to further analyze the reasons for the disagreements
identified earlier in this section, the opinions of the practising
systems analysts were grouped according to their demographic data
and processed using the Kruskal-Wallis Test. For each dimension:
HO - no difference of opinion (groups could not be said to
disagree)
HI - difference of opinion (groups disagree)
(See section 3,6.2.2) ,
Table 5.11 lists those skills for which the null hypothesis
had to be rejected and a disagreement acknowledged. Figures 5.3
to 5.9 are frequency counts which help to identify the details of
the disagreements.
(NOTE: The frequency counts represent the opinions of the systems
analyst respondents (with n = 159). There were two reasons
why the count for certain charts was less than 159,, The
first was that there were occasions when a small number of
observations were missing from the data. The second reason
was that when comparisons were made across industry types, to
enhance the clarity of the diagrams, only those industries
with more than 10 observations were included in the chart.
Where appropriate, the relevant reasons will be noted in
comments on the affected tables. There was no reason to
believe that the data not used introduced a bias into the
results.)
(ii) FACTORS WHICH CONTRIBUTE TO DISAGREEMENTS i!• ■ i1
The following demographic factors were identified as contributing
to disagreements between the systems analysts (which, in turn,
contributed to the disagreements identified in the opinions of the
sample population). In the other cases of disagreement identified
in table 5.11, comparing frequency counts did not give conclusive
evidence for the reason of the disagreements.
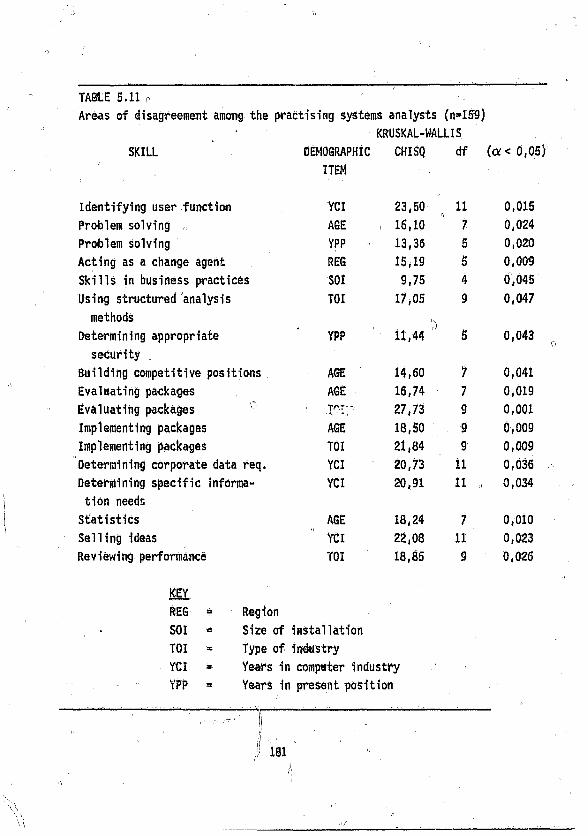
TABLE 5.11
Areas of disagreement among the practising systems analysts (n=159)
• KRUSKAL-WALLIS
SKILL DEMOGRAPHIC
ITEM
CHISQ df (a< 0,05)
Identifying user function YCI 23,50 11 0,015
Problem solving AGE ,i 16,10 7 0,024
Problem solving YPP 13,36 5 0,020
Acting as a change agent REG 15,19 5 0,009
Skills in business practices SOI 9,75 4 0,045
Using structured analysis
methods
TOI 17,05
11,44
9 0,047
Determining appropriate • ypp • 5 0,043
security
Building competitive positions AGE 14,60 7 0,041
Evaluating packages AGE 16,74 7 0,019
Evaluating packages '' :Fc7'' 27,73 9 0,001
Implementing packages AGE 18,50 9 0,009
Implementing packages , TOI 21,84 9 0,009
Determining corporate data req. YCI 20,73 11 0,036
Determining specific informa YCI 20,91 11 , 0,034
tion needs
Statistics AGE 18,24 7 0,010
Selling ideas YCI 22,08 11 0,023
Reviewing performance TOI 18,85 9 0,026
KEY
REG * Region
SOI * Size of installation
H O w H Type of industry
II>-<(J>- Years in computer industry
YPP = Years in present position
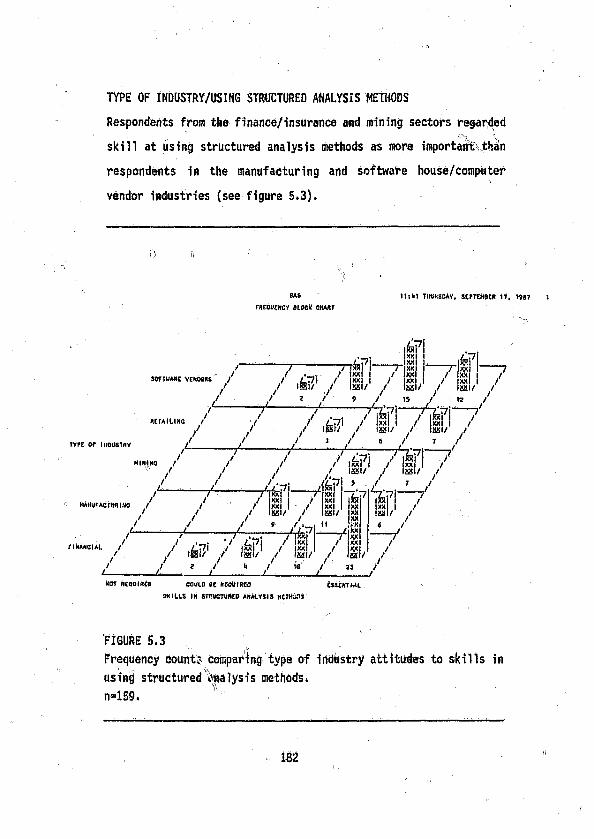
TYPE OF INDUSTRY/USING STRUCTURED ANALYSIS METHODS
Respondents from the finance/insurance and mining sectors regarded
skill at using structured analysis methods as more important:than
respondents in the manufacturing and software house/computer
vendor industries (see figure 5.3).
n ’ '
SAS ttsM l THURSDAY1, SCPTCMQtft 1 7, 1987 1
WQUtNCV BLOCK OIAKT
NOT ACQUfRCO COtilO 0C kCOHtRCO CSSCHTIAL
ski U S in sTrimTUReo analysis Mentoss
‘FIGURE 5.3
Frequency counts comparing type of industry attitudes to skills in
using structured analysis methods.
n=l§9. ^ ' . ■
182
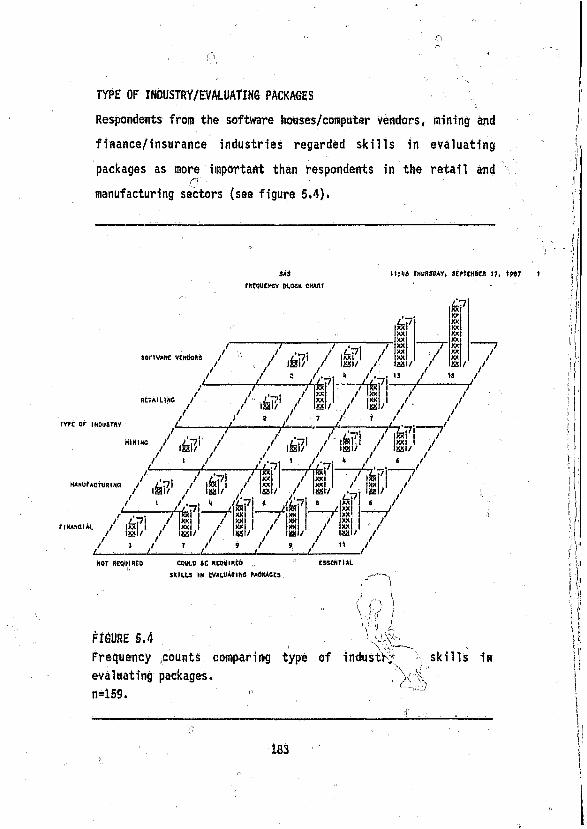
TYPE OF INDUSTRY/EVALUATING PACKAGES
Respondents from the software houses/computer vendors, raining and
finance/insurance industries regarded skills in evaluating
packages as more important than respondents in the retail andO .
manufacturing sectors (see figure 5.4).
SAS
fRCQUCNCY BLOCK CHART
THURSDAY, StmHBCft !?, T997
SKI U S IH EVALUATINO PACKAGES
FIGURE 5.4
Frequency counts comparing type of industlrj; \ skills in
evaluat ing packages *
n=159.
183
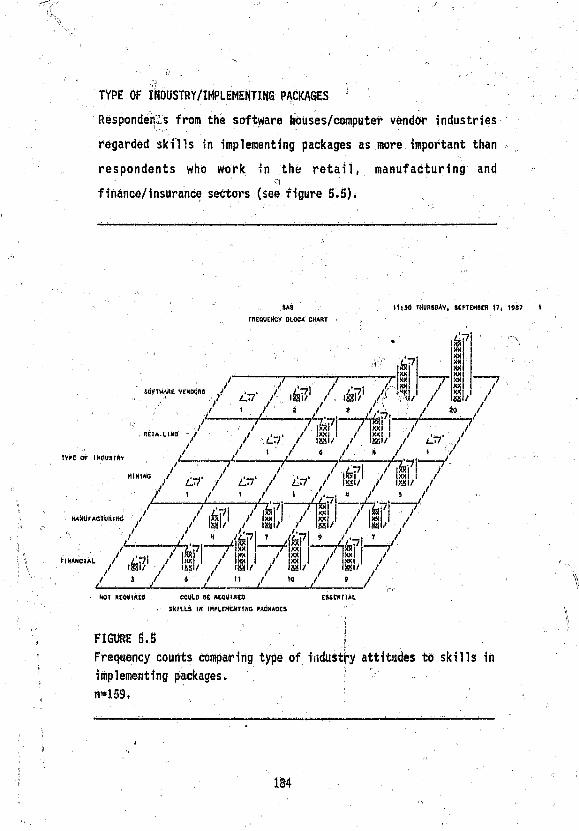
TYPE OF INDUSTRY/IMPLEMENTING PACKAGES
'Responders from the software houses/computer vendor industries
regarded skills in implementing packages as more important than
respondents who work in th& retail, manufacturing andCl
finaiice/insurance sectors (see figure 5.5).
Sa b
fnCQUCHCY BLOCK CHART
11}J0 THURSDAY, SEPTEMBER t7* 1987
/
PXXXXXXXXXXXXXXXXas
, RETA-LlhO - /
/TVFC O r iNOUSffiV ,
J , / / V . * - .i y a y a y * A • y ■ ao /
~ i ~ ii7! ?pj i 7 77 / XX f XX I / *< _ . /
y y W / / M / / L.t7
/ * > • / 9 / * /--------- --------- '— t f f i - i -
■ /
m«,No v , £t7. / i .r7. / / SSii.i /
/ ' / ' / ' /•- *> / s
H h* h c i * L / '
. . / isi // iai/ / Ian/ /
......... 7
4 7
f i \m t y iss.. ,Tl^i7! 71$ T
' /
y % ? \ “Y ,./ / to/ /
- 7 4 7 I - V '/ iwi j> HZ .1 J
m xxXX , ..... , .m/ tt issl/ f
J ,/ i ,1 (1 I 10 / » J
HOI FltQUiniO COUl.O SC M O t t l M W CSSCMMAl.
SKILLS IN IHPLEHCNrt.VO MCKiOES
FIGURE 5.5 ;
Frequency counts comparing type of industry attitudes to skills in
implementing packages.
n*i&9»
184
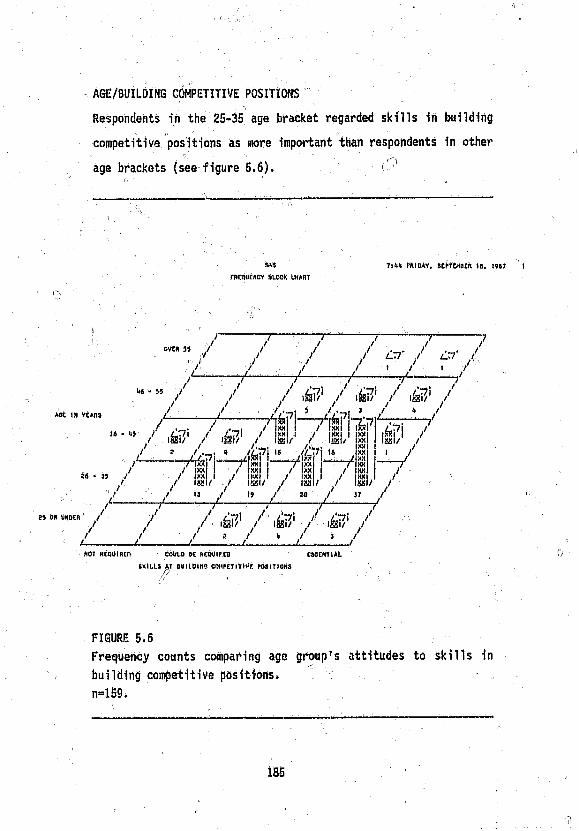
AGE/BUILDING COMPETITIVE POSITIONS
Respondents in the 25-35 age bracket regarded skills in building
competitive positions as more important than respondents in other
age brackets (see figure 5.6). ( J
, M , 7:«u rnloAV, scptcwtR u. t»> I
rRto»E«oY ouoc* UH»nr
mi u s at euiiDiMi conttmiwj resinous
FIGURE 5.6
Frequency counts comparing age group’s attitudes to skills in
building competitive positions.
n=159.
185
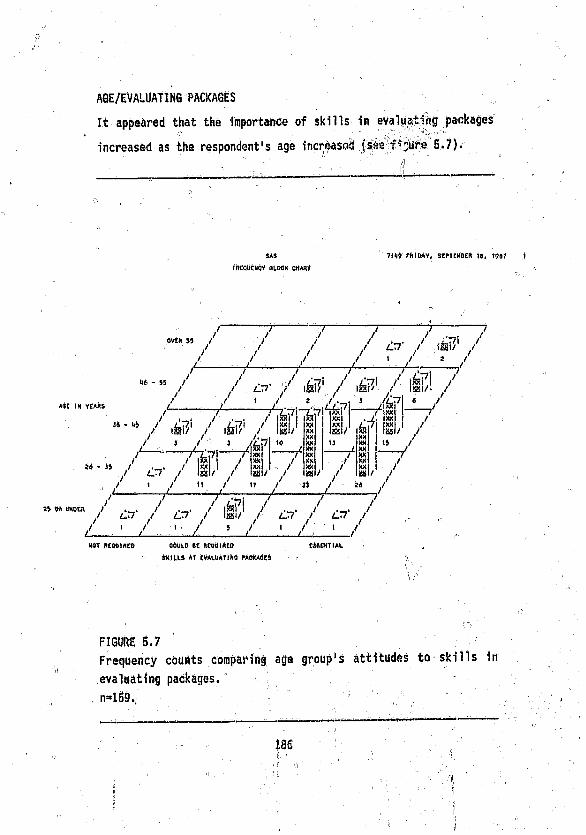
AGE/EVALUATING PACKAGES
It appeared that the importance of skills In evaluating packages
increased as the respondent's age increascvd :ure 5.7).
. ' . , . .________ 11________________
SA5 7 t W rfllD AV, SCPTEHOEJt I S , 1997
rucotfcNW ottoK chart
s k i l l s A t t v * L t « r lh o p a c k a g e s
FIGURE 5.7
Frequency counts Comparing age group1s attitudes to skills in
evaluating packages.
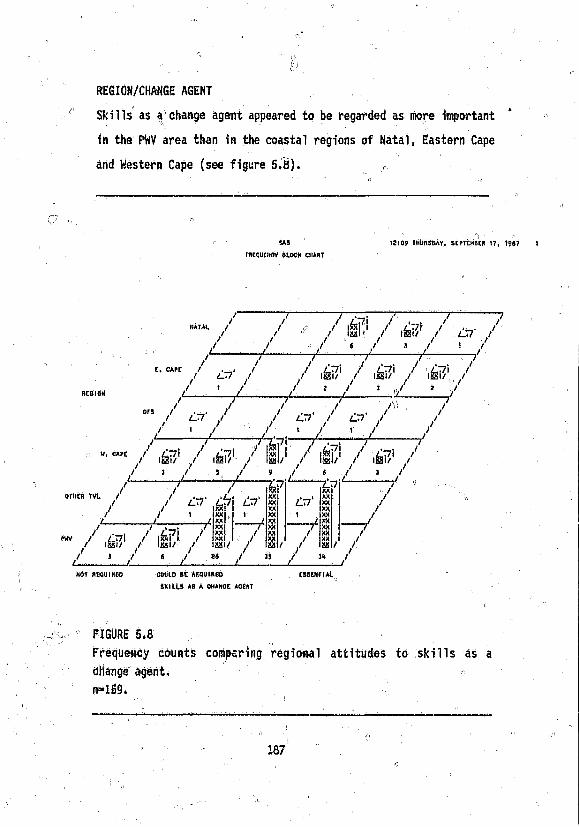
REGION/CHANGE AGENT
Skills as a change agent appeared to be regarded as more important *
in the PWV area than in the coastal regions of Natal, Eastern Cape
and Western Cape (see figure 5.8). f
(7 - ’ ■ -
5AS 1 S }09 THURSDAY, SEPTEMBER 17, 15>87 I
FRCQUCWCY SLOCK CHART
HOT flCQUIKCO COULD BE ACQUlHtO ESSENT I A t
S K IL L S AS A CHAKGE ACEHT
FIGURE 5.8
Frequency Counts compering regional attitudes to skills as a
change agent.
n=159.
187
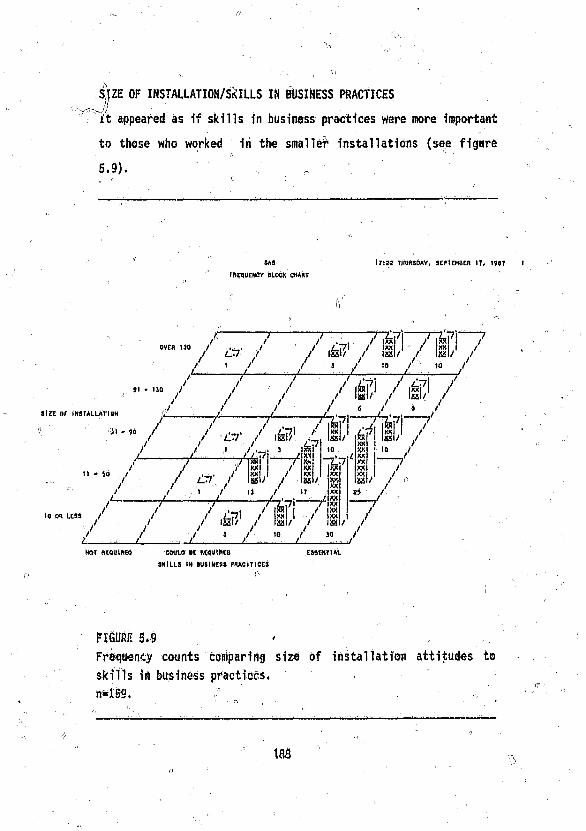
' '■ „ Vs " ' .
SIZE OF INSTALLATION/SKILLS IN BUSINESS PRACTICES
it appeared as If skills in business practices were more important
to those who worked in the smaller installations (see figure
5,9), n
SAS
mCQUCNSY BLOCK CHART
17:22 TWURSOAV, SEP!EMBER 17, 1967
a, 7 ' 7 3 / 1«<7 7~\kn 71,0 / & / r / h?/ / b / 1 y b/ /l____ i _ z _______/_____3 / / 10 /
/ / / / / fi\ // / / / ImI/ I22SI/ /S IZ E Of IN S IA LU lV IO N j,'!_ ■* ■* 1 4 ■' ® '
v rji . 90 /
/ /' 7 " / 7" &/ / 1 / / • -?» 3 / !S'4wtKXI
10~p/ 7 —71® “7 . " * “ / / / » / /
/ / ■>"' / 11 / ” t y ---------- ------------- 7 ^ - 7 1 —
,omusa / / / a ?/ / I d 1 / » / /
/ . / / 3 / ”.../
io
m x RtQUlACO C W L O SC M&UlftttJ ESSENTIAL
s k i l l s ih Bust Ness P R A e m e c s
FIGURE 5.9 '
Frequency counts conipar 1 ng size of installation attitudes to
skills in business practiccs.
n=159.
183
5.2.2.1.6 SUMMARY OF DISAGREEMENTS "
Disagreements concerning the skills required by the systems analyst of
the future covered a broad range of activities. Some reasons for the
disagreements could be traced to factorjs such as differences in the
respondents* perceptions of future systems analyst job
responsibilities, and differences associated with demographic details.
In some cases, however, no apparent reasons for the disagreements could
be isolated. Perhaps factors Ijke the maturity of the I.S. department
(Nolan, 1979, p.115) or the strategic relevance of the systems on Which
" 1 " ! \i -the respondents had worked (Cash et al., 1983, p.26) contributed to the.. I'
lack of agreement (see section 7.6)*
. C, ; ‘
5.2.2.2 SKILLS REQUIRED BY THE FUTURE SYSTEMS ANALYST ON WHICH THERE
WAS NO DISAGREEMENT
A list of future systems analyst skills (together vs ith their median,
upper and lower quartile and standard deviation scores) on which there
was no statistically supported difference of opinion among the
> respondents to the questionnaire, is given in table 5.13. The skills
groupings used in this table follows those of the questionnaire sent to
•the experts (see appendix ’C 1). These groupings were based on the
answers received from the experts to the original open-ended questions
distributed during the early stages of the' empirical research (see
section 4.2.2.1.2). To help retain consistency, the same groupings
were used to analyze these data, but as a first step towards linking the
empirical findings with the conclusions of the literature survey (see

SKILLS REQUIRED F « THE FUTURE SYSTEMS ANALYST 01 WICH THERE WAS NO DISAGREEMENT (n-191)
, FREQUENCY TABLE (PERCENTAGES)
TABLE 5.12 . ■
JOB RESPONSIBILITY DIMENSION <n MEDIAN Q3 1 2 3 4 5
_ ANALYSIS '
Evaluating existing proceduresi,\
VI 4 5 S - 18,8 ' 26,2 55,0
Fact finding V2 4 S 5^
• 7'S 28,8 63,4
Thinking logically V5 S s 5 - - 16,8 63,2
Identifying nser/sinageaerit nteds V6 4 5 S - \W 8,4 18,3 73,3
(tateratning appropriate systea controls Vll 4 S s - 11,5 27,2 61,3
Identifying eonpetltlve advantages
PROJECT MANAGEMENT
VI3 3 4 s * 9.9 27,2 26,7 36,1
Progress aonltoring ' VIS 4 5 5 - • 9,4 32,5 58,1
Estiaatlng tlaescales
DEVELOPMENT
V20 4 S s ■ • U,5 33,5 55,0
Deteralnlng appropriate developaent aethod V22 4 4 5 : - - 11,8 41,4 39,8
FORTRAN programing , V25 1 1 2 50,5 26,1 17,6 5,9 -
ADA programing VZ6 1 1 2,5 49,7 25,4 19,9 5,0 -
Using fourth generation languages V30 4 5 5 - - 13,1 19,9 67,0
Using automated developasnt nethbds V31 3 4 5 - • 27,7 31,4 40,8
IMPLEMENTATION
' lapleaentlng office procedures V34 3, 4 5 - 13,6 30,9 28,3 27,2
Organization and aethods skills V35 3 4 4 - 11,0 •a 29,3 ?5,1 24,6
DATABASE - ,
Designing logical data aodels
HARDWARE ,--j
V37 4 5 : 5 9,9 21,6 65,4
Daiignii.s Installation configurations V39 2 3 4 16,8 19,9 25,1 17,3 £0,9
Designing computer networks V40 2 3 4 18,3 15,7 25,1 17,3 23,6
Oeteraining tetecoaamlcatlon reitttireaents
CCWWNI CATIONS
V41
>/\
3 3 S 12,0 12,6 27,7 20,4 27,2
Interviewing V46 4 5 s - 9,9 25,1 64,9
Verbal ccawnicating V47 S 5 5 * - 21,5 78,5
Report writing V4a 4 5 5 - 6,3 35,1 58,6
Presentation preparing v « 4 5 5 - - 30,9 69,1
Teaching VSO 4 S 5 • 16,8 31,9 51,3
MANAGEMENT
’ Managing/MtlVating people
AUDITING 1
V52
s
S
| S "
s 24,1 75,9
Auditing ctwputar systeas VS7 3 4 5 • 13,1 31,9 29,3 25,7
Building system which can hi audited V58 5 5 - 1,3 12,7 22,2 63,9
1 s NOT IMPORTANT 5 * VERY IMPORTANT
section 7.3.1), the skills listed in table 5.12 were analyzed in the
five categories below (see figure 5.10).
CATEGORY 1 - those skills which Were listed, but which were regarded as
not being required by the future systems analyst, (a median score of l ) . r
CATEGORY 2 - those skills which could (under certain circumstances) be
regarded as necessary to the future systems analyst, (a median score of
3)..
CATEGORY 3 - the skills regarded as necessary to the future systems
analyst (a median score of 4 or 5) Were sub-divided further:
CATEGORY 3.1 systems analyst skills based on the definition used
in section 2.1.1.4;
CATEGORY 3*2 skills required to make the systems analysts more
effective in their tasks (supportive ^kl11s);
CATEGORY 3.3 skills which reflect the changing role of the systems
analyst.
5.2.2.2.1 SKILLS WHICH COULD BE 'REGARDED AS NOT REQUIRED BY THE
SYSTEMS ANALYST OF THE FUTURE (Category 1)
The skills which fell into this category were surprising, not because of
their rejection by the sample population, but because they were ever
irtcluded in the list of skills required by the future systems analyst
(see section 4.2,2)* it is difficult to imagine how third generation
programming in FORTRAN or ADA would ever be skills required by systems
analysts in the future.
191
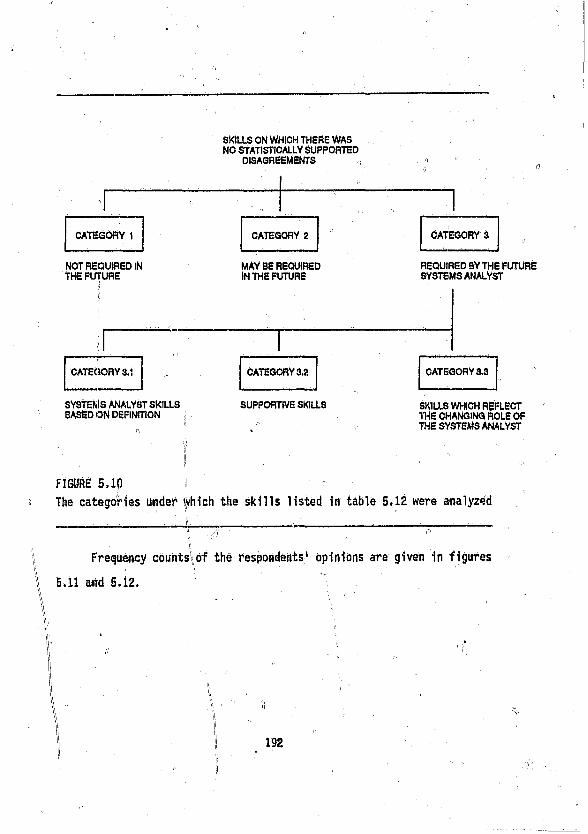
NOT REQUIRED IN THE FUTURE
SYSTEMS ANALYST SKILLS BASED ON DEFINITION
SKILLS ON WHICH THERE WAS NO STATISTICALLY SUPPORTED
DISAGREEMENTS )
MAY BE REQUIRED IN THE FUTURE
SUPPORTIVE SKILLS
CATEGORY i CATEGORY 2 CATEGORY 3
REQUIRED BY THE FUTURE SYSTEMS ANALYST
CATEGORY 3.1 CATEGORY 3.2 CATEGORY 3.3
SKILLS WHICH REFLECT THE CHANGING ROLE OF THE SYSTEMS ANALYST
FIGURE 5.ip j
The categories tinder Which the skills listed in table 5,12 were analyzed
Frequency counts of the respondents' opinions are given in figures
\ 5,11 and 5.12.
192
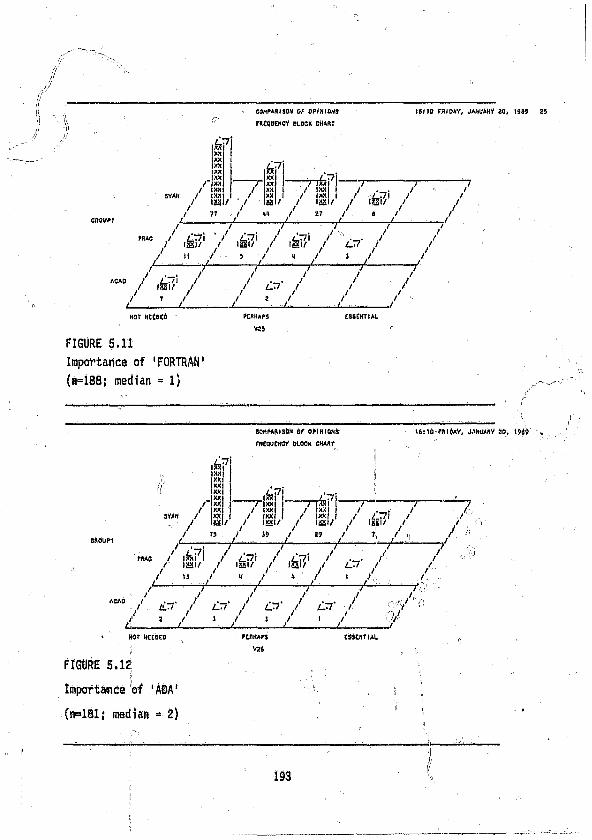
J/ }j
COMPARISON Of OPIHiOHS FREQUENCY BLOCK CtUftT
16110 fftlOAY, JA/fUAKV 20, 1989 25
V25
FIGURE 5.11
Importance of 'FORTRAN'
(n=188; median « 1}
COHPARISOH or OPINIONS
rRfQUtHCY BLOCK CHAflT
UAH /
/
x»
\
>6:10 PS1MV, JANUARr SO, 1 9 # .
__ _lfe7!____ >7?\____ ■ ■tiw<i i---rrai i 7 ; t/ ixxi t / XXI I I \ . /
/ m x | / ix x l | / ,A T 7 l // m\t / issi/ / isii/ //
/ 75 J M I ri t r !
/ - = ------ / — --------f --------------
”7 ;/ - '
•Me / ifetPi / £77i / ,/77i / // Iasi/ / iff ii/ / iS i / / <l^7 /
» V « / V / 4 // ------ f ------ / - ----- / -------f -------7
/ ;n/ ./ 1 / .
• KOr N«0€0
FIGURE S. 12:
Importance of 'ADA1
(n=181i median « 2)
PERHAPSV26
_/ESSENTIAL
193
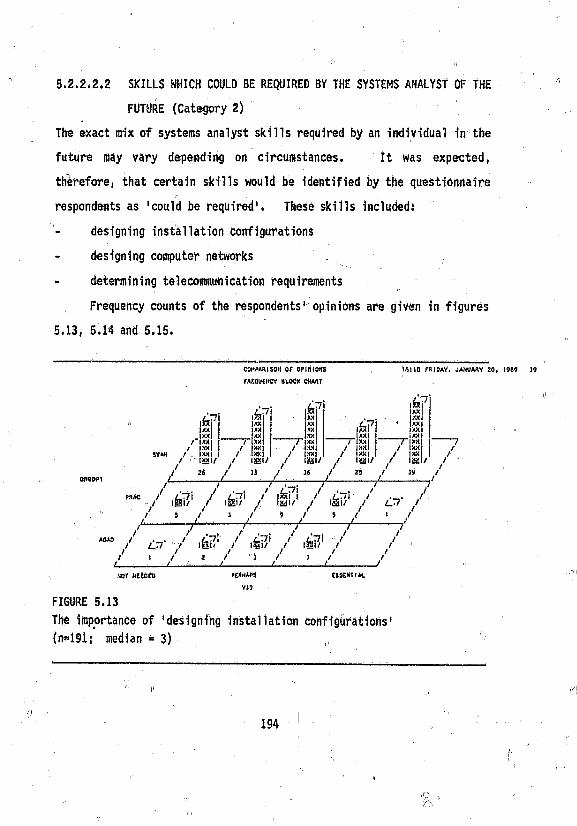
5.2.2.2.2 SKILLS WHICH COULD BE REQUIRED BY THE SYSTEMS ANALYST OF THE
FUTURE (Category 2)
The exact mix of systems analyst skills required by an individual in the
future may vary depending on circumstances. It was expected,
therefore, that certain skills would be identified by the questionnaire
respondents as 'could be required'. These skills included:
- designing installation configurations
- designing computer networks
- determining telecommunication requirements
Frequency counts of the respondents' opinions are given in figures
5.13, 5.14 and 5.15.
COMPARISON OP OPINIONS
FREQUENCY BLOCH CHART
16M O FR IDAY* JANUARY 20, 1909 39
fei7XX!
i fa7 '} liot i
hi7XXXXXXXX
/ |KX j T l X * - -.. . / m i / ixx / ixxjX X I / IXX I I XX / |XXI ............ .
f 1 * sgi/ / m \ / / m t / m i / / m / /
/ 26 / 33 7 46 7 29 / 39 /m L------------ 1------------------- 1-----------------J -------- — t _ _ j - . ^
prac / /r?i / / ifei ! / ,£p'\ / /- / ls£l/ / IM'/ /, t&il/ f l£3l/ / CS? /
■' / 9 / 3 / 9 / 9 / I /,l-------y — ---- — -/----------- j— -----/
** / & / .fei? / .6? / / /
/ 1 / . 8 / ‘3 / 1 / _______/
( P
fei7_^.|XXITixxi
Iixx IXX
* IXX IXX tXX
— Tlxx / ixx
/ IX*
PEftilAPSVJ'9
C5SENTfA l
FIGURE 5.13
The importance of 'designing installation configurations'
(n»l9lr median = 3)
194
f(

COMPARISON Of OPINIONS
FREQUENCY BLOCK CHART
kVXXIXXIXXXXI XX I
jaT
PXXXX XXiXX .1/
* T7i Sfft iXX I ixxi i
T xx / Ixx :
SYAN / XX I / XX ./ Ml/ V / /
/ 28 / 23 / 37 / 29 / «*2 /'
/------- V --------------- j*-------y -------- '
16t10 FR IDAY, JANUARY ?0 * 1909 »0
fei7XX IXX IXX IXXx x i
XXf .X X I I /sat/ /
xxiXX fXXI , SSI/ f/
” K / I 0 1 / ifi? / I ® / Z.T7' / Zl77- /
/ * / 5 / 8 // * / _L _ /
/ 1-77' / £ ? • / I ^ 1 / £ 7 * / /t / 2 / J / 2 7 t /
_________/ / 1 - /_________ z_________ tlOf NEEDED frfWHAPS e s s e n t i a l
n VM
FIGURE 5.14
The importance of 'designing computer networks1
(n=191; median = 3)
COMPARISON Of OPINIONS 1$:10 FRIDAY, JANUARY 20* 1989 Ul
FREQUENCY BLOCK CWAHT
; VttlFIGURE 5.15
The importance of 'determining T.P. requirements'
(n=191; median = 3)
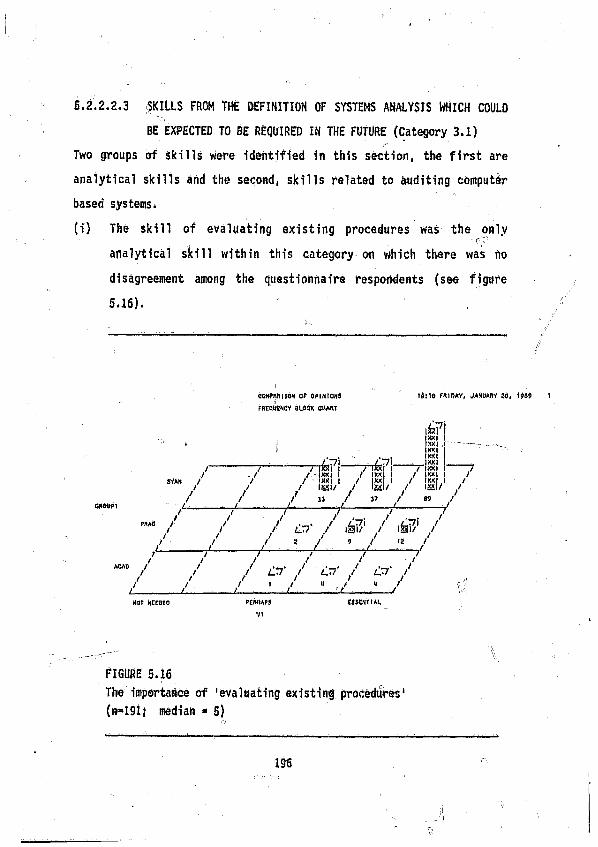
5.2.2.2.3 (SKILLS FROM THE DEFINITION OF SYSTEMS ANALYSIS WHICH COULD
BE EXPECTED TO BE REQUIRED IN THE FUTURE (Category 3.1)
Two groups of skills were identified in this section, the first are
analytical skills and the second, skills related to auditing computer
based systems.
(i) The skill of evaluating existing procedures was the only
analytical skill within this category on which there was no
disagreement among the questionnaire respondents (see figure
5.16).
COMPARISON Of OPINIONS
FftcaytNcY acocK c h a r t
SiM
/CP&UP1 L___________ _
fM S / /
ACAD / /
/ /'
/i rrini i t
X X I i / XX I I/ 1 'JXKI I / I X X I I ,// ISSI/ / Iffil/ ./
i c i t o m iR A V , ja iu a h v jo , <99$
/ 11 ,/ 37 / n /
/ L~‘ / laji/1 / /
/ ■ ' / ■■■■ V - V/ L~- / u-' / /
/ 1 / “ / ‘ /Nor NCCDGO PERHAPS
VI
eSSEHTMl
figure 5.16
The importance of ‘evaluating existing procedures'
(na191; median = 5)
196
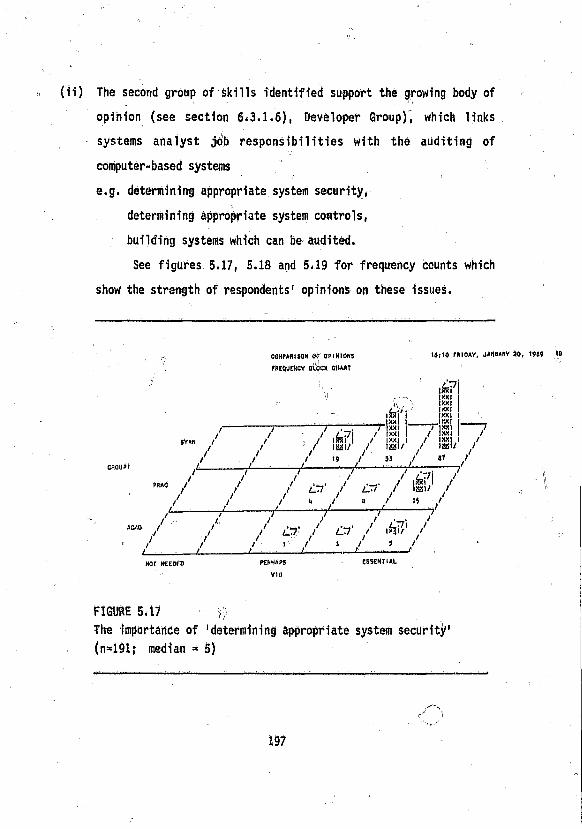
(ii) The second group of skills identified support the growing body of
opinion (see section 6.3.1.6), Developer Group), which links
systems analyst job responsibilities with the auditing of
computer-based systems
e.g. determining appropriate system security,
determining appropriate system controls,
building systems which can be audited.
See figures. 5.17, 5.18 and 5.19 for frequency counts which
show the strength of respondents' opinions on these issues.
COHPAftlSON tit o p in io n s
ttlEQUrtlOY Bl)3CK CHART
I S i IO fR IOAV, JANUARY * 0 , 1989
xxlXX IXX I I /XX I /x x i i / sst/ /
fei7
'SI/«« . .
/ ________ / _ ................................................................../ / / L.~‘ / L-- / /
/ 19 / 53 / #7 /
7Z----- -------------------7'
/ a ' / /
/ / t 'v L ___ 1, / ..NOT NEEQFO PENMAPS
V I0
e s s e n t i a l
FIGURE 5.17 ^
The importance of 'determining appropriate system security'
(n«191; median * 5)
197
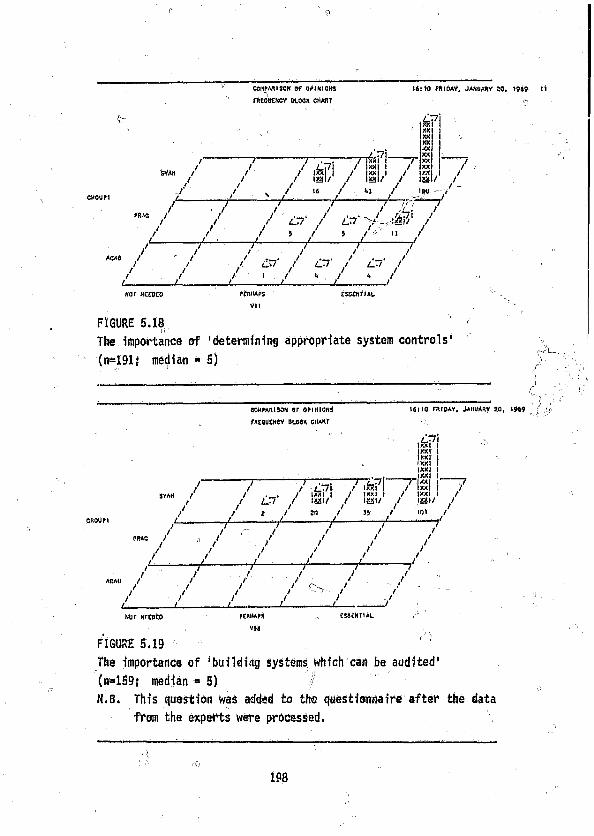
COHPAnlSON OF OPIN IONS
rtawcNeY otoe* chart
SJ / Iw 7 7 ~ p j 7T&FI /5VM / / / II!/1 / iii/1 /
f / . / us / , <ii ,/ mu /in £______ __J_____ v / - _____ / ' J ■■ J
* * / / / // / / 5 / 5 ./ II /
A CO / / / /
Z__L.
16: tO FRIDAY, JANUARY 20, T9«9 i i
0 ,
LT7XXMXXXXX,XXXXXXXX
HOT HCZOCO nmiAp s
VllES®C»TJAU
FIGURE 5 .1 8t! . The importance of 'determining appropriate system controls'
(n«191j median = 5)
C O M M A I W N OF OPINION*
rftEOUCNCV BLOCK CHART
16110 FRIDAY* JANUARY 20,, 19*9 , { 4
- \k?XX|XXI
„ /XXIIX X I
, . . ixxij — :— ?-------- ............... ”7 7 4 7 1 7 1 s !jy*u / / _/ ifc/i f i*xi i /' Ixxi i /'
" / / t lV / IMI/ / l£SI/ / «S8I/ // / i t / H / "» ,/
■ - / • . / - / / 7 .. /— / — / — - f— y
“’/ / / / - / /Ktor Mrtoiro PE»»APS
mCSSChfiAL
FIGURE 5 .1 9 ' '
The importance o f ’building systems which can be a u d ited 1 -
(n=159? median * 5 ) ii
N.B. This question was added to the questionnaire a fte r the data
from the experts were processed*
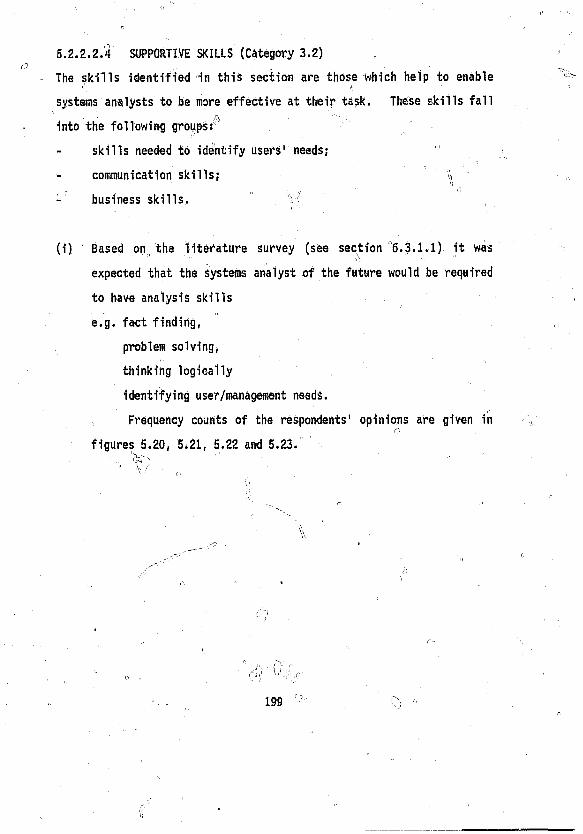
5.2.2.2.4 SUPPORTIVE SKILLS (Category 3.2)
The skills identified in this section are those which help to enable
systems analysts to be more effective at their task. These skills fall
into the following groups:
- skills needed to identify users' needs?
- communication skills; ^
- business skills. %■! „I ' : '
(i) Based on the literature survey (see section 6.3.1.1) it was
expected that the Systems analyst of the future would be required
to have analysis skills
e.g. fact finding,
problem solving,
thinking logically
identifying user/management needs.
„ Frequency counts of the respondents' opinions are given in' n
figures 5.20, 5*21, 5.22 and 5.23.■■ >- "
iyy
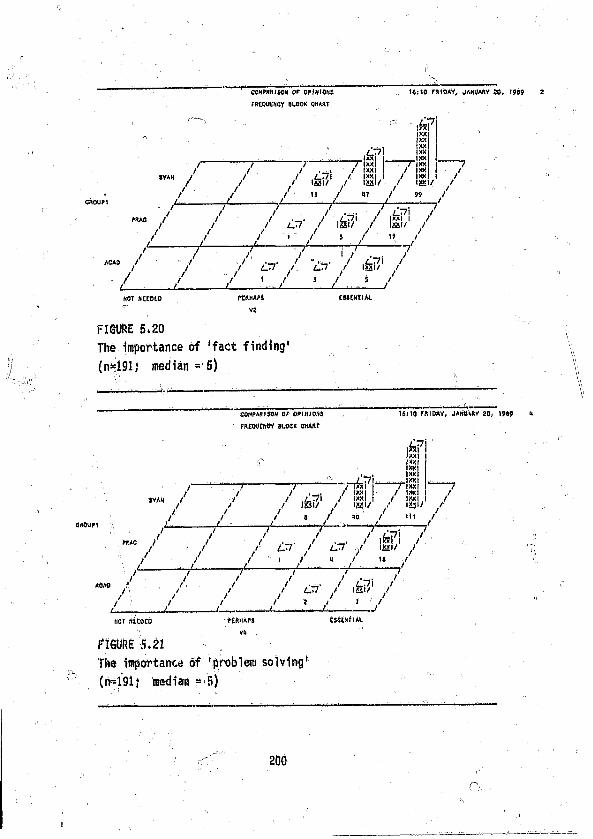
COMPARISON or OffNIOHS
PftEQU'ENCV BLOCK CHART
T & ---T/ / / /' iwi i /5YAN / / / \kV,' / 111/1 /
ifi / / ./____ '1__-L___ "I__—j '
,Ua / / / LS7' / / l £ ! /
/ / ,) ’ / 5 / 17 //--------f—-----f ------ 7 -----— ;— 7
ACA0 / 7 / / ~L.rr / i&i?1 /
/ / / V ../ V / .....1 /
, 16; 10 FRIDAY, JANUARY SO, 1989
p XX XX XX XX XX XX XX XX ££ /
HOT NECOLD PERHAPS
V2
ESSENTIAL
FIGURE 5.20
The importance of 'fact finding'
(n=191; median = 5)
COHPAH J SOM Of OP IH) D/13
fRrqUC/tCY BLOCK CHART
16t10 FRIDAY, JAHU\RY 20, 1989
ixx|<Xix x
4 . ix x / 7 7 l_______ ix x/_Txxi j y ixx
I IXX| I I IXX
p
/ / / Ip/ / Iffil/* / IS ' /CilOUfl ,
/ » / to / m / ■ ----- <------- /
rue ) J
' / - —ACAO ) I /
/'■ / /
7 / 7 / /T7i /'
/ L-n- / a ' / III/ / / i / “ / '• / i---- ---L---- - ■/ . ---- 7
/ £.T7' / lisi/' /
/- / 8 /'PERHAPS
V(» „
HOT ftltOCO
FIGURE S.21
The importance of 'problem solving'
(n=191; median = 5)
CSStNriAU
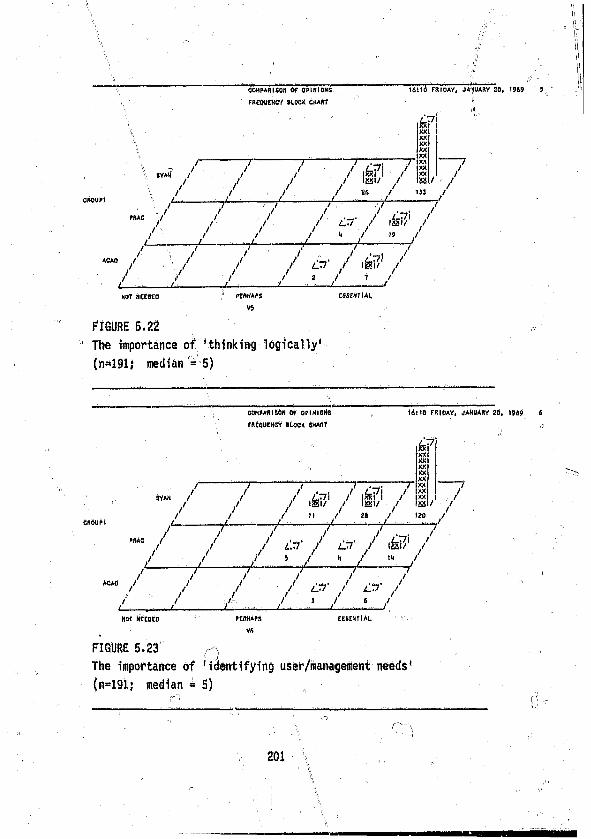
COMPARISON O f OPIN IONS
FREQUENCY S U M * CHARTil .
S'7
161id FRIDAY, JANUARY 20, 1969 5
/ iSi7! / XX , .* a f/ /\ - / . / 7 ” / ^ ,
/ t / / 2S / 143 /
/ ----- - f ------ /. - ./-------7'
- / / / / £=f / A ? /___ / ________ / ...... — / ..... b / 19 — /
ACA0 / / / / L~- / ifei?1 /
/ / .../ _____ / ..,!■ /..± JNOT NEEOEQ rCMAPS
V5
CSSCKTIAU
FIGURE 5.22
The importance of ’thinking logically*
(n»191; median = 5)
COMPARISON Of OPtHIONS
fftCQ'JEHCY BLOCK CHART
16! tO FR IDAY, JANUARY 20, 1949 6
/ / M / 0 /
hi7
/ L .- ' / t in ' / \k 7 / /
9VAH /' / / 71 / I JW j ' J 7 XX // / / m\/ i \m/ J u/ /
/ / / u / 26 / »20 7 IP. /------ jL --- ■—/------ y ---- — / ------7
»«Ae / /
/ / / £ 7 . *7 ^ 7
v • / / / r /liar Need ed PCHHAP5
VS
E5SINTIAL
oFIGURE 5.23
The importance of 1 identifying user/management needs'
(n»191j median = 5)
201
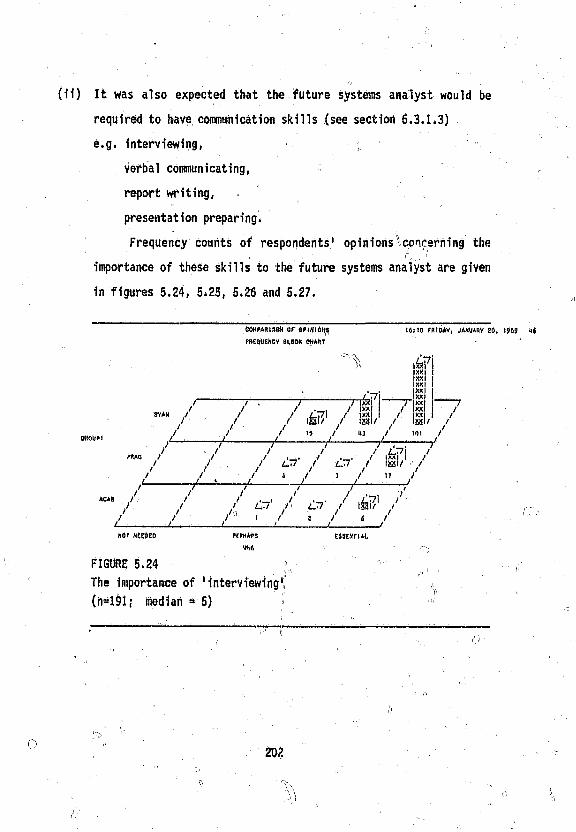
(ii) It was also expected that the future systems analyst would be
required to have communication skills (see section 6.3.1.3)
e.g. interviewing, ■ ■
verbal communicating,
report writing, .
presentat i on prepari ng.
Frequency counts of respondents' opinions concerning the
importance of these skills to the future systems analyst are given
in figures 5.24, 5.25, 5.26 and 5.27.
COHPARIRQN Of* OPINIONS 1«}tQ fftlOAV, JANUARY 20, 1909 H
rflegtiSKCY blo ck c hart .
z---------- 7- — -y-jbVl' 7/ |g|J ■'
hi7
/ J/ / / w / / Iasi/ j „ . ,
.« / • / / 15 / 113 / w /"We / / / . . / , / ix*7i /
/ / „ J L S I t L S 7 / ISSI / /
/ / > / 1 / 1 / » /acaiS / / / , , ). \ , / / T 7 I / ■
/ / / tin / tii / m o // / t " \ t Z / 6 /
I ______________ 7 , , , ■ ■____ — t ___________ - ~ L _______________ / /
Nor NCeeeb PtftHAps t s a m iA i .
VMi ---)
FIGURE 5.24
The importance of 'interviewing1;
(n=191; median => 5)
Om
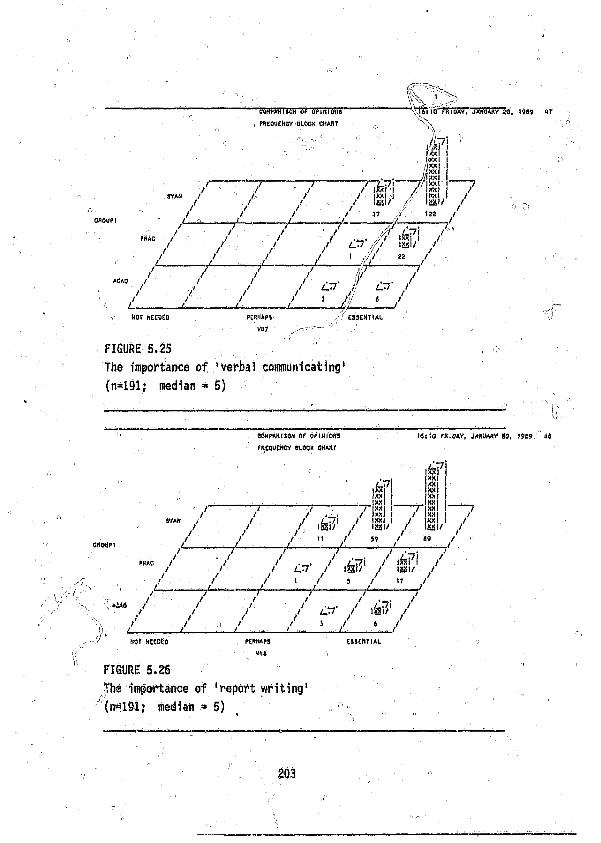
T ij&HMffUQ'N OF QPJKIOHS
, F«ewgf<CY BLOCK CHART
^ ‘JTj10“ FR«0»f." JANUARY 20, 1989 4T
y ~ t t / 77* *~~7'/ / / l&M ■/'fa t / |xx , /
J J * I***' /
i---y
& / // / . , / 37 // 122 /
7 ------- - 3 ^ 3 -------7 /«« / / / / / ? ifcfi / / , /., / / cn //, id/ /
/ — ^ V/ & j L~' /
/ 1 j t 6 /PcmiAj»n
w>.//CS!ESSEN T IAL
FIGURE 5.25
The importance of 'verbal cmrammicating1
(n=191; median = 5)
COHPAR!SOU Of OPINIONS
PRCQUCKCY BLOCK O H M t
l«ito rn.DAV, jAtfiMRV SO, IMS'. It
OiltjUM
/ .i., m i /'
/ .fa!?' / I / 1 // 11 / 59 / «9 t
t*------- 7*~-------iHrz.— y
fe*7
ES / /
PRAC / //
y
/?•IJ
/ ■«. / 4,r7i / , / i,t7 / 1881/ /■' » / « /
HOT MF.COCO PERHAPS ,
‘/tieSSSCNTIAL
FIGURE 5.25 -
The importance of 'report writing'
(n=191; median * 5)
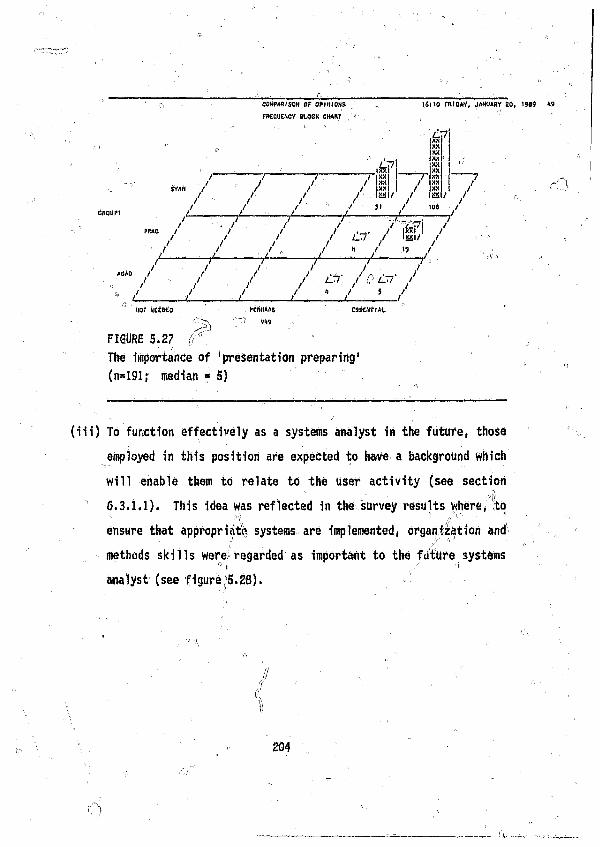
eOMfARfSON Qf OPHIIOHS PHOOCKBY BLOCK CHART
16: tO m O A Y , JANUARY 20, 1999
j
SYAfI / 1 f /
/ /.« ,L------- ^--- u _
/ . /PIMO / 1 /
/ / /'
A — V --------A -7 L___L__ J._
ifeFL“T ikxi i
kXX
7
XXXXXXXXXXXX& /
/ (XXI j // ixxi I // \m/ / _. .
/ 51 / too /
/ --------------- //• M. /TfeTr // /_T7 / IHI/ y
/ 11 / 19 /
/ / 7/ L~' / QtLrf /
/ ' / > /nor iiECDto kcniiAfs
Vi9
FIGURE 5.27 ((*' '
The importance of 'presentation preparing'
(n=191; median = 5)
ii) To function effectively as a systems analyst in the future, those
employed in this position are expected to have a background which
will enable them to relate to the User activity (see section
6.3.1.1). This idea was reflected in the survey results where, ftp
ensure that appropriate systems are implemented, organization and
methods skills were regarded as important to the future systems
analyst (see figure 5.28).
JJ
204
-V_
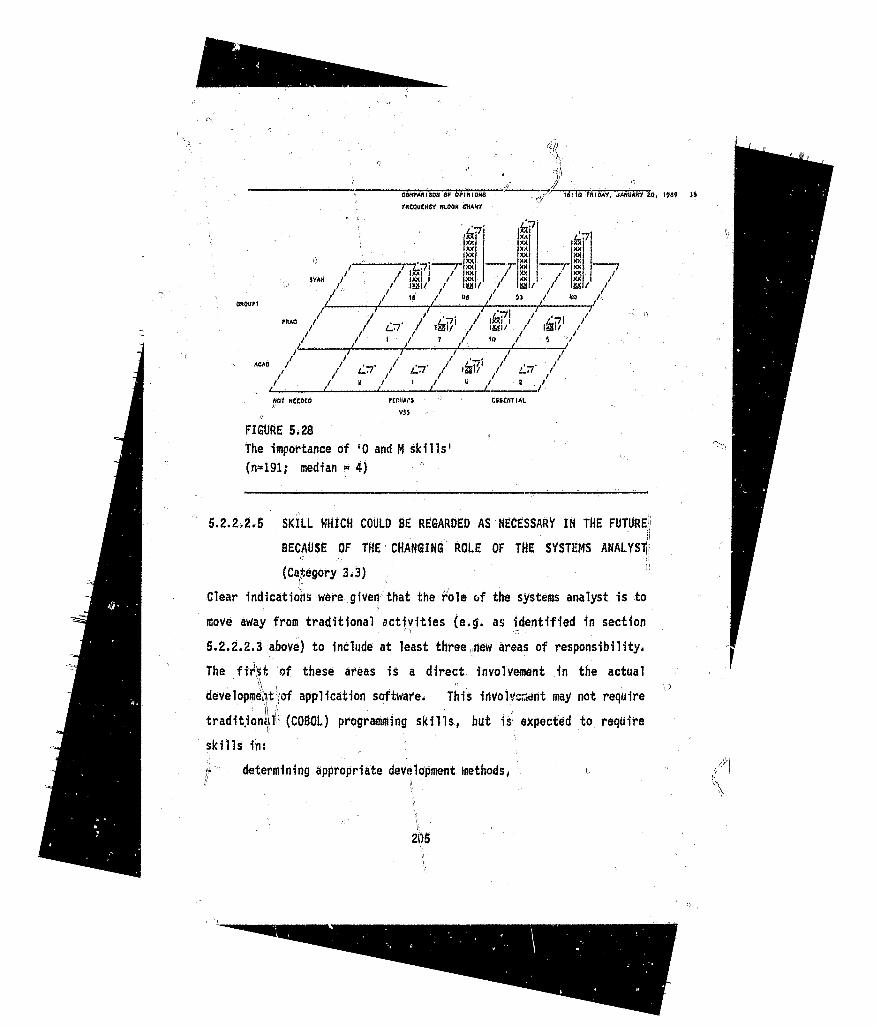
J LCOHfAfclSOM OF OPINIONS
ttCQttCHCV BLOCK CHANT
l<£}10 fR IOAV , JAWUAftV 20* 1989
V l h V l 7/ / la!/ / S:
/ — , , . . . .
«*0 / / / ,4^i / iwFi / Lp\ // / £.77 / 101/ / l«l/ / Iffll/ J
/ ....... 7 •/ • ................................................. •••••/ ...........V
/ / *7* / *7* / / L.77- /
.. / / * / 1 - / JL_Z__ i _ /
i^7ixrfjIXX|XX IXX I'XXfXXXX
' /
I
' V/ »a / M / 5J / ito /
7 ^— — / -------------- — y ------------------------ /
n o t x c c o eo rcwiMS
V33CSSEHTIAl
FIGURE 5.28
The importance of ‘0 and M skills'
(n=sl9i; median a 4) '
5.2.2,2.5 SKILL WHICH COULD BE REGARDED AS NECESSARY IN THE FUTURE/!
BECAUSE OF THE CHANGING ROLE OF THE SYSTEMS ANALYSTjj
(Category 3.3) 11c •
Clear indications were given that the role of the systems analyst is to
move away from traditional activities (e.g. as identified in section
5.2.2.2.3 above) to include at least three,new areas of responsibility,
The fi -jst of these ar*eas is a direct involvement in the actual
\ I! ' -developme.it of application software. This involvement may not require
■ H , 'traditional (COBOL) programming skills, but is expected to require
skills in:
Y determining appropriate development methods, t,
205
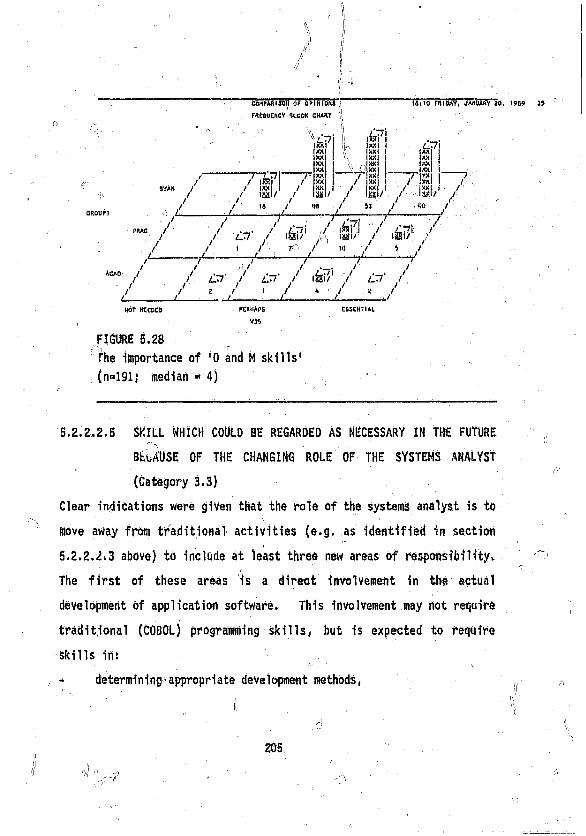
p
COMPARISON Of O P IN IONS
FREQUENCY 3UJCK CHART 1
36t10 FRIDAY, JAH'JASV 20. 1969
<'VW -7
5YAN /
/PRAC /
/ — - A/ /ACAO / J
//_____
X\ o
— r /
/ /f
fet |XXI iXX i Ixx '
l IXXII / *X/ \m/ fi Isa
/ tfi / <r« /' 53 /' ■'■■<» /V ------- /. --/-- r -y~ - ---- y
X\ I
XX)1 ifp\. . xx
x x i i iw«xxi i___ ixxx x i I T i wXX 1 ) IKKXXI f - / JXK i&l/ /
f
J7— j -----------------P----------------- 7— ---- ------- 7-----------------7
/ c r / 6 $ / ili'1 / a !: /
1 / ■' 7 / "1./ ____± _ /7 — / 7 7
/ il~’ / ilT7‘ / isHi/' / /I ___W 1 / “ V * /
HOT HEEDED pcntiArsVJ3
ESSENTIAL
FIGURE 5.28
The •importance of r0 and M skills'
(n=19l; median = 4)
5.2.2.2.5 SKILL WHICH COULD BE REGARDED AS NECESSARY IN THE FUTURE
BbuAUSE OF THE CHANGING ROLE OF THE SYSTEMS ANALYST
(Category 3.3)
Clear indications were given that the role of the systems analyst is to
move away from traditional activities (e.g. as identified in section
5.2.2.2^3 above) to include at least three new areas of responsibility,.
The first of these areas is a direct involvement in the actual
development of application software. This involvement may not require
traditional (COBOL) programming skills, but is expected to require
skills in.*
- determining appropriate development methods,
205
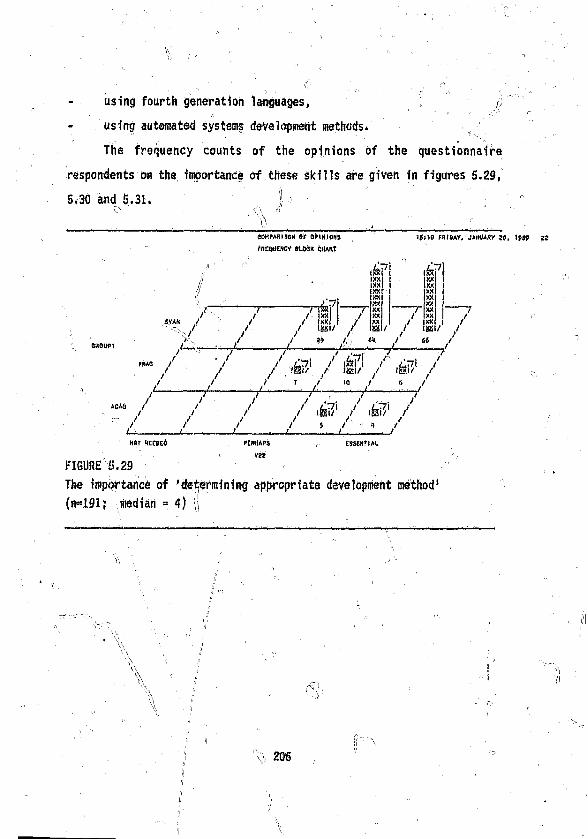
using fourth generation languages,
The frequency counts of the opinions of the questionnaire
respondents on the importance of these ski U s are given in figures 5.29,
5.30 and 5.31. I
\)COMPARISON Of OPINION'S
FREQUENCY BLOCK CHART
JfijiO M i DAY, JANUARY g
/ 7TxRf ---T
(P &
Tjv*« f /' / li<x | / ... .... .
/ / / (881/ - / &> / JOIOUP1 t / __ ” ,fi-> m / . “ /
/ / / B { / I ® / ^ /
/ - ... - / .......- / - 7 / / * ■ /
*M0 / / / / .fetf / A? /l _______ i ..... / / 8 / 1 ». /
1 KOr M to rt PMMAPS , CRCtltlM-v : :
FIGURE 15,29
The importance of 'determining appropriate development method'
(n«19i; median =*4)
"S;, 206
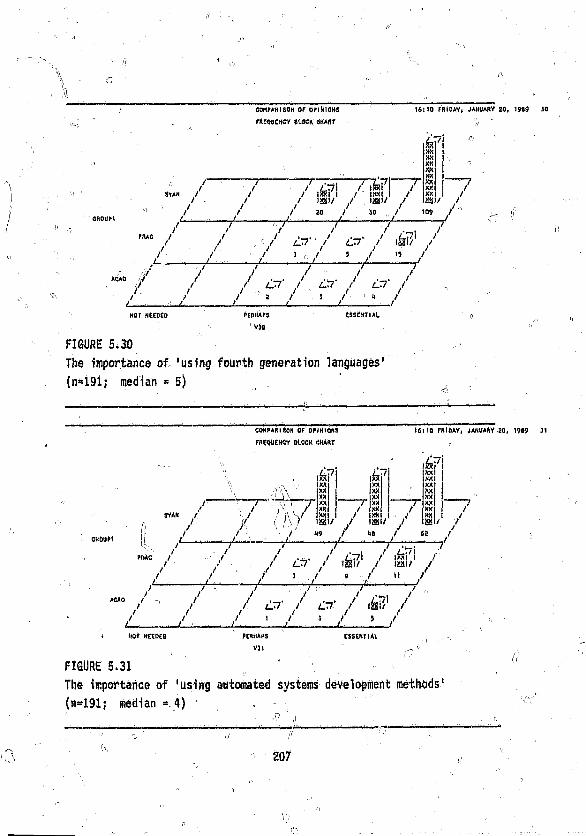
o
COMPARISON OF OPINIONS
FREQUENCY SLOCK CHART
162 10 FRIDAY, JANUARY 20. 1989 30
~t Z'tIt? I 7~ b i fi // - / / ii/1 / is!/1 /
/ /
\ /
/ 80 / 50 , / 109 , /*------- ------- y --------./
/ / -/ xr / or / >hV/
, , / — — ■/ ■/—
■ " / / / a ' / a ~ / f // /' / ! / ! / < ! // /______ t_________ i_________ _______ _ /NOT N'EEOCO cEnittrs
n v»o
eSStN T IA L
FIGURE 5.30
The Importance of 'using fourth generation languages'
(n»19l; median = 5)
COMPARISON Of OPINIONS
FREQUENCY BLOCK CHART
16:10 rnlOAY, JAKUAftY 20, 1989 31
T'AV
SYAH / - / ! I 1, / ... , ........................... .,/ ( ,• \ f &s / ,/ lissi/ ,/ ssi/ /
1 / . ' A - v /
hr
Ixxi m xxi XXI xxt J !**|
is!7XXI NX IXX xxiXXI XX XX f
m \t
PftAC / J
/ ’
/ / ,Lp\ / ifctr // > LS I 7 111/ / IlfKI/ /
/ — ■ / ' / ' / ■ " /
/ il7' / ilT7' / Isji/1 /ACAO / /
/ / / ~ Y . ~ / » /nor needed PERHAPS
V31
e s s e n t i a l
FIGURE 5.31 ‘
The importance of 'using automated systems ctevelefHoeat' BetlWKte'
(n=191; median = 4) .
207
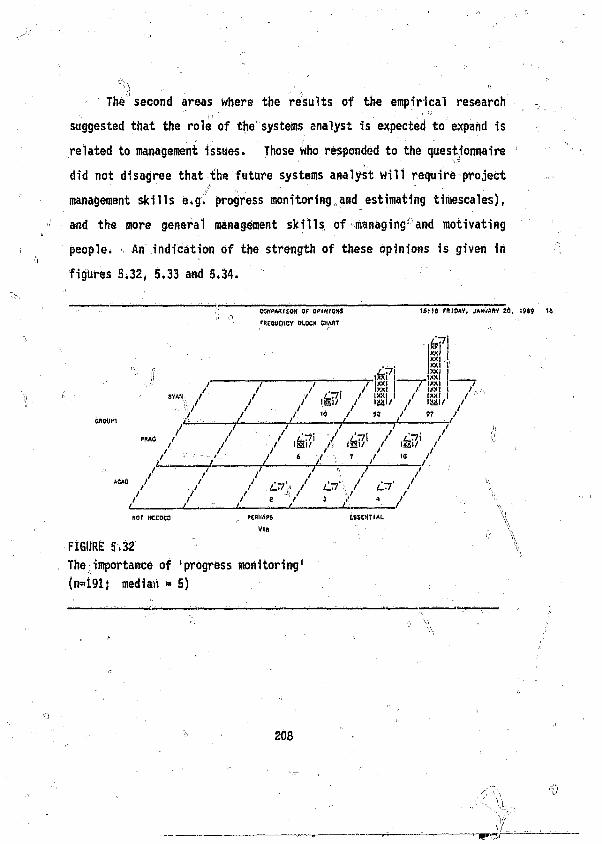
The second areas where the results of the empirical research
suggested that the role of the systems analyst is expected to expand is
related to management issues. Those Who responded to the questionnaire
did not disagree that the future systems analyst will require project
management skills e.g. progress monitoring and estimating timescales),
and the more general management skills of managing and motivating
people. An indication of the strength of these opinions is given in
figures 5.32, 5.33 and 5.34.
COMMA I CON Of OPINIONS fftEOUEHCY BLOCK CHART
)6 :)0 PRJDAY, JANUARY 20, 1939
j j - j - ... 7 ~ jx x
/ / /
SYAfl / / / i '/l / ' / “i/- / i1/ / ' / <0 / 52 / 97 /
f ------ f — --- -f— ---~f— --- f — ---/ „
— / / / / m / m / "
/ -•/ • / - / - / " // 7 7 7 7 7
n o r Nccoeo feniiAps
vt«tSSCNTtAt.
FIGURE 5.32
The importance of 'progress monitoring1
(n=»191; median * 5)
V
208
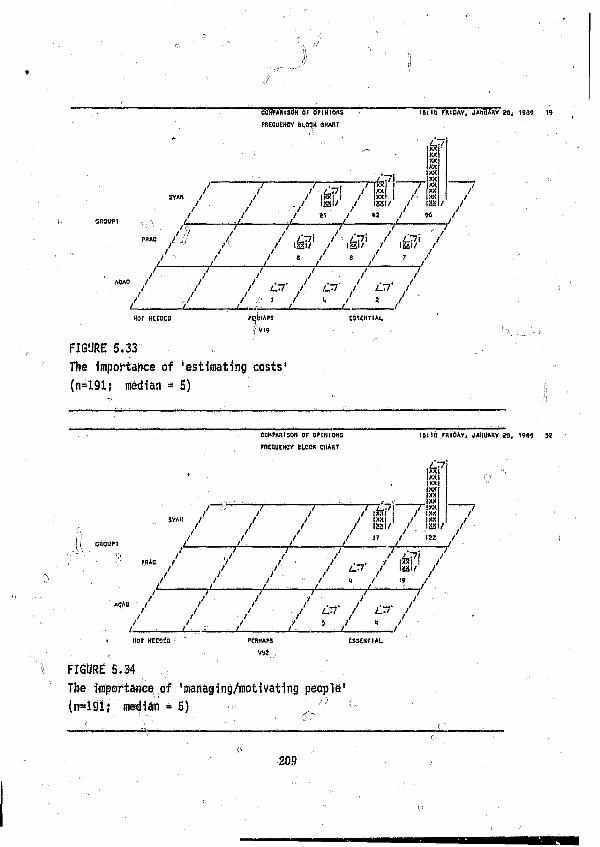
COMPARISON O f OPINIONS
FREQUENCY BLOCK CHART
7 T3 TTw<i / xx J C 7 ? * / K X i i J \*xI**} I t xxi XX
r SR O U fI
PRAC
-----------------7---------------SYAH I I ) '| JR | ' I . ____ . . . . . .
/ t . / I a s i/ / u s * !/ / taa / /
' f ------------^ ---------- - A
/ A / l i/' / 1 1/' / 10' /
1 6 U O FRIDAY, JANUARY 20, 1989 19
.^7XXixxXXxxixxm
/" / / v • / . ' /ACAO / / / ♦ « _ . / / * _ ♦ /
/ / / ^ ^ ^ / .
/ — /_______ <1___ ?../I... u__ L ./HOT HECOCD fC|tHAPS
" V 19
ESSENTIAL
FIGURE 5.33
The importance of 'estimating costs'
(n*191j median = 5)
com parison or o p in io n s
FREQUENCY StOCK CHART
56!IQ FRIDAY, JANUARY 20i 1969 52
/ IxIiM // ISI/1 /
(P
w
/ -----7 ------ 7 ~S¥A« I I I . .................................. .
/ / / / iai/ / . as / // / ,/ / iT i \ii I
/ — t “— / — t ' — . / s r - /pbac /' 7 I I / |JW| i /
/ / / / ^ /
. . / ■ / / / V v -/ / / / & / & /
/ / / / 5 / “ /nor sccocs rtniHKi
V5J ,
FIGURE 5.34
The importance of 'managing/motivating people'
(n*i9l{ median 5) ' ' *
209

Jh
A third area where there was evidence that the role of the'systems
analyst in the future was expected to expand was into the realm of
strategic planning. This skill has been regarded as a separate group
because strategic planning must be regarded as a significant step away
from usual systems analysts' responsibilities (see section 2.1.1.4).
Strengths of opinions from the groups participating in the empirical
research are given in figure 5.35.
COMPARISON Of OPIN IONS
FRCQUCNBV BLOCK CHART
161(0 FR IDAY, JANlMRY 20, t9#9 54
T XX T --T
7XXXXXXXXXXXXXX
u /
. . I /. .1 / X X I | J
-j / / m/ // , v / // is J 35 / 09 /V -------j ----- Th..— —7
PRAB J
/ / J —J JACAQ I /
/ /
/ / ih?/ / i i/1 / iQ7/ // t in / 8 / 5 /I----,— /------- /-------y------
/ 11 / » » / t / Lt?' / \k?/ / ilrr' /
/ 1 / 7 / ‘ /NOT NCCOCO PERHAPS
V5>|CSSEHT IAL
FIGURE 5.35 j;\
The importance of 'strategic planning'
(n»19i; median ■ 4)
f the final area beyond the traditional role of the systems analyst
which could become a future skills requirement is “related directly to
databases* The opinions of the questionnaire respondents on the
importance of the skill of designing logical data models is presented in
tire 5.36.
210
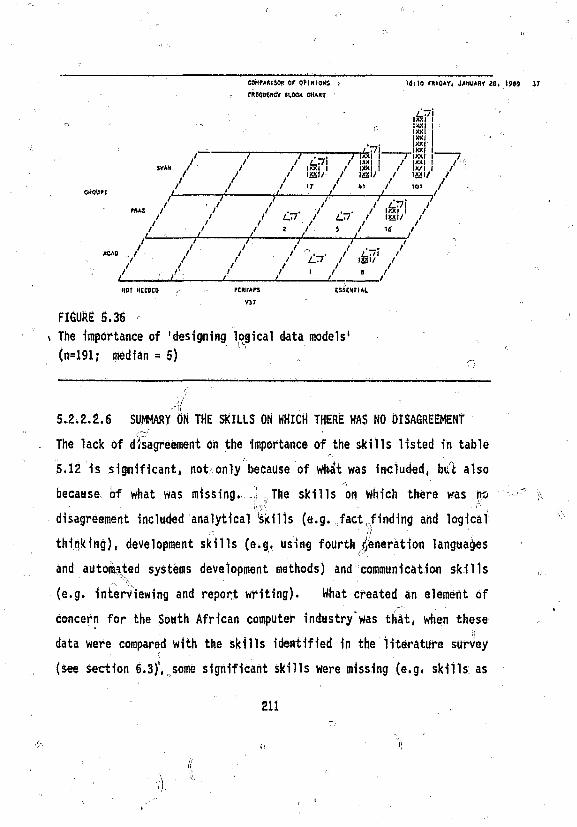
COMPARISON or OPINIONS , nteOKNGV BLOCK CHART
16:10 FRIDAY, JANUARY 20, 1999 37
kI{XX IXXix x | XX
l ^ 7 \ _______ ix x
SYAN /
/
7 TIT; 7T«tl I T ixx / i_T7i / ixki I / ixx
/ iiexi I / ixx | / |x / ./ iiaiA / mu / m / /
/ IT - / «t / lo t / / --------------- jt— --- /
/
■ MAC ///
/ _ ____ r
ACAD ( / /
/ / / / ‘ /HOf NECDCO
FIGURE 5.36
PERHAPS
V J ?
ESSENTIAL
i The importance of 'designing logical data models'
(n=191; median = 5) ,
I I I 4T7I , J / l&l I /f l i S7 / £.77 I i mi f !
J 2 / 5 / 16 /J __________ JL—____ . / ■■■■_______ /
. / /t IS ! / |Si/ // i / » // >________/
f/
5.2.2.2.6 SUMMARY ON THE SKILLS ON WHICH THERE WAS NO DISAGREEMENT
The lack of disagreement on the importance of the skills listed in table
5.12 is significant, not only because of whit was included, blit also
because of what was missing. .;! The skills on which there was noU? {(' l\V, . . „
disagreement -included analytical 'skills (e.g. fact-finding and logical
thinking), development skills (e.g, using fourth generation languages
and automated systems development methods) and communication skills
(e.g. interviewing and report writing). What created an element of
concern for the South African computer industry was that, when these
data were compared with the skills identified in the literature survey
(see section 5.3), some significant skills were missing (e.g* skills as
211
I
((\\
a change agent,skills in business practices, using prototyping
techniques and the whole range df interpersonal relationship and
inanageaent skills). Although these skills were regarded as important
by the sample population as a whole (see section 5.2.2.2), the fact that
there was/disagreement on their importance suggests a lack of foresight- / „
in the South African computer industry. '
/ ' ■ .. i7 - ‘ -// " "
5.272.3 SUMMARY ON COMPARISONS OF RESPONDENTS' OPINIONS ■
/ " nIII this section the opinions of the three constituent groups of
respondents (expert practitioners, academics and systems analysts) Were
compared. Although these comparisons showed strong indications of the
^changing role of the systems analyst (see section 5.2.2.2.4 above) a
number of inconsistencies in the areas of disagreement, were Identified.
For example, it was expected that there would be no disagreement among
the respondents on the significance of, skills in business practices for
the future systems analysts In the light of there being no disagreement
that they would have the increasing of business skills as a job
responsibility. This survey, therefore, revealed a certain lack of
' l) —
consistency and possibly even piiepareuhesspon the part of the South
African computer industry, for the role of the systems analyst in future
application systems development (see- Crossman (1987) and Crossman
(1988)). ^
5.3 JOB RESPONSIBILITIES/SKILLS MODEL
The job resportsibilities/skilis model, which will be compared with the
roles/skills model in section 7/|M and provides input to identifying
212
■v./?
the skills profile of the systems analyst of the future (section 7,3.2),
was built using the empirical data.
5.3.1 — FIRST ATTEMPT AT BUILDING THE MODEL '( ^ ' ; ■ ■
Initially it was envisaged that the inclusion in the next stages of the
research of the skills identified as important by the respondents to the1
questionnaire could be substantiated by following the steps below:
(i) Calculate the median scores for each dimension to both the
question relating to future systems analysts job responsibilities
(questionnaire section 4) and skills (questionnaire sections).
Detailed descriptive statistics for each dimension is provided in
appendix ‘K 1. - i
(ii) Identify those dimensions with median scores of 4 or 5 (on tbs
Scale 1 = not required to 5 = definitely required) ana regard
these dimensions as important to tha respondents (Freund and
Williams, 1977, p*28). [I
(iii) Place each job responsibility into one of the categories. .. . ■ if r
identified in section 5.2.2. ," '// ,
required (by the definition of systems analyst( j 1 ' n
used in the research - ,i\ ' )J <;■ .
required to support the main systems analysts1
responsibilities
required to cate|~ for the changes in the role of the systems analyst*
(iv) Justify the inclusion of each important skill by establishing
links between the dimensions in section 3, 4 and 5 of the
Category 3.1
Category 3.2
Category 3*3
questionnaire, (e.g. If prototyping was expected to be one uf the
methods of building systems in the future, and prototyping systems
w=is regarded as a systems analysts' job responsibility, then the
future systems analyst would be expected to possess skills of
prototyping and using fourth generation language!).
Unfortunately this simple approach could not be used because, in
some cases, these links were not present. (e.i|. Jobr,responsibilities
were missing in the areas of controlling/auditing application systems,
strategic planning and database activities while the respondents
indicated that skills in these areas were expected.)
Another procedure, therefore, needed to be followed to establish
confidence that these skills were a consistent representation of the
opinions of the respondents to the questionnaire.
J5.3.2 SECOND ATTEMPT AT BUILSlM THE MODEL ,
The job responsibilities/ir.il'i'T model was built initially using a
'bottom-up' approach. 'die steps followed are described below, and
presented diagrammatically in figure 5.37.'
(i) The median scores for each dimension were calculated as described
in section 5.3*1 point (i).
(ii) Dimensions with median scores of 4 or 5 were regarded as
representing an important opinion (as in section 5.3.1 point
(io). ” ■ ■ ■ it
(iii) The important dimensions from both sections 4 and 5 of the
questionnaire (future job responsibilities and future skills) were
regarded as level 1 of the model.
7 - 214 \ ,
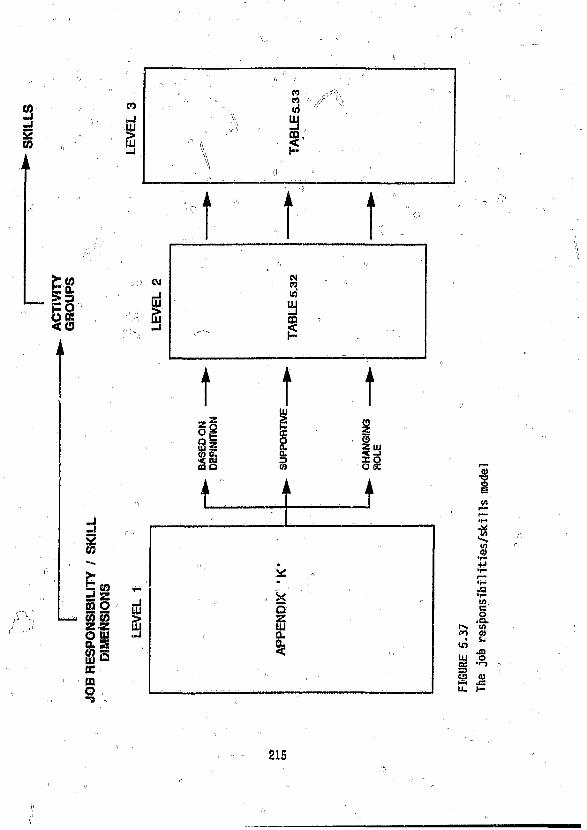
0?
w
» 3i=oO K< o
z S O g
S p(n E< UJ 2 Q
1
-I2 cn
£q tnmi 2I O (0 55 z z o ia. S
-1UJ
§UJ£Ctno“5
UJa
t
t t t
xoo cc
i
!i ' "
, «"■' ' nQ“y>UJELQL<
215
FIGURE
5.3
7
The
job
responsibi1ities/ski 11s
model
(iv) The dimensions in level 1 of the model were grouped into clusters
(for details see section 5.3.2*1).
(v) Each identifiable cluster was given a name to describe the
activities within the group, these descriptive' names constituted
level 2 of the job responsibilities/skills model. (To promote
consistency in the study these activity groups were also divided
into the 3 categories defined in section 5.2,2.2).
(vi) All the skills which were identified as necessary to each of the
activity groups were regarded as the third level of the model and
Used as input to later stages of the research (see section 7.3.1
and 7.3.2),
5.3.2.1 ,, ESTABLISHING ACTIVITY GROUPS
The first level of the job reSponsibilities/skill model contained those
dimensions in sections 4 and 5 of the questionnaire which, in the
opinions of the respondents, were Regarded as important to the future
systems analyst (see appendix 'K‘). These dimensions were grouped into
clusters. This clustering was achieved by applying one of three
approaches: „
- activity groups were identified by extracting those dimensions
with fairly strong Tau-B correlation coefficients and highly
significant probablity levels (because of the sample Size it was
possible to select these groups from only those dimensions with
correlation coefficient of greater than ,3000 and a probability
level of no greater than ,0001)j
216
- following a lead from the literature;
- a combination of both of the above approaches.
By its nature, this process was interpretive. In the paragraphs
below the basic steps which were followed are„ outlined, and
illustrations of the process are given. \
Besides enforcing the statistical1y-ba\ed selection identified
above,., for each dimension the highest ranked Tau-B correlation
coefficients were identified. If it appeared that there was meaning in
the correlation of two dimensions, those items were regarded as part of
an activity group, and the next highest coefficient was inspected. This
process continued until an item was identified which was regarded, as
having a spurious correlation with the base dimension. Once this
Spurious correlation was identified, no further items were included in
that activity group. ^, V")
The activity group identified in table 5.13 is used to illustrate
the process. Tbe base dimension was cost-analyzing systems (C2) and the
four highest correlation coefficients ware for the skill of cost benefit
analyzing (V12), the job responsibility of conducting feasibility
studies (C4), the skills of estimating costs (V19) arid estimating
timescales (20). These correlation coefficients ranged from a high of
,5241 to a low Of ,3099. The probability value in each case was either
,0000 or ,0001. The dimension task prioritizing (V53) had the next
highest correlation coefficient at ,2977. Not Only was the correlation
below the limit set, but the item was not regarded as one which belonged
to a costing activity. This correlation was therefore regarded as
spurious, and no further items were included in that group.
217.■) 1 1 ■ ■
n :: :>\\ .. ■
The details of applying the clustering process are given below.
On some occasions it was regarded as appropriate to create an activity
group from a stand-alone dimension (e.g. see the 'change agent' skill" ' ■ c")
(V7) below), because although no activity group, as such, could be
identified, the activity is well documented in the literature. ’
To provide a consistent approach within the study (see section
5.2.2.2), the resuTtartt activity groups are presented in the three
categories of: r - -
- activities based on the definition of systems analyst (section
' 2.1.1.4); ,
- activities which support the systems analyst activity;
- activities which suggest a change in the role of the systems
analyst.
To facilitate cross-referencing, each dimension referenced is
associated With the code-name used in the statistical processes (see
appendices *J 1 and ’K 1).
5.3.2.1.1 ACTIVITIES BASED ON DEFINITION OF SYSTEMS ANALYST
The activity groups identified in the section were;
costing activities
formal analysis procedures
information engineering
system feasibility determination
user contact
(NOTE: All the activity groups are presented in alphabetic order to
prevent any iraplied priority*)
218
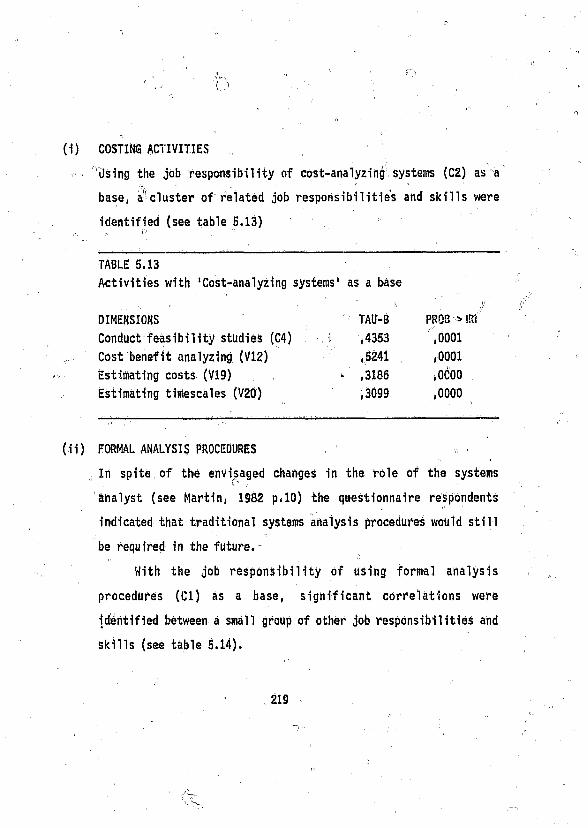
(1) COSTING ACTIVITIES
Using the job responsibility of cost-analyzing systems (C2) as a
base, a cluster of related job responsibilities and skills were
identified (see table 5.13)
TABLE 5.13
Activities with ‘Cost-analyzing systems' as a base
. ;DIMENSIONS ‘ TAU-B PROS * Utt
Conduct feasibility studies (C4) i ,4353 ,0001
Cost benefit analyzing (V12) ,5241 ,0001
Estimating costs (V19) • ,3186 ,0C00
Estimating timescales (V20) ,3099 ,0000
(ii) FORMAL ANALYSIS PROCEDURES >
. In spite of the envisaged changes in the role of the systems
analyst (see Martin, 1982 p*10) the questionnaire respondents
indicated that traditional systems analysis procedures would still
be required in the future.
With the job responsibility of using formal analysis
procedures (Cl) as a base, significant correlations were
identified between a snail group of other job responsibilities and
skills (see table S.14)*
219
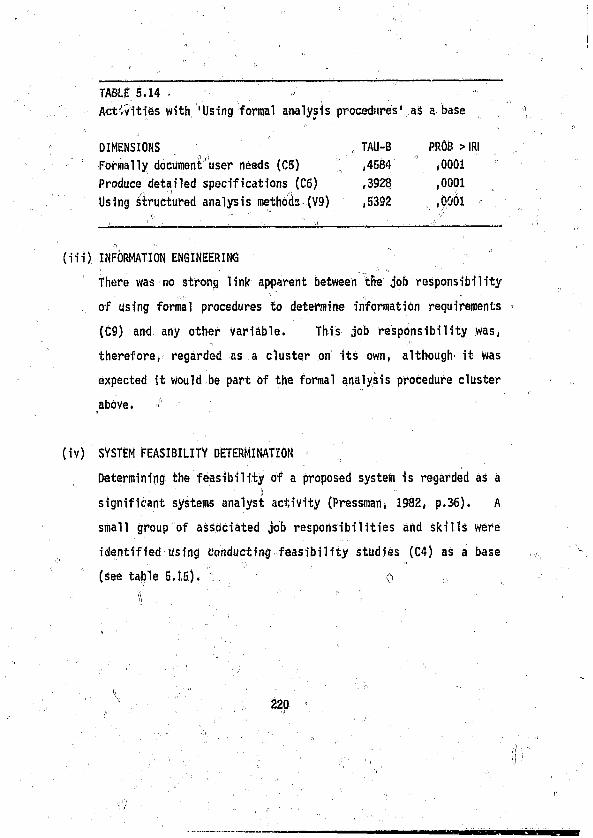
TABLE 5.14 -
Actwities with 'Using formal analysis procedures' as a base
DIMENSIONS TAU-B PROS > IRI
Formally document user needs (C5) ,4584 ,0001
Produce detailed specifications (C6) ,3923 ,0001
Using structured analysis methods (V9) ,5392 ,0001 -
(iii) INFORMATION ENGINEERING
There was no strong link apparent between the job responsibility
of using formal procedures to determine information requirements
(C9) and, any other variable. This job responsibility was,
therefore, regarded as a cluster on its own, although' it was
expected it Would be part of the formal analysis procedure cluster
above. !
(iv) SYSTEM FEASIBILITY DETERMINATION
Determining the feasibility of a proposed system is regarded as a
significant systems analyst activity (Pressman, 1982, p.36). A
small group of associated job responsibilities and skills were
identified using conducting feasibility studies (C4) as a base
(see table 5.15). O n „
■■ ( ''' ■ n ■■ ' ’
220
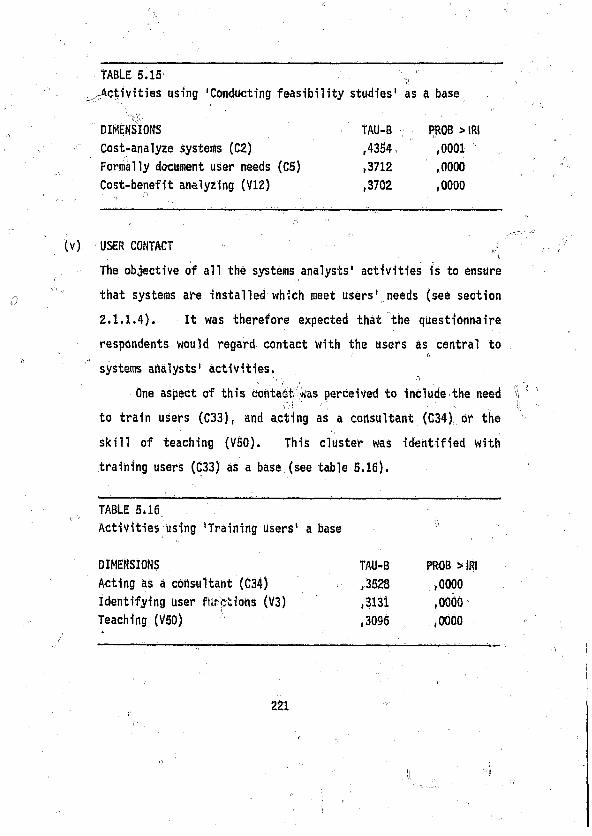
TABLE 5.15 >,
^Activities using 'Conducting feasibility studies' as a base
DIMENSIONS TAU-B PROB > IRI
COat-aiiQ lyze systems (C2) ,4354 ,0001
Formally document user needs (C5) ,3712 ,0000
Cost-benefit analyzing (VIZ) ,3702 ,0000
USER CONTACT j. ‘ I/
The objective of all the systems analysts' activities is to ensure
that systems are installed Which meet users' needs (see section
2.1.1.4). It was therefore expected that the questionnaire
respondents would regard contact with the users as central to
systems analysts' activities.
One aspect of this contact, was perceived to include the need
to train users (C33), and acting as a consultant (C34) or the
skill of teaching (V50). This cluster was identified with
training users (C33) as a base (see table 5.16).
TABLE 5.16
Activities using 'Training users' a base *
DIMENSIONS TAU-B PROB > IRI
Acting as a consultant (C34) ,3528 ,0000
Identifying user functions (V3) ,3131 ,0000
Teaching (V50) ,3096 ,0000
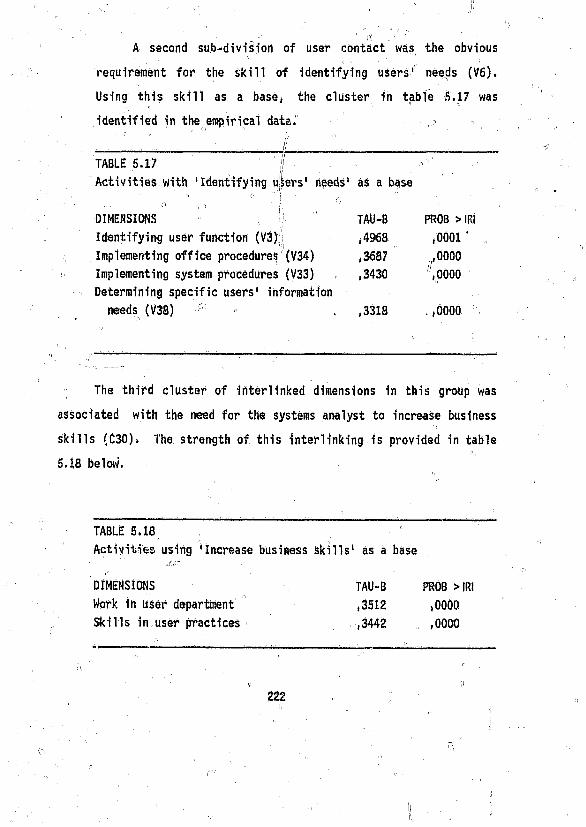
. , - l< r' " ' ..A second sub-division of user contact was the obvious
requirement for the skill of identifying users' needs (V6).
Using this skill as a base, the cluster in table -5,17 was
identified in the empirical data." :
J \ i i .
TABLE 5.17 ' ''j ! ~ ~ "
Activities with 'Identifying u W s ' needs' as a base
DIMENSIONS ;/ TAU-B PROB > IRI
Identifying user function (V3) ,4968 ,0001 '
Implementing office procedures (V34) ,3687 ,0000
Implementing system procedures (V33) ,3430 ,0000
Determining specific users' information
needs (V38) ■ . ,3318 .,0000
The third cluster of interlinked dimensions in this group was
associated with the need for the systems analyst to increase business
skills (C30)# The strength of this interlinking is provided in table
5.18 below.
TABLE 5.18
Activities using 'Increase business skills' as a base
DIMENSIONS TAU-B PROB >1
Work in User department ,3512 ,0000
Skills in user practices ,3442 ,0000
222
5*3*2.1.2 SUPPORTIVE ACTIVITIESt\\ 1,1 ° ■ ' C
The activity groups in this section are those which enable the systems
analyst to function effectively. They include: \
1 0business skills |
* • '‘f\ , l: change agent skills i
communication skills -
decision making skills
fact finding skill
inter-personal relationship skills
keeping abreast of technology
problem solving skills
teaching skills
(The activity groups are presented in alphabetic order.)
(i) BUSINESS SKILLS
'inconsistencies in the questionnaire respondents' opinions on the
need for systems analysts to develop business skills has been
noted (see section 5.2.2.1). In spite of these inconsistencies,
however, some links between associated job responsibilities and
skills could be identified by basing the cluster on the skill of
implementing office procedures (V34) (see table 5.19).
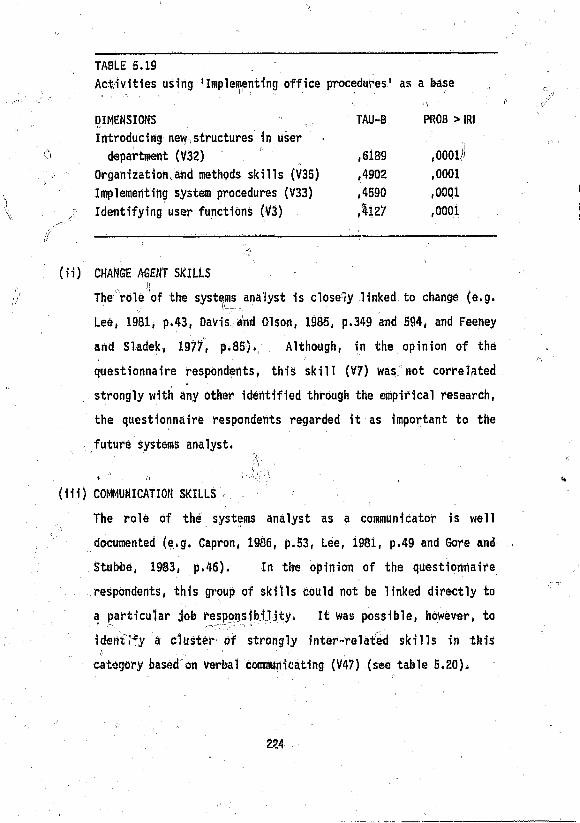
TABLE 5.19
Activities using 'Implementing office procedures1 as a base
DIMENSIONS " „ TAU-B PROB > 1RI
Introducing new structures in user
department (V32) ,6189
ooo
Organization,and methods skills (V35) ,4902 ,0001
Implementing system procedures (V33) ,4590 ,0001
Identifying user functions (V3) , % W ,0001
(ii) CHANGE AGENT SKILLS
The role of the systems analyst is closely linked to change (e.g.
Lee, 1981, p.43, Davis and Olson, 1985, p.349 and 594, and Feeney
and Sladek, 1977, p.85). Although, in the opinion of the
questionnaire respondents, this skill (V7) was not correlated
strongly with any other identified through the empirical research,
the questionnaire respondents regarded it as important to the
, future systems analyst.
(iii) COMMUNICATION SKILLS
The role of the systems analyst as a communicator is well
documented (e.g. Capron, 1986, p.53, Lee, 1981, p.49 and Gore and
Stubbe, 1983, p.46). In the opinion of the questionnaire
respondents, this group of skills could not be linked directly to
a particular job responsibility. It was possible, however, to
identify a cluster of strongly inter-related skills in thisft . . 1 ■ '
category based on Verbal communicating (V47) (see table 5.20).
224
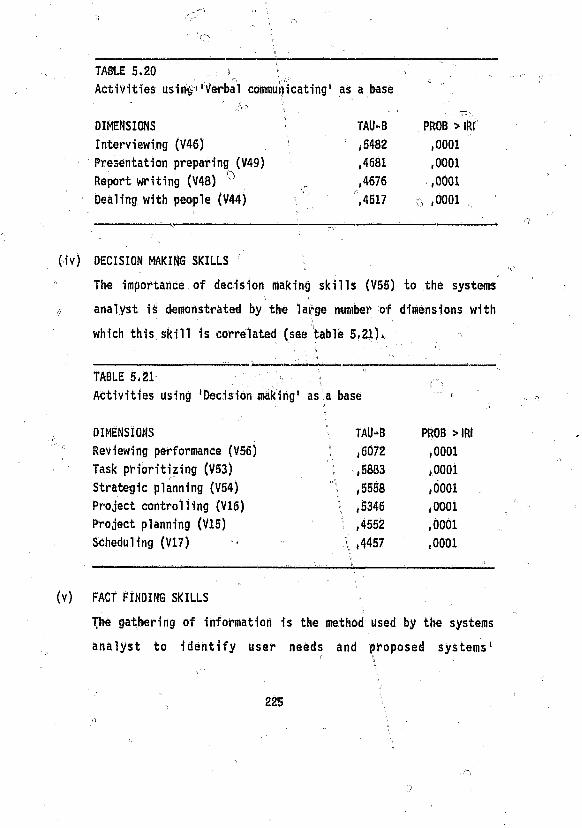
TABLE 5.20 ^ I
Activities usinfe 'Verbal communicating' as a base
DIMENSIONS : TAU-B PROB > IRl
Interviewing (V46) * 5482 ,0001
Presentation preparing (V49) ,4681 ,0001
Report writing (V48) ^ „ ,4676 ,0001
Dealing with people (V44) ,4517 ,0001
DECISION MAKING SKILLS
The importance of decision making skills (V55) to the systems
analyst is demonstrated by the large number of dimensions with
which this skill is correlated (see table 5,21).'' , i : , ■ '
0-
TABLE 5.21 , :f "
Activities using 'Decision making1 as a base
DIMENSIONS TAU-B PROB > IRl
Reviewing performance (V56) ; ,6072 ,0001
Task prioritizing (V53) ; ,5883 ,0001
Strategic planning (V54) \ ,5558 ,0001
Project controlling (V16) \ ,5346 ,0001
Project planning (V15) ; ,4552 ,0001
Scheduling (V17) • \ ,4457 ,0001
FACT FINDING SKILLS
The gathering of information is the method used by the systems
analyst to identify user needs and proposed systems*
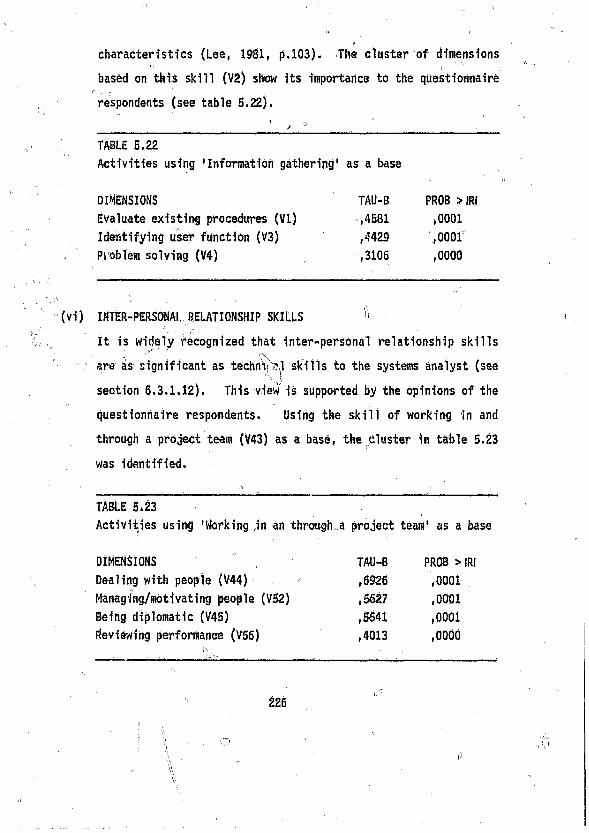
characteristics (Lee, 1981, p.103). The cluster of dimensions
based on this skill (V2) show its importance to the questionnaire
respondents (see table 5.22).
TABLE 5.22
Activities using 'Information gathering1 as a base
DIMENSIONS TAU-B PROB > IRI
Evaluate existing procedures (VI) ,4581 ,0001
Identifying user function (V3) ,4429 ,0001
Problem solving (V4) ,3106 ,0000
INTER-PERSONAL RELATIONSHIP SKILLS >'
It is widely recognized that inter-personal relationship skills
'' ■■ ■ ■ are as significant as technV^l skills to the systems analyst (see
section 6.3.1.12). This view is supported by the opinions of the
questionnaire respondents. Using the skill of working in and
through a project team (V43) as a base, the Cluster in table 5.23
was identified.
TABLE 5.23
Activities using 'Working in an through a project team1 as a base
DIMENSIONS TAU-B PROB >IRI
Dealing with people (V44) ,6926 ,0001
Managing/motivating people (V52) ,5627 ,0001
Being diplomatic (V45) ,5541 ,0001
Reviewing performance (V56) ,4013 ,0000
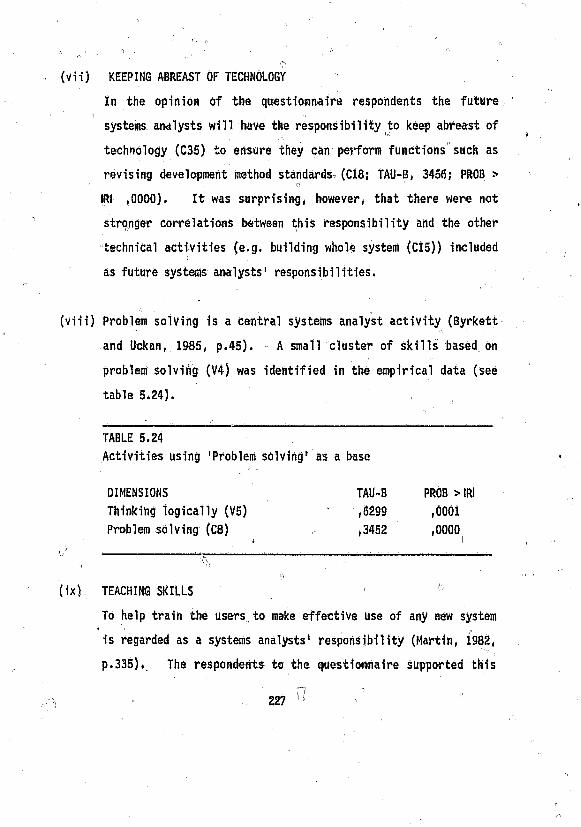
(vii) KEEPING ABREAST OF TECHNOLOGY "
In the opinion of the questionnaire respondents the future
systems analysts will have the responsibility to keep abreast of
technology (C35) to ensure they can perforin functions-such as
revising development method standards (C18; TAU-B, 3456? PROB >
IRI ,0000). It was surprising, however, that there were not
stronger correlations between this responsibility and the other
technical activities (e.g. building whol« system (CIS)) included
as future systems analysts' responsibilities.
(viii) Problem solving is a central systems analyst activity (Byrkett
and Uckan, 1985, p.45). A small cluster of skills based on
problem solviiig (V4) was identified in the empirical data (see
table 5.24).
TABLE 5.24
Activities using 'Problem solving’ as a base
DIMENSIONS TAU-B PROB > IRI
Thinking logically (V5) ■ ,6299 ,0001
Problem solving (C8) ,3452 ,00001!
(ix) TEACHING SKILLS 0
To help train the users to make effective use of any new system
is regarded as a systems analysts' responsibility (Martin, 1982,
p.335). The respondents to the questionnaire supported this
■ 227 A ’

view. The cluster of dimensions in table 5.25 was identified,
based on the skill of teaching (V50).
a
TABLE 5.25
Activities using 'Teaching1 as a base
DIMENSIONS TAU-B PROB > IRI
Presentation preparing (V49) ,4485 ,0001
Selling ideas (V51) ,3779 ,0000
Verbal comntunieating (V47) ,3654 r, >0000
- _ o
5.3.2.1.3 ACTIVITIES WHICH REFLECT CHANGES IN THE ROLE OF THE SYSTEMS
ANALYST
The activity groups identified front level 1 of the model which indicate
that the responsibilities of the systems analyst are changing, Were!
acquiring systems
audit and control activities
database responsib’*!ities
designing systems
identifying appropriate development method
management
strategic planning activities.
(The activity groups are presented in alphabetic order.)
(i) ACQUIRING SYSTEMS \H - ■ .
One of the more dramatic changes envisaged in the future role of
the Systems analysts is that they will rtot only be involved in the
228
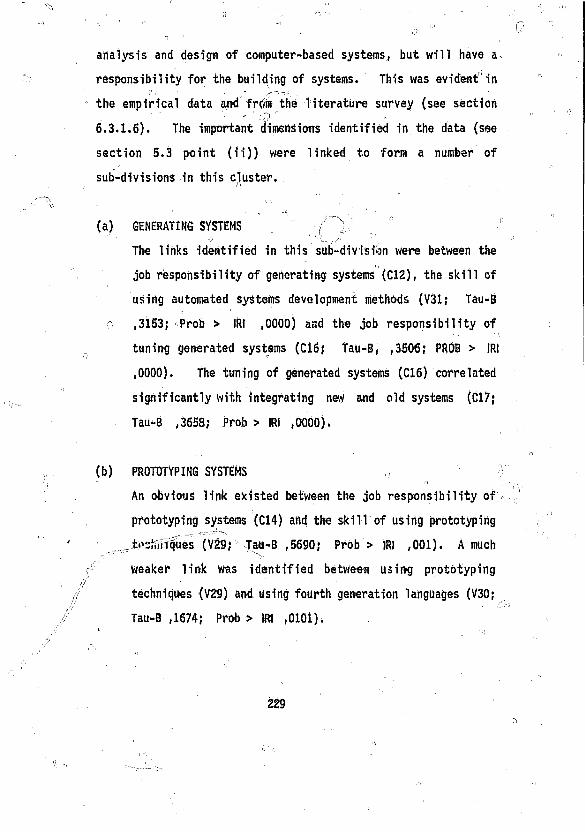
analysis and design of computer-based systems, but will have a.
responsibility for the building of systems. This was evident in
the empirical data and from the literature survey (see section
6.3.1.6). The important dimensions identified in the data (see
section 5.3 point (ii)) were linked to form a number of
sub-divisions in this cluster.r,
(a) GENERATING SYSTEMS 1
The links identified in this sub-division were between the
job responsibility of generating systems (Cl2), the skill of
using automated systems development methods (V31; Tau-B
o ,3153; Prob > IRI ,0000) and the job responsibility of
tuning generated systems (C16; Tau-B, ,3506? PROB > IRI
,0000). The tuning of generated systems (C16) correlated
significantly with integrating new and old systems (C17;
Tau-B ,3658; Prob > IRI ,0000).
(b) PROTOTYPING SYSTEMS ,
An obvious link existed between the job responsibility of
prototyping systems (C14) and the skill of using prototyping
t.v:!iinques (V29; Tau-B ,5690; Prob > IRI >001). A much
weaker link was identified between using prototyping
techniques (V29) and using fourth generation languages (V30;■ C,
Tau-B ,1674} Prob > IRI ,0101).
229
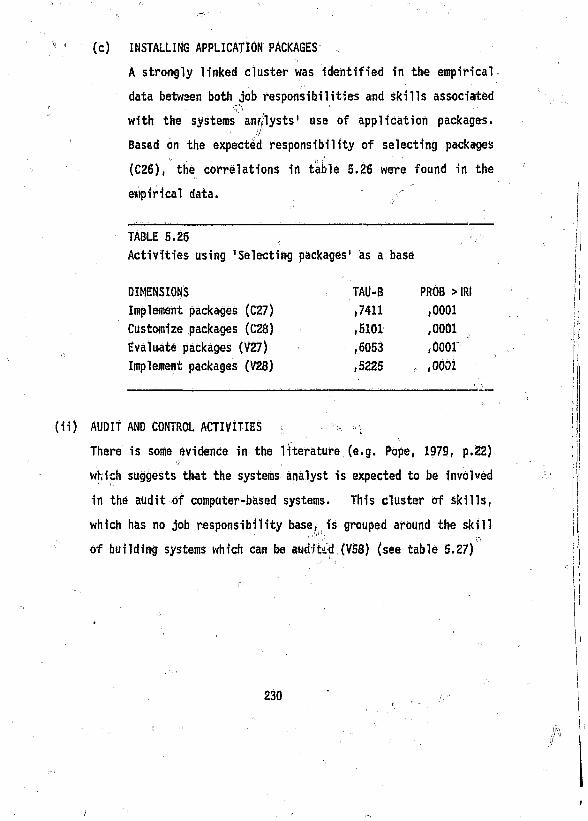
(c) INSTALLING APPLICATION PACKAGES
A strongly linked cluster was identified in the empirical
data betwsen both job responsibilities and skills associated''0
with the systems analysts' use of application packages.
Based on the expected responsibility of selecting packages
(C26), the correlations in table 5.26 were found in the
empirical data.
TABLE 5.26 r
Activities using 'Selecting packages' as a base
DIMENSIONS TAU-B PROB > IRI
Implement packages (C27) ,7411 ,0001
Customize packages (C28) ,5101 ,0001
Evaluate packages (V27) ,6053 ,0001
Implement packages (V28) ,5225 - ,0001
) AUDIT AND CONTROL ACTIVITIES ,
There is some evidence in the literature (e.g. Pope, 1979, p.22)
which suggests that the systems analyst is expected to be involved
in the audit of computer-based systems. This cluster of skills,
which has no job responsibility base, is grouped around the skill
of building systems which can be auriitid (V58) (see table 5.27)
230
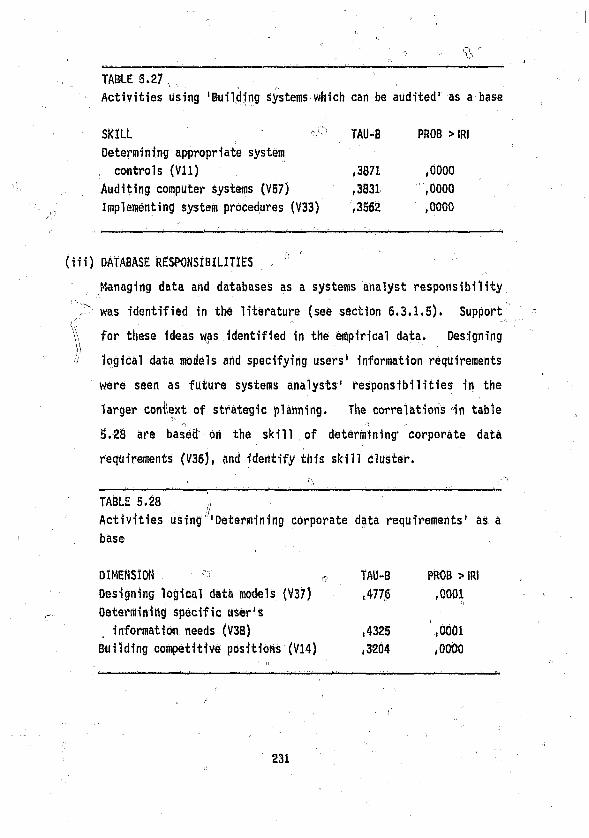
TABLE 5.27
Activities Using 'Building systems which can be audited1 as a base
SKILL ! TAU-B PROB > IRI
Determining appropriate system
controls (Vll) 13871 ,0000
Auditing computer systems (V57) ,3831 ,0000
Implementing system procedures (V33) ,3562 ,0000
(iii) DATABASE RESPONSIBILITIES ''
Managing data and databases as a systems analyst responsibility
was identified in the literature (see section 6.3.1.5). Support
^ for these ideas was identified in the empirical data. Designing
■>'i logical data models and specifying users1 inforaation requirements
were seen as future systems analysts1 responsibilities in the
larger conilekt of strategic planning. The correlations in table
5.28 are based on the skill of determining' corporate data
requirements (V36), and identify this skill cluster.
__________ ■_____________________VN _________________ ^
TABLE 5.28
Activities usingDetermining corporate data requirements' as a
base
DIMENSION ■' r,< TAU-B
Designing logical data models (V37) ,4776
Determining specific user's
, information needs (V38) ,4325
Building competitive positions (V14) ,3204
PROB > IRI
,0001
,0001
,0000
231
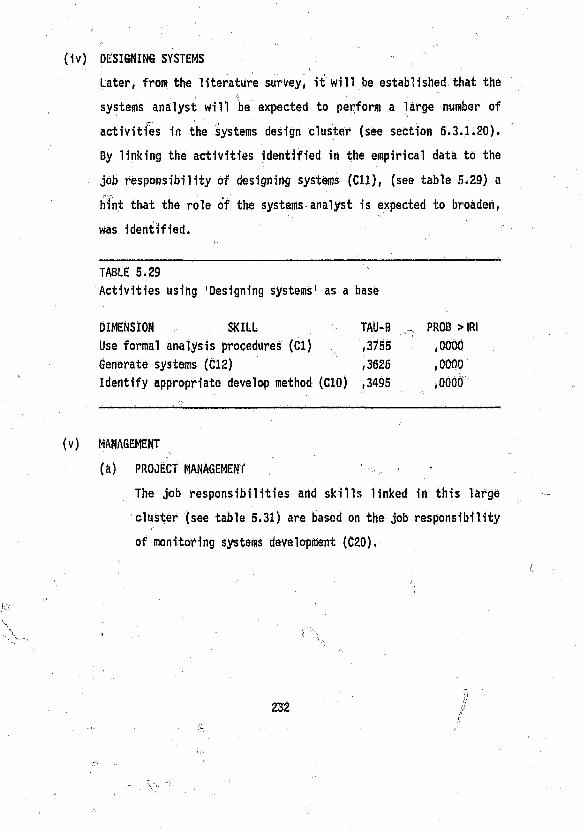
DESIGNING SYSTEMS r
Later, from the literature survey, it will be established that the .. \\
systems analyst will be expected to perform a large number of
activities in the systems design cluster (see section 6.3.1.20).
By linking the activities identified in the empirical data to the
job responsibility of designing systems (Cll), (see table 5.29) a
hint that the role of the systems analyst is expected to broaden,
was identified. „ "
TABLE 5.29
Activities using 'Designing systems' as a base
DIMENSION SKILL TAU-B „ PROB > IRI
Use formal analysis procedures (Cl) ,3755 ,0000
Generate systems (Cl2) ,3626 ,0000
Identify appropriate develop method (CIO) ,3495 ,0000
m a n a g e m e n t
(a) PROJECT MANAGEMENT ‘
The job responsibilities arid skills linked in this large
cluster (see table 5.31) are based on the job responsibility
of monitoring systems development (C20).
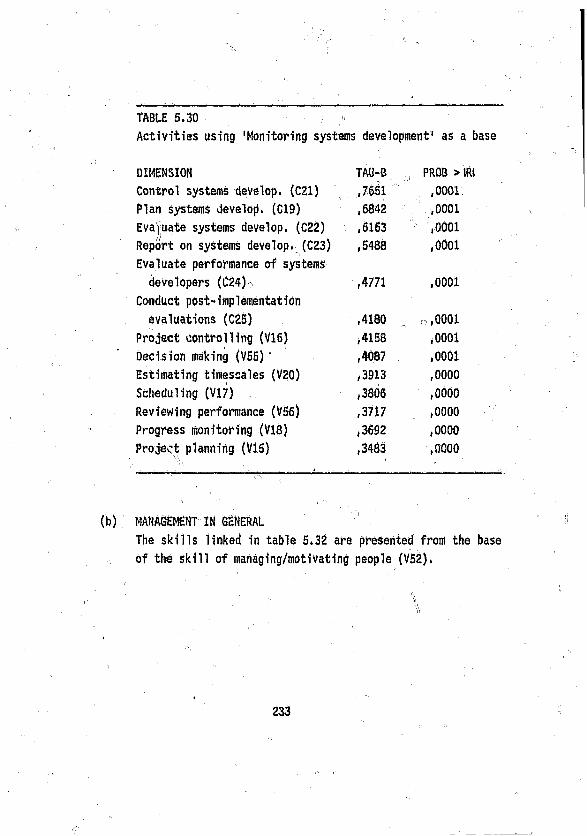
TABLE 5.30
Activities using 'Monitoring systems development' as a base
DIMENSION TAU-B PROB > IRl
Control systems develop. (C21) ,7651 ,0001:
Plan systems develop). (C19) ,6842 ,0001
Evaiuate systems develop. (C22) ,6163 0 ,0001
Report on systems develop. (C23) ,5488 ,0001
Evaluate performance of systems
developers (C24)o ,4771 ,0001
Conduct post-imp1ementation
evaluations (CZS) ,4180
ooo
Project controlling (V16) ,4158 ,0001
Decision making (V55) ‘ ,4087 ,0001
Estimating tiiiescales (V20) (3913 ,0000
Scheduling (V17) ,3806 ,0000
Reviewing performance (V56) ,3717 ,0000
Progress monitoring (V18) ,3692 ,0000
Project planning (V15) ,3483 ,0000
(b) MANAGEMENT IN GENERAL '
The skills 1 inked in table 5*32 are presented front the base
of the Skill of managing/motivating people (V52).
‘ ' \
233
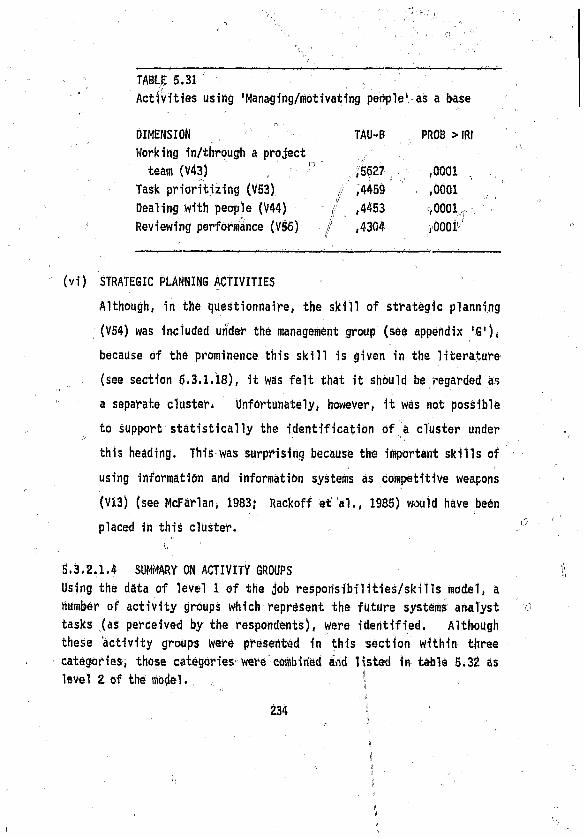
TABLE 5.31 - ,
Activities using 'Managing/motivating people1 as a base1IVDIMENSION
Working in/through a project
team (V43) :
Task prioritizing (V53)
Dealing with people (V44) j
Reviewing performance (V56) /
TAU-B PROB > IRI
5627 ,0001
,4459 - ,0001
,4453 ,0001
,4304 ,0001
(’/i) STRATEGIC PLANNING ACTIVITIES
Although, in the questionnaire, the skill of strategic planning
(V54) was included under the management group (see appendix 1S *)<
because of the prominence this skill is given in the literature
(see section 6.3.1.18), it was felt that it should be regarded as
a separate cluster. Unfortunately, however, it was not possible
to support statistically the identification of a cluster under
this heading. This was surprising because the important skills of
using information and information systems as competitive weapons
(V13) (see McFarlan, 1983; Rackoff at al., 1985) would have been
placed in this cluster.
5.3*2.1.4 SUMMARY ON ACTIVITY GROUPS
Using the data of level 1 of the job reSpoHsibilities/skills model, a
number of activity groups which represent the future systems analyst
tasks (as perceived by the respondents), were identified. Although
these activity groups were presented in this section within three
categories, those categories were combined aftd listed in table 5.32 as
level 2 of the model. , . 5
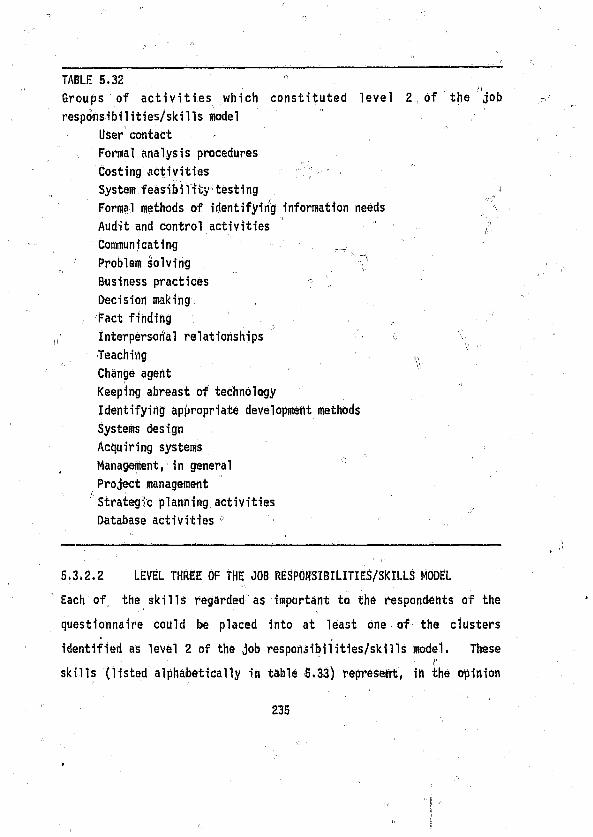
TABLE 5.32 " . _
Groups of activities which constituted level 2 of the job
responsibilities/skills model
User contact • .
Formal analysis procedures
Costing activities
System feasibility testing 1
Formal methods of identifying information needs
Audit and control activities
Communicating J _
Proble* solving v
Business practices r
Decision making
Fact finding , '
Interpersonal relationships ' (
Teaching ^ !>"■ \y
Change agent
Keeping abreast of technology
Identifying appropriate development methods
Systems design
Acquiring systems
Management; in general 1
Project management
' Strategic planning activities
Database activities 0
5.3.2,2 LEVEL THREE OF THE JOB RESPONSIBILITIES/SKILLS MODEL'I .
Each of the skills regarded as important to the respondents of the
questionnaire could be placed into at least one of the dusters
identified as level 2 of the job responsibilities/skills model. These , " . a
skills (listed alphabetically in table 5.33) represent, in the opinion
,of representatives of the South African computer industry, the skills
profile of the systems analyst of the future, and constitute level 3 of
the model. K, , ', ¥
S.3.2.3 SUMMARY ON BUILDING THE JOB RESPONSIBILITIES/SKILLS MODEL
The objective Of this stays of the research Was to identify the skills
which, in the opinion of the questionnaire respondents, will be requiredf: ri '
by the;' future systems analyst. Because of inconsistencies within the
replies from the respondents, identifying these skills could not be done
simplistically. An approach was taken, using as a base the median
scores of each dimension of both sections 4 and 5 of the questionnaire.
This was regarded as level 1 of the model. This base enabled a number
of systems analyst activity groups to be identified which confirmed a
change in the role of the systems, analyst. These activity groups were
regarded as the second level of the model. All the skills which were
part of these activity groups were those identified as important to the
future systems analyst by the questionnaire respondents. These skills,
regarded as level 3 of the modal, provided clear indication of the
skills a sample population of the South African computer industry
thought should be expected of the future systems analyst.
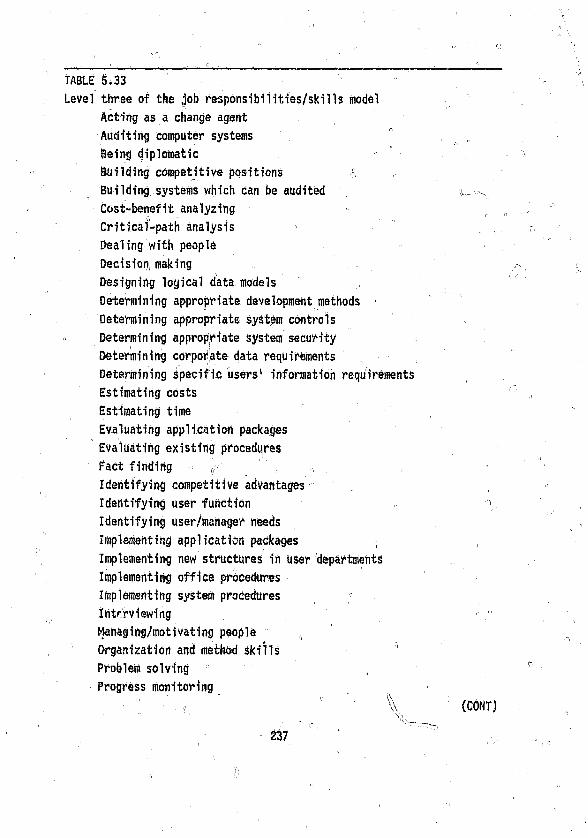
TABLE S.33
Level three of the job responsibilities/skills model
Acting as a change agent
Auditing computer systems
Being diplomatic
Building competitive positions
Building systems which can be audited
Cost-benefit analyzing
Critical-path analysis
Dealing with people
Decision making .
Designing logical data models
Determining appropriate development methods
Determining appropriate system controls
Determining appropriate system security -
Determining corporate data requirements
Determining specific users' information requirements
Estimating costs
Estimating time
Evaluating application packages
Evaluating existing procedures .
Fact finding „ ,
Identifying competitive advantages
Identifying user function
Identifying user/managed needs
Implementing application packages ,
Implementing new structures in user departments
Implementing office procedures
Implementing system procedures :
Interviewing (
Managing/motivating people
Organization and method skills '!
Problem solving
Progress monitoring
' V
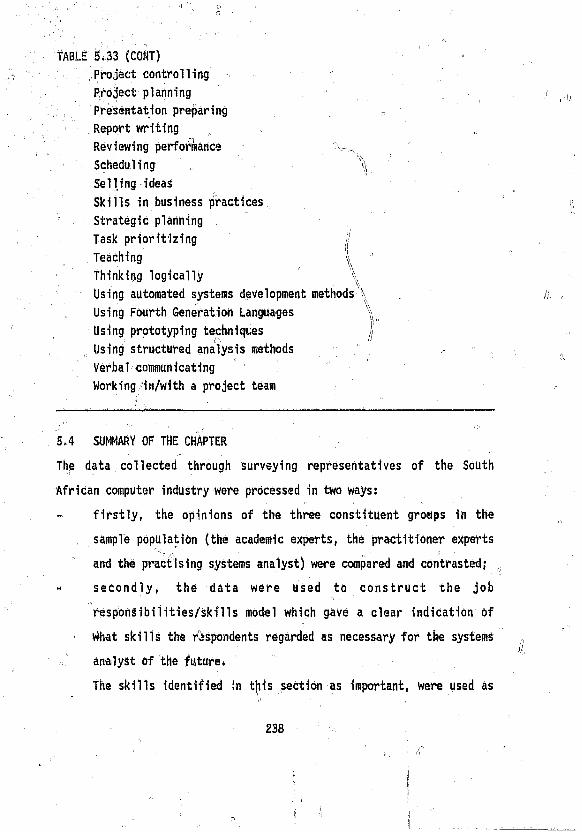
TABLE 5.33 (CONT)
Project controlling
Project planning
Presentation preparing
Report writing
Reviewing performance
' Scheduling ^
Selling ideas
Skills in business practices.
Strategic planning
Task prioritizing jj
Teaching |
thinking logically \
Using automated systems development methods ;;
Using Fourth Generation Languages ^
Using prototyping techniques
Using structured analysis methods
Verbal communicating
Working in/with a project team
5.4 SUMMARY OF THE CHAPTER
The data collected through surveying representatives of the South
African computer industry were processed in two ways:
- firstly, the opinions of the three constituent groups in the
sample population (the academic experts, the practitioner experts
and the practising systems analyst) were compared and contrasted; u
- secondly, the data were used to construct the job
responsibilities/skills model which gave a clear indication of
what skills the respondents regarded as necessary for the systems
analyst of the future.
The skills identified ?n this section as important, were used as
input to other stages of the research. In section 7.3*1 they were,
compared to the skills identified through the literature survey and in
section 7.3.2 they were input to building the skills profile, of the
future systems analyst.
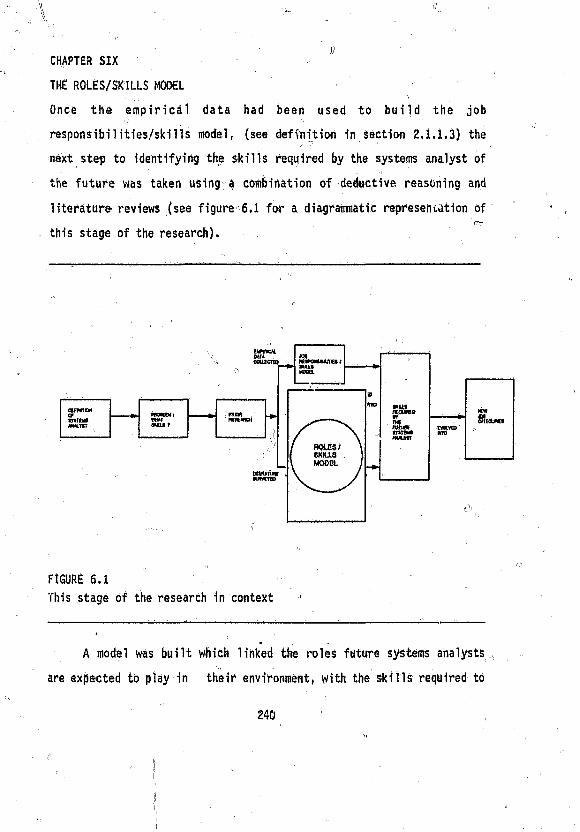
CHAPTER SIX
THE ROLES/SKILLS MODEL
Once the empirical data had been used to build the job
responsibilities/skills model, (see definition in section 2.1.1.3) the
next step to identifying the skills required by the systems analyst of
the future was taken using a combination of deductive reasoning and
literature reviews (see figure 6.1 for a diagrammatic representation of
this stage of the research).
FIGURE 6.1
This stage of the research in context
A model was built which linked the roles future systems analysts
are expected to play in their environment, with the skills required to
240
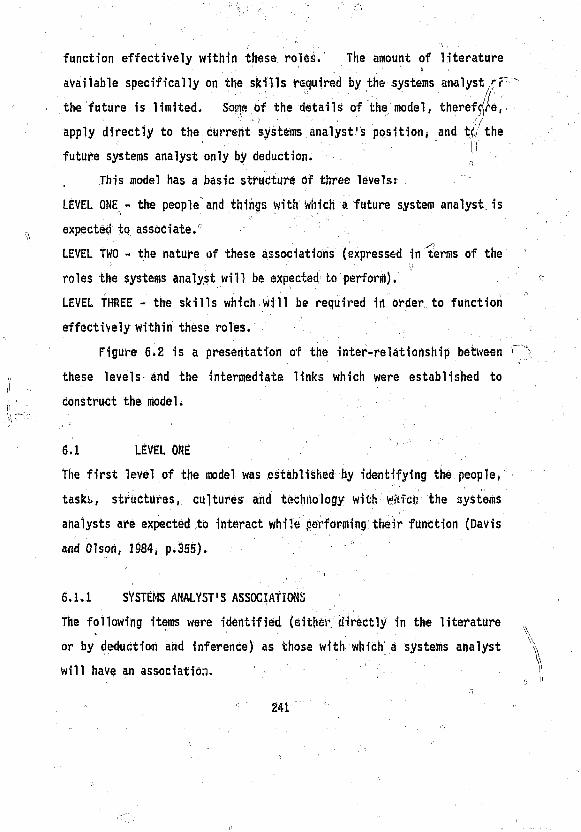
function effectively within these roles. The amount of literature
available specifically on the skills required by the systems analyst/"f
. ' ," ■ ” ■ ■ //' the future is limited. Some of the details of the model, therefore,
. ' " - ■ ■ ■ .. - " (apply directly to the current systems analyst's position, and the
future systems analyst only by deduction. ^
, This model has a basic structure of three levels;
LEVEL ONE - the people and things with which a future system analyst is
expected to associate.. . . ' ,s\
LEVEL TWO - the nature of these associations (expressed in terras df the
roles the systems analyst will be expected to perform).
LEVEL THREE - the skills which will be required in order, to function
effectively within these roles.
Figure 6.2 is a presentation of the inter-relationship between
these levels and the intermediate links which were established to
construct the model.
6.1 LEVEL ONE ■"
The first level of the model was established by identifying the people,
tasks, structures, cultures and technology with• wftTefc the systems
analysts are expected to interact white performing their function (Davis
and 01 sort, 1984, p.355).
6.1.1 SYSTEMS ANALYST'S ASSOCIATIONS
The following items were identified (either directly in the literature
or by deduction arid inference) as those with which a systems analyst
will have an association.
■ 7
r 241
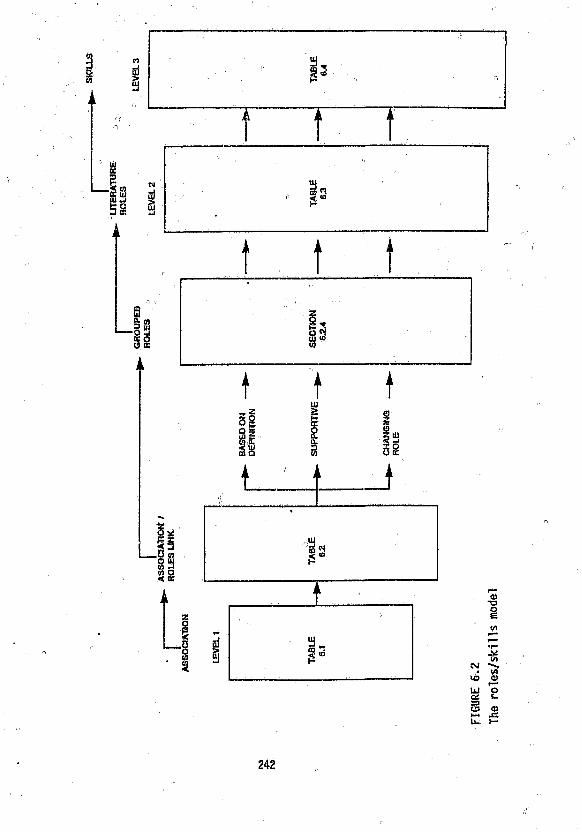
h-4 J SU» f—
242
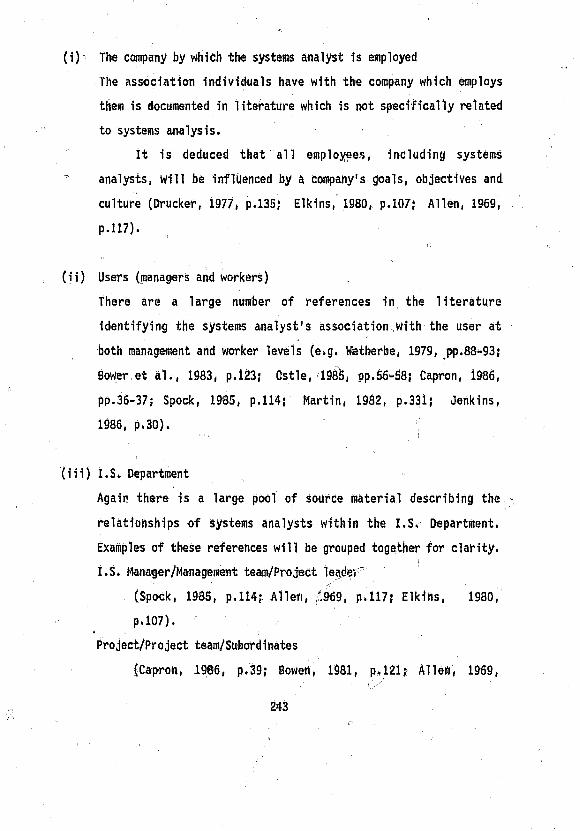
(i) The company by which the systems analyst is employed
The association individuals have with the company which employs
them is documented in literature which is not specifically related
to systems analysis.
It is deduced that all employees, including systems
analysts, Will be influenced by a company's goals, objectives and
culture (Drucker, 1977, p.135; Elkins, 1980, p.107; Allen, 1969,
p.117). ^
(ii) Users (managers and workers) _
There are a large number of references in the literature
identifying the systems analyst's association With the user at
both management and worker levels (e.g. Metherbe, 1979, pp.88-93;
Bower et al., 1983, p.123; Cstle, 1985, pp.56-58; Capron, 1986,
pp.36-37; Spock, 1985, p.114; Martin, 1982, p.331; Jenkins,
1986, p.30). I
(iii) I.Si. Department
Again there is a large pool of source material describing the -
relationships of systems analysts within the I.S. Department.
Examples of these references will be grouped together for clarity.
I. S. Manager /Management team/Pro ject le?c>p '
(Spock, 1985, p.114; Allen, 969 p.117; Elkins, 1980,
p. 107).
Project/Project team/Subordinates
(Capron, 1986, p.39; Bowen, 1981, p.121; Alien, 1969,
'■ • I) ■pp.23-30,* Keen, 1981, pp.183-284; Harold, 1983, p.105;
Jackson, 1986, p.248). •
Peers
(Gore and Stubbe, 1983, p.45; Newman and Rosenberg, 1985,
. p.398; Bower et al., 1985, p.121).
System being developed
(Clarke and Prins, 1986, p.32; Davis W S, 1983, p.397; Lee,
1978, p.49; Jackson, 1986, p.248; Roe, 1984, p.39; McLeod
and Forkner, 1982, p.307; Capron, 1986, pp.36-37).
Systems analyst task „
(Ostle, 1985, p.36; Jeffery and Lawrencer 1984, p.107;
, Thierauf, 1986, pp.643-645; Davis and Olson, 1985, p.458;
Bower et al., 1985, p.121; Harold, 1983, p.105; Leeson,
1981, p.55; Davis D L, 1983, p.17). f]
Other technical colleagues
By deduction, the systems analyst niust communicate and
co-operate with other members of the l.S. department who may
Contribute, directly or indirectly, to the development of
the project.
(iv) Vendors t
To benefit from advances in technology, the systems analyst willA '
' require some association with the suppliers of equipment,
development tools and software. This need is referred to
occasionally in the literature (e.g. Harold, 1983, p.105; Bartol
244 ;
et al., 1988, p .33; Thierauf, 1936, pp.570-597; Capron, 1986,
p.343; Gore and Stubbe, 1983, p.422).
(v'. The I.S. Industry ,,i /' . "I It is sometimes claimed that people involved in application
software development are more loyal to their own industry than to
the company which employs then (e.g. Ginzberg and Baroudi, 1988,
p. 587; Koenig, 1382, p.218; Bartol et al., 1986; Davis and
Olson, 1985, p.646). Any changes in their future role are not
likely to isolate systems analysts completely from this influence.
(vi) The Technology 1 „
Personnel involved in application software development will be
unlikely to have an association with computer-based technology
other than as a user and an evaluator of the technology (Bartol et
al., 1986, p.32; Harold, 1983, p.105).
6.1.2 SUMMARY OF ASSOCIATIONS n. ‘
The associations a systems analyst is expected to have in the future are
summarized in table 6.1. This is regarded as the first level of the
roles/skills model.
6.2 LEVEL TWO
The second level of the model was built by determining the nature of the
?ssocidtions systems analysts are expected to have with their
environment. This was done by identifying in the literature - or by
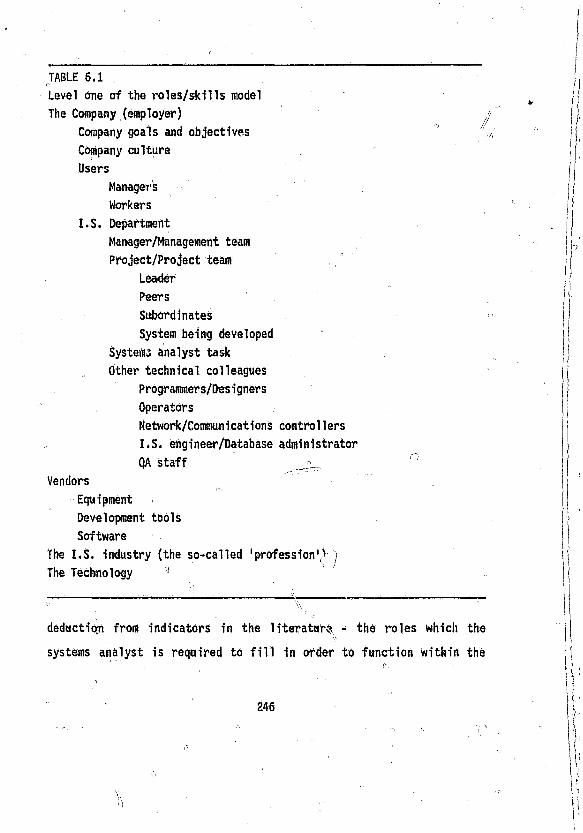
TABLE 6.1
Level one of the roles/skills model '
The Company (employer) y
Company goals and objectives
Company culture
Users
Manager's
Workers
I.S. Department
Manager/Management team
Project/Project team
Leader
Peers
Subordinates
System being developed •
Systems analyst task
Other technical colleagues
Programmers/Desi gners
Network/Communications control lers
I.S. engineer/Database administrator
QA staff
Vendors
Equipment ,
Development tools
Software
The I.S. industry (the so-called 'profession1' j
The Technology 1
---------------,-----_ ---------------- ^------------ -------------- -
deductiqn from indicators in the literature - the roles which the
systems analyst is required to fill in order to function within the
level one associations (see Meissner, 1986, p.7).
6.2.1 INITIAL LIST OF ROLES
No example was found in the literature of linking the future systems
analysts' association with their, environment (see section 6.1) with the
' . .roles they will be expected to fill to be effective within each
association. To establish these links in the model required cycles of
deduction both from the detailed level up, and from the higher levels of
the model down into more detail.
A literature search revealed a list of nearly 100 roles which thei
systems analyst of the future will be expected to fill. It was felt
that if this list of roles could be placed into a hierarchy, which in■ ■ ■ | ■
turn could be linked to the associations which the future systems
analyst will have, then the possibility of any 'Important factors being
overlooked would be minimized.
6.2.2 ROLES LINKED DIRECTLY TO ASSOCIATIONS
The upper levels of the hierarchy was established by deduction. Each
of the items in the systems analysts' environment was analyzed to
attempt to deduce the role the Systems analyst must play to be effective
within that association (see table 6.1). These roles were later \
grouped and linked to the roles identified in the literature.
(i) The Company and the User
As a member of staff, the systems analyst will be required to fill
the.role of subordinate and learner,, The relationship with the
247
user, however, will demand that the systems analyst cover a range
of roles from strategic planner, analyst, systems designer,
prototyper, developer and implementor to change agent, consultant,
instructor and possibly even project nianager, communicator and
: interpersonal facilitator (see table 6.2).
(ii) The I.S. Department ,
The future systems analysts will fill the role of a subordinate to
the management of the I.S. D&partment and the leadership of any
project team with which they may be involved. To their peers the
systems analysts will play the role of learner and interpersonal
11 . Ifacilitator while to their subordinates, they could fill the roles
of project manager or consultant.
A number of the roles already mentioned will be filled by
the systems analysts in their association with the system being
developed. Again these cover a broad spectrum from strategic
planner, analyst, Systems designer, data base designer,
■ nprototyper, developeirii and implementor to estimator, \\ project
" ■■ Imanager, change agent and consultant to perhaps even quality
assurer. \ 1 I
To other technical personnel in the I.S. department the
systems analyst could fill the roles of communicator, consultant
or User (see table 6.2).
(iii) The Vendors
The roles which the future systems analysts will fill in relation
248
to the vendors to the computer industry will include communicator
(of requirements), and learner and implementor (of new technology
and approaches) (see table 6.2).
(iv) ,The I.S. Industry
The systems analysts of the future will also communicate
requirements (and perhaps also experiences) to the I.S. industry,
but in this relationship they will again fill the roles of learner
and subordinate (see table 6.2).
(v) The Technology
The systems analyst will learn to keep abreast of the technology,
but will obviously also play the role of a user of the technology
(see table 6.2).
6.2.3 GROUPING OF THE ROLES
Both models built in this study had the* same underlying structure. In
this section the roles identified through the systems analysts'
associations (table 6.1), are grouped into the same categories as those
used for the job responsibilities in the empirical model (section
S.2.2.2). Using this some basic framework ensured thoroughness in the
contrasting and combining of the two models in section 7.3.1. j
NOTE: To avoid any implied priority, all roles are listed
alphabetically.* // . '
249
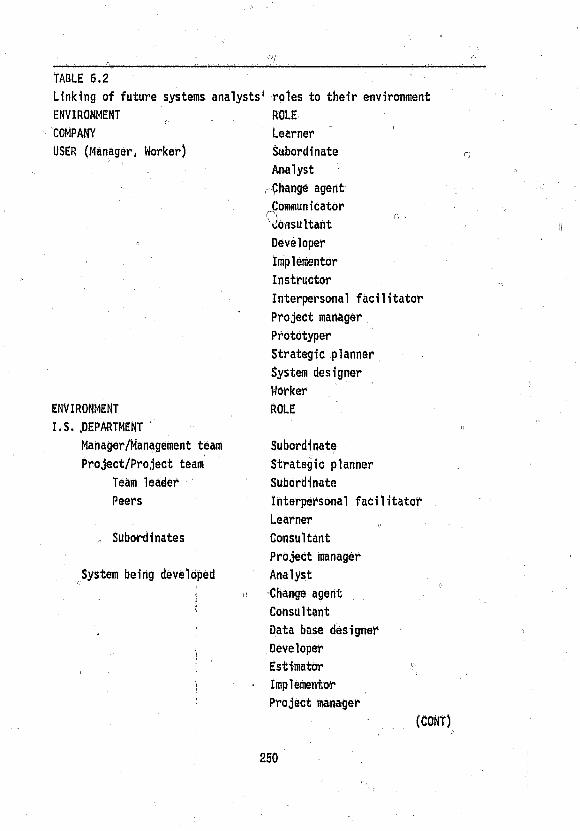
TABLE 6.2
Linking of future systems analysts*
ENVIRONMENT r
COMPANY
USER (Manager, Worker)
ENVIRONMENT
I.S. .DEPARTMENT
Manager/Management team
Project/Project team
Team leader
Peers
, Subordinates
System being developed
roles to their environment
ROLE
Learner
Subordinate
Analyst
Change agent
CommunicatorO n r‘ ■Consultant
Developer
Implementor
Instructor
Interpersonal facilitator
Project manager
Prototyper
Strategic planner
System designer
Worker
ROLE
Subordinate
Strategic planner
Subordinate
Interpersonal facilitator
Learner ,,
consultant
Project Manager
Analyst
Change agent
Consultant
Data base designer
Developer
Estimator 1
Implementor
Project manager
(CONT)
250
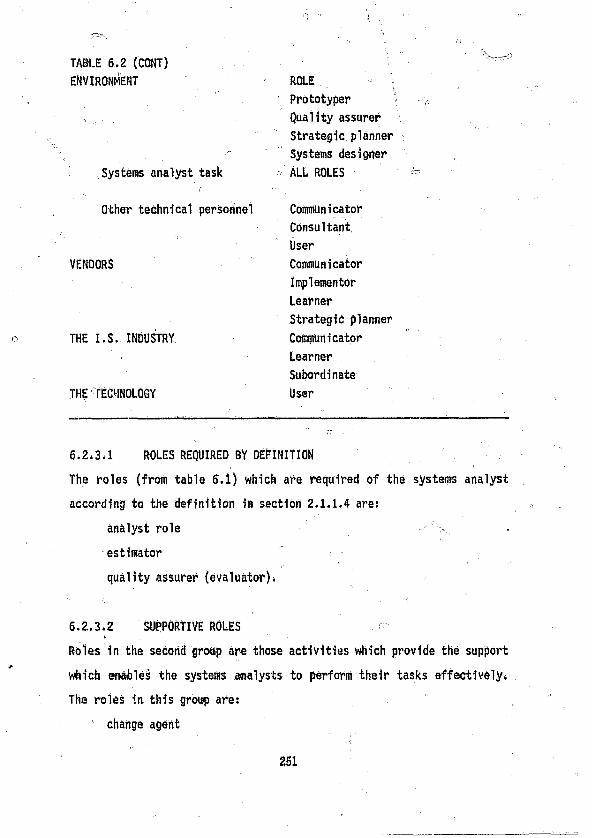
TABLE 6.2 (CONT)
ENVIRONMENT
- Systems analyst task
Other technical personnel
VENDORS
c, THE I.S. INDUSTRY
THE TECHNOLOGY
6.2.3.1 ROLES REQUIRED BY DEFINITION
The roles (from table 6.1) which are required of the systems analyst
according to the definition in section 2.1.1.4 are:
analyst role •
estimator
quality assurer (evaluator)*
6.2*3.2 SUPPORTIVE ROLES <
Roles in the second group are those activities which provide the support
which enables the systems analysts to perform their tasks effectively*
The roles in this group ares
change agent
ROLE '
Prototyper
Quality assurer
Strategic planner
Systems designer
ALL ROLES
Communicator
Consultant
User
Communicator
Implementor
Learner
Strategic planner
Corapnicator
Learner
Subordinate
User
251
communicator
fact finder ~
instructor (i ,
interpersonal facilitator '
learner
numerator 0
subordinate
user (of technology).
6.2.3.3 ROLES INDICATING CHANGE
In the context of this research, the most important group of roles is
that which reflects the changes in the systems analysts1 task. Roles
in this group include:
consultant
data base designer
developer of systems
generalist
implementor of systems
project manager
strategic planner
systems designer.
6.213.4 LINKING THESE ROLES TO THOSE IDENTIFIED IN THE LITERATURE
Significantly more roles than those listed in these three groups were
identified in the literature (see section 6.2.4.1 to 6.2.4.3).
Although it led to some overlapping and redundancy, the roles identified
' 252
■■ /f

in the literature were grouped into these three categories. This
iinking technique was used to minimize the possibility of overlooking
significant roles (and, therefore, not identifying the skills a s s o c i a t e d
with the roles).
6.2.4 A ROLES HIERARCHY
To ensure that no Skills were overlooked in the roles/skills model, all
the roles identified through the literature survey were built irttf? a
roles hierarchy. The highest level of the hierarchy was the roles
identified in table 6.2, and grouped into the three categories
identified in section 6.2.3. , This process is presented graphically in
figure 6.2.
6.2.4.1 ROLES FROM THE DEFINITION OF SYSTEMS ANALYST
The roles in this group are directly linked to the definition of systems
analyst in section 24.1.4.
6.2.4.1.1 ANALYST ROLE
Thfe artaiyst role was perceived to be a composite role comprising,
firstly, of thdse roles which must be performed to function as an
analyst. These includes ;
benefit identifier (Harold, 1983, p. 10.5)' ■- \\
cost justifier (Martin, 1986, p.336)
estimator (Harold, 1983, p.105)
fact finder (Lucas, 1982, p.301)
needs identifier (McLeod, i983, p.545) ,
" y 253 . „ ,
problem recognizer (Wetherbe, 1979, p.86)
task analyzer (Bahl and Hunt, 1984, p.130)
reviewer (Qstle, 1985, p.160)
Specifier (Dickson and Wetherbe, 1985, p.341).
Secondly, to be able to perforin these analysis activities
effectively, the systems analyst could be expected also to fill the
following roles: r
business associate (Lee, 1981, p .49)
decision maker (Wetherbe, 1979, p.100)
methodology expert (Capron, 1986, p.100)
problem solver (Vitalari. and Dickson, 1983, p.946)
task performer (Thierauf, 1986, p.6)
technical assessor (Canning, 1984b, p.4)
technician (McLeod and Forkner, 1982, p.308).
A third group of analyst roles was identified. this group has
not been included here because, although it is closely associated with
the traditional analyst activity of needs identifier, the method pf
identifying these needs is through prototyping the requirements (Boar,
1986, p.28). Because this role is one of the changes in this systems
analysts' associations with the user, details are included as a new
category in section 6.2.4.3.7.
6.2.4.1.2 ESTIMATOR ROLE
One of the systems analysts' basic responsibilities includes estimating.
Within this role, the systems analyst will be required to act as!
cost estimator (Davis W S, 1983, p.188)
254
forecaster (Bowman et al., 1983, p.15)
numerator (Byrkett and Uckan, 1985, p.45) .
time estimator (Pressman, 1982, p.59). .
6.2.4.1.3 QUALITY ASSURER/EVALUATOR ROLE
At the Q.A. Conference in Chicago in 1982 it was suggested that one of
the roles of the systems analyst is that of a quality assurer (Q.A.
Conference/ 1982, p.341). To perform effectively within this
specialist role, the systems analyst will be required to be an:
evaluator (Elkins, 1980, p.385)
reviewer (Ostle, 1985, p.160). !
6.2.4.2 ROLES WHICH SUPPORT THE SYSTEMS ANALYSTS' ACTIVITIES
These groups of roles are based on the supportive roles required for the
individual to function as a systems analyst.
6.2.4.2.1 CHANGE A & N T ROLE
From the many references in the literature to this activity, the
following supportive roles were identified:
advisor/mentor (Barr and Kcchen, 1984, p.175)
catalyst (McLeod, 1983, p.545)
confronter (Capron, 1986, p.36)
i| . „ enforcer (Ostle, 1985, p.57)
innovator (Dickson and Wefcherbe, 1985, p.399)
persuader (Capron, 1986, p.36).
. i' ''To be ^ble to perform tliese roles, the change agent needs further
to be a:
forecaster (Bowman et al., 1983, p.15) ,Or. ' .
influencer (Ostle, 1985, p.57)ii,
initiator (Ostle, 1985, p.57)
politician (Koenig, 1982, p.218)
seller (of ideas) (FitzGerald et al., 1981, p.236)
technical assessor (Canning, 1984b, p.4).
6.2.4.2.2 COMMUNICATOR ROLE
The supportive roles in this group have been identified as those which
cover the whole spectrum of communication:
communicator (Davis D L, 1983, p-15)
documentor/writer (Capron, 1986, p.54)
interviewer (Capron, 1986, p.100)
presenter/speaker (Semprevivo, 1982, p.69).
To be able to function effectively in these roles, the
communicator also needs to be a:
diplomat (Harold, 1983, p.120) ,
listener (Nylen et al., 1967, p.119)
negotiator (Jeffery and Lawrence, 1984, p.107).
6.2.4.2.3 FACT FINDER ROLE
To perform the role of a fact finder, the systems analyst will need to
function within the following roles:
communicator (Davis D L, 1983, p.15) ' :
observer (Capron, 1986, p.100)
256 "
problem recognizer (Wetherbe, 1979, p.86)
reviewer (Ostle, 1985, p.160)
diplomat (Harold, 1983, p.120)*
6.2.4.2.4 INSTRUCTOR ROLE -
A number of sources indicated that the function of the systems analyst
should include the roles of:
educator (Martin, 1981, p.335)
instructor (Cox and Snyder, 1983, p.247)
seller (FitzGerald et al., 1981, p.236)
teacher (Martin, 1982, p*335)
trainer;, (Jenkins, 1986, p.30).
! i . ■ " ..-J!
6.2.4.2.5 INTERPERSONAL FACILITATOR ROLE
Ons group of roles identified in the literature possessed a strong
interpersonal flavour (Bower at al., 1989, p.121). These roles
included:
arbitrator/mediator (Harold, 1983, p.102) ^
co-operator (Spock, 1985, p.114)
diplomat (Harold, 1983, p,120)
enabler/helper (Martin, 1982, p.332)
encourager (Martin, 1982, p.334)
facilitator (Rivard and Huff, 1985, p.90)
motivator (Drucker, 1977, p.55)
participant (Newman and Rosenberg, 1985, p.404)
politician (Koenig, 1982, p.213)
supporter (Thomsett, 1980, p.43)
team member (Semprevivo, 1982, p.66).
6.2.4.2.6 LEARNER ROLE •
Certain literature references strongly suggest that the systems analyst
will not be effective without filling the role of a learner (Davis W S,
1983, p.44). These references include!
acceptor (Allen, 1969, p.110)
listener (Nylen et al., 1967, p.119)
observer (Capron, 1986, p.36)
understander (Leeson, 1981, p.53).
6.2.4.2*7 NUMERATOR ROLE
A group of roles which the systems analyst is expected to fill requires
mathematical and statistical competencies* These roles include:
analytical modeller (Harold, 1983, p.17)
; mathematical modeller (Byrkett and .an, 1985, p.45)' . t //
mathematician (Byrkett and Uckan, 1985, p.45) |
statistician (Jenkins, 1986, p.32). \
6.2.4.2*8 SUBORDINATE ROLE
The employees of any organization Will tend to be productive (and
successful) within the organization if they function effectively as
subordinates. From the literature survey the following supportive
roles were identified as being appropriate for the systems analyst:
acceptor (Allen, 1959, p.110)
258
co-operator (Spock, 1985, p.114)
learner (Davis W S, 1983, p.44)
participant (Newman and Rosenberg, 1985, p.404)
supporter (Thomsett, 1980, p.43) r
task performer (Thierauf, 1986, p.6).
6.2.4.2.9 USER (OF TECHNOLOGY) ROLE
To be able to benefit frotn advances in technology which assists in the
building of computer-based application systems, the systems analyst say
be required to function Within the roles of:
acceptor (Allen, 1969, p.110)
buyer (Harold, 1983, p.105)
learner (Davis W S, 1983, p.44)
technical assessor (Canning, 1984b, p.4)
tools expert (Thierauf, 1986, p.643)
understander (Leeson, 1981, p.53).
6.2.4.3 ROLES WHICH INDICATE A CHANGE IN THE SYSTEMS ANALYSTS' TASK
These groups of roles indicate a shift from the definition of systems
analyst (see section 2.1.1.4).
6.2.4.3.1 CONSULTANT ROLE ’
To function as a consultant* the future systems analyst will be required
to fill the following roles:
advisbr/mentor (Barr and Kochen, 1984, p.175)
buyer (Harold, 1983, p.105) /
' . /
„ 259 /7
change agent (Feeney and Sladek, 1977, p.85)
co-ordinator (Capron, 1986, p.38)
encourager (Martin, 1982, p.334)
evaluator (Elkins, 1980, p.385) '
forecaster (Bowman et al., 1983, p.15)
instructor (Cox and Snyder, 1985, p.247)
system building facilitator (Rivard and Huff, 1985, p.90) „
technical assessor (Canning, 1984b, p.4).
To be able to function in these roles, the future systems analyst
way need to fill the following additional roles:■ " q •
business associate (Lee, 1981, p.49)
seller (of ideas) (FitzGerald et al., 1981, p.236)
task performer (Thierauf, 1986, p.6)
tools expert (Thierauf, 1986* p.643).
" " O ,- ..- " -7
6.2.4.3.2 DATABASE DESIGNER ROLE '
This is one of the more technical activities which the systems analyst
of the future is expected to perform. The roles which will need to be
filled are:
data element identifier (Dickson and Wetherbe, 1985, p.210)
logical data modeller (Martin, 1982, p.576)
methodology expert (Capron, 1986, p.236)
task performer (Thierauf, 1986, p.6)
tools expert (Thierauf, 1986, p.643)*
6.2.4.3.3 DEVELOPER ROLE
To perform the tasks of a developer (as opposed to performing only the
analytical step of system's implementation) requires the systems analyst' C
to perform the following roles: '"S. ^estimator (Harold, 1983, p.105) »
methodology expert (Capron, 1986, p.236)
programmer (fourth generation) (Davis and Olson, 1985, p.426)
programmer (third generation) (Greenwood et al., 1986, p.12) '
: reviewer (Ostle, 1985, p.160) >
specialist (Martin, 1982, p.160)
technical assessor (Canning, 1984b, p.4)
technician (McLeod and Forkner, 1982, p.3098)
tools expert (Thierauf, 1986, p.643)
user of technology (McLeod and Forkner, 1982, p.308).
The non-technical roles which support these technical activities
include:
reconciler (Lee, 1981, p.49)
task performer (Thierauf, 1986, p.6).
6.2.4.3.4 GENERALIST ROLE ,
The emphasis of some authors (e.g. Clarke and Prins, 1986, p.32 and
Benbasat et al., 1980, p.31) is that generalist skills are perceived to
be more useful for the future systems analyst than specialist skills.
This perception appeared to be in direct contrast with other writers
(e.g. Martin, 1982, p.337 and Thierauf, 1986, p.102) who claim that more
specialization is needed nn the task of the systems analyst (see section
261
7.5.2.1 where this issue is resolved).
6.2.4.3.5 IMPLEMENTOR ROLE
As an implementor of new systems the future systems analyst will be
required to fill the roles of:
buyer (Harold, 1983, p.105)
change agent (Feeney arid Sladek, 1977, p.85)
converter of user procedures (Keen, 1981, p.225)
co-ordinator (Capron, 1986, p.38)
estimator (Harold, 1983, p.105)
evaluator (Elkins, 1980, p.385)
file creator (Crocker, 1984, p.36)
systems tester (Crocker, 1984) p.36)
test data designer (Crocker, 1984, p.36)
tools expert (Thierauf, 1986, p.643).
To be able to support these technical activities, the implementor
must also function in the roles of:
forecaster (Bowman, 1983, p.15)
organizer (Keen, 1981, p.214)
seller (FitzGerald et al., 1981, p.236)
task performer (Thierauf, 1986, p.6)
technical assessor (Canning, 1984b, p.4)
technician (McLeod and Forkner, 1982, p^30S).
6.2.4.3.6 PROJECT MANAGER ROLEIf . ° ,
A number of Sources in the -literature suggested that the f utur>\-'Ystemsn ‘
262 fi'
Ml
analysts will be expected to manage application software development
projects. To achieve this, they will require to function within the
roles of: , 0
advisor/mentor (Barr and Kochen, 1984, p.175)
■' appraiser (Allen, 19P- , p.205)
controller (Keen, 1981, p.261)
co-ordinator (Capron, 1986, p.38)
delegator (Allen, 1969, p.107)
estimator (Harold, 1983, p.105)
evaluator (Elkins, 1980, p.385)
leader (Canning, 1984b, p.4)
motivator (Crocker, 1977* p.55)
organizer (Keen, 1981, p.214)
project planner (Keen, 1981, p.188)
scheduler (Harold, 1983, p.105) 1
task performer (Thierattf, 1986, p.6). ^ ^
' , i ' \ :
6.2.4.3.7 PR0T0TYPER ROLE
This new role is an extension of the analyst role (section 6.2.4.1.1).
One of the methods which a systems analyst may use to determine user
requirements is the technique of prototyping (Boar, 1986, p.28). To
perform effectively Within this Vole, the systems analyst will be
required to be an:
analyst (Gore and Stubbe, 1983, p.45)
implementor (McFarlan, 1983, p.8)
programmer (fourth generation)(Davis and Olson, 1985, p.426)
specialist (Martin, 1982, p.337)
systems designer (Capron, 1986, p.39).
It is envisaged that the following supporting roles will also be
required: ’
reconciler (Lee, 1981, p .49)
technician (McLeod and Forkner, 1982, p.308)
tools expert (Thierauf, 1986, p.643).
6.2.4.3.8 STRATEGIC PLANNER ROLE |
Another specialist role identified in the literature was a (Systems
analyst as a strategic planner (Davis and Olson, 1985, p.444). To
function withir) this role the systems analyst will need to be a:
business associate (Lee, 1981, p.49)
communicator (Oavis D L, 1983, p.15)
estimator (Harold, 1983, p.105)
forecaster (Bowen at al., 1933, p.15)
numerator (Byrkett and Uckan, 1985, p.45)
task performer (Thierauf, 1986, p.6).
6.2.4.3.9 SYSTEMS DESIGNER ROLE
It is interesting that the foie of the systems analyst is considered to
include the function of the physical design of the system (e.g. Davis
and Olson, 1984, p.577). This suggests (a point expanded upon later -
see section 7.4.2) that the title 1 systems analyst1 does not describe
adequately the tasks performed by a person working in this position.
Further support is given to this argument by writers who suggest that
264
the future systems analyst will function within roles such as:
conceptual designer (Capron, 1986, p.142)
configuration designer (Jenkins, 1986, p.30)
„ data base designer (Davenport, 1980, p.506)
procedure designer (Davis and Olson, 1985, p.587)
specifier (Dickson and Wetherbe, 1985, p.341).
To be able to support these functions the systems analyst may also
be required to fill the following roles:
decision maker (Wetherbe, 1979, p.100)
estimator (Harold, 1983, p.120)
reviewer (Ostle, 1985, p.160)
task performer (Thierauf, 1986, p.6)
technical assessor (Canning, 1984b, p.4) '
technician (McLeod and Forkner, 1982, p.308)
tools expert (Thierauf, 1986, p.308).
6.2.5 SUMMARY ON ROLES
The systems analyst roles identified in the literature, and grouped into
the hierarchy described in section 6.2.4, were known to contain
overlapping ideas and, in some places, duplication. Part of the
redundancy was that some of the roles were only complete if they
included other roles (e.g. consultant, developer, project manager) while
other roles could be presented in their primary form (e.g. advisor,
catalyst, Innovator). Because the reason for building this model was
to identify systems analyst skills, (not systems analyst roles), the
second level Of- the roles/skillS model was identified by combining each;
ii ' , ' ;
265
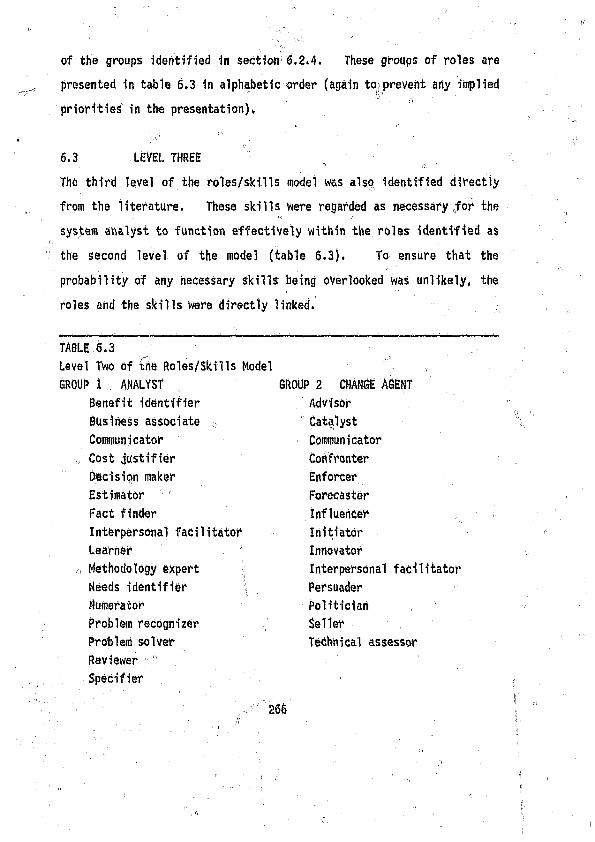
of the groups identified in section 6.2,4. These groups of roles are
presented in table 6.3 in alphabetic order (again to prevent any implied
priorities in the presentation).
6.3 LEVEL THREE
The third level of the roles/skills model was also identified directly
fro* the literature. These skills were regarded as necessary for the
system analyst to function effectively within the roles identified as
the Second level of the model (table 6,3). To ensure that the
probability of any necessary skills being overlooked was unlikely, the
roles and the skills Were directly linked.
TABLE 6.3
Level Two of trie Roles/Skills Model
GROUP 1 ANALYST
Benefit identifier
Business associate
Communicator
„ Cost justifier
Decision maker
Estimator
Fact finder
Interpersonal facilitator
Learner
o Methodology expert
Needs identifier \
Numerator
Problem recognizer
Problem solver
Reviewer 11
Specifier
GROUP 2 CHANGE AGENT
Advisor
Catalyst
Communicator
Confronter
Enforcer
forecaster
Influencer
Initiator
Innovator
Interpersonal faci1itator
Persuader
Politician
SellerTechnical assessor
266
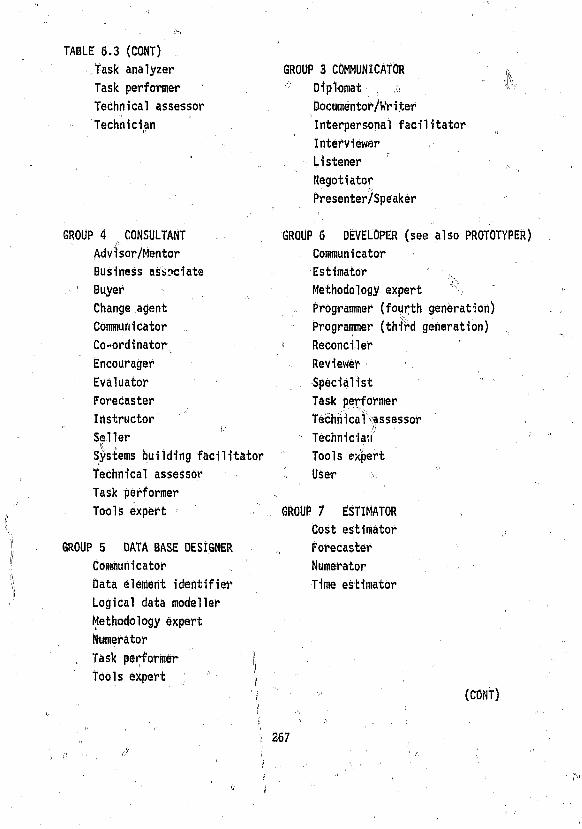
TABLE 6.3 (CONT)
Task analyzer
Task performer
Technical assessor
Technician
GROUP 4 CONSULTANT
Advisor/Mentor
Business associate
Buyer
Change agent
Communicator
Co-ordinator
Encourager
Evaluator
Forecaster
Instructor
Seller\ *
Systems building facilitator
Technical assessor
Task performer
, Tools expert
GROUP 5 DATA BASE DESIGNER
Communicator
Data element identifier
Logical data modeller
Methodology expert
Numerator
Task performer |
Tools expert 1
GROUP 3 COMMUNICATOR ,,j - a v .' Diplomat ,, ,ai 45
Documentor/Wri ter
Interpersonal facilitator
Interviewer
Listener
Negotiator
Presenter/Speaker
GROUP 6 DEVELOPER (see also PROTOTYPER)
Communicator
Estimator ^
Methodology expert ^
. Programmer (fourth generation)
Programmer (third generation)
Reconciler
Reviewer
Specialist
Task performer
Technical assessor
Technician
Tools expert
User r
GROUP 7 ESTIMATOR ,
Cost estimator f
Forecaster
Numerator
Time estimator
(CONT)
267
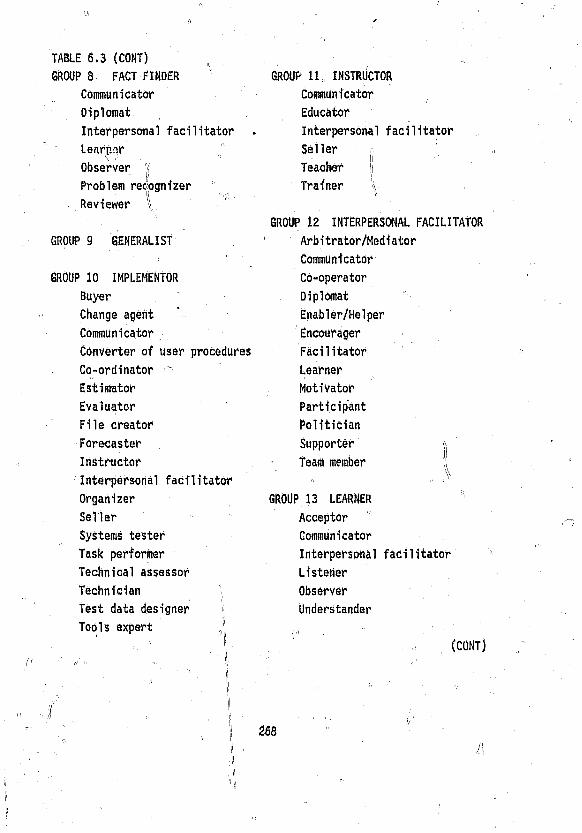
TABLE 6.3 (CONT)
GROUP 8 FACT FINDER
Communicator
Diplomat „
Interpersonal facilitator .
Learner'C -1 .
Observer J
Problem recognizer 0
Reviewer \
GROUP 9 GENERALIST
GROUP 10 IMPLEMENTOR
Buyer
Change agent '
Communicator
Converter of user procedures
Co-ordinator '
Estimator
Evaluator
File creator*
Forecaster
Instructor
Interpersonal facilitator
Organizer
Seller
Systems tester
Task performer
Technical assessor
Technician
Test data designer ,
Tools expert J,
GROUP 11 INSTRUCTOR
Communicator
Educator
Interpersonal facilitator
Seller o
Teacher |
Trainer \\\ ■
GROUP 12 INTERPERSONAL FACILITATOR
Arbitrator/Mediator
Communicator
Co-operator
Diplomat V
Enabler/Helper
Encourager
Facilitator
Learner
Motivator
Participant
Politician
Supporter \\
Team member I
GROUP 13 LEARNER '■
Acceptor
Communicator
Interpersonal facilitator
Listener
Observer
Understander
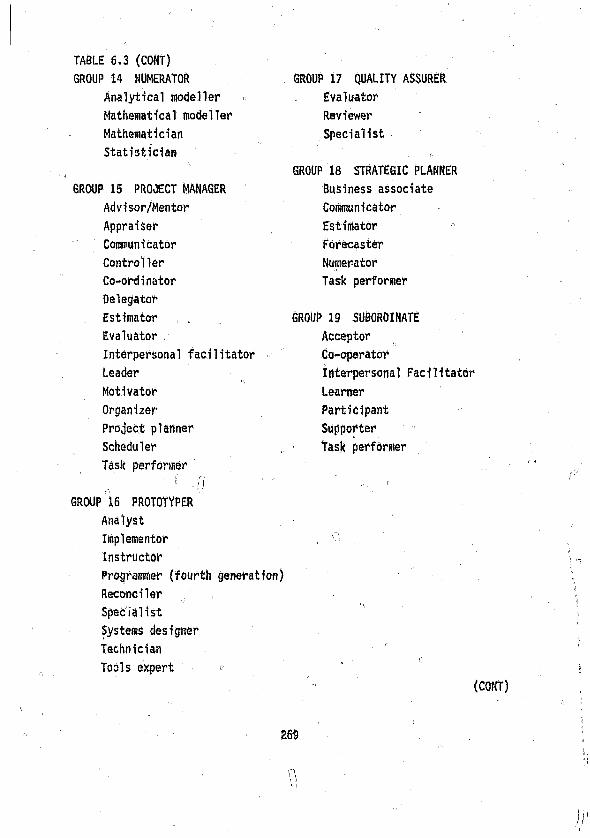
TABLE 6.3 (CONT)
GROUP 14 NUMERATOR
Analytical modeller
Mathematical modeller
Mathematician
Statistician
GROUP 15 PROJECT MANAGER
Advisor/Mentor
Appraiser
Communicator
Controller
Co-ordinator
Delegator
Estimator .
Evaluator
Interpersonal facilitator
Leader
Motivator
Organizer
Project planner
Scheduler
Task performer
GROUP 16 PROTOTYPER
Analyst
Implementor
Instructor
Programmer (fourth generation)
Reconciler . ;
Specialist
Systems designer
Technician
Tools expert <
GROUP 17 QUALITY ASSURER
Evaluator
Reviewer
Specialist
GROUP 18 STRATEGIC PLANNER
Business associate
Communicator
Estimator r
Forecaster
Numerator
Task performer
GROUP 19 SUBORDINATE
Acceptor
Co-operator
interpersonal Facilitator
Learner
Participant
Supporter
Task performer
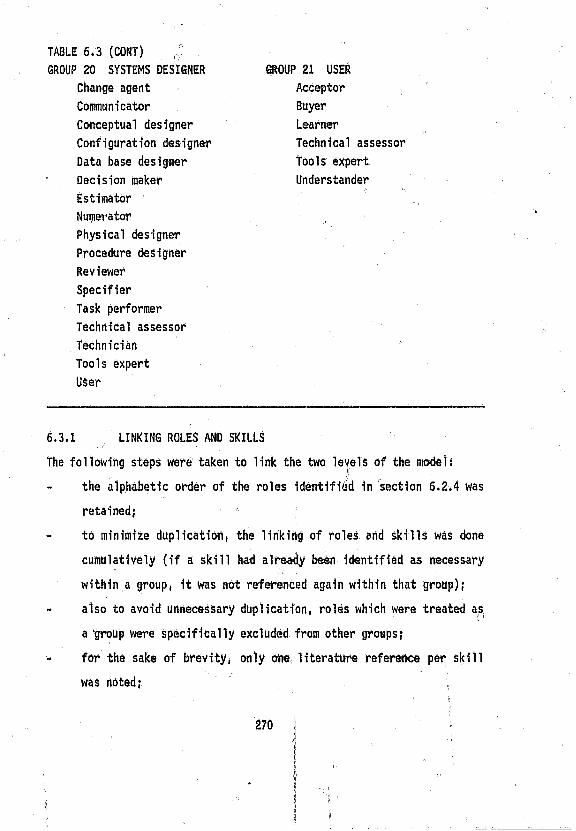
TABLE 6.3 (CONT)
GROUP 20 SYSTEMS DESIGNER
Change agent
Communicator
Conceptual designer
Configuration designer
Data base designer
Decision maker
GROUP 21 USER
Acceptor
Buyer
Learner
Technical assessor
Tools expert
Understander
Estimator
Numerator
Physical designer
Procedure designer
Reviewer
Specifier
Task performer
Technical assessor
Technician
Tools expert
User
6.3.1 LINKING ROLES AND SKILLS
The following steps were taken to link the two levels of the models// _
- the alphabetic order of the roles identified in section 6.2*4 was
retained;
- to minimize duplication, the linking of roles and skills was done
cumulatively (if a skill had already been identified as necessary
within a group, it was not referenced again within that group);
- also to avoid unnecessary duplication, roles which were treated as
a ‘group were specifically excluded from other groups;
- for the sake of brevity, only one literature reference per skill
was noted;
270
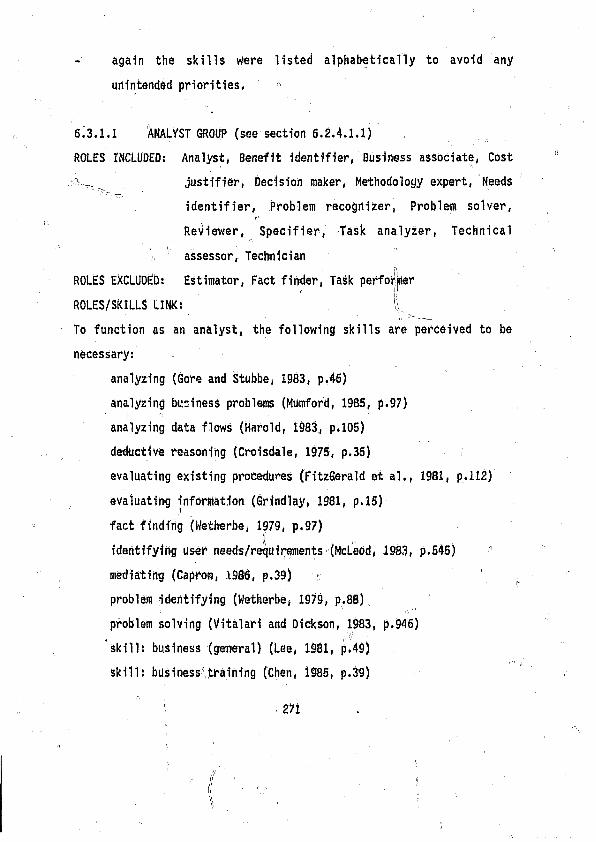
- again the skills were listed alphabetically to avoid any
unintended priorities,
6.3.1.1 ANALYST GROUP (see section 6.2.4.1.1) .
ROLES INCLUDED: Analyst, Benefit identifier, Business associate, Cost
> justifier, Decision maker, Methodology expert, Needs
identifier, Problem recognizer, Problem solver,
Reviewer, Specifier, Task analyzer, Technical
1 assessor, Technician
ROLES EXCLUDED: Estimator, Fact finder, Task perfoijjner
ROLES/SKILLS LINK: |
to function as an analyst, the following skills are perceived to be
necessary:
analyzing (Gore and Stubbe, 1983, p.46)
analyzing business problems (Mumford, 1985, p.97)
analyzing data flows (Harold, 1983, p.105)
deductive reasoning (Croisdale, 1975, p.35)
evaluating existing procedures (FitzGerald et al., 1981, p*112)
evaluating information (Grindlay, 1981, p.15)
fact finding (Wetherbe, 1979, p.97)(I
identifying user needs/requirements (McLeod, 1983, p.545) 7
Mediating (Capron, 1986, p.39)
problem identifying (Wetherbe, 1979, p.88)
problem solving (Vitalari and Dickson, 1983, p.946)
skill: business (general) (Lee, 1981, p.49)
skill: business"training (Chen, 1985, p.39)
271
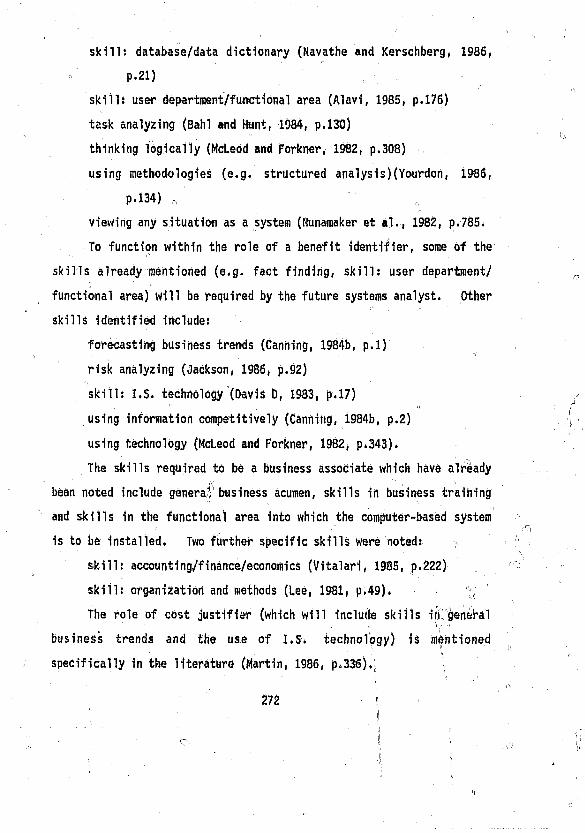
skills database/data dictionary (Navathe and Kerschberg, 1986,
p.2i)
skill: user department/functional area (Alavi, 1985, p.176)
task analyzing (Bah1 and Hunt, 1984, p.130)
thinking logically (McLeod and Forkner, 1982, p.308)
using methodologies (e.g. structured analysiS)(Yourdon, 1986,
p.134) n
viewing any situation as a system (Nunamaker et al., 1982, p.785.
to function within the role of a benefit identifier, some of the
skills already mentioned (e.g. fact finding, skill: user department/
functional area) will be required by the future systems analyst. Other
skills identified include:
forecasting business trends (Canning, 1984b, p.l)
risk analyzing (Jackson, 1986, p.92)
skill: I.S. technology (Davis D, 1983, p.17)
using information competitively (Canning, 1984b, p.2)
using technology (McLeod and Forkner, 1982, p.343).
The skills required to be a business associate which have already
been noted include genera’, business acumen, skills in business training
and skills in the functional area into which the computer-based system
is to be installed. Two further specific skills were noted:
skill: accounting/finance/economics (Vitalari, 1985, p.222)
skill: organization and methods (Lee, 1981, p.49).
The role of cost justifier (which will include skills iri general
business trends and the use of I.S. technology) is mentioned
specifically in the literature (Martin, 1986, p.336).
272 ■ i
Many of the'roles to be filled by the future systems analyst (e.g.
systems designer, implementor, evaluator) require the skill of decision >
making. Obviously, this skill is also required within this analyst
group of roles (Wetherbe, 1979, p.100).
To ensure that the analysis activities are not approached purely
subjectively, the future systems analyst will require skills in the use
of current analytical methodologies (Yourdon, 1986, p.134).
Skills required for the roles of needs identifier and problem
recognizer have already been noted (e.g. identifying user requirements),
as have the need for skills in problem identification and problem
solving.
Although the role of reviewer could be perceived as an
after-the-eveht responsibility to ensure that the installed system is
meeting the users' requirements, there is another dimension which could
be added to this role. This dimension would include the
responsibilities of ensuring that systems which are requested are
feasible, and that appropriate development approaches are taken.
Skills required for this role includes
identifying appropriate approach (Sumner, 1986, p.205)
determining system feasibility (Lee, 1981, pp.83-92).
There is a suggestion in the literature that the future systems
analyst will fill the role of a specifier and consequently require
skills which include:
prototyping (BOar, 1986, p.25)
setting objectives (FitzGerald et al., 1981, p.236)
system specifying (Dickson and Wetherbe, 1985, p.341)
273
The task analyzing skills required for the role of task analyzer
was mentioned as a skill'required' for the analysis role above.
The technical roles of the future systems analyst (e.g. technical
assessor and technician) will require skills which Include:
keeping abreast of technology (Ostle, 1985, p.37) , 1
skill: technical (McLeod and Forkner, 1982, p.308)
using technology (McLeod and Forkner, 1982, p.343),
One further point is noted in this section. Contrary to the
ideas expressed above, at least one literature reference (Cox and
Snyder, 1985, p.248) suggested that the future systems analyst need not
be an expert in the functioning of the User department. Further
examples of such differences of,opinion are givem in table 6.5.
6.3.1.2 CHANGE AGENT GROUP (see section 6.2.4.2.1)
ROLES INCLUDED: Advisor, Catalyst, Confrouter, Enforcer, Forecaster,
Influericer, Initiator, Innovator, Persuader,
Politician, Seller, Technical assessor,
ROLES/SKILLS LINK: „
The role of the systems analyst as a change agent demands a group of
skills which are tightly linked to the roles identified above. y
The role of advisor/mentor Will require the skills of: |1 !i
giving advice and support (Barr and Kochen, 1984, p.175)
Selling ideas/persuading/gaining acceptance (Capron, 1986, pp.36
and 37)
thinking logically (McLeod and Forkner, 1982, p.308).
The role of catalyst who introduces change into the user function
(McLeod, 1983, p.545), will require the skills of:
influencing (Ostle, 1985, p.57)
initiating/integrating (Ostle, 1985, p.57)
innovating (Dickson and Wetherbe, 1985, p.399)
introducing change (Feeney and Sladek, 1977, p.85). //
negotiating (Jeffery and Lawrence, 1984, p.107).
To introduce change it nay be necessary to act as a confronter and
an enforcer. The skills required to operate within these roles are
identified as:
confronting (Capron, 1986, pp.36 and 37)
enforcing (Ostle, 1985, p.57) ,
imposing (Capron, 1986, pp.36 and 37) |
skill: being politically aware (Davis and Olson, 1985, p.458).
Resistance to change is a common problem faced by those who
implement computer-based systems (Lee, 1981, pp.43-47). The change
agent, therefore, needs to be able to display various forecasting
skills, including identifying the impact of change (Capron, 1986, p.36).
Because of this resistance to change, the change agent needs
skills at:
coping with resentment (Newman and Rosenberg, 1985, p.397)
skill: relating to people (Newman and Rosenberg, 1985, p.397).
The skills required for the next grouping of roles (influencer,
initiator, innovator, persuader, politician and seller) have been
identified above.
The final diwension to the change agent's role is technical. The
275
skills required for this role include!
keeping abreast of technology (Canning, 1984b, p*4)
technical assessing (Canning, 1984b, p.4).
6.3.1.3 COMMUNICATOR GROUP (see section 6.2,4.2.2)
ROLES INCLUDED: Communicator, Diplomat, Documen t o r / W r i t e r ,
' Interviewer, Listener, Negotiator, Presenter/Speaker1
ROLES/SKILLS LINK:
The expected communication roles are those related to verbal (oral) and
written communication. The skills required for these roles include:
documenting (Capron, 1986, p.54)
interviewing (Lucas, 1982, p.301)
listening (Nylen at at., 1957, p.119)
negotiating (Jeffery and Lawrence, 1984, p.107)
preparing presentations (Capron, 1986, p.65)
record keeping/note taking (McLeod and Forkner, 1982, p.308)
report writing (Lee, 1981, p.53)
selling ideas (FitzGerald et al., 1981, p.236)
specifying (e|g. requirements)(Dickson and Wetherbe, 1985, p.341)
teaching (Martin, 1982, p.335)
using body language (Davis and Olson, 1985, p.,259)
using charting techniques/graphics (GOre arid Stubbe, 1983,
pp.104-12.5), "
Other skills which assist in being effective in the role of a
communicator include:Ii '
276 r
being politically aware (Davis and Olson, 1985, p.458)
identifying receivers 'frame * (Bostron et al., 1983, p.2)
skill: understanding people (Bower et al., 1985, p.121)
thinking logically (McLeod and Forkner, 1982, p.308).
6.3.3.4 CONSULTANT GROUP (see section 6.2.4.3.1)
ROLES INCLUDED: Advisor/Mentor, Business a s s o c i a t e / Buyer,
Co-ordinator, Encourager, Evaluator, ' Forecaster,
Seller, Systems building facilitator, Technical
assessor, Tools expert
ROLES EXCLUDED: Change agent, Instructor
11 ■
ROLES/SKILLS LINK:
As can be anticipated, many of the roles in Which the consultant must
function will o v eHap with those of the analyst and the change agent ’( 1
(e.g. advisor/mentor, business associate, encourager, forecaster,
innovator, seller, technical assessor). The skills required for these
roles will not be duplicated here (see Sections 6.3.1.1 and 6.3.1.3
above).
As a buyer of computer equipment and systems, the consultant will
require skills at:
acquiring/se’ecting hardware (Thierauf, 1986, p.570)
; ( acquiring/selecting software (Bariol et al. , 1986, p.35)
estimating (Harold, 1983, p.105).
To function effectively within the role of a systems building
facilitator, the consultant will require skills which could includes
277
Author Crossman T DName of thesis Towards identifying the skills required for the changing role of the systems analyst 1990
PUBLISHER:University of the Witwatersrand, Johannesburg
©2013
LEGAL NOTICES:Copyright Notice: All materials on the U n i v e r s i t y o f t he W i t w a t e r s r a n d , J o h a n n e s b u r g L i b r a r y website are protected by South African copyright law and may not be distributed, transmitted, displayed, or otherwise published in any format, without the prior written permission of the copyright owner.
Disclaimer and Terms of Use: Provided that you maintain all copyright and other notices contained therein, you may download material (one machine readable copy and one print copy per page) for your personal and/or educational non-commercial use only.
The University o f the W itw atersrand, Johannesburg , is not responsible for any errors or omissions and excludes any and all liability for any errors in or omissions from the information on the Library website.