Embed Size (px)
Citation preview
/2 ijglobal.com
Download the data
INFRASTRUCTURELEAGUE TABLES
/3ijglobal.com
Download the data
IJGlobal Infrastructure Finance league table report H1 2018
INFRASTRUCTURELEAGUE TABLES
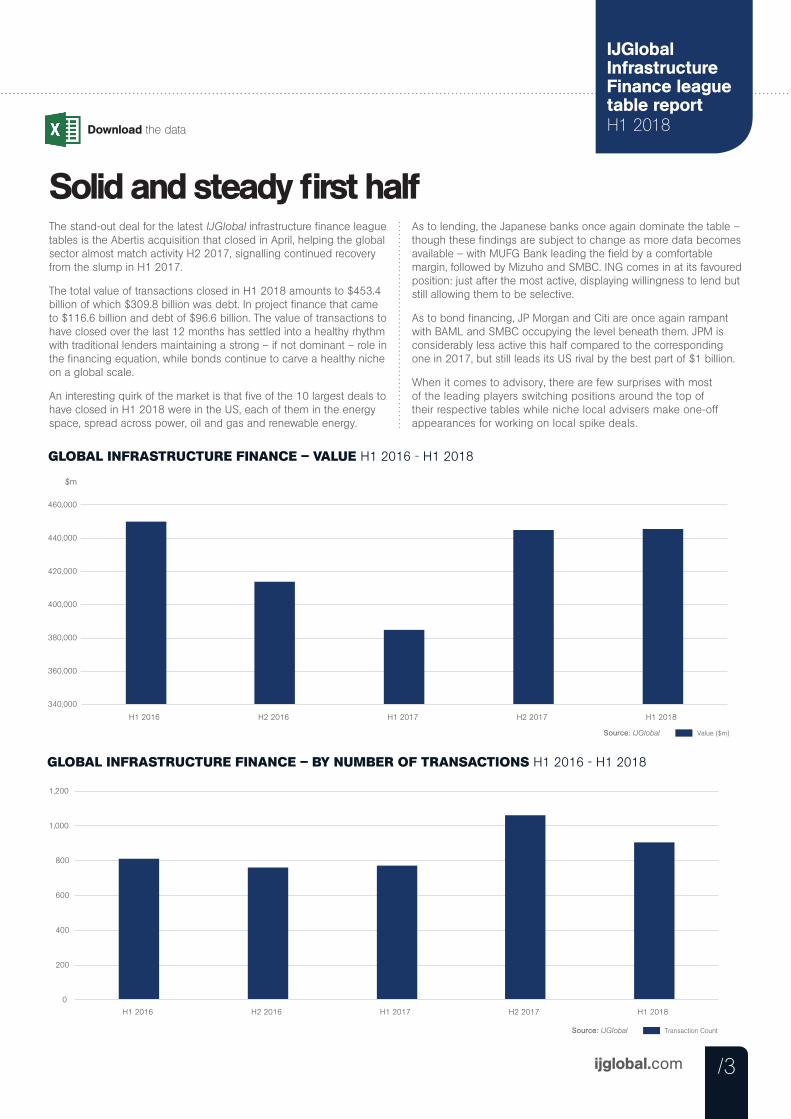
GLOBAL INFRASTRUCTURE FINANCE – BY NUMBER OF TRANSACTIONS H1 2016 - H1 2018
GLOBAL INFRASTRUCTURE FINANCE – VALUE H1 2016 - H1 2018
$m
Value ($m) Source: IJGlobal
340,000
360,000
380,000
400,000
420,000
440,000
460,000
H1 2016 H2 2016 H1 2017 H2 2017 H1 2018
Solid and steady first halfThe stand-out deal for the latest IJGlobal infrastructure finance league tables is the Abertis acquisition that closed in April, helping the global sector almost match activity H2 2017, signalling continued recovery from the slump in H1 2017.
The total value of transactions closed in H1 2018 amounts to $453.4 billion of which $309.8 billion was debt. In project finance that came to $116.6 billion and debt of $96.6 billion. The value of transactions to have closed over the last 12 months has settled into a healthy rhythm with traditional lenders maintaining a strong – if not dominant – role in the financing equation, while bonds continue to carve a healthy niche on a global scale.
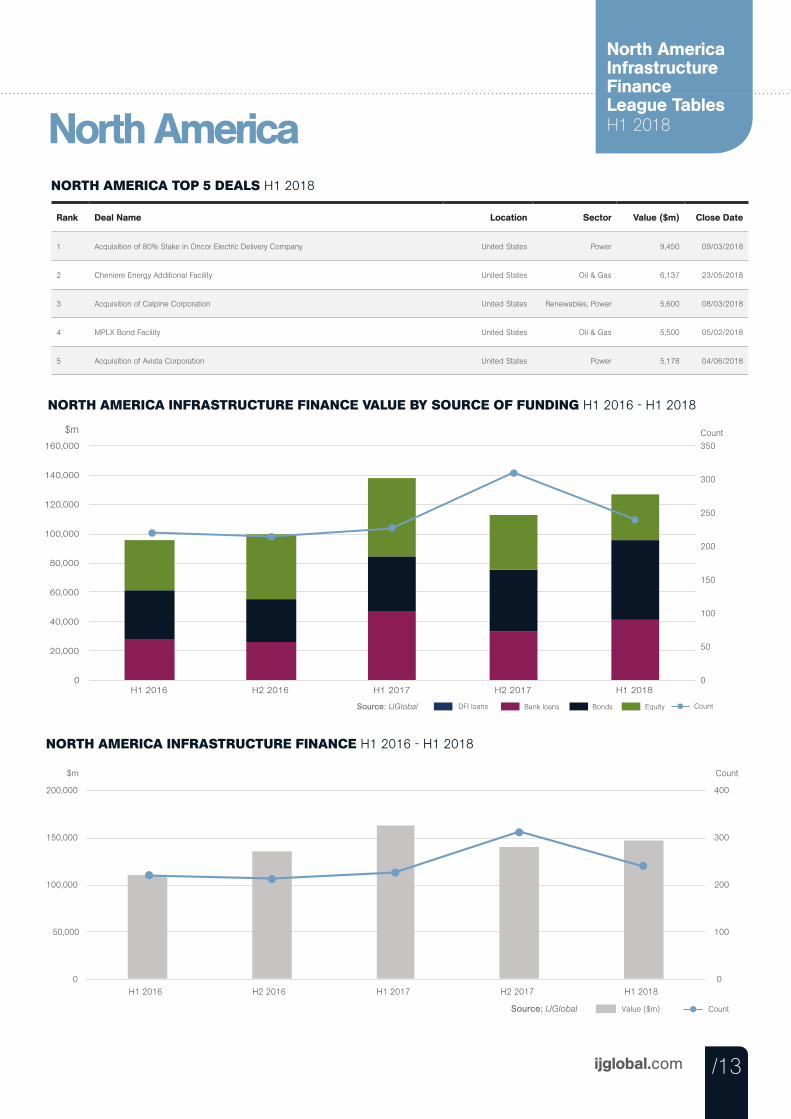
An interesting quirk of the market is that five of the 10 largest deals to have closed in H1 2018 were in the US, each of them in the energy space, spread across power, oil and gas and renewable energy.
Transaction Count Source: IJGlobal
0
200
400
600
800
1,000
1,200
H1 2016 H2 2016 H1 2017 H2 2017 H1 2018
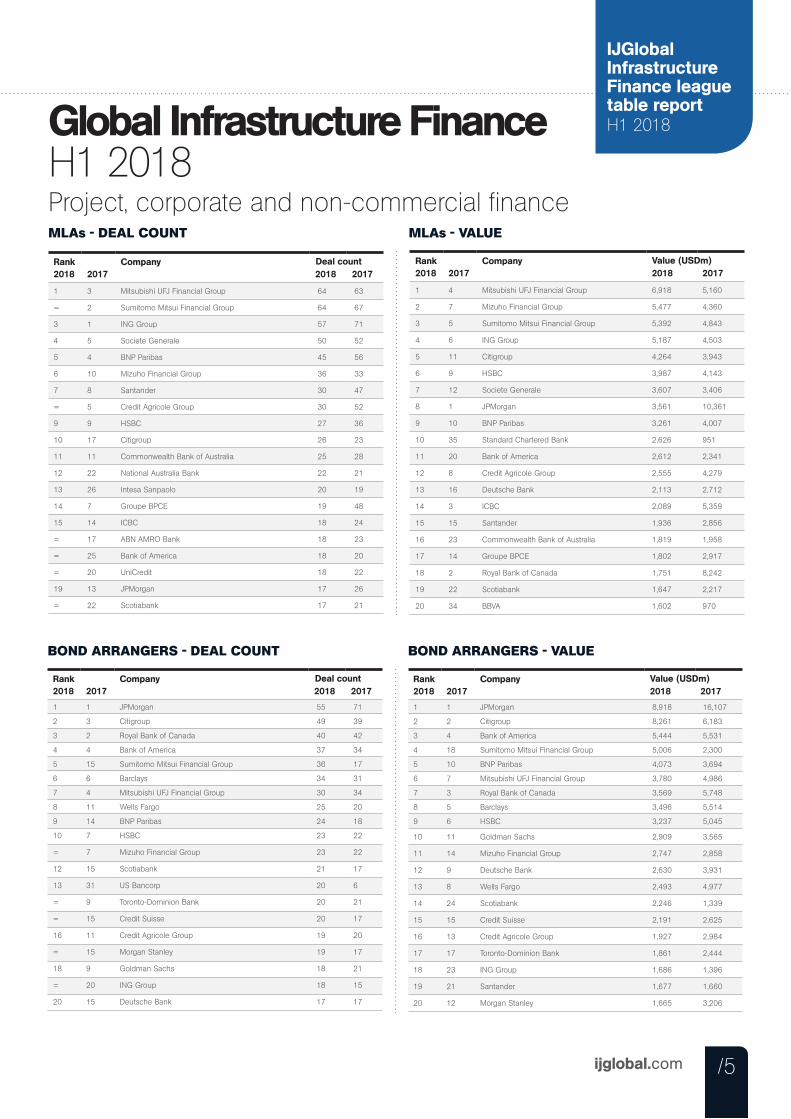
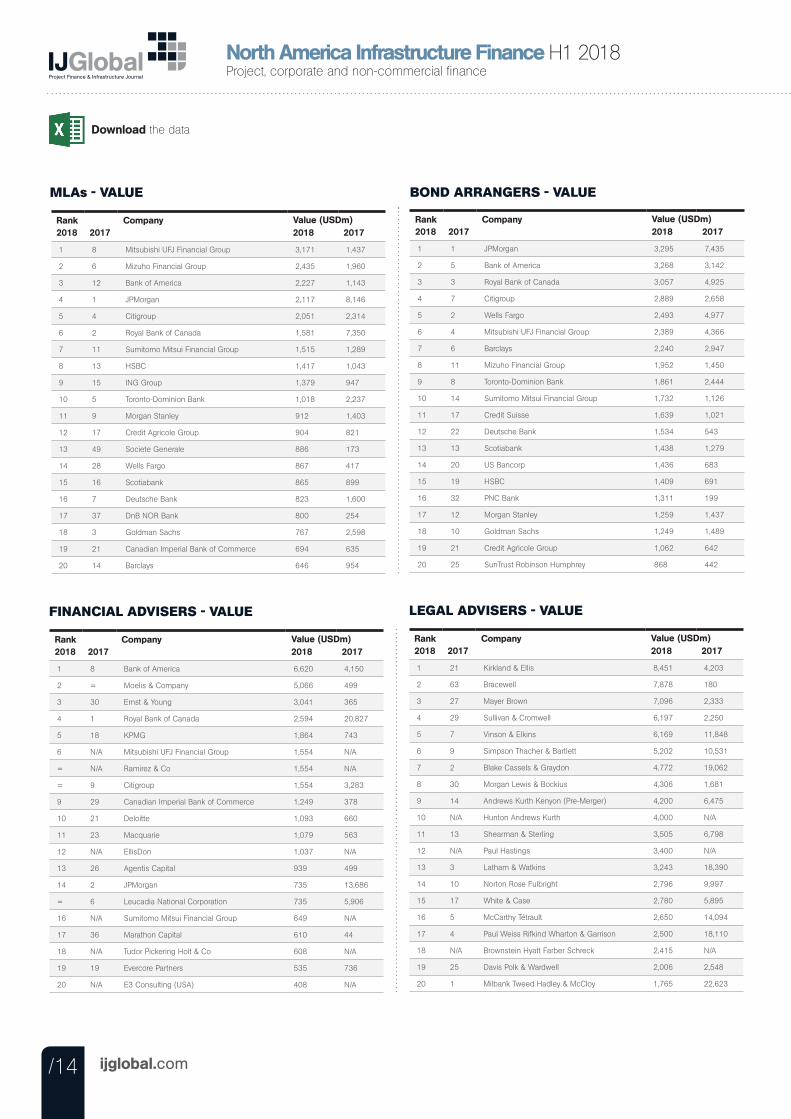
As to lending, the Japanese banks once again dominate the table – though these findings are subject to change as more data becomes available – with MUFG Bank leading the field by a comfortable margin, followed by Mizuho and SMBC. ING comes in at its favoured position: just after the most active, displaying willingness to lend but still allowing them to be selective.
As to bond financing, JP Morgan and Citi are once again rampant with BAML and SMBC occupying the level beneath them. JPM is considerably less active this half compared to the corresponding one in 2017, but still leads its US rival by the best part of $1 billion.
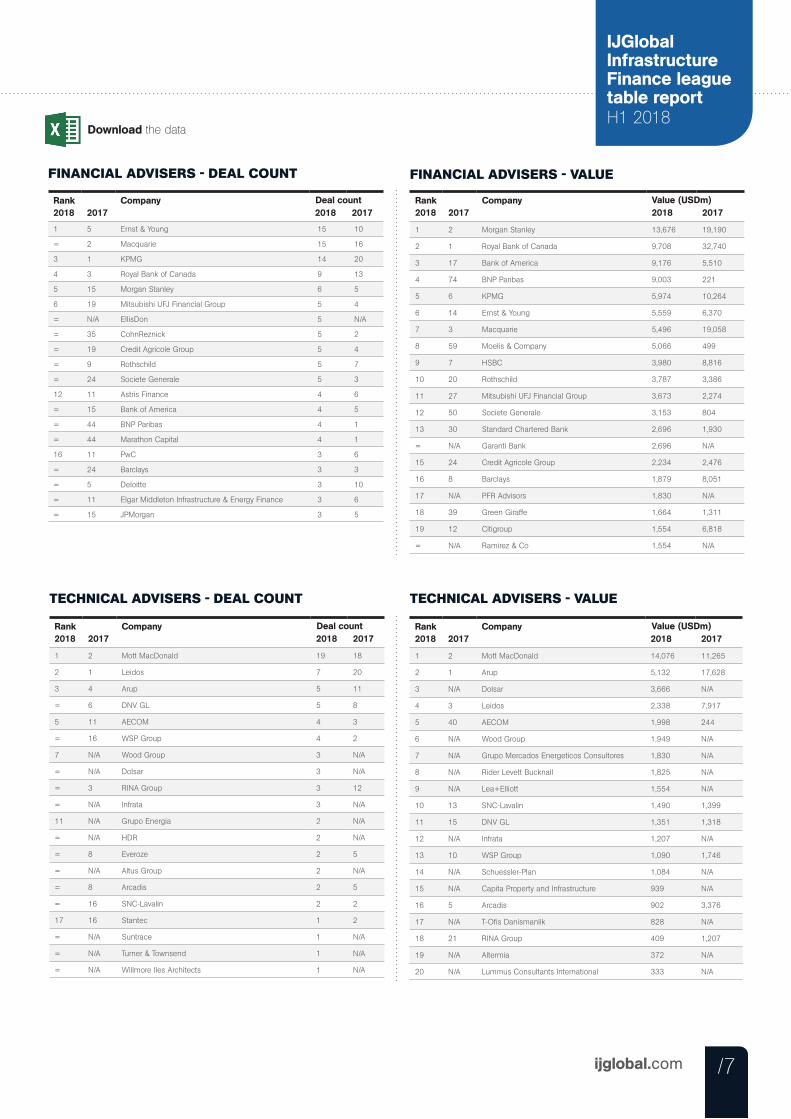
When it comes to advisory, there are few surprises with most of the leading players switching positions around the top of their respective tables while niche local advisers make one-off appearances for working on local spike deals.
/4 ijglobal.com
Download the dataDownload the data
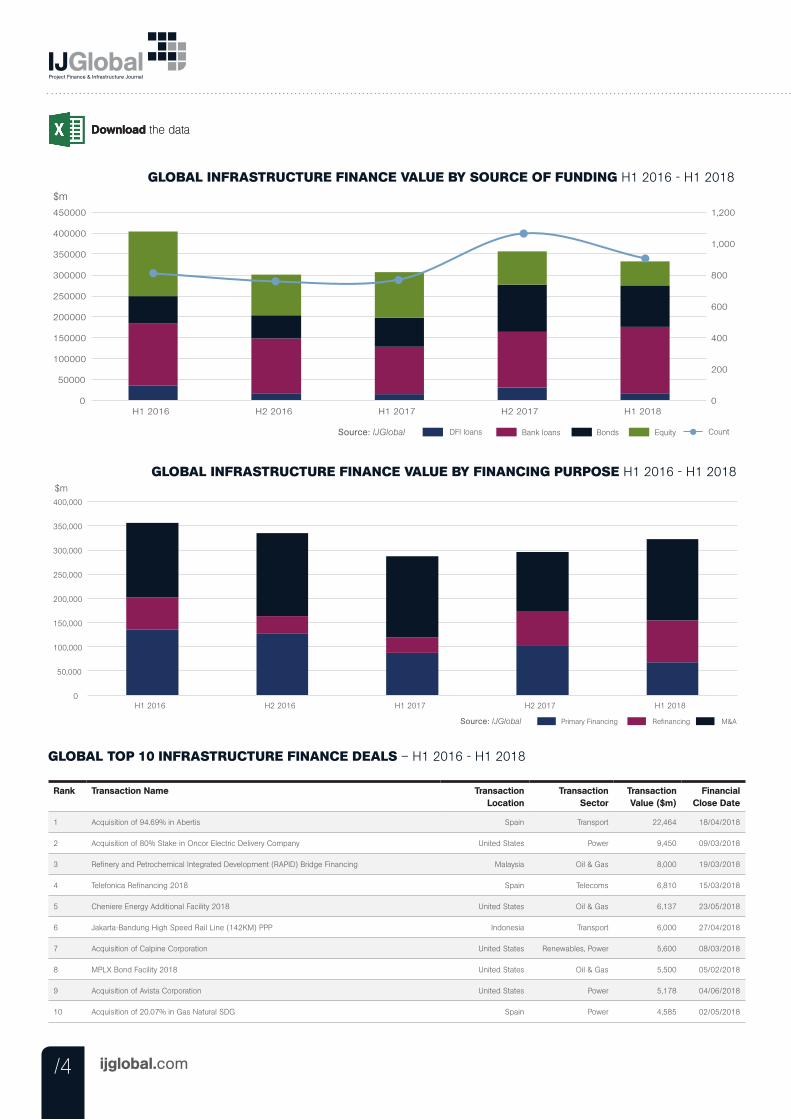
GLOBAL INFRASTRUCTURE FINANCE VALUE BY SOURCE OF FUNDING H1 2016 - H1 2018$m
Bank loans DFI loans Bonds Equity Source: IJGlobal Count
0
200
400
600
800
1,000
1,200
0
50000
100000
150000
200000
250000
300000
350000
400000
450000
H1 2016 H2 2016 H1 2017 H2 2017 H1 2018
$m
Source: IJGlobal Primary Financing Refinancing M&A
0
50,000
100,000
150,000
200,000
250,000
300,000
350,000
400,000
H1 2016 H2 2016 H1 2017 H2 2017 H1 2018
GLOBAL INFRASTRUCTURE FINANCE VALUE BY FINANCING PURPOSE H1 2016 - H1 2018
GLOBAL TOP 10 INFRASTRUCTURE FINANCE DEALS – H1 2016 - H1 2018
Rank Transaction Name Transaction Location
Transaction Sector
Transaction Value ($m)
Financial Close Date
1 Acquisition of 94.69% in Abertis Spain Transport 22,464 18/04/2018
2 Acquisition of 80% Stake in Oncor Electric Delivery Company United States Power 9,450 09/03/2018
3 Refinery and Petrochemical Integrated Development (RAPID) Bridge Financing Malaysia Oil & Gas 8,000 19/03/2018
4 Telefonica Refinancing 2018 Spain Telecoms 6,810 15/03/2018
5 Cheniere Energy Additional Facility 2018 United States Oil & Gas 6,137 23/05/2018
6 Jakarta-Bandung High Speed Rail Line (142KM) PPP Indonesia Transport 6,000 27/04/2018
7 Acquisition of Calpine Corporation United States Renewables, Power 5,600 08/03/2018
8 MPLX Bond Facility 2018 United States Oil & Gas 5,500 05/02/2018
9 Acquisition of Avista Corporation United States Power 5,178 04/06/2018
10 Acquisition of 20.07% in Gas Natural SDG Spain Power 4,585 02/05/2018
/5ijglobal.com
Europe Infrastructure FinanceLeague Tables H1 2017
IJGlobal Infrastructure Finance league table report H1 2018Global Infrastructure Finance
H1 2018Project, corporate and non-commercial financeMLAs - DEAL COUNT MLAs - VALUE
Rank2018 2017
Company2018 2017
1 3 Mitsubishi UFJ Financial Group 64 63
= 2 Sumitomo Mitsui Financial Group 64 67
3 1 ING Group 57 71
4 5 Societe Generale 50 52
5 4 BNP Paribas 45 56
6 10 Mizuho Financial Group 36 33
7 8 Santander 30 47
= 5 Credit Agricole Group 30 52
9 9 HSBC 27 36
10 17 Citigroup 26 23
11 11 Commonwealth Bank of Australia 25 28
12 22 National Australia Bank 22 21
13 26 Intesa Sanpaolo 20 19
14 7 Groupe BPCE 19 48
15 14 ICBC 18 24
= 17 ABN AMRO Bank 18 23
= 25 Bank of America 18 20
= 20 UniCredit 18 22
19 13 JPMorgan 17 26
= 22 Scotiabank 17 21
Deal count Rank2018 2017
Company2018 2017
1 4 Mitsubishi UFJ Financial Group 6,918 5,160
2 7 Mizuho Financial Group 5,477 4,360
3 5 Sumitomo Mitsui Financial Group 5,392 4,843
4 6 ING Group 5,187 4,503
5 11 Citigroup 4,264 3,943
6 9 HSBC 3,987 4,143
7 12 Societe Generale 3,607 3,406
8 1 JPMorgan 3,561 10,361
9 10 BNP Paribas 3,261 4,007
10 35 Standard Chartered Bank 2,626 951
11 20 Bank of America 2,612 2,341
12 8 Credit Agricole Group 2,555 4,279
13 16 Deutsche Bank 2,113 2,712
14 3 ICBC 2,089 5,359
15 15 Santander 1,936 2,856
16 23 Commonwealth Bank of Australia 1,819 1,958
17 14 Groupe BPCE 1,802 2,917
18 2 Royal Bank of Canada 1,751 8,242
19 22 Scotiabank 1,647 2,217
20 34 BBVA 1,602 970
Value (USDm)
BOND ARRANGERS - DEAL COUNT BOND ARRANGERS - VALUE
Rank2018 2017
Company2018 2017
1 1 JPMorgan 55 71
2 3 Citigroup 49 39
3 2 Royal Bank of Canada 40 42
4 4 Bank of America 37 34
5 15 Sumitomo Mitsui Financial Group 36 17
6 6 Barclays 34 31
7 4 Mitsubishi UFJ Financial Group 30 34
8 11 Wells Fargo 25 20
9 14 BNP Paribas 24 18
10 7 HSBC 23 22
= 7 Mizuho Financial Group 23 22
12 15 Scotiabank 21 17
13 31 US Bancorp 20 6
= 9 Toronto-Dominion Bank 20 21
= 15 Credit Suisse 20 17
16 11 Credit Agricole Group 19 20
= 15 Morgan Stanley 19 17
18 9 Goldman Sachs 18 21
= 20 ING Group 18 15
20 15 Deutsche Bank 17 17
Deal count Rank2018 2017
Company2018 2017
1 1 JPMorgan 8,918 16,107
2 2 Citigroup 8,261 6,183
3 4 Bank of America 5,444 5,531
4 18 Sumitomo Mitsui Financial Group 5,006 2,300
5 10 BNP Paribas 4,073 3,694
6 7 Mitsubishi UFJ Financial Group 3,780 4,986
7 3 Royal Bank of Canada 3,569 5,748
8 5 Barclays 3,496 5,514
9 6 HSBC 3,237 5,045
10 11 Goldman Sachs 2,909 3,565
11 14 Mizuho Financial Group 2,747 2,858
12 9 Deutsche Bank 2,630 3,931
13 8 Wells Fargo 2,493 4,977
14 24 Scotiabank 2,246 1,339
15 15 Credit Suisse 2,191 2,625
16 13 Credit Agricole Group 1,927 2,984
17 17 Toronto-Dominion Bank 1,861 2,444
18 23 ING Group 1,686 1,396
19 21 Santander 1,677 1,660
20 12 Morgan Stanley 1,665 3,206
Value (USDm)

/6 ijglobal.com
LEGAL ADVISERS - DEAL COUNT LEGAL ADVISERS - VALUE
Rank2018 2017
Company2018 2017
1 3 Allen & Overy 45 43
2 2 Clifford Chance 43 48
3 1 Norton Rose Fulbright 37 53
4 9 White & Case 31 25
5 9 DLA Piper 29 25
6 5 Linklaters 25 36
7 6 Milbank Tweed Hadley & McCloy 23 30
= 7 Herbert Smith Freehills 23 26
9 15 Simpson Thacher & Bartlett 21 19
10 4 Latham & Watkins 20 37
11 21 Mayer Brown 18 13
= 18 Allens 18 18
13 7 Watson Farley & Williams 17 26
14 19 Vinson & Elkins 15 14
= 55 Morgan Lewis & Bockius 15 3
16 12 Shearman & Sterling 14 23
17 11 Ashurst 13 24
= 19 CMS 13 14
19 21 King & Wood Mallesons 11 13
20 29 Garrigues 9 8
Deal count Rank2018 2017
Company2018 2017
1 1 Clifford Chance 37,523 33,203
2 9 White & Case 26,529 16,122
3 5 Allen & Overy 25,393 27,167
4 2 Milbank Tweed Hadley & McCloy 20,376 33,050
5 4 Linklaters 17,431 28,543
6 11 Shearman & Sterling 16,124 15,151
7 6 Norton Rose Fulbright 14,978 25,546
8 13 Ashurst 14,124 14,077
9 19 Herbert Smith Freehills 9,883 10,145
10 16 Vinson & Elkins 9,519 11,848
11 43 Mayer Brown 9,124 4,062
12 39 Kirkland & Ellis 8,451 4,639
13 21 DLA Piper 8,017 8,487
14 N/A Kadir Andri & Partners 8,000 N/A
= N/A Rahmat Lim & Partners 8,000 N/A
16 81 Bracewell 7,878 1,180
17 15 Simpson Thacher & Bartlett 7,689 13,231
18 17 Allens 7,551 11,593
19 10 Baker & McKenzie 7,294 15,247
20 46 Gilbert & Tobin 6,208 3,738
Value (USDm)
SPONSORS - VALUE
Rank2018 2017
Company2018 2017
1 N/A Sempra Energy 10,430 N/A
2 N/A Telefonica 8,810 N/A
3 117 Atlantia 8,784 807
4 188 ACS Group 8,584 479
5 N/A Hochtief 8,084 N/A
6 26 Cheniere Energy 6,137 2,900
7 N/A CVC Capital Partners 6,041 N/A
8 39 Marathon Petroleum Corporation 5,500 2,250
9 58 Energy Transfer Partners 5,200 1,500
10 N/A Hydro One 5,178 N/A
11 N/A Saudi Aramco 5,050 N/A
12 51 Enel 4,996 1,649
13 N/A PETRONAS 4,575 N/A
14 N/A Fortum Oyj 4,452 N/A
15 12 Macquarie 4,358 4,612
16 N/A Oil and Natural Gas Corporation 4,294 N/A
17 N/A Government of Indonesia 4,250 N/A
18 N/A Apache Corporation 4,000 N/A
= 151 Noble Energy 4,000 625
= 13 Pemex 4,000 4,495
Value (USDm)
Download the data behind the deals at IJGlobal
Download the data
/7ijglobal.com
IJGlobal Infrastructure Finance league table report H1 2018
TECHNICAL ADVISERS - DEAL COUNT
Rank2018 2017
Company2018 2017
1 2 Mott MacDonald 19 18
2 1 Leidos 7 20
3 4 Arup 5 11
= 6 DNV GL 5 8
5 11 AECOM 4 3
= 16 WSP Group 4 2
7 N/A Wood Group 3 N/A
= N/A Dolsar 3 N/A
= 3 RINA Group 3 12
= N/A Infrata 3 N/A
11 N/A Grupo Energia 2 N/A
= N/A HDR 2 N/A
= 8 Everoze 2 5
= N/A Altus Group 2 N/A
= 8 Arcadis 2 5
= 16 SNC-Lavalin 2 2
17 16 Stantec 1 2
= N/A Suntrace 1 N/A
= N/A Turner & Townsend 1 N/A
= N/A Willmore Iles Architects 1 N/A
Deal count
TECHNICAL ADVISERS - VALUE
Rank2018 2017
Company2018 2017
1 2 Mott MacDonald 14,076 11,265
2 1 Arup 5,132 17,628
3 N/A Dolsar 3,666 N/A
4 3 Leidos 2,338 7,917
5 40 AECOM 1,998 244
6 N/A Wood Group 1,949 N/A
7 N/A Grupo Mercados Energeticos Consultores 1,830 N/A
8 N/A Rider Levett Bucknall 1,825 N/A
9 N/A Lea+Elliott 1,554 N/A
10 13 SNC-Lavalin 1,490 1,399
11 15 DNV GL 1,351 1,318
12 N/A Infrata 1,207 N/A
13 10 WSP Group 1,090 1,746
14 N/A Schuessler-Plan 1,084 N/A
15 N/A Capita Property and Infrastructure 939 N/A
16 5 Arcadis 902 3,376
17 N/A T-Ofis Danismanlik 828 N/A
18 21 RINA Group 409 1,207
19 N/A Altermia 372 N/A
20 N/A Lummus Consultants International 333 N/A
Value (USDm)
FINANCIAL ADVISERS - DEAL COUNT FINANCIAL ADVISERS - VALUE
Rank2018 2017
Company2018 2017
1 2 Morgan Stanley 13,676 19,190
2 1 Royal Bank of Canada 9,708 32,740
3 17 Bank of America 9,176 5,510
4 74 BNP Paribas 9,003 221
5 6 KPMG 5,974 10,264
6 14 Ernst & Young 5,559 6,370
7 3 Macquarie 5,496 19,058
8 59 Moelis & Company 5,066 499
9 7 HSBC 3,980 8,816
10 20 Rothschild 3,787 3,386
11 27 Mitsubishi UFJ Financial Group 3,673 2,274
12 50 Societe Generale 3,153 804
13 30 Standard Chartered Bank 2,696 1,930
= N/A Garanti Bank 2,696 N/A
15 24 Credit Agricole Group 2,234 2,476
16 8 Barclays 1,879 8,051
17 N/A PFR Advisors 1,830 N/A
18 39 Green Giraffe 1,664 1,311
19 12 Citigroup 1,554 6,818
= N/A Ramirez & Co 1,554 N/A
Value (USDm)Rank2018 2017
Company2018 2017
1 5 Ernst & Young 15 10
= 2 Macquarie 15 16
3 1 KPMG 14 20
4 3 Royal Bank of Canada 9 13
5 15 Morgan Stanley 6 5
6 19 Mitsubishi UFJ Financial Group 5 4
= N/A EllisDon 5 N/A
= 35 CohnReznick 5 2
= 19 Credit Agricole Group 5 4
= 9 Rothschild 5 7
= 24 Societe Generale 5 3
12 11 Astris Finance 4 6
= 15 Bank of America 4 5
= 44 BNP Paribas 4 1
= 44 Marathon Capital 4 1
16 11 PwC 3 6
= 24 Barclays 3 3
= 5 Deloitte 3 10
= 11 Elgar Middleton Infrastructure & Energy Finance 3 6
= 15 JPMorgan 3 5
Deal count
Download the data
/8 ijglobal.com
Download the data
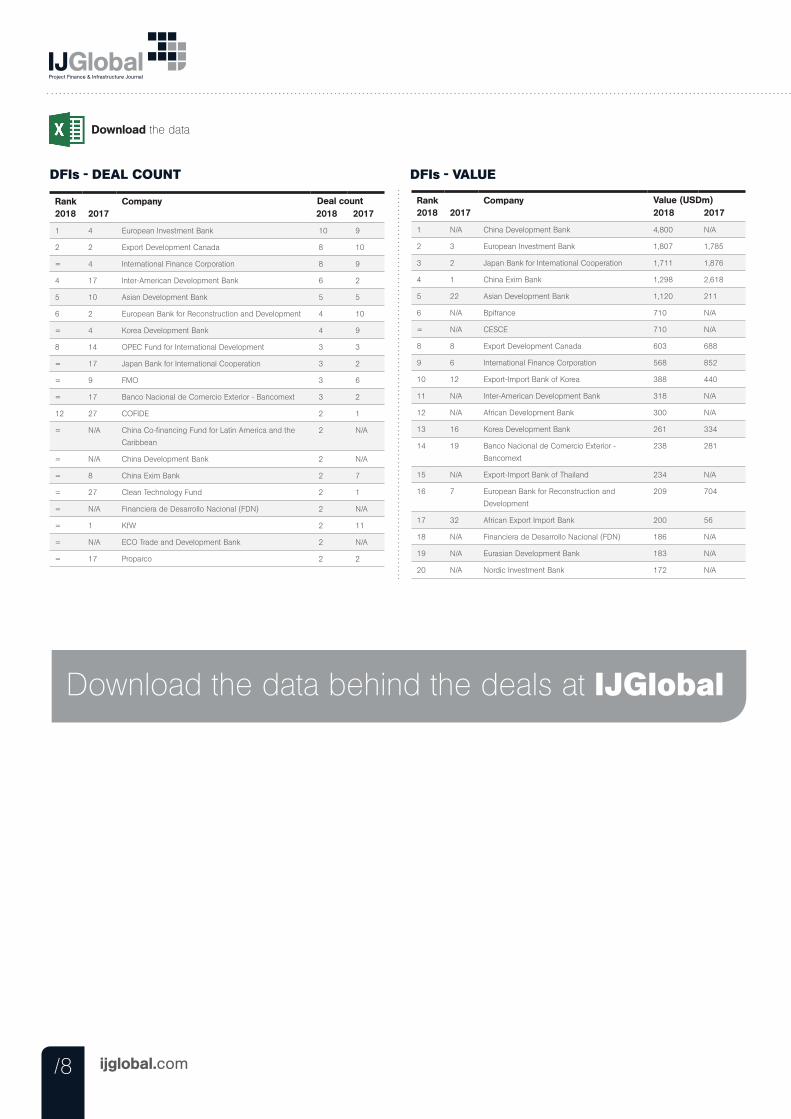
DFIs - DEAL COUNT DFIs - VALUE
Rank2018 2017
Company2018 2017
1 4 European Investment Bank 10 9
2 2 Export Development Canada 8 10
= 4 International Finance Corporation 8 9
4 17 Inter-American Development Bank 6 2
5 10 Asian Development Bank 5 5
6 2 European Bank for Reconstruction and Development 4 10
= 4 Korea Development Bank 4 9
8 14 OPEC Fund for International Development 3 3
= 17 Japan Bank for International Cooperation 3 2
= 9 FMO 3 6
= 17 Banco Nacional de Comercio Exterior - Bancomext 3 2
12 27 COFIDE 2 1
= N/A China Co-financing Fund for Latin America and the
Caribbean
2 N/A
= N/A China Development Bank 2 N/A
= 8 China Exim Bank 2 7
= 27 Clean Technology Fund 2 1
= N/A Financiera de Desarrollo Nacional (FDN) 2 N/A
= 1 KfW 2 11
= N/A ECO Trade and Development Bank 2 N/A
= 17 Proparco 2 2
Deal count Rank2018 2017
Company2018 2017
1 N/A China Development Bank 4,800 N/A
2 3 European Investment Bank 1,807 1,785
3 2 Japan Bank for International Cooperation 1,711 1,876
4 1 China Exim Bank 1,298 2,618
5 22 Asian Development Bank 1,120 211
6 N/A Bpifrance 710 N/A
= N/A CESCE 710 N/A
8 8 Export Development Canada 603 688
9 6 International Finance Corporation 568 852
10 12 Export-Import Bank of Korea 388 440
11 N/A Inter-American Development Bank 318 N/A
12 N/A African Development Bank 300 N/A
13 16 Korea Development Bank 261 334
14 19 Banco Nacional de Comercio Exterior -
Bancomext
238 281
15 N/A Export-Import Bank of Thailand 234 N/A
16 7 European Bank for Reconstruction and
Development
209 704
17 32 African Export Import Bank 200 56
18 N/A Financiera de Desarrollo Nacional (FDN) 186 N/A
19 N/A Eurasian Development Bank 183 N/A
20 N/A Nordic Investment Bank 172 N/A
Value (USDm)
Download the data behind the deals at IJGlobal
/9ijglobal.com
Europe Infrastructure FinanceLeague Tables H1 2018Download the data
IJGlobal Infrastructure Finance league table report H1 2018
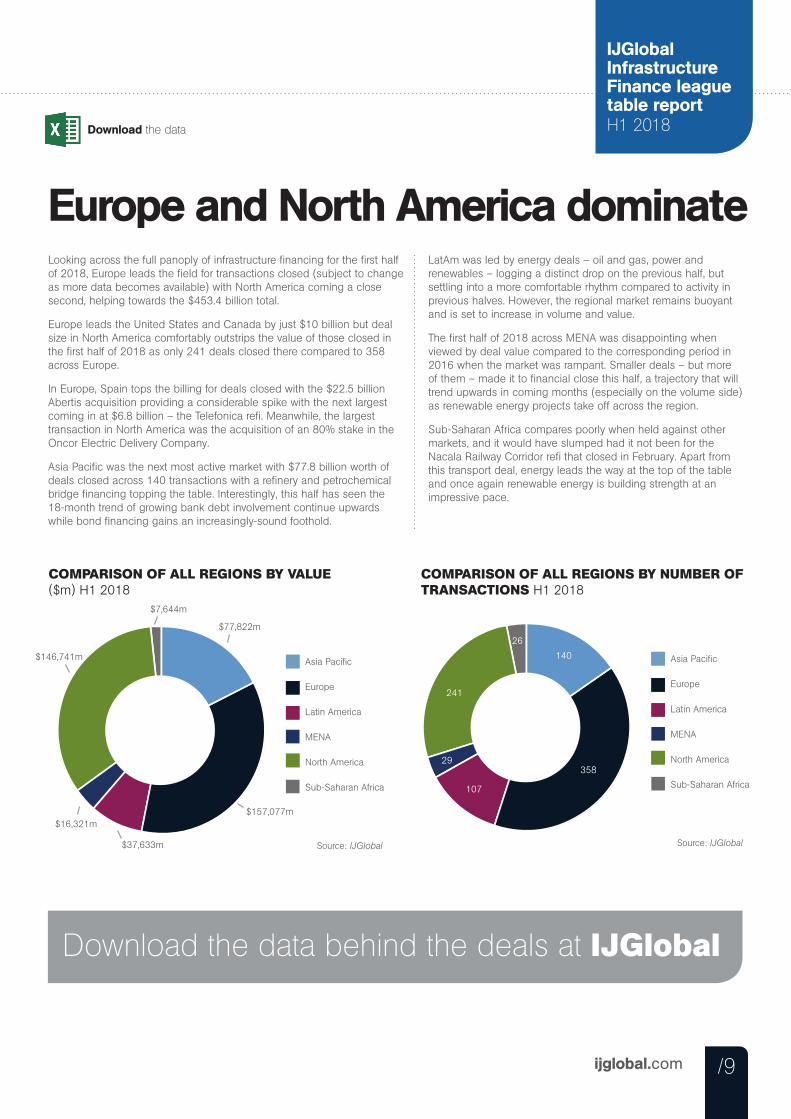
Europe and North America dominateLooking across the full panoply of infrastructure financing for the first half of 2018, Europe leads the field for transactions closed (subject to change as more data becomes available) with North America coming a close second, helping towards the $453.4 billion total.
Europe leads the United States and Canada by just $10 billion but deal size in North America comfortably outstrips the value of those closed in the first half of 2018 as only 241 deals closed there compared to 358 across Europe.
In Europe, Spain tops the billing for deals closed with the $22.5 billion Abertis acquisition providing a considerable spike with the next largest coming in at $6.8 billion – the Telefonica refi. Meanwhile, the largest transaction in North America was the acquisition of an 80% stake in the Oncor Electric Delivery Company.
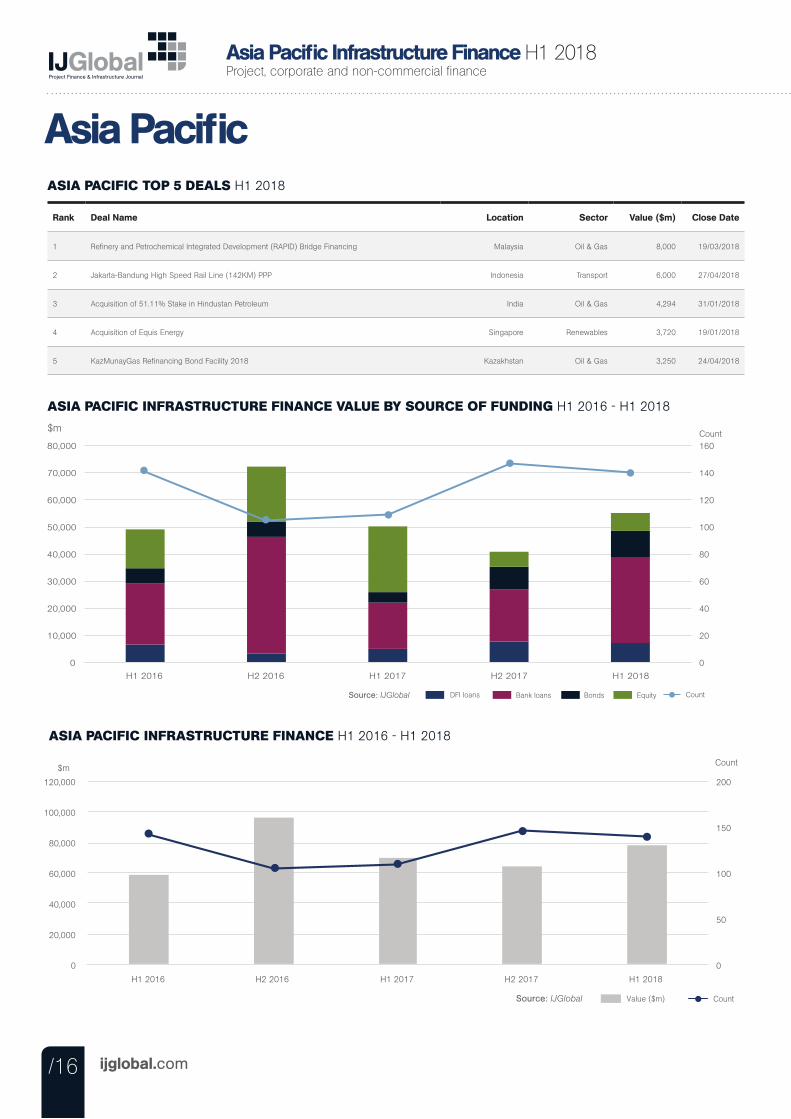
Asia Pacific was the next most active market with $77.8 billion worth of deals closed across 140 transactions with a refinery and petrochemical bridge financing topping the table. Interestingly, this half has seen the 18-month trend of growing bank debt involvement continue upwards while bond financing gains an increasingly-sound foothold.
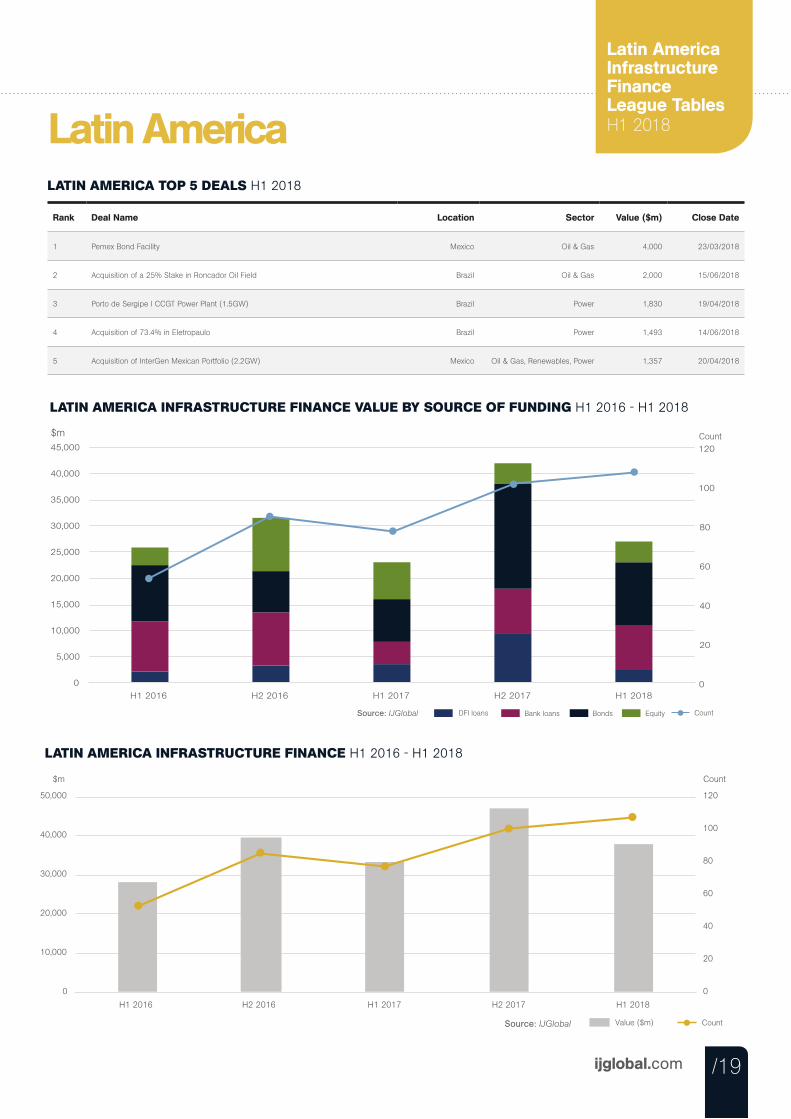
LatAm was led by energy deals – oil and gas, power and renewables – logging a distinct drop on the previous half, but settling into a more comfortable rhythm compared to activity in previous halves. However, the regional market remains buoyant and is set to increase in volume and value.
The first half of 2018 across MENA was disappointing when viewed by deal value compared to the corresponding period in 2016 when the market was rampant. Smaller deals – but more of them – made it to financial close this half, a trajectory that will trend upwards in coming months (especially on the volume side) as renewable energy projects take off across the region.
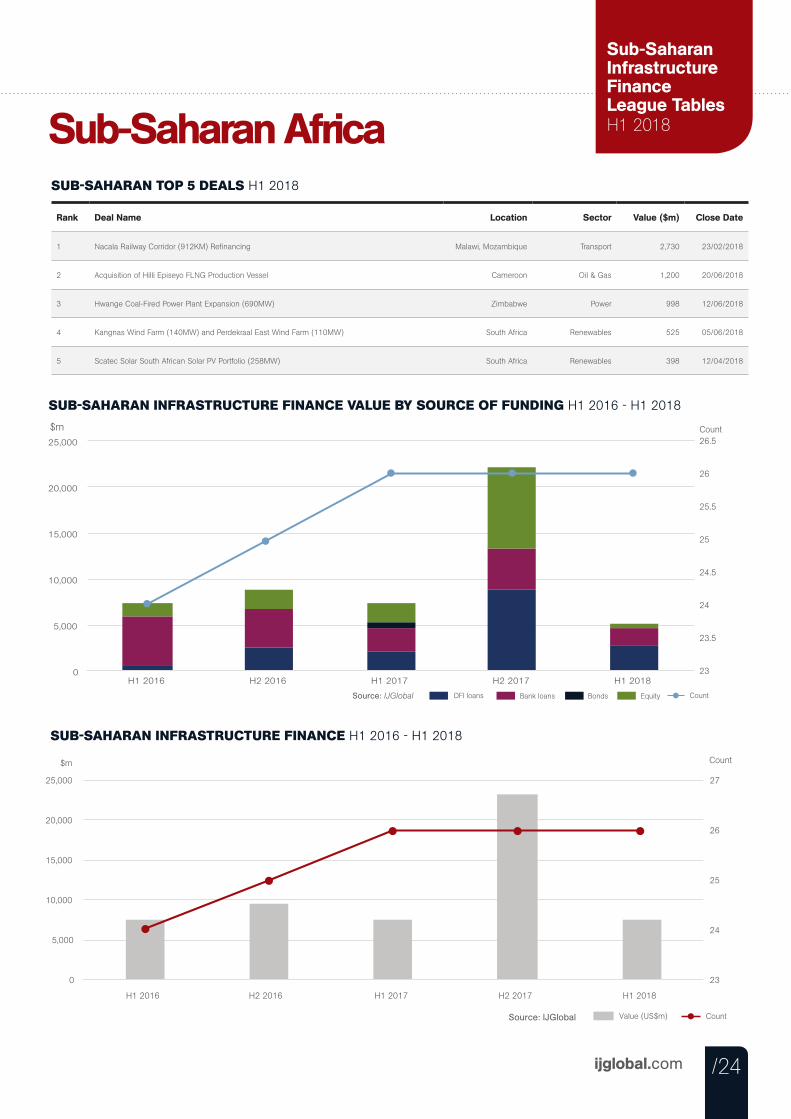
Sub-Saharan Africa compares poorly when held against other markets, and it would have slumped had it not been for the Nacala Railway Corridor refi that closed in February. Apart from this transport deal, energy leads the way at the top of the table and once again renewable energy is building strength at an impressive pace.
COMPARISON OF ALL REGIONS BY VALUE ($m) H1 2018
Asia Pacific
Europe
Latin America
MENA
North America
Sub-Saharan Africa
$77,822m
$157,077m
$37,633m
$16,321m
$146,741m
$7,644m
COMPARISON OF ALL REGIONS BY NUMBER OF TRANSACTIONS H1 2018
Asia Pacific
Europe
Latin America
MENA
North America
Sub-Saharan Africa
358
140
107
29
241
26
Download the data behind the deals at IJGlobal
Source: IJGlobal Source: IJGlobal
/10 ijglobal.com
Europe Infrastructure Finance H1 2018Project, corporate and non-commercial finance
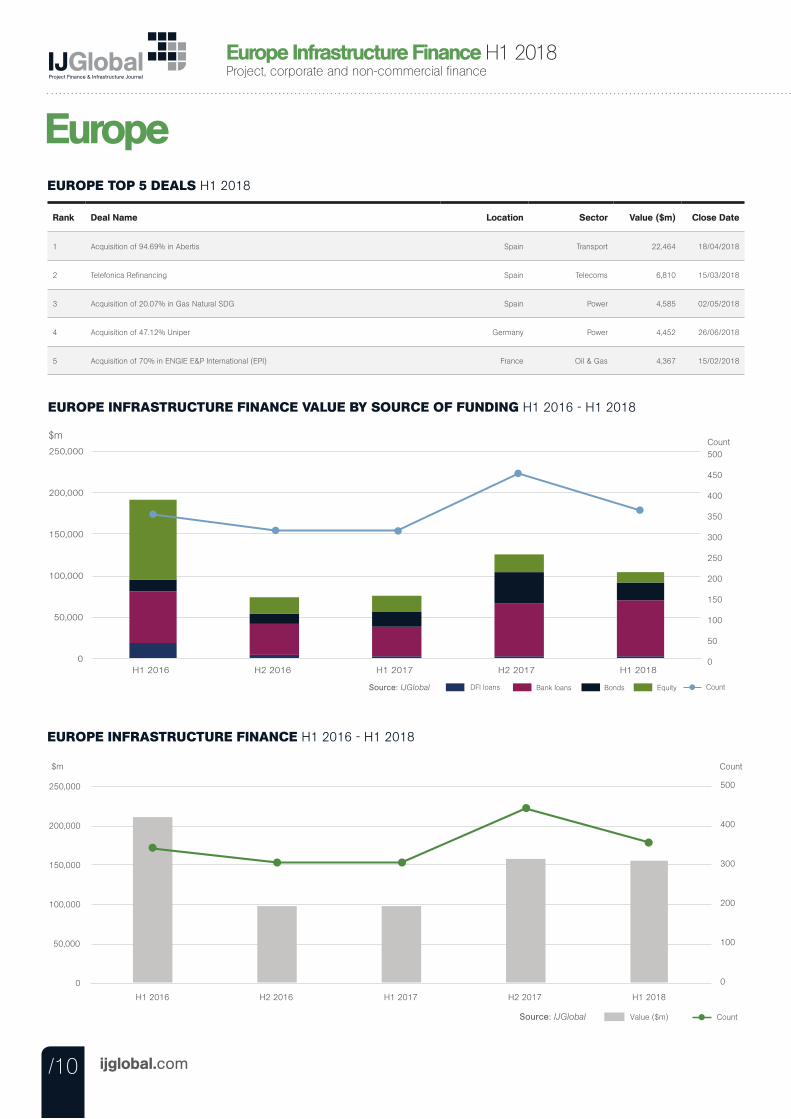
EuropeEUROPE TOP 5 DEALS H1 2018
Rank Deal Name Location Sector Value ($m) Close Date
1 Acquisition of 94.69% in Abertis Spain Transport 22,464 18/04/2018
2 Telefonica Refinancing Spain Telecoms 6,810 15/03/2018
3 Acquisition of 20.07% in Gas Natural SDG Spain Power 4,585 02/05/2018
4 Acquisition of 47.12% Uniper Germany Power 4,452 26/06/2018
5 Acquisition of 70% in ENGIE E&P International (EPI) France Oil & Gas 4,367 15/02/2018
EUROPE INFRASTRUCTURE FINANCE VALUE BY SOURCE OF FUNDING H1 2016 - H1 2018
$m
Bank loans DFI loans Bonds Equity Source: IJGlobal Count
0
50
100
150
200
250
300
350
400
450
500
0
50,000
100,000
150,000
200,000
250,000
H1 2016 H2 2016 H1 2017 H2 2017 H1 2018
Count
EUROPE INFRASTRUCTURE FINANCE H1 2016 - H1 2018
$m Count
Value ($m) Count Source: IJGlobal
0
100
200
300
400
500
0
50,000
100,000
150,000
200,000
250,000
H1 2016 H2 2016 H1 2017 H2 2017 H1 2018
/11ijglobal.com
Europe Infrastructure FinanceLeague Tables H1 2018
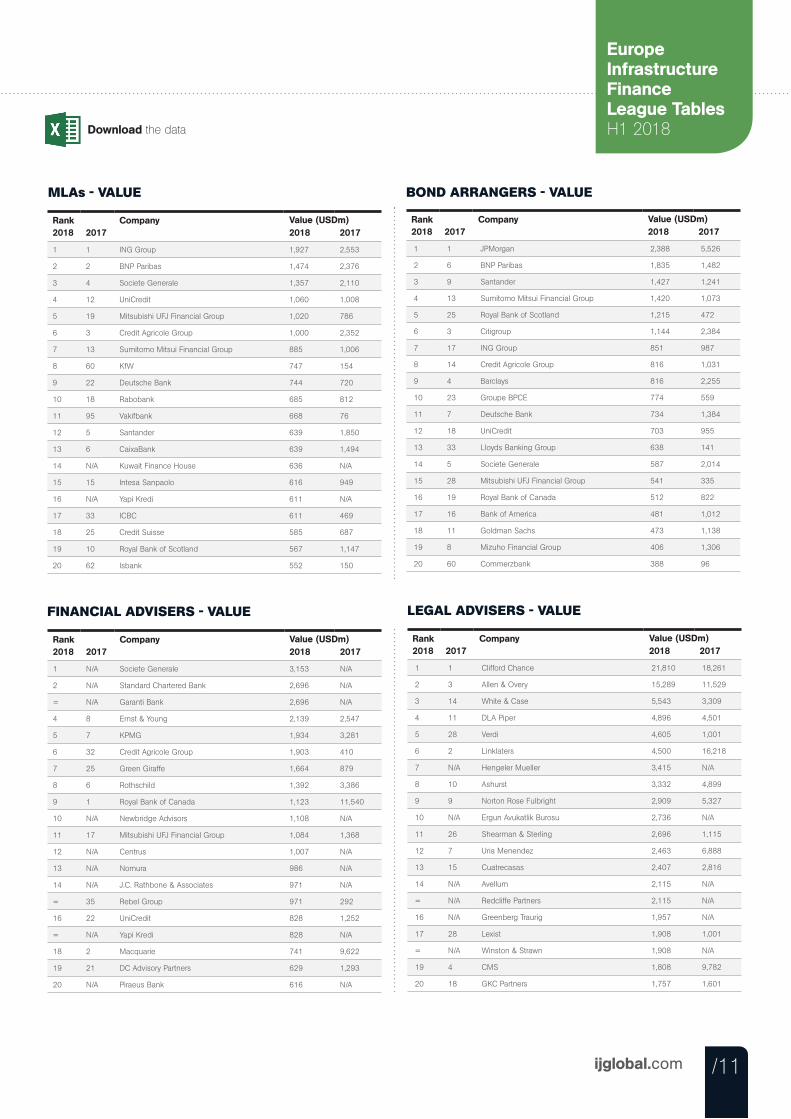
MLAs - VALUE
Rank2018 2017
Company2018 2017
1 1 ING Group 1,927 2,553
2 2 BNP Paribas 1,474 2,376
3 4 Societe Generale 1,357 2,110
4 12 UniCredit 1,060 1,008
5 19 Mitsubishi UFJ Financial Group 1,020 786
6 3 Credit Agricole Group 1,000 2,352
7 13 Sumitomo Mitsui Financial Group 885 1,006
8 60 KfW 747 154
9 22 Deutsche Bank 744 720
10 18 Rabobank 685 812
11 95 Vakifbank 668 76
12 5 Santander 639 1,850
13 6 CaixaBank 639 1,494
14 N/A Kuwait Finance House 636 N/A
15 15 Intesa Sanpaolo 616 949
16 N/A Yapi Kredi 611 N/A
17 33 ICBC 611 469
18 25 Credit Suisse 585 687
19 10 Royal Bank of Scotland 567 1,147
20 62 Isbank 552 150
Value (USDm)
BOND ARRANGERS - VALUE
Rank2018 2017
Company2018 2017
1 1 JPMorgan 2,388 5,526
2 6 BNP Paribas 1,835 1,482
3 9 Santander 1,427 1,241
4 13 Sumitomo Mitsui Financial Group 1,420 1,073
5 25 Royal Bank of Scotland 1,215 472
6 3 Citigroup 1,144 2,384
7 17 ING Group 851 987
8 14 Credit Agricole Group 816 1,031
9 4 Barclays 816 2,255
10 23 Groupe BPCE 774 559
11 7 Deutsche Bank 734 1,384
12 18 UniCredit 703 955
13 33 Lloyds Banking Group 638 141
14 5 Societe Generale 587 2,014
15 28 Mitsubishi UFJ Financial Group 541 335
16 19 Royal Bank of Canada 512 822
17 16 Bank of America 481 1,012
18 11 Goldman Sachs 473 1,138
19 8 Mizuho Financial Group 406 1,306
20 60 Commerzbank 388 96
Value (USDm)
FINANCIAL ADVISERS - VALUE
Rank2018 2017
Company2018 2017
1 N/A Societe Generale 3,153 N/A
2 N/A Standard Chartered Bank 2,696 N/A
= N/A Garanti Bank 2,696 N/A
4 8 Ernst & Young 2,139 2,547
5 7 KPMG 1,934 3,281
6 32 Credit Agricole Group 1,903 410
7 25 Green Giraffe 1,664 879
8 6 Rothschild 1,392 3,386
9 1 Royal Bank of Canada 1,123 11,540
10 N/A Newbridge Advisors 1,108 N/A
11 17 Mitsubishi UFJ Financial Group 1,084 1,368
12 N/A Centrus 1,007 N/A
13 N/A Nomura 986 N/A
14 N/A J.C. Rathbone & Associates 971 N/A
= 35 Rebel Group 971 292
16 22 UniCredit 828 1,252
= N/A Yapi Kredi 828 N/A
18 2 Macquarie 741 9,622
19 21 DC Advisory Partners 629 1,293
20 N/A Piraeus Bank 616 N/A
Value (USDm)
LEGAL ADVISERS - VALUE
Rank2018 2017
Company2018 2017
1 1 Clifford Chance 21,810 18,261
2 3 Allen & Overy 15,289 11,529
3 14 White & Case 5,543 3,309
4 11 DLA Piper 4,896 4,501
5 28 Verdi 4,605 1,001
6 2 Linklaters 4,500 16,218
7 N/A Hengeler Mueller 3,415 N/A
8 10 Ashurst 3,332 4,899
9 9 Norton Rose Fulbright 2,909 5,327
10 N/A Ergun Avukatlik Burosu 2,736 N/A
11 26 Shearman & Sterling 2,696 1,115
12 7 Uria Menendez 2,463 6,888
13 15 Cuatrecasas 2,407 2,816
14 N/A Avellum 2,115 N/A
= N/A Redcliffe Partners 2,115 N/A
16 N/A Greenberg Traurig 1,957 N/A
17 28 Lexist 1,908 1,001
= N/A Winston & Strawn 1,908 N/A
19 4 CMS 1,808 9,782
20 18 GKC Partners 1,757 1,601
Value (USDm)
Download the data
/12 ijglobal.com
Europe Infrastructure Finance H1 2018Project, corporate and non-commercial finance
Download the data
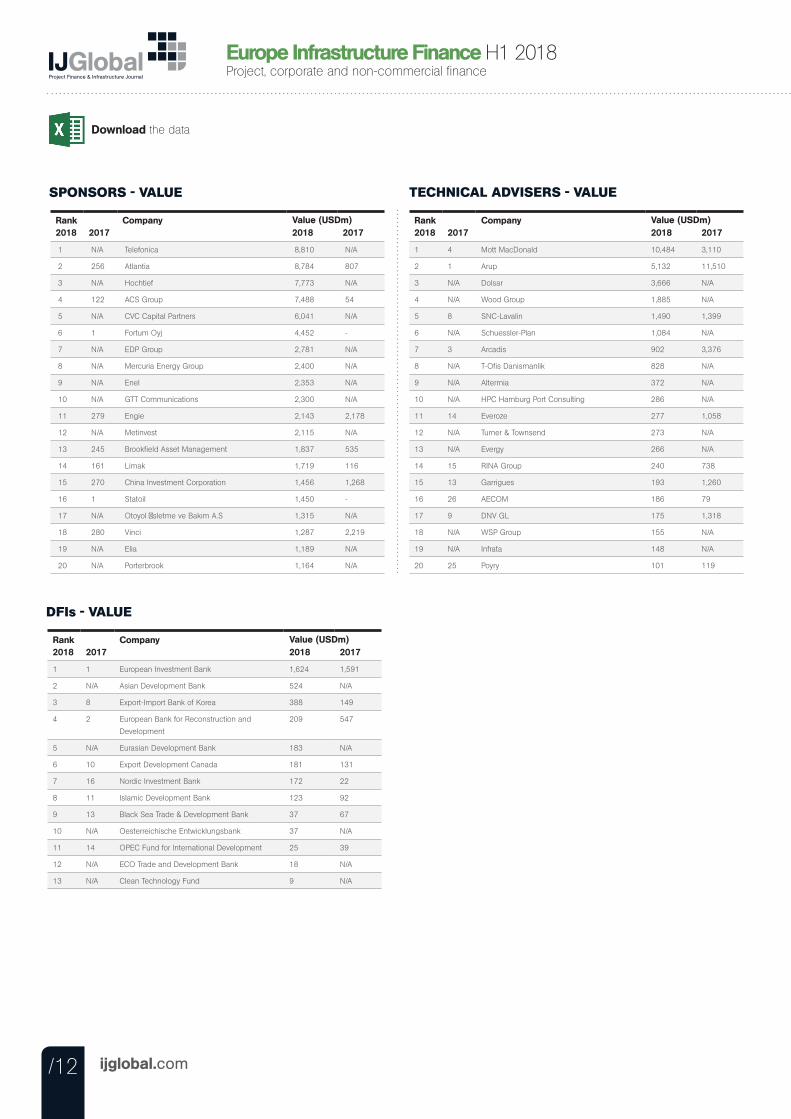
SPONSORS - VALUE
Rank2018 2017
Company2018 2017
1 N/A Telefonica 8,810 N/A
2 256 Atlantia 8,784 807
3 N/A Hochtief 7,773 N/A
4 122 ACS Group 7,488 54
5 N/A CVC Capital Partners 6,041 N/A
6 1 Fortum Oyj 4,452 -
7 N/A EDP Group 2,781 N/A
8 N/A Mercuria Energy Group 2,400 N/A
9 N/A Enel 2,353 N/A
10 N/A GTT Communications 2,300 N/A
11 279 Engie 2,143 2,178
12 N/A Metinvest 2,115 N/A
13 245 Brookfield Asset Management 1,837 535
14 161 Limak 1,719 116
15 270 China Investment Corporation 1,456 1,268
16 1 Statoil 1,450 -
17 N/A Otoyol İsletme ve Bakım A.S 1,315 N/A
18 280 Vinci 1,287 2,219
19 N/A Elia 1,189 N/A
20 N/A Porterbrook 1,164 N/A
Value (USDm)
TECHNICAL ADVISERS - VALUE
Rank2018 2017
Company2018 2017
1 4 Mott MacDonald 10,484 3,110
2 1 Arup 5,132 11,510
3 N/A Dolsar 3,666 N/A
4 N/A Wood Group 1,885 N/A
5 8 SNC-Lavalin 1,490 1,399
6 N/A Schuessler-Plan 1,084 N/A
7 3 Arcadis 902 3,376
8 N/A T-Ofis Danismanlik 828 N/A
9 N/A Altermia 372 N/A
10 N/A HPC Hamburg Port Consulting 286 N/A
11 14 Everoze 277 1,058
12 N/A Turner & Townsend 273 N/A
13 N/A Evergy 266 N/A
14 15 RINA Group 240 738
15 13 Garrigues 193 1,260
16 26 AECOM 186 79
17 9 DNV GL 175 1,318
18 N/A WSP Group 155 N/A
19 N/A Infrata 148 N/A
20 25 Poyry 101 119
Value (USDm)
DFIs - VALUE
Rank2018 2017
Company2018 2017
1 1 European Investment Bank 1,624 1,591
2 N/A Asian Development Bank 524 N/A
3 8 Export-Import Bank of Korea 388 149
4 2 European Bank for Reconstruction and
Development
209 547
5 N/A Eurasian Development Bank 183 N/A
6 10 Export Development Canada 181 131
7 16 Nordic Investment Bank 172 22
8 11 Islamic Development Bank 123 92
9 13 Black Sea Trade & Development Bank 37 67
10 N/A Oesterreichische Entwicklungsbank 37 N/A
11 14 OPEC Fund for International Development 25 39
12 N/A ECO Trade and Development Bank 18 N/A
13 N/A Clean Technology Fund 9 N/A
Value (USDm)
/13ijglobal.com
North America Infrastructure FinanceLeague Tables H1 2018North America
NORTH AMERICA TOP 5 DEALS H1 2018
Rank Deal Name Location Sector Value ($m) Close Date
1 Acquisition of 80% Stake in Oncor Electric Delivery Company United States Power 9,450 09/03/2018
2 Cheniere Energy Additional Facility United States Oil & Gas 6,137 23/05/2018
3 Acquisition of Calpine Corporation United States Renewables, Power 5,600 08/03/2018
4 MPLX Bond Facility United States Oil & Gas 5,500 05/02/2018
5 Acquisition of Avista Corporation United States Power 5,178 04/06/2018
NORTH AMERICA INFRASTRUCTURE FINANCE VALUE BY SOURCE OF FUNDING H1 2016 - H1 2018
0
50
100
150
200
250
300
350
0
20,000
40,000
60,000
80,000
100,000
120,000
140,000
160,000
H1 2016 H2 2016 H1 2017 H2 2017 H1 2018
Bank loans DFI loans Bonds Equity Source: IJGlobal Count
$m Count
NORTH AMERICA INFRASTRUCTURE FINANCE H1 2016 - H1 2018
$m Count
Value ($m) Count Source: IJGlobal
0
100
200
300
400
0
50,000
100,000
150,000
200,000
H1 2016 H2 2016 H1 2017 H2 2017 H1 2018
/14 ijglobal.com
Download the data
North America Infrastructure Finance H1 2018Project, corporate and non-commercial finance
MLAs - VALUE
Rank2018 2017
Company2018 2017
1 8 Mitsubishi UFJ Financial Group 3,171 1,437
2 6 Mizuho Financial Group 2,435 1,960
3 12 Bank of America 2,227 1,143
4 1 JPMorgan 2,117 8,146
5 4 Citigroup 2,051 2,314
6 2 Royal Bank of Canada 1,581 7,350
7 11 Sumitomo Mitsui Financial Group 1,515 1,289
8 13 HSBC 1,417 1,043
9 15 ING Group 1,379 947
10 5 Toronto-Dominion Bank 1,018 2,237
11 9 Morgan Stanley 912 1,403
12 17 Credit Agricole Group 904 821
13 49 Societe Generale 886 173
14 28 Wells Fargo 867 417
15 16 Scotiabank 865 899
16 7 Deutsche Bank 823 1,600
17 37 DnB NOR Bank 800 254
18 3 Goldman Sachs 767 2,598
19 21 Canadian Imperial Bank of Commerce 694 635
20 14 Barclays 646 954
Value (USDm)
BOND ARRANGERS - VALUE
Rank2018 2017
Company2018 2017
1 1 JPMorgan 3,295 7,435
2 5 Bank of America 3,268 3,142
3 3 Royal Bank of Canada 3,057 4,925
4 7 Citigroup 2,889 2,658
5 2 Wells Fargo 2,493 4,977
6 4 Mitsubishi UFJ Financial Group 2,389 4,366
7 6 Barclays 2,240 2,947
8 11 Mizuho Financial Group 1,952 1,450
9 8 Toronto-Dominion Bank 1,861 2,444
10 14 Sumitomo Mitsui Financial Group 1,732 1,126
11 17 Credit Suisse 1,639 1,021
12 22 Deutsche Bank 1,534 543
13 13 Scotiabank 1,438 1,279
14 20 US Bancorp 1,436 683
15 19 HSBC 1,409 691
16 32 PNC Bank 1,311 199
17 12 Morgan Stanley 1,259 1,437
18 10 Goldman Sachs 1,249 1,489
19 21 Credit Agricole Group 1,062 642
20 25 SunTrust Robinson Humphrey 868 442
Value (USDm)
FINANCIAL ADVISERS - VALUE
Rank2018 2017
Company2018 2017
1 8 Bank of America 6,620 4,150
2 = Moelis & Company 5,066 499
3 30 Ernst & Young 3,041 365
4 1 Royal Bank of Canada 2,594 20,827
5 18 KPMG 1,864 743
6 N/A Mitsubishi UFJ Financial Group 1,554 N/A
= N/A Ramirez & Co 1,554 N/A
= 9 Citigroup 1,554 3,283
9 29 Canadian Imperial Bank of Commerce 1,249 378
10 21 Deloitte 1,093 660
11 23 Macquarie 1,079 563
12 N/A EllisDon 1,037 N/A
13 26 Agentis Capital 939 499
14 2 JPMorgan 735 13,686
= 6 Leucadia National Corporation 735 5,906
16 N/A Sumitomo Mitsui Financial Group 649 N/A
17 36 Marathon Capital 610 44
18 N/A Tudor Pickering Holt & Co 608 N/A
19 19 Evercore Partners 535 736
20 N/A E3 Consulting (USA) 408 N/A
Value (USDm)
LEGAL ADVISERS - VALUE
Rank2018 2017
Company2018 2017
1 21 Kirkland & Ellis 8,451 4,203
2 63 Bracewell 7,878 180
3 27 Mayer Brown 7,096 2,333
4 29 Sullivan & Cromwell 6,197 2,250
5 7 Vinson & Elkins 6,169 11,848
6 9 Simpson Thacher & Bartlett 5,202 10,531
7 2 Blake Cassels & Graydon 4,772 19,062
8 30 Morgan Lewis & Bockius 4,306 1,681
9 14 Andrews Kurth Kenyon (Pre-Merger) 4,200 6,475
10 N/A Hunton Andrews Kurth 4,000 N/A
11 13 Shearman & Sterling 3,505 6,798
12 N/A Paul Hastings 3,400 N/A
13 3 Latham & Watkins 3,243 18,390
14 10 Norton Rose Fulbright 2,796 9,997
15 17 White & Case 2,780 5,895
16 5 McCarthy Tétrault 2,650 14,094
17 4 Paul Weiss Rifkind Wharton & Garrison 2,500 18,110
18 N/A Brownstein Hyatt Farber Schreck 2,415 N/A
19 25 Davis Polk & Wardwell 2,006 2,548
20 1 Milbank Tweed Hadley & McCloy 1,765 22,623
Value (USDm)
/15ijglobal.com
Download the data
North America Infrastructure FinanceLeague Tables H1 2018
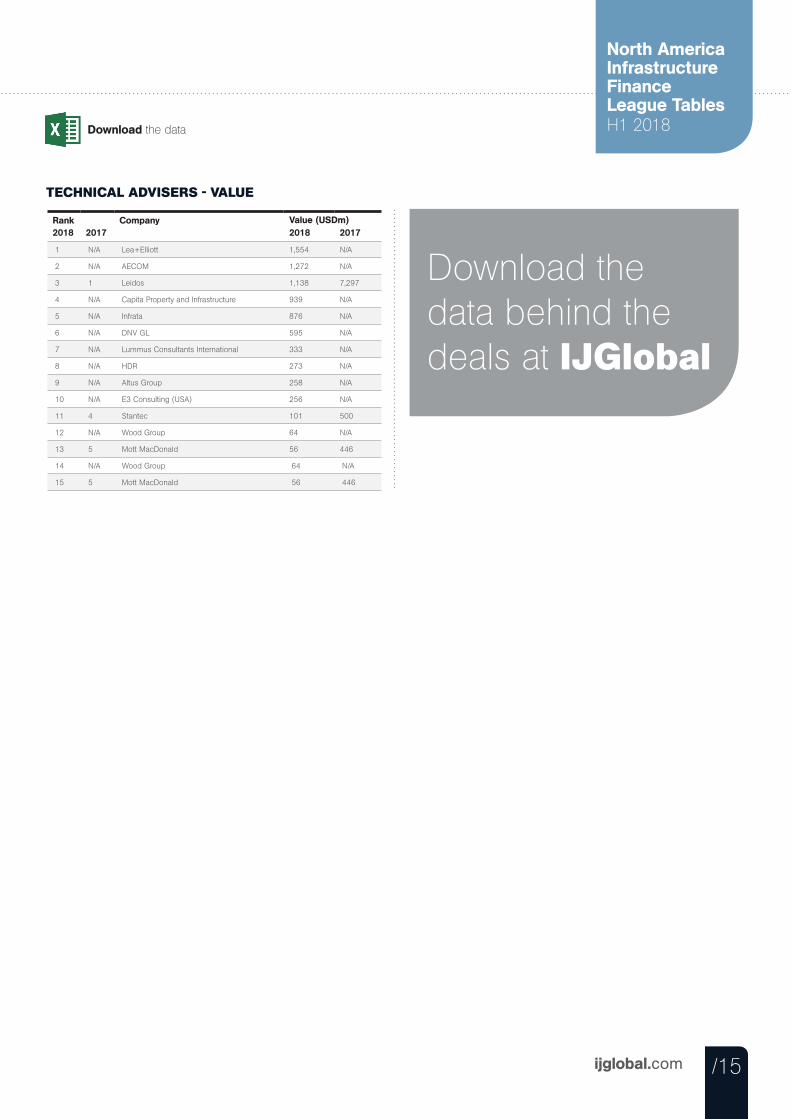
TECHNICAL ADVISERS - VALUE
Rank2018 2017
Company2018 2017
1 N/A Lea+Elliott 1,554 N/A
2 N/A AECOM 1,272 N/A
3 1 Leidos 1,138 7,297
4 N/A Capita Property and Infrastructure 939 N/A
5 N/A Infrata 876 N/A
6 N/A DNV GL 595 N/A
7 N/A Lummus Consultants International 333 N/A
8 N/A HDR 273 N/A
9 N/A Altus Group 258 N/A
10 N/A E3 Consulting (USA) 256 N/A
11 4 Stantec 101 500
12 N/A Wood Group 64 N/A
13 5 Mott MacDonald 56 446
14 N/A Wood Group 64 N/A
15 5 Mott MacDonald 56 446
Value (USDm)
Download the data behind the deals at IJGlobal
/16 ijglobal.com
Asia Pacific Infrastructure Finance H1 2018Project, corporate and non-commercial finance
Asia PacificASIA PACIFIC TOP 5 DEALS H1 2018
Rank Deal Name Location Sector Value ($m) Close Date
1 Refinery and Petrochemical Integrated Development (RAPID) Bridge Financing Malaysia Oil & Gas 8,000 19/03/2018
2 Jakarta-Bandung High Speed Rail Line (142KM) PPP Indonesia Transport 6,000 27/04/2018
3 Acquisition of 51.11% Stake in Hindustan Petroleum India Oil & Gas 4,294 31/01/2018
4 Acquisition of Equis Energy Singapore Renewables 3,720 19/01/2018
5 KazMunayGas Refinancing Bond Facility 2018 Kazakhstan Oil & Gas 3,250 24/04/2018
ASIA PACIFIC INFRASTRUCTURE FINANCE VALUE BY SOURCE OF FUNDING H1 2016 - H1 2018
$m
Bank loans DFI loans Bonds Equity Source: IJGlobal Count
0
20
40
60
80
100
120
140
160
0
10,000
20,000
30,000
40,000
50,000
60,000
70,000
80,000
H1 2016 H2 2016 H1 2017 H2 2017 H1 2018
Count
ASIA PACIFIC INFRASTRUCTURE FINANCE H1 2016 - H1 2018
$m Count
Value ($m) Count Source: IJGlobal
0
50
100
150
200
0
20,000
40,000
60,000
80,000
100,000
120,000
H1 2016 H2 2016 H1 2017 H2 2017 H1 2018
/17ijglobal.com
Asia Pacific Infrastructure FinanceLeague Tables H1 2018
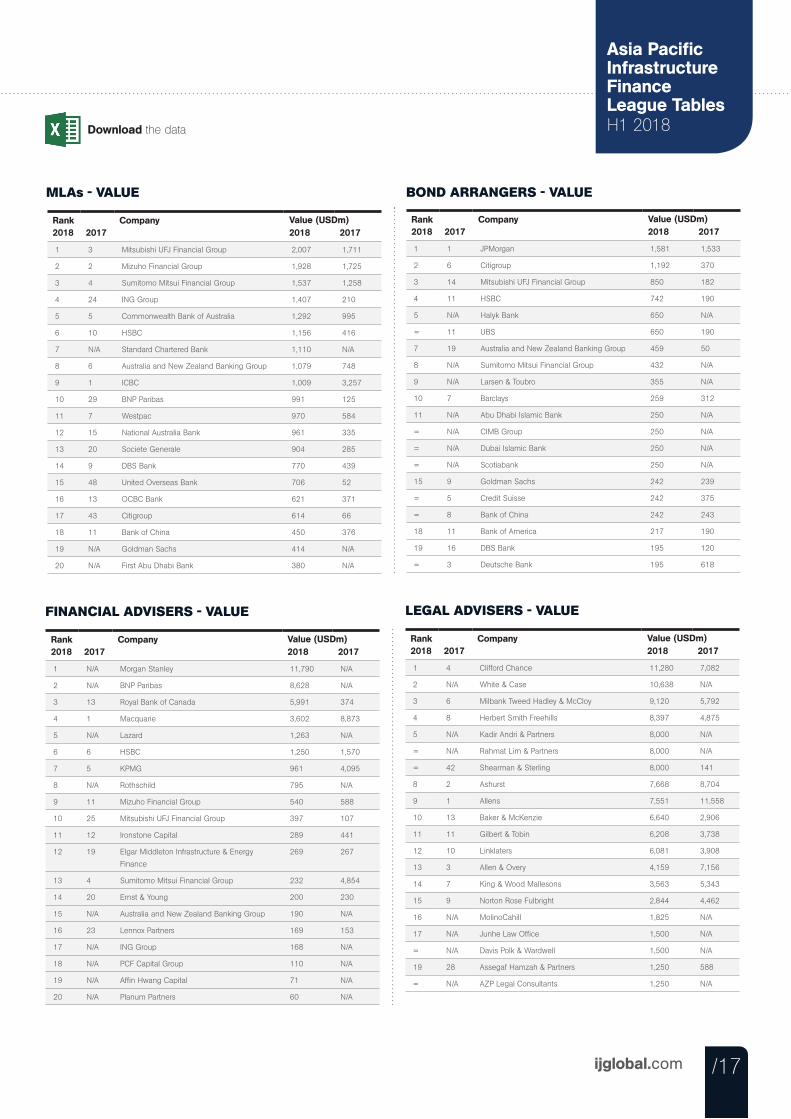
MLAs - VALUE
Rank2018 2017
Company2018 2017
1 3 Mitsubishi UFJ Financial Group 2,007 1,711
2 2 Mizuho Financial Group 1,928 1,725
3 4 Sumitomo Mitsui Financial Group 1,537 1,258
4 24 ING Group 1,407 210
5 5 Commonwealth Bank of Australia 1,292 995
6 10 HSBC 1,156 416
7 N/A Standard Chartered Bank 1,110 N/A
8 6 Australia and New Zealand Banking Group 1,079 748
9 1 ICBC 1,009 3,257
10 29 BNP Paribas 991 125
11 7 Westpac 970 584
12 15 National Australia Bank 961 335
13 20 Societe Generale 904 285
14 9 DBS Bank 770 439
15 48 United Overseas Bank 706 52
16 13 OCBC Bank 621 371
17 43 Citigroup 614 66
18 11 Bank of China 450 376
19 N/A Goldman Sachs 414 N/A
20 N/A First Abu Dhabi Bank 380 N/A
Value (USDm)
BOND ARRANGERS - VALUE
Rank2018 2017
Company2018 2017
1 1 JPMorgan 1,581 1,533
2 6 Citigroup 1,192 370
3 14 Mitsubishi UFJ Financial Group 850 182
4 11 HSBC 742 190
5 N/A Halyk Bank 650 N/A
= 11 UBS 650 190
7 19 Australia and New Zealand Banking Group 459 50
8 N/A Sumitomo Mitsui Financial Group 432 N/A
9 N/A Larsen & Toubro 355 N/A
10 7 Barclays 259 312
11 N/A Abu Dhabi Islamic Bank 250 N/A
= N/A CIMB Group 250 N/A
= N/A Dubai Islamic Bank 250 N/A
= N/A Scotiabank 250 N/A
15 9 Goldman Sachs 242 239
= 5 Credit Suisse 242 375
= 8 Bank of China 242 243
18 11 Bank of America 217 190
19 16 DBS Bank 195 120
= 3 Deutsche Bank 195 618
Value (USDm)
FINANCIAL ADVISERS - VALUE
Rank2018 2017
Company2018 2017
1 N/A Morgan Stanley 11,790 N/A
2 N/A BNP Paribas 8,628 N/A
3 13 Royal Bank of Canada 5,991 374
4 1 Macquarie 3,602 8,873
5 N/A Lazard 1,263 N/A
6 6 HSBC 1,250 1,570
7 5 KPMG 961 4,095
8 N/A Rothschild 795 N/A
9 11 Mizuho Financial Group 540 588
10 25 Mitsubishi UFJ Financial Group 397 107
11 12 Ironstone Capital 289 441
12 19 Elgar Middleton Infrastructure & Energy
Finance
269 267
13 4 Sumitomo Mitsui Financial Group 232 4,854
14 20 Ernst & Young 200 230
15 N/A Australia and New Zealand Banking Group 190 N/A
16 23 Lennox Partners 169 153
17 N/A ING Group 168 N/A
18 N/A PCF Capital Group 110 N/A
19 N/A Affin Hwang Capital 71 N/A
20 N/A Planum Partners 60 N/A
Value (USDm)
LEGAL ADVISERS - VALUE
Rank2018 2017
Company2018 2017
1 4 Clifford Chance 11,280 7,082
2 N/A White & Case 10,638 N/A
3 6 Milbank Tweed Hadley & McCloy 9,120 5,792
4 8 Herbert Smith Freehills 8,397 4,875
5 N/A Kadir Andri & Partners 8,000 N/A
= N/A Rahmat Lim & Partners 8,000 N/A
= 42 Shearman & Sterling 8,000 141
8 2 Ashurst 7,668 8,704
9 1 Allens 7,551 11,558
10 13 Baker & McKenzie 6,640 2,906
11 11 Gilbert & Tobin 6,208 3,738
12 10 Linklaters 6,081 3,908
13 3 Allen & Overy 4,159 7,156
14 7 King & Wood Mallesons 3,563 5,343
15 9 Norton Rose Fulbright 2,844 4,462
16 N/A MolinoCahill 1,825 N/A
17 N/A Junhe Law Office 1,500 N/A
= N/A Davis Polk & Wardwell 1,500 N/A
19 28 Assegaf Hamzah & Partners 1,250 588
= N/A AZP Legal Consultants 1,250 N/A
Value (USDm)
Download the data
/18 ijglobal.com
Download the data
Asia Pacific Infrastructure Finance H1 2018Project, corporate and non-commercial finance
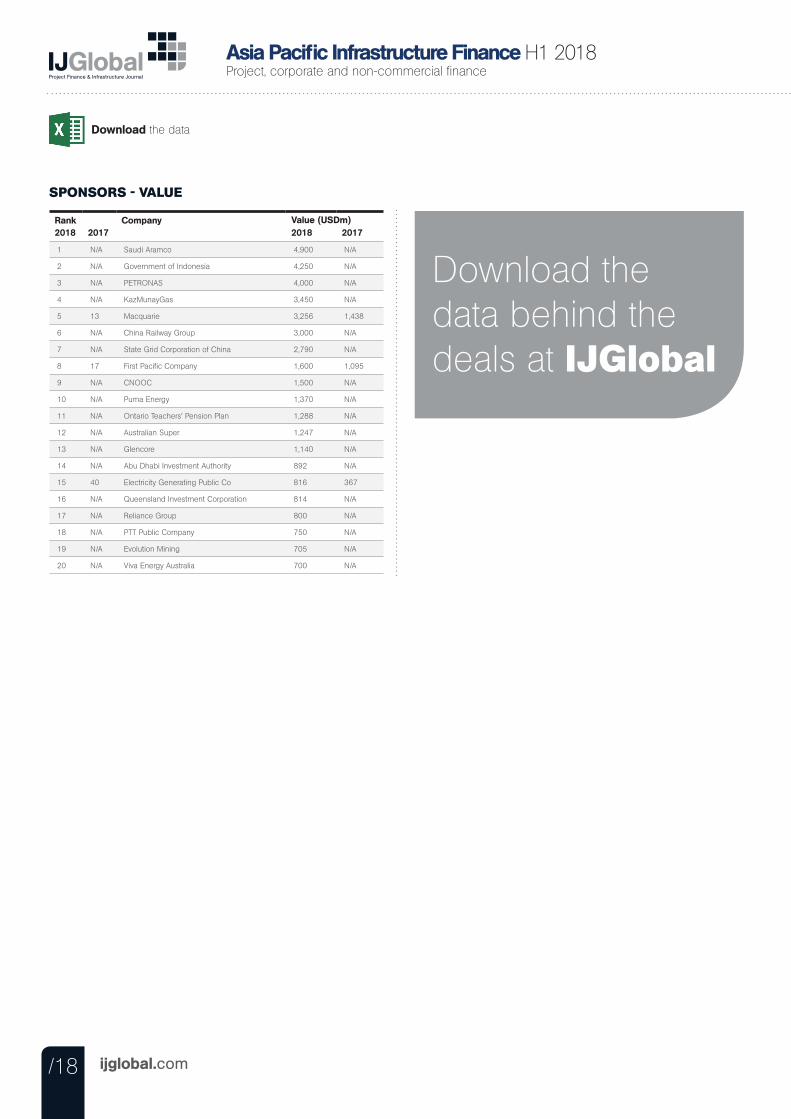
SPONSORS - VALUE
Rank2018 2017
Company2018 2017
1 N/A Saudi Aramco 4,900 N/A
2 N/A Government of Indonesia 4,250 N/A
3 N/A PETRONAS 4,000 N/A
4 N/A KazMunayGas 3,450 N/A
5 13 Macquarie 3,256 1,438
6 N/A China Railway Group 3,000 N/A
7 N/A State Grid Corporation of China 2,790 N/A
8 17 First Pacific Company 1,600 1,095
9 N/A CNOOC 1,500 N/A
10 N/A Puma Energy 1,370 N/A
11 N/A Ontario Teachers' Pension Plan 1,288 N/A
12 N/A Australian Super 1,247 N/A
13 N/A Glencore 1,140 N/A
14 N/A Abu Dhabi Investment Authority 892 N/A
15 40 Electricity Generating Public Co 816 367
16 N/A Queensland Investment Corporation 814 N/A
17 N/A Reliance Group 800 N/A
18 N/A PTT Public Company 750 N/A
19 N/A Evolution Mining 705 N/A
20 N/A Viva Energy Australia 700 N/A
Value (USDm)
Download the data behind the deals at IJGlobal
/19ijglobal.com
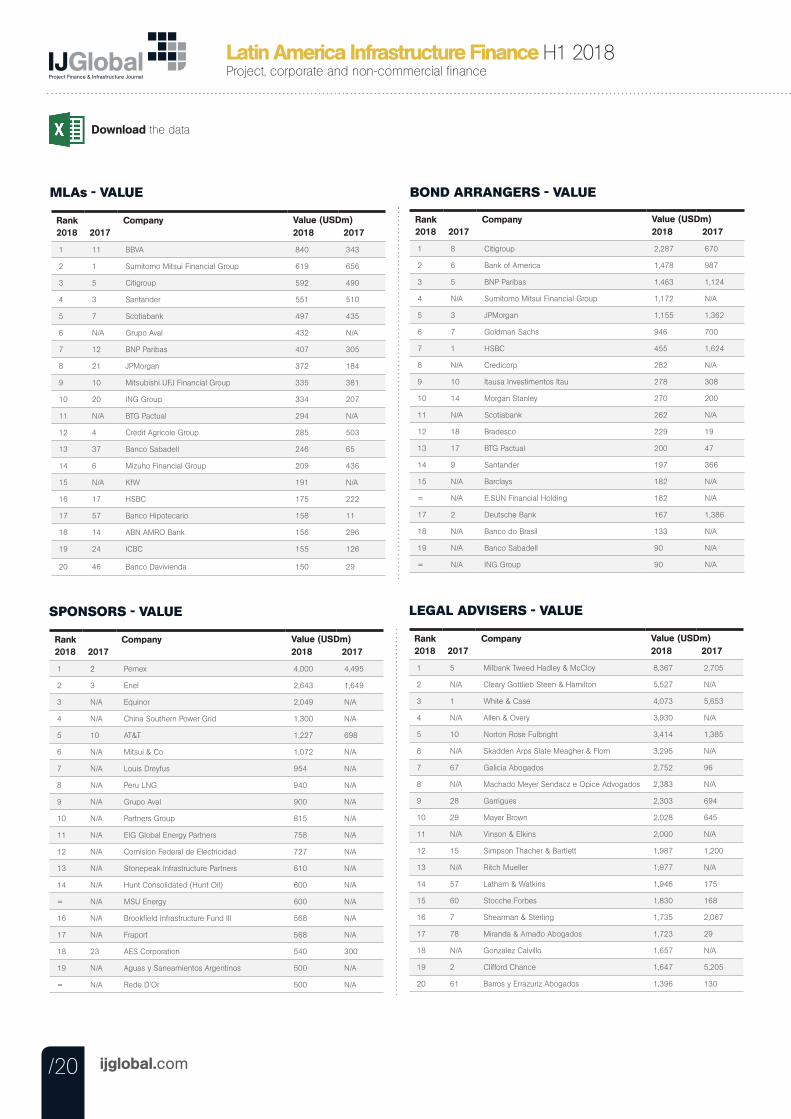
Latin America Infrastructure FinanceLeague Tables H1 2018Latin America
LATIN AMERICA TOP 5 DEALS H1 2018
Rank Deal Name Location Sector Value ($m) Close Date
1 Pemex Bond Facility Mexico Oil & Gas 4,000 23/03/2018
2 Acquisition of a 25% Stake in Roncador Oil Field Brazil Oil & Gas 2,000 15/06/2018
3 Porto de Sergipe I CCGT Power Plant (1.5GW) Brazil Power 1,830 19/04/2018
4 Acquisition of 73.4% in Eletropaulo Brazil Power 1,493 14/06/2018
5 Acquisition of InterGen Mexican Portfolio (2.2GW) Mexico Oil & Gas, Renewables, Power 1,357 20/04/2018
LATIN AMERICA INFRASTRUCTURE FINANCE VALUE BY SOURCE OF FUNDING H1 2016 - H1 2018
Bank loans DFI loans Bonds Equity Source: IJGlobal Count
0
20
40
60
80
100
120
0
5,000
10,000
15,000
20,000
25,000
30,000
35,000
40,000
45,000
H1 2016 H2 2016 H1 2017 H2 2017 H1 2018
$m Count
LATIN AMERICA INFRASTRUCTURE FINANCE H1 2016 - H1 2018
$m Count
Value ($m) Count Source: IJGlobal
0
20
40
60
80
100
120
0
10,000
20,000
30,000
40,000
50,000
H1 2016 H2 2016 H1 2017 H2 2017 H1 2018
/20 ijglobal.com
Download the data
Latin America Infrastructure Finance H1 2018Project, corporate and non-commercial finance
MLAs - VALUE
Rank2018 2017
Company2018 2017
1 11 BBVA 840 343
2 1 Sumitomo Mitsui Financial Group 619 656
3 5 Citigroup 592 490
4 3 Santander 551 510
5 7 Scotiabank 497 435
6 N/A Grupo Aval 432 N/A
7 12 BNP Paribas 407 305
8 21 JPMorgan 372 184
9 10 Mitsubishi UFJ Financial Group 335 381
10 20 ING Group 334 207
11 N/A BTG Pactual 294 N/A
12 4 Credit Agricole Group 285 503
13 37 Banco Sabadell 246 65
14 6 Mizuho Financial Group 209 436
15 N/A KfW 191 N/A
16 17 HSBC 175 222
17 57 Banco Hipotecario 158 11
18 14 ABN AMRO Bank 156 296
19 24 ICBC 155 126
20 46 Banco Davivienda 150 29
Value (USDm)
BOND ARRANGERS - VALUE
Rank2018 2017
Company2018 2017
1 8 Citigroup 2,287 670
2 6 Bank of America 1,478 987
3 5 BNP Paribas 1,463 1,124
4 N/A Sumitomo Mitsui Financial Group 1,172 N/A
5 3 JPMorgan 1,155 1,362
6 7 Goldman Sachs 946 700
7 1 HSBC 455 1,624
8 N/A Credicorp 282 N/A
9 10 Itausa Investimentos Itau 278 308
10 14 Morgan Stanley 270 200
11 N/A Scotiabank 262 N/A
12 18 Bradesco 229 19
13 17 BTG Pactual 200 47
14 9 Santander 197 366
15 N/A Barclays 182 N/A
= N/A E.SUN Financial Holding 182 N/A
17 2 Deutsche Bank 167 1,386
18 N/A Banco do Brasil 133 N/A
19 N/A Banco Sabadell 90 N/A
= N/A ING Group 90 N/A
Value (USDm)
SPONSORS - VALUE
Rank2018 2017
Company2018 2017
1 2 Pemex 4,000 4,495
2 3 Enel 2,643 1,649
3 N/A Equinor 2,049 N/A
4 N/A China Southern Power Grid 1,300 N/A
5 10 AT&T 1,227 698
6 N/A Mitsui & Co 1,072 N/A
7 N/A Louis Dreyfus 954 N/A
8 N/A Peru LNG 940 N/A
9 N/A Grupo Aval 900 N/A
10 N/A Partners Group 815 N/A
11 N/A EIG Global Energy Partners 758 N/A
12 N/A Comision Federal de Electricidad 727 N/A
13 N/A Stonepeak Infrastructure Partners 610 N/A
14 N/A Hunt Consolidated (Hunt Oil) 600 N/A
= N/A MSU Energy 600 N/A
16 N/A Brookfield Infrastructure Fund III 568 N/A
17 N/A Fraport 568 N/A
18 23 AES Corporation 540 300
19 N/A Aguas y Saneamientos Argentinos 500 N/A
= N/A Rede D’Or 500 N/A
Value (USDm)
LEGAL ADVISERS - VALUE
Rank2018 2017
Company2018 2017
1 5 Milbank Tweed Hadley & McCloy 8,367 2,705
2 N/A Cleary Gottlieb Steen & Hamilton 5,527 N/A
3 1 White & Case 4,073 5,653
4 N/A Allen & Overy 3,930 N/A
5 10 Norton Rose Fulbright 3,414 1,385
6 N/A Skadden Arps Slate Meagher & Flom 3,295 N/A
7 67 Galicia Abogados 2,752 96
8 N/A Machado Meyer Sendacz e Opice Advogados 2,383 N/A
9 28 Garrigues 2,303 694
10 29 Mayer Brown 2,028 645
11 N/A Vinson & Elkins 2,000 N/A
12 15 Simpson Thacher & Bartlett 1,987 1,200
13 N/A Ritch Mueller 1,977 N/A
14 57 Latham & Watkins 1,946 175
15 60 Stocche Forbes 1,830 168
16 7 Shearman & Sterling 1,735 2,067
17 78 Miranda & Amado Abogados 1,723 29
18 N/A Gonzalez Calvillo 1,657 N/A
19 2 Clifford Chance 1,647 5,205
20 61 Barros y Errazuriz Abogados 1,396 130
Value (USDm)
/21ijglobal.com
Latin America Infrastructure FinanceLeague Tables H1 2018Download the data
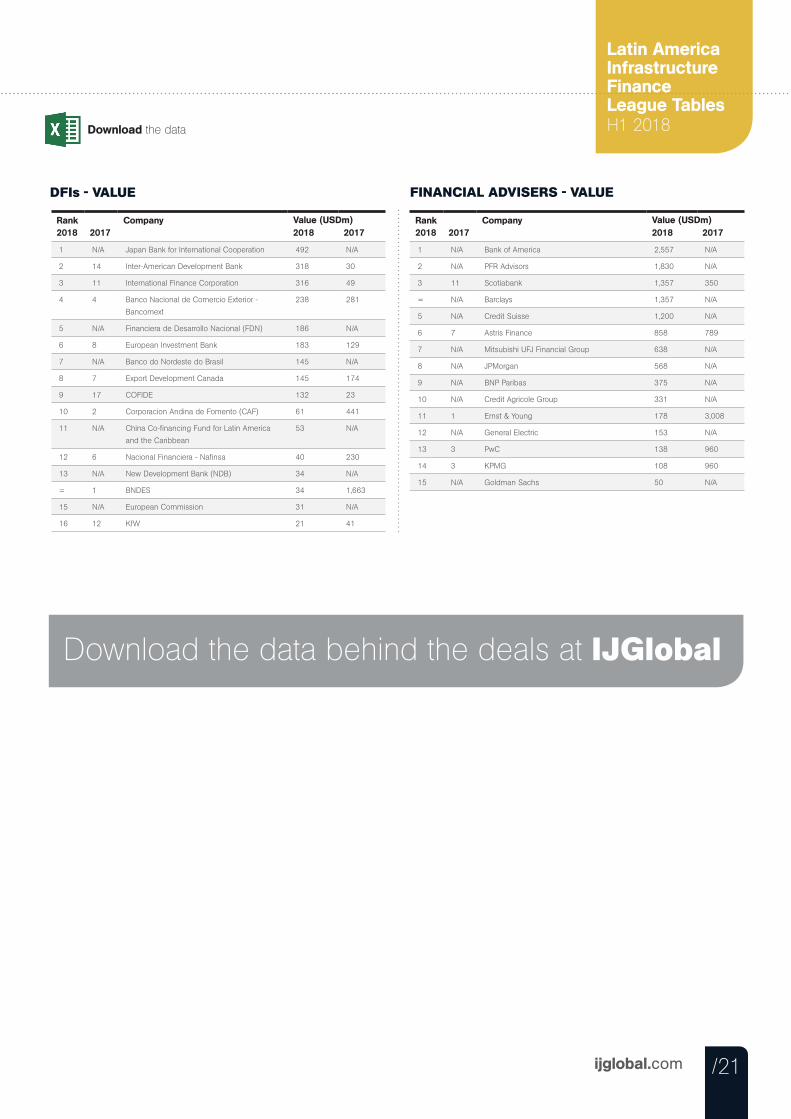
DFIs - VALUE
Rank2018 2017
Company2018 2017
1 N/A Japan Bank for International Cooperation 492 N/A
2 14 Inter-American Development Bank 318 30
3 11 International Finance Corporation 316 49
4 4 Banco Nacional de Comercio Exterior -
Bancomext
238 281
5 N/A Financiera de Desarrollo Nacional (FDN) 186 N/A
6 8 European Investment Bank 183 129
7 N/A Banco do Nordeste do Brasil 145 N/A
8 7 Export Development Canada 145 174
9 17 COFIDE 132 23
10 2 Corporacion Andina de Fomento (CAF) 61 441
11 N/A China Co-financing Fund for Latin America
and the Caribbean
53 N/A
12 6 Nacional Financiera - Nafinsa 40 230
13 N/A New Development Bank (NDB) 34 N/A
= 1 BNDES 34 1,663
15 N/A European Commission 31 N/A
16 12 KfW 21 41
Value (USDm)
FINANCIAL ADVISERS - VALUE
Rank2018 2017
Company2018 2017
1 N/A Bank of America 2,557 N/A
2 N/A PFR Advisors 1,830 N/A
3 11 Scotiabank 1,357 350
= N/A Barclays 1,357 N/A
5 N/A Credit Suisse 1,200 N/A
6 7 Astris Finance 858 789
7 N/A Mitsubishi UFJ Financial Group 638 N/A
8 N/A JPMorgan 568 N/A
9 N/A BNP Paribas 375 N/A
10 N/A Credit Agricole Group 331 N/A
11 1 Ernst & Young 178 3,008
12 N/A General Electric 153 N/A
13 3 PwC 138 960
14 3 KPMG 108 960
15 N/A Goldman Sachs 50 N/A
Value (USDm)
Download the data behind the deals at IJGlobal
/22 ijglobal.com
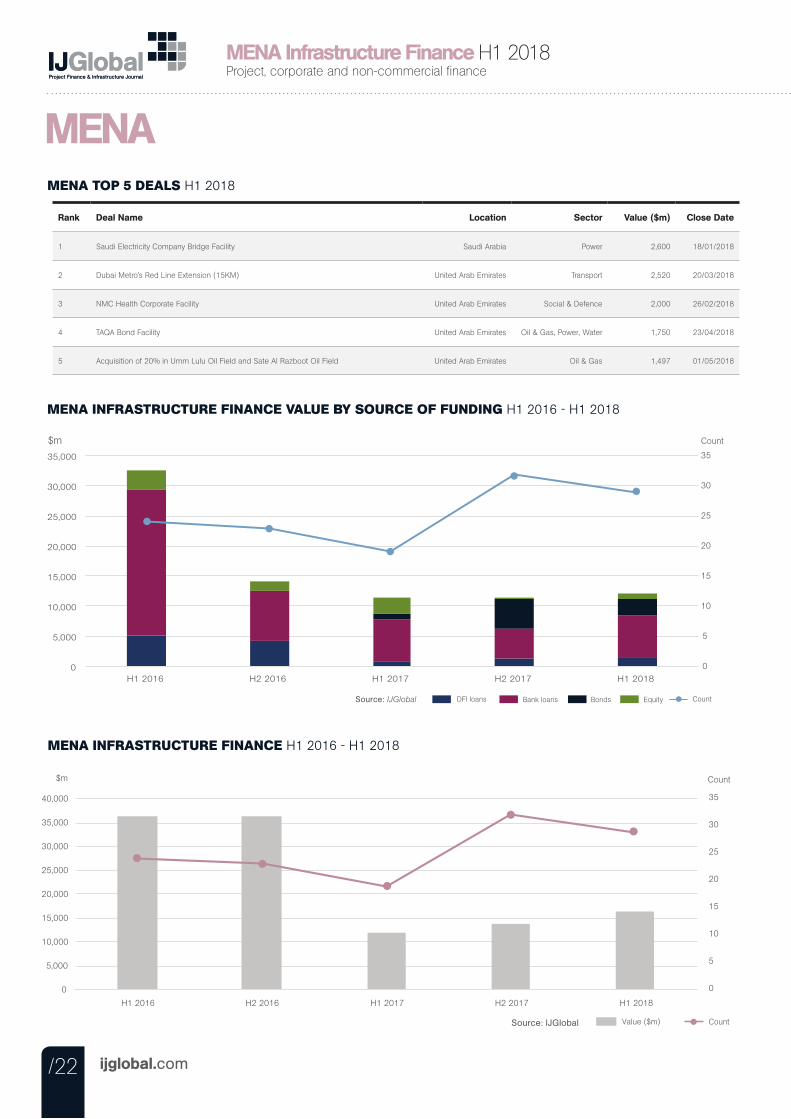
MENA Infrastructure Finance H1 2018Project, corporate and non-commercial finance
MENAMENA TOP 5 DEALS H1 2018
Rank Deal Name Location Sector Value ($m) Close Date
1 Saudi Electricity Company Bridge Facility Saudi Arabia Power 2,600 18/01/2018
2 Dubai Metro’s Red Line Extension (15KM) United Arab Emirates Transport 2,520 20/03/2018
3 NMC Health Corporate Facility United Arab Emirates Social & Defence 2,000 26/02/2018
4 TAQA Bond Facility United Arab Emirates Oil & Gas, Power, Water 1,750 23/04/2018
5 Acquisition of 20% in Umm Lulu Oil Field and Sate Al Razboot Oil Field United Arab Emirates Oil & Gas 1,497 01/05/2018
MENA INFRASTRUCTURE FINANCE VALUE BY SOURCE OF FUNDING H1 2016 - H1 2018
Bank loans DFI loans Bonds Equity Source: IJGlobal Count
0
5
10
15
20
25
30
35
0
5,000
10,000
15,000
20,000
25,000
30,000
35,000
H1 2016 H2 2016 H1 2017 H2 2017 H1 2018
$m Count
MENA INFRASTRUCTURE FINANCE H1 2016 - H1 2018
$m Count
Value ($m) Count Source: IJGlobal
0
5
10
15
20
25
30
35
0
5,000
10,000
15,000
20,000
25,000
30,000
35,000
40,000
H1 2016 H2 2016 H1 2017 H2 2017 H1 2018
Download the data
/23ijglobal.com
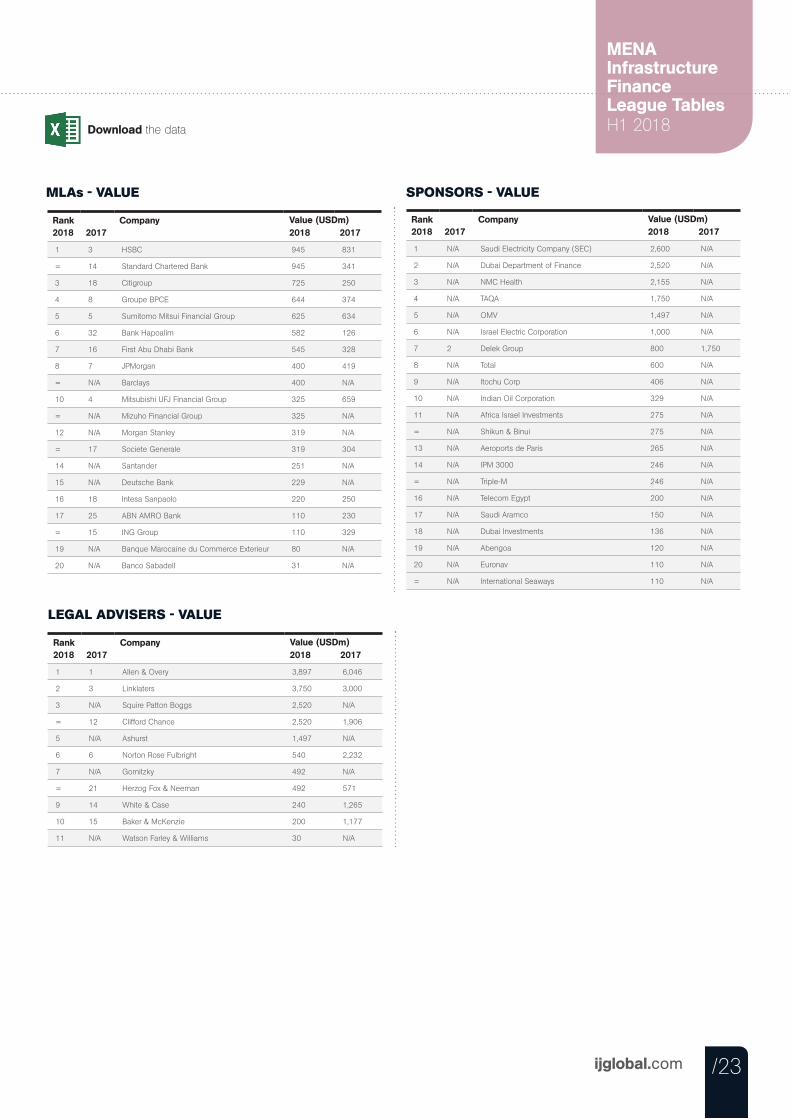
MENA Infrastructure FinanceLeague Tables H1 2018
MLAs - VALUE
Rank2018 2017
Company2018 2017
1 3 HSBC 945 831
= 14 Standard Chartered Bank 945 341
3 18 Citigroup 725 250
4 8 Groupe BPCE 644 374
5 5 Sumitomo Mitsui Financial Group 625 634
6 32 Bank Hapoalim 582 126
7 16 First Abu Dhabi Bank 545 328
8 7 JPMorgan 400 419
= N/A Barclays 400 N/A
10 4 Mitsubishi UFJ Financial Group 325 659
= N/A Mizuho Financial Group 325 N/A
12 N/A Morgan Stanley 319 N/A
= 17 Societe Generale 319 304
14 N/A Santander 251 N/A
15 N/A Deutsche Bank 229 N/A
16 18 Intesa Sanpaolo 220 250
17 25 ABN AMRO Bank 110 230
= 15 ING Group 110 329
19 N/A Banque Marocaine du Commerce Exterieur 80 N/A
20 N/A Banco Sabadell 31 N/A
Value (USDm)
SPONSORS - VALUE
Rank2018 2017
Company2018 2017
1 N/A Saudi Electricity Company (SEC) 2,600 N/A
2 N/A Dubai Department of Finance 2,520 N/A
3 N/A NMC Health 2,155 N/A
4 N/A TAQA 1,750 N/A
5 N/A OMV 1,497 N/A
6 N/A Israel Electric Corporation 1,000 N/A
7 2 Delek Group 800 1,750
8 N/A Total 600 N/A
9 N/A Itochu Corp 406 N/A
10 N/A Indian Oil Corporation 329 N/A
11 N/A Africa Israel Investments 275 N/A
= N/A Shikun & Binui 275 N/A
13 N/A Aeroports de Paris 265 N/A
14 N/A IPM 3000 246 N/A
= N/A Triple-M 246 N/A
16 N/A Telecom Egypt 200 N/A
17 N/A Saudi Aramco 150 N/A
18 N/A Dubai Investments 136 N/A
19 N/A Abengoa 120 N/A
20 N/A Euronav 110 N/A
= N/A International Seaways 110 N/A
Value (USDm)
LEGAL ADVISERS - VALUE
Rank2018 2017
Company2018 2017
1 1 Allen & Overy 3,897 6,046
2 3 Linklaters 3,750 3,000
3 N/A Squire Patton Boggs 2,520 N/A
= 12 Clifford Chance 2,520 1,906
5 N/A Ashurst 1,497 N/A
6 6 Norton Rose Fulbright 540 2,232
7 N/A Gornitzky 492 N/A
= 21 Herzog Fox & Neeman 492 571
9 14 White & Case 240 1,265
10 15 Baker & McKenzie 200 1,177
11 N/A Watson Farley & Williams 30 N/A
Value (USDm)
/24ijglobal.com
Sub-Saharan Infrastructure FinanceLeague Tables H1 2018Sub-Saharan Africa
SUB-SAHARAN TOP 5 DEALS H1 2018
Rank Deal Name Location Sector Value ($m) Close Date
1 Nacala Railway Corridor (912KM) Refinancing Malawi, Mozambique Transport 2,730 23/02/2018
2 Acquisition of Hilli Episeyo FLNG Production Vessel Cameroon Oil & Gas 1,200 20/06/2018
3 Hwange Coal-Fired Power Plant Expansion (690MW) Zimbabwe Power 998 12/06/2018
4 Kangnas Wind Farm (140MW) and Perdekraal East Wind Farm (110MW) South Africa Renewables 525 05/06/2018
5 Scatec Solar South African Solar PV Portfolio (258MW) South Africa Renewables 398 12/04/2018
SUB-SAHARAN INFRASTRUCTURE FINANCE VALUE BY SOURCE OF FUNDING H1 2016 - H1 2018
23
23.5
24
24.5
25
25.5
26
26.5
0
5,000
10,000
15,000
20,000
25,000
H1 2016 H2 2016 H1 2017 H2 2017 H1 2018
Bank loans DFI loans Bonds Equity Source: IJGlobal Count
$m Count
SUB-SAHARAN INFRASTRUCTURE FINANCE H1 2016 - H1 2018
$m Count
Value (US$m) Count Source: IJGlobal
23
24
25
26
27
0
5,000
10,000
15,000
20,000
25,000
H1 2016 H2 2016 H1 2017 H2 2017 H1 2018
/25 ijglobal.com
Sub-Saharan Africa Infrastructure Finance H1 2018Project, corporate and non-commercial finance
Download the data
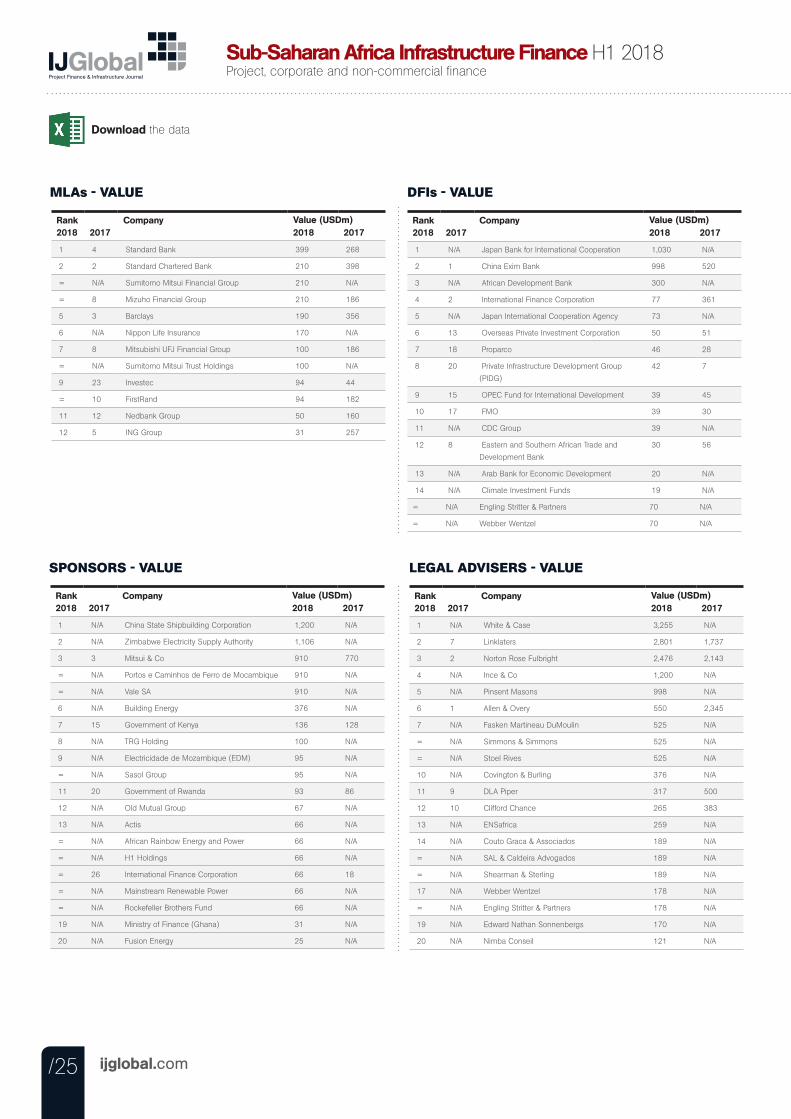
MLAs - VALUE
Rank2018 2017
Company2018 2017
1 4 Standard Bank 399 268
2 2 Standard Chartered Bank 210 398
= N/A Sumitomo Mitsui Financial Group 210 N/A
= 8 Mizuho Financial Group 210 186
5 3 Barclays 190 356
6 N/A Nippon Life Insurance 170 N/A
7 8 Mitsubishi UFJ Financial Group 100 186
= N/A Sumitomo Mitsui Trust Holdings 100 N/A
9 23 Investec 94 44
= 10 FirstRand 94 182
11 12 Nedbank Group 50 160
12 5 ING Group 31 257
Value (USDm)
DFIs - VALUE
Rank2018 2017
Company2018 2017
1 N/A Japan Bank for International Cooperation 1,030 N/A
2 1 China Exim Bank 998 520
3 N/A African Development Bank 300 N/A
4 2 International Finance Corporation 77 361
5 N/A Japan International Cooperation Agency 73 N/A
6 13 Overseas Private Investment Corporation 50 51
7 18 Proparco 46 28
8 20 Private Infrastructure Development Group
(PIDG)
42 7
9 15 OPEC Fund for International Development 39 45
10 17 FMO 39 30
11 N/A CDC Group 39 N/A
12 8 Eastern and Southern African Trade and
Development Bank
30 56
13 N/A Arab Bank for Economic Development 20 N/A
14 N/A Climate Investment Funds 19 N/A
= N/A Engling Stritter & Partners 70 N/A
= N/A Webber Wentzel 70 N/A
Value (USDm)
SPONSORS - VALUE
Rank2018 2017
Company2018 2017
1 N/A China State Shipbuilding Corporation 1,200 N/A
2 N/A Zimbabwe Electricity Supply Authority 1,106 N/A
3 3 Mitsui & Co 910 770
= N/A Portos e Caminhos de Ferro de Mocambique 910 N/A
= N/A Vale SA 910 N/A
6 N/A Building Energy 376 N/A
7 15 Government of Kenya 136 128
8 N/A TRG Holding 100 N/A
9 N/A Electricidade de Mozambique (EDM) 95 N/A
= N/A Sasol Group 95 N/A
11 20 Government of Rwanda 93 86
12 N/A Old Mutual Group 67 N/A
13 N/A Actis 66 N/A
= N/A African Rainbow Energy and Power 66 N/A
= N/A H1 Holdings 66 N/A
= 26 International Finance Corporation 66 18
= N/A Mainstream Renewable Power 66 N/A
= N/A Rockefeller Brothers Fund 66 N/A
19 N/A Ministry of Finance (Ghana) 31 N/A
20 N/A Fusion Energy 25 N/A
Value (USDm)
LEGAL ADVISERS - VALUE
Rank2018 2017
Company2018 2017
1 N/A White & Case 3,255 N/A
2 7 Linklaters 2,801 1,737
3 2 Norton Rose Fulbright 2,476 2,143
4 N/A Ince & Co 1,200 N/A
5 N/A Pinsent Masons 998 N/A
6 1 Allen & Overy 550 2,345
7 N/A Fasken Martineau DuMoulin 525 N/A
= N/A Simmons & Simmons 525 N/A
= N/A Stoel Rives 525 N/A
10 N/A Covington & Burling 376 N/A
11 9 DLA Piper 317 500
12 10 Clifford Chance 265 383
13 N/A ENSafrica 259 N/A
14 N/A Couto Graca & Associados 189 N/A
= N/A SAL & Caldeira Advogados 189 N/A
= N/A Shearman & Sterling 189 N/A
17 N/A Webber Wentzel 178 N/A
= N/A Engling Stritter & Partners 178 N/A
19 N/A Edward Nathan Sonnenbergs 170 N/A
20 N/A Nimba Conseil 121 N/A
Value (USDm)
/26 ijglobal.com
Renewables Infrastructure Finance H1 2018
/26
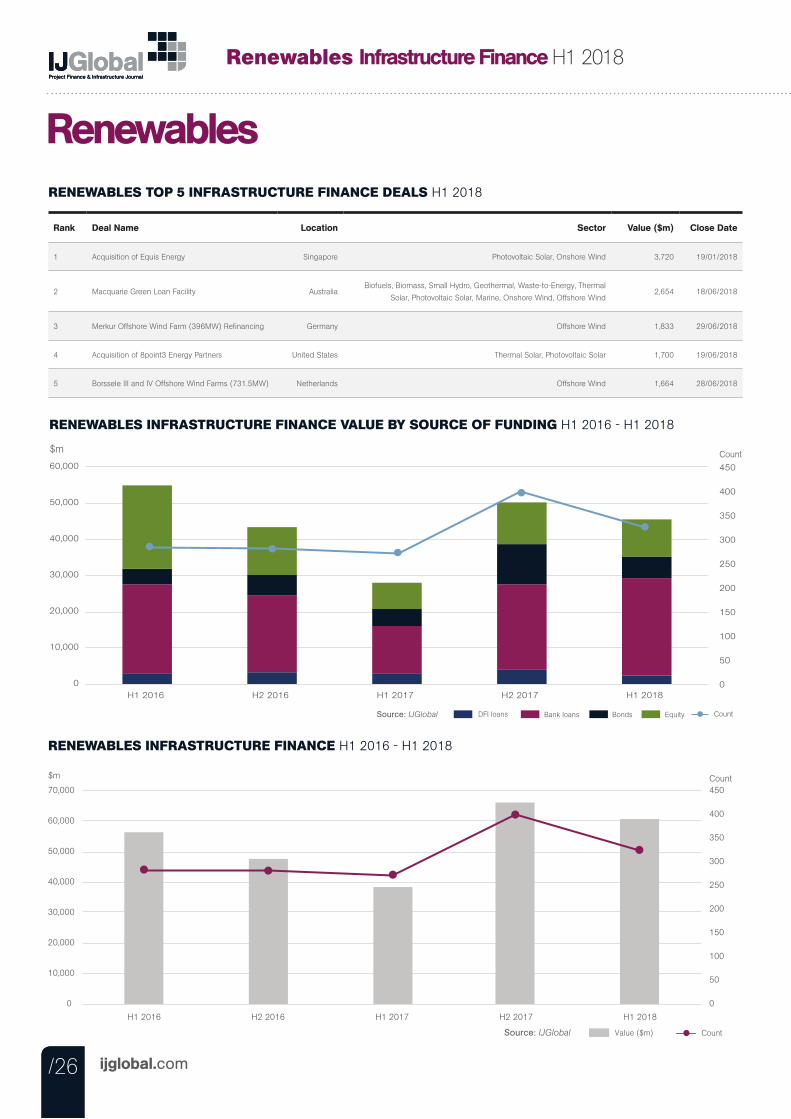
RENEWABLES INFRASTRUCTURE FINANCE VALUE BY SOURCE OF FUNDING H1 2016 - H1 2018
$m
Bank loans DFI loans Bonds Equity Source: IJGlobal Count
0
50
100
150
200
250
300
350
400
450
0
10,000
20,000
30,000
40,000
50,000
60,000
H1 2016 H2 2016 H1 2017 H2 2017 H1 2018
Count
RENEWABLES INFRASTRUCTURE FINANCE H1 2016 - H1 2018
0
50
100
150
200
250
300
350
400
450
0
10,000
20,000
30,000
40,000
50,000
60,000
70,000
H1 2016 H2 2016 H1 2017 H2 2017 H1 2018
Value ($m) Count Source: IJGlobal
$m Count
RENEWABLES TOP 5 INFRASTRUCTURE FINANCE DEALS H1 2018
Renewables
Rank Deal Name Location Sector Value ($m) Close Date
1 Acquisition of Equis Energy Singapore Photovoltaic Solar, Onshore Wind 3,720 19/01/2018
2 Macquarie Green Loan Facility AustraliaBiofuels, Biomass, Small Hydro, Geothermal, Waste-to-Energy, Thermal
Solar, Photovoltaic Solar, Marine, Onshore Wind, Offshore Wind 2,654 18/06/2018
3 Merkur Offshore Wind Farm (396MW) Refinancing Germany Offshore Wind 1,833 29/06/2018
4 Acquisition of 8point3 Energy Partners United States Thermal Solar, Photovoltaic Solar 1,700 19/06/2018
5 Borssele III and IV Offshore Wind Farms (731.5MW) Netherlands Offshore Wind 1,664 28/06/2018
Download the data
/27ijglobal.com
Renewables Infrastructure FinanceLeague Tables H1 2018
/27
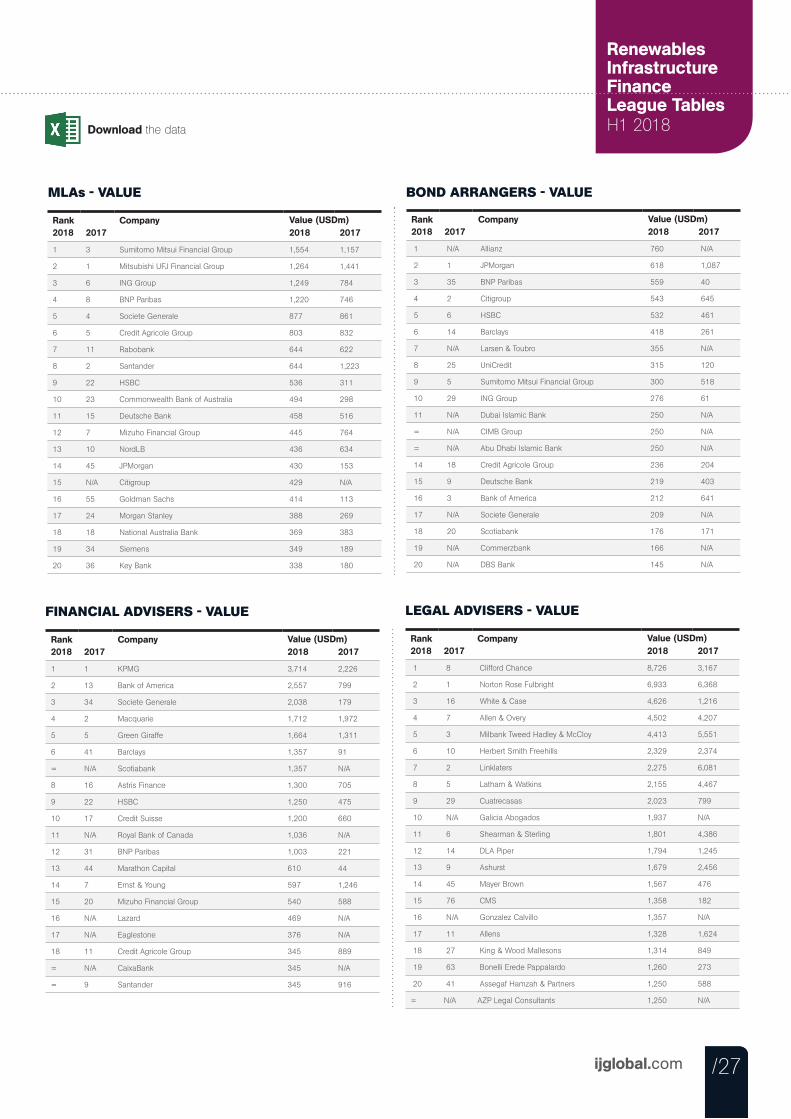
MLAs - VALUE
Rank2018 2017
Company2018 2017
1 3 Sumitomo Mitsui Financial Group 1,554 1,157
2 1 Mitsubishi UFJ Financial Group 1,264 1,441
3 6 ING Group 1,249 784
4 8 BNP Paribas 1,220 746
5 4 Societe Generale 877 861
6 5 Credit Agricole Group 803 832
7 11 Rabobank 644 622
8 2 Santander 644 1,223
9 22 HSBC 536 311
10 23 Commonwealth Bank of Australia 494 298
11 15 Deutsche Bank 458 516
12 7 Mizuho Financial Group 445 764
13 10 NordLB 436 634
14 45 JPMorgan 430 153
15 N/A Citigroup 429 N/A
16 55 Goldman Sachs 414 113
17 24 Morgan Stanley 388 269
18 18 National Australia Bank 369 383
19 34 Siemens 349 189
20 36 Key Bank 338 180
Value (USDm)
BOND ARRANGERS - VALUE
Rank2018 2017
Company2018 2017
1 N/A Allianz 760 N/A
2 1 JPMorgan 618 1,087
3 35 BNP Paribas 559 40
4 2 Citigroup 543 645
5 6 HSBC 532 461
6 14 Barclays 418 261
7 N/A Larsen & Toubro 355 N/A
8 25 UniCredit 315 120
9 5 Sumitomo Mitsui Financial Group 300 518
10 29 ING Group 276 61
11 N/A Dubai Islamic Bank 250 N/A
= N/A CIMB Group 250 N/A
= N/A Abu Dhabi Islamic Bank 250 N/A
14 18 Credit Agricole Group 236 204
15 9 Deutsche Bank 219 403
16 3 Bank of America 212 641
17 N/A Societe Generale 209 N/A
18 20 Scotiabank 176 171
19 N/A Commerzbank 166 N/A
20 N/A DBS Bank 145 N/A
Value (USDm)
FINANCIAL ADVISERS - VALUE
Rank2018 2017
Company2018 2017
1 1 KPMG 3,714 2,226
2 13 Bank of America 2,557 799
3 34 Societe Generale 2,038 179
4 2 Macquarie 1,712 1,972
5 5 Green Giraffe 1,664 1,311
6 41 Barclays 1,357 91
= N/A Scotiabank 1,357 N/A
8 16 Astris Finance 1,300 705
9 22 HSBC 1,250 475
10 17 Credit Suisse 1,200 660
11 N/A Royal Bank of Canada 1,036 N/A
12 31 BNP Paribas 1,003 221
13 44 Marathon Capital 610 44
14 7 Ernst & Young 597 1,246
15 20 Mizuho Financial Group 540 588
16 N/A Lazard 469 N/A
17 N/A Eaglestone 376 N/A
18 11 Credit Agricole Group 345 889
= N/A CaixaBank 345 N/A
= 9 Santander 345 916
Value (USDm)
LEGAL ADVISERS - VALUE
Rank2018 2017
Company2018 2017
1 8 Clifford Chance 8,726 3,167
2 1 Norton Rose Fulbright 6,933 6,368
3 16 White & Case 4,626 1,216
4 7 Allen & Overy 4,502 4,207
5 3 Milbank Tweed Hadley & McCloy 4,413 5,551
6 10 Herbert Smith Freehills 2,329 2,374
7 2 Linklaters 2,275 6,081
8 5 Latham & Watkins 2,155 4,467
9 29 Cuatrecasas 2,023 799
10 N/A Galicia Abogados 1,937 N/A
11 6 Shearman & Sterling 1,801 4,386
12 14 DLA Piper 1,794 1,245
13 9 Ashurst 1,679 2,456
14 45 Mayer Brown 1,567 476
15 76 CMS 1,358 182
16 N/A Gonzalez Calvillo 1,357 N/A
17 11 Allens 1,328 1,624
18 27 King & Wood Mallesons 1,314 849
19 63 Bonelli Erede Pappalardo 1,260 273
20 41 Assegaf Hamzah & Partners 1,250 588
= N/A AZP Legal Consultants 1,250 N/A
Value (USDm)
Download the data
/28 ijglobal.com
Renewables Infrastructure Finance H1 2018
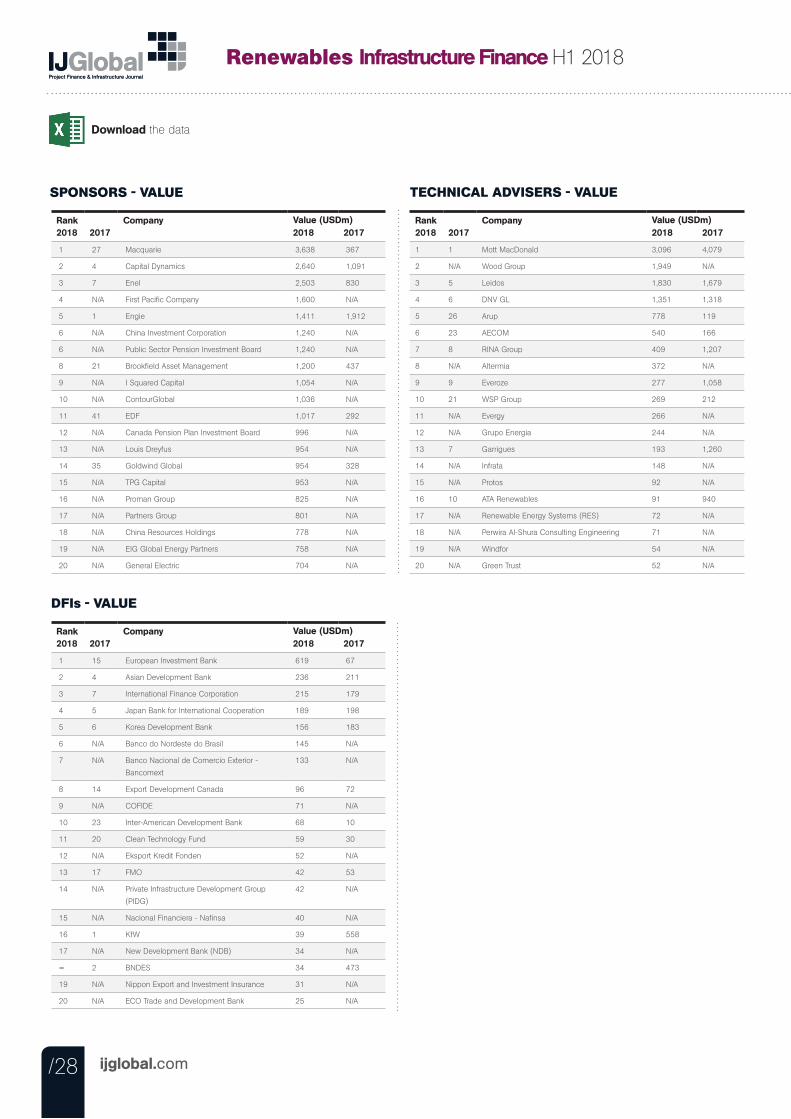
SPONSORS - VALUE
Rank2018 2017
Company2018 2017
1 27 Macquarie 3,638 367
2 4 Capital Dynamics 2,640 1,091
3 7 Enel 2,503 830
4 N/A First Pacific Company 1,600 N/A
5 1 Engie 1,411 1,912
6 N/A China Investment Corporation 1,240 N/A
6 N/A Public Sector Pension Investment Board 1,240 N/A
8 21 Brookfield Asset Management 1,200 437
9 N/A I Squared Capital 1,054 N/A
10 N/A ContourGlobal 1,036 N/A
11 41 EDF 1,017 292
12 N/A Canada Pension Plan Investment Board 996 N/A
13 N/A Louis Dreyfus 954 N/A
14 35 Goldwind Global 954 328
15 N/A TPG Capital 953 N/A
16 N/A Proman Group 825 N/A
17 N/A Partners Group 801 N/A
18 N/A China Resources Holdings 778 N/A
19 N/A EIG Global Energy Partners 758 N/A
20 N/A General Electric 704 N/A
Value (USDm)
TECHNICAL ADVISERS - VALUE
Rank2018 2017
Company2018 2017
1 1 Mott MacDonald 3,096 4,079
2 N/A Wood Group 1,949 N/A
3 5 Leidos 1,830 1,679
4 6 DNV GL 1,351 1,318
5 26 Arup 778 119
6 23 AECOM 540 166
7 8 RINA Group 409 1,207
8 N/A Altermia 372 N/A
9 9 Everoze 277 1,058
10 21 WSP Group 269 212
11 N/A Evergy 266 N/A
12 N/A Grupo Energia 244 N/A
13 7 Garrigues 193 1,260
14 N/A Infrata 148 N/A
15 N/A Protos 92 N/A
16 10 ATA Renewables 91 940
17 N/A Renewable Energy Systems (RES) 72 N/A
18 N/A Perwira Al-Shura Consulting Engineering 71 N/A
19 N/A Windfor 54 N/A
20 N/A Green Trust 52 N/A
Value (USDm)
DFIs - VALUE
Rank2018 2017
Company2018 2017
1 15 European Investment Bank 619 67
2 4 Asian Development Bank 236 211
3 7 International Finance Corporation 215 179
4 5 Japan Bank for International Cooperation 189 198
5 6 Korea Development Bank 156 183
6 N/A Banco do Nordeste do Brasil 145 N/A
7 N/A Banco Nacional de Comercio Exterior -
Bancomext
133 N/A
8 14 Export Development Canada 96 72
9 N/A COFIDE 71 N/A
10 23 Inter-American Development Bank 68 10
11 20 Clean Technology Fund 59 30
12 N/A Eksport Kredit Fonden 52 N/A
13 17 FMO 42 53
14 N/A Private Infrastructure Development Group
(PIDG)
42 N/A
15 N/A Nacional Financiera - Nafinsa 40 N/A
16 1 KfW 39 558
17 N/A New Development Bank (NDB) 34 N/A
= 2 BNDES 34 473
19 N/A Nippon Export and Investment Insurance 31 N/A
20 N/A ECO Trade and Development Bank 25 N/A
Value (USDm)
/29ijglobal.com
Renewables Infrastructure FinanceLeague Tables H1 2018
/29
Oil & Gas Infrastructure FinanceLeague Tables H1 2018
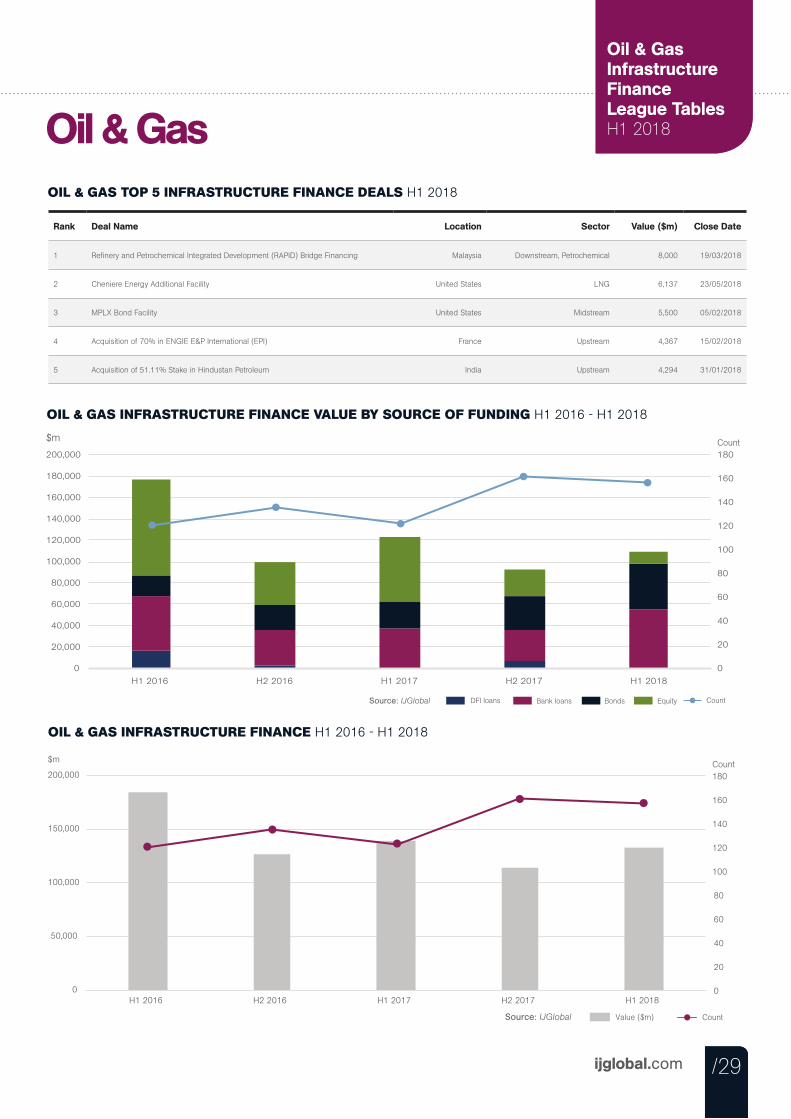
OIL & GAS INFRASTRUCTURE FINANCE VALUE BY SOURCE OF FUNDING H1 2016 - H1 2018
$m
0
20
40
60
80
100
120
140
160
180
0
20,000
40,000
60,000
80,000
100,000
120,000
140,000
160,000
180,000
200,000
H1 2016 H2 2016 H1 2017 H2 2017 H1 2018
Bank loans DFI loans Bonds Equity Source: IJGlobal Count
Count
OIL & GAS INFRASTRUCTURE FINANCE H1 2016 - H1 2018
Value ($m) Count Source: IJGlobal
0
20
40
60
80
100
120
140
160
180
0
50,000
100,000
150,000
200,000
H1 2016 H2 2016 H1 2017 H2 2017 H1 2018
$m Count
OIL & GAS TOP 5 INFRASTRUCTURE FINANCE DEALS H1 2018
Oil & Gas
Rank Deal Name Location Sector Value ($m) Close Date
1 Refinery and Petrochemical Integrated Development (RAPID) Bridge Financing Malaysia Downstream, Petrochemical 8,000 19/03/2018
2 Cheniere Energy Additional Facility United States LNG 6,137 23/05/2018
3 MPLX Bond Facility United States Midstream 5,500 05/02/2018
4 Acquisition of 70% in ENGIE E&P International (EPI) France Upstream 4,367 15/02/2018
5 Acquisition of 51.11% Stake in Hindustan Petroleum India Upstream 4,294 31/01/2018
/30 ijglobal.com
Oil & Gas Infrastructure Finance H1 2018
Download the data
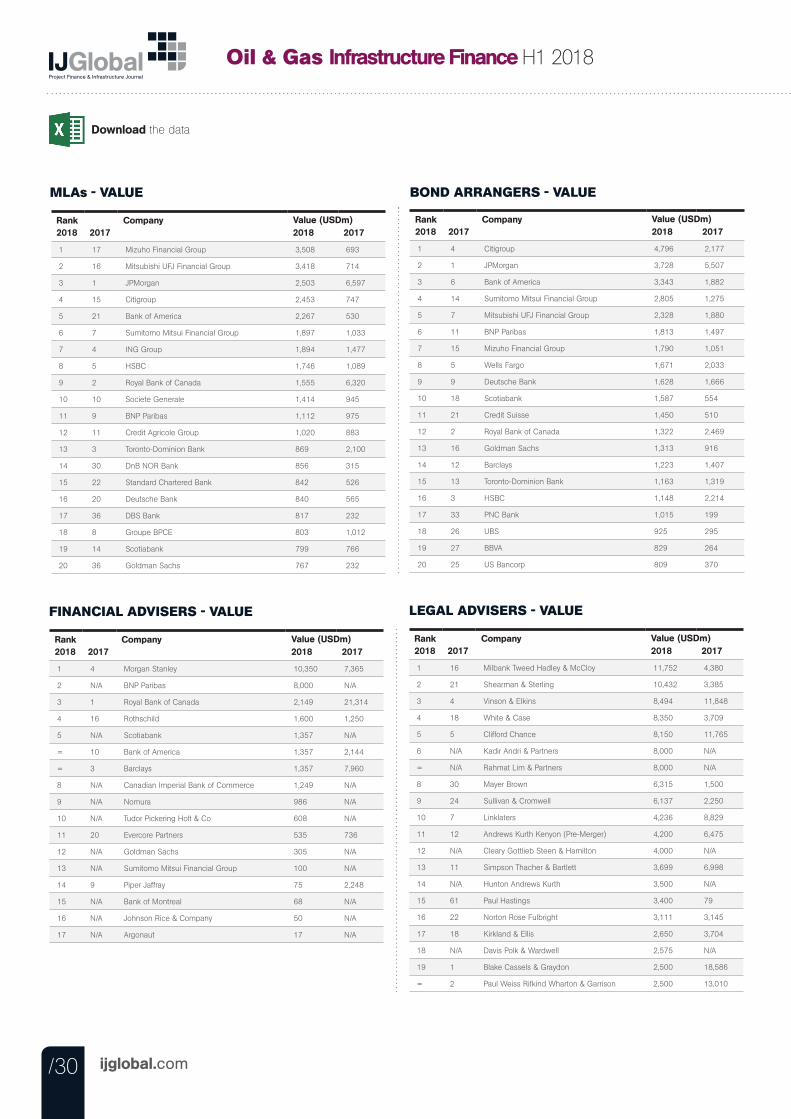
MLAs - VALUE
Rank2018 2017
Company2018 2017
1 17 Mizuho Financial Group 3,508 693
2 16 Mitsubishi UFJ Financial Group 3,418 714
3 1 JPMorgan 2,503 6,597
4 15 Citigroup 2,453 747
5 21 Bank of America 2,267 530
6 7 Sumitomo Mitsui Financial Group 1,897 1,033
7 4 ING Group 1,894 1,477
8 5 HSBC 1,746 1,089
9 2 Royal Bank of Canada 1,555 6,320
10 10 Societe Generale 1,414 945
11 9 BNP Paribas 1,112 975
12 11 Credit Agricole Group 1,020 883
13 3 Toronto-Dominion Bank 869 2,100
14 30 DnB NOR Bank 856 315
15 22 Standard Chartered Bank 842 526
16 20 Deutsche Bank 840 565
17 36 DBS Bank 817 232
18 8 Groupe BPCE 803 1,012
19 14 Scotiabank 799 766
20 36 Goldman Sachs 767 232
Value (USDm)
BOND ARRANGERS - VALUE
Rank2018 2017
Company2018 2017
1 4 Citigroup 4,796 2,177
2 1 JPMorgan 3,728 5,507
3 6 Bank of America 3,343 1,882
4 14 Sumitomo Mitsui Financial Group 2,805 1,275
5 7 Mitsubishi UFJ Financial Group 2,328 1,880
6 11 BNP Paribas 1,813 1,497
7 15 Mizuho Financial Group 1,790 1,051
8 5 Wells Fargo 1,671 2,033
9 9 Deutsche Bank 1,628 1,666
10 18 Scotiabank 1,587 554
11 21 Credit Suisse 1,450 510
12 2 Royal Bank of Canada 1,322 2,469
13 16 Goldman Sachs 1,313 916
14 12 Barclays 1,223 1,407
15 13 Toronto-Dominion Bank 1,163 1,319
16 3 HSBC 1,148 2,214
17 33 PNC Bank 1,015 199
18 26 UBS 925 295
19 27 BBVA 829 264
20 25 US Bancorp 809 370
Value (USDm)
FINANCIAL ADVISERS - VALUE
Rank2018 2017
Company2018 2017
1 4 Morgan Stanley 10,350 7,365
2 N/A BNP Paribas 8,000 N/A
3 1 Royal Bank of Canada 2,149 21,314
4 16 Rothschild 1,600 1,250
5 N/A Scotiabank 1,357 N/A
= 10 Bank of America 1,357 2,144
= 3 Barclays 1,357 7,960
8 N/A Canadian Imperial Bank of Commerce 1,249 N/A
9 N/A Nomura 986 N/A
10 N/A Tudor Pickering Holt & Co 608 N/A
11 20 Evercore Partners 535 736
12 N/A Goldman Sachs 305 N/A
13 N/A Sumitomo Mitsui Financial Group 100 N/A
14 9 Piper Jaffray 75 2,248
15 N/A Bank of Montreal 68 N/A
16 N/A Johnson Rice & Company 50 N/A
17 N/A Argonaut 17 N/A
Value (USDm)
LEGAL ADVISERS - VALUE
Rank2018 2017
Company2018 2017
1 16 Milbank Tweed Hadley & McCloy 11,752 4,380
2 21 Shearman & Sterling 10,432 3,385
3 4 Vinson & Elkins 8,494 11,848
4 18 White & Case 8,350 3,709
5 5 Clifford Chance 8,150 11,765
6 N/A Kadir Andri & Partners 8,000 N/A
= N/A Rahmat Lim & Partners 8,000 N/A
8 30 Mayer Brown 6,315 1,500
9 24 Sullivan & Cromwell 6,137 2,250
10 7 Linklaters 4,236 8,829
11 12 Andrews Kurth Kenyon (Pre-Merger) 4,200 6,475
12 N/A Cleary Gottlieb Steen & Hamilton 4,000 N/A
13 11 Simpson Thacher & Bartlett 3,699 6,998
14 N/A Hunton Andrews Kurth 3,500 N/A
15 61 Paul Hastings 3,400 79
16 22 Norton Rose Fulbright 3,111 3,145
17 18 Kirkland & Ellis 2,650 3,704
18 N/A Davis Polk & Wardwell 2,575 N/A
19 1 Blake Cassels & Graydon 2,500 18,586
= 2 Paul Weiss Rifkind Wharton & Garrison 2,500 13,010
Value (USDm)
/31ijglobal.com
Download the data
Oil & Gas Infrastructure FinanceLeague Tables H1 2018
/31ijglobal.com
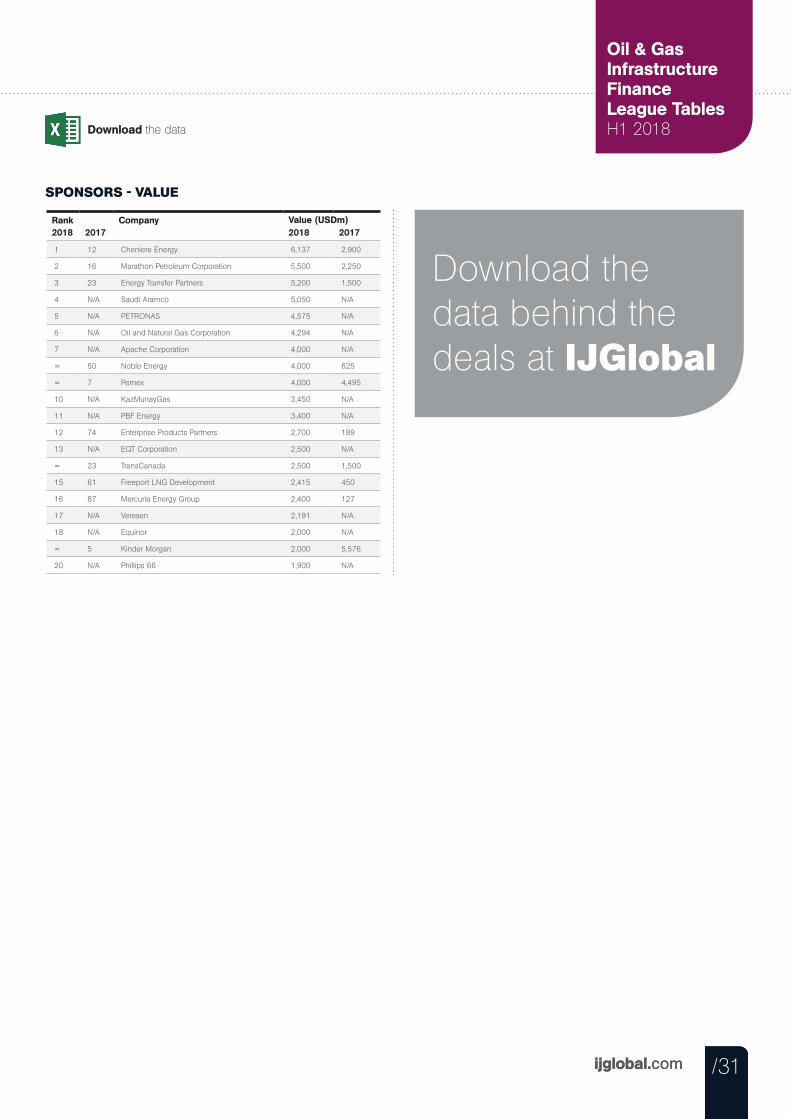
SPONSORS - VALUE
Rank2018 2017
Company2018 2017
1 12 Cheniere Energy 6,137 2,900
2 16 Marathon Petroleum Corporation 5,500 2,250
3 23 Energy Transfer Partners 5,200 1,500
4 N/A Saudi Aramco 5,050 N/A
5 N/A PETRONAS 4,575 N/A
6 N/A Oil and Natural Gas Corporation 4,294 N/A
7 N/A Apache Corporation 4,000 N/A
= 50 Noble Energy 4,000 625
= 7 Pemex 4,000 4,495
10 N/A KazMunayGas 3,450 N/A
11 N/A PBF Energy 3,400 N/A
12 74 Enterprise Products Partners 2,700 189
13 N/A EQT Corporation 2,500 N/A
= 23 TransCanada 2,500 1,500
15 61 Freeport LNG Development 2,415 450
16 87 Mercuria Energy Group 2,400 127
17 N/A Veresen 2,191 N/A
18 N/A Equinor 2,000 N/A
= 5 Kinder Morgan 2,000 5,576
20 N/A Phillips 66 1,900 N/A
Value (USDm)
Download the data behind the deals at IJGlobal
/32 ijglobal.com
Power Infrastructure Finance H1 2018
/32 ijglobal.com
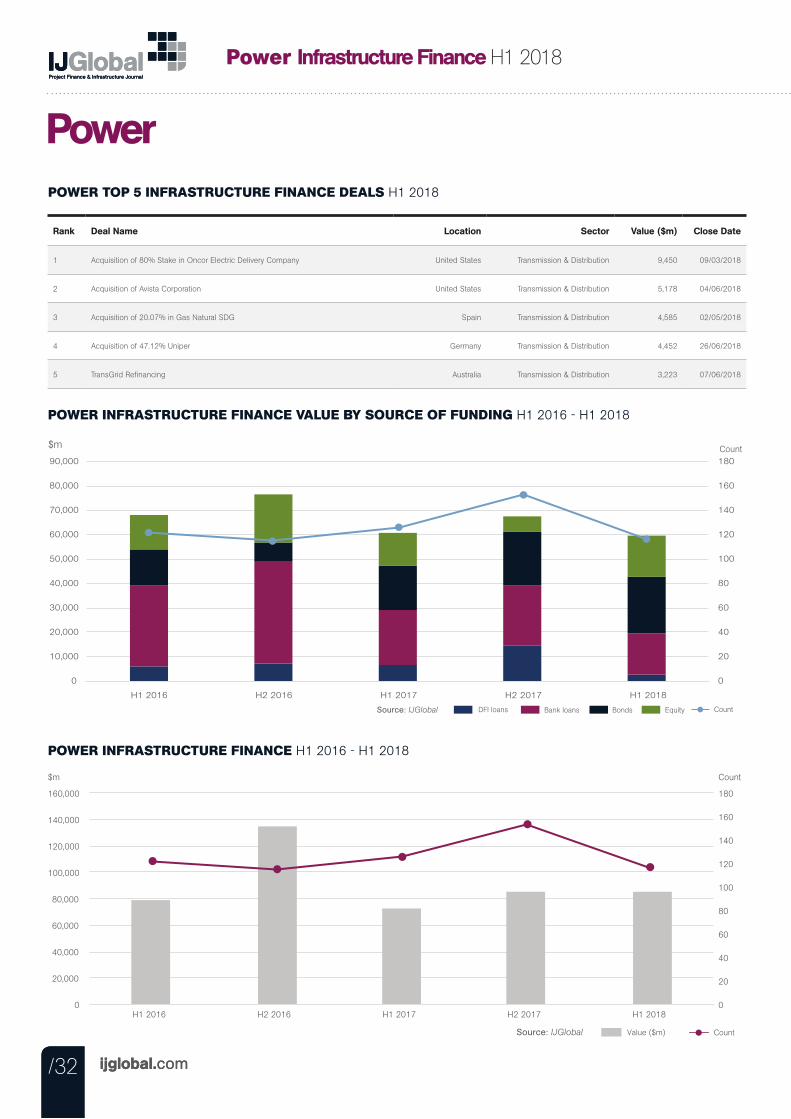
POWER INFRASTRUCTURE FINANCE VALUE BY SOURCE OF FUNDING H1 2016 - H1 2018
$m
Bank loans DFI loans Bonds Equity Source: IJGlobal Count
0
20
40
60
80
100
120
140
160
180
0
10,000
20,000
30,000
40,000
50,000
60,000
70,000
80,000
90,000
H1 2016 H2 2016 H1 2017 H2 2017 H1 2018
Count
POWER INFRASTRUCTURE FINANCE H1 2016 - H1 2018
Value ($m) Count Source: IJGlobal
$m
0
20
40
60
80
100
120
140
160
180
0
20,000
40,000
60,000
80,000
100,000
120,000
140,000
160,000
H1 2016 H2 2016 H1 2017 H2 2017 H1 2018
Count
POWER TOP 5 INFRASTRUCTURE FINANCE DEALS H1 2018
Power
Rank Deal Name Location Sector Value ($m) Close Date
1 Acquisition of 80% Stake in Oncor Electric Delivery Company United States Transmission & Distribution 9,450 09/03/2018
2 Acquisition of Avista Corporation United States Transmission & Distribution 5,178 04/06/2018
3 Acquisition of 20.07% in Gas Natural SDG Spain Transmission & Distribution 4,585 02/05/2018
4 Acquisition of 47.12% Uniper Germany Transmission & Distribution 4,452 26/06/2018
5 TransGrid Refinancing Australia Transmission & Distribution 3,223 07/06/2018
Download the data
/33ijglobal.com
Power Infrastructure FinanceLeague Tables H1 2018
/33ijglobal.com
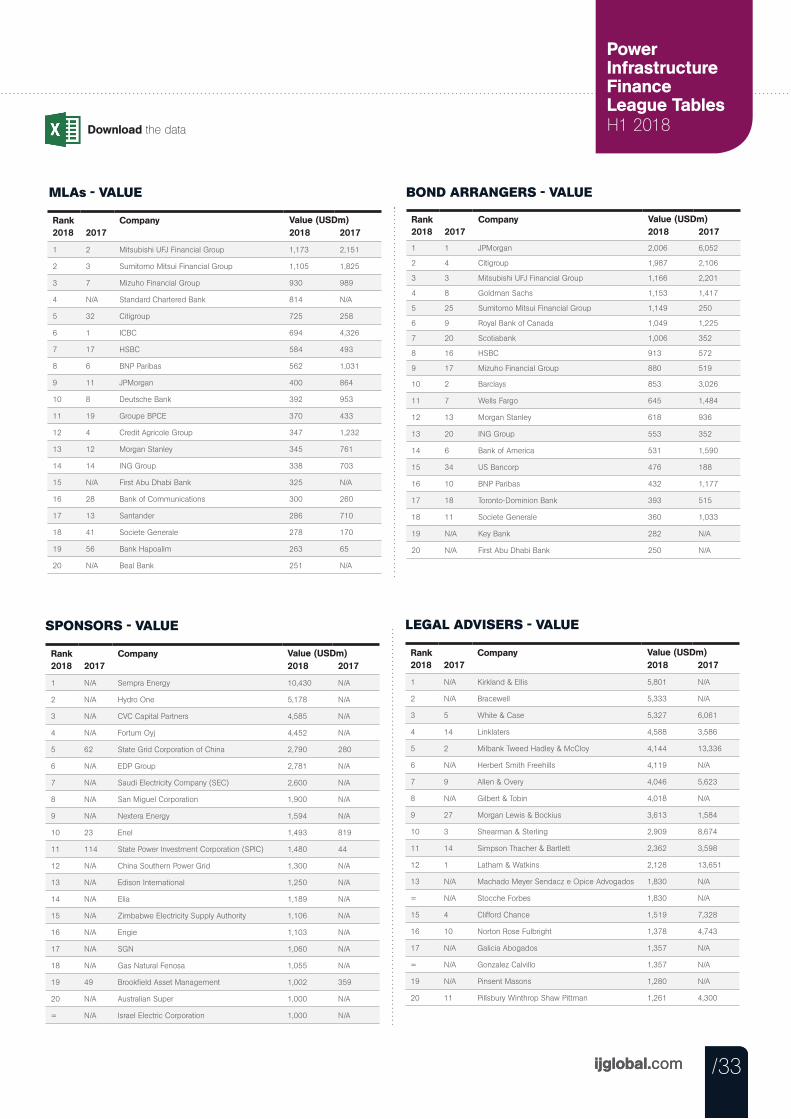
MLAs - VALUE
Rank2018 2017
Company2018 2017
1 2 Mitsubishi UFJ Financial Group 1,173 2,151
2 3 Sumitomo Mitsui Financial Group 1,105 1,825
3 7 Mizuho Financial Group 930 989
4 N/A Standard Chartered Bank 814 N/A
5 32 Citigroup 725 258
6 1 ICBC 694 4,326
7 17 HSBC 584 493
8 6 BNP Paribas 562 1,031
9 11 JPMorgan 400 864
10 8 Deutsche Bank 392 953
11 19 Groupe BPCE 370 433
12 4 Credit Agricole Group 347 1,232
13 12 Morgan Stanley 345 761
14 14 ING Group 338 703
15 N/A First Abu Dhabi Bank 325 N/A
16 28 Bank of Communications 300 260
17 13 Santander 286 710
18 41 Societe Generale 278 170
19 56 Bank Hapoalim 263 65
20 N/A Beal Bank 251 N/A
Value (USDm)
BOND ARRANGERS - VALUE
Rank2018 2017
Company2018 2017
1 1 JPMorgan 2,006 6,052
2 4 Citigroup 1,987 2,106
3 3 Mitsubishi UFJ Financial Group 1,166 2,201
4 8 Goldman Sachs 1,153 1,417
5 25 Sumitomo Mitsui Financial Group 1,149 250
6 9 Royal Bank of Canada 1,049 1,225
7 20 Scotiabank 1,006 352
8 16 HSBC 913 572
9 17 Mizuho Financial Group 880 519
10 2 Barclays 853 3,026
11 7 Wells Fargo 645 1,484
12 13 Morgan Stanley 618 936
13 20 ING Group 553 352
14 6 Bank of America 531 1,590
15 34 US Bancorp 476 188
16 10 BNP Paribas 432 1,177
17 18 Toronto-Dominion Bank 393 515
18 11 Societe Generale 360 1,033
19 N/A Key Bank 282 N/A
20 N/A First Abu Dhabi Bank 250 N/A
Value (USDm)
SPONSORS - VALUE
Rank2018 2017
Company2018 2017
1 N/A Sempra Energy 10,430 N/A
2 N/A Hydro One 5,178 N/A
3 N/A CVC Capital Partners 4,585 N/A
4 N/A Fortum Oyj 4,452 N/A
5 62 State Grid Corporation of China 2,790 280
6 N/A EDP Group 2,781 N/A
7 N/A Saudi Electricity Company (SEC) 2,600 N/A
8 N/A San Miguel Corporation 1,900 N/A
9 N/A Nextera Energy 1,594 N/A
10 23 Enel 1,493 819
11 114 State Power Investment Corporation (SPIC) 1,480 44
12 N/A China Southern Power Grid 1,300 N/A
13 N/A Edison International 1,250 N/A
14 N/A Elia 1,189 N/A
15 N/A Zimbabwe Electricity Supply Authority 1,106 N/A
16 N/A Engie 1,103 N/A
17 N/A SGN 1,060 N/A
18 N/A Gas Natural Fenosa 1,055 N/A
19 49 Brookfield Asset Management 1,002 359
20 N/A Australian Super 1,000 N/A
= N/A Israel Electric Corporation 1,000 N/A
Value (USDm)
LEGAL ADVISERS - VALUE
Rank2018 2017
Company2018 2017
1 N/A Kirkland & Ellis 5,801 N/A
2 N/A Bracewell 5,333 N/A
3 5 White & Case 5,327 6,061
4 14 Linklaters 4,588 3,586
5 2 Milbank Tweed Hadley & McCloy 4,144 13,336
6 N/A Herbert Smith Freehills 4,119 N/A
7 9 Allen & Overy 4,046 5,623
8 N/A Gilbert & Tobin 4,018 N/A
9 27 Morgan Lewis & Bockius 3,613 1,584
10 3 Shearman & Sterling 2,909 8,674
11 14 Simpson Thacher & Bartlett 2,362 3,598
12 1 Latham & Watkins 2,128 13,651
13 N/A Machado Meyer Sendacz e Opice Advogados 1,830 N/A
= N/A Stocche Forbes 1,830 N/A
15 4 Clifford Chance 1,519 7,328
16 10 Norton Rose Fulbright 1,378 4,743
17 N/A Galicia Abogados 1,357 N/A
= N/A Gonzalez Calvillo 1,357 N/A
19 N/A Pinsent Masons 1,280 N/A
20 11 Pillsbury Winthrop Shaw Pittman 1,261 4,300
Value (USDm)
/34 ijglobal.com
Download the data
Power Infrastructure Finance H1 2018
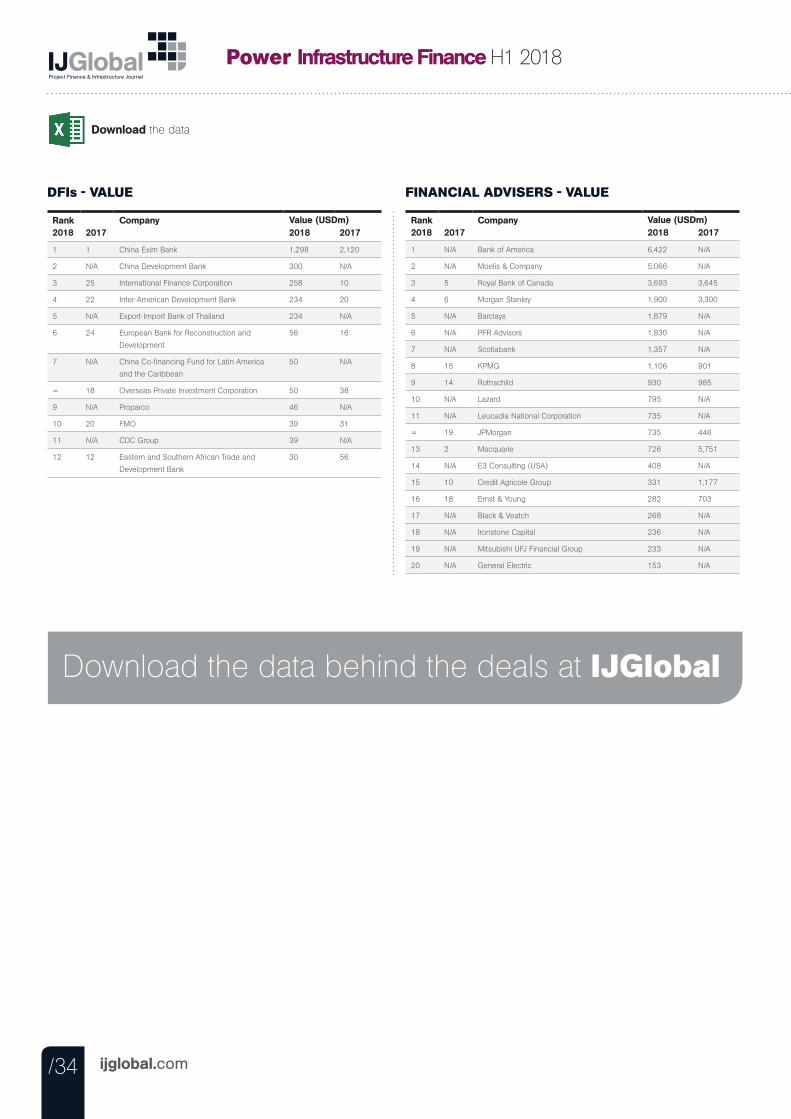
DFIs - VALUE
Rank2018 2017
Company2018 2017
1 1 China Exim Bank 1,298 2,120
2 N/A China Development Bank 300 N/A
3 25 International Finance Corporation 258 10
4 22 Inter-American Development Bank 234 20
5 N/A Export-Import Bank of Thailand 234 N/A
6 24 European Bank for Reconstruction and
Development
56 16
7 N/A China Co-financing Fund for Latin America
and the Caribbean
50 N/A
= 18 Overseas Private Investment Corporation 50 38
9 N/A Proparco 46 N/A
10 20 FMO 39 31
11 N/A CDC Group 39 N/A
12 12 Eastern and Southern African Trade and
Development Bank
30 56
Value (USDm)
FINANCIAL ADVISERS - VALUE
Rank2018 2017
Company2018 2017
1 N/A Bank of America 6,422 N/A
2 N/A Moelis & Company 5,066 N/A
3 5 Royal Bank of Canada 3,693 3,645
4 6 Morgan Stanley 1,900 3,300
5 N/A Barclays 1,879 N/A
6 N/A PFR Advisors 1,830 N/A
7 N/A Scotiabank 1,357 N/A
8 15 KPMG 1,106 901
9 14 Rothschild 930 985
10 N/A Lazard 795 N/A
11 N/A Leucadia National Corporation 735 N/A
= 19 JPMorgan 735 446
13 2 Macquarie 726 5,751
14 N/A E3 Consulting (USA) 408 N/A
15 10 Credit Agricole Group 331 1,177
16 18 Ernst & Young 282 703
17 N/A Black & Veatch 268 N/A
18 N/A Ironstone Capital 236 N/A
19 N/A Mitsubishi UFJ Financial Group 233 N/A
20 N/A General Electric 153 N/A
Value (USDm)
Download the data behind the deals at IJGlobal
/35ijglobal.com
Renewables Infrastructure FinanceLeague Tables H1 2018
/35
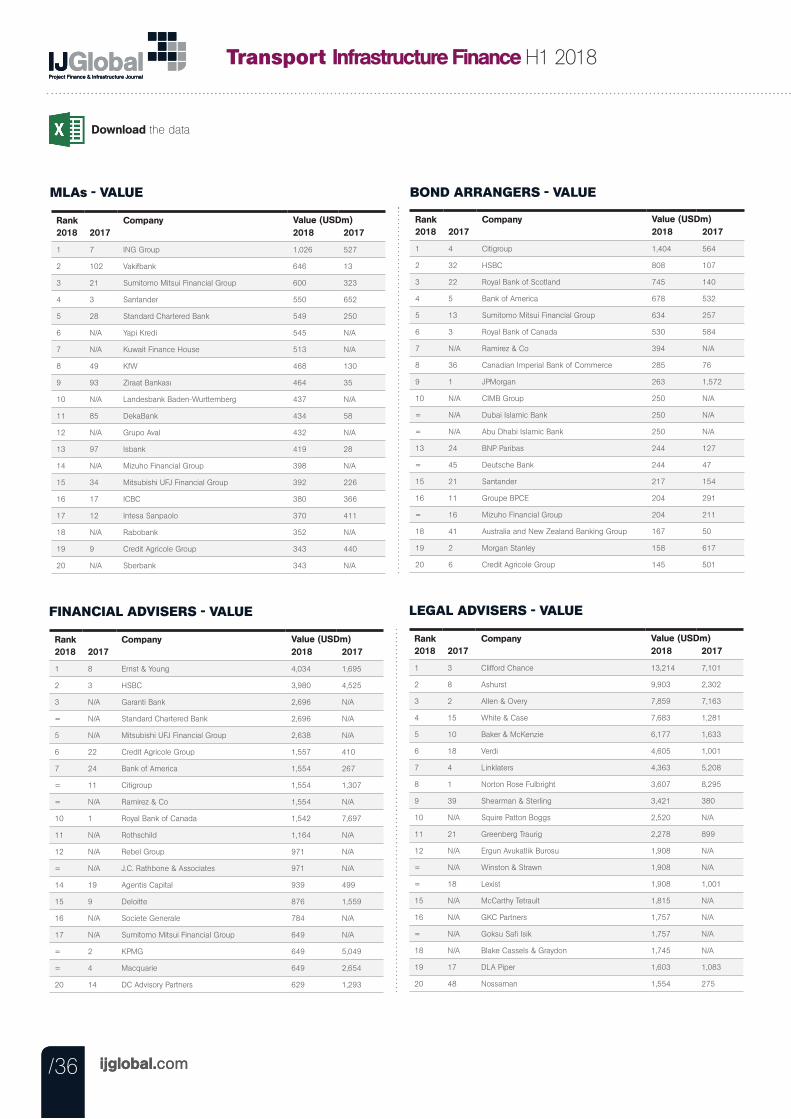
Transport Infrastructure FinanceLeague Tables H1 2018
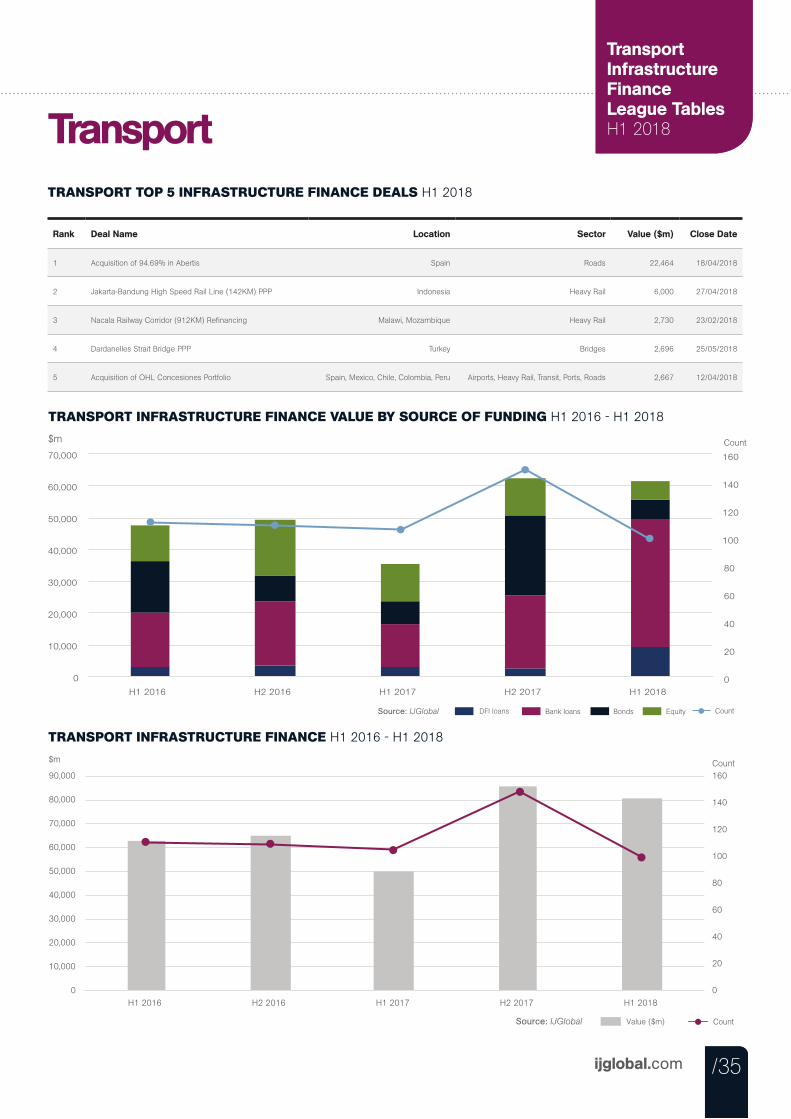
TRANSPORT INFRASTRUCTURE FINANCE VALUE BY SOURCE OF FUNDING H1 2016 - H1 2018
$m
Bank loans DFI loans Bonds Equity Source: IJGlobal Count
0
20
40
60
80
100
120
140
160
0
10,000
20,000
30,000
40,000
50,000
60,000
70,000
H1 2016 H2 2016 H1 2017 H2 2017 H1 2018
Count
TRANSPORT INFRASTRUCTURE FINANCE H1 2016 - H1 2018
$m
0
20
40
60
80
100
120
140
160
0
10,000
20,000
30,000
40,000
50,000
60,000
70,000
80,000
90,000
H1 2016 H2 2016 H1 2017 H2 2017 H1 2018
Value ($m) Count Source: IJGlobal
Count
TRANSPORT TOP 5 INFRASTRUCTURE FINANCE DEALS H1 2018
Transport
Rank Deal Name Location Sector Value ($m) Close Date
1 Acquisition of 94.69% in Abertis Spain Roads 22,464 18/04/2018
2 Jakarta-Bandung High Speed Rail Line (142KM) PPP Indonesia Heavy Rail 6,000 27/04/2018
3 Nacala Railway Corridor (912KM) Refinancing Malawi, Mozambique Heavy Rail 2,730 23/02/2018
4 Dardanelles Strait Bridge PPP Turkey Bridges 2,696 25/05/2018
5 Acquisition of OHL Concesiones Portfolio Spain, Mexico, Chile, Colombia, Peru Airports, Heavy Rail, Transit, Ports, Roads 2,667 12/04/2018
Download the data
/36 ijglobal.com
Transport Infrastructure Finance H1 2018
/36 ijglobal.com
MLAs - VALUE
Rank2018 2017
Company2018 2017
1 7 ING Group 1,026 527
2 102 Vakifbank 646 13
3 21 Sumitomo Mitsui Financial Group 600 323
4 3 Santander 550 652
5 28 Standard Chartered Bank 549 250
6 N/A Yapi Kredi 545 N/A
7 N/A Kuwait Finance House 513 N/A
8 49 KfW 468 130
9 93 Ziraat Bankası 464 35
10 N/A Landesbank Baden-Wurttemberg 437 N/A
11 85 DekaBank 434 58
12 N/A Grupo Aval 432 N/A
13 97 Isbank 419 28
14 N/A Mizuho Financial Group 398 N/A
15 34 Mitsubishi UFJ Financial Group 392 226
16 17 ICBC 380 366
17 12 Intesa Sanpaolo 370 411
18 N/A Rabobank 352 N/A
19 9 Credit Agricole Group 343 440
20 N/A Sberbank 343 N/A
Value (USDm)
BOND ARRANGERS - VALUE
Rank2018 2017
Company2018 2017
1 4 Citigroup 1,404 564
2 32 HSBC 808 107
3 22 Royal Bank of Scotland 745 140
4 5 Bank of America 678 532
5 13 Sumitomo Mitsui Financial Group 634 257
6 3 Royal Bank of Canada 530 584
7 N/A Ramirez & Co 394 N/A
8 36 Canadian Imperial Bank of Commerce 285 76
9 1 JPMorgan 263 1,572
10 N/A CIMB Group 250 N/A
= N/A Dubai Islamic Bank 250 N/A
= N/A Abu Dhabi Islamic Bank 250 N/A
13 24 BNP Paribas 244 127
= 45 Deutsche Bank 244 47
15 21 Santander 217 154
16 11 Groupe BPCE 204 291
= 16 Mizuho Financial Group 204 211
18 41 Australia and New Zealand Banking Group 167 50
19 2 Morgan Stanley 158 617
20 6 Credit Agricole Group 145 501
Value (USDm)
FINANCIAL ADVISERS - VALUE
Rank2018 2017
Company2018 2017
1 8 Ernst & Young 4,034 1,695
2 3 HSBC 3,980 4,525
3 N/A Garanti Bank 2,696 N/A
= N/A Standard Chartered Bank 2,696 N/A
5 N/A Mitsubishi UFJ Financial Group 2,638 N/A
6 22 Credit Agricole Group 1,557 410
7 24 Bank of America 1,554 267
= 11 Citigroup 1,554 1,307
= N/A Ramirez & Co 1,554 N/A
10 1 Royal Bank of Canada 1,542 7,697
11 N/A Rothschild 1,164 N/A
12 N/A Rebel Group 971 N/A
= N/A J.C. Rathbone & Associates 971 N/A
14 19 Agentis Capital 939 499
15 9 Deloitte 876 1,559
16 N/A Societe Generale 784 N/A
17 N/A Sumitomo Mitsui Financial Group 649 N/A
= 2 KPMG 649 5,049
= 4 Macquarie 649 2,654
20 14 DC Advisory Partners 629 1,293
Value (USDm)
LEGAL ADVISERS - VALUE
Rank2018 2017
Company2018 2017
1 3 Clifford Chance 13,214 7,101
2 8 Ashurst 9,903 2,302
3 2 Allen & Overy 7,859 7,163
4 15 White & Case 7,683 1,281
5 10 Baker & McKenzie 6,177 1,633
6 18 Verdi 4,605 1,001
7 4 Linklaters 4,363 5,208
8 1 Norton Rose Fulbright 3,607 8,295
9 39 Shearman & Sterling 3,421 380
10 N/A Squire Patton Boggs 2,520 N/A
11 21 Greenberg Traurig 2,278 899
12 N/A Ergun Avukatlik Burosu 1,908 N/A
= N/A Winston & Strawn 1,908 N/A
= 18 Lexist 1,908 1,001
15 N/A McCarthy Tetrault 1,815 N/A
16 N/A GKC Partners 1,757 N/A
= N/A Goksu Safi Isik 1,757 N/A
18 N/A Blake Cassels & Graydon 1,745 N/A
19 17 DLA Piper 1,603 1,083
20 48 Nossaman 1,554 275
Value (USDm)
Download the data
/37ijglobal.com
Transport Infrastructure FinanceLeague Tables H1 2018
/37ijglobal.com
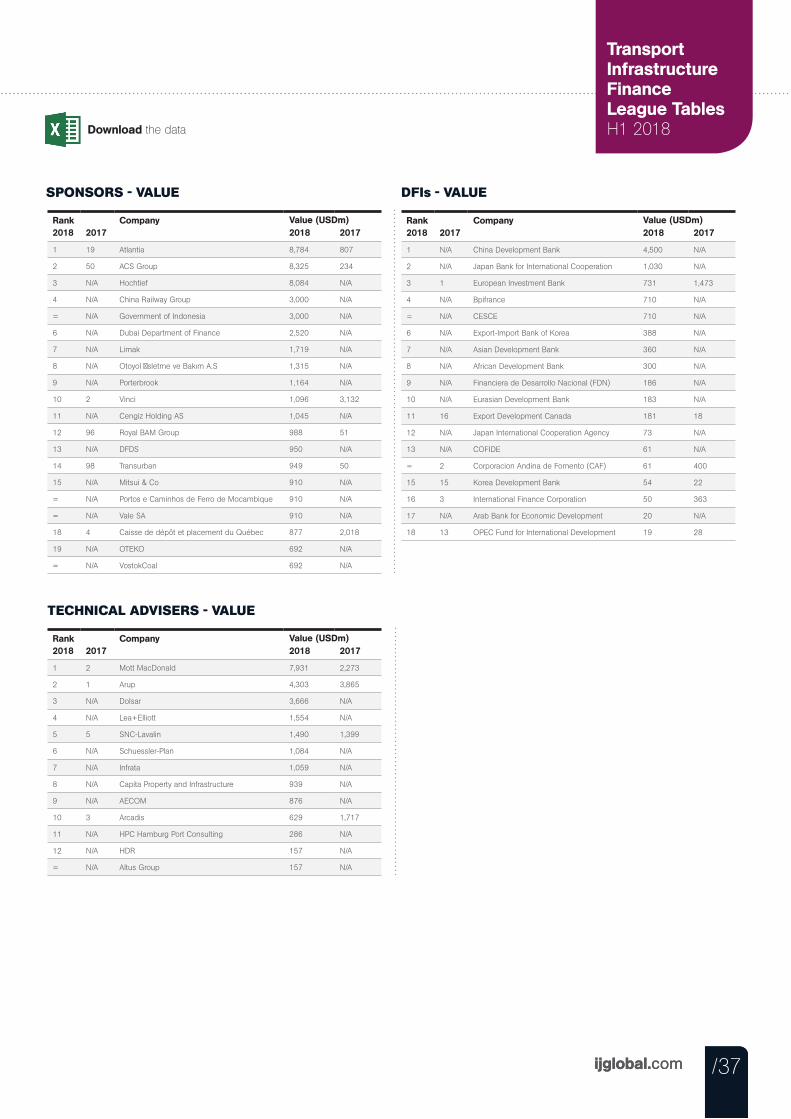
SPONSORS - VALUE
Rank2018 2017
Company2018 2017
1 19 Atlantia 8,784 807
2 50 ACS Group 8,325 234
3 N/A Hochtief 8,084 N/A
4 N/A China Railway Group 3,000 N/A
= N/A Government of Indonesia 3,000 N/A
6 N/A Dubai Department of Finance 2,520 N/A
7 N/A Limak 1,719 N/A
8 N/A Otoyol İsletme ve Bakım A.S 1,315 N/A
9 N/A Porterbrook 1,164 N/A
10 2 Vinci 1,096 3,132
11 N/A Cengiz Holding AS 1,045 N/A
12 96 Royal BAM Group 988 51
13 N/A DFDS 950 N/A
14 98 Transurban 949 50
15 N/A Mitsui & Co 910 N/A
= N/A Portos e Caminhos de Ferro de Mocambique 910 N/A
= N/A Vale SA 910 N/A
18 4 Caisse de dépôt et placement du Québec 877 2,018
19 N/A OTEKO 692 N/A
= N/A VostokCoal 692 N/A
Value (USDm)
DFIs - VALUE
Rank2018 2017
Company2018 2017
1 N/A China Development Bank 4,500 N/A
2 N/A Japan Bank for International Cooperation 1,030 N/A
3 1 European Investment Bank 731 1,473
4 N/A Bpifrance 710 N/A
= N/A CESCE 710 N/A
6 N/A Export-Import Bank of Korea 388 N/A
7 N/A Asian Development Bank 360 N/A
8 N/A African Development Bank 300 N/A
9 N/A Financiera de Desarrollo Nacional (FDN) 186 N/A
10 N/A Eurasian Development Bank 183 N/A
11 16 Export Development Canada 181 18
12 N/A Japan International Cooperation Agency 73 N/A
13 N/A COFIDE 61 N/A
= 2 Corporacion Andina de Fomento (CAF) 61 400
15 15 Korea Development Bank 54 22
16 3 International Finance Corporation 50 363
17 N/A Arab Bank for Economic Development 20 N/A
18 13 OPEC Fund for International Development 19 28
Value (USDm)
TECHNICAL ADVISERS - VALUE
Rank2018 2017
Company2018 2017
1 2 Mott MacDonald 7,931 2,273
2 1 Arup 4,303 3,865
3 N/A Dolsar 3,666 N/A
4 N/A Lea+Elliott 1,554 N/A
5 5 SNC-Lavalin 1,490 1,399
6 N/A Schuessler-Plan 1,084 N/A
7 N/A Infrata 1,059 N/A
8 N/A Capita Property and Infrastructure 939 N/A
9 N/A AECOM 876 N/A
10 3 Arcadis 629 1,717
11 N/A HPC Hamburg Port Consulting 286 N/A
12 N/A HDR 157 N/A
= N/A Altus Group 157 N/A
Value (USDm)
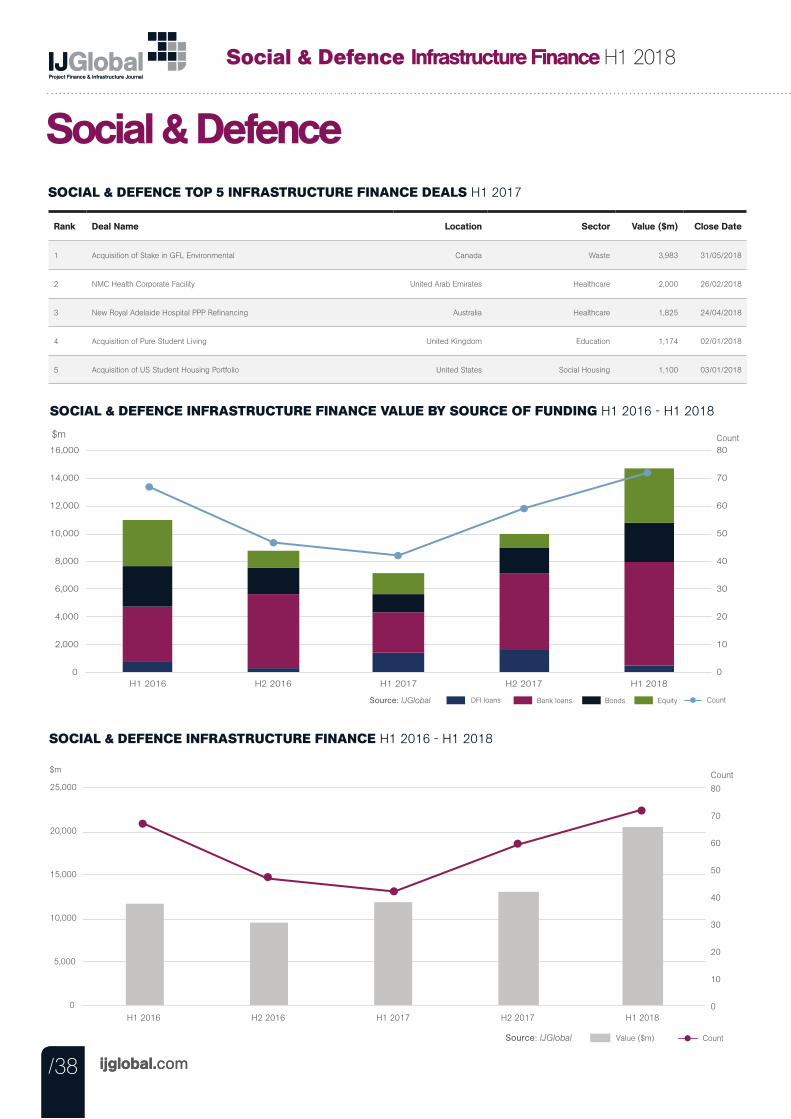
/38 ijglobal.com
Social & Defence Infrastructure Finance H1 2018
/38 ijglobal.com
SOCIAL & DEFENCE INFRASTRUCTURE FINANCE VALUE BY SOURCE OF FUNDING H1 2016 - H1 2018
$m
Bank loans DFI loans Bonds Equity Source: IJGlobal Count
0
10
20
30
40
50
60
70
80
0
2,000
4,000
6,000
8,000
10,000
12,000
14,000
16,000
H1 2016 H2 2016 H1 2017 H2 2017 H1 2018
Count
SOCIAL & DEFENCE INFRASTRUCTURE FINANCE H1 2016 - H1 2018
$m
0
10
20
30
40
50
60
70
80
0
5,000
10,000
15,000
20,000
25,000
H1 2016 H2 2016 H1 2017 H2 2017 H1 2018
Value ($m) Count Source: IJGlobal
Count
SOCIAL & DEFENCE TOP 5 INFRASTRUCTURE FINANCE DEALS H1 2017
Social & Defence
Rank Deal Name Location Sector Value ($m) Close Date
1 Acquisition of Stake in GFL Environmental Canada Waste 3,983 31/05/2018
2 NMC Health Corporate Facility United Arab Emirates Healthcare 2,000 26/02/2018
3 New Royal Adelaide Hospital PPP Refinancing Australia Healthcare 1,825 24/04/2018
4 Acquisition of Pure Student Living United Kingdom Education 1,174 02/01/2018
5 Acquisition of US Student Housing Portfolio United States Social Housing 1,100 03/01/2018
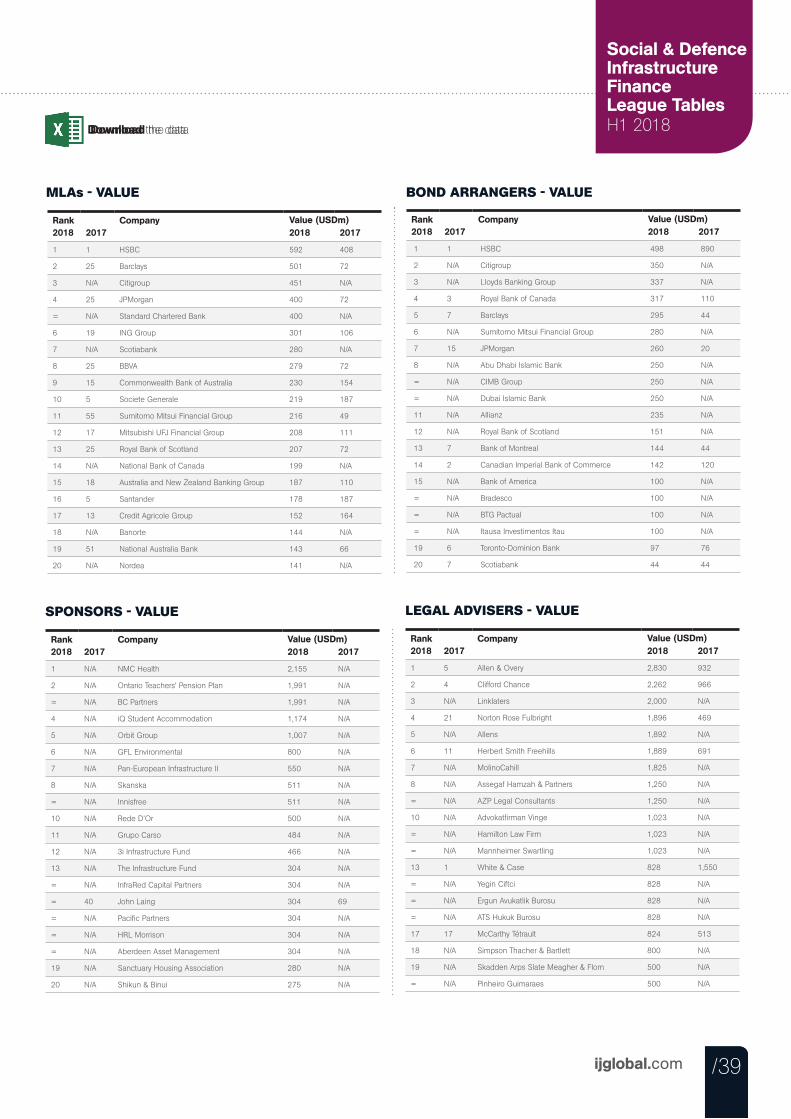
Download the data
/39ijglobal.com
Social & Defence Infrastructure FinanceLeague Tables H1 2018Download the data
/39
MLAs - VALUE
Rank2018 2017
Company2018 2017
1 1 HSBC 592 408
2 25 Barclays 501 72
3 N/A Citigroup 451 N/A
4 25 JPMorgan 400 72
= N/A Standard Chartered Bank 400 N/A
6 19 ING Group 301 106
7 N/A Scotiabank 280 N/A
8 25 BBVA 279 72
9 15 Commonwealth Bank of Australia 230 154
10 5 Societe Generale 219 187
11 55 Sumitomo Mitsui Financial Group 216 49
12 17 Mitsubishi UFJ Financial Group 208 111
13 25 Royal Bank of Scotland 207 72
14 N/A National Bank of Canada 199 N/A
15 18 Australia and New Zealand Banking Group 187 110
16 5 Santander 178 187
17 13 Credit Agricole Group 152 164
18 N/A Banorte 144 N/A
19 51 National Australia Bank 143 66
20 N/A Nordea 141 N/A
Value (USDm)
BOND ARRANGERS - VALUE
Rank2018 2017
Company2018 2017
1 1 HSBC 498 890
2 N/A Citigroup 350 N/A
3 N/A Lloyds Banking Group 337 N/A
4 3 Royal Bank of Canada 317 110
5 7 Barclays 295 44
6 N/A Sumitomo Mitsui Financial Group 280 N/A
7 15 JPMorgan 260 20
8 N/A Abu Dhabi Islamic Bank 250 N/A
= N/A CIMB Group 250 N/A
= N/A Dubai Islamic Bank 250 N/A
11 N/A Allianz 235 N/A
12 N/A Royal Bank of Scotland 151 N/A
13 7 Bank of Montreal 144 44
14 2 Canadian Imperial Bank of Commerce 142 120
15 N/A Bank of America 100 N/A
= N/A Bradesco 100 N/A
= N/A BTG Pactual 100 N/A
= N/A Itausa Investimentos Itau 100 N/A
19 6 Toronto-Dominion Bank 97 76
20 7 Scotiabank 44 44
Value (USDm)
SPONSORS - VALUE
Rank2018 2017
Company2018 2017
1 N/A NMC Health 2,155 N/A
2 N/A Ontario Teachers' Pension Plan 1,991 N/A
= N/A BC Partners 1,991 N/A
4 N/A iQ Student Accommodation 1,174 N/A
5 N/A Orbit Group 1,007 N/A
6 N/A GFL Environmental 800 N/A
7 N/A Pan-European Infrastructure II 550 N/A
8 N/A Skanska 511 N/A
= N/A Innisfree 511 N/A
10 N/A Rede D’Or 500 N/A
11 N/A Grupo Carso 484 N/A
12 N/A 3i Infrastructure Fund 466 N/A
13 N/A The Infrastructure Fund 304 N/A
= N/A InfraRed Capital Partners 304 N/A
= 40 John Laing 304 69
= N/A Pacific Partners 304 N/A
= N/A HRL Morrison 304 N/A
= N/A Aberdeen Asset Management 304 N/A
19 N/A Sanctuary Housing Association 280 N/A
20 N/A Shikun & Binui 275 N/A
Value (USDm)
LEGAL ADVISERS - VALUE
Rank2018 2017
Company2018 2017
1 5 Allen & Overy 2,830 932
2 4 Clifford Chance 2,262 966
3 N/A Linklaters 2,000 N/A
4 21 Norton Rose Fulbright 1,896 469
5 N/A Allens 1,892 N/A
6 11 Herbert Smith Freehills 1,889 691
7 N/A MolinoCahill 1,825 N/A
8 N/A Assegaf Hamzah & Partners 1,250 N/A
= N/A AZP Legal Consultants 1,250 N/A
10 N/A Advokatfirman Vinge 1,023 N/A
= N/A Hamilton Law Firm 1,023 N/A
= N/A Mannheimer Swartling 1,023 N/A
13 1 White & Case 828 1,550
= N/A Yegin Ciftci 828 N/A
= N/A Ergun Avukatlik Burosu 828 N/A
= N/A ATS Hukuk Burosu 828 N/A
17 17 McCarthy Tétrault 824 513
18 N/A Simpson Thacher & Bartlett 800 N/A
19 N/A Skadden Arps Slate Meagher & Flom 500 N/A
= N/A Pinheiro Guimaraes 500 N/A
Value (USDm)
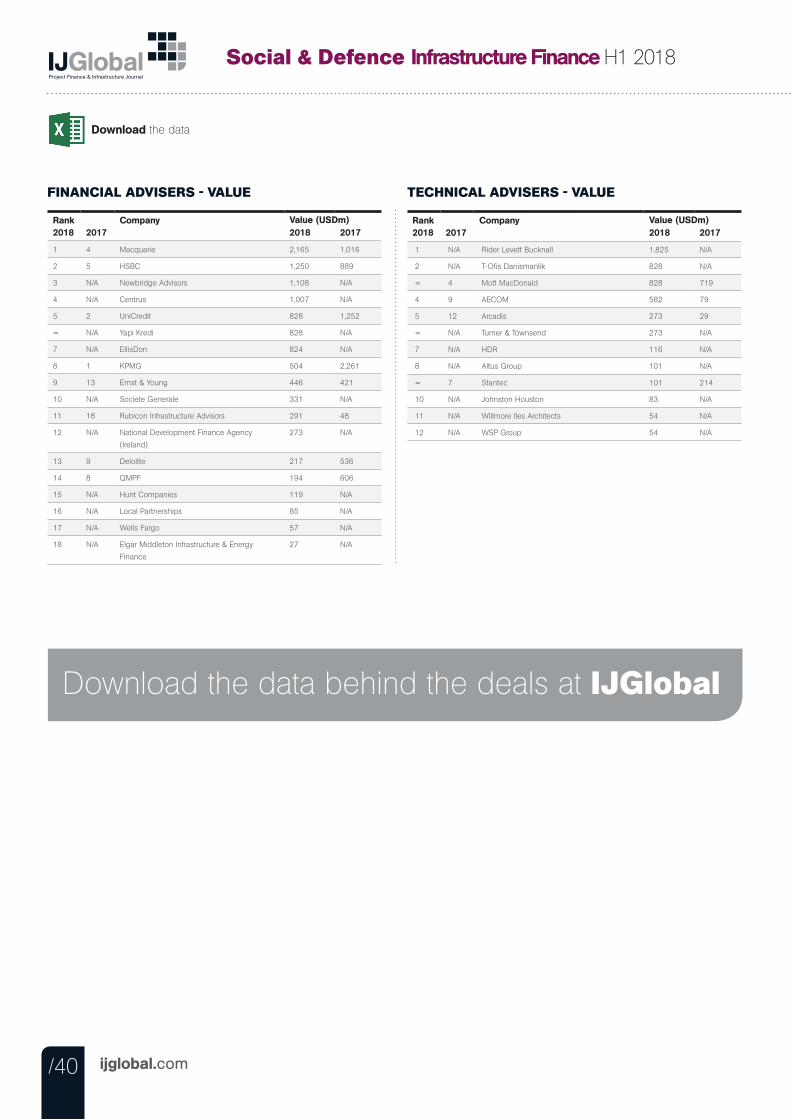
/40 ijglobal.com
Download the data
Social & Defence Infrastructure Finance H1 2018
FINANCIAL ADVISERS - VALUE
Rank2018 2017
Company2018 2017
1 4 Macquarie 2,165 1,016
2 5 HSBC 1,250 889
3 N/A Newbridge Advisors 1,108 N/A
4 N/A Centrus 1,007 N/A
5 2 UniCredit 828 1,252
= N/A Yapi Kredi 828 N/A
7 N/A EllisDon 824 N/A
8 1 KPMG 504 2,261
9 13 Ernst & Young 446 421
10 N/A Societe Generale 331 N/A
11 18 Rubicon Infrastructure Advisors 291 48
12 N/A National Development Finance Agency
(Ireland)
273 N/A
13 9 Deloitte 217 536
14 8 QMPF 194 606
15 N/A Hunt Companies 119 N/A
16 N/A Local Partnerships 85 N/A
17 N/A Wells Fargo 57 N/A
18 N/A Elgar Middleton Infrastructure & Energy
Finance
27 N/A
Value (USDm)
TECHNICAL ADVISERS - VALUE
Rank2018 2017
Company2018 2017
1 N/A Rider Levett Bucknall 1,825 N/A
2 N/A T-Ofis Danismanlik 828 N/A
= 4 Mott MacDonald 828 719
4 9 AECOM 582 79
5 12 Arcadis 273 29
= N/A Turner & Townsend 273 N/A
7 N/A HDR 116 N/A
8 N/A Altus Group 101 N/A
= 7 Stantec 101 214
10 N/A Johnston Houston 83 N/A
11 N/A Willmore Iles Architects 54 N/A
12 N/A WSP Group 54 N/A
Value (USDm)
Download the data behind the deals at IJGlobal
/41ijglobal.com /41
PROJECT FINANCELEAGUE TABLES
Download the data
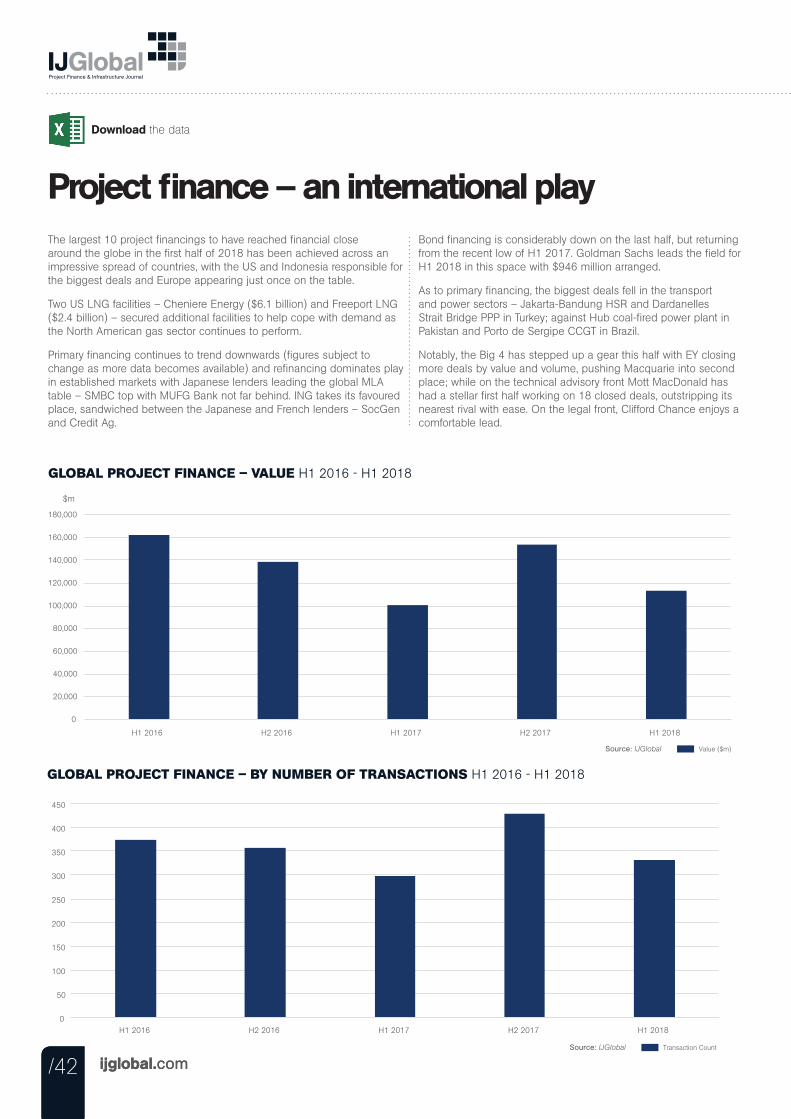
/42 ijglobal.com
Download the data
/42 ijglobal.com
GLOBAL PROJECT FINANCE – BY NUMBER OF TRANSACTIONS H1 2016 - H1 2018
GLOBAL PROJECT FINANCE – VALUE H1 2016 - H1 2018
$m
Value ($m) Source: IJGlobal
0
20,000
40,000
60,000
80,000
100,000
120,000
140,000
160,000
180,000
H1 2016 H2 2016 H1 2017 H2 2017 H1 2018
Transaction Count Source: IJGlobal
0
50
100
150
200
250
300
350
400
450
H1 2016 H2 2016 H1 2017 H2 2017 H1 2018
Project finance – an international playThe largest 10 project financings to have reached financial close around the globe in the first half of 2018 has been achieved across an impressive spread of countries, with the US and Indonesia responsible for the biggest deals and Europe appearing just once on the table.
Two US LNG facilities – Cheniere Energy ($6.1 billion) and Freeport LNG ($2.4 billion) – secured additional facilities to help cope with demand as the North American gas sector continues to perform.
Primary financing continues to trend downwards (figures subject to change as more data becomes available) and refinancing dominates play in established markets with Japanese lenders leading the global MLA table – SMBC top with MUFG Bank not far behind. ING takes its favoured place, sandwiched between the Japanese and French lenders – SocGen and Credit Ag.
Bond financing is considerably down on the last half, but returning from the recent low of H1 2017. Goldman Sachs leads the field for H1 2018 in this space with $946 million arranged.
As to primary financing, the biggest deals fell in the transport and power sectors – Jakarta-Bandung HSR and Dardanelles Strait Bridge PPP in Turkey; against Hub coal-fired power plant in Pakistan and Porto de Sergipe CCGT in Brazil.
Notably, the Big 4 has stepped up a gear this half with EY closing more deals by value and volume, pushing Macquarie into second place; while on the technical advisory front Mott MacDonald has had a stellar first half working on 18 closed deals, outstripping its nearest rival with ease. On the legal front, Clifford Chance enjoys a comfortable lead.
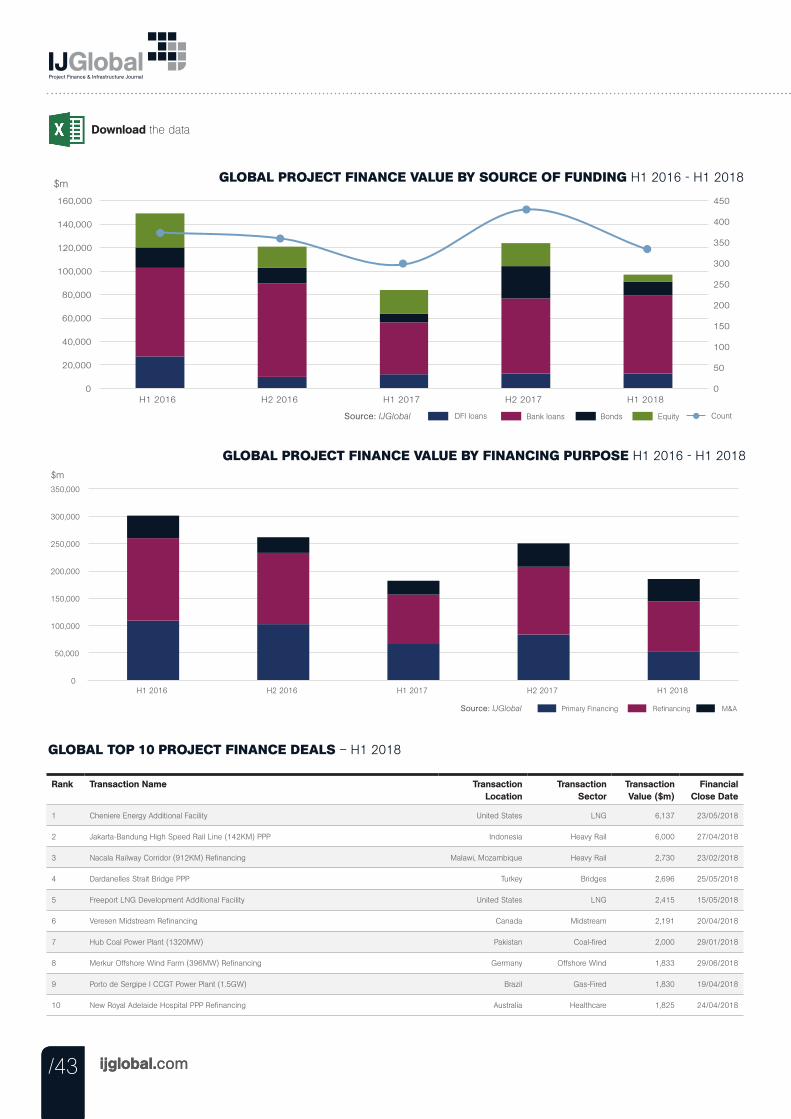
/43 ijglobal.com
Download the data
/43 ijglobal.com
GLOBAL PROJECT FINANCE VALUE BY SOURCE OF FUNDING H1 2016 - H1 2018$m
Bank loans DFI loans Bonds Equity Source: IJGlobal Count
0
50
100
150
200
250
300
350
400
450
0
20,000
40,000
60,000
80,000
100,000
120,000
140,000
160,000
H1 2016 H2 2016 H1 2017 H2 2017 H1 2018
$m
0
50,000
100,000
150,000
200,000
250,000
300,000
350,000
H1 2016 H2 2016 H1 2017 H2 2017 H1 2018
Source: IJGlobal Primary Financing Refinancing M&A
GLOBAL PROJECT FINANCE VALUE BY FINANCING PURPOSE H1 2016 - H1 2018
GLOBAL TOP 10 PROJECT FINANCE DEALS – H1 2018
Rank Transaction Name Transaction Location
Transaction Sector
Transaction Value ($m)
Financial Close Date
1 Cheniere Energy Additional Facility United States LNG 6,137 23/05/2018
2 Jakarta-Bandung High Speed Rail Line (142KM) PPP Indonesia Heavy Rail 6,000 27/04/2018
3 Nacala Railway Corridor (912KM) Refinancing Malawi, Mozambique Heavy Rail 2,730 23/02/2018
4 Dardanelles Strait Bridge PPP Turkey Bridges 2,696 25/05/2018
5 Freeport LNG Development Additional Facility United States LNG 2,415 15/05/2018
6 Veresen Midstream Refinancing Canada Midstream 2,191 20/04/2018
7 Hub Coal Power Plant (1320MW) Pakistan Coal-fired 2,000 29/01/2018
8 Merkur Offshore Wind Farm (396MW) Refinancing Germany Offshore Wind 1,833 29/06/2018
9 Porto de Sergipe I CCGT Power Plant (1.5GW) Brazil Gas-Fired 1,830 19/04/2018
10 New Royal Adelaide Hospital PPP Refinancing Australia Healthcare 1,825 24/04/2018
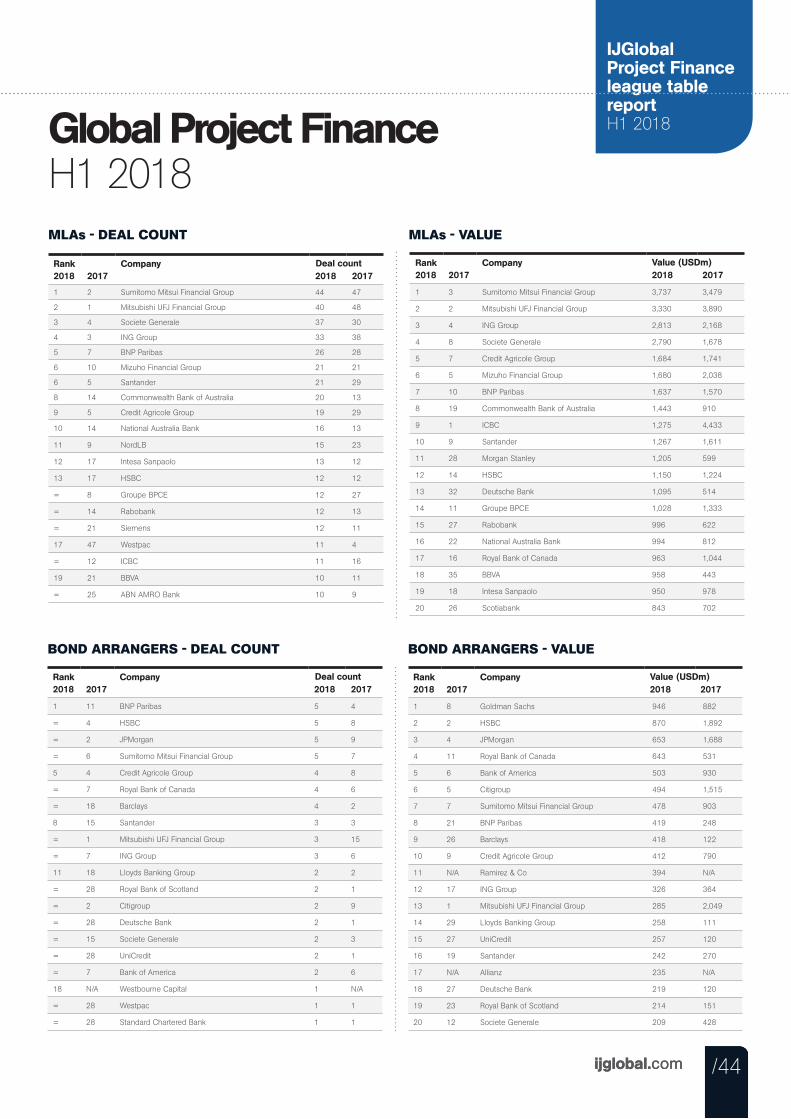
/44ijglobal.com
IJGlobal Project Finance league table report H1 2018
/44ijglobal.com /44
Global Project Finance H1 2018MLAs - DEAL COUNT MLAs - VALUE
Rank2018 2017
Company2018 2017
1 2 Sumitomo Mitsui Financial Group 44 47
2 1 Mitsubishi UFJ Financial Group 40 48
3 4 Societe Generale 37 30
4 3 ING Group 33 38
5 7 BNP Paribas 26 28
6 10 Mizuho Financial Group 21 21
6 5 Santander 21 29
8 14 Commonwealth Bank of Australia 20 13
9 5 Credit Agricole Group 19 29
10 14 National Australia Bank 16 13
11 9 NordLB 15 23
12 17 Intesa Sanpaolo 13 12
13 17 HSBC 12 12
= 8 Groupe BPCE 12 27
= 14 Rabobank 12 13
= 21 Siemens 12 11
17 47 Westpac 11 4
= 12 ICBC 11 16
19 21 BBVA 10 11
= 25 ABN AMRO Bank 10 9
Deal count Rank2018 2017
Company2018 2017
1 3 Sumitomo Mitsui Financial Group 3,737 3,479
2 2 Mitsubishi UFJ Financial Group 3,330 3,890
3 4 ING Group 2,813 2,168
4 8 Societe Generale 2,790 1,678
5 7 Credit Agricole Group 1,684 1,741
6 5 Mizuho Financial Group 1,680 2,038
7 10 BNP Paribas 1,637 1,570
8 19 Commonwealth Bank of Australia 1,443 910
9 1 ICBC 1,275 4,433
10 9 Santander 1,267 1,611
11 28 Morgan Stanley 1,205 599
12 14 HSBC 1,150 1,224
13 32 Deutsche Bank 1,095 514
14 11 Groupe BPCE 1,028 1,333
15 27 Rabobank 996 622
16 22 National Australia Bank 994 812
17 16 Royal Bank of Canada 963 1,044
18 35 BBVA 958 443
19 18 Intesa Sanpaolo 950 978
20 26 Scotiabank 843 702
Value (USDm)
BOND ARRANGERS - DEAL COUNT BOND ARRANGERS - VALUE
Rank2018 2017
Company2018 2017
1 11 BNP Paribas 5 4
= 4 HSBC 5 8
= 2 JPMorgan 5 9
= 6 Sumitomo Mitsui Financial Group 5 7
5 4 Credit Agricole Group 4 8
= 7 Royal Bank of Canada 4 6
= 18 Barclays 4 2
8 15 Santander 3 3
= 1 Mitsubishi UFJ Financial Group 3 15
= 7 ING Group 3 6
11 18 Lloyds Banking Group 2 2
= 28 Royal Bank of Scotland 2 1
= 2 Citigroup 2 9
= 28 Deutsche Bank 2 1
= 15 Societe Generale 2 3
= 28 UniCredit 2 1
= 7 Bank of America 2 6
18 N/A Westbourne Capital 1 N/A
= 28 Westpac 1 1
= 28 Standard Chartered Bank 1 1
Deal count Rank2018 2017
Company2018 2017
1 8 Goldman Sachs 946 882
2 2 HSBC 870 1,892
3 4 JPMorgan 653 1,688
4 11 Royal Bank of Canada 643 531
5 6 Bank of America 503 930
6 5 Citigroup 494 1,515
7 7 Sumitomo Mitsui Financial Group 478 903
8 21 BNP Paribas 419 248
9 26 Barclays 418 122
10 9 Credit Agricole Group 412 790
11 N/A Ramirez & Co 394 N/A
12 17 ING Group 326 364
13 1 Mitsubishi UFJ Financial Group 285 2,049
14 29 Lloyds Banking Group 258 111
15 27 UniCredit 257 120
16 19 Santander 242 270
17 N/A Allianz 235 N/A
18 27 Deutsche Bank 219 120
19 23 Royal Bank of Scotland 214 151
20 12 Societe Generale 209 428
Value (USDm)
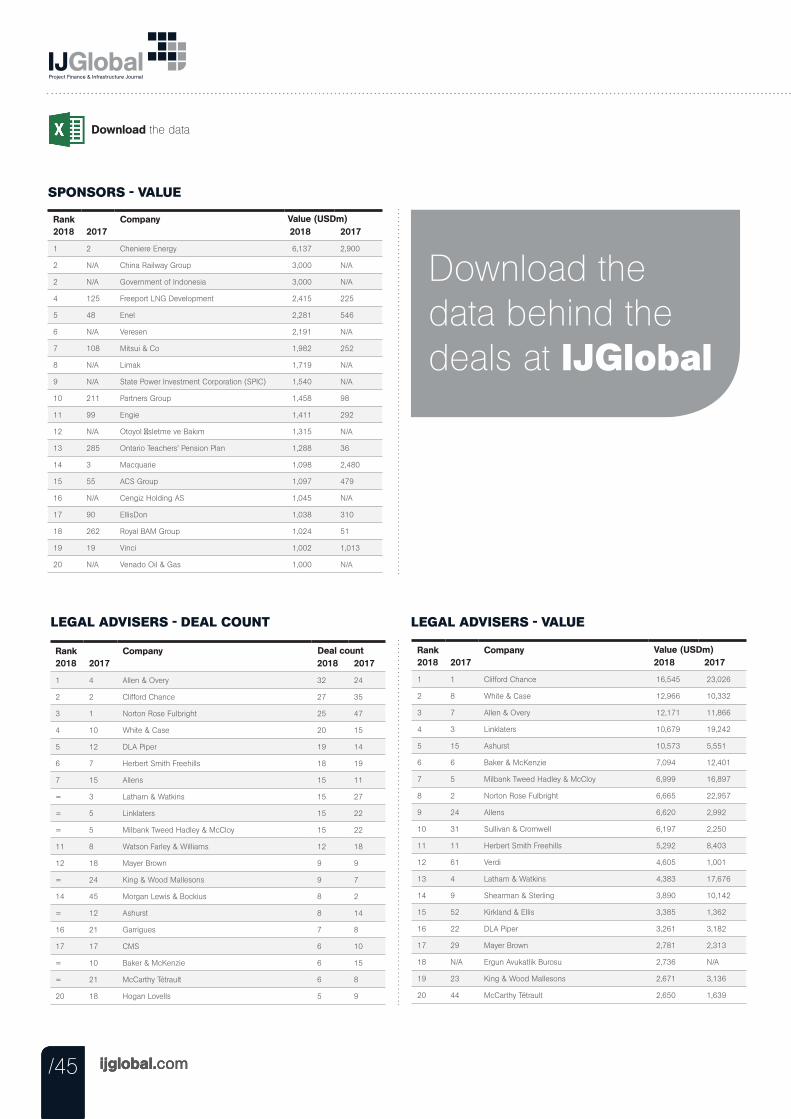
/45 ijglobal.com
Download the data
/45 ijglobal.com/45 ijglobal.com
LEGAL ADVISERS - DEAL COUNT LEGAL ADVISERS - VALUE
Rank2018 2017
Company2018 2017
1 4 Allen & Overy 32 24
2 2 Clifford Chance 27 35
3 1 Norton Rose Fulbright 25 47
4 10 White & Case 20 15
5 12 DLA Piper 19 14
6 7 Herbert Smith Freehills 18 19
7 15 Allens 15 11
= 3 Latham & Watkins 15 27
= 5 Linklaters 15 22
= 5 Milbank Tweed Hadley & McCloy 15 22
11 8 Watson Farley & Williams 12 18
12 18 Mayer Brown 9 9
= 24 King & Wood Mallesons 9 7
14 45 Morgan Lewis & Bockius 8 2
= 12 Ashurst 8 14
16 21 Garrigues 7 8
17 17 CMS 6 10
= 10 Baker & McKenzie 6 15
= 21 McCarthy Tétrault 6 8
20 18 Hogan Lovells 5 9
Deal count Rank2018 2017
Company2018 2017
1 1 Clifford Chance 16,545 23,026
2 8 White & Case 12,966 10,332
3 7 Allen & Overy 12,171 11,866
4 3 Linklaters 10,679 19,242
5 15 Ashurst 10,573 5,551
6 6 Baker & McKenzie 7,094 12,401
7 5 Milbank Tweed Hadley & McCloy 6,999 16,897
8 2 Norton Rose Fulbright 6,665 22,957
9 24 Allens 6,620 2,992
10 31 Sullivan & Cromwell 6,197 2,250
11 11 Herbert Smith Freehills 5,292 8,403
12 61 Verdi 4,605 1,001
13 4 Latham & Watkins 4,383 17,676
14 9 Shearman & Sterling 3,890 10,142
15 52 Kirkland & Ellis 3,385 1,362
16 22 DLA Piper 3,261 3,182
17 29 Mayer Brown 2,781 2,313
18 N/A Ergun Avukatlik Burosu 2,736 N/A
19 23 King & Wood Mallesons 2,671 3,136
20 44 McCarthy Tétrault 2,650 1,639
Value (USDm)
SPONSORS - VALUE
Rank2018 2017
Company2018 2017
1 2 Cheniere Energy 6,137 2,900
2 N/A China Railway Group 3,000 N/A
2 N/A Government of Indonesia 3,000 N/A
4 125 Freeport LNG Development 2,415 225
5 48 Enel 2,281 546
6 N/A Veresen 2,191 N/A
7 108 Mitsui & Co 1,982 252
8 N/A Limak 1,719 N/A
9 N/A State Power Investment Corporation (SPIC) 1,540 N/A
10 211 Partners Group 1,458 98
11 99 Engie 1,411 292
12 N/A Otoyol İsletme ve Bakım 1,315 N/A
13 285 Ontario Teachers' Pension Plan 1,288 36
14 3 Macquarie 1,098 2,480
15 55 ACS Group 1,097 479
16 N/A Cengiz Holding AS 1,045 N/A
17 90 EllisDon 1,038 310
18 262 Royal BAM Group 1,024 51
19 19 Vinci 1,002 1,013
20 N/A Venado Oil & Gas 1,000 N/A
Value (USDm)
Download the data behind the deals at IJGlobal
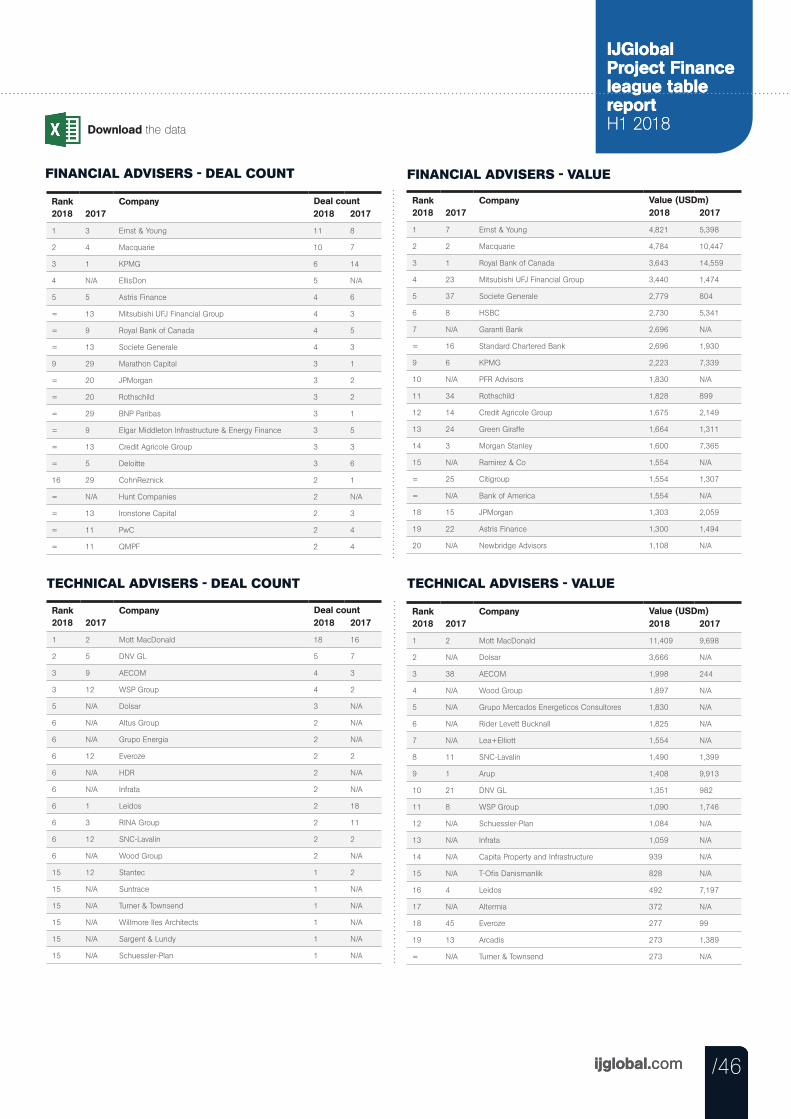
/46ijglobal.com
IJGlobal Project Finance league table report H1 2018Download the data
/46ijglobal.com
IJGlobal Project Finance league table report H1 2018
/46
TECHNICAL ADVISERS - DEAL COUNT TECHNICAL ADVISERS - VALUE
Rank2018 2017
Company2018 2017
1 2 Mott MacDonald 11,409 9,698
2 N/A Dolsar 3,666 N/A
3 38 AECOM 1,998 244
4 N/A Wood Group 1,897 N/A
5 N/A Grupo Mercados Energeticos Consultores 1,830 N/A
6 N/A Rider Levett Bucknall 1,825 N/A
7 N/A Lea+Elliott 1,554 N/A
8 11 SNC-Lavalin 1,490 1,399
9 1 Arup 1,408 9,913
10 21 DNV GL 1,351 982
11 8 WSP Group 1,090 1,746
12 N/A Schuessler-Plan 1,084 N/A
13 N/A Infrata 1,059 N/A
14 N/A Capita Property and Infrastructure 939 N/A
15 N/A T-Ofis Danismanlik 828 N/A
16 4 Leidos 492 7,197
17 N/A Altermia 372 N/A
18 45 Everoze 277 99
19 13 Arcadis 273 1,389
= N/A Turner & Townsend 273 N/A
Value (USDm)
FINANCIAL ADVISERS - DEAL COUNT FINANCIAL ADVISERS - VALUE
Rank2018 2017
Company2018 2017
1 7 Ernst & Young 4,821 5,398
2 2 Macquarie 4,784 10,447
3 1 Royal Bank of Canada 3,643 14,559
4 23 Mitsubishi UFJ Financial Group 3,440 1,474
5 37 Societe Generale 2,779 804
6 8 HSBC 2,730 5,341
7 N/A Garanti Bank 2,696 N/A
= 16 Standard Chartered Bank 2,696 1,930
9 6 KPMG 2,223 7,339
10 N/A PFR Advisors 1,830 N/A
11 34 Rothschild 1,828 899
12 14 Credit Agricole Group 1,675 2,149
13 24 Green Giraffe 1,664 1,311
14 3 Morgan Stanley 1,600 7,365
15 N/A Ramirez & Co 1,554 N/A
= 25 Citigroup 1,554 1,307
= N/A Bank of America 1,554 N/A
18 15 JPMorgan 1,303 2,059
19 22 Astris Finance 1,300 1,494
20 N/A Newbridge Advisors 1,108 N/A
Value (USDm)Rank2018 2017
Company2018 2017
1 3 Ernst & Young 11 8
2 4 Macquarie 10 7
3 1 KPMG 6 14
4 N/A EllisDon 5 N/A
5 5 Astris Finance 4 6
= 13 Mitsubishi UFJ Financial Group 4 3
= 9 Royal Bank of Canada 4 5
= 13 Societe Generale 4 3
9 29 Marathon Capital 3 1
= 20 JPMorgan 3 2
= 20 Rothschild 3 2
= 29 BNP Paribas 3 1
= 9 Elgar Middleton Infrastructure & Energy Finance 3 5
= 13 Credit Agricole Group 3 3
= 5 Deloitte 3 6
16 29 CohnReznick 2 1
= N/A Hunt Companies 2 N/A
= 13 Ironstone Capital 2 3
= 11 PwC 2 4
= 11 QMPF 2 4
Deal count
Rank2018 2017
Company2018 2017
1 2 Mott MacDonald 18 16
2 5 DNV GL 5 7
3 9 AECOM 4 3
3 12 WSP Group 4 2
5 N/A Dolsar 3 N/A
6 N/A Altus Group 2 N/A
6 N/A Grupo Energia 2 N/A
6 12 Everoze 2 2
6 N/A HDR 2 N/A
6 N/A Infrata 2 N/A
6 1 Leidos 2 18
6 3 RINA Group 2 11
6 12 SNC-Lavalin 2 2
6 N/A Wood Group 2 N/A
15 12 Stantec 1 2
15 N/A Suntrace 1 N/A
15 N/A Turner & Townsend 1 N/A
15 N/A Willmore Iles Architects 1 N/A
15 N/A Sargent & Lundy 1 N/A
15 N/A Schuessler-Plan 1 N/A
Deal count
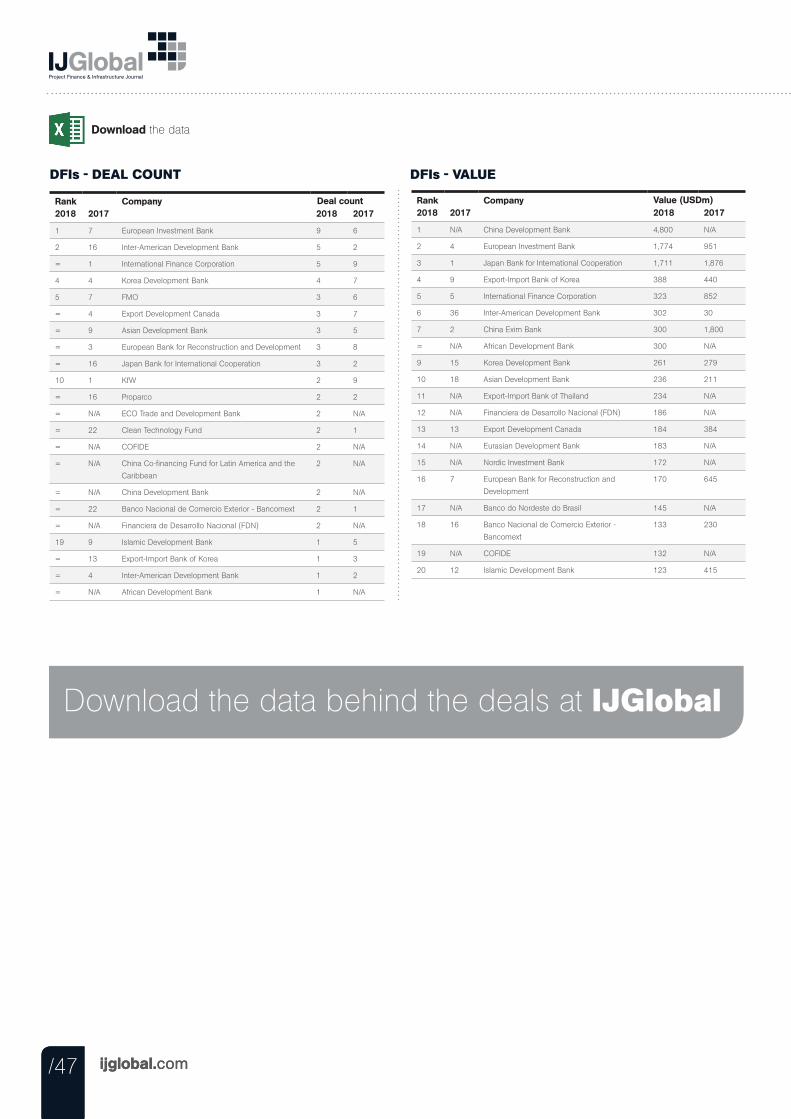
/47 ijglobal.com
Download the data
/47 ijglobal.com
DFIs - DEAL COUNT DFIs - VALUE
Rank2018 2017
Company2018 2017
1 7 European Investment Bank 9 6
2 16 Inter-American Development Bank 5 2
= 1 International Finance Corporation 5 9
4 4 Korea Development Bank 4 7
5 7 FMO 3 6
= 4 Export Development Canada 3 7
= 9 Asian Development Bank 3 5
= 3 European Bank for Reconstruction and Development 3 8
= 16 Japan Bank for International Cooperation 3 2
10 1 KfW 2 9
= 16 Proparco 2 2
= N/A ECO Trade and Development Bank 2 N/A
= 22 Clean Technology Fund 2 1
= N/A COFIDE 2 N/A
= N/A China Co-financing Fund for Latin America and the
Caribbean
2 N/A
= N/A China Development Bank 2 N/A
= 22 Banco Nacional de Comercio Exterior - Bancomext 2 1
= N/A Financiera de Desarrollo Nacional (FDN) 2 N/A
19 9 Islamic Development Bank 1 5
= 13 Export-Import Bank of Korea 1 3
= 4 Inter-American Development Bank 1 2
= N/A African Development Bank 1 N/A
Deal count Rank2018 2017
Company2018 2017
1 N/A China Development Bank 4,800 N/A
2 4 European Investment Bank 1,774 951
3 1 Japan Bank for International Cooperation 1,711 1,876
4 9 Export-Import Bank of Korea 388 440
5 5 International Finance Corporation 323 852
6 36 Inter-American Development Bank 302 30
7 2 China Exim Bank 300 1,800
= N/A African Development Bank 300 N/A
9 15 Korea Development Bank 261 279
10 18 Asian Development Bank 236 211
11 N/A Export-Import Bank of Thailand 234 N/A
12 N/A Financiera de Desarrollo Nacional (FDN) 186 N/A
13 13 Export Development Canada 184 384
14 N/A Eurasian Development Bank 183 N/A
15 N/A Nordic Investment Bank 172 N/A
16 7 European Bank for Reconstruction and
Development
170 645
17 N/A Banco do Nordeste do Brasil 145 N/A
18 16 Banco Nacional de Comercio Exterior -
Bancomext
133 230
19 N/A COFIDE 132 N/A
20 12 Islamic Development Bank 123 415
Value (USDm)
Download the data behind the deals at IJGlobal
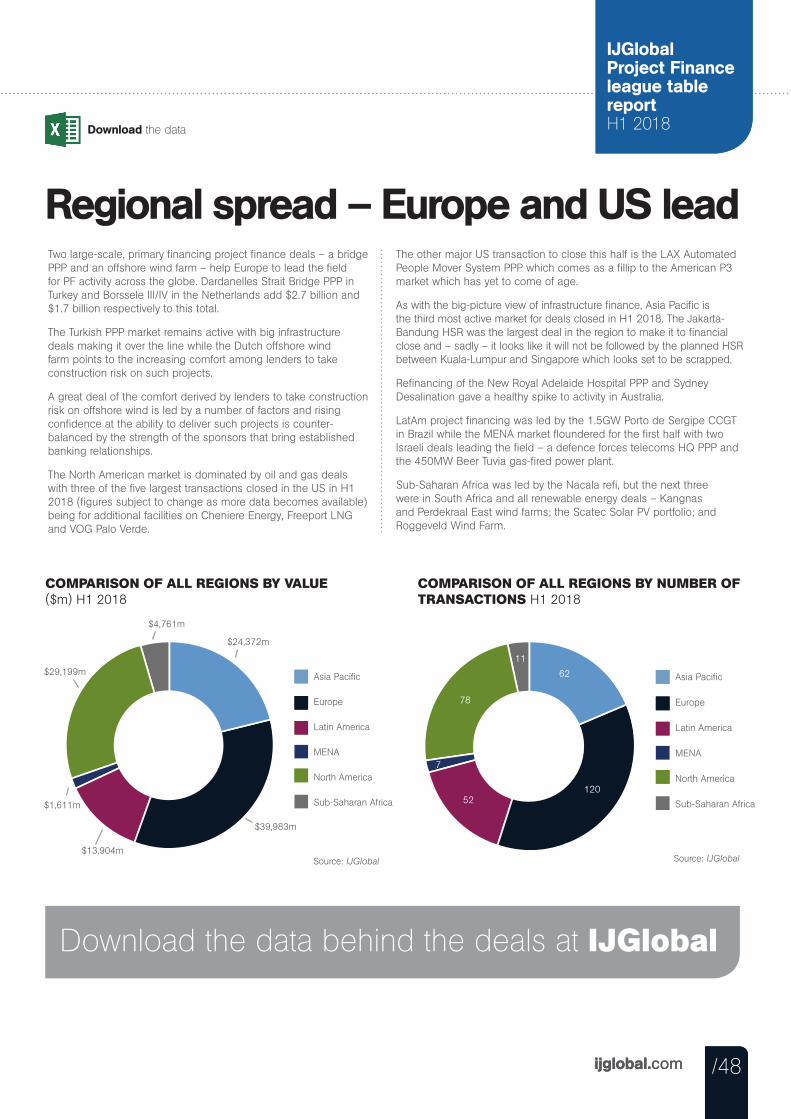
/48ijglobal.com
IJGlobal Project Finance league table report H1 2018Download the data
/48ijglobal.com
Europe Infrastructure FinanceLeague Tables H1 2018
IJGlobal Project Finance league table report H1 2018
COMPARISON OF ALL REGIONS BY VALUE ($m) H1 2018
Asia Pacific
Europe
Latin America
MENA
North America
Sub-Saharan Africa
$24,372m
$39,983m
$13,904m
$1,611m
$29,199m
$4,761m
COMPARISON OF ALL REGIONS BY NUMBER OF TRANSACTIONS H1 2018
Asia Pacific
Europe
Latin America
MENA
North America
Sub-Saharan Africa
120
62
52
7
78
11
Regional spread – Europe and US leadTwo large-scale, primary financing project finance deals – a bridge PPP and an offshore wind farm – help Europe to lead the field for PF activity across the globe. Dardanelles Strait Bridge PPP in Turkey and Borssele III/IV in the Netherlands add $2.7 billion and $1.7 billion respectively to this total.
The Turkish PPP market remains active with big infrastructure deals making it over the line while the Dutch offshore wind farm points to the increasing comfort among lenders to take construction risk on such projects.
A great deal of the comfort derived by lenders to take construction risk on offshore wind is led by a number of factors and rising confidence at the ability to deliver such projects is counter-balanced by the strength of the sponsors that bring established banking relationships.
The North American market is dominated by oil and gas deals with three of the five largest transactions closed in the US in H1 2018 (figures subject to change as more data becomes available) being for additional facilities on Cheniere Energy, Freeport LNG and VOG Palo Verde.
The other major US transaction to close this half is the LAX Automated People Mover System PPP which comes as a fillip to the American P3 market which has yet to come of age.
As with the big-picture view of infrastructure finance, Asia Pacific is the third most active market for deals closed in H1 2018. The Jakarta-Bandung HSR was the largest deal in the region to make it to financial close and – sadly – it looks like it will not be followed by the planned HSR between Kuala-Lumpur and Singapore which looks set to be scrapped.
Refinancing of the New Royal Adelaide Hospital PPP and Sydney Desalination gave a healthy spike to activity in Australia.
LatAm project financing was led by the 1.5GW Porto de Sergipe CCGT in Brazil while the MENA market floundered for the first half with two Israeli deals leading the field – a defence forces telecoms HQ PPP and the 450MW Beer Tuvia gas-fired power plant.
Sub-Saharan Africa was led by the Nacala refi, but the next three were in South Africa and all renewable energy deals – Kangnas and Perdekraal East wind farms; the Scatec Solar PV portfolio; and Roggeveld Wind Farm.
Download the data behind the deals at IJGlobal
Source: IJGlobal Source: IJGlobal
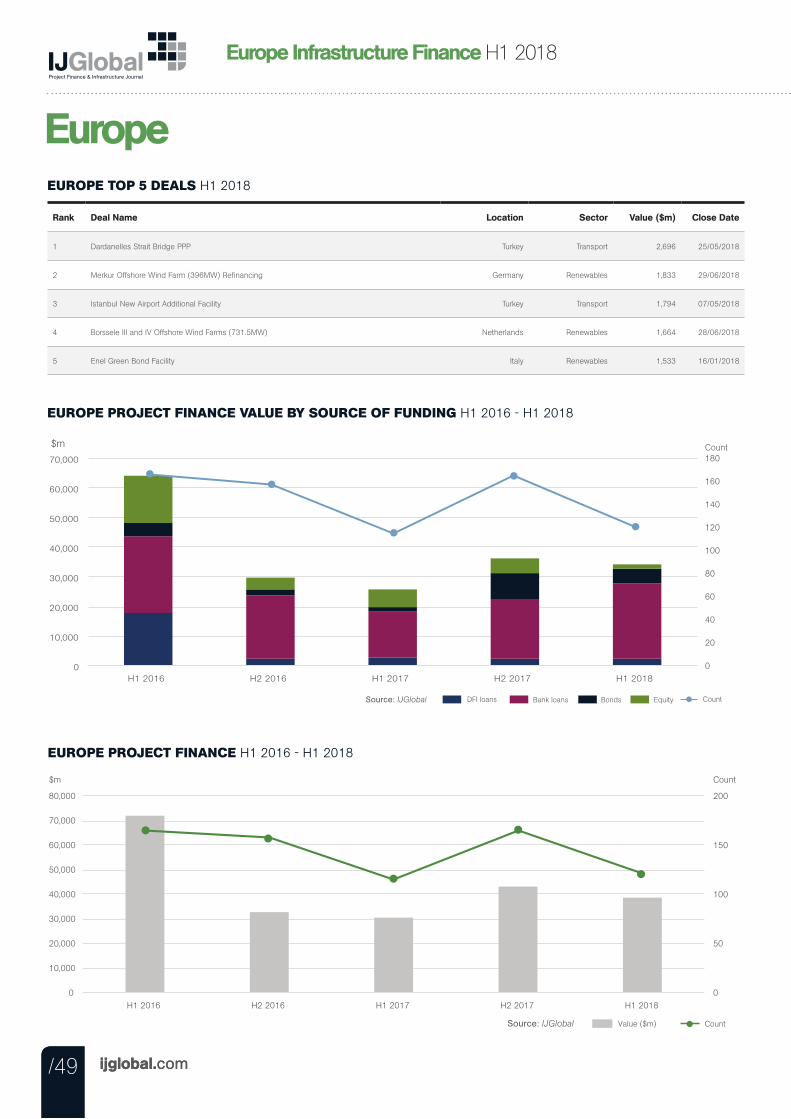
/49 ijglobal.com
Europe Infrastructure Finance H1 2018
/49 ijglobal.com
EuropeEUROPE TOP 5 DEALS H1 2018
Rank Deal Name Location Sector Value ($m) Close Date
1 Dardanelles Strait Bridge PPP Turkey Transport 2,696 25/05/2018
2 Merkur Offshore Wind Farm (396MW) Refinancing Germany Renewables 1,833 29/06/2018
3 Istanbul New Airport Additional Facility Turkey Transport 1,794 07/05/2018
4 Borssele III and IV Offshore Wind Farms (731.5MW) Netherlands Renewables 1,664 28/06/2018
5 Enel Green Bond Facility Italy Renewables 1,533 16/01/2018
EUROPE PROJECT FINANCE VALUE BY SOURCE OF FUNDING H1 2016 - H1 2018
$m
Bank loans DFI loans Bonds Equity Source: IJGlobal Count
0
20
40
60
80
100
120
140
160
180
0
10,000
20,000
30,000
40,000
50,000
60,000
70,000
H1 2016 H2 2016 H1 2017 H2 2017 H1 2018
Count
EUROPE PROJECT FINANCE H1 2016 - H1 2018
$m Count
Value ($m) Count Source: IJGlobal
0
50
100
150
200
0
10,000
20,000
30,000
40,000
50,000
60,000
70,000
80,000
H1 2016 H2 2016 H1 2017 H2 2017 H1 2018

/50ijglobal.com
Europe Infrastructure FinanceLeague Tables H1 2018Download the data
/50
Europe Project FinanceLeague Tables H1 2018
MLAs - VALUE
Rank2018 2017
Company2018 2017
1 2 ING Group 1,036 968
2 9 BNP Paribas 978 728
3 6 Societe Generale 834 860
4 104 Vakifbank 646 13
5 N/A Kuwait Finance House 636 N/A
6 5 Credit Agricole Group 632 885
7 N/A Yapi Kredi 611 N/A
8 12 Sumitomo Mitsui Financial Group 549 640
9 67 DekaBank 541 58
10 21 Rabobank 539 430
11 57 Isbank 532 87
12 18 UniCredit 517 480
13 82 Garanti Bank 500 38
14 103 Belfius Bank 486 15
15 11 Mitsubishi UFJ Financial Group 467 659
16 83 Ziraat Bankası 464 35
17 8 Intesa Sanpaolo 442 731
18 95 Landesbank Baden-Wurttemberg 437 20
19 4 Santander 426 906
20 13 NordLB 394 627
Value (USDm)
BOND ARRANGERS - VALUE
Rank2018 2017
Company2018 2017
1 2 ING Group 1,036 968
2 9 BNP Paribas 978 728
3 6 Societe Generale 834 860
4 104 Vakifbank 646 13
5 N/A Kuwait Finance House 636 N/A
6 5 Credit Agricole Group 632 885
7 N/A Yapi Kredi 611 N/A
8 12 Sumitomo Mitsui Financial Group 549 640
9 67 DekaBank 541 58
10 21 Rabobank 539 430
11 57 Isbank 532 87
12 18 UniCredit 517 480
13 40 KfW 506 154
14 82 Garanti Bank 500 38
15 103 Belfius Bank 486 15
16 11 Mitsubishi UFJ Financial Group 467 659
17 83 Ziraat Bankası 464 35
18 8 Intesa Sanpaolo 442 731
19 95 Landesbank Baden-Wurttemberg 437 20
20 4 Santander 426 906
Value (USDm)
FINANCIAL ADVISERS - VALUE
Rank2018 2017
Company2018 2017
1 N/A Societe Generale 2,779 N/A
2 N/A Standard Chartered Bank 2,696 N/A
= N/A Garanti Bank 2,696 N/A
4 35 Credit Agricole Group 1,675 82
5 21 Green Giraffe 1,664 879
6 6 Ernst & Young 1,540 2,547
7 N/A Newbridge Advisors 1,108 N/A
8 12 Mitsubishi UFJ Financial Group 1,084 1,368
9 N/A Nomura 986 N/A
10 28 Rebel Group 971 292
= N/A J.C. Rathbone & Associates 971 N/A
12 18 UniCredit 828 1,252
= N/A Yapi Kredi 828 N/A
14 20 PwC 519 889
= N/A DnB NOR Bank 519 N/A
16 23 Astris Finance 442 705
17 N/A Groupe BPCE 431 N/A
18 N/A CaixaBank 345 N/A
= 7 Santander 345 2,165
20 N/A National Development Finance Agency
(Ireland)
273 N/A
Value (USDm)
LEGAL ADVISERS - VALUE
Rank2018 2017
Company2018 2017
1 1 Clifford Chance 12,914 15,941
2 6 Allen & Overy 8,399 5,279
3 20 Verdi 4,605 1,001
4 10 White & Case 3,691 2,170
5 2 Linklaters 3,360 12,909
6 N/A Ergun Avukatlik Burosu 2,736 N/A
7 N/A Shearman & Sterling 2,696 N/A
8 29 DLA Piper 2,103 791
9 9 Ashurst 2,051 2,507
10 N/A Winston & Strawn 1,908 N/A
= 20 Lexist 1,908 1,001
12 17 GKC Partners 1,757 1,252
= N/A Goksu Safi Isik 1,757 N/A
14 12 Herbert Smith Freehills 1,400 1,775
15 11 Hogan Lovells 1,301 2,135
16 38 Bonelli Erede Pappalardo 1,260 323
17 N/A Greenberg Traurig 1,084 N/A
18 N/A De Brauw Blackstone Westbroek 971 N/A
= 55 Nauta Dutilh 971 169
20 45 Cuatrecasas 963 267
Value (USDm)
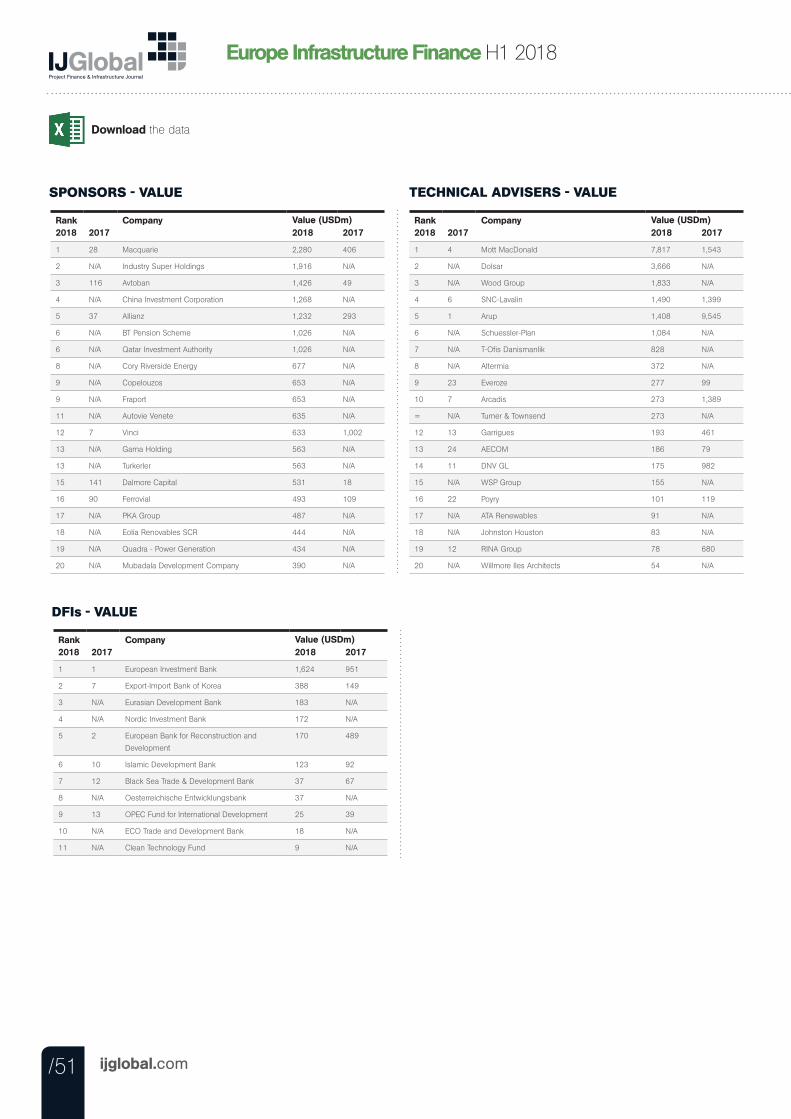
/51 ijglobal.com
Download the data
Europe Infrastructure Finance H1 2018
SPONSORS - VALUE
Rank2018 2017
Company2018 2017
1 28 Macquarie 2,280 406
2 N/A Industry Super Holdings 1,916 N/A
3 116 Avtoban 1,426 49
4 N/A China Investment Corporation 1,268 N/A
5 37 Allianz 1,232 293
6 N/A BT Pension Scheme 1,026 N/A
6 N/A Qatar Investment Authority 1,026 N/A
8 N/A Cory Riverside Energy 677 N/A
9 N/A Copelouzos 653 N/A
9 N/A Fraport 653 N/A
11 N/A Autovie Venete 635 N/A
12 7 Vinci 633 1,002
13 N/A Gama Holding 563 N/A
13 N/A Turkerler 563 N/A
15 141 Dalmore Capital 531 18
16 90 Ferrovial 493 109
17 N/A PKA Group 487 N/A
18 N/A Eolia Renovables SCR 444 N/A
19 N/A Quadra - Power Generation 434 N/A
20 N/A Mubadala Development Company 390 N/A
Value (USDm)
TECHNICAL ADVISERS - VALUE
Rank2018 2017
Company2018 2017
1 4 Mott MacDonald 7,817 1,543
2 N/A Dolsar 3,666 N/A
3 N/A Wood Group 1,833 N/A
4 6 SNC-Lavalin 1,490 1,399
5 1 Arup 1,408 9,545
6 N/A Schuessler-Plan 1,084 N/A
7 N/A T-Ofis Danismanlik 828 N/A
8 N/A Altermia 372 N/A
9 23 Everoze 277 99
10 7 Arcadis 273 1,389
= N/A Turner & Townsend 273 N/A
12 13 Garrigues 193 461
13 24 AECOM 186 79
14 11 DNV GL 175 982
15 N/A WSP Group 155 N/A
16 22 Poyry 101 119
17 N/A ATA Renewables 91 N/A
18 N/A Johnston Houston 83 N/A
19 12 RINA Group 78 680
20 N/A Willmore Iles Architects 54 N/A
Value (USDm)
DFIs - VALUE
Rank2018 2017
Company2018 2017
1 1 European Investment Bank 1,624 951
2 7 Export-Import Bank of Korea 388 149
3 N/A Eurasian Development Bank 183 N/A
4 N/A Nordic Investment Bank 172 N/A
5 2 European Bank for Reconstruction and
Development
170 489
6 10 Islamic Development Bank 123 92
7 12 Black Sea Trade & Development Bank 37 67
8 N/A Oesterreichische Entwicklungsbank 37 N/A
9 13 OPEC Fund for International Development 25 39
10 N/A ECO Trade and Development Bank 18 N/A
11 N/A Clean Technology Fund 9 N/A
Value (USDm)
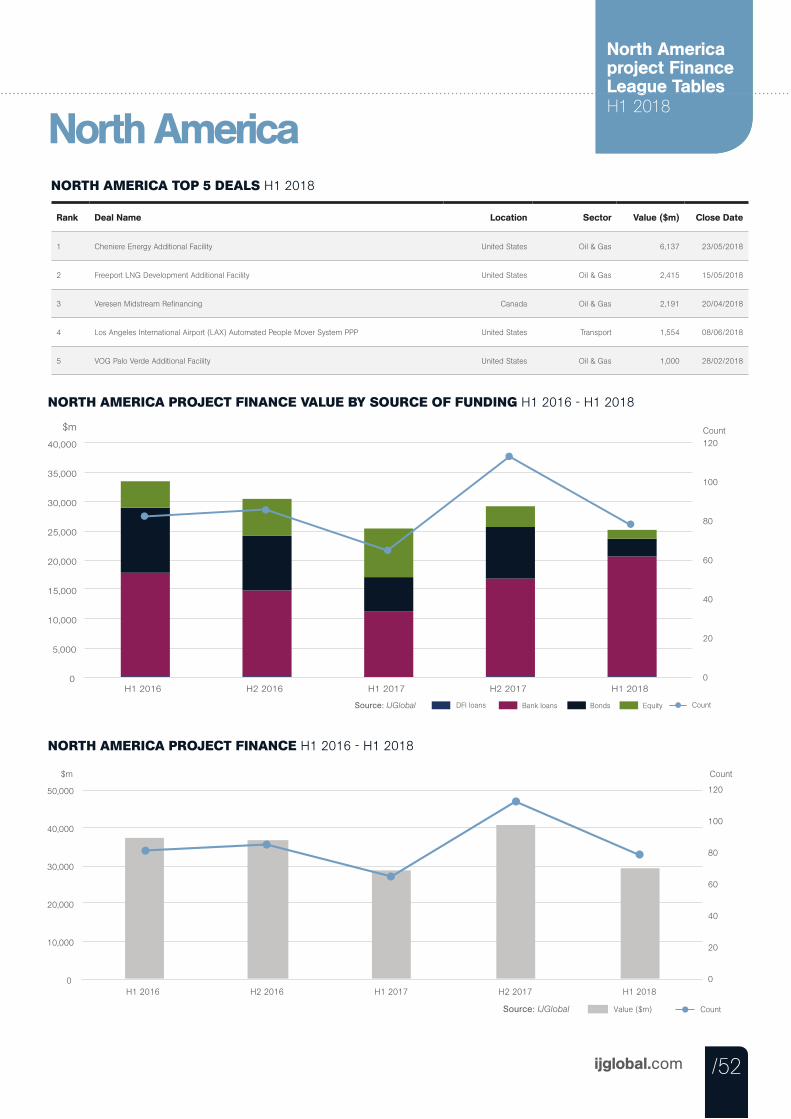
/52ijglobal.com
Europe Infrastructure FinanceLeague Tables H1 2018
North America project FinanceLeague Tables H1 2018
North AmericaNORTH AMERICA TOP 5 DEALS H1 2018
Rank Deal Name Location Sector Value ($m) Close Date
1 Cheniere Energy Additional Facility United States Oil & Gas 6,137 23/05/2018
2 Freeport LNG Development Additional Facility United States Oil & Gas 2,415 15/05/2018
3 Veresen Midstream Refinancing Canada Oil & Gas 2,191 20/04/2018
4 Los Angeles International Airport (LAX) Automated People Mover System PPP United States Transport 1,554 08/06/2018
5 VOG Palo Verde Additional Facility United States Oil & Gas 1,000 28/02/2018
NORTH AMERICA PROJECT FINANCE VALUE BY SOURCE OF FUNDING H1 2016 - H1 2018
Bank loans DFI loans Bonds Equity Source: IJGlobal Count
$m
0
20
40
60
80
100
120
0
5,000
10,000
15,000
20,000
25,000
30,000
35,000
40,000
H1 2016 H2 2016 H1 2017 H2 2017 H1 2018
Count
NORTH AMERICA PROJECT FINANCE H1 2016 - H1 2018
$m Count
Value ($m) Count Source: IJGlobal
0
20
40
60
80
100
120
0
10,000
20,000
30,000
40,000
50,000
H1 2016 H2 2016 H1 2017 H2 2017 H1 2018
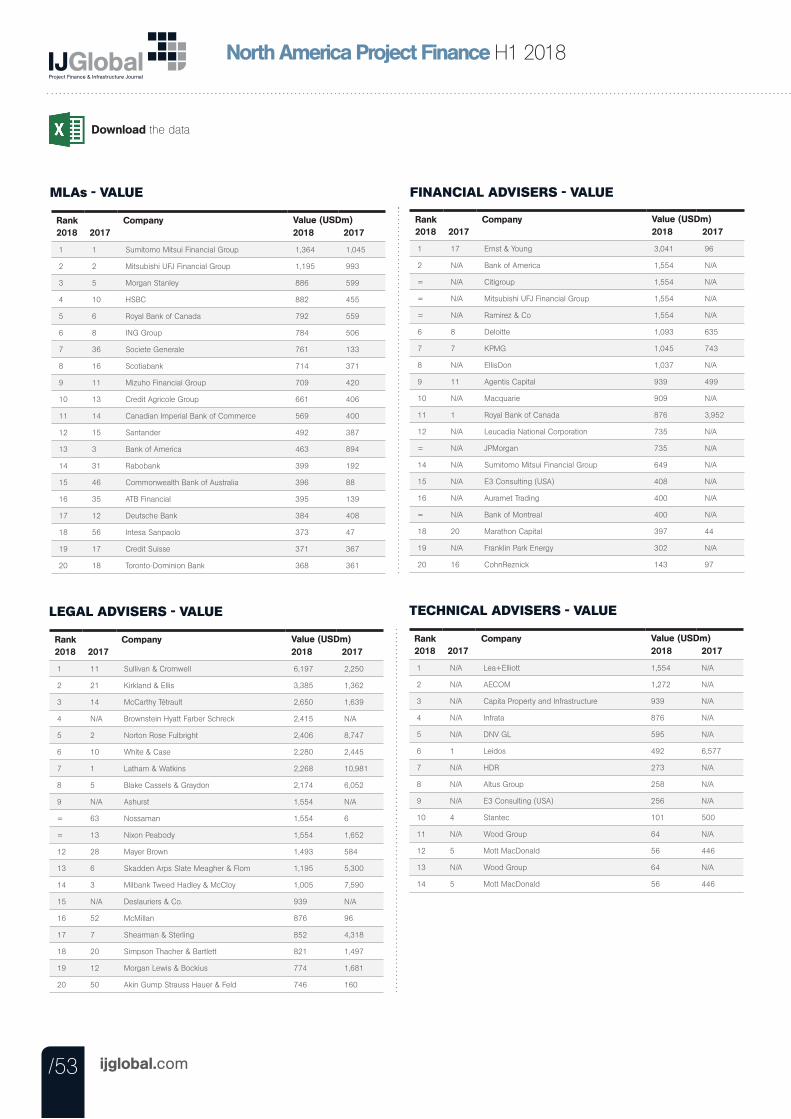
/53 ijglobal.com
North America Project Finance H1 2018
MLAs - VALUE
Rank2018 2017
Company2018 2017
1 1 Sumitomo Mitsui Financial Group 1,364 1,045
2 2 Mitsubishi UFJ Financial Group 1,195 993
3 5 Morgan Stanley 886 599
4 10 HSBC 882 455
5 6 Royal Bank of Canada 792 559
6 8 ING Group 784 506
7 36 Societe Generale 761 133
8 16 Scotiabank 714 371
9 11 Mizuho Financial Group 709 420
10 13 Credit Agricole Group 661 406
11 14 Canadian Imperial Bank of Commerce 569 400
12 15 Santander 492 387
13 3 Bank of America 463 894
14 31 Rabobank 399 192
15 46 Commonwealth Bank of Australia 396 88
16 35 ATB Financial 395 139
17 12 Deutsche Bank 384 408
18 56 Intesa Sanpaolo 373 47
19 17 Credit Suisse 371 367
20 18 Toronto-Dominion Bank 368 361
Value (USDm)
FINANCIAL ADVISERS - VALUE
Rank2018 2017
Company2018 2017
1 17 Ernst & Young 3,041 96
2 N/A Bank of America 1,554 N/A
= N/A Citigroup 1,554 N/A
= N/A Mitsubishi UFJ Financial Group 1,554 N/A
= N/A Ramirez & Co 1,554 N/A
6 8 Deloitte 1,093 635
7 7 KPMG 1,045 743
8 N/A EllisDon 1,037 N/A
9 11 Agentis Capital 939 499
10 N/A Macquarie 909 N/A
11 1 Royal Bank of Canada 876 3,952
12 N/A Leucadia National Corporation 735 N/A
= N/A JPMorgan 735 N/A
14 N/A Sumitomo Mitsui Financial Group 649 N/A
15 N/A E3 Consulting (USA) 408 N/A
16 N/A Auramet Trading 400 N/A
= N/A Bank of Montreal 400 N/A
18 20 Marathon Capital 397 44
19 N/A Franklin Park Energy 302 N/A
20 16 CohnReznick 143 97
Value (USDm)
LEGAL ADVISERS - VALUE
Rank2018 2017
Company2018 2017
1 11 Sullivan & Cromwell 6,197 2,250
2 21 Kirkland & Ellis 3,385 1,362
3 14 McCarthy Tétrault 2,650 1,639
4 N/A Brownstein Hyatt Farber Schreck 2,415 N/A
5 2 Norton Rose Fulbright 2,406 8,747
6 10 White & Case 2,280 2,445
7 1 Latham & Watkins 2,268 10,981
8 5 Blake Cassels & Graydon 2,174 6,052
9 N/A Ashurst 1,554 N/A
= 63 Nossaman 1,554 6
= 13 Nixon Peabody 1,554 1,652
12 28 Mayer Brown 1,493 584
13 6 Skadden Arps Slate Meagher & Flom 1,195 5,300
14 3 Milbank Tweed Hadley & McCloy 1,005 7,590
15 N/A Deslauriers & Co. 939 N/A
16 52 McMillan 876 96
17 7 Shearman & Sterling 852 4,318
18 20 Simpson Thacher & Bartlett 821 1,497
19 12 Morgan Lewis & Bockius 774 1,681
20 50 Akin Gump Strauss Hauer & Feld 746 160
Value (USDm)
TECHNICAL ADVISERS - VALUE
Rank2018 2017
Company2018 2017
1 N/A Lea+Elliott 1,554 N/A
2 N/A AECOM 1,272 N/A
3 N/A Capita Property and Infrastructure 939 N/A
4 N/A Infrata 876 N/A
5 N/A DNV GL 595 N/A
6 1 Leidos 492 6,577
7 N/A HDR 273 N/A
8 N/A Altus Group 258 N/A
9 N/A E3 Consulting (USA) 256 N/A
10 4 Stantec 101 500
11 N/A Wood Group 64 N/A
12 5 Mott MacDonald 56 446
13 N/A Wood Group 64 N/A
14 5 Mott MacDonald 56 446
Value (USDm)
Download the data

/54ijglobal.com
North America project FinanceLeague Tables H1 2018
SPONSORS - VALUE
Rank2018 2017
Company2018 2017
1 2 Cheniere Energy 6,137 2,900
2 33 Freeport LNG Development 2,415 225
3 N/A Veresen 2,191 N/A
4 21 EllisDon 1,038 310
5 N/A Venado Oil & Gas 1,000 N/A
6 4 Blackstone 970 1,875
7 30 ACS Group 838 234
8 N/A Transurban 649 N/A
9 N/A Sunrun 595 N/A
10 N/A New Energy Solar 594 N/A
11 N/A PETRONAS 575 N/A
12 N/A Hanhwa Group 500 N/A
13 N/A Orascom Construction Industries 495 N/A
14 N/A Pembina Pipeline Corporation 451 N/A
15 33 Freeport LNG Development 450 225
16 33 Industry Super Holdings 450 225
17 10 Osaka Gas 450 450
18 N/A Corporación Gestamp 444 N/A
19 N/A Longroad Energy 443 N/A
20 N/A Athabasca Oil Corporation 441 N/A
Value (USDm)
Download the data behind the deals at IJGlobal
Download the data
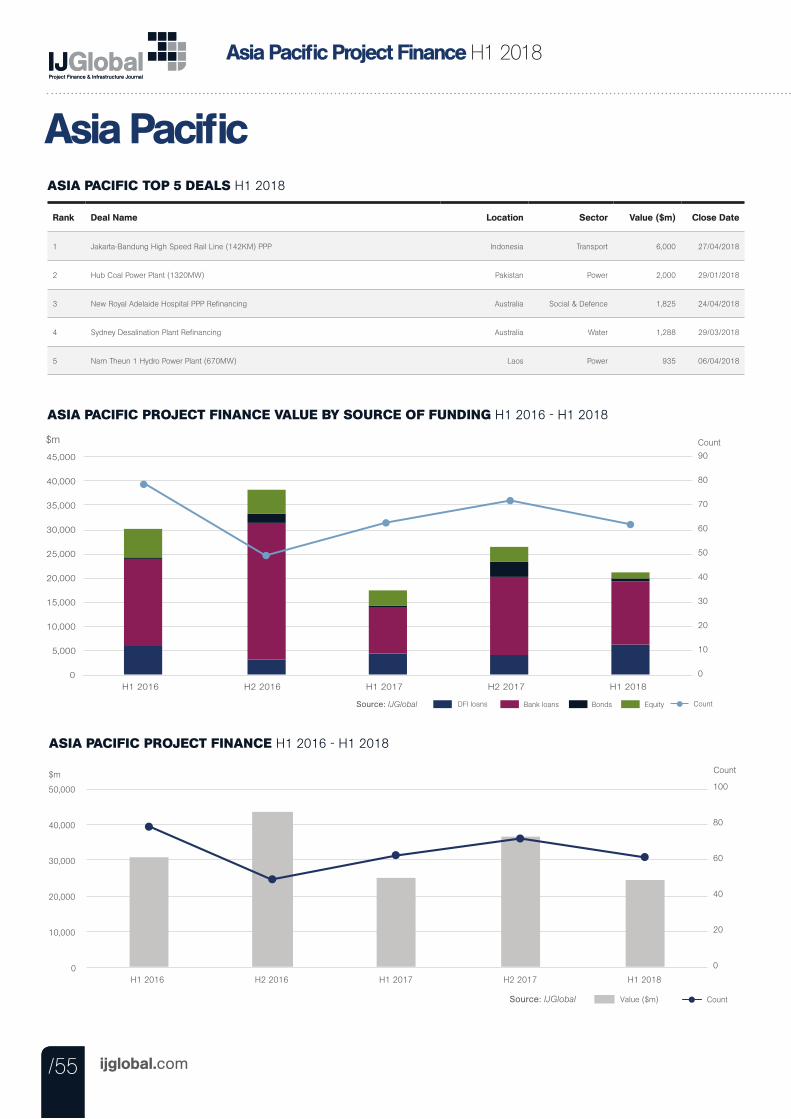
/55 ijglobal.com
Asia Pacific Project Finance H1 2018
/55
Asia PacificASIA PACIFIC TOP 5 DEALS H1 2018
Rank Deal Name Location Sector Value ($m) Close Date
1 Jakarta-Bandung High Speed Rail Line (142KM) PPP Indonesia Transport 6,000 27/04/2018
2 Hub Coal Power Plant (1320MW) Pakistan Power 2,000 29/01/2018
3 New Royal Adelaide Hospital PPP Refinancing Australia Social & Defence 1,825 24/04/2018
4 Sydney Desalination Plant Refinancing Australia Water 1,288 29/03/2018
5 Nam Theun 1 Hydro Power Plant (670MW) Laos Power 935 06/04/2018
ASIA PACIFIC PROJECT FINANCE VALUE BY SOURCE OF FUNDING H1 2016 - H1 2018
$m
Bank loans DFI loans Bonds Equity Source: IJGlobal Count
0
10
20
30
40
50
60
70
80
90
0
5,000
10,000
15,000
20,000
25,000
30,000
35,000
40,000
45,000
H1 2016 H2 2016 H1 2017 H2 2017 H1 2018
Count
ASIA PACIFIC PROJECT FINANCE H1 2016 - H1 2018
$m Count
Value ($m) Count Source: IJGlobal
0
20
40
60
80
100
0
10,000
20,000
30,000
40,000
50,000
H1 2016 H2 2016 H1 2017 H2 2017 H1 2018
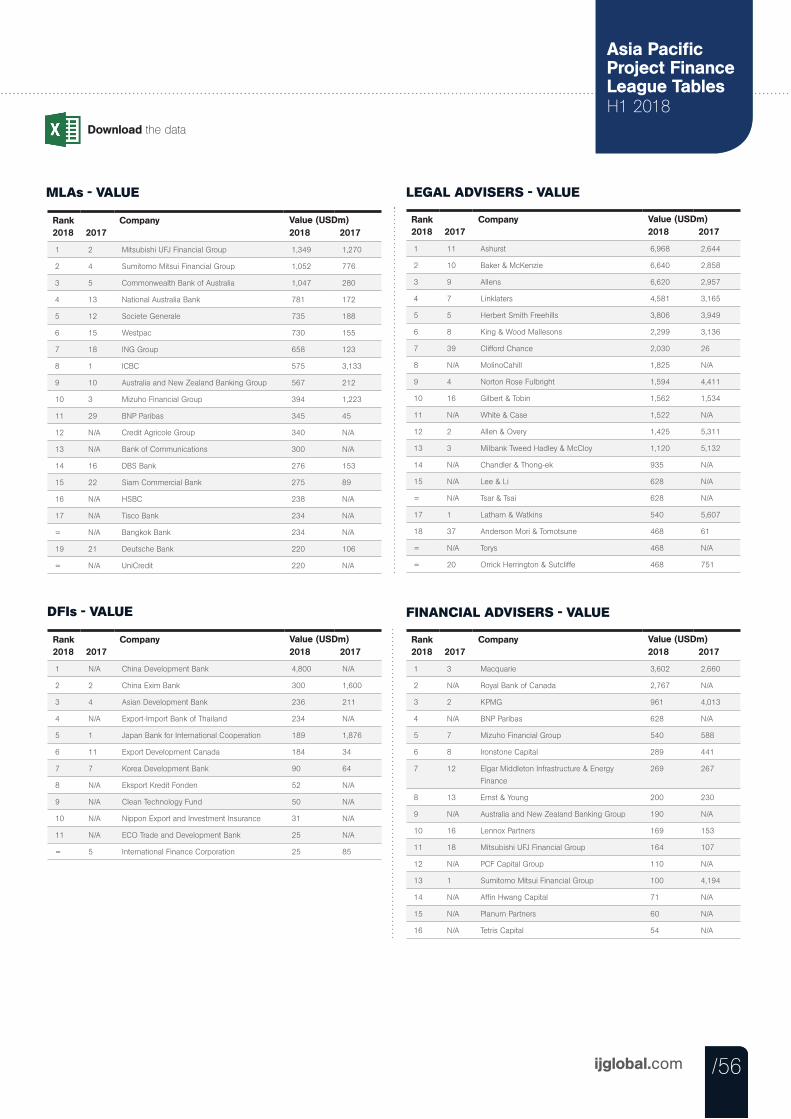
/56ijglobal.com
Europe Infrastructure FinanceLeague Tables H1 2018
/56
Asia Pacific Project FinanceLeague Tables H1 2018
MLAs - VALUE
Rank2018 2017
Company2018 2017
1 2 Mitsubishi UFJ Financial Group 1,349 1,270
2 4 Sumitomo Mitsui Financial Group 1,052 776
3 5 Commonwealth Bank of Australia 1,047 280
4 13 National Australia Bank 781 172
5 12 Societe Generale 735 188
6 15 Westpac 730 155
7 18 ING Group 658 123
8 1 ICBC 575 3,133
9 10 Australia and New Zealand Banking Group 567 212
10 3 Mizuho Financial Group 394 1,223
11 29 BNP Paribas 345 45
12 N/A Credit Agricole Group 340 N/A
13 N/A Bank of Communications 300 N/A
14 16 DBS Bank 276 153
15 22 Siam Commercial Bank 275 89
16 N/A HSBC 238 N/A
17 N/A Tisco Bank 234 N/A
= N/A Bangkok Bank 234 N/A
19 21 Deutsche Bank 220 106
= N/A UniCredit 220 N/A
Value (USDm)
LEGAL ADVISERS - VALUE
Rank2018 2017
Company2018 2017
1 11 Ashurst 6,968 2,644
2 10 Baker & McKenzie 6,640 2,858
3 9 Allens 6,620 2,957
4 7 Linklaters 4,581 3,165
5 5 Herbert Smith Freehills 3,806 3,949
6 8 King & Wood Mallesons 2,299 3,136
7 39 Clifford Chance 2,030 26
8 N/A MolinoCahill 1,825 N/A
9 4 Norton Rose Fulbright 1,594 4,411
10 16 Gilbert & Tobin 1,562 1,534
11 N/A White & Case 1,522 N/A
12 2 Allen & Overy 1,425 5,311
13 3 Milbank Tweed Hadley & McCloy 1,120 5,132
14 N/A Chandler & Thong-ek 935 N/A
15 N/A Lee & Li 628 N/A
= N/A Tsar & Tsai 628 N/A
17 1 Latham & Watkins 540 5,607
18 37 Anderson Mori & Tomotsune 468 61
= N/A Torys 468 N/A
= 20 Orrick Herrington & Sutcliffe 468 751
Value (USDm)
DFIs - VALUE
Rank2018 2017
Company2018 2017
1 N/A China Development Bank 4,800 N/A
2 2 China Exim Bank 300 1,600
3 4 Asian Development Bank 236 211
4 N/A Export-Import Bank of Thailand 234 N/A
5 1 Japan Bank for International Cooperation 189 1,876
6 11 Export Development Canada 184 34
7 7 Korea Development Bank 90 64
8 N/A Eksport Kredit Fonden 52 N/A
9 N/A Clean Technology Fund 50 N/A
10 N/A Nippon Export and Investment Insurance 31 N/A
11 N/A ECO Trade and Development Bank 25 N/A
= 5 International Finance Corporation 25 85
Value (USDm)
FINANCIAL ADVISERS - VALUE
Rank2018 2017
Company2018 2017
1 3 Macquarie 3,602 2,660
2 N/A Royal Bank of Canada 2,767 N/A
3 2 KPMG 961 4,013
4 N/A BNP Paribas 628 N/A
5 7 Mizuho Financial Group 540 588
6 8 Ironstone Capital 289 441
7 12 Elgar Middleton Infrastructure & Energy
Finance
269 267
8 13 Ernst & Young 200 230
9 N/A Australia and New Zealand Banking Group 190 N/A
10 16 Lennox Partners 169 153
11 18 Mitsubishi UFJ Financial Group 164 107
12 N/A PCF Capital Group 110 N/A
13 1 Sumitomo Mitsui Financial Group 100 4,194
14 N/A Affin Hwang Capital 71 N/A
15 N/A Planum Partners 60 N/A
16 N/A Tetris Capital 54 N/A
Value (USDm)
Download the data
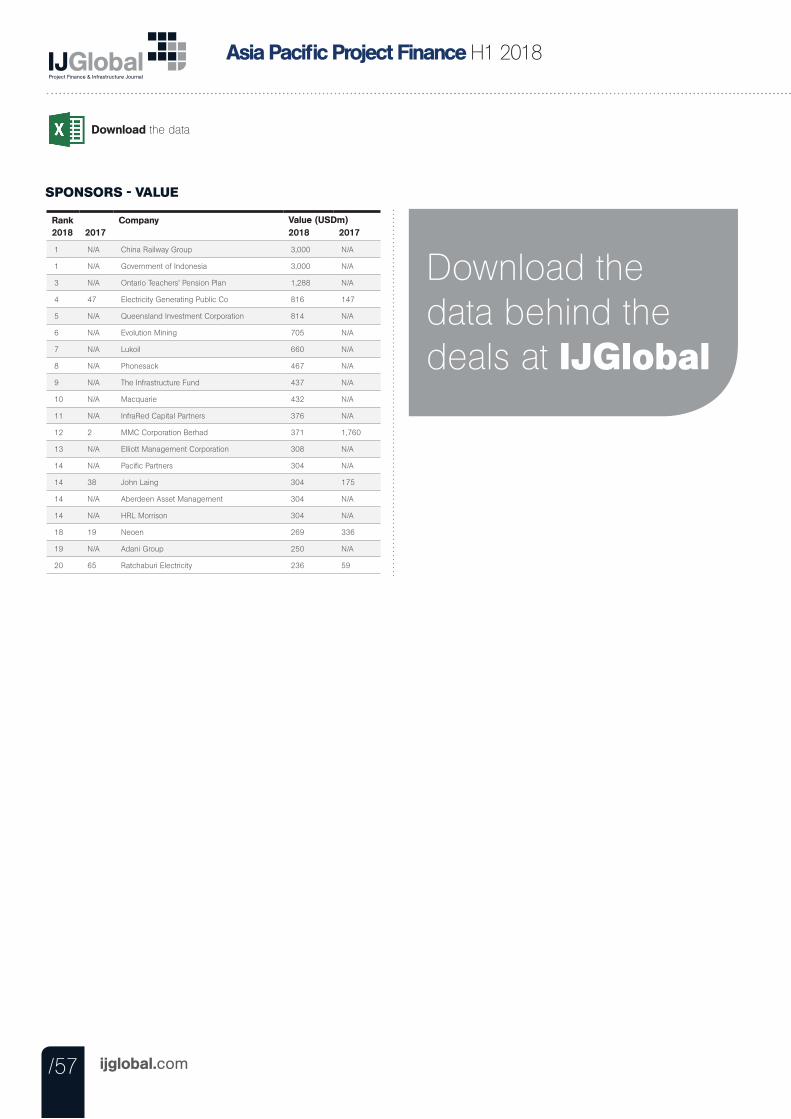
Download the data
/57 ijglobal.com
Asia Pacific Project Finance H1 2018
SPONSORS - VALUE
Rank2018 2017
Company2018 2017
1 N/A China Railway Group 3,000 N/A
1 N/A Government of Indonesia 3,000 N/A
3 N/A Ontario Teachers' Pension Plan 1,288 N/A
4 47 Electricity Generating Public Co 816 147
5 N/A Queensland Investment Corporation 814 N/A
6 N/A Evolution Mining 705 N/A
7 N/A Lukoil 660 N/A
8 N/A Phonesack 467 N/A
9 N/A The Infrastructure Fund 437 N/A
10 N/A Macquarie 432 N/A
11 N/A InfraRed Capital Partners 376 N/A
12 2 MMC Corporation Berhad 371 1,760
13 N/A Elliott Management Corporation 308 N/A
14 N/A Pacific Partners 304 N/A
14 38 John Laing 304 175
14 N/A Aberdeen Asset Management 304 N/A
14 N/A HRL Morrison 304 N/A
18 19 Neoen 269 336
19 N/A Adani Group 250 N/A
20 65 Ratchaburi Electricity 236 59
Value (USDm)
Download the data behind the deals at IJGlobal
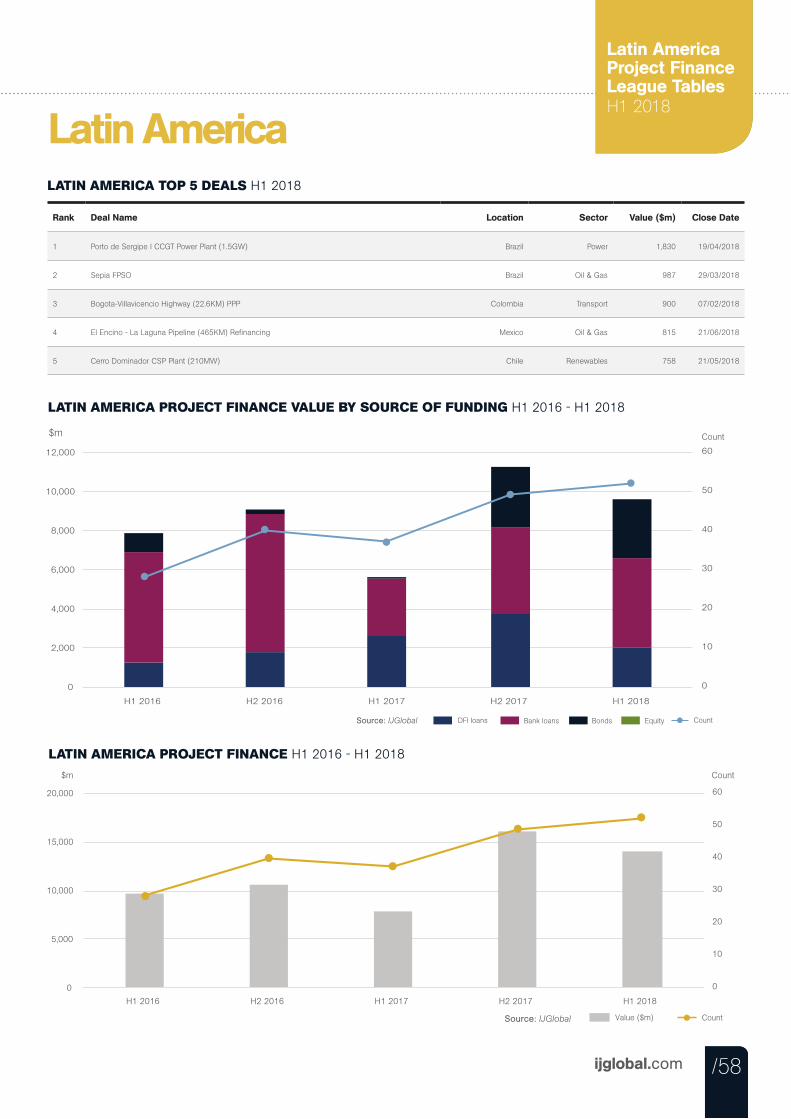
/58ijglobal.com
Europe Infrastructure FinanceLeague Tables H1 2018
/58
Latin America Project FinanceLeague Tables H1 2018
Latin AmericaLATIN AMERICA TOP 5 DEALS H1 2018
Rank Deal Name Location Sector Value ($m) Close Date
1 Porto de Sergipe I CCGT Power Plant (1.5GW) Brazil Power 1,830 19/04/2018
2 Sepia FPSO Brazil Oil & Gas 987 29/03/2018
3 Bogota-Villavicencio Highway (22.6KM) PPP Colombia Transport 900 07/02/2018
4 El Encino - La Laguna Pipeline (465KM) Refinancing Mexico Oil & Gas 815 21/06/2018
5 Cerro Dominador CSP Plant (210MW) Chile Renewables 758 21/05/2018
LATIN AMERICA PROJECT FINANCE VALUE BY SOURCE OF FUNDING H1 2016 - H1 2018
Bank loans DFI loans Bonds Equity Source: IJGlobal Count
$m
0
10
20
30
40
50
60
0
2,000
4,000
6,000
8,000
10,000
12,000
H1 2016 H2 2016 H1 2017 H2 2017 H1 2018
Count
LATIN AMERICA PROJECT FINANCE H1 2016 - H1 2018 $m Count
Value ($m) Count Source: IJGlobal
0
10
20
30
40
50
60
0
5,000
10,000
15,000
20,000
H1 2016 H2 2016 H1 2017 H2 2017 H1 2018
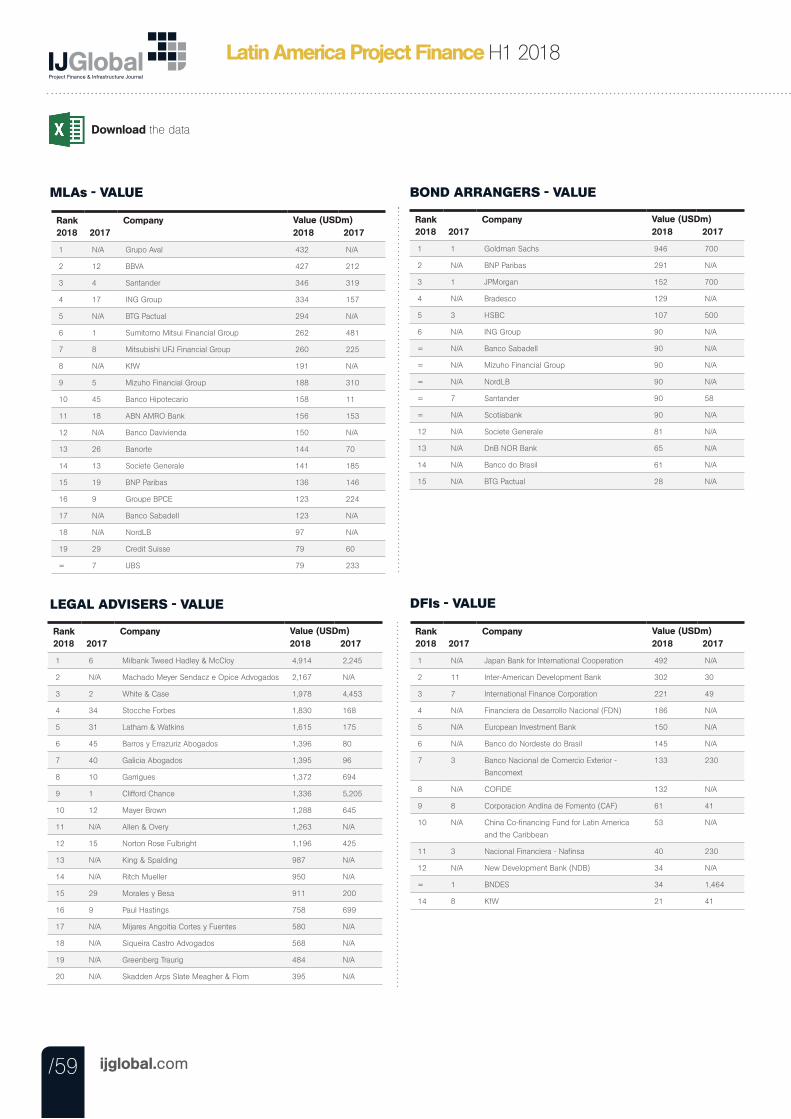
/59 ijglobal.com
Latin America Project Finance H1 2018
MLAs - VALUE
Rank2018 2017
Company2018 2017
1 N/A Grupo Aval 432 N/A
2 12 BBVA 427 212
3 4 Santander 346 319
4 17 ING Group 334 157
5 N/A BTG Pactual 294 N/A
6 1 Sumitomo Mitsui Financial Group 262 481
7 8 Mitsubishi UFJ Financial Group 260 225
8 N/A KfW 191 N/A
9 5 Mizuho Financial Group 188 310
10 45 Banco Hipotecario 158 11
11 18 ABN AMRO Bank 156 153
12 N/A Banco Davivienda 150 N/A
13 26 Banorte 144 70
14 13 Societe Generale 141 185
15 19 BNP Paribas 136 146
16 9 Groupe BPCE 123 224
17 N/A Banco Sabadell 123 N/A
18 N/A NordLB 97 N/A
19 29 Credit Suisse 79 60
= 7 UBS 79 233
Value (USDm)
BOND ARRANGERS - VALUE
Rank2018 2017
Company2018 2017
1 1 Goldman Sachs 946 700
2 N/A BNP Paribas 291 N/A
3 1 JPMorgan 152 700
4 N/A Bradesco 129 N/A
5 3 HSBC 107 500
6 N/A ING Group 90 N/A
= N/A Banco Sabadell 90 N/A
= N/A Mizuho Financial Group 90 N/A
= N/A NordLB 90 N/A
= 7 Santander 90 58
= N/A Scotiabank 90 N/A
12 N/A Societe Generale 81 N/A
13 N/A DnB NOR Bank 65 N/A
14 N/A Banco do Brasil 61 N/A
15 N/A BTG Pactual 28 N/A
Value (USDm)
LEGAL ADVISERS - VALUE DFIs - VALUE
Rank2018 2017
Company2018 2017
1 N/A Japan Bank for International Cooperation 492 N/A
2 11 Inter-American Development Bank 302 30
3 7 International Finance Corporation 221 49
4 N/A Financiera de Desarrollo Nacional (FDN) 186 N/A
5 N/A European Investment Bank 150 N/A
6 N/A Banco do Nordeste do Brasil 145 N/A
7 3 Banco Nacional de Comercio Exterior -
Bancomext
133 230
8 N/A COFIDE 132 N/A
9 8 Corporacion Andina de Fomento (CAF) 61 41
10 N/A China Co-financing Fund for Latin America
and the Caribbean
53 N/A
11 3 Nacional Financiera - Nafinsa 40 230
12 N/A New Development Bank (NDB) 34 N/A
= 1 BNDES 34 1,464
14 8 KfW 21 41
Value (USDm)Rank2018 2017
Company2018 2017
1 6 Milbank Tweed Hadley & McCloy 4,914 2,245
2 N/A Machado Meyer Sendacz e Opice Advogados 2,167 N/A
3 2 White & Case 1,978 4,453
4 34 Stocche Forbes 1,830 168
5 31 Latham & Watkins 1,615 175
6 45 Barros y Errazuriz Abogados 1,396 80
7 40 Galicia Abogados 1,395 96
8 10 Garrigues 1,372 694
9 1 Clifford Chance 1,336 5,205
10 12 Mayer Brown 1,288 645
11 N/A Allen & Overy 1,263 N/A
12 15 Norton Rose Fulbright 1,196 425
13 N/A King & Spalding 987 N/A
14 N/A Ritch Mueller 950 N/A
15 29 Morales y Besa 911 200
16 9 Paul Hastings 758 699
17 N/A Mijares Angoitia Cortes y Fuentes 580 N/A
18 N/A Siqueira Castro Advogados 568 N/A
19 N/A Greenberg Traurig 484 N/A
20 N/A Skadden Arps Slate Meagher & Flom 395 N/A
Value (USDm)
Download the data
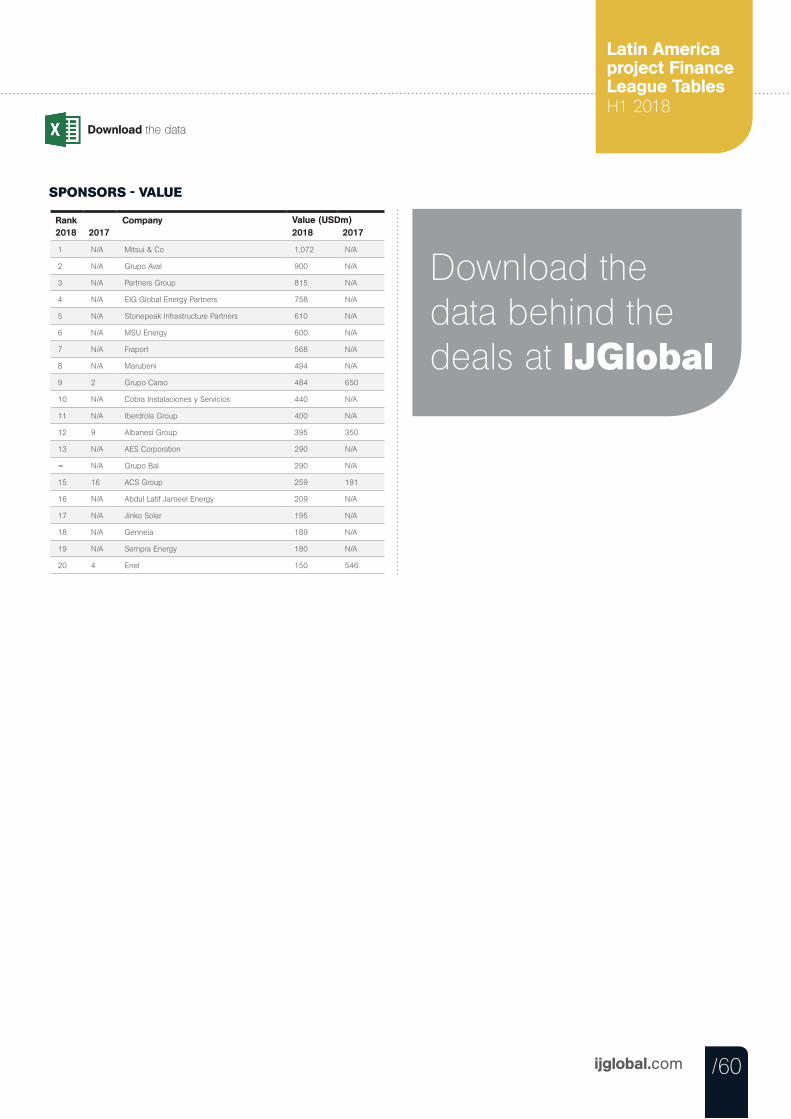
Download the data
/60ijglobal.com
Latin America project FinanceLeague Tables H1 2018
SPONSORS - VALUE
Rank2018 2017
Company2018 2017
1 N/A Mitsui & Co 1,072 N/A
2 N/A Grupo Aval 900 N/A
3 N/A Partners Group 815 N/A
4 N/A EIG Global Energy Partners 758 N/A
5 N/A Stonepeak Infrastructure Partners 610 N/A
6 N/A MSU Energy 600 N/A
7 N/A Fraport 568 N/A
8 N/A Marubeni 494 N/A
9 2 Grupo Carso 484 650
10 N/A Cobra Instalaciones y Servicios 440 N/A
11 N/A Iberdrola Group 400 N/A
12 9 Albanesi Group 395 350
13 N/A AES Corporation 290 N/A
= N/A Grupo Bal 290 N/A
15 16 ACS Group 259 191
16 N/A Abdul Latif Jameel Energy 209 N/A
17 N/A Jinko Solar 195 N/A
18 N/A Genneia 189 N/A
19 N/A Sempra Energy 180 N/A
20 4 Enel 150 546
Value (USDm)
Download the data behind the deals at IJGlobal
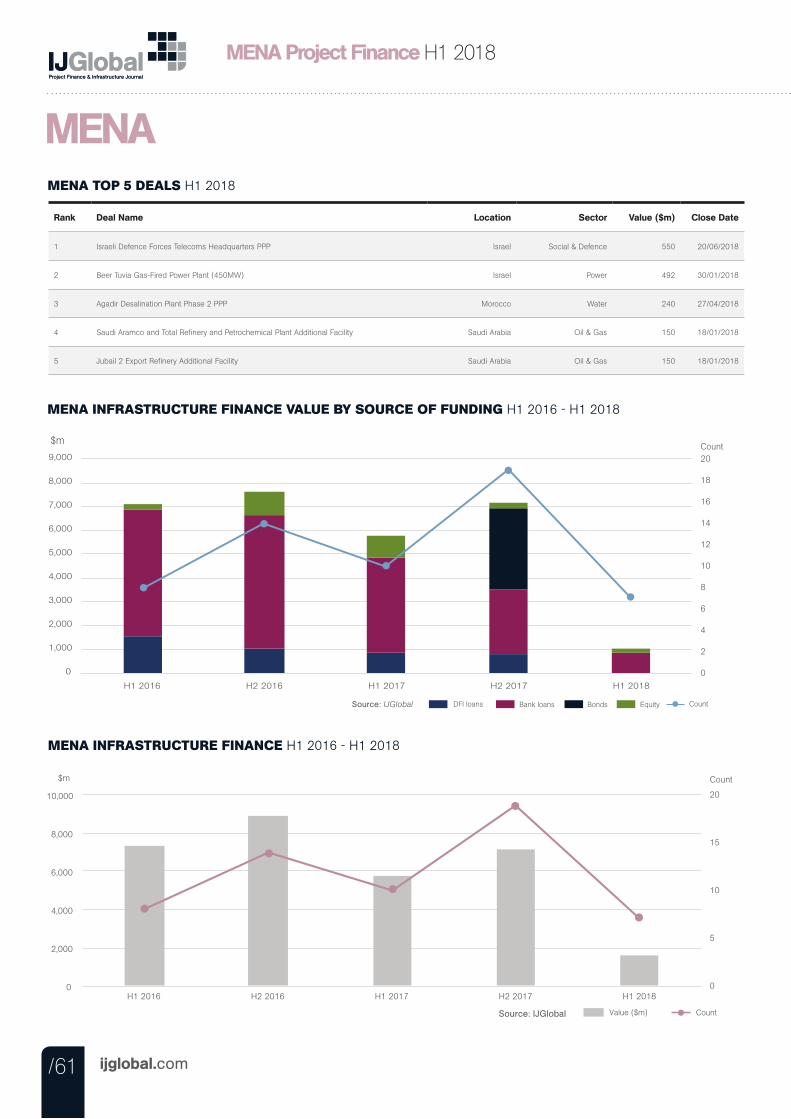
/61 ijglobal.com
MENA Project Finance H1 2018
MENAMENA TOP 5 DEALS H1 2018
Rank Deal Name Location Sector Value ($m) Close Date
1 Israeli Defence Forces Telecoms Headquarters PPP Israel Social & Defence 550 20/06/2018
2 Beer Tuvia Gas-Fired Power Plant (450MW) Israel Power 492 30/01/2018
3 Agadir Desalination Plant Phase 2 PPP Morocco Water 240 27/04/2018
4 Saudi Aramco and Total Refinery and Petrochemical Plant Additional Facility Saudi Arabia Oil & Gas 150 18/01/2018
5 Jubail 2 Export Refinery Additional Facility Saudi Arabia Oil & Gas 150 18/01/2018
MENA INFRASTRUCTURE FINANCE VALUE BY SOURCE OF FUNDING H1 2016 - H1 2018
Bank loans DFI loans Bonds Equity Source: IJGlobal Count
$m
0
2
4
6
8
10
12
14
16
18
20
0
1,000
2,000
3,000
4,000
5,000
6,000
7,000
8,000
9,000
H1 2016 H2 2016 H1 2017 H2 2017 H1 2018
Count
MENA INFRASTRUCTURE FINANCE H1 2016 - H1 2018
$m Count
Value ($m) Count Source: IJGlobal
0
5
10
15
20
0
2,000
4,000
6,000
8,000
10,000
H1 2016 H2 2016 H1 2017 H2 2017 H1 2018
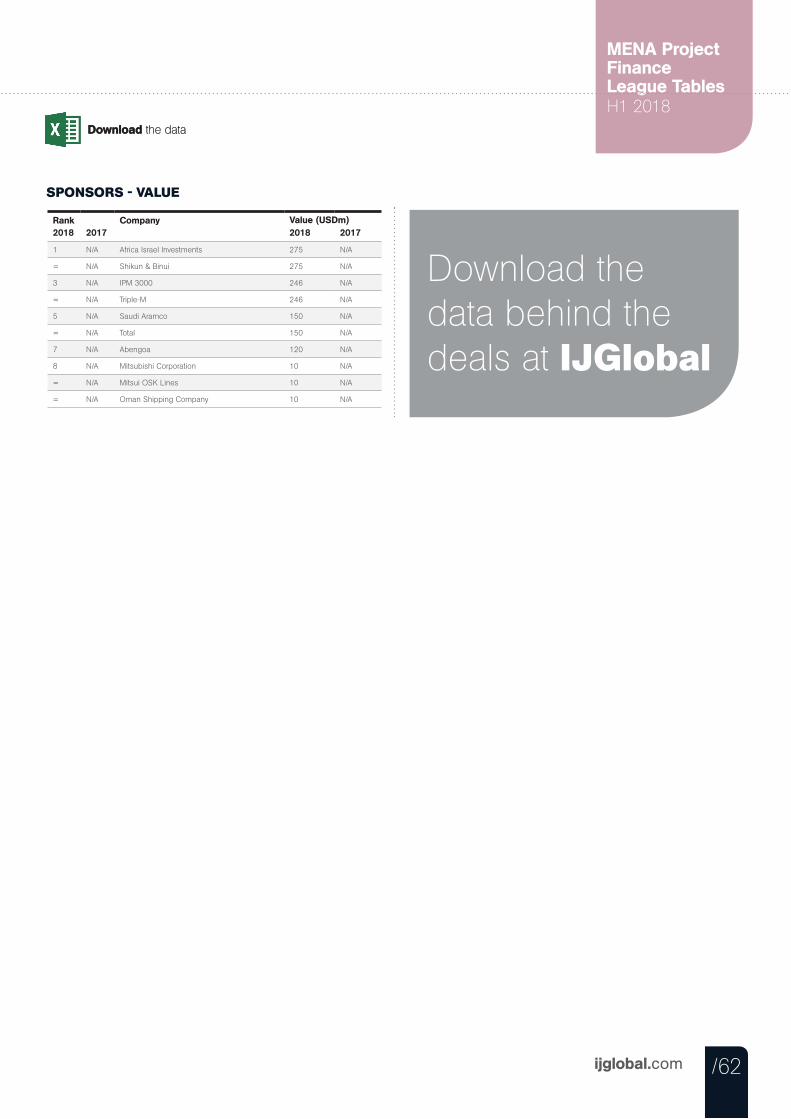
/62ijglobal.com
Download the data
MENA Project FinanceLeague Tables H1 2018
Download the data
SPONSORS - VALUE
Rank2018 2017
Company2018 2017
1 N/A Africa Israel Investments 275 N/A
= N/A Shikun & Binui 275 N/A
3 N/A IPM 3000 246 N/A
= N/A Triple-M 246 N/A
5 N/A Saudi Aramco 150 N/A
= N/A Total 150 N/A
7 N/A Abengoa 120 N/A
8 N/A Mitsubishi Corporation 10 N/A
= N/A Mitsui OSK Lines 10 N/A
= N/A Oman Shipping Company 10 N/A
Value (USDm)
Download the data behind the deals at IJGlobal
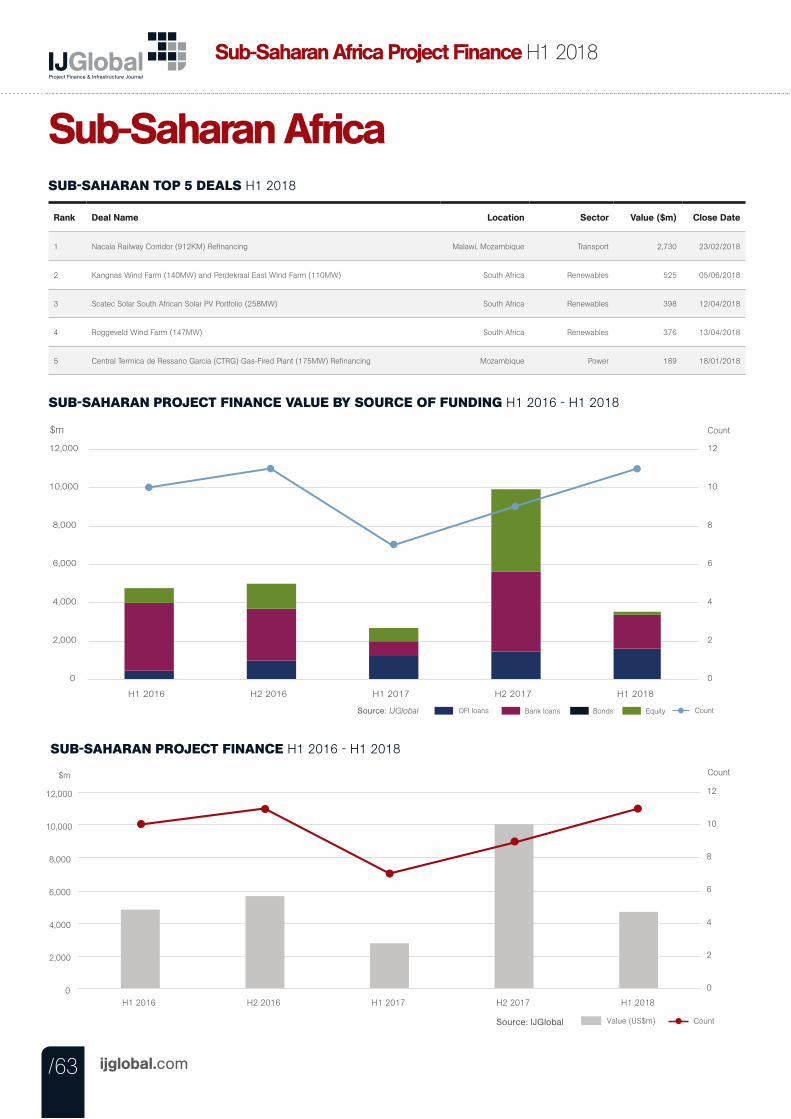
/63 ijglobal.com
Sub-Saharan Africa Project Finance H1 2018
Sub-Saharan AfricaSUB-SAHARAN TOP 5 DEALS H1 2018
Rank Deal Name Location Sector Value ($m) Close Date
1 Nacala Railway Corridor (912KM) Refinancing Malawi, Mozambique Transport 2,730 23/02/2018
2 Kangnas Wind Farm (140MW) and Perdekraal East Wind Farm (110MW) South Africa Renewables 525 05/06/2018
3 Scatec Solar South African Solar PV Portfolio (258MW) South Africa Renewables 398 12/04/2018
4 Roggeveld Wind Farm (147MW) South Africa Renewables 376 13/04/2018
5 Central Termica de Ressano Garcia (CTRG) Gas-Fired Plant (175MW) Refinancing Mozambique Power 189 18/01/2018
SUB-SAHARAN PROJECT FINANCE VALUE BY SOURCE OF FUNDING H1 2016 - H1 2018
Bank loans DFI loans Bonds Equity Source: IJGlobal Count
$m
0
2
4
6
8
10
12
0
2,000
4,000
6,000
8,000
10,000
12,000
H1 2016 H2 2016 H1 2017 H2 2017 H1 2018
Count
SUB-SAHARAN PROJECT FINANCE H1 2016 - H1 2018
$m Count
Value (US$m) Count Source: IJGlobal
0
2
4
6
8
10
12
0
2,000
4,000
6,000
8,000
10,000
12,000
H1 2016 H2 2016 H1 2017 H2 2017 H1 2018
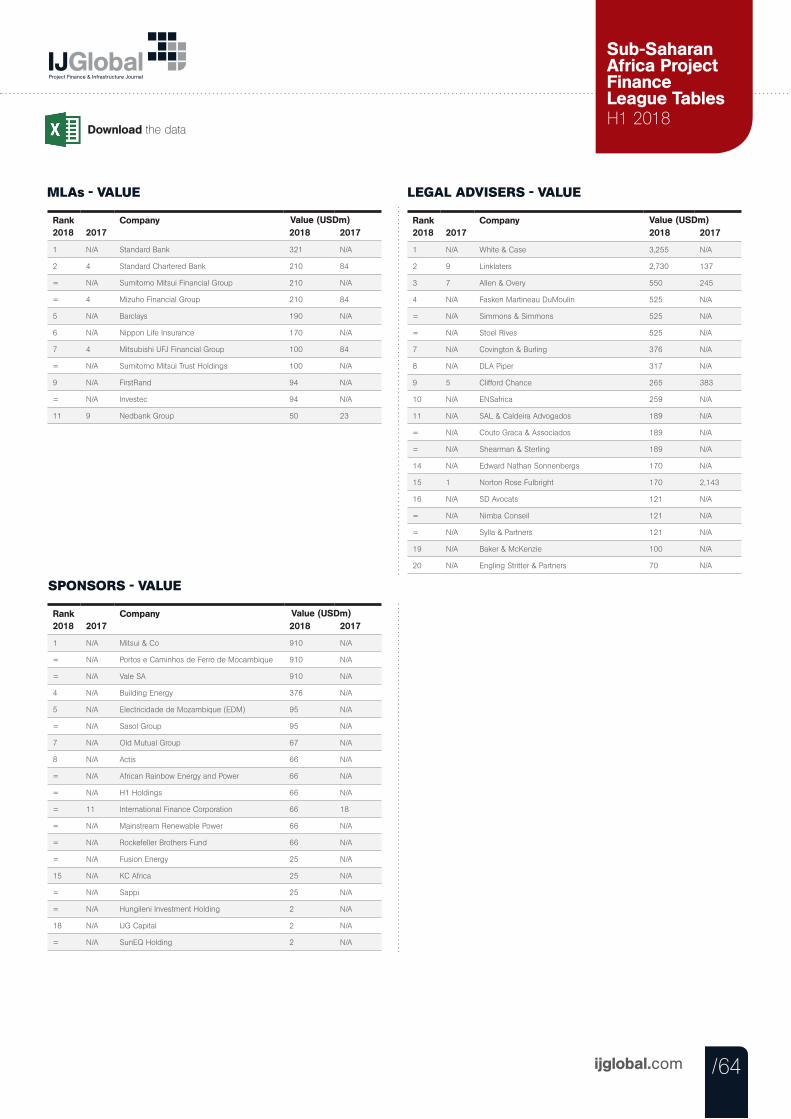
Download the data
/64ijglobal.com
Sub-Saharan Africa Project FinanceLeague Tables H1 2018
MLAs - VALUE
Rank2018 2017
Company2018 2017
1 N/A Standard Bank 321 N/A
2 4 Standard Chartered Bank 210 84
= N/A Sumitomo Mitsui Financial Group 210 N/A
= 4 Mizuho Financial Group 210 84
5 N/A Barclays 190 N/A
6 N/A Nippon Life Insurance 170 N/A
7 4 Mitsubishi UFJ Financial Group 100 84
= N/A Sumitomo Mitsui Trust Holdings 100 N/A
9 N/A FirstRand 94 N/A
= N/A Investec 94 N/A
11 9 Nedbank Group 50 23
Value (USDm)
LEGAL ADVISERS - VALUE
Rank2018 2017
Company2018 2017
1 N/A White & Case 3,255 N/A
2 9 Linklaters 2,730 137
3 7 Allen & Overy 550 245
4 N/A Fasken Martineau DuMoulin 525 N/A
= N/A Simmons & Simmons 525 N/A
= N/A Stoel Rives 525 N/A
7 N/A Covington & Burling 376 N/A
8 N/A DLA Piper 317 N/A
9 5 Clifford Chance 265 383
10 N/A ENSafrica 259 N/A
11 N/A SAL & Caldeira Advogados 189 N/A
= N/A Couto Graca & Associados 189 N/A
= N/A Shearman & Sterling 189 N/A
14 N/A Edward Nathan Sonnenbergs 170 N/A
15 1 Norton Rose Fulbright 170 2,143
16 N/A SD Avocats 121 N/A
= N/A Nimba Conseil 121 N/A
= N/A Sylla & Partners 121 N/A
19 N/A Baker & McKenzie 100 N/A
20 N/A Engling Stritter & Partners 70 N/A
Value (USDm)
SPONSORS - VALUE
Rank2018 2017
Company2018 2017
1 N/A Mitsui & Co 910 N/A
= N/A Portos e Caminhos de Ferro de Mocambique 910 N/A
= N/A Vale SA 910 N/A
4 N/A Building Energy 376 N/A
5 N/A Electricidade de Mozambique (EDM) 95 N/A
= N/A Sasol Group 95 N/A
7 N/A Old Mutual Group 67 N/A
8 N/A Actis 66 N/A
= N/A African Rainbow Energy and Power 66 N/A
= N/A H1 Holdings 66 N/A
= 11 International Finance Corporation 66 18
= N/A Mainstream Renewable Power 66 N/A
= N/A Rockefeller Brothers Fund 66 N/A
= N/A Fusion Energy 25 N/A
15 N/A KC Africa 25 N/A
= N/A Sappi 25 N/A
= N/A Hungileni Investment Holding 2 N/A
18 N/A IJG Capital 2 N/A
= N/A SunEQ Holding 2 N/A
Value (USDm)
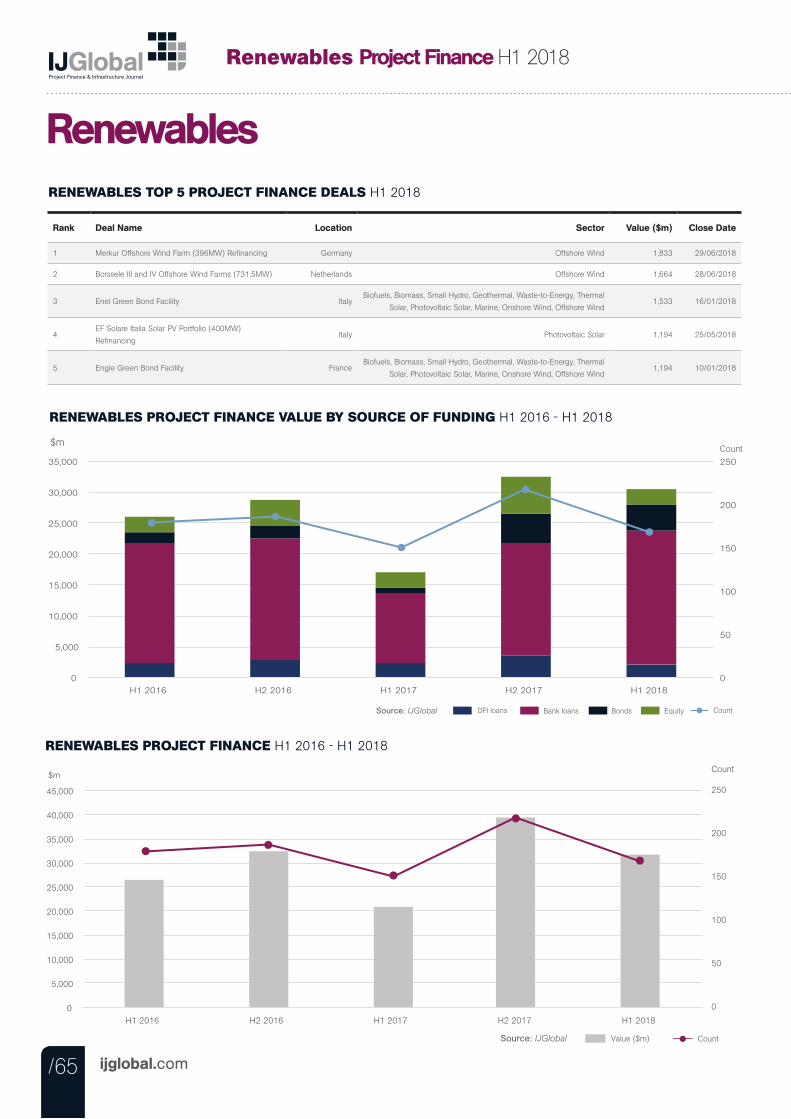
/65 ijglobal.com
Renewables Project Finance H1 2018
/65/65
RENEWABLES PROJECT FINANCE VALUE BY SOURCE OF FUNDING H1 2016 - H1 2018
$m
Bank loans DFI loans Bonds Equity Source: IJGlobal Count
0
50
100
150
200
250
0
5,000
10,000
15,000
20,000
25,000
30,000
35,000
H1 2016 H2 2016 H1 2017 H2 2017 H1 2018
Count
RENEWABLES PROJECT FINANCE H1 2016 - H1 2018
Value ($m) Count Source: IJGlobal
$m
0
50
100
150
200
250
0
5,000
10,000
15,000
20,000
25,000
30,000
35,000
40,000
45,000
H1 2016 H2 2016 H1 2017 H2 2017 H1 2018
Count
RENEWABLES TOP 5 PROJECT FINANCE DEALS H1 2018
Renewables
Rank Deal Name Location Sector Value ($m) Close Date
1 Merkur Offshore Wind Farm (396MW) Refinancing Germany Offshore Wind 1,833 29/06/2018
2 Borssele III and IV Offshore Wind Farms (731.5MW) Netherlands Offshore Wind 1,664 28/06/2018
3 Enel Green Bond Facility ItalyBiofuels, Biomass, Small Hydro, Geothermal, Waste-to-Energy, Thermal
Solar, Photovoltaic Solar, Marine, Onshore Wind, Offshore Wind 1,533 16/01/2018
4EF Solare Italia Solar PV Portfolio (400MW)
RefinancingItaly Photovoltaic Solar 1,194 25/05/2018
5 Engie Green Bond Facility FranceBiofuels, Biomass, Small Hydro, Geothermal, Waste-to-Energy, Thermal
Solar, Photovoltaic Solar, Marine, Onshore Wind, Offshore Wind 1,194 10/01/2018
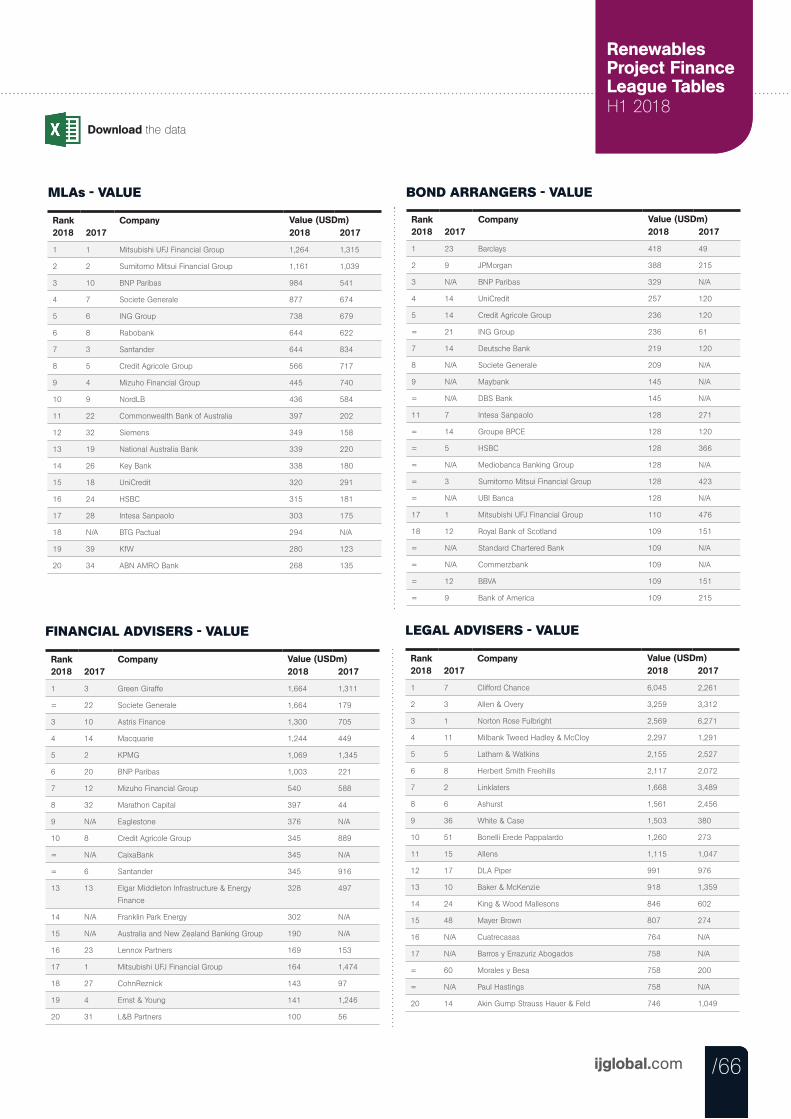
Download the data
/66ijglobal.com
Renewables Infrastructure FinanceLeague Tables H1 2018
/66
Renewables Project FinanceLeague Tables H1 2018
/66
MLAs - VALUE
Rank2018 2017
Company2018 2017
1 1 Mitsubishi UFJ Financial Group 1,264 1,315
2 2 Sumitomo Mitsui Financial Group 1,161 1,039
3 10 BNP Paribas 984 541
4 7 Societe Generale 877 674
5 6 ING Group 738 679
6 8 Rabobank 644 622
7 3 Santander 644 834
8 5 Credit Agricole Group 566 717
9 4 Mizuho Financial Group 445 740
10 9 NordLB 436 584
11 22 Commonwealth Bank of Australia 397 202
12 32 Siemens 349 158
13 19 National Australia Bank 339 220
14 26 Key Bank 338 180
15 18 UniCredit 320 291
16 24 HSBC 315 181
17 28 Intesa Sanpaolo 303 175
18 N/A BTG Pactual 294 N/A
19 39 KfW 280 123
20 34 ABN AMRO Bank 268 135
Value (USDm)
BOND ARRANGERS - VALUE
Rank2018 2017
Company2018 2017
1 23 Barclays 418 49
2 9 JPMorgan 388 215
3 N/A BNP Paribas 329 N/A
4 14 UniCredit 257 120
5 14 Credit Agricole Group 236 120
= 21 ING Group 236 61
7 14 Deutsche Bank 219 120
8 N/A Societe Generale 209 N/A
9 N/A Maybank 145 N/A
= N/A DBS Bank 145 N/A
11 7 Intesa Sanpaolo 128 271
= 14 Groupe BPCE 128 120
= 5 HSBC 128 366
= N/A Mediobanca Banking Group 128 N/A
= 3 Sumitomo Mitsui Financial Group 128 423
= N/A UBI Banca 128 N/A
17 1 Mitsubishi UFJ Financial Group 110 476
18 12 Royal Bank of Scotland 109 151
= N/A Standard Chartered Bank 109 N/A
= N/A Commerzbank 109 N/A
= 12 BBVA 109 151
= 9 Bank of America 109 215
Value (USDm)
FINANCIAL ADVISERS - VALUE
Rank2018 2017
Company2018 2017
1 3 Green Giraffe 1,664 1,311
= 22 Societe Generale 1,664 179
3 10 Astris Finance 1,300 705
4 14 Macquarie 1,244 449
5 2 KPMG 1,069 1,345
6 20 BNP Paribas 1,003 221
7 12 Mizuho Financial Group 540 588
8 32 Marathon Capital 397 44
9 N/A Eaglestone 376 N/A
10 8 Credit Agricole Group 345 889
= N/A CaixaBank 345 N/A
= 6 Santander 345 916
13 13 Elgar Middleton Infrastructure & Energy
Finance
328 497
14 N/A Franklin Park Energy 302 N/A
15 N/A Australia and New Zealand Banking Group 190 N/A
16 23 Lennox Partners 169 153
17 1 Mitsubishi UFJ Financial Group 164 1,474
18 27 CohnReznick 143 97
19 4 Ernst & Young 141 1,246
20 31 L&B Partners 100 56
Value (USDm)
LEGAL ADVISERS - VALUE
Rank2018 2017
Company2018 2017
1 7 Clifford Chance 6,045 2,261
2 3 Allen & Overy 3,259 3,312
3 1 Norton Rose Fulbright 2,569 6,271
4 11 Milbank Tweed Hadley & McCloy 2,297 1,291
5 5 Latham & Watkins 2,155 2,527
6 8 Herbert Smith Freehills 2,117 2,072
7 2 Linklaters 1,668 3,489
8 6 Ashurst 1,561 2,456
9 36 White & Case 1,503 380
10 51 Bonelli Erede Pappalardo 1,260 273
11 15 Allens 1,115 1,047
12 17 DLA Piper 991 976
13 10 Baker & McKenzie 918 1,359
14 24 King & Wood Mallesons 846 602
15 48 Mayer Brown 807 274
16 N/A Cuatrecasas 764 N/A
17 N/A Barros y Errazuriz Abogados 758 N/A
= 60 Morales y Besa 758 200
= N/A Paul Hastings 758 N/A
20 14 Akin Gump Strauss Hauer & Feld 746 1,049
Value (USDm)
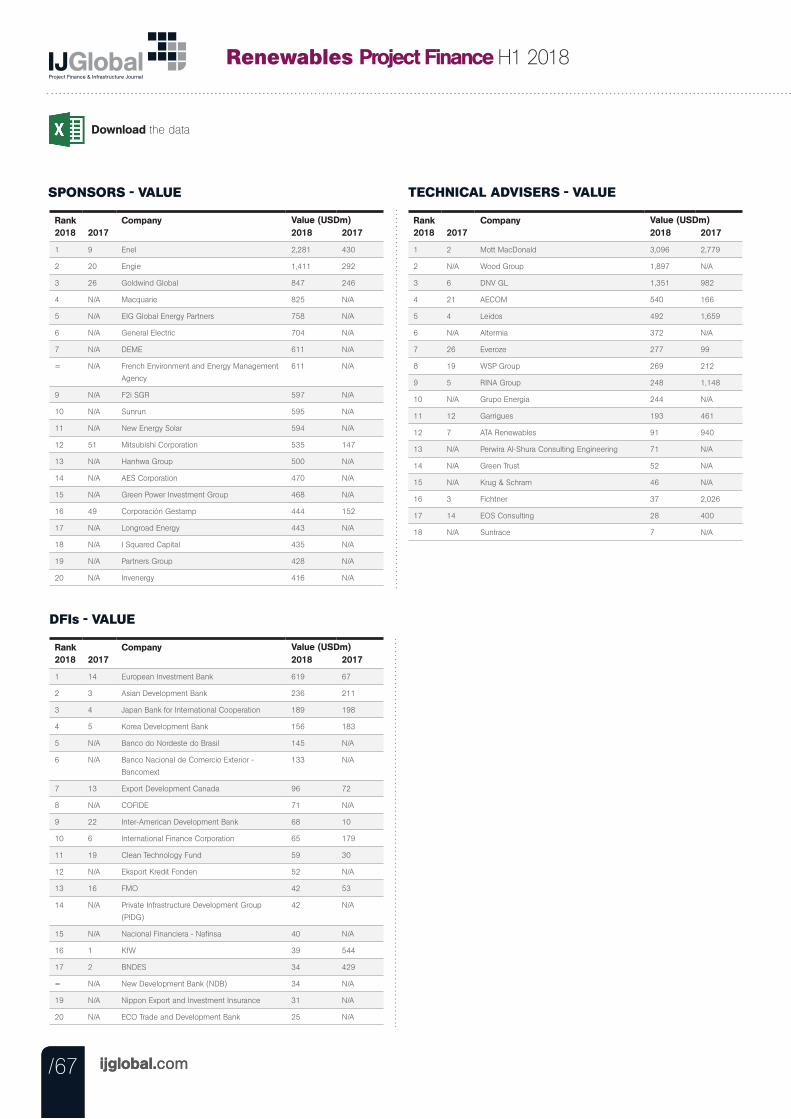
Download the data
/67 ijglobal.com
Renewables Project Finance H1 2018
/67 ijglobal.com
SPONSORS - VALUE
Rank2018 2017
Company2018 2017
1 9 Enel 2,281 430
2 20 Engie 1,411 292
3 26 Goldwind Global 847 246
4 N/A Macquarie 825 N/A
5 N/A EIG Global Energy Partners 758 N/A
6 N/A General Electric 704 N/A
7 N/A DEME 611 N/A
= N/A French Environment and Energy Management
Agency
611 N/A
9 N/A F2i SGR 597 N/A
10 N/A Sunrun 595 N/A
11 N/A New Energy Solar 594 N/A
12 51 Mitsubishi Corporation 535 147
13 N/A Hanhwa Group 500 N/A
14 N/A AES Corporation 470 N/A
15 N/A Green Power Investment Group 468 N/A
16 49 Corporación Gestamp 444 152
17 N/A Longroad Energy 443 N/A
18 N/A I Squared Capital 435 N/A
19 N/A Partners Group 428 N/A
20 N/A Invenergy 416 N/A
Value (USDm)
TECHNICAL ADVISERS - VALUE
Rank2018 2017
Company2018 2017
1 2 Mott MacDonald 3,096 2,779
2 N/A Wood Group 1,897 N/A
3 6 DNV GL 1,351 982
4 21 AECOM 540 166
5 4 Leidos 492 1,659
6 N/A Altermia 372 N/A
7 26 Everoze 277 99
8 19 WSP Group 269 212
9 5 RINA Group 248 1,148
10 N/A Grupo Energia 244 N/A
11 12 Garrigues 193 461
12 7 ATA Renewables 91 940
13 N/A Perwira Al-Shura Consulting Engineering 71 N/A
14 N/A Green Trust 52 N/A
15 N/A Krug & Schram 46 N/A
16 3 Fichtner 37 2,026
17 14 EOS Consulting 28 400
18 N/A Suntrace 7 N/A
Value (USDm)
DFIs - VALUE
Rank2018 2017
Company2018 2017
1 14 European Investment Bank 619 67
2 3 Asian Development Bank 236 211
3 4 Japan Bank for International Cooperation 189 198
4 5 Korea Development Bank 156 183
5 N/A Banco do Nordeste do Brasil 145 N/A
6 N/A Banco Nacional de Comercio Exterior -
Bancomext
133 N/A
7 13 Export Development Canada 96 72
8 N/A COFIDE 71 N/A
9 22 Inter-American Development Bank 68 10
10 6 International Finance Corporation 65 179
11 19 Clean Technology Fund 59 30
12 N/A Eksport Kredit Fonden 52 N/A
13 16 FMO 42 53
14 N/A Private Infrastructure Development Group
(PIDG)
42 N/A
15 N/A Nacional Financiera - Nafinsa 40 N/A
16 1 KfW 39 544
17 2 BNDES 34 429
= N/A New Development Bank (NDB) 34 N/A
19 N/A Nippon Export and Investment Insurance 31 N/A
20 N/A ECO Trade and Development Bank 25 N/A
Value (USDm)
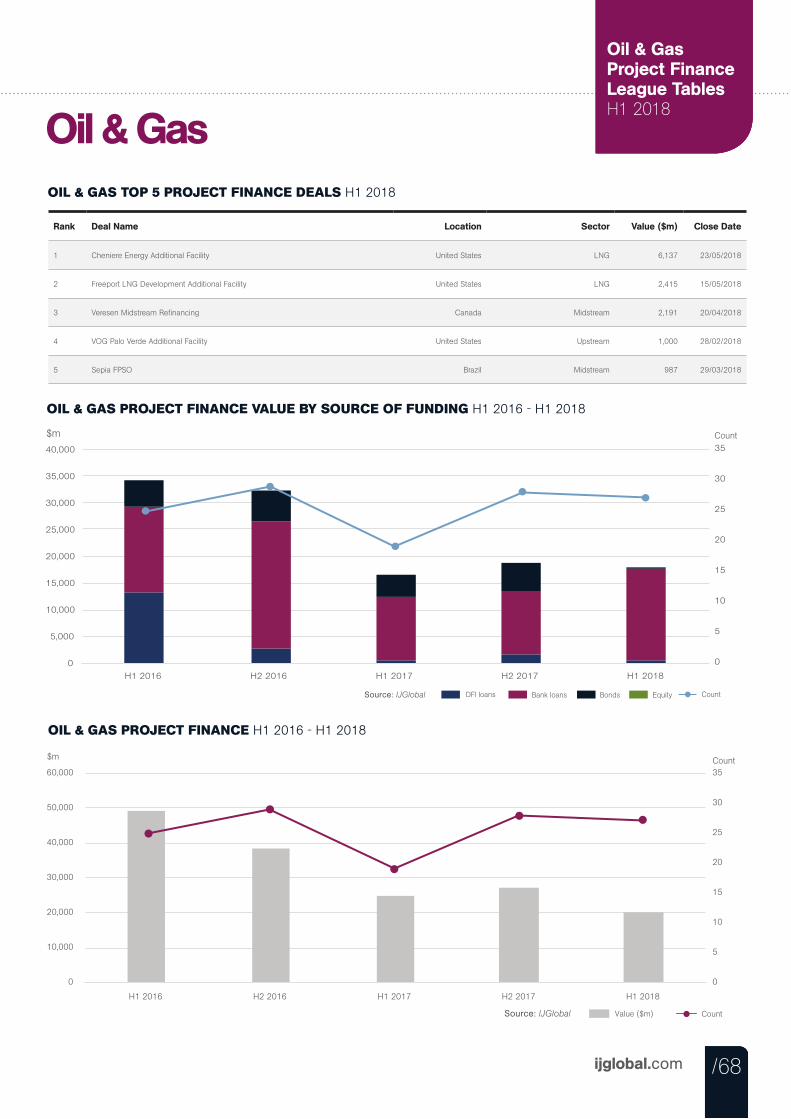
/68ijglobal.com
Renewables Infrastructure FinanceLeague Tables H1 2018
/68
Renewables Infrastructure FinanceLeague Tables H1 2018
/68
Oil & Gas Project FinanceLeague Tables H1 2018
OIL & GAS PROJECT FINANCE VALUE BY SOURCE OF FUNDING H1 2016 - H1 2018
$m
Bank loans DFI loans Bonds Equity Source: IJGlobal Count
0
5
10
15
20
25
30
35
0
5,000
10,000
15,000
20,000
25,000
30,000
35,000
40,000
H1 2016 H2 2016 H1 2017 H2 2017 H1 2018
Count
OIL & GAS PROJECT FINANCE H1 2016 - H1 2018
Value ($m) Count Source: IJGlobal
$m
0
5
10
15
20
25
30
35
0
10,000
20,000
30,000
40,000
50,000
60,000
H1 2016 H2 2016 H1 2017 H2 2017 H1 2018
Count
OIL & GAS TOP 5 PROJECT FINANCE DEALS H1 2018
Oil & Gas
Rank Deal Name Location Sector Value ($m) Close Date
1 Cheniere Energy Additional Facility United States LNG 6,137 23/05/2018
2 Freeport LNG Development Additional Facility United States LNG 2,415 15/05/2018
3 Veresen Midstream Refinancing Canada Midstream 2,191 20/04/2018
4 VOG Palo Verde Additional Facility United States Upstream 1,000 28/02/2018
5 Sepia FPSO Brazil Midstream 987 29/03/2018
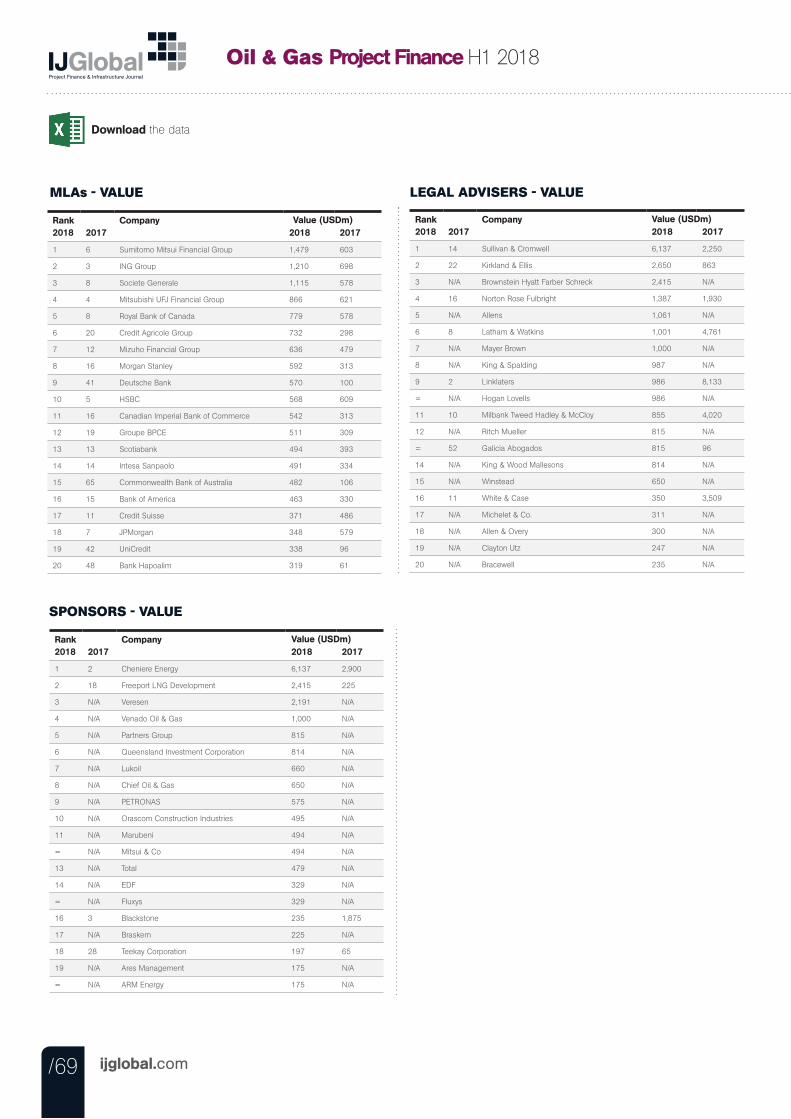
Download the data
/69 ijglobal.com
Oil & Gas Project Finance H1 2018
MLAs - VALUE
Rank2018 2017
Company2018 2017
1 6 Sumitomo Mitsui Financial Group 1,479 603
2 3 ING Group 1,210 698
3 8 Societe Generale 1,115 578
4 4 Mitsubishi UFJ Financial Group 866 621
5 8 Royal Bank of Canada 779 578
6 20 Credit Agricole Group 732 298
7 12 Mizuho Financial Group 636 479
8 16 Morgan Stanley 592 313
9 41 Deutsche Bank 570 100
10 5 HSBC 568 609
11 16 Canadian Imperial Bank of Commerce 542 313
12 19 Groupe BPCE 511 309
13 13 Scotiabank 494 393
14 14 Intesa Sanpaolo 491 334
15 65 Commonwealth Bank of Australia 482 106
16 15 Bank of America 463 330
17 11 Credit Suisse 371 486
18 7 JPMorgan 348 579
19 42 UniCredit 338 96
20 48 Bank Hapoalim 319 61
Value (USDm)
LEGAL ADVISERS - VALUE
Rank2018 2017
Company2018 2017
1 14 Sullivan & Cromwell 6,137 2,250
2 22 Kirkland & Ellis 2,650 863
3 N/A Brownstein Hyatt Farber Schreck 2,415 N/A
4 16 Norton Rose Fulbright 1,387 1,930
5 N/A Allens 1,061 N/A
6 8 Latham & Watkins 1,001 4,761
7 N/A Mayer Brown 1,000 N/A
8 N/A King & Spalding 987 N/A
9 2 Linklaters 986 8,133
= N/A Hogan Lovells 986 N/A
11 10 Milbank Tweed Hadley & McCloy 855 4,020
12 N/A Ritch Mueller 815 N/A
= 52 Galicia Abogados 815 96
14 N/A King & Wood Mallesons 814 N/A
15 N/A Winstead 650 N/A
16 11 White & Case 350 3,509
17 N/A Michelet & Co. 311 N/A
18 N/A Allen & Overy 300 N/A
19 N/A Clayton Utz 247 N/A
20 N/A Bracewell 235 N/A
Value (USDm)
SPONSORS - VALUE
Rank2018 2017
Company2018 2017
1 2 Cheniere Energy 6,137 2,900
2 18 Freeport LNG Development 2,415 225
3 N/A Veresen 2,191 N/A
4 N/A Venado Oil & Gas 1,000 N/A
5 N/A Partners Group 815 N/A
6 N/A Queensland Investment Corporation 814 N/A
7 N/A Lukoil 660 N/A
8 N/A Chief Oil & Gas 650 N/A
9 N/A PETRONAS 575 N/A
10 N/A Orascom Construction Industries 495 N/A
11 N/A Marubeni 494 N/A
= N/A Mitsui & Co 494 N/A
13 N/A Total 479 N/A
14 N/A EDF 329 N/A
= N/A Fluxys 329 N/A
16 3 Blackstone 235 1,875
17 N/A Braskem 225 N/A
18 28 Teekay Corporation 197 65
19 N/A Ares Management 175 N/A
= N/A ARM Energy 175 N/A
Value (USDm)
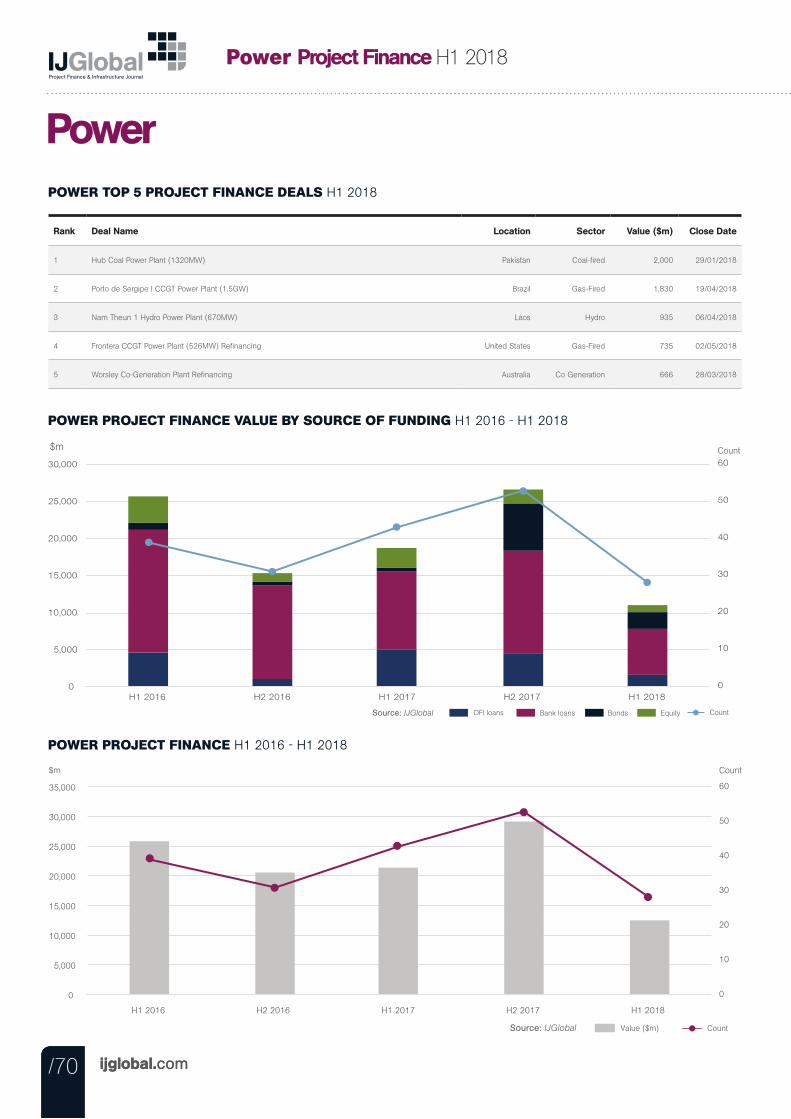
/70 ijglobal.com
Power Project Finance H1 2018
/70 ijglobal.com/70
POWER PROJECT FINANCE VALUE BY SOURCE OF FUNDING H1 2016 - H1 2018
$m
Bank loans DFI loans Bonds Equity Source: IJGlobal Count
0
10
20
30
40
50
60
0
5,000
10,000
15,000
20,000
25,000
30,000
H1 2016 H2 2016 H1 2017 H2 2017 H1 2018
Count
POWER PROJECT FINANCE H1 2016 - H1 2018
Value ($m) Count Source: IJGlobal
$m
0
10
20
30
40
50
60
0
5,000
10,000
15,000
20,000
25,000
30,000
35,000
H1 2016 H2 2016 H1 2017 H2 2017 H1 2018
Count
POWER TOP 5 PROJECT FINANCE DEALS H1 2018
Power
Rank Deal Name Location Sector Value ($m) Close Date
1 Hub Coal Power Plant (1320MW) Pakistan Coal-fired 2,000 29/01/2018
2 Porto de Sergipe I CCGT Power Plant (1.5GW) Brazil Gas-Fired 1,830 19/04/2018
3 Nam Theun 1 Hydro Power Plant (670MW) Laos Hydro 935 06/04/2018
4 Frontera CCGT Power Plant (526MW) Refinancing United States Gas-Fired 735 02/05/2018
5 Worsley Co-Generation Plant Refinancing Australia Co Generation 666 28/03/2018
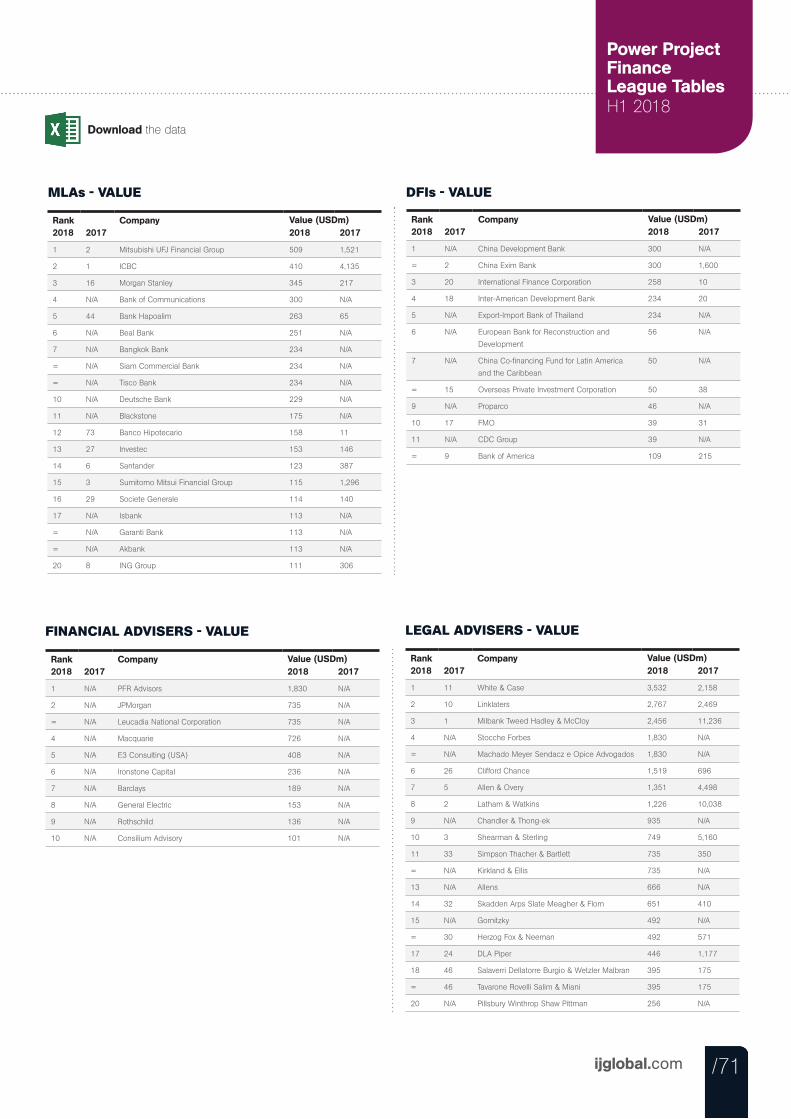
Download the data
/71ijglobal.com
Power Project FinanceLeague Tables H1 2018
/71/71
MLAs - VALUE
Rank2018 2017
Company2018 2017
1 2 Mitsubishi UFJ Financial Group 509 1,521
2 1 ICBC 410 4,135
3 16 Morgan Stanley 345 217
4 N/A Bank of Communications 300 N/A
5 44 Bank Hapoalim 263 65
6 N/A Beal Bank 251 N/A
7 N/A Bangkok Bank 234 N/A
= N/A Siam Commercial Bank 234 N/A
= N/A Tisco Bank 234 N/A
10 N/A Deutsche Bank 229 N/A
11 N/A Blackstone 175 N/A
12 73 Banco Hipotecario 158 11
13 27 Investec 153 146
14 6 Santander 123 387
15 3 Sumitomo Mitsui Financial Group 115 1,296
16 29 Societe Generale 114 140
17 N/A Isbank 113 N/A
= N/A Garanti Bank 113 N/A
= N/A Akbank 113 N/A
20 8 ING Group 111 306
Value (USDm)
DFIs - VALUE
Rank2018 2017
Company2018 2017
1 N/A China Development Bank 300 N/A
= 2 China Exim Bank 300 1,600
3 20 International Finance Corporation 258 10
4 18 Inter-American Development Bank 234 20
5 N/A Export-Import Bank of Thailand 234 N/A
6 N/A European Bank for Reconstruction and
Development
56 N/A
7 N/A China Co-financing Fund for Latin America
and the Caribbean
50 N/A
= 15 Overseas Private Investment Corporation 50 38
9 N/A Proparco 46 N/A
10 17 FMO 39 31
11 N/A CDC Group 39 N/A
= 9 Bank of America 109 215
Value (USDm)
FINANCIAL ADVISERS - VALUE
Rank2018 2017
Company2018 2017
1 N/A PFR Advisors 1,830 N/A
2 N/A JPMorgan 735 N/A
= N/A Leucadia National Corporation 735 N/A
4 N/A Macquarie 726 N/A
5 N/A E3 Consulting (USA) 408 N/A
6 N/A Ironstone Capital 236 N/A
7 N/A Barclays 189 N/A
8 N/A General Electric 153 N/A
9 N/A Rothschild 136 N/A
10 N/A Consilium Advisory 101 N/A
Value (USDm)
LEGAL ADVISERS - VALUE
Rank2018 2017
Company2018 2017
1 11 White & Case 3,532 2,158
2 10 Linklaters 2,767 2,469
3 1 Milbank Tweed Hadley & McCloy 2,456 11,236
4 N/A Stocche Forbes 1,830 N/A
= N/A Machado Meyer Sendacz e Opice Advogados 1,830 N/A
6 26 Clifford Chance 1,519 696
7 5 Allen & Overy 1,351 4,498
8 2 Latham & Watkins 1,226 10,038
9 N/A Chandler & Thong-ek 935 N/A
10 3 Shearman & Sterling 749 5,160
11 33 Simpson Thacher & Bartlett 735 350
= N/A Kirkland & Ellis 735 N/A
13 N/A Allens 666 N/A
14 32 Skadden Arps Slate Meagher & Flom 651 410
15 N/A Gornitzky 492 N/A
= 30 Herzog Fox & Neeman 492 571
17 24 DLA Piper 446 1,177
18 46 Salaverri Dellatorre Burgio & Wetzler Malbran 395 175
= 46 Tavarone Rovelli Salim & Miani 395 175
20 N/A Pillsbury Winthrop Shaw Pittman 256 N/A
Value (USDm)
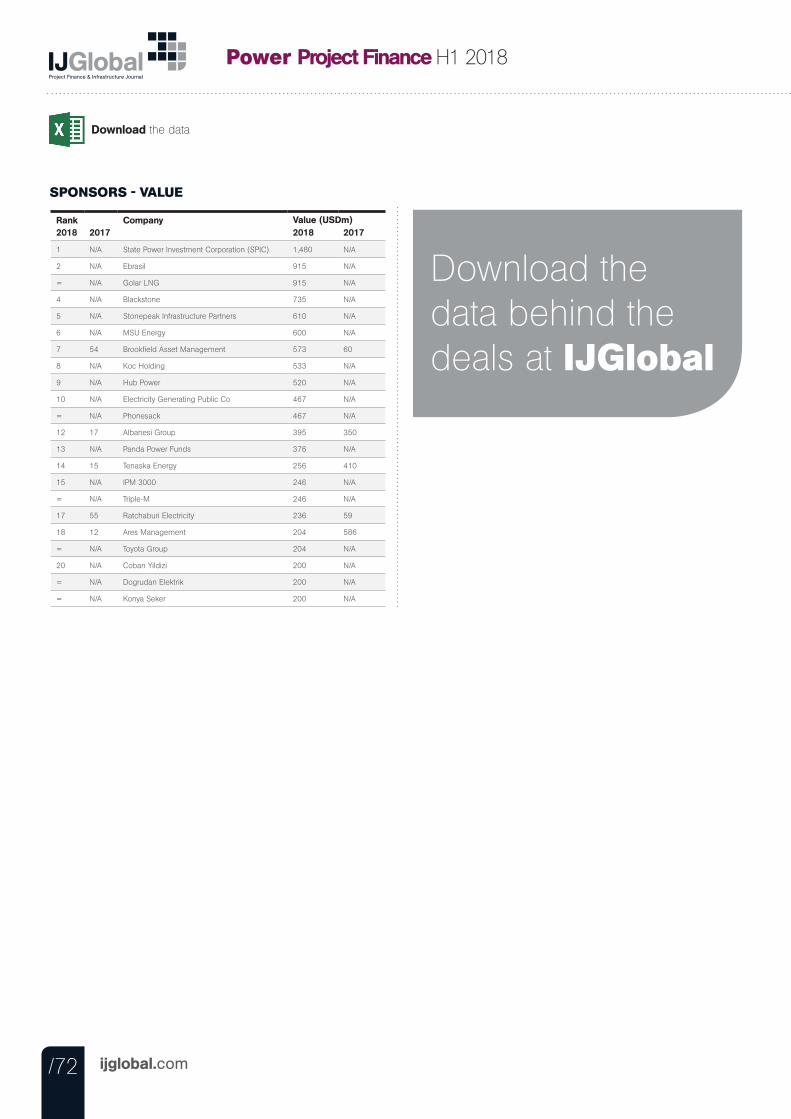
/72 ijglobal.com
Download the data
Power Project Finance H1 2018
SPONSORS - VALUE
Rank2018 2017
Company2018 2017
1 N/A State Power Investment Corporation (SPIC) 1,480 N/A
2 N/A Ebrasil 915 N/A
= N/A Golar LNG 915 N/A
4 N/A Blackstone 735 N/A
5 N/A Stonepeak Infrastructure Partners 610 N/A
6 N/A MSU Energy 600 N/A
7 54 Brookfield Asset Management 573 60
8 N/A Koc Holding 533 N/A
9 N/A Hub Power 520 N/A
10 N/A Electricity Generating Public Co 467 N/A
= N/A Phonesack 467 N/A
12 17 Albanesi Group 395 350
13 N/A Panda Power Funds 376 N/A
14 15 Tenaska Energy 256 410
15 N/A IPM 3000 246 N/A
= N/A Triple-M 246 N/A
17 55 Ratchaburi Electricity 236 59
18 12 Ares Management 204 586
= N/A Toyota Group 204 N/A
20 N/A Coban Yildizi 200 N/A
= N/A Dogrudan Elektrik 200 N/A
= N/A Konya Seker 200 N/A
Value (USDm)
Download the data behind the deals at IJGlobal
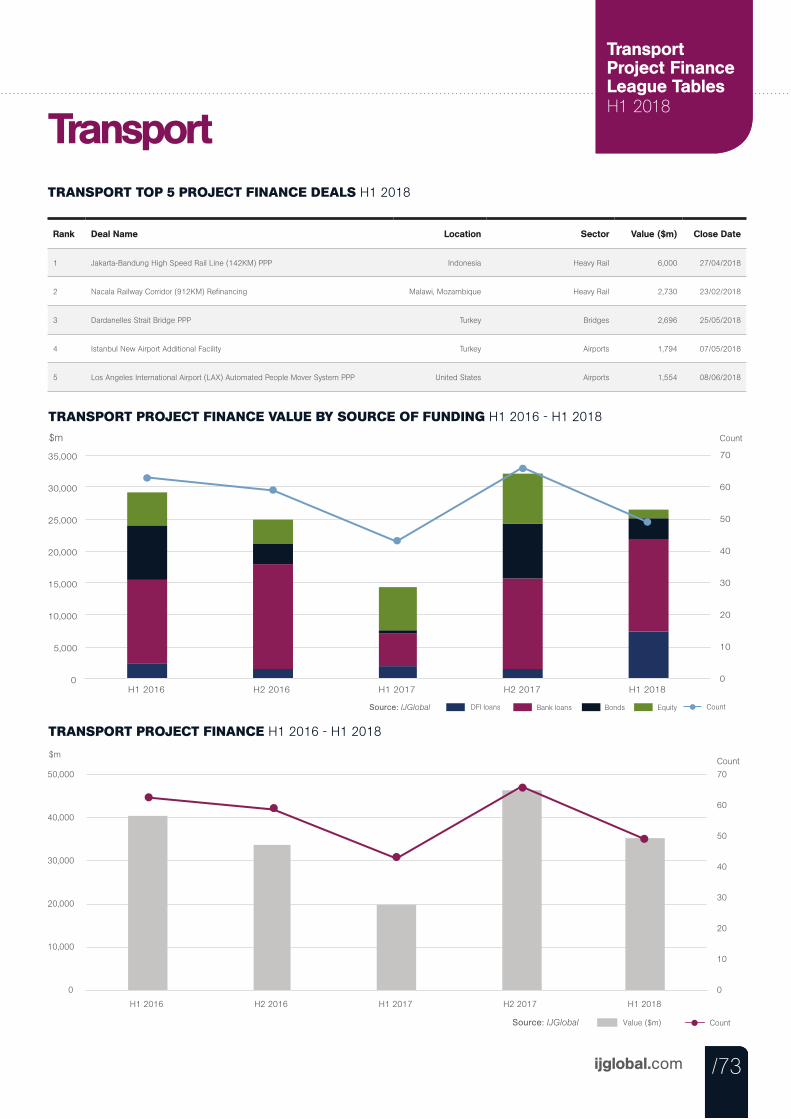
/73ijglobal.com
Renewables Infrastructure FinanceLeague Tables H1 2018
/73
Transport Project FinanceLeague Tables H1 2018
/73
TRANSPORT PROJECT FINANCE VALUE BY SOURCE OF FUNDING H1 2016 - H1 2018
$m
Bank loans DFI loans Bonds Equity Source: IJGlobal Count
0
10
20
30
40
50
60
70
0
5,000
10,000
15,000
20,000
25,000
30,000
35,000
H1 2016 H2 2016 H1 2017 H2 2017 H1 2018
Count
TRANSPORT PROJECT FINANCE H1 2016 - H1 2018
$m
Value ($m) Count Source: IJGlobal
0
10
20
30
40
50
60
70
0
10,000
20,000
30,000
40,000
50,000
H1 2016 H2 2016 H1 2017 H2 2017 H1 2018
Count
TRANSPORT TOP 5 PROJECT FINANCE DEALS H1 2018
Transport
Rank Deal Name Location Sector Value ($m) Close Date
1 Jakarta-Bandung High Speed Rail Line (142KM) PPP Indonesia Heavy Rail 6,000 27/04/2018
2 Nacala Railway Corridor (912KM) Refinancing Malawi, Mozambique Heavy Rail 2,730 23/02/2018
3 Dardanelles Strait Bridge PPP Turkey Bridges 2,696 25/05/2018
4 Istanbul New Airport Additional Facility Turkey Airports 1,794 07/05/2018
5 Los Angeles International Airport (LAX) Automated People Mover System PPP United States Airports 1,554 08/06/2018
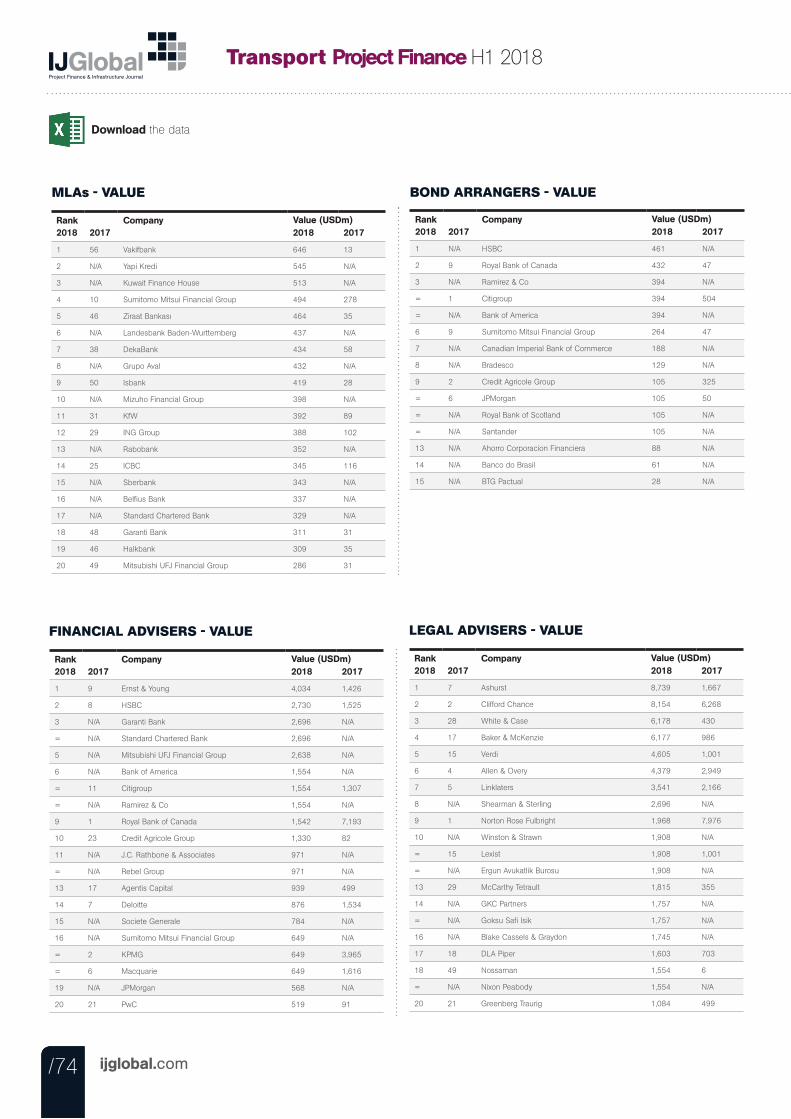
Download the data
/74 ijglobal.com
Transport Project Finance H1 2018
/74/74
MLAs - VALUE
Rank2018 2017
Company2018 2017
1 56 Vakifbank 646 13
2 N/A Yapi Kredi 545 N/A
3 N/A Kuwait Finance House 513 N/A
4 10 Sumitomo Mitsui Financial Group 494 278
5 46 Ziraat Bankası 464 35
6 N/A Landesbank Baden-Wurttemberg 437 N/A
7 38 DekaBank 434 58
8 N/A Grupo Aval 432 N/A
9 50 Isbank 419 28
10 N/A Mizuho Financial Group 398 N/A
11 31 KfW 392 89
12 29 ING Group 388 102
13 N/A Rabobank 352 N/A
14 25 ICBC 345 116
15 N/A Sberbank 343 N/A
16 N/A Belfius Bank 337 N/A
17 N/A Standard Chartered Bank 329 N/A
18 48 Garanti Bank 311 31
19 46 Halkbank 309 35
20 49 Mitsubishi UFJ Financial Group 286 31
Value (USDm)
BOND ARRANGERS - VALUE
Rank2018 2017
Company2018 2017
1 N/A HSBC 461 N/A
2 9 Royal Bank of Canada 432 47
3 N/A Ramirez & Co 394 N/A
= 1 Citigroup 394 504
= N/A Bank of America 394 N/A
6 9 Sumitomo Mitsui Financial Group 264 47
7 N/A Canadian Imperial Bank of Commerce 188 N/A
8 N/A Bradesco 129 N/A
9 2 Credit Agricole Group 105 325
= 6 JPMorgan 105 50
= N/A Royal Bank of Scotland 105 N/A
= N/A Santander 105 N/A
13 N/A Ahorro Corporacion Financiera 88 N/A
14 N/A Banco do Brasil 61 N/A
15 N/A BTG Pactual 28 N/A
Value (USDm)
FINANCIAL ADVISERS - VALUE
Rank2018 2017
Company2018 2017
1 9 Ernst & Young 4,034 1,426
2 8 HSBC 2,730 1,525
3 N/A Garanti Bank 2,696 N/A
= N/A Standard Chartered Bank 2,696 N/A
5 N/A Mitsubishi UFJ Financial Group 2,638 N/A
6 N/A Bank of America 1,554 N/A
= 11 Citigroup 1,554 1,307
= N/A Ramirez & Co 1,554 N/A
9 1 Royal Bank of Canada 1,542 7,193
10 23 Credit Agricole Group 1,330 82
11 N/A J.C. Rathbone & Associates 971 N/A
= N/A Rebel Group 971 N/A
13 17 Agentis Capital 939 499
14 7 Deloitte 876 1,534
15 N/A Societe Generale 784 N/A
16 N/A Sumitomo Mitsui Financial Group 649 N/A
= 2 KPMG 649 3,965
= 6 Macquarie 649 1,616
19 N/A JPMorgan 568 N/A
20 21 PwC 519 91
Value (USDm)
LEGAL ADVISERS - VALUE
Rank2018 2017
Company2018 2017
1 7 Ashurst 8,739 1,667
2 2 Clifford Chance 8,154 6,268
3 28 White & Case 6,178 430
4 17 Baker & McKenzie 6,177 986
5 15 Verdi 4,605 1,001
6 4 Allen & Overy 4,379 2,949
7 5 Linklaters 3,541 2,166
8 N/A Shearman & Sterling 2,696 N/A
9 1 Norton Rose Fulbright 1,968 7,976
10 N/A Winston & Strawn 1,908 N/A
= 15 Lexist 1,908 1,001
= N/A Ergun Avukatlik Burosu 1,908 N/A
13 29 McCarthy Tetrault 1,815 355
14 N/A GKC Partners 1,757 N/A
= N/A Goksu Safi Isik 1,757 N/A
16 N/A Blake Cassels & Graydon 1,745 N/A
17 18 DLA Piper 1,603 703
18 49 Nossaman 1,554 6
= N/A Nixon Peabody 1,554 N/A
20 21 Greenberg Traurig 1,084 499
Value (USDm)
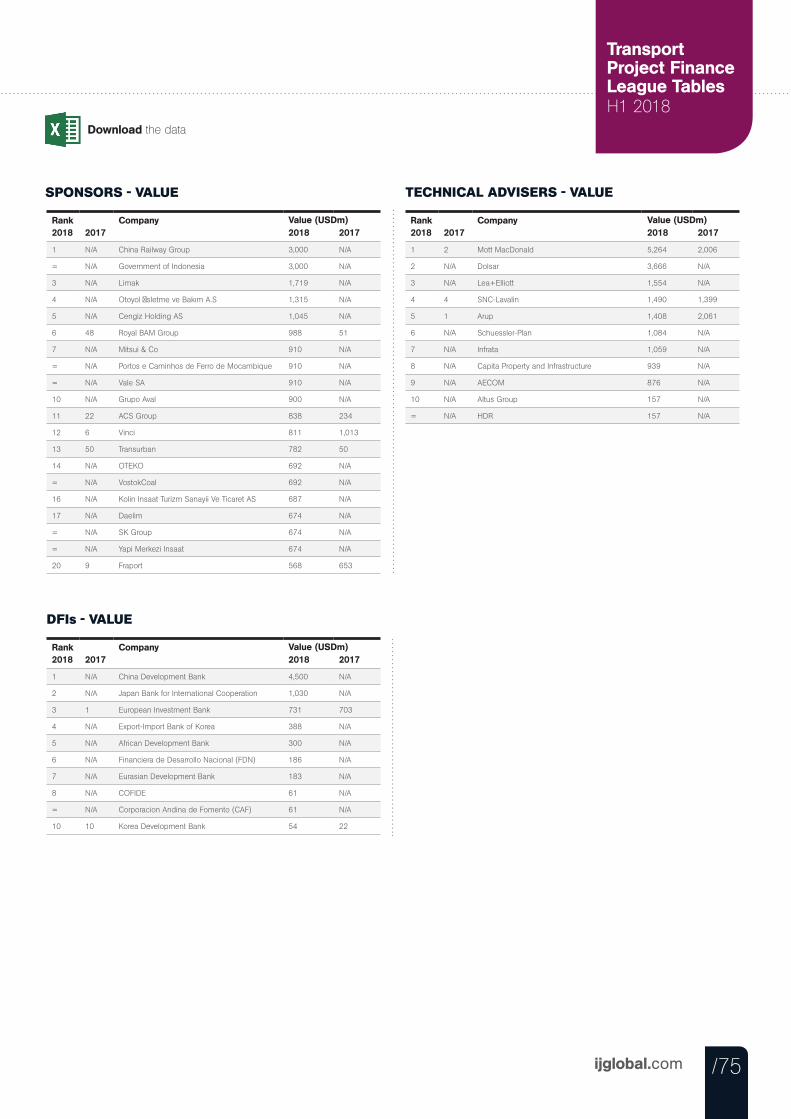
/75ijglobal.com
Download the data
Transport Project FinanceLeague Tables H1 2018
SPONSORS - VALUE
Rank2018 2017
Company2018 2017
1 N/A China Railway Group 3,000 N/A
= N/A Government of Indonesia 3,000 N/A
3 N/A Limak 1,719 N/A
4 N/A Otoyol İsletme ve Bakım A.S 1,315 N/A
5 N/A Cengiz Holding AS 1,045 N/A
6 48 Royal BAM Group 988 51
7 N/A Mitsui & Co 910 N/A
= N/A Portos e Caminhos de Ferro de Mocambique 910 N/A
= N/A Vale SA 910 N/A
10 N/A Grupo Aval 900 N/A
11 22 ACS Group 838 234
12 6 Vinci 811 1,013
13 50 Transurban 782 50
14 N/A OTEKO 692 N/A
= N/A VostokCoal 692 N/A
16 N/A Kolin Insaat Turizm Sanayii Ve Ticaret AS 687 N/A
17 N/A Daelim 674 N/A
= N/A SK Group 674 N/A
= N/A Yapi Merkezi Insaat 674 N/A
20 9 Fraport 568 653
Value (USDm)
TECHNICAL ADVISERS - VALUE
Rank2018 2017
Company2018 2017
1 2 Mott MacDonald 5,264 2,006
2 N/A Dolsar 3,666 N/A
3 N/A Lea+Elliott 1,554 N/A
4 4 SNC-Lavalin 1,490 1,399
5 1 Arup 1,408 2,061
6 N/A Schuessler-Plan 1,084 N/A
7 N/A Infrata 1,059 N/A
8 N/A Capita Property and Infrastructure 939 N/A
9 N/A AECOM 876 N/A
10 N/A Altus Group 157 N/A
= N/A HDR 157 N/A
Value (USDm)
DFIs - VALUE
Rank2018 2017
Company2018 2017
1 N/A China Development Bank 4,500 N/A
2 N/A Japan Bank for International Cooperation 1,030 N/A
3 1 European Investment Bank 731 703
4 N/A Export-Import Bank of Korea 388 N/A
5 N/A African Development Bank 300 N/A
6 N/A Financiera de Desarrollo Nacional (FDN) 186 N/A
7 N/A Eurasian Development Bank 183 N/A
8 N/A COFIDE 61 N/A
= N/A Corporacion Andina de Fomento (CAF) 61 N/A
10 10 Korea Development Bank 54 22
Value (USDm)
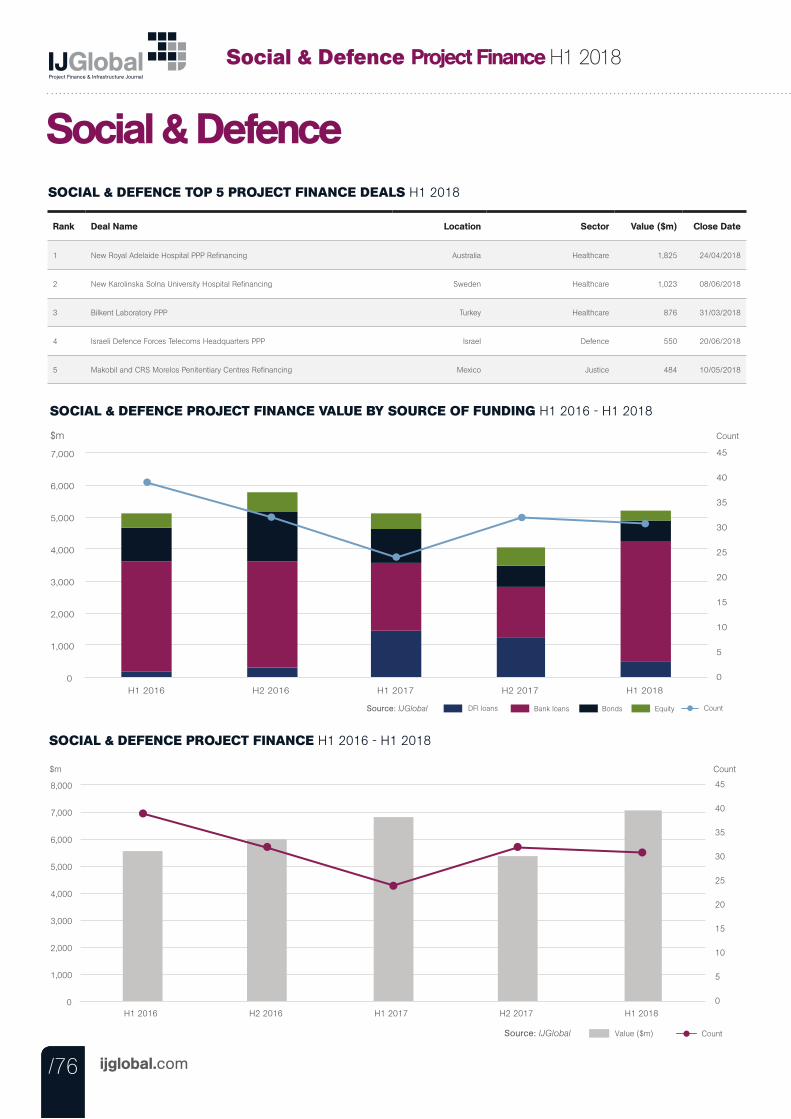
/76 ijglobal.com
Social & Defence Project Finance H1 2018
/76/76
SOCIAL & DEFENCE PROJECT FINANCE VALUE BY SOURCE OF FUNDING H1 2016 - H1 2018
$m
Bank loans DFI loans Bonds Equity Source: IJGlobal Count
0
5
10
15
20
25
30
35
40
45
0
1,000
2,000
3,000
4,000
5,000
6,000
7,000
H1 2016 H2 2016 H1 2017 H2 2017 H1 2018
Count
SOCIAL & DEFENCE PROJECT FINANCE H1 2016 - H1 2018
$m
Value ($m) Count Source: IJGlobal
0
5
10
15
20
25
30
35
40
45
0
1,000
2,000
3,000
4,000
5,000
6,000
7,000
8,000
H1 2016 H2 2016 H1 2017 H2 2017 H1 2018
Count
SOCIAL & DEFENCE TOP 5 PROJECT FINANCE DEALS H1 2018
Social & Defence
Rank Deal Name Location Sector Value ($m) Close Date
1 New Royal Adelaide Hospital PPP Refinancing Australia Healthcare 1,825 24/04/2018
2 New Karolinska Solna University Hospital Refinancing Sweden Healthcare 1,023 08/06/2018
3 Bilkent Laboratory PPP Turkey Healthcare 876 31/03/2018
4 Israeli Defence Forces Telecoms Headquarters PPP Israel Defence 550 20/06/2018
5 Makobil and CRS Morelos Penitentiary Centres Refinancing Mexico Justice 484 10/05/2018
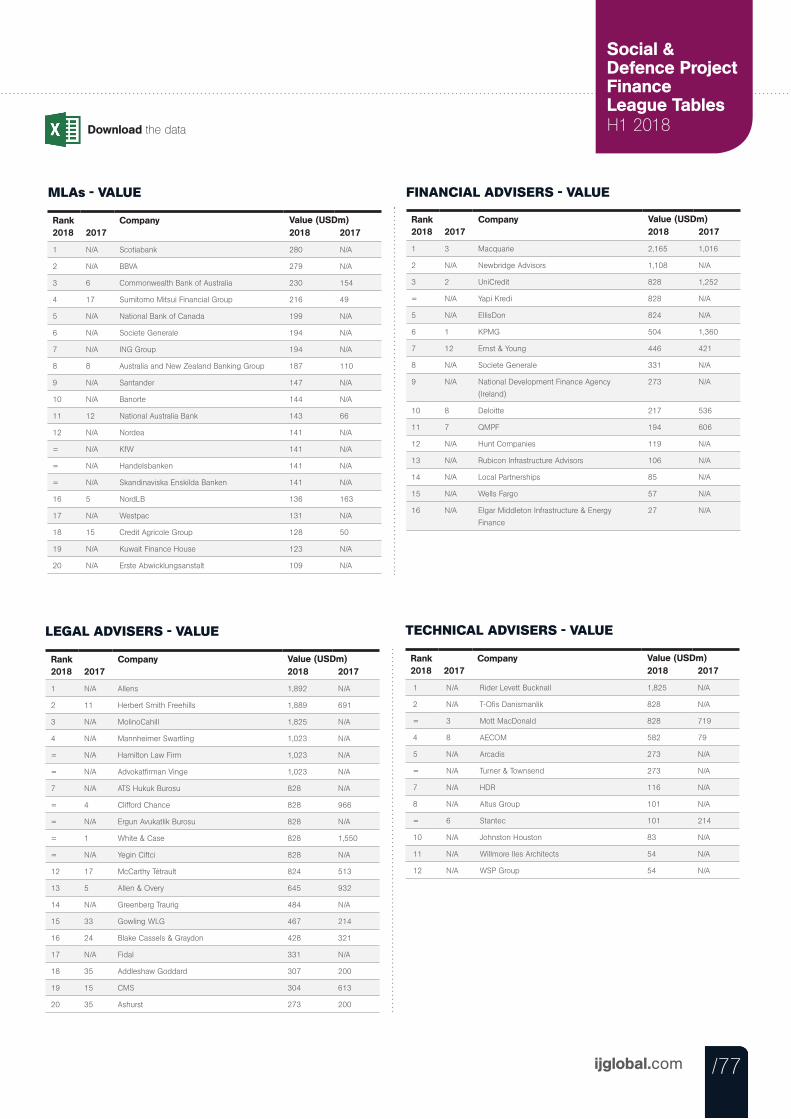
/77ijglobal.com
Social & Defence Project FinanceLeague Tables H1 2018
/77/77
MLAs - VALUE
Rank2018 2017
Company2018 2017
1 N/A Scotiabank 280 N/A
2 N/A BBVA 279 N/A
3 6 Commonwealth Bank of Australia 230 154
4 17 Sumitomo Mitsui Financial Group 216 49
5 N/A National Bank of Canada 199 N/A
6 N/A Societe Generale 194 N/A
7 N/A ING Group 194 N/A
8 8 Australia and New Zealand Banking Group 187 110
9 N/A Santander 147 N/A
10 N/A Banorte 144 N/A
11 12 National Australia Bank 143 66
12 N/A Nordea 141 N/A
= N/A KfW 141 N/A
= N/A Handelsbanken 141 N/A
= N/A Skandinaviska Enskilda Banken 141 N/A
16 5 NordLB 136 163
17 N/A Westpac 131 N/A
18 15 Credit Agricole Group 128 50
19 N/A Kuwait Finance House 123 N/A
20 N/A Erste Abwicklungsanstalt 109 N/A
Value (USDm)
FINANCIAL ADVISERS - VALUE
Rank2018 2017
Company2018 2017
1 3 Macquarie 2,165 1,016
2 N/A Newbridge Advisors 1,108 N/A
3 2 UniCredit 828 1,252
= N/A Yapi Kredi 828 N/A
5 N/A EllisDon 824 N/A
6 1 KPMG 504 1,360
7 12 Ernst & Young 446 421
8 N/A Societe Generale 331 N/A
9 N/A National Development Finance Agency
(Ireland)
273 N/A
10 8 Deloitte 217 536
11 7 QMPF 194 606
12 N/A Hunt Companies 119 N/A
13 N/A Rubicon Infrastructure Advisors 106 N/A
14 N/A Local Partnerships 85 N/A
15 N/A Wells Fargo 57 N/A
16 N/A Elgar Middleton Infrastructure & Energy
Finance
27 N/A
Value (USDm)
LEGAL ADVISERS - VALUE
Rank2018 2017
Company2018 2017
1 N/A Allens 1,892 N/A
2 11 Herbert Smith Freehills 1,889 691
3 N/A MolinoCahill 1,825 N/A
4 N/A Mannheimer Swartling 1,023 N/A
= N/A Hamilton Law Firm 1,023 N/A
= N/A Advokatfirman Vinge 1,023 N/A
7 N/A ATS Hukuk Burosu 828 N/A
= 4 Clifford Chance 828 966
= N/A Ergun Avukatlik Burosu 828 N/A
= 1 White & Case 828 1,550
= N/A Yegin Ciftci 828 N/A
12 17 McCarthy Tétrault 824 513
13 5 Allen & Overy 645 932
14 N/A Greenberg Traurig 484 N/A
15 33 Gowling WLG 467 214
16 24 Blake Cassels & Graydon 428 321
17 N/A Fidal 331 N/A
18 35 Addleshaw Goddard 307 200
19 15 CMS 304 613
20 35 Ashurst 273 200
Value (USDm)
TECHNICAL ADVISERS - VALUE
Rank2018 2017
Company2018 2017
1 N/A Rider Levett Bucknall 1,825 N/A
2 N/A T-Ofis Danismanlik 828 N/A
= 3 Mott MacDonald 828 719
4 8 AECOM 582 79
5 N/A Arcadis 273 N/A
= N/A Turner & Townsend 273 N/A
7 N/A HDR 116 N/A
8 N/A Altus Group 101 N/A
= 6 Stantec 101 214
10 N/A Johnston Houston 83 N/A
11 N/A Willmore Iles Architects 54 N/A
12 N/A WSP Group 54 N/A
Value (USDm)
Download the data
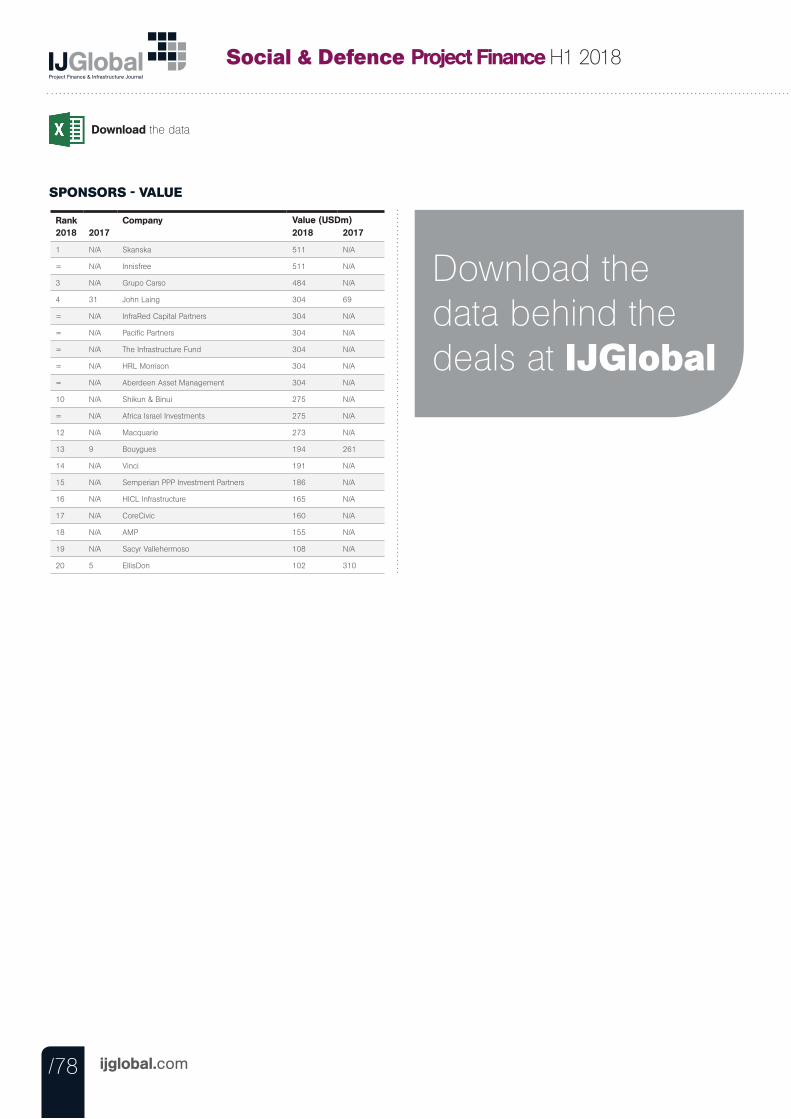
Download the data
/78 ijglobal.com
Social & Defence Project Finance H1 2018
SPONSORS - VALUE
Rank2018 2017
Company2018 2017
1 N/A Skanska 511 N/A
= N/A Innisfree 511 N/A
3 N/A Grupo Carso 484 N/A
4 31 John Laing 304 69
= N/A InfraRed Capital Partners 304 N/A
= N/A Pacific Partners 304 N/A
= N/A The Infrastructure Fund 304 N/A
= N/A HRL Morrison 304 N/A
= N/A Aberdeen Asset Management 304 N/A
10 N/A Shikun & Binui 275 N/A
= N/A Africa Israel Investments 275 N/A
12 N/A Macquarie 273 N/A
13 9 Bouygues 194 261
14 N/A Vinci 191 N/A
15 N/A Semperian PPP Investment Partners 186 N/A
16 N/A HICL Infrastructure 165 N/A
17 N/A CoreCivic 160 N/A
18 N/A AMP 155 N/A
19 N/A Sacyr Vallehermoso 108 N/A
20 5 EllisDon 102 310
Value (USDm)
Download the data behind the deals at IJGlobal

/79ijglobal.com
[email protected]+44 20 7779 8284www.ijglobal.com
IJGlobal, 8 Bouverie Street, LondonEC4Y 8AX
All content © Copyright 2018 Euromoney Institutional Investor plc, all rights reserved.