Embed Size (px)
Citation preview
H1 2018 Results Presentation20th August 2018
Disclaimer
2
This Presentation (the “Presentation”) hasbeen prepared and issued by KenmareResources plc (the “Company” or“Kenmare”). While this Presentation hasbeen prepared in good faith, the Companyand its respective officers, employees,agents and representatives expresslydisclaim any and all liability for the contentsof, or omissions from, this Presentation, andfor any other written or oral communicationtransmitted or made available to the recipientor any of its officers, employees, agents orrepresentatives.
No representations or warranties are or willbe expressed or are to be implied on the partof the Company, or any of its respectiveofficers, employees, agents orrepresentatives in or from this Presentationor any other written or oral communicationfrom the Company, or any of its respectiveofficers, employees, agents orrepresentatives concerning the Company orany other factors relevant to any transactioninvolving the Company or as to the accuracy,completeness or fairness of thisPresentation, the information or opinions on
which it is based, or any other written or oralinformation made available in connectionwith the Company.
This Presentation does not constitute or formpart of, and should not be construed as, anoffer, invitation or inducement to purchase orsubscribe for any securities of the Companynor shall it or any part of it form the basis of,or be relied upon in connection with, anycontract or investment decision relating tosuch securities, nor does it constitute arecommendation regarding the securities ofthe Company.
This Presentation is as of the date hereof.This Presentation includes certainstatements, estimates and projectionsprovided by the Company with respect to theanticipated future performance of theCompany or the industry in which it operates.Such statements, estimates and projectionsreflect various assumptions and subjectivejudgments by the Company’s managementconcerning anticipated results, certain ofwhich assumptions and judgments may besignificant in the context of the statements,
estimates and projections made. Theseassumptions and judgments may or may notprove to be correct and there can be noassurance that any projected results areattainable or will be realised. In particular,certain statements in this Presentationrelating to future financials, results, plansand expectations regarding the Company’sbusiness, growth and profitability, as well asthe general economic conditions to which theCompany is exposed, are forward looking bynature and may be affected by a variety offactors. The Company is under no obligationto update or keep current the informationcontained in this Presentation, to correct anyinaccuracies which may become apparent,or to publicly announce the result of anyrevision to the statements made herein andany opinions expressed in the Presentationor in any related materials are subject tochange without notice.
Kenmare Resources plc — H1 2018 Results Presentation
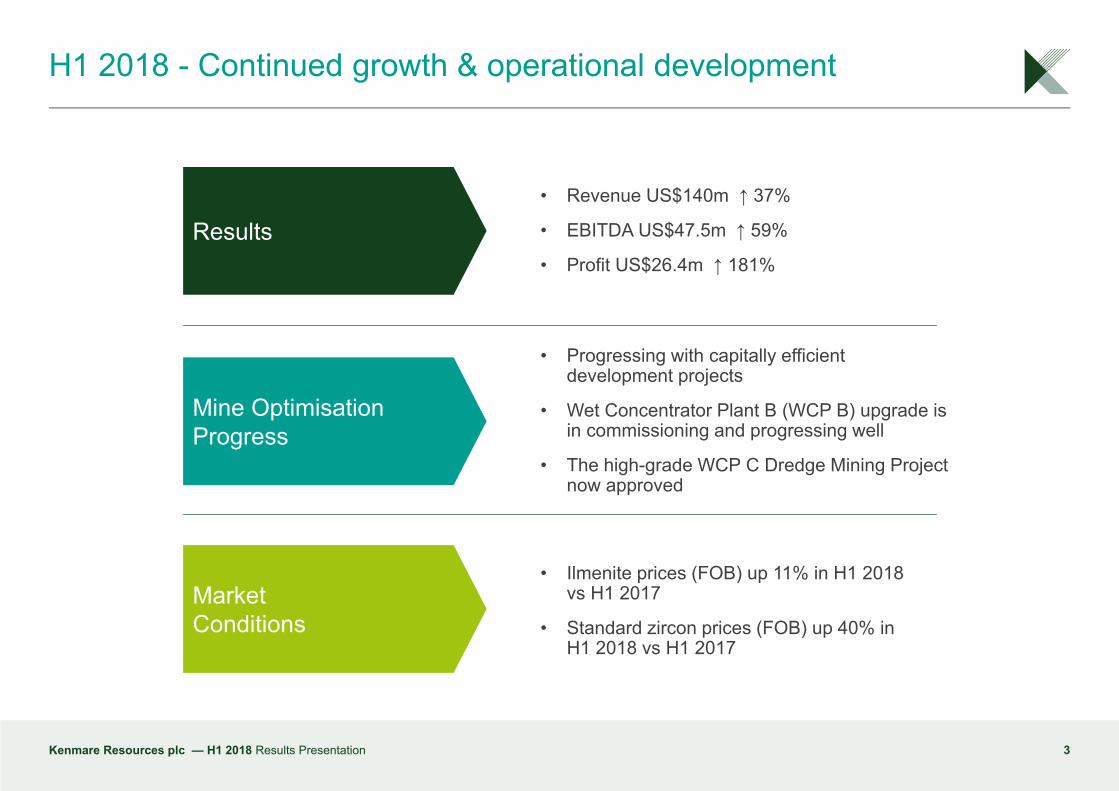
H1 2018 - Continued growth & operational development
Kenmare Resources plc — H1 2018 Results Presentation 3
• Ilmenite prices (FOB) up 11% in H1 2018 vs H1 2017
• Standard zircon prices (FOB) up 40% in H1 2018 vs H1 2017
• Revenue US$140m ↑ 37%
• EBITDA US$47.5m ↑ 59%
• Profit US$26.4m ↑ 181%Results
Mine Optimisation Progress
MarketConditions
• Progressing with capitally efficient development projects
• Wet Concentrator Plant B (WCP B) upgrade is in commissioning and progressing well
• The high-grade WCP C Dredge Mining Project now approved
0
300
600
900
1,200
2013 2014 2015 2016 2017 2018 2013 2014 2015 2016 2017 20180
20
40
60
80
Ilmne
nite
(kt)
Zirc
on (k
t)
Zircon (RHS) Ilmenite (LHS)
H1
H2
H1
H2
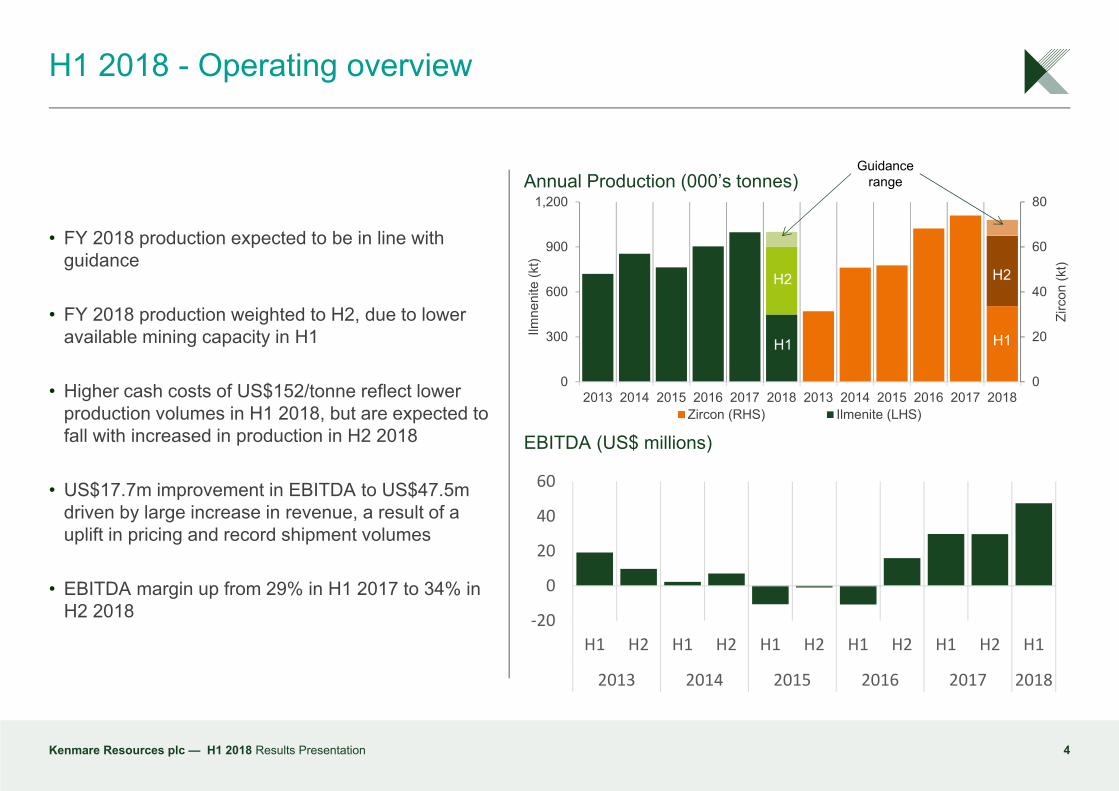
H1 2018 - Operating overview
4
• FY 2018 production expected to be in line with guidance
• FY 2018 production weighted to H2, due to lower available mining capacity in H1
• Higher cash costs of US$152/tonne reflect lower production volumes in H1 2018, but are expected to fall with increased in production in H2 2018
• US$17.7m improvement in EBITDA to US$47.5m driven by large increase in revenue, a result of a uplift in pricing and record shipment volumes
• EBITDA margin up from 29% in H1 2017 to 34% in H2 2018
EBITDA (US$ millions)
Annual Production (000’s tonnes)
Kenmare Resources plc — H1 2018 Results Presentation
‐20
0
20
40
60
H1 H2 H1 H2 H1 H2 H1 H2 H1 H2 H1
2013 2014 2015 2016 2017 2018
Guidance range
Progressing capitally efficient development projects
5
Additional mining capacity required to sustain production levels at around 1Mt ilmenite per annum, to offset declining gradesas the Namalope zone progresses toward end of mine life:
• WCP B Upgrade - Estimated DFS cost: <US$16 million
• 20% capacity addition, increasing WCP B production from 2,000tph to 2,400tph• Project in commissioning• Currently on time and under budget
• WCP C Dredge Mining Project - Estimated DFS cost: <US$45 million
• Located in a high-grade area of the Namalope orebody and inaccessible to existing dredge operations• 10 year life of mine, close to the MSP, at a mining rate of 500tph• Expect to complete construction by end-2019 and generate an IRR >30%• DFS completed recently and now approved
Additional revenue stream captured to enhance margins:
• Monazite concentrate project - Estimated DFS cost: US$6 million
• High-return project delivering additional concentrate product tonnes• Incremental revenues at low operating costs • Feasibility studies completed in 2017, board approved and currently in construction
Kenmare Resources plc — H1 2018 Results Presentation
H1 2018 Financial Results
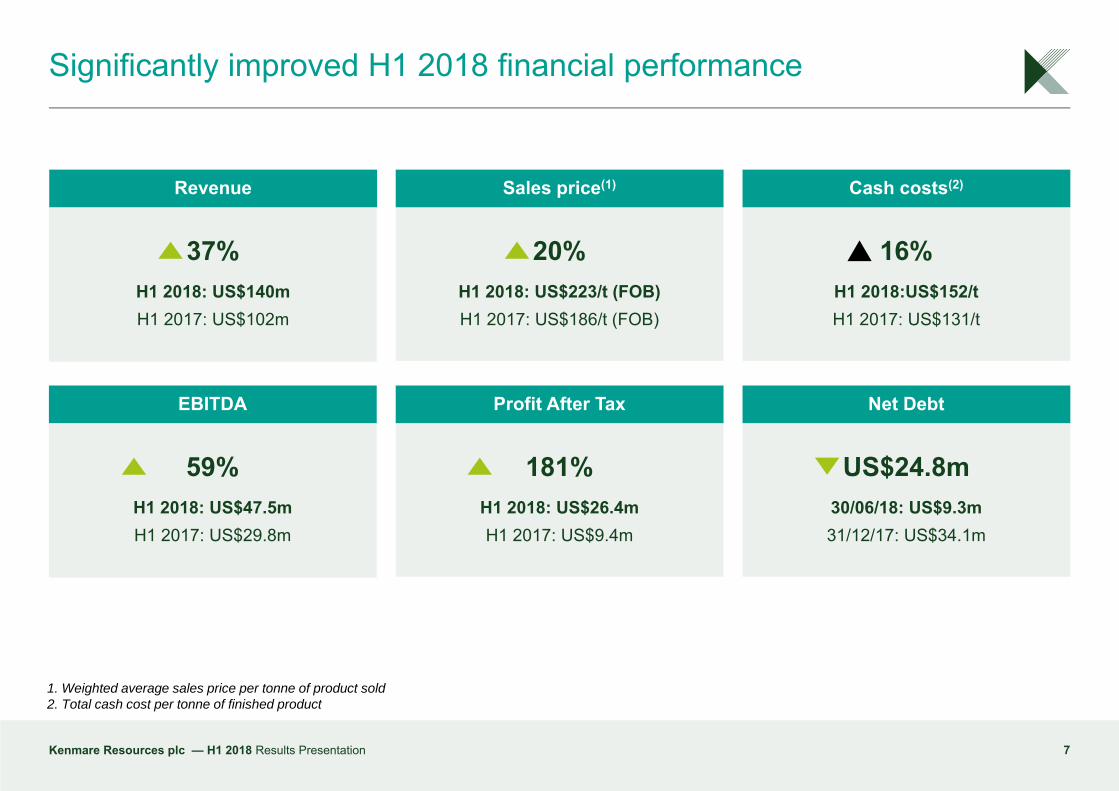
Significantly improved H1 2018 financial performance
Kenmare Resources plc — H1 2018 Results Presentation 7
Sales price(1) Cash costs(2)
20%H1 2018: US$223/t (FOB)H1 2017: US$186/t (FOB)
16%H1 2018:US$152/tH1 2017: US$131/t
EBITDA Profit After Tax Net Debt
59%H1 2018: US$47.5mH1 2017: US$29.8m
181%H1 2018: US$26.4mH1 2017: US$9.4m
US$24.8m30/06/18: US$9.3m31/12/17: US$34.1m
1. Weighted average sales price per tonne of product sold2. Total cash cost per tonne of finished product
Revenue
37%H1 2018: US$140mH1 2017: US$102m
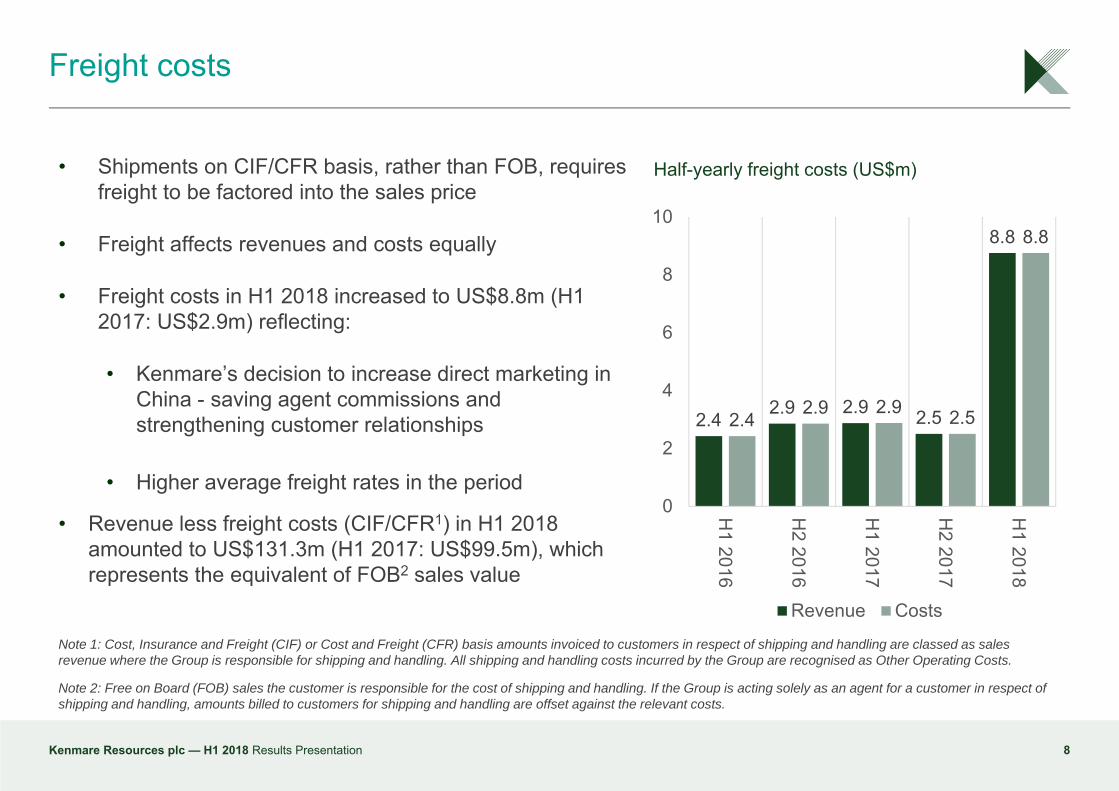
• Shipments on CIF/CFR basis, rather than FOB, requires freight to be factored into the sales price
• Freight affects revenues and costs equally
• Freight costs in H1 2018 increased to US$8.8m (H1 2017: US$2.9m) reflecting:
• Kenmare’s decision to increase direct marketing in China - saving agent commissions and strengthening customer relationships
• Higher average freight rates in the period
• Revenue less freight costs (CIF/CFR1) in H1 2018 amounted to US$131.3m (H1 2017: US$99.5m), which represents the equivalent of FOB2 sales value
Freight costs
8Kenmare Resources plc — H1 2018 Results Presentation
Note 1: Cost, Insurance and Freight (CIF) or Cost and Freight (CFR) basis amounts invoiced to customers in respect of shipping and handling are classed as sales revenue where the Group is responsible for shipping and handling. All shipping and handling costs incurred by the Group are recognised as Other Operating Costs.
Note 2: Free on Board (FOB) sales the customer is responsible for the cost of shipping and handling. If the Group is acting solely as an agent for a customer in respect of shipping and handling, amounts billed to customers for shipping and handling are offset against the relevant costs.
2.4 2.9 2.9 2.5
8.8
2.4 2.9 2.9 2.5
8.8
0
2
4
6
8
10
H1 2016
H2 2016
H1 2017
H2 2017
H1 2018
Revenue Costs
Half-yearly freight costs (US$m)
H1 2018 Income Statement review
Kenmare Resources plc — H1 2018 Results Presentation 9
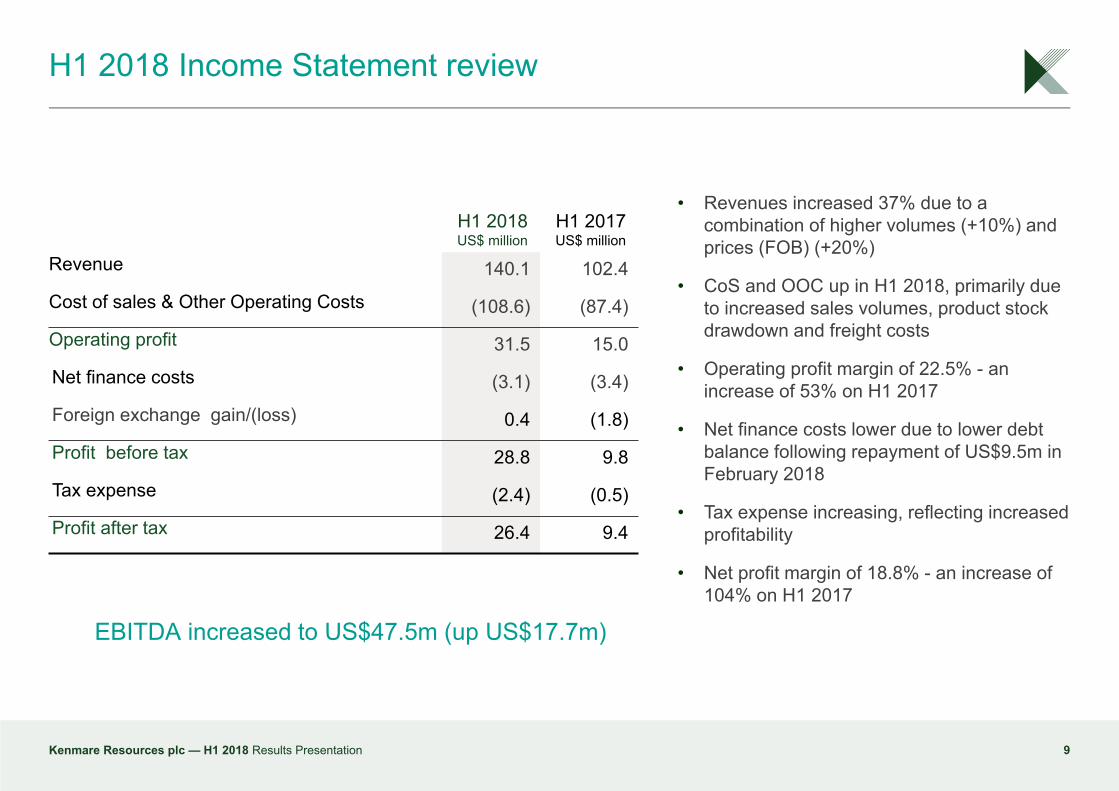
H1 2018US$ million
H1 2017US$ million
Revenue 140.1 102.4
Cost of sales & Other Operating Costs (108.6) (87.4)
Operating profit 31.5 15.0
Net finance costs (3.1) (3.4)
Foreign exchange gain/(loss) 0.4 (1.8)
Profit before tax 28.8 9.8
Tax expense (2.4) (0.5)
Profit after tax 26.4 9.4
• Revenues increased 37% due to a combination of higher volumes (+10%) and prices (FOB) (+20%)
• CoS and OOC up in H1 2018, primarily due to increased sales volumes, product stock drawdown and freight costs
• Operating profit margin of 22.5% - an increase of 53% on H1 2017
• Net finance costs lower due to lower debt balance following repayment of US$9.5m in February 2018
• Tax expense increasing, reflecting increased profitability
• Net profit margin of 18.8% - an increase of 104% on H1 2017
EBITDA increased to US$47.5m (up US$17.7m)
H1 2018 revenue review
Kenmare Resources plc — H1 2018 Results Presentation 10
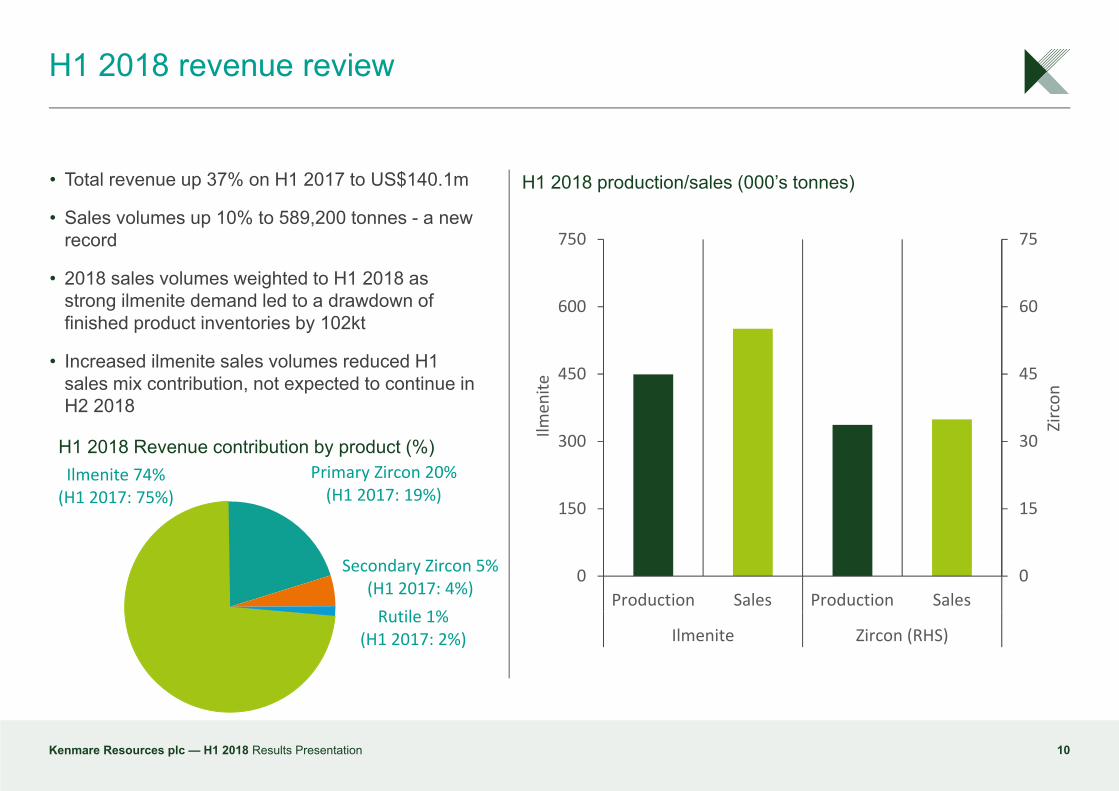
• Total revenue up 37% on H1 2017 to US$140.1m
• Sales volumes up 10% to 589,200 tonnes - a new record
• 2018 sales volumes weighted to H1 2018 as strong ilmenite demand led to a drawdown of finished product inventories by 102kt
• Increased ilmenite sales volumes reduced H1 sales mix contribution, not expected to continue in H2 2018
H1 2018 production/sales (000’s tonnes)
Ilmenite 74% (H1 2017: 75%)
Primary Zircon 20% (H1 2017: 19%)
Secondary Zircon 5% (H1 2017: 4%)Rutile 1%
(H1 2017: 2%)
H1 2018 Revenue contribution by product (%)
0
15
30
45
60
75
0
150
300
450
600
750
Production Sales Production Sales
Ilmenite Zircon (RHS)
Zircon
Ilmen
ite
H1 2018 achieved pricing
Kenmare Resources plc — H1 2018 Results Presentation 11
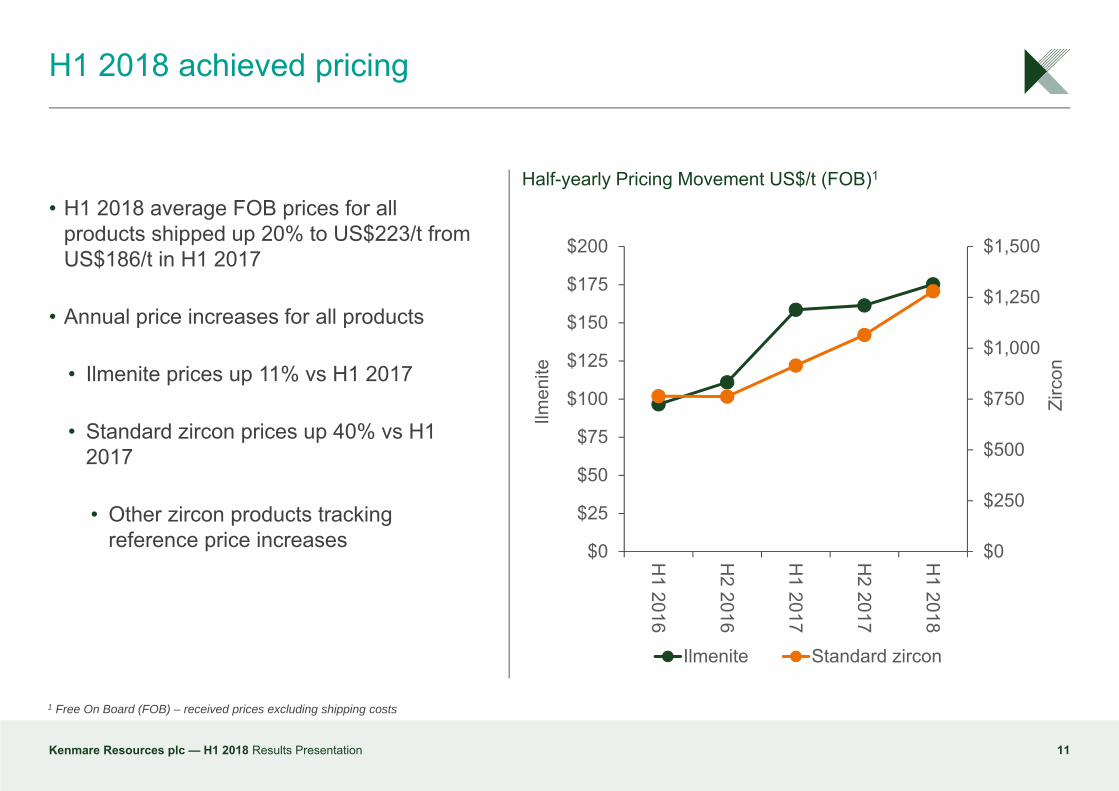
• H1 2018 average FOB prices for all products shipped up 20% to US$223/t from US$186/t in H1 2017
• Annual price increases for all products
• Ilmenite prices up 11% vs H1 2017
• Standard zircon prices up 40% vs H1 2017
• Other zircon products tracking reference price increases
Half-yearly Pricing Movement US$/t (FOB)1
1 Free On Board (FOB) – received prices excluding shipping costs
$0
$250
$500
$750
$1,000
$1,250
$1,500
$0
$25
$50
$75
$100
$125
$150
$175
$200
H1 2016
H2 2016
H1 2017
H2 2017
H1 2018
Zirc
on
Ilmen
ite
Ilmenite Standard zircon
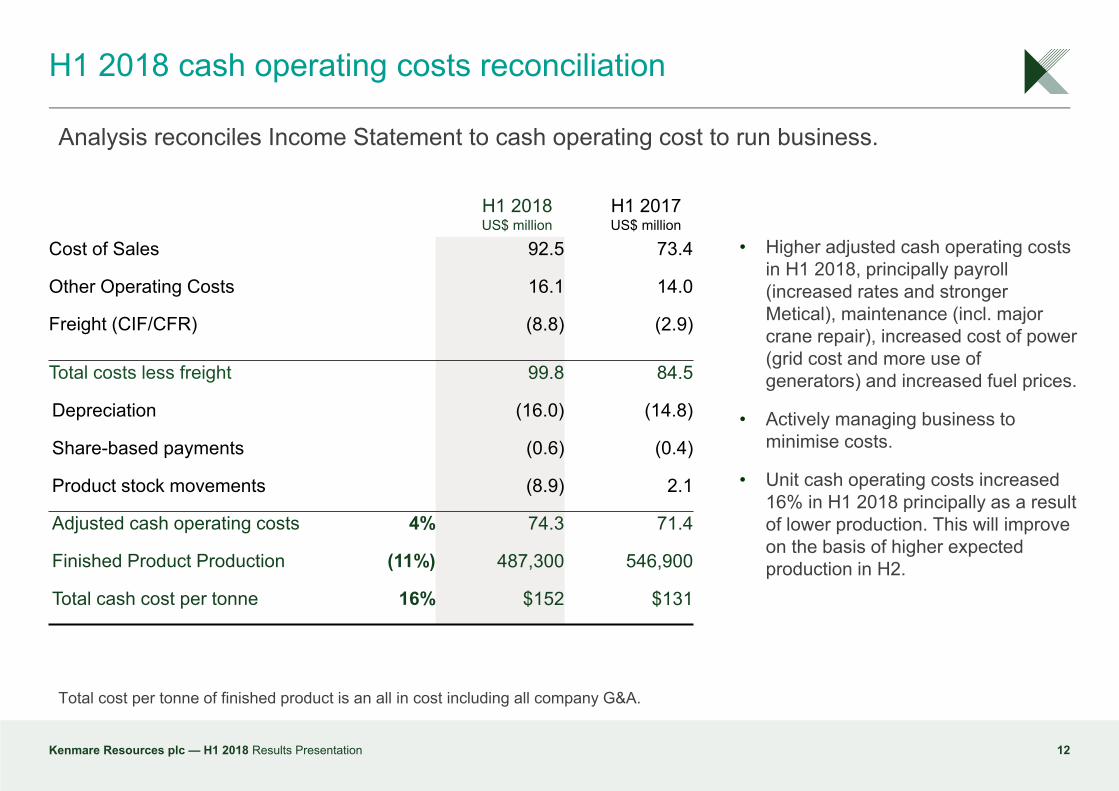
H1 2018 cash operating costs reconciliation
Kenmare Resources plc — H1 2018 Results Presentation 12
H1 2018US$ million
H1 2017US$ million
Cost of Sales 92.5 73.4
Other Operating Costs 16.1 14.0
Freight (CIF/CFR) (8.8) (2.9)
Total costs less freight 99.8 84.5
Depreciation (16.0) (14.8)
Share-based payments (0.6) (0.4)
Product stock movements (8.9) 2.1
Adjusted cash operating costs 4% 74.3 71.4
Finished Product Production (11%) 487,300 546,900
Total cash cost per tonne 16% $152 $131
• Higher adjusted cash operating costs in H1 2018, principally payroll (increased rates and stronger Metical), maintenance (incl. major crane repair), increased cost of power (grid cost and more use of generators) and increased fuel prices.
• Actively managing business to minimise costs.
• Unit cash operating costs increased 16% in H1 2018 principally as a result of lower production. This will improve on the basis of higher expected production in H2.
Analysis reconciles Income Statement to cash operating cost to run business.
Total cost per tonne of finished product is an all in cost including all company G&A.
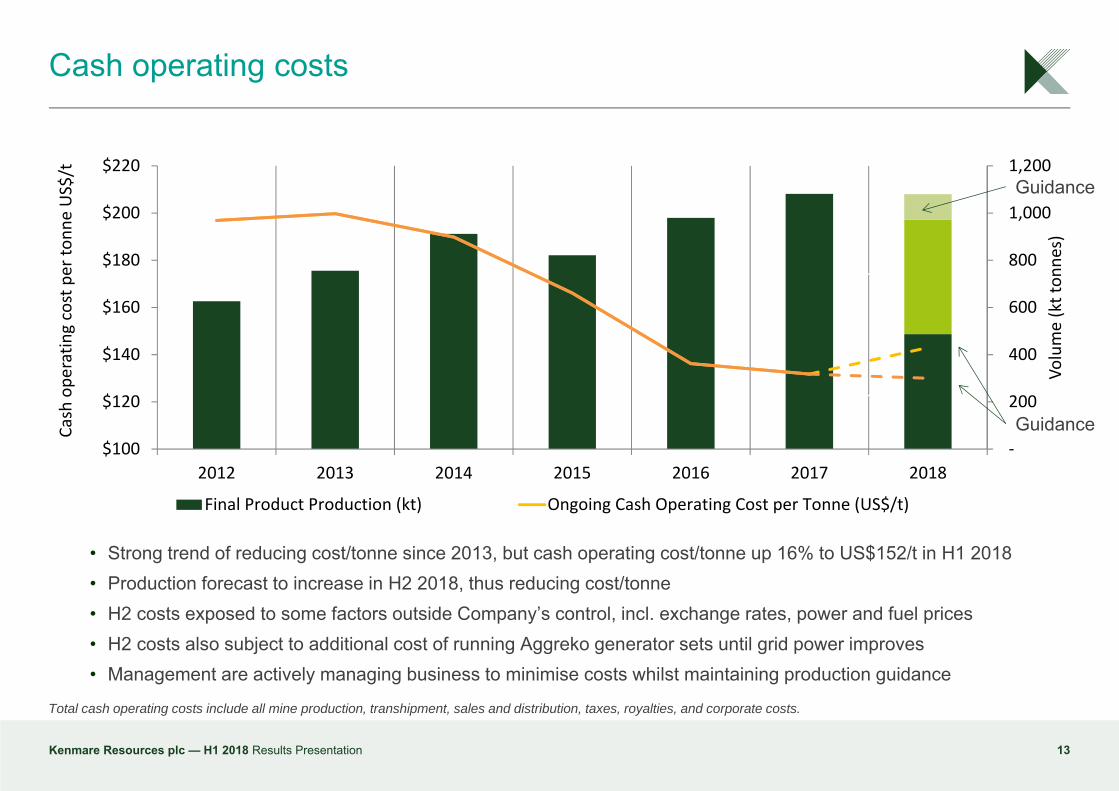
Cash operating costs
13
Total cash operating costs include all mine production, transhipment, sales and distribution, taxes, royalties, and corporate costs.
• Strong trend of reducing cost/tonne since 2013, but cash operating cost/tonne up 16% to US$152/t in H1 2018• Production forecast to increase in H2 2018, thus reducing cost/tonne• H2 costs exposed to some factors outside Company’s control, incl. exchange rates, power and fuel prices• H2 costs also subject to additional cost of running Aggreko generator sets until grid power improves• Management are actively managing business to minimise costs whilst maintaining production guidance
Kenmare Resources plc — H1 2018 Results Presentation
‐
200
400
600
800
1,000
1,200
$100
$120
$140
$160
$180
$200
$220
2012 2013 2014 2015 2016 2017 2018
Volume (kt ton
nes)
Cash ope
ratin
g cost per to
nne US$/t
Final Product Production (kt) Ongoing Cash Operating Cost per Tonne (US$/t)
H1
H2
Guidance
Guidance
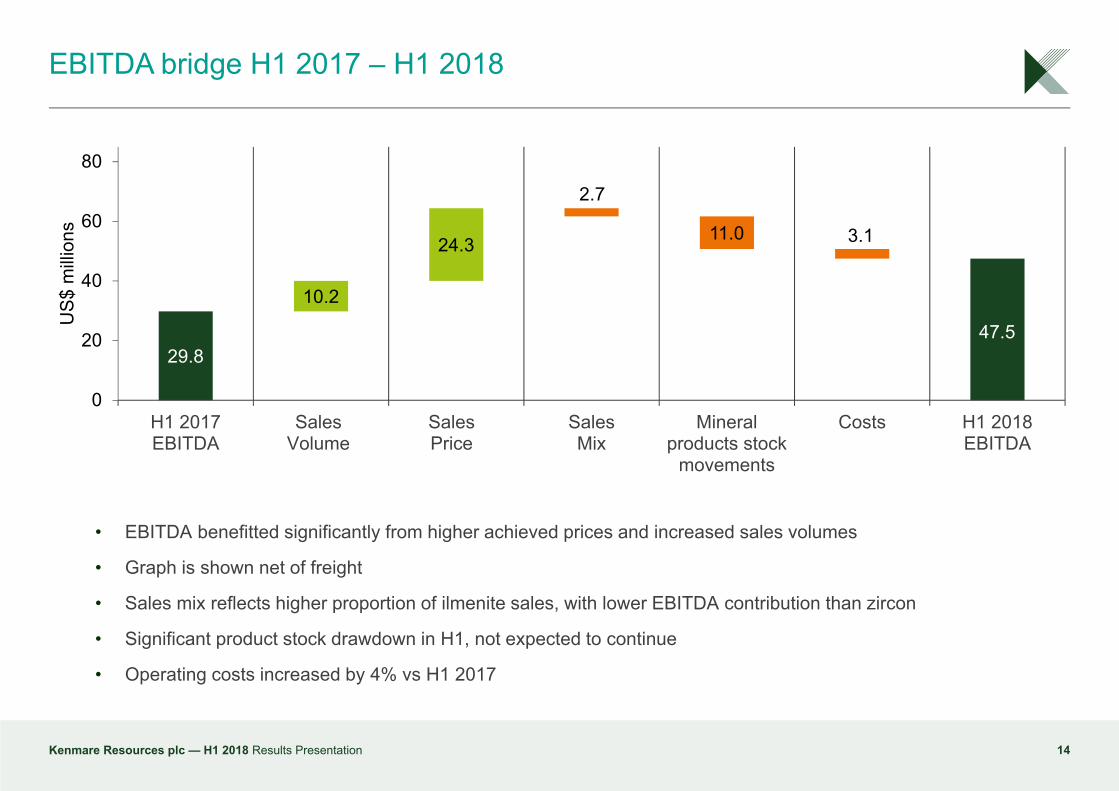
• EBITDA benefitted significantly from higher achieved prices and increased sales volumes
• Graph is shown net of freight
• Sales mix reflects higher proportion of ilmenite sales, with lower EBITDA contribution than zircon
• Significant product stock drawdown in H1, not expected to continue
• Operating costs increased by 4% vs H1 2017
EBITDA bridge H1 2017 – H1 2018
14Kenmare Resources plc — H1 2018 Results Presentation
29.8
10.2
24.3
2.7
11.0 3.1
0
20
40
60
80
H1 2017EBITDA
SalesVolume
SalesPrice
SalesMix
Mineralproducts stock
movements
Costs H1 2018EBITDA
US$
milli
ons
47.5
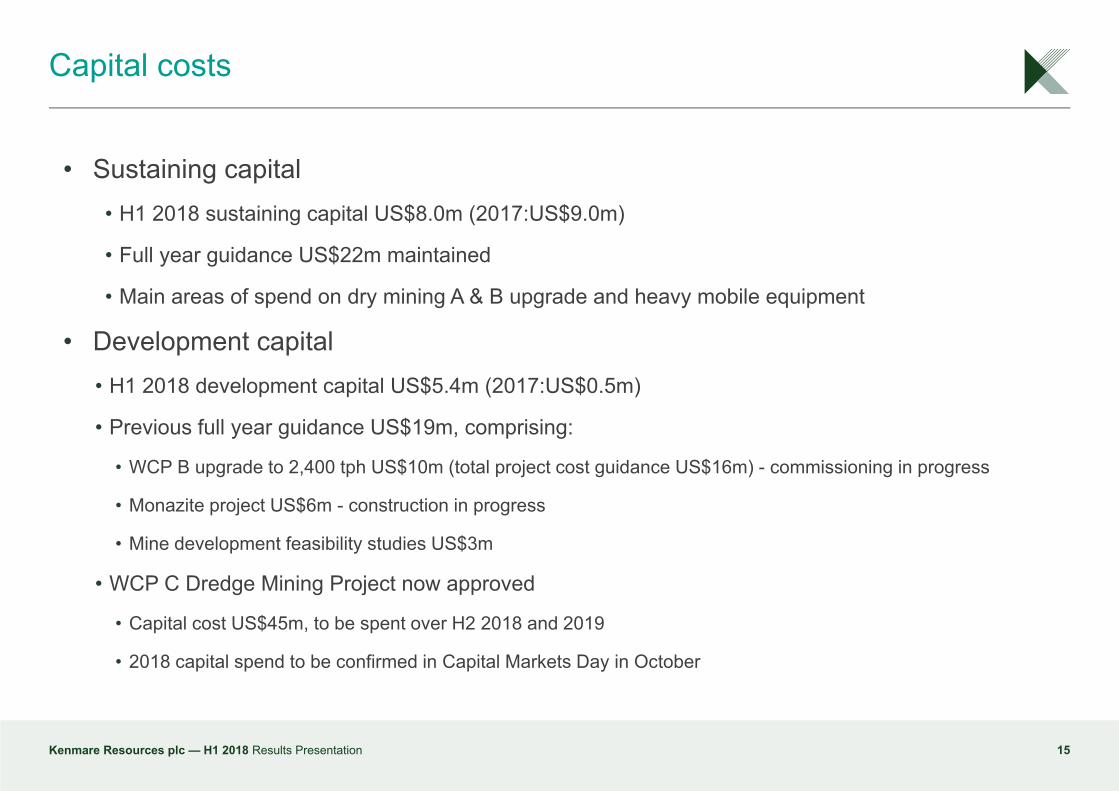
Capital costs
15
• Sustaining capital• H1 2018 sustaining capital US$8.0m (2017:US$9.0m)
• Full year guidance US$22m maintained
• Main areas of spend on dry mining A & B upgrade and heavy mobile equipment
• Development capital• H1 2018 development capital US$5.4m (2017:US$0.5m)
• Previous full year guidance US$19m, comprising:
• WCP B upgrade to 2,400 tph US$10m (total project cost guidance US$16m) - commissioning in progress
• Monazite project US$6m - construction in progress
• Mine development feasibility studies US$3m
• WCP C Dredge Mining Project now approved
• Capital cost US$45m, to be spent over H2 2018 and 2019
• 2018 capital spend to be confirmed in Capital Markets Day in October
Kenmare Resources plc — H1 2018 Results Presentation

Balance Sheet review
Kenmare Resources plc — H1 2018 Results Presentation 16
30-Jun-2018US$ million
31-Dec-2017US$ million
Property, plant & equipment 789.6 793.6
Inventories 44.5 52.7
Trade & other receivables 39.6 25.4
Deferred tax asset 1.8 4.2
Cash 84.0 68.8
Total assets 959.5 944.7
Equity & reserves 823.2 796.2
Bank loans 93.3 102.9
Creditors & provisions 43.0 45.6
Total equity & liabilities 959.5 944.7
• Mineral inventories (↓US$8.9m) of US$22.0m
(Dec-17: US$30.9m), reflecting drawdown of
stock in H1 2018
• Trade & other receivables (↑ US$14.2m) up as
a result of higher shipments & prices in the
period and timing of shipments
• Tax losses were utilised in period reducing the
deferred tax asset
• Cash balance increased in line with increased
sales and profitability in the period
• Bank loans reduced to US$93m after the first
repayment of principal in Feb-18
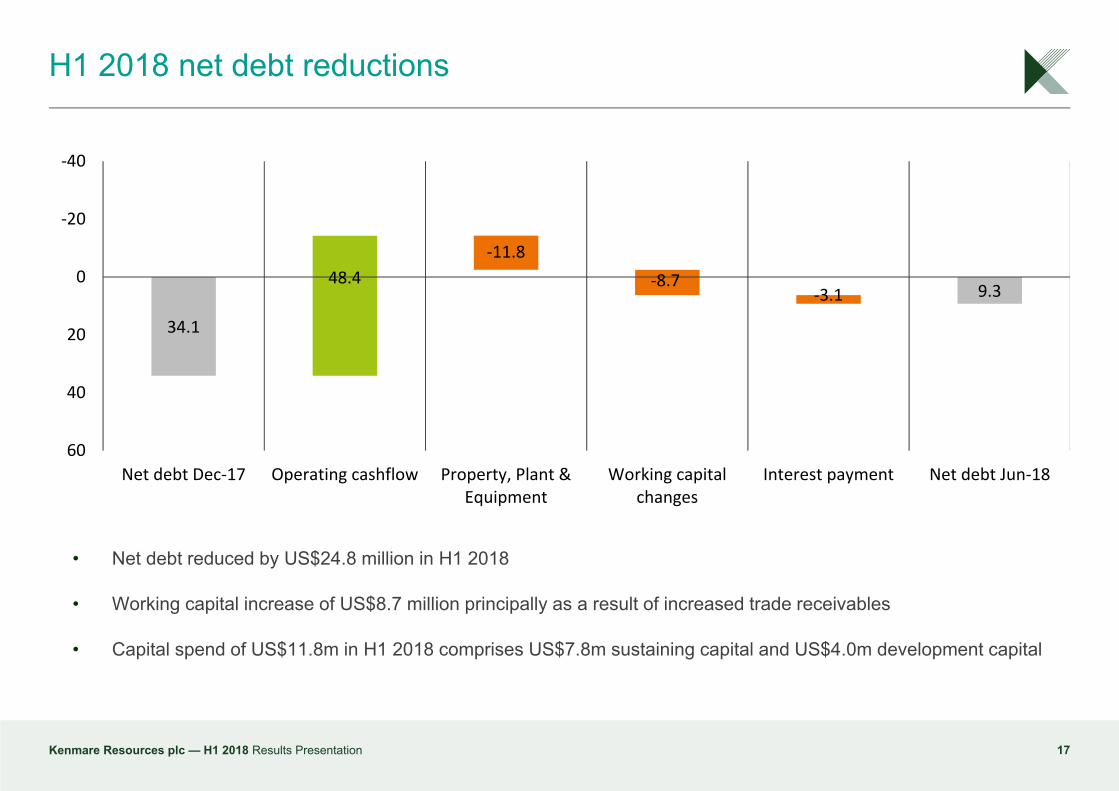
H1 2018 net debt reductions
17
• Net debt reduced by US$24.8 million in H1 2018
• Working capital increase of US$8.7 million principally as a result of increased trade receivables
• Capital spend of US$11.8m in H1 2018 comprises US$7.8m sustaining capital and US$4.0m development capital
Kenmare Resources plc — H1 2018 Results Presentation
34.1
48.4‐11.8
‐8.7‐3.1 9.3
‐40
‐20
0
20
40
60Net debt Dec‐17 Operating cashflow Property, Plant &
EquipmentWorking capital
changesInterest payment Net debt Jun‐18
Outlook
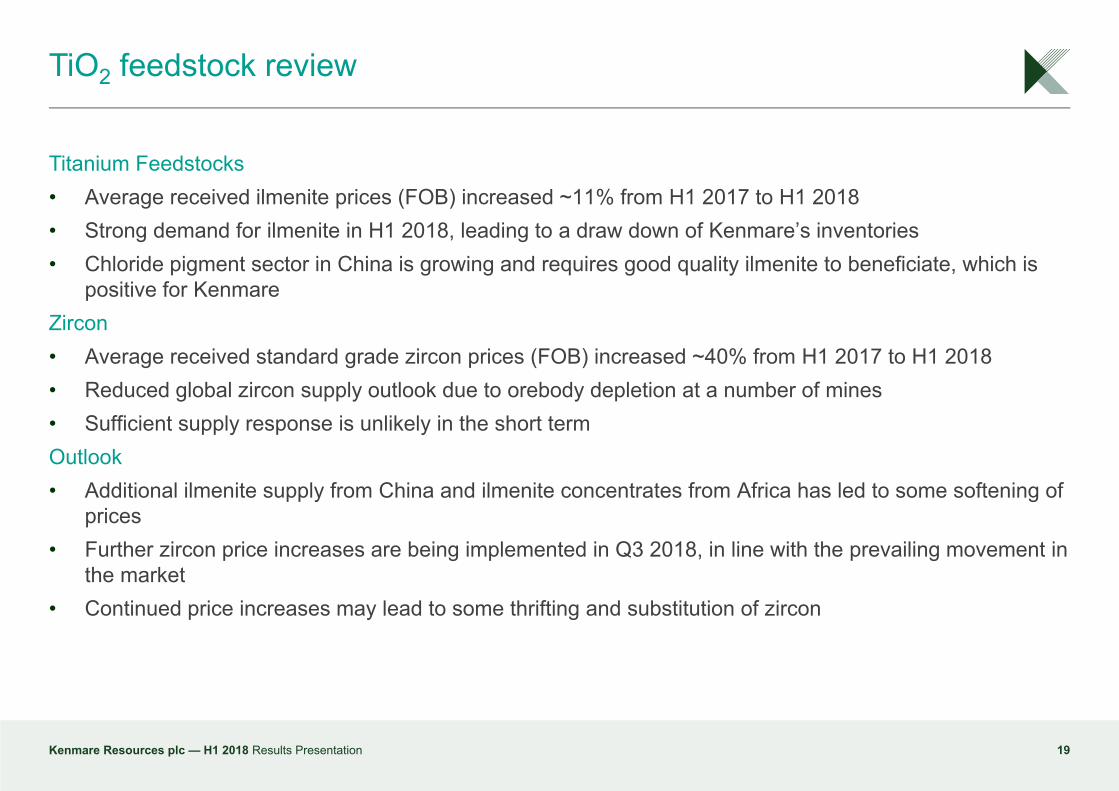
TiO2 feedstock review
19
Titanium Feedstocks• Average received ilmenite prices (FOB) increased ~11% from H1 2017 to H1 2018• Strong demand for ilmenite in H1 2018, leading to a draw down of Kenmare’s inventories• Chloride pigment sector in China is growing and requires good quality ilmenite to beneficiate, which is
positive for KenmareZircon• Average received standard grade zircon prices (FOB) increased ~40% from H1 2017 to H1 2018• Reduced global zircon supply outlook due to orebody depletion at a number of mines• Sufficient supply response is unlikely in the short termOutlook• Additional ilmenite supply from China and ilmenite concentrates from Africa has led to some softening of
prices• Further zircon price increases are being implemented in Q3 2018, in line with the prevailing movement in
the market• Continued price increases may lead to some thrifting and substitution of zircon
Kenmare Resources plc — H1 2018 Results Presentation
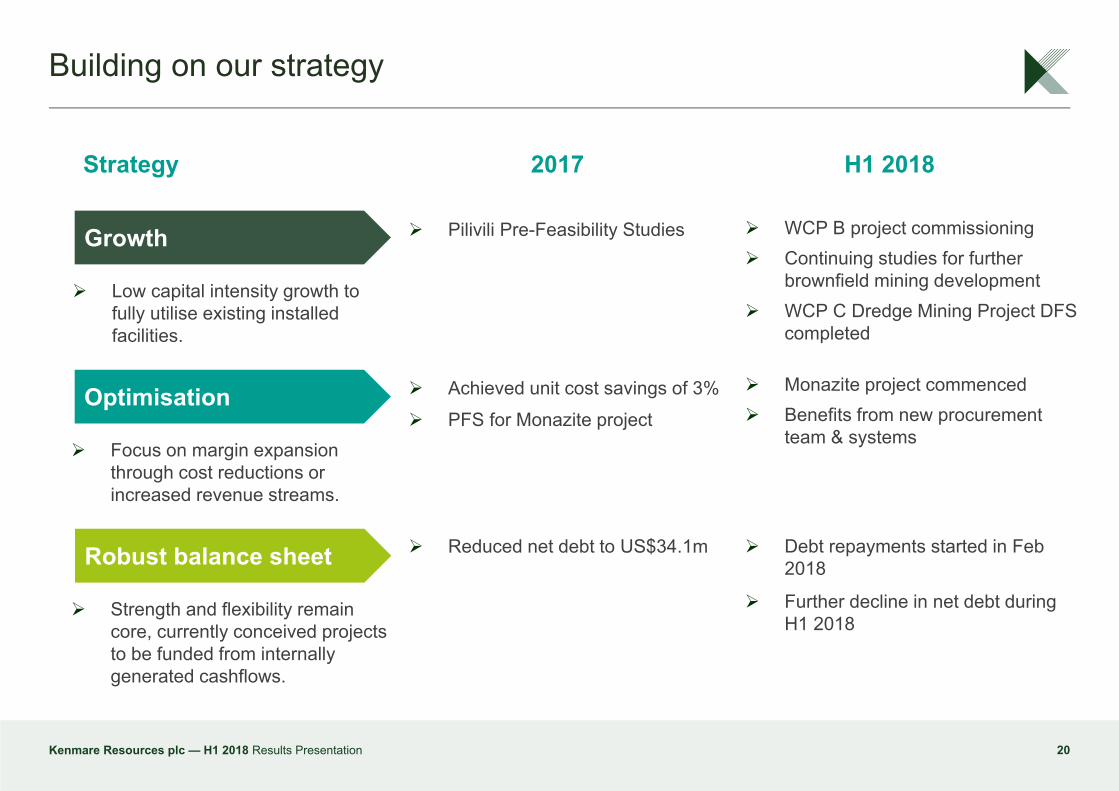
Building on our strategy
20
Growth
Robust balance sheet
Optimisation
Strategy 2017 H1 2018
Low capital intensity growth to fully utilise existing installed facilities.
Focus on margin expansion through cost reductions or increased revenue streams.
Strength and flexibility remain core, currently conceived projects to be funded from internally generated cashflows.
Pilivili Pre-Feasibility Studies
Achieved unit cost savings of 3% PFS for Monazite project
Reduced net debt to US$34.1m
WCP B project commissioning Continuing studies for further
brownfield mining development WCP C Dredge Mining Project DFS
completed
Monazite project commenced Benefits from new procurement
team & systems
Debt repayments started in Feb 2018
Further decline in net debt during H1 2018
Kenmare Resources plc — H1 2018 Results Presentation

Appendices
2018 guidance (provided 11 January 2018)
22Kenmare Resources plc — H1 2018 Results Presentation
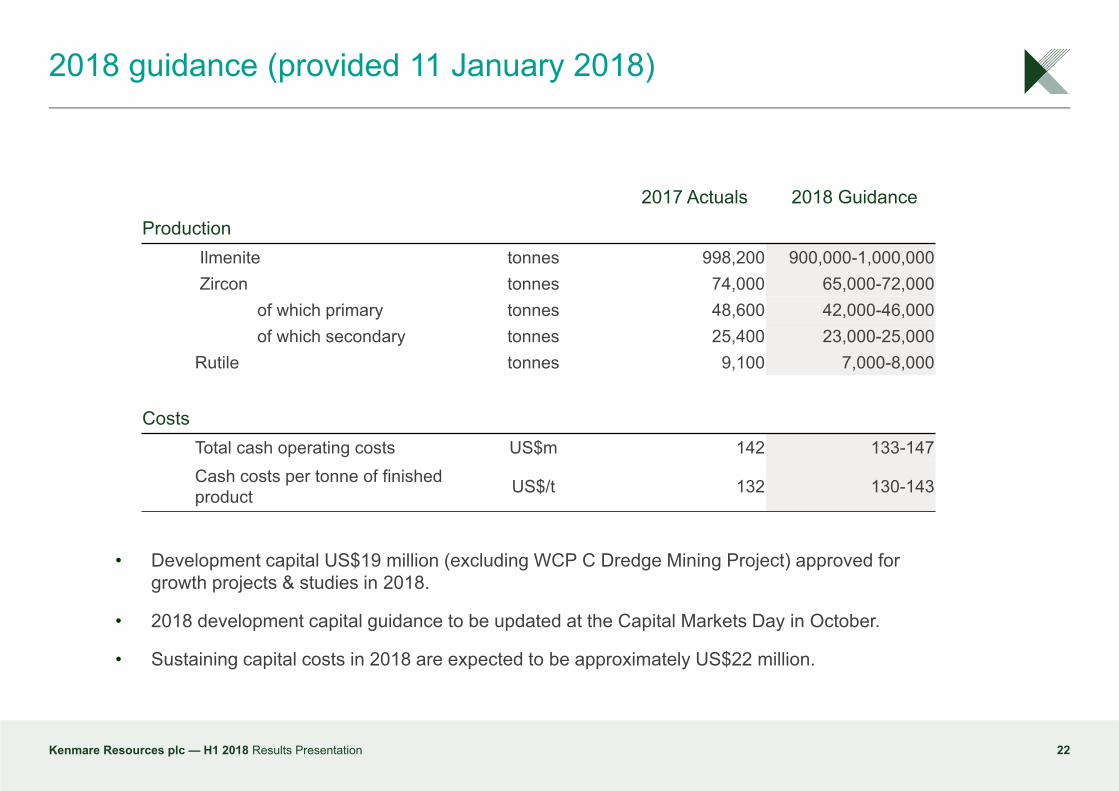
• Development capital US$19 million (excluding WCP C Dredge Mining Project) approved for growth projects & studies in 2018.
• 2018 development capital guidance to be updated at the Capital Markets Day in October.
• Sustaining capital costs in 2018 are expected to be approximately US$22 million.
2017 Actuals 2018 GuidanceProduction
Ilmenite tonnes 998,200 900,000-1,000,000Zircon tonnes 74,000 65,000-72,000
of which primary tonnes 48,600 42,000-46,000of which secondary tonnes 25,400 23,000-25,000
Rutile tonnes 9,100 7,000-8,000
CostsTotal cash operating costs US$m 142 133-147Cash costs per tonne of finished product US$/t 132 130-143
Adjusted Cash Operating Costs
23Kenmare Resources plc — H1 2018 Results Presentation
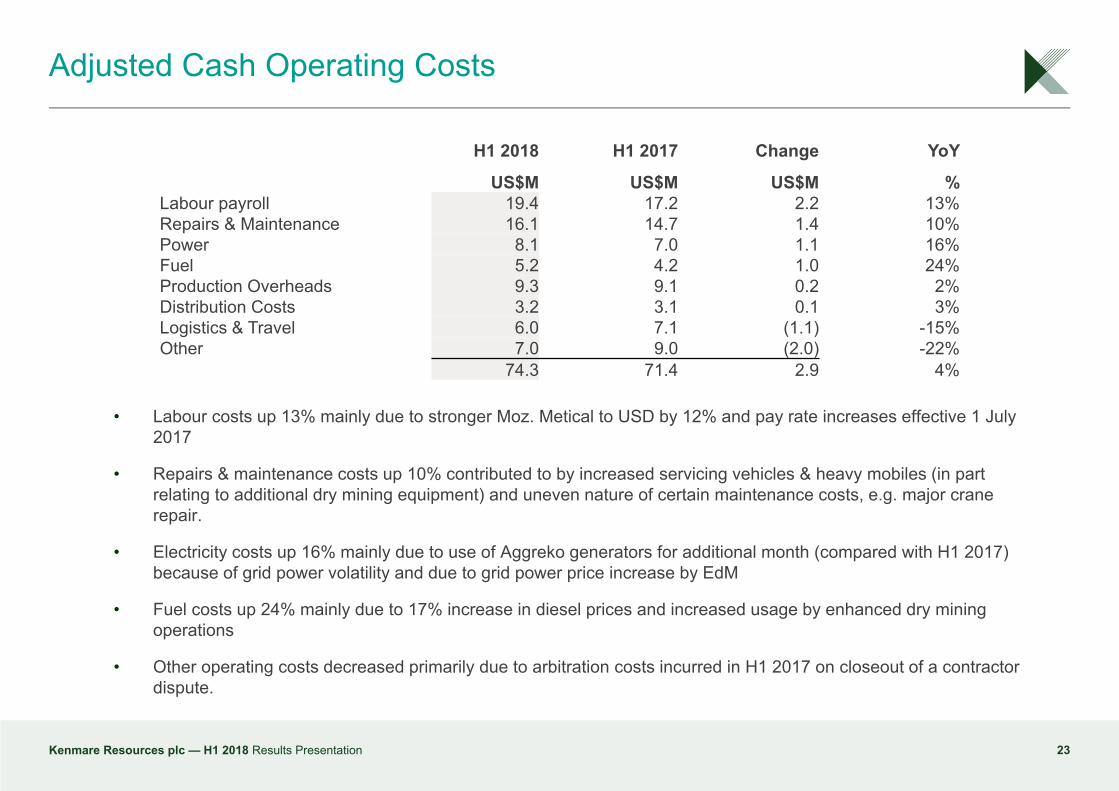
H1 2018 H1 2017 Change YoY
US$M US$M US$M %Labour payroll 19.4 17.2 2.2 13%Repairs & Maintenance 16.1 14.7 1.4 10%Power 8.1 7.0 1.1 16%Fuel 5.2 4.2 1.0 24%Production Overheads 9.3 9.1 0.2 2%Distribution Costs 3.2 3.1 0.1 3%Logistics & Travel 6.0 7.1 (1.1) -15%Other 7.0 9.0 (2.0) -22%
74.3 71.4 2.9 4%
• Labour costs up 13% mainly due to stronger Moz. Metical to USD by 12% and pay rate increases effective 1 July 2017
• Repairs & maintenance costs up 10% contributed to by increased servicing vehicles & heavy mobiles (in part relating to additional dry mining equipment) and uneven nature of certain maintenance costs, e.g. major crane repair.
• Electricity costs up 16% mainly due to use of Aggreko generators for additional month (compared with H1 2017) because of grid power volatility and due to grid power price increase by EdM
• Fuel costs up 24% mainly due to 17% increase in diesel prices and increased usage by enhanced dry mining operations
• Other operating costs decreased primarily due to arbitration costs incurred in H1 2017 on closeout of a contractor dispute.
H1 2018 Cash Operating Costs
24
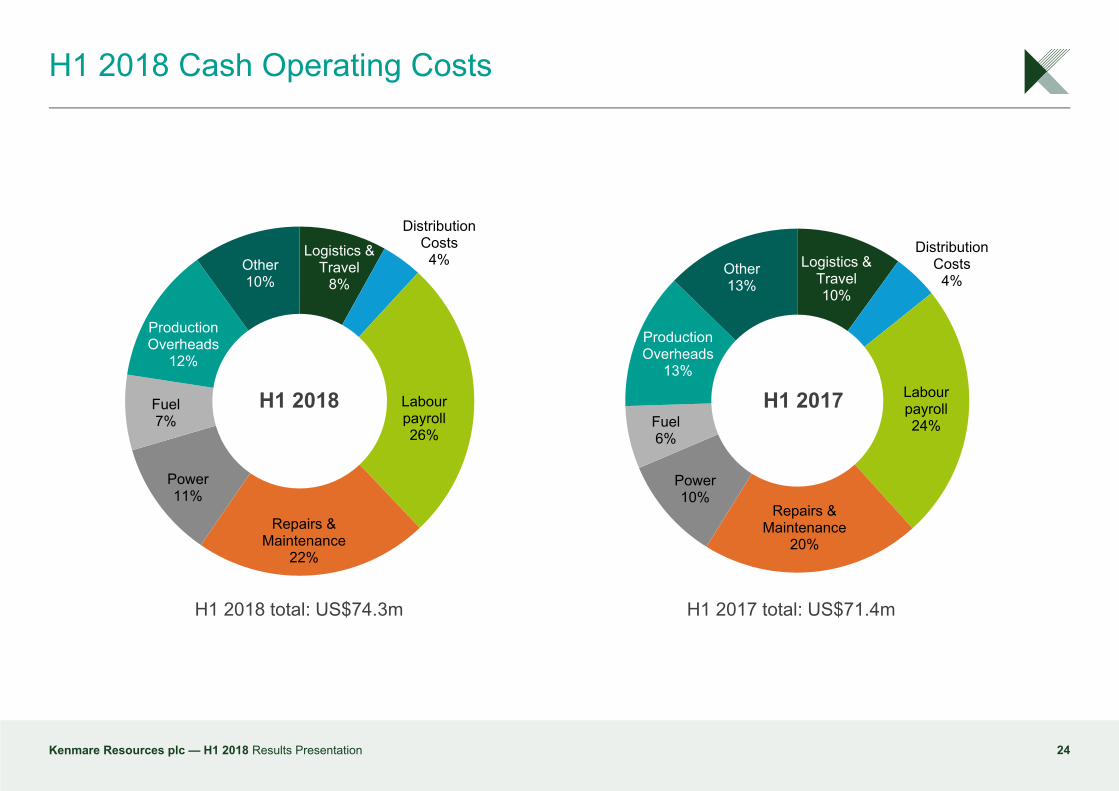
H1 2018 total: US$74.3m H1 2017 total: US$71.4m
Kenmare Resources plc — H1 2018 Results Presentation
Logistics & Travel
8%
Distribution Costs
4%
Labour payroll26%
Repairs & Maintenance
22%
Power11%
Fuel7%
Production Overheads
12%
Other10%
H1 2018
Logistics & Travel10%
Distribution Costs
4%
Labour payroll24%
Repairs & Maintenance
20%
Power10%
Fuel6%
Production Overheads
13%
Other13%
H1 2017
Group Lenders at 30 June 2018
25Kenmare Resources plc — H1 2018 Results Presentation
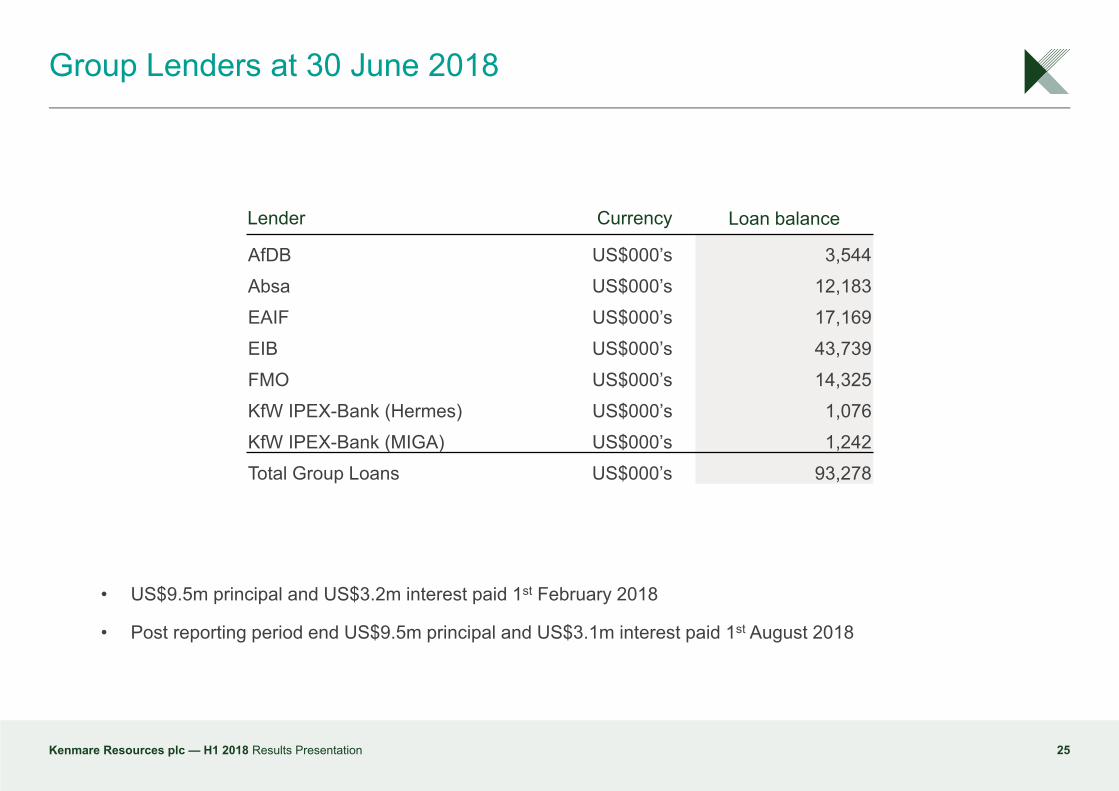
• US$9.5m principal and US$3.2m interest paid 1st February 2018
• Post reporting period end US$9.5m principal and US$3.1m interest paid 1st August 2018
Lender Currency Loan balance
AfDB US$000’s 3,544Absa US$000’s 12,183EAIF US$000’s 17,169EIB US$000’s 43,739FMO US$000’s 14,325KfW IPEX-Bank (Hermes) US$000’s 1,076KfW IPEX-Bank (MIGA) US$000’s 1,242Total Group Loans US$000’s 93,278
0
5
10
15
20
25
Aug-
16
Feb-
17
Aug-
17
Feb-
18
Aug-
18
Feb-
19
Aug-
19
Feb-
20
Aug-
20
Feb-
21
Aug-
21
Feb-
22
US$
milli
ons
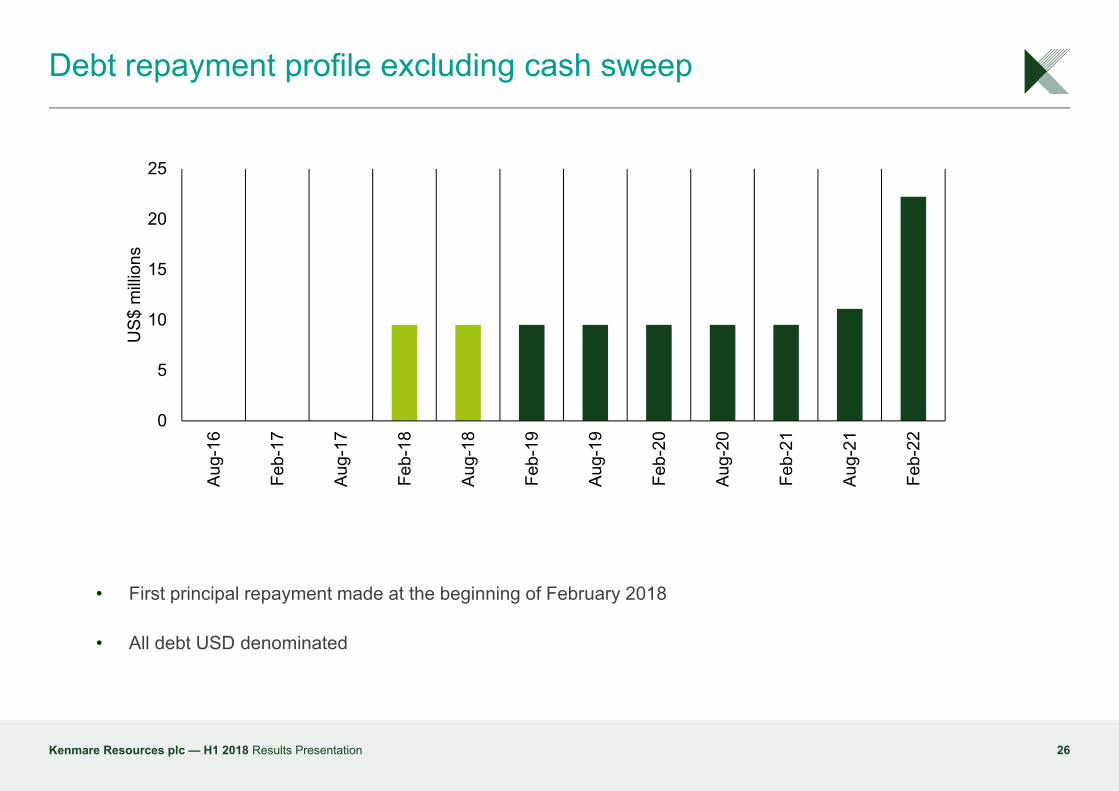
• First principal repayment made at the beginning of February 2018
• All debt USD denominated
Debt repayment profile excluding cash sweep
26Kenmare Resources plc — H1 2018 Results Presentation