Embed Size (px)
Citation preview

1THE WOODLEY
H1 2020Trends in the Mid-Atlantic Multifamily Market
Suburban Maryland
District of ColumbiaNorthern Virginia
Baltimore
2
PREFACECBRE is pleased to release the H1 2020 Mid-Atlantic Multifamily Report highlighting the most current and comprehensive data available for the region Produced by the Washington DC Multifamily Investment Properties Team this report has been assembled by local experts to empower the decision making and inform those interested in multifamily in the Mid-Atlantic
This report compiles research from a variety of in-house and third-party data sources to explain the market at a granular level
Data contributions and validations to this publication were made by
This Washington DC Investment Properties Team has access to the most comprehensive data on the market and has a deep understanding of the metrics involved
CBRE Multifamily consists of more than 300 dedicated professionals nationally specializing in all aspects of multifamily real estate brokerage and finance providing investment and advisory services to meet the needs of investors across the multifamily investment spectrum With offices in 65 cities across every major US market our Team also maintains a strong global presence with offices on nearly every continent offering strategic advice and execution for residential and multifamily assignments worldwide
We welcome any inquiries you may have and encourage you to contact our Team with any questions
bull CBRE Researchbull CBRE Econometrics Advisorsbull Claritasbull Yardi Matrix
bull Axiometricsbull Delta Associatesbull Bureau of Labor Statisticsbull CoStar
2
3
TAB
LE O
F CO
NTE
NTS
Executive Summary PG 4
Resilience Proven in Prior Recessions
PG 5
Outlook PG 6
The District PG 8
Northern Virginia PG 12
Suburban Maryland PG 16
Baltimore PG 20
Contacts PG 24
TAB
LE O
F CO
NTE
NTS
Executive Summary PG 4
Resilience Proven in Prior Recessions
PG 5
Outlook PG 6
The District PG 8
Northern Virginia PG 12
Suburban Maryland PG 16
Baltimore PG 20
Contacts PG 24
3
4
BALTIMORE
NORTHERN VIRGINIA
WASHINGTON DC
MID-ATLANTIC MULTIFAMILY MARKET
EXECUTIVE SUMMARYThe Mid-Atlantic region began 2020 on a great notemdashpositive rent growth across all markets prolific development activity and high transaction volumes All of a sudden in mid-March COVID-19 shook the nation We are now experiencing the effects of the pandemic on multifamily operations and transaction velocity However several early signs indicated that the Mid-Atlantic would fare well compared to other large metros and indeed it has Historically the Washington DC metro is recognized as the most risk-averse employment base due to its low employment rates in industries such as Leisure amp Hospitality and Retail Additionally the federal government and local federal spending has provided a unique degree of insulation to the regional economy Intellectual capital has also been rich within the region a large supply of highly educated talent bolsters the strong cyber security biotech bio-sciences defense and technology industries in the Mid-Atlantic
While the Mid-Atlantic multifamily market was impacted by the pandemic it has shown its continued resilience in the face of unprecedented market volatility In Q2 2020 across national Tier II markets the Baltimore metro was ranked first and second in the nation in terms of rent growth and lowest vacancy change respectively Vacancy in the Baltimore metro increased by only 80 bps and rent growth held steady Across national Tier I markets the Washington DC metro experienced similar success as it ranked fourth in the nation in terms of rent growth and lowest vacancy change The Washington DC metro experienced a 90 bps increase in vacancy and a 23 decrease in overall rents which compared to the rest of the nation is quite favorable Net absorption in the Washington DC metro as a percentage of total inventory was the second highest in the nation across large metros and the only gateway market to make it to the top 20 across all national markets
Although job losses across the country were substantial the Baltimore and Washington DC metros fared well on a national scale The Washington DC metro saw fewer job losses than any other large metro in the country likely due to federal government activity in response to the pandemic In June out of 51 MSArsquos Baltimore ranked 8th in the nation for the lowest unemployment rate at 80 and Washington DC followed close behind in 10th place at 84 unemployment In recent years the Mid-Atlantic economy has become more diversified with tech education and private business on the rise Additionally while sequestration reduced the footprint of the federal government and its presence in the region it has grown in recent months and played an integral role in keeping workers employed and stimulating the economy
The Washington DC metro will continue to see an influx of supply with an estimated 15150 units delivering in the next 12 months Construction has not slowed since the start of the year and over 3300 units began construction in the second quarter of 2020
As a result of the pandemic data suggests that renters are now favoring properties in lower density areas In the Washington DC metro rent growth in low-rise apartments outperformed rent growth in high-rise apartments by 21 In the Baltimore metro the lower-density suburbs saw only a slightly negative growth rate of 10 bps while Baltimore City rents fell 30
SUBURBAN MARYLAND
Baltim
ore-
Was
hingt
on Pa
rkway
MID-ATLANTIC MULTIFAMILY MARKET
Risk-Averse Employment Base
Mid-Atlantic Resilience
Urban to Suburban Migration
5
During previous recessions the Mid-Atlantic anchored by Washington DC and Baltimore proved to be the most resilient region in the country due to its diversified economy strong market drivers and the presence of the nationrsquos largest employermdashthe federal government The stability and dynamism of the regionrsquos economy underpins its resilient multifamily real estate market fundamentals
EXECUTIVE SUMMARY
bull Minimal Vacancy Change DC and Baltimore were ranked 3 and 5 respectively in terms of least amount of change in vacancy across the country during the 2008 recession at an average increase of only 150 bps
bull Most Stable Rents in the Nation Baltimore and DC ranked 1 and 2 respectively for least impacted rent growth in the nation and recovered in just six quarters compared to a national average of 12 quarters The regionrsquos peak-to-trough rent change was a mere 2 during the previous recessionmdashlower than the nearly 6 national average
bull Prolific Investment Market Since recovery in 2010 DCrsquos and Baltimores per unit increased by an average of 6 and 4 respectively as investors remain bullish on the region as a powerhouse center of the East Coast
bull Durability of Employment Base DC and Baltimore have historically lower unemployment rates compared to the US The strong and prominent labor markets of ldquoEds and Medsrdquo biotech and government are some of the most resilient industries through recessions Tech has also proven to be a pillar of the economy with significant future growth centered around the establishment of Amazonrsquos new HQ2 Washington is ranked 1 for lowest percentage of at-risk employment segments in the current downturn
These strong economic drivers will bolster the multifamily market drive demand and lead the region towards future growth
MID-ATLANTIC MULTIFAMILY MARKET
RESILIENCE PROVEN IN PREVIOUS RECESSIONS
0
2
4
6
8
10
01234567
Va
can
cy
Recession
Washington DC
Baltimore
Tech Boom
Tech Bust Post 911 RecessionPost Global Financial Crisis
Recovery Forecast
Atlanta
Baltimore
BostonChicagoDallasFt Worth
Denver
Detroit
Houston
Inland Empire
Long Island
Los Angeles
Miami
Minneapolis
New York CityOaklandOrange County
Orlando
Philadelphia
Phoenix
San Diego
San Francisco
Seattle
St Louis
Tampa
US
Washington DC
-16
-14
-12
-10
-8
-6
-4
-2
0
100 150 200 250 300 350
Rent
Chan
ge (
)
Vacancy Change (Bps)
Least Severe Downturn
Most Severe Downturn
METRO MARKET RENT amp VACANCY CHANGE IN LAST DOWNTURN
WASHINGTON DC amp BALTIMORE METROSrsquo VACANCY
CLICK HERE TO READ THE FULL REPORT ON CBRErsquoS
RESEARCH GATEWAY
-4
-2
0
2
4
6
8
10
Q12008
Q32008
Q12009
Q32009
Q12010
Q32010
Q12011
Q32011
YoY Re
nt Grow
th
Class A Class B Class C National
DC METRO YOY AVERAGE RENT GROWTH
-4
-2
0
2
4
6
8
10
Q12008
Q32008
Q12009
Q32009
Q12010
Q32010
Q12011
Q32011
YoY Re
nt Gr
owth
Class A Class B Class C National
BALTIMORE METRO YOY AVERAGE RENT GROWTH
OUTLOOKThe Mid-Atlantic is a booming market for millennials empty nesters and many others to live work and play in There are some challenges for developers investors and property managers in the short-term but the long-term future is bright The regionrsquos economy has strong fundamentals bolstered by the largest employer in the nation the federal government
Vacancy IncreasesWhile the Mid-Atlantic has performed at the top of the nation overall vacancy has increased in Washington DC and Baltimore by 90 bps and 80 bps respectively since Q2 2019 Unemployment and increased work from home flexibility have caused residents to consider alternative housing to save money on rent
High Rent CollectionsRent collections across the nation have been substantially higher than expectations in H1 2020 The National Multifamily Housing Council reported that 930 and 922 of residents paid rent across the nation in May and June respectively Approximately 940 of Washington DC residents paid rent in April and 892 of Baltimore residents paid rent in May
ADVANTAGES AND CHALLENGES FOR THE MULTIFAMILY INVESTORDEVELOPER
ADVANTAGES CHALLENGES
The Success of Virtual ToursVirtual tours have become the new normal for leasing offices in the Mid-Atlantic The per-project lease up rate in Washington DC is 14 units per month down only one unit from Q2 2019 In the Baltimore metro there are currently 18 projects in lease up with an average absorption rate of 15 units per project per month
Growing Tech TalentWashington DC has risen to the No 2 spot on CBRErsquos annual tech talent report coming in as the runner-up to the San Francisco Bay Area Washington has over 263000 tech workers and has experienced 10 growth since 2015 However Washington DCrsquos average apartment asking rate is ranked 8th in the nation indicating that it is one of the most affordable areas with the highest concentration of tech talent in the nation This growing labor market in high paying industries will continue to drive wages up and increase demand for Class-A and Class-B multifamily product
Click here to read CBRErsquos July 2020 Tech Talent Report
Significant PipelineThe Mid-Atlantic region will continue to see an influx of supply over the next few years Washington DC will experience an estimated increase of 15150 units in the next 12 months Construction has not slowed since the start of the year and over 3300 units began construction in the second quarter of 2020 In Baltimore 2437 units delivered in H1 2020 and 6906 units are on track to deliver in the next 36 months Developers are optimistic about future deliveries in 2021 with an expected market recovery that will renew demand
MID-ATLANTIC MULTIFAMILY MARKET
6
Eviction MoratoriumsThe Washington DC Councilrsquos emergency measures to respond to the pandemicrsquos economic impacts included a freeze on evictions and a prohibition on rent increases through October 2020 In Northern Virginia eviction freezes were extended to September 8 2020 In Maryland there are currently no eviction restrictions
MID-ATLANTIC H1 2020 ACCOLADES
bull Washington DC metro saw fewer YoY job losses than any other large metro in the country
bull Baltimore (80) and Washington DC (84) are ranked 8th and 10th for lowest unemployment rate across the largest 51 US metros
bull Washington DCrsquos net absorption as a percentage of total inventory was the second highest in the nation for large metros
bull Across Tier II markets Baltimore ranked first and second in the nation in terms of rent growth and lowest vacancy change
bull Across Tier I markets Washington DC ranked fourth in the nation in terms of rent growth and lowest vacancy change
bull Washington DC ranked 1 most risk-averse metro for employment base in the recent downturn
bull Washington DC ranked second in the nation in CBRErsquos Scoring Tech Talent report and has seen 10 industry growth since 2015
7
MID-ATLANTIC MULTIFAMILY MARKET
STRENGTH OF MULTIFAMILY INVESTMENTS
DEBT MARKETSDebt for multifamily investments is available at historic levels Interest rates are at all-time lows and offer multi-year interest-only periods These low-rate interest-only loans allow investors to achieve as high cash-on-cash leveraged returns as they have ever been able to achieve in the multifamily market and have helped to maintain low cap rates Currently attractive debt is available and equity is plentiful which typically means that private capital buyers have strong appetites There is a consensus among investors that multifamily as a need-based asset type remains a safe investment given the ubiquitous need for housing
While the CMBS markets have shown some distress the agency loan market has remained active Through the COVID-19 pandemic the GSEs have stepped up to fulfill their mission of providing liquidity to the multifamily market While their rates are at historically low levels they have increased their reserve requirements to protect themselves against current of future renterrsquos inability to make rent payments as a result of the pandemic These reserve requirements are sized to six months and are released to the owner once the property has maintained certain occupancyrental income requirements for a period post-closing and in the case of Freddie Mac once the emergency declarations andor stay at home orders have been lifted at the federal and local level These reserves typically amount to between 3 to 6 of the loan amount and most borrowers are willing to accept these requirements given the benefit of locking in sub 3 interest only long term debt As conditions stabilize or if a borrower is seeking relatively low leverage the requirement for debt service escrow is likely to mitigate or go away
AMAZON HQ2Amazonrsquos HQ2 is a generational market catalyst for employment and rent growth The new headquarters in Crystal City is slated to create 37000+ direct jobs over the next 14 years Amazon HQ2 is expected to occupy over 4M SF of office space accounting for 33 of Crystal Cityrsquos existing office inventory The expected average annual salaries of $150000 for Amazon employees could support apartment rents of more than $3750 per month As of Q2 2020 Amazon has already hired over 1000 employees It is estimated that Amazon will bring 1200 employees in 2020 and an additional 2000 employees in 2021 By 2023 when the two-million square foot campus near Pentagon City opens Amazon will employ over 5000 employees at HQ2 The second phase of construction will continue for several years with a full build-out of over 4M SF in the newly termed submarket ldquoNational Landingrdquo Amazon has received approximately $752M in subsidies for job creation from the state of Virginia and Arlington County Multifamily communities proximate to HQ2 are already experiencing significant rent growth As residents are priced out of Arlington County increased demand will radiate throughout Northern Virginia as residents seek a discount to in-fill Northern Virginia
The Amazon ldquoMultiplier EffectrdquoAmazon will not only draw entrepreneurs to the area but will also serve as a hub for startups and a magnet for venture capital within the greater DC MSA An infusion of new jobs to any region creates what economists call the ldquomultiplier effectrdquo The multiplier effect implies that Amazonrsquos 37000 employees could increase to as many as 185000+ indirect jobs and ldquomultiplyrdquo outwards
25000-35000 new STEM degrees over the next 20 years from the new $1B Virginia Tech Innovation Campus
Demand for an additional 40000-60000 rental units as a result of the ldquoAmazon Effectrdquo
THE DISTRICT
NORTHERN VIRGINIA
SUBURBAN MARYLAND
8
WASHINGTON DC H1 2020
WASHINGTON DC OVERVIEW
The District is experiencing negative effects of the COVID-19 pandemic with drops in rent absorption and rising vacancy throughout the apartment market The average monthly Class-A rent fell 35 YoY to a monthly average of $2561 per unit per month or $327SF The average Class-B rent fell 27 to an average of $2067unitmonth or $274SF
Just over 3000 units across the city delivered in the first half of 2020 and 12969 units are currently under construction Capitol Riverfront emerged as the leading submarket in terms of development activity with a 1475-unit increase with the delivery of The Estate The Kelvin Parc Riverside Phase I Meridian on First and The Maren Multifamily capital markets finished H1 2020 with $292860000 sold throughout the District over 9 sales The COVID-19 pandemic has slowed investment activity significantly as investors weather the storm of economic volatility Comparatively in the first half of 2019 over $685000000 transacted over 30 sales
THE DISTRICT
9
WASHINGTON DC H1 2020
2020 DELIVERIES MAP
THE DISTRICT DELIVERIES
Over 3000 units delivered to the District in H1 2020 accounting for a 21 increase to the total multifamily housing inventory The pipeline continues on a steady upward trend and will not slow until late 2022 There are currently 12696 units under construction that will increase the total multifamily inventory by 88 over the next two years
NoMa H Street Corridor Union Market and Capitol Riverfront are the most active submarkets in terms of development activity These growing areas continue to deliver Class-A luxury apartment buildings in areas that are also seeing retail and office space developments
382274copy 2020 CBRE Inc All rights reserved This information has been obtained from sources believed reliable but has not been verified for accuracy or completeness You should conduct a careful independent investigation of the property and verify all information Any reliance on this information issolely at your own risk CBRE and the CBRE logo are service marks of CBRE Inc All other marks displayed on this document are the property of their respective owners and the use of such logos does not imply any affiliation with or endorsement of CBRE
1
2
3
4
5 6
7
8
9
1 0
1 1
WASHINGTON
295
5050
695
395
395
395
Rhode Island Ave NE
Virginia Ave NW
Rhode Island Ave NW
H St NE
Min
neso
taAv
eN
E
Q St NW
Potomac Ave SE
11
th S
t S
E
Minnesota Ave SE
13
th S
t N
W
13
th S
t N
E
Pennsylvania Ave SE
3rd
St
NW
So
uth
Ca
pit
ol
St
12
thS
tS
W
Florida Ave NE
9th
St
SW 7th
St
SW
9th
St
NW
Pennsylvania Ave NW
Tenn
esse
eAv
eN
E
E Capitol St SE
US-1N
6th
St
NE
Massachusetts Ave NW
US-
1S
4th
St
NE
Independence Ave SE
14
thS
tS
W
Mt Olivet Rd NE
Constitution Ave NW
KentuckyAve
SE
9th
StN
E
Benning Rd NE
6th
St
SE
7th
St
NW
K St NW
Bra
nch
Ave
SE
6th
St
NW
New
Ham
pshi
re A
ve N
W
L St NW
E Capitol St NE
No
rth
Ca
pit
ol
St
14
th S
t N
W
North Carolin
a Ave SE
D St SW
9th
St
SE
22ndSt
NE
Texas AveSE
16
th S
t N
W
B St SE
2n
d S
t N
E
D St SE
21
stSt
NE
8th
St
SE
Maine
Ave
SW
12
th S
t S
E
Kenilw
orthAve
NE
M St SW
I St SE
Bryant St NW
19
th S
t N
W
17
th S
t N
W
11
th S
t N
E
Florida Ave NW
Maryland Ave NE
15
th S
t N
W
4th
St
SE
U St NW
M St NW
M St SE
RidgeRd
SE
Independence Ave SW
H St NW
C St NE
R St NW
2020 MID ATLANTIC MULTIFAMILY DELIVERIESWASHINGTON DC
sup1 0 025 05013
Miles
MULTIFAMILY DELIVERY
Leased 23Developer CAS RieglerEB5
8 BlackbirdUnits 167
Leased 7Developer FRP DevelopmentMRP Realty
7 The MarenUnits 264
Leased 6Developer Paradigm Development
6 Meridian on First IUnits 273
Leased 11Developer Toll Brothers
5 Parc Riverside Phase IIUnits 308
Leased 39Developer Brookfield Properties
3 The EstateUnits 320
Leased 43Developer RappaportWC SmithEB5
2 AvecUnits 420
Leased 36Developer Jair LynchMacFarlane Partners
4 The KelvinUnits 310
Leased 28Developer JBG SmithMRP Realty
1 The WrenUnits 433
Leased 4Developer Jefferson Apt GroupStars Investment
10 J LineaUnits 132
Leased 17Developer JBG Smith
9 901WUnits 161
Leased 42Developer Coba
11 1714-1716 14th Street NWUnits 8
Leased 28
Leased 43
Leased 39
Leased 36
Leased 11
Leased 6
Leased 7
Leased 23
Leased 17
Leased 4
Leased 42
10
-60000 -50000 -40000 -30000 -20000 -10000 0 10000
Q2 2020 DC Employment
WASHINGTON DC H1 2020
Job Growth YoY
-50000 -40000 -30000 -20000 -10000 0 10000
StateLocal Government
Federal Government
Other Services
Leisure and Hospitality
Education and Health Services
Professional and Business Services
Financial Activities
Information
Retail Trade
Wholesale Trade
Trade Transportation and Utilities
Manufacturing
Mining Logging and Construction
EMPLOYMENT
CAPITAL MARKETS
$292860000SALES IN H1 2020
845 UNITSSOLD IN H1 2020
9 PROPERTIES
Deliveries Net Absorption Vacancy
Year
DEVELOPMENTDC BY THE NUMBERS
61
$2561
12696 UNITSUNDER CONSTRUCTION
3004 UNITSDELIVERED IN 2020
STABILIZED VACANCY
PIPELINE
CLASS A AVG RENTS
CLASS B AVG RENTS
Source CBRE Research and Delta Associates
As of June 30 2020
PER UNIT PER MONTH
18907 UNITS36-MONTH PIPELINE
Recent deliveries in the District were concentrated primarily in the Capitol Riverfront and H Street submarkets NoMa and Union Market also remain top submarkets for development activity with around 3483 units under construction on-track to deliver in the next 24 months Annual absorption in the District was 25 lower than a year ago as 2003 units absorbed in the first half of the year Q2 stabilized vacancy rate in the District is 61 a 250 bps increase from the previous year The average lease-up pace of new product in the District is 14 units per month and concessions average 15 months free rent
Insulated by the federal government Washington DC has fared favorably thus far in the downturn compared to other large metros across the nation The District experienced 67000 job losses which represents an 8 YoY loss in employment Leisure and Hospitality suffered the biggest job loss as 60 of the workforce was laid off or furloughed Promisingly government information and other services were the only industries to experience job growth albeit small
PER SF PER MONTH$327
$2067PER UNIT PER MONTH
PER SF PER MONTH$274
7000
6000
5000
4000
3000
2000
1000
0
8
7
6
5
4
3
2
1
0
VacancyUnitsDelivered
Washington DC Summary
2013 2014 2015 2016 2017 2018 2019 2021 2022H22020
H12020
00
10
20
30
40
50
60
70
80
90
0
1000
2000
3000
4000
5000
6000
7000
2013 2014 2015 2016 2017 2018 2019 H1 2020 H2 2020 2021 2022
Vaca
ncy
Units
Deliveries Net Absorption Vacancy
Forecast
11
WASHINGTON DC H1 2020
WASHINGTON DC HOME PRICES
Property Year Built Price Sold Units $Unit
The Woodley 2014 $180250000 010820 212 $850235
Skyline Apartments 1965 $58700000 030120 398 $147487
Glenwood Apartments 1942 $13700000 013020 90 $152222
The Waring 1909 $8400000 063020 24 $328947
The Regent 1937 $8450000 063020 12 $228378
LARGEST SALESDC MULTIFAMILY SALES VOLUME
$2000000000
$1500000000
$1000000000
$500000000
$02018 20192016 20172014 20152013
THE SHELBY
Class A High-Rise Avg $UnitMo
Avg $SFMo Vacancy YoY Rent Change
Upper NW $2810 $347 50 -06
Central $2822 $345 51 -46
Columbia HeightsShaw $2663 $363 64 -21
NoMaH Street $2290 $302 82 -57
Capitol HillRiverfrontSouthwest $2583 $325 77 -33
Northeast $2092 $266 85 -07
Upper Georgia $2183 $281 53 06
Class B Mid-and High-Rise Avg $UnitMo
Avg $SFMo Vacancy YoY Rent Change
Upper Northwest $2104 $258 43 -26
Mount Vernon Square NW $1925 $291 76 -74
Southwest $2085 $289 30 -04
RENTAL RATES
The District experienced broad rent decreases across almost all submarkets with the exception of Upper Georgia The Northeast and NoMaH Street submarkets have the highest Class-A High-Rise vacancy at 85 and 82 respectively This is in part due to an influx of new deliveries to those markets Class-B vacancy currently stands at 45 and concessions are at 30 of face rent The Mount Vernon Square submarket has the highest Class-B Mid and High-Rise vacancy at 76 and the highest decline in rent growth at -74 Class-A and Class-B apartments rents fell by a total of 33
The current average home value in the District is $586000 While home values grew in 2020mdashseeing an average annual increase of 70mdashhome values in the District have increased on average 30 YoY since 2015
A total of $2929M multifamily sales transacted in the District in nine sales in the first two quarters of 2020 CoreCore-Plus transactions made up for 71 of transactions and Value-Add transactions made up for the remaining 29 of total sales volume The highest sales in terms of price per unit were The Woodley a 212-unit property in Woodley Park at $850235 per unit and The Shelby a 24-unit property in Dupont Circle at $350000 per unit both of which were brokered by CBRE The Woodley was also the largest sale in H1 2020 across the District at $18025M
$0
$500000000
$1000000000
$1500000000
$2000000000
2013 2014 2015 2016 2017 2018 2019 H1 2020
DC Sales Volume
H1 2020
$600000
$500000
$400000
$300000
$200000
$100000
2014 2015 2016 2017 2018 2019$0
$100000
$200000
$300000
$400000
$500000
$600000
2014 2015 2016 2017 2018 2019 2020
DC Home Prices
2020
12
NORTHERN VIRGINIA H1 2020
NORTHERN VIRGINIA
NORTHERN VIRGINIA OVERVIEW
Northern Virginia continues to be the fastest growing region in the DC metro The regionrsquos economic future has been bolstered by Amazonrsquos decision to build its HQ2 in National Landing Amazon selected Northern Virginia because of its inherently strong fundamentals including a rich pipeline of talent provided by numerous universities in the area Amazon has subsequently begun the first phase of its hiring process and build-out at National Landing including hiring over 1000 white-collar employees and moving into 300000 SF of office space The delivery of HQ2 is expected to add 40000 to 60000 units of additional apartment demand to the area in the next decade A typical Amazon HQ2 worker will make $150000 per year which allows for up to $3750 in monthly rent Additionally Virginia Tech is moving forward with its plans to build the $1 Billion Innovation Campus in Potomac Yard The introduction of these two strong economic drivers will continue to further diversify the job base and incentivize more businesses to move to all areas of the DC metro where a pipeline of talent awaits
$400000
$450000
$500000
$550000
$600000
2014 2015 2016 2017 2018 2019
DC Home Prices
13
NORTHERN VIRGINIA H1 2020
2020 DELIVERIES MAP
NORTHERN VA DELIVERIES
Just under 4000 new units delivered in H1 2020 across Northern Virginia accounting for a 16 increase in total volume There are currently 10135 units under construction which will add 4 to the inventory over the next 24 months The largest deliveries in the region include Perseus Realtyrsquos The Foundry a 525-unit property in Alexandria Saul Centersrsquo Waycroft a 490-unit property in BallstonVirginia Square Wash REITrsquos The Trove a 401-unit property in Columbia Heights Arlington and Combined Propertiesrsquo Scout on the Circle a 400-unit property in Fairfax
382274copy 2020 CBRE Inc All rights reserved This information has been obtained from sources believed reliable but has not been verified for accuracy or completeness You should conduct a careful independent investigation of the property and verify all information Any reliance on this information issolely at your own risk CBRE and the CBRE logo are service marks of CBRE Inc All other marks displayed on this document are the property of their respective owners and the use of such logos does not imply any affiliation with or endorsement of CBRE
1
2
45
6
7
8
9
1 0
1 1
1 2
LORTON
MANASSAS
WOODBRIDGE
FORT HUNTNEWINGTON
LAKE RIDGE
CENTREVILLE
HERNDON
MANASSAS PARK
RESTON
STERLING
CHANTILLY
FAIRFAX STATION
ANNANDALE
BETHESDA
BURKE
FAIRFAX
FALLS CHURCH
NORTH BETHESDA
TYSONS CORNER
VIENNA
POTOMAC
MCLEAN
OAKTON
SPRINGFIELD
GROVETON
IDYLWOOD
JEFFERSON
LINCOLNIA
WEST SPRINGFIELD
WOLF TRAP
ADELPHI
BELTSVILLE
BOWIE
CALVERTON
CAMP SPRINGS
CLINTON
COLLEGE PARK
FORESTVILLE
GREENBELT
HILLCREST HEIGHTS
HYATTSVILLE
LANHAM
ROSARYVILLE
GLENN DALE
CORAL HILLS
EAST RIVERDALE
KETTERING
WASHINGTON201
267
28295
295
381
110
5
50
29
301
695
66
270
495
395
95
495
495
495
95
WASHINGTONDULLES INTL
AIRPORT
RONALD REAGANWASHINGTON
NATL ARPT
POTOMACAIRFIELD
FREEWAYAIRPORT
COLLEGE PARK AIRPORT
2020 MID ATLANTIC MULTIFAMILY DELIVERIESNORTHERN VIRGINIA
sup1 0 2 41
Miles
MULTIFAMILY DELIVERY
Leased 20Developer Novare Group Mulberry Development Group
8 Cameron SquareUnits 302
Leased 22Developer Praedium Group
7 The ClarkUnits 342
Leased 5Developer Erkiletian DevelopmentPCCP
6 The Sur at National GatewayUnits 360
Leased 65Developer Orr Partners
5 Centro ArlingtonUnits 366
Leased 12Developer Washington Real Estate Investment Trust
3 The TroveUnits 401
Leased 34Developer Saul Centers REIT (Northwestern Mutual Life Insurance)
2 The WaycroftUnits 490
Developer Combined Properties
4 Scout on the CircleUnits 400
Leased 21Developer Perseus RealtyELVFour Points
1 Foundry at CarlyleUnits 525
Leased 49Developer Shooshan Co Brandywine Realty Trust
10 4040 WilsonUnits 244
Leased 25Developer Abramson Properties Weingarten Realty AHDC
9 Array at West AlexUnits 278
Leased 40Developer Elm Street DevelopmentNorthwood Ravin
12 Preserve at Westfields - Phase IUnits 132
Leased 17Developer Novus
11 Mission LoftsUnits 157
Leased 21
Leased 34
Leased 12
Leased 7
Leased 65
Leased 5
Leased 22
Leased 20
Leased 25
Leased 49
Leased 17
Leased 40
Source Axiometrics 2020
VIRGINIA TECH INNOVATION CAMPUS
AMAZON HQ2
3
14
NORTHERN VIRGINIA H12020
$494500000SALES IN H1 2020
1823 UNITSSOLD IN H1 2020
9 PROPERTIES
Deliveries Net Absorption VacancyYear
NoVA BY THE NUMBERS
43
$1992
10135 UNITSUNDER CONSTRUCTION
3997 UNITSDELIVERED IN 2020
STABILIZED VACANCY
PIPELINE
CLASS A AVG RENTS
CLASS B AVG RENTS
Source CBRE Research and Delta Associates
As of June 30 2020
PER UNIT PER MONTH
14567 UNITS36-MONTH PIPELINE
Just under 4000 units delivered in H1 2020 which equates to a 10 increase in total inventory throughout the year Arlington accounted for 59 of new deliveries and Alexandria accounted for 27 The average lease-up pace for properties in Northern Virginia is currently 21 units per month compared to 24 units per month in January 2020 Northern Virginiarsquos current stabilized vacancy is 43 a 70 bps YoY increase
Job Growth YoY as of June 2020EMPLOYMENT
Northern Virginia experienced the YoY employment decline of 134700 jobs Leisure and Hospitality fared the worst with the loss of 64500 jobs and Education and Health Services with the loss of 32100 jobs However there was growth in Information and Financial Activities industries At the start of the year unemployment was at 25 and it currently stands at 86
As of June 2020 Amazon has already hired 1000 employees It is estimated that Amazon will bring 1200 employees in 2020 and an additional 2000 employees in 2021
CAPITAL MARKETS
PER SF PER MONTH$217
$1746 PER UNIT PER MONTH
PER SF PER MONTH$194
VacancyNorthern Virginia SummaryUnits
Delivered
DEVELOPMENT
-70000 -60000 -50000 -40000 -30000 -20000 -10000 0 10000
H1 2020 NoVa Employment
-70000 -50000 -30000 -10000 0 10000
5
4
3
2
1
02014 2015 2016 2017 2018 2019 H1
2020H2
2020
10000
8000
6000
4000
2000
02021 2022
StateLocal Government
Federal Government
Other Services
Leisure and Hospitality
Education and Health Services
Professional and Business Services
Financial Activities
Information
Retail Trade
Wholesale Trade
Trade Transportation and Utilities
Manufacturing
Mining Logging and Construction
0
001
002
003
004
005
006
0
1000
2000
3000
4000
5000
6000
7000
8000
9000
2014 2015 2016 2017 2018 2019 H1 2020 H2 2020 2021 2022
Vaca
ncy
Units
Deliveries Net Absorption Vacancy
Forecast
15
NORTHERN VIRGINIA H1 2020
NoVA HOME PRICES
Property Year Built Sold Price Units $Unit
The Emerson 2019 012720 $117000000 355 $329577
Avana Alexandria 1991 013020 $106000000 326 $325153
Ravensworth Towers 1973 041120 $59000000 219 $269406
The Bradley 2015 012020 $57666667 165 $349495
Monroe Place 2008 032620 $56950000 202 $281931
LARGEST SALESNoVA MULTIFAMILY SALES VOLUME
Class A High-Rise Avg $UnitMo
Avg $SFMo Vacancy YoY Rent
Change
Alexandria $2124 $243 54 -33
RosslynBallston Corridor $2490 $300 36 -27
Crystal CityPentagon City $2356 $268 74 -72
South Arlington $2024 $232 45 00
Tysons $2264 $252 78 -134
RestonHerndon $2106 $226 95 -71
Falls ChurchMerrifield $2117 $234 55 -70
Class B Mid-and High Rise Avg $UnitMo
Avg $SFMo Vacancy YoY Rent
Change
Falls ChurchNorth Arlington $2264 $249 54 07
South Arlington $1674 $198 21 -01
Arlandria $1662 $220 16 11
West Alexandria $1666 $183 54 -04
Crystal City $2226 $206 62 -60
RENTAL RATES
$650000
$625000
$600000
$575000
$550000
$5250002014 2015 2016 2017 2018 2019
$5000000000
$4000000000
$3000000000
$2000000000
$1000000000
$0
Northern Virginia experienced rent decreases compared to H1 2019 with the exception of Class-A product in South Arlington and Class-B product in Falls ChurchNorth Arlington and Arlandria Class-A rents fell by 41 to $1992unitmonth or $217 per square foot Class-A vacancy in Northern Virginia is currently 49 and concessions are at 50 of face rent RestonHerndon and Tysons have the highest Class-A vacancy at 95 and 78 due in most part to increased deliveries in those submarkets Class B rents fell 16 YoY to $1746unitmonth or $194 per square foot Class-B vacancy is currently 39 and concessions are 20 of face rent Crystal City has the highest Class-B vacancy at 62 Class-A and Class-B rents fell by a total of 25 YoY
Homes values in Northern Virginia continue to see impressive growth as demand significantly outweighs supply in 2020 New listing inventory was down by 35 this year and prices continue to climb Homes are on the market for an average of 35 weeks before selling The current median home value in Northern Virginia is $641002 which is a 44 YoY increase across the region Alexandria is the fastest growing housing market in the nation with 202 YoY median sale value growth Arlington County currently maintains the highest home value in Northern Virginia and experienced an 11 YoY increase The high cost of home buying in Northern Virginia will likely drive multifamily demand as renters are priced out of the for sale housing market
A total of $4945M multifamily sales transacted in Northern Virginia in nine properties in the first half of 2020 Value-add sales accounted for 77 of transactions and CoreCore-Plus sales made up the remaining 23 of total investment volume The highest price per unit sales were The Bradley a 165-unit property in Alexandria which sold at $349500 per unit and The Emerson a 355-unit property in Herndon which sold at $329600 per unit
JEFFERSON FAIR OAKS
$520000
$540000
$560000
$580000
$600000
$620000
2014 2015 2016 2017 2018 2019
NoVA Average Sold Home Price
$0
$1000000000
$2000000000
$3000000000
$4000000000
$5000000000
2013 2014 2015 2016 2017 2018 2019 H1 2020
NoVA Sales Volume
2018 20192016 20172014 20152013 H1 2020
$500000$520000$540000$560000$580000$600000$620000$640000$660000
2014 2015 2016 2017 2018 2019 2020
NoVA Average Sold Home Price
2020
16
SUBURBAN MD H1 2020
SUBURBAN MARYLAND
SUBURBAN MARYLAND OVERVIEW
Suburban Maryland fared the best in terms of rent growth absorption and transaction volume compared to the other markets in Washington DC Its lower density setting may be in part responsible for its recent resilience as residents choose to relocate out of higher density urban areas
Suburban Maryland is one of the most prominent areas in the region for the Life Sciences sector and is home to the headquarters of the National Institute of Health Department of Energy the Food and Drug Administration and the National Institute of Standards and Technology The presence of biotech in the I-270 Corridor in particular has greatly benefited the commercial real estate market in office industrial and multifamily Life Sciences buildings have significantly lower vacancy rates than that of other commercial office buildings As of 2019 laboratory vacancy sits at around 50 on average while office vacancy rate in Suburban Maryland is nearly 19 Montgomery and Prince Georgersquos counties continue to be largely unique in their growth of biotech because they remain suburban areas in comparison to Life Sciences hubs such as Boston New York and San Francisco that continue to grow as urban areas
Although investment activity slowed down considerably across the region Suburban Maryland is an outlier Over $12B transacted in H1 2020 which is more than H1 2019 when $893M transacted
17
SUBURBAN MD H1 2020
2020 DELIVERIES MAP
SUBURBAN MD DELIVERIES
Deliveries slowed in Suburban Maryland with an addition of 492 units across three projects in H1 2020 The deliveries were Bainbridgersquos Bainbridge Lake Linganore a 322-unit property in Frederick NV Commercial Brick Lanersquos The Bottling Plant a 86-unit property in Outlying Frederick County and Landex Developmentrsquos Artisan 4100 an 84-unit property in Brentwood There are currently 6441 units under construction which will add a total of 35 to total inventory over the next 24 months Bethesda has the highest concentration of development activity with just over 1900 units delivering in the next 36 months Unlike other markets in the DC metro Suburban Marylandrsquos vacancy which currently stands at 36 was not largely impacted in the past six months
382274copy 2020 CBRE Inc All rights reserved This information has been obtained from sources believed reliable but has not been verified for accuracy or completeness You should conduct a careful independent investigation of the property and verify all information Any reliance on this information issolely at your own risk CBRE and the CBRE logo are service marks of CBRE Inc All other marks displayed on this document are the property of their respective owners and the use of such logos does not imply any affiliation with or endorsement of CBRE
1
2
3
HERNDONRESTON
STERLING
BALLENGER CREEK
ASPEN HILL
BETHESDA
CHILLUM
NORTH BETHESDA
ROCKVILLE
SILVER SPRING
TAKOMA PARK
TYSONS CORNER
VIENNA
WHEATON-GLENMONT
WHITE OAK
POTOMAC
MCLEAN
COLESVILLENORTH POTOMAC
IDYLWOOD
WOLF TRAP
ADELPHI
BELTSVILLE
BOWIE
CROFTONGREENBELT
HYATTSVILLELANHAM
LAUREL
ODENTONSOUTH LAUREL
CATONSVILLE
COLUMBIA
DAMASCUS
GAITHERSBURG
LINTHICUM HEIGHTS
NORTH LAURELOLNEY
PIKESVILLE
WOODLAWN
SEVERN
ARBUTUS
MONTGOMERY VILLAGE
GERMANTOWN FERNDALE
ELDERSBURG
LOCHEARN
MAYS CHAPEL
REISTERSTOWN
DUNDALK
PERRY HALL
RIVIERA BEACH
ROSEDALE
SEVERNA PARK
TOWSON
ARNOLD
ESSEX
GLEN BURNIE
PASADENA
PARKVILLE
SOUTH GATE
OVERLEANOTTINGHAM
ANNAPOLIS NECK
WASHINGTON
ANNAPOLIS
BALTIMORE
201
3
295
267
7
100
15
50
15
340
40 1
29
301
301
270
495
70
83
195
95
66
97
895
95
95
695
270395
695
WASHINGTONDULLES INTL
AIRPORT
TIPTONAIRPORT
LEE AIRPORT
BALTIMOREWASHINGTONINTL AIRPORT
MARTIN STATEAIRPORT
2020 MID ATLANTIC MULTIFAMILY DELIVERIESSUBURBAN MARYLANDMULTIFAMILY DELIVERY
sup1 0 3 615Miles
Leased 20Developer Landex Development
3 Artisan 4100Units 84
Leased 60Developer NV Commercial Brick Lane
2 Bottling PlantUnits 86
Leased 9Developer Bainbridge Companies
1 Bainbridge Lake LinganoreUnits 322Leased 9
Leased 60
Leased 20
18
-45000 -40000 -35000 -30000 -25000 -20000 -15000 -10000 -5000 0 5000
H1 2020 SubMD Employment
SUBURBAN MD H1 2020
Job Growth YoY
EMPLOYMENT
$12 BILLIONSALES IN H1 2020
5006 UNITSSOLD IN H1 2020
14 PROPERTIES
5000
4000
3000
2000
1000
0
6
5
4
3
2
1
0
VacancyUnits
Delivered Suburban MD Summary
Deliveries Net Absorption Vacancy
Year
DEVELOPMENTSUBURBAN MD BY THE NUMBERS
36
$1905
6441 UNITSUNDER CONSTRUCTION
492 UNITSDELIVERED IN 2020
STABILIZED VACANCY
PIPELINE
CLASS A AVG RENTS
CLASS B AVG RENTS
Source CBRE Research and Delta Associates
As of June 30 2020
PER UNIT PER MONTH
13773 UNITS36-MONTH PIPELINE
As the most affordable option for residents in Washington DC Suburban Maryland continues to provide job opportunities and relatively affordable living Just under 500 units delivered in H1 2020 and 100 units have been absorbed so far this year Suburban Marylandrsquos current stabilized vacancy is 36 down 30 bps from last year
CAPITAL MARKETS
Suburban Maryland experienced the YoY loss of 111400 jobs The most impacted industries were Leisure and Hospitality with a 40 decrease in employment and Education and Health Services with a loss of 15 of employees Trade and Transportation also lost just under 20000 jobs The Federal Government saw a growth of 1000 employees Unemployment in Montgomery and Prince Georgersquos counties is currently 80 and 99 respectively up from 28 and 36 respectively in January 2020
$203PER SF PER MONTH
$1591PER UNIT PER MONTH
$173PER SF PER MONTH
2014 2015 2016 2017 2018 2019 H12020
H22020
2021 2022
StateLocal Government
Federal Government
Other Services
Leisure and Hospitality
Education and Health Services
Professional and Business Services
Financial Activities
Information
Retail Trade
Wholesale Trade
Trade Transportation and Utilities
Manufacturing
Mining Logging and Construction
-35000 -25000 -15000 -5000 0 10000
00
10
20
30
40
50
60
0
500
1000
1500
2000
2500
3000
3500
4000
4500
2014 2015 2016 2017 2018 2019 H12020
H22020
2021 2022
Vacanc
y
Units
Deliveries Net Absorption Vacancy
Forecast
19
SUBURBAN MD H1 2020
SUBURBAN MD HOME PRICES
Property Year Built Sold Price Units $Unit
4701 Willard 1969 062920 $276500000 525 $526667
The Varsity 2011 032720 $146022026 258 $565977
Gallery on New Hampshire 1960 022820 $117000000 675 $173333
Montgomery Paint Branch 1984 061220 $113206000 529 $214000
Jefferson at Inigos Crossing 2008 011320 $109000000 473 $230444
LARGEST SALESSUBURBAN MD MULTIFAMILY SALES VOLUME
Class A High Rise Avg $UnitMo Avg $SFMo Vacancy YoY Rent
Change
Bethesda $2670 $293 72 31
N Bethesda Rockville $2047 $223 60 22
Silver Spring Wheaton $2012 $242 35 18
Hyattsville College Park $1867 $206 46 NA
Class B Mid-and High-Rise Avg $UnitMo Avg $SFMo Vacancy YoY Rent
Change
Silver Spring $1622 $169 920 -190
BethesdaChevy Chase $1982 $217 520 -530
Rockville $1709 $184 430 450
RENTAL RATES
$400000
$380000
$360000
$340000
$320000
2014 2015 2016 2017 2018 2019
$3000000000
$2500000000
$2000000000
$1500000000
$1000000000
$500000000
$0
Although no markets saw overall positive rent growth over the past year Suburban Maryland was the least negatively impacted region in the metro in terms of rental rates Class-A rents declined by 13 YoY to an average of $1905unitmonth or $203 per square foot Class-A vacancy currently stands at 45 Class-B rents declined 10 to an average of $1591unitmonth or $173 per square foot Class-B vacancy currently stands at 31 Overall Class-A and Class-B apartment rents fell by a total of 11 YoY to an average of $1697unitmonth or $183 per square foot
Home prices have dropped slightly in Suburban Maryland after four consecutive years of positive growth The current median home sale price is $393000 The robust effect of the Amazon announcement has spilled over into Suburban Marylandrsquos housing market as a desirable and often more affordable option than Northern Virginia Much of Suburban Maryland multifamily properties remain within the ideal 30-minute commute from large employment drivers such as Amazon HQ2 and parts of Washington DC
Investment activity was highest in Suburban Maryland as $1222570000 traded in 13 sales in the first half of 2020 Value-Add product made up a majority of transaction volume at 61 while CoreCore-Plus accounted for the remaining 39 4017 Willard was the highest sale in terms of total volume and price per unit at $267500000 and $526667 per unit
BETHESDA ROW
NORTHLAKE
$310000
$320000
$330000
$340000
$350000
$360000
$370000
$380000
$390000
$400000
2014 2015 2016 2017 2018 2019 2020
Sub MD Median Home Sales Price
2020
$0
$500000000
$1000000000
$1500000000
$2000000000
$2500000000
$3000000000
2013 2014 2015 2016 2017 2018 2019 H1 2020
Sub MD Sales Volume
2018 20192016 20172014 20152013 H1 2020
4701 WILLARD
20
BALTIMORE METRO H1 2020
BALTIMORE METRO OVERVIEW
While the Baltimore metro is performing well compared to other metros across the country the region has seen the effects of the COVID-19 pandemic with impacts to employment transaction volume rent growth and absorption rates Over 172000 jobs were lost in greater Baltimore since Q2 2019 which is a 12 decrease in total nonfarm employment The June 2020 unemployment rate in the Baltimore metro is 80 which is a 450 bps increase from January 2020 Baltimore however is considered to be better positioned than other regions to weather the current economic downturn due to its impressive resilience in previous recessions In the Global Financial Crisis Baltimore ranked sixth in terms of GDP growth and ninth in payroll job growth across the nation
Just over 2400 units delivered in the Baltimore metro in H1 2020 and 2532 units are currently under construction The average rent in Baltimore is $1759unitmonth or $185 per square foot An aggregate of $506M in sales transacted across 13 sales CBRE brokered two of the three largest transactions in H1 2020 across the Baltimore metro
BALTIMORE METRO
21
BALTIMORE METRO H1 2020
382274copy 2020 CBRE Inc All rights reserved This information has been obtained from sources believed reliable but has not been verified for accuracy or completeness You should conduct a careful independent investigation of the property and verify all information Any reliance on this information issolely at your own risk CBRE and the CBRE logo are service marks of CBRE Inc All other marks displayed on this document are the property of their respective owners and the use of such logos does not imply any affiliation with or endorsement of CBRE
1
2
3
4
5
6
7
8
91 0
CATONSVILLE
ELKRIDGE
ELLICOTT CITY
LINTHICUM HEIGHTS
PIKESVILLE
RANDALLSTOWN
WOODLAWN
SEVERN
ARBUTUS
FERNDALE
LOCHEARN
MAYS CHAPEL
MILFORD MILL
OWINGS MILLS
REISTERSTOWN
DUNDALK
MIDDLE RIVER
PERRY HALL
RIVIERA BEACH
ROSEDALE
ESSEX
GLEN BURNIE
PARKVILLE
EDGEWOODJOPPA
CARNEY
GREEN HAVEN
OVERLEA
ROSSVILLE
JOPPATOWNE
BALTIMORE
295
24
924
100
29
1
70
83
83
195
97
895
95
95
395
695 95
BALTIMOREWASHINGTONINTL AIRPORT
MARTINSTATE
AIRPORT
2020 MID ATLANTIC MULTIFAMILY DELIVERIESBALTIMORE
sup1 0 15 3075
Miles
MULTIFAMILY DELIVERY
Leased 45Developer Sid Emmer
8 The View at Mill Run Phase IIUnits 157
Developer Greystar
7 Elan TowsonUnits 208
Leased 40Developer La Cite
6 CenterWest- Phase 1AUnits 262
Developer Klein EnterprisesManekin LLC
5 The WoodberryUnits 284
Leased 35Developer AvalonBay CommunitiesRetail Properties
3 Avalon TowsonUnits 371
Leased 7Developer Wood Partners
2 Alta Brewers HillUnits 371
Leased 4Developer Chesapeake Realty Partners
4 Avenue GrandUnits 324
Leased 36Developer Howard Hughes
1 Juniper - Merriweather DistrictUnits 380
Leased 67Developer Atlantic Realty
10 The MorrisonUnits 15
Leased 10Developer Zahlco
9 9 E Mount Royal StreetUnits 65
2020 DELIVERIES MAP
BALTIMORE METRO DELIVERIES
Deliveries picked up in Baltimore throughout 2020 with the addition of 2437 units throughout the metro equating to a 12 increase in total inventory More units delivered in the first half of 2020 than were delivered in all of 2019 The largest deliveries were Howard Hughesrsquo Juniper a 380-unit property as part of the Merriweather District in Columbia Wood Partnersrsquo Alta Brewers Hill a 371-unit property in Baltimore City and Avalonbay Communitiesrsquo Avalon Towson a 371-unit property in Towson There are currently 2532 units under construction that are expected to deliver in the next 24 months The average lease-up pace for properties in Baltimore is 15 units per month
Leased 36
Leased 7
Leased 35
Leased 4
Leased 34
Leased 40
Leased 19
Leased 45
Leased 10
Leased 67
Source Yardi Matrix 2020 Source Axiometrics 2020
22
BALTIMORE METRO H1 2020
Job Growth YoY EMPLOYMENT
$506028000SALES IN H1 2020
2913 UNITSSOLD IN H1 2020
14 PROPERTIES
10000
8000
6000
4000
2000
0
7
6
5
4
3
2
0
VacancyUnits
Delivered Baltimore Metro Summary
Deliveries Net Absorption Vacancy
Year
DEVELOPMENTBALTIMORE METRO BY THE NUMBERS
500
$1759
2532 UNITSUNDER CONSTRUCTION
2437 UNITSDELIVERED IN 2020
STABILIZED VACANCY
PIPELINE
TOTAL AVG RENTS
Source CBRE Research Axiometrics and Delta Associates
As of June 30 2020
PER UNIT PER MONTH
6906 UNITS36-MONTH PIPELINE
Deliveries in Baltimore picked up with an additional 2437 units in H1 2020 Just under 2000 units were absorbed in the past 12 months most of them before the beginning of 2020 which has caused vacancy to increase in H1 2020 Across the Baltimore metro vacancy increased 80 bps to 50 In the Baltimore Suburbs vacancy stands at 44 up 10 bps YoY and in Baltimore city vacancy is 66 up 290 bps YoY
During the recent downturn Baltimore experienced a loss of 172500 jobs The most impacted sector was Leisure and Hospitality in which 45 of employees were furloughed or laid off Education and Health Services also took a loss of 30800 jobs Federal Government and Mining Logging and Construction were the only industries to see job growth with an increase of 800 employees and 3300 respectively The spike in Mining Logging and Construction may have been the result of the emergency expansion of Baltimorersquos hospitals and uninterrupted construction at existing development sites At the start of 2020 Baltimorersquos unemployment rate was 35 and is currently 95 There are currently 1253600 nonfarm employees in the Baltimore metro
CAPITAL MARKETS
$185PER SF PER MONTH
09RENT GROWTH
NORTHERN SUBURBS
-010SOUTHERN SUBURBS
-50000 -30000 -10000 0 10000-70000 -60000 -50000 -40000 -30000 -20000 -10000 0 10000
H2 2020 Baltimore Employment
2015 2016 2017 2018 2019 2020 2021 2022 2023 2024 20250
1
2
3
4
5
6
7
-2000
0
2000
4000
6000
8000
10000
Vacanc
y ()
Units
Rentable Completions(Units)
Net Absorption(Units)
Vacancy Rate(Avg )
StateLocal Government
Federal Government
Other Services
Leisure and Hospitality
Education and Health Services
Professional and Business Services
Financial Activities
Information
Retail Trade
Wholesale Trade
Trade Transportation and Utilities
Manufacturing
Mining Logging and Construction
Forecast
23
BALTIMORE METRO H1 2020
BALTIMORE METRO HOME PRICES
Property Year Built Sold Price Units $Unit
Townes at Holly Station 1985 042320 $115000000 510 $225490
Chatham Gardens 1980 041720 $83280000 414 $201159
The Point at Elkridge 1988 032720 $72500000 312 $232372
BLVD at White Springs 1977 040820 $61099000 459 $133113
Old Orchard 1986 041720 $33179940 180 $184333
LARGEST SALESBALTIMORE METRO MULTIFAMILY SALES VOLUME
Submarket Avg $UnitMo Avg $SFMo Vacancy
Annapolis $1749 $198 49
Baltimore City East $1434 $179 55
Baltimore City North $1095 $135 69
Baltimore City West $996 $125 41
ColumbiaNorth Laurel $1643 $170 44
Downtown Baltimore $1548 $189 85
Ellicott CityElkridge $1609 $167 47
Far North Baltimore Suburbs $1310 $136 29
Northeast Anne Arundel County $1374 $157 42
Northwest Anne Arundel County $1720 $172 51
Owings MillsPikesvilleRandallstown $1365 $132 45
ParkvilleCarneyPerry Hall $1164 $135 36
Southeast Baltimore County $1097 $132 38
Southwest Baltimore County $1172 $131 45
TowsonHunt Valley $1390 $140 53
RENTAL RATES - ALL PRODUCT TYPES
$3000000000
$2500000000
$2000000000
$1500000000
$1000000000
$500000000
$0
2014 2015 2016 2017 2018 2019
$255000
$250000
$245000
$240000
$235000
$220000
$205000
Rent growth in the Baltimore metro remained largely flat since June 2019 The Northern Baltimore Suburbs experienced 09 rent growth the Southern Baltimore Suburbs experienced a drop of 01 rent growth and Baltimore City rents fell by 30 The Baltimore suburbs outpaced Baltimore City in terms of rent growth and absorption Current vacancy in the Baltimore metro is 50 with the highest vacancies in Downtown Baltimore at 85 Baltimore City North at 69 and Baltimore City East at 55 According to Delta Reports the Howard CountyColumbia submarket fared the best in the metro with 27 YoY rent growth
Home values in the Baltimore metro increased 20 YoY up slightly from the five-year average growth rate of 15 The current median sales price in the Baltimore metro is $251000 Single-family homes in Baltimore County posted a 10-year high median sale price of $330000 This is a 6 YoY increase from June 2019 Homes in Baltimore City also posted a 10-year high median sale price of $238000 Of note Owings Mills experienced a 27 YoY increase in median home value for an average of $415000
Investment activity reached $506M in the Baltimore metro during the first two quarters of 2020 in 14 transactions All but one sale was value-add product The highest sales in terms of price per unit were Point at Elkridge a 312-unit property in Elkridge which sold for $232400 per unit and Townes at Holly Station a 510-unit property in Waldorf which sold for $225500 per unit CBRE brokered both sales
TOWNES AT HOLLY STATION
$215000
$220000
$225000
$230000
$235000
$240000
$245000
$250000
2014 2015 2016 2017 2018 2019
Baltimore Metro Median Sale Price
$0
$500000000
$1000000000
$1500000000
$2000000000
$2500000000
$3000000000
2013 2014 2015 2016 2017 2018 2019 H1 2020
Balitmore Metro Sales Volume
2018 20192016 20172014 20152013 H1 2020
$210000$215000$220000$225000$230000$235000$240000$245000$250000$255000
2014 2015 2016 2017 2018 2019 2020
Baltimore Metro Median Sale Price
2020
24
FOR SALES OR FINANCING INFORMATION CONTACT
William S RoohanVice Chairman(O) +1 410 244 3122(M) +1 443 690 6967billroohancbrecom
Michael E MuldowneyExecutive Vice President(O) +1 410 244 3144(M) +1 443 250 3144mikemuldowneycbrecom
Robert G Dean IIISenior Vice President(O) +1 202 585 5766(M) +1 202 578 6941robertdeancbrecom
Jonathan M GreenbergSenior Vice President(O) +1 703 734 4772(M) +1 202 423 6655jonathangreenbergcbrecom
Martha A HastingsSenior Vice President(O) +1 410 244 3162(M) +1 410 807 2450marthahastingscbrecom
Brian H MargerumSenior Vice President(O) +1 410 244 3135(M) +1 443 386 1096brianmargerumcbrecom
Michael D RudolphSenior Vice President(O) +1 410 244 3121(M) +1 443 928 0392michaelrudolphcbrecom
John T Sheridan JrSenior Vice President(O) +1 703 905 0239(M) +1 703 200 7720johnsheridancbrecom
Yalda G HowellFirst Vice President(O) +1 202 585 5677(M) +1 240 462 2332yaldaghamariancbrecom
Thomas B LeachmanVice President(O) +1 202 585 5638(M) +1 240 688 0189thomasleachmancbrecom
Kemp D BroujosSenior Associate(O) +1 202 585 5724(M) +1 443 786 2951kempbroujoscbrecom
Nathan E BarthAssociate(O) +1 703 905 0228(C) +1 703 340 6828nathanbarthcbrecom
Zachary L StoneSales Assistant(O) +1 202 585 5650 (M) +1 202 713 8404zachstonecbrecom
Investment Sales amp Brokerage
Operations amp Marketing
Debt amp Structured Finance Team
Patricia C BonebrakeSenior Director of Operations(O) +1 410 244 3141(C) +1 443 253 5917trishbonebrakecbrecom
Jennifer W BusseyOperations Manager(O) +1 410 244 3134(C) +1 410 300 1302jenniferbusseycbrecom
Cheryl FinlaysonProductions Systems Manager(O) +1 410 244 7100(C) +1 410 244 3101cherylfinlaysoncbrecom
Margaret O MacleayOperations Supervisor(O) +1 202 585 5638(C) +1 410 562 9340maggiemacleaycbrecom
Rachel L MossmanSenior Communications Specialist(O) +1 410 244 3179(C) +1 410 244 7100rachelmossmancbrecom
Samantha S FifieldSales Assistant(O) +1 202 585 5773(C) +1 310 266 0003samanthafifieldcbrecom
Caroline P LekakosClient Services Coordinator(O) +1 202 585 5606(C) +1 240 595 0642carolinelekakoscbrecom
Yasmeen F ShararaClient Services Coordinator(O) +1 202 585 5580(C) +1 301 828 7435yasmeenshararacbrecom
Lauren E SpielmanClient Services Coordinator(O) +1 410 244 3129(C) +1 443 800 4388laurenspielmancbrecom
Grace F TrimbleClient Services Coordinator(O) +1 410 244 3123(C) +1 410 499 1064gracetrimblecbrecom
David F WebbVice Chairman(O) +1 202 585 5721(M) +1 202 744 4900davidwebbcbrecom
Maximiliane T LeachmanExecutive Vice President(O) +1 202 585 5655(M) +1 404 358 4317maxileachmancbrecom
Justin J GlasgowSenior Vice President(O) +1 202 783 1723(M) +1 202 316 1804justinglasgowcbrecom
RESEARCH TEAM
JEANETTE I RICE Americas Head of Multifamily Research (O) +1 214 979 6169
(C) +1 817 412 0709 jeanettericecbrecom
MOLLY M HUNT Research Analyst (O) +1 202 585 5597(C) +1 415 599 6009 mollyhuntcbrecom
RANK
1Fortune Magazinersquos
Most Admired Commercial Real Estate
Firm
REPUTATION
2Ranked the 2
Multifamily Brokerage Team in the entire nation by
Real Estate Forum
THE CBRE TEAM COMPETITIVE ADVANTAGE
25
RESOURCES
26Largest team and most
capacity in the Mid-Atlantic region
EXPERIENCE
$174B+The aggregate sales
value of deals our team has brokered since
2015
DEBT TEAM
1The CBRE Debt amp
Structured Finance Team is the 1 Freddie Mac
SellerServicer
copy Copyright 2020 All rights reserved Information contained herein including projections has been obtained from sources believed to be reliable but has not been verified for accuracy or completeness CBRE Inc makes no guarantee warranty or representation about it Any reliance on such information is solely at your own risk This information is exclusively for use by CBRE clients and professionals and may not be reproduced without the prior written permission of CBRErsquos Global Chief Economist CBRE and the CBRE logo are service marks of CBRE Inc andor its affiliated or related companies in the United States and other countries All other marks displayed on this document are the property of their respective owners Photos herein are the property of their respective owners Use of these images without the express written consent of the owner is prohibited
WASHINGTON DC1900 N Street NW
Suite 700 Washington DC 20036
+1 (202) 783 8200
BALTIMORE MD100 East Pratt Street
Suite 1700Baltimore MD 21202+1 (410) 244 7100
TYSONS VA1861 International Drive
Suite 300McLean VA 22102+1 (703) 821-6900
2
PREFACECBRE is pleased to release the H1 2020 Mid-Atlantic Multifamily Report highlighting the most current and comprehensive data available for the region Produced by the Washington DC Multifamily Investment Properties Team this report has been assembled by local experts to empower the decision making and inform those interested in multifamily in the Mid-Atlantic
This report compiles research from a variety of in-house and third-party data sources to explain the market at a granular level
Data contributions and validations to this publication were made by
This Washington DC Investment Properties Team has access to the most comprehensive data on the market and has a deep understanding of the metrics involved
CBRE Multifamily consists of more than 300 dedicated professionals nationally specializing in all aspects of multifamily real estate brokerage and finance providing investment and advisory services to meet the needs of investors across the multifamily investment spectrum With offices in 65 cities across every major US market our Team also maintains a strong global presence with offices on nearly every continent offering strategic advice and execution for residential and multifamily assignments worldwide
We welcome any inquiries you may have and encourage you to contact our Team with any questions
bull CBRE Researchbull CBRE Econometrics Advisorsbull Claritasbull Yardi Matrix
bull Axiometricsbull Delta Associatesbull Bureau of Labor Statisticsbull CoStar
2
3
TAB
LE O
F CO
NTE
NTS
Executive Summary PG 4
Resilience Proven in Prior Recessions
PG 5
Outlook PG 6
The District PG 8
Northern Virginia PG 12
Suburban Maryland PG 16
Baltimore PG 20
Contacts PG 24
TAB
LE O
F CO
NTE
NTS
Executive Summary PG 4
Resilience Proven in Prior Recessions
PG 5
Outlook PG 6
The District PG 8
Northern Virginia PG 12
Suburban Maryland PG 16
Baltimore PG 20
Contacts PG 24
3
4
BALTIMORE
NORTHERN VIRGINIA
WASHINGTON DC
MID-ATLANTIC MULTIFAMILY MARKET
EXECUTIVE SUMMARYThe Mid-Atlantic region began 2020 on a great notemdashpositive rent growth across all markets prolific development activity and high transaction volumes All of a sudden in mid-March COVID-19 shook the nation We are now experiencing the effects of the pandemic on multifamily operations and transaction velocity However several early signs indicated that the Mid-Atlantic would fare well compared to other large metros and indeed it has Historically the Washington DC metro is recognized as the most risk-averse employment base due to its low employment rates in industries such as Leisure amp Hospitality and Retail Additionally the federal government and local federal spending has provided a unique degree of insulation to the regional economy Intellectual capital has also been rich within the region a large supply of highly educated talent bolsters the strong cyber security biotech bio-sciences defense and technology industries in the Mid-Atlantic
While the Mid-Atlantic multifamily market was impacted by the pandemic it has shown its continued resilience in the face of unprecedented market volatility In Q2 2020 across national Tier II markets the Baltimore metro was ranked first and second in the nation in terms of rent growth and lowest vacancy change respectively Vacancy in the Baltimore metro increased by only 80 bps and rent growth held steady Across national Tier I markets the Washington DC metro experienced similar success as it ranked fourth in the nation in terms of rent growth and lowest vacancy change The Washington DC metro experienced a 90 bps increase in vacancy and a 23 decrease in overall rents which compared to the rest of the nation is quite favorable Net absorption in the Washington DC metro as a percentage of total inventory was the second highest in the nation across large metros and the only gateway market to make it to the top 20 across all national markets
Although job losses across the country were substantial the Baltimore and Washington DC metros fared well on a national scale The Washington DC metro saw fewer job losses than any other large metro in the country likely due to federal government activity in response to the pandemic In June out of 51 MSArsquos Baltimore ranked 8th in the nation for the lowest unemployment rate at 80 and Washington DC followed close behind in 10th place at 84 unemployment In recent years the Mid-Atlantic economy has become more diversified with tech education and private business on the rise Additionally while sequestration reduced the footprint of the federal government and its presence in the region it has grown in recent months and played an integral role in keeping workers employed and stimulating the economy
The Washington DC metro will continue to see an influx of supply with an estimated 15150 units delivering in the next 12 months Construction has not slowed since the start of the year and over 3300 units began construction in the second quarter of 2020
As a result of the pandemic data suggests that renters are now favoring properties in lower density areas In the Washington DC metro rent growth in low-rise apartments outperformed rent growth in high-rise apartments by 21 In the Baltimore metro the lower-density suburbs saw only a slightly negative growth rate of 10 bps while Baltimore City rents fell 30
SUBURBAN MARYLAND
Baltim
ore-
Was
hingt
on Pa
rkway
MID-ATLANTIC MULTIFAMILY MARKET
Risk-Averse Employment Base
Mid-Atlantic Resilience
Urban to Suburban Migration
5
During previous recessions the Mid-Atlantic anchored by Washington DC and Baltimore proved to be the most resilient region in the country due to its diversified economy strong market drivers and the presence of the nationrsquos largest employermdashthe federal government The stability and dynamism of the regionrsquos economy underpins its resilient multifamily real estate market fundamentals
EXECUTIVE SUMMARY
bull Minimal Vacancy Change DC and Baltimore were ranked 3 and 5 respectively in terms of least amount of change in vacancy across the country during the 2008 recession at an average increase of only 150 bps
bull Most Stable Rents in the Nation Baltimore and DC ranked 1 and 2 respectively for least impacted rent growth in the nation and recovered in just six quarters compared to a national average of 12 quarters The regionrsquos peak-to-trough rent change was a mere 2 during the previous recessionmdashlower than the nearly 6 national average
bull Prolific Investment Market Since recovery in 2010 DCrsquos and Baltimores per unit increased by an average of 6 and 4 respectively as investors remain bullish on the region as a powerhouse center of the East Coast
bull Durability of Employment Base DC and Baltimore have historically lower unemployment rates compared to the US The strong and prominent labor markets of ldquoEds and Medsrdquo biotech and government are some of the most resilient industries through recessions Tech has also proven to be a pillar of the economy with significant future growth centered around the establishment of Amazonrsquos new HQ2 Washington is ranked 1 for lowest percentage of at-risk employment segments in the current downturn
These strong economic drivers will bolster the multifamily market drive demand and lead the region towards future growth
MID-ATLANTIC MULTIFAMILY MARKET
RESILIENCE PROVEN IN PREVIOUS RECESSIONS
0
2
4
6
8
10
01234567
Va
can
cy
Recession
Washington DC
Baltimore
Tech Boom
Tech Bust Post 911 RecessionPost Global Financial Crisis
Recovery Forecast
Atlanta
Baltimore
BostonChicagoDallasFt Worth
Denver
Detroit
Houston
Inland Empire
Long Island
Los Angeles
Miami
Minneapolis
New York CityOaklandOrange County
Orlando
Philadelphia
Phoenix
San Diego
San Francisco
Seattle
St Louis
Tampa
US
Washington DC
-16
-14
-12
-10
-8
-6
-4
-2
0
100 150 200 250 300 350
Rent
Chan
ge (
)
Vacancy Change (Bps)
Least Severe Downturn
Most Severe Downturn
METRO MARKET RENT amp VACANCY CHANGE IN LAST DOWNTURN
WASHINGTON DC amp BALTIMORE METROSrsquo VACANCY
CLICK HERE TO READ THE FULL REPORT ON CBRErsquoS
RESEARCH GATEWAY
-4
-2
0
2
4
6
8
10
Q12008
Q32008
Q12009
Q32009
Q12010
Q32010
Q12011
Q32011
YoY Re
nt Grow
th
Class A Class B Class C National
DC METRO YOY AVERAGE RENT GROWTH
-4
-2
0
2
4
6
8
10
Q12008
Q32008
Q12009
Q32009
Q12010
Q32010
Q12011
Q32011
YoY Re
nt Gr
owth
Class A Class B Class C National
BALTIMORE METRO YOY AVERAGE RENT GROWTH
OUTLOOKThe Mid-Atlantic is a booming market for millennials empty nesters and many others to live work and play in There are some challenges for developers investors and property managers in the short-term but the long-term future is bright The regionrsquos economy has strong fundamentals bolstered by the largest employer in the nation the federal government
Vacancy IncreasesWhile the Mid-Atlantic has performed at the top of the nation overall vacancy has increased in Washington DC and Baltimore by 90 bps and 80 bps respectively since Q2 2019 Unemployment and increased work from home flexibility have caused residents to consider alternative housing to save money on rent
High Rent CollectionsRent collections across the nation have been substantially higher than expectations in H1 2020 The National Multifamily Housing Council reported that 930 and 922 of residents paid rent across the nation in May and June respectively Approximately 940 of Washington DC residents paid rent in April and 892 of Baltimore residents paid rent in May
ADVANTAGES AND CHALLENGES FOR THE MULTIFAMILY INVESTORDEVELOPER
ADVANTAGES CHALLENGES
The Success of Virtual ToursVirtual tours have become the new normal for leasing offices in the Mid-Atlantic The per-project lease up rate in Washington DC is 14 units per month down only one unit from Q2 2019 In the Baltimore metro there are currently 18 projects in lease up with an average absorption rate of 15 units per project per month
Growing Tech TalentWashington DC has risen to the No 2 spot on CBRErsquos annual tech talent report coming in as the runner-up to the San Francisco Bay Area Washington has over 263000 tech workers and has experienced 10 growth since 2015 However Washington DCrsquos average apartment asking rate is ranked 8th in the nation indicating that it is one of the most affordable areas with the highest concentration of tech talent in the nation This growing labor market in high paying industries will continue to drive wages up and increase demand for Class-A and Class-B multifamily product
Click here to read CBRErsquos July 2020 Tech Talent Report
Significant PipelineThe Mid-Atlantic region will continue to see an influx of supply over the next few years Washington DC will experience an estimated increase of 15150 units in the next 12 months Construction has not slowed since the start of the year and over 3300 units began construction in the second quarter of 2020 In Baltimore 2437 units delivered in H1 2020 and 6906 units are on track to deliver in the next 36 months Developers are optimistic about future deliveries in 2021 with an expected market recovery that will renew demand
MID-ATLANTIC MULTIFAMILY MARKET
6
Eviction MoratoriumsThe Washington DC Councilrsquos emergency measures to respond to the pandemicrsquos economic impacts included a freeze on evictions and a prohibition on rent increases through October 2020 In Northern Virginia eviction freezes were extended to September 8 2020 In Maryland there are currently no eviction restrictions
MID-ATLANTIC H1 2020 ACCOLADES
bull Washington DC metro saw fewer YoY job losses than any other large metro in the country
bull Baltimore (80) and Washington DC (84) are ranked 8th and 10th for lowest unemployment rate across the largest 51 US metros
bull Washington DCrsquos net absorption as a percentage of total inventory was the second highest in the nation for large metros
bull Across Tier II markets Baltimore ranked first and second in the nation in terms of rent growth and lowest vacancy change
bull Across Tier I markets Washington DC ranked fourth in the nation in terms of rent growth and lowest vacancy change
bull Washington DC ranked 1 most risk-averse metro for employment base in the recent downturn
bull Washington DC ranked second in the nation in CBRErsquos Scoring Tech Talent report and has seen 10 industry growth since 2015
7
MID-ATLANTIC MULTIFAMILY MARKET
STRENGTH OF MULTIFAMILY INVESTMENTS
DEBT MARKETSDebt for multifamily investments is available at historic levels Interest rates are at all-time lows and offer multi-year interest-only periods These low-rate interest-only loans allow investors to achieve as high cash-on-cash leveraged returns as they have ever been able to achieve in the multifamily market and have helped to maintain low cap rates Currently attractive debt is available and equity is plentiful which typically means that private capital buyers have strong appetites There is a consensus among investors that multifamily as a need-based asset type remains a safe investment given the ubiquitous need for housing
While the CMBS markets have shown some distress the agency loan market has remained active Through the COVID-19 pandemic the GSEs have stepped up to fulfill their mission of providing liquidity to the multifamily market While their rates are at historically low levels they have increased their reserve requirements to protect themselves against current of future renterrsquos inability to make rent payments as a result of the pandemic These reserve requirements are sized to six months and are released to the owner once the property has maintained certain occupancyrental income requirements for a period post-closing and in the case of Freddie Mac once the emergency declarations andor stay at home orders have been lifted at the federal and local level These reserves typically amount to between 3 to 6 of the loan amount and most borrowers are willing to accept these requirements given the benefit of locking in sub 3 interest only long term debt As conditions stabilize or if a borrower is seeking relatively low leverage the requirement for debt service escrow is likely to mitigate or go away
AMAZON HQ2Amazonrsquos HQ2 is a generational market catalyst for employment and rent growth The new headquarters in Crystal City is slated to create 37000+ direct jobs over the next 14 years Amazon HQ2 is expected to occupy over 4M SF of office space accounting for 33 of Crystal Cityrsquos existing office inventory The expected average annual salaries of $150000 for Amazon employees could support apartment rents of more than $3750 per month As of Q2 2020 Amazon has already hired over 1000 employees It is estimated that Amazon will bring 1200 employees in 2020 and an additional 2000 employees in 2021 By 2023 when the two-million square foot campus near Pentagon City opens Amazon will employ over 5000 employees at HQ2 The second phase of construction will continue for several years with a full build-out of over 4M SF in the newly termed submarket ldquoNational Landingrdquo Amazon has received approximately $752M in subsidies for job creation from the state of Virginia and Arlington County Multifamily communities proximate to HQ2 are already experiencing significant rent growth As residents are priced out of Arlington County increased demand will radiate throughout Northern Virginia as residents seek a discount to in-fill Northern Virginia
The Amazon ldquoMultiplier EffectrdquoAmazon will not only draw entrepreneurs to the area but will also serve as a hub for startups and a magnet for venture capital within the greater DC MSA An infusion of new jobs to any region creates what economists call the ldquomultiplier effectrdquo The multiplier effect implies that Amazonrsquos 37000 employees could increase to as many as 185000+ indirect jobs and ldquomultiplyrdquo outwards
25000-35000 new STEM degrees over the next 20 years from the new $1B Virginia Tech Innovation Campus
Demand for an additional 40000-60000 rental units as a result of the ldquoAmazon Effectrdquo
THE DISTRICT
NORTHERN VIRGINIA
SUBURBAN MARYLAND
8
WASHINGTON DC H1 2020
WASHINGTON DC OVERVIEW
The District is experiencing negative effects of the COVID-19 pandemic with drops in rent absorption and rising vacancy throughout the apartment market The average monthly Class-A rent fell 35 YoY to a monthly average of $2561 per unit per month or $327SF The average Class-B rent fell 27 to an average of $2067unitmonth or $274SF
Just over 3000 units across the city delivered in the first half of 2020 and 12969 units are currently under construction Capitol Riverfront emerged as the leading submarket in terms of development activity with a 1475-unit increase with the delivery of The Estate The Kelvin Parc Riverside Phase I Meridian on First and The Maren Multifamily capital markets finished H1 2020 with $292860000 sold throughout the District over 9 sales The COVID-19 pandemic has slowed investment activity significantly as investors weather the storm of economic volatility Comparatively in the first half of 2019 over $685000000 transacted over 30 sales
THE DISTRICT
9
WASHINGTON DC H1 2020
2020 DELIVERIES MAP
THE DISTRICT DELIVERIES
Over 3000 units delivered to the District in H1 2020 accounting for a 21 increase to the total multifamily housing inventory The pipeline continues on a steady upward trend and will not slow until late 2022 There are currently 12696 units under construction that will increase the total multifamily inventory by 88 over the next two years
NoMa H Street Corridor Union Market and Capitol Riverfront are the most active submarkets in terms of development activity These growing areas continue to deliver Class-A luxury apartment buildings in areas that are also seeing retail and office space developments
382274copy 2020 CBRE Inc All rights reserved This information has been obtained from sources believed reliable but has not been verified for accuracy or completeness You should conduct a careful independent investigation of the property and verify all information Any reliance on this information issolely at your own risk CBRE and the CBRE logo are service marks of CBRE Inc All other marks displayed on this document are the property of their respective owners and the use of such logos does not imply any affiliation with or endorsement of CBRE
1
2
3
4
5 6
7
8
9
1 0
1 1
WASHINGTON
295
5050
695
395
395
395
Rhode Island Ave NE
Virginia Ave NW
Rhode Island Ave NW
H St NE
Min
neso
taAv
eN
E
Q St NW
Potomac Ave SE
11
th S
t S
E
Minnesota Ave SE
13
th S
t N
W
13
th S
t N
E
Pennsylvania Ave SE
3rd
St
NW
So
uth
Ca
pit
ol
St
12
thS
tS
W
Florida Ave NE
9th
St
SW 7th
St
SW
9th
St
NW
Pennsylvania Ave NW
Tenn
esse
eAv
eN
E
E Capitol St SE
US-1N
6th
St
NE
Massachusetts Ave NW
US-
1S
4th
St
NE
Independence Ave SE
14
thS
tS
W
Mt Olivet Rd NE
Constitution Ave NW
KentuckyAve
SE
9th
StN
E
Benning Rd NE
6th
St
SE
7th
St
NW
K St NW
Bra
nch
Ave
SE
6th
St
NW
New
Ham
pshi
re A
ve N
W
L St NW
E Capitol St NE
No
rth
Ca
pit
ol
St
14
th S
t N
W
North Carolin
a Ave SE
D St SW
9th
St
SE
22ndSt
NE
Texas AveSE
16
th S
t N
W
B St SE
2n
d S
t N
E
D St SE
21
stSt
NE
8th
St
SE
Maine
Ave
SW
12
th S
t S
E
Kenilw
orthAve
NE
M St SW
I St SE
Bryant St NW
19
th S
t N
W
17
th S
t N
W
11
th S
t N
E
Florida Ave NW
Maryland Ave NE
15
th S
t N
W
4th
St
SE
U St NW
M St NW
M St SE
RidgeRd
SE
Independence Ave SW
H St NW
C St NE
R St NW
2020 MID ATLANTIC MULTIFAMILY DELIVERIESWASHINGTON DC
sup1 0 025 05013
Miles
MULTIFAMILY DELIVERY
Leased 23Developer CAS RieglerEB5
8 BlackbirdUnits 167
Leased 7Developer FRP DevelopmentMRP Realty
7 The MarenUnits 264
Leased 6Developer Paradigm Development
6 Meridian on First IUnits 273
Leased 11Developer Toll Brothers
5 Parc Riverside Phase IIUnits 308
Leased 39Developer Brookfield Properties
3 The EstateUnits 320
Leased 43Developer RappaportWC SmithEB5
2 AvecUnits 420
Leased 36Developer Jair LynchMacFarlane Partners
4 The KelvinUnits 310
Leased 28Developer JBG SmithMRP Realty
1 The WrenUnits 433
Leased 4Developer Jefferson Apt GroupStars Investment
10 J LineaUnits 132
Leased 17Developer JBG Smith
9 901WUnits 161
Leased 42Developer Coba
11 1714-1716 14th Street NWUnits 8
Leased 28
Leased 43
Leased 39
Leased 36
Leased 11
Leased 6
Leased 7
Leased 23
Leased 17
Leased 4
Leased 42
10
-60000 -50000 -40000 -30000 -20000 -10000 0 10000
Q2 2020 DC Employment
WASHINGTON DC H1 2020
Job Growth YoY
-50000 -40000 -30000 -20000 -10000 0 10000
StateLocal Government
Federal Government
Other Services
Leisure and Hospitality
Education and Health Services
Professional and Business Services
Financial Activities
Information
Retail Trade
Wholesale Trade
Trade Transportation and Utilities
Manufacturing
Mining Logging and Construction
EMPLOYMENT
CAPITAL MARKETS
$292860000SALES IN H1 2020
845 UNITSSOLD IN H1 2020
9 PROPERTIES
Deliveries Net Absorption Vacancy
Year
DEVELOPMENTDC BY THE NUMBERS
61
$2561
12696 UNITSUNDER CONSTRUCTION
3004 UNITSDELIVERED IN 2020
STABILIZED VACANCY
PIPELINE
CLASS A AVG RENTS
CLASS B AVG RENTS
Source CBRE Research and Delta Associates
As of June 30 2020
PER UNIT PER MONTH
18907 UNITS36-MONTH PIPELINE
Recent deliveries in the District were concentrated primarily in the Capitol Riverfront and H Street submarkets NoMa and Union Market also remain top submarkets for development activity with around 3483 units under construction on-track to deliver in the next 24 months Annual absorption in the District was 25 lower than a year ago as 2003 units absorbed in the first half of the year Q2 stabilized vacancy rate in the District is 61 a 250 bps increase from the previous year The average lease-up pace of new product in the District is 14 units per month and concessions average 15 months free rent
Insulated by the federal government Washington DC has fared favorably thus far in the downturn compared to other large metros across the nation The District experienced 67000 job losses which represents an 8 YoY loss in employment Leisure and Hospitality suffered the biggest job loss as 60 of the workforce was laid off or furloughed Promisingly government information and other services were the only industries to experience job growth albeit small
PER SF PER MONTH$327
$2067PER UNIT PER MONTH
PER SF PER MONTH$274
7000
6000
5000
4000
3000
2000
1000
0
8
7
6
5
4
3
2
1
0
VacancyUnitsDelivered
Washington DC Summary
2013 2014 2015 2016 2017 2018 2019 2021 2022H22020
H12020
00
10
20
30
40
50
60
70
80
90
0
1000
2000
3000
4000
5000
6000
7000
2013 2014 2015 2016 2017 2018 2019 H1 2020 H2 2020 2021 2022
Vaca
ncy
Units
Deliveries Net Absorption Vacancy
Forecast
11
WASHINGTON DC H1 2020
WASHINGTON DC HOME PRICES
Property Year Built Price Sold Units $Unit
The Woodley 2014 $180250000 010820 212 $850235
Skyline Apartments 1965 $58700000 030120 398 $147487
Glenwood Apartments 1942 $13700000 013020 90 $152222
The Waring 1909 $8400000 063020 24 $328947
The Regent 1937 $8450000 063020 12 $228378
LARGEST SALESDC MULTIFAMILY SALES VOLUME
$2000000000
$1500000000
$1000000000
$500000000
$02018 20192016 20172014 20152013
THE SHELBY
Class A High-Rise Avg $UnitMo
Avg $SFMo Vacancy YoY Rent Change
Upper NW $2810 $347 50 -06
Central $2822 $345 51 -46
Columbia HeightsShaw $2663 $363 64 -21
NoMaH Street $2290 $302 82 -57
Capitol HillRiverfrontSouthwest $2583 $325 77 -33
Northeast $2092 $266 85 -07
Upper Georgia $2183 $281 53 06
Class B Mid-and High-Rise Avg $UnitMo
Avg $SFMo Vacancy YoY Rent Change
Upper Northwest $2104 $258 43 -26
Mount Vernon Square NW $1925 $291 76 -74
Southwest $2085 $289 30 -04
RENTAL RATES
The District experienced broad rent decreases across almost all submarkets with the exception of Upper Georgia The Northeast and NoMaH Street submarkets have the highest Class-A High-Rise vacancy at 85 and 82 respectively This is in part due to an influx of new deliveries to those markets Class-B vacancy currently stands at 45 and concessions are at 30 of face rent The Mount Vernon Square submarket has the highest Class-B Mid and High-Rise vacancy at 76 and the highest decline in rent growth at -74 Class-A and Class-B apartments rents fell by a total of 33
The current average home value in the District is $586000 While home values grew in 2020mdashseeing an average annual increase of 70mdashhome values in the District have increased on average 30 YoY since 2015
A total of $2929M multifamily sales transacted in the District in nine sales in the first two quarters of 2020 CoreCore-Plus transactions made up for 71 of transactions and Value-Add transactions made up for the remaining 29 of total sales volume The highest sales in terms of price per unit were The Woodley a 212-unit property in Woodley Park at $850235 per unit and The Shelby a 24-unit property in Dupont Circle at $350000 per unit both of which were brokered by CBRE The Woodley was also the largest sale in H1 2020 across the District at $18025M
$0
$500000000
$1000000000
$1500000000
$2000000000
2013 2014 2015 2016 2017 2018 2019 H1 2020
DC Sales Volume
H1 2020
$600000
$500000
$400000
$300000
$200000
$100000
2014 2015 2016 2017 2018 2019$0
$100000
$200000
$300000
$400000
$500000
$600000
2014 2015 2016 2017 2018 2019 2020
DC Home Prices
2020
12
NORTHERN VIRGINIA H1 2020
NORTHERN VIRGINIA
NORTHERN VIRGINIA OVERVIEW
Northern Virginia continues to be the fastest growing region in the DC metro The regionrsquos economic future has been bolstered by Amazonrsquos decision to build its HQ2 in National Landing Amazon selected Northern Virginia because of its inherently strong fundamentals including a rich pipeline of talent provided by numerous universities in the area Amazon has subsequently begun the first phase of its hiring process and build-out at National Landing including hiring over 1000 white-collar employees and moving into 300000 SF of office space The delivery of HQ2 is expected to add 40000 to 60000 units of additional apartment demand to the area in the next decade A typical Amazon HQ2 worker will make $150000 per year which allows for up to $3750 in monthly rent Additionally Virginia Tech is moving forward with its plans to build the $1 Billion Innovation Campus in Potomac Yard The introduction of these two strong economic drivers will continue to further diversify the job base and incentivize more businesses to move to all areas of the DC metro where a pipeline of talent awaits
$400000
$450000
$500000
$550000
$600000
2014 2015 2016 2017 2018 2019
DC Home Prices
13
NORTHERN VIRGINIA H1 2020
2020 DELIVERIES MAP
NORTHERN VA DELIVERIES
Just under 4000 new units delivered in H1 2020 across Northern Virginia accounting for a 16 increase in total volume There are currently 10135 units under construction which will add 4 to the inventory over the next 24 months The largest deliveries in the region include Perseus Realtyrsquos The Foundry a 525-unit property in Alexandria Saul Centersrsquo Waycroft a 490-unit property in BallstonVirginia Square Wash REITrsquos The Trove a 401-unit property in Columbia Heights Arlington and Combined Propertiesrsquo Scout on the Circle a 400-unit property in Fairfax
382274copy 2020 CBRE Inc All rights reserved This information has been obtained from sources believed reliable but has not been verified for accuracy or completeness You should conduct a careful independent investigation of the property and verify all information Any reliance on this information issolely at your own risk CBRE and the CBRE logo are service marks of CBRE Inc All other marks displayed on this document are the property of their respective owners and the use of such logos does not imply any affiliation with or endorsement of CBRE
1
2
45
6
7
8
9
1 0
1 1
1 2
LORTON
MANASSAS
WOODBRIDGE
FORT HUNTNEWINGTON
LAKE RIDGE
CENTREVILLE
HERNDON
MANASSAS PARK
RESTON
STERLING
CHANTILLY
FAIRFAX STATION
ANNANDALE
BETHESDA
BURKE
FAIRFAX
FALLS CHURCH
NORTH BETHESDA
TYSONS CORNER
VIENNA
POTOMAC
MCLEAN
OAKTON
SPRINGFIELD
GROVETON
IDYLWOOD
JEFFERSON
LINCOLNIA
WEST SPRINGFIELD
WOLF TRAP
ADELPHI
BELTSVILLE
BOWIE
CALVERTON
CAMP SPRINGS
CLINTON
COLLEGE PARK
FORESTVILLE
GREENBELT
HILLCREST HEIGHTS
HYATTSVILLE
LANHAM
ROSARYVILLE
GLENN DALE
CORAL HILLS
EAST RIVERDALE
KETTERING
WASHINGTON201
267
28295
295
381
110
5
50
29
301
695
66
270
495
395
95
495
495
495
95
WASHINGTONDULLES INTL
AIRPORT
RONALD REAGANWASHINGTON
NATL ARPT
POTOMACAIRFIELD
FREEWAYAIRPORT
COLLEGE PARK AIRPORT
2020 MID ATLANTIC MULTIFAMILY DELIVERIESNORTHERN VIRGINIA
sup1 0 2 41
Miles
MULTIFAMILY DELIVERY
Leased 20Developer Novare Group Mulberry Development Group
8 Cameron SquareUnits 302
Leased 22Developer Praedium Group
7 The ClarkUnits 342
Leased 5Developer Erkiletian DevelopmentPCCP
6 The Sur at National GatewayUnits 360
Leased 65Developer Orr Partners
5 Centro ArlingtonUnits 366
Leased 12Developer Washington Real Estate Investment Trust
3 The TroveUnits 401
Leased 34Developer Saul Centers REIT (Northwestern Mutual Life Insurance)
2 The WaycroftUnits 490
Developer Combined Properties
4 Scout on the CircleUnits 400
Leased 21Developer Perseus RealtyELVFour Points
1 Foundry at CarlyleUnits 525
Leased 49Developer Shooshan Co Brandywine Realty Trust
10 4040 WilsonUnits 244
Leased 25Developer Abramson Properties Weingarten Realty AHDC
9 Array at West AlexUnits 278
Leased 40Developer Elm Street DevelopmentNorthwood Ravin
12 Preserve at Westfields - Phase IUnits 132
Leased 17Developer Novus
11 Mission LoftsUnits 157
Leased 21
Leased 34
Leased 12
Leased 7
Leased 65
Leased 5
Leased 22
Leased 20
Leased 25
Leased 49
Leased 17
Leased 40
Source Axiometrics 2020
VIRGINIA TECH INNOVATION CAMPUS
AMAZON HQ2
3
14
NORTHERN VIRGINIA H12020
$494500000SALES IN H1 2020
1823 UNITSSOLD IN H1 2020
9 PROPERTIES
Deliveries Net Absorption VacancyYear
NoVA BY THE NUMBERS
43
$1992
10135 UNITSUNDER CONSTRUCTION
3997 UNITSDELIVERED IN 2020
STABILIZED VACANCY
PIPELINE
CLASS A AVG RENTS
CLASS B AVG RENTS
Source CBRE Research and Delta Associates
As of June 30 2020
PER UNIT PER MONTH
14567 UNITS36-MONTH PIPELINE
Just under 4000 units delivered in H1 2020 which equates to a 10 increase in total inventory throughout the year Arlington accounted for 59 of new deliveries and Alexandria accounted for 27 The average lease-up pace for properties in Northern Virginia is currently 21 units per month compared to 24 units per month in January 2020 Northern Virginiarsquos current stabilized vacancy is 43 a 70 bps YoY increase
Job Growth YoY as of June 2020EMPLOYMENT
Northern Virginia experienced the YoY employment decline of 134700 jobs Leisure and Hospitality fared the worst with the loss of 64500 jobs and Education and Health Services with the loss of 32100 jobs However there was growth in Information and Financial Activities industries At the start of the year unemployment was at 25 and it currently stands at 86
As of June 2020 Amazon has already hired 1000 employees It is estimated that Amazon will bring 1200 employees in 2020 and an additional 2000 employees in 2021
CAPITAL MARKETS
PER SF PER MONTH$217
$1746 PER UNIT PER MONTH
PER SF PER MONTH$194
VacancyNorthern Virginia SummaryUnits
Delivered
DEVELOPMENT
-70000 -60000 -50000 -40000 -30000 -20000 -10000 0 10000
H1 2020 NoVa Employment
-70000 -50000 -30000 -10000 0 10000
5
4
3
2
1
02014 2015 2016 2017 2018 2019 H1
2020H2
2020
10000
8000
6000
4000
2000
02021 2022
StateLocal Government
Federal Government
Other Services
Leisure and Hospitality
Education and Health Services
Professional and Business Services
Financial Activities
Information
Retail Trade
Wholesale Trade
Trade Transportation and Utilities
Manufacturing
Mining Logging and Construction
0
001
002
003
004
005
006
0
1000
2000
3000
4000
5000
6000
7000
8000
9000
2014 2015 2016 2017 2018 2019 H1 2020 H2 2020 2021 2022
Vaca
ncy
Units
Deliveries Net Absorption Vacancy
Forecast
15
NORTHERN VIRGINIA H1 2020
NoVA HOME PRICES
Property Year Built Sold Price Units $Unit
The Emerson 2019 012720 $117000000 355 $329577
Avana Alexandria 1991 013020 $106000000 326 $325153
Ravensworth Towers 1973 041120 $59000000 219 $269406
The Bradley 2015 012020 $57666667 165 $349495
Monroe Place 2008 032620 $56950000 202 $281931
LARGEST SALESNoVA MULTIFAMILY SALES VOLUME
Class A High-Rise Avg $UnitMo
Avg $SFMo Vacancy YoY Rent
Change
Alexandria $2124 $243 54 -33
RosslynBallston Corridor $2490 $300 36 -27
Crystal CityPentagon City $2356 $268 74 -72
South Arlington $2024 $232 45 00
Tysons $2264 $252 78 -134
RestonHerndon $2106 $226 95 -71
Falls ChurchMerrifield $2117 $234 55 -70
Class B Mid-and High Rise Avg $UnitMo
Avg $SFMo Vacancy YoY Rent
Change
Falls ChurchNorth Arlington $2264 $249 54 07
South Arlington $1674 $198 21 -01
Arlandria $1662 $220 16 11
West Alexandria $1666 $183 54 -04
Crystal City $2226 $206 62 -60
RENTAL RATES
$650000
$625000
$600000
$575000
$550000
$5250002014 2015 2016 2017 2018 2019
$5000000000
$4000000000
$3000000000
$2000000000
$1000000000
$0
Northern Virginia experienced rent decreases compared to H1 2019 with the exception of Class-A product in South Arlington and Class-B product in Falls ChurchNorth Arlington and Arlandria Class-A rents fell by 41 to $1992unitmonth or $217 per square foot Class-A vacancy in Northern Virginia is currently 49 and concessions are at 50 of face rent RestonHerndon and Tysons have the highest Class-A vacancy at 95 and 78 due in most part to increased deliveries in those submarkets Class B rents fell 16 YoY to $1746unitmonth or $194 per square foot Class-B vacancy is currently 39 and concessions are 20 of face rent Crystal City has the highest Class-B vacancy at 62 Class-A and Class-B rents fell by a total of 25 YoY
Homes values in Northern Virginia continue to see impressive growth as demand significantly outweighs supply in 2020 New listing inventory was down by 35 this year and prices continue to climb Homes are on the market for an average of 35 weeks before selling The current median home value in Northern Virginia is $641002 which is a 44 YoY increase across the region Alexandria is the fastest growing housing market in the nation with 202 YoY median sale value growth Arlington County currently maintains the highest home value in Northern Virginia and experienced an 11 YoY increase The high cost of home buying in Northern Virginia will likely drive multifamily demand as renters are priced out of the for sale housing market
A total of $4945M multifamily sales transacted in Northern Virginia in nine properties in the first half of 2020 Value-add sales accounted for 77 of transactions and CoreCore-Plus sales made up the remaining 23 of total investment volume The highest price per unit sales were The Bradley a 165-unit property in Alexandria which sold at $349500 per unit and The Emerson a 355-unit property in Herndon which sold at $329600 per unit
JEFFERSON FAIR OAKS
$520000
$540000
$560000
$580000
$600000
$620000
2014 2015 2016 2017 2018 2019
NoVA Average Sold Home Price
$0
$1000000000
$2000000000
$3000000000
$4000000000
$5000000000
2013 2014 2015 2016 2017 2018 2019 H1 2020
NoVA Sales Volume
2018 20192016 20172014 20152013 H1 2020
$500000$520000$540000$560000$580000$600000$620000$640000$660000
2014 2015 2016 2017 2018 2019 2020
NoVA Average Sold Home Price
2020
16
SUBURBAN MD H1 2020
SUBURBAN MARYLAND
SUBURBAN MARYLAND OVERVIEW
Suburban Maryland fared the best in terms of rent growth absorption and transaction volume compared to the other markets in Washington DC Its lower density setting may be in part responsible for its recent resilience as residents choose to relocate out of higher density urban areas
Suburban Maryland is one of the most prominent areas in the region for the Life Sciences sector and is home to the headquarters of the National Institute of Health Department of Energy the Food and Drug Administration and the National Institute of Standards and Technology The presence of biotech in the I-270 Corridor in particular has greatly benefited the commercial real estate market in office industrial and multifamily Life Sciences buildings have significantly lower vacancy rates than that of other commercial office buildings As of 2019 laboratory vacancy sits at around 50 on average while office vacancy rate in Suburban Maryland is nearly 19 Montgomery and Prince Georgersquos counties continue to be largely unique in their growth of biotech because they remain suburban areas in comparison to Life Sciences hubs such as Boston New York and San Francisco that continue to grow as urban areas
Although investment activity slowed down considerably across the region Suburban Maryland is an outlier Over $12B transacted in H1 2020 which is more than H1 2019 when $893M transacted
17
SUBURBAN MD H1 2020
2020 DELIVERIES MAP
SUBURBAN MD DELIVERIES
Deliveries slowed in Suburban Maryland with an addition of 492 units across three projects in H1 2020 The deliveries were Bainbridgersquos Bainbridge Lake Linganore a 322-unit property in Frederick NV Commercial Brick Lanersquos The Bottling Plant a 86-unit property in Outlying Frederick County and Landex Developmentrsquos Artisan 4100 an 84-unit property in Brentwood There are currently 6441 units under construction which will add a total of 35 to total inventory over the next 24 months Bethesda has the highest concentration of development activity with just over 1900 units delivering in the next 36 months Unlike other markets in the DC metro Suburban Marylandrsquos vacancy which currently stands at 36 was not largely impacted in the past six months
382274copy 2020 CBRE Inc All rights reserved This information has been obtained from sources believed reliable but has not been verified for accuracy or completeness You should conduct a careful independent investigation of the property and verify all information Any reliance on this information issolely at your own risk CBRE and the CBRE logo are service marks of CBRE Inc All other marks displayed on this document are the property of their respective owners and the use of such logos does not imply any affiliation with or endorsement of CBRE
1
2
3
HERNDONRESTON
STERLING
BALLENGER CREEK
ASPEN HILL
BETHESDA
CHILLUM
NORTH BETHESDA
ROCKVILLE
SILVER SPRING
TAKOMA PARK
TYSONS CORNER
VIENNA
WHEATON-GLENMONT
WHITE OAK
POTOMAC
MCLEAN
COLESVILLENORTH POTOMAC
IDYLWOOD
WOLF TRAP
ADELPHI
BELTSVILLE
BOWIE
CROFTONGREENBELT
HYATTSVILLELANHAM
LAUREL
ODENTONSOUTH LAUREL
CATONSVILLE
COLUMBIA
DAMASCUS
GAITHERSBURG
LINTHICUM HEIGHTS
NORTH LAURELOLNEY
PIKESVILLE
WOODLAWN
SEVERN
ARBUTUS
MONTGOMERY VILLAGE
GERMANTOWN FERNDALE
ELDERSBURG
LOCHEARN
MAYS CHAPEL
REISTERSTOWN
DUNDALK
PERRY HALL
RIVIERA BEACH
ROSEDALE
SEVERNA PARK
TOWSON
ARNOLD
ESSEX
GLEN BURNIE
PASADENA
PARKVILLE
SOUTH GATE
OVERLEANOTTINGHAM
ANNAPOLIS NECK
WASHINGTON
ANNAPOLIS
BALTIMORE
201
3
295
267
7
100
15
50
15
340
40 1
29
301
301
270
495
70
83
195
95
66
97
895
95
95
695
270395
695
WASHINGTONDULLES INTL
AIRPORT
TIPTONAIRPORT
LEE AIRPORT
BALTIMOREWASHINGTONINTL AIRPORT
MARTIN STATEAIRPORT
2020 MID ATLANTIC MULTIFAMILY DELIVERIESSUBURBAN MARYLANDMULTIFAMILY DELIVERY
sup1 0 3 615Miles
Leased 20Developer Landex Development
3 Artisan 4100Units 84
Leased 60Developer NV Commercial Brick Lane
2 Bottling PlantUnits 86
Leased 9Developer Bainbridge Companies
1 Bainbridge Lake LinganoreUnits 322Leased 9
Leased 60
Leased 20
18
-45000 -40000 -35000 -30000 -25000 -20000 -15000 -10000 -5000 0 5000
H1 2020 SubMD Employment
SUBURBAN MD H1 2020
Job Growth YoY
EMPLOYMENT
$12 BILLIONSALES IN H1 2020
5006 UNITSSOLD IN H1 2020
14 PROPERTIES
5000
4000
3000
2000
1000
0
6
5
4
3
2
1
0
VacancyUnits
Delivered Suburban MD Summary
Deliveries Net Absorption Vacancy
Year
DEVELOPMENTSUBURBAN MD BY THE NUMBERS
36
$1905
6441 UNITSUNDER CONSTRUCTION
492 UNITSDELIVERED IN 2020
STABILIZED VACANCY
PIPELINE
CLASS A AVG RENTS
CLASS B AVG RENTS
Source CBRE Research and Delta Associates
As of June 30 2020
PER UNIT PER MONTH
13773 UNITS36-MONTH PIPELINE
As the most affordable option for residents in Washington DC Suburban Maryland continues to provide job opportunities and relatively affordable living Just under 500 units delivered in H1 2020 and 100 units have been absorbed so far this year Suburban Marylandrsquos current stabilized vacancy is 36 down 30 bps from last year
CAPITAL MARKETS
Suburban Maryland experienced the YoY loss of 111400 jobs The most impacted industries were Leisure and Hospitality with a 40 decrease in employment and Education and Health Services with a loss of 15 of employees Trade and Transportation also lost just under 20000 jobs The Federal Government saw a growth of 1000 employees Unemployment in Montgomery and Prince Georgersquos counties is currently 80 and 99 respectively up from 28 and 36 respectively in January 2020
$203PER SF PER MONTH
$1591PER UNIT PER MONTH
$173PER SF PER MONTH
2014 2015 2016 2017 2018 2019 H12020
H22020
2021 2022
StateLocal Government
Federal Government
Other Services
Leisure and Hospitality
Education and Health Services
Professional and Business Services
Financial Activities
Information
Retail Trade
Wholesale Trade
Trade Transportation and Utilities
Manufacturing
Mining Logging and Construction
-35000 -25000 -15000 -5000 0 10000
00
10
20
30
40
50
60
0
500
1000
1500
2000
2500
3000
3500
4000
4500
2014 2015 2016 2017 2018 2019 H12020
H22020
2021 2022
Vacanc
y
Units
Deliveries Net Absorption Vacancy
Forecast
19
SUBURBAN MD H1 2020
SUBURBAN MD HOME PRICES
Property Year Built Sold Price Units $Unit
4701 Willard 1969 062920 $276500000 525 $526667
The Varsity 2011 032720 $146022026 258 $565977
Gallery on New Hampshire 1960 022820 $117000000 675 $173333
Montgomery Paint Branch 1984 061220 $113206000 529 $214000
Jefferson at Inigos Crossing 2008 011320 $109000000 473 $230444
LARGEST SALESSUBURBAN MD MULTIFAMILY SALES VOLUME
Class A High Rise Avg $UnitMo Avg $SFMo Vacancy YoY Rent
Change
Bethesda $2670 $293 72 31
N Bethesda Rockville $2047 $223 60 22
Silver Spring Wheaton $2012 $242 35 18
Hyattsville College Park $1867 $206 46 NA
Class B Mid-and High-Rise Avg $UnitMo Avg $SFMo Vacancy YoY Rent
Change
Silver Spring $1622 $169 920 -190
BethesdaChevy Chase $1982 $217 520 -530
Rockville $1709 $184 430 450
RENTAL RATES
$400000
$380000
$360000
$340000
$320000
2014 2015 2016 2017 2018 2019
$3000000000
$2500000000
$2000000000
$1500000000
$1000000000
$500000000
$0
Although no markets saw overall positive rent growth over the past year Suburban Maryland was the least negatively impacted region in the metro in terms of rental rates Class-A rents declined by 13 YoY to an average of $1905unitmonth or $203 per square foot Class-A vacancy currently stands at 45 Class-B rents declined 10 to an average of $1591unitmonth or $173 per square foot Class-B vacancy currently stands at 31 Overall Class-A and Class-B apartment rents fell by a total of 11 YoY to an average of $1697unitmonth or $183 per square foot
Home prices have dropped slightly in Suburban Maryland after four consecutive years of positive growth The current median home sale price is $393000 The robust effect of the Amazon announcement has spilled over into Suburban Marylandrsquos housing market as a desirable and often more affordable option than Northern Virginia Much of Suburban Maryland multifamily properties remain within the ideal 30-minute commute from large employment drivers such as Amazon HQ2 and parts of Washington DC
Investment activity was highest in Suburban Maryland as $1222570000 traded in 13 sales in the first half of 2020 Value-Add product made up a majority of transaction volume at 61 while CoreCore-Plus accounted for the remaining 39 4017 Willard was the highest sale in terms of total volume and price per unit at $267500000 and $526667 per unit
BETHESDA ROW
NORTHLAKE
$310000
$320000
$330000
$340000
$350000
$360000
$370000
$380000
$390000
$400000
2014 2015 2016 2017 2018 2019 2020
Sub MD Median Home Sales Price
2020
$0
$500000000
$1000000000
$1500000000
$2000000000
$2500000000
$3000000000
2013 2014 2015 2016 2017 2018 2019 H1 2020
Sub MD Sales Volume
2018 20192016 20172014 20152013 H1 2020
4701 WILLARD
20
BALTIMORE METRO H1 2020
BALTIMORE METRO OVERVIEW
While the Baltimore metro is performing well compared to other metros across the country the region has seen the effects of the COVID-19 pandemic with impacts to employment transaction volume rent growth and absorption rates Over 172000 jobs were lost in greater Baltimore since Q2 2019 which is a 12 decrease in total nonfarm employment The June 2020 unemployment rate in the Baltimore metro is 80 which is a 450 bps increase from January 2020 Baltimore however is considered to be better positioned than other regions to weather the current economic downturn due to its impressive resilience in previous recessions In the Global Financial Crisis Baltimore ranked sixth in terms of GDP growth and ninth in payroll job growth across the nation
Just over 2400 units delivered in the Baltimore metro in H1 2020 and 2532 units are currently under construction The average rent in Baltimore is $1759unitmonth or $185 per square foot An aggregate of $506M in sales transacted across 13 sales CBRE brokered two of the three largest transactions in H1 2020 across the Baltimore metro
BALTIMORE METRO
21
BALTIMORE METRO H1 2020
382274copy 2020 CBRE Inc All rights reserved This information has been obtained from sources believed reliable but has not been verified for accuracy or completeness You should conduct a careful independent investigation of the property and verify all information Any reliance on this information issolely at your own risk CBRE and the CBRE logo are service marks of CBRE Inc All other marks displayed on this document are the property of their respective owners and the use of such logos does not imply any affiliation with or endorsement of CBRE
1
2
3
4
5
6
7
8
91 0
CATONSVILLE
ELKRIDGE
ELLICOTT CITY
LINTHICUM HEIGHTS
PIKESVILLE
RANDALLSTOWN
WOODLAWN
SEVERN
ARBUTUS
FERNDALE
LOCHEARN
MAYS CHAPEL
MILFORD MILL
OWINGS MILLS
REISTERSTOWN
DUNDALK
MIDDLE RIVER
PERRY HALL
RIVIERA BEACH
ROSEDALE
ESSEX
GLEN BURNIE
PARKVILLE
EDGEWOODJOPPA
CARNEY
GREEN HAVEN
OVERLEA
ROSSVILLE
JOPPATOWNE
BALTIMORE
295
24
924
100
29
1
70
83
83
195
97
895
95
95
395
695 95
BALTIMOREWASHINGTONINTL AIRPORT
MARTINSTATE
AIRPORT
2020 MID ATLANTIC MULTIFAMILY DELIVERIESBALTIMORE
sup1 0 15 3075
Miles
MULTIFAMILY DELIVERY
Leased 45Developer Sid Emmer
8 The View at Mill Run Phase IIUnits 157
Developer Greystar
7 Elan TowsonUnits 208
Leased 40Developer La Cite
6 CenterWest- Phase 1AUnits 262
Developer Klein EnterprisesManekin LLC
5 The WoodberryUnits 284
Leased 35Developer AvalonBay CommunitiesRetail Properties
3 Avalon TowsonUnits 371
Leased 7Developer Wood Partners
2 Alta Brewers HillUnits 371
Leased 4Developer Chesapeake Realty Partners
4 Avenue GrandUnits 324
Leased 36Developer Howard Hughes
1 Juniper - Merriweather DistrictUnits 380
Leased 67Developer Atlantic Realty
10 The MorrisonUnits 15
Leased 10Developer Zahlco
9 9 E Mount Royal StreetUnits 65
2020 DELIVERIES MAP
BALTIMORE METRO DELIVERIES
Deliveries picked up in Baltimore throughout 2020 with the addition of 2437 units throughout the metro equating to a 12 increase in total inventory More units delivered in the first half of 2020 than were delivered in all of 2019 The largest deliveries were Howard Hughesrsquo Juniper a 380-unit property as part of the Merriweather District in Columbia Wood Partnersrsquo Alta Brewers Hill a 371-unit property in Baltimore City and Avalonbay Communitiesrsquo Avalon Towson a 371-unit property in Towson There are currently 2532 units under construction that are expected to deliver in the next 24 months The average lease-up pace for properties in Baltimore is 15 units per month
Leased 36
Leased 7
Leased 35
Leased 4
Leased 34
Leased 40
Leased 19
Leased 45
Leased 10
Leased 67
Source Yardi Matrix 2020 Source Axiometrics 2020
22
BALTIMORE METRO H1 2020
Job Growth YoY EMPLOYMENT
$506028000SALES IN H1 2020
2913 UNITSSOLD IN H1 2020
14 PROPERTIES
10000
8000
6000
4000
2000
0
7
6
5
4
3
2
0
VacancyUnits
Delivered Baltimore Metro Summary
Deliveries Net Absorption Vacancy
Year
DEVELOPMENTBALTIMORE METRO BY THE NUMBERS
500
$1759
2532 UNITSUNDER CONSTRUCTION
2437 UNITSDELIVERED IN 2020
STABILIZED VACANCY
PIPELINE
TOTAL AVG RENTS
Source CBRE Research Axiometrics and Delta Associates
As of June 30 2020
PER UNIT PER MONTH
6906 UNITS36-MONTH PIPELINE
Deliveries in Baltimore picked up with an additional 2437 units in H1 2020 Just under 2000 units were absorbed in the past 12 months most of them before the beginning of 2020 which has caused vacancy to increase in H1 2020 Across the Baltimore metro vacancy increased 80 bps to 50 In the Baltimore Suburbs vacancy stands at 44 up 10 bps YoY and in Baltimore city vacancy is 66 up 290 bps YoY
During the recent downturn Baltimore experienced a loss of 172500 jobs The most impacted sector was Leisure and Hospitality in which 45 of employees were furloughed or laid off Education and Health Services also took a loss of 30800 jobs Federal Government and Mining Logging and Construction were the only industries to see job growth with an increase of 800 employees and 3300 respectively The spike in Mining Logging and Construction may have been the result of the emergency expansion of Baltimorersquos hospitals and uninterrupted construction at existing development sites At the start of 2020 Baltimorersquos unemployment rate was 35 and is currently 95 There are currently 1253600 nonfarm employees in the Baltimore metro
CAPITAL MARKETS
$185PER SF PER MONTH
09RENT GROWTH
NORTHERN SUBURBS
-010SOUTHERN SUBURBS
-50000 -30000 -10000 0 10000-70000 -60000 -50000 -40000 -30000 -20000 -10000 0 10000
H2 2020 Baltimore Employment
2015 2016 2017 2018 2019 2020 2021 2022 2023 2024 20250
1
2
3
4
5
6
7
-2000
0
2000
4000
6000
8000
10000
Vacanc
y ()
Units
Rentable Completions(Units)
Net Absorption(Units)
Vacancy Rate(Avg )
StateLocal Government
Federal Government
Other Services
Leisure and Hospitality
Education and Health Services
Professional and Business Services
Financial Activities
Information
Retail Trade
Wholesale Trade
Trade Transportation and Utilities
Manufacturing
Mining Logging and Construction
Forecast
23
BALTIMORE METRO H1 2020
BALTIMORE METRO HOME PRICES
Property Year Built Sold Price Units $Unit
Townes at Holly Station 1985 042320 $115000000 510 $225490
Chatham Gardens 1980 041720 $83280000 414 $201159
The Point at Elkridge 1988 032720 $72500000 312 $232372
BLVD at White Springs 1977 040820 $61099000 459 $133113
Old Orchard 1986 041720 $33179940 180 $184333
LARGEST SALESBALTIMORE METRO MULTIFAMILY SALES VOLUME
Submarket Avg $UnitMo Avg $SFMo Vacancy
Annapolis $1749 $198 49
Baltimore City East $1434 $179 55
Baltimore City North $1095 $135 69
Baltimore City West $996 $125 41
ColumbiaNorth Laurel $1643 $170 44
Downtown Baltimore $1548 $189 85
Ellicott CityElkridge $1609 $167 47
Far North Baltimore Suburbs $1310 $136 29
Northeast Anne Arundel County $1374 $157 42
Northwest Anne Arundel County $1720 $172 51
Owings MillsPikesvilleRandallstown $1365 $132 45
ParkvilleCarneyPerry Hall $1164 $135 36
Southeast Baltimore County $1097 $132 38
Southwest Baltimore County $1172 $131 45
TowsonHunt Valley $1390 $140 53
RENTAL RATES - ALL PRODUCT TYPES
$3000000000
$2500000000
$2000000000
$1500000000
$1000000000
$500000000
$0
2014 2015 2016 2017 2018 2019
$255000
$250000
$245000
$240000
$235000
$220000
$205000
Rent growth in the Baltimore metro remained largely flat since June 2019 The Northern Baltimore Suburbs experienced 09 rent growth the Southern Baltimore Suburbs experienced a drop of 01 rent growth and Baltimore City rents fell by 30 The Baltimore suburbs outpaced Baltimore City in terms of rent growth and absorption Current vacancy in the Baltimore metro is 50 with the highest vacancies in Downtown Baltimore at 85 Baltimore City North at 69 and Baltimore City East at 55 According to Delta Reports the Howard CountyColumbia submarket fared the best in the metro with 27 YoY rent growth
Home values in the Baltimore metro increased 20 YoY up slightly from the five-year average growth rate of 15 The current median sales price in the Baltimore metro is $251000 Single-family homes in Baltimore County posted a 10-year high median sale price of $330000 This is a 6 YoY increase from June 2019 Homes in Baltimore City also posted a 10-year high median sale price of $238000 Of note Owings Mills experienced a 27 YoY increase in median home value for an average of $415000
Investment activity reached $506M in the Baltimore metro during the first two quarters of 2020 in 14 transactions All but one sale was value-add product The highest sales in terms of price per unit were Point at Elkridge a 312-unit property in Elkridge which sold for $232400 per unit and Townes at Holly Station a 510-unit property in Waldorf which sold for $225500 per unit CBRE brokered both sales
TOWNES AT HOLLY STATION
$215000
$220000
$225000
$230000
$235000
$240000
$245000
$250000
2014 2015 2016 2017 2018 2019
Baltimore Metro Median Sale Price
$0
$500000000
$1000000000
$1500000000
$2000000000
$2500000000
$3000000000
2013 2014 2015 2016 2017 2018 2019 H1 2020
Balitmore Metro Sales Volume
2018 20192016 20172014 20152013 H1 2020
$210000$215000$220000$225000$230000$235000$240000$245000$250000$255000
2014 2015 2016 2017 2018 2019 2020
Baltimore Metro Median Sale Price
2020
24
FOR SALES OR FINANCING INFORMATION CONTACT
William S RoohanVice Chairman(O) +1 410 244 3122(M) +1 443 690 6967billroohancbrecom
Michael E MuldowneyExecutive Vice President(O) +1 410 244 3144(M) +1 443 250 3144mikemuldowneycbrecom
Robert G Dean IIISenior Vice President(O) +1 202 585 5766(M) +1 202 578 6941robertdeancbrecom
Jonathan M GreenbergSenior Vice President(O) +1 703 734 4772(M) +1 202 423 6655jonathangreenbergcbrecom
Martha A HastingsSenior Vice President(O) +1 410 244 3162(M) +1 410 807 2450marthahastingscbrecom
Brian H MargerumSenior Vice President(O) +1 410 244 3135(M) +1 443 386 1096brianmargerumcbrecom
Michael D RudolphSenior Vice President(O) +1 410 244 3121(M) +1 443 928 0392michaelrudolphcbrecom
John T Sheridan JrSenior Vice President(O) +1 703 905 0239(M) +1 703 200 7720johnsheridancbrecom
Yalda G HowellFirst Vice President(O) +1 202 585 5677(M) +1 240 462 2332yaldaghamariancbrecom
Thomas B LeachmanVice President(O) +1 202 585 5638(M) +1 240 688 0189thomasleachmancbrecom
Kemp D BroujosSenior Associate(O) +1 202 585 5724(M) +1 443 786 2951kempbroujoscbrecom
Nathan E BarthAssociate(O) +1 703 905 0228(C) +1 703 340 6828nathanbarthcbrecom
Zachary L StoneSales Assistant(O) +1 202 585 5650 (M) +1 202 713 8404zachstonecbrecom
Investment Sales amp Brokerage
Operations amp Marketing
Debt amp Structured Finance Team
Patricia C BonebrakeSenior Director of Operations(O) +1 410 244 3141(C) +1 443 253 5917trishbonebrakecbrecom
Jennifer W BusseyOperations Manager(O) +1 410 244 3134(C) +1 410 300 1302jenniferbusseycbrecom
Cheryl FinlaysonProductions Systems Manager(O) +1 410 244 7100(C) +1 410 244 3101cherylfinlaysoncbrecom
Margaret O MacleayOperations Supervisor(O) +1 202 585 5638(C) +1 410 562 9340maggiemacleaycbrecom
Rachel L MossmanSenior Communications Specialist(O) +1 410 244 3179(C) +1 410 244 7100rachelmossmancbrecom
Samantha S FifieldSales Assistant(O) +1 202 585 5773(C) +1 310 266 0003samanthafifieldcbrecom
Caroline P LekakosClient Services Coordinator(O) +1 202 585 5606(C) +1 240 595 0642carolinelekakoscbrecom
Yasmeen F ShararaClient Services Coordinator(O) +1 202 585 5580(C) +1 301 828 7435yasmeenshararacbrecom
Lauren E SpielmanClient Services Coordinator(O) +1 410 244 3129(C) +1 443 800 4388laurenspielmancbrecom
Grace F TrimbleClient Services Coordinator(O) +1 410 244 3123(C) +1 410 499 1064gracetrimblecbrecom
David F WebbVice Chairman(O) +1 202 585 5721(M) +1 202 744 4900davidwebbcbrecom
Maximiliane T LeachmanExecutive Vice President(O) +1 202 585 5655(M) +1 404 358 4317maxileachmancbrecom
Justin J GlasgowSenior Vice President(O) +1 202 783 1723(M) +1 202 316 1804justinglasgowcbrecom
RESEARCH TEAM
JEANETTE I RICE Americas Head of Multifamily Research (O) +1 214 979 6169
(C) +1 817 412 0709 jeanettericecbrecom
MOLLY M HUNT Research Analyst (O) +1 202 585 5597(C) +1 415 599 6009 mollyhuntcbrecom
RANK
1Fortune Magazinersquos
Most Admired Commercial Real Estate
Firm
REPUTATION
2Ranked the 2
Multifamily Brokerage Team in the entire nation by
Real Estate Forum
THE CBRE TEAM COMPETITIVE ADVANTAGE
25
RESOURCES
26Largest team and most
capacity in the Mid-Atlantic region
EXPERIENCE
$174B+The aggregate sales
value of deals our team has brokered since
2015
DEBT TEAM
1The CBRE Debt amp
Structured Finance Team is the 1 Freddie Mac
SellerServicer
copy Copyright 2020 All rights reserved Information contained herein including projections has been obtained from sources believed to be reliable but has not been verified for accuracy or completeness CBRE Inc makes no guarantee warranty or representation about it Any reliance on such information is solely at your own risk This information is exclusively for use by CBRE clients and professionals and may not be reproduced without the prior written permission of CBRErsquos Global Chief Economist CBRE and the CBRE logo are service marks of CBRE Inc andor its affiliated or related companies in the United States and other countries All other marks displayed on this document are the property of their respective owners Photos herein are the property of their respective owners Use of these images without the express written consent of the owner is prohibited
WASHINGTON DC1900 N Street NW
Suite 700 Washington DC 20036
+1 (202) 783 8200
BALTIMORE MD100 East Pratt Street
Suite 1700Baltimore MD 21202+1 (410) 244 7100
TYSONS VA1861 International Drive
Suite 300McLean VA 22102+1 (703) 821-6900

3
TAB
LE O
F CO
NTE
NTS
Executive Summary PG 4
Resilience Proven in Prior Recessions
PG 5
Outlook PG 6
The District PG 8
Northern Virginia PG 12
Suburban Maryland PG 16
Baltimore PG 20
Contacts PG 24
TAB
LE O
F CO
NTE
NTS
Executive Summary PG 4
Resilience Proven in Prior Recessions
PG 5
Outlook PG 6
The District PG 8
Northern Virginia PG 12
Suburban Maryland PG 16
Baltimore PG 20
Contacts PG 24
3
4
BALTIMORE
NORTHERN VIRGINIA
WASHINGTON DC
MID-ATLANTIC MULTIFAMILY MARKET
EXECUTIVE SUMMARYThe Mid-Atlantic region began 2020 on a great notemdashpositive rent growth across all markets prolific development activity and high transaction volumes All of a sudden in mid-March COVID-19 shook the nation We are now experiencing the effects of the pandemic on multifamily operations and transaction velocity However several early signs indicated that the Mid-Atlantic would fare well compared to other large metros and indeed it has Historically the Washington DC metro is recognized as the most risk-averse employment base due to its low employment rates in industries such as Leisure amp Hospitality and Retail Additionally the federal government and local federal spending has provided a unique degree of insulation to the regional economy Intellectual capital has also been rich within the region a large supply of highly educated talent bolsters the strong cyber security biotech bio-sciences defense and technology industries in the Mid-Atlantic
While the Mid-Atlantic multifamily market was impacted by the pandemic it has shown its continued resilience in the face of unprecedented market volatility In Q2 2020 across national Tier II markets the Baltimore metro was ranked first and second in the nation in terms of rent growth and lowest vacancy change respectively Vacancy in the Baltimore metro increased by only 80 bps and rent growth held steady Across national Tier I markets the Washington DC metro experienced similar success as it ranked fourth in the nation in terms of rent growth and lowest vacancy change The Washington DC metro experienced a 90 bps increase in vacancy and a 23 decrease in overall rents which compared to the rest of the nation is quite favorable Net absorption in the Washington DC metro as a percentage of total inventory was the second highest in the nation across large metros and the only gateway market to make it to the top 20 across all national markets
Although job losses across the country were substantial the Baltimore and Washington DC metros fared well on a national scale The Washington DC metro saw fewer job losses than any other large metro in the country likely due to federal government activity in response to the pandemic In June out of 51 MSArsquos Baltimore ranked 8th in the nation for the lowest unemployment rate at 80 and Washington DC followed close behind in 10th place at 84 unemployment In recent years the Mid-Atlantic economy has become more diversified with tech education and private business on the rise Additionally while sequestration reduced the footprint of the federal government and its presence in the region it has grown in recent months and played an integral role in keeping workers employed and stimulating the economy
The Washington DC metro will continue to see an influx of supply with an estimated 15150 units delivering in the next 12 months Construction has not slowed since the start of the year and over 3300 units began construction in the second quarter of 2020
As a result of the pandemic data suggests that renters are now favoring properties in lower density areas In the Washington DC metro rent growth in low-rise apartments outperformed rent growth in high-rise apartments by 21 In the Baltimore metro the lower-density suburbs saw only a slightly negative growth rate of 10 bps while Baltimore City rents fell 30
SUBURBAN MARYLAND
Baltim
ore-
Was
hingt
on Pa
rkway
MID-ATLANTIC MULTIFAMILY MARKET
Risk-Averse Employment Base
Mid-Atlantic Resilience
Urban to Suburban Migration
5
During previous recessions the Mid-Atlantic anchored by Washington DC and Baltimore proved to be the most resilient region in the country due to its diversified economy strong market drivers and the presence of the nationrsquos largest employermdashthe federal government The stability and dynamism of the regionrsquos economy underpins its resilient multifamily real estate market fundamentals
EXECUTIVE SUMMARY
bull Minimal Vacancy Change DC and Baltimore were ranked 3 and 5 respectively in terms of least amount of change in vacancy across the country during the 2008 recession at an average increase of only 150 bps
bull Most Stable Rents in the Nation Baltimore and DC ranked 1 and 2 respectively for least impacted rent growth in the nation and recovered in just six quarters compared to a national average of 12 quarters The regionrsquos peak-to-trough rent change was a mere 2 during the previous recessionmdashlower than the nearly 6 national average
bull Prolific Investment Market Since recovery in 2010 DCrsquos and Baltimores per unit increased by an average of 6 and 4 respectively as investors remain bullish on the region as a powerhouse center of the East Coast
bull Durability of Employment Base DC and Baltimore have historically lower unemployment rates compared to the US The strong and prominent labor markets of ldquoEds and Medsrdquo biotech and government are some of the most resilient industries through recessions Tech has also proven to be a pillar of the economy with significant future growth centered around the establishment of Amazonrsquos new HQ2 Washington is ranked 1 for lowest percentage of at-risk employment segments in the current downturn
These strong economic drivers will bolster the multifamily market drive demand and lead the region towards future growth
MID-ATLANTIC MULTIFAMILY MARKET
RESILIENCE PROVEN IN PREVIOUS RECESSIONS
0
2
4
6
8
10
01234567
Va
can
cy
Recession
Washington DC
Baltimore
Tech Boom
Tech Bust Post 911 RecessionPost Global Financial Crisis
Recovery Forecast
Atlanta
Baltimore
BostonChicagoDallasFt Worth
Denver
Detroit
Houston
Inland Empire
Long Island
Los Angeles
Miami
Minneapolis
New York CityOaklandOrange County
Orlando
Philadelphia
Phoenix
San Diego
San Francisco
Seattle
St Louis
Tampa
US
Washington DC
-16
-14
-12
-10
-8
-6
-4
-2
0
100 150 200 250 300 350
Rent
Chan
ge (
)
Vacancy Change (Bps)
Least Severe Downturn
Most Severe Downturn
METRO MARKET RENT amp VACANCY CHANGE IN LAST DOWNTURN
WASHINGTON DC amp BALTIMORE METROSrsquo VACANCY
CLICK HERE TO READ THE FULL REPORT ON CBRErsquoS
RESEARCH GATEWAY
-4
-2
0
2
4
6
8
10
Q12008
Q32008
Q12009
Q32009
Q12010
Q32010
Q12011
Q32011
YoY Re
nt Grow
th
Class A Class B Class C National
DC METRO YOY AVERAGE RENT GROWTH
-4
-2
0
2
4
6
8
10
Q12008
Q32008
Q12009
Q32009
Q12010
Q32010
Q12011
Q32011
YoY Re
nt Gr
owth
Class A Class B Class C National
BALTIMORE METRO YOY AVERAGE RENT GROWTH
OUTLOOKThe Mid-Atlantic is a booming market for millennials empty nesters and many others to live work and play in There are some challenges for developers investors and property managers in the short-term but the long-term future is bright The regionrsquos economy has strong fundamentals bolstered by the largest employer in the nation the federal government
Vacancy IncreasesWhile the Mid-Atlantic has performed at the top of the nation overall vacancy has increased in Washington DC and Baltimore by 90 bps and 80 bps respectively since Q2 2019 Unemployment and increased work from home flexibility have caused residents to consider alternative housing to save money on rent
High Rent CollectionsRent collections across the nation have been substantially higher than expectations in H1 2020 The National Multifamily Housing Council reported that 930 and 922 of residents paid rent across the nation in May and June respectively Approximately 940 of Washington DC residents paid rent in April and 892 of Baltimore residents paid rent in May
ADVANTAGES AND CHALLENGES FOR THE MULTIFAMILY INVESTORDEVELOPER
ADVANTAGES CHALLENGES
The Success of Virtual ToursVirtual tours have become the new normal for leasing offices in the Mid-Atlantic The per-project lease up rate in Washington DC is 14 units per month down only one unit from Q2 2019 In the Baltimore metro there are currently 18 projects in lease up with an average absorption rate of 15 units per project per month
Growing Tech TalentWashington DC has risen to the No 2 spot on CBRErsquos annual tech talent report coming in as the runner-up to the San Francisco Bay Area Washington has over 263000 tech workers and has experienced 10 growth since 2015 However Washington DCrsquos average apartment asking rate is ranked 8th in the nation indicating that it is one of the most affordable areas with the highest concentration of tech talent in the nation This growing labor market in high paying industries will continue to drive wages up and increase demand for Class-A and Class-B multifamily product
Click here to read CBRErsquos July 2020 Tech Talent Report
Significant PipelineThe Mid-Atlantic region will continue to see an influx of supply over the next few years Washington DC will experience an estimated increase of 15150 units in the next 12 months Construction has not slowed since the start of the year and over 3300 units began construction in the second quarter of 2020 In Baltimore 2437 units delivered in H1 2020 and 6906 units are on track to deliver in the next 36 months Developers are optimistic about future deliveries in 2021 with an expected market recovery that will renew demand
MID-ATLANTIC MULTIFAMILY MARKET
6
Eviction MoratoriumsThe Washington DC Councilrsquos emergency measures to respond to the pandemicrsquos economic impacts included a freeze on evictions and a prohibition on rent increases through October 2020 In Northern Virginia eviction freezes were extended to September 8 2020 In Maryland there are currently no eviction restrictions
MID-ATLANTIC H1 2020 ACCOLADES
bull Washington DC metro saw fewer YoY job losses than any other large metro in the country
bull Baltimore (80) and Washington DC (84) are ranked 8th and 10th for lowest unemployment rate across the largest 51 US metros
bull Washington DCrsquos net absorption as a percentage of total inventory was the second highest in the nation for large metros
bull Across Tier II markets Baltimore ranked first and second in the nation in terms of rent growth and lowest vacancy change
bull Across Tier I markets Washington DC ranked fourth in the nation in terms of rent growth and lowest vacancy change
bull Washington DC ranked 1 most risk-averse metro for employment base in the recent downturn
bull Washington DC ranked second in the nation in CBRErsquos Scoring Tech Talent report and has seen 10 industry growth since 2015
7
MID-ATLANTIC MULTIFAMILY MARKET
STRENGTH OF MULTIFAMILY INVESTMENTS
DEBT MARKETSDebt for multifamily investments is available at historic levels Interest rates are at all-time lows and offer multi-year interest-only periods These low-rate interest-only loans allow investors to achieve as high cash-on-cash leveraged returns as they have ever been able to achieve in the multifamily market and have helped to maintain low cap rates Currently attractive debt is available and equity is plentiful which typically means that private capital buyers have strong appetites There is a consensus among investors that multifamily as a need-based asset type remains a safe investment given the ubiquitous need for housing
While the CMBS markets have shown some distress the agency loan market has remained active Through the COVID-19 pandemic the GSEs have stepped up to fulfill their mission of providing liquidity to the multifamily market While their rates are at historically low levels they have increased their reserve requirements to protect themselves against current of future renterrsquos inability to make rent payments as a result of the pandemic These reserve requirements are sized to six months and are released to the owner once the property has maintained certain occupancyrental income requirements for a period post-closing and in the case of Freddie Mac once the emergency declarations andor stay at home orders have been lifted at the federal and local level These reserves typically amount to between 3 to 6 of the loan amount and most borrowers are willing to accept these requirements given the benefit of locking in sub 3 interest only long term debt As conditions stabilize or if a borrower is seeking relatively low leverage the requirement for debt service escrow is likely to mitigate or go away
AMAZON HQ2Amazonrsquos HQ2 is a generational market catalyst for employment and rent growth The new headquarters in Crystal City is slated to create 37000+ direct jobs over the next 14 years Amazon HQ2 is expected to occupy over 4M SF of office space accounting for 33 of Crystal Cityrsquos existing office inventory The expected average annual salaries of $150000 for Amazon employees could support apartment rents of more than $3750 per month As of Q2 2020 Amazon has already hired over 1000 employees It is estimated that Amazon will bring 1200 employees in 2020 and an additional 2000 employees in 2021 By 2023 when the two-million square foot campus near Pentagon City opens Amazon will employ over 5000 employees at HQ2 The second phase of construction will continue for several years with a full build-out of over 4M SF in the newly termed submarket ldquoNational Landingrdquo Amazon has received approximately $752M in subsidies for job creation from the state of Virginia and Arlington County Multifamily communities proximate to HQ2 are already experiencing significant rent growth As residents are priced out of Arlington County increased demand will radiate throughout Northern Virginia as residents seek a discount to in-fill Northern Virginia
The Amazon ldquoMultiplier EffectrdquoAmazon will not only draw entrepreneurs to the area but will also serve as a hub for startups and a magnet for venture capital within the greater DC MSA An infusion of new jobs to any region creates what economists call the ldquomultiplier effectrdquo The multiplier effect implies that Amazonrsquos 37000 employees could increase to as many as 185000+ indirect jobs and ldquomultiplyrdquo outwards
25000-35000 new STEM degrees over the next 20 years from the new $1B Virginia Tech Innovation Campus
Demand for an additional 40000-60000 rental units as a result of the ldquoAmazon Effectrdquo
THE DISTRICT
NORTHERN VIRGINIA
SUBURBAN MARYLAND
8
WASHINGTON DC H1 2020
WASHINGTON DC OVERVIEW
The District is experiencing negative effects of the COVID-19 pandemic with drops in rent absorption and rising vacancy throughout the apartment market The average monthly Class-A rent fell 35 YoY to a monthly average of $2561 per unit per month or $327SF The average Class-B rent fell 27 to an average of $2067unitmonth or $274SF
Just over 3000 units across the city delivered in the first half of 2020 and 12969 units are currently under construction Capitol Riverfront emerged as the leading submarket in terms of development activity with a 1475-unit increase with the delivery of The Estate The Kelvin Parc Riverside Phase I Meridian on First and The Maren Multifamily capital markets finished H1 2020 with $292860000 sold throughout the District over 9 sales The COVID-19 pandemic has slowed investment activity significantly as investors weather the storm of economic volatility Comparatively in the first half of 2019 over $685000000 transacted over 30 sales
THE DISTRICT
9
WASHINGTON DC H1 2020
2020 DELIVERIES MAP
THE DISTRICT DELIVERIES
Over 3000 units delivered to the District in H1 2020 accounting for a 21 increase to the total multifamily housing inventory The pipeline continues on a steady upward trend and will not slow until late 2022 There are currently 12696 units under construction that will increase the total multifamily inventory by 88 over the next two years
NoMa H Street Corridor Union Market and Capitol Riverfront are the most active submarkets in terms of development activity These growing areas continue to deliver Class-A luxury apartment buildings in areas that are also seeing retail and office space developments
382274copy 2020 CBRE Inc All rights reserved This information has been obtained from sources believed reliable but has not been verified for accuracy or completeness You should conduct a careful independent investigation of the property and verify all information Any reliance on this information issolely at your own risk CBRE and the CBRE logo are service marks of CBRE Inc All other marks displayed on this document are the property of their respective owners and the use of such logos does not imply any affiliation with or endorsement of CBRE
1
2
3
4
5 6
7
8
9
1 0
1 1
WASHINGTON
295
5050
695
395
395
395
Rhode Island Ave NE
Virginia Ave NW
Rhode Island Ave NW
H St NE
Min
neso
taAv
eN
E
Q St NW
Potomac Ave SE
11
th S
t S
E
Minnesota Ave SE
13
th S
t N
W
13
th S
t N
E
Pennsylvania Ave SE
3rd
St
NW
So
uth
Ca
pit
ol
St
12
thS
tS
W
Florida Ave NE
9th
St
SW 7th
St
SW
9th
St
NW
Pennsylvania Ave NW
Tenn
esse
eAv
eN
E
E Capitol St SE
US-1N
6th
St
NE
Massachusetts Ave NW
US-
1S
4th
St
NE
Independence Ave SE
14
thS
tS
W
Mt Olivet Rd NE
Constitution Ave NW
KentuckyAve
SE
9th
StN
E
Benning Rd NE
6th
St
SE
7th
St
NW
K St NW
Bra
nch
Ave
SE
6th
St
NW
New
Ham
pshi
re A
ve N
W
L St NW
E Capitol St NE
No
rth
Ca
pit
ol
St
14
th S
t N
W
North Carolin
a Ave SE
D St SW
9th
St
SE
22ndSt
NE
Texas AveSE
16
th S
t N
W
B St SE
2n
d S
t N
E
D St SE
21
stSt
NE
8th
St
SE
Maine
Ave
SW
12
th S
t S
E
Kenilw
orthAve
NE
M St SW
I St SE
Bryant St NW
19
th S
t N
W
17
th S
t N
W
11
th S
t N
E
Florida Ave NW
Maryland Ave NE
15
th S
t N
W
4th
St
SE
U St NW
M St NW
M St SE
RidgeRd
SE
Independence Ave SW
H St NW
C St NE
R St NW
2020 MID ATLANTIC MULTIFAMILY DELIVERIESWASHINGTON DC
sup1 0 025 05013
Miles
MULTIFAMILY DELIVERY
Leased 23Developer CAS RieglerEB5
8 BlackbirdUnits 167
Leased 7Developer FRP DevelopmentMRP Realty
7 The MarenUnits 264
Leased 6Developer Paradigm Development
6 Meridian on First IUnits 273
Leased 11Developer Toll Brothers
5 Parc Riverside Phase IIUnits 308
Leased 39Developer Brookfield Properties
3 The EstateUnits 320
Leased 43Developer RappaportWC SmithEB5
2 AvecUnits 420
Leased 36Developer Jair LynchMacFarlane Partners
4 The KelvinUnits 310
Leased 28Developer JBG SmithMRP Realty
1 The WrenUnits 433
Leased 4Developer Jefferson Apt GroupStars Investment
10 J LineaUnits 132
Leased 17Developer JBG Smith
9 901WUnits 161
Leased 42Developer Coba
11 1714-1716 14th Street NWUnits 8
Leased 28
Leased 43
Leased 39
Leased 36
Leased 11
Leased 6
Leased 7
Leased 23
Leased 17
Leased 4
Leased 42
10
-60000 -50000 -40000 -30000 -20000 -10000 0 10000
Q2 2020 DC Employment
WASHINGTON DC H1 2020
Job Growth YoY
-50000 -40000 -30000 -20000 -10000 0 10000
StateLocal Government
Federal Government
Other Services
Leisure and Hospitality
Education and Health Services
Professional and Business Services
Financial Activities
Information
Retail Trade
Wholesale Trade
Trade Transportation and Utilities
Manufacturing
Mining Logging and Construction
EMPLOYMENT
CAPITAL MARKETS
$292860000SALES IN H1 2020
845 UNITSSOLD IN H1 2020
9 PROPERTIES
Deliveries Net Absorption Vacancy
Year
DEVELOPMENTDC BY THE NUMBERS
61
$2561
12696 UNITSUNDER CONSTRUCTION
3004 UNITSDELIVERED IN 2020
STABILIZED VACANCY
PIPELINE
CLASS A AVG RENTS
CLASS B AVG RENTS
Source CBRE Research and Delta Associates
As of June 30 2020
PER UNIT PER MONTH
18907 UNITS36-MONTH PIPELINE
Recent deliveries in the District were concentrated primarily in the Capitol Riverfront and H Street submarkets NoMa and Union Market also remain top submarkets for development activity with around 3483 units under construction on-track to deliver in the next 24 months Annual absorption in the District was 25 lower than a year ago as 2003 units absorbed in the first half of the year Q2 stabilized vacancy rate in the District is 61 a 250 bps increase from the previous year The average lease-up pace of new product in the District is 14 units per month and concessions average 15 months free rent
Insulated by the federal government Washington DC has fared favorably thus far in the downturn compared to other large metros across the nation The District experienced 67000 job losses which represents an 8 YoY loss in employment Leisure and Hospitality suffered the biggest job loss as 60 of the workforce was laid off or furloughed Promisingly government information and other services were the only industries to experience job growth albeit small
PER SF PER MONTH$327
$2067PER UNIT PER MONTH
PER SF PER MONTH$274
7000
6000
5000
4000
3000
2000
1000
0
8
7
6
5
4
3
2
1
0
VacancyUnitsDelivered
Washington DC Summary
2013 2014 2015 2016 2017 2018 2019 2021 2022H22020
H12020
00
10
20
30
40
50
60
70
80
90
0
1000
2000
3000
4000
5000
6000
7000
2013 2014 2015 2016 2017 2018 2019 H1 2020 H2 2020 2021 2022
Vaca
ncy
Units
Deliveries Net Absorption Vacancy
Forecast
11
WASHINGTON DC H1 2020
WASHINGTON DC HOME PRICES
Property Year Built Price Sold Units $Unit
The Woodley 2014 $180250000 010820 212 $850235
Skyline Apartments 1965 $58700000 030120 398 $147487
Glenwood Apartments 1942 $13700000 013020 90 $152222
The Waring 1909 $8400000 063020 24 $328947
The Regent 1937 $8450000 063020 12 $228378
LARGEST SALESDC MULTIFAMILY SALES VOLUME
$2000000000
$1500000000
$1000000000
$500000000
$02018 20192016 20172014 20152013
THE SHELBY
Class A High-Rise Avg $UnitMo
Avg $SFMo Vacancy YoY Rent Change
Upper NW $2810 $347 50 -06
Central $2822 $345 51 -46
Columbia HeightsShaw $2663 $363 64 -21
NoMaH Street $2290 $302 82 -57
Capitol HillRiverfrontSouthwest $2583 $325 77 -33
Northeast $2092 $266 85 -07
Upper Georgia $2183 $281 53 06
Class B Mid-and High-Rise Avg $UnitMo
Avg $SFMo Vacancy YoY Rent Change
Upper Northwest $2104 $258 43 -26
Mount Vernon Square NW $1925 $291 76 -74
Southwest $2085 $289 30 -04
RENTAL RATES
The District experienced broad rent decreases across almost all submarkets with the exception of Upper Georgia The Northeast and NoMaH Street submarkets have the highest Class-A High-Rise vacancy at 85 and 82 respectively This is in part due to an influx of new deliveries to those markets Class-B vacancy currently stands at 45 and concessions are at 30 of face rent The Mount Vernon Square submarket has the highest Class-B Mid and High-Rise vacancy at 76 and the highest decline in rent growth at -74 Class-A and Class-B apartments rents fell by a total of 33
The current average home value in the District is $586000 While home values grew in 2020mdashseeing an average annual increase of 70mdashhome values in the District have increased on average 30 YoY since 2015
A total of $2929M multifamily sales transacted in the District in nine sales in the first two quarters of 2020 CoreCore-Plus transactions made up for 71 of transactions and Value-Add transactions made up for the remaining 29 of total sales volume The highest sales in terms of price per unit were The Woodley a 212-unit property in Woodley Park at $850235 per unit and The Shelby a 24-unit property in Dupont Circle at $350000 per unit both of which were brokered by CBRE The Woodley was also the largest sale in H1 2020 across the District at $18025M
$0
$500000000
$1000000000
$1500000000
$2000000000
2013 2014 2015 2016 2017 2018 2019 H1 2020
DC Sales Volume
H1 2020
$600000
$500000
$400000
$300000
$200000
$100000
2014 2015 2016 2017 2018 2019$0
$100000
$200000
$300000
$400000
$500000
$600000
2014 2015 2016 2017 2018 2019 2020
DC Home Prices
2020
12
NORTHERN VIRGINIA H1 2020
NORTHERN VIRGINIA
NORTHERN VIRGINIA OVERVIEW
Northern Virginia continues to be the fastest growing region in the DC metro The regionrsquos economic future has been bolstered by Amazonrsquos decision to build its HQ2 in National Landing Amazon selected Northern Virginia because of its inherently strong fundamentals including a rich pipeline of talent provided by numerous universities in the area Amazon has subsequently begun the first phase of its hiring process and build-out at National Landing including hiring over 1000 white-collar employees and moving into 300000 SF of office space The delivery of HQ2 is expected to add 40000 to 60000 units of additional apartment demand to the area in the next decade A typical Amazon HQ2 worker will make $150000 per year which allows for up to $3750 in monthly rent Additionally Virginia Tech is moving forward with its plans to build the $1 Billion Innovation Campus in Potomac Yard The introduction of these two strong economic drivers will continue to further diversify the job base and incentivize more businesses to move to all areas of the DC metro where a pipeline of talent awaits
$400000
$450000
$500000
$550000
$600000
2014 2015 2016 2017 2018 2019
DC Home Prices
13
NORTHERN VIRGINIA H1 2020
2020 DELIVERIES MAP
NORTHERN VA DELIVERIES
Just under 4000 new units delivered in H1 2020 across Northern Virginia accounting for a 16 increase in total volume There are currently 10135 units under construction which will add 4 to the inventory over the next 24 months The largest deliveries in the region include Perseus Realtyrsquos The Foundry a 525-unit property in Alexandria Saul Centersrsquo Waycroft a 490-unit property in BallstonVirginia Square Wash REITrsquos The Trove a 401-unit property in Columbia Heights Arlington and Combined Propertiesrsquo Scout on the Circle a 400-unit property in Fairfax
382274copy 2020 CBRE Inc All rights reserved This information has been obtained from sources believed reliable but has not been verified for accuracy or completeness You should conduct a careful independent investigation of the property and verify all information Any reliance on this information issolely at your own risk CBRE and the CBRE logo are service marks of CBRE Inc All other marks displayed on this document are the property of their respective owners and the use of such logos does not imply any affiliation with or endorsement of CBRE
1
2
45
6
7
8
9
1 0
1 1
1 2
LORTON
MANASSAS
WOODBRIDGE
FORT HUNTNEWINGTON
LAKE RIDGE
CENTREVILLE
HERNDON
MANASSAS PARK
RESTON
STERLING
CHANTILLY
FAIRFAX STATION
ANNANDALE
BETHESDA
BURKE
FAIRFAX
FALLS CHURCH
NORTH BETHESDA
TYSONS CORNER
VIENNA
POTOMAC
MCLEAN
OAKTON
SPRINGFIELD
GROVETON
IDYLWOOD
JEFFERSON
LINCOLNIA
WEST SPRINGFIELD
WOLF TRAP
ADELPHI
BELTSVILLE
BOWIE
CALVERTON
CAMP SPRINGS
CLINTON
COLLEGE PARK
FORESTVILLE
GREENBELT
HILLCREST HEIGHTS
HYATTSVILLE
LANHAM
ROSARYVILLE
GLENN DALE
CORAL HILLS
EAST RIVERDALE
KETTERING
WASHINGTON201
267
28295
295
381
110
5
50
29
301
695
66
270
495
395
95
495
495
495
95
WASHINGTONDULLES INTL
AIRPORT
RONALD REAGANWASHINGTON
NATL ARPT
POTOMACAIRFIELD
FREEWAYAIRPORT
COLLEGE PARK AIRPORT
2020 MID ATLANTIC MULTIFAMILY DELIVERIESNORTHERN VIRGINIA
sup1 0 2 41
Miles
MULTIFAMILY DELIVERY
Leased 20Developer Novare Group Mulberry Development Group
8 Cameron SquareUnits 302
Leased 22Developer Praedium Group
7 The ClarkUnits 342
Leased 5Developer Erkiletian DevelopmentPCCP
6 The Sur at National GatewayUnits 360
Leased 65Developer Orr Partners
5 Centro ArlingtonUnits 366
Leased 12Developer Washington Real Estate Investment Trust
3 The TroveUnits 401
Leased 34Developer Saul Centers REIT (Northwestern Mutual Life Insurance)
2 The WaycroftUnits 490
Developer Combined Properties
4 Scout on the CircleUnits 400
Leased 21Developer Perseus RealtyELVFour Points
1 Foundry at CarlyleUnits 525
Leased 49Developer Shooshan Co Brandywine Realty Trust
10 4040 WilsonUnits 244
Leased 25Developer Abramson Properties Weingarten Realty AHDC
9 Array at West AlexUnits 278
Leased 40Developer Elm Street DevelopmentNorthwood Ravin
12 Preserve at Westfields - Phase IUnits 132
Leased 17Developer Novus
11 Mission LoftsUnits 157
Leased 21
Leased 34
Leased 12
Leased 7
Leased 65
Leased 5
Leased 22
Leased 20
Leased 25
Leased 49
Leased 17
Leased 40
Source Axiometrics 2020
VIRGINIA TECH INNOVATION CAMPUS
AMAZON HQ2
3
14
NORTHERN VIRGINIA H12020
$494500000SALES IN H1 2020
1823 UNITSSOLD IN H1 2020
9 PROPERTIES
Deliveries Net Absorption VacancyYear
NoVA BY THE NUMBERS
43
$1992
10135 UNITSUNDER CONSTRUCTION
3997 UNITSDELIVERED IN 2020
STABILIZED VACANCY
PIPELINE
CLASS A AVG RENTS
CLASS B AVG RENTS
Source CBRE Research and Delta Associates
As of June 30 2020
PER UNIT PER MONTH
14567 UNITS36-MONTH PIPELINE
Just under 4000 units delivered in H1 2020 which equates to a 10 increase in total inventory throughout the year Arlington accounted for 59 of new deliveries and Alexandria accounted for 27 The average lease-up pace for properties in Northern Virginia is currently 21 units per month compared to 24 units per month in January 2020 Northern Virginiarsquos current stabilized vacancy is 43 a 70 bps YoY increase
Job Growth YoY as of June 2020EMPLOYMENT
Northern Virginia experienced the YoY employment decline of 134700 jobs Leisure and Hospitality fared the worst with the loss of 64500 jobs and Education and Health Services with the loss of 32100 jobs However there was growth in Information and Financial Activities industries At the start of the year unemployment was at 25 and it currently stands at 86
As of June 2020 Amazon has already hired 1000 employees It is estimated that Amazon will bring 1200 employees in 2020 and an additional 2000 employees in 2021
CAPITAL MARKETS
PER SF PER MONTH$217
$1746 PER UNIT PER MONTH
PER SF PER MONTH$194
VacancyNorthern Virginia SummaryUnits
Delivered
DEVELOPMENT
-70000 -60000 -50000 -40000 -30000 -20000 -10000 0 10000
H1 2020 NoVa Employment
-70000 -50000 -30000 -10000 0 10000
5
4
3
2
1
02014 2015 2016 2017 2018 2019 H1
2020H2
2020
10000
8000
6000
4000
2000
02021 2022
StateLocal Government
Federal Government
Other Services
Leisure and Hospitality
Education and Health Services
Professional and Business Services
Financial Activities
Information
Retail Trade
Wholesale Trade
Trade Transportation and Utilities
Manufacturing
Mining Logging and Construction
0
001
002
003
004
005
006
0
1000
2000
3000
4000
5000
6000
7000
8000
9000
2014 2015 2016 2017 2018 2019 H1 2020 H2 2020 2021 2022
Vaca
ncy
Units
Deliveries Net Absorption Vacancy
Forecast
15
NORTHERN VIRGINIA H1 2020
NoVA HOME PRICES
Property Year Built Sold Price Units $Unit
The Emerson 2019 012720 $117000000 355 $329577
Avana Alexandria 1991 013020 $106000000 326 $325153
Ravensworth Towers 1973 041120 $59000000 219 $269406
The Bradley 2015 012020 $57666667 165 $349495
Monroe Place 2008 032620 $56950000 202 $281931
LARGEST SALESNoVA MULTIFAMILY SALES VOLUME
Class A High-Rise Avg $UnitMo
Avg $SFMo Vacancy YoY Rent
Change
Alexandria $2124 $243 54 -33
RosslynBallston Corridor $2490 $300 36 -27
Crystal CityPentagon City $2356 $268 74 -72
South Arlington $2024 $232 45 00
Tysons $2264 $252 78 -134
RestonHerndon $2106 $226 95 -71
Falls ChurchMerrifield $2117 $234 55 -70
Class B Mid-and High Rise Avg $UnitMo
Avg $SFMo Vacancy YoY Rent
Change
Falls ChurchNorth Arlington $2264 $249 54 07
South Arlington $1674 $198 21 -01
Arlandria $1662 $220 16 11
West Alexandria $1666 $183 54 -04
Crystal City $2226 $206 62 -60
RENTAL RATES
$650000
$625000
$600000
$575000
$550000
$5250002014 2015 2016 2017 2018 2019
$5000000000
$4000000000
$3000000000
$2000000000
$1000000000
$0
Northern Virginia experienced rent decreases compared to H1 2019 with the exception of Class-A product in South Arlington and Class-B product in Falls ChurchNorth Arlington and Arlandria Class-A rents fell by 41 to $1992unitmonth or $217 per square foot Class-A vacancy in Northern Virginia is currently 49 and concessions are at 50 of face rent RestonHerndon and Tysons have the highest Class-A vacancy at 95 and 78 due in most part to increased deliveries in those submarkets Class B rents fell 16 YoY to $1746unitmonth or $194 per square foot Class-B vacancy is currently 39 and concessions are 20 of face rent Crystal City has the highest Class-B vacancy at 62 Class-A and Class-B rents fell by a total of 25 YoY
Homes values in Northern Virginia continue to see impressive growth as demand significantly outweighs supply in 2020 New listing inventory was down by 35 this year and prices continue to climb Homes are on the market for an average of 35 weeks before selling The current median home value in Northern Virginia is $641002 which is a 44 YoY increase across the region Alexandria is the fastest growing housing market in the nation with 202 YoY median sale value growth Arlington County currently maintains the highest home value in Northern Virginia and experienced an 11 YoY increase The high cost of home buying in Northern Virginia will likely drive multifamily demand as renters are priced out of the for sale housing market
A total of $4945M multifamily sales transacted in Northern Virginia in nine properties in the first half of 2020 Value-add sales accounted for 77 of transactions and CoreCore-Plus sales made up the remaining 23 of total investment volume The highest price per unit sales were The Bradley a 165-unit property in Alexandria which sold at $349500 per unit and The Emerson a 355-unit property in Herndon which sold at $329600 per unit
JEFFERSON FAIR OAKS
$520000
$540000
$560000
$580000
$600000
$620000
2014 2015 2016 2017 2018 2019
NoVA Average Sold Home Price
$0
$1000000000
$2000000000
$3000000000
$4000000000
$5000000000
2013 2014 2015 2016 2017 2018 2019 H1 2020
NoVA Sales Volume
2018 20192016 20172014 20152013 H1 2020
$500000$520000$540000$560000$580000$600000$620000$640000$660000
2014 2015 2016 2017 2018 2019 2020
NoVA Average Sold Home Price
2020
16
SUBURBAN MD H1 2020
SUBURBAN MARYLAND
SUBURBAN MARYLAND OVERVIEW
Suburban Maryland fared the best in terms of rent growth absorption and transaction volume compared to the other markets in Washington DC Its lower density setting may be in part responsible for its recent resilience as residents choose to relocate out of higher density urban areas
Suburban Maryland is one of the most prominent areas in the region for the Life Sciences sector and is home to the headquarters of the National Institute of Health Department of Energy the Food and Drug Administration and the National Institute of Standards and Technology The presence of biotech in the I-270 Corridor in particular has greatly benefited the commercial real estate market in office industrial and multifamily Life Sciences buildings have significantly lower vacancy rates than that of other commercial office buildings As of 2019 laboratory vacancy sits at around 50 on average while office vacancy rate in Suburban Maryland is nearly 19 Montgomery and Prince Georgersquos counties continue to be largely unique in their growth of biotech because they remain suburban areas in comparison to Life Sciences hubs such as Boston New York and San Francisco that continue to grow as urban areas
Although investment activity slowed down considerably across the region Suburban Maryland is an outlier Over $12B transacted in H1 2020 which is more than H1 2019 when $893M transacted
17
SUBURBAN MD H1 2020
2020 DELIVERIES MAP
SUBURBAN MD DELIVERIES
Deliveries slowed in Suburban Maryland with an addition of 492 units across three projects in H1 2020 The deliveries were Bainbridgersquos Bainbridge Lake Linganore a 322-unit property in Frederick NV Commercial Brick Lanersquos The Bottling Plant a 86-unit property in Outlying Frederick County and Landex Developmentrsquos Artisan 4100 an 84-unit property in Brentwood There are currently 6441 units under construction which will add a total of 35 to total inventory over the next 24 months Bethesda has the highest concentration of development activity with just over 1900 units delivering in the next 36 months Unlike other markets in the DC metro Suburban Marylandrsquos vacancy which currently stands at 36 was not largely impacted in the past six months
382274copy 2020 CBRE Inc All rights reserved This information has been obtained from sources believed reliable but has not been verified for accuracy or completeness You should conduct a careful independent investigation of the property and verify all information Any reliance on this information issolely at your own risk CBRE and the CBRE logo are service marks of CBRE Inc All other marks displayed on this document are the property of their respective owners and the use of such logos does not imply any affiliation with or endorsement of CBRE
1
2
3
HERNDONRESTON
STERLING
BALLENGER CREEK
ASPEN HILL
BETHESDA
CHILLUM
NORTH BETHESDA
ROCKVILLE
SILVER SPRING
TAKOMA PARK
TYSONS CORNER
VIENNA
WHEATON-GLENMONT
WHITE OAK
POTOMAC
MCLEAN
COLESVILLENORTH POTOMAC
IDYLWOOD
WOLF TRAP
ADELPHI
BELTSVILLE
BOWIE
CROFTONGREENBELT
HYATTSVILLELANHAM
LAUREL
ODENTONSOUTH LAUREL
CATONSVILLE
COLUMBIA
DAMASCUS
GAITHERSBURG
LINTHICUM HEIGHTS
NORTH LAURELOLNEY
PIKESVILLE
WOODLAWN
SEVERN
ARBUTUS
MONTGOMERY VILLAGE
GERMANTOWN FERNDALE
ELDERSBURG
LOCHEARN
MAYS CHAPEL
REISTERSTOWN
DUNDALK
PERRY HALL
RIVIERA BEACH
ROSEDALE
SEVERNA PARK
TOWSON
ARNOLD
ESSEX
GLEN BURNIE
PASADENA
PARKVILLE
SOUTH GATE
OVERLEANOTTINGHAM
ANNAPOLIS NECK
WASHINGTON
ANNAPOLIS
BALTIMORE
201
3
295
267
7
100
15
50
15
340
40 1
29
301
301
270
495
70
83
195
95
66
97
895
95
95
695
270395
695
WASHINGTONDULLES INTL
AIRPORT
TIPTONAIRPORT
LEE AIRPORT
BALTIMOREWASHINGTONINTL AIRPORT
MARTIN STATEAIRPORT
2020 MID ATLANTIC MULTIFAMILY DELIVERIESSUBURBAN MARYLANDMULTIFAMILY DELIVERY
sup1 0 3 615Miles
Leased 20Developer Landex Development
3 Artisan 4100Units 84
Leased 60Developer NV Commercial Brick Lane
2 Bottling PlantUnits 86
Leased 9Developer Bainbridge Companies
1 Bainbridge Lake LinganoreUnits 322Leased 9
Leased 60
Leased 20
18
-45000 -40000 -35000 -30000 -25000 -20000 -15000 -10000 -5000 0 5000
H1 2020 SubMD Employment
SUBURBAN MD H1 2020
Job Growth YoY
EMPLOYMENT
$12 BILLIONSALES IN H1 2020
5006 UNITSSOLD IN H1 2020
14 PROPERTIES
5000
4000
3000
2000
1000
0
6
5
4
3
2
1
0
VacancyUnits
Delivered Suburban MD Summary
Deliveries Net Absorption Vacancy
Year
DEVELOPMENTSUBURBAN MD BY THE NUMBERS
36
$1905
6441 UNITSUNDER CONSTRUCTION
492 UNITSDELIVERED IN 2020
STABILIZED VACANCY
PIPELINE
CLASS A AVG RENTS
CLASS B AVG RENTS
Source CBRE Research and Delta Associates
As of June 30 2020
PER UNIT PER MONTH
13773 UNITS36-MONTH PIPELINE
As the most affordable option for residents in Washington DC Suburban Maryland continues to provide job opportunities and relatively affordable living Just under 500 units delivered in H1 2020 and 100 units have been absorbed so far this year Suburban Marylandrsquos current stabilized vacancy is 36 down 30 bps from last year
CAPITAL MARKETS
Suburban Maryland experienced the YoY loss of 111400 jobs The most impacted industries were Leisure and Hospitality with a 40 decrease in employment and Education and Health Services with a loss of 15 of employees Trade and Transportation also lost just under 20000 jobs The Federal Government saw a growth of 1000 employees Unemployment in Montgomery and Prince Georgersquos counties is currently 80 and 99 respectively up from 28 and 36 respectively in January 2020
$203PER SF PER MONTH
$1591PER UNIT PER MONTH
$173PER SF PER MONTH
2014 2015 2016 2017 2018 2019 H12020
H22020
2021 2022
StateLocal Government
Federal Government
Other Services
Leisure and Hospitality
Education and Health Services
Professional and Business Services
Financial Activities
Information
Retail Trade
Wholesale Trade
Trade Transportation and Utilities
Manufacturing
Mining Logging and Construction
-35000 -25000 -15000 -5000 0 10000
00
10
20
30
40
50
60
0
500
1000
1500
2000
2500
3000
3500
4000
4500
2014 2015 2016 2017 2018 2019 H12020
H22020
2021 2022
Vacanc
y
Units
Deliveries Net Absorption Vacancy
Forecast
19
SUBURBAN MD H1 2020
SUBURBAN MD HOME PRICES
Property Year Built Sold Price Units $Unit
4701 Willard 1969 062920 $276500000 525 $526667
The Varsity 2011 032720 $146022026 258 $565977
Gallery on New Hampshire 1960 022820 $117000000 675 $173333
Montgomery Paint Branch 1984 061220 $113206000 529 $214000
Jefferson at Inigos Crossing 2008 011320 $109000000 473 $230444
LARGEST SALESSUBURBAN MD MULTIFAMILY SALES VOLUME
Class A High Rise Avg $UnitMo Avg $SFMo Vacancy YoY Rent
Change
Bethesda $2670 $293 72 31
N Bethesda Rockville $2047 $223 60 22
Silver Spring Wheaton $2012 $242 35 18
Hyattsville College Park $1867 $206 46 NA
Class B Mid-and High-Rise Avg $UnitMo Avg $SFMo Vacancy YoY Rent
Change
Silver Spring $1622 $169 920 -190
BethesdaChevy Chase $1982 $217 520 -530
Rockville $1709 $184 430 450
RENTAL RATES
$400000
$380000
$360000
$340000
$320000
2014 2015 2016 2017 2018 2019
$3000000000
$2500000000
$2000000000
$1500000000
$1000000000
$500000000
$0
Although no markets saw overall positive rent growth over the past year Suburban Maryland was the least negatively impacted region in the metro in terms of rental rates Class-A rents declined by 13 YoY to an average of $1905unitmonth or $203 per square foot Class-A vacancy currently stands at 45 Class-B rents declined 10 to an average of $1591unitmonth or $173 per square foot Class-B vacancy currently stands at 31 Overall Class-A and Class-B apartment rents fell by a total of 11 YoY to an average of $1697unitmonth or $183 per square foot
Home prices have dropped slightly in Suburban Maryland after four consecutive years of positive growth The current median home sale price is $393000 The robust effect of the Amazon announcement has spilled over into Suburban Marylandrsquos housing market as a desirable and often more affordable option than Northern Virginia Much of Suburban Maryland multifamily properties remain within the ideal 30-minute commute from large employment drivers such as Amazon HQ2 and parts of Washington DC
Investment activity was highest in Suburban Maryland as $1222570000 traded in 13 sales in the first half of 2020 Value-Add product made up a majority of transaction volume at 61 while CoreCore-Plus accounted for the remaining 39 4017 Willard was the highest sale in terms of total volume and price per unit at $267500000 and $526667 per unit
BETHESDA ROW
NORTHLAKE
$310000
$320000
$330000
$340000
$350000
$360000
$370000
$380000
$390000
$400000
2014 2015 2016 2017 2018 2019 2020
Sub MD Median Home Sales Price
2020
$0
$500000000
$1000000000
$1500000000
$2000000000
$2500000000
$3000000000
2013 2014 2015 2016 2017 2018 2019 H1 2020
Sub MD Sales Volume
2018 20192016 20172014 20152013 H1 2020
4701 WILLARD
20
BALTIMORE METRO H1 2020
BALTIMORE METRO OVERVIEW
While the Baltimore metro is performing well compared to other metros across the country the region has seen the effects of the COVID-19 pandemic with impacts to employment transaction volume rent growth and absorption rates Over 172000 jobs were lost in greater Baltimore since Q2 2019 which is a 12 decrease in total nonfarm employment The June 2020 unemployment rate in the Baltimore metro is 80 which is a 450 bps increase from January 2020 Baltimore however is considered to be better positioned than other regions to weather the current economic downturn due to its impressive resilience in previous recessions In the Global Financial Crisis Baltimore ranked sixth in terms of GDP growth and ninth in payroll job growth across the nation
Just over 2400 units delivered in the Baltimore metro in H1 2020 and 2532 units are currently under construction The average rent in Baltimore is $1759unitmonth or $185 per square foot An aggregate of $506M in sales transacted across 13 sales CBRE brokered two of the three largest transactions in H1 2020 across the Baltimore metro
BALTIMORE METRO
21
BALTIMORE METRO H1 2020
382274copy 2020 CBRE Inc All rights reserved This information has been obtained from sources believed reliable but has not been verified for accuracy or completeness You should conduct a careful independent investigation of the property and verify all information Any reliance on this information issolely at your own risk CBRE and the CBRE logo are service marks of CBRE Inc All other marks displayed on this document are the property of their respective owners and the use of such logos does not imply any affiliation with or endorsement of CBRE
1
2
3
4
5
6
7
8
91 0
CATONSVILLE
ELKRIDGE
ELLICOTT CITY
LINTHICUM HEIGHTS
PIKESVILLE
RANDALLSTOWN
WOODLAWN
SEVERN
ARBUTUS
FERNDALE
LOCHEARN
MAYS CHAPEL
MILFORD MILL
OWINGS MILLS
REISTERSTOWN
DUNDALK
MIDDLE RIVER
PERRY HALL
RIVIERA BEACH
ROSEDALE
ESSEX
GLEN BURNIE
PARKVILLE
EDGEWOODJOPPA
CARNEY
GREEN HAVEN
OVERLEA
ROSSVILLE
JOPPATOWNE
BALTIMORE
295
24
924
100
29
1
70
83
83
195
97
895
95
95
395
695 95
BALTIMOREWASHINGTONINTL AIRPORT
MARTINSTATE
AIRPORT
2020 MID ATLANTIC MULTIFAMILY DELIVERIESBALTIMORE
sup1 0 15 3075
Miles
MULTIFAMILY DELIVERY
Leased 45Developer Sid Emmer
8 The View at Mill Run Phase IIUnits 157
Developer Greystar
7 Elan TowsonUnits 208
Leased 40Developer La Cite
6 CenterWest- Phase 1AUnits 262
Developer Klein EnterprisesManekin LLC
5 The WoodberryUnits 284
Leased 35Developer AvalonBay CommunitiesRetail Properties
3 Avalon TowsonUnits 371
Leased 7Developer Wood Partners
2 Alta Brewers HillUnits 371
Leased 4Developer Chesapeake Realty Partners
4 Avenue GrandUnits 324
Leased 36Developer Howard Hughes
1 Juniper - Merriweather DistrictUnits 380
Leased 67Developer Atlantic Realty
10 The MorrisonUnits 15
Leased 10Developer Zahlco
9 9 E Mount Royal StreetUnits 65
2020 DELIVERIES MAP
BALTIMORE METRO DELIVERIES
Deliveries picked up in Baltimore throughout 2020 with the addition of 2437 units throughout the metro equating to a 12 increase in total inventory More units delivered in the first half of 2020 than were delivered in all of 2019 The largest deliveries were Howard Hughesrsquo Juniper a 380-unit property as part of the Merriweather District in Columbia Wood Partnersrsquo Alta Brewers Hill a 371-unit property in Baltimore City and Avalonbay Communitiesrsquo Avalon Towson a 371-unit property in Towson There are currently 2532 units under construction that are expected to deliver in the next 24 months The average lease-up pace for properties in Baltimore is 15 units per month
Leased 36
Leased 7
Leased 35
Leased 4
Leased 34
Leased 40
Leased 19
Leased 45
Leased 10
Leased 67
Source Yardi Matrix 2020 Source Axiometrics 2020
22
BALTIMORE METRO H1 2020
Job Growth YoY EMPLOYMENT
$506028000SALES IN H1 2020
2913 UNITSSOLD IN H1 2020
14 PROPERTIES
10000
8000
6000
4000
2000
0
7
6
5
4
3
2
0
VacancyUnits
Delivered Baltimore Metro Summary
Deliveries Net Absorption Vacancy
Year
DEVELOPMENTBALTIMORE METRO BY THE NUMBERS
500
$1759
2532 UNITSUNDER CONSTRUCTION
2437 UNITSDELIVERED IN 2020
STABILIZED VACANCY
PIPELINE
TOTAL AVG RENTS
Source CBRE Research Axiometrics and Delta Associates
As of June 30 2020
PER UNIT PER MONTH
6906 UNITS36-MONTH PIPELINE
Deliveries in Baltimore picked up with an additional 2437 units in H1 2020 Just under 2000 units were absorbed in the past 12 months most of them before the beginning of 2020 which has caused vacancy to increase in H1 2020 Across the Baltimore metro vacancy increased 80 bps to 50 In the Baltimore Suburbs vacancy stands at 44 up 10 bps YoY and in Baltimore city vacancy is 66 up 290 bps YoY
During the recent downturn Baltimore experienced a loss of 172500 jobs The most impacted sector was Leisure and Hospitality in which 45 of employees were furloughed or laid off Education and Health Services also took a loss of 30800 jobs Federal Government and Mining Logging and Construction were the only industries to see job growth with an increase of 800 employees and 3300 respectively The spike in Mining Logging and Construction may have been the result of the emergency expansion of Baltimorersquos hospitals and uninterrupted construction at existing development sites At the start of 2020 Baltimorersquos unemployment rate was 35 and is currently 95 There are currently 1253600 nonfarm employees in the Baltimore metro
CAPITAL MARKETS
$185PER SF PER MONTH
09RENT GROWTH
NORTHERN SUBURBS
-010SOUTHERN SUBURBS
-50000 -30000 -10000 0 10000-70000 -60000 -50000 -40000 -30000 -20000 -10000 0 10000
H2 2020 Baltimore Employment
2015 2016 2017 2018 2019 2020 2021 2022 2023 2024 20250
1
2
3
4
5
6
7
-2000
0
2000
4000
6000
8000
10000
Vacanc
y ()
Units
Rentable Completions(Units)
Net Absorption(Units)
Vacancy Rate(Avg )
StateLocal Government
Federal Government
Other Services
Leisure and Hospitality
Education and Health Services
Professional and Business Services
Financial Activities
Information
Retail Trade
Wholesale Trade
Trade Transportation and Utilities
Manufacturing
Mining Logging and Construction
Forecast
23
BALTIMORE METRO H1 2020
BALTIMORE METRO HOME PRICES
Property Year Built Sold Price Units $Unit
Townes at Holly Station 1985 042320 $115000000 510 $225490
Chatham Gardens 1980 041720 $83280000 414 $201159
The Point at Elkridge 1988 032720 $72500000 312 $232372
BLVD at White Springs 1977 040820 $61099000 459 $133113
Old Orchard 1986 041720 $33179940 180 $184333
LARGEST SALESBALTIMORE METRO MULTIFAMILY SALES VOLUME
Submarket Avg $UnitMo Avg $SFMo Vacancy
Annapolis $1749 $198 49
Baltimore City East $1434 $179 55
Baltimore City North $1095 $135 69
Baltimore City West $996 $125 41
ColumbiaNorth Laurel $1643 $170 44
Downtown Baltimore $1548 $189 85
Ellicott CityElkridge $1609 $167 47
Far North Baltimore Suburbs $1310 $136 29
Northeast Anne Arundel County $1374 $157 42
Northwest Anne Arundel County $1720 $172 51
Owings MillsPikesvilleRandallstown $1365 $132 45
ParkvilleCarneyPerry Hall $1164 $135 36
Southeast Baltimore County $1097 $132 38
Southwest Baltimore County $1172 $131 45
TowsonHunt Valley $1390 $140 53
RENTAL RATES - ALL PRODUCT TYPES
$3000000000
$2500000000
$2000000000
$1500000000
$1000000000
$500000000
$0
2014 2015 2016 2017 2018 2019
$255000
$250000
$245000
$240000
$235000
$220000
$205000
Rent growth in the Baltimore metro remained largely flat since June 2019 The Northern Baltimore Suburbs experienced 09 rent growth the Southern Baltimore Suburbs experienced a drop of 01 rent growth and Baltimore City rents fell by 30 The Baltimore suburbs outpaced Baltimore City in terms of rent growth and absorption Current vacancy in the Baltimore metro is 50 with the highest vacancies in Downtown Baltimore at 85 Baltimore City North at 69 and Baltimore City East at 55 According to Delta Reports the Howard CountyColumbia submarket fared the best in the metro with 27 YoY rent growth
Home values in the Baltimore metro increased 20 YoY up slightly from the five-year average growth rate of 15 The current median sales price in the Baltimore metro is $251000 Single-family homes in Baltimore County posted a 10-year high median sale price of $330000 This is a 6 YoY increase from June 2019 Homes in Baltimore City also posted a 10-year high median sale price of $238000 Of note Owings Mills experienced a 27 YoY increase in median home value for an average of $415000
Investment activity reached $506M in the Baltimore metro during the first two quarters of 2020 in 14 transactions All but one sale was value-add product The highest sales in terms of price per unit were Point at Elkridge a 312-unit property in Elkridge which sold for $232400 per unit and Townes at Holly Station a 510-unit property in Waldorf which sold for $225500 per unit CBRE brokered both sales
TOWNES AT HOLLY STATION
$215000
$220000
$225000
$230000
$235000
$240000
$245000
$250000
2014 2015 2016 2017 2018 2019
Baltimore Metro Median Sale Price
$0
$500000000
$1000000000
$1500000000
$2000000000
$2500000000
$3000000000
2013 2014 2015 2016 2017 2018 2019 H1 2020
Balitmore Metro Sales Volume
2018 20192016 20172014 20152013 H1 2020
$210000$215000$220000$225000$230000$235000$240000$245000$250000$255000
2014 2015 2016 2017 2018 2019 2020
Baltimore Metro Median Sale Price
2020
24
FOR SALES OR FINANCING INFORMATION CONTACT
William S RoohanVice Chairman(O) +1 410 244 3122(M) +1 443 690 6967billroohancbrecom
Michael E MuldowneyExecutive Vice President(O) +1 410 244 3144(M) +1 443 250 3144mikemuldowneycbrecom
Robert G Dean IIISenior Vice President(O) +1 202 585 5766(M) +1 202 578 6941robertdeancbrecom
Jonathan M GreenbergSenior Vice President(O) +1 703 734 4772(M) +1 202 423 6655jonathangreenbergcbrecom
Martha A HastingsSenior Vice President(O) +1 410 244 3162(M) +1 410 807 2450marthahastingscbrecom
Brian H MargerumSenior Vice President(O) +1 410 244 3135(M) +1 443 386 1096brianmargerumcbrecom
Michael D RudolphSenior Vice President(O) +1 410 244 3121(M) +1 443 928 0392michaelrudolphcbrecom
John T Sheridan JrSenior Vice President(O) +1 703 905 0239(M) +1 703 200 7720johnsheridancbrecom
Yalda G HowellFirst Vice President(O) +1 202 585 5677(M) +1 240 462 2332yaldaghamariancbrecom
Thomas B LeachmanVice President(O) +1 202 585 5638(M) +1 240 688 0189thomasleachmancbrecom
Kemp D BroujosSenior Associate(O) +1 202 585 5724(M) +1 443 786 2951kempbroujoscbrecom
Nathan E BarthAssociate(O) +1 703 905 0228(C) +1 703 340 6828nathanbarthcbrecom
Zachary L StoneSales Assistant(O) +1 202 585 5650 (M) +1 202 713 8404zachstonecbrecom
Investment Sales amp Brokerage
Operations amp Marketing
Debt amp Structured Finance Team
Patricia C BonebrakeSenior Director of Operations(O) +1 410 244 3141(C) +1 443 253 5917trishbonebrakecbrecom
Jennifer W BusseyOperations Manager(O) +1 410 244 3134(C) +1 410 300 1302jenniferbusseycbrecom
Cheryl FinlaysonProductions Systems Manager(O) +1 410 244 7100(C) +1 410 244 3101cherylfinlaysoncbrecom
Margaret O MacleayOperations Supervisor(O) +1 202 585 5638(C) +1 410 562 9340maggiemacleaycbrecom
Rachel L MossmanSenior Communications Specialist(O) +1 410 244 3179(C) +1 410 244 7100rachelmossmancbrecom
Samantha S FifieldSales Assistant(O) +1 202 585 5773(C) +1 310 266 0003samanthafifieldcbrecom
Caroline P LekakosClient Services Coordinator(O) +1 202 585 5606(C) +1 240 595 0642carolinelekakoscbrecom
Yasmeen F ShararaClient Services Coordinator(O) +1 202 585 5580(C) +1 301 828 7435yasmeenshararacbrecom
Lauren E SpielmanClient Services Coordinator(O) +1 410 244 3129(C) +1 443 800 4388laurenspielmancbrecom
Grace F TrimbleClient Services Coordinator(O) +1 410 244 3123(C) +1 410 499 1064gracetrimblecbrecom
David F WebbVice Chairman(O) +1 202 585 5721(M) +1 202 744 4900davidwebbcbrecom
Maximiliane T LeachmanExecutive Vice President(O) +1 202 585 5655(M) +1 404 358 4317maxileachmancbrecom
Justin J GlasgowSenior Vice President(O) +1 202 783 1723(M) +1 202 316 1804justinglasgowcbrecom
RESEARCH TEAM
JEANETTE I RICE Americas Head of Multifamily Research (O) +1 214 979 6169
(C) +1 817 412 0709 jeanettericecbrecom
MOLLY M HUNT Research Analyst (O) +1 202 585 5597(C) +1 415 599 6009 mollyhuntcbrecom
RANK
1Fortune Magazinersquos
Most Admired Commercial Real Estate
Firm
REPUTATION
2Ranked the 2
Multifamily Brokerage Team in the entire nation by
Real Estate Forum
THE CBRE TEAM COMPETITIVE ADVANTAGE
25
RESOURCES
26Largest team and most
capacity in the Mid-Atlantic region
EXPERIENCE
$174B+The aggregate sales
value of deals our team has brokered since
2015
DEBT TEAM
1The CBRE Debt amp
Structured Finance Team is the 1 Freddie Mac
SellerServicer
copy Copyright 2020 All rights reserved Information contained herein including projections has been obtained from sources believed to be reliable but has not been verified for accuracy or completeness CBRE Inc makes no guarantee warranty or representation about it Any reliance on such information is solely at your own risk This information is exclusively for use by CBRE clients and professionals and may not be reproduced without the prior written permission of CBRErsquos Global Chief Economist CBRE and the CBRE logo are service marks of CBRE Inc andor its affiliated or related companies in the United States and other countries All other marks displayed on this document are the property of their respective owners Photos herein are the property of their respective owners Use of these images without the express written consent of the owner is prohibited
WASHINGTON DC1900 N Street NW
Suite 700 Washington DC 20036
+1 (202) 783 8200
BALTIMORE MD100 East Pratt Street
Suite 1700Baltimore MD 21202+1 (410) 244 7100
TYSONS VA1861 International Drive
Suite 300McLean VA 22102+1 (703) 821-6900

4
BALTIMORE
NORTHERN VIRGINIA
WASHINGTON DC
MID-ATLANTIC MULTIFAMILY MARKET
EXECUTIVE SUMMARYThe Mid-Atlantic region began 2020 on a great notemdashpositive rent growth across all markets prolific development activity and high transaction volumes All of a sudden in mid-March COVID-19 shook the nation We are now experiencing the effects of the pandemic on multifamily operations and transaction velocity However several early signs indicated that the Mid-Atlantic would fare well compared to other large metros and indeed it has Historically the Washington DC metro is recognized as the most risk-averse employment base due to its low employment rates in industries such as Leisure amp Hospitality and Retail Additionally the federal government and local federal spending has provided a unique degree of insulation to the regional economy Intellectual capital has also been rich within the region a large supply of highly educated talent bolsters the strong cyber security biotech bio-sciences defense and technology industries in the Mid-Atlantic
While the Mid-Atlantic multifamily market was impacted by the pandemic it has shown its continued resilience in the face of unprecedented market volatility In Q2 2020 across national Tier II markets the Baltimore metro was ranked first and second in the nation in terms of rent growth and lowest vacancy change respectively Vacancy in the Baltimore metro increased by only 80 bps and rent growth held steady Across national Tier I markets the Washington DC metro experienced similar success as it ranked fourth in the nation in terms of rent growth and lowest vacancy change The Washington DC metro experienced a 90 bps increase in vacancy and a 23 decrease in overall rents which compared to the rest of the nation is quite favorable Net absorption in the Washington DC metro as a percentage of total inventory was the second highest in the nation across large metros and the only gateway market to make it to the top 20 across all national markets
Although job losses across the country were substantial the Baltimore and Washington DC metros fared well on a national scale The Washington DC metro saw fewer job losses than any other large metro in the country likely due to federal government activity in response to the pandemic In June out of 51 MSArsquos Baltimore ranked 8th in the nation for the lowest unemployment rate at 80 and Washington DC followed close behind in 10th place at 84 unemployment In recent years the Mid-Atlantic economy has become more diversified with tech education and private business on the rise Additionally while sequestration reduced the footprint of the federal government and its presence in the region it has grown in recent months and played an integral role in keeping workers employed and stimulating the economy
The Washington DC metro will continue to see an influx of supply with an estimated 15150 units delivering in the next 12 months Construction has not slowed since the start of the year and over 3300 units began construction in the second quarter of 2020
As a result of the pandemic data suggests that renters are now favoring properties in lower density areas In the Washington DC metro rent growth in low-rise apartments outperformed rent growth in high-rise apartments by 21 In the Baltimore metro the lower-density suburbs saw only a slightly negative growth rate of 10 bps while Baltimore City rents fell 30
SUBURBAN MARYLAND
Baltim
ore-
Was
hingt
on Pa
rkway
MID-ATLANTIC MULTIFAMILY MARKET
Risk-Averse Employment Base
Mid-Atlantic Resilience
Urban to Suburban Migration
5
During previous recessions the Mid-Atlantic anchored by Washington DC and Baltimore proved to be the most resilient region in the country due to its diversified economy strong market drivers and the presence of the nationrsquos largest employermdashthe federal government The stability and dynamism of the regionrsquos economy underpins its resilient multifamily real estate market fundamentals
EXECUTIVE SUMMARY
bull Minimal Vacancy Change DC and Baltimore were ranked 3 and 5 respectively in terms of least amount of change in vacancy across the country during the 2008 recession at an average increase of only 150 bps
bull Most Stable Rents in the Nation Baltimore and DC ranked 1 and 2 respectively for least impacted rent growth in the nation and recovered in just six quarters compared to a national average of 12 quarters The regionrsquos peak-to-trough rent change was a mere 2 during the previous recessionmdashlower than the nearly 6 national average
bull Prolific Investment Market Since recovery in 2010 DCrsquos and Baltimores per unit increased by an average of 6 and 4 respectively as investors remain bullish on the region as a powerhouse center of the East Coast
bull Durability of Employment Base DC and Baltimore have historically lower unemployment rates compared to the US The strong and prominent labor markets of ldquoEds and Medsrdquo biotech and government are some of the most resilient industries through recessions Tech has also proven to be a pillar of the economy with significant future growth centered around the establishment of Amazonrsquos new HQ2 Washington is ranked 1 for lowest percentage of at-risk employment segments in the current downturn
These strong economic drivers will bolster the multifamily market drive demand and lead the region towards future growth
MID-ATLANTIC MULTIFAMILY MARKET
RESILIENCE PROVEN IN PREVIOUS RECESSIONS
0
2
4
6
8
10
01234567
Va
can
cy
Recession
Washington DC
Baltimore
Tech Boom
Tech Bust Post 911 RecessionPost Global Financial Crisis
Recovery Forecast
Atlanta
Baltimore
BostonChicagoDallasFt Worth
Denver
Detroit
Houston
Inland Empire
Long Island
Los Angeles
Miami
Minneapolis
New York CityOaklandOrange County
Orlando
Philadelphia
Phoenix
San Diego
San Francisco
Seattle
St Louis
Tampa
US
Washington DC
-16
-14
-12
-10
-8
-6
-4
-2
0
100 150 200 250 300 350
Rent
Chan
ge (
)
Vacancy Change (Bps)
Least Severe Downturn
Most Severe Downturn
METRO MARKET RENT amp VACANCY CHANGE IN LAST DOWNTURN
WASHINGTON DC amp BALTIMORE METROSrsquo VACANCY
CLICK HERE TO READ THE FULL REPORT ON CBRErsquoS
RESEARCH GATEWAY
-4
-2
0
2
4
6
8
10
Q12008
Q32008
Q12009
Q32009
Q12010
Q32010
Q12011
Q32011
YoY Re
nt Grow
th
Class A Class B Class C National
DC METRO YOY AVERAGE RENT GROWTH
-4
-2
0
2
4
6
8
10
Q12008
Q32008
Q12009
Q32009
Q12010
Q32010
Q12011
Q32011
YoY Re
nt Gr
owth
Class A Class B Class C National
BALTIMORE METRO YOY AVERAGE RENT GROWTH
OUTLOOKThe Mid-Atlantic is a booming market for millennials empty nesters and many others to live work and play in There are some challenges for developers investors and property managers in the short-term but the long-term future is bright The regionrsquos economy has strong fundamentals bolstered by the largest employer in the nation the federal government
Vacancy IncreasesWhile the Mid-Atlantic has performed at the top of the nation overall vacancy has increased in Washington DC and Baltimore by 90 bps and 80 bps respectively since Q2 2019 Unemployment and increased work from home flexibility have caused residents to consider alternative housing to save money on rent
High Rent CollectionsRent collections across the nation have been substantially higher than expectations in H1 2020 The National Multifamily Housing Council reported that 930 and 922 of residents paid rent across the nation in May and June respectively Approximately 940 of Washington DC residents paid rent in April and 892 of Baltimore residents paid rent in May
ADVANTAGES AND CHALLENGES FOR THE MULTIFAMILY INVESTORDEVELOPER
ADVANTAGES CHALLENGES
The Success of Virtual ToursVirtual tours have become the new normal for leasing offices in the Mid-Atlantic The per-project lease up rate in Washington DC is 14 units per month down only one unit from Q2 2019 In the Baltimore metro there are currently 18 projects in lease up with an average absorption rate of 15 units per project per month
Growing Tech TalentWashington DC has risen to the No 2 spot on CBRErsquos annual tech talent report coming in as the runner-up to the San Francisco Bay Area Washington has over 263000 tech workers and has experienced 10 growth since 2015 However Washington DCrsquos average apartment asking rate is ranked 8th in the nation indicating that it is one of the most affordable areas with the highest concentration of tech talent in the nation This growing labor market in high paying industries will continue to drive wages up and increase demand for Class-A and Class-B multifamily product
Click here to read CBRErsquos July 2020 Tech Talent Report
Significant PipelineThe Mid-Atlantic region will continue to see an influx of supply over the next few years Washington DC will experience an estimated increase of 15150 units in the next 12 months Construction has not slowed since the start of the year and over 3300 units began construction in the second quarter of 2020 In Baltimore 2437 units delivered in H1 2020 and 6906 units are on track to deliver in the next 36 months Developers are optimistic about future deliveries in 2021 with an expected market recovery that will renew demand
MID-ATLANTIC MULTIFAMILY MARKET
6
Eviction MoratoriumsThe Washington DC Councilrsquos emergency measures to respond to the pandemicrsquos economic impacts included a freeze on evictions and a prohibition on rent increases through October 2020 In Northern Virginia eviction freezes were extended to September 8 2020 In Maryland there are currently no eviction restrictions
MID-ATLANTIC H1 2020 ACCOLADES
bull Washington DC metro saw fewer YoY job losses than any other large metro in the country
bull Baltimore (80) and Washington DC (84) are ranked 8th and 10th for lowest unemployment rate across the largest 51 US metros
bull Washington DCrsquos net absorption as a percentage of total inventory was the second highest in the nation for large metros
bull Across Tier II markets Baltimore ranked first and second in the nation in terms of rent growth and lowest vacancy change
bull Across Tier I markets Washington DC ranked fourth in the nation in terms of rent growth and lowest vacancy change
bull Washington DC ranked 1 most risk-averse metro for employment base in the recent downturn
bull Washington DC ranked second in the nation in CBRErsquos Scoring Tech Talent report and has seen 10 industry growth since 2015
7
MID-ATLANTIC MULTIFAMILY MARKET
STRENGTH OF MULTIFAMILY INVESTMENTS
DEBT MARKETSDebt for multifamily investments is available at historic levels Interest rates are at all-time lows and offer multi-year interest-only periods These low-rate interest-only loans allow investors to achieve as high cash-on-cash leveraged returns as they have ever been able to achieve in the multifamily market and have helped to maintain low cap rates Currently attractive debt is available and equity is plentiful which typically means that private capital buyers have strong appetites There is a consensus among investors that multifamily as a need-based asset type remains a safe investment given the ubiquitous need for housing
While the CMBS markets have shown some distress the agency loan market has remained active Through the COVID-19 pandemic the GSEs have stepped up to fulfill their mission of providing liquidity to the multifamily market While their rates are at historically low levels they have increased their reserve requirements to protect themselves against current of future renterrsquos inability to make rent payments as a result of the pandemic These reserve requirements are sized to six months and are released to the owner once the property has maintained certain occupancyrental income requirements for a period post-closing and in the case of Freddie Mac once the emergency declarations andor stay at home orders have been lifted at the federal and local level These reserves typically amount to between 3 to 6 of the loan amount and most borrowers are willing to accept these requirements given the benefit of locking in sub 3 interest only long term debt As conditions stabilize or if a borrower is seeking relatively low leverage the requirement for debt service escrow is likely to mitigate or go away
AMAZON HQ2Amazonrsquos HQ2 is a generational market catalyst for employment and rent growth The new headquarters in Crystal City is slated to create 37000+ direct jobs over the next 14 years Amazon HQ2 is expected to occupy over 4M SF of office space accounting for 33 of Crystal Cityrsquos existing office inventory The expected average annual salaries of $150000 for Amazon employees could support apartment rents of more than $3750 per month As of Q2 2020 Amazon has already hired over 1000 employees It is estimated that Amazon will bring 1200 employees in 2020 and an additional 2000 employees in 2021 By 2023 when the two-million square foot campus near Pentagon City opens Amazon will employ over 5000 employees at HQ2 The second phase of construction will continue for several years with a full build-out of over 4M SF in the newly termed submarket ldquoNational Landingrdquo Amazon has received approximately $752M in subsidies for job creation from the state of Virginia and Arlington County Multifamily communities proximate to HQ2 are already experiencing significant rent growth As residents are priced out of Arlington County increased demand will radiate throughout Northern Virginia as residents seek a discount to in-fill Northern Virginia
The Amazon ldquoMultiplier EffectrdquoAmazon will not only draw entrepreneurs to the area but will also serve as a hub for startups and a magnet for venture capital within the greater DC MSA An infusion of new jobs to any region creates what economists call the ldquomultiplier effectrdquo The multiplier effect implies that Amazonrsquos 37000 employees could increase to as many as 185000+ indirect jobs and ldquomultiplyrdquo outwards
25000-35000 new STEM degrees over the next 20 years from the new $1B Virginia Tech Innovation Campus
Demand for an additional 40000-60000 rental units as a result of the ldquoAmazon Effectrdquo
THE DISTRICT
NORTHERN VIRGINIA
SUBURBAN MARYLAND
8
WASHINGTON DC H1 2020
WASHINGTON DC OVERVIEW
The District is experiencing negative effects of the COVID-19 pandemic with drops in rent absorption and rising vacancy throughout the apartment market The average monthly Class-A rent fell 35 YoY to a monthly average of $2561 per unit per month or $327SF The average Class-B rent fell 27 to an average of $2067unitmonth or $274SF
Just over 3000 units across the city delivered in the first half of 2020 and 12969 units are currently under construction Capitol Riverfront emerged as the leading submarket in terms of development activity with a 1475-unit increase with the delivery of The Estate The Kelvin Parc Riverside Phase I Meridian on First and The Maren Multifamily capital markets finished H1 2020 with $292860000 sold throughout the District over 9 sales The COVID-19 pandemic has slowed investment activity significantly as investors weather the storm of economic volatility Comparatively in the first half of 2019 over $685000000 transacted over 30 sales
THE DISTRICT
9
WASHINGTON DC H1 2020
2020 DELIVERIES MAP
THE DISTRICT DELIVERIES
Over 3000 units delivered to the District in H1 2020 accounting for a 21 increase to the total multifamily housing inventory The pipeline continues on a steady upward trend and will not slow until late 2022 There are currently 12696 units under construction that will increase the total multifamily inventory by 88 over the next two years
NoMa H Street Corridor Union Market and Capitol Riverfront are the most active submarkets in terms of development activity These growing areas continue to deliver Class-A luxury apartment buildings in areas that are also seeing retail and office space developments
382274copy 2020 CBRE Inc All rights reserved This information has been obtained from sources believed reliable but has not been verified for accuracy or completeness You should conduct a careful independent investigation of the property and verify all information Any reliance on this information issolely at your own risk CBRE and the CBRE logo are service marks of CBRE Inc All other marks displayed on this document are the property of their respective owners and the use of such logos does not imply any affiliation with or endorsement of CBRE
1
2
3
4
5 6
7
8
9
1 0
1 1
WASHINGTON
295
5050
695
395
395
395
Rhode Island Ave NE
Virginia Ave NW
Rhode Island Ave NW
H St NE
Min
neso
taAv
eN
E
Q St NW
Potomac Ave SE
11
th S
t S
E
Minnesota Ave SE
13
th S
t N
W
13
th S
t N
E
Pennsylvania Ave SE
3rd
St
NW
So
uth
Ca
pit
ol
St
12
thS
tS
W
Florida Ave NE
9th
St
SW 7th
St
SW
9th
St
NW
Pennsylvania Ave NW
Tenn
esse
eAv
eN
E
E Capitol St SE
US-1N
6th
St
NE
Massachusetts Ave NW
US-
1S
4th
St
NE
Independence Ave SE
14
thS
tS
W
Mt Olivet Rd NE
Constitution Ave NW
KentuckyAve
SE
9th
StN
E
Benning Rd NE
6th
St
SE
7th
St
NW
K St NW
Bra
nch
Ave
SE
6th
St
NW
New
Ham
pshi
re A
ve N
W
L St NW
E Capitol St NE
No
rth
Ca
pit
ol
St
14
th S
t N
W
North Carolin
a Ave SE
D St SW
9th
St
SE
22ndSt
NE
Texas AveSE
16
th S
t N
W
B St SE
2n
d S
t N
E
D St SE
21
stSt
NE
8th
St
SE
Maine
Ave
SW
12
th S
t S
E
Kenilw
orthAve
NE
M St SW
I St SE
Bryant St NW
19
th S
t N
W
17
th S
t N
W
11
th S
t N
E
Florida Ave NW
Maryland Ave NE
15
th S
t N
W
4th
St
SE
U St NW
M St NW
M St SE
RidgeRd
SE
Independence Ave SW
H St NW
C St NE
R St NW
2020 MID ATLANTIC MULTIFAMILY DELIVERIESWASHINGTON DC
sup1 0 025 05013
Miles
MULTIFAMILY DELIVERY
Leased 23Developer CAS RieglerEB5
8 BlackbirdUnits 167
Leased 7Developer FRP DevelopmentMRP Realty
7 The MarenUnits 264
Leased 6Developer Paradigm Development
6 Meridian on First IUnits 273
Leased 11Developer Toll Brothers
5 Parc Riverside Phase IIUnits 308
Leased 39Developer Brookfield Properties
3 The EstateUnits 320
Leased 43Developer RappaportWC SmithEB5
2 AvecUnits 420
Leased 36Developer Jair LynchMacFarlane Partners
4 The KelvinUnits 310
Leased 28Developer JBG SmithMRP Realty
1 The WrenUnits 433
Leased 4Developer Jefferson Apt GroupStars Investment
10 J LineaUnits 132
Leased 17Developer JBG Smith
9 901WUnits 161
Leased 42Developer Coba
11 1714-1716 14th Street NWUnits 8
Leased 28
Leased 43
Leased 39
Leased 36
Leased 11
Leased 6
Leased 7
Leased 23
Leased 17
Leased 4
Leased 42
10
-60000 -50000 -40000 -30000 -20000 -10000 0 10000
Q2 2020 DC Employment
WASHINGTON DC H1 2020
Job Growth YoY
-50000 -40000 -30000 -20000 -10000 0 10000
StateLocal Government
Federal Government
Other Services
Leisure and Hospitality
Education and Health Services
Professional and Business Services
Financial Activities
Information
Retail Trade
Wholesale Trade
Trade Transportation and Utilities
Manufacturing
Mining Logging and Construction
EMPLOYMENT
CAPITAL MARKETS
$292860000SALES IN H1 2020
845 UNITSSOLD IN H1 2020
9 PROPERTIES
Deliveries Net Absorption Vacancy
Year
DEVELOPMENTDC BY THE NUMBERS
61
$2561
12696 UNITSUNDER CONSTRUCTION
3004 UNITSDELIVERED IN 2020
STABILIZED VACANCY
PIPELINE
CLASS A AVG RENTS
CLASS B AVG RENTS
Source CBRE Research and Delta Associates
As of June 30 2020
PER UNIT PER MONTH
18907 UNITS36-MONTH PIPELINE
Recent deliveries in the District were concentrated primarily in the Capitol Riverfront and H Street submarkets NoMa and Union Market also remain top submarkets for development activity with around 3483 units under construction on-track to deliver in the next 24 months Annual absorption in the District was 25 lower than a year ago as 2003 units absorbed in the first half of the year Q2 stabilized vacancy rate in the District is 61 a 250 bps increase from the previous year The average lease-up pace of new product in the District is 14 units per month and concessions average 15 months free rent
Insulated by the federal government Washington DC has fared favorably thus far in the downturn compared to other large metros across the nation The District experienced 67000 job losses which represents an 8 YoY loss in employment Leisure and Hospitality suffered the biggest job loss as 60 of the workforce was laid off or furloughed Promisingly government information and other services were the only industries to experience job growth albeit small
PER SF PER MONTH$327
$2067PER UNIT PER MONTH
PER SF PER MONTH$274
7000
6000
5000
4000
3000
2000
1000
0
8
7
6
5
4
3
2
1
0
VacancyUnitsDelivered
Washington DC Summary
2013 2014 2015 2016 2017 2018 2019 2021 2022H22020
H12020
00
10
20
30
40
50
60
70
80
90
0
1000
2000
3000
4000
5000
6000
7000
2013 2014 2015 2016 2017 2018 2019 H1 2020 H2 2020 2021 2022
Vaca
ncy
Units
Deliveries Net Absorption Vacancy
Forecast
11
WASHINGTON DC H1 2020
WASHINGTON DC HOME PRICES
Property Year Built Price Sold Units $Unit
The Woodley 2014 $180250000 010820 212 $850235
Skyline Apartments 1965 $58700000 030120 398 $147487
Glenwood Apartments 1942 $13700000 013020 90 $152222
The Waring 1909 $8400000 063020 24 $328947
The Regent 1937 $8450000 063020 12 $228378
LARGEST SALESDC MULTIFAMILY SALES VOLUME
$2000000000
$1500000000
$1000000000
$500000000
$02018 20192016 20172014 20152013
THE SHELBY
Class A High-Rise Avg $UnitMo
Avg $SFMo Vacancy YoY Rent Change
Upper NW $2810 $347 50 -06
Central $2822 $345 51 -46
Columbia HeightsShaw $2663 $363 64 -21
NoMaH Street $2290 $302 82 -57
Capitol HillRiverfrontSouthwest $2583 $325 77 -33
Northeast $2092 $266 85 -07
Upper Georgia $2183 $281 53 06
Class B Mid-and High-Rise Avg $UnitMo
Avg $SFMo Vacancy YoY Rent Change
Upper Northwest $2104 $258 43 -26
Mount Vernon Square NW $1925 $291 76 -74
Southwest $2085 $289 30 -04
RENTAL RATES
The District experienced broad rent decreases across almost all submarkets with the exception of Upper Georgia The Northeast and NoMaH Street submarkets have the highest Class-A High-Rise vacancy at 85 and 82 respectively This is in part due to an influx of new deliveries to those markets Class-B vacancy currently stands at 45 and concessions are at 30 of face rent The Mount Vernon Square submarket has the highest Class-B Mid and High-Rise vacancy at 76 and the highest decline in rent growth at -74 Class-A and Class-B apartments rents fell by a total of 33
The current average home value in the District is $586000 While home values grew in 2020mdashseeing an average annual increase of 70mdashhome values in the District have increased on average 30 YoY since 2015
A total of $2929M multifamily sales transacted in the District in nine sales in the first two quarters of 2020 CoreCore-Plus transactions made up for 71 of transactions and Value-Add transactions made up for the remaining 29 of total sales volume The highest sales in terms of price per unit were The Woodley a 212-unit property in Woodley Park at $850235 per unit and The Shelby a 24-unit property in Dupont Circle at $350000 per unit both of which were brokered by CBRE The Woodley was also the largest sale in H1 2020 across the District at $18025M
$0
$500000000
$1000000000
$1500000000
$2000000000
2013 2014 2015 2016 2017 2018 2019 H1 2020
DC Sales Volume
H1 2020
$600000
$500000
$400000
$300000
$200000
$100000
2014 2015 2016 2017 2018 2019$0
$100000
$200000
$300000
$400000
$500000
$600000
2014 2015 2016 2017 2018 2019 2020
DC Home Prices
2020
12
NORTHERN VIRGINIA H1 2020
NORTHERN VIRGINIA
NORTHERN VIRGINIA OVERVIEW
Northern Virginia continues to be the fastest growing region in the DC metro The regionrsquos economic future has been bolstered by Amazonrsquos decision to build its HQ2 in National Landing Amazon selected Northern Virginia because of its inherently strong fundamentals including a rich pipeline of talent provided by numerous universities in the area Amazon has subsequently begun the first phase of its hiring process and build-out at National Landing including hiring over 1000 white-collar employees and moving into 300000 SF of office space The delivery of HQ2 is expected to add 40000 to 60000 units of additional apartment demand to the area in the next decade A typical Amazon HQ2 worker will make $150000 per year which allows for up to $3750 in monthly rent Additionally Virginia Tech is moving forward with its plans to build the $1 Billion Innovation Campus in Potomac Yard The introduction of these two strong economic drivers will continue to further diversify the job base and incentivize more businesses to move to all areas of the DC metro where a pipeline of talent awaits
$400000
$450000
$500000
$550000
$600000
2014 2015 2016 2017 2018 2019
DC Home Prices
13
NORTHERN VIRGINIA H1 2020
2020 DELIVERIES MAP
NORTHERN VA DELIVERIES
Just under 4000 new units delivered in H1 2020 across Northern Virginia accounting for a 16 increase in total volume There are currently 10135 units under construction which will add 4 to the inventory over the next 24 months The largest deliveries in the region include Perseus Realtyrsquos The Foundry a 525-unit property in Alexandria Saul Centersrsquo Waycroft a 490-unit property in BallstonVirginia Square Wash REITrsquos The Trove a 401-unit property in Columbia Heights Arlington and Combined Propertiesrsquo Scout on the Circle a 400-unit property in Fairfax
382274copy 2020 CBRE Inc All rights reserved This information has been obtained from sources believed reliable but has not been verified for accuracy or completeness You should conduct a careful independent investigation of the property and verify all information Any reliance on this information issolely at your own risk CBRE and the CBRE logo are service marks of CBRE Inc All other marks displayed on this document are the property of their respective owners and the use of such logos does not imply any affiliation with or endorsement of CBRE
1
2
45
6
7
8
9
1 0
1 1
1 2
LORTON
MANASSAS
WOODBRIDGE
FORT HUNTNEWINGTON
LAKE RIDGE
CENTREVILLE
HERNDON
MANASSAS PARK
RESTON
STERLING
CHANTILLY
FAIRFAX STATION
ANNANDALE
BETHESDA
BURKE
FAIRFAX
FALLS CHURCH
NORTH BETHESDA
TYSONS CORNER
VIENNA
POTOMAC
MCLEAN
OAKTON
SPRINGFIELD
GROVETON
IDYLWOOD
JEFFERSON
LINCOLNIA
WEST SPRINGFIELD
WOLF TRAP
ADELPHI
BELTSVILLE
BOWIE
CALVERTON
CAMP SPRINGS
CLINTON
COLLEGE PARK
FORESTVILLE
GREENBELT
HILLCREST HEIGHTS
HYATTSVILLE
LANHAM
ROSARYVILLE
GLENN DALE
CORAL HILLS
EAST RIVERDALE
KETTERING
WASHINGTON201
267
28295
295
381
110
5
50
29
301
695
66
270
495
395
95
495
495
495
95
WASHINGTONDULLES INTL
AIRPORT
RONALD REAGANWASHINGTON
NATL ARPT
POTOMACAIRFIELD
FREEWAYAIRPORT
COLLEGE PARK AIRPORT
2020 MID ATLANTIC MULTIFAMILY DELIVERIESNORTHERN VIRGINIA
sup1 0 2 41
Miles
MULTIFAMILY DELIVERY
Leased 20Developer Novare Group Mulberry Development Group
8 Cameron SquareUnits 302
Leased 22Developer Praedium Group
7 The ClarkUnits 342
Leased 5Developer Erkiletian DevelopmentPCCP
6 The Sur at National GatewayUnits 360
Leased 65Developer Orr Partners
5 Centro ArlingtonUnits 366
Leased 12Developer Washington Real Estate Investment Trust
3 The TroveUnits 401
Leased 34Developer Saul Centers REIT (Northwestern Mutual Life Insurance)
2 The WaycroftUnits 490
Developer Combined Properties
4 Scout on the CircleUnits 400
Leased 21Developer Perseus RealtyELVFour Points
1 Foundry at CarlyleUnits 525
Leased 49Developer Shooshan Co Brandywine Realty Trust
10 4040 WilsonUnits 244
Leased 25Developer Abramson Properties Weingarten Realty AHDC
9 Array at West AlexUnits 278
Leased 40Developer Elm Street DevelopmentNorthwood Ravin
12 Preserve at Westfields - Phase IUnits 132
Leased 17Developer Novus
11 Mission LoftsUnits 157
Leased 21
Leased 34
Leased 12
Leased 7
Leased 65
Leased 5
Leased 22
Leased 20
Leased 25
Leased 49
Leased 17
Leased 40
Source Axiometrics 2020
VIRGINIA TECH INNOVATION CAMPUS
AMAZON HQ2
3
14
NORTHERN VIRGINIA H12020
$494500000SALES IN H1 2020
1823 UNITSSOLD IN H1 2020
9 PROPERTIES
Deliveries Net Absorption VacancyYear
NoVA BY THE NUMBERS
43
$1992
10135 UNITSUNDER CONSTRUCTION
3997 UNITSDELIVERED IN 2020
STABILIZED VACANCY
PIPELINE
CLASS A AVG RENTS
CLASS B AVG RENTS
Source CBRE Research and Delta Associates
As of June 30 2020
PER UNIT PER MONTH
14567 UNITS36-MONTH PIPELINE
Just under 4000 units delivered in H1 2020 which equates to a 10 increase in total inventory throughout the year Arlington accounted for 59 of new deliveries and Alexandria accounted for 27 The average lease-up pace for properties in Northern Virginia is currently 21 units per month compared to 24 units per month in January 2020 Northern Virginiarsquos current stabilized vacancy is 43 a 70 bps YoY increase
Job Growth YoY as of June 2020EMPLOYMENT
Northern Virginia experienced the YoY employment decline of 134700 jobs Leisure and Hospitality fared the worst with the loss of 64500 jobs and Education and Health Services with the loss of 32100 jobs However there was growth in Information and Financial Activities industries At the start of the year unemployment was at 25 and it currently stands at 86
As of June 2020 Amazon has already hired 1000 employees It is estimated that Amazon will bring 1200 employees in 2020 and an additional 2000 employees in 2021
CAPITAL MARKETS
PER SF PER MONTH$217
$1746 PER UNIT PER MONTH
PER SF PER MONTH$194
VacancyNorthern Virginia SummaryUnits
Delivered
DEVELOPMENT
-70000 -60000 -50000 -40000 -30000 -20000 -10000 0 10000
H1 2020 NoVa Employment
-70000 -50000 -30000 -10000 0 10000
5
4
3
2
1
02014 2015 2016 2017 2018 2019 H1
2020H2
2020
10000
8000
6000
4000
2000
02021 2022
StateLocal Government
Federal Government
Other Services
Leisure and Hospitality
Education and Health Services
Professional and Business Services
Financial Activities
Information
Retail Trade
Wholesale Trade
Trade Transportation and Utilities
Manufacturing
Mining Logging and Construction
0
001
002
003
004
005
006
0
1000
2000
3000
4000
5000
6000
7000
8000
9000
2014 2015 2016 2017 2018 2019 H1 2020 H2 2020 2021 2022
Vaca
ncy
Units
Deliveries Net Absorption Vacancy
Forecast
15
NORTHERN VIRGINIA H1 2020
NoVA HOME PRICES
Property Year Built Sold Price Units $Unit
The Emerson 2019 012720 $117000000 355 $329577
Avana Alexandria 1991 013020 $106000000 326 $325153
Ravensworth Towers 1973 041120 $59000000 219 $269406
The Bradley 2015 012020 $57666667 165 $349495
Monroe Place 2008 032620 $56950000 202 $281931
LARGEST SALESNoVA MULTIFAMILY SALES VOLUME
Class A High-Rise Avg $UnitMo
Avg $SFMo Vacancy YoY Rent
Change
Alexandria $2124 $243 54 -33
RosslynBallston Corridor $2490 $300 36 -27
Crystal CityPentagon City $2356 $268 74 -72
South Arlington $2024 $232 45 00
Tysons $2264 $252 78 -134
RestonHerndon $2106 $226 95 -71
Falls ChurchMerrifield $2117 $234 55 -70
Class B Mid-and High Rise Avg $UnitMo
Avg $SFMo Vacancy YoY Rent
Change
Falls ChurchNorth Arlington $2264 $249 54 07
South Arlington $1674 $198 21 -01
Arlandria $1662 $220 16 11
West Alexandria $1666 $183 54 -04
Crystal City $2226 $206 62 -60
RENTAL RATES
$650000
$625000
$600000
$575000
$550000
$5250002014 2015 2016 2017 2018 2019
$5000000000
$4000000000
$3000000000
$2000000000
$1000000000
$0
Northern Virginia experienced rent decreases compared to H1 2019 with the exception of Class-A product in South Arlington and Class-B product in Falls ChurchNorth Arlington and Arlandria Class-A rents fell by 41 to $1992unitmonth or $217 per square foot Class-A vacancy in Northern Virginia is currently 49 and concessions are at 50 of face rent RestonHerndon and Tysons have the highest Class-A vacancy at 95 and 78 due in most part to increased deliveries in those submarkets Class B rents fell 16 YoY to $1746unitmonth or $194 per square foot Class-B vacancy is currently 39 and concessions are 20 of face rent Crystal City has the highest Class-B vacancy at 62 Class-A and Class-B rents fell by a total of 25 YoY
Homes values in Northern Virginia continue to see impressive growth as demand significantly outweighs supply in 2020 New listing inventory was down by 35 this year and prices continue to climb Homes are on the market for an average of 35 weeks before selling The current median home value in Northern Virginia is $641002 which is a 44 YoY increase across the region Alexandria is the fastest growing housing market in the nation with 202 YoY median sale value growth Arlington County currently maintains the highest home value in Northern Virginia and experienced an 11 YoY increase The high cost of home buying in Northern Virginia will likely drive multifamily demand as renters are priced out of the for sale housing market
A total of $4945M multifamily sales transacted in Northern Virginia in nine properties in the first half of 2020 Value-add sales accounted for 77 of transactions and CoreCore-Plus sales made up the remaining 23 of total investment volume The highest price per unit sales were The Bradley a 165-unit property in Alexandria which sold at $349500 per unit and The Emerson a 355-unit property in Herndon which sold at $329600 per unit
JEFFERSON FAIR OAKS
$520000
$540000
$560000
$580000
$600000
$620000
2014 2015 2016 2017 2018 2019
NoVA Average Sold Home Price
$0
$1000000000
$2000000000
$3000000000
$4000000000
$5000000000
2013 2014 2015 2016 2017 2018 2019 H1 2020
NoVA Sales Volume
2018 20192016 20172014 20152013 H1 2020
$500000$520000$540000$560000$580000$600000$620000$640000$660000
2014 2015 2016 2017 2018 2019 2020
NoVA Average Sold Home Price
2020
16
SUBURBAN MD H1 2020
SUBURBAN MARYLAND
SUBURBAN MARYLAND OVERVIEW
Suburban Maryland fared the best in terms of rent growth absorption and transaction volume compared to the other markets in Washington DC Its lower density setting may be in part responsible for its recent resilience as residents choose to relocate out of higher density urban areas
Suburban Maryland is one of the most prominent areas in the region for the Life Sciences sector and is home to the headquarters of the National Institute of Health Department of Energy the Food and Drug Administration and the National Institute of Standards and Technology The presence of biotech in the I-270 Corridor in particular has greatly benefited the commercial real estate market in office industrial and multifamily Life Sciences buildings have significantly lower vacancy rates than that of other commercial office buildings As of 2019 laboratory vacancy sits at around 50 on average while office vacancy rate in Suburban Maryland is nearly 19 Montgomery and Prince Georgersquos counties continue to be largely unique in their growth of biotech because they remain suburban areas in comparison to Life Sciences hubs such as Boston New York and San Francisco that continue to grow as urban areas
Although investment activity slowed down considerably across the region Suburban Maryland is an outlier Over $12B transacted in H1 2020 which is more than H1 2019 when $893M transacted
17
SUBURBAN MD H1 2020
2020 DELIVERIES MAP
SUBURBAN MD DELIVERIES
Deliveries slowed in Suburban Maryland with an addition of 492 units across three projects in H1 2020 The deliveries were Bainbridgersquos Bainbridge Lake Linganore a 322-unit property in Frederick NV Commercial Brick Lanersquos The Bottling Plant a 86-unit property in Outlying Frederick County and Landex Developmentrsquos Artisan 4100 an 84-unit property in Brentwood There are currently 6441 units under construction which will add a total of 35 to total inventory over the next 24 months Bethesda has the highest concentration of development activity with just over 1900 units delivering in the next 36 months Unlike other markets in the DC metro Suburban Marylandrsquos vacancy which currently stands at 36 was not largely impacted in the past six months
382274copy 2020 CBRE Inc All rights reserved This information has been obtained from sources believed reliable but has not been verified for accuracy or completeness You should conduct a careful independent investigation of the property and verify all information Any reliance on this information issolely at your own risk CBRE and the CBRE logo are service marks of CBRE Inc All other marks displayed on this document are the property of their respective owners and the use of such logos does not imply any affiliation with or endorsement of CBRE
1
2
3
HERNDONRESTON
STERLING
BALLENGER CREEK
ASPEN HILL
BETHESDA
CHILLUM
NORTH BETHESDA
ROCKVILLE
SILVER SPRING
TAKOMA PARK
TYSONS CORNER
VIENNA
WHEATON-GLENMONT
WHITE OAK
POTOMAC
MCLEAN
COLESVILLENORTH POTOMAC
IDYLWOOD
WOLF TRAP
ADELPHI
BELTSVILLE
BOWIE
CROFTONGREENBELT
HYATTSVILLELANHAM
LAUREL
ODENTONSOUTH LAUREL
CATONSVILLE
COLUMBIA
DAMASCUS
GAITHERSBURG
LINTHICUM HEIGHTS
NORTH LAURELOLNEY
PIKESVILLE
WOODLAWN
SEVERN
ARBUTUS
MONTGOMERY VILLAGE
GERMANTOWN FERNDALE
ELDERSBURG
LOCHEARN
MAYS CHAPEL
REISTERSTOWN
DUNDALK
PERRY HALL
RIVIERA BEACH
ROSEDALE
SEVERNA PARK
TOWSON
ARNOLD
ESSEX
GLEN BURNIE
PASADENA
PARKVILLE
SOUTH GATE
OVERLEANOTTINGHAM
ANNAPOLIS NECK
WASHINGTON
ANNAPOLIS
BALTIMORE
201
3
295
267
7
100
15
50
15
340
40 1
29
301
301
270
495
70
83
195
95
66
97
895
95
95
695
270395
695
WASHINGTONDULLES INTL
AIRPORT
TIPTONAIRPORT
LEE AIRPORT
BALTIMOREWASHINGTONINTL AIRPORT
MARTIN STATEAIRPORT
2020 MID ATLANTIC MULTIFAMILY DELIVERIESSUBURBAN MARYLANDMULTIFAMILY DELIVERY
sup1 0 3 615Miles
Leased 20Developer Landex Development
3 Artisan 4100Units 84
Leased 60Developer NV Commercial Brick Lane
2 Bottling PlantUnits 86
Leased 9Developer Bainbridge Companies
1 Bainbridge Lake LinganoreUnits 322Leased 9
Leased 60
Leased 20
18
-45000 -40000 -35000 -30000 -25000 -20000 -15000 -10000 -5000 0 5000
H1 2020 SubMD Employment
SUBURBAN MD H1 2020
Job Growth YoY
EMPLOYMENT
$12 BILLIONSALES IN H1 2020
5006 UNITSSOLD IN H1 2020
14 PROPERTIES
5000
4000
3000
2000
1000
0
6
5
4
3
2
1
0
VacancyUnits
Delivered Suburban MD Summary
Deliveries Net Absorption Vacancy
Year
DEVELOPMENTSUBURBAN MD BY THE NUMBERS
36
$1905
6441 UNITSUNDER CONSTRUCTION
492 UNITSDELIVERED IN 2020
STABILIZED VACANCY
PIPELINE
CLASS A AVG RENTS
CLASS B AVG RENTS
Source CBRE Research and Delta Associates
As of June 30 2020
PER UNIT PER MONTH
13773 UNITS36-MONTH PIPELINE
As the most affordable option for residents in Washington DC Suburban Maryland continues to provide job opportunities and relatively affordable living Just under 500 units delivered in H1 2020 and 100 units have been absorbed so far this year Suburban Marylandrsquos current stabilized vacancy is 36 down 30 bps from last year
CAPITAL MARKETS
Suburban Maryland experienced the YoY loss of 111400 jobs The most impacted industries were Leisure and Hospitality with a 40 decrease in employment and Education and Health Services with a loss of 15 of employees Trade and Transportation also lost just under 20000 jobs The Federal Government saw a growth of 1000 employees Unemployment in Montgomery and Prince Georgersquos counties is currently 80 and 99 respectively up from 28 and 36 respectively in January 2020
$203PER SF PER MONTH
$1591PER UNIT PER MONTH
$173PER SF PER MONTH
2014 2015 2016 2017 2018 2019 H12020
H22020
2021 2022
StateLocal Government
Federal Government
Other Services
Leisure and Hospitality
Education and Health Services
Professional and Business Services
Financial Activities
Information
Retail Trade
Wholesale Trade
Trade Transportation and Utilities
Manufacturing
Mining Logging and Construction
-35000 -25000 -15000 -5000 0 10000
00
10
20
30
40
50
60
0
500
1000
1500
2000
2500
3000
3500
4000
4500
2014 2015 2016 2017 2018 2019 H12020
H22020
2021 2022
Vacanc
y
Units
Deliveries Net Absorption Vacancy
Forecast
19
SUBURBAN MD H1 2020
SUBURBAN MD HOME PRICES
Property Year Built Sold Price Units $Unit
4701 Willard 1969 062920 $276500000 525 $526667
The Varsity 2011 032720 $146022026 258 $565977
Gallery on New Hampshire 1960 022820 $117000000 675 $173333
Montgomery Paint Branch 1984 061220 $113206000 529 $214000
Jefferson at Inigos Crossing 2008 011320 $109000000 473 $230444
LARGEST SALESSUBURBAN MD MULTIFAMILY SALES VOLUME
Class A High Rise Avg $UnitMo Avg $SFMo Vacancy YoY Rent
Change
Bethesda $2670 $293 72 31
N Bethesda Rockville $2047 $223 60 22
Silver Spring Wheaton $2012 $242 35 18
Hyattsville College Park $1867 $206 46 NA
Class B Mid-and High-Rise Avg $UnitMo Avg $SFMo Vacancy YoY Rent
Change
Silver Spring $1622 $169 920 -190
BethesdaChevy Chase $1982 $217 520 -530
Rockville $1709 $184 430 450
RENTAL RATES
$400000
$380000
$360000
$340000
$320000
2014 2015 2016 2017 2018 2019
$3000000000
$2500000000
$2000000000
$1500000000
$1000000000
$500000000
$0
Although no markets saw overall positive rent growth over the past year Suburban Maryland was the least negatively impacted region in the metro in terms of rental rates Class-A rents declined by 13 YoY to an average of $1905unitmonth or $203 per square foot Class-A vacancy currently stands at 45 Class-B rents declined 10 to an average of $1591unitmonth or $173 per square foot Class-B vacancy currently stands at 31 Overall Class-A and Class-B apartment rents fell by a total of 11 YoY to an average of $1697unitmonth or $183 per square foot
Home prices have dropped slightly in Suburban Maryland after four consecutive years of positive growth The current median home sale price is $393000 The robust effect of the Amazon announcement has spilled over into Suburban Marylandrsquos housing market as a desirable and often more affordable option than Northern Virginia Much of Suburban Maryland multifamily properties remain within the ideal 30-minute commute from large employment drivers such as Amazon HQ2 and parts of Washington DC
Investment activity was highest in Suburban Maryland as $1222570000 traded in 13 sales in the first half of 2020 Value-Add product made up a majority of transaction volume at 61 while CoreCore-Plus accounted for the remaining 39 4017 Willard was the highest sale in terms of total volume and price per unit at $267500000 and $526667 per unit
BETHESDA ROW
NORTHLAKE
$310000
$320000
$330000
$340000
$350000
$360000
$370000
$380000
$390000
$400000
2014 2015 2016 2017 2018 2019 2020
Sub MD Median Home Sales Price
2020
$0
$500000000
$1000000000
$1500000000
$2000000000
$2500000000
$3000000000
2013 2014 2015 2016 2017 2018 2019 H1 2020
Sub MD Sales Volume
2018 20192016 20172014 20152013 H1 2020
4701 WILLARD
20
BALTIMORE METRO H1 2020
BALTIMORE METRO OVERVIEW
While the Baltimore metro is performing well compared to other metros across the country the region has seen the effects of the COVID-19 pandemic with impacts to employment transaction volume rent growth and absorption rates Over 172000 jobs were lost in greater Baltimore since Q2 2019 which is a 12 decrease in total nonfarm employment The June 2020 unemployment rate in the Baltimore metro is 80 which is a 450 bps increase from January 2020 Baltimore however is considered to be better positioned than other regions to weather the current economic downturn due to its impressive resilience in previous recessions In the Global Financial Crisis Baltimore ranked sixth in terms of GDP growth and ninth in payroll job growth across the nation
Just over 2400 units delivered in the Baltimore metro in H1 2020 and 2532 units are currently under construction The average rent in Baltimore is $1759unitmonth or $185 per square foot An aggregate of $506M in sales transacted across 13 sales CBRE brokered two of the three largest transactions in H1 2020 across the Baltimore metro
BALTIMORE METRO
21
BALTIMORE METRO H1 2020
382274copy 2020 CBRE Inc All rights reserved This information has been obtained from sources believed reliable but has not been verified for accuracy or completeness You should conduct a careful independent investigation of the property and verify all information Any reliance on this information issolely at your own risk CBRE and the CBRE logo are service marks of CBRE Inc All other marks displayed on this document are the property of their respective owners and the use of such logos does not imply any affiliation with or endorsement of CBRE
1
2
3
4
5
6
7
8
91 0
CATONSVILLE
ELKRIDGE
ELLICOTT CITY
LINTHICUM HEIGHTS
PIKESVILLE
RANDALLSTOWN
WOODLAWN
SEVERN
ARBUTUS
FERNDALE
LOCHEARN
MAYS CHAPEL
MILFORD MILL
OWINGS MILLS
REISTERSTOWN
DUNDALK
MIDDLE RIVER
PERRY HALL
RIVIERA BEACH
ROSEDALE
ESSEX
GLEN BURNIE
PARKVILLE
EDGEWOODJOPPA
CARNEY
GREEN HAVEN
OVERLEA
ROSSVILLE
JOPPATOWNE
BALTIMORE
295
24
924
100
29
1
70
83
83
195
97
895
95
95
395
695 95
BALTIMOREWASHINGTONINTL AIRPORT
MARTINSTATE
AIRPORT
2020 MID ATLANTIC MULTIFAMILY DELIVERIESBALTIMORE
sup1 0 15 3075
Miles
MULTIFAMILY DELIVERY
Leased 45Developer Sid Emmer
8 The View at Mill Run Phase IIUnits 157
Developer Greystar
7 Elan TowsonUnits 208
Leased 40Developer La Cite
6 CenterWest- Phase 1AUnits 262
Developer Klein EnterprisesManekin LLC
5 The WoodberryUnits 284
Leased 35Developer AvalonBay CommunitiesRetail Properties
3 Avalon TowsonUnits 371
Leased 7Developer Wood Partners
2 Alta Brewers HillUnits 371
Leased 4Developer Chesapeake Realty Partners
4 Avenue GrandUnits 324
Leased 36Developer Howard Hughes
1 Juniper - Merriweather DistrictUnits 380
Leased 67Developer Atlantic Realty
10 The MorrisonUnits 15
Leased 10Developer Zahlco
9 9 E Mount Royal StreetUnits 65
2020 DELIVERIES MAP
BALTIMORE METRO DELIVERIES
Deliveries picked up in Baltimore throughout 2020 with the addition of 2437 units throughout the metro equating to a 12 increase in total inventory More units delivered in the first half of 2020 than were delivered in all of 2019 The largest deliveries were Howard Hughesrsquo Juniper a 380-unit property as part of the Merriweather District in Columbia Wood Partnersrsquo Alta Brewers Hill a 371-unit property in Baltimore City and Avalonbay Communitiesrsquo Avalon Towson a 371-unit property in Towson There are currently 2532 units under construction that are expected to deliver in the next 24 months The average lease-up pace for properties in Baltimore is 15 units per month
Leased 36
Leased 7
Leased 35
Leased 4
Leased 34
Leased 40
Leased 19
Leased 45
Leased 10
Leased 67
Source Yardi Matrix 2020 Source Axiometrics 2020
22
BALTIMORE METRO H1 2020
Job Growth YoY EMPLOYMENT
$506028000SALES IN H1 2020
2913 UNITSSOLD IN H1 2020
14 PROPERTIES
10000
8000
6000
4000
2000
0
7
6
5
4
3
2
0
VacancyUnits
Delivered Baltimore Metro Summary
Deliveries Net Absorption Vacancy
Year
DEVELOPMENTBALTIMORE METRO BY THE NUMBERS
500
$1759
2532 UNITSUNDER CONSTRUCTION
2437 UNITSDELIVERED IN 2020
STABILIZED VACANCY
PIPELINE
TOTAL AVG RENTS
Source CBRE Research Axiometrics and Delta Associates
As of June 30 2020
PER UNIT PER MONTH
6906 UNITS36-MONTH PIPELINE
Deliveries in Baltimore picked up with an additional 2437 units in H1 2020 Just under 2000 units were absorbed in the past 12 months most of them before the beginning of 2020 which has caused vacancy to increase in H1 2020 Across the Baltimore metro vacancy increased 80 bps to 50 In the Baltimore Suburbs vacancy stands at 44 up 10 bps YoY and in Baltimore city vacancy is 66 up 290 bps YoY
During the recent downturn Baltimore experienced a loss of 172500 jobs The most impacted sector was Leisure and Hospitality in which 45 of employees were furloughed or laid off Education and Health Services also took a loss of 30800 jobs Federal Government and Mining Logging and Construction were the only industries to see job growth with an increase of 800 employees and 3300 respectively The spike in Mining Logging and Construction may have been the result of the emergency expansion of Baltimorersquos hospitals and uninterrupted construction at existing development sites At the start of 2020 Baltimorersquos unemployment rate was 35 and is currently 95 There are currently 1253600 nonfarm employees in the Baltimore metro
CAPITAL MARKETS
$185PER SF PER MONTH
09RENT GROWTH
NORTHERN SUBURBS
-010SOUTHERN SUBURBS
-50000 -30000 -10000 0 10000-70000 -60000 -50000 -40000 -30000 -20000 -10000 0 10000
H2 2020 Baltimore Employment
2015 2016 2017 2018 2019 2020 2021 2022 2023 2024 20250
1
2
3
4
5
6
7
-2000
0
2000
4000
6000
8000
10000
Vacanc
y ()
Units
Rentable Completions(Units)
Net Absorption(Units)
Vacancy Rate(Avg )
StateLocal Government
Federal Government
Other Services
Leisure and Hospitality
Education and Health Services
Professional and Business Services
Financial Activities
Information
Retail Trade
Wholesale Trade
Trade Transportation and Utilities
Manufacturing
Mining Logging and Construction
Forecast
23
BALTIMORE METRO H1 2020
BALTIMORE METRO HOME PRICES
Property Year Built Sold Price Units $Unit
Townes at Holly Station 1985 042320 $115000000 510 $225490
Chatham Gardens 1980 041720 $83280000 414 $201159
The Point at Elkridge 1988 032720 $72500000 312 $232372
BLVD at White Springs 1977 040820 $61099000 459 $133113
Old Orchard 1986 041720 $33179940 180 $184333
LARGEST SALESBALTIMORE METRO MULTIFAMILY SALES VOLUME
Submarket Avg $UnitMo Avg $SFMo Vacancy
Annapolis $1749 $198 49
Baltimore City East $1434 $179 55
Baltimore City North $1095 $135 69
Baltimore City West $996 $125 41
ColumbiaNorth Laurel $1643 $170 44
Downtown Baltimore $1548 $189 85
Ellicott CityElkridge $1609 $167 47
Far North Baltimore Suburbs $1310 $136 29
Northeast Anne Arundel County $1374 $157 42
Northwest Anne Arundel County $1720 $172 51
Owings MillsPikesvilleRandallstown $1365 $132 45
ParkvilleCarneyPerry Hall $1164 $135 36
Southeast Baltimore County $1097 $132 38
Southwest Baltimore County $1172 $131 45
TowsonHunt Valley $1390 $140 53
RENTAL RATES - ALL PRODUCT TYPES
$3000000000
$2500000000
$2000000000
$1500000000
$1000000000
$500000000
$0
2014 2015 2016 2017 2018 2019
$255000
$250000
$245000
$240000
$235000
$220000
$205000
Rent growth in the Baltimore metro remained largely flat since June 2019 The Northern Baltimore Suburbs experienced 09 rent growth the Southern Baltimore Suburbs experienced a drop of 01 rent growth and Baltimore City rents fell by 30 The Baltimore suburbs outpaced Baltimore City in terms of rent growth and absorption Current vacancy in the Baltimore metro is 50 with the highest vacancies in Downtown Baltimore at 85 Baltimore City North at 69 and Baltimore City East at 55 According to Delta Reports the Howard CountyColumbia submarket fared the best in the metro with 27 YoY rent growth
Home values in the Baltimore metro increased 20 YoY up slightly from the five-year average growth rate of 15 The current median sales price in the Baltimore metro is $251000 Single-family homes in Baltimore County posted a 10-year high median sale price of $330000 This is a 6 YoY increase from June 2019 Homes in Baltimore City also posted a 10-year high median sale price of $238000 Of note Owings Mills experienced a 27 YoY increase in median home value for an average of $415000
Investment activity reached $506M in the Baltimore metro during the first two quarters of 2020 in 14 transactions All but one sale was value-add product The highest sales in terms of price per unit were Point at Elkridge a 312-unit property in Elkridge which sold for $232400 per unit and Townes at Holly Station a 510-unit property in Waldorf which sold for $225500 per unit CBRE brokered both sales
TOWNES AT HOLLY STATION
$215000
$220000
$225000
$230000
$235000
$240000
$245000
$250000
2014 2015 2016 2017 2018 2019
Baltimore Metro Median Sale Price
$0
$500000000
$1000000000
$1500000000
$2000000000
$2500000000
$3000000000
2013 2014 2015 2016 2017 2018 2019 H1 2020
Balitmore Metro Sales Volume
2018 20192016 20172014 20152013 H1 2020
$210000$215000$220000$225000$230000$235000$240000$245000$250000$255000
2014 2015 2016 2017 2018 2019 2020
Baltimore Metro Median Sale Price
2020
24
FOR SALES OR FINANCING INFORMATION CONTACT
William S RoohanVice Chairman(O) +1 410 244 3122(M) +1 443 690 6967billroohancbrecom
Michael E MuldowneyExecutive Vice President(O) +1 410 244 3144(M) +1 443 250 3144mikemuldowneycbrecom
Robert G Dean IIISenior Vice President(O) +1 202 585 5766(M) +1 202 578 6941robertdeancbrecom
Jonathan M GreenbergSenior Vice President(O) +1 703 734 4772(M) +1 202 423 6655jonathangreenbergcbrecom
Martha A HastingsSenior Vice President(O) +1 410 244 3162(M) +1 410 807 2450marthahastingscbrecom
Brian H MargerumSenior Vice President(O) +1 410 244 3135(M) +1 443 386 1096brianmargerumcbrecom
Michael D RudolphSenior Vice President(O) +1 410 244 3121(M) +1 443 928 0392michaelrudolphcbrecom
John T Sheridan JrSenior Vice President(O) +1 703 905 0239(M) +1 703 200 7720johnsheridancbrecom
Yalda G HowellFirst Vice President(O) +1 202 585 5677(M) +1 240 462 2332yaldaghamariancbrecom
Thomas B LeachmanVice President(O) +1 202 585 5638(M) +1 240 688 0189thomasleachmancbrecom
Kemp D BroujosSenior Associate(O) +1 202 585 5724(M) +1 443 786 2951kempbroujoscbrecom
Nathan E BarthAssociate(O) +1 703 905 0228(C) +1 703 340 6828nathanbarthcbrecom
Zachary L StoneSales Assistant(O) +1 202 585 5650 (M) +1 202 713 8404zachstonecbrecom
Investment Sales amp Brokerage
Operations amp Marketing
Debt amp Structured Finance Team
Patricia C BonebrakeSenior Director of Operations(O) +1 410 244 3141(C) +1 443 253 5917trishbonebrakecbrecom
Jennifer W BusseyOperations Manager(O) +1 410 244 3134(C) +1 410 300 1302jenniferbusseycbrecom
Cheryl FinlaysonProductions Systems Manager(O) +1 410 244 7100(C) +1 410 244 3101cherylfinlaysoncbrecom
Margaret O MacleayOperations Supervisor(O) +1 202 585 5638(C) +1 410 562 9340maggiemacleaycbrecom
Rachel L MossmanSenior Communications Specialist(O) +1 410 244 3179(C) +1 410 244 7100rachelmossmancbrecom
Samantha S FifieldSales Assistant(O) +1 202 585 5773(C) +1 310 266 0003samanthafifieldcbrecom
Caroline P LekakosClient Services Coordinator(O) +1 202 585 5606(C) +1 240 595 0642carolinelekakoscbrecom
Yasmeen F ShararaClient Services Coordinator(O) +1 202 585 5580(C) +1 301 828 7435yasmeenshararacbrecom
Lauren E SpielmanClient Services Coordinator(O) +1 410 244 3129(C) +1 443 800 4388laurenspielmancbrecom
Grace F TrimbleClient Services Coordinator(O) +1 410 244 3123(C) +1 410 499 1064gracetrimblecbrecom
David F WebbVice Chairman(O) +1 202 585 5721(M) +1 202 744 4900davidwebbcbrecom
Maximiliane T LeachmanExecutive Vice President(O) +1 202 585 5655(M) +1 404 358 4317maxileachmancbrecom
Justin J GlasgowSenior Vice President(O) +1 202 783 1723(M) +1 202 316 1804justinglasgowcbrecom
RESEARCH TEAM
JEANETTE I RICE Americas Head of Multifamily Research (O) +1 214 979 6169
(C) +1 817 412 0709 jeanettericecbrecom
MOLLY M HUNT Research Analyst (O) +1 202 585 5597(C) +1 415 599 6009 mollyhuntcbrecom
RANK
1Fortune Magazinersquos
Most Admired Commercial Real Estate
Firm
REPUTATION
2Ranked the 2
Multifamily Brokerage Team in the entire nation by
Real Estate Forum
THE CBRE TEAM COMPETITIVE ADVANTAGE
25
RESOURCES
26Largest team and most
capacity in the Mid-Atlantic region
EXPERIENCE
$174B+The aggregate sales
value of deals our team has brokered since
2015
DEBT TEAM
1The CBRE Debt amp
Structured Finance Team is the 1 Freddie Mac
SellerServicer
copy Copyright 2020 All rights reserved Information contained herein including projections has been obtained from sources believed to be reliable but has not been verified for accuracy or completeness CBRE Inc makes no guarantee warranty or representation about it Any reliance on such information is solely at your own risk This information is exclusively for use by CBRE clients and professionals and may not be reproduced without the prior written permission of CBRErsquos Global Chief Economist CBRE and the CBRE logo are service marks of CBRE Inc andor its affiliated or related companies in the United States and other countries All other marks displayed on this document are the property of their respective owners Photos herein are the property of their respective owners Use of these images without the express written consent of the owner is prohibited
WASHINGTON DC1900 N Street NW
Suite 700 Washington DC 20036
+1 (202) 783 8200
BALTIMORE MD100 East Pratt Street
Suite 1700Baltimore MD 21202+1 (410) 244 7100
TYSONS VA1861 International Drive
Suite 300McLean VA 22102+1 (703) 821-6900

5
During previous recessions the Mid-Atlantic anchored by Washington DC and Baltimore proved to be the most resilient region in the country due to its diversified economy strong market drivers and the presence of the nationrsquos largest employermdashthe federal government The stability and dynamism of the regionrsquos economy underpins its resilient multifamily real estate market fundamentals
EXECUTIVE SUMMARY
bull Minimal Vacancy Change DC and Baltimore were ranked 3 and 5 respectively in terms of least amount of change in vacancy across the country during the 2008 recession at an average increase of only 150 bps
bull Most Stable Rents in the Nation Baltimore and DC ranked 1 and 2 respectively for least impacted rent growth in the nation and recovered in just six quarters compared to a national average of 12 quarters The regionrsquos peak-to-trough rent change was a mere 2 during the previous recessionmdashlower than the nearly 6 national average
bull Prolific Investment Market Since recovery in 2010 DCrsquos and Baltimores per unit increased by an average of 6 and 4 respectively as investors remain bullish on the region as a powerhouse center of the East Coast
bull Durability of Employment Base DC and Baltimore have historically lower unemployment rates compared to the US The strong and prominent labor markets of ldquoEds and Medsrdquo biotech and government are some of the most resilient industries through recessions Tech has also proven to be a pillar of the economy with significant future growth centered around the establishment of Amazonrsquos new HQ2 Washington is ranked 1 for lowest percentage of at-risk employment segments in the current downturn
These strong economic drivers will bolster the multifamily market drive demand and lead the region towards future growth
MID-ATLANTIC MULTIFAMILY MARKET
RESILIENCE PROVEN IN PREVIOUS RECESSIONS
0
2
4
6
8
10
01234567
Va
can
cy
Recession
Washington DC
Baltimore
Tech Boom
Tech Bust Post 911 RecessionPost Global Financial Crisis
Recovery Forecast
Atlanta
Baltimore
BostonChicagoDallasFt Worth
Denver
Detroit
Houston
Inland Empire
Long Island
Los Angeles
Miami
Minneapolis
New York CityOaklandOrange County
Orlando
Philadelphia
Phoenix
San Diego
San Francisco
Seattle
St Louis
Tampa
US
Washington DC
-16
-14
-12
-10
-8
-6
-4
-2
0
100 150 200 250 300 350
Rent
Chan
ge (
)
Vacancy Change (Bps)
Least Severe Downturn
Most Severe Downturn
METRO MARKET RENT amp VACANCY CHANGE IN LAST DOWNTURN
WASHINGTON DC amp BALTIMORE METROSrsquo VACANCY
CLICK HERE TO READ THE FULL REPORT ON CBRErsquoS
RESEARCH GATEWAY
-4
-2
0
2
4
6
8
10
Q12008
Q32008
Q12009
Q32009
Q12010
Q32010
Q12011
Q32011
YoY Re
nt Grow
th
Class A Class B Class C National
DC METRO YOY AVERAGE RENT GROWTH
-4
-2
0
2
4
6
8
10
Q12008
Q32008
Q12009
Q32009
Q12010
Q32010
Q12011
Q32011
YoY Re
nt Gr
owth
Class A Class B Class C National
BALTIMORE METRO YOY AVERAGE RENT GROWTH
OUTLOOKThe Mid-Atlantic is a booming market for millennials empty nesters and many others to live work and play in There are some challenges for developers investors and property managers in the short-term but the long-term future is bright The regionrsquos economy has strong fundamentals bolstered by the largest employer in the nation the federal government
Vacancy IncreasesWhile the Mid-Atlantic has performed at the top of the nation overall vacancy has increased in Washington DC and Baltimore by 90 bps and 80 bps respectively since Q2 2019 Unemployment and increased work from home flexibility have caused residents to consider alternative housing to save money on rent
High Rent CollectionsRent collections across the nation have been substantially higher than expectations in H1 2020 The National Multifamily Housing Council reported that 930 and 922 of residents paid rent across the nation in May and June respectively Approximately 940 of Washington DC residents paid rent in April and 892 of Baltimore residents paid rent in May
ADVANTAGES AND CHALLENGES FOR THE MULTIFAMILY INVESTORDEVELOPER
ADVANTAGES CHALLENGES
The Success of Virtual ToursVirtual tours have become the new normal for leasing offices in the Mid-Atlantic The per-project lease up rate in Washington DC is 14 units per month down only one unit from Q2 2019 In the Baltimore metro there are currently 18 projects in lease up with an average absorption rate of 15 units per project per month
Growing Tech TalentWashington DC has risen to the No 2 spot on CBRErsquos annual tech talent report coming in as the runner-up to the San Francisco Bay Area Washington has over 263000 tech workers and has experienced 10 growth since 2015 However Washington DCrsquos average apartment asking rate is ranked 8th in the nation indicating that it is one of the most affordable areas with the highest concentration of tech talent in the nation This growing labor market in high paying industries will continue to drive wages up and increase demand for Class-A and Class-B multifamily product
Click here to read CBRErsquos July 2020 Tech Talent Report
Significant PipelineThe Mid-Atlantic region will continue to see an influx of supply over the next few years Washington DC will experience an estimated increase of 15150 units in the next 12 months Construction has not slowed since the start of the year and over 3300 units began construction in the second quarter of 2020 In Baltimore 2437 units delivered in H1 2020 and 6906 units are on track to deliver in the next 36 months Developers are optimistic about future deliveries in 2021 with an expected market recovery that will renew demand
MID-ATLANTIC MULTIFAMILY MARKET
6
Eviction MoratoriumsThe Washington DC Councilrsquos emergency measures to respond to the pandemicrsquos economic impacts included a freeze on evictions and a prohibition on rent increases through October 2020 In Northern Virginia eviction freezes were extended to September 8 2020 In Maryland there are currently no eviction restrictions
MID-ATLANTIC H1 2020 ACCOLADES
bull Washington DC metro saw fewer YoY job losses than any other large metro in the country
bull Baltimore (80) and Washington DC (84) are ranked 8th and 10th for lowest unemployment rate across the largest 51 US metros
bull Washington DCrsquos net absorption as a percentage of total inventory was the second highest in the nation for large metros
bull Across Tier II markets Baltimore ranked first and second in the nation in terms of rent growth and lowest vacancy change
bull Across Tier I markets Washington DC ranked fourth in the nation in terms of rent growth and lowest vacancy change
bull Washington DC ranked 1 most risk-averse metro for employment base in the recent downturn
bull Washington DC ranked second in the nation in CBRErsquos Scoring Tech Talent report and has seen 10 industry growth since 2015
7
MID-ATLANTIC MULTIFAMILY MARKET
STRENGTH OF MULTIFAMILY INVESTMENTS
DEBT MARKETSDebt for multifamily investments is available at historic levels Interest rates are at all-time lows and offer multi-year interest-only periods These low-rate interest-only loans allow investors to achieve as high cash-on-cash leveraged returns as they have ever been able to achieve in the multifamily market and have helped to maintain low cap rates Currently attractive debt is available and equity is plentiful which typically means that private capital buyers have strong appetites There is a consensus among investors that multifamily as a need-based asset type remains a safe investment given the ubiquitous need for housing
While the CMBS markets have shown some distress the agency loan market has remained active Through the COVID-19 pandemic the GSEs have stepped up to fulfill their mission of providing liquidity to the multifamily market While their rates are at historically low levels they have increased their reserve requirements to protect themselves against current of future renterrsquos inability to make rent payments as a result of the pandemic These reserve requirements are sized to six months and are released to the owner once the property has maintained certain occupancyrental income requirements for a period post-closing and in the case of Freddie Mac once the emergency declarations andor stay at home orders have been lifted at the federal and local level These reserves typically amount to between 3 to 6 of the loan amount and most borrowers are willing to accept these requirements given the benefit of locking in sub 3 interest only long term debt As conditions stabilize or if a borrower is seeking relatively low leverage the requirement for debt service escrow is likely to mitigate or go away
AMAZON HQ2Amazonrsquos HQ2 is a generational market catalyst for employment and rent growth The new headquarters in Crystal City is slated to create 37000+ direct jobs over the next 14 years Amazon HQ2 is expected to occupy over 4M SF of office space accounting for 33 of Crystal Cityrsquos existing office inventory The expected average annual salaries of $150000 for Amazon employees could support apartment rents of more than $3750 per month As of Q2 2020 Amazon has already hired over 1000 employees It is estimated that Amazon will bring 1200 employees in 2020 and an additional 2000 employees in 2021 By 2023 when the two-million square foot campus near Pentagon City opens Amazon will employ over 5000 employees at HQ2 The second phase of construction will continue for several years with a full build-out of over 4M SF in the newly termed submarket ldquoNational Landingrdquo Amazon has received approximately $752M in subsidies for job creation from the state of Virginia and Arlington County Multifamily communities proximate to HQ2 are already experiencing significant rent growth As residents are priced out of Arlington County increased demand will radiate throughout Northern Virginia as residents seek a discount to in-fill Northern Virginia
The Amazon ldquoMultiplier EffectrdquoAmazon will not only draw entrepreneurs to the area but will also serve as a hub for startups and a magnet for venture capital within the greater DC MSA An infusion of new jobs to any region creates what economists call the ldquomultiplier effectrdquo The multiplier effect implies that Amazonrsquos 37000 employees could increase to as many as 185000+ indirect jobs and ldquomultiplyrdquo outwards
25000-35000 new STEM degrees over the next 20 years from the new $1B Virginia Tech Innovation Campus
Demand for an additional 40000-60000 rental units as a result of the ldquoAmazon Effectrdquo
THE DISTRICT
NORTHERN VIRGINIA
SUBURBAN MARYLAND
8
WASHINGTON DC H1 2020
WASHINGTON DC OVERVIEW
The District is experiencing negative effects of the COVID-19 pandemic with drops in rent absorption and rising vacancy throughout the apartment market The average monthly Class-A rent fell 35 YoY to a monthly average of $2561 per unit per month or $327SF The average Class-B rent fell 27 to an average of $2067unitmonth or $274SF
Just over 3000 units across the city delivered in the first half of 2020 and 12969 units are currently under construction Capitol Riverfront emerged as the leading submarket in terms of development activity with a 1475-unit increase with the delivery of The Estate The Kelvin Parc Riverside Phase I Meridian on First and The Maren Multifamily capital markets finished H1 2020 with $292860000 sold throughout the District over 9 sales The COVID-19 pandemic has slowed investment activity significantly as investors weather the storm of economic volatility Comparatively in the first half of 2019 over $685000000 transacted over 30 sales
THE DISTRICT
9
WASHINGTON DC H1 2020
2020 DELIVERIES MAP
THE DISTRICT DELIVERIES
Over 3000 units delivered to the District in H1 2020 accounting for a 21 increase to the total multifamily housing inventory The pipeline continues on a steady upward trend and will not slow until late 2022 There are currently 12696 units under construction that will increase the total multifamily inventory by 88 over the next two years
NoMa H Street Corridor Union Market and Capitol Riverfront are the most active submarkets in terms of development activity These growing areas continue to deliver Class-A luxury apartment buildings in areas that are also seeing retail and office space developments
382274copy 2020 CBRE Inc All rights reserved This information has been obtained from sources believed reliable but has not been verified for accuracy or completeness You should conduct a careful independent investigation of the property and verify all information Any reliance on this information issolely at your own risk CBRE and the CBRE logo are service marks of CBRE Inc All other marks displayed on this document are the property of their respective owners and the use of such logos does not imply any affiliation with or endorsement of CBRE
1
2
3
4
5 6
7
8
9
1 0
1 1
WASHINGTON
295
5050
695
395
395
395
Rhode Island Ave NE
Virginia Ave NW
Rhode Island Ave NW
H St NE
Min
neso
taAv
eN
E
Q St NW
Potomac Ave SE
11
th S
t S
E
Minnesota Ave SE
13
th S
t N
W
13
th S
t N
E
Pennsylvania Ave SE
3rd
St
NW
So
uth
Ca
pit
ol
St
12
thS
tS
W
Florida Ave NE
9th
St
SW 7th
St
SW
9th
St
NW
Pennsylvania Ave NW
Tenn
esse
eAv
eN
E
E Capitol St SE
US-1N
6th
St
NE
Massachusetts Ave NW
US-
1S
4th
St
NE
Independence Ave SE
14
thS
tS
W
Mt Olivet Rd NE
Constitution Ave NW
KentuckyAve
SE
9th
StN
E
Benning Rd NE
6th
St
SE
7th
St
NW
K St NW
Bra
nch
Ave
SE
6th
St
NW
New
Ham
pshi
re A
ve N
W
L St NW
E Capitol St NE
No
rth
Ca
pit
ol
St
14
th S
t N
W
North Carolin
a Ave SE
D St SW
9th
St
SE
22ndSt
NE
Texas AveSE
16
th S
t N
W
B St SE
2n
d S
t N
E
D St SE
21
stSt
NE
8th
St
SE
Maine
Ave
SW
12
th S
t S
E
Kenilw
orthAve
NE
M St SW
I St SE
Bryant St NW
19
th S
t N
W
17
th S
t N
W
11
th S
t N
E
Florida Ave NW
Maryland Ave NE
15
th S
t N
W
4th
St
SE
U St NW
M St NW
M St SE
RidgeRd
SE
Independence Ave SW
H St NW
C St NE
R St NW
2020 MID ATLANTIC MULTIFAMILY DELIVERIESWASHINGTON DC
sup1 0 025 05013
Miles
MULTIFAMILY DELIVERY
Leased 23Developer CAS RieglerEB5
8 BlackbirdUnits 167
Leased 7Developer FRP DevelopmentMRP Realty
7 The MarenUnits 264
Leased 6Developer Paradigm Development
6 Meridian on First IUnits 273
Leased 11Developer Toll Brothers
5 Parc Riverside Phase IIUnits 308
Leased 39Developer Brookfield Properties
3 The EstateUnits 320
Leased 43Developer RappaportWC SmithEB5
2 AvecUnits 420
Leased 36Developer Jair LynchMacFarlane Partners
4 The KelvinUnits 310
Leased 28Developer JBG SmithMRP Realty
1 The WrenUnits 433
Leased 4Developer Jefferson Apt GroupStars Investment
10 J LineaUnits 132
Leased 17Developer JBG Smith
9 901WUnits 161
Leased 42Developer Coba
11 1714-1716 14th Street NWUnits 8
Leased 28
Leased 43
Leased 39
Leased 36
Leased 11
Leased 6
Leased 7
Leased 23
Leased 17
Leased 4
Leased 42
10
-60000 -50000 -40000 -30000 -20000 -10000 0 10000
Q2 2020 DC Employment
WASHINGTON DC H1 2020
Job Growth YoY
-50000 -40000 -30000 -20000 -10000 0 10000
StateLocal Government
Federal Government
Other Services
Leisure and Hospitality
Education and Health Services
Professional and Business Services
Financial Activities
Information
Retail Trade
Wholesale Trade
Trade Transportation and Utilities
Manufacturing
Mining Logging and Construction
EMPLOYMENT
CAPITAL MARKETS
$292860000SALES IN H1 2020
845 UNITSSOLD IN H1 2020
9 PROPERTIES
Deliveries Net Absorption Vacancy
Year
DEVELOPMENTDC BY THE NUMBERS
61
$2561
12696 UNITSUNDER CONSTRUCTION
3004 UNITSDELIVERED IN 2020
STABILIZED VACANCY
PIPELINE
CLASS A AVG RENTS
CLASS B AVG RENTS
Source CBRE Research and Delta Associates
As of June 30 2020
PER UNIT PER MONTH
18907 UNITS36-MONTH PIPELINE
Recent deliveries in the District were concentrated primarily in the Capitol Riverfront and H Street submarkets NoMa and Union Market also remain top submarkets for development activity with around 3483 units under construction on-track to deliver in the next 24 months Annual absorption in the District was 25 lower than a year ago as 2003 units absorbed in the first half of the year Q2 stabilized vacancy rate in the District is 61 a 250 bps increase from the previous year The average lease-up pace of new product in the District is 14 units per month and concessions average 15 months free rent
Insulated by the federal government Washington DC has fared favorably thus far in the downturn compared to other large metros across the nation The District experienced 67000 job losses which represents an 8 YoY loss in employment Leisure and Hospitality suffered the biggest job loss as 60 of the workforce was laid off or furloughed Promisingly government information and other services were the only industries to experience job growth albeit small
PER SF PER MONTH$327
$2067PER UNIT PER MONTH
PER SF PER MONTH$274
7000
6000
5000
4000
3000
2000
1000
0
8
7
6
5
4
3
2
1
0
VacancyUnitsDelivered
Washington DC Summary
2013 2014 2015 2016 2017 2018 2019 2021 2022H22020
H12020
00
10
20
30
40
50
60
70
80
90
0
1000
2000
3000
4000
5000
6000
7000
2013 2014 2015 2016 2017 2018 2019 H1 2020 H2 2020 2021 2022
Vaca
ncy
Units
Deliveries Net Absorption Vacancy
Forecast
11
WASHINGTON DC H1 2020
WASHINGTON DC HOME PRICES
Property Year Built Price Sold Units $Unit
The Woodley 2014 $180250000 010820 212 $850235
Skyline Apartments 1965 $58700000 030120 398 $147487
Glenwood Apartments 1942 $13700000 013020 90 $152222
The Waring 1909 $8400000 063020 24 $328947
The Regent 1937 $8450000 063020 12 $228378
LARGEST SALESDC MULTIFAMILY SALES VOLUME
$2000000000
$1500000000
$1000000000
$500000000
$02018 20192016 20172014 20152013
THE SHELBY
Class A High-Rise Avg $UnitMo
Avg $SFMo Vacancy YoY Rent Change
Upper NW $2810 $347 50 -06
Central $2822 $345 51 -46
Columbia HeightsShaw $2663 $363 64 -21
NoMaH Street $2290 $302 82 -57
Capitol HillRiverfrontSouthwest $2583 $325 77 -33
Northeast $2092 $266 85 -07
Upper Georgia $2183 $281 53 06
Class B Mid-and High-Rise Avg $UnitMo
Avg $SFMo Vacancy YoY Rent Change
Upper Northwest $2104 $258 43 -26
Mount Vernon Square NW $1925 $291 76 -74
Southwest $2085 $289 30 -04
RENTAL RATES
The District experienced broad rent decreases across almost all submarkets with the exception of Upper Georgia The Northeast and NoMaH Street submarkets have the highest Class-A High-Rise vacancy at 85 and 82 respectively This is in part due to an influx of new deliveries to those markets Class-B vacancy currently stands at 45 and concessions are at 30 of face rent The Mount Vernon Square submarket has the highest Class-B Mid and High-Rise vacancy at 76 and the highest decline in rent growth at -74 Class-A and Class-B apartments rents fell by a total of 33
The current average home value in the District is $586000 While home values grew in 2020mdashseeing an average annual increase of 70mdashhome values in the District have increased on average 30 YoY since 2015
A total of $2929M multifamily sales transacted in the District in nine sales in the first two quarters of 2020 CoreCore-Plus transactions made up for 71 of transactions and Value-Add transactions made up for the remaining 29 of total sales volume The highest sales in terms of price per unit were The Woodley a 212-unit property in Woodley Park at $850235 per unit and The Shelby a 24-unit property in Dupont Circle at $350000 per unit both of which were brokered by CBRE The Woodley was also the largest sale in H1 2020 across the District at $18025M
$0
$500000000
$1000000000
$1500000000
$2000000000
2013 2014 2015 2016 2017 2018 2019 H1 2020
DC Sales Volume
H1 2020
$600000
$500000
$400000
$300000
$200000
$100000
2014 2015 2016 2017 2018 2019$0
$100000
$200000
$300000
$400000
$500000
$600000
2014 2015 2016 2017 2018 2019 2020
DC Home Prices
2020
12
NORTHERN VIRGINIA H1 2020
NORTHERN VIRGINIA
NORTHERN VIRGINIA OVERVIEW
Northern Virginia continues to be the fastest growing region in the DC metro The regionrsquos economic future has been bolstered by Amazonrsquos decision to build its HQ2 in National Landing Amazon selected Northern Virginia because of its inherently strong fundamentals including a rich pipeline of talent provided by numerous universities in the area Amazon has subsequently begun the first phase of its hiring process and build-out at National Landing including hiring over 1000 white-collar employees and moving into 300000 SF of office space The delivery of HQ2 is expected to add 40000 to 60000 units of additional apartment demand to the area in the next decade A typical Amazon HQ2 worker will make $150000 per year which allows for up to $3750 in monthly rent Additionally Virginia Tech is moving forward with its plans to build the $1 Billion Innovation Campus in Potomac Yard The introduction of these two strong economic drivers will continue to further diversify the job base and incentivize more businesses to move to all areas of the DC metro where a pipeline of talent awaits
$400000
$450000
$500000
$550000
$600000
2014 2015 2016 2017 2018 2019
DC Home Prices
13
NORTHERN VIRGINIA H1 2020
2020 DELIVERIES MAP
NORTHERN VA DELIVERIES
Just under 4000 new units delivered in H1 2020 across Northern Virginia accounting for a 16 increase in total volume There are currently 10135 units under construction which will add 4 to the inventory over the next 24 months The largest deliveries in the region include Perseus Realtyrsquos The Foundry a 525-unit property in Alexandria Saul Centersrsquo Waycroft a 490-unit property in BallstonVirginia Square Wash REITrsquos The Trove a 401-unit property in Columbia Heights Arlington and Combined Propertiesrsquo Scout on the Circle a 400-unit property in Fairfax
382274copy 2020 CBRE Inc All rights reserved This information has been obtained from sources believed reliable but has not been verified for accuracy or completeness You should conduct a careful independent investigation of the property and verify all information Any reliance on this information issolely at your own risk CBRE and the CBRE logo are service marks of CBRE Inc All other marks displayed on this document are the property of their respective owners and the use of such logos does not imply any affiliation with or endorsement of CBRE
1
2
45
6
7
8
9
1 0
1 1
1 2
LORTON
MANASSAS
WOODBRIDGE
FORT HUNTNEWINGTON
LAKE RIDGE
CENTREVILLE
HERNDON
MANASSAS PARK
RESTON
STERLING
CHANTILLY
FAIRFAX STATION
ANNANDALE
BETHESDA
BURKE
FAIRFAX
FALLS CHURCH
NORTH BETHESDA
TYSONS CORNER
VIENNA
POTOMAC
MCLEAN
OAKTON
SPRINGFIELD
GROVETON
IDYLWOOD
JEFFERSON
LINCOLNIA
WEST SPRINGFIELD
WOLF TRAP
ADELPHI
BELTSVILLE
BOWIE
CALVERTON
CAMP SPRINGS
CLINTON
COLLEGE PARK
FORESTVILLE
GREENBELT
HILLCREST HEIGHTS
HYATTSVILLE
LANHAM
ROSARYVILLE
GLENN DALE
CORAL HILLS
EAST RIVERDALE
KETTERING
WASHINGTON201
267
28295
295
381
110
5
50
29
301
695
66
270
495
395
95
495
495
495
95
WASHINGTONDULLES INTL
AIRPORT
RONALD REAGANWASHINGTON
NATL ARPT
POTOMACAIRFIELD
FREEWAYAIRPORT
COLLEGE PARK AIRPORT
2020 MID ATLANTIC MULTIFAMILY DELIVERIESNORTHERN VIRGINIA
sup1 0 2 41
Miles
MULTIFAMILY DELIVERY
Leased 20Developer Novare Group Mulberry Development Group
8 Cameron SquareUnits 302
Leased 22Developer Praedium Group
7 The ClarkUnits 342
Leased 5Developer Erkiletian DevelopmentPCCP
6 The Sur at National GatewayUnits 360
Leased 65Developer Orr Partners
5 Centro ArlingtonUnits 366
Leased 12Developer Washington Real Estate Investment Trust
3 The TroveUnits 401
Leased 34Developer Saul Centers REIT (Northwestern Mutual Life Insurance)
2 The WaycroftUnits 490
Developer Combined Properties
4 Scout on the CircleUnits 400
Leased 21Developer Perseus RealtyELVFour Points
1 Foundry at CarlyleUnits 525
Leased 49Developer Shooshan Co Brandywine Realty Trust
10 4040 WilsonUnits 244
Leased 25Developer Abramson Properties Weingarten Realty AHDC
9 Array at West AlexUnits 278
Leased 40Developer Elm Street DevelopmentNorthwood Ravin
12 Preserve at Westfields - Phase IUnits 132
Leased 17Developer Novus
11 Mission LoftsUnits 157
Leased 21
Leased 34
Leased 12
Leased 7
Leased 65
Leased 5
Leased 22
Leased 20
Leased 25
Leased 49
Leased 17
Leased 40
Source Axiometrics 2020
VIRGINIA TECH INNOVATION CAMPUS
AMAZON HQ2
3
14
NORTHERN VIRGINIA H12020
$494500000SALES IN H1 2020
1823 UNITSSOLD IN H1 2020
9 PROPERTIES
Deliveries Net Absorption VacancyYear
NoVA BY THE NUMBERS
43
$1992
10135 UNITSUNDER CONSTRUCTION
3997 UNITSDELIVERED IN 2020
STABILIZED VACANCY
PIPELINE
CLASS A AVG RENTS
CLASS B AVG RENTS
Source CBRE Research and Delta Associates
As of June 30 2020
PER UNIT PER MONTH
14567 UNITS36-MONTH PIPELINE
Just under 4000 units delivered in H1 2020 which equates to a 10 increase in total inventory throughout the year Arlington accounted for 59 of new deliveries and Alexandria accounted for 27 The average lease-up pace for properties in Northern Virginia is currently 21 units per month compared to 24 units per month in January 2020 Northern Virginiarsquos current stabilized vacancy is 43 a 70 bps YoY increase
Job Growth YoY as of June 2020EMPLOYMENT
Northern Virginia experienced the YoY employment decline of 134700 jobs Leisure and Hospitality fared the worst with the loss of 64500 jobs and Education and Health Services with the loss of 32100 jobs However there was growth in Information and Financial Activities industries At the start of the year unemployment was at 25 and it currently stands at 86
As of June 2020 Amazon has already hired 1000 employees It is estimated that Amazon will bring 1200 employees in 2020 and an additional 2000 employees in 2021
CAPITAL MARKETS
PER SF PER MONTH$217
$1746 PER UNIT PER MONTH
PER SF PER MONTH$194
VacancyNorthern Virginia SummaryUnits
Delivered
DEVELOPMENT
-70000 -60000 -50000 -40000 -30000 -20000 -10000 0 10000
H1 2020 NoVa Employment
-70000 -50000 -30000 -10000 0 10000
5
4
3
2
1
02014 2015 2016 2017 2018 2019 H1
2020H2
2020
10000
8000
6000
4000
2000
02021 2022
StateLocal Government
Federal Government
Other Services
Leisure and Hospitality
Education and Health Services
Professional and Business Services
Financial Activities
Information
Retail Trade
Wholesale Trade
Trade Transportation and Utilities
Manufacturing
Mining Logging and Construction
0
001
002
003
004
005
006
0
1000
2000
3000
4000
5000
6000
7000
8000
9000
2014 2015 2016 2017 2018 2019 H1 2020 H2 2020 2021 2022
Vaca
ncy
Units
Deliveries Net Absorption Vacancy
Forecast
15
NORTHERN VIRGINIA H1 2020
NoVA HOME PRICES
Property Year Built Sold Price Units $Unit
The Emerson 2019 012720 $117000000 355 $329577
Avana Alexandria 1991 013020 $106000000 326 $325153
Ravensworth Towers 1973 041120 $59000000 219 $269406
The Bradley 2015 012020 $57666667 165 $349495
Monroe Place 2008 032620 $56950000 202 $281931
LARGEST SALESNoVA MULTIFAMILY SALES VOLUME
Class A High-Rise Avg $UnitMo
Avg $SFMo Vacancy YoY Rent
Change
Alexandria $2124 $243 54 -33
RosslynBallston Corridor $2490 $300 36 -27
Crystal CityPentagon City $2356 $268 74 -72
South Arlington $2024 $232 45 00
Tysons $2264 $252 78 -134
RestonHerndon $2106 $226 95 -71
Falls ChurchMerrifield $2117 $234 55 -70
Class B Mid-and High Rise Avg $UnitMo
Avg $SFMo Vacancy YoY Rent
Change
Falls ChurchNorth Arlington $2264 $249 54 07
South Arlington $1674 $198 21 -01
Arlandria $1662 $220 16 11
West Alexandria $1666 $183 54 -04
Crystal City $2226 $206 62 -60
RENTAL RATES
$650000
$625000
$600000
$575000
$550000
$5250002014 2015 2016 2017 2018 2019
$5000000000
$4000000000
$3000000000
$2000000000
$1000000000
$0
Northern Virginia experienced rent decreases compared to H1 2019 with the exception of Class-A product in South Arlington and Class-B product in Falls ChurchNorth Arlington and Arlandria Class-A rents fell by 41 to $1992unitmonth or $217 per square foot Class-A vacancy in Northern Virginia is currently 49 and concessions are at 50 of face rent RestonHerndon and Tysons have the highest Class-A vacancy at 95 and 78 due in most part to increased deliveries in those submarkets Class B rents fell 16 YoY to $1746unitmonth or $194 per square foot Class-B vacancy is currently 39 and concessions are 20 of face rent Crystal City has the highest Class-B vacancy at 62 Class-A and Class-B rents fell by a total of 25 YoY
Homes values in Northern Virginia continue to see impressive growth as demand significantly outweighs supply in 2020 New listing inventory was down by 35 this year and prices continue to climb Homes are on the market for an average of 35 weeks before selling The current median home value in Northern Virginia is $641002 which is a 44 YoY increase across the region Alexandria is the fastest growing housing market in the nation with 202 YoY median sale value growth Arlington County currently maintains the highest home value in Northern Virginia and experienced an 11 YoY increase The high cost of home buying in Northern Virginia will likely drive multifamily demand as renters are priced out of the for sale housing market
A total of $4945M multifamily sales transacted in Northern Virginia in nine properties in the first half of 2020 Value-add sales accounted for 77 of transactions and CoreCore-Plus sales made up the remaining 23 of total investment volume The highest price per unit sales were The Bradley a 165-unit property in Alexandria which sold at $349500 per unit and The Emerson a 355-unit property in Herndon which sold at $329600 per unit
JEFFERSON FAIR OAKS
$520000
$540000
$560000
$580000
$600000
$620000
2014 2015 2016 2017 2018 2019
NoVA Average Sold Home Price
$0
$1000000000
$2000000000
$3000000000
$4000000000
$5000000000
2013 2014 2015 2016 2017 2018 2019 H1 2020
NoVA Sales Volume
2018 20192016 20172014 20152013 H1 2020
$500000$520000$540000$560000$580000$600000$620000$640000$660000
2014 2015 2016 2017 2018 2019 2020
NoVA Average Sold Home Price
2020
16
SUBURBAN MD H1 2020
SUBURBAN MARYLAND
SUBURBAN MARYLAND OVERVIEW
Suburban Maryland fared the best in terms of rent growth absorption and transaction volume compared to the other markets in Washington DC Its lower density setting may be in part responsible for its recent resilience as residents choose to relocate out of higher density urban areas
Suburban Maryland is one of the most prominent areas in the region for the Life Sciences sector and is home to the headquarters of the National Institute of Health Department of Energy the Food and Drug Administration and the National Institute of Standards and Technology The presence of biotech in the I-270 Corridor in particular has greatly benefited the commercial real estate market in office industrial and multifamily Life Sciences buildings have significantly lower vacancy rates than that of other commercial office buildings As of 2019 laboratory vacancy sits at around 50 on average while office vacancy rate in Suburban Maryland is nearly 19 Montgomery and Prince Georgersquos counties continue to be largely unique in their growth of biotech because they remain suburban areas in comparison to Life Sciences hubs such as Boston New York and San Francisco that continue to grow as urban areas
Although investment activity slowed down considerably across the region Suburban Maryland is an outlier Over $12B transacted in H1 2020 which is more than H1 2019 when $893M transacted
17
SUBURBAN MD H1 2020
2020 DELIVERIES MAP
SUBURBAN MD DELIVERIES
Deliveries slowed in Suburban Maryland with an addition of 492 units across three projects in H1 2020 The deliveries were Bainbridgersquos Bainbridge Lake Linganore a 322-unit property in Frederick NV Commercial Brick Lanersquos The Bottling Plant a 86-unit property in Outlying Frederick County and Landex Developmentrsquos Artisan 4100 an 84-unit property in Brentwood There are currently 6441 units under construction which will add a total of 35 to total inventory over the next 24 months Bethesda has the highest concentration of development activity with just over 1900 units delivering in the next 36 months Unlike other markets in the DC metro Suburban Marylandrsquos vacancy which currently stands at 36 was not largely impacted in the past six months
382274copy 2020 CBRE Inc All rights reserved This information has been obtained from sources believed reliable but has not been verified for accuracy or completeness You should conduct a careful independent investigation of the property and verify all information Any reliance on this information issolely at your own risk CBRE and the CBRE logo are service marks of CBRE Inc All other marks displayed on this document are the property of their respective owners and the use of such logos does not imply any affiliation with or endorsement of CBRE
1
2
3
HERNDONRESTON
STERLING
BALLENGER CREEK
ASPEN HILL
BETHESDA
CHILLUM
NORTH BETHESDA
ROCKVILLE
SILVER SPRING
TAKOMA PARK
TYSONS CORNER
VIENNA
WHEATON-GLENMONT
WHITE OAK
POTOMAC
MCLEAN
COLESVILLENORTH POTOMAC
IDYLWOOD
WOLF TRAP
ADELPHI
BELTSVILLE
BOWIE
CROFTONGREENBELT
HYATTSVILLELANHAM
LAUREL
ODENTONSOUTH LAUREL
CATONSVILLE
COLUMBIA
DAMASCUS
GAITHERSBURG
LINTHICUM HEIGHTS
NORTH LAURELOLNEY
PIKESVILLE
WOODLAWN
SEVERN
ARBUTUS
MONTGOMERY VILLAGE
GERMANTOWN FERNDALE
ELDERSBURG
LOCHEARN
MAYS CHAPEL
REISTERSTOWN
DUNDALK
PERRY HALL
RIVIERA BEACH
ROSEDALE
SEVERNA PARK
TOWSON
ARNOLD
ESSEX
GLEN BURNIE
PASADENA
PARKVILLE
SOUTH GATE
OVERLEANOTTINGHAM
ANNAPOLIS NECK
WASHINGTON
ANNAPOLIS
BALTIMORE
201
3
295
267
7
100
15
50
15
340
40 1
29
301
301
270
495
70
83
195
95
66
97
895
95
95
695
270395
695
WASHINGTONDULLES INTL
AIRPORT
TIPTONAIRPORT
LEE AIRPORT
BALTIMOREWASHINGTONINTL AIRPORT
MARTIN STATEAIRPORT
2020 MID ATLANTIC MULTIFAMILY DELIVERIESSUBURBAN MARYLANDMULTIFAMILY DELIVERY
sup1 0 3 615Miles
Leased 20Developer Landex Development
3 Artisan 4100Units 84
Leased 60Developer NV Commercial Brick Lane
2 Bottling PlantUnits 86
Leased 9Developer Bainbridge Companies
1 Bainbridge Lake LinganoreUnits 322Leased 9
Leased 60
Leased 20
18
-45000 -40000 -35000 -30000 -25000 -20000 -15000 -10000 -5000 0 5000
H1 2020 SubMD Employment
SUBURBAN MD H1 2020
Job Growth YoY
EMPLOYMENT
$12 BILLIONSALES IN H1 2020
5006 UNITSSOLD IN H1 2020
14 PROPERTIES
5000
4000
3000
2000
1000
0
6
5
4
3
2
1
0
VacancyUnits
Delivered Suburban MD Summary
Deliveries Net Absorption Vacancy
Year
DEVELOPMENTSUBURBAN MD BY THE NUMBERS
36
$1905
6441 UNITSUNDER CONSTRUCTION
492 UNITSDELIVERED IN 2020
STABILIZED VACANCY
PIPELINE
CLASS A AVG RENTS
CLASS B AVG RENTS
Source CBRE Research and Delta Associates
As of June 30 2020
PER UNIT PER MONTH
13773 UNITS36-MONTH PIPELINE
As the most affordable option for residents in Washington DC Suburban Maryland continues to provide job opportunities and relatively affordable living Just under 500 units delivered in H1 2020 and 100 units have been absorbed so far this year Suburban Marylandrsquos current stabilized vacancy is 36 down 30 bps from last year
CAPITAL MARKETS
Suburban Maryland experienced the YoY loss of 111400 jobs The most impacted industries were Leisure and Hospitality with a 40 decrease in employment and Education and Health Services with a loss of 15 of employees Trade and Transportation also lost just under 20000 jobs The Federal Government saw a growth of 1000 employees Unemployment in Montgomery and Prince Georgersquos counties is currently 80 and 99 respectively up from 28 and 36 respectively in January 2020
$203PER SF PER MONTH
$1591PER UNIT PER MONTH
$173PER SF PER MONTH
2014 2015 2016 2017 2018 2019 H12020
H22020
2021 2022
StateLocal Government
Federal Government
Other Services
Leisure and Hospitality
Education and Health Services
Professional and Business Services
Financial Activities
Information
Retail Trade
Wholesale Trade
Trade Transportation and Utilities
Manufacturing
Mining Logging and Construction
-35000 -25000 -15000 -5000 0 10000
00
10
20
30
40
50
60
0
500
1000
1500
2000
2500
3000
3500
4000
4500
2014 2015 2016 2017 2018 2019 H12020
H22020
2021 2022
Vacanc
y
Units
Deliveries Net Absorption Vacancy
Forecast
19
SUBURBAN MD H1 2020
SUBURBAN MD HOME PRICES
Property Year Built Sold Price Units $Unit
4701 Willard 1969 062920 $276500000 525 $526667
The Varsity 2011 032720 $146022026 258 $565977
Gallery on New Hampshire 1960 022820 $117000000 675 $173333
Montgomery Paint Branch 1984 061220 $113206000 529 $214000
Jefferson at Inigos Crossing 2008 011320 $109000000 473 $230444
LARGEST SALESSUBURBAN MD MULTIFAMILY SALES VOLUME
Class A High Rise Avg $UnitMo Avg $SFMo Vacancy YoY Rent
Change
Bethesda $2670 $293 72 31
N Bethesda Rockville $2047 $223 60 22
Silver Spring Wheaton $2012 $242 35 18
Hyattsville College Park $1867 $206 46 NA
Class B Mid-and High-Rise Avg $UnitMo Avg $SFMo Vacancy YoY Rent
Change
Silver Spring $1622 $169 920 -190
BethesdaChevy Chase $1982 $217 520 -530
Rockville $1709 $184 430 450
RENTAL RATES
$400000
$380000
$360000
$340000
$320000
2014 2015 2016 2017 2018 2019
$3000000000
$2500000000
$2000000000
$1500000000
$1000000000
$500000000
$0
Although no markets saw overall positive rent growth over the past year Suburban Maryland was the least negatively impacted region in the metro in terms of rental rates Class-A rents declined by 13 YoY to an average of $1905unitmonth or $203 per square foot Class-A vacancy currently stands at 45 Class-B rents declined 10 to an average of $1591unitmonth or $173 per square foot Class-B vacancy currently stands at 31 Overall Class-A and Class-B apartment rents fell by a total of 11 YoY to an average of $1697unitmonth or $183 per square foot
Home prices have dropped slightly in Suburban Maryland after four consecutive years of positive growth The current median home sale price is $393000 The robust effect of the Amazon announcement has spilled over into Suburban Marylandrsquos housing market as a desirable and often more affordable option than Northern Virginia Much of Suburban Maryland multifamily properties remain within the ideal 30-minute commute from large employment drivers such as Amazon HQ2 and parts of Washington DC
Investment activity was highest in Suburban Maryland as $1222570000 traded in 13 sales in the first half of 2020 Value-Add product made up a majority of transaction volume at 61 while CoreCore-Plus accounted for the remaining 39 4017 Willard was the highest sale in terms of total volume and price per unit at $267500000 and $526667 per unit
BETHESDA ROW
NORTHLAKE
$310000
$320000
$330000
$340000
$350000
$360000
$370000
$380000
$390000
$400000
2014 2015 2016 2017 2018 2019 2020
Sub MD Median Home Sales Price
2020
$0
$500000000
$1000000000
$1500000000
$2000000000
$2500000000
$3000000000
2013 2014 2015 2016 2017 2018 2019 H1 2020
Sub MD Sales Volume
2018 20192016 20172014 20152013 H1 2020
4701 WILLARD
20
BALTIMORE METRO H1 2020
BALTIMORE METRO OVERVIEW
While the Baltimore metro is performing well compared to other metros across the country the region has seen the effects of the COVID-19 pandemic with impacts to employment transaction volume rent growth and absorption rates Over 172000 jobs were lost in greater Baltimore since Q2 2019 which is a 12 decrease in total nonfarm employment The June 2020 unemployment rate in the Baltimore metro is 80 which is a 450 bps increase from January 2020 Baltimore however is considered to be better positioned than other regions to weather the current economic downturn due to its impressive resilience in previous recessions In the Global Financial Crisis Baltimore ranked sixth in terms of GDP growth and ninth in payroll job growth across the nation
Just over 2400 units delivered in the Baltimore metro in H1 2020 and 2532 units are currently under construction The average rent in Baltimore is $1759unitmonth or $185 per square foot An aggregate of $506M in sales transacted across 13 sales CBRE brokered two of the three largest transactions in H1 2020 across the Baltimore metro
BALTIMORE METRO
21
BALTIMORE METRO H1 2020
382274copy 2020 CBRE Inc All rights reserved This information has been obtained from sources believed reliable but has not been verified for accuracy or completeness You should conduct a careful independent investigation of the property and verify all information Any reliance on this information issolely at your own risk CBRE and the CBRE logo are service marks of CBRE Inc All other marks displayed on this document are the property of their respective owners and the use of such logos does not imply any affiliation with or endorsement of CBRE
1
2
3
4
5
6
7
8
91 0
CATONSVILLE
ELKRIDGE
ELLICOTT CITY
LINTHICUM HEIGHTS
PIKESVILLE
RANDALLSTOWN
WOODLAWN
SEVERN
ARBUTUS
FERNDALE
LOCHEARN
MAYS CHAPEL
MILFORD MILL
OWINGS MILLS
REISTERSTOWN
DUNDALK
MIDDLE RIVER
PERRY HALL
RIVIERA BEACH
ROSEDALE
ESSEX
GLEN BURNIE
PARKVILLE
EDGEWOODJOPPA
CARNEY
GREEN HAVEN
OVERLEA
ROSSVILLE
JOPPATOWNE
BALTIMORE
295
24
924
100
29
1
70
83
83
195
97
895
95
95
395
695 95
BALTIMOREWASHINGTONINTL AIRPORT
MARTINSTATE
AIRPORT
2020 MID ATLANTIC MULTIFAMILY DELIVERIESBALTIMORE
sup1 0 15 3075
Miles
MULTIFAMILY DELIVERY
Leased 45Developer Sid Emmer
8 The View at Mill Run Phase IIUnits 157
Developer Greystar
7 Elan TowsonUnits 208
Leased 40Developer La Cite
6 CenterWest- Phase 1AUnits 262
Developer Klein EnterprisesManekin LLC
5 The WoodberryUnits 284
Leased 35Developer AvalonBay CommunitiesRetail Properties
3 Avalon TowsonUnits 371
Leased 7Developer Wood Partners
2 Alta Brewers HillUnits 371
Leased 4Developer Chesapeake Realty Partners
4 Avenue GrandUnits 324
Leased 36Developer Howard Hughes
1 Juniper - Merriweather DistrictUnits 380
Leased 67Developer Atlantic Realty
10 The MorrisonUnits 15
Leased 10Developer Zahlco
9 9 E Mount Royal StreetUnits 65
2020 DELIVERIES MAP
BALTIMORE METRO DELIVERIES
Deliveries picked up in Baltimore throughout 2020 with the addition of 2437 units throughout the metro equating to a 12 increase in total inventory More units delivered in the first half of 2020 than were delivered in all of 2019 The largest deliveries were Howard Hughesrsquo Juniper a 380-unit property as part of the Merriweather District in Columbia Wood Partnersrsquo Alta Brewers Hill a 371-unit property in Baltimore City and Avalonbay Communitiesrsquo Avalon Towson a 371-unit property in Towson There are currently 2532 units under construction that are expected to deliver in the next 24 months The average lease-up pace for properties in Baltimore is 15 units per month
Leased 36
Leased 7
Leased 35
Leased 4
Leased 34
Leased 40
Leased 19
Leased 45
Leased 10
Leased 67
Source Yardi Matrix 2020 Source Axiometrics 2020
22
BALTIMORE METRO H1 2020
Job Growth YoY EMPLOYMENT
$506028000SALES IN H1 2020
2913 UNITSSOLD IN H1 2020
14 PROPERTIES
10000
8000
6000
4000
2000
0
7
6
5
4
3
2
0
VacancyUnits
Delivered Baltimore Metro Summary
Deliveries Net Absorption Vacancy
Year
DEVELOPMENTBALTIMORE METRO BY THE NUMBERS
500
$1759
2532 UNITSUNDER CONSTRUCTION
2437 UNITSDELIVERED IN 2020
STABILIZED VACANCY
PIPELINE
TOTAL AVG RENTS
Source CBRE Research Axiometrics and Delta Associates
As of June 30 2020
PER UNIT PER MONTH
6906 UNITS36-MONTH PIPELINE
Deliveries in Baltimore picked up with an additional 2437 units in H1 2020 Just under 2000 units were absorbed in the past 12 months most of them before the beginning of 2020 which has caused vacancy to increase in H1 2020 Across the Baltimore metro vacancy increased 80 bps to 50 In the Baltimore Suburbs vacancy stands at 44 up 10 bps YoY and in Baltimore city vacancy is 66 up 290 bps YoY
During the recent downturn Baltimore experienced a loss of 172500 jobs The most impacted sector was Leisure and Hospitality in which 45 of employees were furloughed or laid off Education and Health Services also took a loss of 30800 jobs Federal Government and Mining Logging and Construction were the only industries to see job growth with an increase of 800 employees and 3300 respectively The spike in Mining Logging and Construction may have been the result of the emergency expansion of Baltimorersquos hospitals and uninterrupted construction at existing development sites At the start of 2020 Baltimorersquos unemployment rate was 35 and is currently 95 There are currently 1253600 nonfarm employees in the Baltimore metro
CAPITAL MARKETS
$185PER SF PER MONTH
09RENT GROWTH
NORTHERN SUBURBS
-010SOUTHERN SUBURBS
-50000 -30000 -10000 0 10000-70000 -60000 -50000 -40000 -30000 -20000 -10000 0 10000
H2 2020 Baltimore Employment
2015 2016 2017 2018 2019 2020 2021 2022 2023 2024 20250
1
2
3
4
5
6
7
-2000
0
2000
4000
6000
8000
10000
Vacanc
y ()
Units
Rentable Completions(Units)
Net Absorption(Units)
Vacancy Rate(Avg )
StateLocal Government
Federal Government
Other Services
Leisure and Hospitality
Education and Health Services
Professional and Business Services
Financial Activities
Information
Retail Trade
Wholesale Trade
Trade Transportation and Utilities
Manufacturing
Mining Logging and Construction
Forecast
23
BALTIMORE METRO H1 2020
BALTIMORE METRO HOME PRICES
Property Year Built Sold Price Units $Unit
Townes at Holly Station 1985 042320 $115000000 510 $225490
Chatham Gardens 1980 041720 $83280000 414 $201159
The Point at Elkridge 1988 032720 $72500000 312 $232372
BLVD at White Springs 1977 040820 $61099000 459 $133113
Old Orchard 1986 041720 $33179940 180 $184333
LARGEST SALESBALTIMORE METRO MULTIFAMILY SALES VOLUME
Submarket Avg $UnitMo Avg $SFMo Vacancy
Annapolis $1749 $198 49
Baltimore City East $1434 $179 55
Baltimore City North $1095 $135 69
Baltimore City West $996 $125 41
ColumbiaNorth Laurel $1643 $170 44
Downtown Baltimore $1548 $189 85
Ellicott CityElkridge $1609 $167 47
Far North Baltimore Suburbs $1310 $136 29
Northeast Anne Arundel County $1374 $157 42
Northwest Anne Arundel County $1720 $172 51
Owings MillsPikesvilleRandallstown $1365 $132 45
ParkvilleCarneyPerry Hall $1164 $135 36
Southeast Baltimore County $1097 $132 38
Southwest Baltimore County $1172 $131 45
TowsonHunt Valley $1390 $140 53
RENTAL RATES - ALL PRODUCT TYPES
$3000000000
$2500000000
$2000000000
$1500000000
$1000000000
$500000000
$0
2014 2015 2016 2017 2018 2019
$255000
$250000
$245000
$240000
$235000
$220000
$205000
Rent growth in the Baltimore metro remained largely flat since June 2019 The Northern Baltimore Suburbs experienced 09 rent growth the Southern Baltimore Suburbs experienced a drop of 01 rent growth and Baltimore City rents fell by 30 The Baltimore suburbs outpaced Baltimore City in terms of rent growth and absorption Current vacancy in the Baltimore metro is 50 with the highest vacancies in Downtown Baltimore at 85 Baltimore City North at 69 and Baltimore City East at 55 According to Delta Reports the Howard CountyColumbia submarket fared the best in the metro with 27 YoY rent growth
Home values in the Baltimore metro increased 20 YoY up slightly from the five-year average growth rate of 15 The current median sales price in the Baltimore metro is $251000 Single-family homes in Baltimore County posted a 10-year high median sale price of $330000 This is a 6 YoY increase from June 2019 Homes in Baltimore City also posted a 10-year high median sale price of $238000 Of note Owings Mills experienced a 27 YoY increase in median home value for an average of $415000
Investment activity reached $506M in the Baltimore metro during the first two quarters of 2020 in 14 transactions All but one sale was value-add product The highest sales in terms of price per unit were Point at Elkridge a 312-unit property in Elkridge which sold for $232400 per unit and Townes at Holly Station a 510-unit property in Waldorf which sold for $225500 per unit CBRE brokered both sales
TOWNES AT HOLLY STATION
$215000
$220000
$225000
$230000
$235000
$240000
$245000
$250000
2014 2015 2016 2017 2018 2019
Baltimore Metro Median Sale Price
$0
$500000000
$1000000000
$1500000000
$2000000000
$2500000000
$3000000000
2013 2014 2015 2016 2017 2018 2019 H1 2020
Balitmore Metro Sales Volume
2018 20192016 20172014 20152013 H1 2020
$210000$215000$220000$225000$230000$235000$240000$245000$250000$255000
2014 2015 2016 2017 2018 2019 2020
Baltimore Metro Median Sale Price
2020
24
FOR SALES OR FINANCING INFORMATION CONTACT
William S RoohanVice Chairman(O) +1 410 244 3122(M) +1 443 690 6967billroohancbrecom
Michael E MuldowneyExecutive Vice President(O) +1 410 244 3144(M) +1 443 250 3144mikemuldowneycbrecom
Robert G Dean IIISenior Vice President(O) +1 202 585 5766(M) +1 202 578 6941robertdeancbrecom
Jonathan M GreenbergSenior Vice President(O) +1 703 734 4772(M) +1 202 423 6655jonathangreenbergcbrecom
Martha A HastingsSenior Vice President(O) +1 410 244 3162(M) +1 410 807 2450marthahastingscbrecom
Brian H MargerumSenior Vice President(O) +1 410 244 3135(M) +1 443 386 1096brianmargerumcbrecom
Michael D RudolphSenior Vice President(O) +1 410 244 3121(M) +1 443 928 0392michaelrudolphcbrecom
John T Sheridan JrSenior Vice President(O) +1 703 905 0239(M) +1 703 200 7720johnsheridancbrecom
Yalda G HowellFirst Vice President(O) +1 202 585 5677(M) +1 240 462 2332yaldaghamariancbrecom
Thomas B LeachmanVice President(O) +1 202 585 5638(M) +1 240 688 0189thomasleachmancbrecom
Kemp D BroujosSenior Associate(O) +1 202 585 5724(M) +1 443 786 2951kempbroujoscbrecom
Nathan E BarthAssociate(O) +1 703 905 0228(C) +1 703 340 6828nathanbarthcbrecom
Zachary L StoneSales Assistant(O) +1 202 585 5650 (M) +1 202 713 8404zachstonecbrecom
Investment Sales amp Brokerage
Operations amp Marketing
Debt amp Structured Finance Team
Patricia C BonebrakeSenior Director of Operations(O) +1 410 244 3141(C) +1 443 253 5917trishbonebrakecbrecom
Jennifer W BusseyOperations Manager(O) +1 410 244 3134(C) +1 410 300 1302jenniferbusseycbrecom
Cheryl FinlaysonProductions Systems Manager(O) +1 410 244 7100(C) +1 410 244 3101cherylfinlaysoncbrecom
Margaret O MacleayOperations Supervisor(O) +1 202 585 5638(C) +1 410 562 9340maggiemacleaycbrecom
Rachel L MossmanSenior Communications Specialist(O) +1 410 244 3179(C) +1 410 244 7100rachelmossmancbrecom
Samantha S FifieldSales Assistant(O) +1 202 585 5773(C) +1 310 266 0003samanthafifieldcbrecom
Caroline P LekakosClient Services Coordinator(O) +1 202 585 5606(C) +1 240 595 0642carolinelekakoscbrecom
Yasmeen F ShararaClient Services Coordinator(O) +1 202 585 5580(C) +1 301 828 7435yasmeenshararacbrecom
Lauren E SpielmanClient Services Coordinator(O) +1 410 244 3129(C) +1 443 800 4388laurenspielmancbrecom
Grace F TrimbleClient Services Coordinator(O) +1 410 244 3123(C) +1 410 499 1064gracetrimblecbrecom
David F WebbVice Chairman(O) +1 202 585 5721(M) +1 202 744 4900davidwebbcbrecom
Maximiliane T LeachmanExecutive Vice President(O) +1 202 585 5655(M) +1 404 358 4317maxileachmancbrecom
Justin J GlasgowSenior Vice President(O) +1 202 783 1723(M) +1 202 316 1804justinglasgowcbrecom
RESEARCH TEAM
JEANETTE I RICE Americas Head of Multifamily Research (O) +1 214 979 6169
(C) +1 817 412 0709 jeanettericecbrecom
MOLLY M HUNT Research Analyst (O) +1 202 585 5597(C) +1 415 599 6009 mollyhuntcbrecom
RANK
1Fortune Magazinersquos
Most Admired Commercial Real Estate
Firm
REPUTATION
2Ranked the 2
Multifamily Brokerage Team in the entire nation by
Real Estate Forum
THE CBRE TEAM COMPETITIVE ADVANTAGE
25
RESOURCES
26Largest team and most
capacity in the Mid-Atlantic region
EXPERIENCE
$174B+The aggregate sales
value of deals our team has brokered since
2015
DEBT TEAM
1The CBRE Debt amp
Structured Finance Team is the 1 Freddie Mac
SellerServicer
copy Copyright 2020 All rights reserved Information contained herein including projections has been obtained from sources believed to be reliable but has not been verified for accuracy or completeness CBRE Inc makes no guarantee warranty or representation about it Any reliance on such information is solely at your own risk This information is exclusively for use by CBRE clients and professionals and may not be reproduced without the prior written permission of CBRErsquos Global Chief Economist CBRE and the CBRE logo are service marks of CBRE Inc andor its affiliated or related companies in the United States and other countries All other marks displayed on this document are the property of their respective owners Photos herein are the property of their respective owners Use of these images without the express written consent of the owner is prohibited
WASHINGTON DC1900 N Street NW
Suite 700 Washington DC 20036
+1 (202) 783 8200
BALTIMORE MD100 East Pratt Street
Suite 1700Baltimore MD 21202+1 (410) 244 7100
TYSONS VA1861 International Drive
Suite 300McLean VA 22102+1 (703) 821-6900
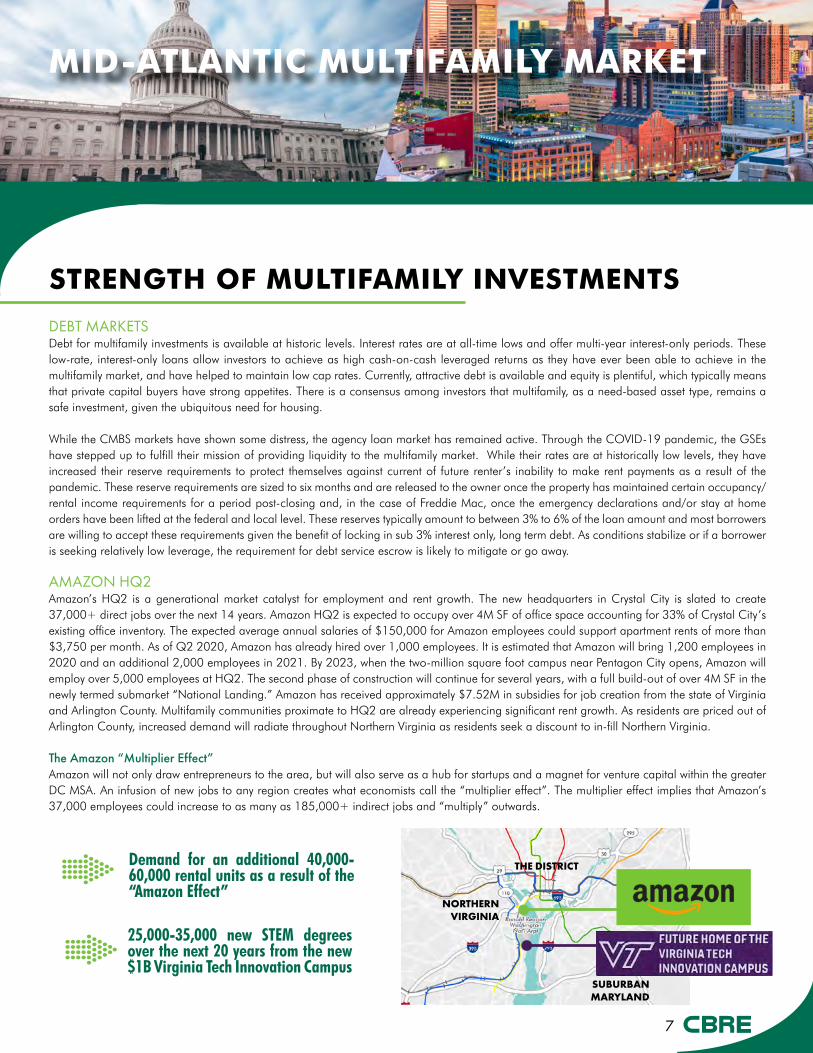
7
MID-ATLANTIC MULTIFAMILY MARKET
STRENGTH OF MULTIFAMILY INVESTMENTS
DEBT MARKETSDebt for multifamily investments is available at historic levels Interest rates are at all-time lows and offer multi-year interest-only periods These low-rate interest-only loans allow investors to achieve as high cash-on-cash leveraged returns as they have ever been able to achieve in the multifamily market and have helped to maintain low cap rates Currently attractive debt is available and equity is plentiful which typically means that private capital buyers have strong appetites There is a consensus among investors that multifamily as a need-based asset type remains a safe investment given the ubiquitous need for housing
While the CMBS markets have shown some distress the agency loan market has remained active Through the COVID-19 pandemic the GSEs have stepped up to fulfill their mission of providing liquidity to the multifamily market While their rates are at historically low levels they have increased their reserve requirements to protect themselves against current of future renterrsquos inability to make rent payments as a result of the pandemic These reserve requirements are sized to six months and are released to the owner once the property has maintained certain occupancyrental income requirements for a period post-closing and in the case of Freddie Mac once the emergency declarations andor stay at home orders have been lifted at the federal and local level These reserves typically amount to between 3 to 6 of the loan amount and most borrowers are willing to accept these requirements given the benefit of locking in sub 3 interest only long term debt As conditions stabilize or if a borrower is seeking relatively low leverage the requirement for debt service escrow is likely to mitigate or go away
AMAZON HQ2Amazonrsquos HQ2 is a generational market catalyst for employment and rent growth The new headquarters in Crystal City is slated to create 37000+ direct jobs over the next 14 years Amazon HQ2 is expected to occupy over 4M SF of office space accounting for 33 of Crystal Cityrsquos existing office inventory The expected average annual salaries of $150000 for Amazon employees could support apartment rents of more than $3750 per month As of Q2 2020 Amazon has already hired over 1000 employees It is estimated that Amazon will bring 1200 employees in 2020 and an additional 2000 employees in 2021 By 2023 when the two-million square foot campus near Pentagon City opens Amazon will employ over 5000 employees at HQ2 The second phase of construction will continue for several years with a full build-out of over 4M SF in the newly termed submarket ldquoNational Landingrdquo Amazon has received approximately $752M in subsidies for job creation from the state of Virginia and Arlington County Multifamily communities proximate to HQ2 are already experiencing significant rent growth As residents are priced out of Arlington County increased demand will radiate throughout Northern Virginia as residents seek a discount to in-fill Northern Virginia
The Amazon ldquoMultiplier EffectrdquoAmazon will not only draw entrepreneurs to the area but will also serve as a hub for startups and a magnet for venture capital within the greater DC MSA An infusion of new jobs to any region creates what economists call the ldquomultiplier effectrdquo The multiplier effect implies that Amazonrsquos 37000 employees could increase to as many as 185000+ indirect jobs and ldquomultiplyrdquo outwards
25000-35000 new STEM degrees over the next 20 years from the new $1B Virginia Tech Innovation Campus
Demand for an additional 40000-60000 rental units as a result of the ldquoAmazon Effectrdquo
THE DISTRICT
NORTHERN VIRGINIA
SUBURBAN MARYLAND
8
WASHINGTON DC H1 2020
WASHINGTON DC OVERVIEW
The District is experiencing negative effects of the COVID-19 pandemic with drops in rent absorption and rising vacancy throughout the apartment market The average monthly Class-A rent fell 35 YoY to a monthly average of $2561 per unit per month or $327SF The average Class-B rent fell 27 to an average of $2067unitmonth or $274SF
Just over 3000 units across the city delivered in the first half of 2020 and 12969 units are currently under construction Capitol Riverfront emerged as the leading submarket in terms of development activity with a 1475-unit increase with the delivery of The Estate The Kelvin Parc Riverside Phase I Meridian on First and The Maren Multifamily capital markets finished H1 2020 with $292860000 sold throughout the District over 9 sales The COVID-19 pandemic has slowed investment activity significantly as investors weather the storm of economic volatility Comparatively in the first half of 2019 over $685000000 transacted over 30 sales
THE DISTRICT
9
WASHINGTON DC H1 2020
2020 DELIVERIES MAP
THE DISTRICT DELIVERIES
Over 3000 units delivered to the District in H1 2020 accounting for a 21 increase to the total multifamily housing inventory The pipeline continues on a steady upward trend and will not slow until late 2022 There are currently 12696 units under construction that will increase the total multifamily inventory by 88 over the next two years
NoMa H Street Corridor Union Market and Capitol Riverfront are the most active submarkets in terms of development activity These growing areas continue to deliver Class-A luxury apartment buildings in areas that are also seeing retail and office space developments
382274copy 2020 CBRE Inc All rights reserved This information has been obtained from sources believed reliable but has not been verified for accuracy or completeness You should conduct a careful independent investigation of the property and verify all information Any reliance on this information issolely at your own risk CBRE and the CBRE logo are service marks of CBRE Inc All other marks displayed on this document are the property of their respective owners and the use of such logos does not imply any affiliation with or endorsement of CBRE
1
2
3
4
5 6
7
8
9
1 0
1 1
WASHINGTON
295
5050
695
395
395
395
Rhode Island Ave NE
Virginia Ave NW
Rhode Island Ave NW
H St NE
Min
neso
taAv
eN
E
Q St NW
Potomac Ave SE
11
th S
t S
E
Minnesota Ave SE
13
th S
t N
W
13
th S
t N
E
Pennsylvania Ave SE
3rd
St
NW
So
uth
Ca
pit
ol
St
12
thS
tS
W
Florida Ave NE
9th
St
SW 7th
St
SW
9th
St
NW
Pennsylvania Ave NW
Tenn
esse
eAv
eN
E
E Capitol St SE
US-1N
6th
St
NE
Massachusetts Ave NW
US-
1S
4th
St
NE
Independence Ave SE
14
thS
tS
W
Mt Olivet Rd NE
Constitution Ave NW
KentuckyAve
SE
9th
StN
E
Benning Rd NE
6th
St
SE
7th
St
NW
K St NW
Bra
nch
Ave
SE
6th
St
NW
New
Ham
pshi
re A
ve N
W
L St NW
E Capitol St NE
No
rth
Ca
pit
ol
St
14
th S
t N
W
North Carolin
a Ave SE
D St SW
9th
St
SE
22ndSt
NE
Texas AveSE
16
th S
t N
W
B St SE
2n
d S
t N
E
D St SE
21
stSt
NE
8th
St
SE
Maine
Ave
SW
12
th S
t S
E
Kenilw
orthAve
NE
M St SW
I St SE
Bryant St NW
19
th S
t N
W
17
th S
t N
W
11
th S
t N
E
Florida Ave NW
Maryland Ave NE
15
th S
t N
W
4th
St
SE
U St NW
M St NW
M St SE
RidgeRd
SE
Independence Ave SW
H St NW
C St NE
R St NW
2020 MID ATLANTIC MULTIFAMILY DELIVERIESWASHINGTON DC
sup1 0 025 05013
Miles
MULTIFAMILY DELIVERY
Leased 23Developer CAS RieglerEB5
8 BlackbirdUnits 167
Leased 7Developer FRP DevelopmentMRP Realty
7 The MarenUnits 264
Leased 6Developer Paradigm Development
6 Meridian on First IUnits 273
Leased 11Developer Toll Brothers
5 Parc Riverside Phase IIUnits 308
Leased 39Developer Brookfield Properties
3 The EstateUnits 320
Leased 43Developer RappaportWC SmithEB5
2 AvecUnits 420
Leased 36Developer Jair LynchMacFarlane Partners
4 The KelvinUnits 310
Leased 28Developer JBG SmithMRP Realty
1 The WrenUnits 433
Leased 4Developer Jefferson Apt GroupStars Investment
10 J LineaUnits 132
Leased 17Developer JBG Smith
9 901WUnits 161
Leased 42Developer Coba
11 1714-1716 14th Street NWUnits 8
Leased 28
Leased 43
Leased 39
Leased 36
Leased 11
Leased 6
Leased 7
Leased 23
Leased 17
Leased 4
Leased 42
10
-60000 -50000 -40000 -30000 -20000 -10000 0 10000
Q2 2020 DC Employment
WASHINGTON DC H1 2020
Job Growth YoY
-50000 -40000 -30000 -20000 -10000 0 10000
StateLocal Government
Federal Government
Other Services
Leisure and Hospitality
Education and Health Services
Professional and Business Services
Financial Activities
Information
Retail Trade
Wholesale Trade
Trade Transportation and Utilities
Manufacturing
Mining Logging and Construction
EMPLOYMENT
CAPITAL MARKETS
$292860000SALES IN H1 2020
845 UNITSSOLD IN H1 2020
9 PROPERTIES
Deliveries Net Absorption Vacancy
Year
DEVELOPMENTDC BY THE NUMBERS
61
$2561
12696 UNITSUNDER CONSTRUCTION
3004 UNITSDELIVERED IN 2020
STABILIZED VACANCY
PIPELINE
CLASS A AVG RENTS
CLASS B AVG RENTS
Source CBRE Research and Delta Associates
As of June 30 2020
PER UNIT PER MONTH
18907 UNITS36-MONTH PIPELINE
Recent deliveries in the District were concentrated primarily in the Capitol Riverfront and H Street submarkets NoMa and Union Market also remain top submarkets for development activity with around 3483 units under construction on-track to deliver in the next 24 months Annual absorption in the District was 25 lower than a year ago as 2003 units absorbed in the first half of the year Q2 stabilized vacancy rate in the District is 61 a 250 bps increase from the previous year The average lease-up pace of new product in the District is 14 units per month and concessions average 15 months free rent
Insulated by the federal government Washington DC has fared favorably thus far in the downturn compared to other large metros across the nation The District experienced 67000 job losses which represents an 8 YoY loss in employment Leisure and Hospitality suffered the biggest job loss as 60 of the workforce was laid off or furloughed Promisingly government information and other services were the only industries to experience job growth albeit small
PER SF PER MONTH$327
$2067PER UNIT PER MONTH
PER SF PER MONTH$274
7000
6000
5000
4000
3000
2000
1000
0
8
7
6
5
4
3
2
1
0
VacancyUnitsDelivered
Washington DC Summary
2013 2014 2015 2016 2017 2018 2019 2021 2022H22020
H12020
00
10
20
30
40
50
60
70
80
90
0
1000
2000
3000
4000
5000
6000
7000
2013 2014 2015 2016 2017 2018 2019 H1 2020 H2 2020 2021 2022
Vaca
ncy
Units
Deliveries Net Absorption Vacancy
Forecast
11
WASHINGTON DC H1 2020
WASHINGTON DC HOME PRICES
Property Year Built Price Sold Units $Unit
The Woodley 2014 $180250000 010820 212 $850235
Skyline Apartments 1965 $58700000 030120 398 $147487
Glenwood Apartments 1942 $13700000 013020 90 $152222
The Waring 1909 $8400000 063020 24 $328947
The Regent 1937 $8450000 063020 12 $228378
LARGEST SALESDC MULTIFAMILY SALES VOLUME
$2000000000
$1500000000
$1000000000
$500000000
$02018 20192016 20172014 20152013
THE SHELBY
Class A High-Rise Avg $UnitMo
Avg $SFMo Vacancy YoY Rent Change
Upper NW $2810 $347 50 -06
Central $2822 $345 51 -46
Columbia HeightsShaw $2663 $363 64 -21
NoMaH Street $2290 $302 82 -57
Capitol HillRiverfrontSouthwest $2583 $325 77 -33
Northeast $2092 $266 85 -07
Upper Georgia $2183 $281 53 06
Class B Mid-and High-Rise Avg $UnitMo
Avg $SFMo Vacancy YoY Rent Change
Upper Northwest $2104 $258 43 -26
Mount Vernon Square NW $1925 $291 76 -74
Southwest $2085 $289 30 -04
RENTAL RATES
The District experienced broad rent decreases across almost all submarkets with the exception of Upper Georgia The Northeast and NoMaH Street submarkets have the highest Class-A High-Rise vacancy at 85 and 82 respectively This is in part due to an influx of new deliveries to those markets Class-B vacancy currently stands at 45 and concessions are at 30 of face rent The Mount Vernon Square submarket has the highest Class-B Mid and High-Rise vacancy at 76 and the highest decline in rent growth at -74 Class-A and Class-B apartments rents fell by a total of 33
The current average home value in the District is $586000 While home values grew in 2020mdashseeing an average annual increase of 70mdashhome values in the District have increased on average 30 YoY since 2015
A total of $2929M multifamily sales transacted in the District in nine sales in the first two quarters of 2020 CoreCore-Plus transactions made up for 71 of transactions and Value-Add transactions made up for the remaining 29 of total sales volume The highest sales in terms of price per unit were The Woodley a 212-unit property in Woodley Park at $850235 per unit and The Shelby a 24-unit property in Dupont Circle at $350000 per unit both of which were brokered by CBRE The Woodley was also the largest sale in H1 2020 across the District at $18025M
$0
$500000000
$1000000000
$1500000000
$2000000000
2013 2014 2015 2016 2017 2018 2019 H1 2020
DC Sales Volume
H1 2020
$600000
$500000
$400000
$300000
$200000
$100000
2014 2015 2016 2017 2018 2019$0
$100000
$200000
$300000
$400000
$500000
$600000
2014 2015 2016 2017 2018 2019 2020
DC Home Prices
2020
12
NORTHERN VIRGINIA H1 2020
NORTHERN VIRGINIA
NORTHERN VIRGINIA OVERVIEW
Northern Virginia continues to be the fastest growing region in the DC metro The regionrsquos economic future has been bolstered by Amazonrsquos decision to build its HQ2 in National Landing Amazon selected Northern Virginia because of its inherently strong fundamentals including a rich pipeline of talent provided by numerous universities in the area Amazon has subsequently begun the first phase of its hiring process and build-out at National Landing including hiring over 1000 white-collar employees and moving into 300000 SF of office space The delivery of HQ2 is expected to add 40000 to 60000 units of additional apartment demand to the area in the next decade A typical Amazon HQ2 worker will make $150000 per year which allows for up to $3750 in monthly rent Additionally Virginia Tech is moving forward with its plans to build the $1 Billion Innovation Campus in Potomac Yard The introduction of these two strong economic drivers will continue to further diversify the job base and incentivize more businesses to move to all areas of the DC metro where a pipeline of talent awaits
$400000
$450000
$500000
$550000
$600000
2014 2015 2016 2017 2018 2019
DC Home Prices
13
NORTHERN VIRGINIA H1 2020
2020 DELIVERIES MAP
NORTHERN VA DELIVERIES
Just under 4000 new units delivered in H1 2020 across Northern Virginia accounting for a 16 increase in total volume There are currently 10135 units under construction which will add 4 to the inventory over the next 24 months The largest deliveries in the region include Perseus Realtyrsquos The Foundry a 525-unit property in Alexandria Saul Centersrsquo Waycroft a 490-unit property in BallstonVirginia Square Wash REITrsquos The Trove a 401-unit property in Columbia Heights Arlington and Combined Propertiesrsquo Scout on the Circle a 400-unit property in Fairfax
382274copy 2020 CBRE Inc All rights reserved This information has been obtained from sources believed reliable but has not been verified for accuracy or completeness You should conduct a careful independent investigation of the property and verify all information Any reliance on this information issolely at your own risk CBRE and the CBRE logo are service marks of CBRE Inc All other marks displayed on this document are the property of their respective owners and the use of such logos does not imply any affiliation with or endorsement of CBRE
1
2
45
6
7
8
9
1 0
1 1
1 2
LORTON
MANASSAS
WOODBRIDGE
FORT HUNTNEWINGTON
LAKE RIDGE
CENTREVILLE
HERNDON
MANASSAS PARK
RESTON
STERLING
CHANTILLY
FAIRFAX STATION
ANNANDALE
BETHESDA
BURKE
FAIRFAX
FALLS CHURCH
NORTH BETHESDA
TYSONS CORNER
VIENNA
POTOMAC
MCLEAN
OAKTON
SPRINGFIELD
GROVETON
IDYLWOOD
JEFFERSON
LINCOLNIA
WEST SPRINGFIELD
WOLF TRAP
ADELPHI
BELTSVILLE
BOWIE
CALVERTON
CAMP SPRINGS
CLINTON
COLLEGE PARK
FORESTVILLE
GREENBELT
HILLCREST HEIGHTS
HYATTSVILLE
LANHAM
ROSARYVILLE
GLENN DALE
CORAL HILLS
EAST RIVERDALE
KETTERING
WASHINGTON201
267
28295
295
381
110
5
50
29
301
695
66
270
495
395
95
495
495
495
95
WASHINGTONDULLES INTL
AIRPORT
RONALD REAGANWASHINGTON
NATL ARPT
POTOMACAIRFIELD
FREEWAYAIRPORT
COLLEGE PARK AIRPORT
2020 MID ATLANTIC MULTIFAMILY DELIVERIESNORTHERN VIRGINIA
sup1 0 2 41
Miles
MULTIFAMILY DELIVERY
Leased 20Developer Novare Group Mulberry Development Group
8 Cameron SquareUnits 302
Leased 22Developer Praedium Group
7 The ClarkUnits 342
Leased 5Developer Erkiletian DevelopmentPCCP
6 The Sur at National GatewayUnits 360
Leased 65Developer Orr Partners
5 Centro ArlingtonUnits 366
Leased 12Developer Washington Real Estate Investment Trust
3 The TroveUnits 401
Leased 34Developer Saul Centers REIT (Northwestern Mutual Life Insurance)
2 The WaycroftUnits 490
Developer Combined Properties
4 Scout on the CircleUnits 400
Leased 21Developer Perseus RealtyELVFour Points
1 Foundry at CarlyleUnits 525
Leased 49Developer Shooshan Co Brandywine Realty Trust
10 4040 WilsonUnits 244
Leased 25Developer Abramson Properties Weingarten Realty AHDC
9 Array at West AlexUnits 278
Leased 40Developer Elm Street DevelopmentNorthwood Ravin
12 Preserve at Westfields - Phase IUnits 132
Leased 17Developer Novus
11 Mission LoftsUnits 157
Leased 21
Leased 34
Leased 12
Leased 7
Leased 65
Leased 5
Leased 22
Leased 20
Leased 25
Leased 49
Leased 17
Leased 40
Source Axiometrics 2020
VIRGINIA TECH INNOVATION CAMPUS
AMAZON HQ2
3
14
NORTHERN VIRGINIA H12020
$494500000SALES IN H1 2020
1823 UNITSSOLD IN H1 2020
9 PROPERTIES
Deliveries Net Absorption VacancyYear
NoVA BY THE NUMBERS
43
$1992
10135 UNITSUNDER CONSTRUCTION
3997 UNITSDELIVERED IN 2020
STABILIZED VACANCY
PIPELINE
CLASS A AVG RENTS
CLASS B AVG RENTS
Source CBRE Research and Delta Associates
As of June 30 2020
PER UNIT PER MONTH
14567 UNITS36-MONTH PIPELINE
Just under 4000 units delivered in H1 2020 which equates to a 10 increase in total inventory throughout the year Arlington accounted for 59 of new deliveries and Alexandria accounted for 27 The average lease-up pace for properties in Northern Virginia is currently 21 units per month compared to 24 units per month in January 2020 Northern Virginiarsquos current stabilized vacancy is 43 a 70 bps YoY increase
Job Growth YoY as of June 2020EMPLOYMENT
Northern Virginia experienced the YoY employment decline of 134700 jobs Leisure and Hospitality fared the worst with the loss of 64500 jobs and Education and Health Services with the loss of 32100 jobs However there was growth in Information and Financial Activities industries At the start of the year unemployment was at 25 and it currently stands at 86
As of June 2020 Amazon has already hired 1000 employees It is estimated that Amazon will bring 1200 employees in 2020 and an additional 2000 employees in 2021
CAPITAL MARKETS
PER SF PER MONTH$217
$1746 PER UNIT PER MONTH
PER SF PER MONTH$194
VacancyNorthern Virginia SummaryUnits
Delivered
DEVELOPMENT
-70000 -60000 -50000 -40000 -30000 -20000 -10000 0 10000
H1 2020 NoVa Employment
-70000 -50000 -30000 -10000 0 10000
5
4
3
2
1
02014 2015 2016 2017 2018 2019 H1
2020H2
2020
10000
8000
6000
4000
2000
02021 2022
StateLocal Government
Federal Government
Other Services
Leisure and Hospitality
Education and Health Services
Professional and Business Services
Financial Activities
Information
Retail Trade
Wholesale Trade
Trade Transportation and Utilities
Manufacturing
Mining Logging and Construction
0
001
002
003
004
005
006
0
1000
2000
3000
4000
5000
6000
7000
8000
9000
2014 2015 2016 2017 2018 2019 H1 2020 H2 2020 2021 2022
Vaca
ncy
Units
Deliveries Net Absorption Vacancy
Forecast
15
NORTHERN VIRGINIA H1 2020
NoVA HOME PRICES
Property Year Built Sold Price Units $Unit
The Emerson 2019 012720 $117000000 355 $329577
Avana Alexandria 1991 013020 $106000000 326 $325153
Ravensworth Towers 1973 041120 $59000000 219 $269406
The Bradley 2015 012020 $57666667 165 $349495
Monroe Place 2008 032620 $56950000 202 $281931
LARGEST SALESNoVA MULTIFAMILY SALES VOLUME
Class A High-Rise Avg $UnitMo
Avg $SFMo Vacancy YoY Rent
Change
Alexandria $2124 $243 54 -33
RosslynBallston Corridor $2490 $300 36 -27
Crystal CityPentagon City $2356 $268 74 -72
South Arlington $2024 $232 45 00
Tysons $2264 $252 78 -134
RestonHerndon $2106 $226 95 -71
Falls ChurchMerrifield $2117 $234 55 -70
Class B Mid-and High Rise Avg $UnitMo
Avg $SFMo Vacancy YoY Rent
Change
Falls ChurchNorth Arlington $2264 $249 54 07
South Arlington $1674 $198 21 -01
Arlandria $1662 $220 16 11
West Alexandria $1666 $183 54 -04
Crystal City $2226 $206 62 -60
RENTAL RATES
$650000
$625000
$600000
$575000
$550000
$5250002014 2015 2016 2017 2018 2019
$5000000000
$4000000000
$3000000000
$2000000000
$1000000000
$0
Northern Virginia experienced rent decreases compared to H1 2019 with the exception of Class-A product in South Arlington and Class-B product in Falls ChurchNorth Arlington and Arlandria Class-A rents fell by 41 to $1992unitmonth or $217 per square foot Class-A vacancy in Northern Virginia is currently 49 and concessions are at 50 of face rent RestonHerndon and Tysons have the highest Class-A vacancy at 95 and 78 due in most part to increased deliveries in those submarkets Class B rents fell 16 YoY to $1746unitmonth or $194 per square foot Class-B vacancy is currently 39 and concessions are 20 of face rent Crystal City has the highest Class-B vacancy at 62 Class-A and Class-B rents fell by a total of 25 YoY
Homes values in Northern Virginia continue to see impressive growth as demand significantly outweighs supply in 2020 New listing inventory was down by 35 this year and prices continue to climb Homes are on the market for an average of 35 weeks before selling The current median home value in Northern Virginia is $641002 which is a 44 YoY increase across the region Alexandria is the fastest growing housing market in the nation with 202 YoY median sale value growth Arlington County currently maintains the highest home value in Northern Virginia and experienced an 11 YoY increase The high cost of home buying in Northern Virginia will likely drive multifamily demand as renters are priced out of the for sale housing market
A total of $4945M multifamily sales transacted in Northern Virginia in nine properties in the first half of 2020 Value-add sales accounted for 77 of transactions and CoreCore-Plus sales made up the remaining 23 of total investment volume The highest price per unit sales were The Bradley a 165-unit property in Alexandria which sold at $349500 per unit and The Emerson a 355-unit property in Herndon which sold at $329600 per unit
JEFFERSON FAIR OAKS
$520000
$540000
$560000
$580000
$600000
$620000
2014 2015 2016 2017 2018 2019
NoVA Average Sold Home Price
$0
$1000000000
$2000000000
$3000000000
$4000000000
$5000000000
2013 2014 2015 2016 2017 2018 2019 H1 2020
NoVA Sales Volume
2018 20192016 20172014 20152013 H1 2020
$500000$520000$540000$560000$580000$600000$620000$640000$660000
2014 2015 2016 2017 2018 2019 2020
NoVA Average Sold Home Price
2020
16
SUBURBAN MD H1 2020
SUBURBAN MARYLAND
SUBURBAN MARYLAND OVERVIEW
Suburban Maryland fared the best in terms of rent growth absorption and transaction volume compared to the other markets in Washington DC Its lower density setting may be in part responsible for its recent resilience as residents choose to relocate out of higher density urban areas
Suburban Maryland is one of the most prominent areas in the region for the Life Sciences sector and is home to the headquarters of the National Institute of Health Department of Energy the Food and Drug Administration and the National Institute of Standards and Technology The presence of biotech in the I-270 Corridor in particular has greatly benefited the commercial real estate market in office industrial and multifamily Life Sciences buildings have significantly lower vacancy rates than that of other commercial office buildings As of 2019 laboratory vacancy sits at around 50 on average while office vacancy rate in Suburban Maryland is nearly 19 Montgomery and Prince Georgersquos counties continue to be largely unique in their growth of biotech because they remain suburban areas in comparison to Life Sciences hubs such as Boston New York and San Francisco that continue to grow as urban areas
Although investment activity slowed down considerably across the region Suburban Maryland is an outlier Over $12B transacted in H1 2020 which is more than H1 2019 when $893M transacted
17
SUBURBAN MD H1 2020
2020 DELIVERIES MAP
SUBURBAN MD DELIVERIES
Deliveries slowed in Suburban Maryland with an addition of 492 units across three projects in H1 2020 The deliveries were Bainbridgersquos Bainbridge Lake Linganore a 322-unit property in Frederick NV Commercial Brick Lanersquos The Bottling Plant a 86-unit property in Outlying Frederick County and Landex Developmentrsquos Artisan 4100 an 84-unit property in Brentwood There are currently 6441 units under construction which will add a total of 35 to total inventory over the next 24 months Bethesda has the highest concentration of development activity with just over 1900 units delivering in the next 36 months Unlike other markets in the DC metro Suburban Marylandrsquos vacancy which currently stands at 36 was not largely impacted in the past six months
382274copy 2020 CBRE Inc All rights reserved This information has been obtained from sources believed reliable but has not been verified for accuracy or completeness You should conduct a careful independent investigation of the property and verify all information Any reliance on this information issolely at your own risk CBRE and the CBRE logo are service marks of CBRE Inc All other marks displayed on this document are the property of their respective owners and the use of such logos does not imply any affiliation with or endorsement of CBRE
1
2
3
HERNDONRESTON
STERLING
BALLENGER CREEK
ASPEN HILL
BETHESDA
CHILLUM
NORTH BETHESDA
ROCKVILLE
SILVER SPRING
TAKOMA PARK
TYSONS CORNER
VIENNA
WHEATON-GLENMONT
WHITE OAK
POTOMAC
MCLEAN
COLESVILLENORTH POTOMAC
IDYLWOOD
WOLF TRAP
ADELPHI
BELTSVILLE
BOWIE
CROFTONGREENBELT
HYATTSVILLELANHAM
LAUREL
ODENTONSOUTH LAUREL
CATONSVILLE
COLUMBIA
DAMASCUS
GAITHERSBURG
LINTHICUM HEIGHTS
NORTH LAURELOLNEY
PIKESVILLE
WOODLAWN
SEVERN
ARBUTUS
MONTGOMERY VILLAGE
GERMANTOWN FERNDALE
ELDERSBURG
LOCHEARN
MAYS CHAPEL
REISTERSTOWN
DUNDALK
PERRY HALL
RIVIERA BEACH
ROSEDALE
SEVERNA PARK
TOWSON
ARNOLD
ESSEX
GLEN BURNIE
PASADENA
PARKVILLE
SOUTH GATE
OVERLEANOTTINGHAM
ANNAPOLIS NECK
WASHINGTON
ANNAPOLIS
BALTIMORE
201
3
295
267
7
100
15
50
15
340
40 1
29
301
301
270
495
70
83
195
95
66
97
895
95
95
695
270395
695
WASHINGTONDULLES INTL
AIRPORT
TIPTONAIRPORT
LEE AIRPORT
BALTIMOREWASHINGTONINTL AIRPORT
MARTIN STATEAIRPORT
2020 MID ATLANTIC MULTIFAMILY DELIVERIESSUBURBAN MARYLANDMULTIFAMILY DELIVERY
sup1 0 3 615Miles
Leased 20Developer Landex Development
3 Artisan 4100Units 84
Leased 60Developer NV Commercial Brick Lane
2 Bottling PlantUnits 86
Leased 9Developer Bainbridge Companies
1 Bainbridge Lake LinganoreUnits 322Leased 9
Leased 60
Leased 20
18
-45000 -40000 -35000 -30000 -25000 -20000 -15000 -10000 -5000 0 5000
H1 2020 SubMD Employment
SUBURBAN MD H1 2020
Job Growth YoY
EMPLOYMENT
$12 BILLIONSALES IN H1 2020
5006 UNITSSOLD IN H1 2020
14 PROPERTIES
5000
4000
3000
2000
1000
0
6
5
4
3
2
1
0
VacancyUnits
Delivered Suburban MD Summary
Deliveries Net Absorption Vacancy
Year
DEVELOPMENTSUBURBAN MD BY THE NUMBERS
36
$1905
6441 UNITSUNDER CONSTRUCTION
492 UNITSDELIVERED IN 2020
STABILIZED VACANCY
PIPELINE
CLASS A AVG RENTS
CLASS B AVG RENTS
Source CBRE Research and Delta Associates
As of June 30 2020
PER UNIT PER MONTH
13773 UNITS36-MONTH PIPELINE
As the most affordable option for residents in Washington DC Suburban Maryland continues to provide job opportunities and relatively affordable living Just under 500 units delivered in H1 2020 and 100 units have been absorbed so far this year Suburban Marylandrsquos current stabilized vacancy is 36 down 30 bps from last year
CAPITAL MARKETS
Suburban Maryland experienced the YoY loss of 111400 jobs The most impacted industries were Leisure and Hospitality with a 40 decrease in employment and Education and Health Services with a loss of 15 of employees Trade and Transportation also lost just under 20000 jobs The Federal Government saw a growth of 1000 employees Unemployment in Montgomery and Prince Georgersquos counties is currently 80 and 99 respectively up from 28 and 36 respectively in January 2020
$203PER SF PER MONTH
$1591PER UNIT PER MONTH
$173PER SF PER MONTH
2014 2015 2016 2017 2018 2019 H12020
H22020
2021 2022
StateLocal Government
Federal Government
Other Services
Leisure and Hospitality
Education and Health Services
Professional and Business Services
Financial Activities
Information
Retail Trade
Wholesale Trade
Trade Transportation and Utilities
Manufacturing
Mining Logging and Construction
-35000 -25000 -15000 -5000 0 10000
00
10
20
30
40
50
60
0
500
1000
1500
2000
2500
3000
3500
4000
4500
2014 2015 2016 2017 2018 2019 H12020
H22020
2021 2022
Vacanc
y
Units
Deliveries Net Absorption Vacancy
Forecast
19
SUBURBAN MD H1 2020
SUBURBAN MD HOME PRICES
Property Year Built Sold Price Units $Unit
4701 Willard 1969 062920 $276500000 525 $526667
The Varsity 2011 032720 $146022026 258 $565977
Gallery on New Hampshire 1960 022820 $117000000 675 $173333
Montgomery Paint Branch 1984 061220 $113206000 529 $214000
Jefferson at Inigos Crossing 2008 011320 $109000000 473 $230444
LARGEST SALESSUBURBAN MD MULTIFAMILY SALES VOLUME
Class A High Rise Avg $UnitMo Avg $SFMo Vacancy YoY Rent
Change
Bethesda $2670 $293 72 31
N Bethesda Rockville $2047 $223 60 22
Silver Spring Wheaton $2012 $242 35 18
Hyattsville College Park $1867 $206 46 NA
Class B Mid-and High-Rise Avg $UnitMo Avg $SFMo Vacancy YoY Rent
Change
Silver Spring $1622 $169 920 -190
BethesdaChevy Chase $1982 $217 520 -530
Rockville $1709 $184 430 450
RENTAL RATES
$400000
$380000
$360000
$340000
$320000
2014 2015 2016 2017 2018 2019
$3000000000
$2500000000
$2000000000
$1500000000
$1000000000
$500000000
$0
Although no markets saw overall positive rent growth over the past year Suburban Maryland was the least negatively impacted region in the metro in terms of rental rates Class-A rents declined by 13 YoY to an average of $1905unitmonth or $203 per square foot Class-A vacancy currently stands at 45 Class-B rents declined 10 to an average of $1591unitmonth or $173 per square foot Class-B vacancy currently stands at 31 Overall Class-A and Class-B apartment rents fell by a total of 11 YoY to an average of $1697unitmonth or $183 per square foot
Home prices have dropped slightly in Suburban Maryland after four consecutive years of positive growth The current median home sale price is $393000 The robust effect of the Amazon announcement has spilled over into Suburban Marylandrsquos housing market as a desirable and often more affordable option than Northern Virginia Much of Suburban Maryland multifamily properties remain within the ideal 30-minute commute from large employment drivers such as Amazon HQ2 and parts of Washington DC
Investment activity was highest in Suburban Maryland as $1222570000 traded in 13 sales in the first half of 2020 Value-Add product made up a majority of transaction volume at 61 while CoreCore-Plus accounted for the remaining 39 4017 Willard was the highest sale in terms of total volume and price per unit at $267500000 and $526667 per unit
BETHESDA ROW
NORTHLAKE
$310000
$320000
$330000
$340000
$350000
$360000
$370000
$380000
$390000
$400000
2014 2015 2016 2017 2018 2019 2020
Sub MD Median Home Sales Price
2020
$0
$500000000
$1000000000
$1500000000
$2000000000
$2500000000
$3000000000
2013 2014 2015 2016 2017 2018 2019 H1 2020
Sub MD Sales Volume
2018 20192016 20172014 20152013 H1 2020
4701 WILLARD
20
BALTIMORE METRO H1 2020
BALTIMORE METRO OVERVIEW
While the Baltimore metro is performing well compared to other metros across the country the region has seen the effects of the COVID-19 pandemic with impacts to employment transaction volume rent growth and absorption rates Over 172000 jobs were lost in greater Baltimore since Q2 2019 which is a 12 decrease in total nonfarm employment The June 2020 unemployment rate in the Baltimore metro is 80 which is a 450 bps increase from January 2020 Baltimore however is considered to be better positioned than other regions to weather the current economic downturn due to its impressive resilience in previous recessions In the Global Financial Crisis Baltimore ranked sixth in terms of GDP growth and ninth in payroll job growth across the nation
Just over 2400 units delivered in the Baltimore metro in H1 2020 and 2532 units are currently under construction The average rent in Baltimore is $1759unitmonth or $185 per square foot An aggregate of $506M in sales transacted across 13 sales CBRE brokered two of the three largest transactions in H1 2020 across the Baltimore metro
BALTIMORE METRO
21
BALTIMORE METRO H1 2020
382274copy 2020 CBRE Inc All rights reserved This information has been obtained from sources believed reliable but has not been verified for accuracy or completeness You should conduct a careful independent investigation of the property and verify all information Any reliance on this information issolely at your own risk CBRE and the CBRE logo are service marks of CBRE Inc All other marks displayed on this document are the property of their respective owners and the use of such logos does not imply any affiliation with or endorsement of CBRE
1
2
3
4
5
6
7
8
91 0
CATONSVILLE
ELKRIDGE
ELLICOTT CITY
LINTHICUM HEIGHTS
PIKESVILLE
RANDALLSTOWN
WOODLAWN
SEVERN
ARBUTUS
FERNDALE
LOCHEARN
MAYS CHAPEL
MILFORD MILL
OWINGS MILLS
REISTERSTOWN
DUNDALK
MIDDLE RIVER
PERRY HALL
RIVIERA BEACH
ROSEDALE
ESSEX
GLEN BURNIE
PARKVILLE
EDGEWOODJOPPA
CARNEY
GREEN HAVEN
OVERLEA
ROSSVILLE
JOPPATOWNE
BALTIMORE
295
24
924
100
29
1
70
83
83
195
97
895
95
95
395
695 95
BALTIMOREWASHINGTONINTL AIRPORT
MARTINSTATE
AIRPORT
2020 MID ATLANTIC MULTIFAMILY DELIVERIESBALTIMORE
sup1 0 15 3075
Miles
MULTIFAMILY DELIVERY
Leased 45Developer Sid Emmer
8 The View at Mill Run Phase IIUnits 157
Developer Greystar
7 Elan TowsonUnits 208
Leased 40Developer La Cite
6 CenterWest- Phase 1AUnits 262
Developer Klein EnterprisesManekin LLC
5 The WoodberryUnits 284
Leased 35Developer AvalonBay CommunitiesRetail Properties
3 Avalon TowsonUnits 371
Leased 7Developer Wood Partners
2 Alta Brewers HillUnits 371
Leased 4Developer Chesapeake Realty Partners
4 Avenue GrandUnits 324
Leased 36Developer Howard Hughes
1 Juniper - Merriweather DistrictUnits 380
Leased 67Developer Atlantic Realty
10 The MorrisonUnits 15
Leased 10Developer Zahlco
9 9 E Mount Royal StreetUnits 65
2020 DELIVERIES MAP
BALTIMORE METRO DELIVERIES
Deliveries picked up in Baltimore throughout 2020 with the addition of 2437 units throughout the metro equating to a 12 increase in total inventory More units delivered in the first half of 2020 than were delivered in all of 2019 The largest deliveries were Howard Hughesrsquo Juniper a 380-unit property as part of the Merriweather District in Columbia Wood Partnersrsquo Alta Brewers Hill a 371-unit property in Baltimore City and Avalonbay Communitiesrsquo Avalon Towson a 371-unit property in Towson There are currently 2532 units under construction that are expected to deliver in the next 24 months The average lease-up pace for properties in Baltimore is 15 units per month
Leased 36
Leased 7
Leased 35
Leased 4
Leased 34
Leased 40
Leased 19
Leased 45
Leased 10
Leased 67
Source Yardi Matrix 2020 Source Axiometrics 2020
22
BALTIMORE METRO H1 2020
Job Growth YoY EMPLOYMENT
$506028000SALES IN H1 2020
2913 UNITSSOLD IN H1 2020
14 PROPERTIES
10000
8000
6000
4000
2000
0
7
6
5
4
3
2
0
VacancyUnits
Delivered Baltimore Metro Summary
Deliveries Net Absorption Vacancy
Year
DEVELOPMENTBALTIMORE METRO BY THE NUMBERS
500
$1759
2532 UNITSUNDER CONSTRUCTION
2437 UNITSDELIVERED IN 2020
STABILIZED VACANCY
PIPELINE
TOTAL AVG RENTS
Source CBRE Research Axiometrics and Delta Associates
As of June 30 2020
PER UNIT PER MONTH
6906 UNITS36-MONTH PIPELINE
Deliveries in Baltimore picked up with an additional 2437 units in H1 2020 Just under 2000 units were absorbed in the past 12 months most of them before the beginning of 2020 which has caused vacancy to increase in H1 2020 Across the Baltimore metro vacancy increased 80 bps to 50 In the Baltimore Suburbs vacancy stands at 44 up 10 bps YoY and in Baltimore city vacancy is 66 up 290 bps YoY
During the recent downturn Baltimore experienced a loss of 172500 jobs The most impacted sector was Leisure and Hospitality in which 45 of employees were furloughed or laid off Education and Health Services also took a loss of 30800 jobs Federal Government and Mining Logging and Construction were the only industries to see job growth with an increase of 800 employees and 3300 respectively The spike in Mining Logging and Construction may have been the result of the emergency expansion of Baltimorersquos hospitals and uninterrupted construction at existing development sites At the start of 2020 Baltimorersquos unemployment rate was 35 and is currently 95 There are currently 1253600 nonfarm employees in the Baltimore metro
CAPITAL MARKETS
$185PER SF PER MONTH
09RENT GROWTH
NORTHERN SUBURBS
-010SOUTHERN SUBURBS
-50000 -30000 -10000 0 10000-70000 -60000 -50000 -40000 -30000 -20000 -10000 0 10000
H2 2020 Baltimore Employment
2015 2016 2017 2018 2019 2020 2021 2022 2023 2024 20250
1
2
3
4
5
6
7
-2000
0
2000
4000
6000
8000
10000
Vacanc
y ()
Units
Rentable Completions(Units)
Net Absorption(Units)
Vacancy Rate(Avg )
StateLocal Government
Federal Government
Other Services
Leisure and Hospitality
Education and Health Services
Professional and Business Services
Financial Activities
Information
Retail Trade
Wholesale Trade
Trade Transportation and Utilities
Manufacturing
Mining Logging and Construction
Forecast
23
BALTIMORE METRO H1 2020
BALTIMORE METRO HOME PRICES
Property Year Built Sold Price Units $Unit
Townes at Holly Station 1985 042320 $115000000 510 $225490
Chatham Gardens 1980 041720 $83280000 414 $201159
The Point at Elkridge 1988 032720 $72500000 312 $232372
BLVD at White Springs 1977 040820 $61099000 459 $133113
Old Orchard 1986 041720 $33179940 180 $184333
LARGEST SALESBALTIMORE METRO MULTIFAMILY SALES VOLUME
Submarket Avg $UnitMo Avg $SFMo Vacancy
Annapolis $1749 $198 49
Baltimore City East $1434 $179 55
Baltimore City North $1095 $135 69
Baltimore City West $996 $125 41
ColumbiaNorth Laurel $1643 $170 44
Downtown Baltimore $1548 $189 85
Ellicott CityElkridge $1609 $167 47
Far North Baltimore Suburbs $1310 $136 29
Northeast Anne Arundel County $1374 $157 42
Northwest Anne Arundel County $1720 $172 51
Owings MillsPikesvilleRandallstown $1365 $132 45
ParkvilleCarneyPerry Hall $1164 $135 36
Southeast Baltimore County $1097 $132 38
Southwest Baltimore County $1172 $131 45
TowsonHunt Valley $1390 $140 53
RENTAL RATES - ALL PRODUCT TYPES
$3000000000
$2500000000
$2000000000
$1500000000
$1000000000
$500000000
$0
2014 2015 2016 2017 2018 2019
$255000
$250000
$245000
$240000
$235000
$220000
$205000
Rent growth in the Baltimore metro remained largely flat since June 2019 The Northern Baltimore Suburbs experienced 09 rent growth the Southern Baltimore Suburbs experienced a drop of 01 rent growth and Baltimore City rents fell by 30 The Baltimore suburbs outpaced Baltimore City in terms of rent growth and absorption Current vacancy in the Baltimore metro is 50 with the highest vacancies in Downtown Baltimore at 85 Baltimore City North at 69 and Baltimore City East at 55 According to Delta Reports the Howard CountyColumbia submarket fared the best in the metro with 27 YoY rent growth
Home values in the Baltimore metro increased 20 YoY up slightly from the five-year average growth rate of 15 The current median sales price in the Baltimore metro is $251000 Single-family homes in Baltimore County posted a 10-year high median sale price of $330000 This is a 6 YoY increase from June 2019 Homes in Baltimore City also posted a 10-year high median sale price of $238000 Of note Owings Mills experienced a 27 YoY increase in median home value for an average of $415000
Investment activity reached $506M in the Baltimore metro during the first two quarters of 2020 in 14 transactions All but one sale was value-add product The highest sales in terms of price per unit were Point at Elkridge a 312-unit property in Elkridge which sold for $232400 per unit and Townes at Holly Station a 510-unit property in Waldorf which sold for $225500 per unit CBRE brokered both sales
TOWNES AT HOLLY STATION
$215000
$220000
$225000
$230000
$235000
$240000
$245000
$250000
2014 2015 2016 2017 2018 2019
Baltimore Metro Median Sale Price
$0
$500000000
$1000000000
$1500000000
$2000000000
$2500000000
$3000000000
2013 2014 2015 2016 2017 2018 2019 H1 2020
Balitmore Metro Sales Volume
2018 20192016 20172014 20152013 H1 2020
$210000$215000$220000$225000$230000$235000$240000$245000$250000$255000
2014 2015 2016 2017 2018 2019 2020
Baltimore Metro Median Sale Price
2020
24
FOR SALES OR FINANCING INFORMATION CONTACT
William S RoohanVice Chairman(O) +1 410 244 3122(M) +1 443 690 6967billroohancbrecom
Michael E MuldowneyExecutive Vice President(O) +1 410 244 3144(M) +1 443 250 3144mikemuldowneycbrecom
Robert G Dean IIISenior Vice President(O) +1 202 585 5766(M) +1 202 578 6941robertdeancbrecom
Jonathan M GreenbergSenior Vice President(O) +1 703 734 4772(M) +1 202 423 6655jonathangreenbergcbrecom
Martha A HastingsSenior Vice President(O) +1 410 244 3162(M) +1 410 807 2450marthahastingscbrecom
Brian H MargerumSenior Vice President(O) +1 410 244 3135(M) +1 443 386 1096brianmargerumcbrecom
Michael D RudolphSenior Vice President(O) +1 410 244 3121(M) +1 443 928 0392michaelrudolphcbrecom
John T Sheridan JrSenior Vice President(O) +1 703 905 0239(M) +1 703 200 7720johnsheridancbrecom
Yalda G HowellFirst Vice President(O) +1 202 585 5677(M) +1 240 462 2332yaldaghamariancbrecom
Thomas B LeachmanVice President(O) +1 202 585 5638(M) +1 240 688 0189thomasleachmancbrecom
Kemp D BroujosSenior Associate(O) +1 202 585 5724(M) +1 443 786 2951kempbroujoscbrecom
Nathan E BarthAssociate(O) +1 703 905 0228(C) +1 703 340 6828nathanbarthcbrecom
Zachary L StoneSales Assistant(O) +1 202 585 5650 (M) +1 202 713 8404zachstonecbrecom
Investment Sales amp Brokerage
Operations amp Marketing
Debt amp Structured Finance Team
Patricia C BonebrakeSenior Director of Operations(O) +1 410 244 3141(C) +1 443 253 5917trishbonebrakecbrecom
Jennifer W BusseyOperations Manager(O) +1 410 244 3134(C) +1 410 300 1302jenniferbusseycbrecom
Cheryl FinlaysonProductions Systems Manager(O) +1 410 244 7100(C) +1 410 244 3101cherylfinlaysoncbrecom
Margaret O MacleayOperations Supervisor(O) +1 202 585 5638(C) +1 410 562 9340maggiemacleaycbrecom
Rachel L MossmanSenior Communications Specialist(O) +1 410 244 3179(C) +1 410 244 7100rachelmossmancbrecom
Samantha S FifieldSales Assistant(O) +1 202 585 5773(C) +1 310 266 0003samanthafifieldcbrecom
Caroline P LekakosClient Services Coordinator(O) +1 202 585 5606(C) +1 240 595 0642carolinelekakoscbrecom
Yasmeen F ShararaClient Services Coordinator(O) +1 202 585 5580(C) +1 301 828 7435yasmeenshararacbrecom
Lauren E SpielmanClient Services Coordinator(O) +1 410 244 3129(C) +1 443 800 4388laurenspielmancbrecom
Grace F TrimbleClient Services Coordinator(O) +1 410 244 3123(C) +1 410 499 1064gracetrimblecbrecom
David F WebbVice Chairman(O) +1 202 585 5721(M) +1 202 744 4900davidwebbcbrecom
Maximiliane T LeachmanExecutive Vice President(O) +1 202 585 5655(M) +1 404 358 4317maxileachmancbrecom
Justin J GlasgowSenior Vice President(O) +1 202 783 1723(M) +1 202 316 1804justinglasgowcbrecom
RESEARCH TEAM
JEANETTE I RICE Americas Head of Multifamily Research (O) +1 214 979 6169
(C) +1 817 412 0709 jeanettericecbrecom
MOLLY M HUNT Research Analyst (O) +1 202 585 5597(C) +1 415 599 6009 mollyhuntcbrecom
RANK
1Fortune Magazinersquos
Most Admired Commercial Real Estate
Firm
REPUTATION
2Ranked the 2
Multifamily Brokerage Team in the entire nation by
Real Estate Forum
THE CBRE TEAM COMPETITIVE ADVANTAGE
25
RESOURCES
26Largest team and most
capacity in the Mid-Atlantic region
EXPERIENCE
$174B+The aggregate sales
value of deals our team has brokered since
2015
DEBT TEAM
1The CBRE Debt amp
Structured Finance Team is the 1 Freddie Mac
SellerServicer
copy Copyright 2020 All rights reserved Information contained herein including projections has been obtained from sources believed to be reliable but has not been verified for accuracy or completeness CBRE Inc makes no guarantee warranty or representation about it Any reliance on such information is solely at your own risk This information is exclusively for use by CBRE clients and professionals and may not be reproduced without the prior written permission of CBRErsquos Global Chief Economist CBRE and the CBRE logo are service marks of CBRE Inc andor its affiliated or related companies in the United States and other countries All other marks displayed on this document are the property of their respective owners Photos herein are the property of their respective owners Use of these images without the express written consent of the owner is prohibited
WASHINGTON DC1900 N Street NW
Suite 700 Washington DC 20036
+1 (202) 783 8200
BALTIMORE MD100 East Pratt Street
Suite 1700Baltimore MD 21202+1 (410) 244 7100
TYSONS VA1861 International Drive
Suite 300McLean VA 22102+1 (703) 821-6900

8
WASHINGTON DC H1 2020
WASHINGTON DC OVERVIEW
The District is experiencing negative effects of the COVID-19 pandemic with drops in rent absorption and rising vacancy throughout the apartment market The average monthly Class-A rent fell 35 YoY to a monthly average of $2561 per unit per month or $327SF The average Class-B rent fell 27 to an average of $2067unitmonth or $274SF
Just over 3000 units across the city delivered in the first half of 2020 and 12969 units are currently under construction Capitol Riverfront emerged as the leading submarket in terms of development activity with a 1475-unit increase with the delivery of The Estate The Kelvin Parc Riverside Phase I Meridian on First and The Maren Multifamily capital markets finished H1 2020 with $292860000 sold throughout the District over 9 sales The COVID-19 pandemic has slowed investment activity significantly as investors weather the storm of economic volatility Comparatively in the first half of 2019 over $685000000 transacted over 30 sales
THE DISTRICT
9
WASHINGTON DC H1 2020
2020 DELIVERIES MAP
THE DISTRICT DELIVERIES
Over 3000 units delivered to the District in H1 2020 accounting for a 21 increase to the total multifamily housing inventory The pipeline continues on a steady upward trend and will not slow until late 2022 There are currently 12696 units under construction that will increase the total multifamily inventory by 88 over the next two years
NoMa H Street Corridor Union Market and Capitol Riverfront are the most active submarkets in terms of development activity These growing areas continue to deliver Class-A luxury apartment buildings in areas that are also seeing retail and office space developments
382274copy 2020 CBRE Inc All rights reserved This information has been obtained from sources believed reliable but has not been verified for accuracy or completeness You should conduct a careful independent investigation of the property and verify all information Any reliance on this information issolely at your own risk CBRE and the CBRE logo are service marks of CBRE Inc All other marks displayed on this document are the property of their respective owners and the use of such logos does not imply any affiliation with or endorsement of CBRE
1
2
3
4
5 6
7
8
9
1 0
1 1
WASHINGTON
295
5050
695
395
395
395
Rhode Island Ave NE
Virginia Ave NW
Rhode Island Ave NW
H St NE
Min
neso
taAv
eN
E
Q St NW
Potomac Ave SE
11
th S
t S
E
Minnesota Ave SE
13
th S
t N
W
13
th S
t N
E
Pennsylvania Ave SE
3rd
St
NW
So
uth
Ca
pit
ol
St
12
thS
tS
W
Florida Ave NE
9th
St
SW 7th
St
SW
9th
St
NW
Pennsylvania Ave NW
Tenn
esse
eAv
eN
E
E Capitol St SE
US-1N
6th
St
NE
Massachusetts Ave NW
US-
1S
4th
St
NE
Independence Ave SE
14
thS
tS
W
Mt Olivet Rd NE
Constitution Ave NW
KentuckyAve
SE
9th
StN
E
Benning Rd NE
6th
St
SE
7th
St
NW
K St NW
Bra
nch
Ave
SE
6th
St
NW
New
Ham
pshi
re A
ve N
W
L St NW
E Capitol St NE
No
rth
Ca
pit
ol
St
14
th S
t N
W
North Carolin
a Ave SE
D St SW
9th
St
SE
22ndSt
NE
Texas AveSE
16
th S
t N
W
B St SE
2n
d S
t N
E
D St SE
21
stSt
NE
8th
St
SE
Maine
Ave
SW
12
th S
t S
E
Kenilw
orthAve
NE
M St SW
I St SE
Bryant St NW
19
th S
t N
W
17
th S
t N
W
11
th S
t N
E
Florida Ave NW
Maryland Ave NE
15
th S
t N
W
4th
St
SE
U St NW
M St NW
M St SE
RidgeRd
SE
Independence Ave SW
H St NW
C St NE
R St NW
2020 MID ATLANTIC MULTIFAMILY DELIVERIESWASHINGTON DC
sup1 0 025 05013
Miles
MULTIFAMILY DELIVERY
Leased 23Developer CAS RieglerEB5
8 BlackbirdUnits 167
Leased 7Developer FRP DevelopmentMRP Realty
7 The MarenUnits 264
Leased 6Developer Paradigm Development
6 Meridian on First IUnits 273
Leased 11Developer Toll Brothers
5 Parc Riverside Phase IIUnits 308
Leased 39Developer Brookfield Properties
3 The EstateUnits 320
Leased 43Developer RappaportWC SmithEB5
2 AvecUnits 420
Leased 36Developer Jair LynchMacFarlane Partners
4 The KelvinUnits 310
Leased 28Developer JBG SmithMRP Realty
1 The WrenUnits 433
Leased 4Developer Jefferson Apt GroupStars Investment
10 J LineaUnits 132
Leased 17Developer JBG Smith
9 901WUnits 161
Leased 42Developer Coba
11 1714-1716 14th Street NWUnits 8
Leased 28
Leased 43
Leased 39
Leased 36
Leased 11
Leased 6
Leased 7
Leased 23
Leased 17
Leased 4
Leased 42
10
-60000 -50000 -40000 -30000 -20000 -10000 0 10000
Q2 2020 DC Employment
WASHINGTON DC H1 2020
Job Growth YoY
-50000 -40000 -30000 -20000 -10000 0 10000
StateLocal Government
Federal Government
Other Services
Leisure and Hospitality
Education and Health Services
Professional and Business Services
Financial Activities
Information
Retail Trade
Wholesale Trade
Trade Transportation and Utilities
Manufacturing
Mining Logging and Construction
EMPLOYMENT
CAPITAL MARKETS
$292860000SALES IN H1 2020
845 UNITSSOLD IN H1 2020
9 PROPERTIES
Deliveries Net Absorption Vacancy
Year
DEVELOPMENTDC BY THE NUMBERS
61
$2561
12696 UNITSUNDER CONSTRUCTION
3004 UNITSDELIVERED IN 2020
STABILIZED VACANCY
PIPELINE
CLASS A AVG RENTS
CLASS B AVG RENTS
Source CBRE Research and Delta Associates
As of June 30 2020
PER UNIT PER MONTH
18907 UNITS36-MONTH PIPELINE
Recent deliveries in the District were concentrated primarily in the Capitol Riverfront and H Street submarkets NoMa and Union Market also remain top submarkets for development activity with around 3483 units under construction on-track to deliver in the next 24 months Annual absorption in the District was 25 lower than a year ago as 2003 units absorbed in the first half of the year Q2 stabilized vacancy rate in the District is 61 a 250 bps increase from the previous year The average lease-up pace of new product in the District is 14 units per month and concessions average 15 months free rent
Insulated by the federal government Washington DC has fared favorably thus far in the downturn compared to other large metros across the nation The District experienced 67000 job losses which represents an 8 YoY loss in employment Leisure and Hospitality suffered the biggest job loss as 60 of the workforce was laid off or furloughed Promisingly government information and other services were the only industries to experience job growth albeit small
PER SF PER MONTH$327
$2067PER UNIT PER MONTH
PER SF PER MONTH$274
7000
6000
5000
4000
3000
2000
1000
0
8
7
6
5
4
3
2
1
0
VacancyUnitsDelivered
Washington DC Summary
2013 2014 2015 2016 2017 2018 2019 2021 2022H22020
H12020
00
10
20
30
40
50
60
70
80
90
0
1000
2000
3000
4000
5000
6000
7000
2013 2014 2015 2016 2017 2018 2019 H1 2020 H2 2020 2021 2022
Vaca
ncy
Units
Deliveries Net Absorption Vacancy
Forecast
11
WASHINGTON DC H1 2020
WASHINGTON DC HOME PRICES
Property Year Built Price Sold Units $Unit
The Woodley 2014 $180250000 010820 212 $850235
Skyline Apartments 1965 $58700000 030120 398 $147487
Glenwood Apartments 1942 $13700000 013020 90 $152222
The Waring 1909 $8400000 063020 24 $328947
The Regent 1937 $8450000 063020 12 $228378
LARGEST SALESDC MULTIFAMILY SALES VOLUME
$2000000000
$1500000000
$1000000000
$500000000
$02018 20192016 20172014 20152013
THE SHELBY
Class A High-Rise Avg $UnitMo
Avg $SFMo Vacancy YoY Rent Change
Upper NW $2810 $347 50 -06
Central $2822 $345 51 -46
Columbia HeightsShaw $2663 $363 64 -21
NoMaH Street $2290 $302 82 -57
Capitol HillRiverfrontSouthwest $2583 $325 77 -33
Northeast $2092 $266 85 -07
Upper Georgia $2183 $281 53 06
Class B Mid-and High-Rise Avg $UnitMo
Avg $SFMo Vacancy YoY Rent Change
Upper Northwest $2104 $258 43 -26
Mount Vernon Square NW $1925 $291 76 -74
Southwest $2085 $289 30 -04
RENTAL RATES
The District experienced broad rent decreases across almost all submarkets with the exception of Upper Georgia The Northeast and NoMaH Street submarkets have the highest Class-A High-Rise vacancy at 85 and 82 respectively This is in part due to an influx of new deliveries to those markets Class-B vacancy currently stands at 45 and concessions are at 30 of face rent The Mount Vernon Square submarket has the highest Class-B Mid and High-Rise vacancy at 76 and the highest decline in rent growth at -74 Class-A and Class-B apartments rents fell by a total of 33
The current average home value in the District is $586000 While home values grew in 2020mdashseeing an average annual increase of 70mdashhome values in the District have increased on average 30 YoY since 2015
A total of $2929M multifamily sales transacted in the District in nine sales in the first two quarters of 2020 CoreCore-Plus transactions made up for 71 of transactions and Value-Add transactions made up for the remaining 29 of total sales volume The highest sales in terms of price per unit were The Woodley a 212-unit property in Woodley Park at $850235 per unit and The Shelby a 24-unit property in Dupont Circle at $350000 per unit both of which were brokered by CBRE The Woodley was also the largest sale in H1 2020 across the District at $18025M
$0
$500000000
$1000000000
$1500000000
$2000000000
2013 2014 2015 2016 2017 2018 2019 H1 2020
DC Sales Volume
H1 2020
$600000
$500000
$400000
$300000
$200000
$100000
2014 2015 2016 2017 2018 2019$0
$100000
$200000
$300000
$400000
$500000
$600000
2014 2015 2016 2017 2018 2019 2020
DC Home Prices
2020
12
NORTHERN VIRGINIA H1 2020
NORTHERN VIRGINIA
NORTHERN VIRGINIA OVERVIEW
Northern Virginia continues to be the fastest growing region in the DC metro The regionrsquos economic future has been bolstered by Amazonrsquos decision to build its HQ2 in National Landing Amazon selected Northern Virginia because of its inherently strong fundamentals including a rich pipeline of talent provided by numerous universities in the area Amazon has subsequently begun the first phase of its hiring process and build-out at National Landing including hiring over 1000 white-collar employees and moving into 300000 SF of office space The delivery of HQ2 is expected to add 40000 to 60000 units of additional apartment demand to the area in the next decade A typical Amazon HQ2 worker will make $150000 per year which allows for up to $3750 in monthly rent Additionally Virginia Tech is moving forward with its plans to build the $1 Billion Innovation Campus in Potomac Yard The introduction of these two strong economic drivers will continue to further diversify the job base and incentivize more businesses to move to all areas of the DC metro where a pipeline of talent awaits
$400000
$450000
$500000
$550000
$600000
2014 2015 2016 2017 2018 2019
DC Home Prices
13
NORTHERN VIRGINIA H1 2020
2020 DELIVERIES MAP
NORTHERN VA DELIVERIES
Just under 4000 new units delivered in H1 2020 across Northern Virginia accounting for a 16 increase in total volume There are currently 10135 units under construction which will add 4 to the inventory over the next 24 months The largest deliveries in the region include Perseus Realtyrsquos The Foundry a 525-unit property in Alexandria Saul Centersrsquo Waycroft a 490-unit property in BallstonVirginia Square Wash REITrsquos The Trove a 401-unit property in Columbia Heights Arlington and Combined Propertiesrsquo Scout on the Circle a 400-unit property in Fairfax
382274copy 2020 CBRE Inc All rights reserved This information has been obtained from sources believed reliable but has not been verified for accuracy or completeness You should conduct a careful independent investigation of the property and verify all information Any reliance on this information issolely at your own risk CBRE and the CBRE logo are service marks of CBRE Inc All other marks displayed on this document are the property of their respective owners and the use of such logos does not imply any affiliation with or endorsement of CBRE
1
2
45
6
7
8
9
1 0
1 1
1 2
LORTON
MANASSAS
WOODBRIDGE
FORT HUNTNEWINGTON
LAKE RIDGE
CENTREVILLE
HERNDON
MANASSAS PARK
RESTON
STERLING
CHANTILLY
FAIRFAX STATION
ANNANDALE
BETHESDA
BURKE
FAIRFAX
FALLS CHURCH
NORTH BETHESDA
TYSONS CORNER
VIENNA
POTOMAC
MCLEAN
OAKTON
SPRINGFIELD
GROVETON
IDYLWOOD
JEFFERSON
LINCOLNIA
WEST SPRINGFIELD
WOLF TRAP
ADELPHI
BELTSVILLE
BOWIE
CALVERTON
CAMP SPRINGS
CLINTON
COLLEGE PARK
FORESTVILLE
GREENBELT
HILLCREST HEIGHTS
HYATTSVILLE
LANHAM
ROSARYVILLE
GLENN DALE
CORAL HILLS
EAST RIVERDALE
KETTERING
WASHINGTON201
267
28295
295
381
110
5
50
29
301
695
66
270
495
395
95
495
495
495
95
WASHINGTONDULLES INTL
AIRPORT
RONALD REAGANWASHINGTON
NATL ARPT
POTOMACAIRFIELD
FREEWAYAIRPORT
COLLEGE PARK AIRPORT
2020 MID ATLANTIC MULTIFAMILY DELIVERIESNORTHERN VIRGINIA
sup1 0 2 41
Miles
MULTIFAMILY DELIVERY
Leased 20Developer Novare Group Mulberry Development Group
8 Cameron SquareUnits 302
Leased 22Developer Praedium Group
7 The ClarkUnits 342
Leased 5Developer Erkiletian DevelopmentPCCP
6 The Sur at National GatewayUnits 360
Leased 65Developer Orr Partners
5 Centro ArlingtonUnits 366
Leased 12Developer Washington Real Estate Investment Trust
3 The TroveUnits 401
Leased 34Developer Saul Centers REIT (Northwestern Mutual Life Insurance)
2 The WaycroftUnits 490
Developer Combined Properties
4 Scout on the CircleUnits 400
Leased 21Developer Perseus RealtyELVFour Points
1 Foundry at CarlyleUnits 525
Leased 49Developer Shooshan Co Brandywine Realty Trust
10 4040 WilsonUnits 244
Leased 25Developer Abramson Properties Weingarten Realty AHDC
9 Array at West AlexUnits 278
Leased 40Developer Elm Street DevelopmentNorthwood Ravin
12 Preserve at Westfields - Phase IUnits 132
Leased 17Developer Novus
11 Mission LoftsUnits 157
Leased 21
Leased 34
Leased 12
Leased 7
Leased 65
Leased 5
Leased 22
Leased 20
Leased 25
Leased 49
Leased 17
Leased 40
Source Axiometrics 2020
VIRGINIA TECH INNOVATION CAMPUS
AMAZON HQ2
3
14
NORTHERN VIRGINIA H12020
$494500000SALES IN H1 2020
1823 UNITSSOLD IN H1 2020
9 PROPERTIES
Deliveries Net Absorption VacancyYear
NoVA BY THE NUMBERS
43
$1992
10135 UNITSUNDER CONSTRUCTION
3997 UNITSDELIVERED IN 2020
STABILIZED VACANCY
PIPELINE
CLASS A AVG RENTS
CLASS B AVG RENTS
Source CBRE Research and Delta Associates
As of June 30 2020
PER UNIT PER MONTH
14567 UNITS36-MONTH PIPELINE
Just under 4000 units delivered in H1 2020 which equates to a 10 increase in total inventory throughout the year Arlington accounted for 59 of new deliveries and Alexandria accounted for 27 The average lease-up pace for properties in Northern Virginia is currently 21 units per month compared to 24 units per month in January 2020 Northern Virginiarsquos current stabilized vacancy is 43 a 70 bps YoY increase
Job Growth YoY as of June 2020EMPLOYMENT
Northern Virginia experienced the YoY employment decline of 134700 jobs Leisure and Hospitality fared the worst with the loss of 64500 jobs and Education and Health Services with the loss of 32100 jobs However there was growth in Information and Financial Activities industries At the start of the year unemployment was at 25 and it currently stands at 86
As of June 2020 Amazon has already hired 1000 employees It is estimated that Amazon will bring 1200 employees in 2020 and an additional 2000 employees in 2021
CAPITAL MARKETS
PER SF PER MONTH$217
$1746 PER UNIT PER MONTH
PER SF PER MONTH$194
VacancyNorthern Virginia SummaryUnits
Delivered
DEVELOPMENT
-70000 -60000 -50000 -40000 -30000 -20000 -10000 0 10000
H1 2020 NoVa Employment
-70000 -50000 -30000 -10000 0 10000
5
4
3
2
1
02014 2015 2016 2017 2018 2019 H1
2020H2
2020
10000
8000
6000
4000
2000
02021 2022
StateLocal Government
Federal Government
Other Services
Leisure and Hospitality
Education and Health Services
Professional and Business Services
Financial Activities
Information
Retail Trade
Wholesale Trade
Trade Transportation and Utilities
Manufacturing
Mining Logging and Construction
0
001
002
003
004
005
006
0
1000
2000
3000
4000
5000
6000
7000
8000
9000
2014 2015 2016 2017 2018 2019 H1 2020 H2 2020 2021 2022
Vaca
ncy
Units
Deliveries Net Absorption Vacancy
Forecast
15
NORTHERN VIRGINIA H1 2020
NoVA HOME PRICES
Property Year Built Sold Price Units $Unit
The Emerson 2019 012720 $117000000 355 $329577
Avana Alexandria 1991 013020 $106000000 326 $325153
Ravensworth Towers 1973 041120 $59000000 219 $269406
The Bradley 2015 012020 $57666667 165 $349495
Monroe Place 2008 032620 $56950000 202 $281931
LARGEST SALESNoVA MULTIFAMILY SALES VOLUME
Class A High-Rise Avg $UnitMo
Avg $SFMo Vacancy YoY Rent
Change
Alexandria $2124 $243 54 -33
RosslynBallston Corridor $2490 $300 36 -27
Crystal CityPentagon City $2356 $268 74 -72
South Arlington $2024 $232 45 00
Tysons $2264 $252 78 -134
RestonHerndon $2106 $226 95 -71
Falls ChurchMerrifield $2117 $234 55 -70
Class B Mid-and High Rise Avg $UnitMo
Avg $SFMo Vacancy YoY Rent
Change
Falls ChurchNorth Arlington $2264 $249 54 07
South Arlington $1674 $198 21 -01
Arlandria $1662 $220 16 11
West Alexandria $1666 $183 54 -04
Crystal City $2226 $206 62 -60
RENTAL RATES
$650000
$625000
$600000
$575000
$550000
$5250002014 2015 2016 2017 2018 2019
$5000000000
$4000000000
$3000000000
$2000000000
$1000000000
$0
Northern Virginia experienced rent decreases compared to H1 2019 with the exception of Class-A product in South Arlington and Class-B product in Falls ChurchNorth Arlington and Arlandria Class-A rents fell by 41 to $1992unitmonth or $217 per square foot Class-A vacancy in Northern Virginia is currently 49 and concessions are at 50 of face rent RestonHerndon and Tysons have the highest Class-A vacancy at 95 and 78 due in most part to increased deliveries in those submarkets Class B rents fell 16 YoY to $1746unitmonth or $194 per square foot Class-B vacancy is currently 39 and concessions are 20 of face rent Crystal City has the highest Class-B vacancy at 62 Class-A and Class-B rents fell by a total of 25 YoY
Homes values in Northern Virginia continue to see impressive growth as demand significantly outweighs supply in 2020 New listing inventory was down by 35 this year and prices continue to climb Homes are on the market for an average of 35 weeks before selling The current median home value in Northern Virginia is $641002 which is a 44 YoY increase across the region Alexandria is the fastest growing housing market in the nation with 202 YoY median sale value growth Arlington County currently maintains the highest home value in Northern Virginia and experienced an 11 YoY increase The high cost of home buying in Northern Virginia will likely drive multifamily demand as renters are priced out of the for sale housing market
A total of $4945M multifamily sales transacted in Northern Virginia in nine properties in the first half of 2020 Value-add sales accounted for 77 of transactions and CoreCore-Plus sales made up the remaining 23 of total investment volume The highest price per unit sales were The Bradley a 165-unit property in Alexandria which sold at $349500 per unit and The Emerson a 355-unit property in Herndon which sold at $329600 per unit
JEFFERSON FAIR OAKS
$520000
$540000
$560000
$580000
$600000
$620000
2014 2015 2016 2017 2018 2019
NoVA Average Sold Home Price
$0
$1000000000
$2000000000
$3000000000
$4000000000
$5000000000
2013 2014 2015 2016 2017 2018 2019 H1 2020
NoVA Sales Volume
2018 20192016 20172014 20152013 H1 2020
$500000$520000$540000$560000$580000$600000$620000$640000$660000
2014 2015 2016 2017 2018 2019 2020
NoVA Average Sold Home Price
2020
16
SUBURBAN MD H1 2020
SUBURBAN MARYLAND
SUBURBAN MARYLAND OVERVIEW
Suburban Maryland fared the best in terms of rent growth absorption and transaction volume compared to the other markets in Washington DC Its lower density setting may be in part responsible for its recent resilience as residents choose to relocate out of higher density urban areas
Suburban Maryland is one of the most prominent areas in the region for the Life Sciences sector and is home to the headquarters of the National Institute of Health Department of Energy the Food and Drug Administration and the National Institute of Standards and Technology The presence of biotech in the I-270 Corridor in particular has greatly benefited the commercial real estate market in office industrial and multifamily Life Sciences buildings have significantly lower vacancy rates than that of other commercial office buildings As of 2019 laboratory vacancy sits at around 50 on average while office vacancy rate in Suburban Maryland is nearly 19 Montgomery and Prince Georgersquos counties continue to be largely unique in their growth of biotech because they remain suburban areas in comparison to Life Sciences hubs such as Boston New York and San Francisco that continue to grow as urban areas
Although investment activity slowed down considerably across the region Suburban Maryland is an outlier Over $12B transacted in H1 2020 which is more than H1 2019 when $893M transacted
17
SUBURBAN MD H1 2020
2020 DELIVERIES MAP
SUBURBAN MD DELIVERIES
Deliveries slowed in Suburban Maryland with an addition of 492 units across three projects in H1 2020 The deliveries were Bainbridgersquos Bainbridge Lake Linganore a 322-unit property in Frederick NV Commercial Brick Lanersquos The Bottling Plant a 86-unit property in Outlying Frederick County and Landex Developmentrsquos Artisan 4100 an 84-unit property in Brentwood There are currently 6441 units under construction which will add a total of 35 to total inventory over the next 24 months Bethesda has the highest concentration of development activity with just over 1900 units delivering in the next 36 months Unlike other markets in the DC metro Suburban Marylandrsquos vacancy which currently stands at 36 was not largely impacted in the past six months
382274copy 2020 CBRE Inc All rights reserved This information has been obtained from sources believed reliable but has not been verified for accuracy or completeness You should conduct a careful independent investigation of the property and verify all information Any reliance on this information issolely at your own risk CBRE and the CBRE logo are service marks of CBRE Inc All other marks displayed on this document are the property of their respective owners and the use of such logos does not imply any affiliation with or endorsement of CBRE
1
2
3
HERNDONRESTON
STERLING
BALLENGER CREEK
ASPEN HILL
BETHESDA
CHILLUM
NORTH BETHESDA
ROCKVILLE
SILVER SPRING
TAKOMA PARK
TYSONS CORNER
VIENNA
WHEATON-GLENMONT
WHITE OAK
POTOMAC
MCLEAN
COLESVILLENORTH POTOMAC
IDYLWOOD
WOLF TRAP
ADELPHI
BELTSVILLE
BOWIE
CROFTONGREENBELT
HYATTSVILLELANHAM
LAUREL
ODENTONSOUTH LAUREL
CATONSVILLE
COLUMBIA
DAMASCUS
GAITHERSBURG
LINTHICUM HEIGHTS
NORTH LAURELOLNEY
PIKESVILLE
WOODLAWN
SEVERN
ARBUTUS
MONTGOMERY VILLAGE
GERMANTOWN FERNDALE
ELDERSBURG
LOCHEARN
MAYS CHAPEL
REISTERSTOWN
DUNDALK
PERRY HALL
RIVIERA BEACH
ROSEDALE
SEVERNA PARK
TOWSON
ARNOLD
ESSEX
GLEN BURNIE
PASADENA
PARKVILLE
SOUTH GATE
OVERLEANOTTINGHAM
ANNAPOLIS NECK
WASHINGTON
ANNAPOLIS
BALTIMORE
201
3
295
267
7
100
15
50
15
340
40 1
29
301
301
270
495
70
83
195
95
66
97
895
95
95
695
270395
695
WASHINGTONDULLES INTL
AIRPORT
TIPTONAIRPORT
LEE AIRPORT
BALTIMOREWASHINGTONINTL AIRPORT
MARTIN STATEAIRPORT
2020 MID ATLANTIC MULTIFAMILY DELIVERIESSUBURBAN MARYLANDMULTIFAMILY DELIVERY
sup1 0 3 615Miles
Leased 20Developer Landex Development
3 Artisan 4100Units 84
Leased 60Developer NV Commercial Brick Lane
2 Bottling PlantUnits 86
Leased 9Developer Bainbridge Companies
1 Bainbridge Lake LinganoreUnits 322Leased 9
Leased 60
Leased 20
18
-45000 -40000 -35000 -30000 -25000 -20000 -15000 -10000 -5000 0 5000
H1 2020 SubMD Employment
SUBURBAN MD H1 2020
Job Growth YoY
EMPLOYMENT
$12 BILLIONSALES IN H1 2020
5006 UNITSSOLD IN H1 2020
14 PROPERTIES
5000
4000
3000
2000
1000
0
6
5
4
3
2
1
0
VacancyUnits
Delivered Suburban MD Summary
Deliveries Net Absorption Vacancy
Year
DEVELOPMENTSUBURBAN MD BY THE NUMBERS
36
$1905
6441 UNITSUNDER CONSTRUCTION
492 UNITSDELIVERED IN 2020
STABILIZED VACANCY
PIPELINE
CLASS A AVG RENTS
CLASS B AVG RENTS
Source CBRE Research and Delta Associates
As of June 30 2020
PER UNIT PER MONTH
13773 UNITS36-MONTH PIPELINE
As the most affordable option for residents in Washington DC Suburban Maryland continues to provide job opportunities and relatively affordable living Just under 500 units delivered in H1 2020 and 100 units have been absorbed so far this year Suburban Marylandrsquos current stabilized vacancy is 36 down 30 bps from last year
CAPITAL MARKETS
Suburban Maryland experienced the YoY loss of 111400 jobs The most impacted industries were Leisure and Hospitality with a 40 decrease in employment and Education and Health Services with a loss of 15 of employees Trade and Transportation also lost just under 20000 jobs The Federal Government saw a growth of 1000 employees Unemployment in Montgomery and Prince Georgersquos counties is currently 80 and 99 respectively up from 28 and 36 respectively in January 2020
$203PER SF PER MONTH
$1591PER UNIT PER MONTH
$173PER SF PER MONTH
2014 2015 2016 2017 2018 2019 H12020
H22020
2021 2022
StateLocal Government
Federal Government
Other Services
Leisure and Hospitality
Education and Health Services
Professional and Business Services
Financial Activities
Information
Retail Trade
Wholesale Trade
Trade Transportation and Utilities
Manufacturing
Mining Logging and Construction
-35000 -25000 -15000 -5000 0 10000
00
10
20
30
40
50
60
0
500
1000
1500
2000
2500
3000
3500
4000
4500
2014 2015 2016 2017 2018 2019 H12020
H22020
2021 2022
Vacanc
y
Units
Deliveries Net Absorption Vacancy
Forecast
19
SUBURBAN MD H1 2020
SUBURBAN MD HOME PRICES
Property Year Built Sold Price Units $Unit
4701 Willard 1969 062920 $276500000 525 $526667
The Varsity 2011 032720 $146022026 258 $565977
Gallery on New Hampshire 1960 022820 $117000000 675 $173333
Montgomery Paint Branch 1984 061220 $113206000 529 $214000
Jefferson at Inigos Crossing 2008 011320 $109000000 473 $230444
LARGEST SALESSUBURBAN MD MULTIFAMILY SALES VOLUME
Class A High Rise Avg $UnitMo Avg $SFMo Vacancy YoY Rent
Change
Bethesda $2670 $293 72 31
N Bethesda Rockville $2047 $223 60 22
Silver Spring Wheaton $2012 $242 35 18
Hyattsville College Park $1867 $206 46 NA
Class B Mid-and High-Rise Avg $UnitMo Avg $SFMo Vacancy YoY Rent
Change
Silver Spring $1622 $169 920 -190
BethesdaChevy Chase $1982 $217 520 -530
Rockville $1709 $184 430 450
RENTAL RATES
$400000
$380000
$360000
$340000
$320000
2014 2015 2016 2017 2018 2019
$3000000000
$2500000000
$2000000000
$1500000000
$1000000000
$500000000
$0
Although no markets saw overall positive rent growth over the past year Suburban Maryland was the least negatively impacted region in the metro in terms of rental rates Class-A rents declined by 13 YoY to an average of $1905unitmonth or $203 per square foot Class-A vacancy currently stands at 45 Class-B rents declined 10 to an average of $1591unitmonth or $173 per square foot Class-B vacancy currently stands at 31 Overall Class-A and Class-B apartment rents fell by a total of 11 YoY to an average of $1697unitmonth or $183 per square foot
Home prices have dropped slightly in Suburban Maryland after four consecutive years of positive growth The current median home sale price is $393000 The robust effect of the Amazon announcement has spilled over into Suburban Marylandrsquos housing market as a desirable and often more affordable option than Northern Virginia Much of Suburban Maryland multifamily properties remain within the ideal 30-minute commute from large employment drivers such as Amazon HQ2 and parts of Washington DC
Investment activity was highest in Suburban Maryland as $1222570000 traded in 13 sales in the first half of 2020 Value-Add product made up a majority of transaction volume at 61 while CoreCore-Plus accounted for the remaining 39 4017 Willard was the highest sale in terms of total volume and price per unit at $267500000 and $526667 per unit
BETHESDA ROW
NORTHLAKE
$310000
$320000
$330000
$340000
$350000
$360000
$370000
$380000
$390000
$400000
2014 2015 2016 2017 2018 2019 2020
Sub MD Median Home Sales Price
2020
$0
$500000000
$1000000000
$1500000000
$2000000000
$2500000000
$3000000000
2013 2014 2015 2016 2017 2018 2019 H1 2020
Sub MD Sales Volume
2018 20192016 20172014 20152013 H1 2020
4701 WILLARD
20
BALTIMORE METRO H1 2020
BALTIMORE METRO OVERVIEW
While the Baltimore metro is performing well compared to other metros across the country the region has seen the effects of the COVID-19 pandemic with impacts to employment transaction volume rent growth and absorption rates Over 172000 jobs were lost in greater Baltimore since Q2 2019 which is a 12 decrease in total nonfarm employment The June 2020 unemployment rate in the Baltimore metro is 80 which is a 450 bps increase from January 2020 Baltimore however is considered to be better positioned than other regions to weather the current economic downturn due to its impressive resilience in previous recessions In the Global Financial Crisis Baltimore ranked sixth in terms of GDP growth and ninth in payroll job growth across the nation
Just over 2400 units delivered in the Baltimore metro in H1 2020 and 2532 units are currently under construction The average rent in Baltimore is $1759unitmonth or $185 per square foot An aggregate of $506M in sales transacted across 13 sales CBRE brokered two of the three largest transactions in H1 2020 across the Baltimore metro
BALTIMORE METRO
21
BALTIMORE METRO H1 2020
382274copy 2020 CBRE Inc All rights reserved This information has been obtained from sources believed reliable but has not been verified for accuracy or completeness You should conduct a careful independent investigation of the property and verify all information Any reliance on this information issolely at your own risk CBRE and the CBRE logo are service marks of CBRE Inc All other marks displayed on this document are the property of their respective owners and the use of such logos does not imply any affiliation with or endorsement of CBRE
1
2
3
4
5
6
7
8
91 0
CATONSVILLE
ELKRIDGE
ELLICOTT CITY
LINTHICUM HEIGHTS
PIKESVILLE
RANDALLSTOWN
WOODLAWN
SEVERN
ARBUTUS
FERNDALE
LOCHEARN
MAYS CHAPEL
MILFORD MILL
OWINGS MILLS
REISTERSTOWN
DUNDALK
MIDDLE RIVER
PERRY HALL
RIVIERA BEACH
ROSEDALE
ESSEX
GLEN BURNIE
PARKVILLE
EDGEWOODJOPPA
CARNEY
GREEN HAVEN
OVERLEA
ROSSVILLE
JOPPATOWNE
BALTIMORE
295
24
924
100
29
1
70
83
83
195
97
895
95
95
395
695 95
BALTIMOREWASHINGTONINTL AIRPORT
MARTINSTATE
AIRPORT
2020 MID ATLANTIC MULTIFAMILY DELIVERIESBALTIMORE
sup1 0 15 3075
Miles
MULTIFAMILY DELIVERY
Leased 45Developer Sid Emmer
8 The View at Mill Run Phase IIUnits 157
Developer Greystar
7 Elan TowsonUnits 208
Leased 40Developer La Cite
6 CenterWest- Phase 1AUnits 262
Developer Klein EnterprisesManekin LLC
5 The WoodberryUnits 284
Leased 35Developer AvalonBay CommunitiesRetail Properties
3 Avalon TowsonUnits 371
Leased 7Developer Wood Partners
2 Alta Brewers HillUnits 371
Leased 4Developer Chesapeake Realty Partners
4 Avenue GrandUnits 324
Leased 36Developer Howard Hughes
1 Juniper - Merriweather DistrictUnits 380
Leased 67Developer Atlantic Realty
10 The MorrisonUnits 15
Leased 10Developer Zahlco
9 9 E Mount Royal StreetUnits 65
2020 DELIVERIES MAP
BALTIMORE METRO DELIVERIES
Deliveries picked up in Baltimore throughout 2020 with the addition of 2437 units throughout the metro equating to a 12 increase in total inventory More units delivered in the first half of 2020 than were delivered in all of 2019 The largest deliveries were Howard Hughesrsquo Juniper a 380-unit property as part of the Merriweather District in Columbia Wood Partnersrsquo Alta Brewers Hill a 371-unit property in Baltimore City and Avalonbay Communitiesrsquo Avalon Towson a 371-unit property in Towson There are currently 2532 units under construction that are expected to deliver in the next 24 months The average lease-up pace for properties in Baltimore is 15 units per month
Leased 36
Leased 7
Leased 35
Leased 4
Leased 34
Leased 40
Leased 19
Leased 45
Leased 10
Leased 67
Source Yardi Matrix 2020 Source Axiometrics 2020
22
BALTIMORE METRO H1 2020
Job Growth YoY EMPLOYMENT
$506028000SALES IN H1 2020
2913 UNITSSOLD IN H1 2020
14 PROPERTIES
10000
8000
6000
4000
2000
0
7
6
5
4
3
2
0
VacancyUnits
Delivered Baltimore Metro Summary
Deliveries Net Absorption Vacancy
Year
DEVELOPMENTBALTIMORE METRO BY THE NUMBERS
500
$1759
2532 UNITSUNDER CONSTRUCTION
2437 UNITSDELIVERED IN 2020
STABILIZED VACANCY
PIPELINE
TOTAL AVG RENTS
Source CBRE Research Axiometrics and Delta Associates
As of June 30 2020
PER UNIT PER MONTH
6906 UNITS36-MONTH PIPELINE
Deliveries in Baltimore picked up with an additional 2437 units in H1 2020 Just under 2000 units were absorbed in the past 12 months most of them before the beginning of 2020 which has caused vacancy to increase in H1 2020 Across the Baltimore metro vacancy increased 80 bps to 50 In the Baltimore Suburbs vacancy stands at 44 up 10 bps YoY and in Baltimore city vacancy is 66 up 290 bps YoY
During the recent downturn Baltimore experienced a loss of 172500 jobs The most impacted sector was Leisure and Hospitality in which 45 of employees were furloughed or laid off Education and Health Services also took a loss of 30800 jobs Federal Government and Mining Logging and Construction were the only industries to see job growth with an increase of 800 employees and 3300 respectively The spike in Mining Logging and Construction may have been the result of the emergency expansion of Baltimorersquos hospitals and uninterrupted construction at existing development sites At the start of 2020 Baltimorersquos unemployment rate was 35 and is currently 95 There are currently 1253600 nonfarm employees in the Baltimore metro
CAPITAL MARKETS
$185PER SF PER MONTH
09RENT GROWTH
NORTHERN SUBURBS
-010SOUTHERN SUBURBS
-50000 -30000 -10000 0 10000-70000 -60000 -50000 -40000 -30000 -20000 -10000 0 10000
H2 2020 Baltimore Employment
2015 2016 2017 2018 2019 2020 2021 2022 2023 2024 20250
1
2
3
4
5
6
7
-2000
0
2000
4000
6000
8000
10000
Vacanc
y ()
Units
Rentable Completions(Units)
Net Absorption(Units)
Vacancy Rate(Avg )
StateLocal Government
Federal Government
Other Services
Leisure and Hospitality
Education and Health Services
Professional and Business Services
Financial Activities
Information
Retail Trade
Wholesale Trade
Trade Transportation and Utilities
Manufacturing
Mining Logging and Construction
Forecast
23
BALTIMORE METRO H1 2020
BALTIMORE METRO HOME PRICES
Property Year Built Sold Price Units $Unit
Townes at Holly Station 1985 042320 $115000000 510 $225490
Chatham Gardens 1980 041720 $83280000 414 $201159
The Point at Elkridge 1988 032720 $72500000 312 $232372
BLVD at White Springs 1977 040820 $61099000 459 $133113
Old Orchard 1986 041720 $33179940 180 $184333
LARGEST SALESBALTIMORE METRO MULTIFAMILY SALES VOLUME
Submarket Avg $UnitMo Avg $SFMo Vacancy
Annapolis $1749 $198 49
Baltimore City East $1434 $179 55
Baltimore City North $1095 $135 69
Baltimore City West $996 $125 41
ColumbiaNorth Laurel $1643 $170 44
Downtown Baltimore $1548 $189 85
Ellicott CityElkridge $1609 $167 47
Far North Baltimore Suburbs $1310 $136 29
Northeast Anne Arundel County $1374 $157 42
Northwest Anne Arundel County $1720 $172 51
Owings MillsPikesvilleRandallstown $1365 $132 45
ParkvilleCarneyPerry Hall $1164 $135 36
Southeast Baltimore County $1097 $132 38
Southwest Baltimore County $1172 $131 45
TowsonHunt Valley $1390 $140 53
RENTAL RATES - ALL PRODUCT TYPES
$3000000000
$2500000000
$2000000000
$1500000000
$1000000000
$500000000
$0
2014 2015 2016 2017 2018 2019
$255000
$250000
$245000
$240000
$235000
$220000
$205000
Rent growth in the Baltimore metro remained largely flat since June 2019 The Northern Baltimore Suburbs experienced 09 rent growth the Southern Baltimore Suburbs experienced a drop of 01 rent growth and Baltimore City rents fell by 30 The Baltimore suburbs outpaced Baltimore City in terms of rent growth and absorption Current vacancy in the Baltimore metro is 50 with the highest vacancies in Downtown Baltimore at 85 Baltimore City North at 69 and Baltimore City East at 55 According to Delta Reports the Howard CountyColumbia submarket fared the best in the metro with 27 YoY rent growth
Home values in the Baltimore metro increased 20 YoY up slightly from the five-year average growth rate of 15 The current median sales price in the Baltimore metro is $251000 Single-family homes in Baltimore County posted a 10-year high median sale price of $330000 This is a 6 YoY increase from June 2019 Homes in Baltimore City also posted a 10-year high median sale price of $238000 Of note Owings Mills experienced a 27 YoY increase in median home value for an average of $415000
Investment activity reached $506M in the Baltimore metro during the first two quarters of 2020 in 14 transactions All but one sale was value-add product The highest sales in terms of price per unit were Point at Elkridge a 312-unit property in Elkridge which sold for $232400 per unit and Townes at Holly Station a 510-unit property in Waldorf which sold for $225500 per unit CBRE brokered both sales
TOWNES AT HOLLY STATION
$215000
$220000
$225000
$230000
$235000
$240000
$245000
$250000
2014 2015 2016 2017 2018 2019
Baltimore Metro Median Sale Price
$0
$500000000
$1000000000
$1500000000
$2000000000
$2500000000
$3000000000
2013 2014 2015 2016 2017 2018 2019 H1 2020
Balitmore Metro Sales Volume
2018 20192016 20172014 20152013 H1 2020
$210000$215000$220000$225000$230000$235000$240000$245000$250000$255000
2014 2015 2016 2017 2018 2019 2020
Baltimore Metro Median Sale Price
2020
24
FOR SALES OR FINANCING INFORMATION CONTACT
William S RoohanVice Chairman(O) +1 410 244 3122(M) +1 443 690 6967billroohancbrecom
Michael E MuldowneyExecutive Vice President(O) +1 410 244 3144(M) +1 443 250 3144mikemuldowneycbrecom
Robert G Dean IIISenior Vice President(O) +1 202 585 5766(M) +1 202 578 6941robertdeancbrecom
Jonathan M GreenbergSenior Vice President(O) +1 703 734 4772(M) +1 202 423 6655jonathangreenbergcbrecom
Martha A HastingsSenior Vice President(O) +1 410 244 3162(M) +1 410 807 2450marthahastingscbrecom
Brian H MargerumSenior Vice President(O) +1 410 244 3135(M) +1 443 386 1096brianmargerumcbrecom
Michael D RudolphSenior Vice President(O) +1 410 244 3121(M) +1 443 928 0392michaelrudolphcbrecom
John T Sheridan JrSenior Vice President(O) +1 703 905 0239(M) +1 703 200 7720johnsheridancbrecom
Yalda G HowellFirst Vice President(O) +1 202 585 5677(M) +1 240 462 2332yaldaghamariancbrecom
Thomas B LeachmanVice President(O) +1 202 585 5638(M) +1 240 688 0189thomasleachmancbrecom
Kemp D BroujosSenior Associate(O) +1 202 585 5724(M) +1 443 786 2951kempbroujoscbrecom
Nathan E BarthAssociate(O) +1 703 905 0228(C) +1 703 340 6828nathanbarthcbrecom
Zachary L StoneSales Assistant(O) +1 202 585 5650 (M) +1 202 713 8404zachstonecbrecom
Investment Sales amp Brokerage
Operations amp Marketing
Debt amp Structured Finance Team
Patricia C BonebrakeSenior Director of Operations(O) +1 410 244 3141(C) +1 443 253 5917trishbonebrakecbrecom
Jennifer W BusseyOperations Manager(O) +1 410 244 3134(C) +1 410 300 1302jenniferbusseycbrecom
Cheryl FinlaysonProductions Systems Manager(O) +1 410 244 7100(C) +1 410 244 3101cherylfinlaysoncbrecom
Margaret O MacleayOperations Supervisor(O) +1 202 585 5638(C) +1 410 562 9340maggiemacleaycbrecom
Rachel L MossmanSenior Communications Specialist(O) +1 410 244 3179(C) +1 410 244 7100rachelmossmancbrecom
Samantha S FifieldSales Assistant(O) +1 202 585 5773(C) +1 310 266 0003samanthafifieldcbrecom
Caroline P LekakosClient Services Coordinator(O) +1 202 585 5606(C) +1 240 595 0642carolinelekakoscbrecom
Yasmeen F ShararaClient Services Coordinator(O) +1 202 585 5580(C) +1 301 828 7435yasmeenshararacbrecom
Lauren E SpielmanClient Services Coordinator(O) +1 410 244 3129(C) +1 443 800 4388laurenspielmancbrecom
Grace F TrimbleClient Services Coordinator(O) +1 410 244 3123(C) +1 410 499 1064gracetrimblecbrecom
David F WebbVice Chairman(O) +1 202 585 5721(M) +1 202 744 4900davidwebbcbrecom
Maximiliane T LeachmanExecutive Vice President(O) +1 202 585 5655(M) +1 404 358 4317maxileachmancbrecom
Justin J GlasgowSenior Vice President(O) +1 202 783 1723(M) +1 202 316 1804justinglasgowcbrecom
RESEARCH TEAM
JEANETTE I RICE Americas Head of Multifamily Research (O) +1 214 979 6169
(C) +1 817 412 0709 jeanettericecbrecom
MOLLY M HUNT Research Analyst (O) +1 202 585 5597(C) +1 415 599 6009 mollyhuntcbrecom
RANK
1Fortune Magazinersquos
Most Admired Commercial Real Estate
Firm
REPUTATION
2Ranked the 2
Multifamily Brokerage Team in the entire nation by
Real Estate Forum
THE CBRE TEAM COMPETITIVE ADVANTAGE
25
RESOURCES
26Largest team and most
capacity in the Mid-Atlantic region
EXPERIENCE
$174B+The aggregate sales
value of deals our team has brokered since
2015
DEBT TEAM
1The CBRE Debt amp
Structured Finance Team is the 1 Freddie Mac
SellerServicer
copy Copyright 2020 All rights reserved Information contained herein including projections has been obtained from sources believed to be reliable but has not been verified for accuracy or completeness CBRE Inc makes no guarantee warranty or representation about it Any reliance on such information is solely at your own risk This information is exclusively for use by CBRE clients and professionals and may not be reproduced without the prior written permission of CBRErsquos Global Chief Economist CBRE and the CBRE logo are service marks of CBRE Inc andor its affiliated or related companies in the United States and other countries All other marks displayed on this document are the property of their respective owners Photos herein are the property of their respective owners Use of these images without the express written consent of the owner is prohibited
WASHINGTON DC1900 N Street NW
Suite 700 Washington DC 20036
+1 (202) 783 8200
BALTIMORE MD100 East Pratt Street
Suite 1700Baltimore MD 21202+1 (410) 244 7100
TYSONS VA1861 International Drive
Suite 300McLean VA 22102+1 (703) 821-6900
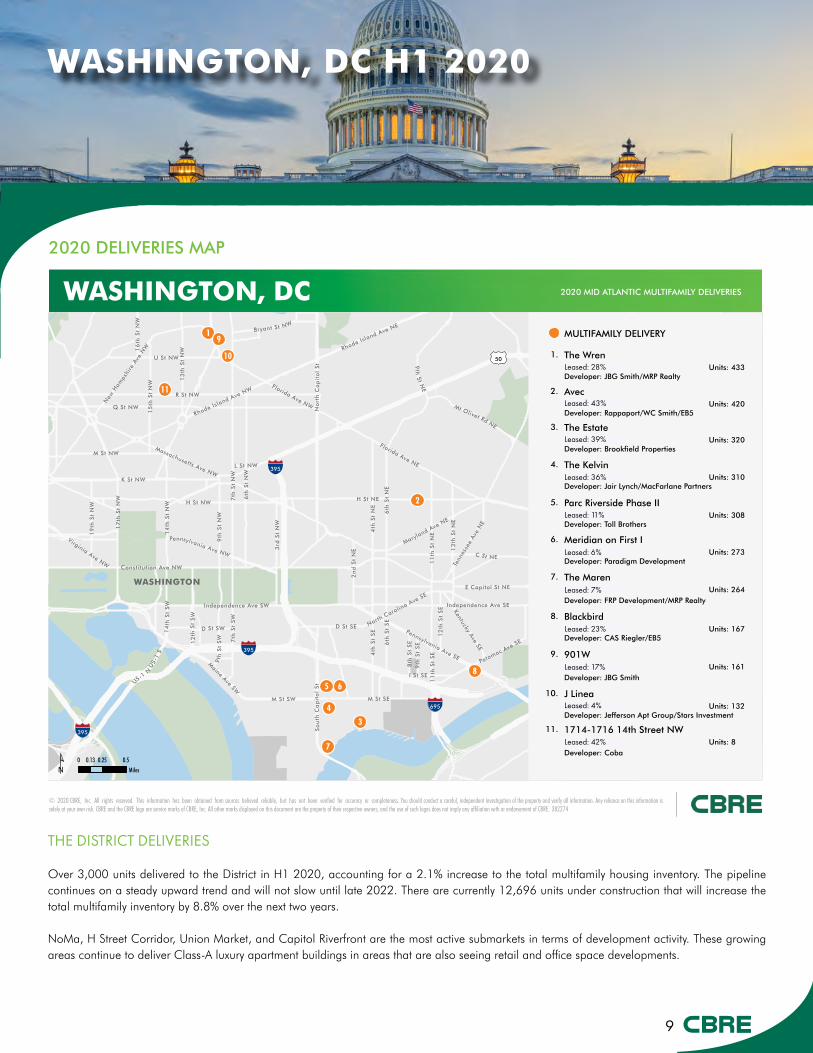
9
WASHINGTON DC H1 2020
2020 DELIVERIES MAP
THE DISTRICT DELIVERIES
Over 3000 units delivered to the District in H1 2020 accounting for a 21 increase to the total multifamily housing inventory The pipeline continues on a steady upward trend and will not slow until late 2022 There are currently 12696 units under construction that will increase the total multifamily inventory by 88 over the next two years
NoMa H Street Corridor Union Market and Capitol Riverfront are the most active submarkets in terms of development activity These growing areas continue to deliver Class-A luxury apartment buildings in areas that are also seeing retail and office space developments
382274copy 2020 CBRE Inc All rights reserved This information has been obtained from sources believed reliable but has not been verified for accuracy or completeness You should conduct a careful independent investigation of the property and verify all information Any reliance on this information issolely at your own risk CBRE and the CBRE logo are service marks of CBRE Inc All other marks displayed on this document are the property of their respective owners and the use of such logos does not imply any affiliation with or endorsement of CBRE
1
2
3
4
5 6
7
8
9
1 0
1 1
WASHINGTON
295
5050
695
395
395
395
Rhode Island Ave NE
Virginia Ave NW
Rhode Island Ave NW
H St NE
Min
neso
taAv
eN
E
Q St NW
Potomac Ave SE
11
th S
t S
E
Minnesota Ave SE
13
th S
t N
W
13
th S
t N
E
Pennsylvania Ave SE
3rd
St
NW
So
uth
Ca
pit
ol
St
12
thS
tS
W
Florida Ave NE
9th
St
SW 7th
St
SW
9th
St
NW
Pennsylvania Ave NW
Tenn
esse
eAv
eN
E
E Capitol St SE
US-1N
6th
St
NE
Massachusetts Ave NW
US-
1S
4th
St
NE
Independence Ave SE
14
thS
tS
W
Mt Olivet Rd NE
Constitution Ave NW
KentuckyAve
SE
9th
StN
E
Benning Rd NE
6th
St
SE
7th
St
NW
K St NW
Bra
nch
Ave
SE
6th
St
NW
New
Ham
pshi
re A
ve N
W
L St NW
E Capitol St NE
No
rth
Ca
pit
ol
St
14
th S
t N
W
North Carolin
a Ave SE
D St SW
9th
St
SE
22ndSt
NE
Texas AveSE
16
th S
t N
W
B St SE
2n
d S
t N
E
D St SE
21
stSt
NE
8th
St
SE
Maine
Ave
SW
12
th S
t S
E
Kenilw
orthAve
NE
M St SW
I St SE
Bryant St NW
19
th S
t N
W
17
th S
t N
W
11
th S
t N
E
Florida Ave NW
Maryland Ave NE
15
th S
t N
W
4th
St
SE
U St NW
M St NW
M St SE
RidgeRd
SE
Independence Ave SW
H St NW
C St NE
R St NW
2020 MID ATLANTIC MULTIFAMILY DELIVERIESWASHINGTON DC
sup1 0 025 05013
Miles
MULTIFAMILY DELIVERY
Leased 23Developer CAS RieglerEB5
8 BlackbirdUnits 167
Leased 7Developer FRP DevelopmentMRP Realty
7 The MarenUnits 264
Leased 6Developer Paradigm Development
6 Meridian on First IUnits 273
Leased 11Developer Toll Brothers
5 Parc Riverside Phase IIUnits 308
Leased 39Developer Brookfield Properties
3 The EstateUnits 320
Leased 43Developer RappaportWC SmithEB5
2 AvecUnits 420
Leased 36Developer Jair LynchMacFarlane Partners
4 The KelvinUnits 310
Leased 28Developer JBG SmithMRP Realty
1 The WrenUnits 433
Leased 4Developer Jefferson Apt GroupStars Investment
10 J LineaUnits 132
Leased 17Developer JBG Smith
9 901WUnits 161
Leased 42Developer Coba
11 1714-1716 14th Street NWUnits 8
Leased 28
Leased 43
Leased 39
Leased 36
Leased 11
Leased 6
Leased 7
Leased 23
Leased 17
Leased 4
Leased 42
10
-60000 -50000 -40000 -30000 -20000 -10000 0 10000
Q2 2020 DC Employment
WASHINGTON DC H1 2020
Job Growth YoY
-50000 -40000 -30000 -20000 -10000 0 10000
StateLocal Government
Federal Government
Other Services
Leisure and Hospitality
Education and Health Services
Professional and Business Services
Financial Activities
Information
Retail Trade
Wholesale Trade
Trade Transportation and Utilities
Manufacturing
Mining Logging and Construction
EMPLOYMENT
CAPITAL MARKETS
$292860000SALES IN H1 2020
845 UNITSSOLD IN H1 2020
9 PROPERTIES
Deliveries Net Absorption Vacancy
Year
DEVELOPMENTDC BY THE NUMBERS
61
$2561
12696 UNITSUNDER CONSTRUCTION
3004 UNITSDELIVERED IN 2020
STABILIZED VACANCY
PIPELINE
CLASS A AVG RENTS
CLASS B AVG RENTS
Source CBRE Research and Delta Associates
As of June 30 2020
PER UNIT PER MONTH
18907 UNITS36-MONTH PIPELINE
Recent deliveries in the District were concentrated primarily in the Capitol Riverfront and H Street submarkets NoMa and Union Market also remain top submarkets for development activity with around 3483 units under construction on-track to deliver in the next 24 months Annual absorption in the District was 25 lower than a year ago as 2003 units absorbed in the first half of the year Q2 stabilized vacancy rate in the District is 61 a 250 bps increase from the previous year The average lease-up pace of new product in the District is 14 units per month and concessions average 15 months free rent
Insulated by the federal government Washington DC has fared favorably thus far in the downturn compared to other large metros across the nation The District experienced 67000 job losses which represents an 8 YoY loss in employment Leisure and Hospitality suffered the biggest job loss as 60 of the workforce was laid off or furloughed Promisingly government information and other services were the only industries to experience job growth albeit small
PER SF PER MONTH$327
$2067PER UNIT PER MONTH
PER SF PER MONTH$274
7000
6000
5000
4000
3000
2000
1000
0
8
7
6
5
4
3
2
1
0
VacancyUnitsDelivered
Washington DC Summary
2013 2014 2015 2016 2017 2018 2019 2021 2022H22020
H12020
00
10
20
30
40
50
60
70
80
90
0
1000
2000
3000
4000
5000
6000
7000
2013 2014 2015 2016 2017 2018 2019 H1 2020 H2 2020 2021 2022
Vaca
ncy
Units
Deliveries Net Absorption Vacancy
Forecast
11
WASHINGTON DC H1 2020
WASHINGTON DC HOME PRICES
Property Year Built Price Sold Units $Unit
The Woodley 2014 $180250000 010820 212 $850235
Skyline Apartments 1965 $58700000 030120 398 $147487
Glenwood Apartments 1942 $13700000 013020 90 $152222
The Waring 1909 $8400000 063020 24 $328947
The Regent 1937 $8450000 063020 12 $228378
LARGEST SALESDC MULTIFAMILY SALES VOLUME
$2000000000
$1500000000
$1000000000
$500000000
$02018 20192016 20172014 20152013
THE SHELBY
Class A High-Rise Avg $UnitMo
Avg $SFMo Vacancy YoY Rent Change
Upper NW $2810 $347 50 -06
Central $2822 $345 51 -46
Columbia HeightsShaw $2663 $363 64 -21
NoMaH Street $2290 $302 82 -57
Capitol HillRiverfrontSouthwest $2583 $325 77 -33
Northeast $2092 $266 85 -07
Upper Georgia $2183 $281 53 06
Class B Mid-and High-Rise Avg $UnitMo
Avg $SFMo Vacancy YoY Rent Change
Upper Northwest $2104 $258 43 -26
Mount Vernon Square NW $1925 $291 76 -74
Southwest $2085 $289 30 -04
RENTAL RATES
The District experienced broad rent decreases across almost all submarkets with the exception of Upper Georgia The Northeast and NoMaH Street submarkets have the highest Class-A High-Rise vacancy at 85 and 82 respectively This is in part due to an influx of new deliveries to those markets Class-B vacancy currently stands at 45 and concessions are at 30 of face rent The Mount Vernon Square submarket has the highest Class-B Mid and High-Rise vacancy at 76 and the highest decline in rent growth at -74 Class-A and Class-B apartments rents fell by a total of 33
The current average home value in the District is $586000 While home values grew in 2020mdashseeing an average annual increase of 70mdashhome values in the District have increased on average 30 YoY since 2015
A total of $2929M multifamily sales transacted in the District in nine sales in the first two quarters of 2020 CoreCore-Plus transactions made up for 71 of transactions and Value-Add transactions made up for the remaining 29 of total sales volume The highest sales in terms of price per unit were The Woodley a 212-unit property in Woodley Park at $850235 per unit and The Shelby a 24-unit property in Dupont Circle at $350000 per unit both of which were brokered by CBRE The Woodley was also the largest sale in H1 2020 across the District at $18025M
$0
$500000000
$1000000000
$1500000000
$2000000000
2013 2014 2015 2016 2017 2018 2019 H1 2020
DC Sales Volume
H1 2020
$600000
$500000
$400000
$300000
$200000
$100000
2014 2015 2016 2017 2018 2019$0
$100000
$200000
$300000
$400000
$500000
$600000
2014 2015 2016 2017 2018 2019 2020
DC Home Prices
2020
12
NORTHERN VIRGINIA H1 2020
NORTHERN VIRGINIA
NORTHERN VIRGINIA OVERVIEW
Northern Virginia continues to be the fastest growing region in the DC metro The regionrsquos economic future has been bolstered by Amazonrsquos decision to build its HQ2 in National Landing Amazon selected Northern Virginia because of its inherently strong fundamentals including a rich pipeline of talent provided by numerous universities in the area Amazon has subsequently begun the first phase of its hiring process and build-out at National Landing including hiring over 1000 white-collar employees and moving into 300000 SF of office space The delivery of HQ2 is expected to add 40000 to 60000 units of additional apartment demand to the area in the next decade A typical Amazon HQ2 worker will make $150000 per year which allows for up to $3750 in monthly rent Additionally Virginia Tech is moving forward with its plans to build the $1 Billion Innovation Campus in Potomac Yard The introduction of these two strong economic drivers will continue to further diversify the job base and incentivize more businesses to move to all areas of the DC metro where a pipeline of talent awaits
$400000
$450000
$500000
$550000
$600000
2014 2015 2016 2017 2018 2019
DC Home Prices
13
NORTHERN VIRGINIA H1 2020
2020 DELIVERIES MAP
NORTHERN VA DELIVERIES
Just under 4000 new units delivered in H1 2020 across Northern Virginia accounting for a 16 increase in total volume There are currently 10135 units under construction which will add 4 to the inventory over the next 24 months The largest deliveries in the region include Perseus Realtyrsquos The Foundry a 525-unit property in Alexandria Saul Centersrsquo Waycroft a 490-unit property in BallstonVirginia Square Wash REITrsquos The Trove a 401-unit property in Columbia Heights Arlington and Combined Propertiesrsquo Scout on the Circle a 400-unit property in Fairfax
382274copy 2020 CBRE Inc All rights reserved This information has been obtained from sources believed reliable but has not been verified for accuracy or completeness You should conduct a careful independent investigation of the property and verify all information Any reliance on this information issolely at your own risk CBRE and the CBRE logo are service marks of CBRE Inc All other marks displayed on this document are the property of their respective owners and the use of such logos does not imply any affiliation with or endorsement of CBRE
1
2
45
6
7
8
9
1 0
1 1
1 2
LORTON
MANASSAS
WOODBRIDGE
FORT HUNTNEWINGTON
LAKE RIDGE
CENTREVILLE
HERNDON
MANASSAS PARK
RESTON
STERLING
CHANTILLY
FAIRFAX STATION
ANNANDALE
BETHESDA
BURKE
FAIRFAX
FALLS CHURCH
NORTH BETHESDA
TYSONS CORNER
VIENNA
POTOMAC
MCLEAN
OAKTON
SPRINGFIELD
GROVETON
IDYLWOOD
JEFFERSON
LINCOLNIA
WEST SPRINGFIELD
WOLF TRAP
ADELPHI
BELTSVILLE
BOWIE
CALVERTON
CAMP SPRINGS
CLINTON
COLLEGE PARK
FORESTVILLE
GREENBELT
HILLCREST HEIGHTS
HYATTSVILLE
LANHAM
ROSARYVILLE
GLENN DALE
CORAL HILLS
EAST RIVERDALE
KETTERING
WASHINGTON201
267
28295
295
381
110
5
50
29
301
695
66
270
495
395
95
495
495
495
95
WASHINGTONDULLES INTL
AIRPORT
RONALD REAGANWASHINGTON
NATL ARPT
POTOMACAIRFIELD
FREEWAYAIRPORT
COLLEGE PARK AIRPORT
2020 MID ATLANTIC MULTIFAMILY DELIVERIESNORTHERN VIRGINIA
sup1 0 2 41
Miles
MULTIFAMILY DELIVERY
Leased 20Developer Novare Group Mulberry Development Group
8 Cameron SquareUnits 302
Leased 22Developer Praedium Group
7 The ClarkUnits 342
Leased 5Developer Erkiletian DevelopmentPCCP
6 The Sur at National GatewayUnits 360
Leased 65Developer Orr Partners
5 Centro ArlingtonUnits 366
Leased 12Developer Washington Real Estate Investment Trust
3 The TroveUnits 401
Leased 34Developer Saul Centers REIT (Northwestern Mutual Life Insurance)
2 The WaycroftUnits 490
Developer Combined Properties
4 Scout on the CircleUnits 400
Leased 21Developer Perseus RealtyELVFour Points
1 Foundry at CarlyleUnits 525
Leased 49Developer Shooshan Co Brandywine Realty Trust
10 4040 WilsonUnits 244
Leased 25Developer Abramson Properties Weingarten Realty AHDC
9 Array at West AlexUnits 278
Leased 40Developer Elm Street DevelopmentNorthwood Ravin
12 Preserve at Westfields - Phase IUnits 132
Leased 17Developer Novus
11 Mission LoftsUnits 157
Leased 21
Leased 34
Leased 12
Leased 7
Leased 65
Leased 5
Leased 22
Leased 20
Leased 25
Leased 49
Leased 17
Leased 40
Source Axiometrics 2020
VIRGINIA TECH INNOVATION CAMPUS
AMAZON HQ2
3
14
NORTHERN VIRGINIA H12020
$494500000SALES IN H1 2020
1823 UNITSSOLD IN H1 2020
9 PROPERTIES
Deliveries Net Absorption VacancyYear
NoVA BY THE NUMBERS
43
$1992
10135 UNITSUNDER CONSTRUCTION
3997 UNITSDELIVERED IN 2020
STABILIZED VACANCY
PIPELINE
CLASS A AVG RENTS
CLASS B AVG RENTS
Source CBRE Research and Delta Associates
As of June 30 2020
PER UNIT PER MONTH
14567 UNITS36-MONTH PIPELINE
Just under 4000 units delivered in H1 2020 which equates to a 10 increase in total inventory throughout the year Arlington accounted for 59 of new deliveries and Alexandria accounted for 27 The average lease-up pace for properties in Northern Virginia is currently 21 units per month compared to 24 units per month in January 2020 Northern Virginiarsquos current stabilized vacancy is 43 a 70 bps YoY increase
Job Growth YoY as of June 2020EMPLOYMENT
Northern Virginia experienced the YoY employment decline of 134700 jobs Leisure and Hospitality fared the worst with the loss of 64500 jobs and Education and Health Services with the loss of 32100 jobs However there was growth in Information and Financial Activities industries At the start of the year unemployment was at 25 and it currently stands at 86
As of June 2020 Amazon has already hired 1000 employees It is estimated that Amazon will bring 1200 employees in 2020 and an additional 2000 employees in 2021
CAPITAL MARKETS
PER SF PER MONTH$217
$1746 PER UNIT PER MONTH
PER SF PER MONTH$194
VacancyNorthern Virginia SummaryUnits
Delivered
DEVELOPMENT
-70000 -60000 -50000 -40000 -30000 -20000 -10000 0 10000
H1 2020 NoVa Employment
-70000 -50000 -30000 -10000 0 10000
5
4
3
2
1
02014 2015 2016 2017 2018 2019 H1
2020H2
2020
10000
8000
6000
4000
2000
02021 2022
StateLocal Government
Federal Government
Other Services
Leisure and Hospitality
Education and Health Services
Professional and Business Services
Financial Activities
Information
Retail Trade
Wholesale Trade
Trade Transportation and Utilities
Manufacturing
Mining Logging and Construction
0
001
002
003
004
005
006
0
1000
2000
3000
4000
5000
6000
7000
8000
9000
2014 2015 2016 2017 2018 2019 H1 2020 H2 2020 2021 2022
Vaca
ncy
Units
Deliveries Net Absorption Vacancy
Forecast
15
NORTHERN VIRGINIA H1 2020
NoVA HOME PRICES
Property Year Built Sold Price Units $Unit
The Emerson 2019 012720 $117000000 355 $329577
Avana Alexandria 1991 013020 $106000000 326 $325153
Ravensworth Towers 1973 041120 $59000000 219 $269406
The Bradley 2015 012020 $57666667 165 $349495
Monroe Place 2008 032620 $56950000 202 $281931
LARGEST SALESNoVA MULTIFAMILY SALES VOLUME
Class A High-Rise Avg $UnitMo
Avg $SFMo Vacancy YoY Rent
Change
Alexandria $2124 $243 54 -33
RosslynBallston Corridor $2490 $300 36 -27
Crystal CityPentagon City $2356 $268 74 -72
South Arlington $2024 $232 45 00
Tysons $2264 $252 78 -134
RestonHerndon $2106 $226 95 -71
Falls ChurchMerrifield $2117 $234 55 -70
Class B Mid-and High Rise Avg $UnitMo
Avg $SFMo Vacancy YoY Rent
Change
Falls ChurchNorth Arlington $2264 $249 54 07
South Arlington $1674 $198 21 -01
Arlandria $1662 $220 16 11
West Alexandria $1666 $183 54 -04
Crystal City $2226 $206 62 -60
RENTAL RATES
$650000
$625000
$600000
$575000
$550000
$5250002014 2015 2016 2017 2018 2019
$5000000000
$4000000000
$3000000000
$2000000000
$1000000000
$0
Northern Virginia experienced rent decreases compared to H1 2019 with the exception of Class-A product in South Arlington and Class-B product in Falls ChurchNorth Arlington and Arlandria Class-A rents fell by 41 to $1992unitmonth or $217 per square foot Class-A vacancy in Northern Virginia is currently 49 and concessions are at 50 of face rent RestonHerndon and Tysons have the highest Class-A vacancy at 95 and 78 due in most part to increased deliveries in those submarkets Class B rents fell 16 YoY to $1746unitmonth or $194 per square foot Class-B vacancy is currently 39 and concessions are 20 of face rent Crystal City has the highest Class-B vacancy at 62 Class-A and Class-B rents fell by a total of 25 YoY
Homes values in Northern Virginia continue to see impressive growth as demand significantly outweighs supply in 2020 New listing inventory was down by 35 this year and prices continue to climb Homes are on the market for an average of 35 weeks before selling The current median home value in Northern Virginia is $641002 which is a 44 YoY increase across the region Alexandria is the fastest growing housing market in the nation with 202 YoY median sale value growth Arlington County currently maintains the highest home value in Northern Virginia and experienced an 11 YoY increase The high cost of home buying in Northern Virginia will likely drive multifamily demand as renters are priced out of the for sale housing market
A total of $4945M multifamily sales transacted in Northern Virginia in nine properties in the first half of 2020 Value-add sales accounted for 77 of transactions and CoreCore-Plus sales made up the remaining 23 of total investment volume The highest price per unit sales were The Bradley a 165-unit property in Alexandria which sold at $349500 per unit and The Emerson a 355-unit property in Herndon which sold at $329600 per unit
JEFFERSON FAIR OAKS
$520000
$540000
$560000
$580000
$600000
$620000
2014 2015 2016 2017 2018 2019
NoVA Average Sold Home Price
$0
$1000000000
$2000000000
$3000000000
$4000000000
$5000000000
2013 2014 2015 2016 2017 2018 2019 H1 2020
NoVA Sales Volume
2018 20192016 20172014 20152013 H1 2020
$500000$520000$540000$560000$580000$600000$620000$640000$660000
2014 2015 2016 2017 2018 2019 2020
NoVA Average Sold Home Price
2020
16
SUBURBAN MD H1 2020
SUBURBAN MARYLAND
SUBURBAN MARYLAND OVERVIEW
Suburban Maryland fared the best in terms of rent growth absorption and transaction volume compared to the other markets in Washington DC Its lower density setting may be in part responsible for its recent resilience as residents choose to relocate out of higher density urban areas
Suburban Maryland is one of the most prominent areas in the region for the Life Sciences sector and is home to the headquarters of the National Institute of Health Department of Energy the Food and Drug Administration and the National Institute of Standards and Technology The presence of biotech in the I-270 Corridor in particular has greatly benefited the commercial real estate market in office industrial and multifamily Life Sciences buildings have significantly lower vacancy rates than that of other commercial office buildings As of 2019 laboratory vacancy sits at around 50 on average while office vacancy rate in Suburban Maryland is nearly 19 Montgomery and Prince Georgersquos counties continue to be largely unique in their growth of biotech because they remain suburban areas in comparison to Life Sciences hubs such as Boston New York and San Francisco that continue to grow as urban areas
Although investment activity slowed down considerably across the region Suburban Maryland is an outlier Over $12B transacted in H1 2020 which is more than H1 2019 when $893M transacted
17
SUBURBAN MD H1 2020
2020 DELIVERIES MAP
SUBURBAN MD DELIVERIES
Deliveries slowed in Suburban Maryland with an addition of 492 units across three projects in H1 2020 The deliveries were Bainbridgersquos Bainbridge Lake Linganore a 322-unit property in Frederick NV Commercial Brick Lanersquos The Bottling Plant a 86-unit property in Outlying Frederick County and Landex Developmentrsquos Artisan 4100 an 84-unit property in Brentwood There are currently 6441 units under construction which will add a total of 35 to total inventory over the next 24 months Bethesda has the highest concentration of development activity with just over 1900 units delivering in the next 36 months Unlike other markets in the DC metro Suburban Marylandrsquos vacancy which currently stands at 36 was not largely impacted in the past six months
382274copy 2020 CBRE Inc All rights reserved This information has been obtained from sources believed reliable but has not been verified for accuracy or completeness You should conduct a careful independent investigation of the property and verify all information Any reliance on this information issolely at your own risk CBRE and the CBRE logo are service marks of CBRE Inc All other marks displayed on this document are the property of their respective owners and the use of such logos does not imply any affiliation with or endorsement of CBRE
1
2
3
HERNDONRESTON
STERLING
BALLENGER CREEK
ASPEN HILL
BETHESDA
CHILLUM
NORTH BETHESDA
ROCKVILLE
SILVER SPRING
TAKOMA PARK
TYSONS CORNER
VIENNA
WHEATON-GLENMONT
WHITE OAK
POTOMAC
MCLEAN
COLESVILLENORTH POTOMAC
IDYLWOOD
WOLF TRAP
ADELPHI
BELTSVILLE
BOWIE
CROFTONGREENBELT
HYATTSVILLELANHAM
LAUREL
ODENTONSOUTH LAUREL
CATONSVILLE
COLUMBIA
DAMASCUS
GAITHERSBURG
LINTHICUM HEIGHTS
NORTH LAURELOLNEY
PIKESVILLE
WOODLAWN
SEVERN
ARBUTUS
MONTGOMERY VILLAGE
GERMANTOWN FERNDALE
ELDERSBURG
LOCHEARN
MAYS CHAPEL
REISTERSTOWN
DUNDALK
PERRY HALL
RIVIERA BEACH
ROSEDALE
SEVERNA PARK
TOWSON
ARNOLD
ESSEX
GLEN BURNIE
PASADENA
PARKVILLE
SOUTH GATE
OVERLEANOTTINGHAM
ANNAPOLIS NECK
WASHINGTON
ANNAPOLIS
BALTIMORE
201
3
295
267
7
100
15
50
15
340
40 1
29
301
301
270
495
70
83
195
95
66
97
895
95
95
695
270395
695
WASHINGTONDULLES INTL
AIRPORT
TIPTONAIRPORT
LEE AIRPORT
BALTIMOREWASHINGTONINTL AIRPORT
MARTIN STATEAIRPORT
2020 MID ATLANTIC MULTIFAMILY DELIVERIESSUBURBAN MARYLANDMULTIFAMILY DELIVERY
sup1 0 3 615Miles
Leased 20Developer Landex Development
3 Artisan 4100Units 84
Leased 60Developer NV Commercial Brick Lane
2 Bottling PlantUnits 86
Leased 9Developer Bainbridge Companies
1 Bainbridge Lake LinganoreUnits 322Leased 9
Leased 60
Leased 20
18
-45000 -40000 -35000 -30000 -25000 -20000 -15000 -10000 -5000 0 5000
H1 2020 SubMD Employment
SUBURBAN MD H1 2020
Job Growth YoY
EMPLOYMENT
$12 BILLIONSALES IN H1 2020
5006 UNITSSOLD IN H1 2020
14 PROPERTIES
5000
4000
3000
2000
1000
0
6
5
4
3
2
1
0
VacancyUnits
Delivered Suburban MD Summary
Deliveries Net Absorption Vacancy
Year
DEVELOPMENTSUBURBAN MD BY THE NUMBERS
36
$1905
6441 UNITSUNDER CONSTRUCTION
492 UNITSDELIVERED IN 2020
STABILIZED VACANCY
PIPELINE
CLASS A AVG RENTS
CLASS B AVG RENTS
Source CBRE Research and Delta Associates
As of June 30 2020
PER UNIT PER MONTH
13773 UNITS36-MONTH PIPELINE
As the most affordable option for residents in Washington DC Suburban Maryland continues to provide job opportunities and relatively affordable living Just under 500 units delivered in H1 2020 and 100 units have been absorbed so far this year Suburban Marylandrsquos current stabilized vacancy is 36 down 30 bps from last year
CAPITAL MARKETS
Suburban Maryland experienced the YoY loss of 111400 jobs The most impacted industries were Leisure and Hospitality with a 40 decrease in employment and Education and Health Services with a loss of 15 of employees Trade and Transportation also lost just under 20000 jobs The Federal Government saw a growth of 1000 employees Unemployment in Montgomery and Prince Georgersquos counties is currently 80 and 99 respectively up from 28 and 36 respectively in January 2020
$203PER SF PER MONTH
$1591PER UNIT PER MONTH
$173PER SF PER MONTH
2014 2015 2016 2017 2018 2019 H12020
H22020
2021 2022
StateLocal Government
Federal Government
Other Services
Leisure and Hospitality
Education and Health Services
Professional and Business Services
Financial Activities
Information
Retail Trade
Wholesale Trade
Trade Transportation and Utilities
Manufacturing
Mining Logging and Construction
-35000 -25000 -15000 -5000 0 10000
00
10
20
30
40
50
60
0
500
1000
1500
2000
2500
3000
3500
4000
4500
2014 2015 2016 2017 2018 2019 H12020
H22020
2021 2022
Vacanc
y
Units
Deliveries Net Absorption Vacancy
Forecast
19
SUBURBAN MD H1 2020
SUBURBAN MD HOME PRICES
Property Year Built Sold Price Units $Unit
4701 Willard 1969 062920 $276500000 525 $526667
The Varsity 2011 032720 $146022026 258 $565977
Gallery on New Hampshire 1960 022820 $117000000 675 $173333
Montgomery Paint Branch 1984 061220 $113206000 529 $214000
Jefferson at Inigos Crossing 2008 011320 $109000000 473 $230444
LARGEST SALESSUBURBAN MD MULTIFAMILY SALES VOLUME
Class A High Rise Avg $UnitMo Avg $SFMo Vacancy YoY Rent
Change
Bethesda $2670 $293 72 31
N Bethesda Rockville $2047 $223 60 22
Silver Spring Wheaton $2012 $242 35 18
Hyattsville College Park $1867 $206 46 NA
Class B Mid-and High-Rise Avg $UnitMo Avg $SFMo Vacancy YoY Rent
Change
Silver Spring $1622 $169 920 -190
BethesdaChevy Chase $1982 $217 520 -530
Rockville $1709 $184 430 450
RENTAL RATES
$400000
$380000
$360000
$340000
$320000
2014 2015 2016 2017 2018 2019
$3000000000
$2500000000
$2000000000
$1500000000
$1000000000
$500000000
$0
Although no markets saw overall positive rent growth over the past year Suburban Maryland was the least negatively impacted region in the metro in terms of rental rates Class-A rents declined by 13 YoY to an average of $1905unitmonth or $203 per square foot Class-A vacancy currently stands at 45 Class-B rents declined 10 to an average of $1591unitmonth or $173 per square foot Class-B vacancy currently stands at 31 Overall Class-A and Class-B apartment rents fell by a total of 11 YoY to an average of $1697unitmonth or $183 per square foot
Home prices have dropped slightly in Suburban Maryland after four consecutive years of positive growth The current median home sale price is $393000 The robust effect of the Amazon announcement has spilled over into Suburban Marylandrsquos housing market as a desirable and often more affordable option than Northern Virginia Much of Suburban Maryland multifamily properties remain within the ideal 30-minute commute from large employment drivers such as Amazon HQ2 and parts of Washington DC
Investment activity was highest in Suburban Maryland as $1222570000 traded in 13 sales in the first half of 2020 Value-Add product made up a majority of transaction volume at 61 while CoreCore-Plus accounted for the remaining 39 4017 Willard was the highest sale in terms of total volume and price per unit at $267500000 and $526667 per unit
BETHESDA ROW
NORTHLAKE
$310000
$320000
$330000
$340000
$350000
$360000
$370000
$380000
$390000
$400000
2014 2015 2016 2017 2018 2019 2020
Sub MD Median Home Sales Price
2020
$0
$500000000
$1000000000
$1500000000
$2000000000
$2500000000
$3000000000
2013 2014 2015 2016 2017 2018 2019 H1 2020
Sub MD Sales Volume
2018 20192016 20172014 20152013 H1 2020
4701 WILLARD
20
BALTIMORE METRO H1 2020
BALTIMORE METRO OVERVIEW
While the Baltimore metro is performing well compared to other metros across the country the region has seen the effects of the COVID-19 pandemic with impacts to employment transaction volume rent growth and absorption rates Over 172000 jobs were lost in greater Baltimore since Q2 2019 which is a 12 decrease in total nonfarm employment The June 2020 unemployment rate in the Baltimore metro is 80 which is a 450 bps increase from January 2020 Baltimore however is considered to be better positioned than other regions to weather the current economic downturn due to its impressive resilience in previous recessions In the Global Financial Crisis Baltimore ranked sixth in terms of GDP growth and ninth in payroll job growth across the nation
Just over 2400 units delivered in the Baltimore metro in H1 2020 and 2532 units are currently under construction The average rent in Baltimore is $1759unitmonth or $185 per square foot An aggregate of $506M in sales transacted across 13 sales CBRE brokered two of the three largest transactions in H1 2020 across the Baltimore metro
BALTIMORE METRO
21
BALTIMORE METRO H1 2020
382274copy 2020 CBRE Inc All rights reserved This information has been obtained from sources believed reliable but has not been verified for accuracy or completeness You should conduct a careful independent investigation of the property and verify all information Any reliance on this information issolely at your own risk CBRE and the CBRE logo are service marks of CBRE Inc All other marks displayed on this document are the property of their respective owners and the use of such logos does not imply any affiliation with or endorsement of CBRE
1
2
3
4
5
6
7
8
91 0
CATONSVILLE
ELKRIDGE
ELLICOTT CITY
LINTHICUM HEIGHTS
PIKESVILLE
RANDALLSTOWN
WOODLAWN
SEVERN
ARBUTUS
FERNDALE
LOCHEARN
MAYS CHAPEL
MILFORD MILL
OWINGS MILLS
REISTERSTOWN
DUNDALK
MIDDLE RIVER
PERRY HALL
RIVIERA BEACH
ROSEDALE
ESSEX
GLEN BURNIE
PARKVILLE
EDGEWOODJOPPA
CARNEY
GREEN HAVEN
OVERLEA
ROSSVILLE
JOPPATOWNE
BALTIMORE
295
24
924
100
29
1
70
83
83
195
97
895
95
95
395
695 95
BALTIMOREWASHINGTONINTL AIRPORT
MARTINSTATE
AIRPORT
2020 MID ATLANTIC MULTIFAMILY DELIVERIESBALTIMORE
sup1 0 15 3075
Miles
MULTIFAMILY DELIVERY
Leased 45Developer Sid Emmer
8 The View at Mill Run Phase IIUnits 157
Developer Greystar
7 Elan TowsonUnits 208
Leased 40Developer La Cite
6 CenterWest- Phase 1AUnits 262
Developer Klein EnterprisesManekin LLC
5 The WoodberryUnits 284
Leased 35Developer AvalonBay CommunitiesRetail Properties
3 Avalon TowsonUnits 371
Leased 7Developer Wood Partners
2 Alta Brewers HillUnits 371
Leased 4Developer Chesapeake Realty Partners
4 Avenue GrandUnits 324
Leased 36Developer Howard Hughes
1 Juniper - Merriweather DistrictUnits 380
Leased 67Developer Atlantic Realty
10 The MorrisonUnits 15
Leased 10Developer Zahlco
9 9 E Mount Royal StreetUnits 65
2020 DELIVERIES MAP
BALTIMORE METRO DELIVERIES
Deliveries picked up in Baltimore throughout 2020 with the addition of 2437 units throughout the metro equating to a 12 increase in total inventory More units delivered in the first half of 2020 than were delivered in all of 2019 The largest deliveries were Howard Hughesrsquo Juniper a 380-unit property as part of the Merriweather District in Columbia Wood Partnersrsquo Alta Brewers Hill a 371-unit property in Baltimore City and Avalonbay Communitiesrsquo Avalon Towson a 371-unit property in Towson There are currently 2532 units under construction that are expected to deliver in the next 24 months The average lease-up pace for properties in Baltimore is 15 units per month
Leased 36
Leased 7
Leased 35
Leased 4
Leased 34
Leased 40
Leased 19
Leased 45
Leased 10
Leased 67
Source Yardi Matrix 2020 Source Axiometrics 2020
22
BALTIMORE METRO H1 2020
Job Growth YoY EMPLOYMENT
$506028000SALES IN H1 2020
2913 UNITSSOLD IN H1 2020
14 PROPERTIES
10000
8000
6000
4000
2000
0
7
6
5
4
3
2
0
VacancyUnits
Delivered Baltimore Metro Summary
Deliveries Net Absorption Vacancy
Year
DEVELOPMENTBALTIMORE METRO BY THE NUMBERS
500
$1759
2532 UNITSUNDER CONSTRUCTION
2437 UNITSDELIVERED IN 2020
STABILIZED VACANCY
PIPELINE
TOTAL AVG RENTS
Source CBRE Research Axiometrics and Delta Associates
As of June 30 2020
PER UNIT PER MONTH
6906 UNITS36-MONTH PIPELINE
Deliveries in Baltimore picked up with an additional 2437 units in H1 2020 Just under 2000 units were absorbed in the past 12 months most of them before the beginning of 2020 which has caused vacancy to increase in H1 2020 Across the Baltimore metro vacancy increased 80 bps to 50 In the Baltimore Suburbs vacancy stands at 44 up 10 bps YoY and in Baltimore city vacancy is 66 up 290 bps YoY
During the recent downturn Baltimore experienced a loss of 172500 jobs The most impacted sector was Leisure and Hospitality in which 45 of employees were furloughed or laid off Education and Health Services also took a loss of 30800 jobs Federal Government and Mining Logging and Construction were the only industries to see job growth with an increase of 800 employees and 3300 respectively The spike in Mining Logging and Construction may have been the result of the emergency expansion of Baltimorersquos hospitals and uninterrupted construction at existing development sites At the start of 2020 Baltimorersquos unemployment rate was 35 and is currently 95 There are currently 1253600 nonfarm employees in the Baltimore metro
CAPITAL MARKETS
$185PER SF PER MONTH
09RENT GROWTH
NORTHERN SUBURBS
-010SOUTHERN SUBURBS
-50000 -30000 -10000 0 10000-70000 -60000 -50000 -40000 -30000 -20000 -10000 0 10000
H2 2020 Baltimore Employment
2015 2016 2017 2018 2019 2020 2021 2022 2023 2024 20250
1
2
3
4
5
6
7
-2000
0
2000
4000
6000
8000
10000
Vacanc
y ()
Units
Rentable Completions(Units)
Net Absorption(Units)
Vacancy Rate(Avg )
StateLocal Government
Federal Government
Other Services
Leisure and Hospitality
Education and Health Services
Professional and Business Services
Financial Activities
Information
Retail Trade
Wholesale Trade
Trade Transportation and Utilities
Manufacturing
Mining Logging and Construction
Forecast
23
BALTIMORE METRO H1 2020
BALTIMORE METRO HOME PRICES
Property Year Built Sold Price Units $Unit
Townes at Holly Station 1985 042320 $115000000 510 $225490
Chatham Gardens 1980 041720 $83280000 414 $201159
The Point at Elkridge 1988 032720 $72500000 312 $232372
BLVD at White Springs 1977 040820 $61099000 459 $133113
Old Orchard 1986 041720 $33179940 180 $184333
LARGEST SALESBALTIMORE METRO MULTIFAMILY SALES VOLUME
Submarket Avg $UnitMo Avg $SFMo Vacancy
Annapolis $1749 $198 49
Baltimore City East $1434 $179 55
Baltimore City North $1095 $135 69
Baltimore City West $996 $125 41
ColumbiaNorth Laurel $1643 $170 44
Downtown Baltimore $1548 $189 85
Ellicott CityElkridge $1609 $167 47
Far North Baltimore Suburbs $1310 $136 29
Northeast Anne Arundel County $1374 $157 42
Northwest Anne Arundel County $1720 $172 51
Owings MillsPikesvilleRandallstown $1365 $132 45
ParkvilleCarneyPerry Hall $1164 $135 36
Southeast Baltimore County $1097 $132 38
Southwest Baltimore County $1172 $131 45
TowsonHunt Valley $1390 $140 53
RENTAL RATES - ALL PRODUCT TYPES
$3000000000
$2500000000
$2000000000
$1500000000
$1000000000
$500000000
$0
2014 2015 2016 2017 2018 2019
$255000
$250000
$245000
$240000
$235000
$220000
$205000
Rent growth in the Baltimore metro remained largely flat since June 2019 The Northern Baltimore Suburbs experienced 09 rent growth the Southern Baltimore Suburbs experienced a drop of 01 rent growth and Baltimore City rents fell by 30 The Baltimore suburbs outpaced Baltimore City in terms of rent growth and absorption Current vacancy in the Baltimore metro is 50 with the highest vacancies in Downtown Baltimore at 85 Baltimore City North at 69 and Baltimore City East at 55 According to Delta Reports the Howard CountyColumbia submarket fared the best in the metro with 27 YoY rent growth
Home values in the Baltimore metro increased 20 YoY up slightly from the five-year average growth rate of 15 The current median sales price in the Baltimore metro is $251000 Single-family homes in Baltimore County posted a 10-year high median sale price of $330000 This is a 6 YoY increase from June 2019 Homes in Baltimore City also posted a 10-year high median sale price of $238000 Of note Owings Mills experienced a 27 YoY increase in median home value for an average of $415000
Investment activity reached $506M in the Baltimore metro during the first two quarters of 2020 in 14 transactions All but one sale was value-add product The highest sales in terms of price per unit were Point at Elkridge a 312-unit property in Elkridge which sold for $232400 per unit and Townes at Holly Station a 510-unit property in Waldorf which sold for $225500 per unit CBRE brokered both sales
TOWNES AT HOLLY STATION
$215000
$220000
$225000
$230000
$235000
$240000
$245000
$250000
2014 2015 2016 2017 2018 2019
Baltimore Metro Median Sale Price
$0
$500000000
$1000000000
$1500000000
$2000000000
$2500000000
$3000000000
2013 2014 2015 2016 2017 2018 2019 H1 2020
Balitmore Metro Sales Volume
2018 20192016 20172014 20152013 H1 2020
$210000$215000$220000$225000$230000$235000$240000$245000$250000$255000
2014 2015 2016 2017 2018 2019 2020
Baltimore Metro Median Sale Price
2020
24
FOR SALES OR FINANCING INFORMATION CONTACT
William S RoohanVice Chairman(O) +1 410 244 3122(M) +1 443 690 6967billroohancbrecom
Michael E MuldowneyExecutive Vice President(O) +1 410 244 3144(M) +1 443 250 3144mikemuldowneycbrecom
Robert G Dean IIISenior Vice President(O) +1 202 585 5766(M) +1 202 578 6941robertdeancbrecom
Jonathan M GreenbergSenior Vice President(O) +1 703 734 4772(M) +1 202 423 6655jonathangreenbergcbrecom
Martha A HastingsSenior Vice President(O) +1 410 244 3162(M) +1 410 807 2450marthahastingscbrecom
Brian H MargerumSenior Vice President(O) +1 410 244 3135(M) +1 443 386 1096brianmargerumcbrecom
Michael D RudolphSenior Vice President(O) +1 410 244 3121(M) +1 443 928 0392michaelrudolphcbrecom
John T Sheridan JrSenior Vice President(O) +1 703 905 0239(M) +1 703 200 7720johnsheridancbrecom
Yalda G HowellFirst Vice President(O) +1 202 585 5677(M) +1 240 462 2332yaldaghamariancbrecom
Thomas B LeachmanVice President(O) +1 202 585 5638(M) +1 240 688 0189thomasleachmancbrecom
Kemp D BroujosSenior Associate(O) +1 202 585 5724(M) +1 443 786 2951kempbroujoscbrecom
Nathan E BarthAssociate(O) +1 703 905 0228(C) +1 703 340 6828nathanbarthcbrecom
Zachary L StoneSales Assistant(O) +1 202 585 5650 (M) +1 202 713 8404zachstonecbrecom
Investment Sales amp Brokerage
Operations amp Marketing
Debt amp Structured Finance Team
Patricia C BonebrakeSenior Director of Operations(O) +1 410 244 3141(C) +1 443 253 5917trishbonebrakecbrecom
Jennifer W BusseyOperations Manager(O) +1 410 244 3134(C) +1 410 300 1302jenniferbusseycbrecom
Cheryl FinlaysonProductions Systems Manager(O) +1 410 244 7100(C) +1 410 244 3101cherylfinlaysoncbrecom
Margaret O MacleayOperations Supervisor(O) +1 202 585 5638(C) +1 410 562 9340maggiemacleaycbrecom
Rachel L MossmanSenior Communications Specialist(O) +1 410 244 3179(C) +1 410 244 7100rachelmossmancbrecom
Samantha S FifieldSales Assistant(O) +1 202 585 5773(C) +1 310 266 0003samanthafifieldcbrecom
Caroline P LekakosClient Services Coordinator(O) +1 202 585 5606(C) +1 240 595 0642carolinelekakoscbrecom
Yasmeen F ShararaClient Services Coordinator(O) +1 202 585 5580(C) +1 301 828 7435yasmeenshararacbrecom
Lauren E SpielmanClient Services Coordinator(O) +1 410 244 3129(C) +1 443 800 4388laurenspielmancbrecom
Grace F TrimbleClient Services Coordinator(O) +1 410 244 3123(C) +1 410 499 1064gracetrimblecbrecom
David F WebbVice Chairman(O) +1 202 585 5721(M) +1 202 744 4900davidwebbcbrecom
Maximiliane T LeachmanExecutive Vice President(O) +1 202 585 5655(M) +1 404 358 4317maxileachmancbrecom
Justin J GlasgowSenior Vice President(O) +1 202 783 1723(M) +1 202 316 1804justinglasgowcbrecom
RESEARCH TEAM
JEANETTE I RICE Americas Head of Multifamily Research (O) +1 214 979 6169
(C) +1 817 412 0709 jeanettericecbrecom
MOLLY M HUNT Research Analyst (O) +1 202 585 5597(C) +1 415 599 6009 mollyhuntcbrecom
RANK
1Fortune Magazinersquos
Most Admired Commercial Real Estate
Firm
REPUTATION
2Ranked the 2
Multifamily Brokerage Team in the entire nation by
Real Estate Forum
THE CBRE TEAM COMPETITIVE ADVANTAGE
25
RESOURCES
26Largest team and most
capacity in the Mid-Atlantic region
EXPERIENCE
$174B+The aggregate sales
value of deals our team has brokered since
2015
DEBT TEAM
1The CBRE Debt amp
Structured Finance Team is the 1 Freddie Mac
SellerServicer
copy Copyright 2020 All rights reserved Information contained herein including projections has been obtained from sources believed to be reliable but has not been verified for accuracy or completeness CBRE Inc makes no guarantee warranty or representation about it Any reliance on such information is solely at your own risk This information is exclusively for use by CBRE clients and professionals and may not be reproduced without the prior written permission of CBRErsquos Global Chief Economist CBRE and the CBRE logo are service marks of CBRE Inc andor its affiliated or related companies in the United States and other countries All other marks displayed on this document are the property of their respective owners Photos herein are the property of their respective owners Use of these images without the express written consent of the owner is prohibited
WASHINGTON DC1900 N Street NW
Suite 700 Washington DC 20036
+1 (202) 783 8200
BALTIMORE MD100 East Pratt Street
Suite 1700Baltimore MD 21202+1 (410) 244 7100
TYSONS VA1861 International Drive
Suite 300McLean VA 22102+1 (703) 821-6900

10
-60000 -50000 -40000 -30000 -20000 -10000 0 10000
Q2 2020 DC Employment
WASHINGTON DC H1 2020
Job Growth YoY
-50000 -40000 -30000 -20000 -10000 0 10000
StateLocal Government
Federal Government
Other Services
Leisure and Hospitality
Education and Health Services
Professional and Business Services
Financial Activities
Information
Retail Trade
Wholesale Trade
Trade Transportation and Utilities
Manufacturing
Mining Logging and Construction
EMPLOYMENT
CAPITAL MARKETS
$292860000SALES IN H1 2020
845 UNITSSOLD IN H1 2020
9 PROPERTIES
Deliveries Net Absorption Vacancy
Year
DEVELOPMENTDC BY THE NUMBERS
61
$2561
12696 UNITSUNDER CONSTRUCTION
3004 UNITSDELIVERED IN 2020
STABILIZED VACANCY
PIPELINE
CLASS A AVG RENTS
CLASS B AVG RENTS
Source CBRE Research and Delta Associates
As of June 30 2020
PER UNIT PER MONTH
18907 UNITS36-MONTH PIPELINE
Recent deliveries in the District were concentrated primarily in the Capitol Riverfront and H Street submarkets NoMa and Union Market also remain top submarkets for development activity with around 3483 units under construction on-track to deliver in the next 24 months Annual absorption in the District was 25 lower than a year ago as 2003 units absorbed in the first half of the year Q2 stabilized vacancy rate in the District is 61 a 250 bps increase from the previous year The average lease-up pace of new product in the District is 14 units per month and concessions average 15 months free rent
Insulated by the federal government Washington DC has fared favorably thus far in the downturn compared to other large metros across the nation The District experienced 67000 job losses which represents an 8 YoY loss in employment Leisure and Hospitality suffered the biggest job loss as 60 of the workforce was laid off or furloughed Promisingly government information and other services were the only industries to experience job growth albeit small
PER SF PER MONTH$327
$2067PER UNIT PER MONTH
PER SF PER MONTH$274
7000
6000
5000
4000
3000
2000
1000
0
8
7
6
5
4
3
2
1
0
VacancyUnitsDelivered
Washington DC Summary
2013 2014 2015 2016 2017 2018 2019 2021 2022H22020
H12020
00
10
20
30
40
50
60
70
80
90
0
1000
2000
3000
4000
5000
6000
7000
2013 2014 2015 2016 2017 2018 2019 H1 2020 H2 2020 2021 2022
Vaca
ncy
Units
Deliveries Net Absorption Vacancy
Forecast
11
WASHINGTON DC H1 2020
WASHINGTON DC HOME PRICES
Property Year Built Price Sold Units $Unit
The Woodley 2014 $180250000 010820 212 $850235
Skyline Apartments 1965 $58700000 030120 398 $147487
Glenwood Apartments 1942 $13700000 013020 90 $152222
The Waring 1909 $8400000 063020 24 $328947
The Regent 1937 $8450000 063020 12 $228378
LARGEST SALESDC MULTIFAMILY SALES VOLUME
$2000000000
$1500000000
$1000000000
$500000000
$02018 20192016 20172014 20152013
THE SHELBY
Class A High-Rise Avg $UnitMo
Avg $SFMo Vacancy YoY Rent Change
Upper NW $2810 $347 50 -06
Central $2822 $345 51 -46
Columbia HeightsShaw $2663 $363 64 -21
NoMaH Street $2290 $302 82 -57
Capitol HillRiverfrontSouthwest $2583 $325 77 -33
Northeast $2092 $266 85 -07
Upper Georgia $2183 $281 53 06
Class B Mid-and High-Rise Avg $UnitMo
Avg $SFMo Vacancy YoY Rent Change
Upper Northwest $2104 $258 43 -26
Mount Vernon Square NW $1925 $291 76 -74
Southwest $2085 $289 30 -04
RENTAL RATES
The District experienced broad rent decreases across almost all submarkets with the exception of Upper Georgia The Northeast and NoMaH Street submarkets have the highest Class-A High-Rise vacancy at 85 and 82 respectively This is in part due to an influx of new deliveries to those markets Class-B vacancy currently stands at 45 and concessions are at 30 of face rent The Mount Vernon Square submarket has the highest Class-B Mid and High-Rise vacancy at 76 and the highest decline in rent growth at -74 Class-A and Class-B apartments rents fell by a total of 33
The current average home value in the District is $586000 While home values grew in 2020mdashseeing an average annual increase of 70mdashhome values in the District have increased on average 30 YoY since 2015
A total of $2929M multifamily sales transacted in the District in nine sales in the first two quarters of 2020 CoreCore-Plus transactions made up for 71 of transactions and Value-Add transactions made up for the remaining 29 of total sales volume The highest sales in terms of price per unit were The Woodley a 212-unit property in Woodley Park at $850235 per unit and The Shelby a 24-unit property in Dupont Circle at $350000 per unit both of which were brokered by CBRE The Woodley was also the largest sale in H1 2020 across the District at $18025M
$0
$500000000
$1000000000
$1500000000
$2000000000
2013 2014 2015 2016 2017 2018 2019 H1 2020
DC Sales Volume
H1 2020
$600000
$500000
$400000
$300000
$200000
$100000
2014 2015 2016 2017 2018 2019$0
$100000
$200000
$300000
$400000
$500000
$600000
2014 2015 2016 2017 2018 2019 2020
DC Home Prices
2020
12
NORTHERN VIRGINIA H1 2020
NORTHERN VIRGINIA
NORTHERN VIRGINIA OVERVIEW
Northern Virginia continues to be the fastest growing region in the DC metro The regionrsquos economic future has been bolstered by Amazonrsquos decision to build its HQ2 in National Landing Amazon selected Northern Virginia because of its inherently strong fundamentals including a rich pipeline of talent provided by numerous universities in the area Amazon has subsequently begun the first phase of its hiring process and build-out at National Landing including hiring over 1000 white-collar employees and moving into 300000 SF of office space The delivery of HQ2 is expected to add 40000 to 60000 units of additional apartment demand to the area in the next decade A typical Amazon HQ2 worker will make $150000 per year which allows for up to $3750 in monthly rent Additionally Virginia Tech is moving forward with its plans to build the $1 Billion Innovation Campus in Potomac Yard The introduction of these two strong economic drivers will continue to further diversify the job base and incentivize more businesses to move to all areas of the DC metro where a pipeline of talent awaits
$400000
$450000
$500000
$550000
$600000
2014 2015 2016 2017 2018 2019
DC Home Prices
13
NORTHERN VIRGINIA H1 2020
2020 DELIVERIES MAP
NORTHERN VA DELIVERIES
Just under 4000 new units delivered in H1 2020 across Northern Virginia accounting for a 16 increase in total volume There are currently 10135 units under construction which will add 4 to the inventory over the next 24 months The largest deliveries in the region include Perseus Realtyrsquos The Foundry a 525-unit property in Alexandria Saul Centersrsquo Waycroft a 490-unit property in BallstonVirginia Square Wash REITrsquos The Trove a 401-unit property in Columbia Heights Arlington and Combined Propertiesrsquo Scout on the Circle a 400-unit property in Fairfax
382274copy 2020 CBRE Inc All rights reserved This information has been obtained from sources believed reliable but has not been verified for accuracy or completeness You should conduct a careful independent investigation of the property and verify all information Any reliance on this information issolely at your own risk CBRE and the CBRE logo are service marks of CBRE Inc All other marks displayed on this document are the property of their respective owners and the use of such logos does not imply any affiliation with or endorsement of CBRE
1
2
45
6
7
8
9
1 0
1 1
1 2
LORTON
MANASSAS
WOODBRIDGE
FORT HUNTNEWINGTON
LAKE RIDGE
CENTREVILLE
HERNDON
MANASSAS PARK
RESTON
STERLING
CHANTILLY
FAIRFAX STATION
ANNANDALE
BETHESDA
BURKE
FAIRFAX
FALLS CHURCH
NORTH BETHESDA
TYSONS CORNER
VIENNA
POTOMAC
MCLEAN
OAKTON
SPRINGFIELD
GROVETON
IDYLWOOD
JEFFERSON
LINCOLNIA
WEST SPRINGFIELD
WOLF TRAP
ADELPHI
BELTSVILLE
BOWIE
CALVERTON
CAMP SPRINGS
CLINTON
COLLEGE PARK
FORESTVILLE
GREENBELT
HILLCREST HEIGHTS
HYATTSVILLE
LANHAM
ROSARYVILLE
GLENN DALE
CORAL HILLS
EAST RIVERDALE
KETTERING
WASHINGTON201
267
28295
295
381
110
5
50
29
301
695
66
270
495
395
95
495
495
495
95
WASHINGTONDULLES INTL
AIRPORT
RONALD REAGANWASHINGTON
NATL ARPT
POTOMACAIRFIELD
FREEWAYAIRPORT
COLLEGE PARK AIRPORT
2020 MID ATLANTIC MULTIFAMILY DELIVERIESNORTHERN VIRGINIA
sup1 0 2 41
Miles
MULTIFAMILY DELIVERY
Leased 20Developer Novare Group Mulberry Development Group
8 Cameron SquareUnits 302
Leased 22Developer Praedium Group
7 The ClarkUnits 342
Leased 5Developer Erkiletian DevelopmentPCCP
6 The Sur at National GatewayUnits 360
Leased 65Developer Orr Partners
5 Centro ArlingtonUnits 366
Leased 12Developer Washington Real Estate Investment Trust
3 The TroveUnits 401
Leased 34Developer Saul Centers REIT (Northwestern Mutual Life Insurance)
2 The WaycroftUnits 490
Developer Combined Properties
4 Scout on the CircleUnits 400
Leased 21Developer Perseus RealtyELVFour Points
1 Foundry at CarlyleUnits 525
Leased 49Developer Shooshan Co Brandywine Realty Trust
10 4040 WilsonUnits 244
Leased 25Developer Abramson Properties Weingarten Realty AHDC
9 Array at West AlexUnits 278
Leased 40Developer Elm Street DevelopmentNorthwood Ravin
12 Preserve at Westfields - Phase IUnits 132
Leased 17Developer Novus
11 Mission LoftsUnits 157
Leased 21
Leased 34
Leased 12
Leased 7
Leased 65
Leased 5
Leased 22
Leased 20
Leased 25
Leased 49
Leased 17
Leased 40
Source Axiometrics 2020
VIRGINIA TECH INNOVATION CAMPUS
AMAZON HQ2
3
14
NORTHERN VIRGINIA H12020
$494500000SALES IN H1 2020
1823 UNITSSOLD IN H1 2020
9 PROPERTIES
Deliveries Net Absorption VacancyYear
NoVA BY THE NUMBERS
43
$1992
10135 UNITSUNDER CONSTRUCTION
3997 UNITSDELIVERED IN 2020
STABILIZED VACANCY
PIPELINE
CLASS A AVG RENTS
CLASS B AVG RENTS
Source CBRE Research and Delta Associates
As of June 30 2020
PER UNIT PER MONTH
14567 UNITS36-MONTH PIPELINE
Just under 4000 units delivered in H1 2020 which equates to a 10 increase in total inventory throughout the year Arlington accounted for 59 of new deliveries and Alexandria accounted for 27 The average lease-up pace for properties in Northern Virginia is currently 21 units per month compared to 24 units per month in January 2020 Northern Virginiarsquos current stabilized vacancy is 43 a 70 bps YoY increase
Job Growth YoY as of June 2020EMPLOYMENT
Northern Virginia experienced the YoY employment decline of 134700 jobs Leisure and Hospitality fared the worst with the loss of 64500 jobs and Education and Health Services with the loss of 32100 jobs However there was growth in Information and Financial Activities industries At the start of the year unemployment was at 25 and it currently stands at 86
As of June 2020 Amazon has already hired 1000 employees It is estimated that Amazon will bring 1200 employees in 2020 and an additional 2000 employees in 2021
CAPITAL MARKETS
PER SF PER MONTH$217
$1746 PER UNIT PER MONTH
PER SF PER MONTH$194
VacancyNorthern Virginia SummaryUnits
Delivered
DEVELOPMENT
-70000 -60000 -50000 -40000 -30000 -20000 -10000 0 10000
H1 2020 NoVa Employment
-70000 -50000 -30000 -10000 0 10000
5
4
3
2
1
02014 2015 2016 2017 2018 2019 H1
2020H2
2020
10000
8000
6000
4000
2000
02021 2022
StateLocal Government
Federal Government
Other Services
Leisure and Hospitality
Education and Health Services
Professional and Business Services
Financial Activities
Information
Retail Trade
Wholesale Trade
Trade Transportation and Utilities
Manufacturing
Mining Logging and Construction
0
001
002
003
004
005
006
0
1000
2000
3000
4000
5000
6000
7000
8000
9000
2014 2015 2016 2017 2018 2019 H1 2020 H2 2020 2021 2022
Vaca
ncy
Units
Deliveries Net Absorption Vacancy
Forecast
15
NORTHERN VIRGINIA H1 2020
NoVA HOME PRICES
Property Year Built Sold Price Units $Unit
The Emerson 2019 012720 $117000000 355 $329577
Avana Alexandria 1991 013020 $106000000 326 $325153
Ravensworth Towers 1973 041120 $59000000 219 $269406
The Bradley 2015 012020 $57666667 165 $349495
Monroe Place 2008 032620 $56950000 202 $281931
LARGEST SALESNoVA MULTIFAMILY SALES VOLUME
Class A High-Rise Avg $UnitMo
Avg $SFMo Vacancy YoY Rent
Change
Alexandria $2124 $243 54 -33
RosslynBallston Corridor $2490 $300 36 -27
Crystal CityPentagon City $2356 $268 74 -72
South Arlington $2024 $232 45 00
Tysons $2264 $252 78 -134
RestonHerndon $2106 $226 95 -71
Falls ChurchMerrifield $2117 $234 55 -70
Class B Mid-and High Rise Avg $UnitMo
Avg $SFMo Vacancy YoY Rent
Change
Falls ChurchNorth Arlington $2264 $249 54 07
South Arlington $1674 $198 21 -01
Arlandria $1662 $220 16 11
West Alexandria $1666 $183 54 -04
Crystal City $2226 $206 62 -60
RENTAL RATES
$650000
$625000
$600000
$575000
$550000
$5250002014 2015 2016 2017 2018 2019
$5000000000
$4000000000
$3000000000
$2000000000
$1000000000
$0
Northern Virginia experienced rent decreases compared to H1 2019 with the exception of Class-A product in South Arlington and Class-B product in Falls ChurchNorth Arlington and Arlandria Class-A rents fell by 41 to $1992unitmonth or $217 per square foot Class-A vacancy in Northern Virginia is currently 49 and concessions are at 50 of face rent RestonHerndon and Tysons have the highest Class-A vacancy at 95 and 78 due in most part to increased deliveries in those submarkets Class B rents fell 16 YoY to $1746unitmonth or $194 per square foot Class-B vacancy is currently 39 and concessions are 20 of face rent Crystal City has the highest Class-B vacancy at 62 Class-A and Class-B rents fell by a total of 25 YoY
Homes values in Northern Virginia continue to see impressive growth as demand significantly outweighs supply in 2020 New listing inventory was down by 35 this year and prices continue to climb Homes are on the market for an average of 35 weeks before selling The current median home value in Northern Virginia is $641002 which is a 44 YoY increase across the region Alexandria is the fastest growing housing market in the nation with 202 YoY median sale value growth Arlington County currently maintains the highest home value in Northern Virginia and experienced an 11 YoY increase The high cost of home buying in Northern Virginia will likely drive multifamily demand as renters are priced out of the for sale housing market
A total of $4945M multifamily sales transacted in Northern Virginia in nine properties in the first half of 2020 Value-add sales accounted for 77 of transactions and CoreCore-Plus sales made up the remaining 23 of total investment volume The highest price per unit sales were The Bradley a 165-unit property in Alexandria which sold at $349500 per unit and The Emerson a 355-unit property in Herndon which sold at $329600 per unit
JEFFERSON FAIR OAKS
$520000
$540000
$560000
$580000
$600000
$620000
2014 2015 2016 2017 2018 2019
NoVA Average Sold Home Price
$0
$1000000000
$2000000000
$3000000000
$4000000000
$5000000000
2013 2014 2015 2016 2017 2018 2019 H1 2020
NoVA Sales Volume
2018 20192016 20172014 20152013 H1 2020
$500000$520000$540000$560000$580000$600000$620000$640000$660000
2014 2015 2016 2017 2018 2019 2020
NoVA Average Sold Home Price
2020
16
SUBURBAN MD H1 2020
SUBURBAN MARYLAND
SUBURBAN MARYLAND OVERVIEW
Suburban Maryland fared the best in terms of rent growth absorption and transaction volume compared to the other markets in Washington DC Its lower density setting may be in part responsible for its recent resilience as residents choose to relocate out of higher density urban areas
Suburban Maryland is one of the most prominent areas in the region for the Life Sciences sector and is home to the headquarters of the National Institute of Health Department of Energy the Food and Drug Administration and the National Institute of Standards and Technology The presence of biotech in the I-270 Corridor in particular has greatly benefited the commercial real estate market in office industrial and multifamily Life Sciences buildings have significantly lower vacancy rates than that of other commercial office buildings As of 2019 laboratory vacancy sits at around 50 on average while office vacancy rate in Suburban Maryland is nearly 19 Montgomery and Prince Georgersquos counties continue to be largely unique in their growth of biotech because they remain suburban areas in comparison to Life Sciences hubs such as Boston New York and San Francisco that continue to grow as urban areas
Although investment activity slowed down considerably across the region Suburban Maryland is an outlier Over $12B transacted in H1 2020 which is more than H1 2019 when $893M transacted
17
SUBURBAN MD H1 2020
2020 DELIVERIES MAP
SUBURBAN MD DELIVERIES
Deliveries slowed in Suburban Maryland with an addition of 492 units across three projects in H1 2020 The deliveries were Bainbridgersquos Bainbridge Lake Linganore a 322-unit property in Frederick NV Commercial Brick Lanersquos The Bottling Plant a 86-unit property in Outlying Frederick County and Landex Developmentrsquos Artisan 4100 an 84-unit property in Brentwood There are currently 6441 units under construction which will add a total of 35 to total inventory over the next 24 months Bethesda has the highest concentration of development activity with just over 1900 units delivering in the next 36 months Unlike other markets in the DC metro Suburban Marylandrsquos vacancy which currently stands at 36 was not largely impacted in the past six months
382274copy 2020 CBRE Inc All rights reserved This information has been obtained from sources believed reliable but has not been verified for accuracy or completeness You should conduct a careful independent investigation of the property and verify all information Any reliance on this information issolely at your own risk CBRE and the CBRE logo are service marks of CBRE Inc All other marks displayed on this document are the property of their respective owners and the use of such logos does not imply any affiliation with or endorsement of CBRE
1
2
3
HERNDONRESTON
STERLING
BALLENGER CREEK
ASPEN HILL
BETHESDA
CHILLUM
NORTH BETHESDA
ROCKVILLE
SILVER SPRING
TAKOMA PARK
TYSONS CORNER
VIENNA
WHEATON-GLENMONT
WHITE OAK
POTOMAC
MCLEAN
COLESVILLENORTH POTOMAC
IDYLWOOD
WOLF TRAP
ADELPHI
BELTSVILLE
BOWIE
CROFTONGREENBELT
HYATTSVILLELANHAM
LAUREL
ODENTONSOUTH LAUREL
CATONSVILLE
COLUMBIA
DAMASCUS
GAITHERSBURG
LINTHICUM HEIGHTS
NORTH LAURELOLNEY
PIKESVILLE
WOODLAWN
SEVERN
ARBUTUS
MONTGOMERY VILLAGE
GERMANTOWN FERNDALE
ELDERSBURG
LOCHEARN
MAYS CHAPEL
REISTERSTOWN
DUNDALK
PERRY HALL
RIVIERA BEACH
ROSEDALE
SEVERNA PARK
TOWSON
ARNOLD
ESSEX
GLEN BURNIE
PASADENA
PARKVILLE
SOUTH GATE
OVERLEANOTTINGHAM
ANNAPOLIS NECK
WASHINGTON
ANNAPOLIS
BALTIMORE
201
3
295
267
7
100
15
50
15
340
40 1
29
301
301
270
495
70
83
195
95
66
97
895
95
95
695
270395
695
WASHINGTONDULLES INTL
AIRPORT
TIPTONAIRPORT
LEE AIRPORT
BALTIMOREWASHINGTONINTL AIRPORT
MARTIN STATEAIRPORT
2020 MID ATLANTIC MULTIFAMILY DELIVERIESSUBURBAN MARYLANDMULTIFAMILY DELIVERY
sup1 0 3 615Miles
Leased 20Developer Landex Development
3 Artisan 4100Units 84
Leased 60Developer NV Commercial Brick Lane
2 Bottling PlantUnits 86
Leased 9Developer Bainbridge Companies
1 Bainbridge Lake LinganoreUnits 322Leased 9
Leased 60
Leased 20
18
-45000 -40000 -35000 -30000 -25000 -20000 -15000 -10000 -5000 0 5000
H1 2020 SubMD Employment
SUBURBAN MD H1 2020
Job Growth YoY
EMPLOYMENT
$12 BILLIONSALES IN H1 2020
5006 UNITSSOLD IN H1 2020
14 PROPERTIES
5000
4000
3000
2000
1000
0
6
5
4
3
2
1
0
VacancyUnits
Delivered Suburban MD Summary
Deliveries Net Absorption Vacancy
Year
DEVELOPMENTSUBURBAN MD BY THE NUMBERS
36
$1905
6441 UNITSUNDER CONSTRUCTION
492 UNITSDELIVERED IN 2020
STABILIZED VACANCY
PIPELINE
CLASS A AVG RENTS
CLASS B AVG RENTS
Source CBRE Research and Delta Associates
As of June 30 2020
PER UNIT PER MONTH
13773 UNITS36-MONTH PIPELINE
As the most affordable option for residents in Washington DC Suburban Maryland continues to provide job opportunities and relatively affordable living Just under 500 units delivered in H1 2020 and 100 units have been absorbed so far this year Suburban Marylandrsquos current stabilized vacancy is 36 down 30 bps from last year
CAPITAL MARKETS
Suburban Maryland experienced the YoY loss of 111400 jobs The most impacted industries were Leisure and Hospitality with a 40 decrease in employment and Education and Health Services with a loss of 15 of employees Trade and Transportation also lost just under 20000 jobs The Federal Government saw a growth of 1000 employees Unemployment in Montgomery and Prince Georgersquos counties is currently 80 and 99 respectively up from 28 and 36 respectively in January 2020
$203PER SF PER MONTH
$1591PER UNIT PER MONTH
$173PER SF PER MONTH
2014 2015 2016 2017 2018 2019 H12020
H22020
2021 2022
StateLocal Government
Federal Government
Other Services
Leisure and Hospitality
Education and Health Services
Professional and Business Services
Financial Activities
Information
Retail Trade
Wholesale Trade
Trade Transportation and Utilities
Manufacturing
Mining Logging and Construction
-35000 -25000 -15000 -5000 0 10000
00
10
20
30
40
50
60
0
500
1000
1500
2000
2500
3000
3500
4000
4500
2014 2015 2016 2017 2018 2019 H12020
H22020
2021 2022
Vacanc
y
Units
Deliveries Net Absorption Vacancy
Forecast
19
SUBURBAN MD H1 2020
SUBURBAN MD HOME PRICES
Property Year Built Sold Price Units $Unit
4701 Willard 1969 062920 $276500000 525 $526667
The Varsity 2011 032720 $146022026 258 $565977
Gallery on New Hampshire 1960 022820 $117000000 675 $173333
Montgomery Paint Branch 1984 061220 $113206000 529 $214000
Jefferson at Inigos Crossing 2008 011320 $109000000 473 $230444
LARGEST SALESSUBURBAN MD MULTIFAMILY SALES VOLUME
Class A High Rise Avg $UnitMo Avg $SFMo Vacancy YoY Rent
Change
Bethesda $2670 $293 72 31
N Bethesda Rockville $2047 $223 60 22
Silver Spring Wheaton $2012 $242 35 18
Hyattsville College Park $1867 $206 46 NA
Class B Mid-and High-Rise Avg $UnitMo Avg $SFMo Vacancy YoY Rent
Change
Silver Spring $1622 $169 920 -190
BethesdaChevy Chase $1982 $217 520 -530
Rockville $1709 $184 430 450
RENTAL RATES
$400000
$380000
$360000
$340000
$320000
2014 2015 2016 2017 2018 2019
$3000000000
$2500000000
$2000000000
$1500000000
$1000000000
$500000000
$0
Although no markets saw overall positive rent growth over the past year Suburban Maryland was the least negatively impacted region in the metro in terms of rental rates Class-A rents declined by 13 YoY to an average of $1905unitmonth or $203 per square foot Class-A vacancy currently stands at 45 Class-B rents declined 10 to an average of $1591unitmonth or $173 per square foot Class-B vacancy currently stands at 31 Overall Class-A and Class-B apartment rents fell by a total of 11 YoY to an average of $1697unitmonth or $183 per square foot
Home prices have dropped slightly in Suburban Maryland after four consecutive years of positive growth The current median home sale price is $393000 The robust effect of the Amazon announcement has spilled over into Suburban Marylandrsquos housing market as a desirable and often more affordable option than Northern Virginia Much of Suburban Maryland multifamily properties remain within the ideal 30-minute commute from large employment drivers such as Amazon HQ2 and parts of Washington DC
Investment activity was highest in Suburban Maryland as $1222570000 traded in 13 sales in the first half of 2020 Value-Add product made up a majority of transaction volume at 61 while CoreCore-Plus accounted for the remaining 39 4017 Willard was the highest sale in terms of total volume and price per unit at $267500000 and $526667 per unit
BETHESDA ROW
NORTHLAKE
$310000
$320000
$330000
$340000
$350000
$360000
$370000
$380000
$390000
$400000
2014 2015 2016 2017 2018 2019 2020
Sub MD Median Home Sales Price
2020
$0
$500000000
$1000000000
$1500000000
$2000000000
$2500000000
$3000000000
2013 2014 2015 2016 2017 2018 2019 H1 2020
Sub MD Sales Volume
2018 20192016 20172014 20152013 H1 2020
4701 WILLARD
20
BALTIMORE METRO H1 2020
BALTIMORE METRO OVERVIEW
While the Baltimore metro is performing well compared to other metros across the country the region has seen the effects of the COVID-19 pandemic with impacts to employment transaction volume rent growth and absorption rates Over 172000 jobs were lost in greater Baltimore since Q2 2019 which is a 12 decrease in total nonfarm employment The June 2020 unemployment rate in the Baltimore metro is 80 which is a 450 bps increase from January 2020 Baltimore however is considered to be better positioned than other regions to weather the current economic downturn due to its impressive resilience in previous recessions In the Global Financial Crisis Baltimore ranked sixth in terms of GDP growth and ninth in payroll job growth across the nation
Just over 2400 units delivered in the Baltimore metro in H1 2020 and 2532 units are currently under construction The average rent in Baltimore is $1759unitmonth or $185 per square foot An aggregate of $506M in sales transacted across 13 sales CBRE brokered two of the three largest transactions in H1 2020 across the Baltimore metro
BALTIMORE METRO
21
BALTIMORE METRO H1 2020
382274copy 2020 CBRE Inc All rights reserved This information has been obtained from sources believed reliable but has not been verified for accuracy or completeness You should conduct a careful independent investigation of the property and verify all information Any reliance on this information issolely at your own risk CBRE and the CBRE logo are service marks of CBRE Inc All other marks displayed on this document are the property of their respective owners and the use of such logos does not imply any affiliation with or endorsement of CBRE
1
2
3
4
5
6
7
8
91 0
CATONSVILLE
ELKRIDGE
ELLICOTT CITY
LINTHICUM HEIGHTS
PIKESVILLE
RANDALLSTOWN
WOODLAWN
SEVERN
ARBUTUS
FERNDALE
LOCHEARN
MAYS CHAPEL
MILFORD MILL
OWINGS MILLS
REISTERSTOWN
DUNDALK
MIDDLE RIVER
PERRY HALL
RIVIERA BEACH
ROSEDALE
ESSEX
GLEN BURNIE
PARKVILLE
EDGEWOODJOPPA
CARNEY
GREEN HAVEN
OVERLEA
ROSSVILLE
JOPPATOWNE
BALTIMORE
295
24
924
100
29
1
70
83
83
195
97
895
95
95
395
695 95
BALTIMOREWASHINGTONINTL AIRPORT
MARTINSTATE
AIRPORT
2020 MID ATLANTIC MULTIFAMILY DELIVERIESBALTIMORE
sup1 0 15 3075
Miles
MULTIFAMILY DELIVERY
Leased 45Developer Sid Emmer
8 The View at Mill Run Phase IIUnits 157
Developer Greystar
7 Elan TowsonUnits 208
Leased 40Developer La Cite
6 CenterWest- Phase 1AUnits 262
Developer Klein EnterprisesManekin LLC
5 The WoodberryUnits 284
Leased 35Developer AvalonBay CommunitiesRetail Properties
3 Avalon TowsonUnits 371
Leased 7Developer Wood Partners
2 Alta Brewers HillUnits 371
Leased 4Developer Chesapeake Realty Partners
4 Avenue GrandUnits 324
Leased 36Developer Howard Hughes
1 Juniper - Merriweather DistrictUnits 380
Leased 67Developer Atlantic Realty
10 The MorrisonUnits 15
Leased 10Developer Zahlco
9 9 E Mount Royal StreetUnits 65
2020 DELIVERIES MAP
BALTIMORE METRO DELIVERIES
Deliveries picked up in Baltimore throughout 2020 with the addition of 2437 units throughout the metro equating to a 12 increase in total inventory More units delivered in the first half of 2020 than were delivered in all of 2019 The largest deliveries were Howard Hughesrsquo Juniper a 380-unit property as part of the Merriweather District in Columbia Wood Partnersrsquo Alta Brewers Hill a 371-unit property in Baltimore City and Avalonbay Communitiesrsquo Avalon Towson a 371-unit property in Towson There are currently 2532 units under construction that are expected to deliver in the next 24 months The average lease-up pace for properties in Baltimore is 15 units per month
Leased 36
Leased 7
Leased 35
Leased 4
Leased 34
Leased 40
Leased 19
Leased 45
Leased 10
Leased 67
Source Yardi Matrix 2020 Source Axiometrics 2020
22
BALTIMORE METRO H1 2020
Job Growth YoY EMPLOYMENT
$506028000SALES IN H1 2020
2913 UNITSSOLD IN H1 2020
14 PROPERTIES
10000
8000
6000
4000
2000
0
7
6
5
4
3
2
0
VacancyUnits
Delivered Baltimore Metro Summary
Deliveries Net Absorption Vacancy
Year
DEVELOPMENTBALTIMORE METRO BY THE NUMBERS
500
$1759
2532 UNITSUNDER CONSTRUCTION
2437 UNITSDELIVERED IN 2020
STABILIZED VACANCY
PIPELINE
TOTAL AVG RENTS
Source CBRE Research Axiometrics and Delta Associates
As of June 30 2020
PER UNIT PER MONTH
6906 UNITS36-MONTH PIPELINE
Deliveries in Baltimore picked up with an additional 2437 units in H1 2020 Just under 2000 units were absorbed in the past 12 months most of them before the beginning of 2020 which has caused vacancy to increase in H1 2020 Across the Baltimore metro vacancy increased 80 bps to 50 In the Baltimore Suburbs vacancy stands at 44 up 10 bps YoY and in Baltimore city vacancy is 66 up 290 bps YoY
During the recent downturn Baltimore experienced a loss of 172500 jobs The most impacted sector was Leisure and Hospitality in which 45 of employees were furloughed or laid off Education and Health Services also took a loss of 30800 jobs Federal Government and Mining Logging and Construction were the only industries to see job growth with an increase of 800 employees and 3300 respectively The spike in Mining Logging and Construction may have been the result of the emergency expansion of Baltimorersquos hospitals and uninterrupted construction at existing development sites At the start of 2020 Baltimorersquos unemployment rate was 35 and is currently 95 There are currently 1253600 nonfarm employees in the Baltimore metro
CAPITAL MARKETS
$185PER SF PER MONTH
09RENT GROWTH
NORTHERN SUBURBS
-010SOUTHERN SUBURBS
-50000 -30000 -10000 0 10000-70000 -60000 -50000 -40000 -30000 -20000 -10000 0 10000
H2 2020 Baltimore Employment
2015 2016 2017 2018 2019 2020 2021 2022 2023 2024 20250
1
2
3
4
5
6
7
-2000
0
2000
4000
6000
8000
10000
Vacanc
y ()
Units
Rentable Completions(Units)
Net Absorption(Units)
Vacancy Rate(Avg )
StateLocal Government
Federal Government
Other Services
Leisure and Hospitality
Education and Health Services
Professional and Business Services
Financial Activities
Information
Retail Trade
Wholesale Trade
Trade Transportation and Utilities
Manufacturing
Mining Logging and Construction
Forecast
23
BALTIMORE METRO H1 2020
BALTIMORE METRO HOME PRICES
Property Year Built Sold Price Units $Unit
Townes at Holly Station 1985 042320 $115000000 510 $225490
Chatham Gardens 1980 041720 $83280000 414 $201159
The Point at Elkridge 1988 032720 $72500000 312 $232372
BLVD at White Springs 1977 040820 $61099000 459 $133113
Old Orchard 1986 041720 $33179940 180 $184333
LARGEST SALESBALTIMORE METRO MULTIFAMILY SALES VOLUME
Submarket Avg $UnitMo Avg $SFMo Vacancy
Annapolis $1749 $198 49
Baltimore City East $1434 $179 55
Baltimore City North $1095 $135 69
Baltimore City West $996 $125 41
ColumbiaNorth Laurel $1643 $170 44
Downtown Baltimore $1548 $189 85
Ellicott CityElkridge $1609 $167 47
Far North Baltimore Suburbs $1310 $136 29
Northeast Anne Arundel County $1374 $157 42
Northwest Anne Arundel County $1720 $172 51
Owings MillsPikesvilleRandallstown $1365 $132 45
ParkvilleCarneyPerry Hall $1164 $135 36
Southeast Baltimore County $1097 $132 38
Southwest Baltimore County $1172 $131 45
TowsonHunt Valley $1390 $140 53
RENTAL RATES - ALL PRODUCT TYPES
$3000000000
$2500000000
$2000000000
$1500000000
$1000000000
$500000000
$0
2014 2015 2016 2017 2018 2019
$255000
$250000
$245000
$240000
$235000
$220000
$205000
Rent growth in the Baltimore metro remained largely flat since June 2019 The Northern Baltimore Suburbs experienced 09 rent growth the Southern Baltimore Suburbs experienced a drop of 01 rent growth and Baltimore City rents fell by 30 The Baltimore suburbs outpaced Baltimore City in terms of rent growth and absorption Current vacancy in the Baltimore metro is 50 with the highest vacancies in Downtown Baltimore at 85 Baltimore City North at 69 and Baltimore City East at 55 According to Delta Reports the Howard CountyColumbia submarket fared the best in the metro with 27 YoY rent growth
Home values in the Baltimore metro increased 20 YoY up slightly from the five-year average growth rate of 15 The current median sales price in the Baltimore metro is $251000 Single-family homes in Baltimore County posted a 10-year high median sale price of $330000 This is a 6 YoY increase from June 2019 Homes in Baltimore City also posted a 10-year high median sale price of $238000 Of note Owings Mills experienced a 27 YoY increase in median home value for an average of $415000
Investment activity reached $506M in the Baltimore metro during the first two quarters of 2020 in 14 transactions All but one sale was value-add product The highest sales in terms of price per unit were Point at Elkridge a 312-unit property in Elkridge which sold for $232400 per unit and Townes at Holly Station a 510-unit property in Waldorf which sold for $225500 per unit CBRE brokered both sales
TOWNES AT HOLLY STATION
$215000
$220000
$225000
$230000
$235000
$240000
$245000
$250000
2014 2015 2016 2017 2018 2019
Baltimore Metro Median Sale Price
$0
$500000000
$1000000000
$1500000000
$2000000000
$2500000000
$3000000000
2013 2014 2015 2016 2017 2018 2019 H1 2020
Balitmore Metro Sales Volume
2018 20192016 20172014 20152013 H1 2020
$210000$215000$220000$225000$230000$235000$240000$245000$250000$255000
2014 2015 2016 2017 2018 2019 2020
Baltimore Metro Median Sale Price
2020
24
FOR SALES OR FINANCING INFORMATION CONTACT
William S RoohanVice Chairman(O) +1 410 244 3122(M) +1 443 690 6967billroohancbrecom
Michael E MuldowneyExecutive Vice President(O) +1 410 244 3144(M) +1 443 250 3144mikemuldowneycbrecom
Robert G Dean IIISenior Vice President(O) +1 202 585 5766(M) +1 202 578 6941robertdeancbrecom
Jonathan M GreenbergSenior Vice President(O) +1 703 734 4772(M) +1 202 423 6655jonathangreenbergcbrecom
Martha A HastingsSenior Vice President(O) +1 410 244 3162(M) +1 410 807 2450marthahastingscbrecom
Brian H MargerumSenior Vice President(O) +1 410 244 3135(M) +1 443 386 1096brianmargerumcbrecom
Michael D RudolphSenior Vice President(O) +1 410 244 3121(M) +1 443 928 0392michaelrudolphcbrecom
John T Sheridan JrSenior Vice President(O) +1 703 905 0239(M) +1 703 200 7720johnsheridancbrecom
Yalda G HowellFirst Vice President(O) +1 202 585 5677(M) +1 240 462 2332yaldaghamariancbrecom
Thomas B LeachmanVice President(O) +1 202 585 5638(M) +1 240 688 0189thomasleachmancbrecom
Kemp D BroujosSenior Associate(O) +1 202 585 5724(M) +1 443 786 2951kempbroujoscbrecom
Nathan E BarthAssociate(O) +1 703 905 0228(C) +1 703 340 6828nathanbarthcbrecom
Zachary L StoneSales Assistant(O) +1 202 585 5650 (M) +1 202 713 8404zachstonecbrecom
Investment Sales amp Brokerage
Operations amp Marketing
Debt amp Structured Finance Team
Patricia C BonebrakeSenior Director of Operations(O) +1 410 244 3141(C) +1 443 253 5917trishbonebrakecbrecom
Jennifer W BusseyOperations Manager(O) +1 410 244 3134(C) +1 410 300 1302jenniferbusseycbrecom
Cheryl FinlaysonProductions Systems Manager(O) +1 410 244 7100(C) +1 410 244 3101cherylfinlaysoncbrecom
Margaret O MacleayOperations Supervisor(O) +1 202 585 5638(C) +1 410 562 9340maggiemacleaycbrecom
Rachel L MossmanSenior Communications Specialist(O) +1 410 244 3179(C) +1 410 244 7100rachelmossmancbrecom
Samantha S FifieldSales Assistant(O) +1 202 585 5773(C) +1 310 266 0003samanthafifieldcbrecom
Caroline P LekakosClient Services Coordinator(O) +1 202 585 5606(C) +1 240 595 0642carolinelekakoscbrecom
Yasmeen F ShararaClient Services Coordinator(O) +1 202 585 5580(C) +1 301 828 7435yasmeenshararacbrecom
Lauren E SpielmanClient Services Coordinator(O) +1 410 244 3129(C) +1 443 800 4388laurenspielmancbrecom
Grace F TrimbleClient Services Coordinator(O) +1 410 244 3123(C) +1 410 499 1064gracetrimblecbrecom
David F WebbVice Chairman(O) +1 202 585 5721(M) +1 202 744 4900davidwebbcbrecom
Maximiliane T LeachmanExecutive Vice President(O) +1 202 585 5655(M) +1 404 358 4317maxileachmancbrecom
Justin J GlasgowSenior Vice President(O) +1 202 783 1723(M) +1 202 316 1804justinglasgowcbrecom
RESEARCH TEAM
JEANETTE I RICE Americas Head of Multifamily Research (O) +1 214 979 6169
(C) +1 817 412 0709 jeanettericecbrecom
MOLLY M HUNT Research Analyst (O) +1 202 585 5597(C) +1 415 599 6009 mollyhuntcbrecom
RANK
1Fortune Magazinersquos
Most Admired Commercial Real Estate
Firm
REPUTATION
2Ranked the 2
Multifamily Brokerage Team in the entire nation by
Real Estate Forum
THE CBRE TEAM COMPETITIVE ADVANTAGE
25
RESOURCES
26Largest team and most
capacity in the Mid-Atlantic region
EXPERIENCE
$174B+The aggregate sales
value of deals our team has brokered since
2015
DEBT TEAM
1The CBRE Debt amp
Structured Finance Team is the 1 Freddie Mac
SellerServicer
copy Copyright 2020 All rights reserved Information contained herein including projections has been obtained from sources believed to be reliable but has not been verified for accuracy or completeness CBRE Inc makes no guarantee warranty or representation about it Any reliance on such information is solely at your own risk This information is exclusively for use by CBRE clients and professionals and may not be reproduced without the prior written permission of CBRErsquos Global Chief Economist CBRE and the CBRE logo are service marks of CBRE Inc andor its affiliated or related companies in the United States and other countries All other marks displayed on this document are the property of their respective owners Photos herein are the property of their respective owners Use of these images without the express written consent of the owner is prohibited
WASHINGTON DC1900 N Street NW
Suite 700 Washington DC 20036
+1 (202) 783 8200
BALTIMORE MD100 East Pratt Street
Suite 1700Baltimore MD 21202+1 (410) 244 7100
TYSONS VA1861 International Drive
Suite 300McLean VA 22102+1 (703) 821-6900

15
NORTHERN VIRGINIA H1 2020
NoVA HOME PRICES
Property Year Built Sold Price Units $Unit
The Emerson 2019 012720 $117000000 355 $329577
Avana Alexandria 1991 013020 $106000000 326 $325153
Ravensworth Towers 1973 041120 $59000000 219 $269406
The Bradley 2015 012020 $57666667 165 $349495
Monroe Place 2008 032620 $56950000 202 $281931
LARGEST SALESNoVA MULTIFAMILY SALES VOLUME
Class A High-Rise Avg $UnitMo
Avg $SFMo Vacancy YoY Rent
Change
Alexandria $2124 $243 54 -33
RosslynBallston Corridor $2490 $300 36 -27
Crystal CityPentagon City $2356 $268 74 -72
South Arlington $2024 $232 45 00
Tysons $2264 $252 78 -134
RestonHerndon $2106 $226 95 -71
Falls ChurchMerrifield $2117 $234 55 -70
Class B Mid-and High Rise Avg $UnitMo
Avg $SFMo Vacancy YoY Rent
Change
Falls ChurchNorth Arlington $2264 $249 54 07
South Arlington $1674 $198 21 -01
Arlandria $1662 $220 16 11
West Alexandria $1666 $183 54 -04
Crystal City $2226 $206 62 -60
RENTAL RATES
$650000
$625000
$600000
$575000
$550000
$5250002014 2015 2016 2017 2018 2019
$5000000000
$4000000000
$3000000000
$2000000000
$1000000000
$0
Northern Virginia experienced rent decreases compared to H1 2019 with the exception of Class-A product in South Arlington and Class-B product in Falls ChurchNorth Arlington and Arlandria Class-A rents fell by 41 to $1992unitmonth or $217 per square foot Class-A vacancy in Northern Virginia is currently 49 and concessions are at 50 of face rent RestonHerndon and Tysons have the highest Class-A vacancy at 95 and 78 due in most part to increased deliveries in those submarkets Class B rents fell 16 YoY to $1746unitmonth or $194 per square foot Class-B vacancy is currently 39 and concessions are 20 of face rent Crystal City has the highest Class-B vacancy at 62 Class-A and Class-B rents fell by a total of 25 YoY
Homes values in Northern Virginia continue to see impressive growth as demand significantly outweighs supply in 2020 New listing inventory was down by 35 this year and prices continue to climb Homes are on the market for an average of 35 weeks before selling The current median home value in Northern Virginia is $641002 which is a 44 YoY increase across the region Alexandria is the fastest growing housing market in the nation with 202 YoY median sale value growth Arlington County currently maintains the highest home value in Northern Virginia and experienced an 11 YoY increase The high cost of home buying in Northern Virginia will likely drive multifamily demand as renters are priced out of the for sale housing market
A total of $4945M multifamily sales transacted in Northern Virginia in nine properties in the first half of 2020 Value-add sales accounted for 77 of transactions and CoreCore-Plus sales made up the remaining 23 of total investment volume The highest price per unit sales were The Bradley a 165-unit property in Alexandria which sold at $349500 per unit and The Emerson a 355-unit property in Herndon which sold at $329600 per unit
JEFFERSON FAIR OAKS
$520000
$540000
$560000
$580000
$600000
$620000
2014 2015 2016 2017 2018 2019
NoVA Average Sold Home Price
$0
$1000000000
$2000000000
$3000000000
$4000000000
$5000000000
2013 2014 2015 2016 2017 2018 2019 H1 2020
NoVA Sales Volume
2018 20192016 20172014 20152013 H1 2020
$500000$520000$540000$560000$580000$600000$620000$640000$660000
2014 2015 2016 2017 2018 2019 2020
NoVA Average Sold Home Price
2020
16
SUBURBAN MD H1 2020
SUBURBAN MARYLAND
SUBURBAN MARYLAND OVERVIEW
Suburban Maryland fared the best in terms of rent growth absorption and transaction volume compared to the other markets in Washington DC Its lower density setting may be in part responsible for its recent resilience as residents choose to relocate out of higher density urban areas
Suburban Maryland is one of the most prominent areas in the region for the Life Sciences sector and is home to the headquarters of the National Institute of Health Department of Energy the Food and Drug Administration and the National Institute of Standards and Technology The presence of biotech in the I-270 Corridor in particular has greatly benefited the commercial real estate market in office industrial and multifamily Life Sciences buildings have significantly lower vacancy rates than that of other commercial office buildings As of 2019 laboratory vacancy sits at around 50 on average while office vacancy rate in Suburban Maryland is nearly 19 Montgomery and Prince Georgersquos counties continue to be largely unique in their growth of biotech because they remain suburban areas in comparison to Life Sciences hubs such as Boston New York and San Francisco that continue to grow as urban areas
Although investment activity slowed down considerably across the region Suburban Maryland is an outlier Over $12B transacted in H1 2020 which is more than H1 2019 when $893M transacted
17
SUBURBAN MD H1 2020
2020 DELIVERIES MAP
SUBURBAN MD DELIVERIES
Deliveries slowed in Suburban Maryland with an addition of 492 units across three projects in H1 2020 The deliveries were Bainbridgersquos Bainbridge Lake Linganore a 322-unit property in Frederick NV Commercial Brick Lanersquos The Bottling Plant a 86-unit property in Outlying Frederick County and Landex Developmentrsquos Artisan 4100 an 84-unit property in Brentwood There are currently 6441 units under construction which will add a total of 35 to total inventory over the next 24 months Bethesda has the highest concentration of development activity with just over 1900 units delivering in the next 36 months Unlike other markets in the DC metro Suburban Marylandrsquos vacancy which currently stands at 36 was not largely impacted in the past six months
382274copy 2020 CBRE Inc All rights reserved This information has been obtained from sources believed reliable but has not been verified for accuracy or completeness You should conduct a careful independent investigation of the property and verify all information Any reliance on this information issolely at your own risk CBRE and the CBRE logo are service marks of CBRE Inc All other marks displayed on this document are the property of their respective owners and the use of such logos does not imply any affiliation with or endorsement of CBRE
1
2
3
HERNDONRESTON
STERLING
BALLENGER CREEK
ASPEN HILL
BETHESDA
CHILLUM
NORTH BETHESDA
ROCKVILLE
SILVER SPRING
TAKOMA PARK
TYSONS CORNER
VIENNA
WHEATON-GLENMONT
WHITE OAK
POTOMAC
MCLEAN
COLESVILLENORTH POTOMAC
IDYLWOOD
WOLF TRAP
ADELPHI
BELTSVILLE
BOWIE
CROFTONGREENBELT
HYATTSVILLELANHAM
LAUREL
ODENTONSOUTH LAUREL
CATONSVILLE
COLUMBIA
DAMASCUS
GAITHERSBURG
LINTHICUM HEIGHTS
NORTH LAURELOLNEY
PIKESVILLE
WOODLAWN
SEVERN
ARBUTUS
MONTGOMERY VILLAGE
GERMANTOWN FERNDALE
ELDERSBURG
LOCHEARN
MAYS CHAPEL
REISTERSTOWN
DUNDALK
PERRY HALL
RIVIERA BEACH
ROSEDALE
SEVERNA PARK
TOWSON
ARNOLD
ESSEX
GLEN BURNIE
PASADENA
PARKVILLE
SOUTH GATE
OVERLEANOTTINGHAM
ANNAPOLIS NECK
WASHINGTON
ANNAPOLIS
BALTIMORE
201
3
295
267
7
100
15
50
15
340
40 1
29
301
301
270
495
70
83
195
95
66
97
895
95
95
695
270395
695
WASHINGTONDULLES INTL
AIRPORT
TIPTONAIRPORT
LEE AIRPORT
BALTIMOREWASHINGTONINTL AIRPORT
MARTIN STATEAIRPORT
2020 MID ATLANTIC MULTIFAMILY DELIVERIESSUBURBAN MARYLANDMULTIFAMILY DELIVERY
sup1 0 3 615Miles
Leased 20Developer Landex Development
3 Artisan 4100Units 84
Leased 60Developer NV Commercial Brick Lane
2 Bottling PlantUnits 86
Leased 9Developer Bainbridge Companies
1 Bainbridge Lake LinganoreUnits 322Leased 9
Leased 60
Leased 20
18
-45000 -40000 -35000 -30000 -25000 -20000 -15000 -10000 -5000 0 5000
H1 2020 SubMD Employment
SUBURBAN MD H1 2020
Job Growth YoY
EMPLOYMENT
$12 BILLIONSALES IN H1 2020
5006 UNITSSOLD IN H1 2020
14 PROPERTIES
5000
4000
3000
2000
1000
0
6
5
4
3
2
1
0
VacancyUnits
Delivered Suburban MD Summary
Deliveries Net Absorption Vacancy
Year
DEVELOPMENTSUBURBAN MD BY THE NUMBERS
36
$1905
6441 UNITSUNDER CONSTRUCTION
492 UNITSDELIVERED IN 2020
STABILIZED VACANCY
PIPELINE
CLASS A AVG RENTS
CLASS B AVG RENTS
Source CBRE Research and Delta Associates
As of June 30 2020
PER UNIT PER MONTH
13773 UNITS36-MONTH PIPELINE
As the most affordable option for residents in Washington DC Suburban Maryland continues to provide job opportunities and relatively affordable living Just under 500 units delivered in H1 2020 and 100 units have been absorbed so far this year Suburban Marylandrsquos current stabilized vacancy is 36 down 30 bps from last year
CAPITAL MARKETS
Suburban Maryland experienced the YoY loss of 111400 jobs The most impacted industries were Leisure and Hospitality with a 40 decrease in employment and Education and Health Services with a loss of 15 of employees Trade and Transportation also lost just under 20000 jobs The Federal Government saw a growth of 1000 employees Unemployment in Montgomery and Prince Georgersquos counties is currently 80 and 99 respectively up from 28 and 36 respectively in January 2020
$203PER SF PER MONTH
$1591PER UNIT PER MONTH
$173PER SF PER MONTH
2014 2015 2016 2017 2018 2019 H12020
H22020
2021 2022
StateLocal Government
Federal Government
Other Services
Leisure and Hospitality
Education and Health Services
Professional and Business Services
Financial Activities
Information
Retail Trade
Wholesale Trade
Trade Transportation and Utilities
Manufacturing
Mining Logging and Construction
-35000 -25000 -15000 -5000 0 10000
00
10
20
30
40
50
60
0
500
1000
1500
2000
2500
3000
3500
4000
4500
2014 2015 2016 2017 2018 2019 H12020
H22020
2021 2022
Vacanc
y
Units
Deliveries Net Absorption Vacancy
Forecast
19
SUBURBAN MD H1 2020
SUBURBAN MD HOME PRICES
Property Year Built Sold Price Units $Unit
4701 Willard 1969 062920 $276500000 525 $526667
The Varsity 2011 032720 $146022026 258 $565977
Gallery on New Hampshire 1960 022820 $117000000 675 $173333
Montgomery Paint Branch 1984 061220 $113206000 529 $214000
Jefferson at Inigos Crossing 2008 011320 $109000000 473 $230444
LARGEST SALESSUBURBAN MD MULTIFAMILY SALES VOLUME
Class A High Rise Avg $UnitMo Avg $SFMo Vacancy YoY Rent
Change
Bethesda $2670 $293 72 31
N Bethesda Rockville $2047 $223 60 22
Silver Spring Wheaton $2012 $242 35 18
Hyattsville College Park $1867 $206 46 NA
Class B Mid-and High-Rise Avg $UnitMo Avg $SFMo Vacancy YoY Rent
Change
Silver Spring $1622 $169 920 -190
BethesdaChevy Chase $1982 $217 520 -530
Rockville $1709 $184 430 450
RENTAL RATES
$400000
$380000
$360000
$340000
$320000
2014 2015 2016 2017 2018 2019
$3000000000
$2500000000
$2000000000
$1500000000
$1000000000
$500000000
$0
Although no markets saw overall positive rent growth over the past year Suburban Maryland was the least negatively impacted region in the metro in terms of rental rates Class-A rents declined by 13 YoY to an average of $1905unitmonth or $203 per square foot Class-A vacancy currently stands at 45 Class-B rents declined 10 to an average of $1591unitmonth or $173 per square foot Class-B vacancy currently stands at 31 Overall Class-A and Class-B apartment rents fell by a total of 11 YoY to an average of $1697unitmonth or $183 per square foot
Home prices have dropped slightly in Suburban Maryland after four consecutive years of positive growth The current median home sale price is $393000 The robust effect of the Amazon announcement has spilled over into Suburban Marylandrsquos housing market as a desirable and often more affordable option than Northern Virginia Much of Suburban Maryland multifamily properties remain within the ideal 30-minute commute from large employment drivers such as Amazon HQ2 and parts of Washington DC
Investment activity was highest in Suburban Maryland as $1222570000 traded in 13 sales in the first half of 2020 Value-Add product made up a majority of transaction volume at 61 while CoreCore-Plus accounted for the remaining 39 4017 Willard was the highest sale in terms of total volume and price per unit at $267500000 and $526667 per unit
BETHESDA ROW
NORTHLAKE
$310000
$320000
$330000
$340000
$350000
$360000
$370000
$380000
$390000
$400000
2014 2015 2016 2017 2018 2019 2020
Sub MD Median Home Sales Price
2020
$0
$500000000
$1000000000
$1500000000
$2000000000
$2500000000
$3000000000
2013 2014 2015 2016 2017 2018 2019 H1 2020
Sub MD Sales Volume
2018 20192016 20172014 20152013 H1 2020
4701 WILLARD
20
BALTIMORE METRO H1 2020
BALTIMORE METRO OVERVIEW
While the Baltimore metro is performing well compared to other metros across the country the region has seen the effects of the COVID-19 pandemic with impacts to employment transaction volume rent growth and absorption rates Over 172000 jobs were lost in greater Baltimore since Q2 2019 which is a 12 decrease in total nonfarm employment The June 2020 unemployment rate in the Baltimore metro is 80 which is a 450 bps increase from January 2020 Baltimore however is considered to be better positioned than other regions to weather the current economic downturn due to its impressive resilience in previous recessions In the Global Financial Crisis Baltimore ranked sixth in terms of GDP growth and ninth in payroll job growth across the nation
Just over 2400 units delivered in the Baltimore metro in H1 2020 and 2532 units are currently under construction The average rent in Baltimore is $1759unitmonth or $185 per square foot An aggregate of $506M in sales transacted across 13 sales CBRE brokered two of the three largest transactions in H1 2020 across the Baltimore metro
BALTIMORE METRO
21
BALTIMORE METRO H1 2020
382274copy 2020 CBRE Inc All rights reserved This information has been obtained from sources believed reliable but has not been verified for accuracy or completeness You should conduct a careful independent investigation of the property and verify all information Any reliance on this information issolely at your own risk CBRE and the CBRE logo are service marks of CBRE Inc All other marks displayed on this document are the property of their respective owners and the use of such logos does not imply any affiliation with or endorsement of CBRE
1
2
3
4
5
6
7
8
91 0
CATONSVILLE
ELKRIDGE
ELLICOTT CITY
LINTHICUM HEIGHTS
PIKESVILLE
RANDALLSTOWN
WOODLAWN
SEVERN
ARBUTUS
FERNDALE
LOCHEARN
MAYS CHAPEL
MILFORD MILL
OWINGS MILLS
REISTERSTOWN
DUNDALK
MIDDLE RIVER
PERRY HALL
RIVIERA BEACH
ROSEDALE
ESSEX
GLEN BURNIE
PARKVILLE
EDGEWOODJOPPA
CARNEY
GREEN HAVEN
OVERLEA
ROSSVILLE
JOPPATOWNE
BALTIMORE
295
24
924
100
29
1
70
83
83
195
97
895
95
95
395
695 95
BALTIMOREWASHINGTONINTL AIRPORT
MARTINSTATE
AIRPORT
2020 MID ATLANTIC MULTIFAMILY DELIVERIESBALTIMORE
sup1 0 15 3075
Miles
MULTIFAMILY DELIVERY
Leased 45Developer Sid Emmer
8 The View at Mill Run Phase IIUnits 157
Developer Greystar
7 Elan TowsonUnits 208
Leased 40Developer La Cite
6 CenterWest- Phase 1AUnits 262
Developer Klein EnterprisesManekin LLC
5 The WoodberryUnits 284
Leased 35Developer AvalonBay CommunitiesRetail Properties
3 Avalon TowsonUnits 371
Leased 7Developer Wood Partners
2 Alta Brewers HillUnits 371
Leased 4Developer Chesapeake Realty Partners
4 Avenue GrandUnits 324
Leased 36Developer Howard Hughes
1 Juniper - Merriweather DistrictUnits 380
Leased 67Developer Atlantic Realty
10 The MorrisonUnits 15
Leased 10Developer Zahlco
9 9 E Mount Royal StreetUnits 65
2020 DELIVERIES MAP
BALTIMORE METRO DELIVERIES
Deliveries picked up in Baltimore throughout 2020 with the addition of 2437 units throughout the metro equating to a 12 increase in total inventory More units delivered in the first half of 2020 than were delivered in all of 2019 The largest deliveries were Howard Hughesrsquo Juniper a 380-unit property as part of the Merriweather District in Columbia Wood Partnersrsquo Alta Brewers Hill a 371-unit property in Baltimore City and Avalonbay Communitiesrsquo Avalon Towson a 371-unit property in Towson There are currently 2532 units under construction that are expected to deliver in the next 24 months The average lease-up pace for properties in Baltimore is 15 units per month
Leased 36
Leased 7
Leased 35
Leased 4
Leased 34
Leased 40
Leased 19
Leased 45
Leased 10
Leased 67
Source Yardi Matrix 2020 Source Axiometrics 2020
22
BALTIMORE METRO H1 2020
Job Growth YoY EMPLOYMENT
$506028000SALES IN H1 2020
2913 UNITSSOLD IN H1 2020
14 PROPERTIES
10000
8000
6000
4000
2000
0
7
6
5
4
3
2
0
VacancyUnits
Delivered Baltimore Metro Summary
Deliveries Net Absorption Vacancy
Year
DEVELOPMENTBALTIMORE METRO BY THE NUMBERS
500
$1759
2532 UNITSUNDER CONSTRUCTION
2437 UNITSDELIVERED IN 2020
STABILIZED VACANCY
PIPELINE
TOTAL AVG RENTS
Source CBRE Research Axiometrics and Delta Associates
As of June 30 2020
PER UNIT PER MONTH
6906 UNITS36-MONTH PIPELINE
Deliveries in Baltimore picked up with an additional 2437 units in H1 2020 Just under 2000 units were absorbed in the past 12 months most of them before the beginning of 2020 which has caused vacancy to increase in H1 2020 Across the Baltimore metro vacancy increased 80 bps to 50 In the Baltimore Suburbs vacancy stands at 44 up 10 bps YoY and in Baltimore city vacancy is 66 up 290 bps YoY
During the recent downturn Baltimore experienced a loss of 172500 jobs The most impacted sector was Leisure and Hospitality in which 45 of employees were furloughed or laid off Education and Health Services also took a loss of 30800 jobs Federal Government and Mining Logging and Construction were the only industries to see job growth with an increase of 800 employees and 3300 respectively The spike in Mining Logging and Construction may have been the result of the emergency expansion of Baltimorersquos hospitals and uninterrupted construction at existing development sites At the start of 2020 Baltimorersquos unemployment rate was 35 and is currently 95 There are currently 1253600 nonfarm employees in the Baltimore metro
CAPITAL MARKETS
$185PER SF PER MONTH
09RENT GROWTH
NORTHERN SUBURBS
-010SOUTHERN SUBURBS
-50000 -30000 -10000 0 10000-70000 -60000 -50000 -40000 -30000 -20000 -10000 0 10000
H2 2020 Baltimore Employment
2015 2016 2017 2018 2019 2020 2021 2022 2023 2024 20250
1
2
3
4
5
6
7
-2000
0
2000
4000
6000
8000
10000
Vacanc
y ()
Units
Rentable Completions(Units)
Net Absorption(Units)
Vacancy Rate(Avg )
StateLocal Government
Federal Government
Other Services
Leisure and Hospitality
Education and Health Services
Professional and Business Services
Financial Activities
Information
Retail Trade
Wholesale Trade
Trade Transportation and Utilities
Manufacturing
Mining Logging and Construction
Forecast
23
BALTIMORE METRO H1 2020
BALTIMORE METRO HOME PRICES
Property Year Built Sold Price Units $Unit
Townes at Holly Station 1985 042320 $115000000 510 $225490
Chatham Gardens 1980 041720 $83280000 414 $201159
The Point at Elkridge 1988 032720 $72500000 312 $232372
BLVD at White Springs 1977 040820 $61099000 459 $133113
Old Orchard 1986 041720 $33179940 180 $184333
LARGEST SALESBALTIMORE METRO MULTIFAMILY SALES VOLUME
Submarket Avg $UnitMo Avg $SFMo Vacancy
Annapolis $1749 $198 49
Baltimore City East $1434 $179 55
Baltimore City North $1095 $135 69
Baltimore City West $996 $125 41
ColumbiaNorth Laurel $1643 $170 44
Downtown Baltimore $1548 $189 85
Ellicott CityElkridge $1609 $167 47
Far North Baltimore Suburbs $1310 $136 29
Northeast Anne Arundel County $1374 $157 42
Northwest Anne Arundel County $1720 $172 51
Owings MillsPikesvilleRandallstown $1365 $132 45
ParkvilleCarneyPerry Hall $1164 $135 36
Southeast Baltimore County $1097 $132 38
Southwest Baltimore County $1172 $131 45
TowsonHunt Valley $1390 $140 53
RENTAL RATES - ALL PRODUCT TYPES
$3000000000
$2500000000
$2000000000
$1500000000
$1000000000
$500000000
$0
2014 2015 2016 2017 2018 2019
$255000
$250000
$245000
$240000
$235000
$220000
$205000
Rent growth in the Baltimore metro remained largely flat since June 2019 The Northern Baltimore Suburbs experienced 09 rent growth the Southern Baltimore Suburbs experienced a drop of 01 rent growth and Baltimore City rents fell by 30 The Baltimore suburbs outpaced Baltimore City in terms of rent growth and absorption Current vacancy in the Baltimore metro is 50 with the highest vacancies in Downtown Baltimore at 85 Baltimore City North at 69 and Baltimore City East at 55 According to Delta Reports the Howard CountyColumbia submarket fared the best in the metro with 27 YoY rent growth
Home values in the Baltimore metro increased 20 YoY up slightly from the five-year average growth rate of 15 The current median sales price in the Baltimore metro is $251000 Single-family homes in Baltimore County posted a 10-year high median sale price of $330000 This is a 6 YoY increase from June 2019 Homes in Baltimore City also posted a 10-year high median sale price of $238000 Of note Owings Mills experienced a 27 YoY increase in median home value for an average of $415000
Investment activity reached $506M in the Baltimore metro during the first two quarters of 2020 in 14 transactions All but one sale was value-add product The highest sales in terms of price per unit were Point at Elkridge a 312-unit property in Elkridge which sold for $232400 per unit and Townes at Holly Station a 510-unit property in Waldorf which sold for $225500 per unit CBRE brokered both sales
TOWNES AT HOLLY STATION
$215000
$220000
$225000
$230000
$235000
$240000
$245000
$250000
2014 2015 2016 2017 2018 2019
Baltimore Metro Median Sale Price
$0
$500000000
$1000000000
$1500000000
$2000000000
$2500000000
$3000000000
2013 2014 2015 2016 2017 2018 2019 H1 2020
Balitmore Metro Sales Volume
2018 20192016 20172014 20152013 H1 2020
$210000$215000$220000$225000$230000$235000$240000$245000$250000$255000
2014 2015 2016 2017 2018 2019 2020
Baltimore Metro Median Sale Price
2020
24
FOR SALES OR FINANCING INFORMATION CONTACT
William S RoohanVice Chairman(O) +1 410 244 3122(M) +1 443 690 6967billroohancbrecom
Michael E MuldowneyExecutive Vice President(O) +1 410 244 3144(M) +1 443 250 3144mikemuldowneycbrecom
Robert G Dean IIISenior Vice President(O) +1 202 585 5766(M) +1 202 578 6941robertdeancbrecom
Jonathan M GreenbergSenior Vice President(O) +1 703 734 4772(M) +1 202 423 6655jonathangreenbergcbrecom
Martha A HastingsSenior Vice President(O) +1 410 244 3162(M) +1 410 807 2450marthahastingscbrecom
Brian H MargerumSenior Vice President(O) +1 410 244 3135(M) +1 443 386 1096brianmargerumcbrecom
Michael D RudolphSenior Vice President(O) +1 410 244 3121(M) +1 443 928 0392michaelrudolphcbrecom
John T Sheridan JrSenior Vice President(O) +1 703 905 0239(M) +1 703 200 7720johnsheridancbrecom
Yalda G HowellFirst Vice President(O) +1 202 585 5677(M) +1 240 462 2332yaldaghamariancbrecom
Thomas B LeachmanVice President(O) +1 202 585 5638(M) +1 240 688 0189thomasleachmancbrecom
Kemp D BroujosSenior Associate(O) +1 202 585 5724(M) +1 443 786 2951kempbroujoscbrecom
Nathan E BarthAssociate(O) +1 703 905 0228(C) +1 703 340 6828nathanbarthcbrecom
Zachary L StoneSales Assistant(O) +1 202 585 5650 (M) +1 202 713 8404zachstonecbrecom
Investment Sales amp Brokerage
Operations amp Marketing
Debt amp Structured Finance Team
Patricia C BonebrakeSenior Director of Operations(O) +1 410 244 3141(C) +1 443 253 5917trishbonebrakecbrecom
Jennifer W BusseyOperations Manager(O) +1 410 244 3134(C) +1 410 300 1302jenniferbusseycbrecom
Cheryl FinlaysonProductions Systems Manager(O) +1 410 244 7100(C) +1 410 244 3101cherylfinlaysoncbrecom
Margaret O MacleayOperations Supervisor(O) +1 202 585 5638(C) +1 410 562 9340maggiemacleaycbrecom
Rachel L MossmanSenior Communications Specialist(O) +1 410 244 3179(C) +1 410 244 7100rachelmossmancbrecom
Samantha S FifieldSales Assistant(O) +1 202 585 5773(C) +1 310 266 0003samanthafifieldcbrecom
Caroline P LekakosClient Services Coordinator(O) +1 202 585 5606(C) +1 240 595 0642carolinelekakoscbrecom
Yasmeen F ShararaClient Services Coordinator(O) +1 202 585 5580(C) +1 301 828 7435yasmeenshararacbrecom
Lauren E SpielmanClient Services Coordinator(O) +1 410 244 3129(C) +1 443 800 4388laurenspielmancbrecom
Grace F TrimbleClient Services Coordinator(O) +1 410 244 3123(C) +1 410 499 1064gracetrimblecbrecom
David F WebbVice Chairman(O) +1 202 585 5721(M) +1 202 744 4900davidwebbcbrecom
Maximiliane T LeachmanExecutive Vice President(O) +1 202 585 5655(M) +1 404 358 4317maxileachmancbrecom
Justin J GlasgowSenior Vice President(O) +1 202 783 1723(M) +1 202 316 1804justinglasgowcbrecom
RESEARCH TEAM
JEANETTE I RICE Americas Head of Multifamily Research (O) +1 214 979 6169
(C) +1 817 412 0709 jeanettericecbrecom
MOLLY M HUNT Research Analyst (O) +1 202 585 5597(C) +1 415 599 6009 mollyhuntcbrecom
RANK
1Fortune Magazinersquos
Most Admired Commercial Real Estate
Firm
REPUTATION
2Ranked the 2
Multifamily Brokerage Team in the entire nation by
Real Estate Forum
THE CBRE TEAM COMPETITIVE ADVANTAGE
25
RESOURCES
26Largest team and most
capacity in the Mid-Atlantic region
EXPERIENCE
$174B+The aggregate sales
value of deals our team has brokered since
2015
DEBT TEAM
1The CBRE Debt amp
Structured Finance Team is the 1 Freddie Mac
SellerServicer
copy Copyright 2020 All rights reserved Information contained herein including projections has been obtained from sources believed to be reliable but has not been verified for accuracy or completeness CBRE Inc makes no guarantee warranty or representation about it Any reliance on such information is solely at your own risk This information is exclusively for use by CBRE clients and professionals and may not be reproduced without the prior written permission of CBRErsquos Global Chief Economist CBRE and the CBRE logo are service marks of CBRE Inc andor its affiliated or related companies in the United States and other countries All other marks displayed on this document are the property of their respective owners Photos herein are the property of their respective owners Use of these images without the express written consent of the owner is prohibited
WASHINGTON DC1900 N Street NW
Suite 700 Washington DC 20036
+1 (202) 783 8200
BALTIMORE MD100 East Pratt Street
Suite 1700Baltimore MD 21202+1 (410) 244 7100
TYSONS VA1861 International Drive
Suite 300McLean VA 22102+1 (703) 821-6900
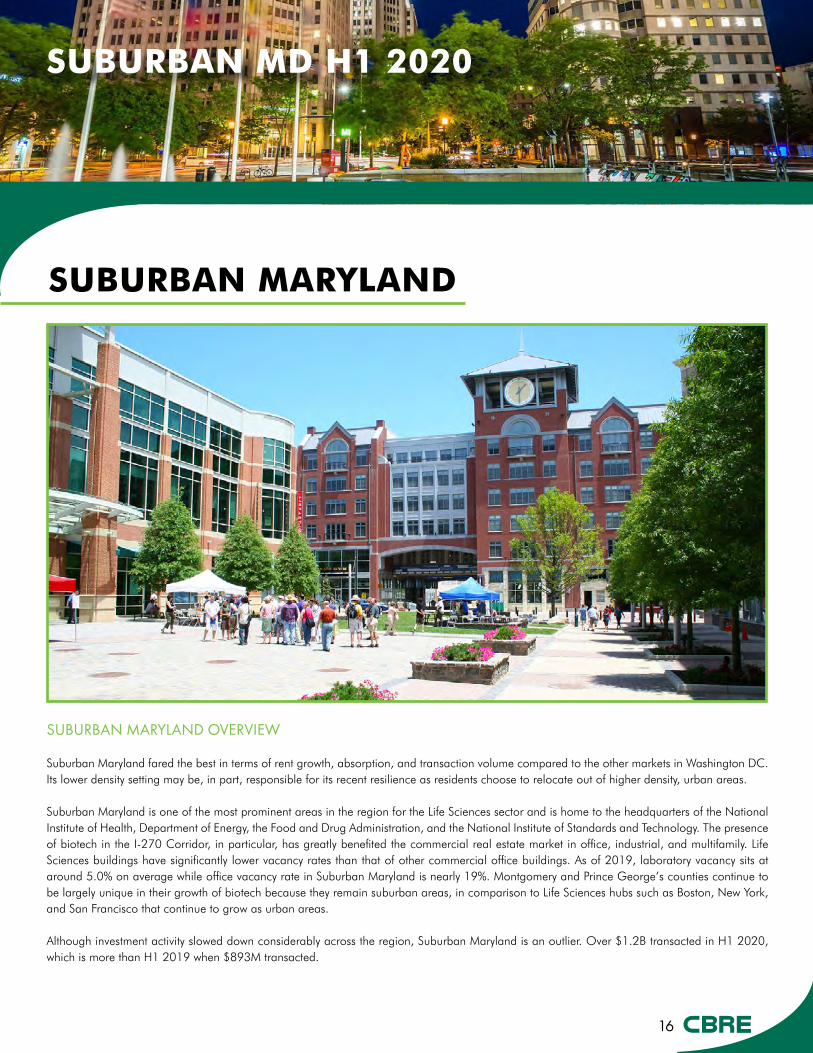
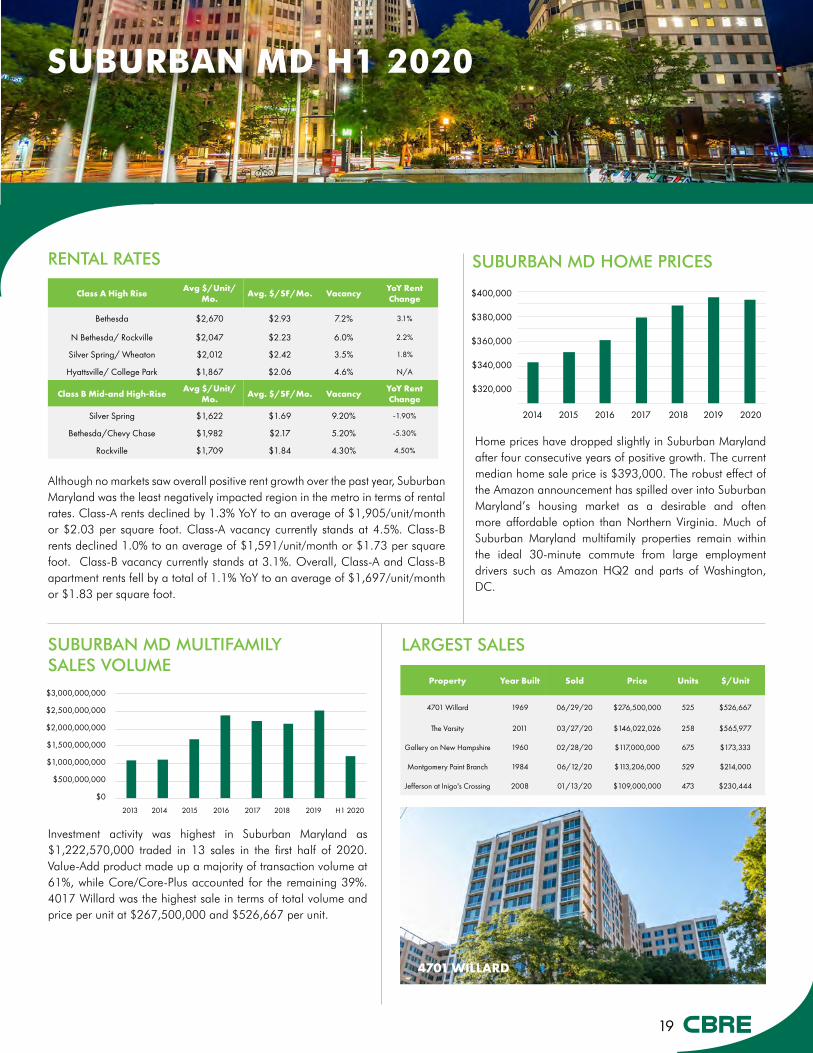