Embed Size (px)
Citation preview
DRAFT ONONDAGA LAKECAPPING AND DREDGE AREA AND DEPTH
INITIAL DESIGN SUBMITTAL
Parsons P:\Honeywell -SYR\444576 2008 Capping\09 Reports\9.3 December 2009_Capping and Dredge Area & Depth IDS\Capping IDS.doc 12/10/2009
H.2
LIQUEFACTION POTENTIAL ANALYSES
Page 1 of 48
Written by: R. Kulasingam Date: 08/20/2008 Reviewed by: Ming Zhu/Jay Beech Date: 08/20/2008
Client: Honeywell Project: Onondaga Lake ILWD Stability Project/ Proposal No.: GD4014 Task No.: 02
GA080480.Appendix C.RTC-V4.doc
LIQUEFACTION POTENTIAL ANALYSES
INTRODUCTION
This calculation package was prepared as part of the In-Lake Waste Deposit (ILWD) geotechnical stability evaluation for the Onondaga Lake Bottom Site. Specifically, the purpose of this package is to present liquefaction potential analyses for the ILWD area. The ILWD area consists of Sediment Management Unit (SMU) 1 and limited portions of SMUs 2, 7, and 8. Liquefaction potential of the Solvay Waste (SOLW) and the underlying soils was evaluated for existing conditions.
Since the details of the isolation cap are currently being developed, the evaluation of the capped condition is not explicitly included herein. The liquefaction potential evaluation of the existing SOLW and underlying soils will not be affected by the installation of a cap (anticipated to be approximately 3-ft thick) at slopes that are similar to existing conditions, and therefore will not need to be updated for post-capping conditions. However, liquefaction potential of the cap itself will be addressed during the Intermediate Capping Design.
The remainder of this calculation package presents: (i) technical framework; (ii) subsurface stratigraphy and material properties; (iii) methodology; (iv) results; and (v) conclusions.
TECHNICAL FRAMEWORK
A technical framework for the proposed liquefaction evaluation is presented in this section. Defining a framework is important because the term “liquefaction” is used to describe a variety of phenomena in the literature. A description of the different liquefaction mechanisms and liquefaction potential evaluation procedures are presented in the following sections.
Liquefaction Mechanisms
Kramer [1996] writes the following about the term “liquefaction”:
Page 2 of 48
Written by: R. Kulasingam Date: 08/20/2008 Reviewed by: Ming Zhu/Jay Beech Date: 08/20/2008
Client: Honeywell Project: Onondaga Lake ILWD Stability Project/ Proposal No.: GD4014 Task No.: 02
GA080480.Appendix C.RTC-V4.doc
“The term liquefaction……has historically been used in conjunction with a variety of phenomena that involve soil deformations caused by monotonic, transient, or repeated disturbance of saturated cohesionless soils under undrained loading conditions. The generation of excess pore pressure under undrained loading conditions is a hallmark of all liquefaction phenomena”.
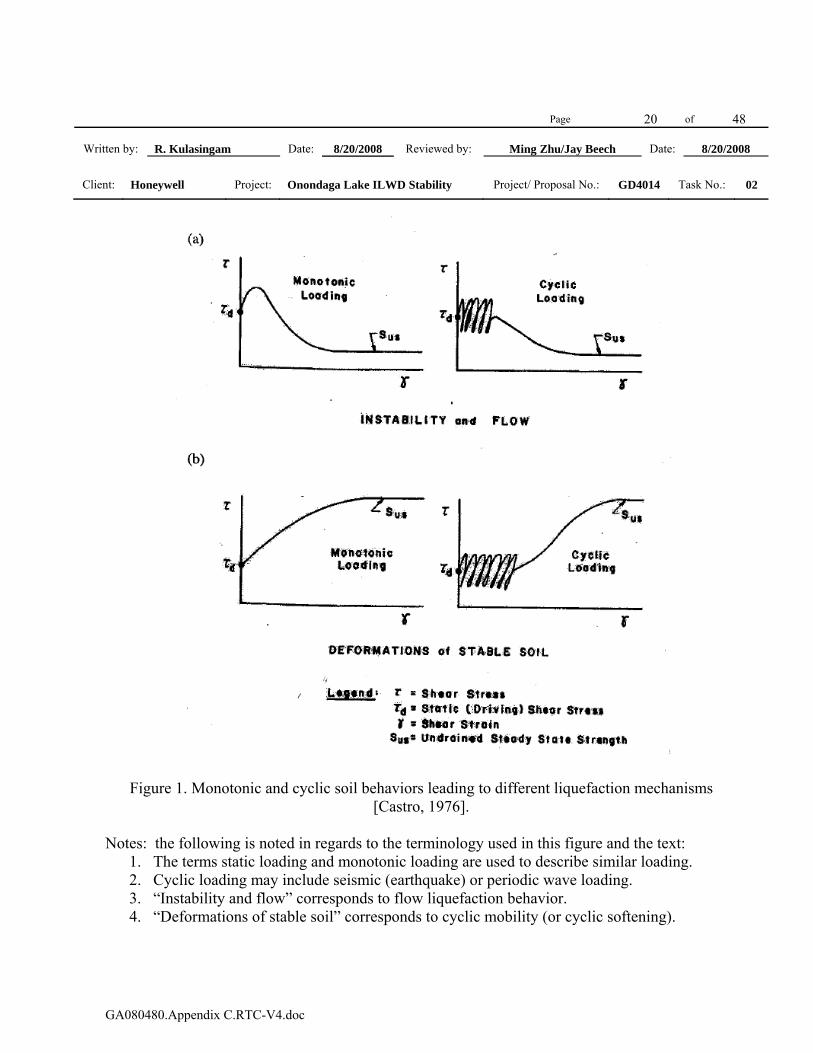
Generally liquefaction phenomena can be divided into two main groups: (i) flow liquefaction (or true liquefaction); and (ii) cyclic mobility (or cyclic liquefaction). These two types of “liquefaction” phenomena are illustrated in Figure 1 and explained in the following paragraphs.
Flow liquefaction can occur when the shear stress required for static equilibrium of a soil mass (static shear stress, τd in Figure 1) is greater than the shear strength of the soil in its liquefied state (Sus in Figure 1). The shear strength of the soil in its liquefied state is also referred to as the undrained steady state shear strength or residual undrained shear strength in the literature. This shear strength is less than the peak shear strength for strain softening soils and is the same as the peak shear strength for strain hardening soils. Deformations produced by flow liquefaction are driven by static shear stresses and can be very large [Kramer 1996]. Flow liquefaction can be initiated by seismic loading, vibrations such as pile driving, geophysical exploration, blasting, and/or monotonic loading (static liquefaction). Flow liquefaction stress paths due to monotonic loading and cyclic loading are illustrated in Figure 1(a). The above discussion about flow liquefaction is generally applicable to cohesionless soils and soils with low plasticity. The term liquefaction is not generally used for cohesive soils that show “clay-like” behavior. However, undrained shear strength of sensitive clays or cemented soils can reduce from their undisturbed undrained shear strength to remolded undrained shear strength when disturbed and show a “flow liquefaction”-like behavior.
Cyclic mobility can be initiated by cyclic loading (i.e., seismic or periodic wave loading) resulting in the development of incremental deformations during loading [Kramer 1996]. It can occur when the static shear stress is less than the shear strength of the liquefied soil, and it will not result in flow liquefaction, which is discussed in the previous paragraph. However, if the static shear stress is greater than the shear strength of the liquefied soil, cyclic mobility can act as a trigger to push the stress path past the peak shear strength and lead to flow liquefaction. Conversely, if cyclic loading is not strong enough to trigger cyclic mobility, flow liquefaction is not likely to occur under that same loading. Cyclic mobility stress path due to cyclic loading is illustrated in Figure 1(b). Monotonic
Page 3 of 48
Written by: R. Kulasingam Date: 08/20/2008 Reviewed by: Ming Zhu/Jay Beech Date: 08/20/2008
Client: Honeywell Project: Onondaga Lake ILWD Stability Project/ Proposal No.: GD4014 Task No.: 02
GA080480.Appendix C.RTC-V4.doc
loading stress paths for the same soil are also provided in this figure to illustrate that the soil deforming due to cyclic mobility still has shear strength to resist shear stresses.
While the term cyclic mobility or cyclic liquefaction is generally used for cohesionless soils and soils with low plasticity, the term cyclic softening is used to describe the behavior of silty and clayey soils during earthquakes [Boulanger and Idriss, 2007].
Liquefaction Potential Evaluation Procedures
The state-of-practice for evaluating the liquefaction potential does not explicitly account for different liquefaction mechanisms. State-of-practice procedures are mainly based on case histories of occurrences and non-occurrences of liquefaction due to past earthquakes. Occurrences (or non-occurrences) of liquefaction are determined by presence (or absence) of surface manifestations of liquefaction such as sand boils, ground cracking, slope movements, and/or flow failures. Surface manifestations are generally present if high pore pressures are generated due to seismic loading and “liquefaction” is triggered. Therefore, if soils at a particular site are deemed to be not susceptible to liquefaction based on methods used in state-of-practice, further analyses such as post-liquefaction slope stability or flow liquefaction are not needed for seismic loading.
An initial step in performing a liquefaction potential evaluation is application of screening criteria based on geotechnical properties to evaluate whether subsurface materials are potentially liquefiable. Seismic loading is not considered in this screening evaluation. In general, soils that show “clay-like” behavior are not susceptible to liquefaction. Boulanger and Idriss [2007] proposed a procedure to evaluate the potential for cyclic softening of silty and clayey soils based on undrained static shear strengths and seismic loading. The screening criteria and the Boulanger and Idriss [2007] procedure to evaluate cyclic softening basically evaluate the potential for significant pore pressure increase due to seismic loading, and therefore cover all forms of “liquefaction” due to seismic loading.
The state-of-practice for liquefaction analysis for cohesionless soils is based on empirical correlations based on insitu soil tests such as Standard Penetration Tests (SPT) or Cone Penetration Tests (CPT). The effect of seismic loading is considered in this approach. This procedure was developed based on field case histories where evidence of liquefaction was or was not observed after earthquakes, and, therefore, covers all forms of “liquefaction” due to seismic loading.
Page 4 of 48
Written by: R. Kulasingam Date: 08/20/2008 Reviewed by: Ming Zhu/Jay Beech Date: 08/20/2008
Client: Honeywell Project: Onondaga Lake ILWD Stability Project/ Proposal No.: GD4014 Task No.: 02
GA080480.Appendix C.RTC-V4.doc
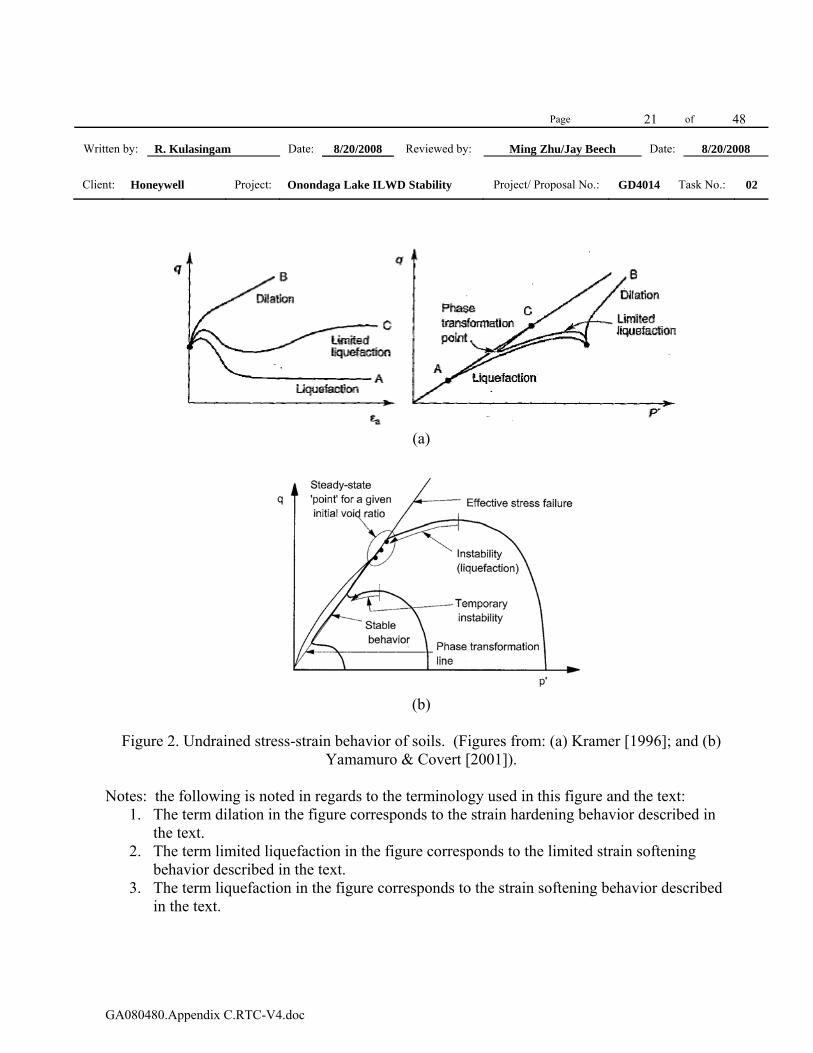
In addition to the state-of-practice based methods, potential for flow liquefaction or sensitivity for loss of shear strength can be directly evaluated for soils based on stress-strain behavior during laboratory tests such as undrained triaxial tests. A pronounced strain softening behavior where the shear strength peaks at relatively low strains and then drops significantly to reach a steady state or residual value may be an indication of the potential to liquefy under certain conditions. On the other hand, a strain hardening behavior where the shear strength keeps increasing as the soil is strained or a limited strain softening behavior where the shear strength peaks and then drops slightly to reach a steady value indicates that flow liquefaction or sensitivity is not an issue. These three types of soil behavior are illustrated in Figure 2. It is noted that liquefaction due to cyclic mobility may still be triggered in a strain hardening soil depending on the acceleration and magnitude of the seismic loading.
SUBSURFACE STRATIGRAPHY AND MATERIAL PROPERTIES
Subsurface soils in the ILWD area consist of primarily seven strata (from top to bottom): (i) SOLW; (ii) marl; (iii) silt and clay; (iv) silt and sand; (v) sand and gravel; (vi) till; and (vii) shale. Standard Penetration Tests (SPT) were conducted in most of the borings to measure the SPT blow count values. Samples of SOLW, marl, and silt and clay were collected during the investigations for laboratory testing of index properties, shear strength, and compressibility. A detailed description of the development of the subsurface model and geotechnical parameters is presented in Appendix A titled “Summary of Subsurface Stratigraphy and Material Properties”.
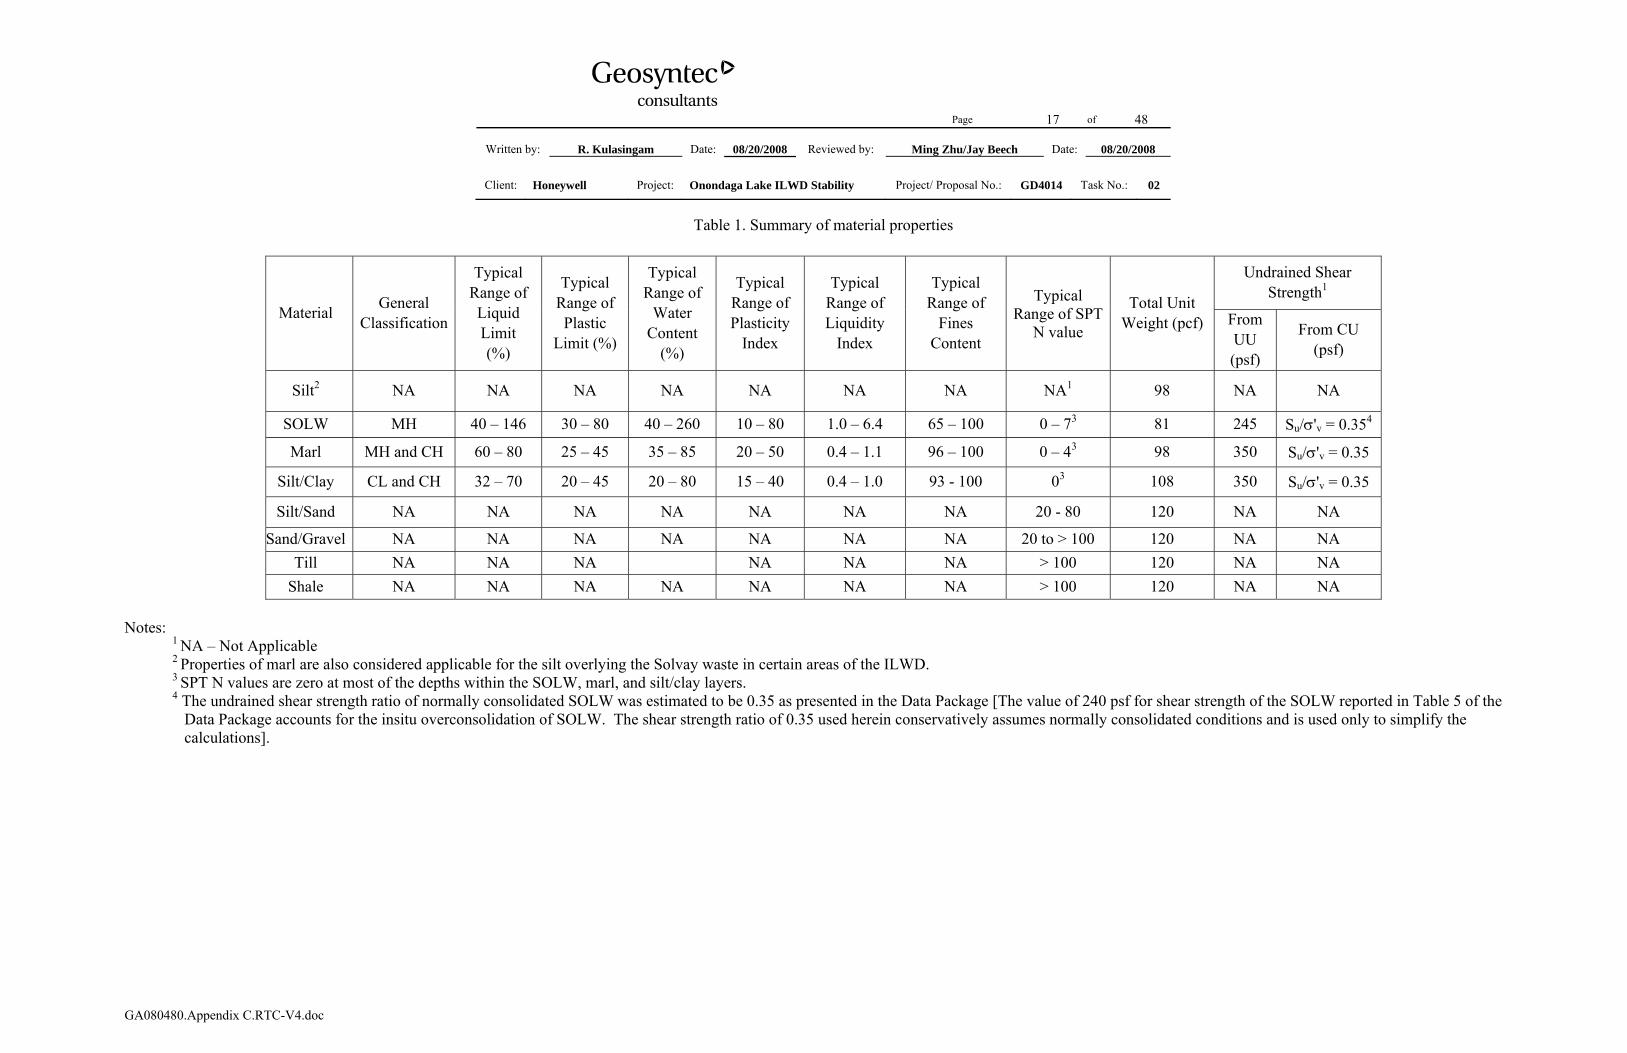
SOLW, marl, and silt and clay units can be classified as mainly MH, MH and CH, and CL and CH type material based on the Unified Soil Classification System (USCS). SPT values for SOLW, marl, and silt and clay mainly ranged from 0 to 7 (with most of the reported blow counts being 0). Plasticity index values for SOLW mainly ranged from 10 to 80. Most of the SOLW samples had water contents that were higher than their liquid limits. However, under laboratory undrained shearing, 12 out of 17 SOLW samples (two to three specimens were tested for each sample) showed strain hardening ductile behavior. Out of the remaining five samples, three showed limited strain-softening behavior and two showed gradual strain softening behavior. Based on laboratory triaxial test results, an undrained shear strength ratio of 0.35 for SOLW, marl, and silt and clay were selected to model the shear strength under undrained conditions. SPT values for the deeper soil layers mainly ranged from 20 to 100. Table 1 summarizes the material properties of each subsurface layer (i.e., SOLW and soils).
Page 5 of 48
Written by: R. Kulasingam Date: 08/20/2008 Reviewed by: Ming Zhu/Jay Beech Date: 08/20/2008
Client: Honeywell Project: Onondaga Lake ILWD Stability Project/ Proposal No.: GD4014 Task No.: 02
GA080480.Appendix C.RTC-V4.doc
METHODOLOGY The liquefaction potential evaluation methodology used for the ILWD area is presented in this section. Screening criteria, Boulanger and Idriss [2007] evaluation procedure for “cohesive” soils, and Seed and Idriss [1971] evaluation procedure for “cohesionless” soils are applied to evaluate the potential for triggering liquefaction. In addition, the potential for flow liquefaction and/or sensitive behavior is directly evaluated for SOLW using stress paths observed in static triaxial tests. This evaluation is described in the following five steps:
1. A general screening is conducted to assess the liquefaction potential of the ILWD. Several screening criteria are used in state-of-practice for evaluating the liquefaction potential of cohesive soils (generally soils that can be classified as ML, CL, MH, CH or combinations of these). These screening criteria are developed from actual field evidence of both liquefaction and no liquefaction in different soil types and supplemental laboratory studies. These criteria cover both flow and cyclic liquefaction due to seismic loading. The following three criteria were used in the screening evaluation presented in this calculation package:
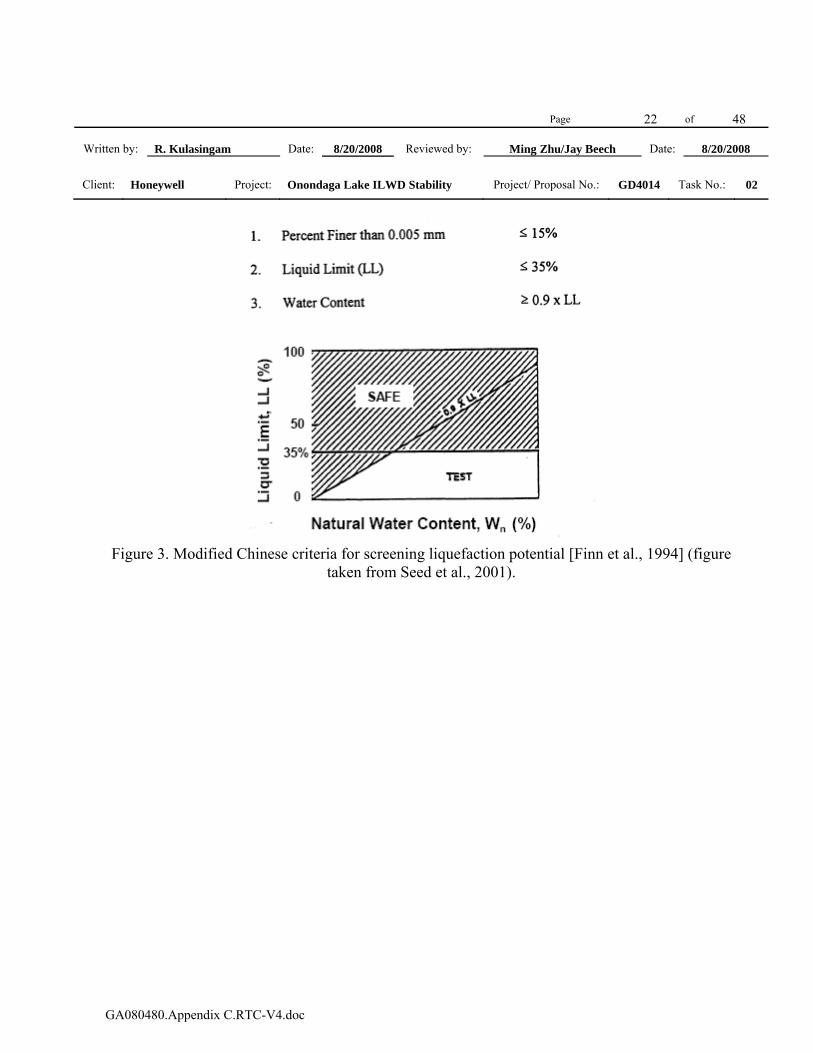
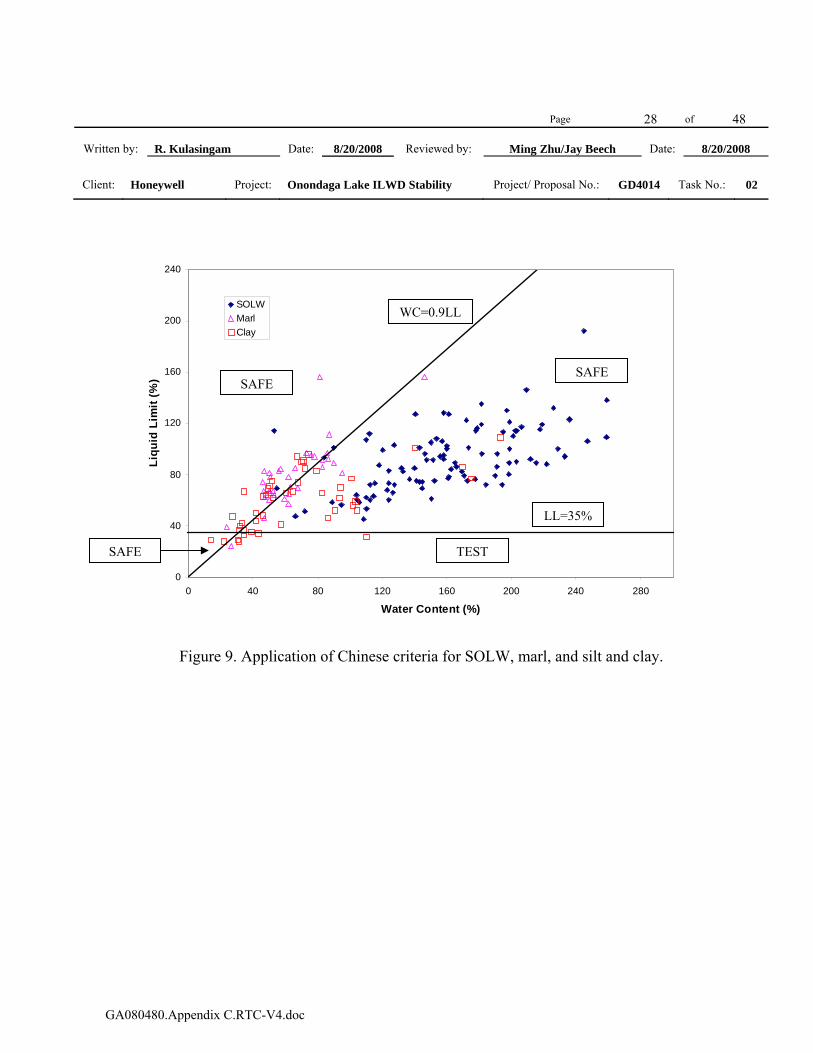
a. Chinese criteria [Wang 1979] has been widely used for the past two decades in US engineering practice to screen liquefaction potential of soils. Soil is considered susceptible if all three of the following conditions are met:
- percent finer than 0.005 mm ≤ 15%
- Liquid Limit ≤ 35%
- Water Content ≥ 0.9 x Liquid Limit
Figure 3 presents these criteria in a chart format.
Page 6 of 48
Written by: R. Kulasingam Date: 08/20/2008 Reviewed by: Ming Zhu/Jay Beech Date: 08/20/2008
Client: Honeywell Project: Onondaga Lake ILWD Stability Project/ Proposal No.: GD4014 Task No.: 02
GA080480.Appendix C.RTC-V4.doc
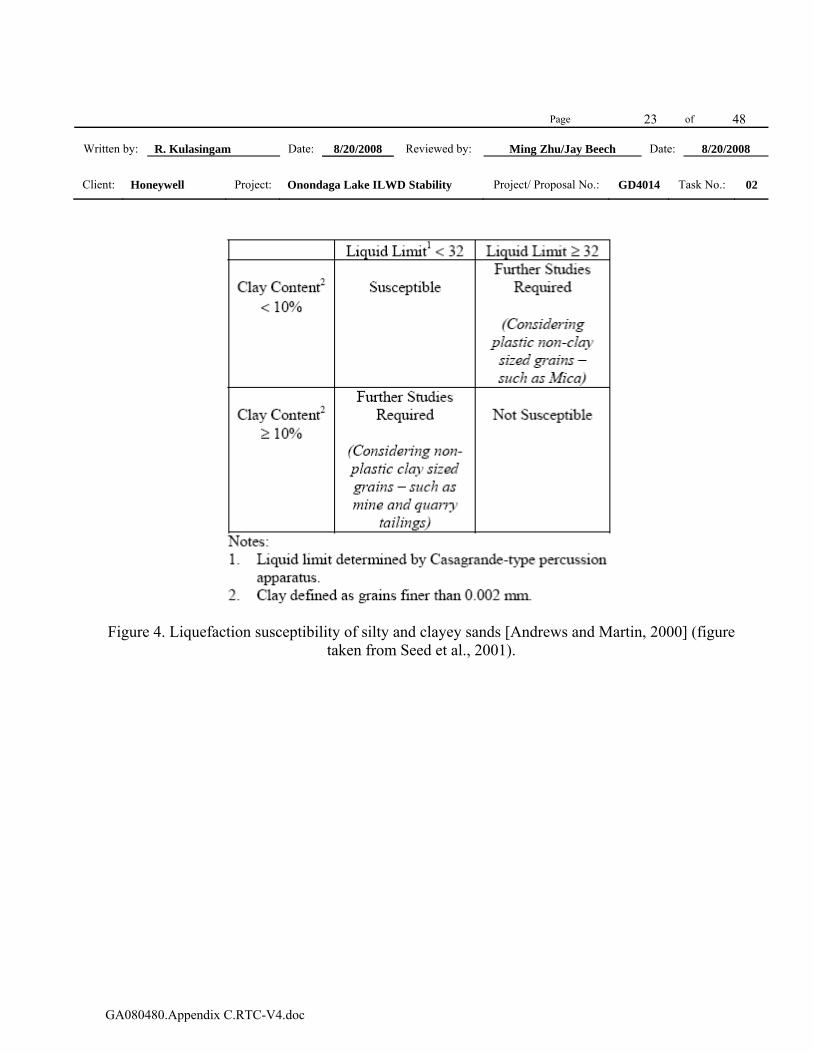
b. Andrews and Martin [2000] presented screening criteria to evaluate the liquefaction susceptibility of silty and clayey sands. These criteria are based on clay fraction (minus 0.002 mm) and Liquid Limit of soils. Figure 4 presents these criteria in a tabular form.
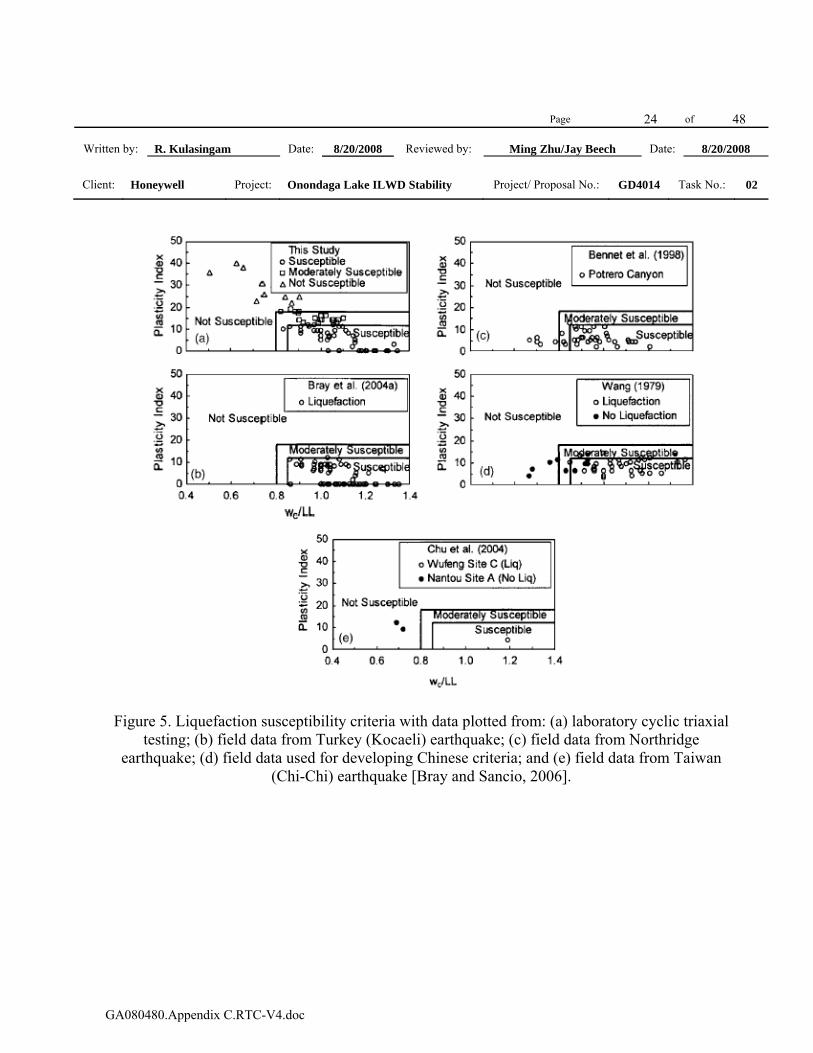
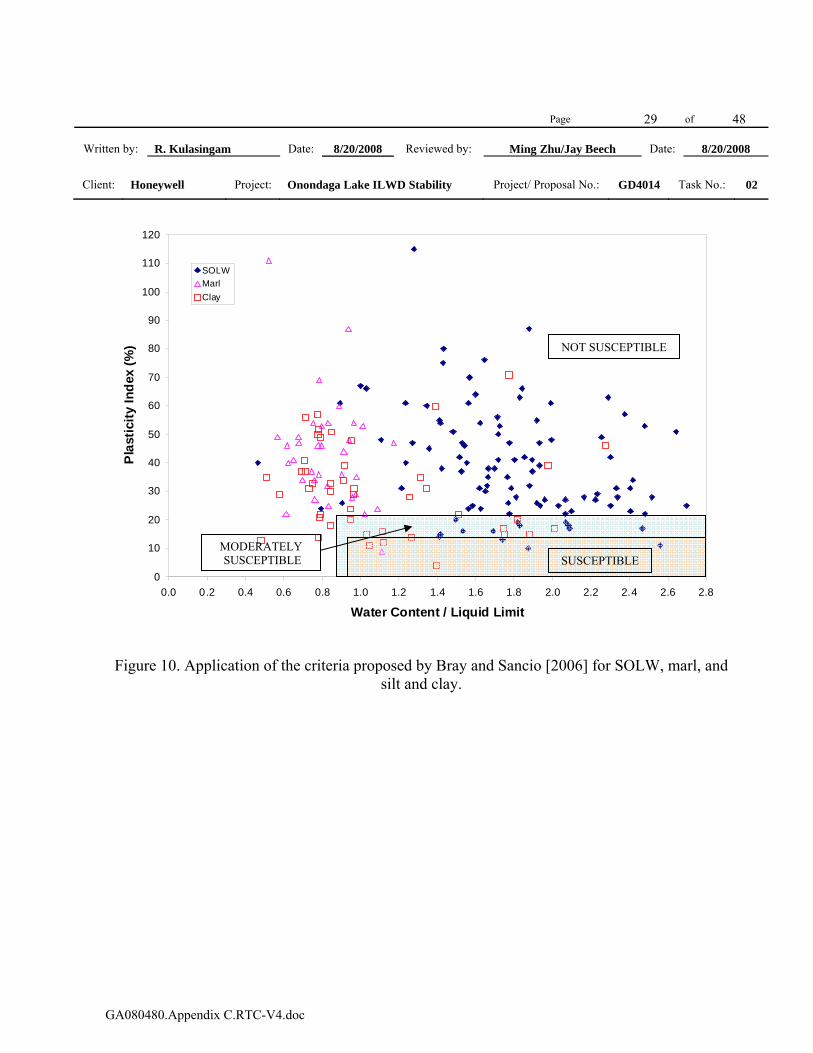
c. Bray and Sancio [2006] evaluated several case histories and performed laboratory cyclic triaxial tests to develop screening criteria based on water content, Liquid Limit, and Plasticity Index. These criteria and the data used to develop them are shown in Figure 5.
2. Cyclic stresses caused by seismic loading within soil units need to be evaluated for liquefaction analyses. The cyclic stresses on the soils are calculated as follows to evaluate the liquefaction potential for “cohesive” soils and “cohesionless” soils described below in steps 3 and 4, respectively.
a. Design bedrock acceleration for a contingency level seismic event (i.e., a seismic event with a 10 percent chance of exceedance in 50 years) was established using United States Geological Survey (USGS) seismic hazard maps [USGS, 2008].
b. The design earthquake magnitude was established using deaggregated seismic hazard provided by USGS. Deaggregation is done to identify the earthquake that is contributing the most to the total hazard at the site.
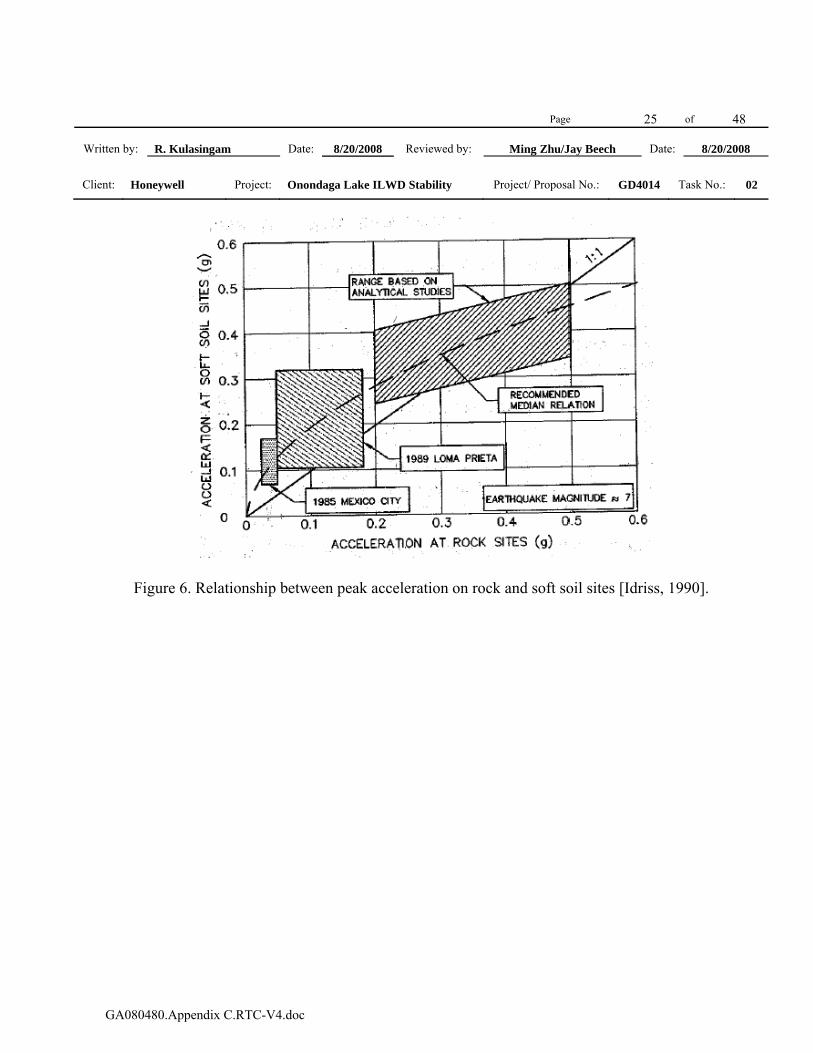
c. Maximum ground surface acceleration for the contingency level seismic event was estimated by considering potential for amplification using the chart proposed by Idriss [1990] for soft soil sites. This chart is presented in Figure 6. Application of this chart in lieu of site response analyses based on time histories is generally considered to be conservative.
d. Cyclic Stress Ratio (CSR) was evaluated using the simplified procedure proposed by Seed and Idriss [1971]. The steps involved and equations used are described below.
′=0
0max65.0v
vdM g
arCSRσ
σ
Page 7 of 48
Written by: R. Kulasingam Date: 08/20/2008 Reviewed by: Ming Zhu/Jay Beech Date: 08/20/2008
Client: Honeywell Project: Onondaga Lake ILWD Stability Project/ Proposal No.: GD4014 Task No.: 02
GA080480.Appendix C.RTC-V4.doc
Where:
CSRM = Cyclic Stress Ratio due to an earthquake with magnitude M;
rd = stress reduction factor;
amax = maximum ground surface acceleration;
g = gravitational acceleration;
σv0 = total vertical stress; and
σv0′ = effective vertical stress.
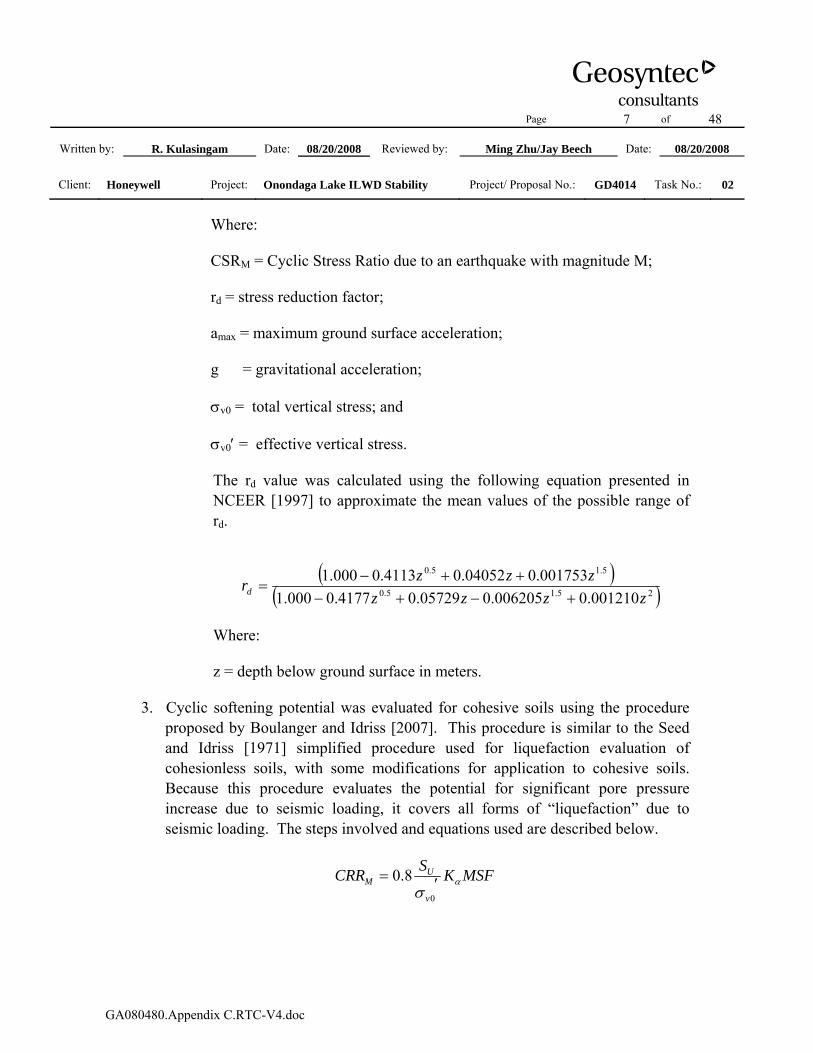
The rd value was calculated using the following equation presented in NCEER [1997] to approximate the mean values of the possible range of rd.
( )
( )25.15.0
5.15.0
001210.0006205.005729.04177.0000.1001753.004052.04113.0000.1
zzzzzzzrd +−+−
++−=
Where:
z = depth below ground surface in meters.
3. Cyclic softening potential was evaluated for cohesive soils using the procedure proposed by Boulanger and Idriss [2007]. This procedure is similar to the Seed and Idriss [1971] simplified procedure used for liquefaction evaluation of cohesionless soils, with some modifications for application to cohesive soils. Because this procedure evaluates the potential for significant pore pressure increase due to seismic loading, it covers all forms of “liquefaction” due to seismic loading. The steps involved and equations used are described below.
MSFKSCRRv
UM α
σ ′=0
8.0
Page 8 of 48
Written by: R. Kulasingam Date: 08/20/2008 Reviewed by: Ming Zhu/Jay Beech Date: 08/20/2008
Client: Honeywell Project: Onondaga Lake ILWD Stability Project/ Proposal No.: GD4014 Task No.: 02
GA080480.Appendix C.RTC-V4.doc
Where:
CRRM = Cyclic Resistance Ratio for an earthquake with magnitude M;
SU = static undrained shear strength;
kα = correction factor for driving static shear stresses; and
MSF = Magnitude Scaling Factor.
The kα is a function of the driving static shear stresses or slope angle. For the mild overall slopes of the ILWD area ranging from three to five degrees, kα can be assumed to be one.
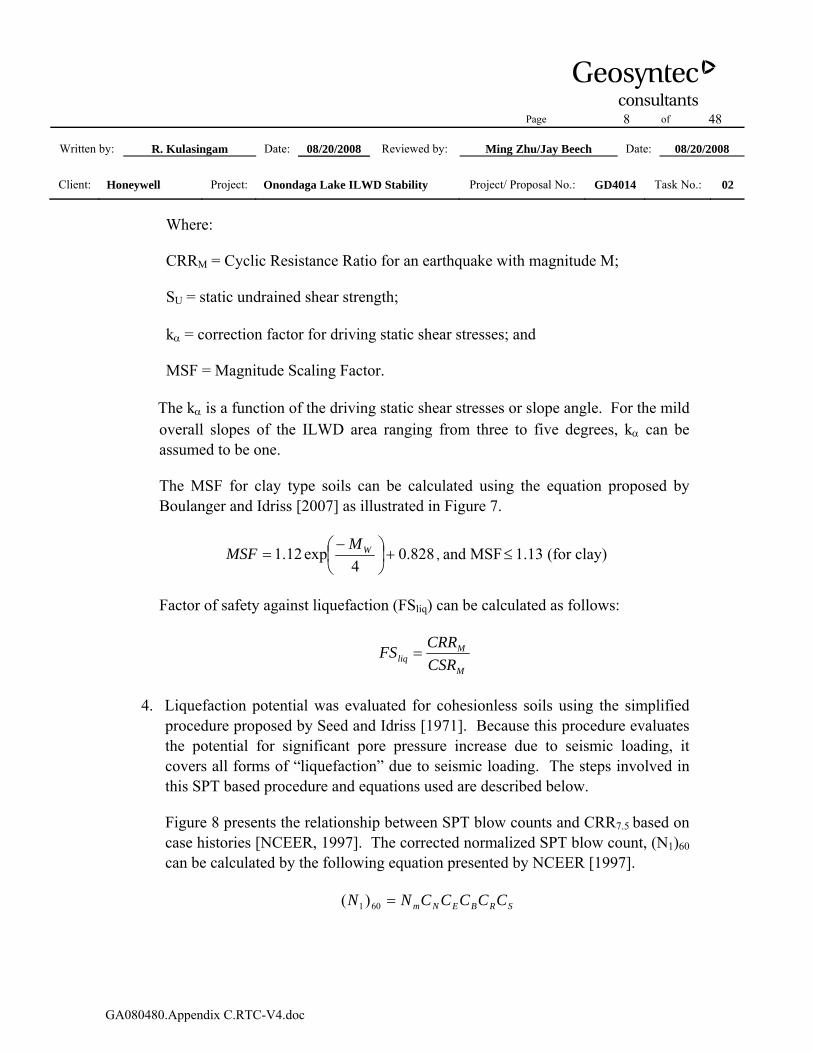
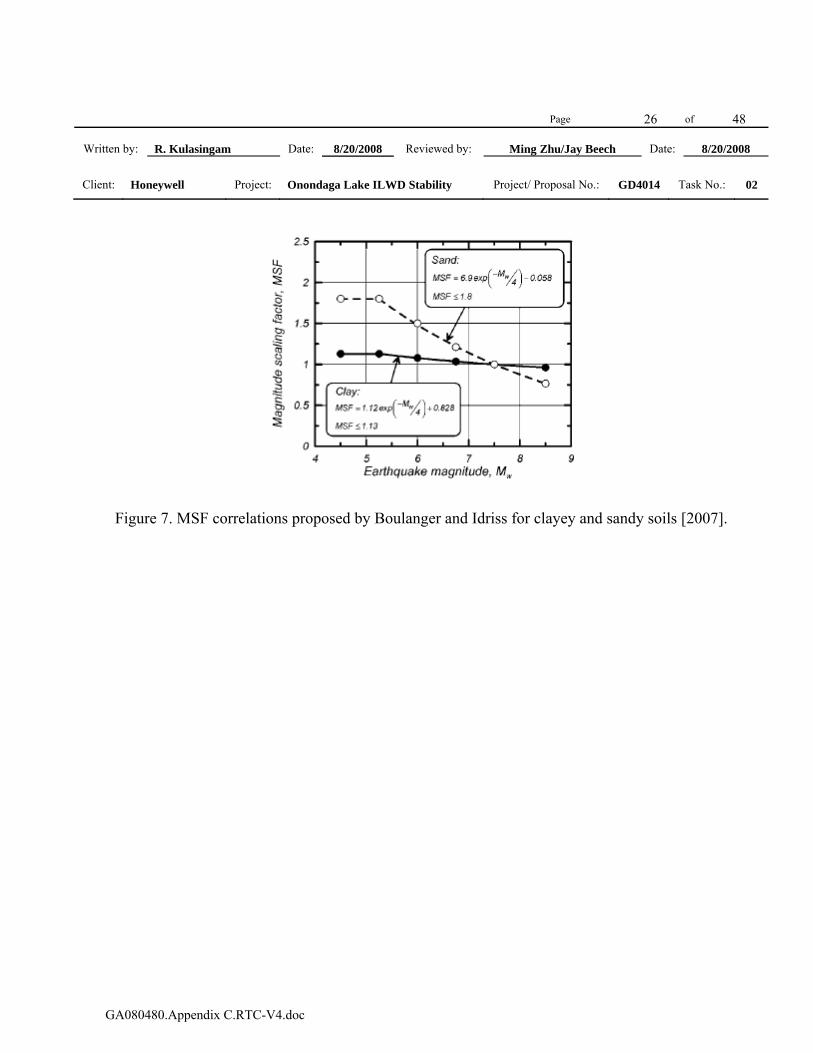
The MSF for clay type soils can be calculated using the equation proposed by Boulanger and Idriss [2007] as illustrated in Figure 7.
828.04
exp12.1 +⎟⎠⎞
⎜⎝⎛ −= WMMSF , and MSF≤1.13 (for clay)
Factor of safety against liquefaction (FSliq) can be calculated as follows:
M
Mliq CSR
CRRFS =
4. Liquefaction potential was evaluated for cohesionless soils using the simplified
procedure proposed by Seed and Idriss [1971]. Because this procedure evaluates the potential for significant pore pressure increase due to seismic loading, it covers all forms of “liquefaction” due to seismic loading. The steps involved in this SPT based procedure and equations used are described below.
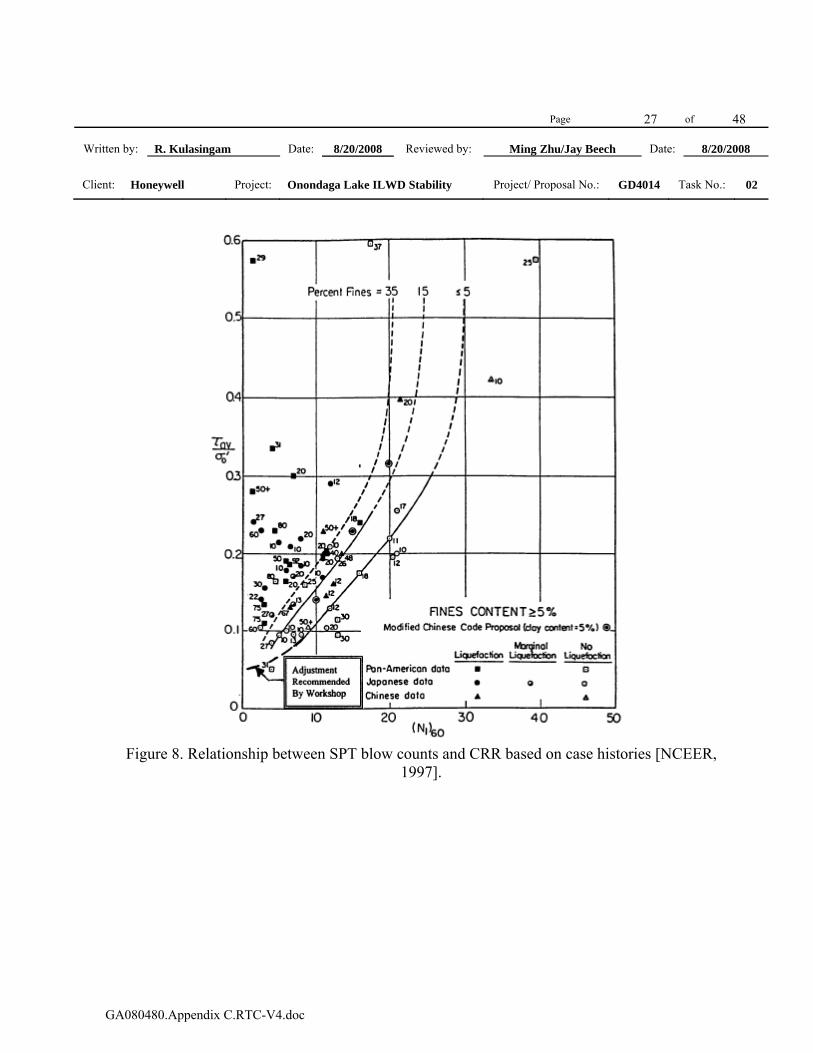
Figure 8 presents the relationship between SPT blow counts and CRR7.5 based on case histories [NCEER, 1997]. The corrected normalized SPT blow count, (N1)60 can be calculated by the following equation presented by NCEER [1997].
SRBENm CCCCCNN =601 )(
Page 9 of 48
Written by: R. Kulasingam Date: 08/20/2008 Reviewed by: Ming Zhu/Jay Beech Date: 08/20/2008
Client: Honeywell Project: Onondaga Lake ILWD Stability Project/ Proposal No.: GD4014 Task No.: 02
GA080480.Appendix C.RTC-V4.doc
Where:
Nm = measured SPT blow count;
CN = correction for overburden pressure;
CE = correction for energy ratio;
CB = correction for borehole diameter;
CR = correction for rod length; and
CS = correction for sampler.
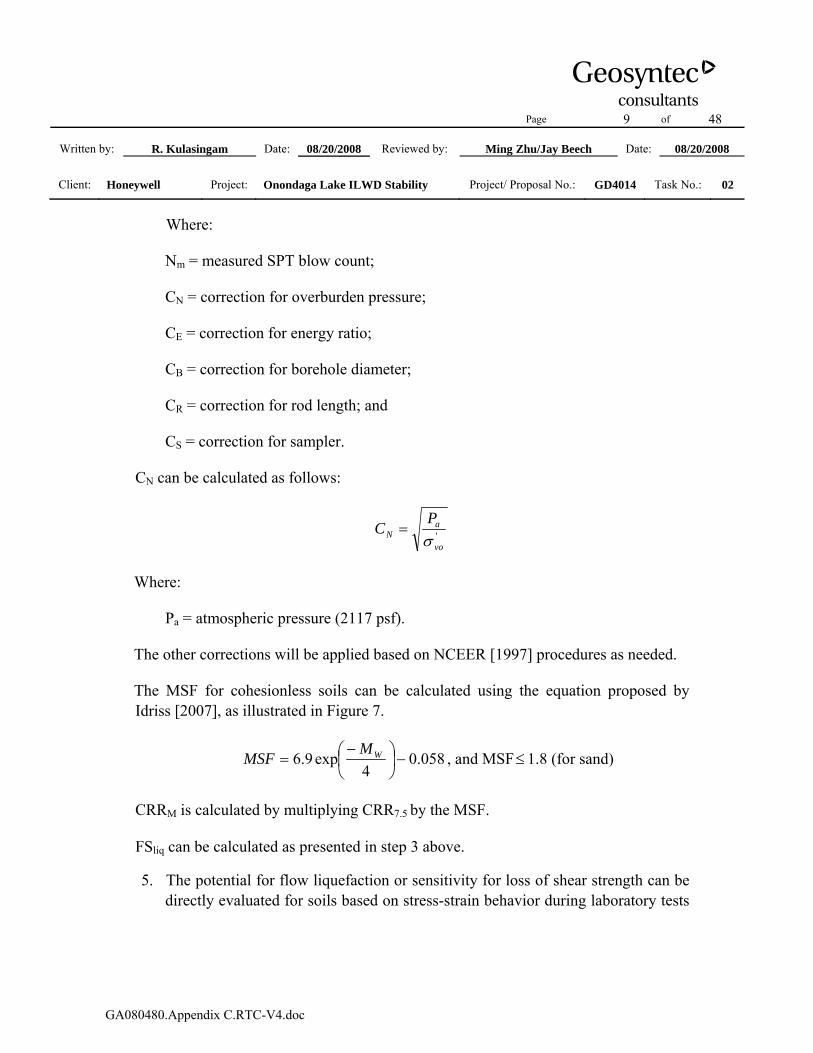
CN can be calculated as follows:
'vo
aN
PCσ
=
Where:
Pa = atmospheric pressure (2117 psf).
The other corrections will be applied based on NCEER [1997] procedures as needed.
The MSF for cohesionless soils can be calculated using the equation proposed by Idriss [2007], as illustrated in Figure 7.
058.04
exp9.6 −⎟⎠⎞
⎜⎝⎛ −= WMMSF , and MSF≤ 1.8 (for sand)
CRRM is calculated by multiplying CRR7.5 by the MSF.
FSliq can be calculated as presented in step 3 above.
5. The potential for flow liquefaction or sensitivity for loss of shear strength can be directly evaluated for soils based on stress-strain behavior during laboratory tests
Page 10 of 48
Written by: R. Kulasingam Date: 08/20/2008 Reviewed by: Ming Zhu/Jay Beech Date: 08/20/2008
Client: Honeywell Project: Onondaga Lake ILWD Stability Project/ Proposal No.: GD4014 Task No.: 02
GA080480.Appendix C.RTC-V4.doc
such as undrained triaxial tests, as discussed in the technical framework section. Stress-strain plots for SOLW were compared with standard stress-strain plots for strain hardening, limited strain softening, and strain softening soil behavior. These three types of soil behavior were illustrated in Figure 2. It is noted that liquefaction due to cyclic mobility cannot be evaluated with this procedure; however, it will be evaluated in the steps described previously.
RESULTS
The liquefaction potential evaluation results are presented in this section, and the steps in this section directly correspond to the steps in the methodology section.
1. Application of screening criteria used in state-of-practice for evaluating the liquefaction potential of cohesive soils indicates that SOLW, marl, and silt and clay units in the ILWD area are not susceptible to liquefaction.
a. Figure 9 presents the application of the Chinese Criteria for SOLW, marl, and silt and clay. Based on these criteria these soils can be considered not susceptible to liquefaction.
b. Liquid limits for SOLW, marl, and silt and clay are greater than 32. Based on the lab results, the clay content (particle size less than 0.002 mm) typically ranges from 5% to 30% for SOLW, from 20% to 43% for marl, and from 14% to 50% for silt and clay. The average clay content was calculated to be 14%, 30%, and 30% for SOLW, marl, and silt and clay, respectively. Per the screening criteria proposed by Andrews and Martin [2000] if clay content is greater than or equal to 10% and liquid limit greater than or equal to 32, soils can be considered not susceptible to liquefaction. If clay content is less than 10% or liquid limit is less than 32, further studies are required. Therefore, in general SOLW, marl, and silt and clay are not considered susceptible to liquefaction based on these criteria.
c. Figure 10 presents the application of the criteria proposed by Bray and Sancio [2006] to SOLW, marl, and silt and clay. Values of water content, liquid limit, and plasticity index were used to classify samples as susceptible, moderately susceptible, and not susceptible to liquefaction.
Page 11 of 48
Written by: R. Kulasingam Date: 08/20/2008 Reviewed by: Ming Zhu/Jay Beech Date: 08/20/2008
Client: Honeywell Project: Onondaga Lake ILWD Stability Project/ Proposal No.: GD4014 Task No.: 02
GA080480.Appendix C.RTC-V4.doc
Out of a total of 101 SOLW samples, 3, 11, and 87 samples were classified as susceptible, moderately susceptible, and not susceptible to liquefaction, respectively. Out of a total of 35 marl samples, 1, 0, and 34 were classified as susceptible, moderately susceptible, and not susceptible to liquefaction, respectively. Out of a total of 47 silt and clay samples, 3, 9, and 35 were classified as susceptible, moderately susceptible, and not susceptible to liquefaction, respectively. A few samples being classified as susceptible to liquefaction are not likely to cause overall liquefaction of the ILWD. Therefore, based on these criteria, these soils are not considered susceptible to liquefaction.
2. The cyclic stresses on the soils are calculated using the following steps:
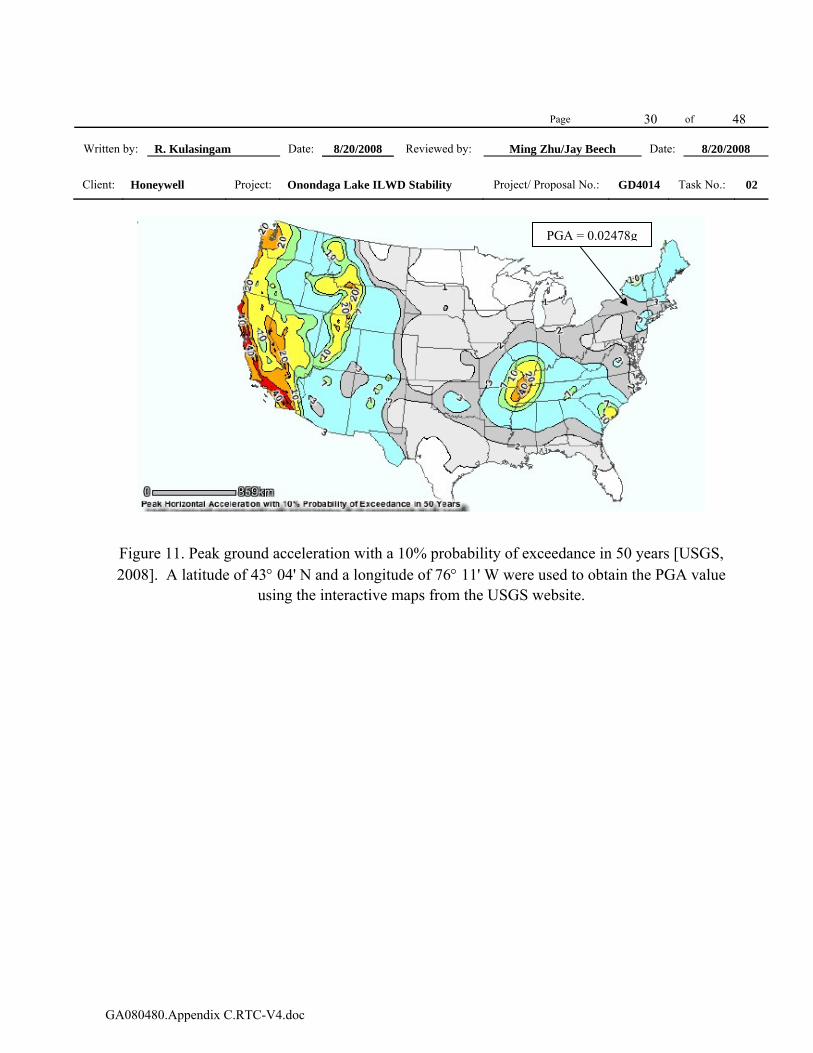
a. Figure 11 presents the peak ground acceleration with a 10% probability of exceedance in 50 years [USGS, 2008]. A latitude of 43° 04' N and a longitude of 76° 11' W were used for the ILWD area to obtain a PGA value of 0.025g (0.02478g) using the interactive maps from the USGS website. Attachment 1 presents the deaggregated seismic hazard for the 10% probability of exceedance in 50 year event. It is noted that the deaggregated hazard was based on the 2002 USGS hazard maps because deaggregated data for 2008 maps are not yet available. Based on the deaggregated hazard, a 5.3 moment magnitude was selected for use in liquefaction analyses as explained in Attachment 1.
b. Maximum ground surface acceleration of 0.09g was estimated for this seismic event by considering potential for amplification using the recommended mean relation in the chart presented in Figure 6. Application of this chart in lieu of site response analyses based on time histories is generally considered to be conservative.
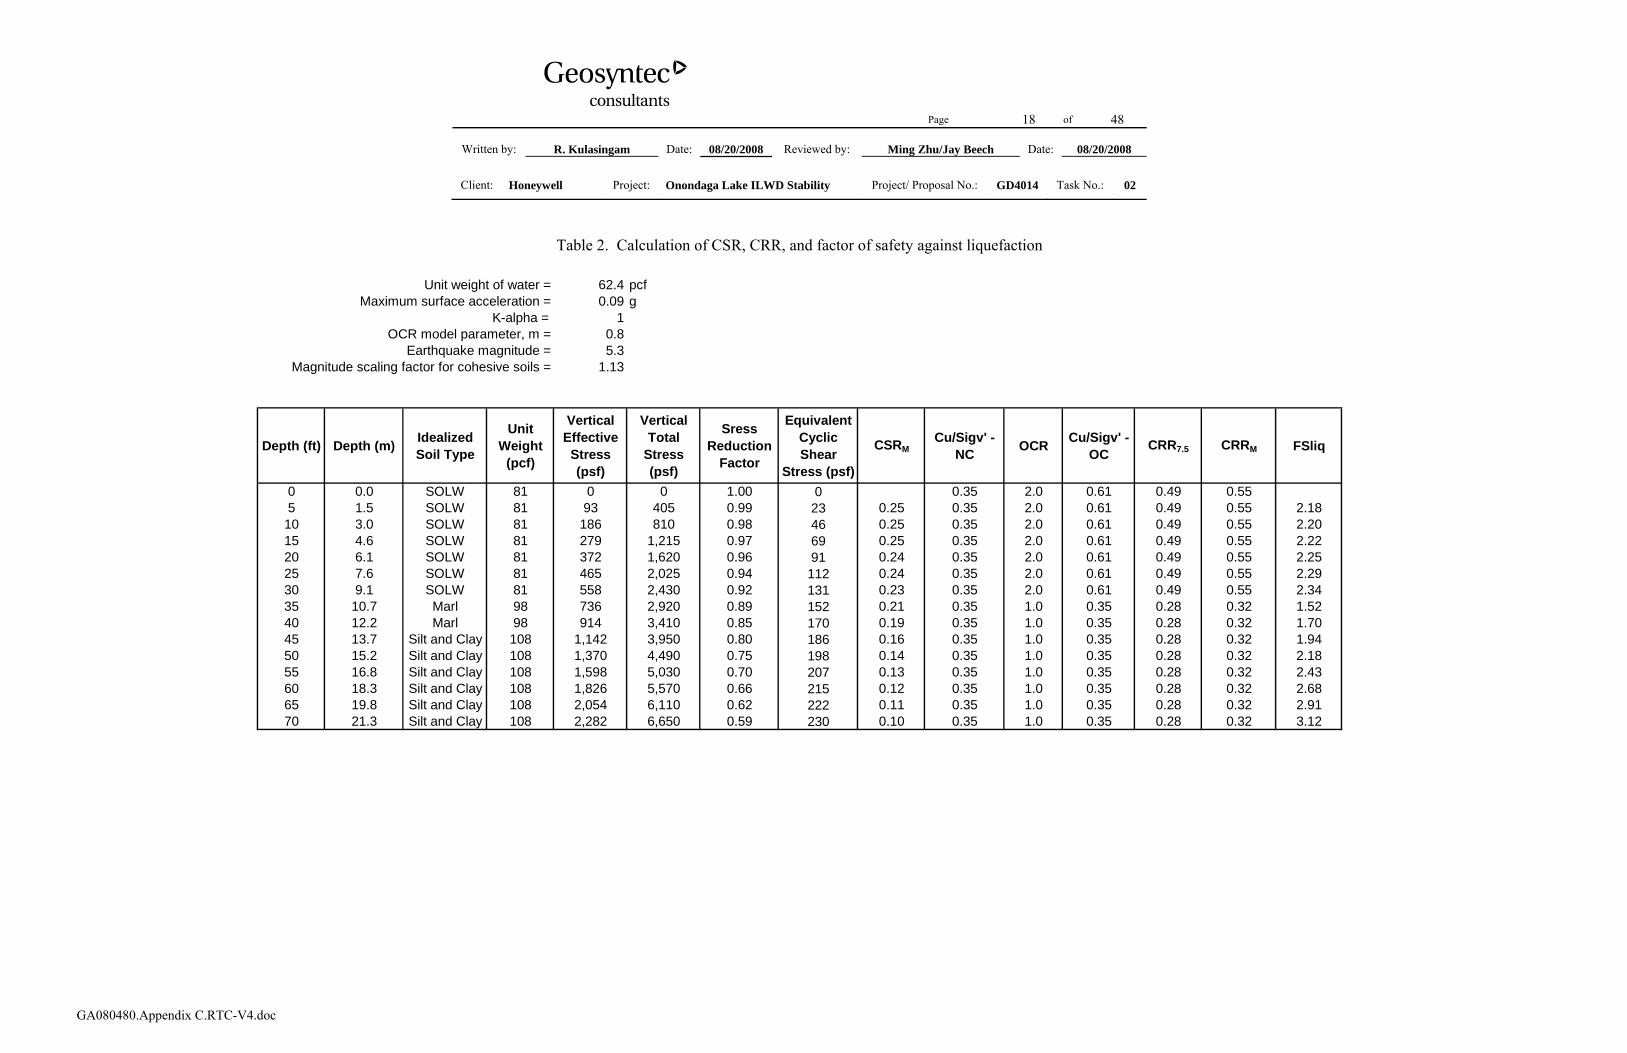
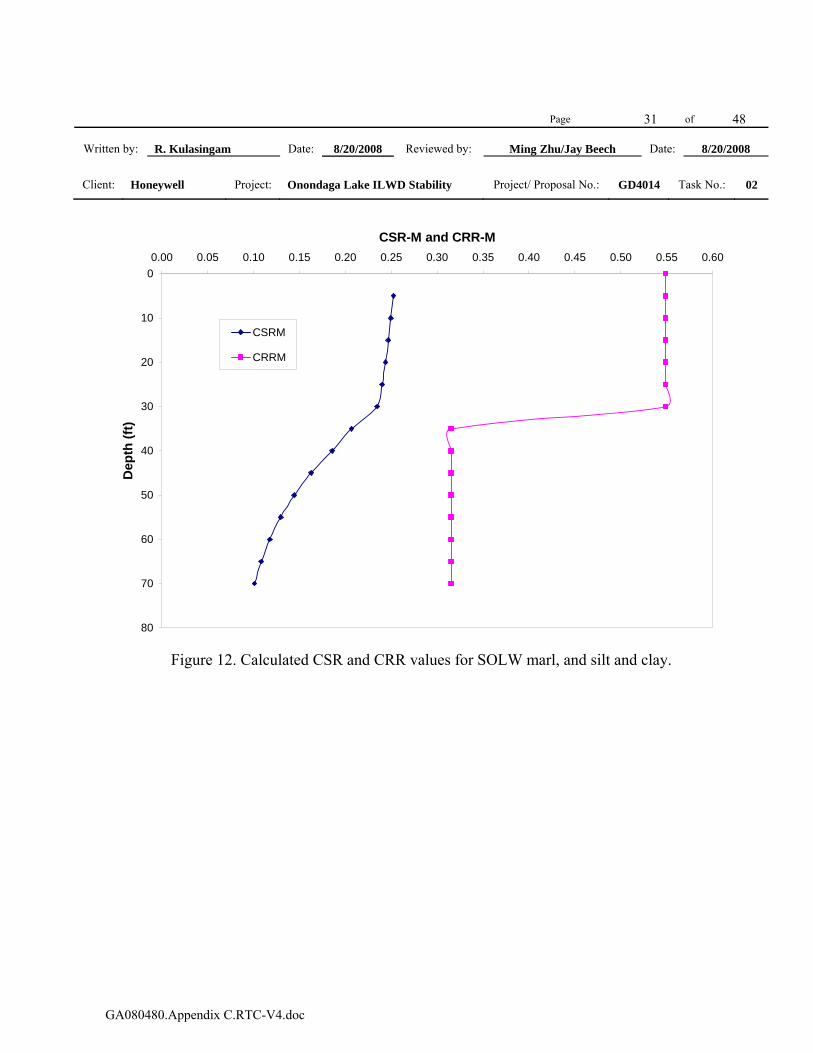
c. Table 2 presents the CSR values calculated using the simplified procedure proposed by Seed and Idriss [1971]. The calculated CSR values are plotted with depth in Figure 12. The calculated CSR values generally ranged from 0.10 at 70 feet depth in the silt and clay unit to 0.25 near the top of the SOLW.
Page 12 of 48
Written by: R. Kulasingam Date: 08/20/2008 Reviewed by: Ming Zhu/Jay Beech Date: 08/20/2008
Client: Honeywell Project: Onondaga Lake ILWD Stability Project/ Proposal No.: GD4014 Task No.: 02
GA080480.Appendix C.RTC-V4.doc
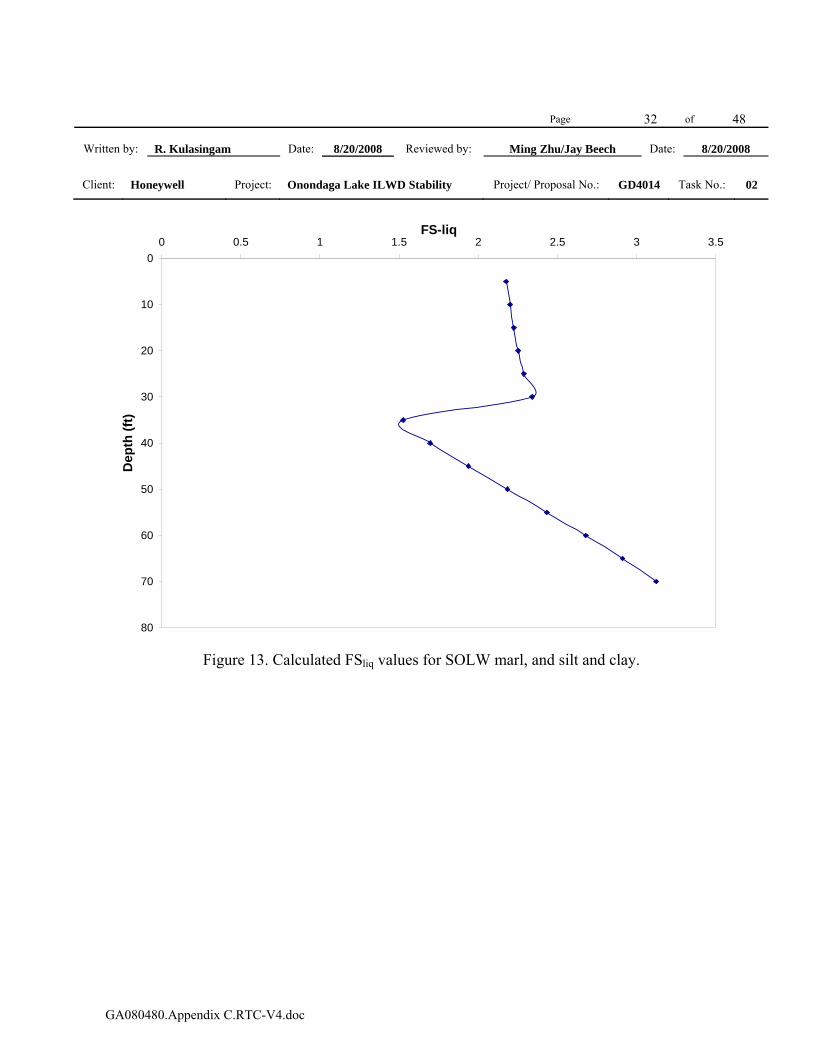
3. Table 2 presents the CRR values for cohesive soils calculated using the procedure proposed by Boulanger and Idriss [2007]. A normalized static strength ratio of 0.35 was used for SOLW, marl, and silt and clay as presented in Table 1 and Appendix A titled “Summary of Subsurface Stratigraphy and Material Properties”. For the mild overall slopes of the ILWD area ranging from three to five degrees, kα was assumed to be one. A MSF value of 1.13 was calculated. The calculated CRR values are plotted with depth in Figure 12. The calculated CRR values generally ranged from 0.32 for the marl and the silt and clay units to 0.55 for the SOLW. Calculated factors of safety against liquefaction are plotted in Figure 13. Calculated factors of safety against liquefaction ranged from about 2.2 to 2.3 for SOLW, 1.5 to 1.7 for marl, and 1.9 to 3.1 for silt and clay units. In liquefaction analyses, calculated factors of safety of 1.0 to 1.2 are considered adequate to conclude that adverse effects due to pore pressure buildup are unlikely. Therefore, based on this analysis, SOLW, marl, and silt and clay units in the ILWD area are not considered to be susceptible to liquefaction during the design seismic event established in step 2.
4. Uncorrected SPT blow counts for deeper soil units such as silt and sand, and sand and gravel ranged from 20 to 100 or more. An uncorrected SPT blow count of 20 is very conservatively assumed for demonstration purposes. It is assumed that energy correction is not required because SPT testing was done per standard US practice. After the application of overburden correction, one can calculate corrected blow count values (N1,60) of about 13 to 20 for depths of 70 feet to 120 feet. Based on Figure 8, these correspond to CRR7.5 values of about 0.14 to 0.22. An MSF value of 1.7 can be calculated for cohesionless soils based on Figure 7. Therefore, calculated CRRM values range from about 0.24 to 0.37. These values are much greater than the CSRM value of 0.10 calculated for 70 feet. CSRM values below 70 feet will be even smaller. Therefore, based on this simple analysis, the silt and sand, and sand and gravel units are not considered susceptible to liquefaction during the design seismic event established in step 2.
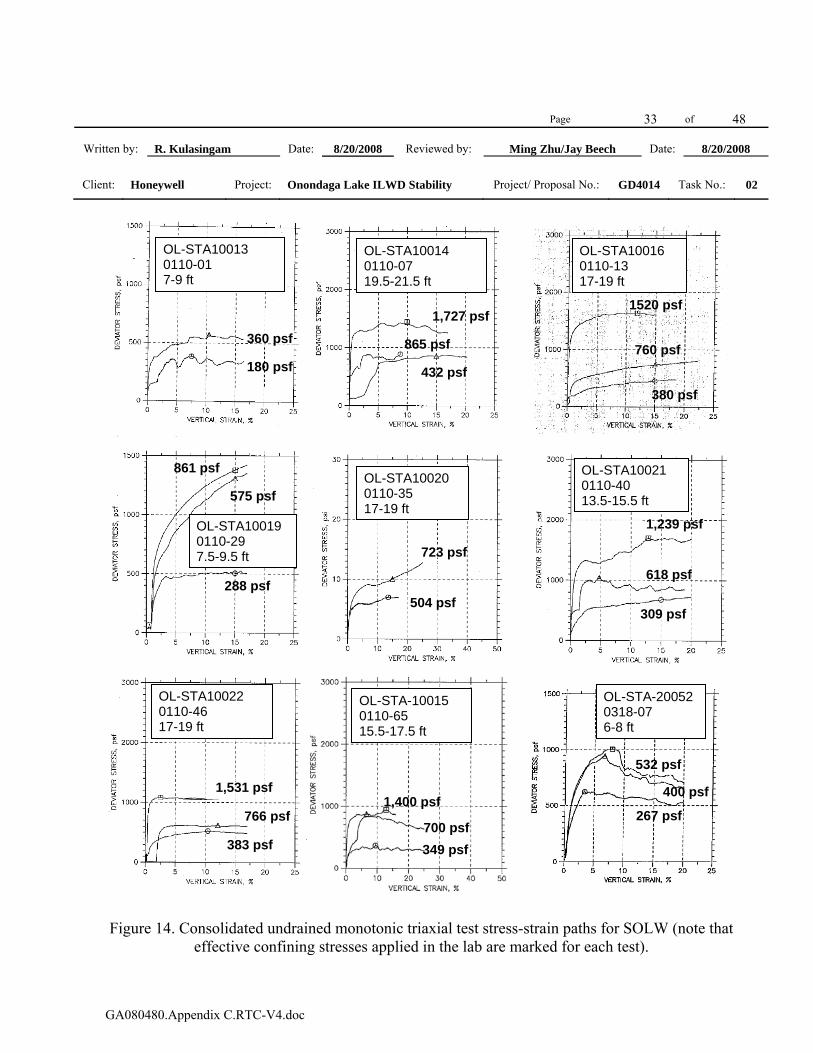
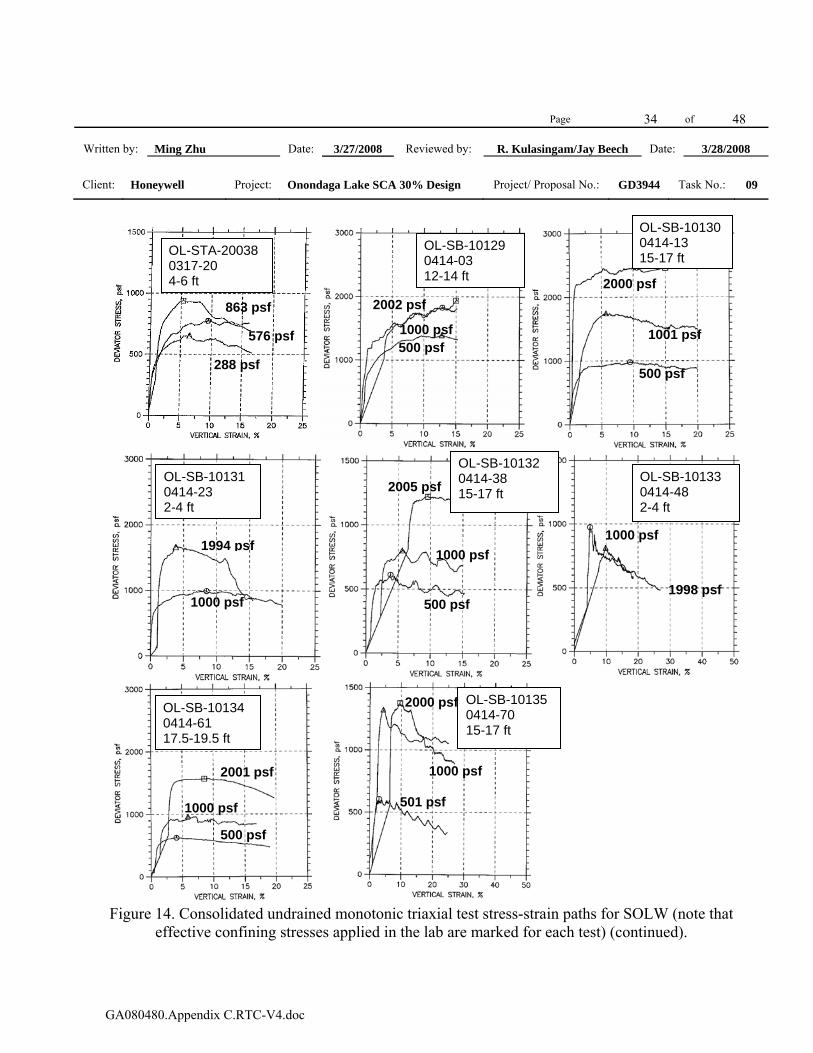
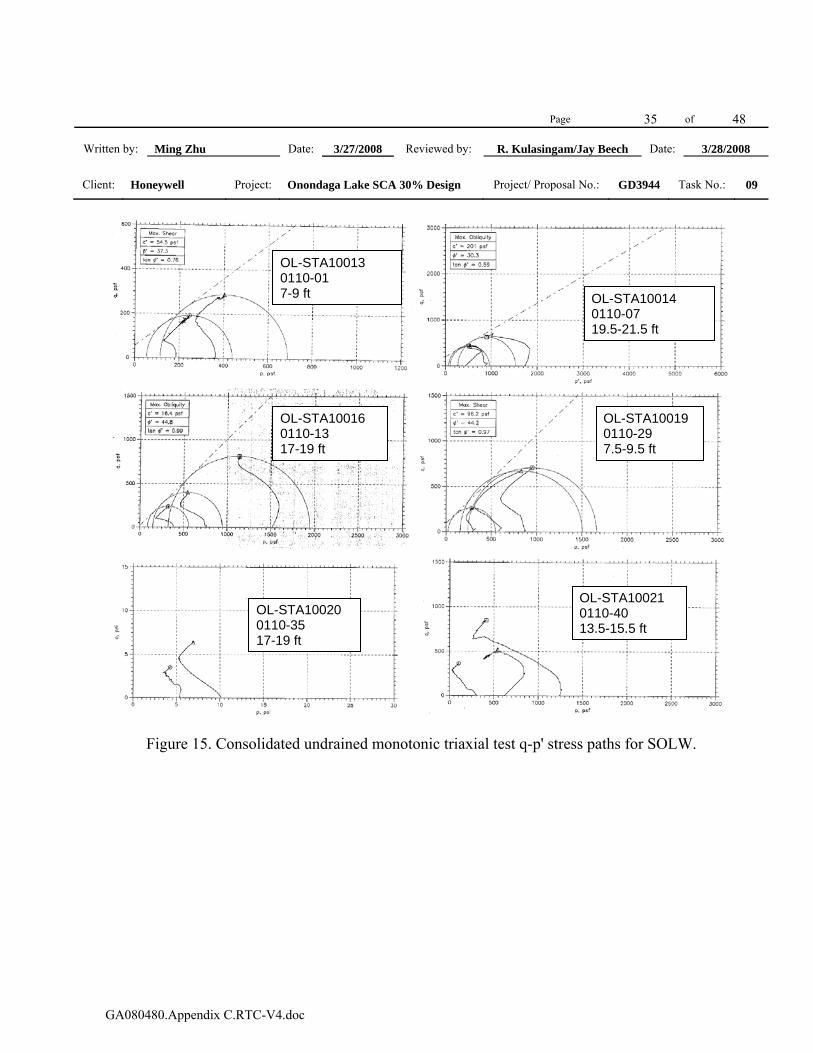
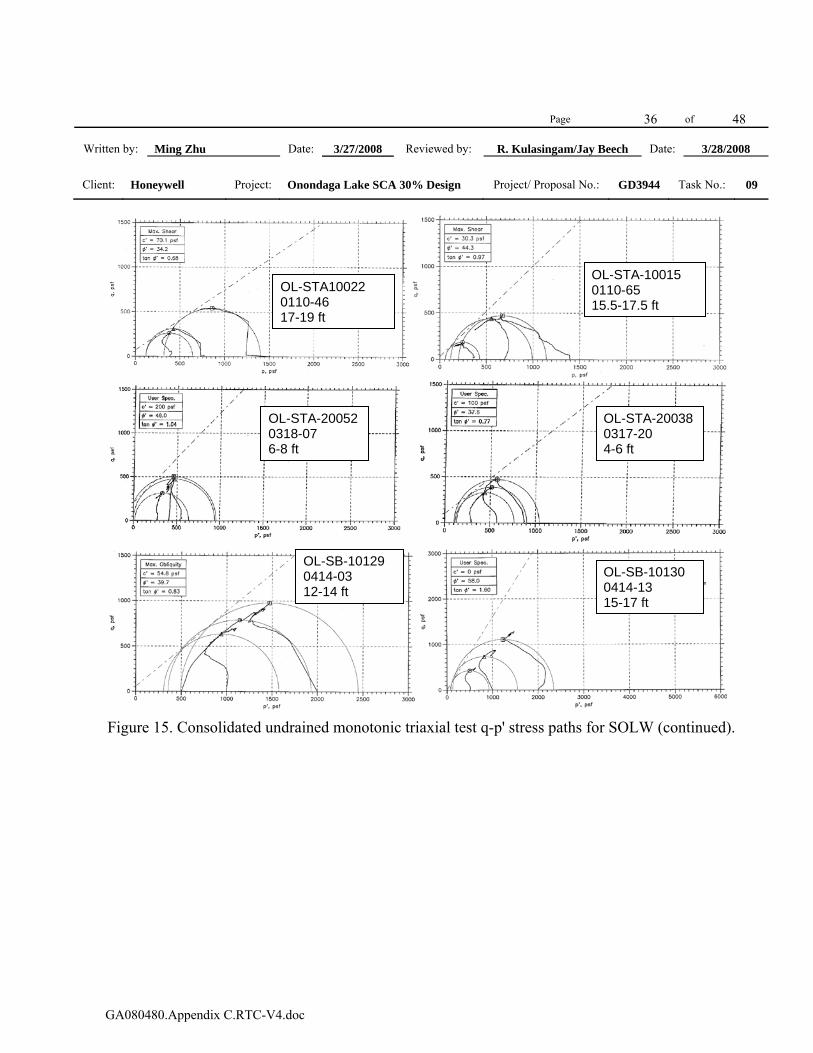
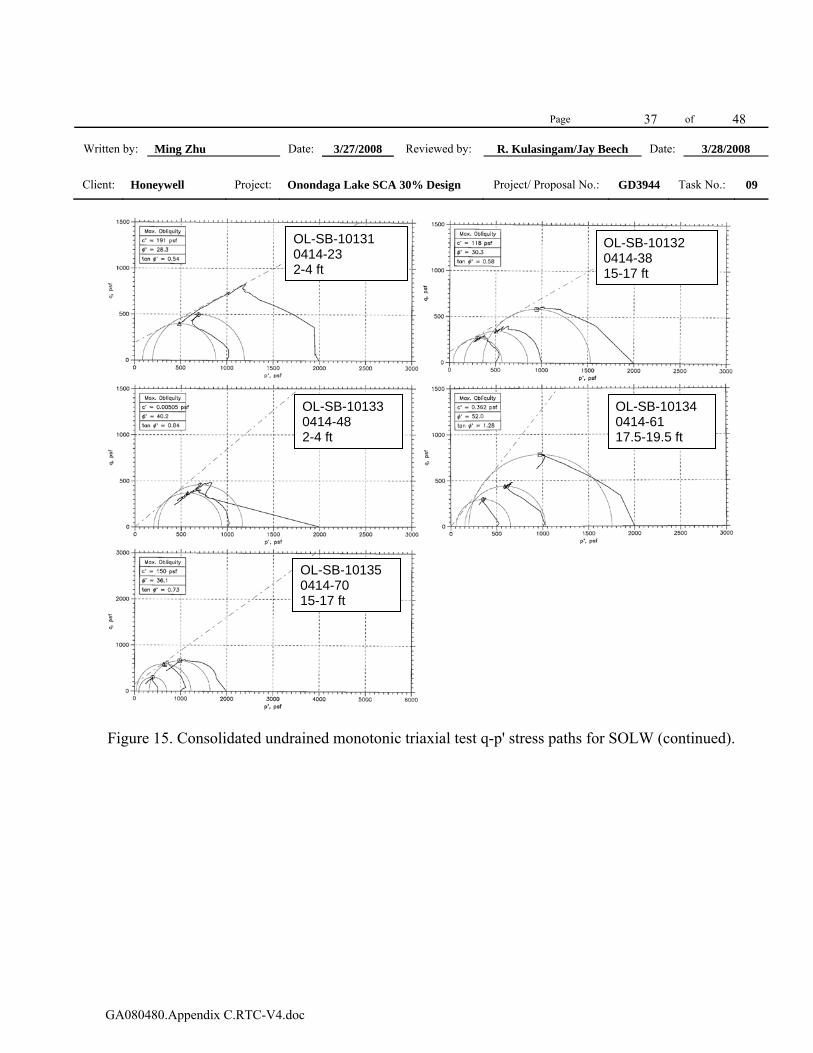
5. Figures 14 and 15 present the stress-strain and q-p' paths, respectively, for SOLW under laboratory consolidated undrained monotonic triaxial tests. These tests were conducted with applied effective confining stresses that are in the general range of insitu effective vertical stresses. Under laboratory undrained shearing,
Page 13 of 48
Written by: R. Kulasingam Date: 08/20/2008 Reviewed by: Ming Zhu/Jay Beech Date: 08/20/2008
Client: Honeywell Project: Onondaga Lake ILWD Stability Project/ Proposal No.: GD4014 Task No.: 02
GA080480.Appendix C.RTC-V4.doc
12 out of 17 SOLW samples (two to three specimens were tested for each sample) showed strain-hardening ductile behavior. Out of the remaining five samples, three showed limited strain-softening behavior (OL-STA-20052, OL-STA-20038, and OL-SB-10131 in Figure 14) and two showed gradual strain softening behavior (OL-SB-10133 and OL-SB-10135 in Figure 14). This gradual softening appears different from the sudden strength loss that is typical of soils susceptible to flow liquefaction or sensitive behavior. Therefore, based on these tests one can conclude that SOLW in the ILWD area is not likely to be susceptible to flow liquefaction or show sensitive behavior.
CONCLUSIONS
Liquefaction potential of the Solvay Waste (SOLW) and the underlying soils was evaluated for existing conditions. Based on the results summarized herein, the ILWD and underlying soils are not considered to have the potential for liquefaction or cyclic softening during the contingency level seismic event. In addition, the SOLW does not appear to have the potential for sensitive behavior or loss of shear strength.
As indicated previously, since the details of the isolation cap are currently being developed, the evaluation of the capped condition is not explicitly included herein. The liquefaction potential evaluation of the existing SOLW and underlying soils will not be affected by the installation of a cap (anticipated to be approximately 3-ft thick) at slopes that are similar to existing conditions, and therefore will not need to be updated for post-capping conditions. However, liquefaction potential of the cap itself will be addressed during the Intermediate Capping Design.
Page 14 of 48
Written by: R. Kulasingam Date: 08/20/2008 Reviewed by: Ming Zhu/Jay Beech Date: 08/20/2008
Client: Honeywell Project: Onondaga Lake ILWD Stability Project/ Proposal No.: GD4014 Task No.: 02
GA080480.Appendix C.RTC-V4.doc
REFERENCES
Andrews, D.C.A. and Martin, G.R. (2000). “Criteria for Liquefaction of Silty Soils”, 12th World Conference on Earthquake Engineering, Proceedings, Auckland, New Zealand.
Boulanger, R.W. and Idriss, I.M. (2007), “Evaluation of Cyclic Softening in Silts and Clays”, Journal of Geotechnical and Geoenvironmental Engineering, ASCE, Volume 133, No. 6, June 2007, pp. 641 - 652.
Bray, J.D. and Sancio, R.B. (2006). “Assessment of the Liquefaction Susceptibility of Fine-Grained Soils”, Journal of Geotechnical and Geoenvironmental Engineering, ASCE, September 2006, Vol. 132, No. 9, pp. 1165-1177.
Castro, G. (1976). “Comments on Seismic Stability Evaluation of Embankment Dams”, Proceedings of the Conference on Evaluation of Dam Safety.
Finn, W.D.L., Ledbetter, R.H., And Wu, G. (1994). “Liquefaction in Silty Soils: Design and Analysis”, Ground Failures under Seismic Conditions, Geotechnical Special Publication 44, ASCE, New York, pp. 51 - 76.
Idriss, I.M. (1990). “Response of Soft Soil Sites during Earthquakes”, in J.M. Duncan, ed., Proceedings, H. Bolton Seed Memorial Symposium, BiTech Publishers, Vancouver, British Columbia, Vol. 2, pp. 273 - 289.
Kramer, S.L (1996). “Geotechnical Earthquake Engineering”, Prentice Hall, Upper Saddle River, New Jersey.
NCEER (1997). “Summary Paper, Proc. of NCEER Workshop on Evaluation of Liquefaction Resistance of Soils”, NCEER-97-0022.
Seed, H.B. and Idriss, I.M. (1971). “Simplified Procedure for Evaluating Soil Liquefaction Potential”, Journal of the Soil Mechanics and Foundations Division, ASCE, Vol. 107, No. SM9, pp. 1249 - 1274.
Seed, R. B., Cetin, K. O., Moss, R. E. S., Kammerer, A. M., Wu, J., Pestana, J. M., and Riemer, M. F. (2001) “Recent Advances in Soil Liquefaction Engineering and Seismic Site Response Evaluation”, 4th International Conference on Recent Advances in Geotechnical Earthquake Engineering and Soil Dynamics, San Diego, March 28-31, 2001.
Page 15 of 48
Written by: R. Kulasingam Date: 08/20/2008 Reviewed by: Ming Zhu/Jay Beech Date: 08/20/2008
Client: Honeywell Project: Onondaga Lake ILWD Stability Project/ Proposal No.: GD4014 Task No.: 02
GA080480.Appendix C.RTC-V4.doc
USGS (2008). “United States Geological Survey (USGS) seismic hazard maps”, http://earthquake.usgs.gov/research/hazmaps/
Wang, W. (1979). “Some Findings in Soil Liquefaction”, Water Conservancy and Hydroelectric Power Scientific Research Institute, Beijing, China.
Yamamuro, J. and Covert, K. (2001). “Monotonic and Cyclic Liquefaction of Very Loose sands with High Silt Content”, Journal of Geotechnical and Geoenvironmental Engineering, ASCE, Volume 127, No. 4, April 2001, pp. 314 - 324.
Page 16 of 48
Written by: R. Kulasingam Date: 08/20/2008 Reviewed by: Ming Zhu/Jay Beech Date: 08/20/2008
Client: Honeywell Project: Onondaga Lake ILWD Stability Project/ Proposal No.: GD4014 Task No.: 02
GA080480.Appendix C.RTC-V4.doc
Tables
Page 17 of 48
Written by: R. Kulasingam Date: 08/20/2008 Reviewed by: Ming Zhu/Jay Beech Date: 08/20/2008
Client: Honeywell Project: Onondaga Lake ILWD Stability Project/ Proposal No.: GD4014 Task No.: 02
GA080480.Appendix C.RTC-V4.doc
Table 1. Summary of material properties
Material General Classification
Typical Range of Liquid Limit (%)
Typical Range of Plastic
Limit (%)
Typical Range of
Water Content
(%)
Typical Range of Plasticity
Index
Typical Range of Liquidity
Index
Typical Range of
Fines Content
Typical Range of SPT
N value
Total Unit Weight (pcf)
Undrained Shear Strength1
From UU (psf)
From CU (psf)
Silt2 NA NA NA NA NA NA NA NA1 98 NA NA
SOLW MH 40 – 146 30 – 80 40 – 260 10 – 80 1.0 – 6.4 65 – 100 0 – 73 81 245 Su/σ'v = 0.354
Marl MH and CH 60 – 80 25 – 45 35 – 85 20 – 50 0.4 – 1.1 96 – 100 0 – 43 98 350 Su/σ'v = 0.35
Silt/Clay CL and CH 32 – 70 20 – 45 20 – 80 15 – 40 0.4 – 1.0 93 - 100 03 108 350 Su/σ'v = 0.35
Silt/Sand NA NA NA NA NA NA NA 20 - 80 120 NA NA
Sand/Gravel NA NA NA NA NA NA NA 20 to > 100 120 NA NA Till NA NA NA NA NA NA > 100 120 NA NA
Shale NA NA NA NA NA NA NA > 100 120 NA NA Notes:
1 NA – Not Applicable
2 Properties of marl are also considered applicable for the silt overlying the Solvay waste in certain areas of the ILWD. 3 SPT N values are zero at most of the depths within the SOLW, marl, and silt/clay layers. 4 The undrained shear strength ratio of normally consolidated SOLW was estimated to be 0.35 as presented in the Data Package [The value of 240 psf for shear strength of the SOLW reported in Table 5 of the
Data Package accounts for the insitu overconsolidation of SOLW. The shear strength ratio of 0.35 used herein conservatively assumes normally consolidated conditions and is used only to simplify the calculations].
Page 18 of 48
Written by: R. Kulasingam Date: 08/20/2008 Reviewed by: Ming Zhu/Jay Beech Date: 08/20/2008
Client: Honeywell Project: Onondaga Lake ILWD Stability Project/ Proposal No.: GD4014 Task No.: 02
GA080480.Appendix C.RTC-V4.doc
Table 2. Calculation of CSR, CRR, and factor of safety against liquefaction
Unit weight of water = 62.4 pcf
Maximum surface acceleration = 0.09 gK-alpha = 1
OCR model parameter, m = 0.8Earthquake magnitude = 5.3
Magnitude scaling factor for cohesive soils = 1.13
Depth (ft) Depth (m) Idealized Soil Type
Unit Weight
(pcf)
Vertical Effective
Stress (psf)
Vertical Total
Stress (psf)
Sress Reduction
Factor
Equivalent Cyclic Shear
Stress (psf)
CSRMCu/Sigv' -
NC OCR Cu/Sigv' - OC
CRR7.5 CRRM FSliq
0 0.0 SOLW 81 0 0 1.00 0 0.35 2.0 0.61 0.49 0.555 1.5 SOLW 81 93 405 0.99 23 0.25 0.35 2.0 0.61 0.49 0.55 2.1810 3.0 SOLW 81 186 810 0.98 46 0.25 0.35 2.0 0.61 0.49 0.55 2.2015 4.6 SOLW 81 279 1,215 0.97 69 0.25 0.35 2.0 0.61 0.49 0.55 2.2220 6.1 SOLW 81 372 1,620 0.96 91 0.24 0.35 2.0 0.61 0.49 0.55 2.2525 7.6 SOLW 81 465 2,025 0.94 112 0.24 0.35 2.0 0.61 0.49 0.55 2.2930 9.1 SOLW 81 558 2,430 0.92 131 0.23 0.35 2.0 0.61 0.49 0.55 2.3435 10.7 Marl 98 736 2,920 0.89 152 0.21 0.35 1.0 0.35 0.28 0.32 1.5240 12.2 Marl 98 914 3,410 0.85 170 0.19 0.35 1.0 0.35 0.28 0.32 1.7045 13.7 Silt and Clay 108 1,142 3,950 0.80 186 0.16 0.35 1.0 0.35 0.28 0.32 1.9450 15.2 Silt and Clay 108 1,370 4,490 0.75 198 0.14 0.35 1.0 0.35 0.28 0.32 2.1855 16.8 Silt and Clay 108 1,598 5,030 0.70 207 0.13 0.35 1.0 0.35 0.28 0.32 2.4360 18.3 Silt and Clay 108 1,826 5,570 0.66 215 0.12 0.35 1.0 0.35 0.28 0.32 2.6865 19.8 Silt and Clay 108 2,054 6,110 0.62 222 0.11 0.35 1.0 0.35 0.28 0.32 2.9170 21.3 Silt and Clay 108 2,282 6,650 0.59 230 0.10 0.35 1.0 0.35 0.28 0.32 3.12
Page 19 of 48
Written by: R. Kulasingam Date: 8/20/2008 Reviewed by: Ming Zhu/Jay Beech Date: 8/20/2008
Client: Honeywell Project: Onondaga Lake ILWD Stability Project/ Proposal No.: GD4014 Task No.: 02
GA080480.Appendix C.RTC-V4.doc
Figures
Page 20 of 48
Written by: R. Kulasingam Date: 8/20/2008 Reviewed by: Ming Zhu/Jay Beech Date: 8/20/2008
Client: Honeywell Project: Onondaga Lake ILWD Stability Project/ Proposal No.: GD4014 Task No.: 02
GA080480.Appendix C.RTC-V4.doc
Figure 1. Monotonic and cyclic soil behaviors leading to different liquefaction mechanisms [Castro, 1976].
Notes: the following is noted in regards to the terminology used in this figure and the text:
1. The terms static loading and monotonic loading are used to describe similar loading. 2. Cyclic loading may include seismic (earthquake) or periodic wave loading. 3. “Instability and flow” corresponds to flow liquefaction behavior. 4. “Deformations of stable soil” corresponds to cyclic mobility (or cyclic softening).
Page 21 of 48
Written by: R. Kulasingam Date: 8/20/2008 Reviewed by: Ming Zhu/Jay Beech Date: 8/20/2008
Client: Honeywell Project: Onondaga Lake ILWD Stability Project/ Proposal No.: GD4014 Task No.: 02
GA080480.Appendix C.RTC-V4.doc
(a)
(b)
Figure 2. Undrained stress-strain behavior of soils. (Figures from: (a) Kramer [1996]; and (b)
Yamamuro & Covert [2001]).
Notes: the following is noted in regards to the terminology used in this figure and the text: 1. The term dilation in the figure corresponds to the strain hardening behavior described in
the text. 2. The term limited liquefaction in the figure corresponds to the limited strain softening
behavior described in the text. 3. The term liquefaction in the figure corresponds to the strain softening behavior described
in the text.
Page 22 of 48
Written by: R. Kulasingam Date: 8/20/2008 Reviewed by: Ming Zhu/Jay Beech Date: 8/20/2008
Client: Honeywell Project: Onondaga Lake ILWD Stability Project/ Proposal No.: GD4014 Task No.: 02
GA080480.Appendix C.RTC-V4.doc
Figure 3. Modified Chinese criteria for screening liquefaction potential [Finn et al., 1994] (figure
taken from Seed et al., 2001).
Page 23 of 48
Written by: R. Kulasingam Date: 8/20/2008 Reviewed by: Ming Zhu/Jay Beech Date: 8/20/2008
Client: Honeywell Project: Onondaga Lake ILWD Stability Project/ Proposal No.: GD4014 Task No.: 02
GA080480.Appendix C.RTC-V4.doc
Figure 4. Liquefaction susceptibility of silty and clayey sands [Andrews and Martin, 2000] (figure
taken from Seed et al., 2001).
Page 24 of 48
Written by: R. Kulasingam Date: 8/20/2008 Reviewed by: Ming Zhu/Jay Beech Date: 8/20/2008
Client: Honeywell Project: Onondaga Lake ILWD Stability Project/ Proposal No.: GD4014 Task No.: 02
GA080480.Appendix C.RTC-V4.doc
Figure 5. Liquefaction susceptibility criteria with data plotted from: (a) laboratory cyclic triaxial testing; (b) field data from Turkey (Kocaeli) earthquake; (c) field data from Northridge
earthquake; (d) field data used for developing Chinese criteria; and (e) field data from Taiwan (Chi-Chi) earthquake [Bray and Sancio, 2006].
Page 25 of 48
Written by: R. Kulasingam Date: 8/20/2008 Reviewed by: Ming Zhu/Jay Beech Date: 8/20/2008
Client: Honeywell Project: Onondaga Lake ILWD Stability Project/ Proposal No.: GD4014 Task No.: 02
GA080480.Appendix C.RTC-V4.doc
Figure 6. Relationship between peak acceleration on rock and soft soil sites [Idriss, 1990].
Page 26 of 48
Written by: R. Kulasingam Date: 8/20/2008 Reviewed by: Ming Zhu/Jay Beech Date: 8/20/2008
Client: Honeywell Project: Onondaga Lake ILWD Stability Project/ Proposal No.: GD4014 Task No.: 02
GA080480.Appendix C.RTC-V4.doc
Figure 7. MSF correlations proposed by Boulanger and Idriss for clayey and sandy soils [2007].
Page 27 of 48
Written by: R. Kulasingam Date: 8/20/2008 Reviewed by: Ming Zhu/Jay Beech Date: 8/20/2008
Client: Honeywell Project: Onondaga Lake ILWD Stability Project/ Proposal No.: GD4014 Task No.: 02
GA080480.Appendix C.RTC-V4.doc
Figure 8. Relationship between SPT blow counts and CRR based on case histories [NCEER,
1997].
Page 28 of 48
Written by: R. Kulasingam Date: 8/20/2008 Reviewed by: Ming Zhu/Jay Beech Date: 8/20/2008
Client: Honeywell Project: Onondaga Lake ILWD Stability Project/ Proposal No.: GD4014 Task No.: 02
GA080480.Appendix C.RTC-V4.doc
Figure 9. Application of Chinese criteria for SOLW, marl, and silt and clay.
0
40
80
120
160
200
240
0 40 80 120 160 200 240 280
Water Content (%)
Liqu
id L
imit
(%)
SOLWMarlClay
LL=35%
WC=0.9LL
TEST
SAFE SAFE
SAFE
Page 29 of 48
Written by: R. Kulasingam Date: 8/20/2008 Reviewed by: Ming Zhu/Jay Beech Date: 8/20/2008
Client: Honeywell Project: Onondaga Lake ILWD Stability Project/ Proposal No.: GD4014 Task No.: 02
GA080480.Appendix C.RTC-V4.doc
Figure 10. Application of the criteria proposed by Bray and Sancio [2006] for SOLW, marl, and silt and clay.
0
10
20
30
40
50
60
70
80
90
100
110
120
0.0 0.2 0.4 0.6 0.8 1.0 1.2 1.4 1.6 1.8 2.0 2.2 2.4 2.6 2.8
Water Content / Liquid Limit
Pla
stic
ity In
dex
(%)
SOLWMarlClay
SUSCEPTIBLE
NOT SUSCEPTIBLE
MODERATELY SUSCEPTIBLE
Page 30 of 48
Written by: R. Kulasingam Date: 8/20/2008 Reviewed by: Ming Zhu/Jay Beech Date: 8/20/2008
Client: Honeywell Project: Onondaga Lake ILWD Stability Project/ Proposal No.: GD4014 Task No.: 02
GA080480.Appendix C.RTC-V4.doc
Figure 11. Peak ground acceleration with a 10% probability of exceedance in 50 years [USGS, 2008]. A latitude of 43° 04' N and a longitude of 76° 11' W were used to obtain the PGA value
using the interactive maps from the USGS website.
PGA = 0.02478g
Page 31 of 48
Written by: R. Kulasingam Date: 8/20/2008 Reviewed by: Ming Zhu/Jay Beech Date: 8/20/2008
Client: Honeywell Project: Onondaga Lake ILWD Stability Project/ Proposal No.: GD4014 Task No.: 02
GA080480.Appendix C.RTC-V4.doc
0
10
20
30
40
50
60
70
80
0.00 0.05 0.10 0.15 0.20 0.25 0.30 0.35 0.40 0.45 0.50 0.55 0.60
CSR-M and CRR-M
Dep
th (f
t)
CSRM
CRRM
Figure 12. Calculated CSR and CRR values for SOLW marl, and silt and clay.
Page 32 of 48
Written by: R. Kulasingam Date: 8/20/2008 Reviewed by: Ming Zhu/Jay Beech Date: 8/20/2008
Client: Honeywell Project: Onondaga Lake ILWD Stability Project/ Proposal No.: GD4014 Task No.: 02
GA080480.Appendix C.RTC-V4.doc
0
10
20
30
40
50
60
70
80
0 0.5 1 1.5 2 2.5 3 3.5FS-liq
Dep
th (f
t)
Figure 13. Calculated FSliq values for SOLW marl, and silt and clay.
Page 33 of 48
Written by: R. Kulasingam Date: 8/20/2008 Reviewed by: Ming Zhu/Jay Beech Date: 8/20/2008
Client: Honeywell Project: Onondaga Lake ILWD Stability Project/ Proposal No.: GD4014 Task No.: 02
GA080480.Appendix C.RTC-V4.doc
Figure 14. Consolidated undrained monotonic triaxial test stress-strain paths for SOLW (note that effective confining stresses applied in the lab are marked for each test).
OL-STA10022 0110-46 17-19 ft
383 psf
766 psf
1,531 psf 532 psf
OL-STA-20052 0318-07 6-8 ft
400 psf
267 psf
OL-STA-10015 0110-65 15.5-17.5 ft
349 psf 700 psf
1,400 psf
OL-STA10013 0110-01 7-9 ft
180 psf
360 psf
432 psf
865 psf
1,727 psf
OL-STA10014 0110-07 19.5-21.5 ft
OL-STA10016 0110-13 17-19 ft
1520 psf
760 psf
380 psf
OL-STA10019 0110-29 7.5-9.5 ft
861 psf
575 psf
288 psf
OL-STA10020 0110-35 17-19 ft
723 psf
504 psf
OL-STA10021 0110-40 13.5-15.5 ft
1,239 psf
618 psf
309 psf
Page 34 of 48
Written by: Ming Zhu Date: 3/27/2008 Reviewed by: R. Kulasingam/Jay Beech Date: 3/28/2008
Client: Honeywell Project: Onondaga Lake SCA 30% Design Project/ Proposal No.: GD3944 Task No.: 09
GA080480.Appendix C.RTC-V4.doc
Figure 14. Consolidated undrained monotonic triaxial test stress-strain paths for SOLW (note that
effective confining stresses applied in the lab are marked for each test) (continued).
OL-SB-10131 0414-23 2-4 ft
1994 psf
1000 psf 500 psf
1000 psf
2005 psf OL-SB-10133 0414-48 2-4 ft
1000 psf
1998 psf
OL-SB-10132 0414-38 15-17 ft
OL-SB-10134 0414-61 17.5-19.5 ft
500 psf
1000 psf
2001 psf
501 psf
OL-SB-10135 0414-70 15-17 ft
1000 psf
2000 psf
OL-STA-20038 0317-20 4-6 ft
863 psf
576 psf
288 psf
OL-SB-10129 0414-03 12-14 ft
2002 psf
1000 psf 500 psf
500 psf
1001 psf
2000 psf
OL-SB-10130 0414-13 15-17 ft
Page 35 of 48
Written by: Ming Zhu Date: 3/27/2008 Reviewed by: R. Kulasingam/Jay Beech Date: 3/28/2008
Client: Honeywell Project: Onondaga Lake SCA 30% Design Project/ Proposal No.: GD3944 Task No.: 09
GA080480.Appendix C.RTC-V4.doc
Figure 15. Consolidated undrained monotonic triaxial test q-p' stress paths for SOLW.
OL-STA10013 0110-01 7-9 ft OL-STA10014
0110-07 19.5-21.5 ft
OL-STA10016 0110-13 17-19 ft
OL-STA10019 0110-29 7.5-9.5 ft
OL-STA10020 0110-35 17-19 ft
OL-STA10021 0110-40 13.5-15.5 ft
Page 36 of 48
Written by: Ming Zhu Date: 3/27/2008 Reviewed by: R. Kulasingam/Jay Beech Date: 3/28/2008
Client: Honeywell Project: Onondaga Lake SCA 30% Design Project/ Proposal No.: GD3944 Task No.: 09
GA080480.Appendix C.RTC-V4.doc
Figure 15. Consolidated undrained monotonic triaxial test q-p' stress paths for SOLW (continued).
OL-STA10022 0110-46 17-19 ft
OL-STA-20052 0318-07 6-8 ft
OL-STA-20038 0317-20 4-6 ft
OL-STA-10015 0110-65 15.5-17.5 ft
OL-SB-10129 0414-03 12-14 ft
OL-SB-10130 0414-13 15-17 ft
Page 37 of 48
Written by: Ming Zhu Date: 3/27/2008 Reviewed by: R. Kulasingam/Jay Beech Date: 3/28/2008
Client: Honeywell Project: Onondaga Lake SCA 30% Design Project/ Proposal No.: GD3944 Task No.: 09
GA080480.Appendix C.RTC-V4.doc
Figure 15. Consolidated undrained monotonic triaxial test q-p' stress paths for SOLW (continued).
OL-SB-10131 0414-23 2-4 ft
OL-SB-10132 0414-38 15-17 ft
OL-SB-10133 0414-48 2-4 ft
OL-SB-10134 0414-61 17.5-19.5 ft
OL-SB-10135 0414-70 15-17 ft
Page 38 of 48
Written by: Ming Zhu Date: 3/27/2008 Reviewed by: R. Kulasingam/Jay Beech Date: 3/28/2008
Client: Honeywell Project: Onondaga Lake SCA 30% Design Project/ Proposal No.: GD3944 Task No.: 09
GA080480.Appendix C.RTC-V4.doc
Attachment 1
Deaggregated Seismic Hazard
Page 39 of 48
Written by: Ming Zhu Date: 3/27/2008 Reviewed by: R. Kulasingam/Jay Beech Date: 3/28/2008
Client: Honeywell Project: Onondaga Lake SCA 30% Design Project/ Proposal No.: GD3944 Task No.: 09
GA080480.Appendix C.RTC-V4.doc
This attachment presents the deaggregated seismic hazard for the 10% probability of exceedance in a 50-year event, which is based on the 2002 United States Geological Survey (USGS) maps. The following paragraphs describe how a 5.3 moment magnitude was selected for the liquefaction analyses based on the deaggregation. Conventional engineering methods for evaluation of soil liquefaction potential are deterministic. Required (deterministic) input parameters for evaluation of soil liquefaction include design earthquake magnitude, M (which is a proxy for duration of strong ground shaking) and free-field (zero-period) Peak Ground Acceleration (PGA). In the Central and Eastern U.S., seismic hazard (and therefore PGA) is typically governed by multiple seismic sources at various distances. Probabilistic seismic hazard analysis is conducted in order to account for these multiple seismic source – distance pairs. The result of the probabilistic seismic hazard analysis is the PGA for a given return period. The contribution of each seismic source in evaluation of the PGA in a probabilistic seismic hazard analysis can be assessed by a process called deaggregation. Deaggregation does not result in a single earthquake magnitude–distance pair. The result of deaggregation is a series of seismic hazard matrices (usually 3 to 5 matrices, each for a different period of oscillation, as available at the United States Geological Survey, USGS web site). For an evaluation of soil liquefaction potential, zero-period PGA is required. Hence, a 0.1-second matrix (matrix with the lowest period available from the USGS web page) is considered for this site. A review of the 0.1-second matrix reveals the following three candidate magnitude-distance pairs:
M 4.81 at 36.3 km (Epsilon = 4.53) M 5.25 at 115.3 km (Epsilon = 3.39) M 5.72 at 164.7 km (Epsilon = 3.27)
These above-listed magnitude-distance pairs have the largest Epsilon and hence, dominate the PGA estimate for this site (zero Epsilon corresponds to the median motion; Epsilon = 2 corresponds to median plus one standard deviation motion; larger Epsilon=larger PGA).
An inspection of the above-listed candidate events indicates that the PGA evaluated for this site corresponds to M 4.81. However, M 4.81 at 36.3 km pair is associated with a relatively low duration of strong ground shaking (5.9 seconds as opposed to 18.5 seconds from the M 5.25 event at a distance of 115.3 km). Therefore, Geosyntec selected the highest evaluated PGA (i.e., PGA that corresponds to an M 4.81 event at 36.3 km) and
Page 40 of 48
Written by: Ming Zhu Date: 3/27/2008 Reviewed by: R. Kulasingam/Jay Beech Date: 3/28/2008
Client: Honeywell Project: Onondaga Lake SCA 30% Design Project/ Proposal No.: GD3944 Task No.: 09
GA080480.Appendix C.RTC-V4.doc
duration (i.e., duration that corresponds to M 5.25 event) for an evaluation of soil liquefaction at this site. This is a conservative approach.
Page 41 of 48
Written by: Ming Zhu Date: 3/27/2008 Reviewed by: R. Kulasingam/Jay Beech Date: 3/28/2008
Client: Honeywell Project: Onondaga Lake SCA 30% Design Project/ Proposal No.: GD3944 Task No.: 09
GA080480.Appendix C.RTC-V4.doc
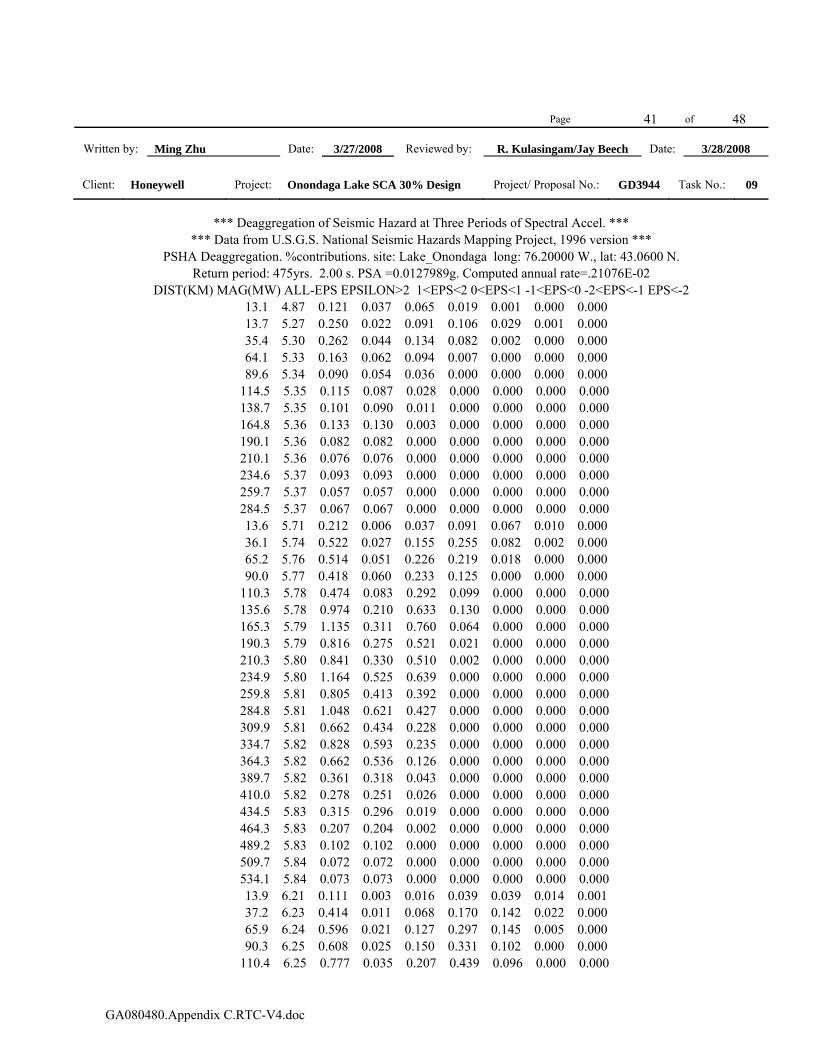
*** Deaggregation of Seismic Hazard at Three Periods of Spectral Accel. *** *** Data from U.S.G.S. National Seismic Hazards Mapping Project, 1996 version ***
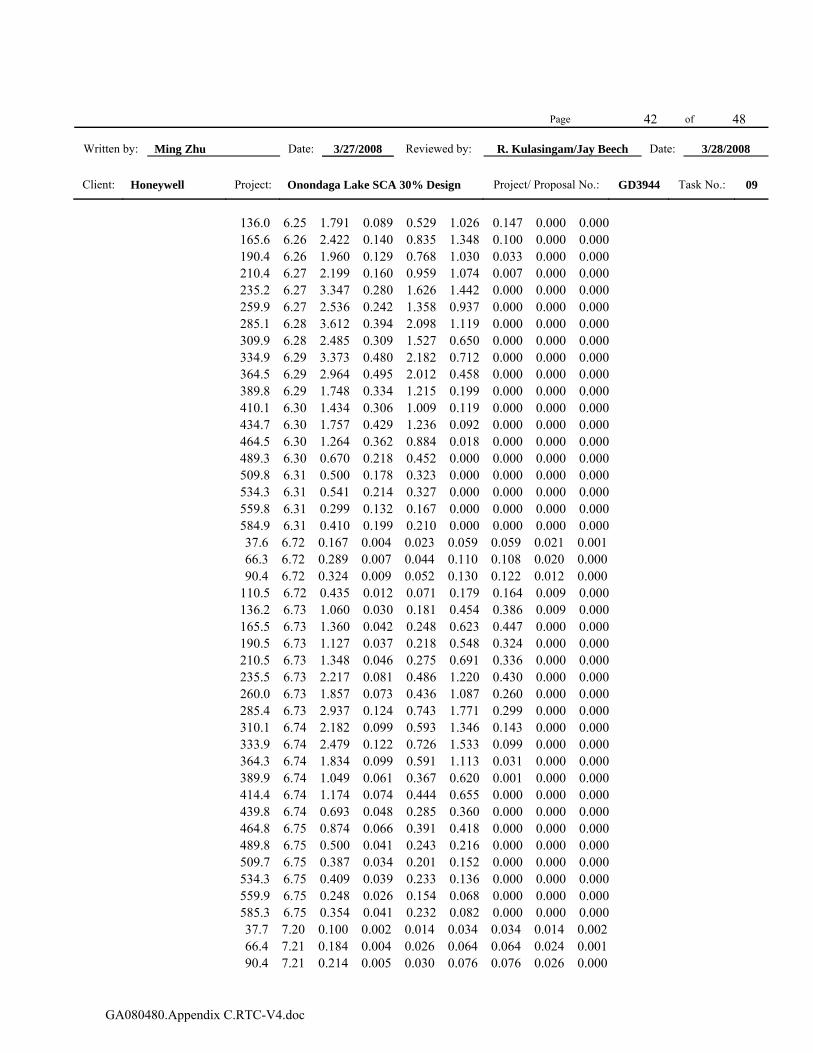
PSHA Deaggregation. %contributions. site: Lake_Onondaga long: 76.20000 W., lat: 43.0600 N. Return period: 475yrs. 2.00 s. PSA =0.0127989g. Computed annual rate=.21076E-02
DIST(KM) MAG(MW) ALL-EPS EPSILON>2 1<EPS<2 0<EPS<1 -1<EPS<0 -2<EPS<-1 EPS<-2 13.1 4.87 0.121 0.037 0.065 0.019 0.001 0.000 0.000 13.7 5.27 0.250 0.022 0.091 0.106 0.029 0.001 0.000 35.4 5.30 0.262 0.044 0.134 0.082 0.002 0.000 0.000 64.1 5.33 0.163 0.062 0.094 0.007 0.000 0.000 0.000 89.6 5.34 0.090 0.054 0.036 0.000 0.000 0.000 0.000 114.5 5.35 0.115 0.087 0.028 0.000 0.000 0.000 0.000 138.7 5.35 0.101 0.090 0.011 0.000 0.000 0.000 0.000 164.8 5.36 0.133 0.130 0.003 0.000 0.000 0.000 0.000 190.1 5.36 0.082 0.082 0.000 0.000 0.000 0.000 0.000 210.1 5.36 0.076 0.076 0.000 0.000 0.000 0.000 0.000 234.6 5.37 0.093 0.093 0.000 0.000 0.000 0.000 0.000 259.7 5.37 0.057 0.057 0.000 0.000 0.000 0.000 0.000 284.5 5.37 0.067 0.067 0.000 0.000 0.000 0.000 0.000 13.6 5.71 0.212 0.006 0.037 0.091 0.067 0.010 0.000 36.1 5.74 0.522 0.027 0.155 0.255 0.082 0.002 0.000 65.2 5.76 0.514 0.051 0.226 0.219 0.018 0.000 0.000 90.0 5.77 0.418 0.060 0.233 0.125 0.000 0.000 0.000 110.3 5.78 0.474 0.083 0.292 0.099 0.000 0.000 0.000 135.6 5.78 0.974 0.210 0.633 0.130 0.000 0.000 0.000 165.3 5.79 1.135 0.311 0.760 0.064 0.000 0.000 0.000 190.3 5.79 0.816 0.275 0.521 0.021 0.000 0.000 0.000 210.3 5.80 0.841 0.330 0.510 0.002 0.000 0.000 0.000 234.9 5.80 1.164 0.525 0.639 0.000 0.000 0.000 0.000 259.8 5.81 0.805 0.413 0.392 0.000 0.000 0.000 0.000 284.8 5.81 1.048 0.621 0.427 0.000 0.000 0.000 0.000 309.9 5.81 0.662 0.434 0.228 0.000 0.000 0.000 0.000 334.7 5.82 0.828 0.593 0.235 0.000 0.000 0.000 0.000 364.3 5.82 0.662 0.536 0.126 0.000 0.000 0.000 0.000 389.7 5.82 0.361 0.318 0.043 0.000 0.000 0.000 0.000 410.0 5.82 0.278 0.251 0.026 0.000 0.000 0.000 0.000 434.5 5.83 0.315 0.296 0.019 0.000 0.000 0.000 0.000 464.3 5.83 0.207 0.204 0.002 0.000 0.000 0.000 0.000 489.2 5.83 0.102 0.102 0.000 0.000 0.000 0.000 0.000 509.7 5.84 0.072 0.072 0.000 0.000 0.000 0.000 0.000 534.1 5.84 0.073 0.073 0.000 0.000 0.000 0.000 0.000 13.9 6.21 0.111 0.003 0.016 0.039 0.039 0.014 0.001 37.2 6.23 0.414 0.011 0.068 0.170 0.142 0.022 0.000 65.9 6.24 0.596 0.021 0.127 0.297 0.145 0.005 0.000 90.3 6.25 0.608 0.025 0.150 0.331 0.102 0.000 0.000 110.4 6.25 0.777 0.035 0.207 0.439 0.096 0.000 0.000
Page 42 of 48
Written by: Ming Zhu Date: 3/27/2008 Reviewed by: R. Kulasingam/Jay Beech Date: 3/28/2008
Client: Honeywell Project: Onondaga Lake SCA 30% Design Project/ Proposal No.: GD3944 Task No.: 09
GA080480.Appendix C.RTC-V4.doc
136.0 6.25 1.791 0.089 0.529 1.026 0.147 0.000 0.000 165.6 6.26 2.422 0.140 0.835 1.348 0.100 0.000 0.000 190.4 6.26 1.960 0.129 0.768 1.030 0.033 0.000 0.000 210.4 6.27 2.199 0.160 0.959 1.074 0.007 0.000 0.000 235.2 6.27 3.347 0.280 1.626 1.442 0.000 0.000 0.000 259.9 6.27 2.536 0.242 1.358 0.937 0.000 0.000 0.000 285.1 6.28 3.612 0.394 2.098 1.119 0.000 0.000 0.000 309.9 6.28 2.485 0.309 1.527 0.650 0.000 0.000 0.000 334.9 6.29 3.373 0.480 2.182 0.712 0.000 0.000 0.000 364.5 6.29 2.964 0.495 2.012 0.458 0.000 0.000 0.000 389.8 6.29 1.748 0.334 1.215 0.199 0.000 0.000 0.000 410.1 6.30 1.434 0.306 1.009 0.119 0.000 0.000 0.000 434.7 6.30 1.757 0.429 1.236 0.092 0.000 0.000 0.000 464.5 6.30 1.264 0.362 0.884 0.018 0.000 0.000 0.000 489.3 6.30 0.670 0.218 0.452 0.000 0.000 0.000 0.000 509.8 6.31 0.500 0.178 0.323 0.000 0.000 0.000 0.000 534.3 6.31 0.541 0.214 0.327 0.000 0.000 0.000 0.000 559.8 6.31 0.299 0.132 0.167 0.000 0.000 0.000 0.000 584.9 6.31 0.410 0.199 0.210 0.000 0.000 0.000 0.000 37.6 6.72 0.167 0.004 0.023 0.059 0.059 0.021 0.001 66.3 6.72 0.289 0.007 0.044 0.110 0.108 0.020 0.000 90.4 6.72 0.324 0.009 0.052 0.130 0.122 0.012 0.000 110.5 6.72 0.435 0.012 0.071 0.179 0.164 0.009 0.000 136.2 6.73 1.060 0.030 0.181 0.454 0.386 0.009 0.000 165.5 6.73 1.360 0.042 0.248 0.623 0.447 0.000 0.000 190.5 6.73 1.127 0.037 0.218 0.548 0.324 0.000 0.000 210.5 6.73 1.348 0.046 0.275 0.691 0.336 0.000 0.000 235.5 6.73 2.217 0.081 0.486 1.220 0.430 0.000 0.000 260.0 6.73 1.857 0.073 0.436 1.087 0.260 0.000 0.000 285.4 6.73 2.937 0.124 0.743 1.771 0.299 0.000 0.000 310.1 6.74 2.182 0.099 0.593 1.346 0.143 0.000 0.000 333.9 6.74 2.479 0.122 0.726 1.533 0.099 0.000 0.000 364.3 6.74 1.834 0.099 0.591 1.113 0.031 0.000 0.000 389.9 6.74 1.049 0.061 0.367 0.620 0.001 0.000 0.000 414.4 6.74 1.174 0.074 0.444 0.655 0.000 0.000 0.000 439.8 6.74 0.693 0.048 0.285 0.360 0.000 0.000 0.000 464.8 6.75 0.874 0.066 0.391 0.418 0.000 0.000 0.000 489.8 6.75 0.500 0.041 0.243 0.216 0.000 0.000 0.000 509.7 6.75 0.387 0.034 0.201 0.152 0.000 0.000 0.000 534.3 6.75 0.409 0.039 0.233 0.136 0.000 0.000 0.000 559.9 6.75 0.248 0.026 0.154 0.068 0.000 0.000 0.000 585.3 6.75 0.354 0.041 0.232 0.082 0.000 0.000 0.000 37.7 7.20 0.100 0.002 0.014 0.034 0.034 0.014 0.002 66.4 7.21 0.184 0.004 0.026 0.064 0.064 0.024 0.001 90.4 7.21 0.214 0.005 0.030 0.076 0.076 0.026 0.000
Page 43 of 48
Written by: Ming Zhu Date: 3/27/2008 Reviewed by: R. Kulasingam/Jay Beech Date: 3/28/2008
Client: Honeywell Project: Onondaga Lake SCA 30% Design Project/ Proposal No.: GD3944 Task No.: 09
GA080480.Appendix C.RTC-V4.doc
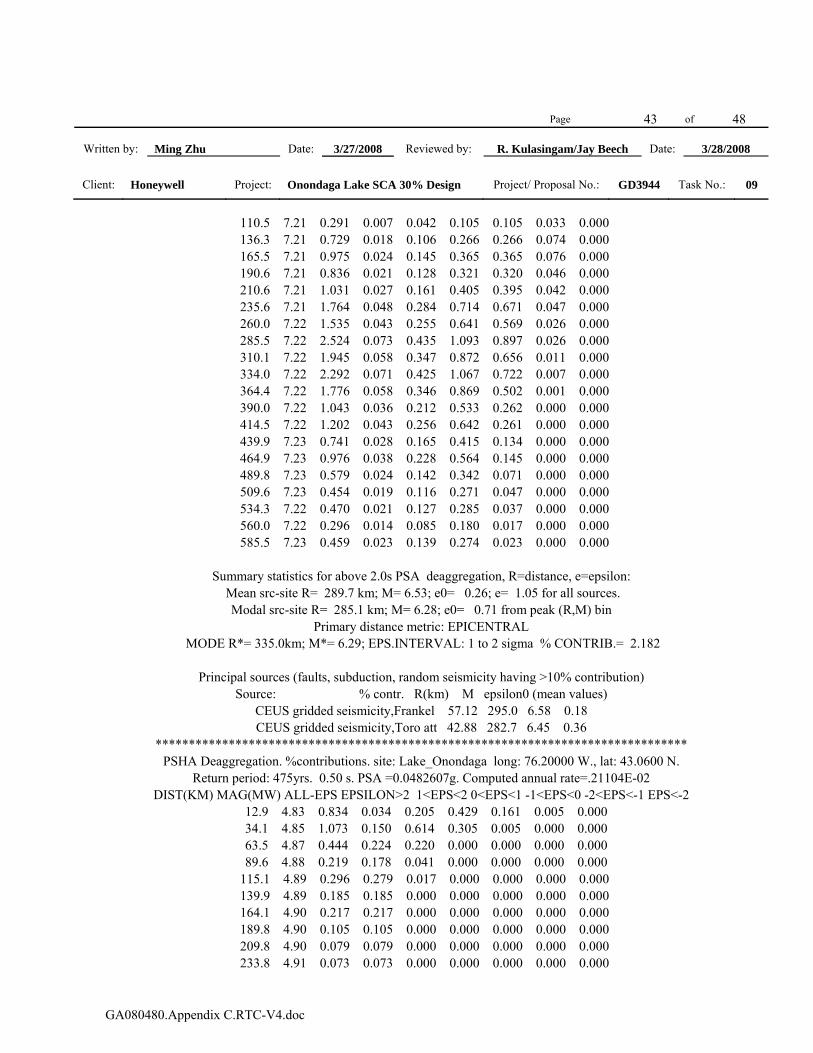
110.5 7.21 0.291 0.007 0.042 0.105 0.105 0.033 0.000 136.3 7.21 0.729 0.018 0.106 0.266 0.266 0.074 0.000 165.5 7.21 0.975 0.024 0.145 0.365 0.365 0.076 0.000 190.6 7.21 0.836 0.021 0.128 0.321 0.320 0.046 0.000 210.6 7.21 1.031 0.027 0.161 0.405 0.395 0.042 0.000 235.6 7.21 1.764 0.048 0.284 0.714 0.671 0.047 0.000 260.0 7.22 1.535 0.043 0.255 0.641 0.569 0.026 0.000 285.5 7.22 2.524 0.073 0.435 1.093 0.897 0.026 0.000 310.1 7.22 1.945 0.058 0.347 0.872 0.656 0.011 0.000 334.0 7.22 2.292 0.071 0.425 1.067 0.722 0.007 0.000 364.4 7.22 1.776 0.058 0.346 0.869 0.502 0.001 0.000 390.0 7.22 1.043 0.036 0.212 0.533 0.262 0.000 0.000 414.5 7.22 1.202 0.043 0.256 0.642 0.261 0.000 0.000 439.9 7.23 0.741 0.028 0.165 0.415 0.134 0.000 0.000 464.9 7.23 0.976 0.038 0.228 0.564 0.145 0.000 0.000 489.8 7.23 0.579 0.024 0.142 0.342 0.071 0.000 0.000 509.6 7.23 0.454 0.019 0.116 0.271 0.047 0.000 0.000 534.3 7.22 0.470 0.021 0.127 0.285 0.037 0.000 0.000 560.0 7.22 0.296 0.014 0.085 0.180 0.017 0.000 0.000 585.5 7.23 0.459 0.023 0.139 0.274 0.023 0.000 0.000
Summary statistics for above 2.0s PSA deaggregation, R=distance, e=epsilon:
Mean src-site R= 289.7 km; M= 6.53; e0= 0.26; e= 1.05 for all sources. Modal src-site R= 285.1 km; M= 6.28; e0= 0.71 from peak (R,M) bin
Primary distance metric: EPICENTRAL MODE R*= 335.0km; M*= 6.29; EPS.INTERVAL: 1 to 2 sigma % CONTRIB.= 2.182
Principal sources (faults, subduction, random seismicity having >10% contribution)
Source: % contr. R(km) M epsilon0 (mean values) CEUS gridded seismicity,Frankel 57.12 295.0 6.58 0.18 CEUS gridded seismicity,Toro att 42.88 282.7 6.45 0.36
******************************************************************************** PSHA Deaggregation. %contributions. site: Lake_Onondaga long: 76.20000 W., lat: 43.0600 N.
Return period: 475yrs. 0.50 s. PSA =0.0482607g. Computed annual rate=.21104E-02 DIST(KM) MAG(MW) ALL-EPS EPSILON>2 1<EPS<2 0<EPS<1 -1<EPS<0 -2<EPS<-1 EPS<-2
12.9 4.83 0.834 0.034 0.205 0.429 0.161 0.005 0.000 34.1 4.85 1.073 0.150 0.614 0.305 0.005 0.000 0.000 63.5 4.87 0.444 0.224 0.220 0.000 0.000 0.000 0.000 89.6 4.88 0.219 0.178 0.041 0.000 0.000 0.000 0.000 115.1 4.89 0.296 0.279 0.017 0.000 0.000 0.000 0.000 139.9 4.89 0.185 0.185 0.000 0.000 0.000 0.000 0.000 164.1 4.90 0.217 0.217 0.000 0.000 0.000 0.000 0.000 189.8 4.90 0.105 0.105 0.000 0.000 0.000 0.000 0.000 209.8 4.90 0.079 0.079 0.000 0.000 0.000 0.000 0.000 233.8 4.91 0.073 0.073 0.000 0.000 0.000 0.000 0.000

Page 44 of 48
Written by: Ming Zhu Date: 3/27/2008 Reviewed by: R. Kulasingam/Jay Beech Date: 3/28/2008
Client: Honeywell Project: Onondaga Lake SCA 30% Design Project/ Proposal No.: GD3944 Task No.: 09
GA080480.Appendix C.RTC-V4.doc
13.7 5.22 0.575 0.015 0.089 0.224 0.211 0.035 0.000 35.8 5.24 1.420 0.065 0.390 0.780 0.184 0.001 0.000 64.6 5.26 1.108 0.123 0.642 0.342 0.001 0.000 0.000 89.9 5.27 0.768 0.145 0.552 0.072 0.000 0.000 0.000 112.3 5.28 0.923 0.254 0.650 0.020 0.000 0.000 0.000 136.3 5.28 1.225 0.442 0.783 0.000 0.000 0.000 0.000 164.6 5.29 1.264 0.691 0.573 0.000 0.000 0.000 0.000 190.0 5.29 0.730 0.525 0.205 0.000 0.000 0.000 0.000 210.0 5.30 0.627 0.528 0.099 0.000 0.000 0.000 0.000 234.3 5.30 0.691 0.655 0.036 0.000 0.000 0.000 0.000 260.8 5.31 0.414 0.414 0.000 0.000 0.000 0.000 0.000 285.1 5.31 0.345 0.345 0.000 0.000 0.000 0.000 0.000 309.5 5.31 0.188 0.188 0.000 0.000 0.000 0.000 0.000 333.9 5.32 0.184 0.184 0.000 0.000 0.000 0.000 0.000 363.6 5.32 0.109 0.109 0.000 0.000 0.000 0.000 0.000 13.9 5.70 0.268 0.006 0.037 0.093 0.093 0.035 0.002 37.0 5.70 0.955 0.027 0.162 0.408 0.328 0.029 0.000 65.4 5.72 1.170 0.051 0.305 0.672 0.142 0.000 0.000 90.1 5.73 1.029 0.060 0.360 0.590 0.019 0.000 0.000 110.2 5.73 1.184 0.083 0.495 0.606 0.000 0.000 0.000 135.6 5.73 2.368 0.212 1.248 0.908 0.000 0.000 0.000 165.1 5.74 2.650 0.335 1.736 0.579 0.000 0.000 0.000 190.2 5.75 1.781 0.308 1.287 0.186 0.000 0.000 0.000 210.2 5.75 1.717 0.384 1.270 0.063 0.000 0.000 0.000 234.6 5.75 2.164 0.670 1.490 0.004 0.000 0.000 0.000 259.6 5.76 1.349 0.571 0.779 0.000 0.000 0.000 0.000 284.5 5.76 1.564 0.865 0.699 0.000 0.000 0.000 0.000 309.7 5.77 0.877 0.594 0.283 0.000 0.000 0.000 0.000 334.2 5.77 0.956 0.764 0.192 0.000 0.000 0.000 0.000 363.9 5.77 0.640 0.594 0.046 0.000 0.000 0.000 0.000 389.5 5.78 0.299 0.297 0.001 0.000 0.000 0.000 0.000 409.8 5.78 0.202 0.202 0.000 0.000 0.000 0.000 0.000 434.1 5.78 0.195 0.195 0.000 0.000 0.000 0.000 0.000 463.9 5.79 0.105 0.105 0.000 0.000 0.000 0.000 0.000 14.0 6.21 0.114 0.003 0.015 0.039 0.039 0.015 0.002 37.5 6.22 0.471 0.011 0.068 0.170 0.170 0.051 0.001 66.0 6.22 0.749 0.021 0.127 0.319 0.265 0.016 0.000 90.3 6.23 0.774 0.025 0.150 0.377 0.221 0.001 0.000 110.4 6.23 0.974 0.035 0.206 0.518 0.214 0.000 0.000 135.9 6.23 2.181 0.088 0.529 1.274 0.291 0.000 0.000 165.5 6.24 2.808 0.140 0.833 1.693 0.142 0.000 0.000 190.3 6.24 2.146 0.128 0.767 1.226 0.025 0.000 0.000 210.3 6.25 2.286 0.160 0.957 1.168 0.001 0.000 0.000 235.0 6.25 3.243 0.279 1.663 1.300 0.000 0.000 0.000 259.8 6.25 2.269 0.242 1.384 0.644 0.000 0.000 0.000
Page 45 of 48
Written by: Ming Zhu Date: 3/27/2008 Reviewed by: R. Kulasingam/Jay Beech Date: 3/28/2008
Client: Honeywell Project: Onondaga Lake SCA 30% Design Project/ Proposal No.: GD3944 Task No.: 09
GA080480.Appendix C.RTC-V4.doc
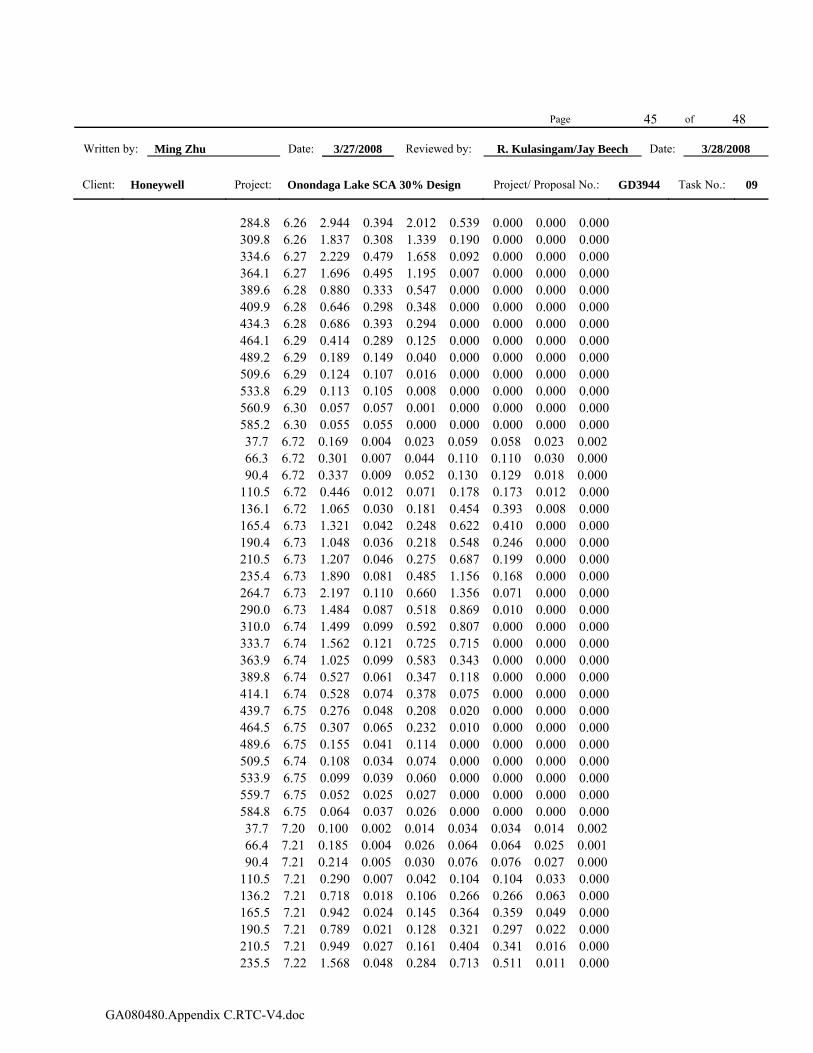
284.8 6.26 2.944 0.394 2.012 0.539 0.000 0.000 0.000 309.8 6.26 1.837 0.308 1.339 0.190 0.000 0.000 0.000 334.6 6.27 2.229 0.479 1.658 0.092 0.000 0.000 0.000 364.1 6.27 1.696 0.495 1.195 0.007 0.000 0.000 0.000 389.6 6.28 0.880 0.333 0.547 0.000 0.000 0.000 0.000 409.9 6.28 0.646 0.298 0.348 0.000 0.000 0.000 0.000 434.3 6.28 0.686 0.393 0.294 0.000 0.000 0.000 0.000 464.1 6.29 0.414 0.289 0.125 0.000 0.000 0.000 0.000 489.2 6.29 0.189 0.149 0.040 0.000 0.000 0.000 0.000 509.6 6.29 0.124 0.107 0.016 0.000 0.000 0.000 0.000 533.8 6.29 0.113 0.105 0.008 0.000 0.000 0.000 0.000 560.9 6.30 0.057 0.057 0.001 0.000 0.000 0.000 0.000 585.2 6.30 0.055 0.055 0.000 0.000 0.000 0.000 0.000 37.7 6.72 0.169 0.004 0.023 0.059 0.058 0.023 0.002 66.3 6.72 0.301 0.007 0.044 0.110 0.110 0.030 0.000 90.4 6.72 0.337 0.009 0.052 0.130 0.129 0.018 0.000 110.5 6.72 0.446 0.012 0.071 0.178 0.173 0.012 0.000 136.1 6.72 1.065 0.030 0.181 0.454 0.393 0.008 0.000 165.4 6.73 1.321 0.042 0.248 0.622 0.410 0.000 0.000 190.4 6.73 1.048 0.036 0.218 0.548 0.246 0.000 0.000 210.5 6.73 1.207 0.046 0.275 0.687 0.199 0.000 0.000 235.4 6.73 1.890 0.081 0.485 1.156 0.168 0.000 0.000 264.7 6.73 2.197 0.110 0.660 1.356 0.071 0.000 0.000 290.0 6.73 1.484 0.087 0.518 0.869 0.010 0.000 0.000 310.0 6.74 1.499 0.099 0.592 0.807 0.000 0.000 0.000 333.7 6.74 1.562 0.121 0.725 0.715 0.000 0.000 0.000 363.9 6.74 1.025 0.099 0.583 0.343 0.000 0.000 0.000 389.8 6.74 0.527 0.061 0.347 0.118 0.000 0.000 0.000 414.1 6.74 0.528 0.074 0.378 0.075 0.000 0.000 0.000 439.7 6.75 0.276 0.048 0.208 0.020 0.000 0.000 0.000 464.5 6.75 0.307 0.065 0.232 0.010 0.000 0.000 0.000 489.6 6.75 0.155 0.041 0.114 0.000 0.000 0.000 0.000 509.5 6.74 0.108 0.034 0.074 0.000 0.000 0.000 0.000 533.9 6.75 0.099 0.039 0.060 0.000 0.000 0.000 0.000 559.7 6.75 0.052 0.025 0.027 0.000 0.000 0.000 0.000 584.8 6.75 0.064 0.037 0.026 0.000 0.000 0.000 0.000 37.7 7.20 0.100 0.002 0.014 0.034 0.034 0.014 0.002 66.4 7.21 0.185 0.004 0.026 0.064 0.064 0.025 0.001 90.4 7.21 0.214 0.005 0.030 0.076 0.076 0.027 0.000 110.5 7.21 0.290 0.007 0.042 0.104 0.104 0.033 0.000 136.2 7.21 0.718 0.018 0.106 0.266 0.266 0.063 0.000 165.5 7.21 0.942 0.024 0.145 0.364 0.359 0.049 0.000 190.5 7.21 0.789 0.021 0.128 0.321 0.297 0.022 0.000 210.5 7.21 0.949 0.027 0.161 0.404 0.341 0.016 0.000 235.5 7.22 1.568 0.048 0.284 0.713 0.511 0.011 0.000
Page 46 of 48
Written by: Ming Zhu Date: 3/27/2008 Reviewed by: R. Kulasingam/Jay Beech Date: 3/28/2008
Client: Honeywell Project: Onondaga Lake SCA 30% Design Project/ Proposal No.: GD3944 Task No.: 09
GA080480.Appendix C.RTC-V4.doc
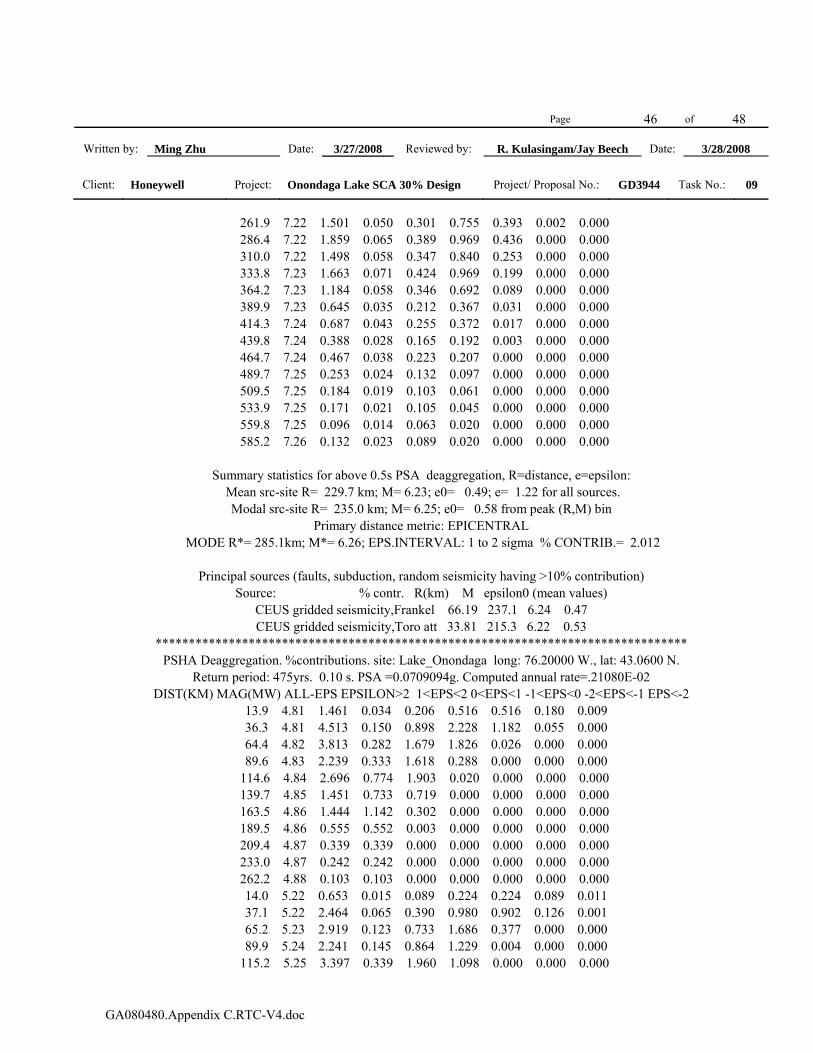
261.9 7.22 1.501 0.050 0.301 0.755 0.393 0.002 0.000 286.4 7.22 1.859 0.065 0.389 0.969 0.436 0.000 0.000 310.0 7.22 1.498 0.058 0.347 0.840 0.253 0.000 0.000 333.8 7.23 1.663 0.071 0.424 0.969 0.199 0.000 0.000 364.2 7.23 1.184 0.058 0.346 0.692 0.089 0.000 0.000 389.9 7.23 0.645 0.035 0.212 0.367 0.031 0.000 0.000 414.3 7.24 0.687 0.043 0.255 0.372 0.017 0.000 0.000 439.8 7.24 0.388 0.028 0.165 0.192 0.003 0.000 0.000 464.7 7.24 0.467 0.038 0.223 0.207 0.000 0.000 0.000 489.7 7.25 0.253 0.024 0.132 0.097 0.000 0.000 0.000 509.5 7.25 0.184 0.019 0.103 0.061 0.000 0.000 0.000 533.9 7.25 0.171 0.021 0.105 0.045 0.000 0.000 0.000 559.8 7.25 0.096 0.014 0.063 0.020 0.000 0.000 0.000 585.2 7.26 0.132 0.023 0.089 0.020 0.000 0.000 0.000
Summary statistics for above 0.5s PSA deaggregation, R=distance, e=epsilon:
Mean src-site R= 229.7 km; M= 6.23; e0= 0.49; e= 1.22 for all sources. Modal src-site R= 235.0 km; M= 6.25; e0= 0.58 from peak (R,M) bin
Primary distance metric: EPICENTRAL MODE R*= 285.1km; M*= 6.26; EPS.INTERVAL: 1 to 2 sigma % CONTRIB.= 2.012
Principal sources (faults, subduction, random seismicity having >10% contribution)
Source: % contr. R(km) M epsilon0 (mean values) CEUS gridded seismicity,Frankel 66.19 237.1 6.24 0.47 CEUS gridded seismicity,Toro att 33.81 215.3 6.22 0.53
******************************************************************************** PSHA Deaggregation. %contributions. site: Lake_Onondaga long: 76.20000 W., lat: 43.0600 N.
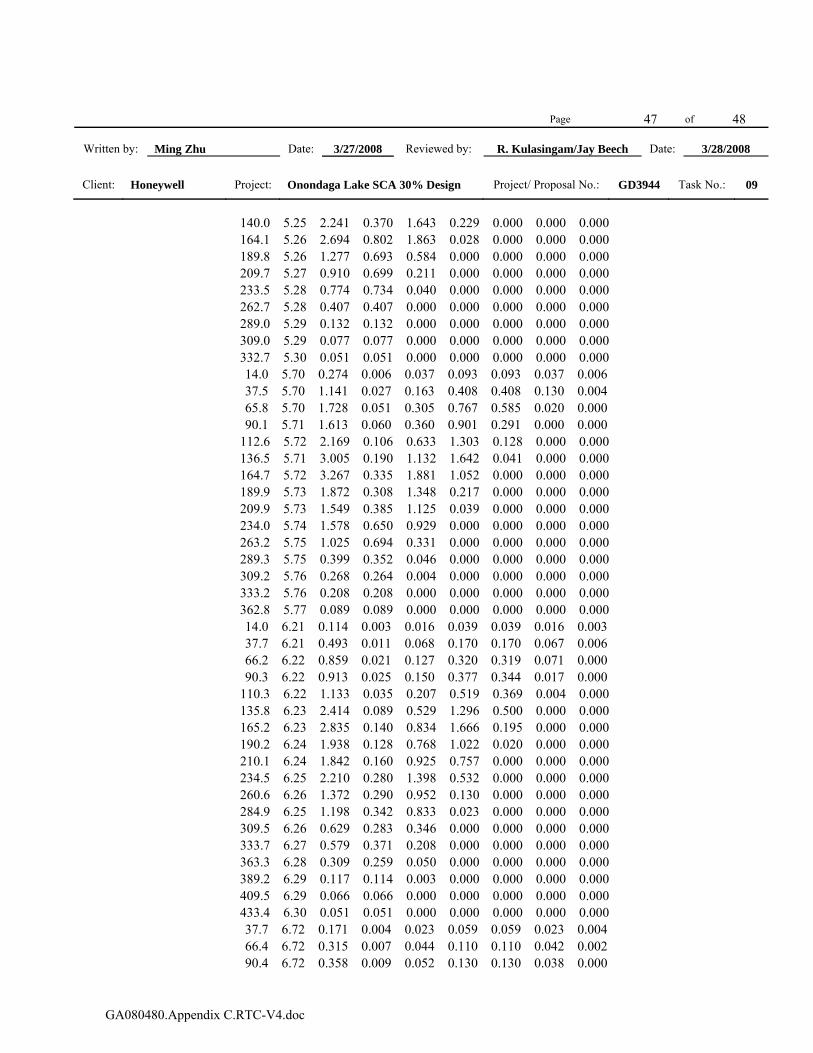
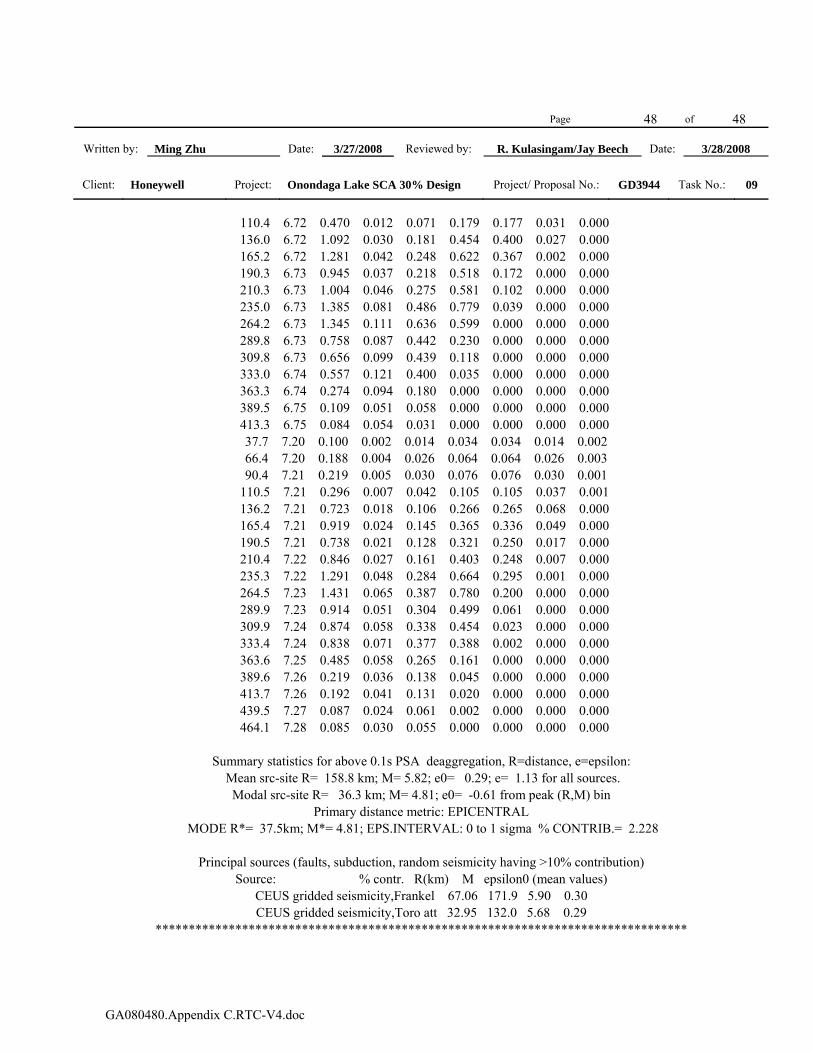
Return period: 475yrs. 0.10 s. PSA =0.0709094g. Computed annual rate=.21080E-02 DIST(KM) MAG(MW) ALL-EPS EPSILON>2 1<EPS<2 0<EPS<1 -1<EPS<0 -2<EPS<-1 EPS<-2
13.9 4.81 1.461 0.034 0.206 0.516 0.516 0.180 0.009 36.3 4.81 4.513 0.150 0.898 2.228 1.182 0.055 0.000 64.4 4.82 3.813 0.282 1.679 1.826 0.026 0.000 0.000 89.6 4.83 2.239 0.333 1.618 0.288 0.000 0.000 0.000 114.6 4.84 2.696 0.774 1.903 0.020 0.000 0.000 0.000 139.7 4.85 1.451 0.733 0.719 0.000 0.000 0.000 0.000 163.5 4.86 1.444 1.142 0.302 0.000 0.000 0.000 0.000 189.5 4.86 0.555 0.552 0.003 0.000 0.000 0.000 0.000 209.4 4.87 0.339 0.339 0.000 0.000 0.000 0.000 0.000 233.0 4.87 0.242 0.242 0.000 0.000 0.000 0.000 0.000 262.2 4.88 0.103 0.103 0.000 0.000 0.000 0.000 0.000 14.0 5.22 0.653 0.015 0.089 0.224 0.224 0.089 0.011 37.1 5.22 2.464 0.065 0.390 0.980 0.902 0.126 0.001 65.2 5.23 2.919 0.123 0.733 1.686 0.377 0.000 0.000 89.9 5.24 2.241 0.145 0.864 1.229 0.004 0.000 0.000 115.2 5.25 3.397 0.339 1.960 1.098 0.000 0.000 0.000
Page 47 of 48
Written by: Ming Zhu Date: 3/27/2008 Reviewed by: R. Kulasingam/Jay Beech Date: 3/28/2008
Client: Honeywell Project: Onondaga Lake SCA 30% Design Project/ Proposal No.: GD3944 Task No.: 09
GA080480.Appendix C.RTC-V4.doc
140.0 5.25 2.241 0.370 1.643 0.229 0.000 0.000 0.000 164.1 5.26 2.694 0.802 1.863 0.028 0.000 0.000 0.000 189.8 5.26 1.277 0.693 0.584 0.000 0.000 0.000 0.000 209.7 5.27 0.910 0.699 0.211 0.000 0.000 0.000 0.000 233.5 5.28 0.774 0.734 0.040 0.000 0.000 0.000 0.000 262.7 5.28 0.407 0.407 0.000 0.000 0.000 0.000 0.000 289.0 5.29 0.132 0.132 0.000 0.000 0.000 0.000 0.000 309.0 5.29 0.077 0.077 0.000 0.000 0.000 0.000 0.000 332.7 5.30 0.051 0.051 0.000 0.000 0.000 0.000 0.000 14.0 5.70 0.274 0.006 0.037 0.093 0.093 0.037 0.006 37.5 5.70 1.141 0.027 0.163 0.408 0.408 0.130 0.004 65.8 5.70 1.728 0.051 0.305 0.767 0.585 0.020 0.000 90.1 5.71 1.613 0.060 0.360 0.901 0.291 0.000 0.000 112.6 5.72 2.169 0.106 0.633 1.303 0.128 0.000 0.000 136.5 5.71 3.005 0.190 1.132 1.642 0.041 0.000 0.000 164.7 5.72 3.267 0.335 1.881 1.052 0.000 0.000 0.000 189.9 5.73 1.872 0.308 1.348 0.217 0.000 0.000 0.000 209.9 5.73 1.549 0.385 1.125 0.039 0.000 0.000 0.000 234.0 5.74 1.578 0.650 0.929 0.000 0.000 0.000 0.000 263.2 5.75 1.025 0.694 0.331 0.000 0.000 0.000 0.000 289.3 5.75 0.399 0.352 0.046 0.000 0.000 0.000 0.000 309.2 5.76 0.268 0.264 0.004 0.000 0.000 0.000 0.000 333.2 5.76 0.208 0.208 0.000 0.000 0.000 0.000 0.000 362.8 5.77 0.089 0.089 0.000 0.000 0.000 0.000 0.000 14.0 6.21 0.114 0.003 0.016 0.039 0.039 0.016 0.003 37.7 6.21 0.493 0.011 0.068 0.170 0.170 0.067 0.006 66.2 6.22 0.859 0.021 0.127 0.320 0.319 0.071 0.000 90.3 6.22 0.913 0.025 0.150 0.377 0.344 0.017 0.000 110.3 6.22 1.133 0.035 0.207 0.519 0.369 0.004 0.000 135.8 6.23 2.414 0.089 0.529 1.296 0.500 0.000 0.000 165.2 6.23 2.835 0.140 0.834 1.666 0.195 0.000 0.000 190.2 6.24 1.938 0.128 0.768 1.022 0.020 0.000 0.000 210.1 6.24 1.842 0.160 0.925 0.757 0.000 0.000 0.000 234.5 6.25 2.210 0.280 1.398 0.532 0.000 0.000 0.000 260.6 6.26 1.372 0.290 0.952 0.130 0.000 0.000 0.000 284.9 6.25 1.198 0.342 0.833 0.023 0.000 0.000 0.000 309.5 6.26 0.629 0.283 0.346 0.000 0.000 0.000 0.000 333.7 6.27 0.579 0.371 0.208 0.000 0.000 0.000 0.000 363.3 6.28 0.309 0.259 0.050 0.000 0.000 0.000 0.000 389.2 6.29 0.117 0.114 0.003 0.000 0.000 0.000 0.000 409.5 6.29 0.066 0.066 0.000 0.000 0.000 0.000 0.000 433.4 6.30 0.051 0.051 0.000 0.000 0.000 0.000 0.000 37.7 6.72 0.171 0.004 0.023 0.059 0.059 0.023 0.004 66.4 6.72 0.315 0.007 0.044 0.110 0.110 0.042 0.002 90.4 6.72 0.358 0.009 0.052 0.130 0.130 0.038 0.000
Page 48 of 48
Written by: Ming Zhu Date: 3/27/2008 Reviewed by: R. Kulasingam/Jay Beech Date: 3/28/2008
Client: Honeywell Project: Onondaga Lake SCA 30% Design Project/ Proposal No.: GD3944 Task No.: 09
GA080480.Appendix C.RTC-V4.doc
110.4 6.72 0.470 0.012 0.071 0.179 0.177 0.031 0.000 136.0 6.72 1.092 0.030 0.181 0.454 0.400 0.027 0.000 165.2 6.72 1.281 0.042 0.248 0.622 0.367 0.002 0.000 190.3 6.73 0.945 0.037 0.218 0.518 0.172 0.000 0.000 210.3 6.73 1.004 0.046 0.275 0.581 0.102 0.000 0.000 235.0 6.73 1.385 0.081 0.486 0.779 0.039 0.000 0.000 264.2 6.73 1.345 0.111 0.636 0.599 0.000 0.000 0.000 289.8 6.73 0.758 0.087 0.442 0.230 0.000 0.000 0.000 309.8 6.73 0.656 0.099 0.439 0.118 0.000 0.000 0.000 333.0 6.74 0.557 0.121 0.400 0.035 0.000 0.000 0.000 363.3 6.74 0.274 0.094 0.180 0.000 0.000 0.000 0.000 389.5 6.75 0.109 0.051 0.058 0.000 0.000 0.000 0.000 413.3 6.75 0.084 0.054 0.031 0.000 0.000 0.000 0.000 37.7 7.20 0.100 0.002 0.014 0.034 0.034 0.014 0.002 66.4 7.20 0.188 0.004 0.026 0.064 0.064 0.026 0.003 90.4 7.21 0.219 0.005 0.030 0.076 0.076 0.030 0.001 110.5 7.21 0.296 0.007 0.042 0.105 0.105 0.037 0.001 136.2 7.21 0.723 0.018 0.106 0.266 0.265 0.068 0.000 165.4 7.21 0.919 0.024 0.145 0.365 0.336 0.049 0.000 190.5 7.21 0.738 0.021 0.128 0.321 0.250 0.017 0.000 210.4 7.22 0.846 0.027 0.161 0.403 0.248 0.007 0.000 235.3 7.22 1.291 0.048 0.284 0.664 0.295 0.001 0.000 264.5 7.23 1.431 0.065 0.387 0.780 0.200 0.000 0.000 289.9 7.23 0.914 0.051 0.304 0.499 0.061 0.000 0.000 309.9 7.24 0.874 0.058 0.338 0.454 0.023 0.000 0.000 333.4 7.24 0.838 0.071 0.377 0.388 0.002 0.000 0.000 363.6 7.25 0.485 0.058 0.265 0.161 0.000 0.000 0.000 389.6 7.26 0.219 0.036 0.138 0.045 0.000 0.000 0.000 413.7 7.26 0.192 0.041 0.131 0.020 0.000 0.000 0.000 439.5 7.27 0.087 0.024 0.061 0.002 0.000 0.000 0.000 464.1 7.28 0.085 0.030 0.055 0.000 0.000 0.000 0.000
Summary statistics for above 0.1s PSA deaggregation, R=distance, e=epsilon:
Mean src-site R= 158.8 km; M= 5.82; e0= 0.29; e= 1.13 for all sources. Modal src-site R= 36.3 km; M= 4.81; e0= -0.61 from peak (R,M) bin
Primary distance metric: EPICENTRAL MODE R*= 37.5km; M*= 4.81; EPS.INTERVAL: 0 to 1 sigma % CONTRIB.= 2.228
Principal sources (faults, subduction, random seismicity having >10% contribution)
Source: % contr. R(km) M epsilon0 (mean values) CEUS gridded seismicity,Frankel 67.06 171.9 5.90 0.30 CEUS gridded seismicity,Toro att 32.95 132.0 5.68 0.29
********************************************************************************