Embed Size (px)
Citation preview
U.S. Department of the Interior Bureau of Reclamation August 2014
Habitat Assessment Final Report Shasta Dam Fish Passage Evaluation
United States Department of the Interior
Mid-Pacific Region
Bureau of Reclamation

Mission Statements
The mission of the Department of the Interior is to protect and provide
access to our Nation’s natural and cultural heritage and honor our trust
responsibilities to Indian Tribes and our commitments to island
communities.
The mission of the Bureau of Reclamation is to manage, develop, and
protect water and related resources in an environmentally and
economically sound manner in the interest of the American public.

Contents
FINAL – August 2014 – i
Contents
Page
Chapter 1 Introduction .................................................................................1 Purpose 2
Chapter 2 Methods ........................................................................................4 Data Collection .....................................................................................................4
Aquatic Habitat Inventory..........................................................................13 Habitat Suitability Assessment ..................................................................14 Spawner Capacity ........................................................................................3
Chapter 3 Results ..........................................................................................4 Sacramento River ..................................................................................................4
Aquatic Habitat Inventory............................................................................4 Habitat Suitability ......................................................................................12
Spawner Capacity ......................................................................................21 McCloud River....................................................................................................25
Aquatic Habitat Inventory..........................................................................25 Habitat Suitability ......................................................................................33 Spawner Capacity ......................................................................................40
Chapter 4 Synthesis and Conclusions .........................................................1 Historical Comparisons .........................................................................................1
Consideration of McCloud-Pit Hydroelectric Project Relicensing Study
Findings about Potential Suitable Salmon Spawning Habitat .....................5
Comparison of Habitat Conditions for the Sacramento and McCloud
Rivers 7
Concluding Considerations .................................................................................10
Chapter 5 References ....................................................................................1
Tables
Table 2-1. Reach-Scale Delineation for the Upper Sacramento River Used
for Assessment of Habitat Condition ...........................................................7
Table 2-2. Reach-Scale Delineation for the McCloud River Used for
Assessment of Habitat Condition.................................................................8
Table 2-3. Representative Field Sites Selected for Ground-Level Surveys
to Verify Videographic Interpretations over a Range of Channel
Types and in Locations Where Aerial Video Coverage was
Obscured in the Sacramento and McCloud Rivers ......................................9

Shasta Dam Fish Passage Evaluation
ii – FINAL – August 2014
Table 2-4. Literature Derived Chinook Salmon Spawning, Egg Incubation,
and Emergence Criteria Selected for a Reach-Scale Spawning
Habitat Condition Assessment on the Sacramento and McCloud
Rivers ...........................................................................................................1
Table 2-5. Literature Derived Chinook Salmon Rearing Habitat Criteria
Selected for a Reach-Scale Spawning Habitat Condition
Assessment on the Sacramento and McCloud Rivers .................................2
Table 3-1. Observations of Salmonid Redd Observations in the Upper
Sacramento and McCloud Rivers During January 2014 Fish
Habitat Surveys ............................................................................................6
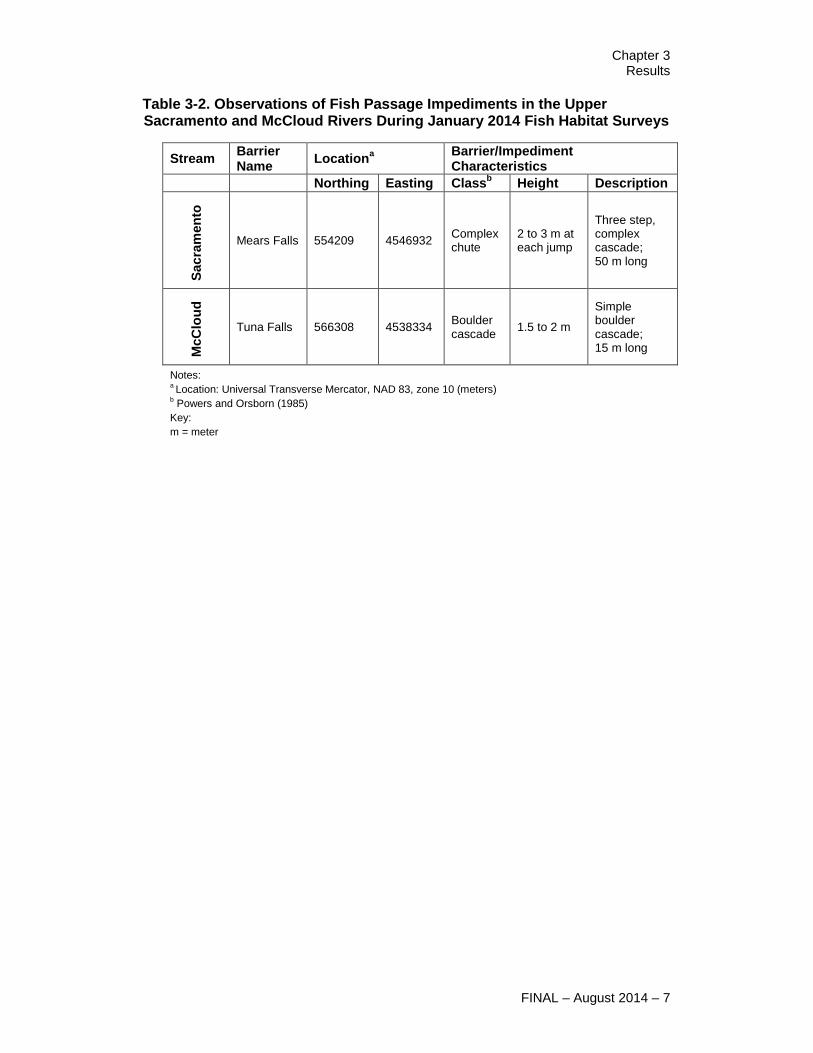
Table 3-2. Observations of Fish Passage Impediments in the Upper
Sacramento and McCloud Rivers During January 2014 Fish
Habitat Surveys ............................................................................................7
Table 3-3. Monthly Maximum Weekly Average Temperatures for the
Upper Sacramento River at Ten Monitoring Locations, with
Approximate River Mile, During May to October, Water Year
2012............................................................................................................13
Table 3-4. Monthly Maximum Weekly Average Temperatures for the
Upper Sacramento River at Delta (USGS Gage No. 11341500)
During May to October for Water Years 2003 to 2012 .............................13
Table 3-5. Aerial Video- and Field Survey-derived Chinook Salmon
Spawning, Egg Incubation, and Emergence Life Stage Habitat
Attributes Scores for the Upper Sacramento River Between Shasta
Lake and Box Canyon Dam .......................................................................14
Table 3-6. Aerial Video- and Field Survey-derived Chinook Salmon
Rearing Life Stage Habitat Attribute Scores for the Upper
Sacramento River Between Shasta Lake and Box Canyon Dam ...............17
Table 3-7. Aerial Video- and Field Survey-derived Estimates of Potential
Chinook Salmon Spawning Habitat Area and Potential Spawner
Capacity, as the Number of Female Salmon, by Study Reach, in
the Upper Sacramento River Between Shasta Lake and Box
Canyon Dam ..............................................................................................24
Table 3-8. Monthly Maximum Weekly Average Temperatures for the
McCloud River at Eight Monitoring Locations, with Approximate
River Mile, During May to October for Various Periods of Record,
Water Years 2003 to 2012 .........................................................................31
Table 3-9. Aerial Video- and Field Survey-derived Chinook Salmon
Spawning, Egg Incubation, and Emergence Life Stage Habitat
Attribute Scores for the McCloud River between Shasta Lake and
McCloud Dam ............................................................................................36
Contents
FINAL – August 2014 – iii
Table 3-10. Aerial Video- and Field Survey-derived Chinook Salmon
Rearing Life Stage Habitat Attribute Scores for the McCloud River
Between Shasta Lake and McCloud Dam .................................................37
Table 3-11. Aerial Video- and Field Survey-derived Estimates of Potential
Chinook Salmon Spawning Habitat Area and Potential Spawner
Capacity, as the Number of Females, by Study Reach, in the
McCloud River Between Shasta Lake and McCloud Dam .......................43
Table 4-1. Comparison of Historic (from Hanson, et al. 1940) Estimates of
Chinook Salmon Spawner Capacity, as the Number of Female
Salmon, with This Study for the Upper Sacramento River Between
Shasta Lake and Box Canyon Dam .............................................................2
Table 4-2. Comparison of Historic (from Hanson et al. 1940) Estimates of
Chinook Salmon Spawner Capacity, as the Number of Female
Salmon, with This Study for the McCloud River Between Shasta
Lake and Lower McCloud Falls ..................................................................4
Table 4-3. Weighted Usable Chinook Salmon Spawning Habitat Areas
Generated from Pacific Gas and Electric Company’s PHABSIM
Modeling Study and the Associated Extrapolations for Total
Spawning Habitat Area in the McCloud River Below McCloud
Dam over a Range of Flows.........................................................................6
Table 4-4. Estimates of Chinook Salmon Spawner Capacity, as the
Number of Female Salmon, Extrapolated from the Weighted
Usable Chinook Salmon Spawning Habitat-Flow Relationship
from Pacific Gas and Electric Company’s PHABSIM Modeling
Study for the McCloud River Below McCloud Dam over a Range
of Flows .......................................................................................................7
Table 4-5. Comparison of Habitat Attributes Scores for the Chinook
Salmon Spawning and Egg Incubation Life Stage in Thermally
Optimal Reaches of the Upper Sacramento River and McCloud
River Study Reaches ....................................................................................9
Table 4-6. Comparison of Habitat Attributes Scores for the Chinook
Salmon Rearing Life Stage in Thermally Optimal Reaches of the
Upper Sacramento River and McCloud River Study Reaches ..................10
Table 4-7. Comparison of Estimates of Chinook Salmon Spawner
Capacity, as the Number of Female Salmon, that Occurs in
Reaches of the Upper Sacramento River and McCloud River with
Summer Water Temperatures Within the Optimal Range for
Spawning and Egg Incubation ...................................................................10
Shasta Dam Fish Passage Evaluation
iv – FINAL – August 2014
Figures
Figure 2-1. Sacramento River Channel Profile between Shasta Lake and
Box Canyon Dam Illustrating Selected Study Reaches and
Representative Field Sites for the Shasta Dam Fish Passage
Evaluation During 2013 and 2014 .............................................................11
Figure 2-2. McCloud River Channel Profile Between Shasta Lake and
Lower McCloud Falls Illustrating Selected Study Reaches and
Representative Field Sites for the Shasta Dam Fish Passage
Evaluation During 2013 and 2014 .............................................................12
Figure 2-3. The Relationships of Habitat Inventory Metrics Measured
from Aerial Videography and Ground-Level Field Surveys of
Representative Sites to Habitat Attribute Metrics and Key Habitat
Attribute Groups and the Habitat Suitability Rating System .....................15
Figure 3-1. Photographs of Mears Falls on the Sacramento River ..........................8
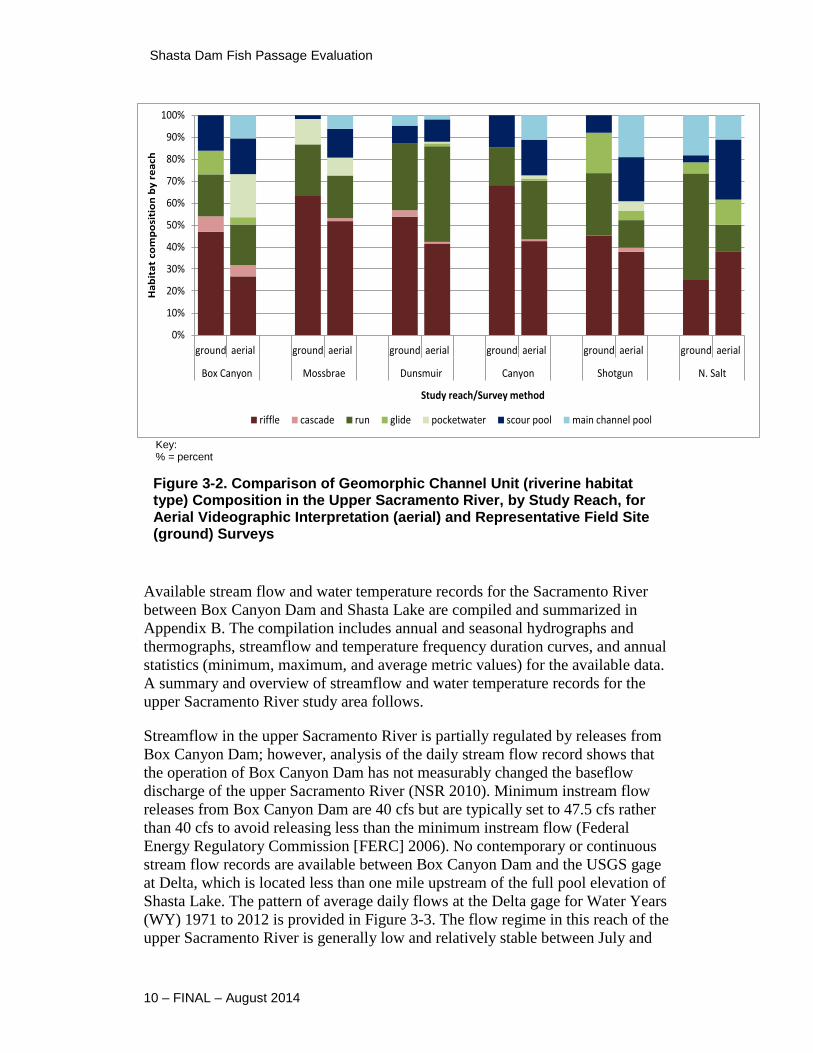
Figure 3-2. Comparison of Geomorphic Channel Unit (riverine habitat
type) Composition in the Upper Sacramento River, by Study
Reach, for Aerial Videographic Interpretation (aerial) and
Representative Field Site (ground) Surveys ..............................................10
Figure 3-3. Average Daily Flow for the Sacramento River at Delta (USGS
Gage No. 11341500) for Water Years 1971 to 2012 .................................11
Figure 3-4. Chinook Salmon Spawning Habitat Condition (derived from
aerial video interpretation) in the Upper Sacramento River
Between Shasta Lake and Box Canyon Dam ............................................17
Figure 3-5. Chinook Salmon Spawning Habitat Condition (derived from
field surveys) in the Upper Sacramento River Between Shasta
Lake and Box Canyon Dam .......................................................................18
Figure 3-6. Chinook Salmon Rearing Habitat Condition (derived from
aerial videographic interpretation) in the Upper Sacramento River
Between Shasta Lake and Box Canyon Dam ............................................19
Figure 3-7. Chinook Salmon Rearing Habitat Condition (derived from
field surveys) in the Upper Sacramento River Between Shasta
Lake and Box Canyon Dam .......................................................................20
Figure 3-8. Estimated Potentially Suitable Chinook Salmon Spawning
Habitat Area in the Upper Sacramento River, by Study Reach, for
Video- (upper panel) and Field-derived (lower panel) Estimates at
Baseflow and Ordinary High Water Mark (OHW) Stages ........................22
Figure 3-9. Estimated Chinook Salmon Spawner Capacities (number
females) in the Upper Sacramento River, by Study Reach, for
Aerial Video- (upper panel) and Field-derived (lower panel)
Estimates at Baseflow and Ordinary High Water Mark Stages for a

Contents
FINAL – August 2014 – v
Range of Literature-based Spawning Area Territory Requirements
from 6 Square Meters to 20 Square Meters ...............................................23
Figure 3-10. Comparison of Geomorphic Channel Unit (riverine habitat
type) Composition in the McCloud River, by Study Reach, for
Aerial Videographic Interpretation (aerial) and Representative
Field Site (ground) Surveys .......................................................................27
Figure 3-11. Photograph of Tuna Falls on the McCloud River near its
Confluence with Tuna Creek .....................................................................28
Figure 3-12. Average Daily Flow in the McCloud River above Shasta
Lake (USGS Gage No. 1136800) for Water Years 2003 to 2012 .............30
Figure 3-13. Daily Average Water Temperature between May and
November During 2006 to 2008 at Seven Locations on the
McCloud River from Above McCloud Reservoir to Shasta Lake .............32
Figure 3-14. Chinook Salmon Spawning Habitat Condition (derived from
aerial videographic interpretation) in the McCloud River Between
Shasta Lake and McCloud Dam ................................................................34
Figure 3-15. Chinook Salmon Spawning Habitat Condition (derived from
field surveys) in the McCloud River Between Shasta Lake and
McCloud Dam ............................................................................................35
Figure 3-16. Chinook Salmon Rearing Habitat Condition (derived from
aerial videographic interpretation) in the McCloud River Between
Shasta Lake and McCloud Dam ................................................................38
Figure 3-17. Chinook Salmon Rearing Habitat Condition (derived from
field surveys) in the McCloud River Between Shasta Lake and
McCloud Dam ............................................................................................39
Figure 3-18. Estimated Potentially Suitable Chinook Salmon Spawning
Habitat Area in the McCloud River, by Study Reach, for Video-
(upper panel) and Field-derived (lower panel) Estimates at
Baseflow and Ordinary High Water Mark (OHW) Stages ........................41
Figure 3-19. Estimated Chinook Salmon Spawner Capacities (number
females) in the McCloud River, by Study Reach, for Aerial Video-
(upper panel) and Field-derived (lower panel) Estimates at
Baseflow and Ordinary High Water Mark (OHW) Stages for a
Range of Literature-based Spawning Area Territory Requirements
from 6 Square Meters to 20 Square Meters ...............................................42

Shasta Dam Fish Passage Evaluation
vi – FINAL – August 2014
This page left blank intentionally.
Contents
FINAL – August 2014 – vii
Appendices
Appendix A: Framework for Assessment of Habitat Conditions to Inform
Planning for a Pilot-Level Chinook Salmon Reintroduction Study
Appendix B: Reach-Specific Habitat Inventories
Appendix C: Habitat Suitability Assessments

Shasta Dam Fish Passage Evaluation
viii – FINAL – August 2014
This page left blank intentionally.
Contents
FINAL – August 2014 – ix
Abbreviations and Acronyms
% percent
°C degrees Celsius
°F degrees Fahrenheit
< less than
> greater than
≤ less than or equal to
≥ greater than or equal to
BO Biological Opinion
CDFW California Department of
Fish and Wildlife
cfs cubic feet per second
D50 median particle size
Fq frequency
fT feet
ft2 square feet
GIS geographic information
system
GPS geographic positioning
system
IFPSC Interagency Fish Passage
Steering Committee
LWD large woody debris
m meters
m2 square meter
mm millimeter
Shasta Dam Fish Passage Evaluation
x – FINAL – August 2014
MMWAT monthly maximum weekly
average water temperatures
NMFS National Marine Fisheries
Services
OHW ordinary high water
PG&E Pacific Gas and Electric
Company
PHABSIM physical habitat simulation
Reclamation U.S. Department of the
Interior, Bureau of
Reclamation
RM river mile
RPA reasonable and prudent
alternative
sDVR spatial digital video recorder
SWFSC Southwest Fisheries Science
Center
USFWS U.S. Fish and Wildlife
Service
USGS U.S. Geological Survey
UTM Universal Transverse
Mercator
WUA weighted usable area
WY Water Years
Contents
FINAL – August 2014 – xi
Acknowledgements
Reclamation wishes to acknowledge several key contributors to this habitat
assessment effort. Pacific Gas and Electric Company provided river temperature,
fish habitat data, and aerial videography for the McCloud River collected as part
of their 2007 to 2010 relicensing studies for the McCloud-Pit Project. The
California Department of Water Resources shared a variety of biological and
physical data on the upper Sacramento and McCloud rivers. The Shasta-Trinity
National Forest provided data and information from watershed assessments
performed throughout the upper Sacramento and McCloud river watersheds. The
Nature Conservancy’s McCloud River Preserve (Drs. Ada Fowler and
Christopher Babcock) graciously shared temperature data and many years of
monitoring experience on the McCloud River, in addition to, providing
permission to access the McCloud River for these habitat surveys. Westlands
Water District provided permission to access the McCloud River for habitat
surveys through the Bollibokka Club. Union Pacific Railroad provided a
commercial permit to North State Resources, Inc., on behalf of Reclamation, to
conduct surveys of the upper Sacramento River along the Union Pacific railroad
corridor in the Sacramento River canyon. Reclamation also appreciates the
California Department of Fish and Wildlife for their assistance in sampling
salmonid redds encountered in the upper Sacramento River during the habitat
surveys. Finally, the members of the multi-agency California Fish Passage
Committee are recognized for their review and insightful comments and
suggestions on an earlier draft of this report.
Disclaimer
Mention of trade names in this report is for the sole purpose of documenting the
scientific methodology used for this habitat assessment and does not imply
endorsement by the U.S. government.


Shasta Dam Fish Passage Evaluation Chapter 2 Methods
FINAL – August 2014 – 1
This page left blank intentionally.
Shasta Dam Fish Passage Evaluation
2 – FINAL – August 2014
Chapter 1 Introduction
This habitat assessment report was prepared as part of the U.S. Department of the
Interior, Bureau of Reclamation’s (Reclamation) planning for a pilot-level study
to evaluate the feasibility of Chinook salmon reintroduction in tributaries
upstream from Shasta Lake. This is required by the reasonable and prudent
alternative (RPA) specified in the National Marine Fisheries Service’s 2009
Biological Opinion on Long-term Operations of the Central Valley Project and
State Water Project, as amended in 2011 (NMFS BO). Evaluation of habitat
conditions above dams is required by the RPA “Action V-Fish Passage Program”
as a priority action during the near-term phase of implementation of the RPA.
The primary objective of these habitat assessments has been further specified by
the Interagency Fish Passage Steering Committee (IFPSC), formed in 2010, to
quantify and characterize the location, amount, suitability, and functionality of
existing and/or potential spawning and rearing habitat above dams for
reintroduction of Chinook salmon listed under the Endangered Species Act.
Purpose
This report describes the findings of a habitat assessment conducted in accordance
with the Shasta Dam Fish Passage Evaluation Framework for Assessment of
Habitat Conditions to Inform Planning for a Pilot-Level Chinook Salmon
Reintroduction Study (Appendix A), hereafter, referred to as the “Habitat
Assessment Framework,” designed to inform development of the Shasta Dam Fish
Passage Pilot Implementation Plan. The primary purpose of this habitat
assessment is to describe habitat availability and conditions relative to the
requirements for the freshwater life stages of Chinook salmon being considered
for reintroduction rather than quantitatively predict the potential production of
Chinook salmon upstream from Shasta Dam. This approach provides sufficient
information for estimating the potential number of salmon that could be supported
by the existing habitat conditions for purposes of a pilot-level study. The
analytical tools consist of a spatially-explicit stream classification procedure; a set
of habitat suitability criteria derived from the literature; use of existing regionally
relevant data and information, augmented with aerial videography and limited
field verification surveys to fill data gaps; and assumptions concerning the
potential distribution and use of habitat by Chinook salmon in portions of the
watershed to which they have not had access for over 70 years.
This report is organized to 1) provide a brief summary of the methodology and
variances to the work plan described in the Habitat Assessment Framework
(Appendix A) that were required to implement this habitat assessment; 2) present
the findings of an aquatic habitat inventory and assessment of habitat conditions
relative to the freshwater life history requirements of Chinook salmon; and, 3)
based on the habitat assessment, provide preliminary estimates of the potential
number of Chinook salmon that could be supported by the existing habitat

Shasta Dam Fish Passage Evaluation Chapter 2 Methods
FINAL – August 2014 – 3
conditions in the upper Sacramento and McCloud rivers above Shasta Lake. To
the extent practical, existing information with relevance to aquatic habitat
conditions in the McCloud and Sacramento rivers above Shasta Dam was
incorporated and used in this assessment.

Shasta Dam Fish Passage Evaluation
4 – FINAL – August 2014
Chapter 2 Methods
This chapter provides a brief overview of the methods used to collect, compile,
and analyze data and information on aquatic habitat conditions in stream reaches
upstream of Shasta Lake on the Sacramento and McCloud rivers. These data are
used to characterize and assess the suitability and spatial distribution of the habitat
that would be available for different life stages of reintroduced anadromous
salmonids and to calculate a preliminary estimate of the potential number of
Chinook salmon the river could support. A detailed study plan and analytical
framework for conducting the Habitat Assessment Framework (Appendix A).
Data Collection
Relevant existing information applicable to the aquatic habitat assessment for the
McCloud and Sacramento rivers above Shasta Dam was obtained and cataloged
as part of the Habitat Assessment Framework (Appendix A). To supplement the
existing information on habitat conditions, geo-referenced aerial videography was
collected, along with limited ground-level surveys at locations representative of
the larger study area.
A helicopter flight service was contracted to obtain low-altitude, slow-flight aerial
videography along mainstem river channels and portions of significant tributaries
during base flow conditions. The river sections flown included the Sacramento
River from Shasta Lake to Box Canyon Dam, and the McCloud River from Shasta
Lake to McCloud Dam and from McCloud Lake to Lower McCloud Falls1.
Flights were conducted at the lowest practical altitude, usually 200 to 400 feet
above ground-level, where legal and safe, and at a ground-speed of 17 to 30 knots
(15-25 miles per hour). A Red Hen spatial digital video recorder (sDVR)
connected to a geographic positioning system (GPS) and a Sony HDR–PJ790V
video camcorder (set to 720 x 576 pixel video resolution for compatibility with
the sDVR) was used to simultaneously obtain aerial video images and GPS
coordinates. Flight altitudes were periodically recorded to an audio channel in the
video files, which were used to calibrate lineal distances measured from the video
images. Video files collected with the sDVR were analyzed directly within a
geographic information system (GIS) platform using specialized extension
software for videographic mapping.
To the extent possible, within the level of resolution of video images, geomorphic
channel units were visually assigned to channel center line features in the GIS
following the Level III habitat typing convention described in the U.S. Forest
1 Aerial videography was postponed and completed in late-November 2013 rather than in October
as proposed in the Habitat Assessment Framework because of temporary work order suspensions resulting from the Federal Government shutdown in 2013.
Shasta Dam Fish Passage Evaluation Chapter 2 Methods
FINAL – August 2014 – 5
Service Pacific Southwest Region Stream Condition Inventory Technical Guide
(Frazier et al. 2005), which is comparable to the methodology of historic surveys
of the McCloud River (McCloud Coordinated Resource Management Plan 2001)
and the Sacramento River (Thomas R. Payne & Associates 1992). The only
exception to this habitat classification scheme was for describing flatwater
geomorphic channel units, which were classified according to the Level IV habitat
typing conventions, a higher level of detail used to identify specific habitat
attributes important in assessing habitat function. For each geomorphic channel
unit, habitat parameters associated with channel morphology (e.g. unit lengths,
channel widths and depths), substrate, and bank condition were determined.
Characterization of riverbed substrates was limited in the videos to determination
of only dominant and subdominant bed sediment particle classes. Unfortunately,
video coverage and detail was not sufficient to confidently apply cover shelter
rating values. This was because aerial videography was obtained during the fall
month, after much of the in-channel and near shore vegetation, which can provide
some overhead cover, had died back.
Key features associated with pools, specifically the differentiation of deep and
shallow pools, pools with suitable spawning gravel on their downstream tailouts,
and areal extents of potentially suitable spawning gravel patches on pool tailouts,
and elsewhere, were measured from the video images and recorded in the GIS
database. Approximate areas of suitable spawning gravel on pool tailouts and
riffle features were measured for the river stage at the time of video collection
(approximately baseflow) and at the ordinary high water (OHW) mark. The OHW
mark, in this case, is thought to represent the typical stage of the study streams at
flows when the winter-run Chinook salmon spawns during the spring to early-
summer months. Indicators of the OHW mark consisted of a distinct demarcation
of the extent of terrestrial plant establishment between the active channel and
floodplain, if any, but, in no case, extended above the bankfull elevation. Gravel
areas on these channel features were assumed to provide generally suitable
spawning conditions in terms of gravel area, water depth and velocity, if gravel
deposits were at least one square meter (m2) in area and would be inundated to a
depth of at least 0.15 meters (m) (6-inches) under the targeted river stages, which
were at baseflow and the OHW mark stages. Where spawning gravel deposits, at
least 1m2, occurred in discontinuous patches within a habitat unit, the sum total of
the areas of the gravel patches and the number of contributing patches was
recorded.
Ground-level surveys were performed at a number of representative sites on each
study stream to verify videographic interpretations across a range of channel types
and in locations where aerial videography was obscured or in specific areas of
interest with unique habitat features or transitional conditions (e.g., increased
sediment deposition). Each of the study streams was divided into a series of
relatively homogeneous study reaches. Study reaches were individually
designated based on geomorphic and physiographic characteristics along the
length of each stream (Tables 2-1 and 2-2).

Shasta Dam Fish Passage Evaluation
6 – FINAL – August 2014
Up to ten representative sites in the Sacramento River between Shasta Lake and
Box Canyon Dam and in the McCloud River between Shasta Lake and McCloud
Dam were originally selected for ground-level surveys. Late-seasonal topographic
aspect shading and flight limitations due to weather conditions impeded video
quality for determining certain habitat parameters (e.g., geomorphic unit type,
channel dimensions, substrate composition, and cover) despite efforts to use
frame-by-frame sequences and adjusting the video display contrast during the
review. This required an expansion of the number and size of ground-level survey
sites to sufficiently characterize the available habitat. The expanded size and
effort to survey sites and the associated impact to budget expenditures for field
work limited the total number of field sites that could be completed on the
McCloud River. Additionally, access restrictions on private land, which borders
nearly the entire reach of the McCloud River below McCloud Dam and above
McCloud Reservoir to the Lower Falls, limited field sites to “Hawkins” and “Ah-
Di-Na” in the upper reach (Shasta-Trinity National Forest) and “Ladybug” in
middle reach (The Nature Concervancy’s (TNC) McCloud River Preserve), and
none in the lower or headwaters reaches. Access to the lower reach was granted
by Westlands Water District, but exhausted budget for field effort prevented the
survey completion. As a result, 11 representative sites were surveyed on the upper
Sacramento River, but only three sites on the McCloud between McCloud Dam
and Ladybug Creek were able to be included in the this effort (Table 2-3).
Chapte
r 2
Meth
ods
FIN
AL –
August 2
014 –
7
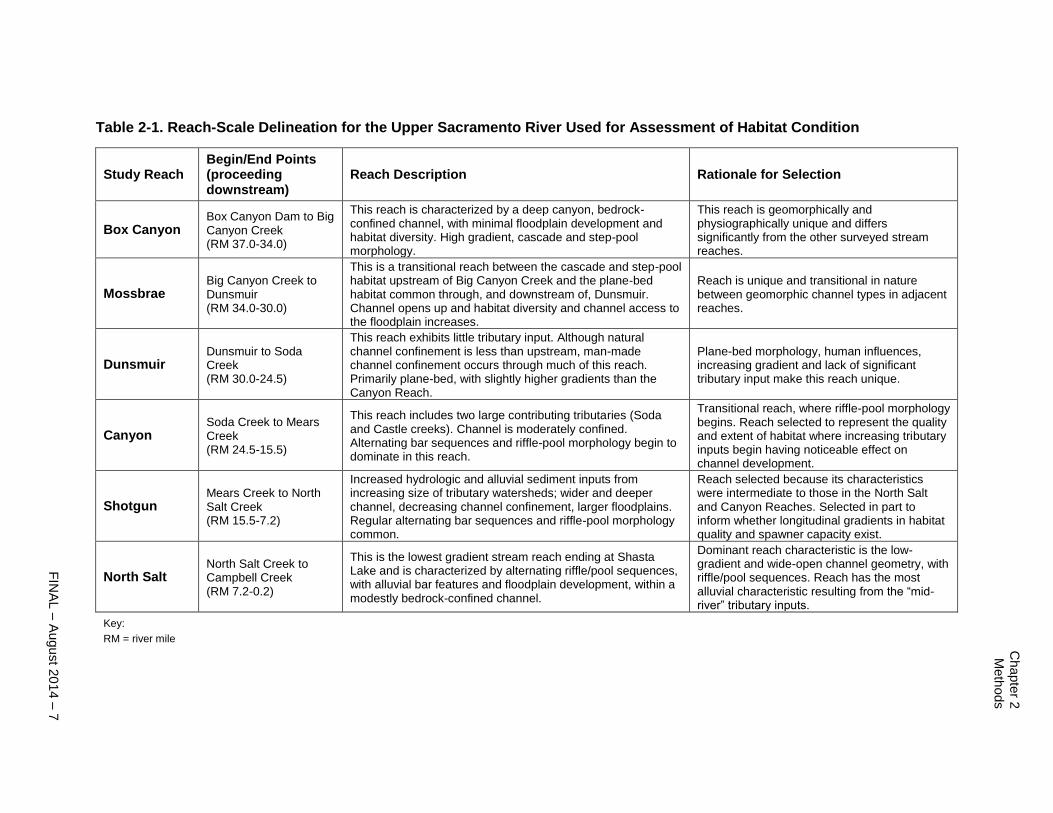
Table 2-1. Reach-Scale Delineation for the Upper Sacramento River Used for Assessment of Habitat Condition
Study Reach Begin/End Points (proceeding downstream)
Reach Description Rationale for Selection
Box Canyon Box Canyon Dam to Big Canyon Creek (RM 37.0-34.0)
This reach is characterized by a deep canyon, bedrock-confined channel, with minimal floodplain development and habitat diversity. High gradient, cascade and step-pool morphology.
This reach is geomorphically and physiographically unique and differs significantly from the other surveyed stream reaches.
Mossbrae Big Canyon Creek to Dunsmuir (RM 34.0-30.0)
This is a transitional reach between the cascade and step-pool habitat upstream of Big Canyon Creek and the plane-bed habitat common through, and downstream of, Dunsmuir. Channel opens up and habitat diversity and channel access to the floodplain increases.
Reach is unique and transitional in nature between geomorphic channel types in adjacent reaches.
Dunsmuir Dunsmuir to Soda Creek (RM 30.0-24.5)
This reach exhibits little tributary input. Although natural channel confinement is less than upstream, man-made channel confinement occurs through much of this reach. Primarily plane-bed, with slightly higher gradients than the Canyon Reach.
Plane-bed morphology, human influences, increasing gradient and lack of significant tributary input make this reach unique.
Canyon Soda Creek to Mears Creek (RM 24.5-15.5)
This reach includes two large contributing tributaries (Soda and Castle creeks). Channel is moderately confined. Alternating bar sequences and riffle-pool morphology begin to dominate in this reach.
Transitional reach, where riffle-pool morphology begins. Reach selected to represent the quality and extent of habitat where increasing tributary inputs begin having noticeable effect on channel development.
Shotgun Mears Creek to North Salt Creek (RM 15.5-7.2)
Increased hydrologic and alluvial sediment inputs from increasing size of tributary watersheds; wider and deeper channel, decreasing channel confinement, larger floodplains. Regular alternating bar sequences and riffle-pool morphology common.
Reach selected because its characteristics were intermediate to those in the North Salt and Canyon Reaches. Selected in part to inform whether longitudinal gradients in habitat quality and spawner capacity exist.
North Salt North Salt Creek to Campbell Creek (RM 7.2-0.2)
This is the lowest gradient stream reach ending at Shasta Lake and is characterized by alternating riffle/pool sequences, with alluvial bar features and floodplain development, within a modestly bedrock-confined channel.
Dominant reach characteristic is the low-gradient and wide-open channel geometry, with riffle/pool sequences. Reach has the most alluvial characteristic resulting from the “mid-river” tributary inputs.
Key:
RM = river mile
Shasta
Da
m F
ish P
assag
e E
valu
atio
n
8 –
FIN
AL –
August 2
014
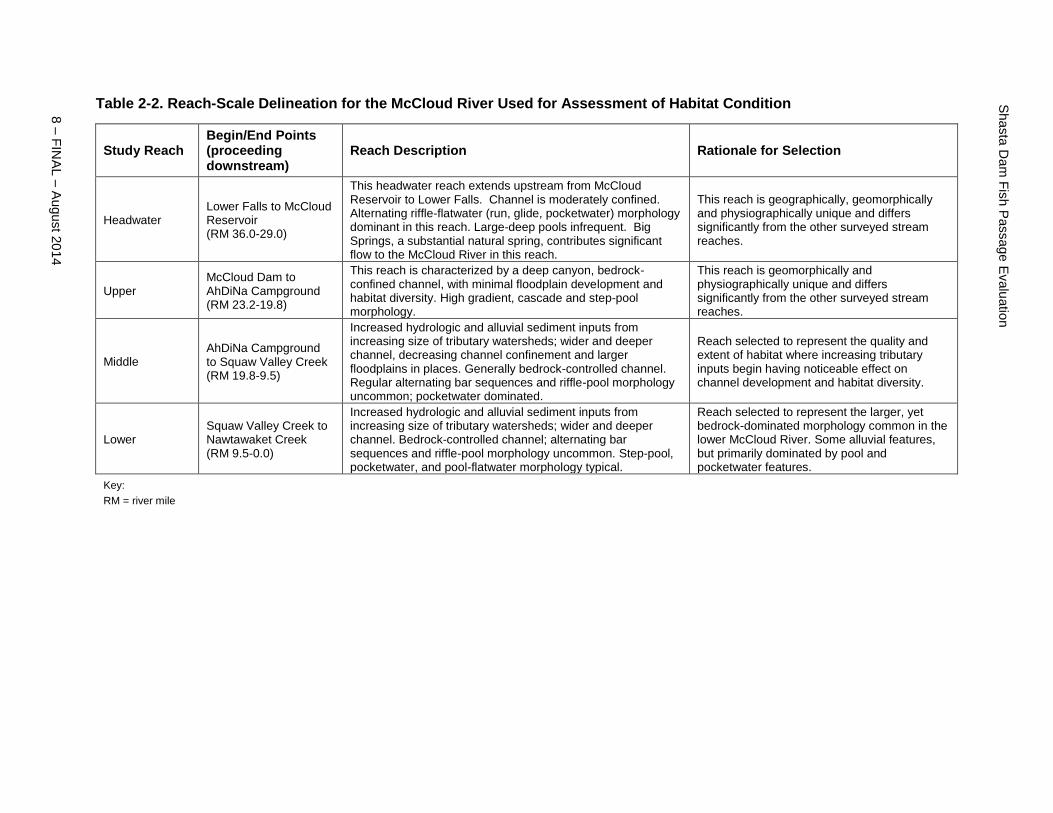
Table 2-2. Reach-Scale Delineation for the McCloud River Used for Assessment of Habitat Condition
Study Reach Begin/End Points (proceeding downstream)
Reach Description Rationale for Selection
Headwater Lower Falls to McCloud Reservoir (RM 36.0-29.0)
This headwater reach extends upstream from McCloud Reservoir to Lower Falls. Channel is moderately confined. Alternating riffle-flatwater (run, glide, pocketwater) morphology dominant in this reach. Large-deep pools infrequent. Big Springs, a substantial natural spring, contributes significant flow to the McCloud River in this reach.
This reach is geographically, geomorphically and physiographically unique and differs significantly from the other surveyed stream reaches.
Upper McCloud Dam to AhDiNa Campground (RM 23.2-19.8)
This reach is characterized by a deep canyon, bedrock-confined channel, with minimal floodplain development and habitat diversity. High gradient, cascade and step-pool morphology.
This reach is geomorphically and physiographically unique and differs significantly from the other surveyed stream reaches.
Middle AhDiNa Campground to Squaw Valley Creek (RM 19.8-9.5)
Increased hydrologic and alluvial sediment inputs from increasing size of tributary watersheds; wider and deeper channel, decreasing channel confinement and larger floodplains in places. Generally bedrock-controlled channel. Regular alternating bar sequences and riffle-pool morphology uncommon; pocketwater dominated.
Reach selected to represent the quality and extent of habitat where increasing tributary inputs begin having noticeable effect on channel development and habitat diversity.
Lower Squaw Valley Creek to Nawtawaket Creek (RM 9.5-0.0)
Increased hydrologic and alluvial sediment inputs from increasing size of tributary watersheds; wider and deeper channel. Bedrock-controlled channel; alternating bar sequences and riffle-pool morphology uncommon. Step-pool, pocketwater, and pool-flatwater morphology typical.
Reach selected to represent the larger, yet bedrock-dominated morphology common in the lower McCloud River. Some alluvial features, but primarily dominated by pool and pocketwater features.
Key:
RM = river mile
Chapter 2 Methods
FINAL – August 2014 – 9
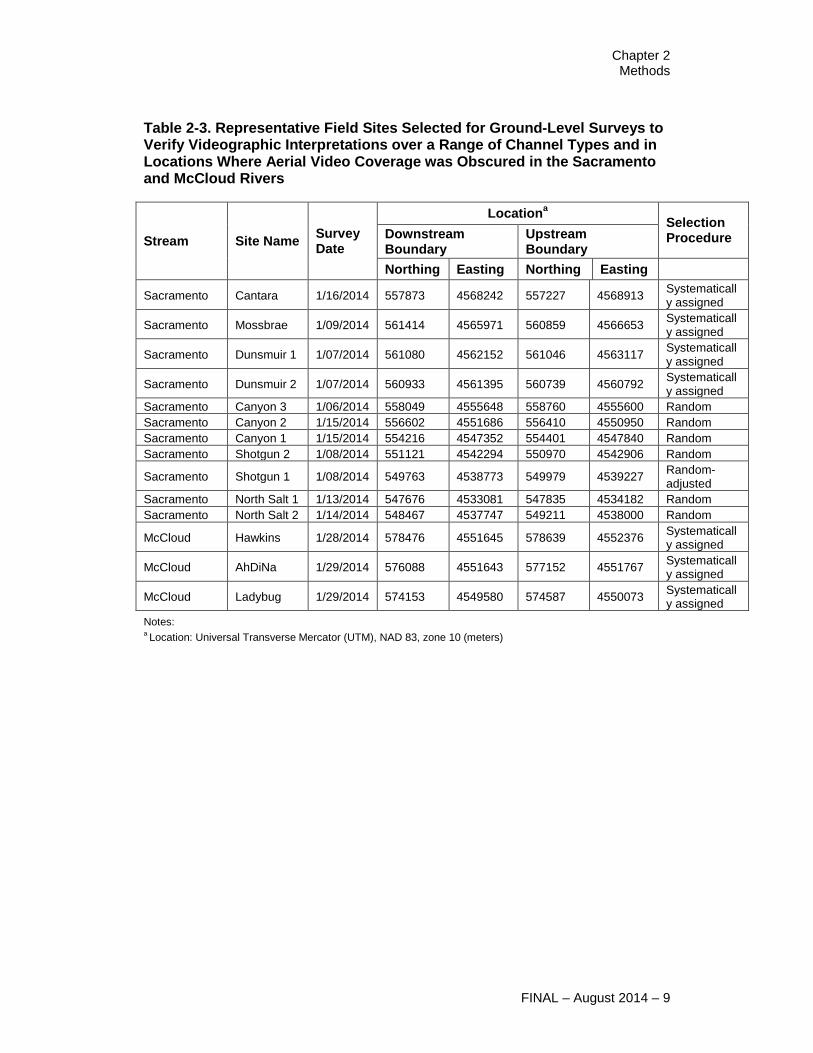
Table 2-3. Representative Field Sites Selected for Ground-Level Surveys to Verify Videographic Interpretations over a Range of Channel Types and in Locations Where Aerial Video Coverage was Obscured in the Sacramento and McCloud Rivers
Stream Site Name Survey Date
Locationa
Selection Procedure Downstream
Boundary Upstream Boundary
Northing Easting Northing Easting
Sacramento Cantara 1/16/2014 557873 4568242 557227 4568913 Systematically assigned
Sacramento Mossbrae 1/09/2014 561414 4565971 560859 4566653 Systematically assigned
Sacramento Dunsmuir 1 1/07/2014 561080 4562152 561046 4563117 Systematically assigned
Sacramento Dunsmuir 2 1/07/2014 560933 4561395 560739 4560792 Systematically assigned
Sacramento Canyon 3 1/06/2014 558049 4555648 558760 4555600 Random
Sacramento Canyon 2 1/15/2014 556602 4551686 556410 4550950 Random
Sacramento Canyon 1 1/15/2014 554216 4547352 554401 4547840 Random
Sacramento Shotgun 2 1/08/2014 551121 4542294 550970 4542906 Random
Sacramento Shotgun 1 1/08/2014 549763 4538773 549979 4539227 Random-adjusted
Sacramento North Salt 1 1/13/2014 547676 4533081 547835 4534182 Random
Sacramento North Salt 2 1/14/2014 548467 4537747 549211 4538000 Random
McCloud Hawkins 1/28/2014 578476 4551645 578639 4552376 Systematically assigned
McCloud AhDiNa 1/29/2014 576088 4551643 577152 4551767 Systematically assigned
McCloud Ladybug 1/29/2014 574153 4549580 574587 4550073 Systematically assigned
Notes: a Location: Universal Transverse Mercator (UTM), NAD 83, zone 10 (meters)
Shasta Dam Fish Passage Evaluation
10 – FINAL – August 2014
Representative sites were first assigned to reaches or channel segments where the
aerial videography was obscured to the extent that geomorphic channel units and
basic habitat parameters (e.g., substrate composition, channel widths and depths)
could not be determined. Remaining sites were allocated proportionally among
distinct reach types and survey starting points were selected at random (Figures 2-
1 and 2-22). Each representative site consisted of a length of stream channel equal
to at least 20 average bankfull channel widths, up to 1,000 m, depending on local
channel conditions and complexity. The minimum objective for each
representative site was to include at least one full channel meander wavelength, or
two riffle-pool sequences.
Field surveys included collection of data for an inventory of habitat types,
identification of potential migratory impediments created by some high-gradient
riffles and cascades, characterization of bed substrate composition,
characterization of type and extent of cover components, assignment of pool
complexity and shelter values, and estimation of the areal extent of suitable
spawning gravel (see the Habitat Assessment Framework (Appendix A) for
details on survey protocols).
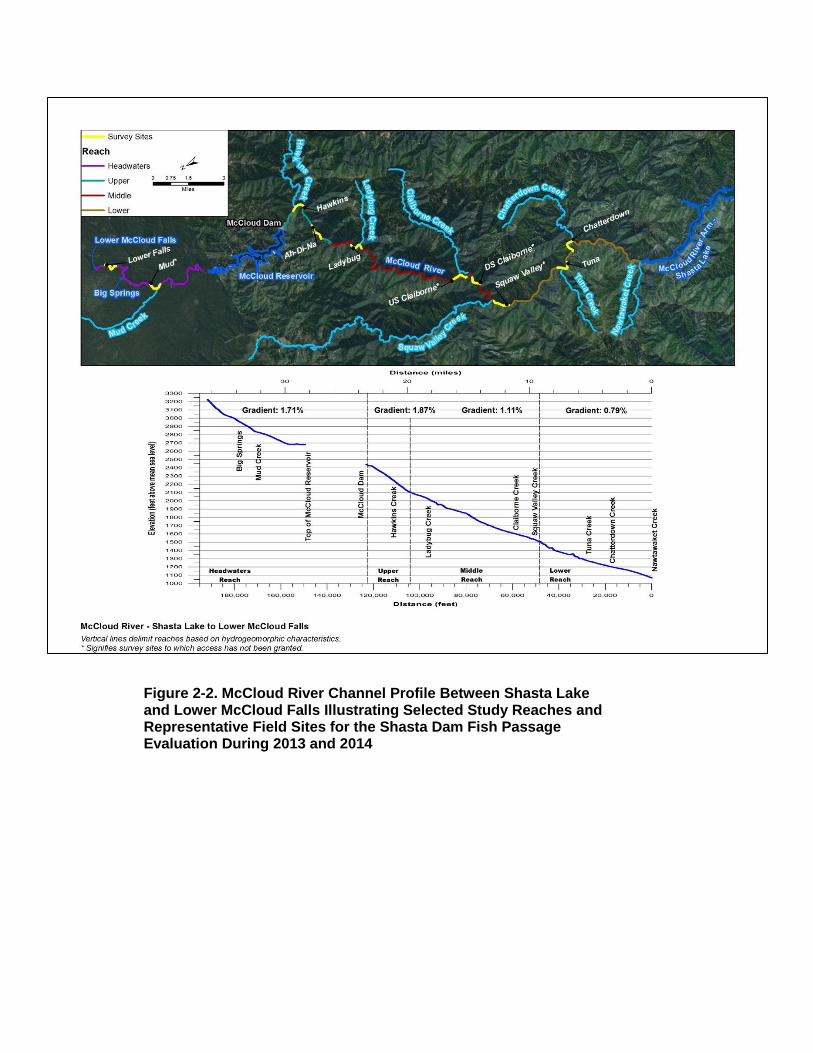
2 Only the first three survey sites from McCloud Dam downstream to Ladybug Creek on this figure
were included in the habitat assessment effort, to date.
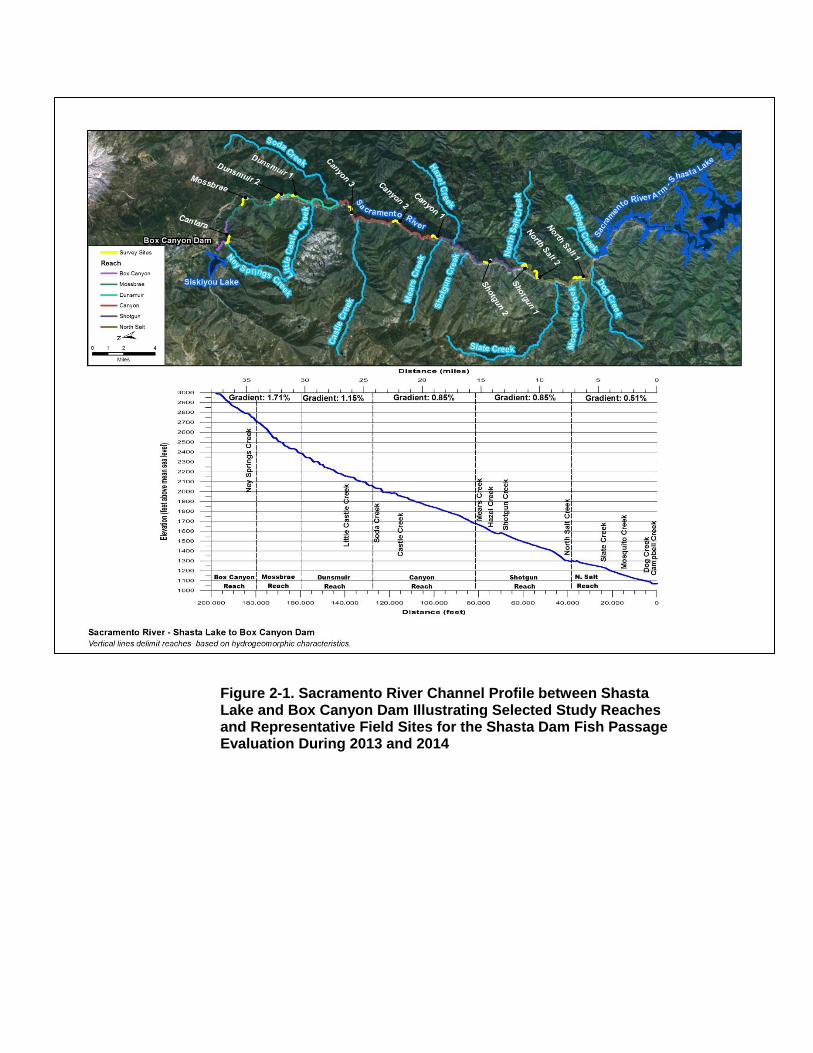
Figure 2-1. Sacramento River Channel Profile between Shasta Lake and Box Canyon Dam Illustrating Selected Study Reaches and Representative Field Sites for the Shasta Dam Fish Passage Evaluation During 2013 and 2014
Sh
asta
Da
m F
ish
Passag
e E
va
luatio
n
12 –
FIN
AL –
Aug
ust 2
014
Figure 2-2. McCloud River Channel Profile Between Shasta Lake and Lower McCloud Falls Illustrating Selected Study Reaches and Representative Field Sites for the Shasta Dam Fish Passage Evaluation During 2013 and 2014
Chapter 2 Methods
FINAL – August 2014 – 13
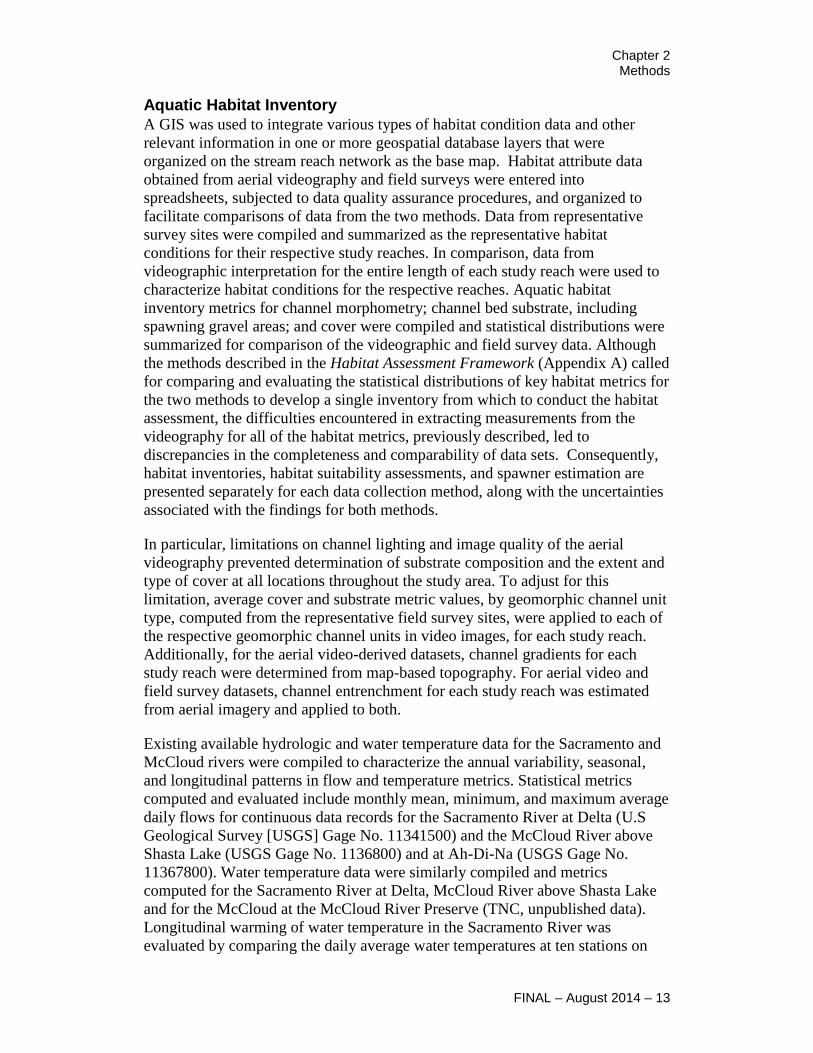
Aquatic Habitat Inventory
A GIS was used to integrate various types of habitat condition data and other
relevant information in one or more geospatial database layers that were
organized on the stream reach network as the base map. Habitat attribute data
obtained from aerial videography and field surveys were entered into
spreadsheets, subjected to data quality assurance procedures, and organized to
facilitate comparisons of data from the two methods. Data from representative
survey sites were compiled and summarized as the representative habitat
conditions for their respective study reaches. In comparison, data from
videographic interpretation for the entire length of each study reach were used to
characterize habitat conditions for the respective reaches. Aquatic habitat
inventory metrics for channel morphometry; channel bed substrate, including
spawning gravel areas; and cover were compiled and statistical distributions were
summarized for comparison of the videographic and field survey data. Although
the methods described in the Habitat Assessment Framework (Appendix A) called
for comparing and evaluating the statistical distributions of key habitat metrics for
the two methods to develop a single inventory from which to conduct the habitat
assessment, the difficulties encountered in extracting measurements from the
videography for all of the habitat metrics, previously described, led to
discrepancies in the completeness and comparability of data sets. Consequently,
habitat inventories, habitat suitability assessments, and spawner estimation are
presented separately for each data collection method, along with the uncertainties
associated with the findings for both methods.
In particular, limitations on channel lighting and image quality of the aerial
videography prevented determination of substrate composition and the extent and
type of cover at all locations throughout the study area. To adjust for this
limitation, average cover and substrate metric values, by geomorphic channel unit
type, computed from the representative field survey sites, were applied to each of
the respective geomorphic channel units in video images, for each study reach.
Additionally, for the aerial video-derived datasets, channel gradients for each
study reach were determined from map-based topography. For aerial video and
field survey datasets, channel entrenchment for each study reach was estimated
from aerial imagery and applied to both.
Existing available hydrologic and water temperature data for the Sacramento and
McCloud rivers were compiled to characterize the annual variability, seasonal,
and longitudinal patterns in flow and temperature metrics. Statistical metrics
computed and evaluated include monthly mean, minimum, and maximum average
daily flows for continuous data records for the Sacramento River at Delta (U.S
Geological Survey [USGS] Gage No. 11341500) and the McCloud River above
Shasta Lake (USGS Gage No. 1136800) and at Ah-Di-Na (USGS Gage No.
11367800). Water temperature data were similarly compiled and metrics
computed for the Sacramento River at Delta, McCloud River above Shasta Lake
and for the McCloud at the McCloud River Preserve (TNC, unpublished data).
Longitudinal warming of water temperature in the Sacramento River was
evaluated by comparing the daily average water temperatures at ten stations on
Shasta Dam Fish Passage Evaluation
14 – FINAL – August 2014
the Sacramento River during Water Year 2012 (Reclamation, unpublished data).
Similar trends in water temperature were evaluated for the McCloud River using
the available water temperatures (daily average) reported in Pacific Gas and
Electric Company (PG&E 2008) and provided in electronic format by PG&E for
May through October in 2006 to 2008. Thermographs located above McCloud
Reservoir, downstream of major tributary confluences (Hawkins Creek, Ladybug
Creek, Claiborne Creek, Squaw Valley Creek, Chatterdown Creek), and above
Shasta Lake were selected to characterize thermal patterns in the McCloud River.
Monthly maximum weekly average water temperatures (MMWAT) were
computed for each month between May and October using the available
thermographic records, including the Sacramento River at Delta, McCloud River
above Shasta Lake, and at the McCloud River Preserve for water years 2003 to
2012; each of the ten Reclamation monitoring stations on the upper Sacramento
River for water year 2012; and each of the PG&E thermographs on the McCloud
River for water years 2006 to 2008. The MMWAT value is the maximum 7-day
moving average of daily average water temperatures for any given month. The
standard deviation of the monthly maximum 7-day moving daily average water
temperature is reported with the MMWATs in this report to provide an indication
of the variability (or stability) of the thermal regime during the period of peak
summer temperatures in the study rivers.
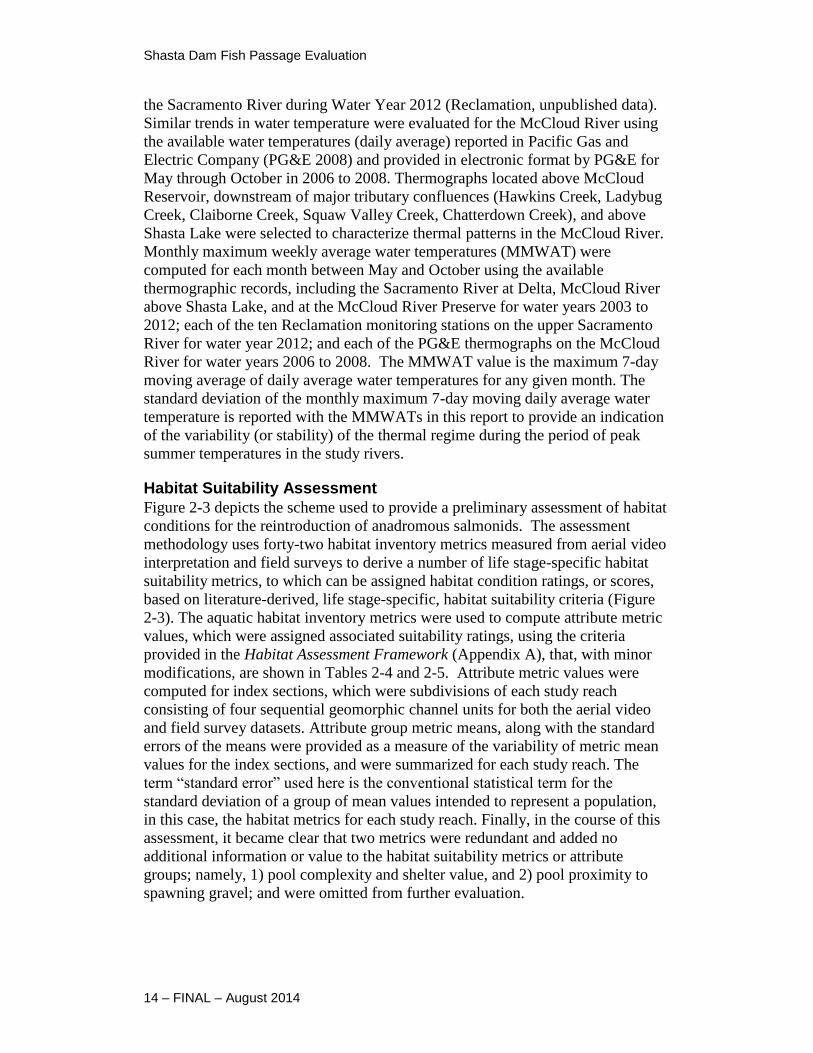
Habitat Suitability Assessment
Figure 2-3 depicts the scheme used to provide a preliminary assessment of habitat
conditions for the reintroduction of anadromous salmonids. The assessment
methodology uses forty-two habitat inventory metrics measured from aerial video
interpretation and field surveys to derive a number of life stage-specific habitat
suitability metrics, to which can be assigned habitat condition ratings, or scores,
based on literature-derived, life stage-specific, habitat suitability criteria (Figure
2-3). The aquatic habitat inventory metrics were used to compute attribute metric
values, which were assigned associated suitability ratings, using the criteria
provided in the Habitat Assessment Framework (Appendix A), that, with minor
modifications, are shown in Tables 2-4 and 2-5. Attribute metric values were
computed for index sections, which were subdivisions of each study reach
consisting of four sequential geomorphic channel units for both the aerial video
and field survey datasets. Attribute group metric means, along with the standard
errors of the means were provided as a measure of the variability of metric mean
values for the index sections, and were summarized for each study reach. The
term “standard error” used here is the conventional statistical term for the
standard deviation of a group of mean values intended to represent a population,
in this case, the habitat metrics for each study reach. Finally, in the course of this
assessment, it became clear that two metrics were redundant and added no
additional information or value to the habitat suitability metrics or attribute
groups; namely, 1) pool complexity and shelter value, and 2) pool proximity to
spawning gravel; and were omitted from further evaluation.
Chapter 2 Methods
FINAL – August 2014 – 15
Figure 2-3. The Relationships of Habitat Inventory Metrics Measured from Aerial Videography and Ground-Level Field Surveys of Representative Sites to Habitat Attribute Metrics and Key Habitat Attribute Groups and the Habitat Suitability Rating System

Chapter 3 Results
FINAL – August 2014 – 1
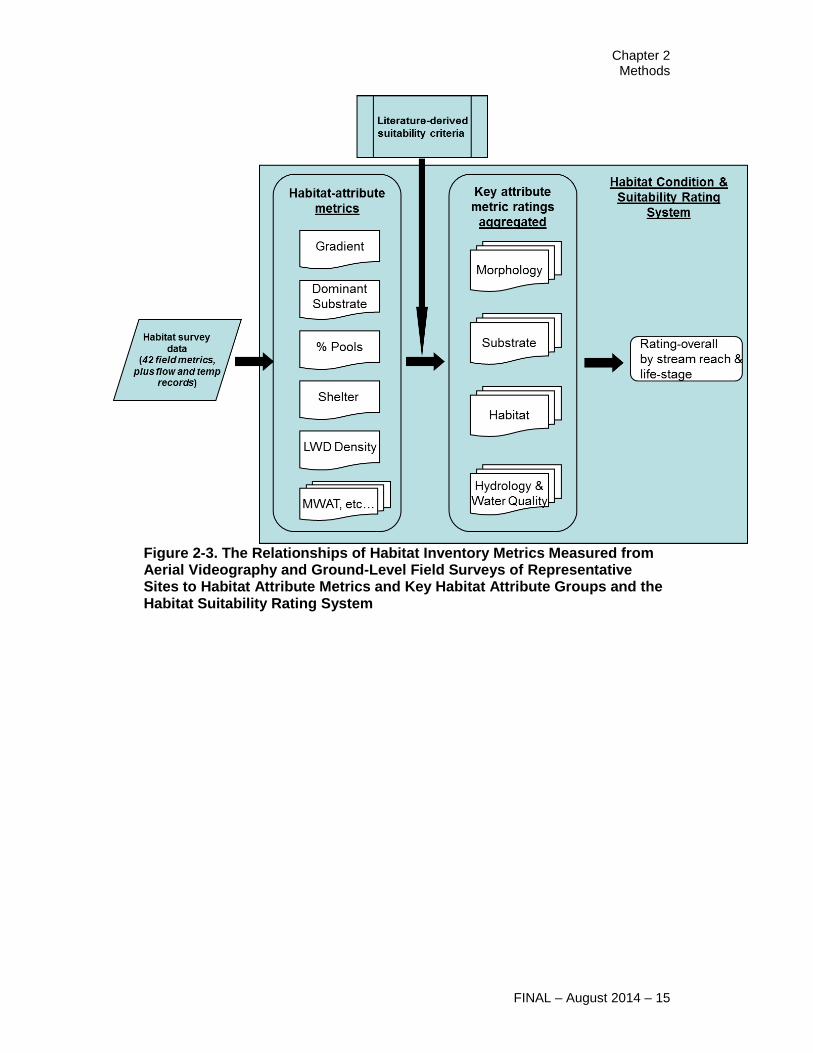
Table 2-4. Literature Derived Chinook Salmon Spawning, Egg Incubation, and Emergence Criteria Selected for a Reach-Scale Spawning Habitat Condition Assessment on the Sacramento and McCloud Rivers
Attribute Metric Good Fair Poor
Channel type pool-riffle plane bed step-pool, cascade
Gradient 1-3% 3-4% ≥ 4%
Channel morphometry
Entrenchment (flood prone width : bankfull width)
≥ 2.2 1.5-2.2 ≤ 1.5
Channel depth 0.25-3.0 m -- < 0.25 m
subdominant bed substrate
gravel/cobble gravel/fines cobble/fines
Substrate (before % gravel in riffles > 30% 15-30% < 15%
redd construction) % cobble in riffles 20-40% 10-20%; 40-70% < 10%; > 70%
% fines in riffles ≤ 10% 10-20% > 20%
Embeddedness in riffles < 25% 25-50% > 50%
ratio 40-60% pools with tailouts
20-40% pools < 20%; > 60% pools
Habitat Pool proximity to spawning gravel
adjacent -- --
Pool depth > 2.5-3 m 1.5-2.5 m < 1.5 m
Spawning gravel area > 6 m2 3-6 m
2 < 3 m
2
Note:
See Habitat Assessment Framework (Appendix A) for detailed review of the literature, bibliography, and selection of habitat criteria for reach scale habitat assessment.
Key:
% = percent
≤ = less than or equal to
≥ = greater than or equal to
< = less than
> = greater than
m = meters
m2 = square meter
“--“ = no data available
Shasta Dam Fish Passage Evaluation
2 – FINAL – August 2014
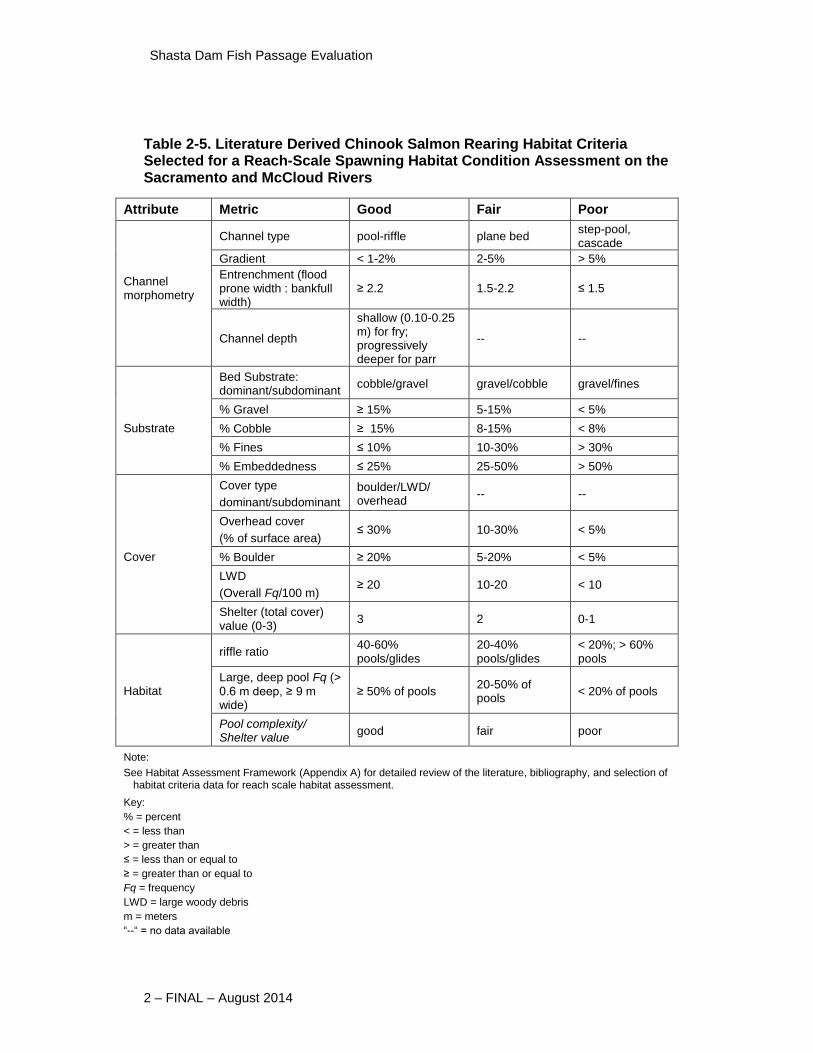
Table 2-5. Literature Derived Chinook Salmon Rearing Habitat Criteria Selected for a Reach-Scale Spawning Habitat Condition Assessment on the Sacramento and McCloud Rivers
Attribute Metric Good Fair Poor
Channel type pool-riffle plane bed step-pool, cascade
Gradient < 1-2% 2-5% > 5%
Channel morphometry
Entrenchment (flood prone width : bankfull width)
≥ 2.2 1.5-2.2 ≤ 1.5
Channel depth
shallow (0.10-0.25 m) for fry; progressively deeper for parr
-- --
Bed Substrate: dominant/subdominant
cobble/gravel gravel/cobble gravel/fines
% Gravel ≥ 15% 5-15% < 5%
Substrate % Cobble ≥ 15% 8-15% < 8%
% Fines ≤ 10% 10-30% > 30%
% Embeddedness ≤ 25% 25-50% > 50%
Cover type
dominant/subdominant
boulder/LWD/ overhead
-- --
Overhead cover
(% of surface area) ≤ 30% 10-30% < 5%
Cover % Boulder ≥ 20% 5-20% < 5%
LWD
(Overall Fq/100 m) ≥ 20 10-20 < 10
Shelter (total cover) value (0-3)
3 2 0-1
riffle ratio 40-60% pools/glides
20-40% pools/glides
< 20%; > 60% pools
Habitat Large, deep pool Fq (>
0.6 m deep, ≥ 9 m wide)
≥ 50% of pools 20-50% of pools
< 20% of pools
Pool complexity/ Shelter value
good fair poor
Note:
See Habitat Assessment Framework (Appendix A) for detailed review of the literature, bibliography, and selection of habitat criteria data for reach scale habitat assessment.
Key:
% = percent
< = less than
> = greater than
≤ = less than or equal to
≥ = greater than or equal to
Fq = frequency
LWD = large woody debris
m = meters
“--“ = no data available
Chapter 3 Results
FINAL – August 2014 – 3
Spawner Capacity
Procedures used for estimating the number of salmon spawners (represented as
the number female salmon) for the purposes of the Shasta Dam Fish Passage Pilot
Implementation were described in detail in the Habitat Assessment Framework
(Appendix A). The selected methodology takes into account the amount of
available suitable spawning habitat and the required redd and defended territory
size (i.e., area required per pair of fish). The spawner capacity is a function of the
area of spawning habitat available, substrate composition, number of gravel
patches, and spawning territory requirements (redd space and defended space).
The original spawning territory size criterion of 20 m2, described in the Habitat
Assessment Framework (Appendix A), was augmented by adding 5 m2 and 10 m
2
criteria because the range of requirements for salmon redd areas and defended
territory sizes in the literature is broad for Chinook salmon, and also, because on-
site field conditions and incidental observations of salmonid nests tended to
suggest that defended redd areas could likely be smaller than 20 m2 in the study
streams. Additionally, the consensus opinion of several experts on the Fish
Passage Habitat Subcommittee was that winter-run Chinook salmon typically
exhibit smaller nest sizes than fall-run Chinook salmon to which most of the
literature-derived data refer. Spawner capacities for aerial video interpreted
habitat metrics were computed for entire study reaches for the baseflow and OHW
mark stages. Spawner capacities from field survey-derived habitat metrics were
computed by simple linear expansion of the number of spawners and spawning
habitat area delineated within representative sites to the full study reach (i.e.,
number of spawners was divided by surveyed field site length and multiplied by
the study reach length). One of the limitations of the video-derived habitat
assessment was our ability to differentiate between gravel- and cobble-sized bed
sediments. Further, the inability to distinguish isolated spawning gravel patches
and the inability to identify substrates in video images with high levels of shading
and vegetative cover also affected our ability to accurately estimate suitable
salmonid spawning habitat from the aerial videography.
Shasta Dam Fish Passage Evaluation
4 – FINAL – August 2014
Results
These results present the findings on habitat conditions in the upper Sacramento
and McCloud rivers upstream from Shasta Lake to support the development of the
Shasta Dam Fish Passage Pilot Implementation Plan. This report is organized to
provide results for the Sacramento and McCloud rivers separately, describing
aquatic habitat inventories, assessment of habitat suitability for freshwater life
stages of Chinook salmon, and estimates of Chinook salmon spawner capacity for
each stream. Detailed data on reach-specific habitat inventories and habitat
suitability assessments are provided in “Reach Specific Habitat Inventories,”
Appendix B and “Habitat Suitability Assessment,” Appendix C, respectively. A
complete spatially-explicit habitat inventory database is available in electronic
format.
Sacramento River
Aquatic Habitat Inventory
Aerial videography was obtained along the upper mainstem Sacramento River
between Shasta Lake and Box Canyon Dam on November 23, 2013. Average
daily flow on this date at the USGS Delta gage (USGS Gage No. 11341500) was
210 cubic feet per second (cfs), when releases from Box Canyon Dam were
approximately 45 cfs, based on Siskiyou County records (Siskiyou Power
Authority, unpublished record, http://www.co.siskiyou.ca.us /content/general-
services-siskiyou-power-authority). Video quality and coverage generally
decreased with distance upstream from Shasta Dam as channel widths decreased
and the channel sinuosity, hillslope, topographic aspect, and vegetation cover
increased (Appendix Table B-1). Overall, video coverage and quality was
sufficient to allow delineation of geomorphic channel units and identification of
most habitat parameters, except for those related to channel gradient, bed
substrate details, and complex cover shelter ratings. In the vicinity and upstream
of the town of Dunsmuir, video quality was poor because flight conditions and
topographic shading affecting the ability to clearly see the river channel and
reliably identify habitat units and measure key features. These sites were
subsequently included in the ground-level field surveys.
Ground-level surveys were conducted at representative field sites between
January 6, 2014 and January 16, 2014. Average daily flow at the Delta gage
during the field survey period averaged 200 cfs, while Box Canyon Dam releases
were about 45 cfs (Siskiyou Power Authority, unpublished record,
http://www.co.siskiyou.ca.us /content/general-services-siskiyou-power-authority).
Several salmonid redds were observed during field site surveys (Table 3-1).
Following habitat surveys, California Department of Fish and Wildlife (CDFW)
biologists and North State Resources, Inc. Aquatic Scientist Keith Marine
collected approximately 50 developing eggs from three of these redds near Sims
Road and Gibson Road on the Sacramento River, which were transferred to the
Chapter 3 Results
FINAL – August 2014 – 5
NMFS Southwest Fisheries Science Center (SWFSC) to determine if these eggs
were from Chinook salmon stocked in Shasta Lake as part of the inland fisheries
management program. Genotyping results indicated that the eggs were not from
Chinook salmon; however, the genetic test could not distinguish to which
salmonid species the eggs belonged, other than that they were, indeed, from
another salmonid (Garza 2014). Other salmonid species occurring in the region
that may have spawned in the late-fall and early winter include, most likely,
brown trout (Salmo trutta) and, perhaps, rainbow trout (Oncorhynchus mykiss).
Adfluvial populations of both species are known to migrate from Shasta Lake to
spawn in the upper Sacramento River (North State Resources [NSR] 2010). The
incidental observation of salmonid redds were used as corroborative evidence of
the potential suitability of habitat features for spawning salmonids.
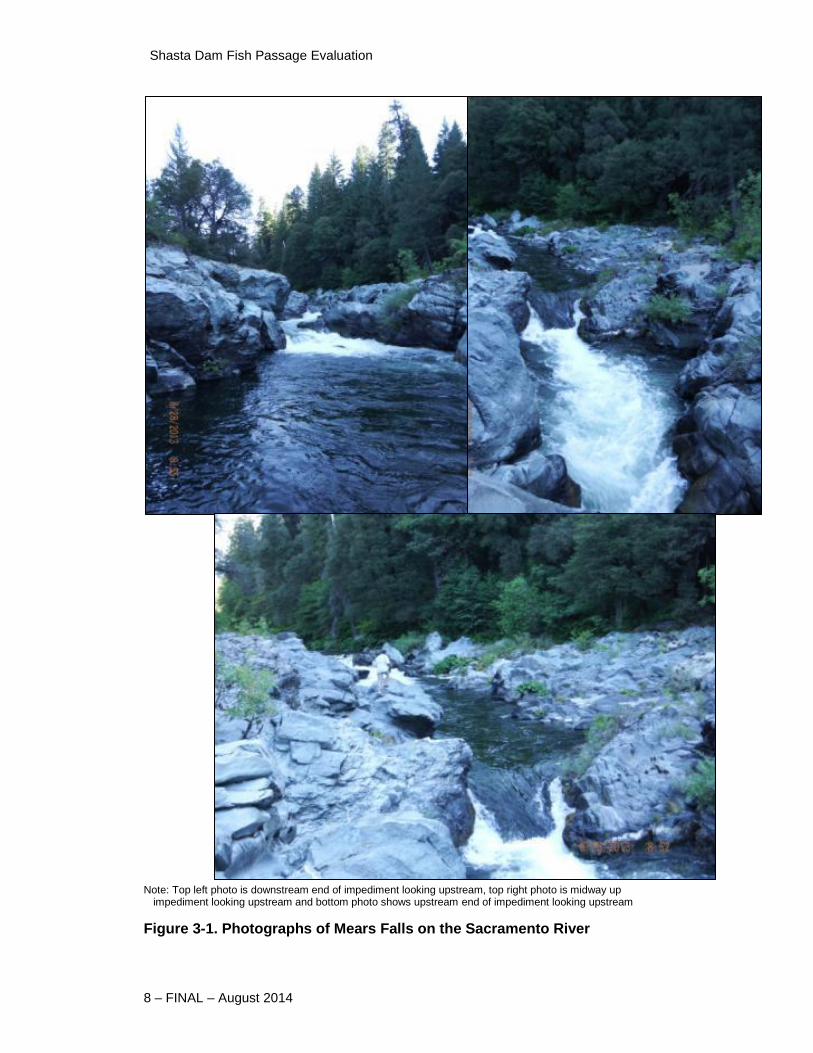
Review of existing data, aerial video and ground surveys indicate the only notable
upstream fish passage impediment in the Sacramento River between Shasta Lake
and Box Canyon Dam is Mears Falls, located immediately upstream of the Mears
Creek confluence with the Sacramento River (RM 15.6) (Table 3-2). This
feature is a three step, compound, cascade approximately 50 meters in length. The
middle and downstream-most cascades are the most formidable sections for fish
passage with a 30 to 40 percent gradient and each cascade is 2 to 2.5 meters in
height at typical late-summer and fall flows (Figure 3-1). This feature forms an
incomplete, seasonally temporary, impediment to upstream migration during such
times, but would not be a complete barrier and would certainly be passable during
the higher river flows of the winter through early-summer months.

Shasta Dam Fish Passage Evaluation
6 – FINAL – August 2014
Table 3-1. Observations of Salmonid Redd Observations in the Upper Sacramento and McCloud Rivers During January 2014 Fish Habitat Surveys
Stream Date Location
a # of
Redds Habitat Unit
Gravel Size Distribution
Notes Northing Easting
Sac
ram
en
to
1/8/2014 551057 4542311 1 Pool-tail D50: 68 mm 44% gravel 49% cobble
Redd size was 0.9 m wide x 1.4 m long.
Sac
ram
en
to
1/15/2014 554370 4547529 1 Pool-tail
D50: 36 mm 10% sand 70% gravel 20% cobble
Redd size was 1.2 m wide x 1.8 long.
McC
lou
d
1/29/2014 574441 4549588 1 Pool-tail D50: 16 mm 97% gravel 3% cobble
Redd size was 1.1 m wide x 1.7 m long. Scattered gravel patches in pool-tail. Redd appeared to be a little older. Embeddedness low, however, quite a bit of very fine silt in gravel matrix.
McC
lou
d
1/28/2014 578686 4551662 2
Depositional bar along margin of step-pool
D50: 12 mm 98% gravel 2% cobble
Redd size was 0.9 m wide x 1.3 m long. Along edge of margin deposit.
McC
lou
d
1/28/2014 578833 4551938 1 Pocketwater D50: 13 mm 99% gravel 1% cobble
Redd size was 0.9 m wide x 1.3 m long. Scour patch of gravel within pocketwater.
McC
lou
d 1/29/2014 576623 4551699 4 Pool-tail
D50: 20 mm 98% gravel 2% cobble
Redd size was 0.9 m wide x 1.2 m long. All on large-pool tail gravel deposit. 3-older redds, one very new redd (< 2 weeks old?).
Source: National Marine Fisheries Service Southwest Fisheries Science Center
Notes:
Genotypes of eggs sampled from Redds were determined not to be Chinook salmon. a Location: Universal Transverse Mercator, NAD 83, zone 10 (meters)
Key: # = number % = percent D50 = median particle size m = meter mm = millimeter
Chapter 3 Results
FINAL – August 2014 – 7
Table 3-2. Observations of Fish Passage Impediments in the Upper Sacramento and McCloud Rivers During January 2014 Fish Habitat Surveys
Stream Barrier Name
Locationa
Barrier/Impediment Characteristics
Northing Easting Classb
Height Description S
ac
ram
en
to
Mears Falls 554209 4546932 Complex chute
2 to 3 m at each jump
Three step, complex cascade; 50 m long
McC
lou
d
Tuna Falls 566308 4538334 Boulder cascade
1.5 to 2 m
Simple boulder cascade; 15 m long
Notes: a Location: Universal Transverse Mercator, NAD 83, zone 10 (meters)
b Powers and Orsborn (1985)
Key:
m = meter
Shasta Dam Fish Passage Evaluation
8 – FINAL – August 2014
Note: Top left photo is downstream end of impediment looking upstream, top right photo is midway up
impediment looking upstream and bottom photo shows upstream end of impediment looking upstream
Figure 3-1. Photographs of Mears Falls on the Sacramento River
Chapter 3 Results
FINAL – August 2014 – 9
Aquatic habitat inventory data collected by aerial videography interpretation and
by representative field surveys were compiled by study reach, details of which are
provided in Appendix B3. Ground-level (field) site surveys covered between 14
and 27 percent of the entire lengths of each study reach (Table 2-1 and Figure 2-
1) and were conducted in part to augment video interpretation where video
coverage was poor and certain parameters were not discernable (i.e., cover and
substrate composition). Geomorphic habitat composition in the Sacramento River
between Shasta Lake and Box Canyon Dam was dominated by flatwater
(consisting of runs, glides, and pocket water) and pools in the two downstream-
most study reaches up to Mears Creek, comprising 15.5 miles, or nearly forty-two
percent, of the entire upper Sacramento River (Figure 3-2). From Mears Creek, up
to Box Canyon Dam, which comprises 21.5 miles of the river, the proportion of
high-gradient, riffle and cascade habitat increases as the channel morphology
transitions from a bedrock-confined channel, with alluvial features, to a bedrock-
confined, wholly plane-bed channel. Pool habitat becomes quite limited (less than
10 percent of the available habitat) from the Dunsmuir Reach on up to Box
Canyon Dam; habitat there is dominated by bedrock-controlled riffle-run
sequences consistent with the increasing channel confinement in these reaches.
Differences were expected to occur in the aquatic habitat inventories obtained
using the two data collection methods. Differences most commonly resulted from
the lack of detail available in the aerial videography to correctly identify or
measure habitat features, and less commonly occurred as a result of chance
absence or omission of habitat features at the selected field sites. Comparison of
the geomorphic channel unit inventories showed that aerial video interpretation
misidentified some riffles for runs and some runs for pools as was verified by
ground surveys of representative sites (see Appendix B for reach-by-reach
comparisons of inventories of the two methods), which resulted in higher
frequencies of pools and lower frequencies of riffles relative to that estimated
from representative site surveys (Figure 3-2). Flatwater habitat units were often
difficult to distinguish from pools because of obscured or unclear views of
channel depth and bottom features in the deep shade that occurred at many
locations along the river on the dates of aerial surveys. Differences in these
habitat inventory results were sufficient that it was decided to not combine, as
originally proposed, but compute and present separate habitat condition
assessment scores for both data collection methods.
3 Complete database files are also available in electronic file format.
Shasta Dam Fish Passage Evaluation
10 – FINAL – August 2014
Key: % = percent
Figure 3-2. Comparison of Geomorphic Channel Unit (riverine habitat type) Composition in the Upper Sacramento River, by Study Reach, for Aerial Videographic Interpretation (aerial) and Representative Field Site (ground) Surveys
Available stream flow and water temperature records for the Sacramento River
between Box Canyon Dam and Shasta Lake are compiled and summarized in
Appendix B. The compilation includes annual and seasonal hydrographs and
thermographs, streamflow and temperature frequency duration curves, and annual
statistics (minimum, maximum, and average metric values) for the available data.
A summary and overview of streamflow and water temperature records for the
upper Sacramento River study area follows.
Streamflow in the upper Sacramento River is partially regulated by releases from
Box Canyon Dam; however, analysis of the daily stream flow record shows that
the operation of Box Canyon Dam has not measurably changed the baseflow
discharge of the upper Sacramento River (NSR 2010). Minimum instream flow
releases from Box Canyon Dam are 40 cfs but are typically set to 47.5 cfs rather
than 40 cfs to avoid releasing less than the minimum instream flow (Federal
Energy Regulatory Commission [FERC] 2006). No contemporary or continuous
stream flow records are available between Box Canyon Dam and the USGS gage
at Delta, which is located less than one mile upstream of the full pool elevation of
Shasta Lake. The pattern of average daily flows at the Delta gage for Water Years
(WY) 1971 to 2012 is provided in Figure 3-3. The flow regime in this reach of the
upper Sacramento River is generally low and relatively stable between July and
0%
10%
20%
30%
40%
50%
60%
70%
80%
90%
100%
ground aerial ground aerial ground aerial ground aerial ground aerial ground aerial
Box Canyon Mossbrae Dunsmuir Canyon Shotgun N. Salt
Ha
bit
at
com
po
siti
on
by
re
ach
Study reach/Survey method
riffle cascade run glide pocketwater scour pool main channel pool
Chapter 3 Results
FINAL – August 2014 – 11
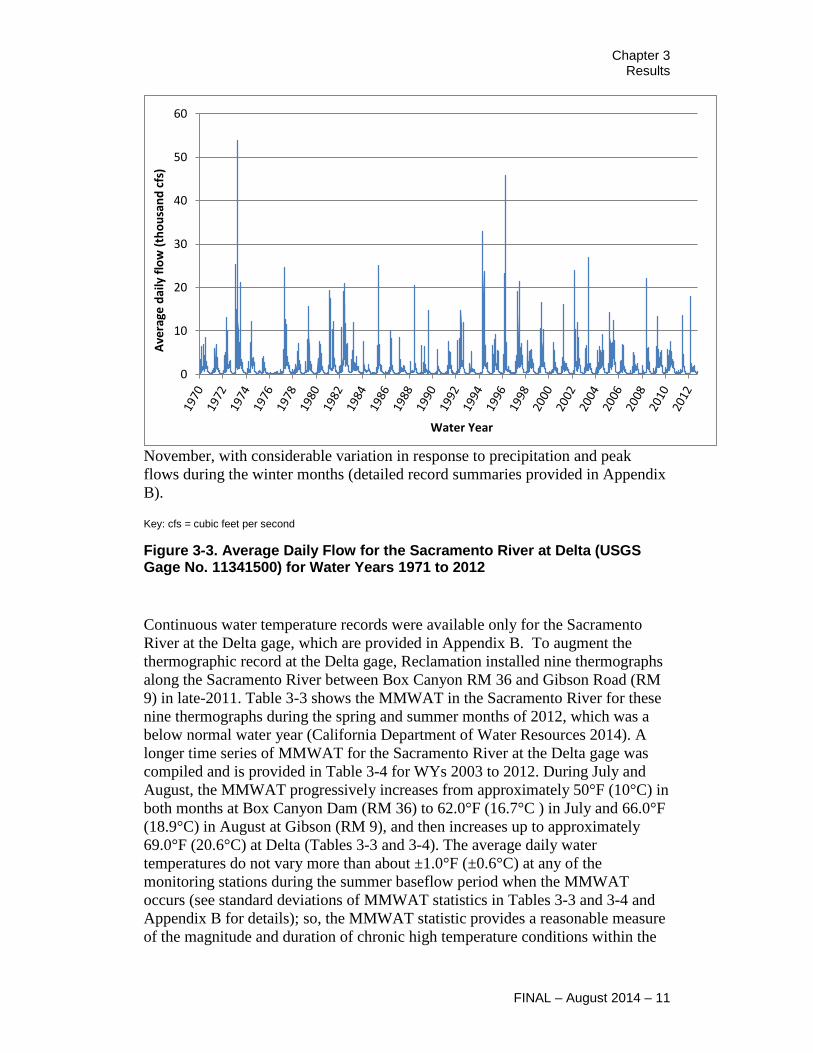
November, with considerable variation in response to precipitation and peak
flows during the winter months (detailed record summaries provided in Appendix
B).
Key: cfs = cubic feet per second
Figure 3-3. Average Daily Flow for the Sacramento River at Delta (USGS Gage No. 11341500) for Water Years 1971 to 2012
Continuous water temperature records were available only for the Sacramento
River at the Delta gage, which are provided in Appendix B. To augment the
thermographic record at the Delta gage, Reclamation installed nine thermographs
along the Sacramento River between Box Canyon RM 36 and Gibson Road (RM
9) in late-2011. Table 3-3 shows the MMWAT in the Sacramento River for these
nine thermographs during the spring and summer months of 2012, which was a
below normal water year (California Department of Water Resources 2014). A
longer time series of MMWAT for the Sacramento River at the Delta gage was
compiled and is provided in Table 3-4 for WYs 2003 to 2012. During July and
August, the MMWAT progressively increases from approximately 50°F (10°C) in
both months at Box Canyon Dam (RM 36) to 62.0°F (16.7°C ) in July and 66.0°F
(18.9°C) in August at Gibson (RM 9), and then increases up to approximately
69.0°F (20.6°C) at Delta (Tables 3-3 and 3-4). The average daily water
temperatures do not vary more than about ±1.0°F (±0.6°C) at any of the
monitoring stations during the summer baseflow period when the MMWAT
occurs (see standard deviations of MMWAT statistics in Tables 3-3 and 3-4 and
Appendix B for details); so, the MMWAT statistic provides a reasonable measure
of the magnitude and duration of chronic high temperature conditions within the
0
10
20
30
40
50
60
Ave
rage
dai
ly f
low
(th
ou
san
d c
fs)
Water Year
Shasta Dam Fish Passage Evaluation
12 – FINAL – August 2014
various river reaches. Furthermore, examination of daily maximum and minimum
water temperatures shows that the typical range of daily temperature fluctuation is
no greater than ±3.0°F (±1.6°C) around the average daily temperature at most of
the monitoring stations (see Appendix B for technical details).
Habitat Suitability
Overall spawning life stage habitat condition scores in the upper Sacramento
River computed from both aerial video- and field-derived habitat inventories
indicated that spawning habitat condition in all study reaches throughout the
upper Sacramento River ranges from fair-to-good (Table 3-5, Appendix B).
Substrate attribute scores, which were the highest of the three spawning habitat
attributes, were similar for both habitat inventory methods because several of the
component substrate parameters from field surveys had to be substituted and used
for the video substrate metric computations due to previously described
limitations on videographic interpretations of bed substrate conditions. The lowest
spawning habitat component scores were for structural habitat metrics (e.g.,
proportion of pool habitat, maximum pool depth, and spawning substrate area),
suggesting that one of the limiting factors of overall salmon spawning habitat
condition in the Sacramento River may be the frequency of large-deep pools and
the amount of suitable-sized spawning gravel, especially in the river reach
upstream of Dunsmuir. However, pool depths and spawning gravel areas may be
more limiting under the low, baseflow conditions occurring in the late-summer
and fall, when spring-run Chinook salmon spawn, but not so limiting during the
higher flows of spring and early summer, when winter-run Chinook salmon
spawning peaks, although the later spawning fraction of the winter-run Chinook
salmon would be affected since they have been observed to spawn as late as into
August (Vogel and Marine 1991; Moyle 2002).
Chapter 3 Results
Chapte
r 3
Results
FIN
AL –
August 2
014 –
13
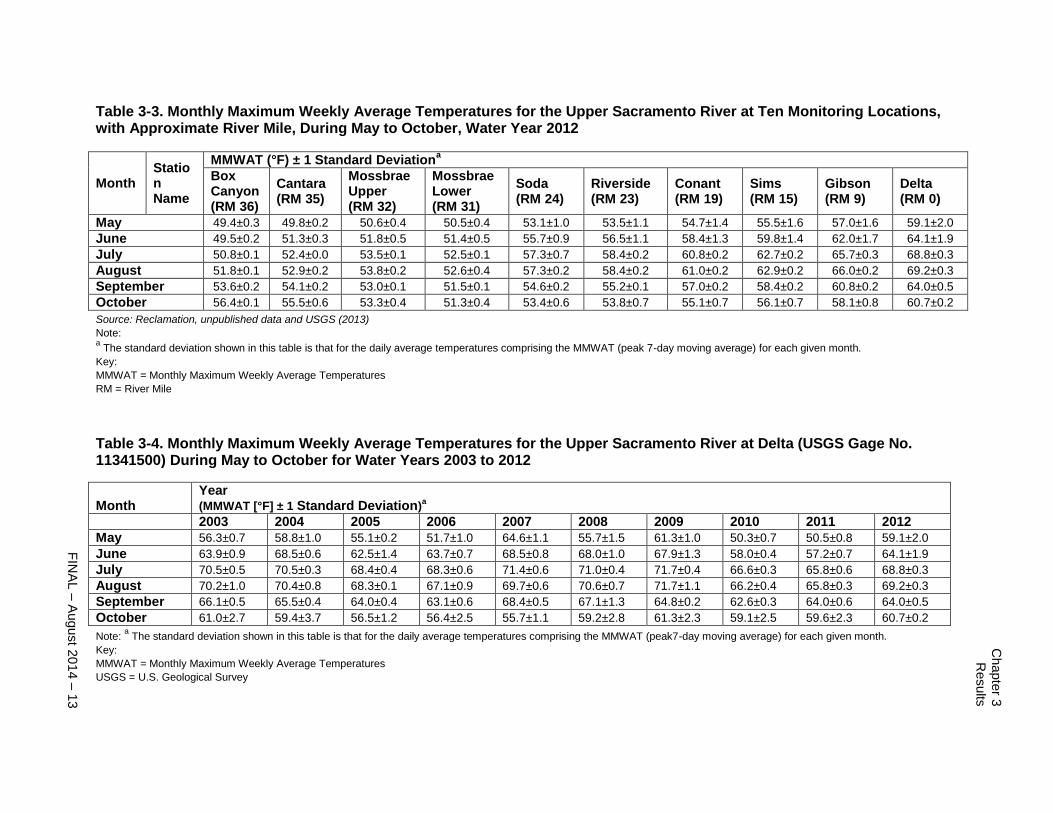
Table 3-3. Monthly Maximum Weekly Average Temperatures for the Upper Sacramento River at Ten Monitoring Locations, with Approximate River Mile, During May to October, Water Year 2012
Month Station Name
MMWAT (°F) ± 1 Standard Deviationa
Box Canyon (RM 36)
Cantara (RM 35)
Mossbrae Upper (RM 32)
Mossbrae Lower (RM 31)
Soda (RM 24)
Riverside (RM 23)
Conant (RM 19)
Sims (RM 15)
Gibson (RM 9)
Delta (RM 0)
May 49.4±0.3 49.8±0.2 50.6±0.4 50.5±0.4 53.1±1.0 53.5±1.1 54.7±1.4 55.5±1.6 57.0±1.6 59.1±2.0
June 49.5±0.2 51.3±0.3 51.8±0.5 51.4±0.5 55.7±0.9 56.5±1.1 58.4±1.3 59.8±1.4 62.0±1.7 64.1±1.9
July 50.8±0.1 52.4±0.0 53.5±0.1 52.5±0.1 57.3±0.7 58.4±0.2 60.8±0.2 62.7±0.2 65.7±0.3 68.8±0.3
August 51.8±0.1 52.9±0.2 53.8±0.2 52.6±0.4 57.3±0.2 58.4±0.2 61.0±0.2 62.9±0.2 66.0±0.2 69.2±0.3
September 53.6±0.2 54.1±0.2 53.0±0.1 51.5±0.1 54.6±0.2 55.2±0.1 57.0±0.2 58.4±0.2 60.8±0.2 64.0±0.5
October 56.4±0.1 55.5±0.6 53.3±0.4 51.3±0.4 53.4±0.6 53.8±0.7 55.1±0.7 56.1±0.7 58.1±0.8 60.7±0.2
Source: Reclamation, unpublished data and USGS (2013)
Note: a The standard deviation shown in this table is that for the daily average temperatures comprising the MMWAT (peak 7-day moving average) for each given month.
Key:
MMWAT = Monthly Maximum Weekly Average Temperatures
RM = River Mile
Table 3-4. Monthly Maximum Weekly Average Temperatures for the Upper Sacramento River at Delta (USGS Gage No. 11341500) During May to October for Water Years 2003 to 2012
Month Year (MMWAT [°F] ± 1 Standard Deviation)
a
2003 2004 2005 2006 2007 2008 2009 2010 2011 2012
May 56.3±0.7 58.8±1.0 55.1±0.2 51.7±1.0 64.6±1.1 55.7±1.5 61.3±1.0 50.3±0.7 50.5±0.8 59.1±2.0
June 63.9±0.9 68.5±0.6 62.5±1.4 63.7±0.7 68.5±0.8 68.0±1.0 67.9±1.3 58.0±0.4 57.2±0.7 64.1±1.9
July 70.5±0.5 70.5±0.3 68.4±0.4 68.3±0.6 71.4±0.6 71.0±0.4 71.7±0.4 66.6±0.3 65.8±0.6 68.8±0.3
August 70.2±1.0 70.4±0.8 68.3±0.1 67.1±0.9 69.7±0.6 70.6±0.7 71.7±1.1 66.2±0.4 65.8±0.3 69.2±0.3
September 66.1±0.5 65.5±0.4 64.0±0.4 63.1±0.6 68.4±0.5 67.1±1.3 64.8±0.2 62.6±0.3 64.0±0.6 64.0±0.5
October 61.0±2.7 59.4±3.7 56.5±1.2 56.4±2.5 55.7±1.1 59.2±2.8 61.3±2.3 59.1±2.5 59.6±2.3 60.7±0.2
Note: a The standard deviation shown in this table is that for the daily average temperatures comprising the MMWAT (peak7-day moving average) for each given month.
Key:
MMWAT = Monthly Maximum Weekly Average Temperatures
USGS = U.S. Geological Survey
Shasta Dam Fish Passage Evaluation
14 – DRAFT – June 2014
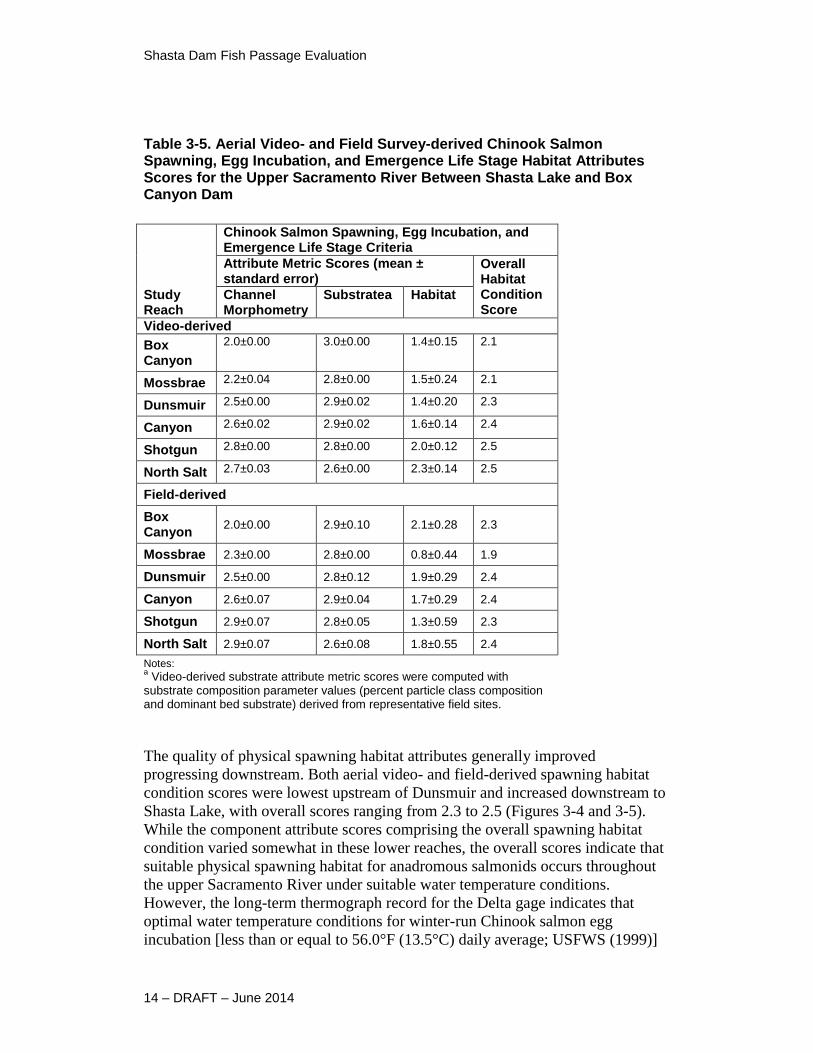
Table 3-5. Aerial Video- and Field Survey-derived Chinook Salmon Spawning, Egg Incubation, and Emergence Life Stage Habitat Attributes Scores for the Upper Sacramento River Between Shasta Lake and Box Canyon Dam
Study Reach
Chinook Salmon Spawning, Egg Incubation, and Emergence Life Stage Criteria
Attribute Metric Scores (mean ± standard error)
Overall Habitat Condition Score
Channel Morphometry
Substratea Habitat
Video-derived
Box Canyon
2.0±0.00 3.0±0.00 1.4±0.15 2.1
Mossbrae 2.2±0.04 2.8±0.00 1.5±0.24 2.1
Dunsmuir 2.5±0.00 2.9±0.02 1.4±0.20 2.3
Canyon 2.6±0.02 2.9±0.02 1.6±0.14 2.4
Shotgun 2.8±0.00 2.8±0.00 2.0±0.12 2.5
North Salt 2.7±0.03 2.6±0.00 2.3±0.14 2.5
Field-derived
Box Canyon
2.0±0.00 2.9±0.10 2.1±0.28 2.3
Mossbrae 2.3±0.00 2.8±0.00 0.8±0.44 1.9
Dunsmuir 2.5±0.00 2.8±0.12 1.9±0.29 2.4
Canyon 2.6±0.07 2.9±0.04 1.7±0.29 2.4
Shotgun 2.9±0.07 2.8±0.05 1.3±0.59 2.3
North Salt 2.9±0.07 2.6±0.08 1.8±0.55 2.4
Notes: a Video-derived substrate attribute metric scores were computed with
substrate composition parameter values (percent particle class composition and dominant bed substrate) derived from representative field sites.
The quality of physical spawning habitat attributes generally improved
progressing downstream. Both aerial video- and field-derived spawning habitat
condition scores were lowest upstream of Dunsmuir and increased downstream to
Shasta Lake, with overall scores ranging from 2.3 to 2.5 (Figures 3-4 and 3-5).
While the component attribute scores comprising the overall spawning habitat
condition varied somewhat in these lower reaches, the overall scores indicate that
suitable physical spawning habitat for anadromous salmonids occurs throughout
the upper Sacramento River under suitable water temperature conditions.
However, the long-term thermograph record for the Delta gage indicates that
optimal water temperature conditions for winter-run Chinook salmon egg
incubation [less than or equal to 56.0°F (13.5°C) daily average; USFWS (1999)]
Chapter 3 Results
FINAL – August 2014 – 15
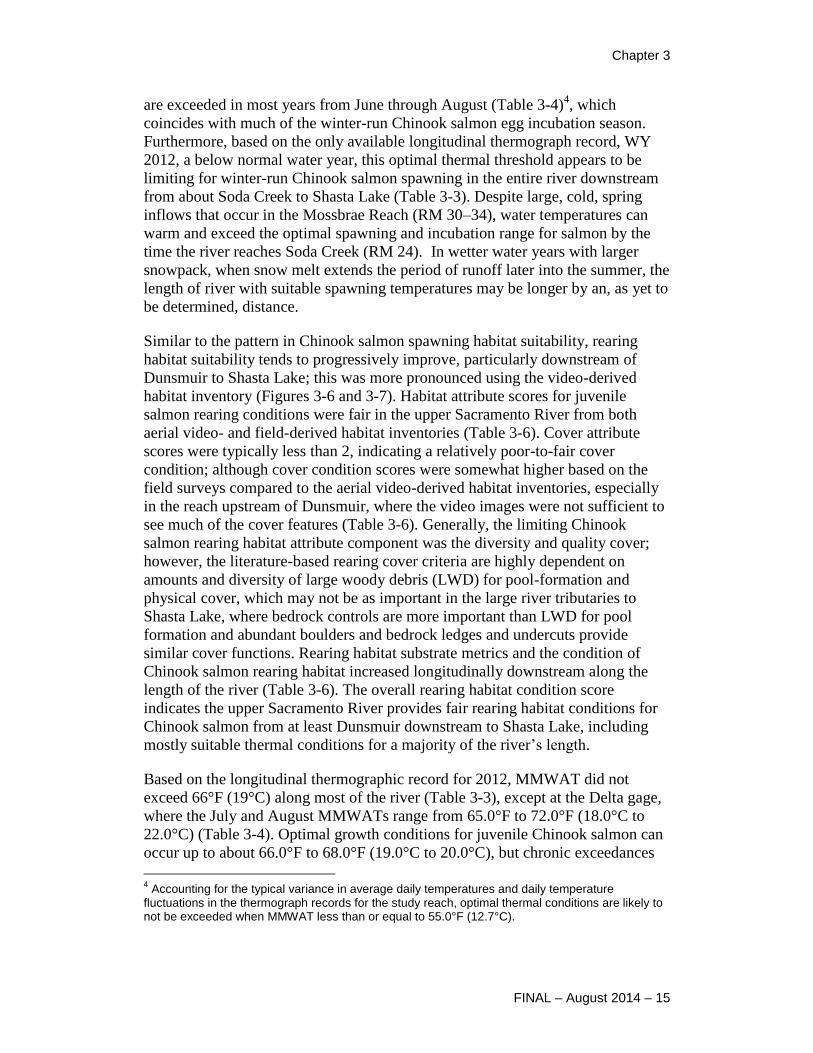
are exceeded in most years from June through August (Table 3-4)4, which
coincides with much of the winter-run Chinook salmon egg incubation season.
Furthermore, based on the only available longitudinal thermograph record, WY
2012, a below normal water year, this optimal thermal threshold appears to be
limiting for winter-run Chinook salmon spawning in the entire river downstream
from about Soda Creek to Shasta Lake (Table 3-3). Despite large, cold, spring
inflows that occur in the Mossbrae Reach (RM 30–34), water temperatures can
warm and exceed the optimal spawning and incubation range for salmon by the
time the river reaches Soda Creek (RM 24). In wetter water years with larger
snowpack, when snow melt extends the period of runoff later into the summer, the
length of river with suitable spawning temperatures may be longer by an, as yet to
be determined, distance.
Similar to the pattern in Chinook salmon spawning habitat suitability, rearing
habitat suitability tends to progressively improve, particularly downstream of
Dunsmuir to Shasta Lake; this was more pronounced using the video-derived
habitat inventory (Figures 3-6 and 3-7). Habitat attribute scores for juvenile
salmon rearing conditions were fair in the upper Sacramento River from both
aerial video- and field-derived habitat inventories (Table 3-6). Cover attribute
scores were typically less than 2, indicating a relatively poor-to-fair cover
condition; although cover condition scores were somewhat higher based on the
field surveys compared to the aerial video-derived habitat inventories, especially
in the reach upstream of Dunsmuir, where the video images were not sufficient to
see much of the cover features (Table 3-6). Generally, the limiting Chinook
salmon rearing habitat attribute component was the diversity and quality cover;
however, the literature-based rearing cover criteria are highly dependent on
amounts and diversity of large woody debris (LWD) for pool-formation and
physical cover, which may not be as important in the large river tributaries to
Shasta Lake, where bedrock controls are more important than LWD for pool
formation and abundant boulders and bedrock ledges and undercuts provide
similar cover functions. Rearing habitat substrate metrics and the condition of
Chinook salmon rearing habitat increased longitudinally downstream along the
length of the river (Table 3-6). The overall rearing habitat condition score
indicates the upper Sacramento River provides fair rearing habitat conditions for
Chinook salmon from at least Dunsmuir downstream to Shasta Lake, including
mostly suitable thermal conditions for a majority of the river’s length.
Based on the longitudinal thermographic record for 2012, MMWAT did not
exceed 66°F (19°C) along most of the river (Table 3-3), except at the Delta gage,
where the July and August MMWATs range from 65.0°F to 72.0°F (18.0°C to
22.0°C) (Table 3-4). Optimal growth conditions for juvenile Chinook salmon can
occur up to about 66.0°F to 68.0°F (19.0°C to 20.0°C), but chronic exceedances
4 Accounting for the typical variance in average daily temperatures and daily temperature
fluctuations in the thermograph records for the study reach, optimal thermal conditions are likely to not be exceeded when MMWAT less than or equal to 55.0°F (12.7°C).
Shasta Dam Fish Passage Evaluation
16 – DRAFT – June 2014
of about 63.0°F (17.0°C), especially during the smolt life stage can result in sub-
lethal effects on certain physiological processes and ecological interactions, such
as vulnerability to predation (McCullough 1999, Sullivan et al. 2000, Marine and
Cech 2004). While it is uncertain how long juvenile winter-run Chinook salmon
will rear and when they will migrate downstream, if reintroduced to tributaries
above Shasta Dam, the ocean type life history pattern of the winter-run Chinook
salmon population downstream of Shasta Dam suggests that they may, after
emerging in the late-summer, rear only into the early fall months, prior to
initiating their emigration to the lower river and estuary (Moyle 2002). Therefore,
the thermal regime along much of the upper Sacramento River (upstream from
Shasta Lake), except in the immediate vicinity of the Delta gage and the head of
Shasta Lake, appears to be highly suitable for rearing Chinook salmon.
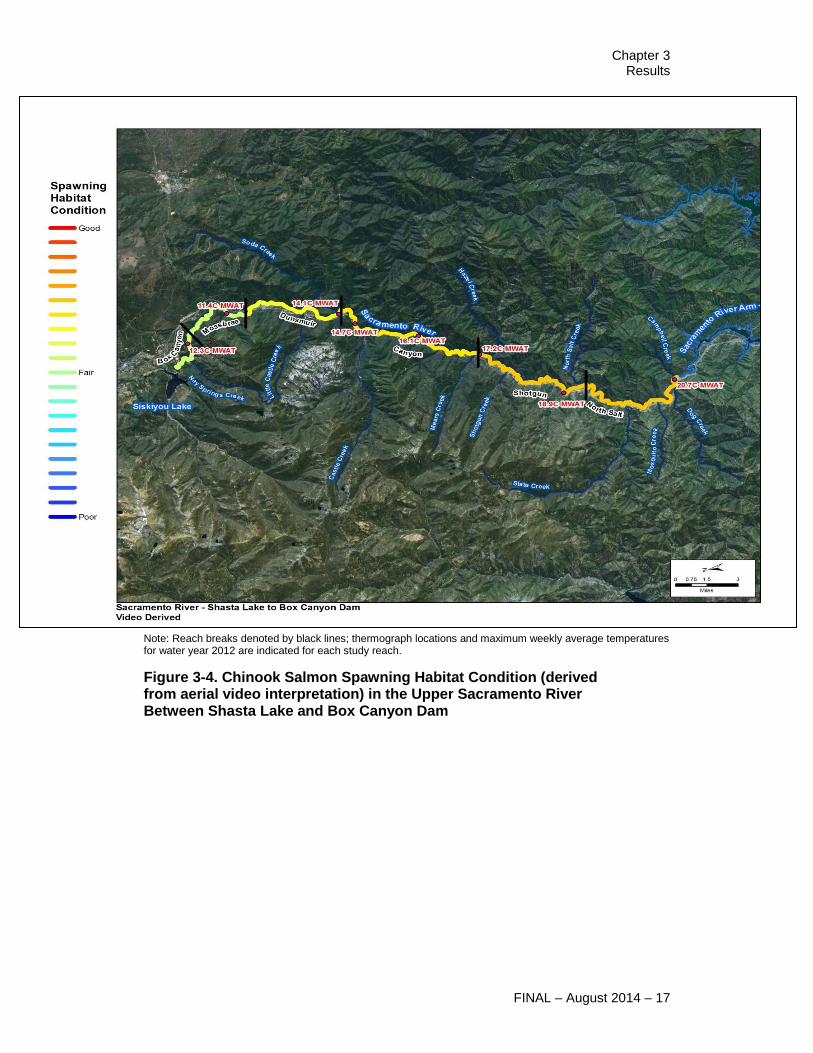
Chapter 3 Results
FINAL – August 2014 – 17
Note: Reach breaks denoted by black lines; thermograph locations and maximum weekly average temperatures for water year 2012 are indicated for each study reach.
Figure 3-4. Chinook Salmon Spawning Habitat Condition (derived from aerial video interpretation) in the Upper Sacramento River Between Shasta Lake and Box Canyon Dam
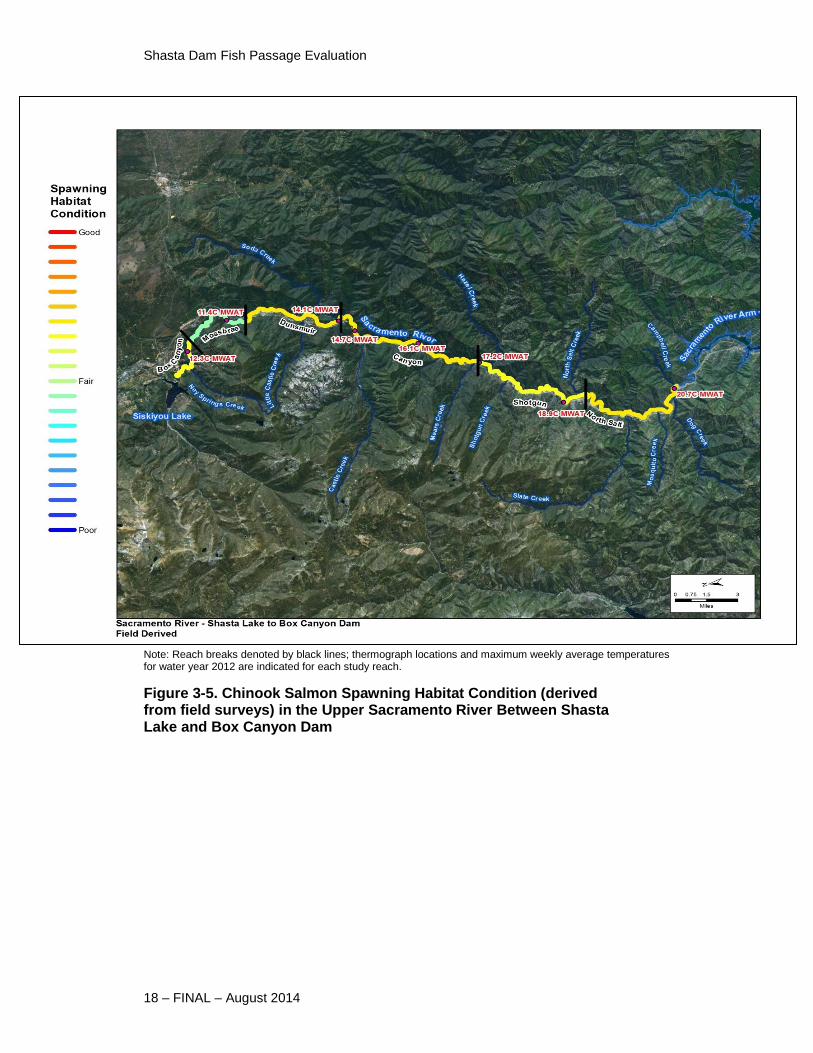
Shasta Dam Fish Passage Evaluation
18 – FINAL – August 2014
Note: Reach breaks denoted by black lines; thermograph locations and maximum weekly average temperatures for water year 2012 are indicated for each study reach.
Figure 3-5. Chinook Salmon Spawning Habitat Condition (derived from field surveys) in the Upper Sacramento River Between Shasta Lake and Box Canyon Dam
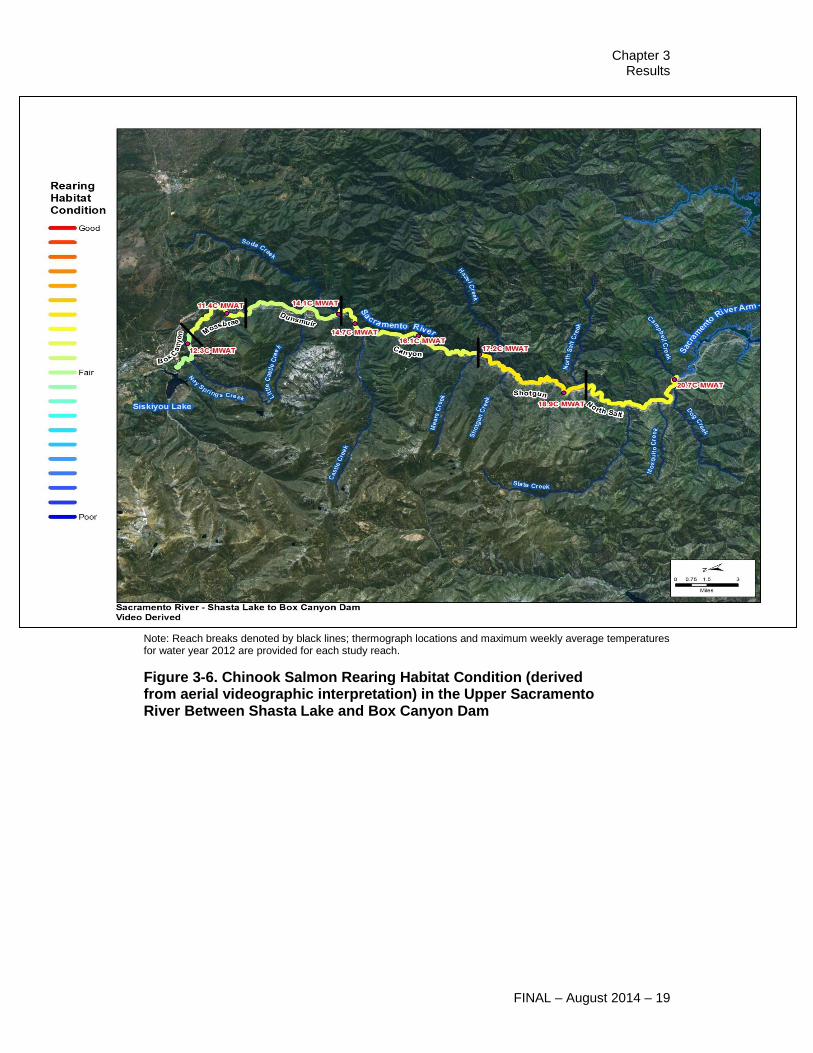
Chapter 3 Results
FINAL – August 2014 – 19
Note: Reach breaks denoted by black lines; thermograph locations and maximum weekly average temperatures for water year 2012 are provided for each study reach.
Figure 3-6. Chinook Salmon Rearing Habitat Condition (derived from aerial videographic interpretation) in the Upper Sacramento River Between Shasta Lake and Box Canyon Dam
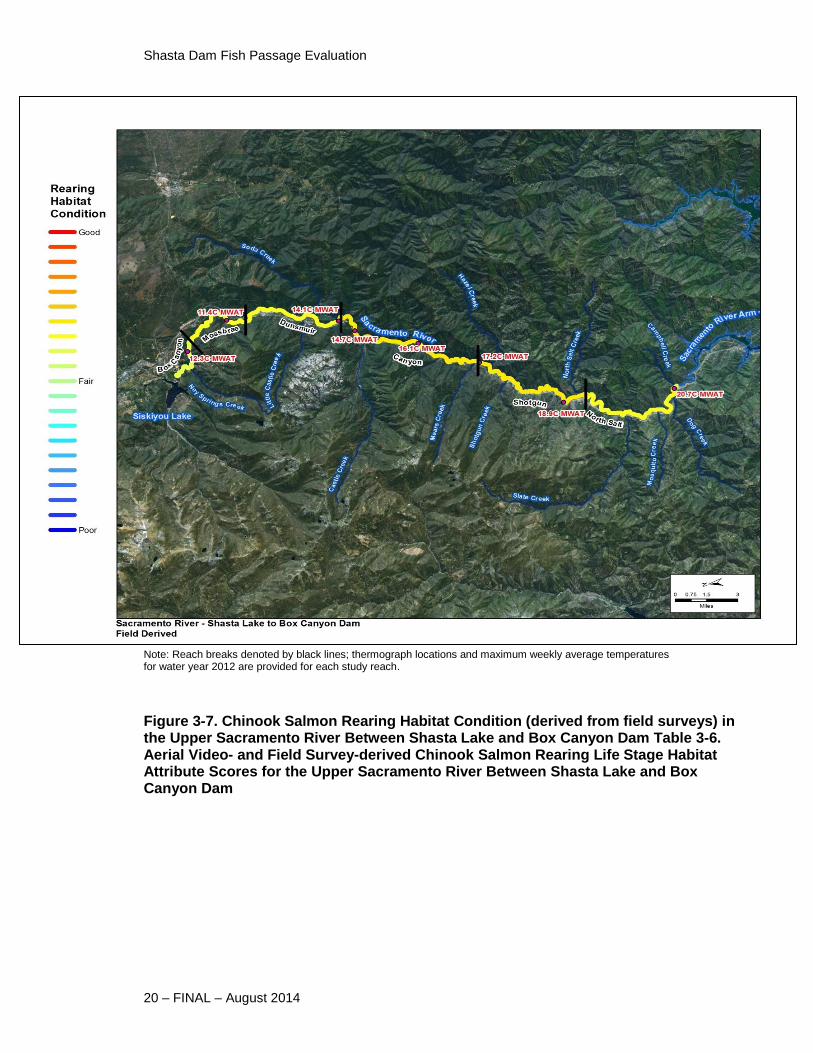
Shasta Dam Fish Passage Evaluation
20 – FINAL – August 2014
Note: Reach breaks denoted by black lines; thermograph locations and maximum weekly average temperatures for water year 2012 are provided for each study reach.
Figure 3-7. Chinook Salmon Rearing Habitat Condition (derived from field surveys) in the Upper Sacramento River Between Shasta Lake and Box Canyon Dam Table 3-6. Aerial Video- and Field Survey-derived Chinook Salmon Rearing Life Stage Habitat Attribute Scores for the Upper Sacramento River Between Shasta Lake and Box Canyon Dam
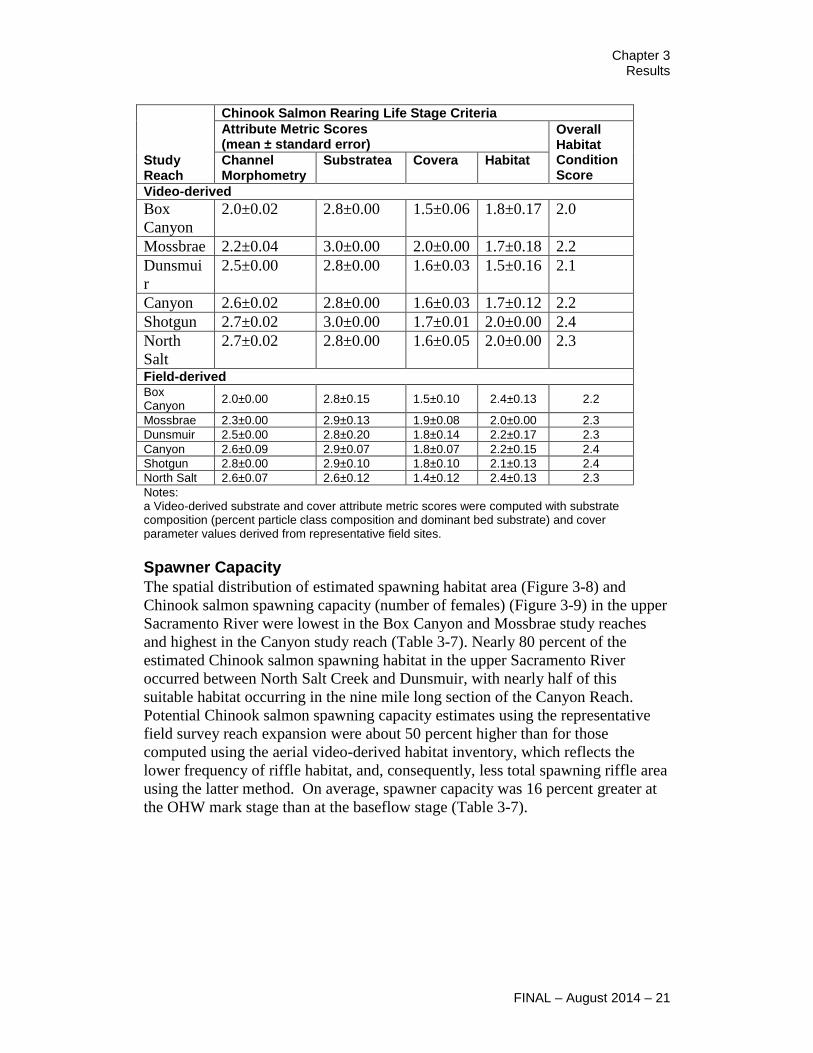
Chapter 3 Results
FINAL – August 2014 – 21
Study Reach
Chinook Salmon Rearing Life Stage Criteria
Attribute Metric Scores (mean ± standard error)
Overall Habitat Condition Score
Channel Morphometry
Substratea Covera Habitat
Video-derived
Box
Canyon
2.0±0.02 2.8±0.00 1.5±0.06 1.8±0.17 2.0
Mossbrae 2.2±0.04 3.0±0.00 2.0±0.00 1.7±0.18 2.2
Dunsmui
r
2.5±0.00 2.8±0.00 1.6±0.03 1.5±0.16 2.1
Canyon 2.6±0.02 2.8±0.00 1.6±0.03 1.7±0.12 2.2
Shotgun 2.7±0.02 3.0±0.00 1.7±0.01 2.0±0.00 2.4
North
Salt
2.7±0.02 2.8±0.00 1.6±0.05 2.0±0.00 2.3
Field-derived Box Canyon
2.0±0.00 2.8±0.15 1.5±0.10 2.4±0.13 2.2
Mossbrae 2.3±0.00 2.9±0.13 1.9±0.08 2.0±0.00 2.3
Dunsmuir 2.5±0.00 2.8±0.20 1.8±0.14 2.2±0.17 2.3
Canyon 2.6±0.09 2.9±0.07 1.8±0.07 2.2±0.15 2.4
Shotgun 2.8±0.00 2.9±0.10 1.8±0.10 2.1±0.13 2.4
North Salt 2.6±0.07 2.6±0.12 1.4±0.12 2.4±0.13 2.3
Notes: a Video-derived substrate and cover attribute metric scores were computed with substrate composition (percent particle class composition and dominant bed substrate) and cover parameter values derived from representative field sites.
Spawner Capacity
The spatial distribution of estimated spawning habitat area (Figure 3-8) and
Chinook salmon spawning capacity (number of females) (Figure 3-9) in the upper
Sacramento River were lowest in the Box Canyon and Mossbrae study reaches
and highest in the Canyon study reach (Table 3-7). Nearly 80 percent of the
estimated Chinook salmon spawning habitat in the upper Sacramento River
occurred between North Salt Creek and Dunsmuir, with nearly half of this
suitable habitat occurring in the nine mile long section of the Canyon Reach.
Potential Chinook salmon spawning capacity estimates using the representative
field survey reach expansion were about 50 percent higher than for those
computed using the aerial video-derived habitat inventory, which reflects the
lower frequency of riffle habitat, and, consequently, less total spawning riffle area
using the latter method. On average, spawner capacity was 16 percent greater at
the OHW mark stage than at the baseflow stage (Table 3-7).
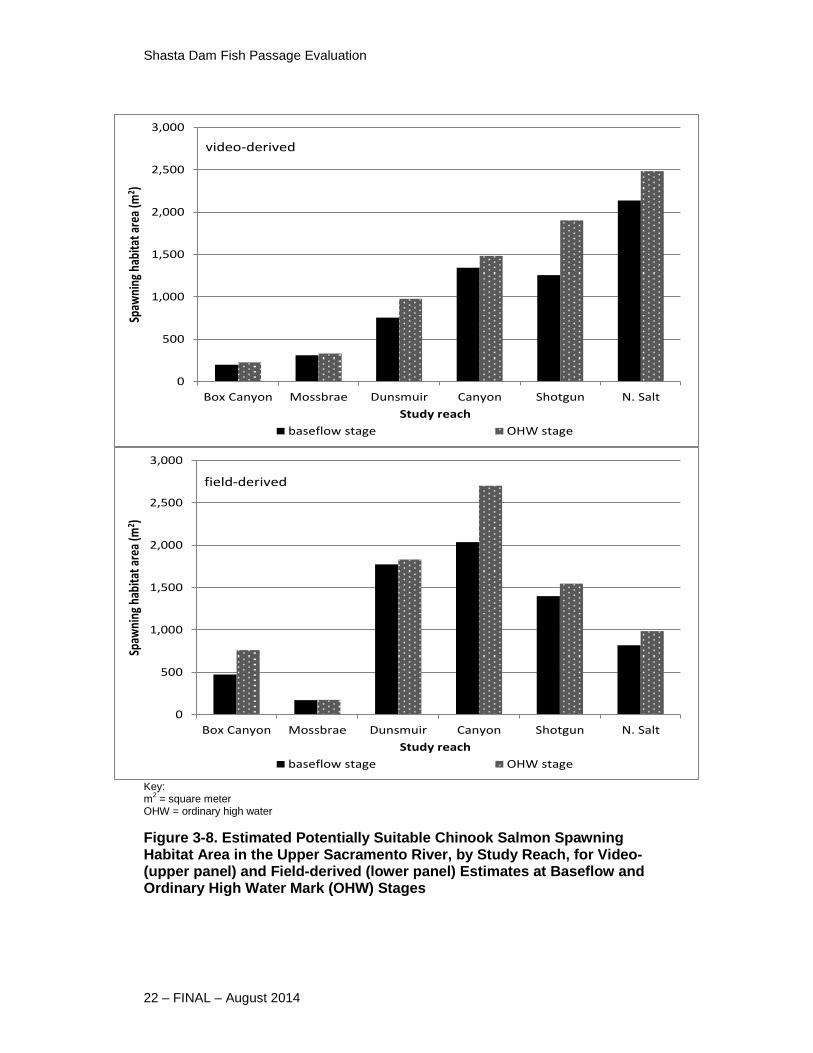
Shasta Dam Fish Passage Evaluation
22 – FINAL – August 2014
Key: m
2 = square meter
OHW = ordinary high water
Figure 3-8. Estimated Potentially Suitable Chinook Salmon Spawning Habitat Area in the Upper Sacramento River, by Study Reach, for Video- (upper panel) and Field-derived (lower panel) Estimates at Baseflow and Ordinary High Water Mark (OHW) Stages
0
500
1,000
1,500
2,000
2,500
3,000
Box Canyon Mossbrae Dunsmuir Canyon Shotgun N. Salt
Spaw
ning
hab
itat a
rea
(m2 )
Study reach
baseflow stage OHW stage
video-derived
0
500
1,000
1,500
2,000
2,500
3,000
Box Canyon Mossbrae Dunsmuir Canyon Shotgun N. Salt
Spaw
ning
hab
itat a
rea
(m2 )
Study reach
baseflow stage OHW stage
field-derived
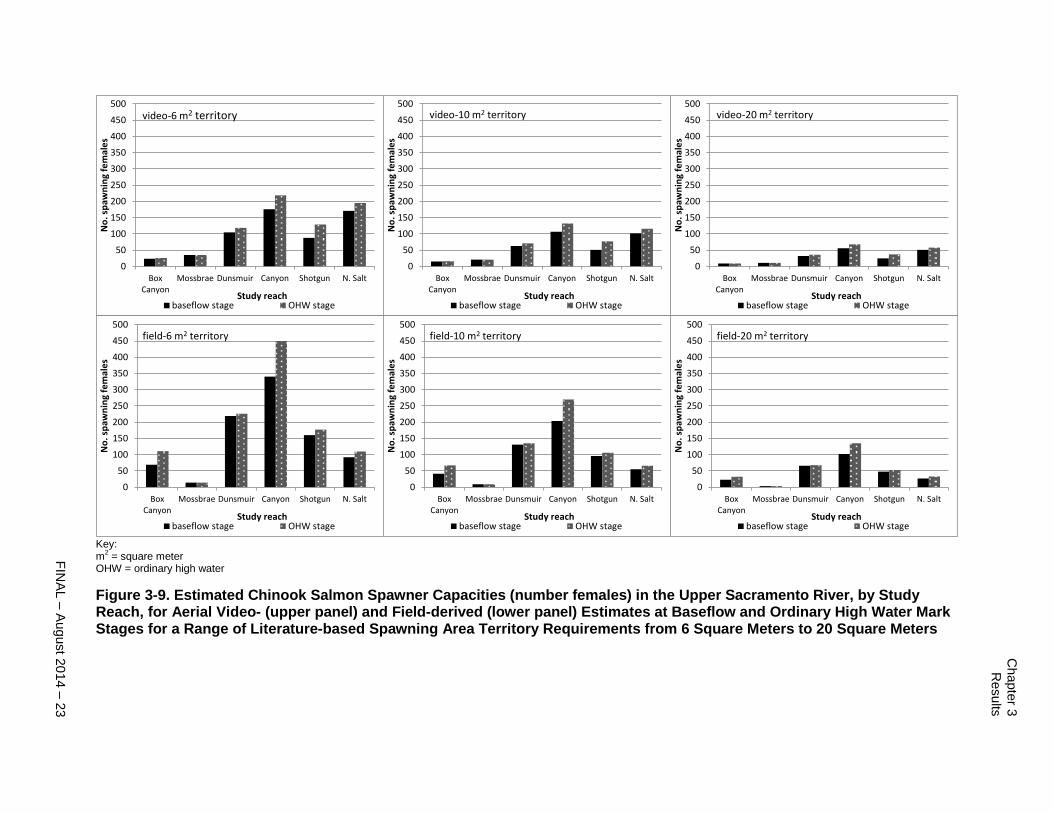
Chapte
r 3
Results
FIN
AL –
August 2
014 –
23
Key: m
2 = square meter
OHW = ordinary high water
Figure 3-9. Estimated Chinook Salmon Spawner Capacities (number females) in the Upper Sacramento River, by Study Reach, for Aerial Video- (upper panel) and Field-derived (lower panel) Estimates at Baseflow and Ordinary High Water Mark Stages for a Range of Literature-based Spawning Area Territory Requirements from 6 Square Meters to 20 Square Meters
0
50
100
150
200
250
300
350
400
450
500
BoxCanyon
Mossbrae Dunsmuir Canyon Shotgun N. Salt
No
. sp
awn
ing
fem
ale
s
Study reachbaseflow stage OHW stage
video-6 m2 territory
0
50
100
150
200
250
300
350
400
450
500
BoxCanyon
Mossbrae Dunsmuir Canyon Shotgun N. Salt
No
. sp
awn
ing
fem
ale
s
Study reachbaseflow stage OHW stage
field-6 m2 territory
0
50
100
150
200
250
300
350
400
450
500
BoxCanyon
Mossbrae Dunsmuir Canyon Shotgun N. Salt
No
. sp
awn
ing
fem
ale
s
Study reachbaseflow stage OHW stage
video-10 m2 territory
0
50
100
150
200
250
300
350
400
450
500
BoxCanyon
Mossbrae Dunsmuir Canyon Shotgun N. Salt
No
. sp
awn
ing
fem
ale
s
Study reachbaseflow stage OHW stage
field-10 m2 territory
0
50
100
150
200
250
300
350
400
450
500
BoxCanyon
Mossbrae Dunsmuir Canyon Shotgun N. Salt
No
. sp
awn
ing
fem
ale
s
Study reachbaseflow stage OHW stage
video-20 m2 territory
0
50
100
150
200
250
300
350
400
450
500
BoxCanyon
Mossbrae Dunsmuir Canyon Shotgun N. Salt
No
. sp
awn
ing
fem
ale
s
Study reachbaseflow stage OHW stage
field-20 m2 territory

Shasta
Da
m F
ish P
assag
e E
valu
atio
n
24 –
FIN
AL
– A
ug
ust 2
014
Table 3-7. Aerial Video- and Field Survey-derived Estimates of Potential Chinook Salmon Spawning Habitat Area and Potential Spawner Capacity, as the Number of Female Salmon, by Study Reach, in the Upper Sacramento River Between Shasta Lake and Box Canyon Dam
Study Reach
Total Spawning Habitat Area (m2)
Estimated Spawner Capacity (number females)
6 m2 Spawning Territory 6 m2 Spawning Territory 20 m2 Spawning Territory
Baseflow Stage
OHW Stage Baseflow Stage
OHW Stage Baseflow Stage
OHW Stage Baseflow Stage
OHW Stage
Video-derived
Box Canyon 199 227 24 26 15 16 9 9 Mossbrae 311 332 35 35 21 21 11 11 Dunsmuir 755 978 105 119 63 71 32 36 Canyon 1,343 1,485 176 219 107 132 56 68 Shotgun 1,257 1,904 88 129 51 77 25 37 North Salt 2,138 2,485 171 195 102 116 51 58 Total 6,004 7,412 600 723 359 434 183 219 Field-derived
Box Canyon 474 761 69 111 41 67 23 32
Mossbrae 172 172 14 14 9 9 3 3
Dunsmuir 1,774 1,830 219 226 131 135 66 68
Canyon 2,037 2,700 340 450 204 270 102 135
Shotgun 1,400 1,547 160 177 96 106 48 53
North Salt 820 985 92 110 55 66 27 33
Total 6,677 7,994 893 1,087 536 652 269 324
Key: m
2 = square meter
OHW = ordinary high water
Chapter 3 Results
FINAL – August 2014 – 25
McCloud River
Aquatic Habitat Inventory
Aerial video was collected along the mainstem McCloud River between Shasta
Lake and McCloud Dam and from McCloud Reservoir to Lower McCloud Falls
on November 24, 20135. Average daily flow in the McCloud River at the gage
above Shasta Lake (USGS Gage No. 1136800) was 270 cfs, at Ah-Di-Na (USGS
Gage No. 11367800) was 190 cfs, and upstream of McCloud Reservoir (USGS
Gage No. 11367500) was 640 cfs. Video quality and coverage decreased with
distance upstream, particularly upstream of Squaw Valley Creek, as channel
widths decreased, and the channel sinuosity, hills slope, topographic aspect, and
vegetation cover increased (Appendix B). With the same limitations as described
for the upper Sacramento River, a geomorphic channel unit inventory and
identification of a number of key habitat parameters for the McCloud River could
be determined from the aerial videography.
As described in the Methods Section, ground-level field surveys were limited, by
restricted access to much of the river and by budget and time limitations, to only
three representative sites on the McCloud River, which were systematically
assigned to the section of the river from Ladybug Creek to the McCloud Dam,
where aerial video was most obscured. Field surveys were conducted between
January 28 and January 29, 2014. Average daily flow in the McCloud River
during the field survey period averaged 260 cfs above Shasta Lake and 190 cfs
near Ah-Di-Na. During field surveys, several salmonid redds were also observed
in the McCloud River and information on the locations and characteristics of
these redds are summarized in Table 3-1.
Habitat inventory technical data for both aerial video and field survey methods are
detailed in Appendix B. Field survey sites covered 38 percent of the channel
length in the upper study reach and 7 percent of the channel length of the middle
study reach (see Figure 2-2 and Table 2-2 for the location and details on these
survey sites). The lower study reach habitat inventory was limited to aerial video
interpretation only because, although permission to access much of this study
reach on the Bollibokka Club from Westlands Water District was obtained, the
timing of weather, flow, and, ultimately, budget restricted the completion of the
surveys for this reach. However, the representative survey reaches that were
selected for this study plan are shown in Figure 2-2 and are recommended to be
surveyed to update this analysis, pending future phases of work.
5 Aquatic habitat inventory was conducted only for the McCloud River between Shasta Lake and
McCloud Dam, excluding the Headwaters Reach due to insufficient video quality and stream access.
Shasta Dam Fish Passage Evaluation
26 – FINAL– August 2014
Habitat composition in the McCloud River determined by aerial video
interpretation was dominated by pools and flatwater habitats (consisting of runs,
glides, and pocket water) in all three study reaches. The frequency of pool
habitats tends to progressively increase downstream from McCloud Dam
becoming the dominant habitat in the lower study reach (Figure 3-10). Higher
gradient, fast water habitats (i.e., riffles and cascades) comprised a greater
proportion of the available habitat in the upper study reach, consistent with its
bedrock-controlled, cascade and step-pool, bed morphology. However, the field
survey site near Hawkins Creek in the upper study reach exhibited lower
proportions of these high gradient features than was measured in the aerial video
interpretation and, thus, may under-represent this dominant habitat type in the
study reach. Similarly, the single field survey site in the middle study reach
exhibited a greater proportion of flatwater habitats, particularly, pocket water,
than was measured in the aerial videography. This may be partly attributable to
the relatively short length of channel that could be legally accessed for field
surveys in the middle study reach but may also have been contributed by
difficulties differentiating between flatwater, pools, and some riffle habitats in
video imagery for the middle study reach. As a result, it is difficult to fully assess
the potential error or bias that may affect the habitat inventory determined by
aerial video interpretation, especially for the middle and lower study reaches.
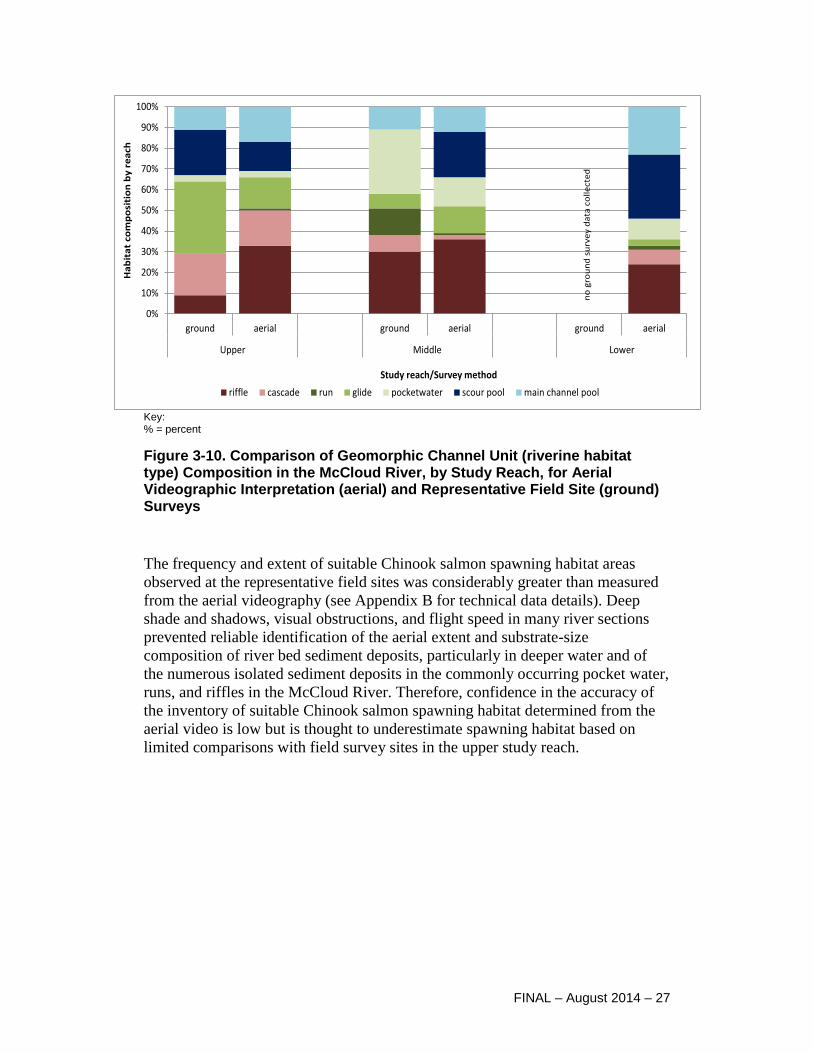
Chapter 3 Results
FINAL – August 2014 – 27
Key: % = percent
Figure 3-10. Comparison of Geomorphic Channel Unit (riverine habitat type) Composition in the McCloud River, by Study Reach, for Aerial Videographic Interpretation (aerial) and Representative Field Site (ground) Surveys
The frequency and extent of suitable Chinook salmon spawning habitat areas
observed at the representative field sites was considerably greater than measured
from the aerial videography (see Appendix B for technical data details). Deep
shade and shadows, visual obstructions, and flight speed in many river sections
prevented reliable identification of the aerial extent and substrate-size
composition of river bed sediment deposits, particularly in deeper water and of
the numerous isolated sediment deposits in the commonly occurring pocket water,
runs, and riffles in the McCloud River. Therefore, confidence in the accuracy of
the inventory of suitable Chinook salmon spawning habitat determined from the
aerial video is low but is thought to underestimate spawning habitat based on
limited comparisons with field survey sites in the upper study reach.
0%
10%
20%
30%
40%
50%
60%
70%
80%
90%
100%
ground aerial ground aerial ground aerial
Upper Middle Lower
Ha
bit
at
com
po
siti
on
by
re
ach
Study reach/Survey method
riffle cascade run glide pocketwater scour pool main channel pool
no
gro
un
d s
urv
ey
da
ta c
oll
ect
ed
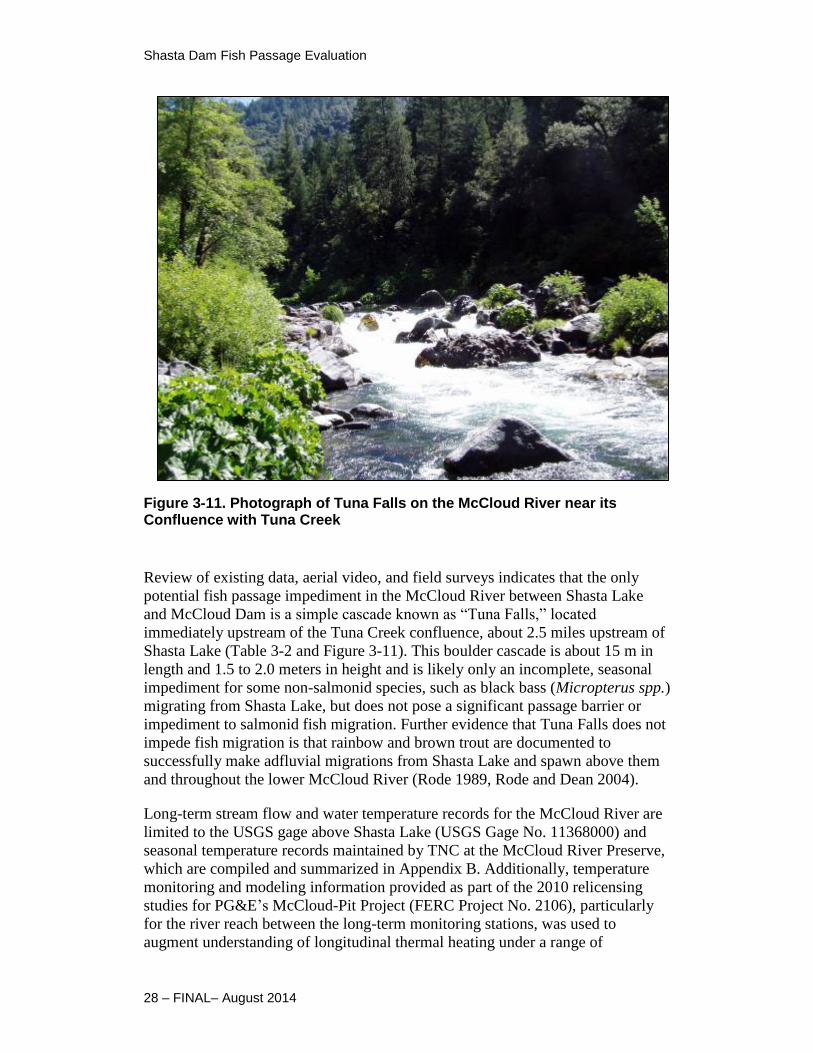
Shasta Dam Fish Passage Evaluation
28 – FINAL– August 2014
Figure 3-11. Photograph of Tuna Falls on the McCloud River near its Confluence with Tuna Creek
Review of existing data, aerial video, and field surveys indicates that the only
potential fish passage impediment in the McCloud River between Shasta Lake
and McCloud Dam is a simple cascade known as “Tuna Falls,” located
immediately upstream of the Tuna Creek confluence, about 2.5 miles upstream of
Shasta Lake (Table 3-2 and Figure 3-11). This boulder cascade is about 15 m in
length and 1.5 to 2.0 meters in height and is likely only an incomplete, seasonal
impediment for some non-salmonid species, such as black bass (Micropterus spp.)
migrating from Shasta Lake, but does not pose a significant passage barrier or
impediment to salmonid fish migration. Further evidence that Tuna Falls does not
impede fish migration is that rainbow and brown trout are documented to
successfully make adfluvial migrations from Shasta Lake and spawn above them
and throughout the lower McCloud River (Rode 1989, Rode and Dean 2004).
Long-term stream flow and water temperature records for the McCloud River are
limited to the USGS gage above Shasta Lake (USGS Gage No. 11368000) and
seasonal temperature records maintained by TNC at the McCloud River Preserve,
which are compiled and summarized in Appendix B. Additionally, temperature
monitoring and modeling information provided as part of the 2010 relicensing
studies for PG&E’s McCloud-Pit Project (FERC Project No. 2106), particularly
for the river reach between the long-term monitoring stations, was used to
augment understanding of longitudinal thermal heating under a range of
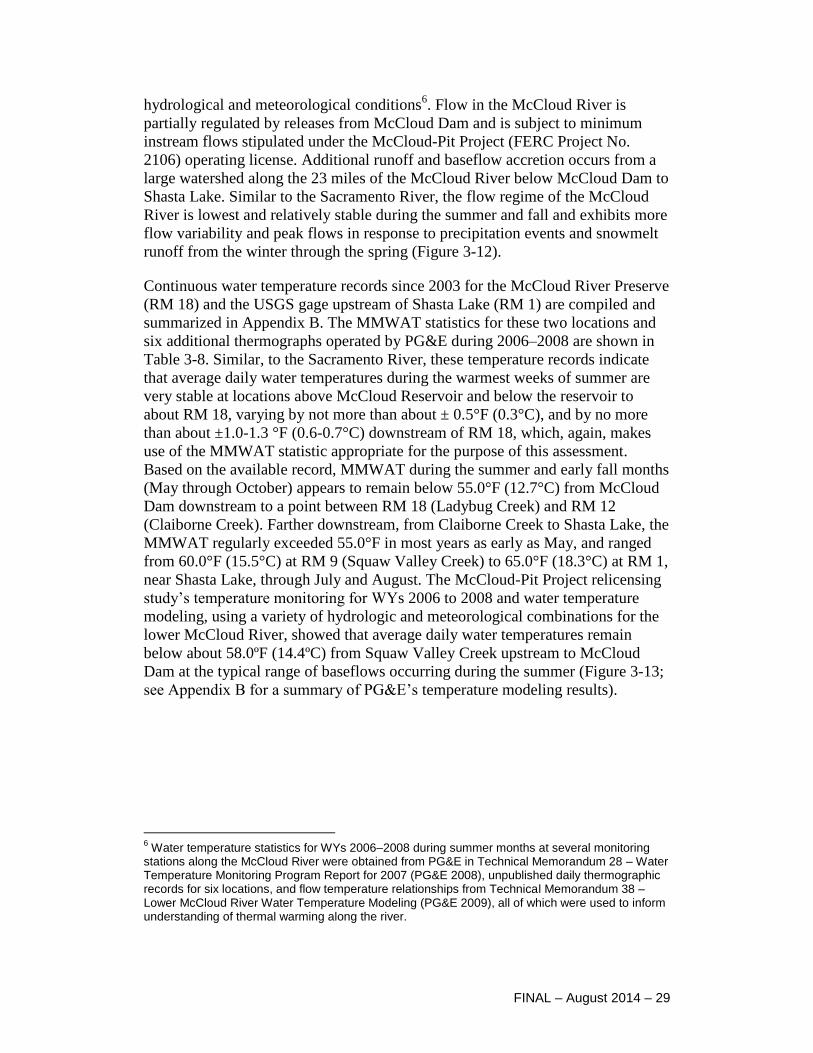
Chapter 3 Results
FINAL – August 2014 – 29
hydrological and meteorological conditions6. Flow in the McCloud River is
partially regulated by releases from McCloud Dam and is subject to minimum
instream flows stipulated under the McCloud-Pit Project (FERC Project No.
2106) operating license. Additional runoff and baseflow accretion occurs from a
large watershed along the 23 miles of the McCloud River below McCloud Dam to
Shasta Lake. Similar to the Sacramento River, the flow regime of the McCloud
River is lowest and relatively stable during the summer and fall and exhibits more
flow variability and peak flows in response to precipitation events and snowmelt
runoff from the winter through the spring (Figure 3-12).
Continuous water temperature records since 2003 for the McCloud River Preserve
(RM 18) and the USGS gage upstream of Shasta Lake (RM 1) are compiled and
summarized in Appendix B. The MMWAT statistics for these two locations and
six additional thermographs operated by PG&E during 2006–2008 are shown in
Table 3-8. Similar, to the Sacramento River, these temperature records indicate
that average daily water temperatures during the warmest weeks of summer are
very stable at locations above McCloud Reservoir and below the reservoir to
about RM 18, varying by not more than about ± 0.5°F (0.3°C), and by no more
than about ±1.0-1.3 °F (0.6-0.7°C) downstream of RM 18, which, again, makes
use of the MMWAT statistic appropriate for the purpose of this assessment.
Based on the available record, MMWAT during the summer and early fall months
(May through October) appears to remain below 55.0°F (12.7°C) from McCloud
Dam downstream to a point between RM 18 (Ladybug Creek) and RM 12
(Claiborne Creek). Farther downstream, from Claiborne Creek to Shasta Lake, the
MMWAT regularly exceeded 55.0°F in most years as early as May, and ranged
from 60.0°F (15.5°C) at RM 9 (Squaw Valley Creek) to 65.0°F (18.3°C) at RM 1,
near Shasta Lake, through July and August. The McCloud-Pit Project relicensing
study’s temperature monitoring for WYs 2006 to 2008 and water temperature
modeling, using a variety of hydrologic and meteorological combinations for the
lower McCloud River, showed that average daily water temperatures remain
below about 58.0ºF (14.4ºC) from Squaw Valley Creek upstream to McCloud
Dam at the typical range of baseflows occurring during the summer (Figure 3-13;
see Appendix B for a summary of PG&E’s temperature modeling results).
6 Water temperature statistics for WYs 2006–2008 during summer months at several monitoring
stations along the McCloud River were obtained from PG&E in Technical Memorandum 28 – Water Temperature Monitoring Program Report for 2007 (PG&E 2008), unpublished daily thermographic records for six locations, and flow temperature relationships from Technical Memorandum 38 – Lower McCloud River Water Temperature Modeling (PG&E 2009), all of which were used to inform understanding of thermal warming along the river.

Shasta Dam Fish Passage Evaluation
30 – FINAL– August 2014
Key: cfs = cubic feet per second
Figure 3-12. Average Daily Flow in the McCloud River above Shasta Lake (USGS Gage No. 1136800) for Water Years 2003 to 2012
0
5
10
15
20
25
30
35
40
45
50
Ave
rage
dai
ly f
low
(th
ou
san
d c
fs)
Water Year
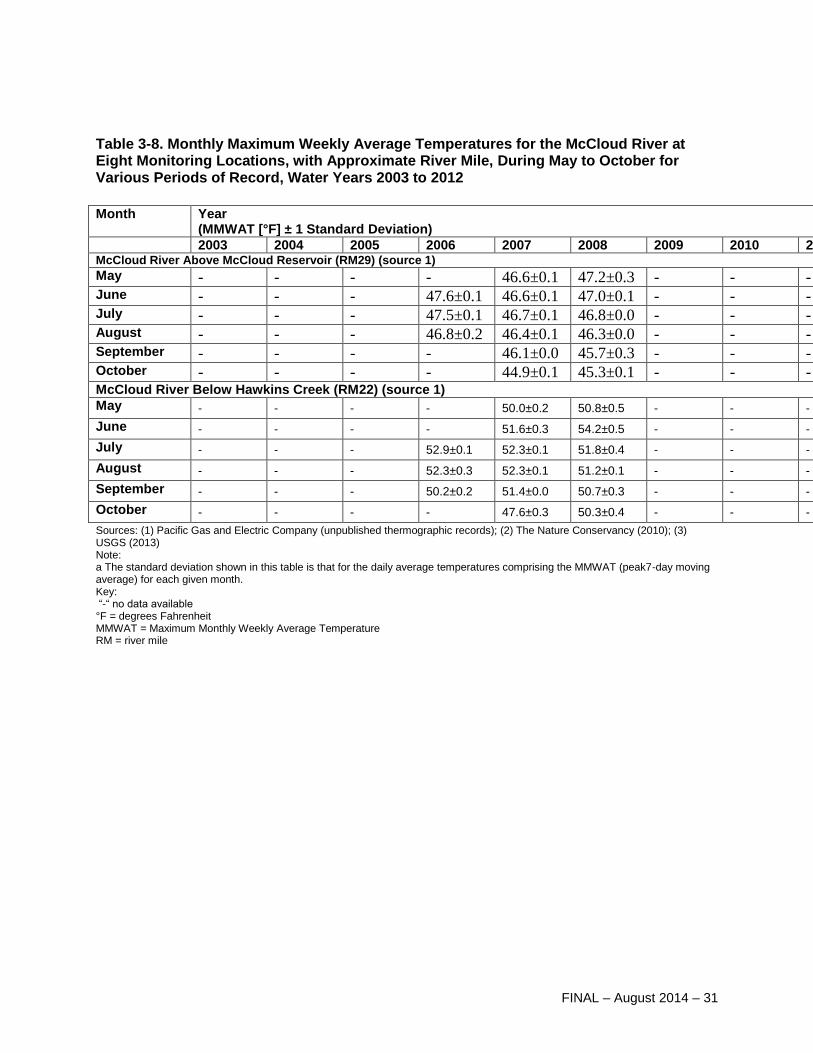
Chapter 3 Results
FINAL – August 2014 – 31
Table 3-8. Monthly Maximum Weekly Average Temperatures for the McCloud River at Eight Monitoring Locations, with Approximate River Mile, During May to October for Various Periods of Record, Water Years 2003 to 2012
Month Year (MMWAT [°F] ± 1 Standard Deviation)
2003 2004 2005 2006 2007 2008 2009 2010 2011 2012 McCloud River Above McCloud Reservoir (RM29) (source 1)
May - - - - 46.6±0.1 47.2±0.3 - - - - June - - - 47.6±0.1 46.6±0.1 47.0±0.1 - - - - July - - - 47.5±0.1 46.7±0.1 46.8±0.0 - - - - August - - - 46.8±0.2 46.4±0.1 46.3±0.0 - - - - September - - - - 46.1±0.0 45.7±0.3 - - - - October - - - - 44.9±0.1 45.3±0.1 - - - - McCloud River Below Hawkins Creek (RM22) (source 1)
May - - - - 50.0±0.2 50.8±0.5 - - - -
June - - - - 51.6±0.3 54.2±0.5 - - - -
July - - - 52.9±0.1 52.3±0.1 51.8±0.4 - - - -
August - - - 52.3±0.3 52.3±0.1 51.2±0.1 - - - -
September - - - 50.2±0.2 51.4±0.0 50.7±0.3 - - - -
October - - - - 47.6±0.3 50.3±0.4 - - - -
Sources: (1) Pacific Gas and Electric Company (unpublished thermographic records); (2) The Nature Conservancy (2010); (3) USGS (2013) Note: a The standard deviation shown in this table is that for the daily average temperatures comprising the MMWAT (peak7-day moving average) for each given month. Key: “-“ no data available °F = degrees Fahrenheit MMWAT = Maximum Monthly Weekly Average Temperature RM = river mile
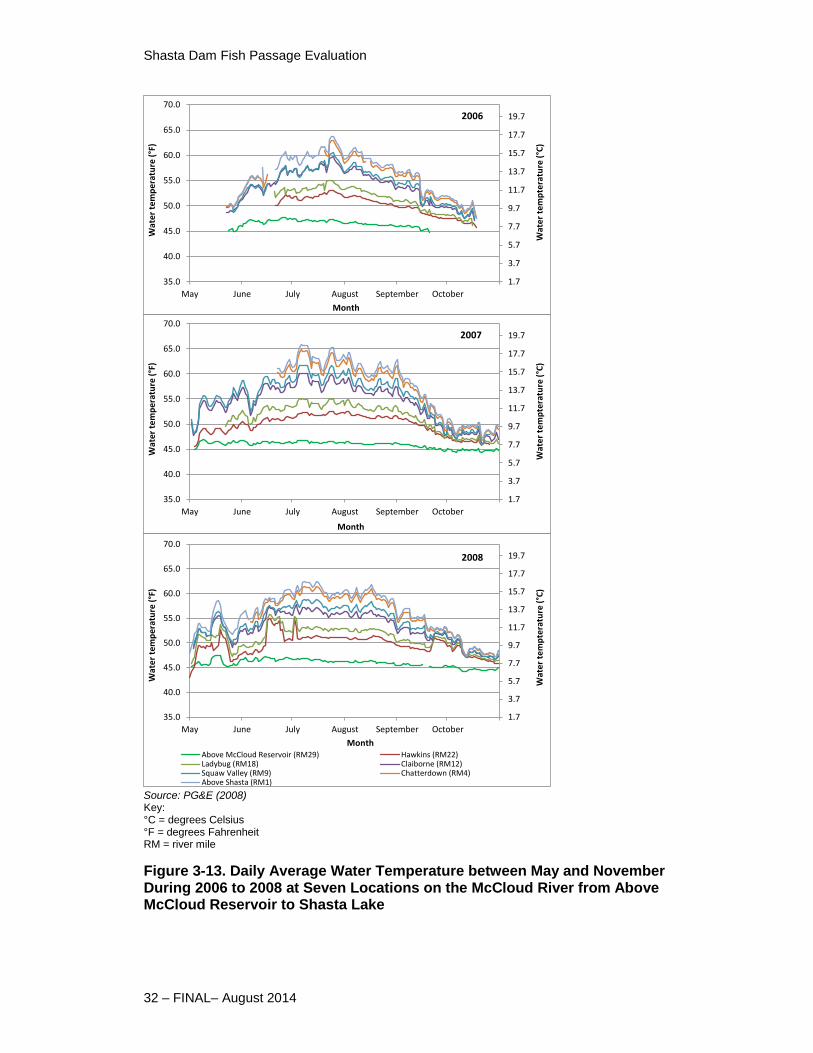
Shasta Dam Fish Passage Evaluation
32 – FINAL– August 2014
Source: PG&E (2008) Key: °C = degrees Celsius °F = degrees Fahrenheit RM = river mile
Figure 3-13. Daily Average Water Temperature between May and November During 2006 to 2008 at Seven Locations on the McCloud River from Above McCloud Reservoir to Shasta Lake
1.7
3.7
5.7
7.7
9.7
11.7
13.7
15.7
17.7
19.7
35.0
40.0
45.0
50.0
55.0
60.0
65.0
70.0
May June July August September October
Wat
er
tem
pte
ratu
re (
°C)
Wat
er
tem
pe
ratu
re (
°F)
Month
2006
1.7
3.7
5.7
7.7
9.7
11.7
13.7
15.7
17.7
19.7
35.0
40.0
45.0
50.0
55.0
60.0
65.0
70.0
May June July August September October
Wat
er
tem
pte
ratu
re (
°C)
Wat
er
tem
pe
ratu
re (
°F)
Month
2007
1.7
3.7
5.7
7.7
9.7
11.7
13.7
15.7
17.7
19.7
35.0
40.0
45.0
50.0
55.0
60.0
65.0
70.0
May June July August September October
Wat
er
tem
pte
ratu
re (
°C)
Wat
er
tem
pe
ratu
re (
°F)
MonthAbove McCloud Reservoir (RM29) Hawkins (RM22)Ladybug (RM18) Claiborne (RM12)Squaw Valley (RM9) Chatterdown (RM4)Above Shasta (RM1)
2008
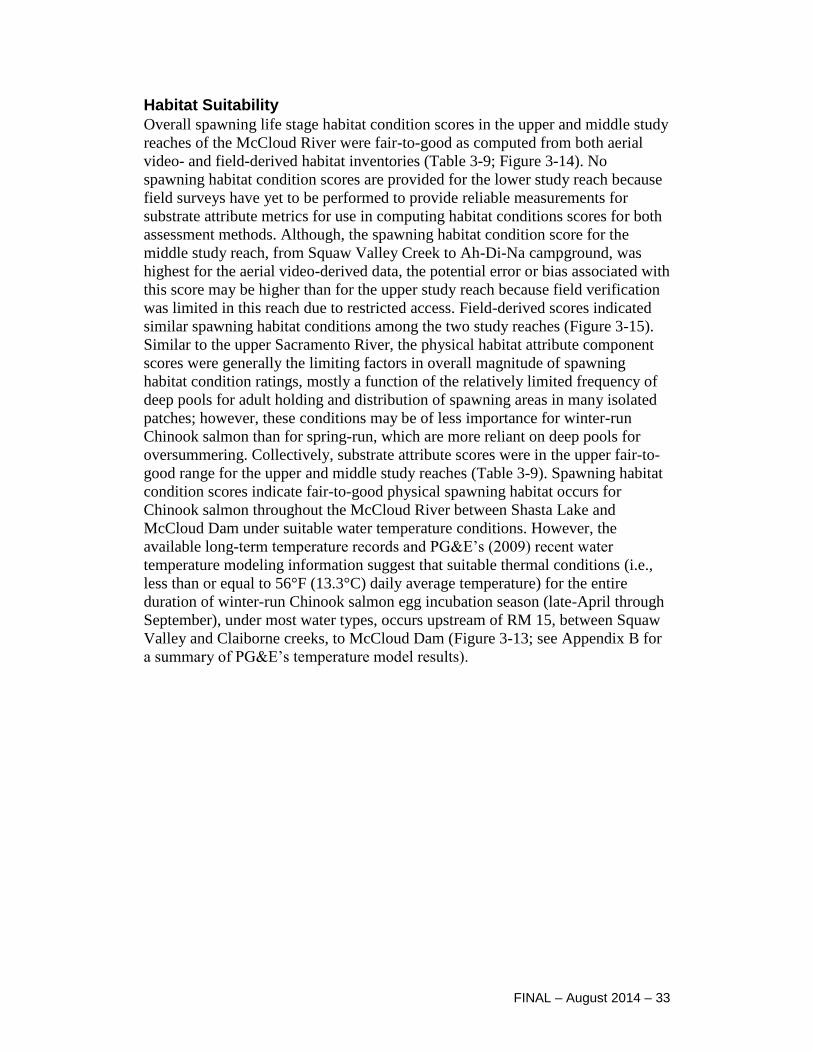
Chapter 3 Results
FINAL – August 2014 – 33
Habitat Suitability
Overall spawning life stage habitat condition scores in the upper and middle study
reaches of the McCloud River were fair-to-good as computed from both aerial
video- and field-derived habitat inventories (Table 3-9; Figure 3-14). No
spawning habitat condition scores are provided for the lower study reach because
field surveys have yet to be performed to provide reliable measurements for
substrate attribute metrics for use in computing habitat conditions scores for both
assessment methods. Although, the spawning habitat condition score for the
middle study reach, from Squaw Valley Creek to Ah-Di-Na campground, was
highest for the aerial video-derived data, the potential error or bias associated with
this score may be higher than for the upper study reach because field verification
was limited in this reach due to restricted access. Field-derived scores indicated
similar spawning habitat conditions among the two study reaches (Figure 3-15).
Similar to the upper Sacramento River, the physical habitat attribute component
scores were generally the limiting factors in overall magnitude of spawning
habitat condition ratings, mostly a function of the relatively limited frequency of
deep pools for adult holding and distribution of spawning areas in many isolated
patches; however, these conditions may be of less importance for winter-run
Chinook salmon than for spring-run, which are more reliant on deep pools for
oversummering. Collectively, substrate attribute scores were in the upper fair-to-
good range for the upper and middle study reaches (Table 3-9). Spawning habitat
condition scores indicate fair-to-good physical spawning habitat occurs for
Chinook salmon throughout the McCloud River between Shasta Lake and
McCloud Dam under suitable water temperature conditions. However, the
available long-term temperature records and PG&E’s (2009) recent water
temperature modeling information suggest that suitable thermal conditions (i.e.,
less than or equal to 56°F (13.3°C) daily average temperature) for the entire
duration of winter-run Chinook salmon egg incubation season (late-April through
September), under most water types, occurs upstream of RM 15, between Squaw
Valley and Claiborne creeks, to McCloud Dam (Figure 3-13; see Appendix B for
a summary of PG&E’s temperature model results).
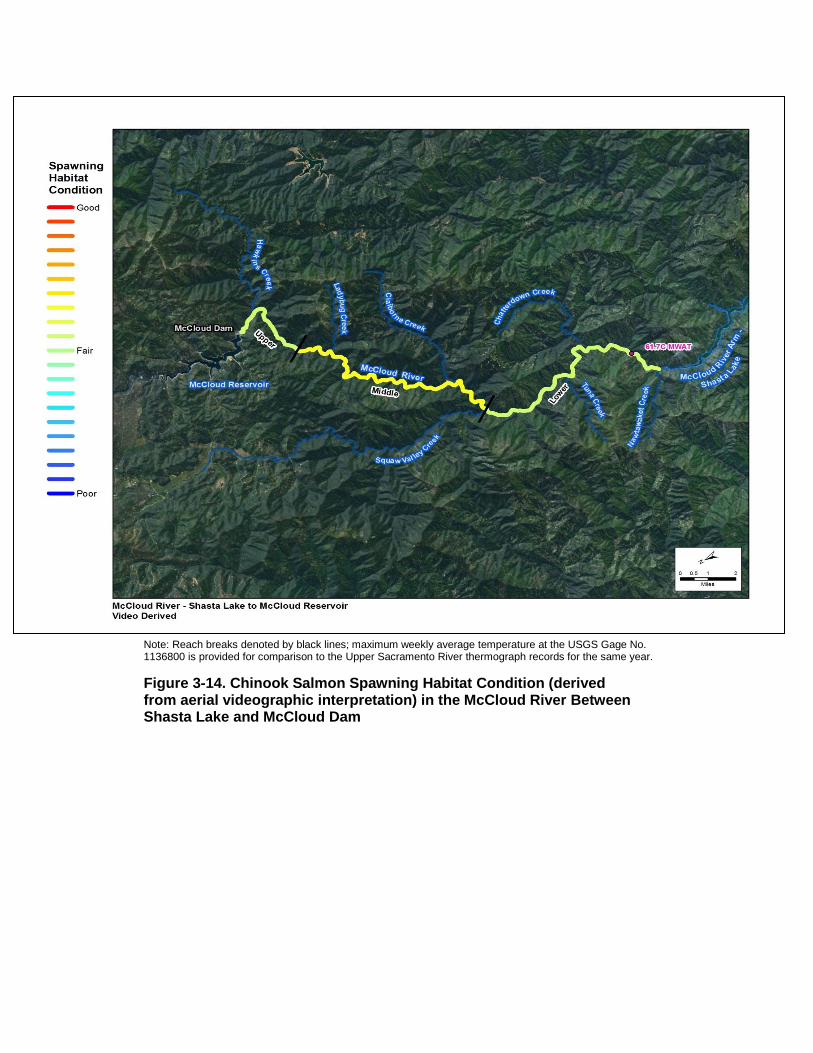
Shasta
Da
m F
ish P
assag
e E
valu
atio
n
34 –
FIN
AL
– A
ug
ust 2
014
Note: Reach breaks denoted by black lines; maximum weekly average temperature at the USGS Gage No. 1136800 is provided for comparison to the Upper Sacramento River thermograph records for the same year.
Figure 3-14. Chinook Salmon Spawning Habitat Condition (derived from aerial videographic interpretation) in the McCloud River Between Shasta Lake and McCloud Dam
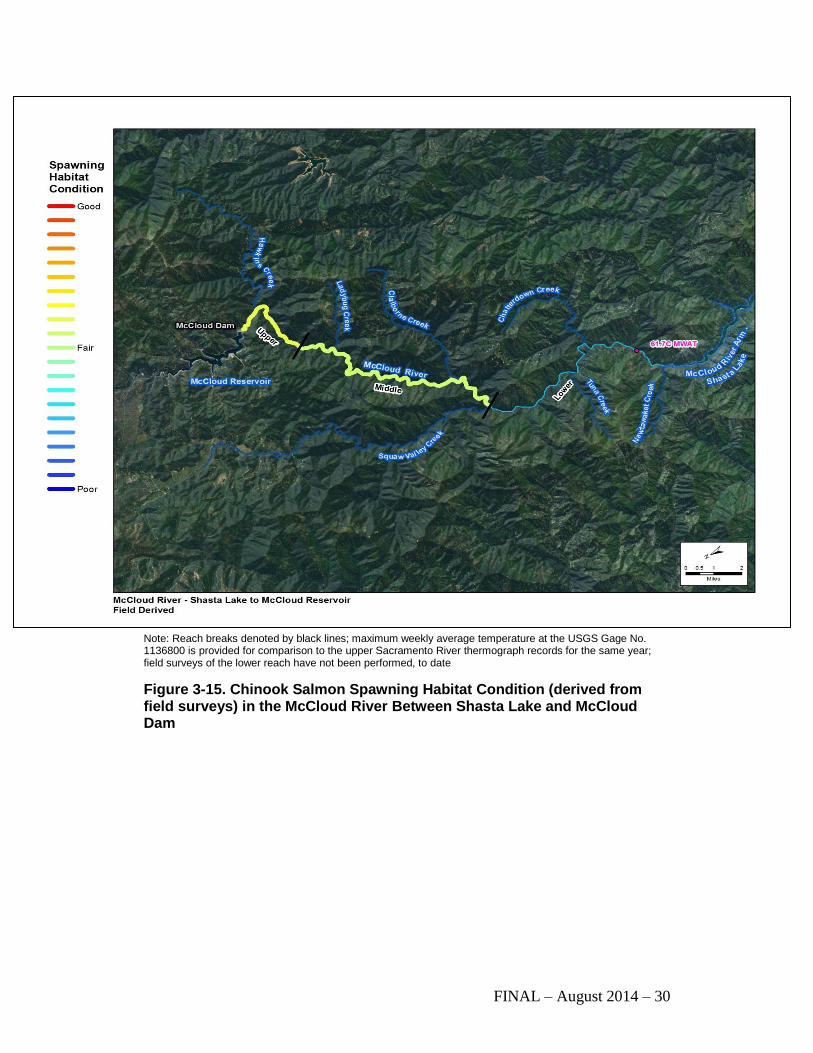
FINAL – August 2014 – 30
Note: Reach breaks denoted by black lines; maximum weekly average temperature at the USGS Gage No. 1136800 is provided for comparison to the upper Sacramento River thermograph records for the same year; field surveys of the lower reach have not been performed, to date
Figure 3-15. Chinook Salmon Spawning Habitat Condition (derived from field surveys) in the McCloud River Between Shasta Lake and McCloud Dam
Shasta Dam Fish Passage Evaluation
36 – FINAL – August 2014
Table 3-9. Aerial Video- and Field Survey-derived Chinook Salmon Spawning, Egg Incubation, and Emergence Life Stage Habitat Attribute Scores for the McCloud River between Shasta Lake and McCloud Dam
Study Reach
Chinook Salmon Spawning, Egg Incubation, and Emergence Life Stage Criteria
Attribute Scores (mean ± standard error) Overall Habitat
Condition Score
Channel Morphometry
Substratea
Habitat
Video-derived
Upper 2.1±0.03 2.6±0.00 1.6±0.10 2.1 Middle 2.3±0.00 2.4±0.00 2.1±0.11 2.3 Lower 2.3±0.00 - 1.9±0.09 - Field-derived
Upper 1.6±0.11 2.6±0.00 2.4±0.21 2.2
Middle 2.1±0.17 2.6±0.00 1.7±0.33 2.1
Lower - - - -
Note: a Video-derived substrate attribute metric scores were computed with substrate composition parameter values (percent particle class composition and dominant bed substrate) derived from representative field sites.
Key: “-“ = no data available.
Chinook salmon rearing life stage habitat condition scores were fair-to-good, with
little spatial variation in the upper and middle study reaches, for both aerial video-
and field-derived habitat inventories (Figures 3-16 and 3-17). Cover attribute
scores were the lowest rated component, which influenced the overall rearing
habitat condition scores for each study reach (Table 3-10).7 As for the upper
Sacramento River, the cover attribute scores are highly dependent on the amounts
and diversity of LWD for pool formation and physical cover, which are limited in
the McCloud River and may not be as important in the large river tributaries
because of the bedrock-controlled channel and pool forming structures. Substrate
and habitat attribute scores were fair-to-good from both the aerial video- and
field-derived habitat inventories (Table 3-10). Although both assessment methods
relied on field-derived metrics for bed substrate composition and embeddedness,
the difference between aerial video- and field-derived rearing habitat substrate
attribute scores may have been a function of the combined error or bias associated
with the aerial video-interpreted habitat inventory and the limited, short field site
surveyed in the Middle study reach, not being fully representative of that study
reach. Channel morphometry attribute scores for rearing habitat condition
increased with distance downstream from McCloud Dam, a function of increasing
7 Qualitative observations suggest that the December 2012 flow event caused localized scour and
deposition and reduced the extent of terrestrial cover in and adjacent to the McCloud River and may have decreased overall cover ratings evaluated during 2014 in the McCloud River.
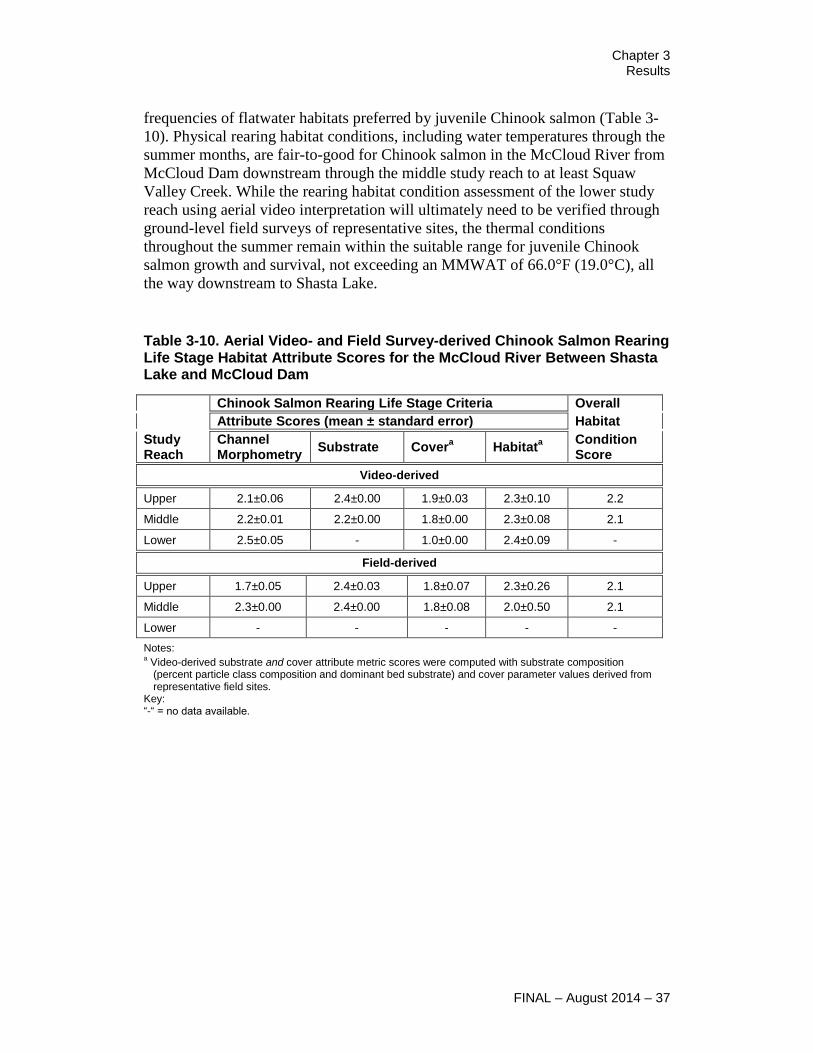
Chapter 3 Results
Chapter 3 Results
FINAL – August 2014 – 37
frequencies of flatwater habitats preferred by juvenile Chinook salmon (Table 3-
10). Physical rearing habitat conditions, including water temperatures through the
summer months, are fair-to-good for Chinook salmon in the McCloud River from
McCloud Dam downstream through the middle study reach to at least Squaw
Valley Creek. While the rearing habitat condition assessment of the lower study
reach using aerial video interpretation will ultimately need to be verified through
ground-level field surveys of representative sites, the thermal conditions
throughout the summer remain within the suitable range for juvenile Chinook
salmon growth and survival, not exceeding an MMWAT of 66.0°F (19.0°C), all
the way downstream to Shasta Lake.
Table 3-10. Aerial Video- and Field Survey-derived Chinook Salmon Rearing Life Stage Habitat Attribute Scores for the McCloud River Between Shasta Lake and McCloud Dam
Chinook Salmon Rearing Life Stage Criteria Overall
Attribute Scores (mean ± standard error) Habitat
Study Reach
Channel Morphometry
Substrate Covera
Habitata Condition
Score
Video-derived
Upper 2.1±0.06 2.4±0.00 1.9±0.03 2.3±0.10 2.2
Middle 2.2±0.01 2.2±0.00 1.8±0.00 2.3±0.08 2.1
Lower 2.5±0.05 - 1.0±0.00
2.4±0.09 -
Field-derived
Upper 1.7±0.05 2.4±0.03 1.8±0.07 2.3±0.26 2.1
Middle 2.3±0.00 2.4±0.00 1.8±0.08 2.0±0.50 2.1
Lower
- - - - -
Notes: a Video-derived substrate and cover attribute metric scores were computed with substrate composition (percent particle class composition and dominant bed substrate) and cover parameter values derived from representative field sites.
Key: “-“ = no data available.
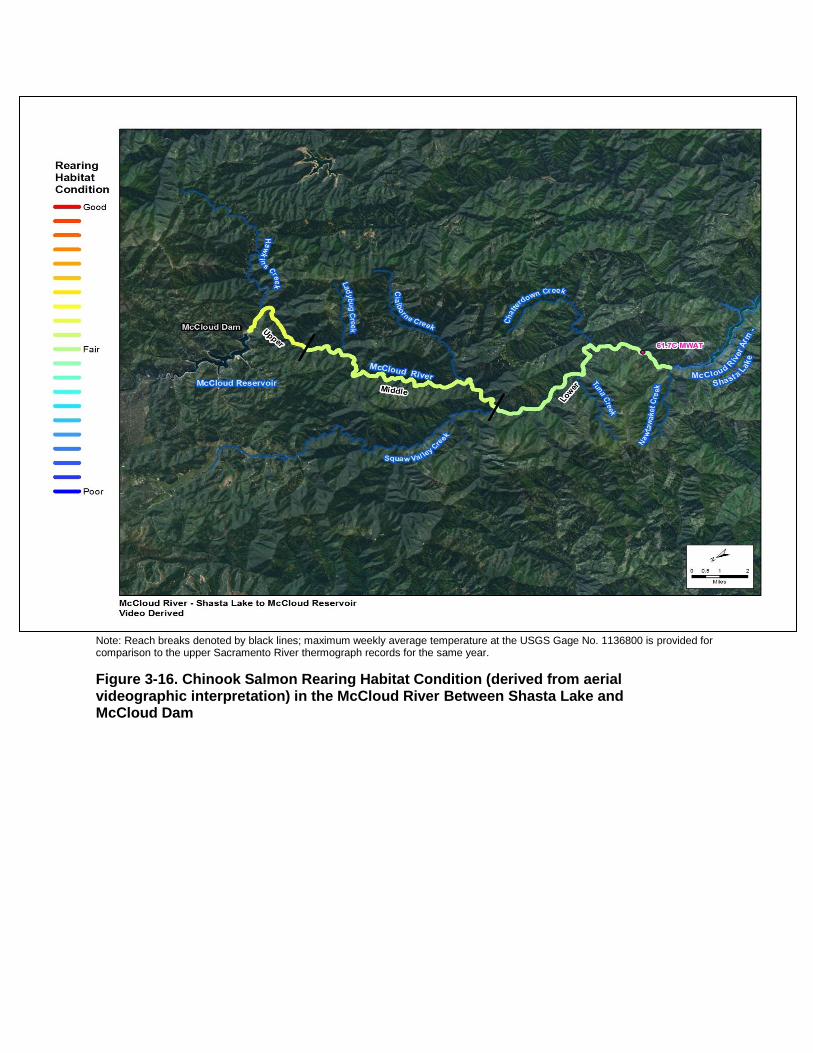
Shasta
Da
m F
ish P
assag
e E
valu
atio
n
38 –
FIN
AL –
Aug
ust 2
014
Note: Reach breaks denoted by black lines; maximum weekly average temperature at the USGS Gage No. 1136800 is provided for comparison to the upper Sacramento River thermograph records for the same year.
Figure 3-16. Chinook Salmon Rearing Habitat Condition (derived from aerial videographic interpretation) in the McCloud River Between Shasta Lake and McCloud Dam
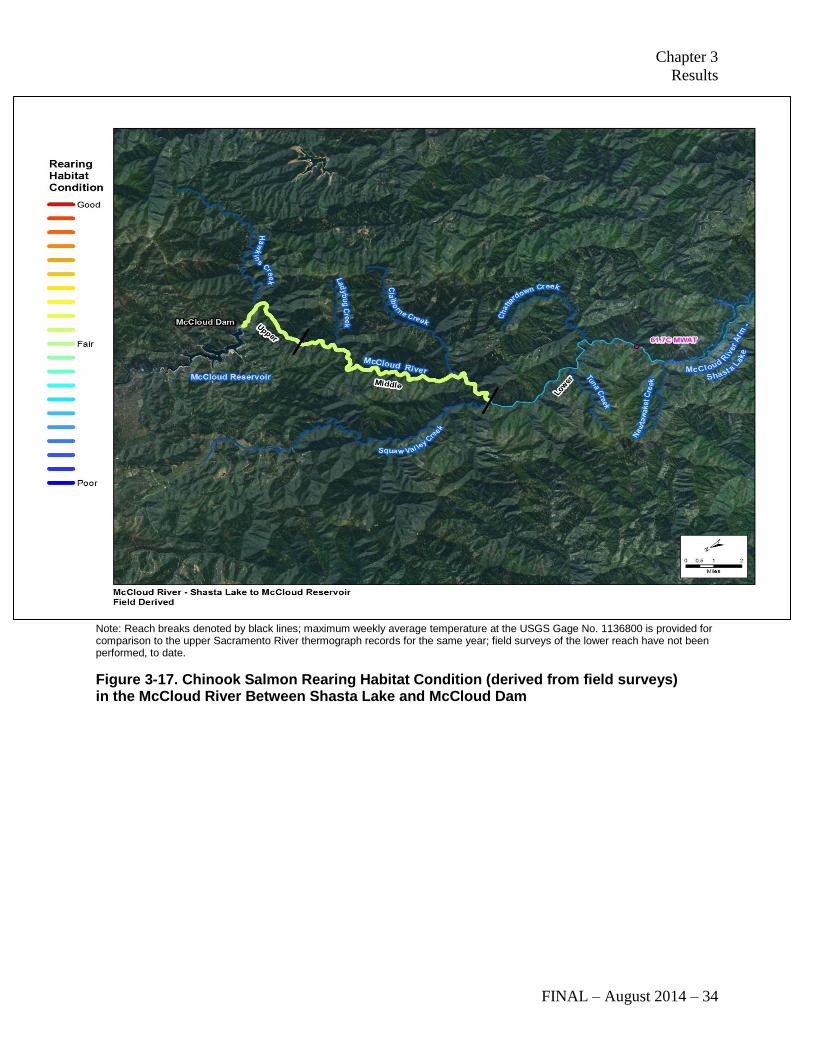
Chapter 3
Results
FINAL – August 2014 – 34
Note: Reach breaks denoted by black lines; maximum weekly average temperature at the USGS Gage No. 1136800 is provided for comparison to the upper Sacramento River thermograph records for the same year; field surveys of the lower reach have not been performed, to date.
Figure 3-17. Chinook Salmon Rearing Habitat Condition (derived from field surveys) in the McCloud River Between Shasta Lake and McCloud Dam
Shasta Dam Fish Passage Evaluation
40 – FINAL – August 2014
Spawner Capacity
Estimates of Chinook salmon spawning habitat and spawning capacity for the
McCloud River from McCloud Dam to Shasta Lake are currently reliant on use of
aerial video-derived habitat inventory, with currently incomplete verification of
representative field sites for all study reaches. Accordingly, the sources of error
and bias associated with the aerial video interpretations previously described for
the habitat inventory result in a greater level of uncertainty in these estimates for
the McCloud River than for the upper Sacramento River. The spatial distribution
of estimated spawning habitat area (Figure 3-18) and Chinook salmon spawning
capacity (numbers of females) (Figure 3-19) in the McCloud River were lowest in
the upper study reach and highest in the middle study reach (Table 3-11).8 Based
on the aerial video interpretation, 98 percent of the estimated available spawning
habitat occurs in the middle and lower study reaches, with over 60 percent
occurring in the middle study reach, from Squaw Valley Creek to Ah-Di-Nah
campground. Field survey-derived estimates of spawning habitat area and
Chinook salmon spawning capacity in the McCloud River were as much as 7
times greater than aerial video-derived estimates (Table 3-11). This discrepancy
between the two habitat estimation methods is, again, likely a function of the
combined error or bias associated with the aerial video-interpreted habitat
inventory and the limited, short field site surveyed in the middle study reach, not
being fully representative of that study reach. Additionally, due to obscuring
vegetative cover and deep shadows on the McCloud River, determination of the
extent of suitable spawning habitat, especially isolated sediment patches, from the
aerial video was limited. The particle-size distribution of the extensive sediment
deposits in isolated patches, lateral deposits and pool tails, particularly
downstream of Claiborne Creek, were difficult to fully classify for the purpose of
determining spawning habitat quality. Field observations in the middle and upper
study reaches suggest a large volume of alluvial material was introduced and
distributed during a large storm event in December 2012, which was reported to
have mobilized landslides and abundant sediment runoff in the McCloud River
and adjacent watersheds as a result of the Bagley Fire (Bachmann 2013). Total
spawner capacity was about 19 percent greater at the OHW mark stage compared
to the baseflow stage, based on the aerial video interpreted spawner estimates
(Table 3-11).
8 No estimates of spawning habitat area or spawning capacity were made for the Headwaters
reach upstream of McCloud Reservoir because no access was granted to conduct ground-level field verification surveys necessary to obtain sufficient habitat inventory data required for computations.
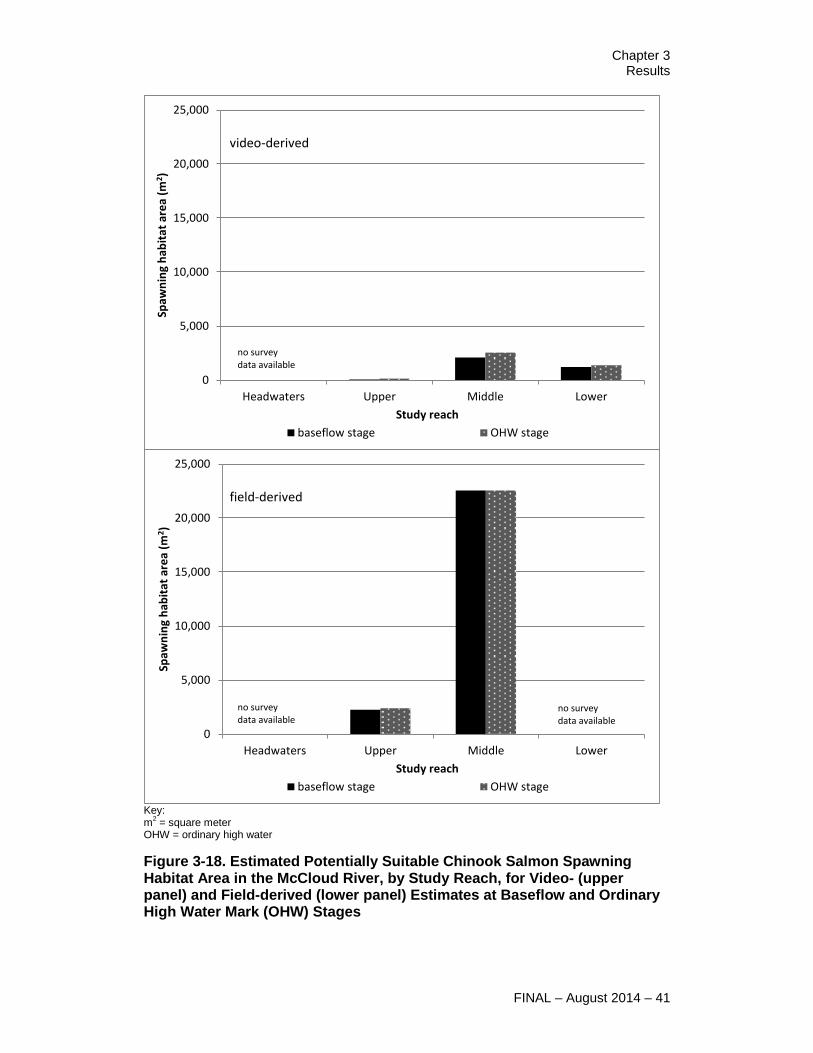
Chapter 3 Results
FINAL – August 2014 – 41
Key: m
2 = square meter
OHW = ordinary high water
Figure 3-18. Estimated Potentially Suitable Chinook Salmon Spawning Habitat Area in the McCloud River, by Study Reach, for Video- (upper panel) and Field-derived (lower panel) Estimates at Baseflow and Ordinary High Water Mark (OHW) Stages
0
5,000
10,000
15,000
20,000
25,000
Headwaters Upper Middle Lower
Spaw
nin
g h
abit
at a
rea
(m2 )
Study reach
baseflow stage OHW stage
video-derived
no survey data available
0
5,000
10,000
15,000
20,000
25,000
Headwaters Upper Middle Lower
Spaw
nin
g h
abit
at a
rea
(m2 )
Study reach
baseflow stage OHW stage
field-derived
no survey data available
no survey data available
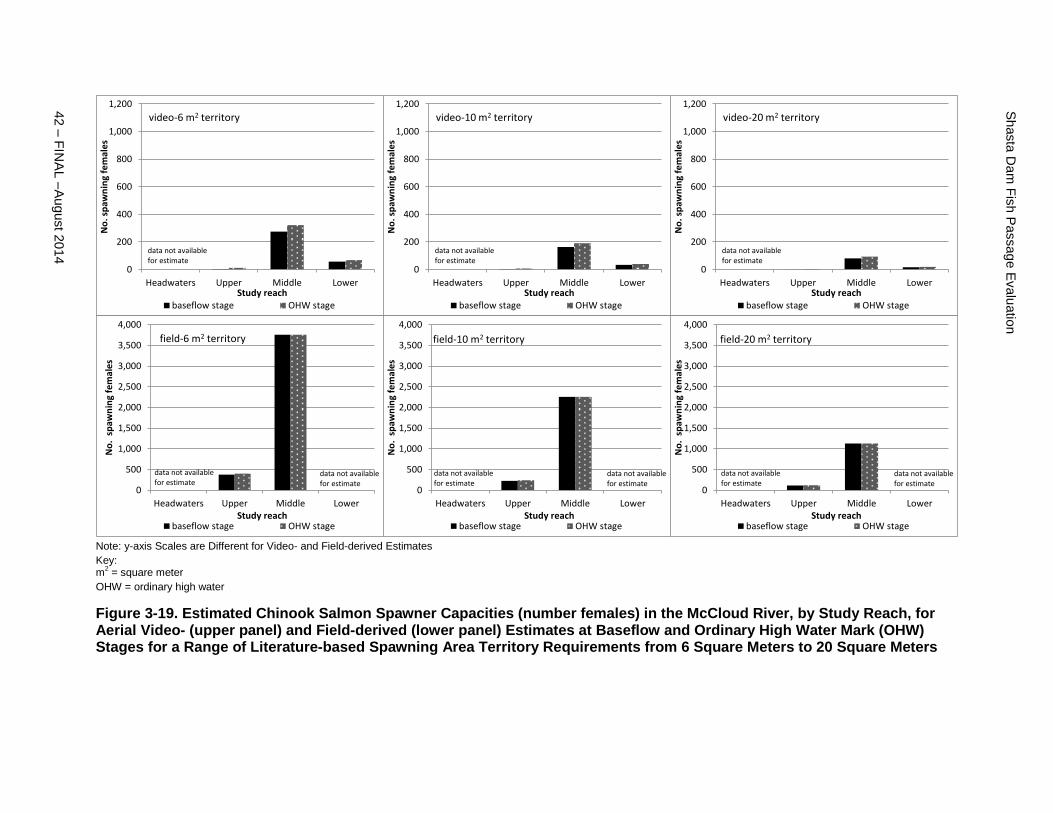
Shasta
Da
m F
ish P
assag
e E
valu
atio
n
42 –
FIN
AL –
Aug
ust 2
014
Note: y-axis Scales are Different for Video- and Field-derived Estimates
Key: m
2 = square meter
OHW = ordinary high water
Figure 3-19. Estimated Chinook Salmon Spawner Capacities (number females) in the McCloud River, by Study Reach, for Aerial Video- (upper panel) and Field-derived (lower panel) Estimates at Baseflow and Ordinary High Water Mark (OHW) Stages for a Range of Literature-based Spawning Area Territory Requirements from 6 Square Meters to 20 Square Meters
0
200
400
600
800
1,000
1,200
Headwaters Upper Middle Lower
No
. sp
awn
ing
fem
ale
s
Study reachbaseflow stage OHW stage
video-6 m2 territory
data not available for estimate
0
500
1,000
1,500
2,000
2,500
3,000
3,500
4,000
Headwaters Upper Middle Lower
No
. sp
awn
ing
fem
ale
s
Study reachbaseflow stage OHW stage
data not available for estimate
data not available for estimate
field-6 m2 territory
0
200
400
600
800
1,000
1,200
Headwaters Upper Middle Lower
No
. sp
awn
ing
fem
ale
s
Study reachbaseflow stage OHW stage
video-10 m2 territory
data not available for estimate
0
500
1,000
1,500
2,000
2,500
3,000
3,500
4,000
Headwaters Upper Middle Lower
No
. sp
awn
ing
fem
ale
s
Study reachbaseflow stage OHW stage
field-10 m2 territory
data not available for estimate
data not available for estimate
0
200
400
600
800
1,000
1,200
Headwaters Upper Middle Lower
No
. sp
awn
ing
fem
ale
s
Study reachbaseflow stage OHW stage
video-20 m2 territory
data not available for estimate
0
500
1,000
1,500
2,000
2,500
3,000
3,500
4,000
Headwaters Upper Middle Lower
No
. sp
awn
ing
fem
ale
s
Study reachbaseflow stage OHW stage
field-20 m2 territory
data not available for estimate
data not available for estimate
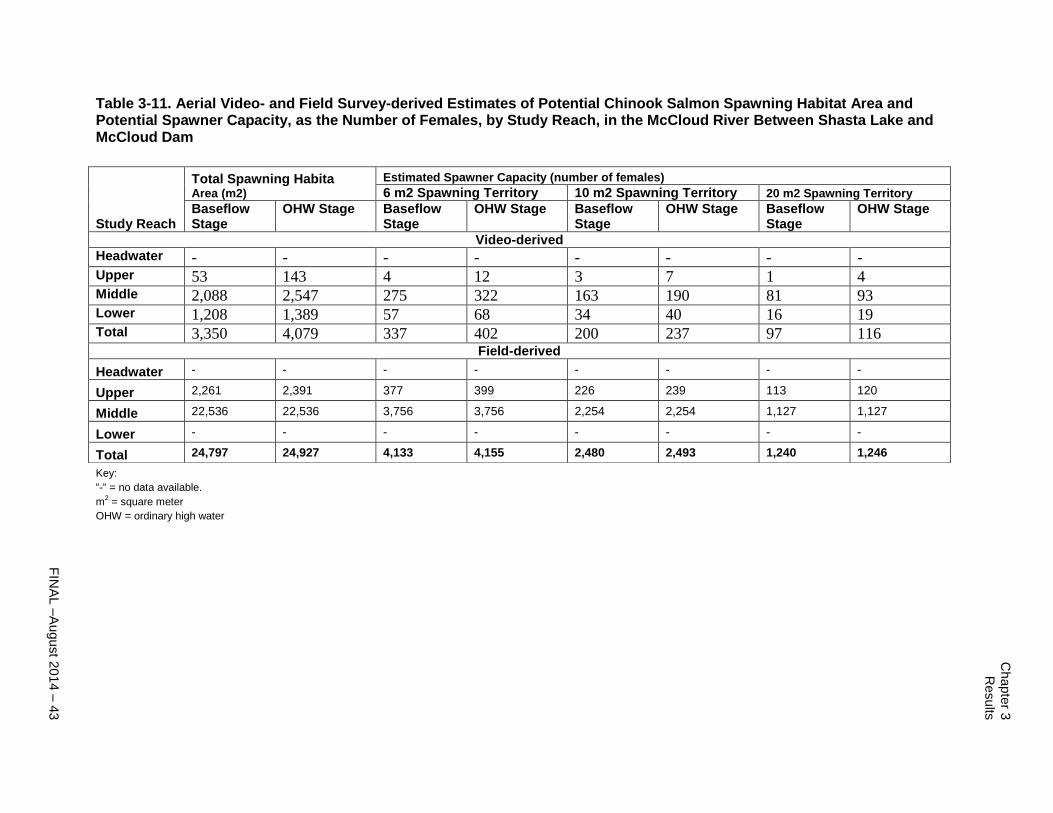
Chapte
r 3
Results
FIN
AL –
August 2
01
4 –
43
Table 3-11. Aerial Video- and Field Survey-derived Estimates of Potential Chinook Salmon Spawning Habitat Area and Potential Spawner Capacity, as the Number of Females, by Study Reach, in the McCloud River Between Shasta Lake and McCloud Dam
Study Reach
Total Spawning Habita Area (m2)
Estimated Spawner Capacity (number of females)
6 m2 Spawning Territory 10 m2 Spawning Territory 20 m2 Spawning Territory
Baseflow Stage
OHW Stage Baseflow Stage
OHW Stage Baseflow Stage
OHW Stage Baseflow Stage
OHW Stage
Video-derived
Headwater - - - - - - - - Upper 53 143 4 12 3 7 1 4 Middle 2,088 2,547 275 322 163 190 81 93 Lower 1,208 1,389 57 68 34 40 16 19 Total 3,350 4,079 337 402 200 237 97 116
Field-derived
Headwater - - - - - - - -
Upper 2,261 2,391 377 399 226 239 113 120
Middle 22,536 22,536 3,756 3,756 2,254 2,254 1,127 1,127
Lower - - - - - - - -
Total 24,797 24,927 4,133 4,155 2,480 2,493 1,240 1,246
Key:
“-“ = no data available.
m2 = square meter
OHW = ordinary high water

Chapter 4 Synthesis and Conclusions
FINAL – August 2014 – 1
Synthesis and Conclusions
This section provides a brief synthesis and discussion of current study’s findings
relative to historic and other recent information on potential Chinook salmon
spawning habitat in the Sacramento and McCloud rivers upstream of Shasta Lake.
This section also compares and discusses the relative condition of Chinook
salmon spawning and rearing habitat and spawner capacity in each of the study
rivers. Finally, this section provides a list of recommended habitat assessment-
related tasks and study elements for consideration in developing the Shasta Dam
Fish Passage Pilot Implementation Plan.
Historical Comparisons
As part of the fish-salvage investigations prior to construction of Shasta Dam,
Hanson et al. (1940) estimated the potential Chinook salmon spawning capacities
of the tributaries to the Sacramento River, including the tributaries located now
above the dam. The potential spawning capacity estimated by Hanson et al.
(1940) for the upper Sacramento River from Delta to the Cantara Loop were
higher, particularly in the Delta to Flume Creek reach, than the estimates resulting
from the current habitat assessment (Table 4-1). Several important
methodological differences are thought to account for these differences. The
timing of habitat surveys for both the Hanson et al. (1940) and the current study
were likely conducted under similar flow conditions, fall and winter baseflows,
because they reported average channel widths and field verification of spawning
area using direct observations of spawning fall-run Chinook salmon, which would
have been from October to December; therefore, it can be assumed that flow
levels and seasonal survey timing is comparable and did not account for the
differences. Two other aspects of the techniques used by Hanson et al. (1940),
though, likely account for differences in the spawner capacity estimates compared
to the current study. The spawning territory requirement used by Hanson et al.
(1940) was smaller than in the current study, 3.7 m2 versus 6 to 20 m
2,
respectively. Additionally, the historic spawner capacity estimates did not take
into account a varying redd density as a function of substrate quality as did the
method used in the current study. For example, 50 percent of the spawning habitat
area at baseflow in the Sacramento River downstream of the Cantara Loop was
considered “fair,” because the streambed in otherwise suitable spawning habitat
was dominated by cobble-sized particles, which was assigned a 0.5 spawning
density coefficient, essentially reducing the potential spawning capacity by one
half in that reach compared to not using this approach.
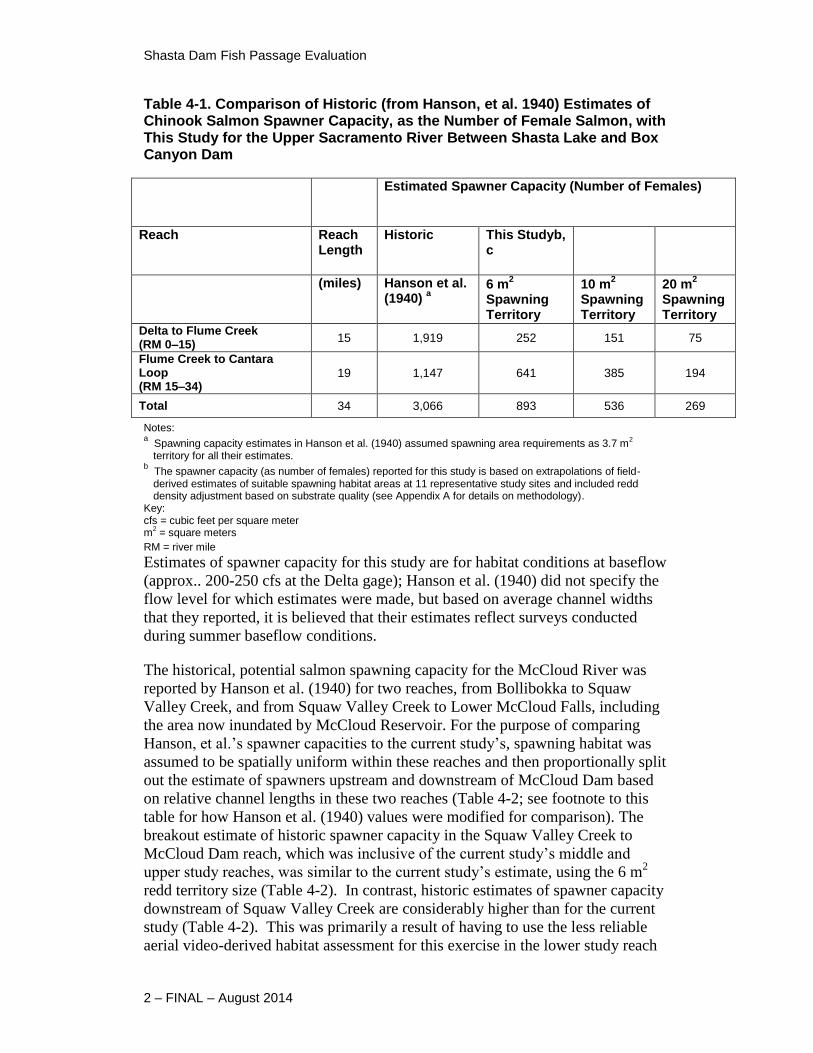
Shasta Dam Fish Passage Evaluation
2 – FINAL – August 2014
Table 4-1. Comparison of Historic (from Hanson, et al. 1940) Estimates of Chinook Salmon Spawner Capacity, as the Number of Female Salmon, with This Study for the Upper Sacramento River Between Shasta Lake and Box Canyon Dam
Estimated Spawner Capacity (Number of Females)
Reach Reach Length
Historic This Studyb, c
(miles) Hanson et al. (1940)
a
6 m2
Spawning Territory
10 m2
Spawning Territory
20 m2
Spawning Territory
Delta to Flume Creek (RM 0–15)
15 1,919 252 151 75
Flume Creek to Cantara Loop (RM 15–34)
19 1,147 641 385 194
Total 34 3,066 893 536 269
Notes: a Spawning capacity estimates in Hanson et al. (1940) assumed spawning area requirements as 3.7 m
2
territory for all their estimates. b The spawner capacity (as number of females) reported for this study is based on extrapolations of field-derived estimates of suitable spawning habitat areas at 11 representative study sites and included redd density adjustment based on substrate quality (see Appendix A for details on methodology).
Key: cfs = cubic feet per square meter m
2 = square meters
RM = river mile
Estimates of spawner capacity for this study are for habitat conditions at baseflow
(approx.. 200-250 cfs at the Delta gage); Hanson et al. (1940) did not specify the
flow level for which estimates were made, but based on average channel widths
that they reported, it is believed that their estimates reflect surveys conducted
during summer baseflow conditions.
The historical, potential salmon spawning capacity for the McCloud River was
reported by Hanson et al. (1940) for two reaches, from Bollibokka to Squaw
Valley Creek, and from Squaw Valley Creek to Lower McCloud Falls, including
the area now inundated by McCloud Reservoir. For the purpose of comparing
Hanson, et al.’s spawner capacities to the current study’s, spawning habitat was
assumed to be spatially uniform within these reaches and then proportionally split
out the estimate of spawners upstream and downstream of McCloud Dam based
on relative channel lengths in these two reaches (Table 4-2; see footnote to this
table for how Hanson et al. (1940) values were modified for comparison). The
breakout estimate of historic spawner capacity in the Squaw Valley Creek to
McCloud Dam reach, which was inclusive of the current study’s middle and
upper study reaches, was similar to the current study’s estimate, using the 6 m2
redd territory size (Table 4-2). In contrast, historic estimates of spawner capacity
downstream of Squaw Valley Creek are considerably higher than for the current
study (Table 4-2). This was primarily a result of having to use the less reliable
aerial video-derived habitat assessment for this exercise in the lower study reach
Chapter 4 Synthesis and Conclusions
FINAL – August 2014 – 3
because field surveys have not been conducted there, to date. As described in
Chapter 3 “Results,” confidence in the potential spawner capacity estimate for the
lower study reach for the current study is very low.
Although, a reliable assessment of habitat condition and spawner capacity for the
McCloud River above McCloud Reservoir could not be made with the available
aerial videography, and field surveys were not permitted due to lack of access to
private property, an estimate of the historic potential spawner capacity from the
data presented by Hanson et al. (1940) was possible and is also presented in Table
4-2 for comparison (see footnote to the table for a description of derivation of this
estimate). Due to the lack of field surveys in the lower and middle segments of the
McCloud River, a priority for further planning studies is adequate field calibration
and verification of aerial surveys to support whether the estimates in this
assessment are accurate.
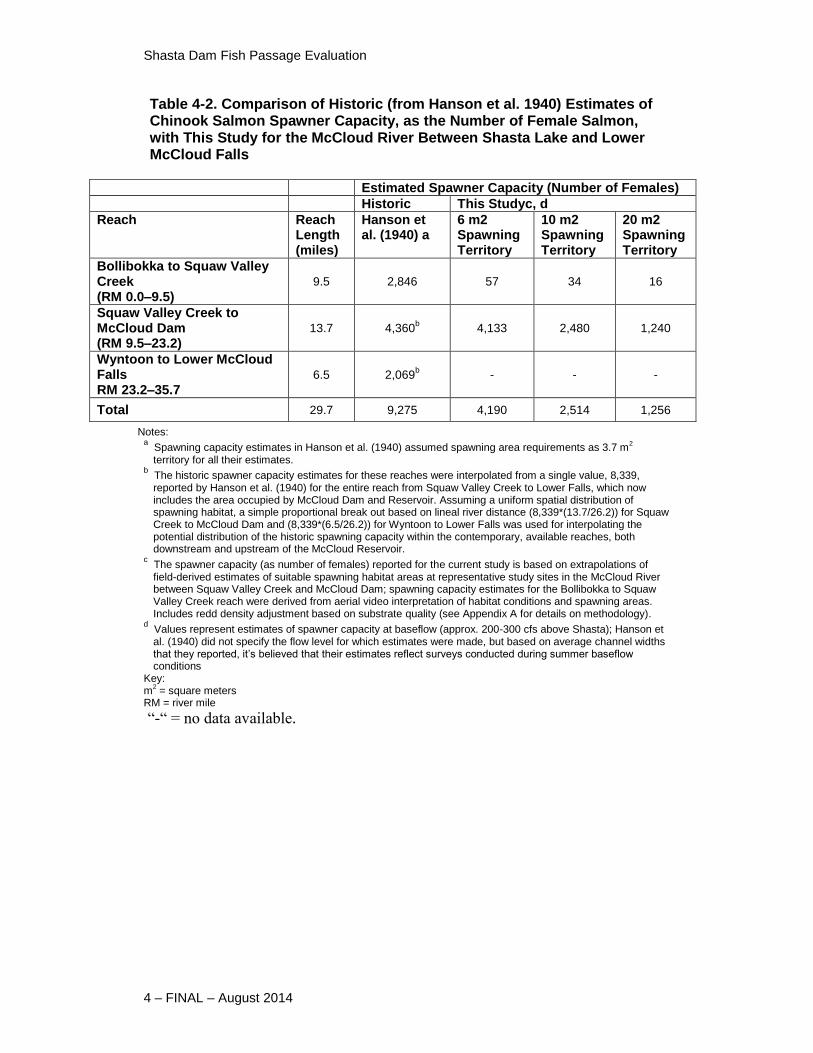
Shasta Dam Fish Passage Evaluation
4 – FINAL – August 2014
Table 4-2. Comparison of Historic (from Hanson et al. 1940) Estimates of Chinook Salmon Spawner Capacity, as the Number of Female Salmon, with This Study for the McCloud River Between Shasta Lake and Lower McCloud Falls
Estimated Spawner Capacity (Number of Females)
Historic This Studyc, d
Reach Reach Length (miles)
Hanson et al. (1940) a
6 m2 Spawning Territory
10 m2 Spawning Territory
20 m2 Spawning Territory
Bollibokka to Squaw Valley Creek (RM 0.0–9.5)
9.5 2,846 57 34 16
Squaw Valley Creek to McCloud Dam (RM 9.5–23.2)
13.7 4,360b
4,133
2,480 1,240
Wyntoon to Lower McCloud Falls RM 23.2–35.7
6.5 2,069b
- - -
Total 29.7 9,275 4,190 2,514 1,256
Notes: a Spawning capacity estimates in Hanson et al. (1940) assumed spawning area requirements as 3.7 m
2
territory for all their estimates. b The historic spawner capacity estimates for these reaches were interpolated from a single value, 8,339, reported by Hanson et al. (1940) for the entire reach from Squaw Valley Creek to Lower Falls, which now includes the area occupied by McCloud Dam and Reservoir. Assuming a uniform spatial distribution of spawning habitat, a simple proportional break out based on lineal river distance (8,339*(13.7/26.2)) for Squaw Creek to McCloud Dam and (8,339*(6.5/26.2)) for Wyntoon to Lower Falls was used for interpolating the potential distribution of the historic spawning capacity within the contemporary, available reaches, both downstream and upstream of the McCloud Reservoir.
c The spawner capacity (as number of females) reported for the current study is based on extrapolations of field-derived estimates of suitable spawning habitat areas at representative study sites in the McCloud River between Squaw Valley Creek and McCloud Dam; spawning capacity estimates for the Bollibokka to Squaw Valley Creek reach were derived from aerial video interpretation of habitat conditions and spawning areas. Includes redd density adjustment based on substrate quality (see Appendix A for details on methodology).
d Values represent estimates of spawner capacity at baseflow (approx. 200-300 cfs above Shasta); Hanson et al. (1940) did not specify the flow level for which estimates were made, but based on average channel widths that they reported, it’s believed that their estimates reflect surveys conducted during summer baseflow conditions
Key: m
2 = square meters
RM = river mile
“-“ = no data available.
Chapter 4 Synthesis and Conclusions
FINAL – August 2014 – 5
Consideration of McCloud-Pit Hydroelectric Project Relicensing Study Findings about Potential Suitable Salmon Spawning Habitat
As part of the recent PG&E’s relicensing application with FERC for the
McCloud-Pit Hydroelectric Project (FERC Project No. 2106), an investigation of
potential habitat-flow relationships for Chinook salmon and steelhead was
conducted pursuant to requests by resource agencies participating in the
relicensing proceedings. PG&E conducted three tasks including: 1) develop
literature-based habitat suitability criteria (HSC) for Chinook salmon and
steelhead for use with the Lower McCloud River one-dimensional (1-D) physical
habitat simulation (PHABSIM) models; 2) conduct additional spawning gravel
surveys to update a 1-D PHABSIM model for use with substrate criteria for
Chinook salmon and steelhead; and 3) conduct a 1-D PHABSIM analysis using
the HSC developed for Chinook salmon and steelhead life stages to evaluate the
potential flow-habitat relationships for these species in the Lower McCloud River
(PG&E 2011, 2012a,b).
To allow comparison with the current study, total spawning habitat was
extrapolated from weighted usable Chinook salmon spawning habitat areas
measured in weighted useable area (WUA) reported in PG&E’s PHABSIM
modeling study over a range of flows in the McCloud River below McCloud Dam
by multiplying the reach-specific WUA values (spawning area (square feet) per
1000 feet) by the reach lengths (in feet) (Table 4-3). These total estimated
spawning areas, in turn, were used to estimate Chinook salmon spawner capacity
for two reaches of the McCloud River, applying a range of spawning territory
requirements (Table 4-4). Estimated spawner capacities derived from PG&E’s
PHABSIM modeling study were greater than for both the historic (Hanson et al.
1940) and the current study’s estimates. However, direct comparison of the
current study’s estimates for the McCloud River with those derived from the
PG&E WUA Chinook salmon spawning habitat curves must be made with the
following cautions and caveats. Firstly, the factor that likely contributes most the
differences in these spawner estimates is that spawning substrate suitability
defined for the PG&E PHABSIM modeling was over a broader range of gravel
sizes than used by the current study. The redd density adjustment factor, varying
redd density as a function of substrate quality, used to estimate spawner capacity
for the current study (see Appendix A for details on methodology), if similarly
applied to the PG&E PHABSIM study would have had the effect of reducing the
estimated suitable habitat area extrapolated from the WUA curves by some
unknown amount. Secondly, the previously described low reliability of the aerial
video-derived habitat assessment for use in estimating spawner capacity in the
lower study reach impedes confidence for any comparisons with the PG&E
PHABSIM derived spawner capacity estimates.
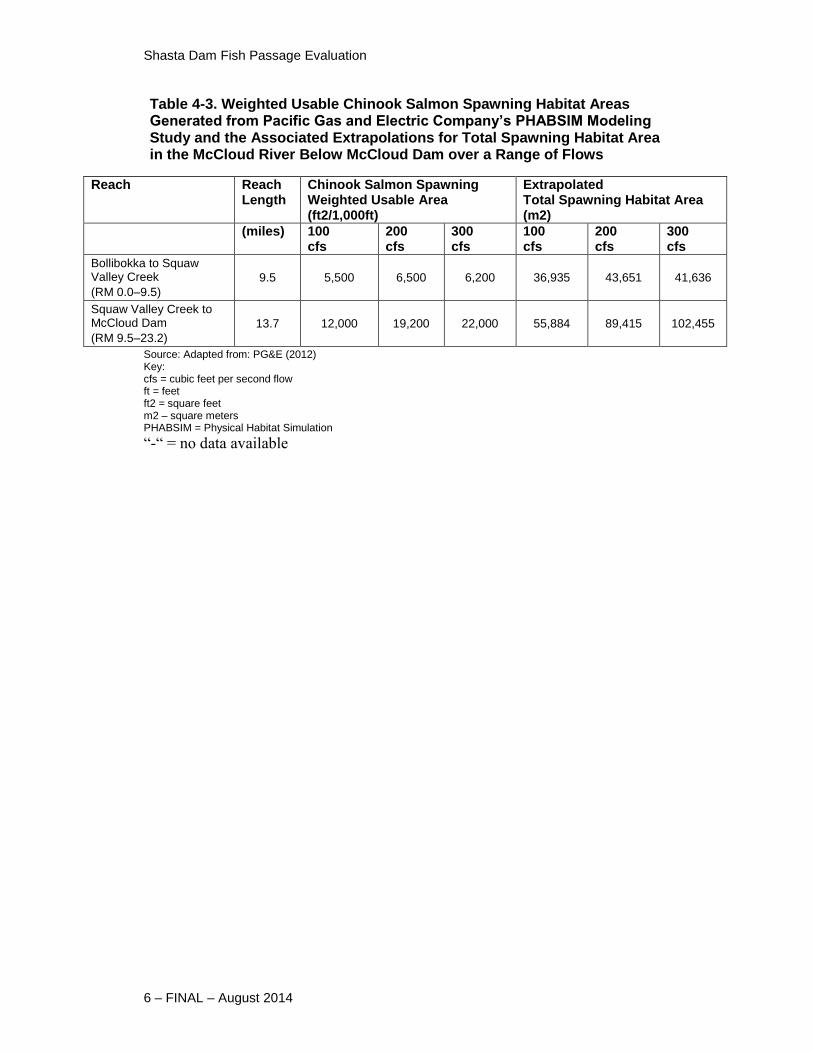
Shasta Dam Fish Passage Evaluation
6 – FINAL – August 2014
Table 4-3. Weighted Usable Chinook Salmon Spawning Habitat Areas Generated from Pacific Gas and Electric Company’s PHABSIM Modeling Study and the Associated Extrapolations for Total Spawning Habitat Area in the McCloud River Below McCloud Dam over a Range of Flows
Reach Reach Length
Chinook Salmon Spawning Weighted Usable Area (ft2/1,000ft)
Extrapolated Total Spawning Habitat Area (m2)
(miles) 100 cfs
200 cfs
300 cfs
100 cfs
200 cfs
300 cfs
Bollibokka to Squaw Valley Creek
(RM 0.0–9.5)
9.5 5,500 6,500 6,200 36,935 43,651 41,636
Squaw Valley Creek to McCloud Dam
(RM 9.5–23.2)
13.7 12,000 19,200 22,000 55,884 89,415 102,455
Source: Adapted from: PG&E (2012) Key: cfs = cubic feet per second flow ft = feet ft2 = square feet m2 – square meters PHABSIM = Physical Habitat Simulation
“-“ = no data available
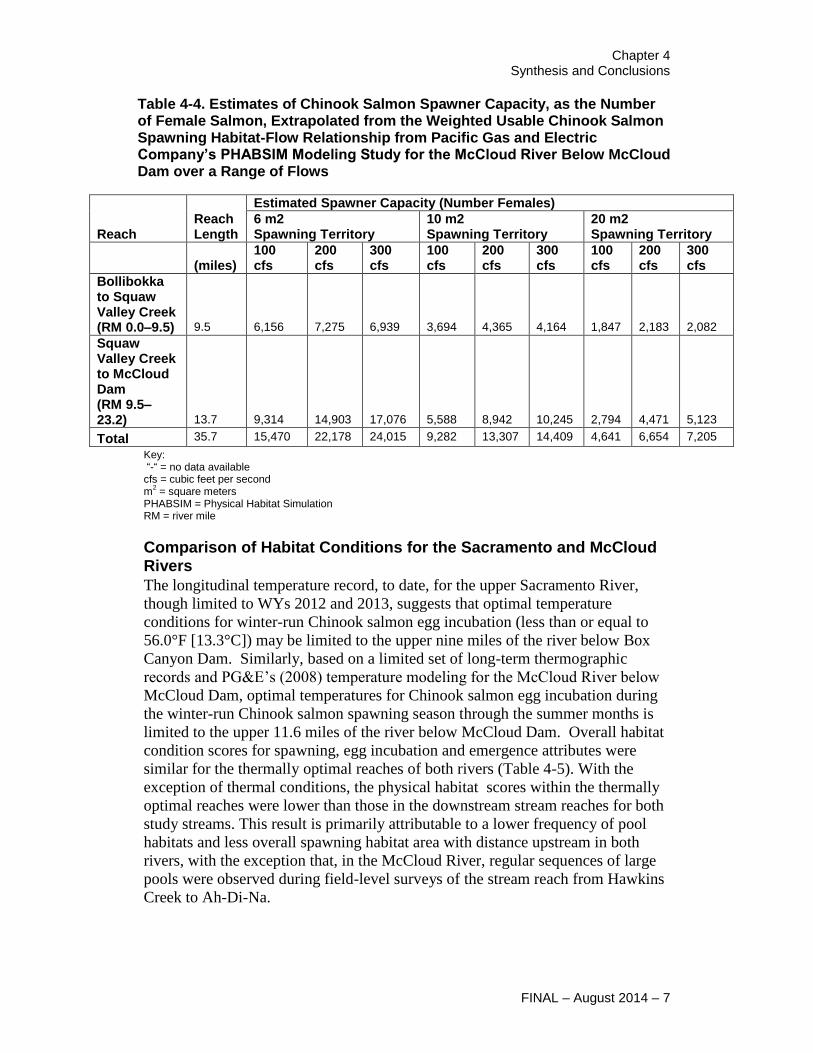
Chapter 4 Synthesis and Conclusions
FINAL – August 2014 – 7
Table 4-4. Estimates of Chinook Salmon Spawner Capacity, as the Number of Female Salmon, Extrapolated from the Weighted Usable Chinook Salmon Spawning Habitat-Flow Relationship from Pacific Gas and Electric Company’s PHABSIM Modeling Study for the McCloud River Below McCloud Dam over a Range of Flows
Reach Reach Length
Estimated Spawner Capacity (Number Females)
6 m2 Spawning Territory
10 m2 Spawning Territory
20 m2 Spawning Territory
(miles) 100 cfs
200 cfs
300 cfs
100 cfs
200 cfs
300 cfs
100 cfs
200 cfs
300 cfs
Bollibokka to Squaw Valley Creek (RM 0.0–9.5) 9.5 6,156 7,275 6,939 3,694 4,365 4,164 1,847 2,183 2,082
Squaw Valley Creek to McCloud Dam (RM 9.5–23.2) 13.7 9,314 14,903 17,076 5,588 8,942 10,245 2,794 4,471 5,123
Total 35.7 15,470 22,178 24,015 9,282 13,307 14,409 4,641 6,654 7,205
Key: “-“ = no data available cfs = cubic feet per second m
2 = square meters
PHABSIM = Physical Habitat Simulation RM = river mile
Comparison of Habitat Conditions for the Sacramento and McCloud Rivers
The longitudinal temperature record, to date, for the upper Sacramento River,
though limited to WYs 2012 and 2013, suggests that optimal temperature
conditions for winter-run Chinook salmon egg incubation (less than or equal to
56.0°F [13.3°C]) may be limited to the upper nine miles of the river below Box
Canyon Dam. Similarly, based on a limited set of long-term thermographic
records and PG&E’s (2008) temperature modeling for the McCloud River below
McCloud Dam, optimal temperatures for Chinook salmon egg incubation during
the winter-run Chinook salmon spawning season through the summer months is
limited to the upper 11.6 miles of the river below McCloud Dam. Overall habitat
condition scores for spawning, egg incubation and emergence attributes were
similar for the thermally optimal reaches of both rivers (Table 4-5). With the
exception of thermal conditions, the physical habitat scores within the thermally
optimal reaches were lower than those in the downstream stream reaches for both
study streams. This result is primarily attributable to a lower frequency of pool
habitats and less overall spawning habitat area with distance upstream in both
rivers, with the exception that, in the McCloud River, regular sequences of large
pools were observed during field-level surveys of the stream reach from Hawkins
Creek to Ah-Di-Na.
Shasta Dam Fish Passage Evaluation
8 – FINAL – August 2014
The available thermographic record indicates that thermal conditions remain
within the suitable range for juvenile Chinook salmon growth and survival
throughout the summer, not exceeding an MMWAT of 66.0°F (19.0°C), for all 23
miles of the McCloud River from McCloud Dam to Shasta Lake and for 28 miles
of the upper Sacramento River from Box Canyon Dam downstream to Gibson
Road (RM 9) (Table 4-6). Habitat condition scores for rearing habitat within the
thermally suitable reach of the upper Sacramento River were slightly greater than
for the McCloud River (Table 4-6). This comparison is affected by the limitations
on use of the aerial video-derived habitat assessment for the lower study reach of
the McCloud, which may have affected a reduced overall rearing habitat condition
score. Overall, rearing habitat conditions for juvenile Chinook salmon in both
streams is rated as fair-to-good, with some limitations due to relatively low
quantity and diversity of the cover composition.
Estimates of Chinook salmon spawning capacity within reaches of the
Sacramento and McCloud rivers with optimal temperatures for spawning and egg
incubation differed considerably despite similar lengths of each stream within
optimal temperature regimes (Table 4-7). These differences were largely
attributable to the differences in spatial distribution of the suitable physical
spawning habitat in the two rivers. The habitat assessment found nearly 80
percent of the total potential Chinook salmon spawning habitat occurred between
North Salt Creek (RM 7.2) and Dunsmuir (RM 30), although less than 10 percent
of the total potential spawning habitat in the upper Sacramento River occurred
within the reaches influenced by the large, cold spring inflows (in the Mossbrae
Reach) upstream of Dunsmuir with temperatures suitable for winter run
spawning. In contrast, a considerably larger proportion of the total potential
spawning habitat estimated for the McCloud River appears to occur within a
thermally optimal reach, particularly from Ah-Di-Na Campground (RM 19.8)
downstream to just above Squaw Valley Creek (RM 9.5). Relying on the total
potential spawning habitat estimates derived from the PG&E PHABSIM
spawning habitat WUA curves because of limitations on the estimates from the
current study, nearly 68 percent of the potential Chinook salmon spawning habitat
of the McCloud River between McCloud Dam and Shasta Lake occurs within the
thermally optimal reach.
In summary, the habitat assessment for both rivers indicated fair-to-good habitat
conditions exist to support spawning and rearing life stages of Chinook salmon.
Though the lowest reach of the upper Sacramento River may have some limitation
on thermal suitability for rearing life stages, the overall length of both rivers
within the thermally optimal range for juvenile salmon rearing is quite similar.
The most significant difference in potential habitat conditions is that the
Sacramento River has considerably less potentially suitable spawning habitat,
within thermally optimal stream reach through the summer than is potentially
available in the McCloud River. Although both rivers exhibit suitable conditions
for potential salmon spawning and rearing habitat, in comparison to the McCloud
River, the temperature regime of the upper Sacramento River would likely be a
major factor limiting the number of winter-run Chinook salmon that could be
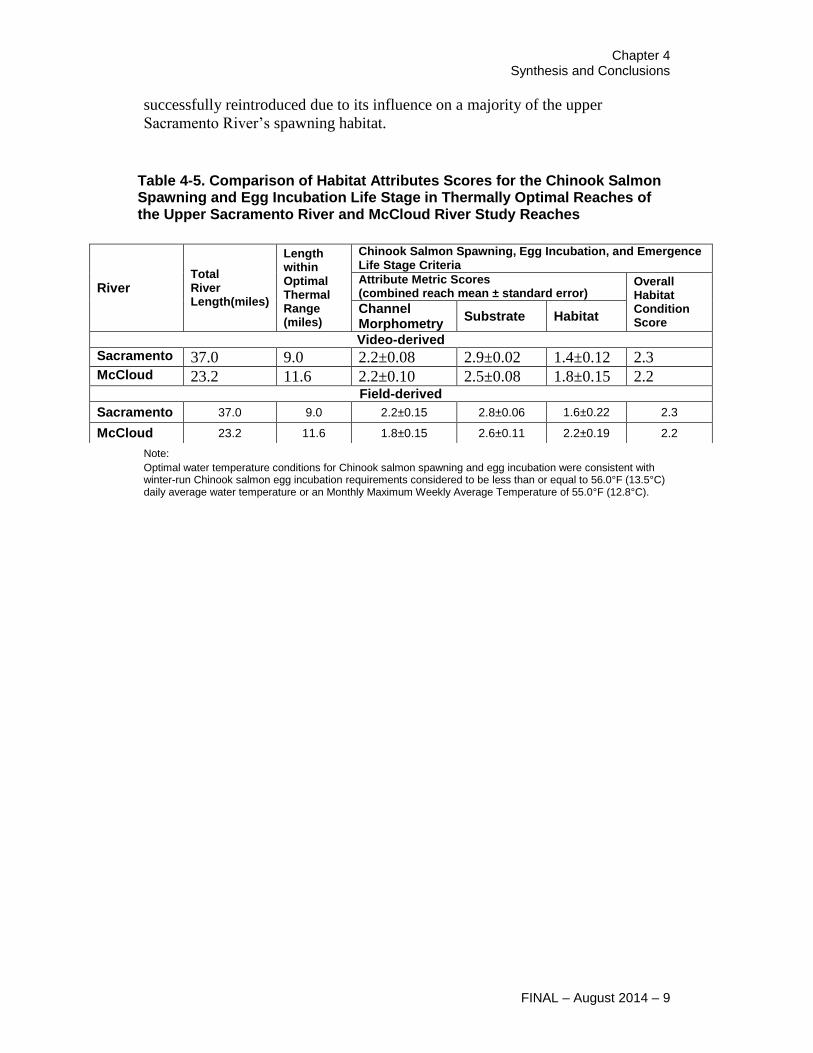
Chapter 4 Synthesis and Conclusions
FINAL – August 2014 – 9
successfully reintroduced due to its influence on a majority of the upper
Sacramento River’s spawning habitat.
Table 4-5. Comparison of Habitat Attributes Scores for the Chinook Salmon Spawning and Egg Incubation Life Stage in Thermally Optimal Reaches of the Upper Sacramento River and McCloud River Study Reaches
Note:
Optimal water temperature conditions for Chinook salmon spawning and egg incubation were consistent with winter-run Chinook salmon egg incubation requirements considered to be less than or equal to 56.0°F (13.5°C) daily average water temperature or an Monthly Maximum Weekly Average Temperature of 55.0°F (12.8°C).
River Total River Length(miles)
Length within Optimal Thermal Range (miles)
Chinook Salmon Spawning, Egg Incubation, and Emergence Life Stage Criteria
Attribute Metric Scores (combined reach mean ± standard error)
Overall Habitat Condition Score
Channel Morphometry
Substrate Habitat
Video-derived
Sacramento 37.0 9.0 2.2±0.08 2.9±0.02 1.4±0.12 2.3 McCloud 23.2 11.6 2.2±0.10 2.5±0.08 1.8±0.15 2.2
Field-derived
Sacramento 37.0 9.0 2.2±0.15 2.8±0.06 1.6±0.22 2.3
McCloud 23.2 11.6 1.8±0.15 2.6±0.11 2.2±0.19 2.2
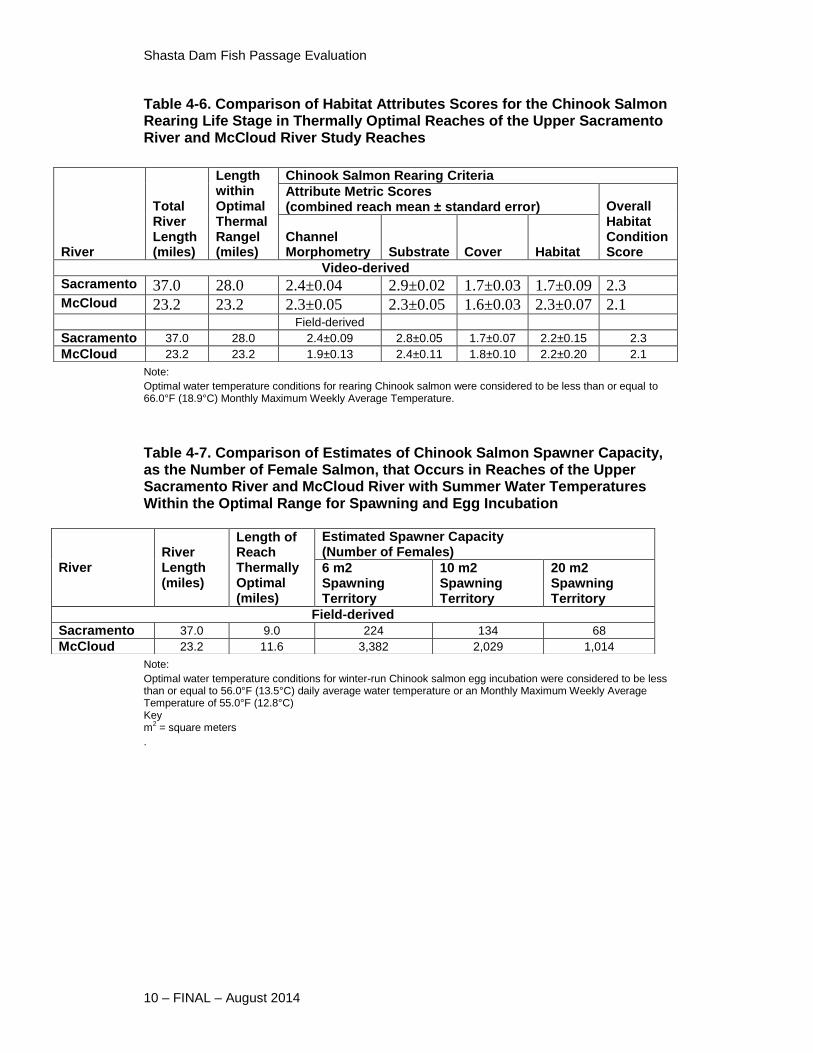
Shasta Dam Fish Passage Evaluation
10 – FINAL – August 2014
Table 4-6. Comparison of Habitat Attributes Scores for the Chinook Salmon Rearing Life Stage in Thermally Optimal Reaches of the Upper Sacramento River and McCloud River Study Reaches
Note:
Optimal water temperature conditions for rearing Chinook salmon were considered to be less than or equal to 66.0°F (18.9°C) Monthly Maximum Weekly Average Temperature.
Table 4-7. Comparison of Estimates of Chinook Salmon Spawner Capacity, as the Number of Female Salmon, that Occurs in Reaches of the Upper Sacramento River and McCloud River with Summer Water Temperatures Within the Optimal Range for Spawning and Egg Incubation
Note:
Optimal water temperature conditions for winter-run Chinook salmon egg incubation were considered to be less than or equal to 56.0°F (13.5°C) daily average water temperature or an Monthly Maximum Weekly Average Temperature of 55.0°F (12.8°C) Key m
2 = square meters
.
River
Total River Length (miles)
Length within Optimal Thermal Rangel (miles)
Chinook Salmon Rearing Criteria
Attribute Metric Scores (combined reach mean ± standard error) Overall
Habitat Condition Score
Channel Morphometry Substrate Cover Habitat
Video-derived
Sacramento 37.0 28.0 2.4±0.04 2.9±0.02 1.7±0.03 1.7±0.09 2.3 McCloud 23.2 23.2 2.3±0.05 2.3±0.05 1.6±0.03 2.3±0.07 2.1 Field-derived
Sacramento 37.0 28.0 2.4±0.09 2.8±0.05 1.7±0.07 2.2±0.15 2.3
McCloud 23.2 23.2 1.9±0.13 2.4±0.11 1.8±0.10 2.2±0.20 2.1
River River Length (miles)
Length of Reach Thermally Optimal (miles)
Estimated Spawner Capacity (Number of Females)
6 m2 Spawning Territory
10 m2 Spawning Territory
20 m2 Spawning Territory
Field-derived
Sacramento 37.0 9.0 224 134 68
McCloud 23.2 11.6 3,382 2,029 1,014
Chapter 4 Synthesis and Conclusions
FINAL – August 2014 – 11
Concluding Considerations
The following are recommended habitat assessment-related tasks and study
elements for prioritization in developing the Pilot Reintroduction Implementation
Study Plan:
Complete field surveys of the representative sites in the lower study reach
of the McCloud River on the Bollibokka Fishing Club, where permission
has been granted to the project by Westlands Water District.
Describe and integrate monitoring hypotheses, studies and metrics for
evaluating adult and juvenile salmon habitat use and preferences in the
Pilot Reintroduction Implementation Study Plan.

References
1 FINAL – August 2014
References
Bachman, S. 2013. U.S. Forest Service, Shasta-Trinity National Forest.
Presentation at the McCloud Coordinated Resource Management Plan
Technical Team Meeting.
Burke, J.L., K.K. Jones and J.M. Dambacher. 2010. HabRate: A Limiting Factors
Model for Assessing Stream Habitat Quality for Salmon and Steelhead in
the Deschutes River Basin. Information Report 2010-03, Oregon
Department of Fish and Wildlife Fish Division, Corvallis, Oregon. 64p.
California Department of Water Resources. 2014. Sacramento and San Joaquin
Valleys Water Year Classification Indices. http://cdec.water.ca.gov/cgi-
progs/iodir/WSIHIST.
Federal Energy Regulatory Commission. 2006. Environmental inspection report
for the Lake Siskiyou (Box Canyon) Power Project. 11p.
Frazier, J.W., K.B. Roby, J.A. Boberg, K. Kenfield, J.B. Reiner, D.L. Azuma, J.L.
Furnish, B.P. Staab, and S.L. Grant. 2005. Stream Condition Inventory
Technical Guide. July 2005. USDA Forest Service, Pacific Southwest
Region – Ecosystem Conservation Staff. Vallejo, California. 111p.
Garza, C. 2014. Southwest Fisheries Science Center, National Marine Fisheries
Service. May 12, 2014. Email notification to John Hannon, fisheries
biologist, U.S. Bureau of Reclamation.
Hanson, H.A., O.R. Smith, and P.R. Needham. 1940. An investigation of fish-
salvage problems in relation to Shasta Dam. Special Scientific Report No.
10. U.S. Department of the Interior, Bureau of Fisheries, Washington,
D.C. 202 p.
Marine, K.R., and J.J. Cech, Jr. 2004. Effects of water temperature on growth,
smoltification, and predator avoidance in juvenile Sacramento River
Chinook salmon. North American Journal of Fisheries Management 24:
198-210.
McCloud Coordinated Resource Management Plan. 2001. McCloud River habitat
typing report. October 2001. Study supported and funded in part by the
McCloud CRMP (Bollibokka Land Co, California Department of Fish and
Game, California Trout, Crane Mills, Hearst Corporation, McCloud Fly
Fishing Club, PG&E, Sierra Pacific Industries, U.S. Forest Service, and
The Nature Conservancy) Redding, California. 25p.
Shasta Dam Fish Passage Evaluation
2 FINAL – August 2014
McCullough, D.A. 1999. A Review and Synthesis of Effects of Alterations to the
Water Temperature Regime on Freshwater Life Stages of Salmnoids, with
Special Reference to Chinook Salmon. Prepared for the Environmental
Protection Agency, Region 10. EPA 910-R-99-010. Columbia Inter-
Tribal Fish Commission, Portland, Oregon. 279 p.
Moyle, P.B. 2002. Inland Fishes of California. University of California Press,
Berkeley, California. 291 p.
National Marine Fisheries Service. 2009. Public Draft Recovery Plan for
Evolutionarily Significant Units of Sacramento River Winter-Run
Chinook Salmon and Central Falley Spring-Run Chinook Salmon and the
Distinct Population Segment of Central Valley Steelhead. October 2009.
Southwest Regional Office, Protected Resources Division, Sacramento,
California. 273p.
NMFS. See National Marine Fisheries Service.
North State Resources, Inc. 2010. Upper Sacramento River watershed
assessment and management strategy. Redding, California. June 2010.
421p.
Pacific Gas and Electric Company. 2008. Water Temperature Monitoring
Program Report for 2007. May 15, 2008. Technical Memorandum (TM-
28), McCloud-Pit Project, FERC No. 2106. Pacific Gas and Electric, San
Francisco, California. 312p.
______. 2009. Lower McCloud River Water Temperature Modeling. July 10,
2009. Technical Memorandum (TM-38), McCloud-Pit Project, FERC No.
2106. Pacific Gas and Electric, San Francisco, California. 57p.
______. 2011. Lower McCloud River Habitat Suitability Criteria Development
for Chinook Salmon. November 8, 2011. Technical Memorandum (TM-
79), McCloud-Pit Project, FERC No. 2106. Pacific Gas and Electric, San
Francisco, California. 40p.
______. 2012a. Lower McCloud River Salmon and Steelhead Spawning Gravel
Mapping. January 10, 2012. Technical Memorandum (TM-80), McCloud-
Pit Project, FERC No. 2106. Pacific Gas and Electric, San Francisco,
California. 52p.
______. 2012b. Lower McCloud River Chinook Salmon and Steelhead
PHABSIM Analysis. January 23, 2012. Technical Memorandum (TM-81),
McCloud-Pit Project, FERC No. 2106. Pacific Gas and Electric, San
Francisco, California. 12p.
PG&E. See Pacific Gas and Electric Company.
References
3 FINAL – August 2014
Powers, P.D. and J.F. Orsborn. 1985. An Investigation of the Physical and
Biological Conditions Affecting Fish Passage Success at Culverts and
Waterfalls. August 1985. Prepared for the Bonneville Power
Administration by the Albrook Hydraulics Laboratory, Department of
Civil and Environmental Engineering, Washington State University.
Pullman, Washington. 127p.
Rode, M. 1989. Administrative draft – California wild trout management
program, McCloud River wild trout area management plan: California
Department of Fish and Wildlife, Inland Fisheries.
Rode, M. and M. Dean. 2004. Lower McCloud River wild trout area fishery
management plan 2004 through 2009. Redding: California Department of
Fish and Wildlife, Northern California – North Coast Region.
Sullivan, K., D.J. Martin, R.D. Cardwell, J.E. Toll, and S. Duke. 2000. An
Analysis of the Effects of Temperature on Salmonids of the Pacific
Northwest with Implications for Selecting Temperature Criteria.
Sustainable Ecosystems Institute, Portland, Oregon.
The Nature Conservancy. Unpublished data. McCloud River water temperature
data for water years 1997 to 2010. Provided by Dr. Ada Fowler, McCloud
River Preserve, McCloud, CA.
Thomas R. Payne and Associates. 1992. Habitat Mapping of the Upper
Sacramento River. Prepared for the California Department of Fish and
Game, Cantara Program by Thomas R. Payne and Associates, Arcata,
California. 42p.
U.S. Bureau of Reclamation. Unpublished data. Sacramento River water
temperature data for water year 2012. Provided by John Hannon, Bay-
Delta Office, Sacramento, CA.
U.S. Fish and Wildlife Service. 1999. Effect of Temperature on Early-Life
Survival of Sacramento River Fall- and Winter-Run Chinook Salmon.
Final Report. January 1999. U.S. Fish and Wildlife Service, Northern
Central Valley Fish and Wildlife Office, Red Bluff, California. 41p.
U.S. Geological Survey (USGS). 2013. National Water Information System: web
data query interface accessed August, 2013. Available:
<http://waterdata.usgs.gov/nwis/uv>.
Vogel, D.A., and K.R. Marine. 1991. Guide to Upper Sacramento River Chinook
Salmon Life History. July 1991. Prepared for the U.S. Bureau of
Reclamation, Mid-Pacific Region, Sacramento, California. Prepared by
CH2M Hill, Redding, California. 55 pages, plus two appendices.