Embed Size (px)
Citation preview
OR I G I N A L A R T I C L E
Habitat use, but not gene flow, is influenced by humanactivities in two ecotypes of Egyptian fruit bat (Rousettusaegyptiacus)
A. Centeno-Cuadros1,2* | P. Hulva3,4* | D. Romportl5 | S. Santoro2,6 | T. St�r�ıbn�a3 |
D. Shohami1 | A. Evin7 | A. Tsoar1 | P. Benda3,8 | I. Hor�a�cek3 | R. Nathan1
1Movement Ecology Laboratory,
Department of Ecology, Evolution and
Behavior, Alexander Silberman Institute of
Life Sciences, Hebrew University of
Jerusalem, Jerusalem, Israel
2Department of Molecular Biology and
Biochemical Engineering, University Pablo
de Olavide, Sevilla, Spain
3Department of Zoology, Charles
University, Prague, Czech Republic
4Department of Biology and Ecology,
University of Ostrava, Ostrava, Czech
Republic
5Department of Physical Geography and
Geoecology, Charles University in Prague,
Prague, Czech Republic
6Department of Ethology and Biodiversity
Conservation, Estaci�on Biol�ogica de Do~nana
(CSIC), Seville, Spain
7Institut des Sciences de l’Evolution,Universit�e de Montpellier, Montpellier,
France
8Department of Zoology, National Museum
(Natural History), Prague, Czech Republic
Correspondence
A. Centeno-Cuadros, Movement Ecology
Laboratory, Department of Ecology,
Evolution and Behavior, Alexander Silberman
Institute of Life Sciences, Hebrew University
of Jerusalem, Jerusalem, Israel.
Email: [email protected]
Present address
A. Tsoar, Nature and Parks Authority, Beer
Sheva, Israel.
Funding information
Lady Davis Fellowship Trust, Hebrew
University of Jerusalem; Charles University
of Prague, Grant/Award Number: SVV 260
3; Universidad Pablo de Olavide; Israel
Science Foundation, Grant/Award Number:
Abstract
Understanding the ecological, behavioural and evolutionary response of organisms
to changing environments is of primary importance in a human-altered world. It is
crucial to elucidate how human activities alter gene flow and what are the conse-
quences for the genetic structure of a species. We studied two lineages of the
Egyptian fruit bat (Rousettus aegyptiacus) throughout the contact zone between
mesic and arid Ecozones in the Middle East to evaluate the species’ response to the
growing proportion of human-altered habitats in the desert. We integrated popula-
tion genetics, morphometrics and movement ecology to analyse population struc-
ture, morphological variation and habitat use from GPS- or radio-tagged individuals
from both desert and Mediterranean areas. We classified the spatial distribution and
environmental stratification by describing physical–geographical conditions and land
cover. We analysed this information to estimate patch occupancy and used an isola-
tion-by-resistance approach to model gene flow patterns. Our results suggest that
lineages from desert and Mediterranean habitats, despite their admixture, are iso-
lated by environment and by adaptation supporting their classification as ecotypes.
We found a positive effect of human-altered habitats on patch occupancy and habi-
tat use of fruit bats by increasing the availability of roosting and foraging areas.
While this commensalism promotes the distribution of fruit bats throughout the
Middle East, gene flow between colonies has not been altered by human activities.
This discrepancy between habitat use and gene flow patterns may, therefore, be
explained by the breeding system of the species and modifications of natal dispersal
patterns.
K E YWORD S
circuit theory, isolation by adaptation, isolation by environment, isolation by resistance,
landscape genetics, Pteropodidae
*These authors contributed equally to this work.
Received: 18 May 2016 | Accepted: 5 September 2017
DOI: 10.1111/mec.14365
6224 | © 2017 John Wiley & Sons Ltd wileyonlinelibrary.com/journal/mec Molecular Ecology. 2017;26:6224–6237.
ISF-FIRST 1316/05, ISF 1259/09; Grant
Agency of the Academy of Sciences of the
Czech Republic, Grant/Award Number: IAA
601110905; Adelina and Massimo Della
Pergolla Chair of Life Sciences; Minerva
Center for Movement Ecology; President of
Israel Doctoral Award
1 | INTRODUCTION
Humans are responsible for the major modification of natural
ecosystems ever documented since the beginning of the Holocene
(Pimm et al., 2014; Rosenzweig, 1995; Thomas et al., 2004) to such
extent that the term Anthropocene had been proposed to character-
ize this period (Ruddiman, Ellis, Kaplan, & Fuller, 2015). While many
of the native species are negatively impacted because of land-use
transformation or its consequences (Vitousek, 1997), others might
be favoured because of their association with human-altered habi-
tats (synanthropic or commensal species) or because they dominate
the exploitation of resources over nonsynanthropic species (e.g.,
invasive species) (Grimm et al., 2008). Therefore, species exposed to
new habitat conditions offer unique opportunities to understand the
mechanisms of adaptation and gene flow of local species that gener-
ally occur within a few generations (contemporary evolution; Stock-
well, Hendry, & Kinnison, 2003).
The study of adaptive evolution can be approached by combining
genetic differentiation and matrix permeability (isolation by resis-
tance, IBR) (McRae, 2006; McRae & Beier, 2007; McRae, Dickson,
Keitt, & Shah, 2008), phenotypic traits (isolation by adaptation, IBA)
(DeWoody, Trewin, & Taylor, 2015; Orsini, Vanoverbeke, Swillen,
Mergeay, & De Meester, 2013) and/or environmental conditions
(isolation by environment, IBE) (Wang & Bradburd, 2014). In highly
mobile animals, behavioural factors and migration between lineages
rather than selection are presumably the main factors modifying pat-
terns at microgeographic scale (Richardson, Urban, Bolnick, & Skelly,
2014). In this sense, gene flow is a double-edged sword for local
adaptations: it counteracts the effects of isolation and divergence
caused by habitat fragmentation but also increases genetic variation
within populations and facilitates their evolutionary potential (Lenor-
mand, 2002; Stockwell et al., 2003). Theoretical approaches studying
the role of gene flow in the evolution of population structure are
based on dispersal neighbourhood, a geographic area where dispersal
of most individuals in a population occurs (Wright, 1969). The analy-
sis of landscape heterogeneity in combination with these theoretical
models has greatly contributed to predict genetic differentiation and
gene flow (landscape genetics) (Manel, Schwartz, Luikart, & Taberlet,
2003; Storfer et al., 2007).
Fruit bats of the genus Rousettus (Pteropodidae, Chiroptera) are
excellent flyers with extraordinary navigational skills (Tsoar et al.,
2011) and echolocation capacity (exceptional in Old World fruit bats).
The echolocation enables them to inhabit caves and disperse indepen-
dently of evergreen forests (Juste et al., 1999). As a consequence,
Rousettus is the most widespread fruit bat genus and R. aegyptiacus is
the only species of its family inhabiting both Asia and Africa including
desert and Mediterranean types of climate (Benda, Vallo, Hulva, &
Hor�a�cek, 2012; Harrison & Bates, 1991). The Egyptian fruit bat
Rousettus aegyptiacus (Geoffroy, 1810) has the northernmost part of
its distribution range in the Middle East and the Eastern Mediter-
ranean. The species shows a phylogeographic structure in this area
(Hulva et al., 2012) including distinct lineages associated with
Mediterranean and desert Ecozones (Figure 1). The first lineage
(Levantine) is distributed mainly in the coastal areas of the Eastern
Mediterranean region. The second (Arabian) is distributed particularly
in the coastal areas of the Arabian Peninsula with probably disjunctive
range offshoot in the Sinai Peninsula and the region of the Dead Sea.
Both lineages differ in body size, with the Levantine individuals being
larger than the Arabians (Benda et al., 2012). These two lineages co-
occur at the transition zone between the coastal Mediterranean zone
and the Negev and Judean Deserts. This relatively steep transition
zone, occurring due to increasing distance southwards from the
Mediterranean Sea and a rain shadow effect of the Judean Hills, repre-
sents a useful model area for studying ecological differentiation. Con-
sidering the barrier effect of deserts on dispersal and the observed
contribution of native agriculture and ornamental plants such as the
common fig (Ficus carica), date palm (Phoenix dactylifera) or carob tree
(Ceratonia siliqua) in the diet of northern populations of the Egyptian
fruit bat (Korine, Izhaki, & Arad, 1999; Lu�can et al., 2016; del Vaglio,
Nicolau, Bosso, & Russo, 2011), we hypothesize that areas devoted to
horticulture and associated with human settlements will play an impor-
tant role in the dispersal of the species.
The Middle East is a melting pot for the admixture of the Afrotrop-
ical, Oriental and Palearctic faunas. It is characterized by the occur-
rence of desert areas acting as barriers for most temperate taxa that
limit the colonization of Eurasia from palaeotropical species. This is
especially critical for groups with relatively limited dispersal capacities
such as terrestrial mammals (Yom-Tov & Tchernov, 1988). Due to the
extreme abiotic conditions of deserts, transition zones between arid
and humid habitats represent a suitable region to the study of ecologi-
cal adaptations. Species adapted to desert areas often inhabit small
and isolated patches of suitable and distant habitats surrounded by
the hostile matrix frequently imposed by the desert. Theoretical mod-
els estimate the degree of genetic differentiation to be inversely corre-
lated to species movement capacities and this has been demonstrated
in sympatric species with different degree of association to human
activities (e.g., Varudkar & Ramakrishnan, 2015). Therefore, vagile and
human-commensal species inhabiting desert areas will vary in their
genetic differentiation depending on the amount and spatial distribu-
tion of suitable (i.e., human-altered) habitats.
CENTENO-CUADROS ET AL. | 6225
Archaeological records of humans in the Middle East extend back
to the Lower Palaeolithic, although the first signs of a switch from
nomadism to a more sedentary, village-based life date from the Neo-
lithic (Bernbeck & Pollock, 2005). Early signs of sedentary lifestyle in
the southern Levant date back to around 13,000–10,000 years ago
(Belfer-Cohen & Bar-Yosef, 2000) and ever since, human activities
have intensively modified natural landscapes in both mesic and arid
parts of the regions, creating a mosaic of natural and human-modi-
fied habitats with a strong influence on the colonization routes of
palaeotropical fauna towards northern latitudes (Fischer & Linden-
mayer, 2007; Western, 2001). Human settlements scattered
throughout desert areas are artificial oases, and they may provide
anthropogenic stepping stone dispersal routes. This is true ever since
ancient times due to the adapted lifestyles of ancient tribes in desert
areas (Berkes, Colding, & Folke, 2000). For example, the Nabateans
(probably the most important Arab tribe controlling trade routes
across desert areas between 4th B.P. to A.D. 1st centuries) had
advanced agricultural skills based on a system of cisterns of runoff
water likely used to grow date palms (among others) (Evenari,
Shanan, & Tadmor, 1982). These patches of anthropogenic origin are
particularly relevant for flying animals as they can effectively use these
stepping stones to overcome landscape barriers and to link otherwise-
isolated populations in Afrotropical and Palaearctic regions. Local
habitat modifications due to human activities may, therefore, change
the balance between selection and gene flow and increase the loss of
adaptive genetic structure, driving taxa to the so-called speciation
reversal (Seehausen, Takimoto, Roy, & Jokela, 2008).
The aim of this study was to test the association between envi-
ronmental zones (IBE), land use (IBR) and phenotypic variation (IBA)
with the genetic structure of the Middle Eastern subpopulations of
the Egyptian fruit bat. We obtained detailed individual movements
and genetic and geographic data and analysed them using models
based on circuit theory representatively covering the transition area
between genetically differentiated populations inhabiting Mediter-
ranean (Levant) and desert (southern Israel, Jordan and Sinai) types
of environments. The following objectives were targeted (i) to
describe levels of genetic diversity and the current genetic structure
of Mediterranean and desert populations using novel detailed sam-
pling in the transition zone, microsatellite markers and circuit theory
approach; (ii) to explore the link between genetic structure and habi-
tat resistance (IBR) and environmental conditions (IBE); (iii) to explore
the link between genetic and phenotypic variation (IBA); (iv) to
assess the level and distribution of admixture in the contact zone
between them; and (v) to evaluate the relative role of human-altered
habitats on habitat use and gene flow patterns. We hypothesize that
(i) the observed patterns of both lineages within the transition zone
are driven by IBR and IBA and respond to environmental conditions
(IBE) and that (ii) introduced plant species located in gardens and
orchards included by the fruit bat in its diet are influencing gene
flow patterns in desert areas. We predict that landscape resistance
models wherein human-altered habitats facilitate gene flow will
increase the significance and correlation between genetic and
landscape distances.
2 | MATERIALS AND METHODS
2.1 | Sample collection
We used a previous set of 56 genotypes from Jordan (n = 52) and
Egypt (Sinai) (n = 4) (Hulva et al., 2012) and genotyped 167 addi-
tional individuals from Egypt (Sinai) (n = 15) and Israel (n = 152) col-
lected in 25 localities between 2005 and 2011, covering the whole
transition area described between the Levantine and Arabian popula-
tions in Hulva et al. (2012) (Figure 1). These localities were scattered
throughout the rainfall gradient from north to south in the studied
area, ranging from 800 to 25 mm/year, respectively. All individuals
were live-trapped at roosts (caves or abandoned buildings) or feed-
ing sites using mist nets. Forearm length and body mass of the spec-
imen were recorded. Samples for DNA extraction were obtained by
wing punch or buccal swabs and stored at �20°C until processing in
laboratory.
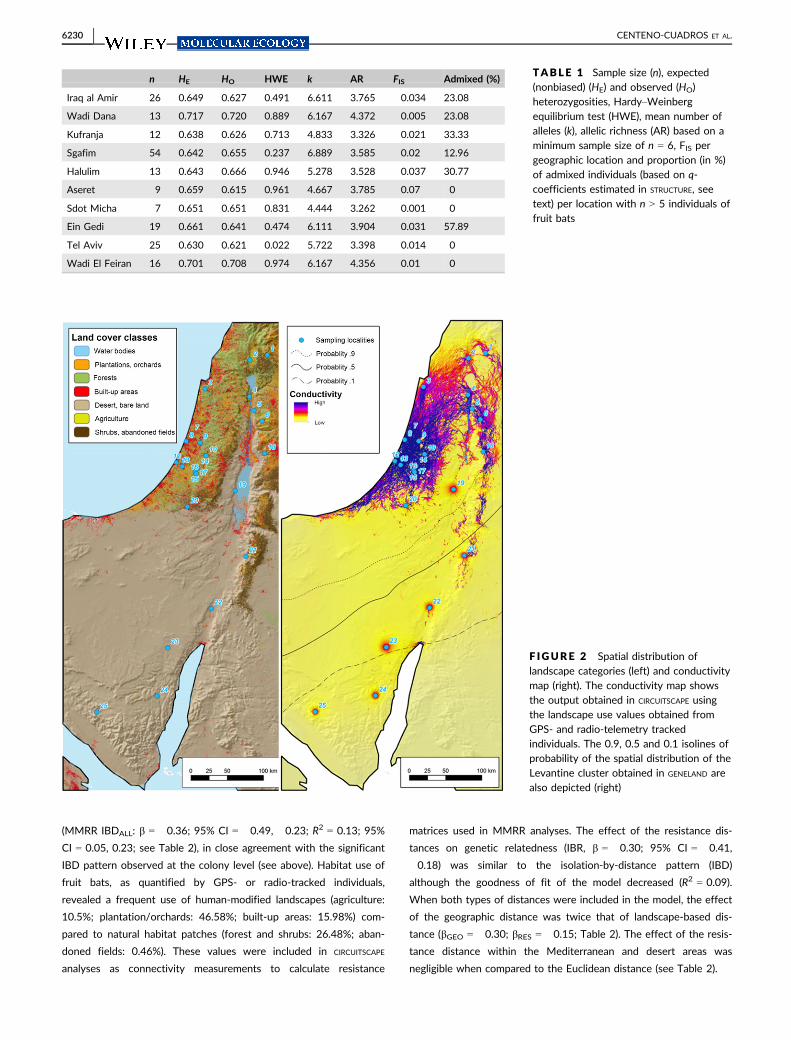
F IGURE 1 Map of study area based on physical–geographicalstratification using k-means cluster analysis showing five distinctenvironmental zones (colour codes in lower right panel). Upper leftscheme shows Middle Eastern range of Egyptian fruit bat (modifiedfrom Kwiecinski and Griffiths (1999), Benda et al. (2012) and www.iucnredlist.org). Colours denote subpopulations according to
STRUCTURE analysis in Hulva et al. (2012). Pie charts mark samplelocations and show the proportion of individuals assigned toMediterranean (purple) or desert (red) clusters based on q-coefficients obtained from STRUCTURE analysis (K = 2) in this study.Bar plots on the right edge displays individual populationmemberships based on STRUCTURE results
6226 | CENTENO-CUADROS ET AL.
2.2 | DNA extraction and genotyping
Genomic DNA was isolated using the Genomic DNA Mini Kit (Gen-
eaid) and DNA Blood and Tissue kit (Qiagen). Genotypes were com-
posed by combination of 18 microsatellites (M3-1, M3-6, M3-8, M3-
120 and M3-121 by Hua et al. (2006) and 66HDZ 80, 105, 106,
110, 117, 304, 327, 334, 340, 341, 343, 407 and 413 by Andri-
anaivoarivelo et al. (2008)) using protocols in Hulva et al. (2012). We
ran negative controls in all sets of DNA extractions and PCRs to
monitor contamination with foreign DNA. Allele sizes were obtained
after binning microsatellite raw data by considering discrete breaks
using AUTOBIN (Guichoux, Lagache, Wagner, & Et, 2011).
2.3 | Genetic diversity and structure
We first tested for the presence of null alleles in all of the 18
microsatellites using the EM algorithm (Dempster, Laird, & Rubin,
1977) implemented in the software FREENA (Chapuis & Estoup, 2007).
We ran analyses of genetic diversity and population genetic struc-
ture only for those sample sites with more than five individuals
(n = 9). Deviations from Hardy–Weinberg equilibrium (HWE) across
pairs of loci and within each population were estimated using Mar-
kov chain Monte Carlo simulations and default values in GENEPOP’007
(Rousset, 2008). Observed (HO) and expected (HE) heterozygosities
and mean number of alleles per locus were estimated over all loci in
GENETIX 4.05.2 (Belkhir, Borsa, Chikhi, Raufaste, & Bonhomme, 2004)
whereas allelic richness (a measure of the number of alleles cor-
rected by the minimum sample size [n = 7]) was calculated using the
rarefaction procedure implemented in FSTAT v.2.9.3.2 (Goudet, 1995).
We also estimated the frequency of private alleles (defined as the
frequency of alleles per loci that occurred in a single population) in
GENALEX v.6.501 (Peakall & Smouse, 2012). Further comparison of the
frequency of private alleles with genetic structure indexes con-
tributes to a better understanding of the level of isolation of popula-
tions. Accordingly, we first estimated differentiation indexes (FST)
and their associated p-values between geographic locations using
GENETIX 4.05.2 (Belkhir et al., 2004). Global FST and 95% confidence
intervals were obtained using FSTAT v.2.9.3.2 (Goudet, 1995). We
evaluated the effects of gene flow on genetic structure by compar-
ing pairwise linearized genetic distances between sampling sites
[FST/(1 � FST)] with geographic distances in logarithmic scales. To
this aim, we ran a Mantel test (Mantel, 1967) and obtained p-values
based on 999 permutations using the function mantel available in
the VEGAN package (Oksanen et al., 2013) for R (R Core Team 2013).
We combined genetic data with geographic location in GENELAND
(Guillot, Mortier, & Estoup, 2005) to consider spatial population
structure. The implemented model selects the group(s) of individuals
that maximize within-group Hardy–Weinberg and linkage equilibrium.
First five runs with 106 MCMC (Markov chain Monte Carlo) itera-
tions were used to determine the most suitable number of clusters
with the following settings: thinning of 100, K values from 1 to 10,
uncorrelated allele frequency model, noise blurring of coordinates of
5 km. Finally, a model with 107 iterations, burn-in of 104 and K = 2
(derived from initial screening) was run. We used individual-based
Bayesian clustering method in STRUCTURE 2.3.2 (Falush, Stephens, &
Pritchard, 2007) to estimate the number of genetically differentiated
groups (K) of individuals and to identify admixed individuals and/or
migrants between groups. The best K was determined in STRUCTURE
HARVESTER (Earl & von Holdt, 2011) based on the highest ΔK, the sec-
ond-order rate of change of log probability of the data between suc-
cessive values of K (Evanno, Regnaut, & Goudet, 2005). We ran 10
replicates for each K, ranging from K = 1 to K = 10, discarding the
first 100,000 steps (burn-in period) and collecting data each 100
steps (thinning) from the following 1,000,000 MCMC. Admixture
model was applied. For the selected K, we averaged the estimated
individual membership coefficients (q) per replicate using CLUMPP
v.1.1.2 (Jakobsson & Rosenberg, 2007) and results were graphically
displayed in DISTRUCT (Rosenberg, 2003). We also used coancestry
indexes per individual obtained in STRUCTURE to quantify the propor-
tion of admixed individuals in each geographic location. We catego-
rized individuals as “pure north” or “pure south” if their q coefficient
assigned to the north (Mediterranean) or south (desert) clusters was
higher than 0.75 (respectively), a reasonable proportion in evolution-
ary/demographic history terms (one grandparent was a migrant)
(Falush et al., 2007). Admixed individuals were, therefore, defined
when their q value ranged between 0.25 and 0.75.
We also used the genetic landscape-shape analysis implemented
in ALLELES IN SPACE (Miller, 2005) to identify landscape regions and the
spatial location of their borders by considering pairwise distribution
of genetic distances. A Delaunay triangulation network among sam-
pling locations was first constructed and assigned the average resid-
ual interindividual genetic distance to each connection line. We then
used the inverse distance weighted interpolation procedure to inter-
polate surface heights within a Cartesian grid covering the study
area. These estimates were then used to build a three-dimensional
surface plot where the X and Y axes draw the spatial layout of the
study area and surface plot heights (Z-axis) corresponded to genetic
distances.
2.4 | Morphometric variation and isolation byadaptation
We evaluated the association between genetics and phenotypic
traits related with body size (IBA). Variation in phenotypic measure-
ments (n = 72) (i.e., logarithm of forearm length), weight (logarithm
of the cube root of the weight) and the ratio of both (body mass) of
genotyped adult specimens was analysed. We tested the existence
of without a priori groups using model-based clustering analyses
(Fraley, Raftery, Murphy, & Scrucca, 2012). Differences between
genetic clusters, determined by the highest membership coefficient
(i.e., including the admixed individuals), were assessed using Wil-
coxon rank tests and visualized using boxplots. The strength of phe-
notypic differences between the genetic clusters was assessed by
the percentage of specimens correctly assigned to its genetic cluster
by a leave-one-out cross-validated linear discriminant analysis fol-
lowing (Evin et al., 2013). To exclude sexual dimorphism as a bias of
CENTENO-CUADROS ET AL. | 6227
differences between genetic groups, significance of the interaction
term of two-way ANOVAs was evaluated.
2.5 | Environmental variation and isolation byenvironment
The whole study area was classified based on a physical–geographi-
cal variables to explore and characterize the essential gradients of
climate (annual mean temperature and precipitation) (Hijmans,
Cameron, Parra, Jones, & Jarvis, 2005) and terrain (altitude and verti-
cal heterogeneity) (Jarvis, Reuter, Nelson, & Guevara, 2008) (data
sources: WorldClim v 1.4 and SRTM v4, NASA, respectively). All
variables were expressed within grids of regular sizes (1 9 1 km).
Then, we ran k-means cluster analysis (Jain, 2010) to classify the
environmental regions (Figure 1).
To describe human modifications of the landscape in the region,
we used remotely sensed data (LANDSAT ETM, USGS, 2015) and
classified land cover in precise resolution (pixel size 30 m). Desert
and bare areas and mosaic of plantation, orchards, shrubs and for-
ests are dominant land cover classes according to the database fol-
lowed by built-up areas, agricultural lands and water bodies. These
categories were used to build landscape resistance map according to
cost values based on patch occupancy of fruit bats (see below). All
spatial data preparation and analysis were performed in ARCGIS 10.5
and PYTHON 2.7 software.
We tested for IBE by evaluating the correlation of Levantine
(Mediterranean) and Arabian populations (see Figure 1) with the
genetic relatedness of individuals between colonies while controlling
for geographic Euclidean distance. To evaluate different hypotheses
about the extent of genetic relatedness between the 25 study sites,
we first built by random selection 100 data sets consisting of a sin-
gle individual per each sampled site. Second, for each of the 100
simulated data sets, we estimated the genetic relatedness among the
25 sites using the function COANCESTRY from the RELATED package
(Pew, Muir, Wang, & Frasier, 2014) in R. We selected Wang’s esti-
mator (Wang, 2002) because it showed the highest correlation coef-
ficient (r = .854) between observed and expected relatedness values
after simulating genotypes of known relatedness. This sequential
approach generated 100 matrices of pairwise genetic relatedness
values that were used to test IBE, IBD and IBR. For IBE, these 100
matrices of pairwise genetic relatedness values were used in a Partial
Mantel Test using the partial.mantel function available in the VEGAN
package (Oksanen et al., 2013) in R. The R-code for the whole
sequential procedure is available as a supplementary material
(Appendix S1). The significance of this test was estimated based on
999 permutations.
2.6 | Combining genetics, movement ecology andgeography: testing isolation by resistance
The application of circuit theory to landscape genetics considers
multiple potential gene flow pathways instead of a single and
optimal pathway, that is, extension of isolation by distance (IBD)
(Wright, 1943) to isolation by resistance (IBR, McRae, 2006;
McRae & Beier, 2007; McRae et al., 2008). This approach has
greatly contributed to the evaluation of the influence of human-
altered habitats on population genetic structure and interpopula-
tion dispersal of species (e.g., Ortego, Aguirre, Noguerales, & Cor-
dero, 2015). As habitat heterogeneity was ultimately related to
the spatial distribution of human settlements across the study
area, we evaluated the effect of geographic distance and habitat
use on genetic relatedness among individuals throughout the
whole transition area and within the Mediterranean and desert
clusters separately. We first built distance matrices as either geo-
graphic (Euclidean distance, null model, IBD) or as landscape-modi-
fied distance (IBR). Cost values for the IBR models were based on
detailed movement data of 43 GPS- or radio-telemetry tagged
Egyptian fruit bats (Tsoar, Shohami, & Nathan, 2010; Tsoar et al.,
2011) captured at Sgafim cave in central Israel (31.683N, 34.910E)
and tracked for 1–7 days. The 219 trees visited by these bats
were mapped and identified. We used the detailed, high-resolution
GIS layer of land cover created in this study to assign a specific
land-use value to each visited tree and calculate the frequency of
occurrence of different land uses selected by the bats. We
assumed that bats from Sgafim cave, a typical Mediterranean fruit
bat colony, sufficiently represent habitat preferences of foraging
bats in the Mediterranean region. In desert areas, we assigned fre-
quency values to land uses that were absent from the Mediter-
ranean region based on our knowledge of Egyptian fruit bat
foraging behaviour (e.g., palm tree plantations are the desert
equivalent of fruit tree orchards in the Mediterranean region).
The landscape/resistance matrices were obtained applying circuit
theory models implemented in CIRCUITSCAPE 4.0 (McRae, 2006) consid-
ering the eight-neighbour cell connection scheme (pixel size: 300 m)
onto the spatially heterogeneous landscape characterized above.
Patch occupancy of GPS- or radio-telemetry tagged bats was used
to generate a telemetry-based landscape resistance matrix based on
the high-resolution land cover GIS layer created for the whole study
area (see above). We then characterized habitat conductance (i.e.,
patch occupancy) and obtained one matrix of pairwise landscape-
modified distances between colonies. We also created a matrix of
pairwise resistances within a homogenous (“flat”) landscape by con-
sidering a raster layer where all cell resistance values were equal. As
recommended by several authors (e.g., Jha & Kremen, 2013; Lee-
Yaw, Davidson, McRae, & Green, 2009; Munshi-South, 2012), we
used this matrix as controlling variable to rule out the effect of geo-
graphic distances when testing the relationship between the matrix
of resistances and that of genetic relatedness (IBR). The matrix of
pairwise landscape-modified distances was then used as explanatory
variable of genetic relatedness using the sequential procedure
explained above. The 100 matrices of pairwise genetic relatedness
values were regressed one-by-one against the telemetry-based land-
scape distance (IBR) using the multiple matrix regression with ran-
domization (MMRR) approach implemented in the MMRR function
(Wang, 2013). The coefficient of determination (R2) and the slope
associated with the explanatory variable (b) was used to evaluate
6228 | CENTENO-CUADROS ET AL.
the relationship between the populations’ genetic relatedness and
telemetry-based distances. The same procedure was also applied
when the matrix of Euclidean distances between colonies was used
as explanatory variable (IBD). For each case (IBD and IBR), we
obtained 100 values of R2 and b (one for each simulated matrix of
genetic relatedness) that we expressed as single 95% confidence
interval (95% CI) estimates of these quantities by calculating the
medians and the 2.5% and 97.5% quantiles. Our sequential proce-
dure averts any potential issue in statistical analyses with pseudo-
replication due to sampling bias of individuals from the same colony.
We repeated this procedure using the whole study area and within
each genetic cluster (those inferred in STRUCTURE) separately. The R-
code for the whole sequential procedure and MMRR analyses is
available in the Appendix S1. Resistance and Euclidean distance
matrices were scaled (mean = 0, SD = 1) so their effects (b) and the
relative contribution of habitat heterogeneity on gene flow patterns
could be compared.
3 | RESULTS
3.1 | Genetic diversity and structure
We obtained genotypes of 223 individuals from Israel, Jordan and
Egypt, 77% (n = 172) typed at 18 microsatellites and 51 samples
failed in, at least, one marker (mean number of failed markers � SD:
0.538 � 1.268). All loci were highly variable (mean number of alleles
per locus: 10.224 � 2.633, range: 3–15; allelic richness per locus
based on n = 6: 4.238 � 1.299, range: 2.027–6.237) and were used
to describe each geographic location used for population genetic
analyses (Table 1). Our analyses rejected a significant effect of null
alleles at any of the 18 microsatellites used in our study (frequency
of null alleles per locus: 0.012 � 0.016, range: 0–0.059), therefore
we kept the whole set of markers for further analyses. Significant
deviations of HWE across loci were only found in Tel Aviv
(p = .016) (Table 1). On the other hand, FIS values revealed a signifi-
cant excess of heterozygotes in Halulim (FIS = �0.037, 95% CI:
�0.167, �0.021; all other 95% CI included zero values). The whole
population of R. aegyptiacus in the transition area remained at HWE
(all populations, p = .939). The number of private alleles varied
between loci (2.3 � 1.534; range: 1–7) and populations
(2.338 � 1.878; range: 1–7) (Table S1). More interestingly, 11 of 18
microsatellites showed private alleles in Wadi El Feiran (Sinai) in low
frequency (8.5 � 7.7%; range: 0–22.2%), a pattern that was followed
by Ein Gedi (n = 8 loci with private alleles), Iraq Al Amir and Kufranja
(n = 5) (Table S1).
Despite the relative abundance of private alleles throughout dif-
ferent populations, there was a weak but significant genetic struc-
ture overall the transition area (overall FST = 0.023, 95%CI: 0.018–
0.029). Using pairwise genetic distances, we found the maximum
value between Tel Aviv and Wadi El Feiran (FST = 0.078, p < .001).
Moreover, ca. 23% of the genetic structure between populations
with more than five individuals was explained by Euclidean distance
between them (Mantel test, r = .4793, p = .067).
The analysis of the output of STRUCTURE using Evanno’s method
highlighted K = 2 based on the highest DK (DK2 = 92.0446;
DK3 = 5.0949; DK4 = 6.7663) and defined two clusters in our data
set (Figure 1). The spatial distribution of these two clusters was
obtained in GENELAND (Figure 2) and individual coancestries (q-coeffi-
cients) are shown in Figure 1. The genetic landscape-shape analysis
revealed substantial differences of population structure within
Mediterranean/desert type of environment (Figure 3) and showed
higher isolation among particular colonies in the desert. According to
the q-coefficients obtained, we allocated most of the admixed indi-
viduals throughout the Jordan Rift Valley (Table 1, Figure 1). Thus,
Ein Gedi showed the highest proportion of admixed individuals
(58%, 11 of 19) followed by Kufranja (33%). Halulim, located in the
southern Judean lowlands within the sharp Mediterranean-desert
ecotone, came in third with 31% admixed individuals. Individual
coancestries were not explained by sex (admixed males: seven of 35
[20%]; admixed females: 20 of 83 females [24%]).
3.2 | Morphometric analysis
A total of 72 specimens was analysed biometrically among which 52
specimens had both measurements (weight information was not
recorded for several individuals and the weight data on the pregnant
females were excluded, respectively). No groups were detected by the
clustering approach for neither of the variables. However, clear pheno-
typic differences exist between the two genetic clusters. Specimens
belonging to the Mediterranean cluster have larger forearm length
(W = 353, p = .002), weigh more (W = 69.5, p < .001) and their ratio
of both was also higher (W = 74, p < .001) (Figure 4). While males
always show larger measurements than females (Figure S1), the sexual
dimorphism appeared homogeneous between the two genetic clusters
(two-way ANOVA, all p > .5). A total of 61.2% of the specimens can
be identified to the correct genetic cluster based on their forearm
length (confidence interval CI = 57–66%), 88.3% (CI = 88–90%) when
the body mass is used, and 91.9% (CI = 90–92%) when the ratio of
body mass and forearm length is analysed.
3.3 | Landscape genetics
The physical–geographical stratification using k-means cluster analy-
sis led to identification of five distinct environmental zones within
the focus area (Figure 1) ranging from humid Mediterranean to arid
and mountainous environments. We observed a marginally signifi-
cant correlation between genetic relatedness and the environmental
zone while controlling for Euclidean distance (Partial Mantel test,
r = �.151; 95% CI = �0.263, 0.01). Significant correlation between
genetic relatedness and Euclidean distance correcting by the envi-
ronmental zone (Partial Mantel test, r = �.184; 95% CI = �0.303,
�0.093) shows the effect of dispersal distance on genetic related-
ness between individuals and reinforces the IBD found at the colony
level (Mantel test, r = .4793; p = .067; see above).
We found throughout the whole study area a significant
decrease of related individuals as Euclidean distance increased
CENTENO-CUADROS ET AL. | 6229
(MMRR IBDALL: b = �0.36; 95% CI = �0.49, �0.23; R2 = 0.13; 95%
CI = 0.05, 0.23; see Table 2), in close agreement with the significant
IBD pattern observed at the colony level (see above). Habitat use of
fruit bats, as quantified by GPS- or radio-tracked individuals,
revealed a frequent use of human-modified landscapes (agriculture:
10.5%; plantation/orchards: 46.58%; built-up areas: 15.98%) com-
pared to natural habitat patches (forest and shrubs: 26.48%; aban-
doned fields: 0.46%). These values were included in CIRCUITSCAPE
analyses as connectivity measurements to calculate resistance
matrices used in MMRR analyses. The effect of the resistance dis-
tances on genetic relatedness (IBR, b = �0.30; 95% CI = �0.41,
�0.18) was similar to the isolation-by-distance pattern (IBD)
although the goodness of fit of the model decreased (R2 = 0.09).
When both types of distances were included in the model, the effect
of the geographic distance was twice that of landscape-based dis-
tance (bGEO = �0.30; bRES = �0.15; Table 2). The effect of the resis-
tance distance within the Mediterranean and desert areas was
negligible when compared to the Euclidean distance (see Table 2).
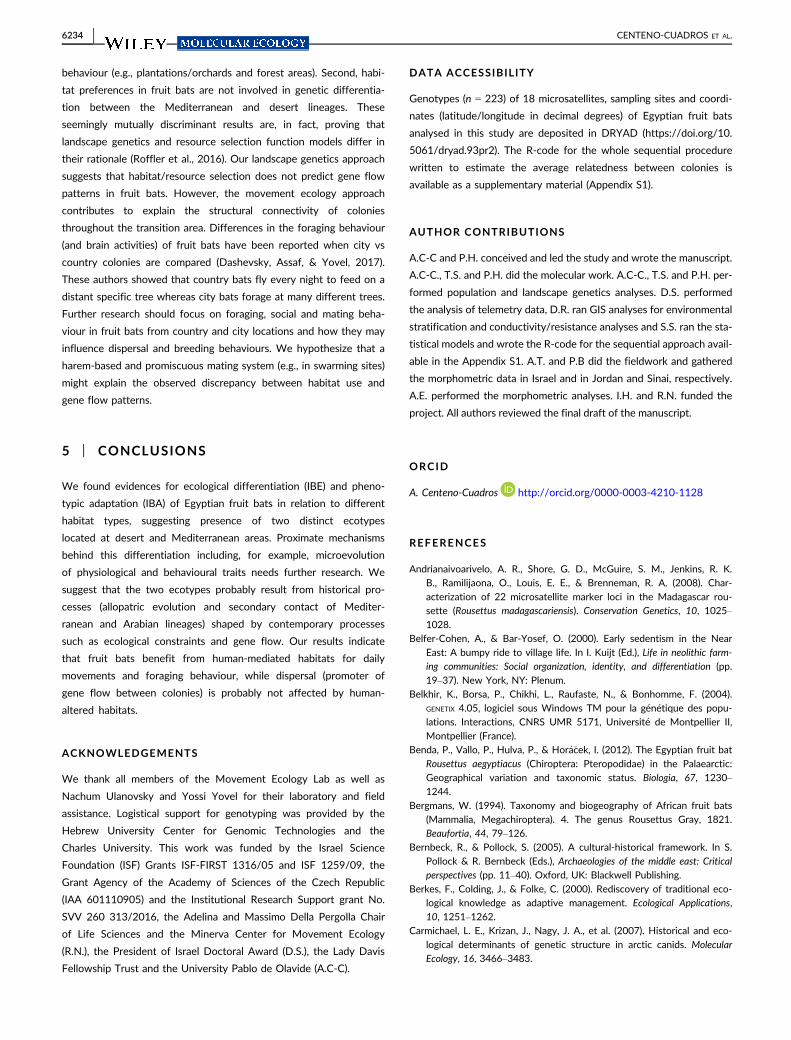
n HE HO HWE k AR FIS Admixed (%)
Iraq al Amir 26 0.649 0.627 0.491 6.611 3.765 0.034 23.08
Wadi Dana 13 0.717 0.720 0.889 6.167 4.372 �0.005 23.08
Kufranja 12 0.638 0.626 0.713 4.833 3.326 0.021 33.33
Sgafim 54 0.642 0.655 0.237 6.889 3.585 �0.02 12.96
Halulim 13 0.643 0.666 0.946 5.278 3.528 �0.037 30.77
Aseret 9 0.659 0.615 0.961 4.667 3.785 0.07 0
Sdot Micha 7 0.651 0.651 0.831 4.444 3.262 0.001 0
Ein Gedi 19 0.661 0.641 0.474 6.111 3.904 0.031 57.89
Tel Aviv 25 0.630 0.621 0.022 5.722 3.398 0.014 0
Wadi El Feiran 16 0.701 0.708 0.974 6.167 4.356 �0.01 0
TABLE 1 Sample size (n), expected(nonbiased) (HE) and observed (HO)heterozygosities, Hardy–Weinbergequilibrium test (HWE), mean number ofalleles (k), allelic richness (AR) based on aminimum sample size of n = 6, FIS pergeographic location and proportion (in %)of admixed individuals (based on q-coefficients estimated in STRUCTURE, seetext) per location with n > 5 individuals offruit bats
F IGURE 2 Spatial distribution oflandscape categories (left) and conductivitymap (right). The conductivity map showsthe output obtained in CIRCUITSCAPE usingthe landscape use values obtained fromGPS- and radio-telemetry trackedindividuals. The 0.9, 0.5 and 0.1 isolines ofprobability of the spatial distribution of theLevantine cluster obtained in GENELAND arealso depicted (right)
6230 | CENTENO-CUADROS ET AL.
4 | DISCUSSION
We integrated population genetics and movement ecology to exam-
ine how genetic differentiation and habitat use of Egyptian fruit bats
are associated in the Middle East. The analysis of detailed individual
GPS tracks showed that fruit bats exploit human-altered habitats
despite being a scarce resource in the transition area. Interestingly,
we found a clear bias of habitat use of fruit bats towards human-
related habitats (agriculture, orchards and built-up areas, ca. 63%),
although circuit theory models in combination with kinship analysis
discarded a significant effect of anthropogenic activities on gene
flow patterns.
4.1 | Biomes, genetic and morphological structure
Our study provides new insights into the distribution and the
genetic and morphological structure of Egyptian fruit bat within
the transition zone along the Middle East. The whole population
is divided into two genetic clusters along a latitudinal gradient.
The northern cluster encompasses all Mediterranean areas and the
northeastern side of the Jordan Rift Valley, whereas the southern
cluster comprises the colonies located in the Negev and Sinai
deserts and the southeastern side of the Jordan Rift Valley. These
two clusters were slightly differentiated (overall FST = 0.023)
although there were no deviations of genotype and allele frequen-
cies at the overall study area (HWE test; not significant) suggest-
ing that gene flow level counteracts natural selection or genetic
drift. Significant deviation from HWE across loci was found in the
Tel Aviv area (HWE; p = .016), although the only significant
heterozygote excess was reported in Halulim (FIS = �0.039;
HE = 0.643, HO = 0.666). The Hardy–Weinberg disequilibrium
reported in Tel Aviv reflects deviation from panmixia and random
mating (likely due to a harem-based mating system) (see e.g., Kor-
ine, Izhaki, & Makin, 1994) although we cannot distinguish the
evolutionary forces causing this pattern. The observed heterozy-
gote excess in Halulim, however, suggests some strategy of
inbreeding avoidance or differences in allelic frequencies between
males and females caused by sex-biased dispersal.
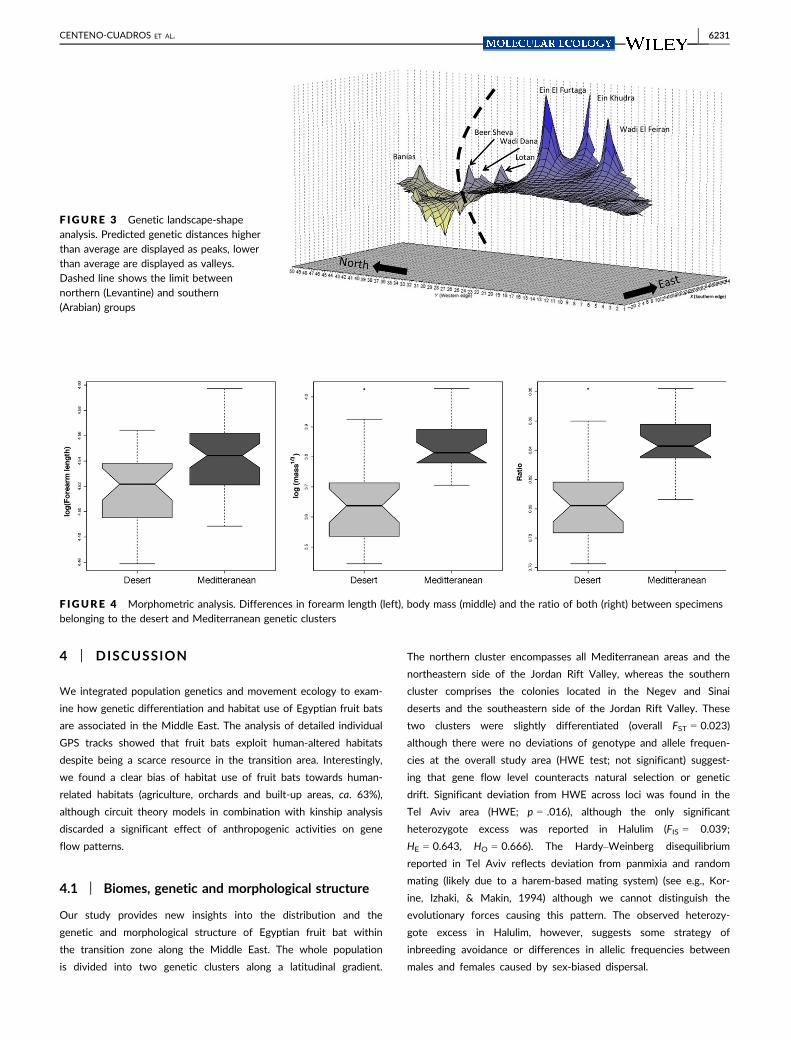
F IGURE 3 Genetic landscape-shapeanalysis. Predicted genetic distances higherthan average are displayed as peaks, lowerthan average are displayed as valleys.Dashed line shows the limit betweennorthern (Levantine) and southern(Arabian) groups
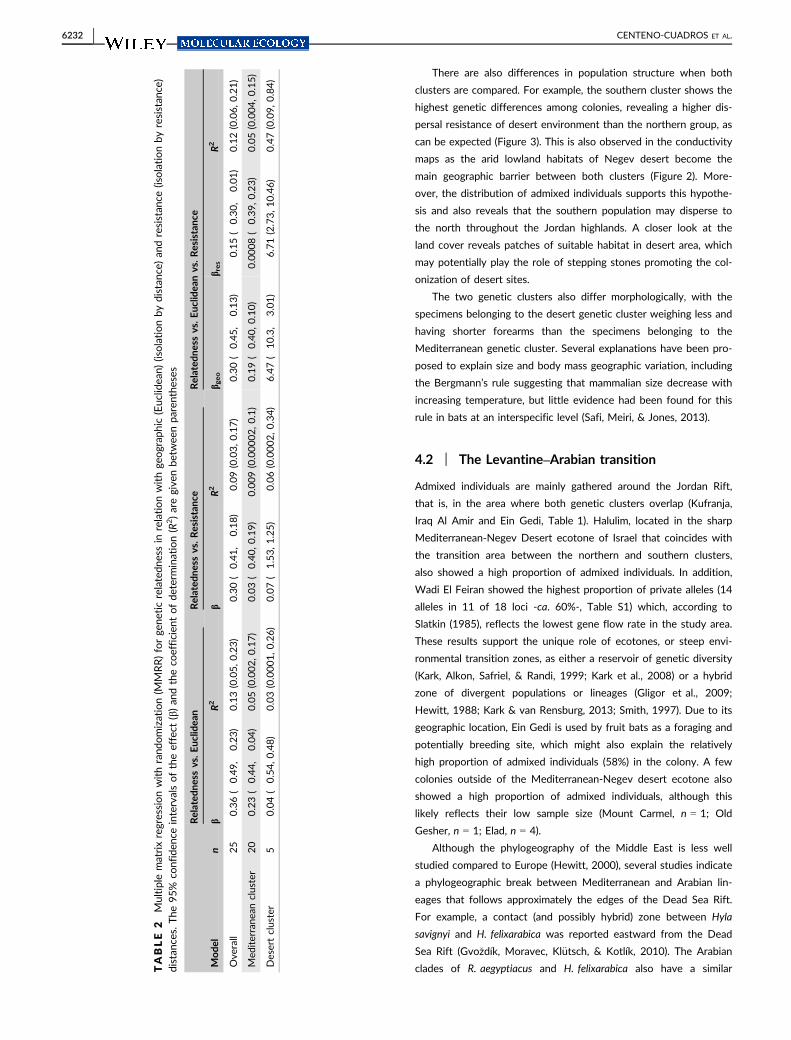
F IGURE 4 Morphometric analysis. Differences in forearm length (left), body mass (middle) and the ratio of both (right) between specimensbelonging to the desert and Mediterranean genetic clusters
CENTENO-CUADROS ET AL. | 6231
There are also differences in population structure when both
clusters are compared. For example, the southern cluster shows the
highest genetic differences among colonies, revealing a higher dis-
persal resistance of desert environment than the northern group, as
can be expected (Figure 3). This is also observed in the conductivity
maps as the arid lowland habitats of Negev desert become the
main geographic barrier between both clusters (Figure 2). More-
over, the distribution of admixed individuals supports this hypothe-
sis and also reveals that the southern population may disperse to
the north throughout the Jordan highlands. A closer look at the
land cover reveals patches of suitable habitat in desert area, which
may potentially play the role of stepping stones promoting the col-
onization of desert sites.
The two genetic clusters also differ morphologically, with the
specimens belonging to the desert genetic cluster weighing less and
having shorter forearms than the specimens belonging to the
Mediterranean genetic cluster. Several explanations have been pro-
posed to explain size and body mass geographic variation, including
the Bergmann’s rule suggesting that mammalian size decrease with
increasing temperature, but little evidence had been found for this
rule in bats at an interspecific level (Safi, Meiri, & Jones, 2013).
4.2 | The Levantine–Arabian transition
Admixed individuals are mainly gathered around the Jordan Rift,
that is, in the area where both genetic clusters overlap (Kufranja,
Iraq Al Amir and Ein Gedi, Table 1). Halulim, located in the sharp
Mediterranean-Negev Desert ecotone of Israel that coincides with
the transition area between the northern and southern clusters,
also showed a high proportion of admixed individuals. In addition,
Wadi El Feiran showed the highest proportion of private alleles (14
alleles in 11 of 18 loci -ca. 60%-, Table S1) which, according to
Slatkin (1985), reflects the lowest gene flow rate in the study area.
These results support the unique role of ecotones, or steep envi-
ronmental transition zones, as either a reservoir of genetic diversity
(Kark, Alkon, Safriel, & Randi, 1999; Kark et al., 2008) or a hybrid
zone of divergent populations or lineages (Gligor et al., 2009;
Hewitt, 1988; Kark & van Rensburg, 2013; Smith, 1997). Due to its
geographic location, Ein Gedi is used by fruit bats as a foraging and
potentially breeding site, which might also explain the relatively
high proportion of admixed individuals (58%) in the colony. A few
colonies outside of the Mediterranean-Negev desert ecotone also
showed a high proportion of admixed individuals, although this
likely reflects their low sample size (Mount Carmel, n = 1; Old
Gesher, n = 1; Elad, n = 4).
Although the phylogeography of the Middle East is less well
studied compared to Europe (Hewitt, 2000), several studies indicate
a phylogeographic break between Mediterranean and Arabian lin-
eages that follows approximately the edges of the Dead Sea Rift.
For example, a contact (and possibly hybrid) zone between Hyla
savignyi and H. felixarabica was reported eastward from the Dead
Sea Rift (Gvo�zd�ık, Moravec, Kl€utsch, & Kotl�ık, 2010). The Arabian
clades of R. aegyptiacus and H. felixarabica also have a similarTABLE
2Multiplematrixregressionwithrand
omization(M
MRR)forge
neticrelatedn
essin
relationwithge
ograp
hic(Euc
lidea
n)(isolationby
distan
ce)an
dresistan
ce(isolationby
resistan
ce)
distan
ces.The
95%
confiden
ceintervalsoftheeffect
(b)an
dtheco
efficien
tofde
term
ination(R
2)aregive
nbe
twee
npa
renthe
ses
Mode
ln
Related
ness
vs.E
uclid
ean
Related
ness
vs.Resistanc
eRelated
ness
vs.E
uclid
eanvs.Resistanc
e
bR2
bR2
b geo
b res
R2
Ove
rall
25
�0.36(�
0.49,�
0.23)
0.13(0.05,0.23)
�0.30(�
0.41,�0
.18)
0.09(0.03,0.17)
�0.30(�
0.45,�0
.13)
�0.15(�
0.30,�0
.01)
0.12(0.06,0.21)
Med
iterrane
ancluster
20
�0.23(�
0.44,�
0.04)
0.05(0.002,0.17)
�0.03(�
0.40,0.19)
0.009(0.00002,0.1)
�0.19(�
0.40,0.10)
�0.0008(�
0.39,0.23)
0.05(0.004,0.15)
Desertcluster
5�0
.04(�
0.54,0
.48)
0.03(0.0001,0.26)
0.07(�
1.53,1.25)
0.06(0.0002,0.34)
�6.47(�
10.3,�3
.01)
6.71(2.73,10.46)
0.47(0.09,0.84)
6232 | CENTENO-CUADROS ET AL.

pattern of disjunct range of two closely related lineages inhabiting
Negev and western Yemen. However, this disjunction could be also
caused by the lack of relevant data from the Hijaz Mountains of
western Arabia. Anyway, the montane region of western Yemen is
denoted as Eastern Afromontane hotspot and could play a role as a
refuge and generate endemic lineages (Mallon, 2011).
The shallow genetic structure between the Mediterranean and
desert lineages was largely explained by the environmental condi-
tions and fits to an IBE pattern. IBE among highly mobile animals is
reported especially in large mammals as in cosmopolitan predators
such as wolves (Carmichael et al., 2007; Czarnomska et al., 2013;
Musiani et al., 2007; Pilot et al., 2006) or killer whales (Foote, 2012;
Morin et al., 2015; Moura et al., 2014), but also in carnivores with
more restricted distribution ranges as in coyotes (Sacks, Brown, &
Ernest, 2004), Arctic foxes (Carmichael et al., 2007; Dalen et al.,
2004), lynx (Row et al., 2014; Rueness et al., 2003), cougars (Waller
& Wheeler, 2012) or sea lions (Wolf et al., 2008) and herbivores as,
for example, caribou (Courtois, Bernatchez, Ouellet, & Breton, 2003;
Pond, Brown, Wilson, & Schaefer, 2016). In contrast, ecotypes in
bats have been seldom studied. Evidence for this phenomenon
within the order Chiroptera comes mainly from the Mediterranean
region of South Africa, where differentiation of respective ecore-
gions promoted ecological diversification within long-fingered (Min-
iopterus; Miller-Butterworth, Jacobs, & Harley, 2003) and horseshoe
bats (Rhinolophus; Stoffberg, Schoeman, & Matthee, 2012). Steep
gradients among particular biomes and differentiation driven by
Pleistocene climate oscillation is typical for regions with Mediter-
ranean type of climate and may be a general feature of these cases
and the one presented in the Egyptian fruit bat.
Our study shows the adaptive phenotypic evolution in both lin-
eages. A smaller sized subspecies R. a. arabicus (Anderson, 1902)
was ascertained in comparison to larger form in the north R. a. ae-
gyptiacus (Geoffroy, 1810) (Benda et al., 2012; Bergmans, 1994;
Juste & Iba~nez, 1993). In the current study, we found an association
between genetic structure and body size along the transition area,
providing evidence for IBA between both lineages. The correlation
between individual traits and habitat preferences is not always
straightforward as adaptations are complex and they also involve
behavioural and foraging ecology or physiology. Therefore, the evo-
lution of Arabian and Mediterranean forms of fruit bats might result,
therefore, from a variety of processes including natal habitat prefer-
ence, philopatry, physiological adaptation driven by thermal metabo-
lism or nutritional limitations. Although further research including
landscape genomics is needed to test these hypotheses, our results
provide clear evidences for IBE and IBA between both lineages and
support their classification as ecotypes.
4.3 | Anthropogenic impact on gene flow andhabitat use patterns
The Middle East has a rich history of human impact on the land-
scape and its wildlife. This region has undergone profound deep
habitat transformations, especially from the second half of the 20th
century, linked to the development in agriculture, urbanization and
infrastructures (e.g., only during the 1960s the number of cities with
100,000 inhabitants or more in the Middle East increased from 249
to 837) (Clarke, 1980). This scenario has created a mosaic of natural
and human-altered ecosystems with a clear impact on the vertebrate
community (Perevolotsky, 2005). A significant IBD between colonies
revealed a decrease in gene flow rates as the geographic distance
increases, a pattern also observed as the average relatedness
between colonies decreased with distance. This result suggests that
there is limiting factor to dispersal that promotes isolation in a flying
mammal that is theoretically less sensitive to habitat heterogeneity
than terrestrial species as shown in the grey long-eared bat (Plecotus
austriacus) (Razgour, 2015; Razgour et al., 2014). The comparison
between the genetic differentiation within the distribution ranges of
the Levantine and Arabian lineages (shallow in the former, strong in
the latter; Figure 3) proved that colonies in the desert are more iso-
lated and gene flow patterns vary at similar spatial scales. This pat-
tern shows the relative importance of the landscape heterogeneity
between colonies and preferences of specific habitat types by fruit
bats (see Figure 2). This is in agreement with circuit theory models
for the Arabian clade, showing high isolation among particular locali-
ties in arid zones of Sinai, southern Israel and southwestern Jordan.
Reduction of gene flow within these areas may be ascribed to land-
scape and environmental properties of desert and mountain type of
habitats. The Arabian ecotype inhabits rather montane and dry areas
of the Arabian peninsula and Persia (Hulva et al., 2012), reaching
similar type of habitats in Sinai and highlands of Jordan, which possi-
bly mirror ancestral habitat in mountains of East Africa. Deserts are
characterized by source scarcity, seasonality and patchiness when
compared with more humid Ecozones (Kelt, 2011). Accordingly,
desert colonies of fruit bats work as demes in a stepping stone dis-
persal within an insular model of population genetic structure. This
is in close agreement with the role of oases as stopover sites located
along bird migration flyways (Lavee & Safriel, 1989; Shobrak, 2011).
The Mediterranean ecotype, on the other hand, is distributed in the
Nile valley and coastal parts of the Levant and Turkey and inhabits
lowlands. As the Jordan River cannot be considered a biogeographic
barrier for the fruit bat, and given abrupt changes in many environ-
mental variables in the region, we can conclude an association
between genetic differentiation with environmental differences (IBE)
(Wang & Bradburd, 2014). This pattern can arise independently from
different processes, including natural and sexual selection and differ-
ences of fitness in hybrid offspring. Interestingly, the observed
genetic differentiation could also be related to biased dispersal of
individuals towards particular environments (e.g., natal habitats) or to
phenotypic differences between native and immigrant individuals
(Nosil, Vines, & Funk, 2005).
The exploitation of human-altered habitats by fruit bats was con-
firmed when detailed movement data and land-use information
based on GPS- and radio-tagged individuals was used in combination
with circuit theory models. Our approach based on the analysis of
habitat use revealed two main conclusions. First, fruit bats are
attracted to some landscape variables likely due to their foraging
CENTENO-CUADROS ET AL. | 6233
behaviour (e.g., plantations/orchards and forest areas). Second, habi-
tat preferences in fruit bats are not involved in genetic differentia-
tion between the Mediterranean and desert lineages. These
seemingly mutually discriminant results are, in fact, proving that
landscape genetics and resource selection function models differ in
their rationale (Roffler et al., 2016). Our landscape genetics approach
suggests that habitat/resource selection does not predict gene flow
patterns in fruit bats. However, the movement ecology approach
contributes to explain the structural connectivity of colonies
throughout the transition area. Differences in the foraging behaviour
(and brain activities) of fruit bats have been reported when city vs
country colonies are compared (Dashevsky, Assaf, & Yovel, 2017).
These authors showed that country bats fly every night to feed on a
distant specific tree whereas city bats forage at many different trees.
Further research should focus on foraging, social and mating beha-
viour in fruit bats from country and city locations and how they may
influence dispersal and breeding behaviours. We hypothesize that a
harem-based and promiscuous mating system (e.g., in swarming sites)
might explain the observed discrepancy between habitat use and
gene flow patterns.
5 | CONCLUSIONS
We found evidences for ecological differentiation (IBE) and pheno-
typic adaptation (IBA) of Egyptian fruit bats in relation to different
habitat types, suggesting presence of two distinct ecotypes
located at desert and Mediterranean areas. Proximate mechanisms
behind this differentiation including, for example, microevolution
of physiological and behavioural traits needs further research. We
suggest that the two ecotypes probably result from historical pro-
cesses (allopatric evolution and secondary contact of Mediter-
ranean and Arabian lineages) shaped by contemporary processes
such as ecological constraints and gene flow. Our results indicate
that fruit bats benefit from human-mediated habitats for daily
movements and foraging behaviour, while dispersal (promoter of
gene flow between colonies) is probably not affected by human-
altered habitats.
ACKNOWLEDGEMENTS
We thank all members of the Movement Ecology Lab as well as
Nachum Ulanovsky and Yossi Yovel for their laboratory and field
assistance. Logistical support for genotyping was provided by the
Hebrew University Center for Genomic Technologies and the
Charles University. This work was funded by the Israel Science
Foundation (ISF) Grants ISF-FIRST 1316/05 and ISF 1259/09, the
Grant Agency of the Academy of Sciences of the Czech Republic
(IAA 601110905) and the Institutional Research Support grant No.
SVV 260 313/2016, the Adelina and Massimo Della Pergolla Chair
of Life Sciences and the Minerva Center for Movement Ecology
(R.N.), the President of Israel Doctoral Award (D.S.), the Lady Davis
Fellowship Trust and the University Pablo de Olavide (A.C-C).
DATA ACCESSIBILITY
Genotypes (n = 223) of 18 microsatellites, sampling sites and coordi-
nates (latitude/longitude in decimal degrees) of Egyptian fruit bats
analysed in this study are deposited in DRYAD (https://doi.org/10.
5061/dryad.93pr2). The R-code for the whole sequential procedure
written to estimate the average relatedness between colonies is
available as a supplementary material (Appendix S1).
AUTHOR CONTRIBUTIONS
A.C-C and P.H. conceived and led the study and wrote the manuscript.
A.C-C., T.S. and P.H. did the molecular work. A.C-C., T.S. and P.H. per-
formed population and landscape genetics analyses. D.S. performed
the analysis of telemetry data, D.R. ran GIS analyses for environmental
stratification and conductivity/resistance analyses and S.S. ran the sta-
tistical models and wrote the R-code for the sequential approach avail-
able in the Appendix S1. A.T. and P.B did the fieldwork and gathered
the morphometric data in Israel and in Jordan and Sinai, respectively.
A.E. performed the morphometric analyses. I.H. and R.N. funded the
project. All authors reviewed the final draft of the manuscript.
ORCID
A. Centeno-Cuadros http://orcid.org/0000-0003-4210-1128
REFERENCES
Andrianaivoarivelo, A. R., Shore, G. D., McGuire, S. M., Jenkins, R. K.
B., Ramilijaona, O., Louis, E. E., & Brenneman, R. A. (2008). Char-
acterization of 22 microsatellite marker loci in the Madagascar rou-
sette (Rousettus madagascariensis). Conservation Genetics, 10, 1025–
1028.
Belfer-Cohen, A., & Bar-Yosef, O. (2000). Early sedentism in the Near
East: A bumpy ride to village life. In I. Kuijt (Ed.), Life in neolithic farm-
ing communities: Social organization, identity, and differentiation (pp.
19–37). New York, NY: Plenum.
Belkhir, K., Borsa, P., Chikhi, L., Raufaste, N., & Bonhomme, F. (2004).
GENETIX 4.05, logiciel sous Windows TM pour la g�en�etique des popu-
lations. Interactions, CNRS UMR 5171, Universit�e de Montpellier II,
Montpellier (France).
Benda, P., Vallo, P., Hulva, P., & Hor�a�cek, I. (2012). The Egyptian fruit bat
Rousettus aegyptiacus (Chiroptera: Pteropodidae) in the Palaearctic:
Geographical variation and taxonomic status. Biologia, 67, 1230–
1244.
Bergmans, W. (1994). Taxonomy and biogeography of African fruit bats
(Mammalia, Megachiroptera). 4. The genus Rousettus Gray, 1821.
Beaufortia, 44, 79–126.
Bernbeck, R., & Pollock, S. (2005). A cultural-historical framework. In S.
Pollock & R. Bernbeck (Eds.), Archaeologies of the middle east: Critical
perspectives (pp. 11–40). Oxford, UK: Blackwell Publishing.
Berkes, F., Colding, J., & Folke, C. (2000). Rediscovery of traditional eco-
logical knowledge as adaptive management. Ecological Applications,
10, 1251–1262.
Carmichael, L. E., Krizan, J., Nagy, J. A., et al. (2007). Historical and eco-
logical determinants of genetic structure in arctic canids. Molecular
Ecology, 16, 3466–3483.
6234 | CENTENO-CUADROS ET AL.
Chapuis, M.-P., & Estoup, A. (2007). Microsatellite null alleles and estima-
tion of population differentiation. Molecular Biology and Evolution, 24,
621–631.
Clarke, J. I. (1980). Contemporary urban growth. In G. H. Blake & R. I.
Lawless (Eds.), The changing Middle Eastern city (p. 273). London:
Routledge Library Editions: Society of the Middle East.
Courtois, R., Bernatchez, L., Ouellet, J.-P., & Breton, L. (2003). Signifi-
cance of caribou (Rangifer tarandus) ecotypes from a molecular genet-
ics viewpoint. Conservation Genetics, 4, 393–404.
Czarnomska, S. D., Jezdrzejewska, B., Borowik, T., et al. (2013). Concor-
dant mitochondrial and microsatellite DNA structuring between Pol-
ish lowland and Carpathian Mountain wolves. Conservation Genetics,
14, 573–588.
Dalen, L., Fuglei, E., Hersteinsson, P., et al. (2004). Population history and
genetic structure of a circumpolar species: The arctic fox. Biological
Journal of the Linnean Society, 84, 79–89.
Dashevsky, O., Assaf, Y., & Yovel, Y. (2017). City bats vs. country bats:
Neural differences due to navigation skills in the Egyptian fruit bat
Rousettus aegyptiacus. In 5th International Berlin Bat Meeting: Are bats
special? Berlin: Leibniz Institute for Zoo and Wildlife Research, 141 p.
Dempster, A., Laird, N., & Rubin, D. (1977). Maximum likelihood from
incomplete data via the EM algorithm. Journal of the Royal Statistical
Society: Series B, 39, 1–38.
DeWoody, J., Trewin, H., & Taylor, G. (2015). Genetic and morphological
differentiation in Populus nigra L.: Isolation by colonization or isola-
tion by adaptation? Molecular Ecology, 24, 2641–2655.
Earl, D. A., & von Holdt, B. M. (2011). STRUCTURE HARVESTER: A website and
program for visualizing STRUCTURE output and implementing the
Evanno method. Conservation Genetics Resources, 4, 359–361.
Evanno, G., Regnaut, S., & Goudet, J. (2005). Detecting the number of
clusters of individuals using the software STRUCTURE: A simulation
study. Molecular Ecology, 14, 2611–2620.
Evenari, M., Shanan, L., & Tadmor, N. (1982). Recent developments. In
The Negev: The challenge of a desert (pp. 338–412). Cambridge: Har-
vard University Press.
Evin, A., Cucchi, T., Cardini, A., et al. (2013). The long and winding road:
Identifying pig domestication through molar size and shape. Journal
of Archaeological Science, 40, 735–743.
Falush, D., Stephens, M., & Pritchard, J. K. (2007). Inference of popula-
tion structure using multilocus genotype data: Dominant markers and
null alleles. Molecular Ecology Notes, 7, 574–578.
Fischer, J., & Lindenmayer, D. B. (2007). Landscape modification and
habitat fragmentation: A synthesis. Global Ecology and Biogeography,
16, 265–280.
Foote, A. D. (2012). Investigating ecological speciation in non-model
organisms: A case study of killer whale ecotypes. Evolutionary Ecology
Research, 14, 447–465.
Fraley, C., Raftery, A. E., Murphy, T. B., & Scrucca, L. (2012). MCLUST Ver-
sion 4 for R: Normal mixture modeling for model-based clustering,
classification, and density estimation. Technical Report No. 597.
Gligor, M., Ganzhorn, J. U., Rakotondravony, D., et al. (2009). Hybridiza-
tion between mouse lemurs in an ecological transition zone in south-
ern Madagascar. Molecular Ecology, 18, 520–533.
Goudet, J. (1995). FSTAT (Version 1.2): A computer program to calculate F-
statistics. Journal of Heredity, 86, 485–486.
Grimm, N. B., Faeth, S. H., Golubiewski, N. E., et al. (2008). Global change
and the ecology of cities. Science (New York, N.Y.), 319, 756–760.
Guichoux, E., Lagache, L., Wagner, S., & Et, A. (2011). Current trends in
microsatellite genotyping. Molecular Ecology Resources, 11, 591–611.
Guillot, G., Mortier, F., & Estoup, A. (2005). GENELAND: A computer pack-
age for landscape genetics. Molecular Ecology Notes, 5, 712–715.
Gvo�zd�ık, V., Moravec, J., Kl€utsch, C., & Kotl�ık, P. (2010). Phylogeographyof the Middle Eastern tree frogs (Hyla, Hylidae, Amphibia) as inferred
from nuclear and mitochondrial DNA variation, with a description of
a new species. Molecular Phylogenetics and Evolution, 55, 1146–1166.
Harrison, D. L., & Bates, P. J. J. (1991) The mammals of Arabia. Kent, UK:
Harrison Zoological Museum.
Hewitt, G. M. (1988). Hybrid zones-natural laboratories for evolutionary
studies. Trends in Ecology & Evolution, 3, 158–167.
Hewitt, G. (2000). The genetic legacy of the Quaternary ice ages. Nature,
405, 907–913.
Hijmans, R. J., Cameron, S. E., Parra, J. L., Jones, P. G., & Jarvis, A.
(2005). Very high resolution interpolated climate surfaces for global
land areas. International Journal of Climatology, 25, 1965–1978.
Hua, P. Y., Chen, J. P., Sun, M., et al. (2006). Characterization of
microsatellite loci in fulvous fruit bat Rousettus leschenaulti. Molecular
Ecology Notes, 6, 939–941.
Hulva, P., Mare�sov�a, T., Dundarova, H., et al. (2012). Environmental mar-
gin and island evolution in Middle Eastern populations of the Egyp-
tian fruit bat. Molecular Ecology, 21, 6104–6116.
Jain, A. K. (2010). Data clustering: 50 years beyond K-means. Pattern
Recognition Letters, 31, 651–666.
Jakobsson, M., & Rosenberg, N. A. (2007). CLUMPP: A cluster matching and
permutation program for dealing with label switching and multi-
modality in analysis of population structure. Bioinformatics (Oxford,
England), 23, 1801–1806.
Jarvis, A., Reuter, H. I., Nelson, A., & Guevara, E. (2008). Hole-filled
SRTM for the globe Version 4. Available from the CGIAR-CSI SRTM
90 m Database (http://srtm.csi.cgiar.org).
Jha, S., & Kremen, C. (2013). Urban land use limits regional bumble bee
gene flow. Molecular Ecology, 22, 2483–2495.
Juste, J., Alvarez, Y., Tabar�es, E., et al. (1999). Phylogeography of African
fruitbats (Megachiroptera). Molecular Phylogenetics and Evolution, 13,
596–604.
Juste, J., & Iba~nez, C. (1993). Geographic variation and taxonomy of
Rousettus aegyptiacus (Mammalia: Megachiroptera) in the islands of
the Gulf of Guinea. Zoological Journal of the Linnean Society, 107,
117–129.
Kark, S., Alkon, P. U., Safriel, U. N., & Randi, E. (1999). Conservation pri-
orities for Chukar partridge in Israel based on genetic diversity across
an ecological gradient. Conservation Biology, 13, 542–552.
Kark, S., Hadany, L., Safriel, U. N., et al. (2008). How does genetic diver-
sity change towards the range periphery? An empirical and theoreti-
cal test. Evolutionary Ecology Research, 10, 391–414.
Kark, S., & van Rensburg, B. J. (2013). Ecotones: marginal or central areas
of transition? Israel Journal of Ecology & Evolution, 52, 29–53.
Kelt, D. A. (2011). Comparative ecology of desert small mammals: A
selective review of the past 30 years. Journal of Mammalogy, 92,
1158–1178.
Korine, C., Izhaki, I., & Arad, Z. (1999). Is the Egyptian fruit-bat Rousettus
aegyptiacus a pest in Israel? An analysis of the bat’s diet and implica-
tions for its conservation. Biological Conservation, 88, 301–306.
Korine, C., Izhaki, I., & Makin, D. (1994). Population structure and emer-
gence order in the fruit-bat (Rousettus aegyptiacus: Mammalia, Chi-
roptera). Journal of Zoology, 232, 163–174.
Kwiecinski, G., & Griffiths, T. (1999). Rousettus egyptiacus. Mammalian
Species, 611, 1–9.
Lavee, D., & Safriel, U. N. (1989). The dilemma of cross-desert migrants –
Stopover or skip a small oasis? Journal of Arid Environments, 17, 69–81.
Lee-Yaw, J. A., Davidson, A., McRae, B. H., & Green, D. M. (2009). Do
landscape processes predict phylogeographic patterns in the wood
frog? Molecular Ecology, 18, 1863–1874.
Lenormand, T. (2002). Gene flow and the limits to natural selection.
Trends in Ecology & Evolution, 17, 183–189.
Lu�can, R. K., Bartoni�cka, T., Jedli�cka, P., �Re�rucha, �S., �S�alek, M., �C�ı�zek, M.,
. . . Hor�a�cek, I. (2016). Spatial activity and feeding ecology of the
endangered northern population of the Egyptian fruit bat (Rousettus
aegyptiacus). Journal of Mammalogy, 97, 815–822.
Mallon, D. P. (2011). Global hotspots in the Arabian Peninsula. Zoology in
the Middle East, 54, 13–20.
CENTENO-CUADROS ET AL. | 6235
Manel, S., Schwartz, M. K., Luikart, G., & Taberlet, P. (2003). Landscape
genetics: Combining landscape ecology and population genetics.
Trends in Ecology & Evolution, 18, 189–197.
Mantel, N. (1967). The detection of disease clustering and a generalized
regression approach. Cancer Research, 27, 209–220.
McRae, B. H. (2006). Isolation by resistance. Evolution, 60, 1551–1561.
McRae, B. H., & Beier, P. (2007). Circuit theory predicts gene flow in
plant and animal populations. Proceedings of the National Academy of
Sciences of the United States of America, 104, 19885–19890.
McRae, B. H., Dickson, B. G., Keitt, T. H., & Shah, V. B. (2008). Using cir-
cuit theory to model connectivity in ecology, evolution and conserva-
tion. Ecology, 89, 2712–2724.
Miller, M. P. (2005). ALLELES IN SPACE (AIS): Computer software for the joint
analysis of interindividual spatial and genetic information. The Journal
of heredity, 96, 722–724.
Miller-Butterworth, C. M., Jacobs, D. S., & Harley, E. H. (2003). Strong
population substructure is correlated with morphology and ecology in
a migratory bat. Nature, 424, 187–191.
Morin, P. A., Parsons, K. M., Archer, F. I., et al. (2015). Geographic and
temporal dynamics of a global radiation and diversification in the
killer whale. Molecular Ecology, 24, 3964–3979.
Moura, A. E., Kenny, J. G., Chaudhuri, R., et al. (2014). Population
genomics of the killer whale indicates ecotype evolution in sympa-
try involving both selection and drift. Molecular Ecology, 23, 5179–
5192.
Munshi-South, J. (2012). Urban landscape genetics: Canopy cover pre-
dicts gene flow between white-footed mouse (Peromyscus leucopus)
populations in New York City. Molecular Ecology, 21, 1360–1378.
Musiani, M., Leonard, J. A., Cluff, H. D., et al. (2007). Differentiation of
tundra/taiga and boreal coniferous forest wolves: Genetics, coat col-
our and association with migratory caribou. Molecular Ecology, 16,
4149–4170.
Nosil, P., Vines, T. H., & Funk, D. (2005). Reproductive isolation caused
by natural selection against immigrants from divergent habitats. Evo-
lution, 59, 705–719.
Oksanen, J., Guillaume Blanchet, F., Kindt, R., Legendre, P., Minchin, P.
R., O’Hara, R. B., . . . Wagner, H. (2013). VEGAN: Community ecology
package. R package version 2.3-0. Retrieved from https://CRAN.R-
project.org/package=vegan
Orsini, L., Vanoverbeke, J., Swillen, I., Mergeay, J., & De Meester, L.
(2013). Drivers of population genetic differentiation in the wild: Isola-
tion by dispersal limitation, isolation by adaptation and isolation by
colonization. Molecular Ecology, 22, 5983–5999.
Ortego, J., Aguirre, M. P., Noguerales, V., & Cordero, P. J. (2015). Conse-
quences of extensive habitat fragmentation in landscape-level pat-
terns of genetic diversity and structure in the Mediterranean esparto
grasshopper. Evolutionary Applications, 8, 621–632.
Peakall, R., & Smouse, P. E. (2012). GENALEX 6.5: Genetic analysis in EXCEL.
Population genetic software for teaching and research – An update.
Bioinformatics (Oxford, England), 28, 2537–2539.
Perevolotsky, A. (2005). Integrating landscape ecology in the conserva-
tion of Mediterranean ecosystems: The Israeli experience. Israel Jour-
nal of Plant Sciences, 53, 203–213.
Pew, J., Muir, P. H., Wang, J., & Frasier, T. R. (2014). RELATED: An R pack-
age for analysing pairwise relatedness from codominant molecular
markers. Molecular Ecology Resources, 15, 557–561.
Pilot, M., Jedrzejewski, W., Branicki, W., et al. (2006). Ecological factors
influence population genetic structure of European grey wolves.
Molecular Ecology, 15, 4533–4553.
Pimm, S. L., Jenkins, C. N., Abell, R., et al. (2014). The biodiversity of spe-
cies and their rates of extinction, distribution, and protection. Science
(New York, N.Y.), 344, 1246752.
Pond, B. A., Brown, G. S., Wilson, K. S., & Schaefer, J. A. (2016). Drawing
lines: Spatial behaviours reveal two ecotypes of woodland caribou.
Biological Conservation, 194, 139–148.
R Core Team. (2013). R: A language and environment for statistical com-
puting. Vienna, Austria: R Foundation for Statistical Computing.
Razgour, O. (2015). Beyond species distribution modeling: A landscape
genetics approach to investigating range shifts under future climate
change. Ecological Informatics, 30, 250–256.
Razgour, O., Rebelo, H., Puechmaille, S. J., et al. (2014). Scale-depen-
dent effects of landscape variables on gene flow and population
structure in bats (C Burridge, Ed.). Diversity and Distributions, 20,
1173–1185.
Richardson, J. L., Urban, M. C., Bolnick, D. I., & Skelly, D. K. (2014).
Microgeographic adaptation and the spatial scale of evolution. Trends
in Ecology & Evolution, 29, 165–176.
Roffler, G. H., Schwartz, M. K., Pilgrim, K. L., et al. (2016). Identification
of landscape features influencing gene flow: How useful are habitat
selection models? Evolutionary Applications, 9, 805–817.
Rosenberg, N. A. (2003). DISTRUCT: A program for the graphical display of
population structure. Molecular Ecology Notes, 4, 137–138.
Rosenzweig, M. (1995). Species diversity in space and time. Cambridge:
Cambridge University Press.
Rousset, F. (2008). GENEPOP’007: A complete re-implementation of the
GENEPOP software for Windows and Linux. Molecular ecology resources,
8, 103–106.
Row, J. R., Wilson, P. J., Gomez, C., et al. (2014). The subtle role of cli-
mate change on population genetic structure in Canada lynx. Global
Change Biology, 20, 2076–2086.
Ruddiman, W. F., Ellis, E. C., Kaplan, J. O., & Fuller, D. Q. (2015). Defining
the epoch we live in. Science, 348, 38–39.
Rueness, E. K., Stenseth, N. C., O’Donoghue, M., et al. (2003). Ecological and
genetic spatial structuring in the Canadian lynx. Nature, 425, 69–72.
Sacks, B. N., Brown, S. K., & Ernest, H. B. (2004). Population structure of
California coyotes corresponds to habitat-specific breaks and illumi-
nates species history. Molecular Ecology, 13, 1265–1275.
Safi, K., Meiri, S., & Jones, K. E. (2013). Evolution of body size in bats. In
F. A. Smith & S. K. Lyons (Eds.), Animal body size: Linking pattern and
process across space, time, and taxonomic group (pp. 95–105). Chicago,
IL: The University of Chicago Press.
Seehausen, O., Takimoto, G., Roy, D., & Jokela, J. (2008). Speciation
reversal and biodiversity dynamics with hybridization in changing
environments. Molecular Ecology, 17, 30–44.
Shobrak, M. (2011). Bird flyways and stopover conservation sites in the
Arabian Peninsula. Zoology in the Middle East, 54, 27–30.
Slatkin, M. (1985). Rare alleles as indicators of gene flow. Evolution, 39,
53–65.
Smith, T. B. (1997). A role for ecotones in generating rainforest biodiver-
sity. Science, 276, 1855–1857.
Stockwell, C. A., Hendry, A. P., & Kinnison, M. T. (2003). Contemporary
evolution meets conservation biology. Trends in Ecology & Evolution,
18, 94–101.
Stoffberg, S., Schoeman, M. C., & Matthee, C. A. (2012). Correlated
genetic and ecological diversification in a widespread southern Afri-
can horseshoe bat. PLoS ONE, 7, e31946.
Storfer, A., Murphy, M. A., Evans, J. S., et al. (2007). Putting the “land-scape” in landscape genetics. Heredity, 98, 128–142.
Thomas, C. D., Cameron, A., Green, R. E., et al. (2004). Extinction risk
from climate change. Nature, 427, 145–148.
Tsoar, A., Nathan, R., Bartan, Y., et al. (2011). Large-scale navigational
map in a mammal. Proceedings of the National Academy of Sciences of
the United States of America, 108, E718–E724.
Tsoar, A., Shohami, D., & Nathan, R. (2010). A movement ecology
approach to study seed dispersal and plant invasion: An overview
and application of seed dispersal by fruit bats. In D. M. Richardson
(Ed.), Fifty years of invasion ecology: The legacy of Charles Elton (pp.
101–119). London: Wiley-Blackwell.
del Vaglio, M. A., Nicolau, H., Bosso, L., & Russo, D. (2011). A first
assessment of feeding habits in the fruit bat Rousettus aegyptiacus
6236 | CENTENO-CUADROS ET AL.
on Cyprus island. Hystrix: The Italian Journal of Mammalogy, 22, 281–
289.
Varudkar, A., & Ramakrishnan, U. (2015). Commensalism facilitates gene
flow in mountains: A comparison between two Rattus species. Hered-
ity, 115, 253–261.
Vitousek, P. M. (1997). Human domination of earth’s ecosystems. Science,
277, 494–499.
Waller, L. A., & Wheeler, D. C. (2012). Spatial analysis linking landscape
features and genetic population structure in cougars (Puma concolor) in
the northern Rocky Mountains. Statistics and Its Interface, 5, 183–193.
Wang, J. (2002). An estimator for pairwise relatedness using molecular
markers. Genetics, 160, 1203–1215.
Wang, I. J. (2013). Examining the full effects of landscape heterogeneity
on spatial genetic variation: A multiple matrix regression approach for
quantifying geographic and ecological isolation. Evolution: International
Journal of Organic Evolution, 67, 3403–3411.
Wang, I. J., & Bradburd, G. S. (2014). Isolation by environment. Molecular
Ecology, 23, 5649–5662.
Western, D. (2001). Human-modified ecosystems and future evolution.
Proceedings of the National Academy of Sciences of the United States
of America, 98, 5458–5465.
Wolf, J. B. W., Harrod, C., Brunner, S., et al. (2008). Tracing early stages of spe-
cies differentiation: Ecological, morphological and genetic divergence of
Gal�apagos sea lion populations. BMCEvolutionary Biology, 8, 150.
Wright, S. (1943). Isolation by distance. Genetics, 28, 114–138.
Wright, S. (1969). Evolution and the genetics of populations. In S. Wright
(Ed.), The theory of gene frequencies (Vol. 2). Chicago:University of
Chicago Press.
Yom-Tov, Y., & Tchernov, E. (1988). The biogeographical history of the
southern Levant. In Y. Yom-Tov & E. Tchernov (Eds.), The zoogeogra-
phy of Israel: The distribution and abundance at a zoogeographical
crossroad (pp. 159–250). Dordrecht, the Netherlands: Dr. W. Junk
Publishers.
SUPPORTING INFORMATION
Additional Supporting Information may be found online in the sup-
porting information tab for this article.
How to cite this article: Centeno-Cuadros A, Hulva P,
Romportl D, et al. Habitat use, but not gene flow, is
influenced by human activities in two ecotypes of Egyptian
fruit bat (Rousettus aegyptiacus). Mol Ecol. 2017;26:6224–
6237. https://doi.org/10.1111/mec.14365
CENTENO-CUADROS ET AL. | 6237


![Evaluating gene flow and habitat connectivity between S ... · [Escrever o nome da empresa] Evaluating gene flow and habitat connectivity between S. salamandra lineages across heterogeneous](https://img.pdfslide.net/doc/110x75/5c04069809d3f2e5418d1357/evaluating-gene-flow-and-habitat-connectivity-between-s-escrever-o-nome.jpg)