Embed Size (px)
Citation preview

HABs and Climate Change Symposium, Göteborg, Sweden, 18-22 May, 2015

Cyanobacterial Harmful Blooms (CHABs): Symptomatic of human and climatic alteration of aquatic environments
Climate (change) plays a key interactive role
Urban, agricultural and industrial expansion
Increasing nutrient (Nitrogen & Phosphorus) inputs
Water use and hydrologic modification play key roles
Blooms are intensifying and spreading

Cyano Expansion in freshwater ecosystems is well-documented

There are parallel scenarios in the marine environment

The CyanoHAB Players

First, the nutrient part of the story Taihu, largest (2400 km2) coastal plain lake in China, located in Yangtze R. Delta. Nutrients (Lots!) associated with development in the Taihu Basin. Results: Cyano blooms have increased
to “pea soup” conditions within only a few decades

The water crises (2007- ?) in the Taihu Basin: Cessation drinking water use for >20 million (hepato- and neuro-toxins) Curtailed recreational use (contact dermatitis) Fisheries (commercial and recreational) Tourism
0102030405060708090
J F MAMJ J AS ONDJ F MAMJ J AS ONDJ F MAMJ J ASOND2006 2007 2008
TN
/TP
station-1 station-2
0
50
100
150
200
250
300
350
J F MAMJ J AS ONDJ F MAMJ J ASONDJ FMAMJ J AS OND2006 2007 2008
DT
N/D
TP
station-1 station-2
0
5
10
15
20
25
J F MAMJ J AS ONDJ F MAMJ J AS ONDJ F MAMJ J ASOND2006 2007 2008
PN
/PP
station-1 station-2
A B
C
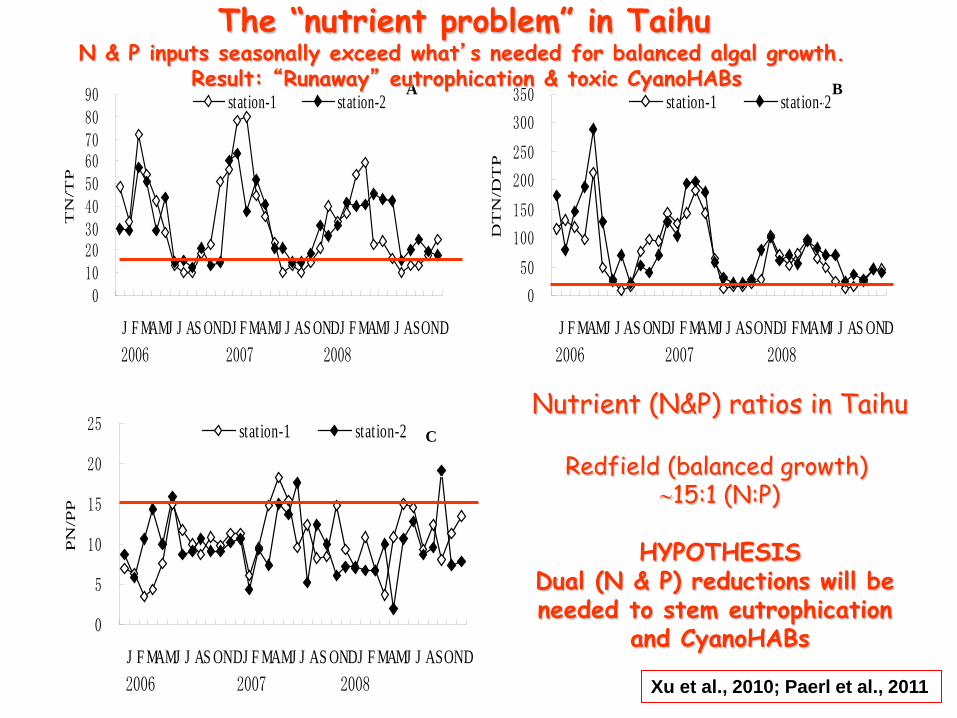
Nutrient (N&P) ratios in Taihu
Redfield (balanced growth) ∼15:1 (N:P)
HYPOTHESIS
Dual (N & P) reductions will be needed to stem eutrophication
and CyanoHABs
The “nutrient problem” in Taihu N & P inputs seasonally exceed what’s needed for balanced algal growth.
Result: “Runaway” eutrophication & toxic CyanoHABs
Xu et al., 2010; Paerl et al., 2011

Effects of nutrient (N & P) additions on phytoplankton production (Chl a) in Lake Taihu, China: Both N & P inputs matter!!
Xu et al. 2010; Paerl et al. 2011
-200
-100
0
100
200
300
400
500
600
1 1 2 2 2 2 3 4 4 4 4 5 5 5 6 6 6 7 7 7 8 8 8 8 9 9 9 10 10 10 1 1 11 11 11 11 12 12 12 12 13 13 14 14 14 10Ch
loro
ph
yll
(% A
bo
ve C
on
tro
l)
+N +P +NPNLake Number
-1-3 0 3
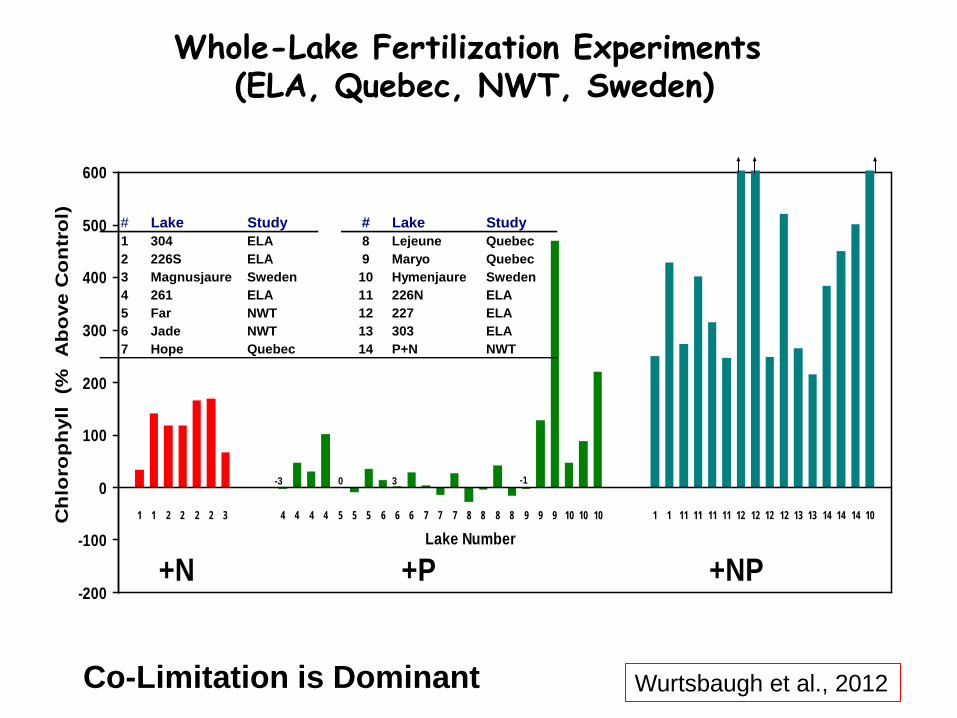
# Lake Study # Lake Study1 304 ELA 8 Lejeune Quebec2 226S ELA 9 Maryo Quebec3 Magnusjaure Sweden 10 Hymenjaure Sweden4 261 ELA 11 226N ELA5 Far NWT 12 227 ELA6 Jade NWT 13 303 ELA7 Hope Quebec 14 P+N NWT
Whole-Lake Fertilization Experiments (ELA, Quebec, NWT, Sweden)
Co-Limitation is Dominant Wurtsbaugh et al., 2012
Control
Mannitol N P Fe
Fe+EDTAN+Fe
P+FeN+P
100
200
300
400
500
600
700
DPM
/ml
LegendDay 1Day 2Day 3
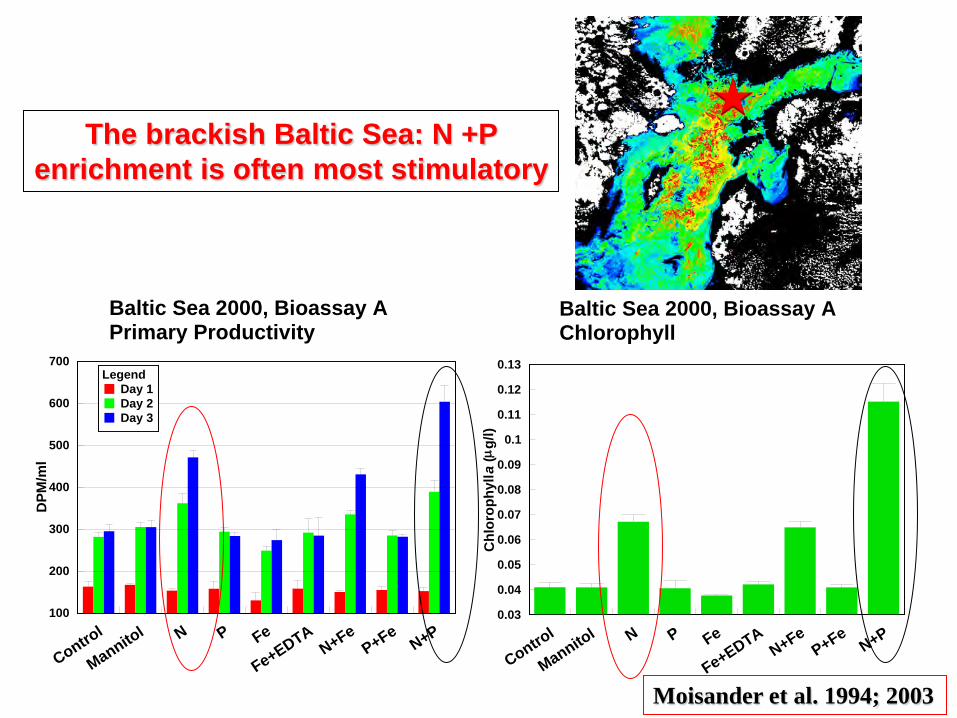
Baltic Sea 2000, Bioassay APrimary Productivity
Control
Mannitol N P Fe
Fe+EDTAN+Fe
P+FeN+P
0.03
0.04
0.05
0.06
0.07
0.08
0.09
0.1
0.11
0.12
0.13
Chl
orop
hyll a
(µg/
l)
Baltic Sea 2000, Bioassay AChlorophyll
The brackish Baltic Sea: N +P enrichment is often most stimulatory
Moisander et al. 1994; 2003
★

Interactive Impacts of Climate Change: Its Getting Warmer
Additional Evidence 2003 was the hottest summer in 500 years in Europe!
2005, 2009, 2014 were the hottest years ever in N. America 2010 hottest year in central Asia
Huisman et al. 2006 Mean epilimnetic Temp. In Dutch lakes

Buoyant Cyanos favored by Stronger Stratification
Paerl and Huisman 2009

Mid August 2003:
Lake Nieuwe Meer, Netherlands
B Microcystis benefits!
Heatwave & little mixing
Jöhnk et al., 2008

Testing the Model
B
Theory Lake data
Huisman et al., 2004

Temperature affects growth rates
Refs.: Kraweik 1982, Grzebyk & Berland 1996; Kudo et al., 2000, Litaker et al., 2002, Briand et al., 2004, Butterwick et al., 2005, Yamamoto & Nakahara 2005, Reynolds 2006

Percentage of cyanobacterial biovolume in phytoplankton communities as a function of water temperature and nutrients in 143 lakes along a climatic gradient in Europe and South America. (a) Combined effects of temperature and nutrients as captured by a logistic regression model (b) Response surface obtained from interpolation of the raw data using inverse distance weighting. From Kosten et al. (2011). Global Change Biology DOI: 10.1111/j.1365-2486.2011.02488.x
Cyanobacterial dominance along temperature & nutrient gradients in 143 lakes

Cyanobacterial resurgence in Lake Erie (Laurentian Great Lakes): Combined effect of eutrophication and warming?
Courtesy NOAA/NESDIS & NASA/SeaWiFS
Microcystis spp

Temperature increases and longer-lasting, more intense cyanobacterial blooms in Taihu. Is warming changing CyanoHAB thresholds?

What’s the evidence that warming promotes cyanobacterial production & dominance in the marine environment?
St Johns River Estuary, Florida, USA Baltic Sea, N. Europe

Relationship of unicellular diazotroph abundances [log10 (nifH copies per liter)] and temperature for Crocosphaera. f = 5.13 – 0.1754x + 0.0638x2 – 0.0124x3..
Marine cyanobacterial diazotrophic picoplankton abundance vs. temperature
Moisander et al. 2010 (Science 327: 1512-114).

North Carolina Coastal Waters: The Neuse R.-Pamlico Sound System

Seasonal patterns of Chl a and cyanobacterial biomass (zeaxanthin) in the Neuse River Estuary, NC
Gaulke et al. 2010
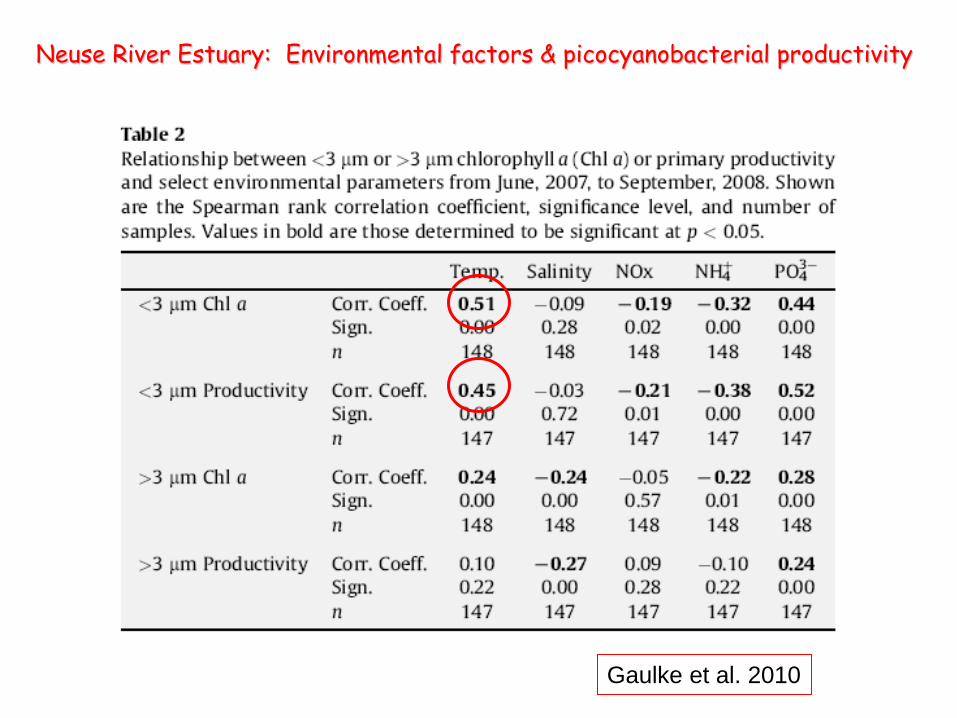
Neuse River Estuary: Environmental factors & picocyanobacterial productivity
Gaulke et al. 2010

Hydrologically: Things are getting more extreme
• Storms, droughts more intense, extensive & frequent

0
2
4
6
8
10
12
Jan-
01
Jul-0
1
Jan-
02
Jul-0
2
Jan-
03
Jul-0
3
Jan-
04
Jul-0
4
Jan-
05
Jul-0
5
Jan-
06
Jul-0
6
Jan-
07
Jul-0
7
Fuco
xant
hin
(µg
L-1)
0
0.5
1
1.5
2
2.5
3
3.5
Zeax
anth
in (µ
g L
-1)
Fucoxantin
Zeaxanthin
0
50
100
150
200
250
300
350
400
Jan-
01
Jul-0
1
Jan-
02
Jul-0
2
Jan-
03
Jul-0
3
Jan-
04
Jul-0
4
Jan-
05
Jul-0
5
Jan-
06
Jul-0
6
Jan-
07
Jul-0
7
disc
harg
e (m
3 se
c -1) Discharge
Paerl et al. 2009
Diatoms like it cool & fast
Effects of Freshwater discharge (flushing) on diatoms (fucoxanthin) and cyanobacteria (zeaxanthin) in the Neuse R. Estuary, NC
Cyanos like it hot & slow

Global warming, associated climate change and CyanoHAB potential

Potential linkage to “cyanotoxin” (microcystin) production in aquatic ecosystems
Paerl and Otten, Science 342: 433 (2013)

With regard to management, what’s most practical across systems?
• Reduce both N & P inputs – Nutrient-bloom threshold are system-specific – May need to reduce N and P inputs even more in a warmer world
• Impose nutrient input restrictions year-round – Residence time is long in large ecosystems (> several years) – Warmer, longer growing seasons

Thanks!! www.unc.edu/ims/paerllab/research/cyanohabs/
82667701
Thanks to: A. Joyner T. Otten B. Peierls B. Qin M. Piehler K. Rossignol S. Wilhelm H. Xu G. Zhu TLLER “crew”
Additional support: Nanjing Instit. of Geography and Limnology, Chinese Academy of Sciences (NIGLAS)