Embed Size (px)
Citation preview

Hackettstown Municipal Utilities Authority
JUNE 2009
A
Final Energy Audit Report


A i E:\HMUA\EnergyAudit\Final Report\Table of Contents.doc
Contents
Executive Summary
Section 1 Introduction 1.1 General ....................................................................................................................... 1-1 1.2 Background ............................................................................................................... 1-2 1.3 Purpose and Scope ................................................................................................... 1-2
Section 2 Facility Description 2.1 Water Supply and Distribution System ................................................................. 2-1 2.1.1 Water Filtration Plant ............................................................................... 2-1
2.1.2 Pump Stations ............................................................................................ 2-1 2.1.3 Water Supply Wells .................................................................................. 2-2 2.1.4 Tanks ........................................................................................................... 2-3
2.2 Water Pollution Control Plant ................................................................................ 2-3 2.2.1 Inlet Facilities ............................................................................................. 2-3 2.2.2 Influent Pump Station ............................................................................... 2-4 2.2.3 Primary Clarifiers and Trickling Filters ................................................. 2-4 2.2.4 Intermediate Clarifiers and Pump Station ............................................. 2-4 2.2.5 Nitrification Tanks and Final Clarifiers ................................................. 2-5 2.2.6 Ultraviolet Disinfection ............................................................................ 2-6 2.2.7 Anaerobic Digestion .................................................................................. 2-6 2.2.8 Non-Potable Water System ...................................................................... 2-8
Section 3 Baseline Energy Use 3.1 Historical Data Analysis .......................................................................................... 3-1
3.1.1 Jacob Garabed Administration Building and Operations Building ... 3-1 3.1.2 Storage Building ........................................................................................ 3-4 3.1.3 Water Filtration Plant ............................................................................... 3-5 3.1.4 Independence Booster Station ................................................................. 3-6 3.1.5 Mt. Olive Booster Station ......................................................................... 3-7 3.1.6 Well #2 Snooks .......................................................................................... 3-9 3.1.7 Well #6 Heath .......................................................................................... 3-10 3.1.8 Well #8 Claremont .................................................................................. 3-11 3.1.9 Water Pollution Control Plant ............................................................... 3-12
3.2 Aggregate Costs ...................................................................................................... 3-13 3.3 Portfolio Manager ................................................................................................... 3-14 3.3.1 Portfolio Manager Overview ................................................................. 3-14 3.3.2 Energy Performance Rating ................................................................... 3-14 3.3.3 Portfolio Manager Account Information.............................................. 3-15

Table of Contents HMUA Draft Energy Audit Report
A ii E:\HMUA\EnergyAudit\Final Report\Table of Contents.doc
Section 4 Energy Conservation and Retrofit Measures (ECRM) 4.1 Water Treatment Plant and Pump Station ............................................................ 4-1 4.1.1 Off-Peak Pumping Ability ....................................................................... 4-1 4.1.2 Hydro-Electric Energy ............................................................................ 4-13 4.2 Water Pollution Control Plant .............................................................................. 4-17 4.2.1 Influent Pump Station ............................................................................. 4-17 4.2.2 Trickling Filter Recirculation Pump System ........................................ 4-20 4.2.3 Nitrification System and Controls ........................................................ 4-21 4.2.3.1 Design Conditions ............................................................... 4-22 4.2.3.2 Actual Current Conditions ................................................. 4-24 4.2.3.3 Nitrification System Improvement Alternatives ............. 4-25 4.2.3.4 Alternative No. 1: New Centrifugal Blowers ................... 4-26 4.2.3.5 Alternative No. 2: New Positive Displacement Blowers .................................................................................. 4-26 4.2.3.6 Alternative No. 3: New Turbo Blowers ............................ 4-26 4.2.4 Anaerobic Digestion System .................................................................. 4-28 4.2.4.1 Sludge Processing Alternatives ................................................. 4-28 4.2.4.2 Digester Mixing ........................................................................... 4-36 4.2.4.3 Insulation of Primary Digester Cover ...................................... 4-40 4.2.4.4 Technologies to Enhance Sludge Digestion ............................. 4-41 4.2.4.5 Cogeneration Technologies ........................................................ 4-45 4.2.5 Ultraviolet Disinfection System ............................................................. 4-51 4.2.6 Non-Potable Water System .................................................................... 4-53 4.3 Building HVAC Systems ....................................................................................... 4-55 4.3.1 Jacob Garabed Administration Building .............................................. 4-55 4.3.2 Operations Building ................................................................................ 4-57 4.3.3 Storage Building ...................................................................................... 4-58 4.3.4 Water Filtration Plant ............................................................................. 4-60 4.3.5 Independence Booster Station ............................................................... 4-61 4.3.6 Mt. Olive Booster Station ....................................................................... 4-62 4.3.7 Well No. 2 Snooks ................................................................................... 4-63 4.3.8 Well No. 4 ................................................................................................. 4-64 4.3.9 Well No. 6 Heath ..................................................................................... 4-65 4.3.10 Well No. 8 Claremont ............................................................................. 4-67 4.3.11 Water Pollution Control Plant Administration Building ................... 4-68 4.3.12 Water Pollution Control Plant Intermediate Pumping Station ......... 4-69 4.3.13 Water Pollution Control Plant Advanced Treatment Building ........ 4-70 4.4 Building Lighting Systems .................................................................................... 4-75 4.4.1 Jacob Garabed Administration Building .............................................. 4-75 4.4.2 Operations Building ................................................................................ 4-77 4.4.3 Storage Building ...................................................................................... 4-78 4.4.4 Water Filtration Plant ............................................................................. 4-79 4.4.5 Independence Booster Station ............................................................... 4-80

Table of Contents HMUA Draft Energy Audit Report
A iii E:\HMUA\EnergyAudit\Final Report\Table of Contents.doc
4.4.6 Mt. Olive Booster Station ....................................................................... 4-80 4.4.7 Well No. 2 Snooks ................................................................................... 4-80 4.4.8 Well No. 4 ................................................................................................. 4-81 4.4.9 Well No. Heath ........................................................................................ 4-81 4.4.10 Well No. 8 Claremont ............................................................................. 4-82 4.4.11 Water Pollution Control Plant Administration Building ................... 4-82 4.4.12 Water Pollution Control Plant Intermediate Pumping Station ......... 4-83 4.4.13 Water Pollution Control Plant Advanced Treatment Building ........ 4-84 4.4.14 Water Pollution Control Plant Digester Building ............................... 4-85 4.4.15 Water Pollution Control Plant Site Lighting ....................................... 4-85
4.5 Building Pump and Motor Systems ..................................................................... 4-86 4.5.1 Jacob Garabed Administration Building .............................................. 4-86 4.5.2 Operations Building ................................................................................ 4-86 4.5.3 Storage Building ...................................................................................... 4-86 4.5.4 Water Filtration Plant ............................................................................. 4-86 4.5.5 Independence Booster Station ............................................................... 4-86 4.5.6 Mt. Olive Booster Station ....................................................................... 4-87 4.5.7 Well No. 2 Snooks ................................................................................... 4-87 4.5.8 Well No. 4 ................................................................................................. 4-88 4.5.9 Well No. 6 Heath ..................................................................................... 4-88 4.5.10 Well No. 8 Claremont ............................................................................. 4-88 4.5.11 Water Pollution Control Plant Administration Building ................... 4-88 4.5.12 Water Pollution Control Plant Intermediate Pumping Station ......... 4-90 4.5.13 Water Pollution Control Plant Advanced Treatment Building ........ 4-90 4.5.14 Water Pollution Control Plant Digester Building ............................... 4-91 4.6 Solar Energy ............................................................................................................ 4-92
Section 5 Evaluation of Energy Purchasing and Procurement Strategies 5.1 Energy Deregulation ................................................................................................ 5-1 5.1.1 Alternate Third Party Electrical Energy Supplier ................................. 5-2
Section 6 Ranking of Energy Conservation and Retrofit Measures (ECRMs) 6.1 ECRMs ........................................................................................................................ 6-1 6.1.1 Water Treatment Plant and Pump Stations ........................................... 6-1 6.1.2 Water Pollution Control Plant ................................................................. 6-2 6.1.3 Building HVAC Components .................................................................. 6-4 6.1.4 Building Lighting Systems ....................................................................... 6-4 6.1.5 Motors ......................................................................................................... 6-5
Section 7 Available Grants, Incentives and Funding Sources 7.1 New Jersey Environmental Infrastructure Financing Program .......................... 7-1 7.1.1 Introduction ............................................................................................... 7-1 7.1.2 Projects Eligible for Funding ................................................................... 7-1

Table of Contents HMUA Draft Energy Audit Report
A iv E:\HMUA\EnergyAudit\Final Report\Table of Contents.doc
7.1.3 Financing through the EIFP ..................................................................... 7-1 7.1.4 Advantages of Borrowing through the EIFP ......................................... 7-2 7.1.5 EIFP Typical Program Schedule .............................................................. 7-2 7.2 New Jersey Clean Energy Program ......................................................................... 7-3 7.2.1 Introduction ............................................................................................... 7-3 7.2.2 Renewable Energy Incentive Program ................................................... 7-4 7.2.3 Renewable Energy Incentive Program Incentives ................................ 7-4 7.2.4 Participation Requirements for the Renewable Energy Incentive Program ...................................................................................................... 7-6 7.2.4.1 Determining Eligibility ................................................................ 7-6 7.2.4.2 Initial Application ........................................................................ 7-7 7.2.4.3 Final Application, Inspection and Up-front Incentive
Processing ................................................................................................... 7-7 7.2.4.4 Earning and Trading Renewable Energy Certificates ............. 7-8 7.2.5 New Jersey Solar Renewable Energy Certificate Program .................. 7-8 7.2.6 SREC Pricing .............................................................................................. 7-9 7.2.7 New Jersey Smart Start Program ............................................................ 7-9
Appendices Appendix A Historical Data Analysis Appendix B Influent Pump Station System Curve Appendix C Turbo Blowers- Equipment Cutsheet Appendix D Primary Sludge Data and Waste Activated Sludge Production Data Appendix E Digester Mixing Systems-Equipment Cutsheet Appendix F eQuest Model Results (Jacob Garabed Admin Bldg, WPCP Admin
Building, WPCP Advanced Treatment Building) Appendix G CHVAC Model Results (Operations Bldg) Appendix H Heat Loss Spreadsheet (Storage Building, Independence Booster Station,
Mt. Olive Booster Station, Well #2 Snooks, Well #4, Well #6 Heath, Well # 8 Claremont, WPCP Intermediate Pumping Station)
Appendix I Lighting Systems Modeling Results Appendix J Motor Master Energy Model Results Appendix K Mechanical Equipment Run Time Data Appendix L New Jersey Smart Start Incentive Worksheets Appendix M Engineers Opinion of Probable Construction Costs Appendix N Portfolio Manager Data

A E:\HMUA\EnergyAudit\Final Report\LOF.doc i
Figures
Figure 1-1 Energy Audit Phases ............................................................................................... 1-1 Figure 2-1 Effect of Detention Time and Initial Volatile Solids Content on Digester
Efficiency ................................................................................................................... 2-8 Figure 3-1 Jacob Garabed Admin Building/Operations Building Electrical Usage .......... 3-2 Figure 3-2 Jacob Garabed Administration Building Gas Usage ........................................... 3-3 Figure 3-3 Operations Building Gas Usage ............................................................................. 3-3 Figure 3-4 Storage Building Electrical Usage .......................................................................... 3-4 Figure 3-5 Storage Building Gas Usage ................................................................................... 3-5 Figure 3-6 Water Filtration Plant/Wells 4, 5 & 7 Electrical Usage ....................................... 3-6 Figure 3-7 Independence Booster Station Electrical Usage ................................................... 3-7 Figure 3-8 Mount Olive Booster Station Electrical Usage ..................................................... 3-8 Figure 3-9 Well #2 Snooks Electrical Usage ............................................................................ 3-9 Figure 3-10 Well #6 Heath Electrical Usage ............................................................................ 3-10 Figure 3-11 Well #8 Claremont Electrical Usage .................................................................... 3-11 Figure 3-12 Water Pollution Control Plant Electrical Usage ................................................. 3-12 Figure 4-1 Peak Day Demand Determination for the Water System ................................... 4-3 Figure 4-2 Peak Day Demand Flows for Water System for Peak Day of July 11, 2008 ..... 4-4 Figure 4-3 Existing Tank Level for Peak Day (July 11th) Flow Rate ..................................... 4-5 Figure 4-4 Model Results Assessing Off-Peak Pumping Capabilities at Peak Day
Demands ................................................................................................................... 4-8 Figure 4-5 Water Level in Main Tank if all 6 wells were switched to Day/Night Electrical
billing rate and Well 7 is run during the peak day hours ................................ 4-10 Figure 4-5a Peak Day Demand Determination for Mt. Olive Booster Station ................... 4-11 Figure 4-5b Peak Day Analysis for Mt. Olive Booster Station .............................................. 4-12 Figure 4-6 Schematic of Existing Water System with Generator ....................................... 4-13 Figure 4-7 Relationship between Measured Current and Pump Speeds .......................... 4-18 Figure 4-8 Representative Diurnal Flow Pattern .................................................................. 4-21 Figure 4-9 Schematic of a Typical Grease Digestion System .............................................. 4-33 Figure 4-10 Eimco Sonolyzer System Schematic .................................................................... 4-44 Figure 4-11 Jacob Garabed Administration Building Gas Use ............................................. 4-56 Figure 4-12 Jacob Garabed Admin Building Heating & Cooling Electricity Use .............. 4-57 Figure 4-13 Operations Building Heating ............................................................................... 4-58 Figure 4-14 Storage Building Heating ...................................................................................... 4-59 Figure 4-15 Independence Booster Station Heating ............................................................... 4-61 Figure 4-16 Mt. Olive Booster Station Heating ....................................................................... 4-62 Figure 4-17 Well #2 Heating ...................................................................................................... 4-64 Figure 4-18 Well #4 Heating ...................................................................................................... 4-65 Figure 4-19 Well #6 Heating ...................................................................................................... 4-66 Figure 4-20 Well #8 Heating ...................................................................................................... 4-67

List of Figures HMUA Draft Energy Audit Report
A ii
E:\HMUA\EnergyAudit\Final Report\LOF.doc
Figure 4-21 WPCP Administration Bldg Predicted Heating Energy Use ........................... 4-69 Figure 4-22 Advanced Treatment Building Predicted Heating Energy Use ...................... 4-71 Figure 4-23 Energy Savings – Energy Recovery Ventilators ................................................ 4-72 Figure 4-24 Fiscal Savings – Energy Recovery Ventilators ................................................... 4-73
A E:\HMUA\EnergyAudit\Final Report\LOT.doc i
Tables
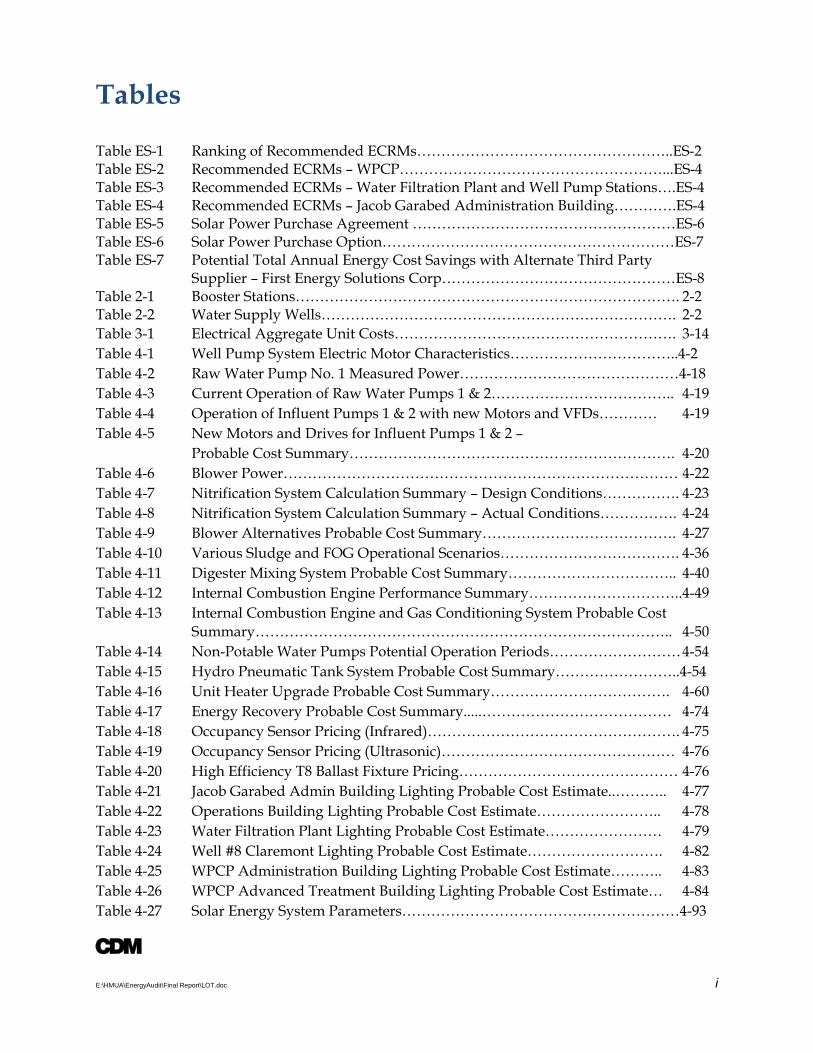
Table ES-1 Ranking of Recommended ECRMs……………………………………………..ES-2 Table ES-2 Recommended ECRMs – WPCP………………………………………………...ES-4 Table ES-3 Recommended ECRMs – Water Filtration Plant and Well Pump Stations….ES-4 Table ES-4 Recommended ECRMs – Jacob Garabed Administration Building………….ES-4 Table ES-5 Solar Power Purchase Agreement ………………………………………………ES-6 Table ES-6 Solar Power Purchase Option……………………………………………………ES-7 Table ES-7 Potential Total Annual Energy Cost Savings with Alternate Third Party Supplier – First Energy Solutions Corp…………………………………………ES-8 Table 2-1 Booster Stations……………………………………………………………………. 2-2 Table 2-2 Water Supply Wells………………………………………………………………. 2-2 Table 3-1 Electrical Aggregate Unit Costs…………………………………………………. 3-14 Table 4-1 Well Pump System Electric Motor Characteristics……………………………..4-2 Table 4-2 Raw Water Pump No. 1 Measured Power………………………………………4-18 Table 4-3 Current Operation of Raw Water Pumps 1 & 2……………………………….. 4-19 Table 4-4 Operation of Influent Pumps 1 & 2 with new Motors and VFDs………… 4-19 Table 4-5 New Motors and Drives for Influent Pumps 1 & 2 – Probable Cost Summary…………………………………………………………. 4-20 Table 4-6 Blower Power……………………………………………………………………… 4-22 Table 4-7 Nitrification System Calculation Summary – Design Conditions……………. 4-23 Table 4-8 Nitrification System Calculation Summary – Actual Conditions……………. 4-24 Table 4-9 Blower Alternatives Probable Cost Summary…………………………………. 4-27 Table 4-10 Various Sludge and FOG Operational Scenarios………………………………. 4-36 Table 4-11 Digester Mixing System Probable Cost Summary…………………………….. 4-40 Table 4-12 Internal Combustion Engine Performance Summary………………………….. 4-49 Table 4-13 Internal Combustion Engine and Gas Conditioning System Probable Cost
Summary………………………………………………………………………….. 4-50 Table 4-14 Non-Potable Water Pumps Potential Operation Periods……………………… 4-54 Table 4-15 Hydro Pneumatic Tank System Probable Cost Summary……………………..4-54 Table 4-16 Unit Heater Upgrade Probable Cost Summary………………………………. 4-60 Table 4-17 Energy Recovery Probable Cost Summary.....………………………………… 4-74 Table 4-18 Occupancy Sensor Pricing (Infrared)……………………………………………. 4-75 Table 4-19 Occupancy Sensor Pricing (Ultrasonic)………………………………………… 4-76 Table 4-20 High Efficiency T8 Ballast Fixture Pricing……………………………………… 4-76 Table 4-21 Jacob Garabed Admin Building Lighting Probable Cost Estimate..……….. 4-77 Table 4-22 Operations Building Lighting Probable Cost Estimate…………………….. 4-78 Table 4-23 Water Filtration Plant Lighting Probable Cost Estimate…………………… 4-79 Table 4-24 Well #8 Claremont Lighting Probable Cost Estimate………………………. 4-82 Table 4-25 WPCP Administration Building Lighting Probable Cost Estimate……….. 4-83 Table 4-26 WPCP Advanced Treatment Building Lighting Probable Cost Estimate… 4-84 Table 4-27 Solar Energy System Parameters…………………………………………………4-93

List of Tables HMUA Draft Energy Audit Report
A ii
E:\HMUA\EnergyAudit\Final Report\LOT.doc
Table 4-28 Simple Financial Analysis for Solar Energy Systems…………………………..4-94 Table 4-29 Eight Year SACP Maximum Schedule…………………………………………...4-95 Table 4-30 Simple Payback Analysis for a Solar Energy System…………………………..4-96 Table 5-1 First Energy Solutions Corp Proposal……………………………………………5-3 Table 5-2 Potential Energy Cost Savings during the Summer (May – Sept) with an
Alternate Third Party Supplier - First Energy Solutions Corp…………...……5-4 Table 5-3 Potential Energy Cost Savings during the Winter (Oct – April) with an Alternate Third Party Supplier – First Energy Solutions Corp………………..5-5 Table 6-1 Ranking of Energy Savings Measures – WPCP………………………………… 6-4 Table 6-2 Ranking of Energy Savings Measures – HVAC………………………………… 6-4 Table 6-3 Ranking of Energy Savings Measures – Electrical Lighting…………………...6-5 Table 6-4 Ranking of Energy Savings Measures – Electrical Motors……………………. 6-5 Table 7-1 EIFP Typical Program Schedule………………………………………………… 7-3 Table 7-2 Solar Electric Systems……………………………………………………………. 7-5 Table 7-3 Sustainable Biomass Systems……………………………………………………. 7-5

A ES-1
E:\HMUA\EnergyAudit\DraftRpt to TRC\Executive Summary_REV.doc
Executive Summary
As part of an initiative to reduce energy cost and consumption, the Hackettstown Municipal Utilities Authority (HMUA) has secured the services of Camp Dresser and McKee (CDM) to perform an energy audit for their wastewater treatment plant, water filtration plant, and remote well pumping stations in an effort to develop comprehensive Energy Conservation and Retrofit Measures (ECRMs).
CDM’s energy audit team visited the water filtration plant, pump stations and the wastewater treatment plant on February 5th and 6th, 2009. As a result of the site visits and evaluation of the historical energy usage of the facilities, CDM was successful in identifying various treatment processes and building system components that present feasible opportunities for energy savings measures.
CDM has also evaluated the potential for renewable energy technologies to be implemented at the Authority’s facilities to offset the Authority’s electrical energy usage. Specifically, the use of solar electric photovoltaic panels, hydro-electric power and combined heat and power co-generation systems such as micro-turbines and engine generators fueled by anaerobic digester gas were investigated.
In addition, CDM solicited proposals from third party electric energy suppliers to investigate additional energy cost savings that may be available to the Authority as a result of potential available reduced energy rates.
Not all ECRMs identified as a result of the energy audit are recommended. ECRMs must be economically feasible to be recommended to the Authority for implementation. The feasibility of each ECRM was measured through a simple payback analysis. The simple payback period was determined after establishing Engineer’s Opinion of Probable Construction Cost estimates, O&M estimates, projected annual energy savings estimates, and the potential value of New Jersey Clean Energy rebates, or Renewable Energy Credits, if applicable. ECRMs with a payback period of 20 years or less are recommended.
Recommended ECRMs
The following table, Table ES-1, presents the ranking of recommended ECRMs identified for treatment processes and equipment and various building system components at the wastewater and water treatment and pumping facilities. Additional ECRMs were identified and evaluated, as discussed in Section 4; however, were not recommended due to longer payback periods. Table ES-1 includes the Engineer’s Opinion of Probable Construction Cost, projected annual energy cost savings, projected annual energy usage savings, and total simple payback period for each recommended ECRM. The ECRMs are ranked based on their simple payback period.

Executive Summary
A ES-2
E:\HMUA\EnergyAudit\DraftRpt to TRC\Executive Summary_REV.doc
Table ES-1: Ranking of Recommended ECRM’s
Overall Ranking
(Based on Simple
Payback)
ECRM
Engineer’s Opinion of Probable
Construction Cost
Project Annual Energy Savings
(kW-hrs or gals of fuel
oil)
Projected Annual
Energy Cost Savings
Simple Payback Period (years)
Water Pollution Control Plant Process Improvements/Additions-(WPCP)
5 Main Sewage Pumps
1 & 2, Motor and VFDs
$114,000 378,505 $53,937 2
13 Digester Mixing System $318,000 65,350 $42,490(1) 9
16 New Turbo Blowers for Aeration System $817,000 463,550 $66,000 15
16 Internal Combustion Engine System(2) $1,000,000 692,484 $98,680 15
12 Insulation of Primary Digester Cover $30,000
1,430
(fuel oil) $3,720 8
HVAC Improvements- WPCP
6
Energy Recovery Ventilators for HV-3 System (Basement
Area)
$22,035 6,678
(fuel oil) $9,907 2.2
15 Energy Recovery
Ventilators for HV-2 System (GBT Area)
$22,035 1,090
(fuel oil) $1,617 13.6
Lighting Systems

Executive Summary
A ES-3
E:\HMUA\EnergyAudit\DraftRpt to TRC\Executive Summary_REV.doc
9 Jacob Garabed Admin Bldg –
Lighting Upgrade $12,330 13,330 $2,322 5
10 WPCP – Advanced
Trmt Bldg – Lighting Upgrade
$8,377 8,309 $1,184 6
11 WPCP – Admin Bldg – Lighting Upgrade $14,910 12,925 $1,841 7
14 Operations Bldg – Lighting Upgrade $5,100 2,440 $425 10
Electric Motor Replacements
1 WPCP – Intermediate
Pump, Motor Replacement
$1,511 19,530 $2,783 0.5
2
WPCP – Trickling Filter Recirculation
Pumps, Motor Replacement
$835 5290 $754 1.1
3 WPCP – Non-Potable Water Pumps, Motor
Replacement $555 3,040 $433 1.3
4 Water Filtration Plant
– High Lift Pump, Motor Replacement
$2,794 12,942 $1,988 1.4
7 Well # 2 – Pump, Motor Replacement $1,325 1,790 $319 4
7 Mount Olive Booster
Station – Pump, Motor Replacement
$3,166 3,910 $738 4
Note 1: Projected annual energy cost savings of $42,490 is broken down as $9,315 in annual electrical energy savings, $16,300 in annual sludge hauling costs, and $16,875 in equivalent fuel oil usage.

Executive Summary
A ES-4
E:\HMUA\EnergyAudit\DraftRpt to TRC\Executive Summary_REV.doc
Note 2: ECRM is recommended contingent upon installation of a digester mixing system for the primary digester and recording actual gas production upon placing mixing system into operation.
Tables ES-2, ES-3 and ES-4 summarize the Total Engineer’s Opinion of Construction Cost, annual energy savings, projected annual energy cost savings and average simple payback based on the implementation of all the recommended ECRMs at each of the Authority’s facilities.
Table ES-2: Recommended ECRM’s- WPCP(1)
Total Engineer’s Opinion of Probable
Construction Cost
Project Annual Energy Savings
(kW-hrs or gals of fuel oil)
Projected Annual Energy Cost
Savings
Average Simple Payback Period
(years)
$2,354,358.00 1,684,803 kw-hrs
9,198 gals. fuel oil
$273,167.00 elect.
$15,248.00 fuel oil
8.2
Note 1: Does not include energy savings associated with solar energy system.
Table ES-3: Recommended ECRM’s- Water Filtration Plant and Well Pump Stations
Total Engineer’s Opinion of Probable
Construction Cost
Project Annual Energy Savings
(kW-hrs)
Projected Annual Energy Cost
Savings
Average Simple Payback Period
(years)
$7,285.00 18,642 $8,059.00(1)
0.9
Note 1: Includes annual energy cost savings of $5,464.00 with no requirement for capital investment associated with operating the well pump systems on a Day/Night billing structure. Demand energy savings calculated to be 815 kW.
Table ES-4: Recommended ECRM’s- Jacob Garabed Administration Building
Total Engineer’s Opinion of Probable
Construction Cost
Project Annual Energy Savings
(kW-hrs)
Projected Annual Energy Cost
Savings
Average Simple Payback Period
(years)
$12,330 13,330 $2,322 5

Executive Summary
A ES-5
E:\HMUA\EnergyAudit\DraftRpt to TRC\Executive Summary_REV.doc
In addition to the process and building system component ECRMs presented above, CDM also evaluated the potential for the Authority to gain energy cost savings from the implementation of an off-peak pumping protocol at the water distribution well and booster pump stations.
Section 4.1.1 of the report evaluates the viability of off-peak pumping of production and booster pumping units in an effort to take advantage of the preferred energy rates during off-peak time periods. CDM performed an evaluation of the existing water system demands to determine the feasibility of the future implementation of an off-peak pumping protocol during peak day conditions. The peak day was selected as this represents the highest demand requirements upon the system, if the peak day demands can be met under an off-peak pumping protocol, all other lesser demands can also be met.
Based upon the comprehensive analyses described in Section 4.1.1, it was concluded that all 6 well pump systems can be operated during off-peak hours and still meet the systems peak demands. Consequently, the Authority would gain an estimated annual energy cost savings of $5,464.00 equating to an annual savings in demand energy usage of 815 kW, if all well pump stations were switched to a Day/Night billing structure. Furthermore, the analyses presented in Section 4.1.1 also concludes that based upon system demand and operational timeframes, it would not be feasible nor cost effective to place the Mount Olive and Independence Water Booster Stations on a Day/Night billing structure.
Renewable Energy Technologies
• Hydro-Electric Energy
Section 4.1.2 of the report evaluates the hydraulic characteristics of the existing reservoir system and water filtration plant to ensure that sufficient hydraulic energy and flow are available to produce electric energy through the installation of a hydro-electric power system and to determine if such an installation is cost effective based upon a simple payback analyses.
As a result of the evaluation, 71.5 feet of energy at a flow of 700 gallons per minute was determined to be available to operate a hydro-electric power system. The theoretical and actual power that can be generated with these hydraulic parameters are 9.4 kW and 7 kW, respectively, resulting in an annual electrical energy savings of 61,320 kW-hrs at an annual energy cost savings of $9,420 per year.
With an annual metered electric energy utilization by the water filtration plant and Well Numbers 4, 5, and 7 for the period ending October 6, 2008 of 1,331,200 kilowatt-hours at a total annual energy cost of $201,933.00 coupled with the fact that the

Executive Summary
A ES-6
E:\HMUA\EnergyAudit\DraftRpt to TRC\Executive Summary_REV.doc
Authority estimates to spend approximately $750,000 to repair the Lower Mine Hill Reservoir, the simple payback period was computed to be 86 years and therefore was concluded that the installation of a hydro-electric power system at the water filtration plant was not economically attractive.
• Solar Energy
Section 4.6 of the report discusses the feasibility of providing a solar energy system to be installed at the Jacob Garabed Administration Building, Operation Building, Storage Building, Water Filtration Plant, and Wastewater Treatment Plant. It was concluded that the only feasible location in terms of cost effectiveness and energy production for the installation of a solar energy system was at the Wastewater Treatment Plant. Section 4.6 provides for an economic evaluation of a solar energy facility to be installed at the wastewater treatment plant. Two options were considered in the evaluation. The first option evaluated the economic feasibility of a solar power purchase agreement whereby the Authority contracts with a solar panel system provider who assumes the capital costs associated with the furnishing and installation of the system including annual O&M costs and the Authority in turn pays the provider a rate for electrical energy production. The second option evaluated the economic feasibility associated with the Authority furnishing and installing a solar energy system under a typical construction contract and to assume full responsibility of the operation of such a system. For the Solar Power Purchase Agreement, the financial data is presented in Table ES-5:
Table ES-5: Solar Power Purchase Agreement
Power Purchase Providers DT Solar Solar Power Partners
Estimated Starting sPPA rate $0.11kWh $0.11kWh
Contract Term Length 15 Years 15 Years
Annual Escalator 2% 3.5%
System Size (W-dc) 961.2 kW 1000 kW
Annual Estimated Energy Production
1,097,565 kWh/yr. 1,289,600 kWh/yr.
2008 Average Utility Cost $/kWh
$0.1425 $0.1425

Executive Summary
A ES-7
E:\HMUA\EnergyAudit\DraftRpt to TRC\Executive Summary_REV.doc
Annual Utility Escalation est. 3% 3%
Estimated Utility Savings for Term of Contract
$3,603,300 $3,959,263
Table ES-6 presents the financial information for the Authority to furnish and install a solar power system:
Table ES-6: Solar Power Purchase Option
Parameter DT Solar
Estimated Budgetary Project Cost In 2009 Dollars
$8,040,000
1st Year Production 1,097,565 kWh
1st Year Electric Savings @ $0.1425/kWh
$39,101
1st Year Net Metering Revenue @ $0.11/kWh
$90,549
1st Year SREC Revenue @ $0.36/kWh
$395,123
Project Simple Payback 14 Years
Capitalizes Equipment Life 20 Years
Total Revenue based on 20 Year Project
$3,304,565
The plant’s current average electrical demand is approximately 200kW to 230kW per day; this coincides when the SEF will be producing most of the solar power as well. For simplification of the financial model, it is assumed 25% of the total power produced by the SEF will be consumed by the plant, this assumes that the solar system will be producing electricity at its rated designed output. This saves the plant the total cost of the power they would normally buy from the utility (the $0.1425 which equals $0.11/kWh cost of retail electricity, the transmission and other charges $0.0325/kWh) the remaining 75% of the power produced is sold back to the utility at just the retail electricity cost of $0.11/kWh.

Executive Summary
A ES-8
E:\HMUA\EnergyAudit\DraftRpt to TRC\Executive Summary_REV.doc
Based on the simple payback model, it has been concluded that it would benefit the Authority to further investigate the solar Power Purchase Agreement option. This is primarily based on the initial upfront capital investment required for a solar energy system installation and the long payback period of approximately 14 years associated with the solar power purchase option. Two major factors influencing the project financial evaluation is the variance of the prevailing energy market conditions and Solar Renewable Energy Credit (SREC) rates, with the largest impact to the simple payback model being the SREC credit pricing. SREC pricing for the last half of 2008 ranged from $308/MWh to a high of $419.5/MWh. For the simple payback model, a value of $360/MWh was used. The simple payback model did not take into account project finance charges, equipment depreciation or possible alternative finance methods to offset initial project costs.
Third Party Electric Energy Supplier
Energy deregulation in New Jersey increased the energy buyers’ options by separating the function of electricity distribution from that of electricity supply, by creating the opportunity to choose an electric energy supplier. As discussed in Section 5, CDM requested quotes for electric service from four approved third party suppliers. CDM received a proposal from First Energy Solutions Corp for service to the Mount Olive Booster Station, Well #6, the Water Filtration Plant and the Water Pollution Control Plant.
The following table, Table ES-7, summarizes the overall potential energy cost savings if service to Well #6, the Water Filtration Plant and the WPCP were supplied by First Energy Solutions as opposed to the current agreement with JCP&L. As discussed in Section 5.1.1, the proposed rate from First Energy Solutions for the Mount Olive Booster Station is not recommended.
Table ES-7: Potential Total Annual Energy Cost Savings with Alternate Third Party Supplier - First Energy Solutions Corp
Services 12 Month Estimated
kWH
Current Annual Cost with JCP&L
Proposed Annual
Cost with First Energy
Potential Annual Savings
Well #6, Water Filtration Plant and WPCP
3,588,710 $441,874 $312,592 $129,282

A 1-1
E:\HMUA\EnergyAudit\DraftRpt to TRC\Section 1.doc
Section 1 Introduction 1.1 General As part of an initiative to reduce energy cost and consumption, the Hackettstown Municipal Utilities Authority (HMUA) has secured the services of Camp Dresser and McKee (CDM) to perform an energy audit for their wastewater treatment plant, water filtration plant, and remote well and booster pumping stations in an effort to develop comprehensive energy conservation initiatives.
The performance of an Energy Audit requires a coordinated phased approach to identify, evaluate and recommend energy conservation and retrofit measures (ECRM). The various phases conducted under this Energy Audit included the following:
Gather preliminary data on all facilities;
Facility inspection;
Identify and evaluate potential ECRMs and evaluate renewable/distributed energy measures;
Develop the energy audit report.
Figure 1-1 is a schematic representation of the phases utilized by CDM to prepare the Energy Audit Report.
Figure 1-1: Energy Audit Phases

Section 1 Introduction
A 1-2
E:\HMUA\EnergyAudit\DraftRpt to TRC\Section 1.doc
1.2 Background The Hackettstown Municipal Utilities Authority (HMUA) is a Water and Sewer Authority providing service to five municipalities in the Hackettstown Area since 1965. The five municipalities include the Town of Hackettstown, Independence Township and Mansfield Township in Warren County and Mount Olive Township and Washington Township in Morris County.
The Water Utility includes six well supplies, two booster stations, and a surface water treatment facility rated at 1.0 MGD which is supplied by three reservoirs; the Upper Mine Hill, Lower Mine Hill and Burd Reservoirs, and 105 miles of water distribution mains. The Sewer Utility includes 95 miles of sanitary sewer collection system which transports wastewater for treatment at a Water Pollution Control Plant rated at an annual average flow of 3.3 MGD.
The Water Filtration Plant site includes the Water Filtration Plant and the Well Number 4 Building. The Water Filtration Plant provides for treatment of surface water from the three reservoirs previously mentioned to produce drinking water. Because of the high cost of operation, the Water Filtration Plant is normally operated only during the summer higher water use period. The Authority is considering discontinuing the Surface Water treatment system in favor of the well supplies.
The Hackettstown Water Pollution Control Plant (WPCP) is a two stage trickling filter wastewater treatment plant providing advanced secondary treatment and is located in Washington Township, Morris County NJ. The WPCP treats wastewater from the Town of Hackettstown, portions of Independence, Mansfield and Washington Townships. The plant operates under NJPDES Permit No. NJ0021369 and discharges directly to the Musconetcong River.
The wastewater treatment processes at the WPCP provide primary and secondary treatment for the removal of BOD5 and suspended solids in the wastewater flow. Primary treatment consists of influent screening, influent pumping, phosphorous removal and primary sedimentation. Secondary treatment consists of trickling filters, intermediate sedimentation, nitrification, final sedimentation, and UV disinfection. Solids handling at the plant consist of sludge thickening of waste and digested activated sludge and anaerobic sludge digestion and off-site disposal.
1.3 Purpose and Scope The objective of the energy audit is to identify energy conservation and retrofit measures to reduce energy usage and to develop an economic basis to financially validate the planning and implementation of identified energy conservation and retrofit measures.

Section 1 Introduction
A 1-3
E:\HMUA\EnergyAudit\DraftRpt to TRC\Section 1.doc
The HMUA water and wastewater treatment processes and facilities were originally designed to treat the wastewater and drinking water demand flow with limited consideration for energy consumption. At the time of the original design, process and capital cost considerations were given a higher priority. Currently, due to the rising costs of power and the desire to minimize dependence on foreign oil supplies, energy consumption is taking a higher priority across the nation. Wastewater treatment facilities can account for 40 – 60 percent of a municipality’s energy needs and surface water treatment facilities typically require more equipment for treatment requiring more energy, but greater potential for energy savings. In addition, significant energy savings may be available with retrofits to the buildings’ envelopes, heating and cooling systems and lighting systems. It should be noted that the magnitude of energy savings available is not only dependent on the type of treatment process and delivery systems in use, but also on the age and condition of the equipment and the capital available to implement major changes. Therefore, with the growing demands for electricity and the increased cost for this electricity, feasible alternatives for reducing energy consumption and operating costs must be evaluated for each wastewater and water treatment plant on a case-by-case basis. In water supply pumping, particularly in well systems, pumping units are conservatively sized for the peak day conditions, at the maximum drawdown. In actuality, these conditions only apply for a very small percentage of the operating times. So, for a good portion of time, the pumping units appear oversized. However, this is done intentionally in order to provide adequate water service for all of the customers.
The purpose of this energy audit is to identify the various critical processes and pumping systems within the wastewater treatment plant facility and water distribution system that are major consumers of electrical energy and are clear candidates for energy savings measures. In addition, potential energy producing systems such as a hydro-electric system to be located at the water treatment plant, combined heat and power co-generation and solar electric systems to be located at the water pollution control plant were also evaluated.
The existing process systems that have been identified for possible energy savings retrofits include the following:
Water Treatment Plant
Building HVAC Systems;
Building Lighting Systems;
On-Peak verses Off-Peak Pumping Operation of Well Pump Stations.
Use of Variable Frequency Drives

Section 1 Introduction
A 1-4
E:\HMUA\EnergyAudit\DraftRpt to TRC\Section 1.doc
Water Pollution Control Plant
Influent Pump Station;
Trickling Filter Recirculation Pump System;
Aeration System and Controls;
Anaerobic Digestion System;
Ultraviolet Disinfection System;
Non-Potable Water System;
Building HVAC Systems;
Building Lighting Systems.
A feasibility analysis of providing a combined heat and power co-generation system and a Solar Energy system at the wastewater treatment plant as well as a hydro-electric system at the water filtration plant was conducted. A discussion on these technologies is included in Section 4 Energy Conservation and Retrofit Measures (ECRM).
In addition to identifying ECRMs and the potential for on-site energy generation, alternate third party suppliers were contacted in an effort to identify further cost savings available for the Authority, by switching service providers. This is discussed further in Section 5.

A 2-1
E:\HMUA\EnergyAudit\DraftRpt to TRC\Section 2.doc
Section 2 Facility Description
2.1 Water Supply and Distribution System 2.1.1 Water Filtration Plant The existing water filtration plant receives its water supply from two reservoirs; the Burd Reservoir and the Lower Mine Hill Reservoir. A third reservoir, the Upper Mine Hill Reservoir, provides storage and overflows into the Lower Mine Hill Reservoir to provide a source of water supply and to prevent siltation from occurring in the Lower Mine Hill Reservoir. Water from the Lower Mine Hill and Burd Reservoirs exits the reservoirs and flows by gravity to the water filtration plant where it is stored in the Raw Water Chamber prior to treatment. Flow control from the reservoirs to the Raw Water Chamber is through an altitude valve that is located on the chamber’s supply pipeline immediately upstream of the chamber.
From the Raw Water Chamber, water flows by gravity to two solid contact units where heavy solids and sludge are allowed to settle. Provisions for pre-chlorinating the water as it exits the Raw Water Chamber have been provided. Settled solids are then conveyed by gravity to a wastewater pump station and ultimately conveyed to the wastewater treatment facility for treatment. Provisions for liquid alum and lime have been provided for the solid contact units to aid in solid removal and pH and alkalinity adjustment.
From the solid contact units, water flows by gravity to two sand filter units and to the Clearwell/Chlorine Contact Tank where the water is chlorinated prior to being conveyed to the distribution system’s storage tank via two high lift pumps.
Because of the high cost of operation, the Water Filtration Plant is normally only operated during the summer higher water use period. The Authority is considering discontinuing the Surface Water treatment system in favor of the well supplies.
2.1.2 Pump Stations The Booster Pump stations include the Mt. Olive Booster station and the Independence Water Booster Station. These Booster Stations are operated based upon the associated tank levels and are used instead of reducing valves between the service areas.
The Independence Water Booster Station is approximately 567 square feet, and includes two constant speed 60 hp water booster pumps with a standby emergency generator. This station operated for 760 hours in 2008.

Section 2 Facility Description
2-2 E:\HMUA\EnergyAudit\DraftRpt to TRC\Section 2.doc
The Mount Olive Booster Station is approximately 628 square feet and includes two constant speed, 75 hp water booster pumps and a standby emergency generator. This Booster Station operated for 3,240 hours in 2008.
Table 2-1 summarizes the characteristics associated with the booster stations.
Table 2-1: Booster Stations
Booster Station.
No. of Pumps
Motor hp Drive Hours of Operation
Independence Water Booster
Station
2 60 Constant Speed
760/year
Mount Olive Water Booster
Station
2 75 Constant Speed
3,240/year
2.1.3 Water Supply Wells Table 2-2 summarizes the characteristics of the water supply wells:
Table 2-2: Water Supply Wells
Well No. No. of Pumps
Motor hp Drive Hours of Operation
2- Snooks 1 15 Constant Speed
2,300/year
4 1 30 VFD 53/year
5 1 125 VFD 2,530/year
6- Heath 1 100 Constant Speed
8,760/year
7 1 175 VFD 6,720/year
8- Claremont See Note 1
Note 1: Well 8 is presently out of service due to redrilling, and the new capacity of the well has not yet been determined.

Section 2 Facility Description
2-3 E:\HMUA\EnergyAudit\DraftRpt to TRC\Section 2.doc
2.1.4 Tanks The main storage tank for the system is a 2.4 million gallon Main Water Storage Tank. This tank is a welded steel ground storage tank with a 100ft inside diameter, a 41ft sheet height and 2,400,000 gallons nominal capacity. The minimum water line elevation is 763.33 (top of silt stop). There is an overflow cone assembly at elevation 80.4 ft. All six groundwater supply wells (Well Numbers 2, 4, 5, 6, 7, and 8), pump into the distribution system and feed the main tank through the system.
There is also a 1.0 million gallon tank connected to the main distribution system. This tank provides fire protection for M&M/ MARS Corporation. When this tank’s water elevation drops in level, flow from Well Number 2 is redirected into the 1.0 MG tank to fill it. Although Well Number 2 is used to fill the 1.0 MG tank, it is normally used to pump into the main distribution system to the Main Water Storage Tank (2.4 MG tank).
2.2 Water Pollution Control Plant The Hackettstown Municipal Utilities Authority (HMUA) owns and operates a Water Pollution Control Plant (WPCP) located on Esna Drive in Washington Township, Morris County, New Jersey. The HMUA WPCP treats wastewater from the Town of Hackettstown and portions of the surrounding municipalities of Independence, Mansfield and Washington Townships. Sections of Mt. Olive and Allamuchy Township are also within the HMUA service area, although no connections to the Authority's sewer system presently exist in these communities. The plant operates under NJPDES Permit No. NJ0021369, is rated at an annual average flow of 3.3 MGD and discharges directly to the Musconetcong River. The existing treatment plant utilizes the Trickling Filter/Activated Sludge Process. The primary clarifiers and trickling filters are arranged such that the trickling filters operate in parallel and serve as treatment units for the reduction of BOD5 from the raw wastewater prior to entering the nitrification tanks. The nitrification tanks are located downstream of the trickling filters whose primary function is for the removal of ammonia from the raw wastewater. Final clarifiers follow the nitrification tanks for settling of mixed liquor suspended solids created in the nitrification tanks. Chemical addition using aluminum sulfate (alum) is used to remove phosphorus from the wastewater. Alum can be introduced at two points in the treatment process: into the raw wastewater at the inlet facilities and into the effluent from the nitrification tanks.
2.2.1 Inlet Facilities The inlet facilities consist of one 36-inch comminutor that is rated for a peak flow rate of 10 MGD, a bypass bar screen and an 18-inch Parshall flume for influent flow measurement. Liquid alum can be added at the inlet facilities to facilitate the removal of phosphorus within the primary clarifiers.

Section 2 Facility Description
2-4 E:\HMUA\EnergyAudit\DraftRpt to TRC\Section 2.doc
2.2.2 Influent Pump Station Sewage leaving the inlet facilities flows by gravity to a wet well located in the Administration Building. At this location, three pumps transfer the raw sewage to a division box (Number 1) upstream of the primary clarifiers. The three raw sewage pumps have the capacity to pump the projected peak flow rate with one pump out of service. The division box has two weirs that allow an even split of the raw sewage to the primary clarifiers. A raw sewage transfer pipe between Division Box 1 and Division Box 2 allows the biological oxygen demand (BOD) to be increased at the nitrification tank anoxic zones if desired.
2.2.3 Primary Clarifiers and Trickling Filters The primary clarifiers are 65 feet in diameter with 7.0 feet of sidewater depth. The primary clarifiers are equipped with mechanical sludge removal and scum removal mechanisms. Primary clarifier effluent is transferred by gravity to the trickling filters and then to the intermediate clarifiers. There are two parallel trains of primary clarifier/trickling filter/intermediate clarifier combinations. Trickling Filter #1 is 105 feet in diameter with 6.75 feet of stone media while Trickling Filter #2 is 100 feet in diameter with 6.0 feet of stone media. Recirculation pumps (two units, each with a capacity of 2.0 mgd) allow plant effluent water to be transferred back to the trickling filters in order to keep the media wet and for the proper operation of the trickling filter distribution mechanisms. Primary sludge can be conveyed either to the anaerobic digester complex or to the sludge thickening facilities through the use of primary sludge pumps located in the basement of the digester complex.
2.2.4 Intermediate Clarifiers and Pump Station Clarifier #1 is 55 feet in diameter with 7.0 feet of sidewater depth while Intermediate Clarifier #2 is 70 feet in diameter with 8.0 feet of sidewater depth.
The effluent from the intermediate clarifiers is then combined and flows by gravity to the intermediate pumping station. Sludge settled in the clarifiers is discharged manually to the raw sewage wet well. The sludge is then pumped to the head of the treatment plant and co- settled with solids from the raw sewage in the primary clarifiers.
The pump station is equipped with three vertically-mounted, 25 hp centrifugal sewage pumps (2 duty, 1 standby). The intermediate pumps are driven by variable frequency drives which adjust the pump speed automatically in response to changes in the wet well water surface level. The intermediate pump station force main discharges into division box number 2 that is located adjacent to the one of the intermediate clarifiers. The division box is equipped with two fixed weirs for splitting of the intermediate clarifier effluent to the two nitrification reactors.
It is also possible to introduce digester supernatant and/or raw sewage to division box number 2. In this manner, supplemental BOD5 can be added to the nitrification

Section 2 Facility Description
2-5 E:\HMUA\EnergyAudit\DraftRpt to TRC\Section 2.doc
reactor as required in order to insure a more stable mixed liquor suspended solids concentration within the reactors. The introduction of raw sewage or digester supernatant to the division box can be conducted manually through the use of telescoping valves.
2.2.5 Nitrification Tanks and Final Clarifiers The nitrification reactors are 180 feet long by 25 feet wide by 15 feet sidewater depth. The first 25 feet of each reactor is baffled and functions either as an aerobic nitrification zone or an anoxic denitrification zone. The three, 10 hp internal recycle pumps (2 duty, 1 standby) can transfer mixed liquor from the end of the nitrification tank to the anoxic zone. There are two, 10 hp submersible mixers that keep the anoxic zone mixed when no air is supplied to the zone.
The conversion of TKN and ammonia to nitrate takes place in the nitrification tanks. In addition, residual BOD5 from the trickling filters is also reduced in the nitrification tanks. The addition of liquid caustic and alum for alkalinity supplementation and polishing for phosphorus removal is also incorporated in these tanks. The hydraulic retention time for the nitrification tanks based on forward flow is approximately 7.3 hours. The blowers for supplying air to the diffused aeration system are housed in the Advanced Treatment Building located directly adjacent to the nitrification tanks. Four, 125 hp centrifugal blowers are installed and their sizing is such that the maximum projected dissolved oxygen demand can be met with one unit out of service. The nitrification tanks are equipped with submerged diffused aeration equipment for supplying dissolved oxygen to the mixed liquor within the tanks. The diffusers are mounted on retractable swing arms such that they can be raised above the liquid surface within the tanks for maintenance and inspection. Return sludge from the final clarifiers is conveyed to the head end of the nitrification tanks via 10 hp variable speed pumps (2 duty, 1 standby).
Effluent from the nitrification tanks is transferred by gravity to the two final clarifiers. The final clarifiers are 80 feet in diameter by 16 feet sidewater depth. The final clarifiers are equipped with an enlarged center well with mechanical flocculating mechanisms to promote the effectiveness of the chemical precipitation of phosphorus. The clarifiers are equipped with rapid sludge removal mechanisms. Return sludge pumps located within the basement of the Advanced Treatment Building draw sludge from the clarifiers and return it to the head end of the nitrification tanks. Sludge is wasted from the final clarifiers to a pre-thickened sludge wet well located at the exterior of the Advanced Treatment Building. Sludge is wasted manually from the final clarifiers through the use of telescoping valves located within the pre-thickened sludge wet well. Effluent from the final clarifiers is transferred by gravity to the ultraviolet disinfection unit. The effluent from the two clarifiers is combined at a manhole and it is possible to adjust the pH through the use of sulfuric acid prior to the disinfection reactor.

Section 2 Facility Description
2-6 E:\HMUA\EnergyAudit\DraftRpt to TRC\Section 2.doc
2.2.6 Ultraviolet Disinfection A substantial break in grade exists between the final clarifiers and the disinfection units. The break in grade is used for step cascade aeration of the final clarifier effluent. The existing four bay chlorine contact tank has been modified to serve as a post aeration and ultraviolet disinfection facility; however, post aeration is currently not used. Two of the old chlorine contact bays have been equipped with submerged diffusers for the introduction of dissolved oxygen (DO) as required to meet the DO requirements contained in the discharge permit. The post aeration blowers have been sized such that one unit will supply the normal dissolved oxygen requirements and two units operating in parallel will be required for maximum temperature days. Each post aeration blower has a 10 hp motor.
The Ultraviolet Disinfection System consists of two channels, each with two banks of bulbs. A third channel serves as a bypass channel. Each bank consists of 9 modules with 8 lamps each for a total of 288 lamps. Flow through the bank is parallel to the lamp orientation. The banks are controlled and monitored by a PLC located in the Power Distribution Center, into which the main power supply is fed. The system is rated for a peak instantaneous flow of 7.2 MGD. The banks are energized based on flow pacing. An input flow signal from 0 to 3.6 MGD will energize the lead bank in each channel and the lead and lag bank will be energized under a flow condition between 3.6 to 7.2 MGD. To prevent frequent on/off cycling due to flow variations, the banks are timed off for a 15 minute (adjustable) cycle.
2.2.7 Anaerobic Digestion The anaerobic digester system consists of a primary and a secondary digester configured in a two-stage digestion system. In this configuration, the primary digester (high-rate digester) is coupled in series with a second digestion tank. The contents of the primary digester is heated and was originally equipped with a draft tube mixing system to facilitate volatile solid destruction, gas production and to avoid grit and sludge accumulation in order to maintain usable digester volume. The secondary digester is used for the storage and concentration of digested sludge and for the formation of a relatively clear supernatant. Piping within the digester complex allows the contents of the secondary digester to be heated, however, mixing of the secondary digester was not provided.
The primary digester is 50 feet in diameter with 27 feet side water depth resulting in a usable volume of 53,000 cubic feet. The corresponding secondary digester is also 50 feet in diameter but has a 24.5 feet side water depth resulting in a usable volume of 48,100 cubic feet.
Initially, the primary digester was equipped with a draft tube mixing system. This system has been subsequently removed from operation and minimal mixing is provided through the sludge heating system via the sludge recirculation pump and a grease recirculation pump located near the water surface of the primary digester.
Section 2 Facility Description
2-7 E:\HMUA\EnergyAudit\DraftRpt to TRC\Section 2.doc
The sludge heating system consists of a dual fuel boiler that can fire on either fuel oil or methane gas rated at 660,000 BTU/hr, a spiral heat exchanger rated at 580,000 BTU/hr and a 5 hp recirculation pump rated at 115 gpm.
Under current operational protocol, primary sludge is conveyed to the primary digester and waste activated sludge is conveyed to the Pre-thickened Sludge Wet Well where it is thickened to approximately 6% solids through a gravity belt thickener and then conveyed to the primary digester. Provisions have been made at the last plant upgrade (Contract No. 17) to convey primary sludge directly to the Pre-thickened Sludge Wet Well for thickening the sludge prior to its introduction into the primary digester.
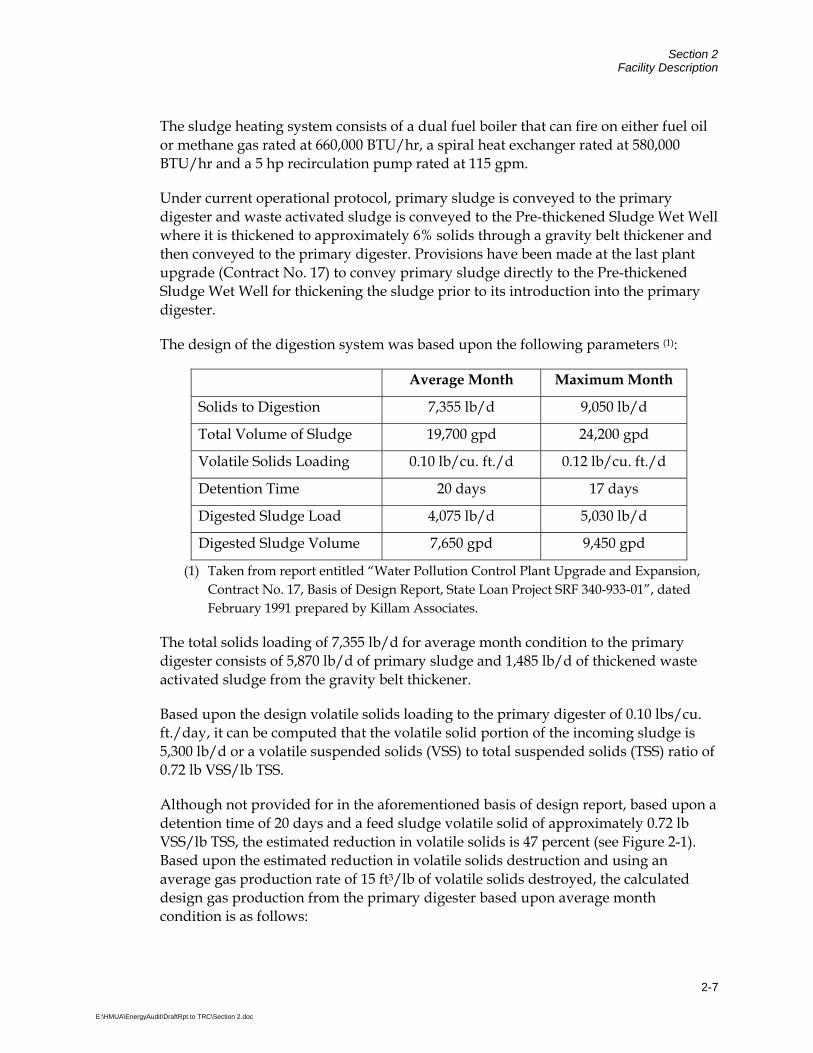
The design of the digestion system was based upon the following parameters (1):
Average Month Maximum Month
Solids to Digestion 7,355 lb/d 9,050 lb/d
Total Volume of Sludge 19,700 gpd 24,200 gpd
Volatile Solids Loading 0.10 lb/cu. ft./d 0.12 lb/cu. ft./d
Detention Time 20 days 17 days
Digested Sludge Load 4,075 lb/d 5,030 lb/d
Digested Sludge Volume 7,650 gpd 9,450 gpd
(1) Taken from report entitled “Water Pollution Control Plant Upgrade and Expansion, Contract No. 17, Basis of Design Report, State Loan Project SRF 340-933-01”, dated February 1991 prepared by Killam Associates.
The total solids loading of 7,355 lb/d for average month condition to the primary digester consists of 5,870 lb/d of primary sludge and 1,485 lb/d of thickened waste activated sludge from the gravity belt thickener.
Based upon the design volatile solids loading to the primary digester of 0.10 lbs/cu. ft./day, it can be computed that the volatile solid portion of the incoming sludge is 5,300 lb/d or a volatile suspended solids (VSS) to total suspended solids (TSS) ratio of 0.72 lb VSS/lb TSS.
Although not provided for in the aforementioned basis of design report, based upon a detention time of 20 days and a feed sludge volatile solid of approximately 0.72 lb VSS/lb TSS, the estimated reduction in volatile solids is 47 percent (see Figure 2-1). Based upon the estimated reduction in volatile solids destruction and using an average gas production rate of 15 ft3/lb of volatile solids destroyed, the calculated design gas production from the primary digester based upon average month condition is as follows:

Section 2 Facility Description
2-8 E:\HMUA\EnergyAudit\DraftRpt to TRC\Section 2.doc
7,355 lb/d x 0.72 lb VSS/lb TSS x 0.47 x 15 ft3 /lb of VSS destroyed = 37,340 ft3/day.
The design sludge heating requirements based upon mesophillic digestion operation at maximum month solid loading condition is computed to be as follows:
Heating Load = 24,200 gpd x (1 BTU/LB-°F) x 8.34 lb/gal x (95°F – 50°F) = 9,082,260 Btu/day or 378,430 Btu/hr.
For estimating purposes, assume a sludge temperature loss of 10 degree F/day, the estimated heat loss is computed to be as follows:
Heat Loss = 53,000 ft3 x 62.4 lb/ft3 x (1 BTU/LB-°F) x 1°F/day = 3,307,200 Btu/day or 137,800 Btu/hr.
Therefore, the total design heat load is computed to be 378,430 Btu/hr + 137,800 Btu/hr = 516,230 Btu/hr.
Figure 2-1: Effect of Detention Time and
Initial Volatile Solids Content on Digester Efficiency
2.2.8 Non-Potable Water System The non-potable water system for the HMUA WPCP consists of twin 100 gpm, 7.5 hp service water pumps. The pumps are located in the basement of the existing

Section 2 Facility Description
2-9 E:\HMUA\EnergyAudit\DraftRpt to TRC\Section 2.doc
Administration Building and take their suction from the effluent end of the ultraviolet disinfection facilities. Non-potable water is required for seal water of pumps in the Administration Building and in the Advanced Treatment Building, for a spray water system at the nitrification tanks, as carry water for alum distribution and for the gravity belt thickener belt wash system. The non-potable water system also serves several yard hydrants adjacent to all facilities for plant maintenance purposes.

A 3-1 E:\HMUA\EnergyAudit\DraftRpt to TRC\Section 3_updated.doc
Section 3 Baseline Energy Use
3.1 Historical Data Analysis The first step in the energy audit process is the compilation and quantification of the facilities current and historical energy usage and associated utility costs. It is important to establish the existing patterns of electric, gas and fuel oil usage in order to be able to identify areas in which energy consumption can be reduced.
For this study, monthly utility bills were analyzed and unit costs of energy obtained. The unit cost of energy, as determined from the monthly utility bills, was utilized in determining the feasibility of switching from one energy source to another or reducing the demand on that particular source of energy to create annual cost savings for the Authority.
It was also important to understand how the utilities charge for the service. For water and wastewater treatment plants, the majority of the energy consumed is electric. Electricity is charged by three basic components: electrical consumption (kWH), electrical demand (kW) and power factor (kVAR) (reactive power). The cost for electrical consumption is similar to the cost for fuel oil, the monthly consumption appears on the utility bill as kWH consumed per month with a cost figure associated with it. In this case, the Authority is billed with a flat rate for consumption or a day / night service rate, as explained in Section 3.1.3.
Electrical demand can be as much as 50 percent or more of the electric bill. The maximum kW value during the billing period is multiplied by the demand cost factor and the result is added to the electric bill. It is often possible to decrease the electric bill by 15 – 25 percent by reducing the demand, while still using the same amount of energy.
The power factor (reactive power) is the power required to energize electric and magnetic fields that result in the production of real power. Power factor is important because transmission and distribution systems must be designed and built to manage the need for real power as well as the reactive power component (the total power). If the power factor is low, then the total power required can be greater than 50 percent or more than the real power alone. The power factor charge is a penalty for having a low power factor. This penalty is placed on the Water Pollution Control Plant each month.
The other parts of the electric bill are the supply charges, delivery charges, system benefits, transmission revenue adjustments, state and municipality tariff surcharges and sales taxes.
3.1.1 Jacob Garabed Administration Building and Operations Building
Power for the Jacob Garabed Admin Building and the Operations Building is fed from the same General Secondary Service line from the Jersey Central Power and Light Company (JCP&L). JCP&L is currently the Authorities supplier and distributer of electric energy. This will be discussed further in Section 4.

Section 3 Baseline Energy Use
A 3-2 E:\HMUA\EnergyAudit\DraftRpt to TRC\Section 3_updated.doc
Figure 3-1 illustrates the average monthly total energy consumption from January 2006 through December 2008. For example, for the month of January, the bar graph represents average energy consumption for January 2006, January 2007 and January 2008. The same graph representation approach has been carried through for all months and is typical for all graphs presented in this Section. Electrical usage has been averaged by month for the three year time period to portray a more encompassing monthly usage trend. From this graph, it can be determined that the electrical baseline consumption averages around 2600 kWH / month, with consumption increasing during the summer months as a result of cooling.
These buildings are billed using a flat rate kWH charge based on JCP&L’s current tariff rates. Demand charges for these buildings are calculated using either 100 percent of the demand for the current month, or using the highest demand usage from any of the previous 12 months.
Figure 3-1: Jacob Garabed Admin Building/Operations Building Electrical Usage
The current tariff rates for General Secondary Service from JCP&L are as follows:
Basic Generation Service: $0.114150/KWH Non-Utility Generation Charges: $0.016958/KWH Societal Benefits Charges: $0.003222/KWH Delivery Service Charges: $0.032379/KWH System Control Charge: $0.000079/KWH
Demand Charges: $3.16/KW Refer to Table 3-1, in Section 3.2, for average electrical aggregate cost. These tariffs are subject to change quite frequently. For the most up to date tariffs, refer to JCP&L’s website. Refer to Appendix A for complete Historical Data Analysis.

Section 3 Baseline Energy Use
A 3-3 E:\HMUA\EnergyAudit\DraftRpt to TRC\Section 3_updated.doc
Heating systems for both buildings are fueled by natural gas. Figure 3-2 illustrates the Jacob Garabed Administration Building average monthly natural gas consumption from January 2006 through December 2008. Figure 3.3 illustrates the Operations Building average monthly natural gas consumption from January 2006 through December 2008. Similar to electric usage, gas usages have been averaged by month for the three year time period to portray a more encompassing monthly usage trend.
Figure 3-2: Jacob Garabed Administration Building Gas Usage
Figure 3-3: Operations Building Gas Usage
Recent utility bills indicate a flat rate of $1.634 per therm billed for both buildings. For more on the building gas usage, refer to Section 4.3.

Section 3 Baseline Energy Use
A 3-4 E:\HMUA\EnergyAudit\DraftRpt to TRC\Section 3_updated.doc
3.1.2 Storage Building
Power for the Storage Building is fed from a General Secondary Service line from JCP&L. Figure 3-4 illustrates the Storage Building’s average monthly consumption from January 2006 through December 2008. In this case, the baseline energy consumption is less than 5 kWH per month. The baseline consumption of electrical energy within the Storage Building is from light fixtures.
This building is billed using a flat rate KWH charge based on JCP&L’s current tariff rates. There have been no demand charges placed on this building in the past three years.
Figure 3-4: Storage Building Electrical Usage
The current tariff rates for General Secondary Service from JCP&L are as follows:
Basic Generation Service: $0.114444/KWH Non-Utility Generation Charges: $0.016667/KWH Societal Benefits Charges: $0.003333/KWH Delivery Service Charges: $0.061111/KWH Refer to Table 3-1, in Section 3.2, for average electrical aggregate cost. These tariffs are subject to change quite frequently. For the most up to date tariffs, refer to JCP&L’s website. Refer to Appendix A for complete Historical Data Analysis.
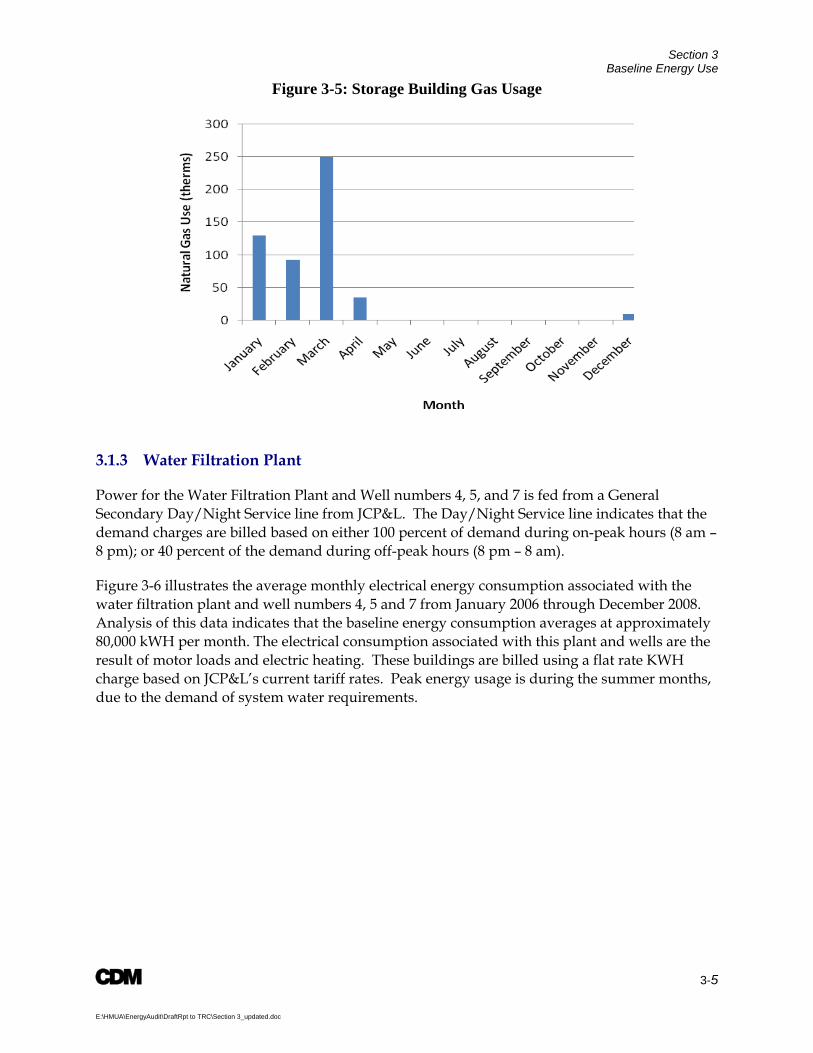
The building heating system is fueled by natural gas. Figure 3-5 illustrates the building average monthly natural gas consumption from January 2006 through November 2008. Recent utility bills indicate a flat rate of $1.634 per therm billed. For more on the building gas usage, refer to Section 4.3.
Section 3 Baseline Energy Use
A 3-5 E:\HMUA\EnergyAudit\DraftRpt to TRC\Section 3_updated.doc
Figure 3-5: Storage Building Gas Usage
3.1.3 Water Filtration Plant
Power for the Water Filtration Plant and Well numbers 4, 5, and 7 is fed from a General Secondary Day/Night Service line from JCP&L. The Day/Night Service line indicates that the demand charges are billed based on either 100 percent of demand during on-peak hours (8 am – 8 pm); or 40 percent of the demand during off-peak hours (8 pm – 8 am).
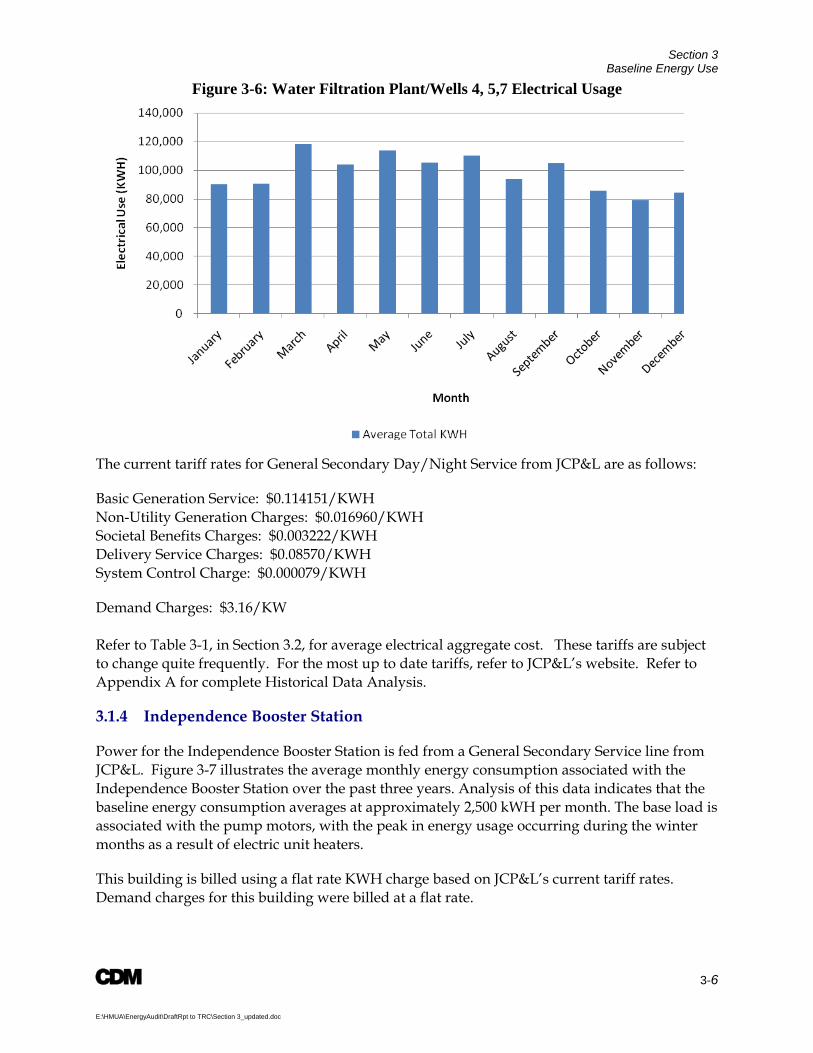
Figure 3-6 illustrates the average monthly electrical energy consumption associated with the water filtration plant and well numbers 4, 5 and 7 from January 2006 through December 2008. Analysis of this data indicates that the baseline energy consumption averages at approximately 80,000 kWH per month. The electrical consumption associated with this plant and wells are the result of motor loads and electric heating. These buildings are billed using a flat rate KWH charge based on JCP&L’s current tariff rates. Peak energy usage is during the summer months, due to the demand of system water requirements.
Section 3 Baseline Energy Use
A 3-6 E:\HMUA\EnergyAudit\DraftRpt to TRC\Section 3_updated.doc
Figure 3-6: Water Filtration Plant/Wells 4, 5,7 Electrical Usage
The current tariff rates for General Secondary Day/Night Service from JCP&L are as follows:
Basic Generation Service: $0.114151/KWH Non-Utility Generation Charges: $0.016960/KWH Societal Benefits Charges: $0.003222/KWH Delivery Service Charges: $0.08570/KWH System Control Charge: $0.000079/KWH
Demand Charges: $3.16/KW Refer to Table 3-1, in Section 3.2, for average electrical aggregate cost. These tariffs are subject to change quite frequently. For the most up to date tariffs, refer to JCP&L’s website. Refer to Appendix A for complete Historical Data Analysis.
3.1.4 Independence Booster Station
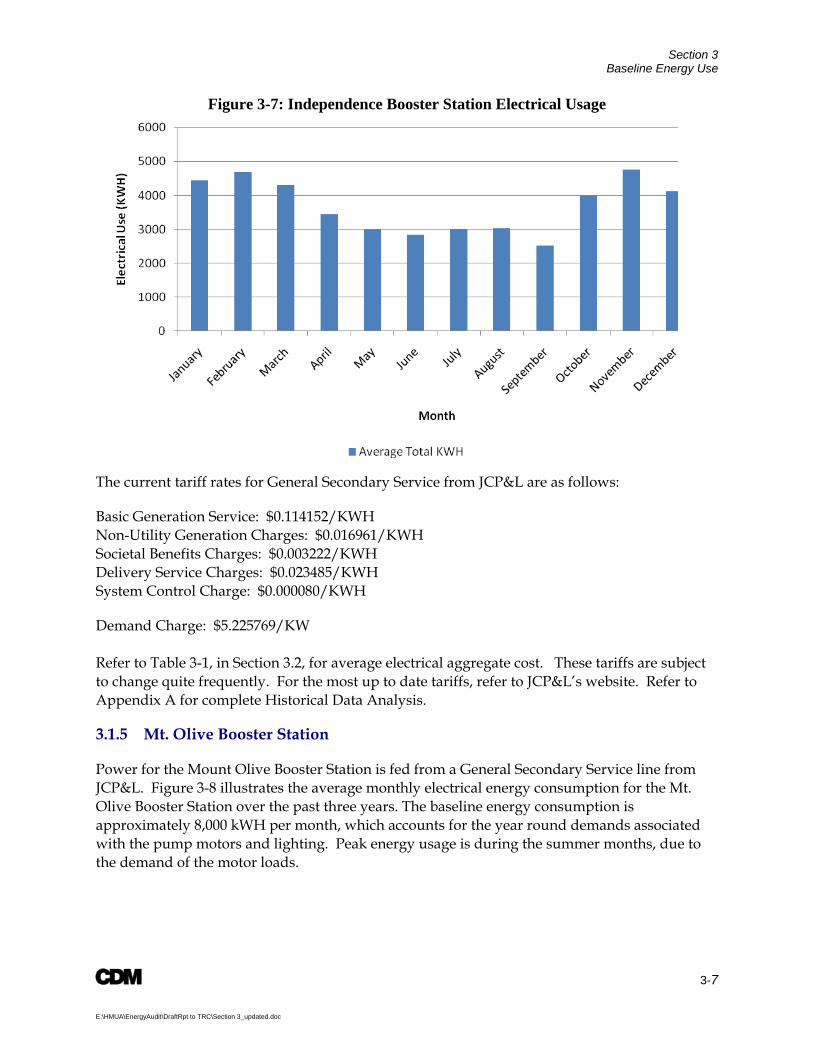
Power for the Independence Booster Station is fed from a General Secondary Service line from JCP&L. Figure 3-7 illustrates the average monthly energy consumption associated with the Independence Booster Station over the past three years. Analysis of this data indicates that the baseline energy consumption averages at approximately 2,500 kWH per month. The base load is associated with the pump motors, with the peak in energy usage occurring during the winter months as a result of electric unit heaters.
This building is billed using a flat rate KWH charge based on JCP&L’s current tariff rates. Demand charges for this building were billed at a flat rate.
Section 3 Baseline Energy Use
A 3-7 E:\HMUA\EnergyAudit\DraftRpt to TRC\Section 3_updated.doc
Figure 3-7: Independence Booster Station Electrical Usage
The current tariff rates for General Secondary Service from JCP&L are as follows:
Basic Generation Service: $0.114152/KWH Non-Utility Generation Charges: $0.016961/KWH Societal Benefits Charges: $0.003222/KWH Delivery Service Charges: $0.023485/KWH System Control Charge: $0.000080/KWH
Demand Charge: $5.225769/KW Refer to Table 3-1, in Section 3.2, for average electrical aggregate cost. These tariffs are subject to change quite frequently. For the most up to date tariffs, refer to JCP&L’s website. Refer to Appendix A for complete Historical Data Analysis.
3.1.5 Mt. Olive Booster Station
Power for the Mount Olive Booster Station is fed from a General Secondary Service line from JCP&L. Figure 3-8 illustrates the average monthly electrical energy consumption for the Mt. Olive Booster Station over the past three years. The baseline energy consumption is approximately 8,000 kWH per month, which accounts for the year round demands associated with the pump motors and lighting. Peak energy usage is during the summer months, due to the demand of the motor loads.

Section 3 Baseline Energy Use
A 3-8 E:\HMUA\EnergyAudit\DraftRpt to TRC\Section 3_updated.doc
This building is billed using a flat rate KWH charge based on JCP&L’s current tariff rates. Demand charges for this building were billed at a flat rate.
Figure 3-8: Mount Olive Booster Station Electrical Usage
The current tariff rates for General Secondary Service from JCP&L are as follows:
Basic Generation Service: $0.114152/KWH Non-Utility Generation Charges: $0.016960/KWH Societal Benefits Charges: $0.003222/KWH Delivery Service Charges: $0.012945/KWH System Control Charge: $0.000079/KWH
Demand Charge: $5.534971/KW Refer to Table 3-1, in Section 3.2, for average electrical aggregate cost. These tariffs are subject to change quite frequently. For the most up to date tariffs, refer to JCP&L’s website. Refer to Appendix A for complete Historical Data Analysis.

Section 3 Baseline Energy Use
A 3-9 E:\HMUA\EnergyAudit\DraftRpt to TRC\Section 3_updated.doc
3.1.6 Well # 2 Snooks
Power for Well #2 Snooks is fed from a General Secondary Service line from JCP&L. Most of these electrical charges are due to motor loads and electric heating. Figure 3-9 illustrates the average monthly electrical energy consumption associated with Well #2. The base load is approximately 3,000 kWH each month. Peak energy usage occurs during the winter months, due to electric heating.
Figure 3-9: Well #2 Snooks Electrical Usage
This building is billed using a flat rate KWH charge based on JCP&L’s current tariff rates. Demand charges for this building were billed at a flat rate, listed below. The current tariff rates for General Secondary Service from JCP&L are as follows:
Basic Generation Service: $0.114153/KWH Non-Utility Generation Charges: $0.016960/KWH Societal Benefits Charges: $0.003222/KWH Delivery Service Charges: $0.025888/KWH System Control Charge: $0.000079/KWH
Demand Charge: $2.213158/KW Refer to Table 3-1, in Section 3-2, for average electrical aggregate cost. These tariffs are subject to change quite frequently. For the most up to date tariffs, refer to JCP&L’s website. Refer to Appendix A for complete Historical Data Analysis.

Section 3 Baseline Energy Use
A 3-10 E:\HMUA\EnergyAudit\DraftRpt to TRC\Section 3_updated.doc
3.1.7 Well # 6 Heath
Power for Well #6 Heath is fed from a General Secondary Service line from JCP&L. Most of these electrical charges are due to motor loads. This building is billed using a flat rate kWH charge based on JCP&L’s current tariff rates. Demand charges for this building were billed at a flat rate. Energy usage is fairly constant as the motor demand remains the same for most months and electric heating is minimal comparatively. However, the slight peaks during the winter months indicate the added load due to the electric heating.
Figure 3-10: Well #6 Heath Electrical Usage
The current tariff rates for General Secondary Service from JCP&L are as follows:
Basic Generation Service: $0.114151/KWH Non-Utility Generation Charges: $0.016960/KWH Societal Benefits Charges: $0.003222/KWH Delivery Service Charges: $0.009004/KWH System Control Charge: $0.000079/KWH
Demand Charge: $5.519971/KW Refer to Table 3-1, in Section 3.2, for average electrical aggregate cost. These tariffs are subject to change quite frequently. For the most up to date tariffs, refer to JCP&L’s website. Refer to Appendix A for complete Historical Data Analysis.

Section 3 Baseline Energy Use
A 3-11 E:\HMUA\EnergyAudit\DraftRpt to TRC\Section 3_updated.doc
3.1.8 Well # 8 Claremont
Power for Well #8 Claremont is fed from a General Secondary Service line from JCP&L. Most of these electrical charges are due to electric heating, as this well is out of service. As a result, the baseline energy usage is approximately 400 kWH per month. This building is billed using a flat rate KWH charge based on JCP&L’s current tariff rates. Demand charges for this building were billed at a flat rate. Peak energy usage is during the winter months, due to electric heating.
Figure 3-11: Well #8 Claremont Electrical Usage
The current tariff rates for General Secondary Service from JCP&L are as follows:
Basic Generation Service: $0.114151/KWH Non-Utility Generation Charges: $0.016962/KWH Societal Benefits Charges: $0.003222/KWH Delivery Service Charges: $0.032608/KWH System Control Charge: $0.000080/KWH Refer to Table 3-1, in Section 3.2, for average electrical aggregate cost. These tariffs are subject to change quite frequently. For the most up to date tariffs, refer to JCP&L’s website. Refer to Appendix A for complete Historical Data Analysis.

Section 3 Baseline Energy Use
A 3-12 E:\HMUA\EnergyAudit\DraftRpt to TRC\Section 3_updated.doc
3.1.9 Water Pollution Control Plant
Power for the Water Pollution Control Plant (WPCP), which includes the Administration Building, the Intermediate Pumping Station, the Advanced Treatment Building and the Digester Building is fed from a General Primary Service line from JCP&L. Figure 3-12 illustrates the average monthly electrical energy consumption associated with the wastewater treatment plant. The baseline energy usage is approximately 146,000 kWH each month. This load is a result of the process equipment, specifically the large motor loads associated with the pumping stations and aeration system blowers, and the building lighting systems.
Figure 3-12: Water Pollution Control Plant Electrical Usage
The Water Pollution Control Plant is billed using a flat rate kWH charge based on JCP&L’s current tariff rates. Demand charges for this building are also billed at a flat rate. Peak energy use appears to occur in March, potentially as a result of wet weather events and the associated increased flow through the treatment plant.
Most of the large motors are running 24 hours a day, 7 days a week and lighting needs are consistent based on the employee work shifts. The WPCP is subject to a reactive power (KVAR) penalty charge. As discussed previously, the KVAR penalty is placed on a facility with a low power factor, which directly relates to an increased total power required to operate the facility. In this case, the KVAR charge is most likely the result of operating influent pump numbers 1 and 2, which both having inefficient 100 hp motors and drives with low power factors. The KVAR penalty charge amounts to $70 – $90 each month.

Section 3 Baseline Energy Use
A 3-13 E:\HMUA\EnergyAudit\DraftRpt to TRC\Section 3_updated.doc
The current tariff rates for General Primary Service from JCP&L are as follows:
Supply Availability Charge: $0.000161/KWH Non-Utility Generation Charge: $0.016095/KWH Societal Benefits Charges: $0.006444/KWH Delivery Service Charges: $0.005981/KWH System Control Charge: $0.000079/KWH Demand Charge: $6.370008/KW KVAR Demand Charge: $0.450000/KVAR Refer to Table 3-1, in Section 3.2, for average electrical aggregate cost. These tariffs are subject to change quite frequently. For the most up to date tariffs, refer to JCP&L’s website. Refer to Appendix A for complete Historical Data Analysis.
Fuel oil is used for heating the WPCP Administration Building and Advanced Treatment Building. Additionally, fuel oil serves as a supplemental fuel source for the dual fuel boiler, which operates primarily on digester gas to heat the Digester Building. Unfortunately, due to the nature of fuel oil deliveries, it is difficult to track monthly oil usage. Deliveries have been made in set quantities at varying intervals, and do not necessarily directly relate to fuel oil consumption. Therefore, monthly fuel oil consumption rates have been predicted through simulation and modeling and presented in Section 4.3.
3.2 Aggregate Costs
For the purposes of computing energy savings for all identified energy conservation and retrofit measures, aggregate unit costs for electrical energy were determined for each service connection and utilized in the simple payback analyses discussed in subsequent sections. The aggregate unit cost accounts for all distribution and supply charges for each location. Table 3-1 summarizes the electrical unit costs utilized.

Section 3 Baseline Energy Use
A 3-14 E:\HMUA\EnergyAudit\DraftRpt to TRC\Section 3_updated.doc
Table 3-1: Electrical Aggregate Unit Costs Service Location Aggregate $ / kW-hr
Mount Olive Booster Station $0.1887
Independence Booster Station $0.2366
Water Filtration Plant $0.1536
Well #2 $0.1785
Well #4 $0.1536
Well #6 $0.2016
Well #8 $0.9507
Jacob Garabed Admin Building $0.1742
Operations Building $0.1742
Storage Building $1.4290
WPCP $0.1425
3.3 Portfolio Manager
3.3.1 Portfolio Manager Overview
Portfolio Manager is an interactive energy management tool that allows the Authority to track and assess energy consumption across the Authority’s entire wastewater treatment in a secure online environment. Portfolio Manager can help the Authority set investment priorities, verify efficiency improvements, and receive EPA recognition for superior energy performance.
3.3.2 Energy Performance Rating
For many facilities, you can rate their energy performance on a scale of 1–100 relative to similar facilities nationwide. Your facility is not compared to the other facilities entered into Portfolio Manager to determine your ENERGY STAR rating. Instead, statistically representative models are used to compare your facility against similar facilities from a national survey conducted by the Department of Energy’s Energy Information Administration. This national survey, known as the Commercial Building Energy Consumption Survey (CBECS), is conducted every four years, and gathers data on building characteristics and energy use from thousands of facilities

Section 3 Baseline Energy Use
A 3-15 E:\HMUA\EnergyAudit\DraftRpt to TRC\Section 3_updated.doc
across the United States. Your facility’s peer group of comparison is those facilities in the CBECS survey that have similar facility and operating characteristics. A rating of 50 indicates that the facility, from an energy consumption standpoint, performs better than 50% of all similar facilities nationwide, while a rating of 75 indicates that the facility performs better than 75% of all similar facilities nationwide.
Facilities eligible to receive a rating, representing over 50 percent of US commercial floor spaces include wastewater treatment plant facilities.
A wastewater treatment plant is a facility that is designed to treat municipal wastewater. The level of treatment at a plant will vary based on the BOD limits and the specific processes involved. This space type in Portfolio Manager is appropriate for primary, secondary, and advanced treatment facilities with or without nutrient removal. Treatment processes may include biological, chemical, and physical treatment. This space type is best applied to wastewater treatment facilities of 150 MGD or smaller. This space type does not apply to water treatment and distribution facilities.
The following information is required for wastewater treatment facilities:
• Zip code • Average influent flow • Average influent biological oxygen demand (BOD5) • Average effluent biological oxygen demand (BOD5) • Plant design flow rate • Presence of fixed film trickle filtration process • Presence of nutrient removal process
3.3.3 Portfolio Manager Account Information
CDM has submitted the Portfolio Manager Data to the USEPA and is awaiting the results of the ranking. The data submitted to USEPA is included in Appendix N and the results of the ranking will be forwarded to Hackettstown MUA under separate cover once received. A Portfolio Manager Account has been established for the Authority. The Authority’s Username and Password that is required to log into the account is as follows:
USERNAME: Hacktownmua
PASSWORD: Execdirector


A 14-1
E:\HMUA\EnergyAudit\Final Report\Section 4.doc
Section 4 Energy Conservation and Retrofit Measures (ECRM)
4.1 Water Treatment Plant and Pump Station 4.1.1 Off-Peak Pumping Ability As part of the energy audit project, CDM has been tasked to assess the viability of off-peak pumping of production and booster pumping units, in an effort to take advantage of the preferred energy rates during off-peak time periods. To undertake this evaluation, CDM performed an evaluation of the existing demands to determine the feasibility for off-peak pumping during the peak day condition. The peak day was selected as this represents the highest demand requirements upon the system, if the peak day demands could be met under an off-peak pumping scenario, all other lesser demands would also be met. Currently all water supply wells feed into a 2.4 million gallon Main Water System Tank. However, Well Number 2 in the system can pump to either the 2.4 million gallon (MG) main tank or a 1.0 million gallon tank, which provides fire protection for M&M/ Mars Corporation. When the 1.0 MG tank level drops, flow from Well Number 2 is redirected to the tank to fill it, yet flow from Well Number 2 is usually directed towards the main 2.4 million gallon Main Water System Tank. The Main Water System Tank is a welded steel ground storage tank with a 100ft inside diameter, 41 foot shell height, and a 2,400,000 gallon nominal capacity. The minimum water line elevation is 763.33 (Top of Silt Stop). There is an Overflow Cone Assembly at elevation 804.00. Each foot of rise or fall in the tank is equal to approximately 58,500 gallons. Under the water system’s current operation, the well pumps operate at various flows. Well Number 4 has a 30 hp motor equipped with a variable speed drive (VFD). Well Number 4 ran for 53 hours in 2008. Well Number 5 is a submersible pump with a 125hp motor, also equipped with a VFD. Well Number 5 operated for 2,531 hours in 2008. Well Number 7 has a 175 hp pump with VFD and operated for 6,723 hours in 2008. Well Number 2 has a constant speed 15 hp motor. This well pump operated for 2,324 hours during 2008. Well Number 6 pumps 24 hours a day at 100 hp. Under current operational conditions, Well Number 6 runs continuously and Well Number 2 operates on a set time schedule, from 6 AM – 9 AM and 6 PM – 9 PM. The other wells

Section 4 Energy Conservation and Retrofit Measures (ECRM)
A 4-2
E:\HMUA\EnergyAudit\Final Report\Section 4.doc
currently operate on a demand basis, in which they are turned on as needed based on tank level and demand throughout the distribution system. Table 4-1 is a summary of with the well system, which includes the demand in KW for each well.
Table 4-1: Well Pump System Electric Motor Characteristics
Well # Motor
hp Drive KW KW
( see Note 2) Day/Night
Rate
2 15 Constant 11.2 11.2 No
4 30 VFD 22.4 23.6 Yes
5 125 VFD 93.25 98.15 Yes
6 100 Constant 74.6 74.6 No
7 175 VFD 130.6 137.4 Yes
8 See Note 1 VFD 29.8 31.4 No
Total KW 376.35
Total KW for Day/Night pumping units 259.15
Note 1: Well #8 is presently out of service due to redrilling, and the new capacity of the well has not yet been determined. For the purpose of this analysis a rate of 300 gpm has been assumed with an assumed hp of 40 and a VFD. Note 2: KW – adjusted to account for assumed VFD efficiency of 95%. To determine the demand of the water system, an analysis of operational data from the SCADA system for the Main Water Tank and the water supply wells was performed. The SCADA system provided detailed hourly production and tank level information by time of day. This information was used to determine peak day and the associated diurnal demand, as shown in Figures 4-1 and 4-2. A mass balance was performed using the hourly production and tank level information to determine the hourly demand for the water system. For a water system, or any similar system, accumulation = input – output. The accumulation is defined by the rising and falling of the water elevation inside the Main Water System Tank. By subtracting this accumulation (positive or negative) inside the tank from the input, a total water system demand, in gallons, was determined.

Section 4 Energy Conservation and Retrofit Measures (ECRM)
A 4-3
E:\HMUA\EnergyAudit\Final Report\Section 4.doc
Figure 4-1: Peak Day Demand Determination for the Water System

Section 4 Energy Conservation and Retrofit Measures (ECRM)
A 4-4
E:\HMUA\EnergyAudit\Final Report\Section 4.doc
Figure 4-2: Peak Day Demand Flows for Water System for Peak Day of July 11, 2008
The intent of this analysis is to fill the tank to the maximum level of 41 feet during off-peak hours (8PM – 8AM) and turn off the pumps during as much of the peak hours as possible. The current electric tariff warrants a cost savings for reduced demand charges only, not energy consumption, on a Day/Night billing rate. This Day/Night billing rate indicates that the demand charges will be billed based on either 100% of demand during on-peak hours (8 am – 8 pm ); or 40% of demand during off-peak hours (8 pm – 8 am), whichever is greater. Most of these electrical charges for the water system stem from motor loads, but there is a portion of the cost attributable to electric heating. Well Numbers 4, 5, and 7 are all located within the limits of the current Water Filtration Plant, and are included on the Day/Night billing structure. Well Numbers 2, 6, and 8 are not included on the Day/Night billing, and are not included in the calculation above comparing the demand during the peak and off-peak periods.

Section 4 Energy Conservation and Retrofit Measures (ECRM)
A 4-5
E:\HMUA\EnergyAudit\Final Report\Section 4.doc
CDM’s analysis of the water distribution system to determine if the well pumps can be operated on a Day/Night operational protocol included a two phased approach. First, the feasibility of operating Well Number 4, 5, and 7 pumps entirely during off peak times was analyzed; as these well pumps are currently on a Day/Night billing structure. Secondly, the feasibility of operating all well pumps during off peak operational hours was evaluated.
• Well Number 4, 5 and 7 Off-Peak Pumping Analysis For the peak day of July 11, 2008, an analysis was completed to determine the energy savings obtainable by using the Main Water System Tank capacity to allow for off-peak pumping. Figure 4-3 shows the tank level for the Peak Day of July 11, 2008, including the tank levels 6 hours before and after the peak day timeframe.
Figure 4-3: Existing Tank Level for a Peak Day (July 11th ) flow rate
For the analysis to determine if off-peak pumping would provide acceptable supply conditions, the model was run to allow Well Numbers 2, 6, and 8 to pump at their normal pumping conditions during the entire 24-hour period, and Well Numbers 4, 5,

Section 4 Energy Conservation and Retrofit Measures (ECRM)
A 4-6
E:\HMUA\EnergyAudit\Final Report\Section 4.doc
and 7 to pump at full capacity during off-peak hours only. This was completed in order to determine if the system could supply the demand for the entire 24-hour period. The analysis started at 8 PM, assuming that the tank level was at 25 feet. Anything below 25 feet would be considered unacceptable pressure for the system, with insufficient pressure to satisfy fire flow and emergency requirements. The model was run with the assumption that 25 feet in the Main Water System Tank provides adequate pressure throughout the distribution system. The ‘capacity’ of the tank is 2,400,000 gallons, or ~ 40.85 feet in tank height. The model was run with the tank starting level at 25 feet and with all wells pumping at full capacity starting at 8 PM until the top of the tank level was met. The well pumps can supply the tank an amount equal to the difference between the total hourly production rate and the hourly system demand. During this off-peak period, the tank fills, since the off-peak demand is less than the total supply for the six well sources. For the analysis of 8PM – 8AM pumping: Well Number 2 has a maximum capacity of 92 gallons per minute (gpm). Under this scenario, this well will be run all day at its current capacity, since it is not on the Day/Night billing structure. Well Number 4 normally does not operate, and was used only 53 hours in 2008. The pump was used in the analysis, but it should be noted that it did not operate during the peak day of July 11, 2008. In order to determine the capacity of the well, previous months’ records were used to determine a capacity rate. Well Number 4 has a 30 hp motor, and it was determined that its flow capacity has an average of 175 gpm. Theoretically, pumping this well at full capacity for 12 hours could deliver 126,000 gallons of water to the distribution system. Well Number 5 also did not operate during July 2008. Similarly to Well Number 4, previous months’ capacity was obtained, and it was determined that Well Number 5 would have an average flow capacity of 620 gallons per minute (gpm). Theoretically, pumping this well at full capacity for 12 hours could deliver 446,400 gallons of water to the distribution system.

Section 4 Energy Conservation and Retrofit Measures (ECRM)
A 4-7
E:\HMUA\EnergyAudit\Final Report\Section 4.doc
Well Number 6 has a maximum flow capacity of 660 gallons per minute (gpm). This well will run all day at its current capacity, since it is not on the Day/Night billing structure. Well Number 7 has a maximum flow capacity of 1,195 gallons per minute (gpm). Theoretically, pumping this well at full capacity for 12 hours can produce 860,400 gallons of water to the distribution system. Well Number 8 is currently out of service. The Well currently has an approved diversion of 300 gpm. For this analysis, a pumping capacity of 300 gpm was used. Well Number 8 will run for the entire 24 hour period at the 300 gpm capacity. The SCADA software monitors the pumping system and the logging occurs at 20 minute time increments. This allowed the model to be undertaken in 20 minute increments, adjusting the calculations as necessary. The Main Water System Tank is filled by the pumps until 8 AM, or the beginning of the peak billing rate, where it is allowed to drain until the well pumps are required to operate at their full capacity to re-charge the tank. If the tank level were to reach the minimum tank level of 25 feet, the pumps with VFD’s can be utilized, to allow for operation at reduced capacity and reduced electrical demands. Under the operating scenario modeled, with the demand equal to the 2008 peak day, the tank stays well above the 25 foot minimum. For the analysis, beginning at 8 pm, and with a starting tank level of 25, the tank is allowed to fill via either on/off sequence or VFD until the off-peak pumping hours are over at 8 AM, or so that it reaches maximum capacity of 2,400,000 gallons right at the end of the off peak energy pumping period. Once the off-peak energy cost time frame is over at 8 AM, and the peak-hourly rate begins, the wells on the Day/Night billing rate are shut off and the tank is able to drain due to the demand in the supply system. Figure 4-4 below shows the model run for off peak pumping capabilities for the water distribution system being assessed for the peak-day demand, in gallons. The chart relates the water tank level vs. the time of day.

Section 4 Energy Conservation and Retrofit Measures (ECRM)
A 4-8
E:\HMUA\EnergyAudit\Final Report\Section 4.doc
Figure 4-4: Model Results Assessing Off-Peak Pumping Capabilities at Peak Day Demands
As can be seen through the graph and data, under on peak day flows and demands the tank would not drop below 25 feet with Well Numbers 4 and 7 operating during off-peak hours and shutting off during peak hours. Under the Day/Night rate structure the demand charges are either billed based on either 100% of demand during on-peak hours or on 40% of demand during off-peak hours, whichever is greater. This analysis has shown that Well Number 5 can pump for 24 hours at its normal capacity and HMUA will still gain energy cost savings, due to the ratio of the pumps operated during the peak and off peak time frames. Through this method, Well Numbers 2, 4, 5, 6, 7, and 8 will be pumping off-peak, which equates to 376.35 kW, with 259.15 kW representing the wells (4, 5, and 7) on the Day/Night rate. During peak hours, Well Numbers 2, 5, 6, and 8 will be pumping, equating to 215.35kW, but
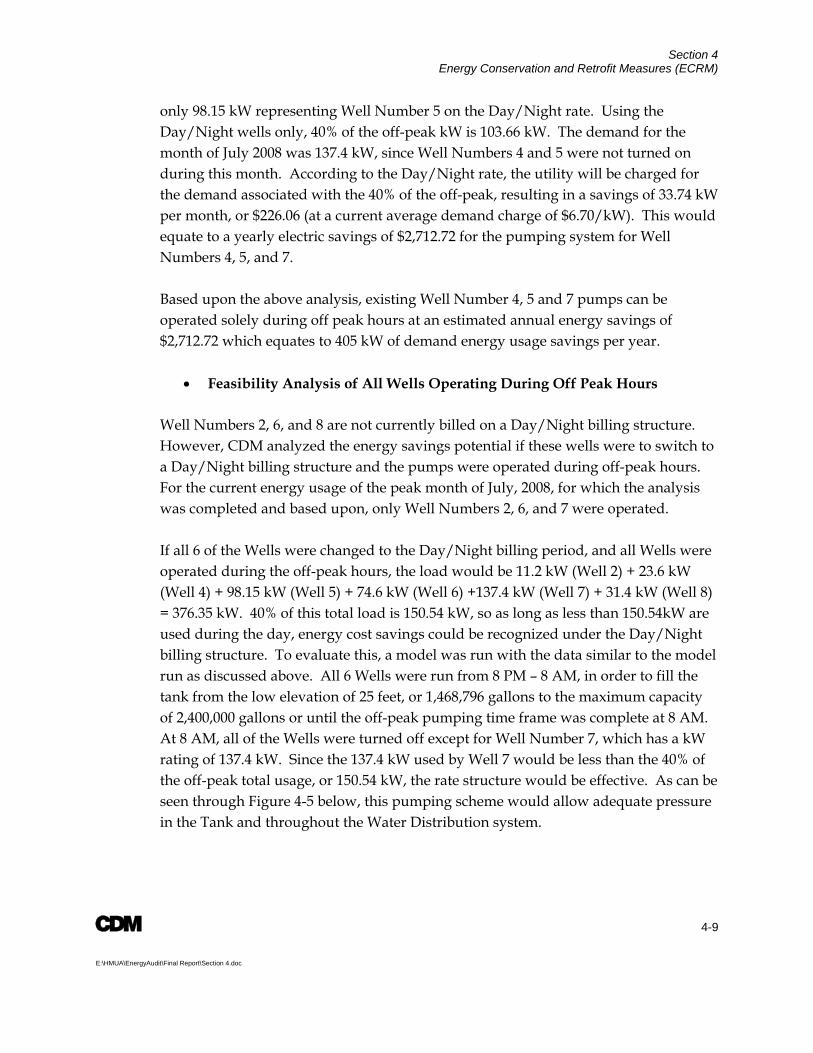
Section 4 Energy Conservation and Retrofit Measures (ECRM)
A 4-9
E:\HMUA\EnergyAudit\Final Report\Section 4.doc
only 98.15 kW representing Well Number 5 on the Day/Night rate. Using the Day/Night wells only, 40% of the off-peak kW is 103.66 kW. The demand for the month of July 2008 was 137.4 kW, since Well Numbers 4 and 5 were not turned on during this month. According to the Day/Night rate, the utility will be charged for the demand associated with the 40% of the off-peak, resulting in a savings of 33.74 kW per month, or $226.06 (at a current average demand charge of $6.70/kW). This would equate to a yearly electric savings of $2,712.72 for the pumping system for Well Numbers 4, 5, and 7. Based upon the above analysis, existing Well Number 4, 5 and 7 pumps can be operated solely during off peak hours at an estimated annual energy savings of $2,712.72 which equates to 405 kW of demand energy usage savings per year.
• Feasibility Analysis of All Wells Operating During Off Peak Hours Well Numbers 2, 6, and 8 are not currently billed on a Day/Night billing structure. However, CDM analyzed the energy savings potential if these wells were to switch to a Day/Night billing structure and the pumps were operated during off-peak hours. For the current energy usage of the peak month of July, 2008, for which the analysis was completed and based upon, only Well Numbers 2, 6, and 7 were operated. If all 6 of the Wells were changed to the Day/Night billing period, and all Wells were operated during the off-peak hours, the load would be 11.2 kW (Well 2) + 23.6 kW (Well 4) + 98.15 kW (Well 5) + 74.6 kW (Well 6) +137.4 kW (Well 7) + 31.4 kW (Well 8) = 376.35 kW. 40% of this total load is 150.54 kW, so as long as less than 150.54kW are used during the day, energy cost savings could be recognized under the Day/Night billing structure. To evaluate this, a model was run with the data similar to the model run as discussed above. All 6 Wells were run from 8 PM – 8 AM, in order to fill the tank from the low elevation of 25 feet, or 1,468,796 gallons to the maximum capacity of 2,400,000 gallons or until the off-peak pumping time frame was complete at 8 AM. At 8 AM, all of the Wells were turned off except for Well Number 7, which has a kW rating of 137.4 kW. Since the 137.4 kW used by Well 7 would be less than the 40% of the off-peak total usage, or 150.54 kW, the rate structure would be effective. As can be seen through Figure 4-5 below, this pumping scheme would allow adequate pressure in the Tank and throughout the Water Distribution system.

Section 4 Energy Conservation and Retrofit Measures (ECRM)
A 4-10
E:\HMUA\EnergyAudit\Final Report\Section 4.doc
Figure 4-5: Water Level in Main tank if all 6 wells were switched to Day/Night Electrical billing rate, and Well 7 is run during the peak day hours.
For energy cost savings to be recognized, HMUA would be billed under this scenario for 150.54 kW (as discussed above), and at an average demand charge of $6.7/kW, the charge would be roughly 1,008.62 per month. Under the current billing method, HMUA would be billed for a rate of 218.5 kW, and at an average demand charge of $6.7/kW, the charge is roughly $1,463.95. By implementing a Day/Night billing for all 6 Wells, HMUA would have an energy cost savings of $1,463.95 - $1,008.62 = $455.33 per month, or $5,463.96 per year. This value in cost savings is not in addition to the cost savings of $2,712.72 per year with only utilizing the off-peak pumping of Wells 4, 5, and 7. Therefore, it is concluded that all 6 wells can be operated on a Day/Night billing structure with an estimated annual energy savings of $5,463.96 which equates to an annual savings in demand energy usage of 815 kW.

Section 4 Energy Conservation and Retrofit Measures (ECRM)
A 4-11
E:\HMUA\EnergyAudit\Final Report\Section 4.doc
This analysis was completed assuming that the cost would be minimal switching from the current billing structure to the Day/Night structure.
Booster Pump Stations
For the Mount Olive booster pump station, the analysis for off-peak pumping assumes that the demand of the Mount Olive High Service Tank service area was equal to the quantity of water pumped by the Mount Olive Booster Station. Again, similar to the analysis on the main service area for the well pumps, this analysis was undertaken for peak day conditions during 2008. Also, the Mount Olive High Service Tank minimum elevation was recorded to be at elevation 50 feet, and this elevation was therefore used to compute the minimum volume of water within the tank. The Mount Olive High Service Tank is 34 feet in diameter and 66 feet in height, having a nominal capacity of 420,000 gallons (0.42 million gallons). At the lowest tank level elevation of 50 feet, the volume of water in the tank would be: Volume = (34’/2)^2 * ∏ * 50’ = 45,396 ft3 = 339585 gallons (0.340 MG).
Figure 4-5a: Peak Day Demand Determination for Mt. Olive Booster Station
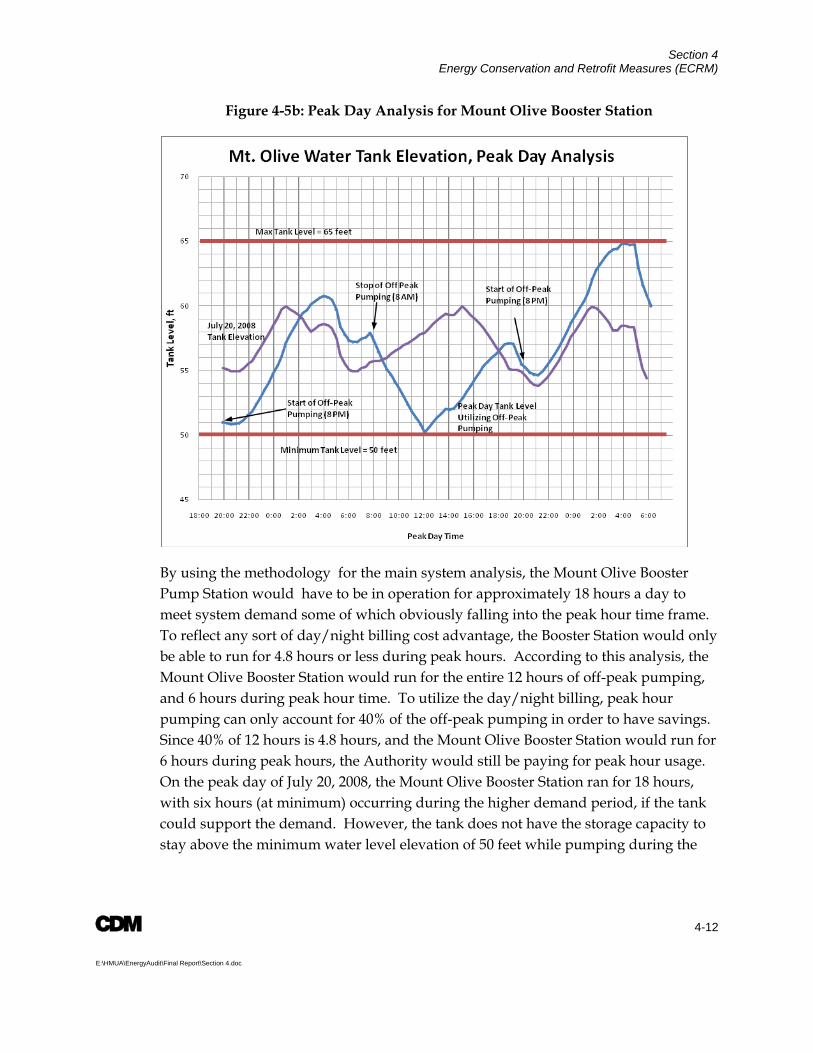
Section 4 Energy Conservation and Retrofit Measures (ECRM)
A 4-12
E:\HMUA\EnergyAudit\Final Report\Section 4.doc
Figure 4-5b: Peak Day Analysis for Mount Olive Booster Station
By using the methodology for the main system analysis, the Mount Olive Booster Pump Station would have to be in operation for approximately 18 hours a day to meet system demand some of which obviously falling into the peak hour time frame. To reflect any sort of day/night billing cost advantage, the Booster Station would only be able to run for 4.8 hours or less during peak hours. According to this analysis, the Mount Olive Booster Station would run for the entire 12 hours of off-peak pumping, and 6 hours during peak hour time. To utilize the day/night billing, peak hour pumping can only account for 40% of the off-peak pumping in order to have savings. Since 40% of 12 hours is 4.8 hours, and the Mount Olive Booster Station would run for 6 hours during peak hours, the Authority would still be paying for peak hour usage. On the peak day of July 20, 2008, the Mount Olive Booster Station ran for 18 hours, with six hours (at minimum) occurring during the higher demand period, if the tank could support the demand. However, the tank does not have the storage capacity to stay above the minimum water level elevation of 50 feet while pumping during the

Section 4 Energy Conservation and Retrofit Measures (ECRM)
A 4-13
E:\HMUA\EnergyAudit\Final Report\Section 4.doc
night and turning off during the day and therefore it is concluded that there would not be any energy savings to switch the Mount Olive Booster Pump Station to a Day/Night billing structure.
For the Independence Booster Pump Station, it has been concluded, because of its minimal operational time (approximately 2 hours per day) that there would not be any energy savings to switch this booster pump station to a Day/Night billing structure.
4.1.2 Hydro-Electric Energy The existing water filtration plant receives its water supply from two reservoirs; the Burd Reservoir having a water surface elevation of 646.7 feet and the Lower Mine Hill Reservoir having a water surface elevation of 800.7 feet. A third reservoir, the Upper Mine Hill Reservoir, provides storage and overflows into the Lower Mine Hill Reservoir to provide a source of water supply and to prevent siltation from occurring in the Lower Mine Hill Reservoir. Water from the Lower Mine Hill and Burd Reservoirs exits the reservoirs via a 10-inch diameter pipeline. Both 10-inch diameter pipelines meet at a common connection, tying together the Lower Mine Hill and Burd Reservoirs. At this connection, the supply pipe (penstock) diameter reduces to 8-inches and ultimately conveys water from both reservoirs to the water filtration plant.
The 10-inch diameter pipeline exiting the Lower Mine Hill Reservoir is provided with a pressure reducing valve such that it prohibits water from this reservoir from
Figure 4-6: Schematic of Existing Water System with Generator

Section 4 Energy Conservation and Retrofit Measures (ECRM)
A 4-14
E:\HMUA\EnergyAudit\Final Report\Section 4.doc
discharging back into the Burd Reservoir, as the Lower Mine Hill Reservoir water elevation is at a higher elevation. At the location where the Lower Mine Hill Reservoir and Burd Reservoir 10-inch diameter pipelines meet, the pressure at this connection must be equal to the available head in the Burd Reservoir. See Figure 4-6 for a schematic layout.
The Upper Mine Hill Reservoir was constructed in the 1930’s and is retained by a solid dam which is reported to be in good condition. The water overflowing or flowing around the Upper Mine Hill Reservoir flows through a small stream to the Lower Mine Hill Reservoir. The Lower Mine Hill reservoir was constructed in 1898 and is in need of repair. Dam Safety has been requesting the Authority to either make repairs or to breach the Lower Mine Hill Dam. The estimated cost for the repair of this dam, as reported by the Authority, is approximately $750,000. The estimated cost of breaching the dam and reforestation of the lakebed would be, as reported by the Authority, approximately $700,000.
The Burd Reservoir is located on a separate property and is smaller compared to the Upper and Lower Mine Hill Reservoirs. The total safe yield of the reservoir system is 1.0 million gallons. In 1980, the Authority constructed a water filtration plant to treat the surface water from the reservoir system. The design capacity of the water filtration plant is 1.0 million gallons (700 gallons per minute). As the Hackettstown service area expands, a larger percentage of the town’s water supply was provided by well water as the operational costs associated with treating surface water was deemed to be more extensive. Based on this, the Authority has considered abandoning the reservoir system and discontinuing surface water treatment.
The goal of this section is to evaluate the hydraulic characteristics and available energy associated with the existing reservoir system, investigate available hydro-electric systems that are commercially available and to determine if the installation of a hydro-electric system is cost effective.
Water power is the combination of head and flow. In a typical hydro system, water is diverted from a stream or reservoir into a pipeline called a penstock, where it is conveyed downhill and through a turbine. The vertical drop or static elevation (head) creates pressure at the bottom end of the penstock. The pressurized water emerging from the end of the penstock creates the force that drives the turbine. More flow or more head, increases the potential power that can be generated.
Therefore, before planning a hydro-electric system or estimating how much power can be produced, the amount of static head available, the net head available, the design flow and the length of the penstock or pipeline must be determined. The net

Section 4 Energy Conservation and Retrofit Measures (ECRM)
A 4-15
E:\HMUA\EnergyAudit\Final Report\Section 4.doc
head is defined as the pressure available at the turbine when water is flowing, which will always be less than the pressure when the water is not flowing.
Upon review of the Authority’s reservoir system and water filtration plant, it was determined that the most appropriate location to install a hydro-electric system would be within the 8-inch feed pipeline (penstock) from the Lower Mine Hill and Burd Reservoirs where it enters the water filtration plant just upstream of the existing Raw Water Chamber.
Once the net head and design flow are known, the theoretical power to be generated by a hydro-electric plant in Hp or Kilowatts can be computed as follows:
Theoretical Horsepower (Hp) = Net Head (feet) x Flow (cubic feet per second) (1) 8.8 Theoretical Kilowatts (Kw) = Net Head (feet) x Flow (cubic feet per second) (2) 11.81 From Figure 4-6, the available static head is calculated as follows: Static Head = (Water surface elevation in Burd Reservoir) – (centerline elevation of 8-inch penstock pipe) = 646.7 feet – 535.17 feet= 111.5 feet. Per Figure 4-6, water is conveyed from the Burd Reservoir via 6,440 linear feet of 10-inch diameter pipe and 2,200 linear feet of 8-inch diameter pipe. Assuming a flow spilt of 60/40 between the Lower Mine Hill and Burd Reservoirs, the design flow associated with the 10-inch diameter pipe exiting the Burd Reservoir is 280 gallons per minute and the design flow for the 8-inch diameter pipe to the water filtration plant is 700 gallons per minute. To determine the net available head to drive the turbine, the pipe frictional losses within the 10–inch and 8-inch diameter pipelines must be calculated. Calculation of pipeline frictional losses is accomplished through the use of the Hazen-Williams equation which is as follows: Hf = (10.44)(L)(Flow)1.85 (3) (C)1.85 (d)4.8655
Where: L = length of pipeline in feet Flow = design flow in gallons per minute C = Hazen-Williams coefficient selected as 100 for old pipe

Section 4 Energy Conservation and Retrofit Measures (ECRM)
A 4-16
E:\HMUA\EnergyAudit\Final Report\Section 4.doc
d = diameter of pipeline in inches Hf = frictional losses in feet The pipeline frictional losses for the 10-inch and 8-inch diameter pipelines can be computed from equation 3 as follows: Hf = (10.44)(6,440)(280)1.85 + (10.44)(2,200)(700)1.85 = 6.16 feet + 33.92 feet = 40 feet (100)1.85 (10)4.8655 (100)1.85 (8)4.8655
Therefore, the net available head to drive a turbine = 111.5 feet – 40 feet = 71.5 feet. From equation number 2, the theoretical power in kilowatts is computed as follows: Theoretical Power (kW) = (71.5 feet) x (700 gallons per minute/448.8) = 9.44 kW 11.81 Assuming an efficiency of 70 percent for the turbine and generator combination, the calculated power that can be generated from this application can be calculated as follows: Actual Power (kW) = 9.44 x 0.7 = 6.6 kW 7 kW Assuming 24 hour operation of the hydro-electric power plant, the annual energy production is calculated to be 61,320 kW-hrs and at energy cost of $0.1536/kW-hr for the Water Filtration Plant as show in Table 3-1, the annual electric energy savings is computed to be as follows: Annual Electric Energy Savings = 7kW x 24 hr x 365 days x $0.1536/Kw-hr = $9,420/year day year Rentricity, a typical engineering firm and supplier of hydro-electric equipment, estimates that the capital equipment cost for a standard 10 kW hydro-electric power plant, engineering and permitting fees will be approximately $60,000, and at a calculated energy savings of $9,420/year, the simple payback for a hydro-electric power plant, not including installation costs, is calculated to be approximately 6 years. Since the filtration plant would need to be operated in order for the hydro electric generator to function and the dam would also need to be repaired, the cost associated with the plant and dam need to be considered in the analysis. The annual metered electrical energy utilized by the water filtration plant and Well Numbers 4, 5 and 7 for

Section 4 Energy Conservation and Retrofit Measures (ECRM)
A 4-17
E:\HMUA\EnergyAudit\Final Report\Section 4.doc
the period ending October 6, 2008 was 1,331,200 kilowatt-hours at a total cost of $201,933.00. Given this and coupled with the fact that the Authority estimates to spend approximately $750,000 to repair the Lower Mine Hill Reservoir, the payback period is computed to be 86 years. It therefore can be concluded that the installation of a hydro-electric power plant will not provide a reasonable amount of energy production to offset the energy used by the water filtration plant or wells nor provide for a reasonable payback timeframe. 4.2 Water Pollution Control Plant 4.2.1 Influent Pump Station Sewage flows by gravity from the inlet facilities to a wet well in the Administration Building. From this wet well, three (3) influent pumps convey the sewage to division box number 1 located upstream of the primary clarifiers. Influent pumps 1 and 2 were installed in 1971 and utilize an AutoCon Control Variable Speed Drive (VSD) to vary the flow rate. Influent pump 3 was installed in 1992 and utilizes a premium efficiency AC motor with a Safetronics variable frequency drive (VFD).
Influent pumps 1 and 2 are rated to convey 3,700 gpm (5.3 mgd) at 65 feet of head, with 100 hp motors. Influent pump 3 is rated to convey 4,100 gpm (5.9 mgd) at 65 feet of head, also equipped with a 100 hp motor. One influent pump is operated 24 hours/day and plant personnel rotate the operation of the pumps to equalize run time hours.
The 39 year old motors and speed controllers associated with influent pumps 1 and 2 present the potential for energy savings, due to their age and the electrical inefficiencies of the equipment. These pumps were evaluated to determine the potential energy savings associated with changing their existing drive system with a more efficient system. Table 4-2 presents current readings taken at various pump speeds for raw water pump number 1. Current readings at various pump speeds are required to determine the actual energy use. To determine the baseline daily energy usage associated with one influent pump operating 24 hours per day, diurnal flow data was analyzed to identify reasonable average flows over a 24 hour period. These average flows are then utilized to model the energy usage. The linear relationship between current readings and pump speeds as presented in Figure 4-7, was utilized to obtain estimates of the motor current at the various pump speeds.

Section 4 Energy Conservation and Retrofit Measures (ECRM)
A 4-18
E:\HMUA\EnergyAudit\Final Report\Section 4.doc
Table 4-2: Influent Pump No. 1 Measured Power Pump Speed (rpm) Measured Motor
Current (amps) 800 80 900 90
1000 115
Figure 4-7: Relationship between Measured Current and Pump Speeds
To determine pump speed, pump efficiency and total dynamic head at various flow rates, an influent pump system curve was estimated and superimposed onto the pump curve. This is shown in Appendix B. The power requirement for the AutoCon Control unit was calculated assuming an electrical efficiency of 80 percent. Table 4-3 summarizes the operational periods along with the associated pump speed, estimated motor current, motor and drive power demand, energy usage, and wire to water efficiency.
An energy savings measure that can be implemented for influent pumps 1 and 2 is to replace their current motors and speed controllers with more efficient motors and variable speed drives, similar to raw water pump 3. Table 4-4 summarizes the energy
Raw Water Pump Number 3
0
20
40
60
80
100
120
0 100 200 300 400 500 600 700 800 900 1000 1100
Pump Speed (rpm)
Mot
or C
urre
nt (a
mps
)
Influent Pump Number 1

Section 4 Energy Conservation and Retrofit Measures (ECRM)
A 4-19
E:\HMUA\EnergyAudit\Final Report\Section 4.doc
usage and wire to water efficiencies associated with the operation of influent pumps 1 or 2 with new motors and VFDs. It can be seen from Table 4-3, that the wire to water efficiency varies from 12% to 31% during the course of the day, which indicates that the overall pumping system associated with pumps 1 and 2 is inefficient. Table 4-4 summarizes the projected energy usage and wire to water efficiencies associated with influent pumps 1 or 2 following the replacement of the motors and drives, with a premium efficiency AC motor and VFDs. To determine the energy usage, the pump system curve, as shown in Appendix B was utilized using motor and drive efficiencies of 95 percent, respectively.
With the replacement of the motors and drives associated with pumps 1 and 2 with high efficiency motors and variable speed drives, the estimated energy savings is calculated to be 1037 kW-hrs/day. Assuming continuous operation of influent pump 1 or 2 the energy cost savings is computed to be as follows:
1037 kW-hrs x 365 days x 0.1425/Kw-hr = $53,937/year day year
TABLE 4-3: Current Operation of Influent Pumps 1 & 2
TABLE 4-4: Operation of Influent Pumps 1 & 2 with new Motors and VFDs

Section 4 Energy Conservation and Retrofit Measures (ECRM)
A 4-20
E:\HMUA\EnergyAudit\Final Report\Section 4.doc
NJ Clean Energy Smart Start Program offers a $400 rebate per motor, as shown in Appendix L. The Engineer’s Opinion of Probable Construction Cost based upon conceptual design for furnishing and installing new motors and VFD drives for influent pumps 1 and 2 is $114,000 with an estimated annual maintenance cost of $3,000. The simple payback period for furnishing and installing new motors and VFD drives for influent pump numbers 1 and 2, considering capital equipment and construction costs, energy cost savings, rebates and maintenance costs is calculated to be 2.2 years. Table 4-5 summarizes the payback analysis for the new motors and drives associated with influent pumps 1 and 2.
Table 4-5: New Motors and Drives for Influent Pumps 1 and 2 –
Probable Cost Summary Engineer’s Opinion of Probable Construction $114,000 Motor Rebate $800 Annual Energy Savings $53,937 Annual O&M Cost $3,000 Simple Payback Period 2years
4.2.2 Trickling Filter Recirculation Pump System The Trickling Filter Recirculation Pump System consists of three (3) pumping units where two (2) pumping units are in continuous operation and the third unit acts as a standby. The Trickling Filter Recirculation Pump System is required in order to maintain a minimum hydraulic wetting rate of approximately 0.5 gpm/ft2 of filter area for the rock media and to maintain the trickling filter distribution arm system in operation.
Each recirculation pump has a rated capacity of 2.0 mgd at 20 ft TDH with 10 hp motors. The annual energy cost associated with the operation of the Trickling Filter Recirculation Pump System is calculated as follows:
2 pumps x 10 hp/pump x 0.745 kw/hp x24 hr/day x 365 days/year x $0.1425/kw-hr. = $18,600/year.
In order to maintain the trickling filter’s distribution arms in satisfactory operation, a minimum flow of 1400 gpm (2 mgd) to a maximum flow of 7,000 gpm (10 mgd) is required. Figure 4-8 depicts a representative diurnal flow pattern for the wastewater treatment plant facility. From Figure 4-8, it can be seen that the maximum flow is approximately 3.1 mgd which is split equally among two treatment trains, namely 1.55 mgd or 1,080 gpm per train. This flow is insufficient to maintain the trickling filter distribution arms in operation. Additionally, based upon the minimum

Section 4 Energy Conservation and Retrofit Measures (ECRM)
A 4-21
E:\HMUA\EnergyAudit\Final Report\Section 4.doc
hydraulic wetting rate requirement of 0.5 gpm/ft2, the required wetting rate for each trickling filter is approximately 4,500 gpm, which when reviewing the plant diurnal flow pattern as shown in Figure 4-8, the plant flow is not sufficient to provide the minimum hydraulic wetting rate for the rock media. Therefore, the Trickling Filter Recirculation Pump System is required to be in continuous operation. However, it is recommended that the pump motors be replaced with high efficiency motors, as
discussed in Section 4.5.11.
4.2.3 Nitrification System and Controls The Authority has indicated that only one of the three duty blowers is operated a majority of the time to aerate the nitrification tanks. The facility currently throttles the inlet butterfly valve on the blower(s) to decrease the amount of air that is delivered to the nitrification tanks. Table 4-6 presents a summary of the power readings taken during the site visit.

Section 4 Energy Conservation and Retrofit Measures (ECRM)
A 4-22
E:\HMUA\EnergyAudit\Final Report\Section 4.doc
Table 4-6: Blower Power
Measured Motor Current (amps)
Airflow (cfm)
78 1300 100 2000 120 2800 140 ≥ 2900
Based on readings taken at the site visit, it is estimated that one blower operates all the time with an average power draw of 120 Amps. This power draw translates into a yearly energy cost of $108,000 (120 Amp x 480 V x0.87 (power factor) x 1.73/1000 x 24 hr/day x 365 day/yr x $0.1425/kWh).
CDM analyzed the design conditions as well as the existing conditions to determine if energy savings can be realized with blower modifications or replacements.
4.2.3.1 Design Conditions There are several differences in calculation procedures between CDM and Killam Associates regarding the blower motor horsepower required. CDM calculates the oxygen demand required per mass of BOD removed while the Killam report (see footnote 1 in Section 2.2.7) assumes a value of 1.2. For this facility, the calculated oxygen demand per mass of BOD was 1.255 lb/lb and is not significantly different than the assumed value.
CDM also assumes a different oxygen demand required per mass of TKN removed than the Killam report; 4.25 lb/lb versus 4.6 lb/lb. CDM’s value is lower because it takes synthesis into account and is therefore lower than the theoretical value of 4.57 lb/lb. Using the lower value of 4.25 lb/lb results in a slightly lower oxygen demand which translates into a lower air and blower horsepower requirement. The total oxygen demand is converted to standard conditions with the following formula. The notes indicate the values that CDM and the Killam report use, respectively.
Standard Oxygen Rate = Actual Oxygen Rate/(α * (β *Cd – DO) * ( 1.024(T-20))))
Where: α = 0.65 (CDM), 0.60 (Killam) β = 0.95 (CDM and Killam) Cd = 8.5 (CDM), 8.4 (Killam) DO = 2.0 mg/L (CDM and Killam) T = 23.5 degrees C (CDM), 25 degrees C (Killam)

Section 4 Energy Conservation and Retrofit Measures (ECRM)
A 4-23
E:\HMUA\EnergyAudit\Final Report\Section 4.doc
Table 4-7 presents a summary of the relevant design parameters used to calculate the amount of air needed for nitrification as well as the blower motor horsepower required based on the design conditions.
Table 4-7: Nitrification System Calculation Summary – Design Conditions
Killam Design
CDM Calculations
Killam Design
CDM Calculations
Killam Design
CDM Calculations
Scenario Average Average Max
Month Max Month Max Day Max Day
Flow mgd 3.0 3.0 3.3 3.3 7.2 7.2 WW Temperature deg C 25 23.5 25 23.5 25 23.5 Beta 0.95 0.95 0.95 0.95 0.95 0.95 Alpha 0.60 0.65 0.60 0.65 0.60 0.65 Oxygen Saturation (Cd, based on WW temp) mg/L 8.4 8.5 8.4 8.5 8.4 8.5 Dissolved Oxygen Concentration mg/L 2.0 2.0 2.0 2.0 2.0 2.0 Oxygen Saturation (Cs, based on Standard Conditions) mg/L 9.2 9.09 9.2 9.09 9.2 9.09 OD/BODrem lb/lb 1.2 1.255 1.2 1.255 1.2 1.255 OD/TKNrem lb/lb 4.6 4.25 4.6 4.25 4.6 4.25 BOD in mg/L 45.4 44 45.4 44 45.4 44 BOD in lb/day 1,136 1,101 1,249 1,211 2,726 2,642 N in mg/L 51.1 51 51.1 51 51.1 51 N in lb/day 1,278 1,276 1,406 1,404 3,067 3,062 Oxygen Demand lb/day 6,649 6,299 7,339 7,390 11,009 8,339 Density air 0.0755 0.075 0.0755 0.075 0.0755 0.075 Oxygen in Air % 23 23.2 23 23.2 23 23.2 SOR listed (Killam) lb/day 15,030 16,590 SOR calculated lb/day 15,142 13,345 16,714 15,657 25,071 17,667 OTE field % 16.0 12.40 16.0 12.40 16.0 12.40 Air Flow scfm 3,750 2,027 4,250 2,379 6,375 2,684 Duty Blower hp 125 375 200
The Killam design recommended three duty blowers each with a 125 hp motor to provide the maximum day air calculated, for a total duty power required of 375 hp. The CDM calculations indicate that only 200 hp is required for all the duty blowers to provide the maximum day air. The major difference is the calculated oxygen demand for the maximum day condition. Killam assumed a peaking factor of 1.5 on top of the maximum month calculated oxygen demand. CDM applies separate peaking factors for influent BOD and nitrogen demand for maximum day conditions – 1.57 and 1.27,

Section 4 Energy Conservation and Retrofit Measures (ECRM)
A 4-24
E:\HMUA\EnergyAudit\Final Report\Section 4.doc
respectively. These peaking factors are applied to average day conditions and are therefore much less conservative than the factor used by Killam.
4.2.3.2 Actual Current Conditions Averaging the actual air delivered to the nitrification tanks over a recent month gives 2,354 cfm with an average dissolved oxygen (DO) concentration in the nitrification tanks of 4.54 mg/L. The high DO concentration indicates that too much oxygen is being delivered to the nitrification tanks. The recorded volume of air delivered to the nitrification tanks also indicates that the air flow meters may need calibration or the installed blowers can actually provide more than their rated capacity of 2,287 cfm.
The facility influent data (flow, BOD and nitrogen loads) was analyzed to determine the actual required blower demands. Table 4-8 presents a summary of the relevant design parameters used to calculate the amount of air needed for nitrification as well as the blower motor horsepower required based on the actual current conditions.
Table 4-8: Nitrification System Calculation Summary – Actual Conditions
Average Max
Month Max Day Flow mgd 2.3 2.93 4.08 WW Temperature deg C 23.5 23.5 23.5 Beta 0.95 0.95 0.95 Alpha 0.65 0.65 0.65 Cd mg/L 8.5 8.5 8.5 DO mg/L 2.0 2.0 2.0 Cs mg/L 9.09 9.09 9.09 OD/BODrem lb/lb 1.564 1.564 1.564 OD/TKNrem lb/lb 4.25 4.25 4.25 BOD in mg/L 52.7 52.7 52.7 BOD in lb/day 1,011 1,288 1,793 N in mg/L 35.4 35.4 35.4 N in lb/day 679 865 1,205 OD lb/day 3,278 3,976 4,572 Density of Air 0.075 0.075 0.075 Oxygen in Air % 23.2% 23.2% 23.2% SOR calculated lb/day 6,945 8,424 9,686 OTE field % 12.40% 12.40% 12.40% Air Flow scfm 1,055 1,280 1,472 Duty Blower bhp 61 74 85 Blower Efficiency % 90% 90% 90% Estimated Blower Power hp 68 82 94

Section 4 Energy Conservation and Retrofit Measures (ECRM)
A 4-25
E:\HMUA\EnergyAudit\Final Report\Section 4.doc
Based on Table 4-8, the actual current conditions require approximately 70 hp to provide adequate air. This power equates to an energy cost of approximately $65,000 per year which is $43,000 less than what the facility is currently paying to operate the blowers.
4.2.3.3 Nitrification System Improvement Alternatives
Using the actual facility influent data to estimate the amount of air required for nitrification gives a range of about 1,080 to 2,663 scfm. The lower end of this range corresponds to a recommended minimum amount of air to keep the tanks mixed (surface area in sq. ft. * 0.12 scfm/sq. ft.).
One option to modify the existing blower system is to install an automatic oxygen control system where dissolved oxygen concentration readings at the nitrification tanks can be used to automatically throttle the inlet butterfly valve on the blower intake line. However, the absolute minimum air flow rate that the blowers can provide is about 1,300 cfm before the blowers go into a surge condition. Therefore, the minimum amount of air flow should conservatively be set at 1,500 to 1,600 cfm. At this air flow range, the inlet butterfly valve would be approximately 90 percent closed which is not a recommended operational protocol and therefore will not be considered further. Furthermore, at an air flow of 1600 cfm, it is estimated that the motor current, from extrapolating the motor current data shown in table 4-6, would be approximately 96 amps which equates to a power draw of 69 kW or 93 Hp. This power draw exceeds the required power for the replacement blower options presented further in this section.
A second option considered to modify the existing blowers would be to install variable speed drives (VFDs). Evaluating the required blower turndown based on the affinity laws, shows that the minimum amount of air that could be expected out of one blower is 2074 scfm. The calculation assumes 13 ft for static head and 1.5 ft for piping losses, which equals 6.25 psig of pressure that the blower has to overcome. The affinity laws give:
P2/P1 = n22/n12 (6.25 psig/7.6 psig) = n22/(3580 rpm)2, therefore, n2 = 3247 rpm.
Q2/Q1 = n2/n1 Q2/2287 scfm = 3247 rpm/3580 rpm, therefore, Q2 = 2074 scfm.
Since the reduced air flow of 2,074 cfm is not significantly different from the monthly average flow of 2,354 cfm, and significantly larger than the required air flow rate based upon table 4-8, the installation of VFDs will not be considered further as it is

Section 4 Energy Conservation and Retrofit Measures (ECRM)
A 4-26
E:\HMUA\EnergyAudit\Final Report\Section 4.doc
not expected to provide significant energy savings to provide a reasonable payback period.
Therefore, to achieve energy savings for the aeration system, three alternatives for the blowers were evaluated: installing new centrifugal blowers, installing new positive displacement blowers, and installing new turbo blowers.
4.2.3.4 Alternative 1: New Centrifugal Blowers New centrifugal blowers that are rated to meet both the maximum day design condition (2,684 scfm) as well as the minimum mixing requirement (1,080 scfm) could be provided. Manufacturers such as Turblex can provide one duty and one standby blower to meet the conditions of the facility. It is estimated that the average required power would be approximately 50 hp which results in $61,000 in energy savings. New instrumentation and controls are recommended to automatically control the blowers’ output capacity to fully realize the energy savings.
4.2.3.5 Alternative 2: New Positive Displacement Blowers New positive displacement blowers that are rated to meet both the maximum day design condition (2,684 scfm) as well as the minimum mixing requirement (1,080 scfm) could be provided. Manufacturers such as Aerzen can provide two duty and one standby blower to meet the conditions of the facility. It is estimated that the average required power would be approximately 52 hp which results in $60,000 in energy savings. Variable speed drives as well as new instrumentation and controls are recommended to automatically control the blowers’ output capacity to fully realize the energy savings.
4.2.3.6 Alternative 3: New Turbo Blowers New turbo-type blowers that are rated to meet both the maximum day design condition (2,684 scfm) as well as the minimum mixing requirement (1,080 scfm) could be provided. Manufacturers such as Neuros can provide two duty and one standby blower to meet the conditions of the facility. It is estimated that the average required power would be approximately 45 hp which results in $66,000 in energy savings. New instrumentation and controls are recommended to automatically control the blowers’ output capacity to fully realize the energy savings.
Table 4-9 presents preliminary costs, savings and a simple payback period for each of the blower alternatives.

Section 4 Energy Conservation and Retrofit Measures (ECRM)
A 4-27
E:\HMUA\EnergyAudit\Final Report\Section 4.doc
Table 4-9: Blower Alternatives Probable Cost Summary Alt. 1 – New
Centrifugal Blowers
Alt. 2 – New Positive
Displacement Blowers
Alt. 3 – New Turbo
Blowers
Engineer’s Opinion of Probable Construction $925,000 $784,000 $871,000 Annual Energy Savings $61,000 $60,000 $66,000 Annual O&M Cost $4,000 $6,000 $6,000 Simple Payback (years) 16.2 14.5 14.5
With regards to an aeration system control scheme, we envision installing three (3) blowers (2 duty; 1 standby) configured in the current parallel piping arrangement. A dissolved oxygen sensor and controller would be provided for each nitrification tank. The dissolved oxygen controller along with the air flow as measured through the existing air flow meters would throttle a new motorized butterfly valve controlling the air flow to each respective nitrification tank. A pressure transducer and controller would need to be installed on the common discharge header that would control the speed of the blowers. For example, if the dissolved oxygen concentration in any one or both nitrification tanks increases, then the motorized valve(s) would close thus increasing the air pressure in the common header causing the blower(s) speed to reduce. In other words, the motorized valves will distribute the total blower output to the two nitrification tanks and at least one of these valves is always maintained in its most open position to minimize the main air pressure. Under this control scenario, the dissolved oxygen concentration in each nitrification tank is controlled independently from each other. This type of control is often referred to as “most open valve” control.
Based upon the simple payback periods presented in Table 4-9, it is recommended that the existing blowers be replaced with turbo-type blowers as the payback period of about 14.5 years is cost effective considering the blowers have a 20 year expected useful life. The positive displacement-type blowers have the same estimated payback period; however, the turbo-type blowers are more efficient and therefore yield a higher annual energy savings. Catalog information for the turbo blowers is included in Appendix C. Not included in this analysis is the value of the existing blowers that the Authority may realize upon future potential sales of the equipment.

Section 4 Energy Conservation and Retrofit Measures (ECRM)
A 4-28
E:\HMUA\EnergyAudit\Final Report\Section 4.doc
4.2.4 Anaerobic Digestion System 4.2.4.1 Sludge Processing Alternatives As discussed in Section 2.2.7, primary sludge is currently conveyed to the primary digester and waste activated sludge is conveyed to the Pre-Thickened Sludge Wet Well where it is thickened to approximately six percent solids through a gravity belt thickener prior to being conveyed to the primary digester. Provisions have been made at the previous plant upgrade to convey primary sludge directly to the Pre-Thickened Sludge Wet Well where it can be co-thickened with waste activated sludge, if so desired, prior to its introduction into the primary digester. Initially, the primary digester was provided with a draft tube mixing system which has been removed from operation. Digester mixing is currently minimal and is being achieved through circulating the contents of the digester through the sludge heat exchanger recirculation pump and grease is kept in suspension through a roof mounted grease recirculation pump system. Currently, the contents of the secondary digester are not mixed. CDM has evaluated the current operation of the anaerobic digestion process and has identified and evaluated potential alternative technologies to enhance sludge digestion with the ultimate goal of improving digester gas production for potential use as fuel for future combined heat and power co-generation systems. The alternative technologies to enhance sludge digestion will be presented in Section 4.2.4.4 entitled Technologies to Enhance Sludge Digestion.
Primary Sludge and Thickened Waste Activated Sludge (Current Mode of Operation)
A summary of the primary sludge flow for the operational period spanning from January 2007 to December 2008 was tabulated and is presented in Appendix D indicates that the maximum month average primary sludge flow to the primary digester was 15,770 gallons per day which occurred during December 2008 having a percent solids concentration of 3.39 percent and a percent volatile solid concentration of 0.81 lb-VSS/lb-TSS. The corresponding total solids loading and volatile solids loading are 4,458 pounds per day and 3,610 pounds per day, respectively.
Additionally, review of the waste activated sludge production data as shown in Appendix D reveals that the current maximum average month production of waste activated sludge occurred during January 2008 at a value of 9,100 gallons per day. With a 95 percent capture rate for the gravity belt thickeners and a solid concentration of the thickened waste activated sludge of 6 percent, 360 pounds per day of thickened waste activated sludge or 720 gallons per day is produced which can be conveyed to the primary digester. Currently, plant operations staff has reported that 1,000 gallons per day of thickened waste activated sludge is being conveyed to the primary

Section 4 Energy Conservation and Retrofit Measures (ECRM)
A 4-29
E:\HMUA\EnergyAudit\Final Report\Section 4.doc
digester. The volatile portion of the thickened waste activated sludge, assuming 0.8 lb-VSS/lb-TSS is computed to be 290 pounds per day.
These operational values represent approximately fifty percent of the design basis of 9,050 lb/day of total solids loading and 6,360 pounds per day of volatile solids loading based upon maximum month loading conditions as presented in Section 2.2.7.
Based upon a usable digester volume of 53,000 ft3 (396,440 gallons), at the maximum average month condition for both primary and waste activated sludge, corresponds to a volatile solids load to the primary digester of 0.073 lb/ft3-day. Additionally, based upon a maximum average month primary sludge and thickened waste activated sludge flow of 15,770 gallons per day and 1,000 gallons per day, respectively, and a usable digester volume of 396,440 gallons, the digester detention time is computed to be approximately 24 days. Typical design peak sustained volatile solids loading ranges from 0.12 to 0.16 lb VS/ft3-day and detention times range between 10 and 20 days. Based upon the plant 2007-2008 operational data, it can be concluded that the primary digester is under loaded.
As shown in Figure 2-1, at a digester feed sludge volatile solid concentration of 80 percent and at a hydraulic detention time of approximately 24 days, yields a theoretical volatile solid destruction of 59 percent for digesters with efficient digester mixing systems, which at an average gas production rate of 15 ft3/lb-VSS destroyed, yields a calculated maximum month gas production rate of 34,515 ft3/day.
A review of the facility’s 2008 gas production data indicates an average gas production rate of 25,850 cubic feet /day from the primary digester as measured from existing gas meters, which corresponds to a volatile solids reduction of 48 percent based upon an average gas production rate of 15 ft3/lb-VSS destroyed. Volatile solids destruction of 40 – 65 percent are typical values, indicating that the digestion system is currently operating at the low end of this range with the potential to improve the process, creating more available energy through increased production of digester gas.
Furthermore, at a volatile solid loading of 3,900 pounds per day (3610 pounds per day of primary sludge plus 290 pounds per day of thickened waste activated sludge) and a volatile solid destruction of 48 percent, the reduction in volatile solids is 1,872 pounds per day. At a total solid concentration of approximately 3 percent, 7,480 gallons per day of digested sludge is to be conveyed to the Thickened Sludge Wet Well to be eventually hauled away as liquid waste. To reduce hauling costs associated with digested sludge, if possible, it is recommended that the Authority consider redirecting the digested sludge to the Pre-Thickened Sludge Wet Well where it can be thickened prior to hauling. For example, with a 95 percent capture rate for the gravity belt thickeners and a solid concentration of the thickened sludge of 6 percent, 1,780

Section 4 Energy Conservation and Retrofit Measures (ECRM)
A 4-30
E:\HMUA\EnergyAudit\Final Report\Section 4.doc
pounds per day of thickened digested sludge or 3,560 gallons per day whill be produced which can ultimately be removed offsite as liquid waste by a private sludge hauling contractor; a volume reduction of 50%.
A potential explanation for the noted difference between actual and theoretical volatile solids destruction stems from the fact that since the primary digester does not have an efficient operational mixing system, a layer of sludge and grit may have accumulated at the bottom of the digester thus consuming usable digester volume. Upon review of the digester drawings, it estimated that the approximate depth of the accumulated sludge and grit is 9’-0” deep which is the elevation of the sludge recirculation pump suction takeoff within the primary digester. The actual depth, however, may be greater. This depth corresponds to a volume of 17,660 ft3 thus reducing the useful volume of the digester from 53,000 ft3 to approximately 35,330 ft3. At a primary sludge and thickened waste activated sludge flow of 15,770 gallons per day and 1,000 gallons per day, respectively, with a reduced digester volume of 35, 330 ft3 (264,300 gallons), results in a hydraulic detention time of approximately 15.7 days, which, from Figure 2-1, correlates to a 54 percent expected reduction in volatile solids. At a noted volatile solid destruction of 48 percent, it can be further reasoned that the depth of the accumulated sludge and grit may be above the expected depth of 9’-0” as previously discussed.
Determination of Maximum Volatile Solid Loading to the Primary Digester To determine the maximum volatile solid loading for the primary digester, two digester operating conditions will be examined. The first condition assumes that the primary digester is equipped with an efficient and operable mixing system (which is highly recommended) with a digester usable volume of 53,000 ft3 and the second condition examines the current operation of the primary digester, i.e. no mixing system with an estimated usable volume of 35, 330 ft3.
To determine the maximum volatile solid loading for the primary digester under the two digester operating conditions, an allowable volatile solids loading rate of 0.14 lbs/ft3-day will be used.
Primary Digester at a usable volume of 53,000 ft3
Under the current maximum average month conditions, the total volatile solids loading to the primary digester associated with primary and thickened waste activated sludge is computed to be 3,900 pounds per day (3,610 pounds per day of primary sludge + 290 pounds per day of thickened waste activated sludge) which equates to a volatile solids loading to the primary digester of 0.073 lbs/ft3-day. The

Section 4 Energy Conservation and Retrofit Measures (ECRM)
A 4-31
E:\HMUA\EnergyAudit\Final Report\Section 4.doc
corresponding digester detention time is computed to be 24 days. Detention times greater than 15 days are required to meet Class B pathogen reduction.
Assuming that the primary digester will be equipped with an efficient and operable mixing system, the maximum volatile solid loading that can be conveyed to the primary digester based upon an allowable volatile solids loading rate of 0.14 lbs/ft3-day, is 7,420 pounds per day. With a total volatile solids loading of 3,900 pounds per day consisting of primary sludge and thickened waste activated sludge that is currently being conveyed to the primary digester, the primary digester can accept an additional volatile solid loading of 3,520 pounds per day. Additional volatile solids loading cannot be obtained by adding increased volumes of primary or thickened waste activated sludge as the mass balance of the sludge system cannot support additional production of these sludge quantities.
Increasing the volatile solid loading to the primary digester by 3,520 pounds per day, assuming that the digester is equipped with an efficient mixing system allowing for a theoretical volatile solid destruction of 59 percent and at an average gas production rate of 15 ft3/lb of volatile solid destroyed, the additional gas production is calculated to be 31,150 ft3/day. This gas production value coupled with the actual measured gas production of 25,850 ft3/day yields an expected total gas production of 57,000 ft3/day.
The addition of fats, oils and grease to the primary digester will be examined as a potential alternative to increase the volatile solid loading to the digester. A detailed evaluation of this alternative is discussed later on in this section.
Primary Digester at a usable volume of 35,330 ft3
Assuming that the primary digester is continued to be operated under its current condition, i.e. mixing the contents of the digester via the sludge heat exchanger recirculation pump, the maximum amount of primary and thickened waste activated sludge that can be conveyed to the primary digester based upon an allowable volatile solids loading rate of 0.14 lbs/ft3-day, is approximately 4,950 pounds per day. With a primary sludge and thickened waste activated sludge volatile solids loading of 3,900 pounds per day being conveyed to the primary digester on a maximum average month basis, the primary digester can now only accept an additional volatile solid loading of 1050 pounds per day. Additional volatile solids loading cannot be obtained by adding increased volumes of primary or thickened waste activated sludge as the mass balance of the sludge system cannot support additional production of these sludge quantities.
Increasing the volatile solid loading to the primary digester by 1,050 pounds per day, assuming that the digester is not equipped with an efficient mixing system, at a

Section 4 Energy Conservation and Retrofit Measures (ECRM)
A 4-32
E:\HMUA\EnergyAudit\Final Report\Section 4.doc
volatile solid destruction of 48 percent and at an average gas production rate of 15 ft3/lb of volatile solid destroyed, the additional gas production is calculated to be 7,560 ft3/day. This gas production value coupled with the actual measured gas production of 25,850 ft3/day yields an expected total gas production of 33,410 ft3/day. As will be discussed in Section 4.2.4.5 entitled Co-Generation Technologies, this expected gas production may not be sufficient to support a combined heat and power co-generation system as the available heat production may not be sufficient to heat the contents of the primary digester.
Primary and Thickened Waste Activated Sludge and Fats, Oils and Grease At a time when energy costs are rising, energy recovery is especially beneficial. One of the desirable characteristics of biodegradable fats, oil, and grease (FOG) is its high energy content. When digested under anaerobic conditions, FOG increases the digester methane yield and total quantity of gas produced.
Typically FOG digestion is more difficult than digestion of primary and waste activated sludges for digesters whose diameter is approximately more than twice its depth. FOG tends to float, so the challenge is to break up the FOG by ensuring adequate digester mixing intensity. Heating of the FOG to more than 160 ºF prior to injection into the digester will liquefy the FOG, promoting better FOG digestion from enhanced mixing, as well as even distribution of FOG throughout the digester volume.
Since FOG is a high-energy material, slug loading the digester with FOG is not desirable, because it can lead to digester upsets or poor digestion of FOG. Therefore, a FOG holding tank large enough to enable FOG to be fed continuously to the digesters at a low rate is recommended.
A typical grease digestion system consists of a fiberglass-reinforced plastic or steel grease holding tank, tank mixing pump, grease feed pump, and tank heating system. Grease haulers can pump grease from their trucks into the grease holding tank. A typical FOG load is between 2,000 and 5,000 gallons and consists of 15 to 20 percent grease, with the balance being water. The grease holding tank mixing pump runs continuously, emulsifying the grease to the consistency of cottage cheese. Over time, grease is pumped into the primary digester. See Figure 4-9 for a typical grease digestion system.

Section 4 Energy Conservation and Retrofit Measures (ECRM)
A 4-33
E:\HMUA\EnergyAudit\Final Report\Section 4.doc
Figure 4-9: Schematic of a Typical Grease Digestion System
Typically, the grease tank mixing pump is a chopper pump and the grease feed pump is a progressive-cavity pump. Care must be taken with regard to the selection of the material for the progressive-cavity pump’s stator as significant wear can be expected as a result of conveying grit. The grease holding tank typically has a conical bottom to facilitate grit accumulation.
One issue with grease digestion is the timing of the grease deliveries and subsequent pumping into the digester. During periods of high deliveries, the grease feed rate to the digester must be increased to make room in the grease holding tank.
The most important design consideration is the increase in solids loading on the primary digester from the grease. Achieving a significant increase in digester gas production requires a significant increase in volatile solids loading. For example, for the City of Watsonville, California, wastewater treatment plant, the average grease delivery was 6100 gallons per day increasing their volatile solids loading by 0.03 lb/day- ft3 or approximately 20 percent.
Other important design considerations include adequate digester mixing, grease holding tank volume, mixing rate, and grease feed pump flow. Because gas production will increase, the digester gas handling system should be checked for adequate capacity, including the gas pipe sizing and equipment capacities, such as pressure relief valves, flame arrestors, condensate tanks, and waste gas flares.

Section 4 Energy Conservation and Retrofit Measures (ECRM)
A 4-34
E:\HMUA\EnergyAudit\Final Report\Section 4.doc
Adding grease to anaerobic digestion is relatively inexpensive and a potential source of income; however, an evaluation should be performed before beginning design of the digestion system. The evaluation should consider the following elements:
Estimate potential grease volume;
Evaluate digester grease-digestion capacity;
Evaluate additional heating requirements for heating the grease within the grease holding tank;
Estimate increased digester gas production with the assumption that grease is 100 percent volatile solids and digests 100 percent;
Review existing gas handling capacity;
Review existing gas utilization capacity;
Determine size and location of grease receiving station;
Estimate construction cost;
Estimate increased gas production value;
Estimate revenue from accepting grease;
Perform economic evaluation.
To determine the quantity of fats, oils and grease that can be conveyed to the primary digester, it is assumed that the primary digester will be upgraded to include an efficient and operable mixing system. An efficient digester mixing system is a requirement to allow FOG to be conveyed to the digester for digestion.
Based upon an additional volatile solids loading of 3,520 pounds per day as previously discussed, and at a solid content of FOG of 15 percent as indicated in design literature, approximately 2,800 gallons per day of FOG can be added to the primary digester.
The detention time of the primary digester when adding primary sludge at 15,770 gallons per day, FOG at 2,800 gallons per day, and thickened waste activated sludge at 1,000 gallons per day is calculated to be approximately 20 days.

Section 4 Energy Conservation and Retrofit Measures (ECRM)
A 4-35
E:\HMUA\EnergyAudit\Final Report\Section 4.doc
Since the FOG will be heated to 160 0 F, there will be no additional sludge heating load to convey the 2,800 gallons per day of FOG to the digester.
For estimating purposes, assume a temperature loss from the primary digester of approximately 10F per day, the estimated heat loss can be computed as follows:
Q = 53,000 ft3 x 62.4 lb/ft3 x 10F/day = 3,307,200 Btu/day = 137,800 Btu/hr.
The total heat load requirement is calculated as follows:
QT = 262,240 Btu/hr + 137,800 Btu/hr. = 400,040 Btu/hr. which is less than the rated capacity of the existing spiral sludge heat exchanger of 580,000 Btu/hr. and existing boiler of 660,000 Btu/hr.
A conceptual design of the FOG system will consist of a nominal capacity steel grease holding tank of 10,000 gallons with external jacketed heating coils, a 350 gpm recirculation chopper pump, a progressive cavity pump rated for 35 – 1600 gph with a variable frequency drive and an inline grinder to be installed on the suction side of the progressive cavity pump. The FOG system will consist of PVC interconnecting piping. To achieve a 2,800 gallon per day FOG loading to the primary digester and assuming a 5,000 gallon storage volume of FOG (typical volume capacity of a septage receiving truck), the frequency of FOG deliveries is estimated to be 2 to 3 times per week.
The governing heating requirement for the design of a FOG system must include the heating requirement for heating sludge to the primary digester and the heating requirement for raising the temperature of FOG within the FOG storage tank from 50 degrees F to 160 degrees F. Both of these heating requirements occur simultaneously until the FOG reaches the 160 degree temperature. Therefore, based upon a 5,000 gallon storage volume of FOG and using a 10 degree temperature difference of FOG in the storage tank, the heating requirement to heat the grease within the storage tank is approximately 420,000 Btu/hr. Adding this heat transfer requirement to the sludge heat transfer requirement of 400,000 Btu/hr, the total heat transfer requirement is computed to be 820,000 Btu/hr. It will be shown and discussed in Section 4.2.4.5 entitled Co-Generation Technologies that the available heat produced by combined heat and power co-generation systems, based upon the projected gas production rate of 57,000 ft3/day, is insufficient to support both digester and FOG heating requirements. Therefore, further evaluation of adding FOG into the primary digester will not be conducted.
Table 4-10 summarizes the above analyses for the various sludge and FOG operational scenarios.

Section 4 Energy Conservation and Retrofit Measures (ECRM)
A 4-36
E:\HMUA\EnergyAudit\Final Report\Section 4.doc
Table 4-10: Various Sludge and FOG Operational Scenarios
Sludge Processing
Volatile Solids
Sludge Loading
Detention Time
(Days)
Volatile Solids
Destruction
Gas Production
Heating Requirement
PSL + TWAS 3,900 16,770* 24* 48* 25,850* 400,000
PSL + TWAS 3,900* 16,770* 24* 59(1) 35,515(1) 400,000
PSL + TWAS + FOG
7,420 19,570 20 59 57,000(1) 820,000(2)
*Based upon plant operating data and current operation of the primary digester. PSL = Primary Sludge TWAS = Thickened Waste Activated Sludge FOG = Fats, Oils, and Grease Note 1: Assumes installation of a digester mixing system within the primary digester. Note 2: Includes sludge heating load of 400,000 Btu/Hr and a FOG heating load of 420,000 Btu/Hr.
4.2.4.2 Digester Mixing Contents of the digester should be adequately mixed to avoid significant variations in temperature and solids concentration. Mixing the digesters will work to maintain the process, increase gas production and avoid grit and sludge accumulation by keeping heavier solids entrained in the sludge rather than settling to the bottom.
To avoid the accumulation of scum within the primary digester, the contents are currently circulated via a Vaughan scumbuster system and digester mixing is accomplished by conveying the contents of the digester through the existing sludge heat exchanger recirculation pump system. As mentioned previously, this method of digester mixing is inefficient and a more efficient scheme of digester mixing should be evaluated to enhance gas production and to avoid solids from settling thus reducing usable digester volume.
There are various types of anaerobic digester sludge mixing equipment currently available to address the goal to increase digester mixing efficiency. For this study, CDM evaluated the following mixing systems:
1. Confined Gas Mixing System – “GasLifter” as manufactured by Walker Process Equipment (Appendix E).

Section 4 Energy Conservation and Retrofit Measures (ECRM)
A 4-37
E:\HMUA\EnergyAudit\Final Report\Section 4.doc
2. External Pump and Nozzle Mixing System – “Rotamix Process Mixing System” as manufactured by Vaughan Company, Inc. (Appendix E)
Confined Gas Mixing System The GasLifter system provides efficient sludge mixing by recirculating compressed digester gas through a single, centrally located, floor-mounted educator tube with individual gas lances to create an airlift effect. Additionally, swirl vanes are located in the top of the GasLifter educator tube to provide a rotational force to the digester contents.
CDM coordinated with Walker Process by providing information on the primary digestion system, including sludge type, concentration, digester size, cover type and tank geometry. Based on the manufacturer’s past experience and empirical models, the proposed mixing system was designed to achieve a turnover rate at maximum liquid level of 26 minutes in the primary digester.
A 36-inch diameter educator tube with a 10 hp gas compressor rated at 200 cfm output would be required. The 10 hp compressor is to be operated continuously with the compressor housing located be on the roof of the Digester Control Building as in the initial design.
External Pump and Nozzle Mixing System The second type of mixing system evaluated was the Vaughan Rotamix Mixing System. This system utilizes floor-mounted sludge mixing nozzles fed by a chopper pump. The use of the chopper pump minimizes nozzle clogging. The mixing performance is developed using a dual rotational mixing field, providing efficient mixing. The system works by the use of jet mixing technology, which generates a high velocity stream at each nozzle discharge.
The two main components of the system are the external chopper pump and the mixing nozzles. The chopper pump is designed with a flushless mechanical seal and direct mounted motor. The floor mounted mixing nozzles are glass lined cast ductile iron, with a 1-inch wall thickness and hardness of Rockwell 73C.
CDM coordinated with Vaughan by providing information on the primary digestion system, including sludge type, concentration, digester size, cover type and tank geometry. Based on the manufacturer’s past experience and empirical models, the proposed mixing system is designed to provide 1500 gpm of recirculation flow to ensure adequate turn-over. A 25 hp chopper pump is required. This mixing system is to be operated continuously.
Section 4 Energy Conservation and Retrofit Measures (ECRM)
A 4-38
E:\HMUA\EnergyAudit\Final Report\Section 4.doc
Regardless of the type of mixing system selected, the existing Vaughan scumbuster system, having a 20 Hp motor and is operated continuously, can be taken out of service which will result in an annual energy savings of 130,700 kW-hrs/year at a cost savings of $18,62500.
A digester mixing system is recommended to be furnished and installed for the primary digester, regardless of the payback period, as installation of a digester mixing system will yield efficient digester operation, increased volatile solid destruction, and increased gas production.
Based upon the above, a confined gas mixing system called “GasLifter” as manufactured by Walker Process Equipment is being recommended for further evaluation as this system has less energy requirements as compared to the Vaughan Rotomix system. The Engineer’s Opinion of Probable Construction Cost based upon conceptual design for furnishing and installing a confined gas mixing system is $317,550. Not included in this estimate are the costs associated with hauling primary and thickened waste activated sludge offsite over the duration of construction including draining and cleaning the inside of the primary digester. Primary sludge must be redirected to the Pre-Thickened Sludge Wet Well for thickening during the duration of construction. The cost to haul the primary sludge diverted from the primary digester during cleaning and construction and the cost to haul the contents of the primary digester to allow for installation of the mixing equipment amounts to $60,000.
The energy required to operate the confined gas mixing system, based upon a 10 hp motor operating continuously is 65,350 kW-hrs/year, which results in an annual cost of $9,312. This results in a net energy savings from placing the existing Vaughan scumbuster system out of operation of approximately 65,350 kW-hrs/year or $9,315.00.
Additionally, it is expected that the installation of a digester mixing system will increase volatile solid reduction from 48 percent as currently experienced to approximately 59 percent thereby reducing the volume of solids to be thickened and removed offsite as liquid sludge. Based upon the current volatile solid loading from primary and thickened waste activated sludge of 3,900 pounds per day, the anticipated reduction in volatile solids is calculated to be:
Volatile solid destruction = 3,900 pound per day x 0.59 = 2,300 pounds per day.
At a total solid concentration of approximately 3 percent, a reduction of 9,200 gallons per day is expected as compared to 7,480 gallons per day as currently experienced with a net reduction of 1,720 gallons per day of digested sludge to be conveyed to the

Section 4 Energy Conservation and Retrofit Measures (ECRM)
A 4-39
E:\HMUA\EnergyAudit\Final Report\Section 4.doc
Thickened Sludge Wet Well for thickening. Assuming that the Authority elects to thicken digested sludge prior to hauling as discussed in Section 4.2.4.1,with a 95 percent capture rate for the gravity belt thickeners and a solid concentration of the thickened sludge of 6 percent, a reduction of 410 pounds per day of thickened digested sludge or 820 gallons per day is anticipated to be enjoyed by the Authority as a result of operating a digester mixing system, which equates to a sludge hauling savings of 213,200 gallons per year and at a sludge hauling cost of $0.0765/gallon, a annual cost savings of $16,300.00.
The installation of a digester mixing system is anticipated to increase the gas production to 35,515 ft3/day from the current average monthly gas production of 25,850 ft3/day, a difference of 9,665 ft3/day. This additional gas production can be used to either provide fuel for a cogeneration system as discussed in Section 4.2.4.5 Co-Generation Technologies to provide electrical power or as fuel to operate a boiler system for future heating requirements. To establish a dollar value for the projected additional digester gas production, as shown in Section 4.2.4.5, for an internal engine generator system operating at a gas supply of 35,515 ft3/day, 692,484 kW-hrs/year of electrical energy is expected to be produced at an annual electric energy cost savings of $98,680.00. This equates to $2.85/ft3 per day of gas production or $27,545.00 per year for the additional gas production of 9,665 ft3/day. Conversely, at a digester gas heating value of 600 BTU/ft3, the additional gas production of 9,665 ft3/day corresponds to 240,000 BTU/hr of available heat energy. At a heating value of 140,000 BTU/gal for #2 fuel oil, this equates to a fuel oil usage of 1.7 gal/hr. Assuming that the heating season extends from October through April, a period of 212 days, and assuming boiler operation at 18 hours per day, equates to approximately 6,490 gallons of fuel oil per heating season. At a fuel oil cost of $2.6006/gal, this equates to an annual fuel oil cost savings of $16,875.00 or $1.75/ft3 of gas production. For conservatism, the computation of simple payback analyses will use the annual cost savings of $16,875.00.
The cost of annual maintenance associated with the gas mixing system is not expected to increase relative to the current maintenance requirements and costs associated with the Vaughan scumbuster system.

Section 4 Energy Conservation and Retrofit Measures (ECRM)
A 4-40
E:\HMUA\EnergyAudit\Final Report\Section 4.doc
Table 4-11 Digester Mixing System Probable Cost Summary
Installation Cost $318,000
Additional Sludge Hauling Costs During Construction
$60,000
Annual Energy Savings $9,315
Annual O&M Cost $0
Annual Sludge Hauling Savings $16,300
Annual Fuel Oil Savings $16,875
Simple Payback Period 9 years
The simple payback period for furnishing and installing a digester mixing system considering capital equipment and construction costs, energy and sludge hauling cost savings and maintenance costs is calculated to be 8 years. Given the simple payback period of 8 years, installing a gas mixing system for the primary digester is considered to be cost effective when considering that the equipment life cycle is 20 years.
4.2.4.3 Insulation of Primary Digester Cover Insulation of the primary digester cover offers the opportunity to reduce the conductive heat loss from the cover and ultimately reduce the required heat load on the existing boiler system. For the primary digester, under existing conditions, the heat loss through the roof is calculated to be, using a heat transfer coefficient of 0.35 Btu/ft2*deg F*hr., and a temperature differential of 95 degrees F (95 degrees F inside temperature – 0 degrees F outside temperature) approximately 65,300 Btu/hr. which is 18 percent of the heat load on the sludge heating loop.
The recommended method of insulation for the primary digester cover is spray applied urethane foam insulation which is a polyfoam system manufactured by GACO Western, Inc. or an equal having a minimum thickness of 2-inches which provides a minimum of an R-14 resistance rating (U=0.07 BTU/ft2*deg F*hr). At this insulation rating, the conductive heat loss through the primary digester cover is reduced to approximately 13,000 BTU/hr. or a net reduction in heat loss of 52,300 Btu/hr.

Section 4 Energy Conservation and Retrofit Measures (ECRM)
A 4-41
E:\HMUA\EnergyAudit\Final Report\Section 4.doc
The reduction in the net heat loss of approximately 52,000 BTU/hr, at a digester gas heating value of 600 Btu/ft3, will free up an additional 90 ft3/hr or 2,100 ft3/day of digester gas that can be used as fuel for potential future combined heat and power co-generation systems.
As presented in Section 4.2.4.2, in order to establish a dollar value for the additional digester gas to be captured as a result of insulating the primary digester cover, the total heat load gained from the 2,100 ft3/day of digester gas, assuming a digester gas heating value of 600 Btu/ft3 is calculated to be 52,500 Btu/hr of additional heat energy. At a heating value of 140,000 Btu/gal for #2 fuel oil, this equates to a fuel oil usage of 0.375 gal/hr. Assuming that the heating season extends from October through April, a period of 212 days, and assuming a boiler operation of 18 hours per day, equates to approximately 1,430 gallons of fuel oil per heating season. At a fuel oil cost of $2.60/gallon, this equates to an annual fuel cost savings of $3,720/year.
Based upon previous digester cover insulation construction contracts, it is reasonably estimated that the cost associated with insulating the primary digester cover will be approximately $15/ft2, which includes costs associated with inflation, contractor’s mobilization, set-up, overhead and profit, and at a cover diameter of 50 feet (1,962 ft2 in area) the cost to insulate the primary digester cover is computed to be approximately $30,000.00.
The simple payback period using an annual fuel cost savings of $3,720/year is computed to be 8 years.
4.2.4.4 Technologies to Enhance Sludge Digestion A technology that was evaluated to enhance sludge digestion included ultrasonic degradation of waste activated sludge.
Ultrasonic Degradation of Waste Activated Sludge Initial studies into the use of ultrasound in wastewater treatment applications started in 1994 with laboratory scale analyses. These studies were aimed at investigation of the affects of ultrasound on the efficiency of the anaerobic sludge digestion process, and the minimization of waste activated sludge from the activated sludge process. The lab and pilot scale tests were so promising that a full scale reactor was built and tested at several wastewater treatment plants. The excellent performance achieved during these full scale trials, resulted in wide spread attention to the use of ultrasound to wastewater treatment applications.
One such manufacturer of an ultrasonic degradation system is EIMCO who markets their product as the Sonolyzer system.
Section 4 Energy Conservation and Retrofit Measures (ECRM)
A 4-42
E:\HMUA\EnergyAudit\Final Report\Section 4.doc
The key components of the EIMCO Sonolyzer system include a plug flow like treatment reactor equipped with five (5) ultrasonic energy oscillating units. The oscillating units are connected to a power generator that supplies the electrical energy necessary for the production of ultrasonic waves. The entire system is very compact and is furnished skid mounted with a control panel, power disconnect, sludge pump, and interconnecting piping.
The reactor is a short detention time, plug flow compartment constructed of stainless steel. It comes equipped with a feed inlet and treated sludge outlet connection. The reactor is fitted with five (5) ultrasonic energy oscillating units for imparting ultrasonic energy to the feed sludge. Each oscillating unit is comprised of a transducer, booster and horn (sonotrode). The horn is positioned within the contacting reactor applying ultrasonic energy to the feed sludge. By virtue of the horn locations within the reactor, feed sludge is exposed to ultrasonic energy five times during its residence time within the reactor. The specific design and positioning of the oscillating units and reactor is the key to achieving the best results from ultrasonic treatment.
Electrical energy is supplied to the oscillating units from a highly efficient, reliable power generator. This generator and oscillating unit are designed to insure production of high intensity ultrasonic energy. Intensity is determined by the relationship between the power delivered by the ultrasound oscillating unit and the surface of the sonotrode where the energy is delivered to the feed sludge. Low intensity devices are capable of producing what is called “soft cavitation”. This type of cavitation is not capable of significant treatment of sludge. Hard cavitation, on the other hand, occurs at high intensity levels and produces significant treatment of sludge. The EIMCO Sonolyzer system produces a high intensity energy input of about 50 W/cm2. This horn element must be designed to accommodate this level of intensity so as not to excessively compromise horn material life.
The EIMCO Sonolyzer uses ultrasonic waves to accomplish the fragmentation and separation of the sludge flocs, as well as the break down and disintegration of sludge cells. Since the key to the performance of the EIMCO Sonolyzer resides in the use of acoustic energy, understanding of “sound” and its properties is fundamental to the design, application and performance of the system. Sound can be defined as waves of compression and expansion passing through gases, liquids or solids. Ultrasound is generally defined as sound with a frequency greater than 20,000 cycles per second or 20 kHz.
Ultrasonic sound waves are created by vibrating objects and then propagated while transporting energy to the medium and to objects that the wave contacts. As

Section 4 Energy Conservation and Retrofit Measures (ECRM)
A 4-43
E:\HMUA\EnergyAudit\Final Report\Section 4.doc
ultrasound passes through a liquid, the expansion cycles exert negative pressure on the liquid, pulling molecules away from one another. If the ultrasound energy level is sufficiently intense, the expansion cycle can create cavitation in the liquid. Normally, cavitation occurs at pre-existing weak points in the liquid, and as such it requires a nucleus. Since wastewater sludge or mixed liquor contains a large quantity of particles, cavitation gas bubbles can readily be formed provided the ultrasound energy level is sufficiently intense.
Once produced, small gas bubbles excited with ultrasound will absorb energy from the sound waves and grow until they can no longer absorb energy. At this moment, these bubbles implode with a highly localized “hot spot” created with temperatures of roughly 9,000°F and a pressure of about 7500 PSI. These extreme conditions can generate thermal break down and highly reactive free radicals from the water vapor contained in the bubble. The violent collapse will also produce high shear forces by the presence of jet streams in the liquid immediately surrounding the imploded bubble. These forces are responsible for the physical breaking action of substances that are present in the surrounding liquid. The physical effects of the imploding cavitation bubbles have violent and significant effects on the structure of microorganisms present in sludge resulting in a weakening, break up and even disintegration of cells.
Cavitation by ultrasound is made possible by use of a generator that supplies electrical energy at the desired ultrasonic frequency to an oscillating unit transducer which in turn converts the electrical energy from the ultrasonic generator into mechanical vibrations that generate the ultrasonic waves.
Ultrasound, properly and efficiently generated and properly applied to the sludge, results in microbiological degradation from cavitation and from high shear stresses as described above. Simply breaking apart sludge flocs is not enough to achieve significant improvement in volatile solids destruction and methane production during anaerobic digestion. To accomplish this, breakup of the microorganism cell wall is required. Only hard cavitation is capable of this effect.
The Eimco Sonolyzer system has several applications to the wastewater treatment process as shown in Figure 4-10.

Section 4 Energy Conservation and Retrofit Measures (ECRM)
A 4-44
E:\HMUA\EnergyAudit\Final Report\Section 4.doc
Figure 4-10: Eimco Sonolyzer System Schematic
At the current thickened waste activated sludge production of 1,000 gallons per day, it was deemed by the manufacturer that because of such a small volume of thickened waste activated sludge, the additional volatile solids destruction, additional gas production and energy savings cost that can be expected from their system will not provide an attractive payback period to offset installation costs and energy costs associated with their system operation.
For example, the expected volatile solids destruction from the ultrasonic degradation system is expected to be 57 percent with digester gas production of approximately 29,100 ft3/day, an increase of 3,250 ft3/day from the current measured gas production, at a capital equipment cost of $245,000.00 and an estimated annual operating cost of $18,000.00 per year as compared to a volatile solid destruction of approximately 59 percent with a calculated digester gas production of 34,515 ft3/day when incorporating a digester mixing system. Since it has been recommended that a digester mixing system be furnished and installed for the primary digester, the ultrasonic degradation system is not considered to be cost effective and will not be further evaluated.

Section 4 Energy Conservation and Retrofit Measures (ECRM)
A 4-45
E:\HMUA\EnergyAudit\Final Report\Section 4.doc
4.2.4.5 Co-Generation Technologies Micro turbine and internal combustion engine combined heat and power co-generation technologies have been evaluated as potential technologies to produce both electric and heat energy as a function of available digester gas as fuel. These technologies were evaluated based upon the current average digester gas production of 25,850 ft3/day, 35,515 ft3/day with the installation of a digester mixing system and future calculated gas production of approximately 57,000 ft3/day for feeding primary and thickened waste activated sludge with FOG.
Microturbine Technology Micro turbines are small combustion turbines that produce between 25kW and 500 kW of power. Micro turbines were derived from turbocharger technologies found in large trucks or the turbines in aircraft auxiliary power units and are composed of a compressor, a combustor, a turbine, an alternator, a recuperator, and a generator. Most micro turbines are single-stage, radial flow devices with high rotating speeds of 90,000 to 120,000 revolutions per minute.
Micro turbines can also be classified as simple-cycle or recuperated. In simple-cycle, or unrecuperated turbines, compressed air is mixed with fuel and burned under constant pressure. The resulting hot gas is allowed to expand through a turbine to perform work. Simple-cycle micro turbines have lower cost, higher reliability, and more heat available for co-generation applications than recuperated units. Recuperated units use a sheet metal heat exchanger that recovers some of the heat from an exhaust stream that transfers it to the incoming air stream. The preheated air is then used in the combustion process. If the air is preheated, less fuel is necessary to raise its temperature to the required level at the turbine inlet. Recuperated units have a higher thermal-to-electric ratio than unrecuperated units and can produce 30 percent - 40 percent fuel savings.
A microturbine system designed to use digester has three basic components: a gas conditioning system, a gas compressor, and a micro turbine.
• Gas Conditioning System
Micro turbines are sensitive to the quality of digester gas that is used for fuel and consequently requires the digester gas to be conditioned for the removal of moisture, particulates (especially siloxanes) and hydrogen sulfide. The removal of siloxane is critical as siloxane is converted to silica (ash) during the combustion process and can erode engine parts. Therefore, conditioning the gas before use is a major factor in reliable micro turbine operations.

Section 4 Energy Conservation and Retrofit Measures (ECRM)
A 4-46
E:\HMUA\EnergyAudit\Final Report\Section 4.doc
• Gas Compressor
The digester gas should be compressed to at least 55 to 65 psig. This compression requirement becomes a significant electrical load based upon the volume of gas to be compressed and must be subtracted from the micro turbine’s gross electrical rating to determine the net electrical load transferred to the plant’s electrical grid.
• Microturbine
Today’s Microturbine has only one moving part (a shaft that rotates at 90,000 to 120,000 revolutions per minute) and uses electronics to maintain a high-quality power output.
At the current maximum average month gas production of 25, 850 ft3/day, and at an assumed digester gas heat value of 600 Btu/ft3, the total heat available to fuel micro turbines is calculated to be 15,510,000 Btu/day or 646,250 Btu/hr. Considering a 30 kW micro turbine, the amount of fuel utilized by a single micro turbine is 13,100 Btu/kW-hr x 30 kW = 393,000 Btu/hr or 15,720 ft3/day. To date, 30 kW micro turbines are not provided with heat exchangers to produce hot water for digester heating. Therefore, the existing boiler must be utilized to provide the necessary hot water for digester heating. The amount of digester gas available to fuel the existing boiler to heat the contents of the primary digester would be 10,130 ft3/day which equates to 6,078,000 Btu/day or 253,250 Btu/hr which is not sufficient to support the requirement of heating the primary sludge of 400,000 Btu/hr as shown in Table 4-10.
Based upon the above and considering that 30 kW micro turbines are not commercially available with a heat recovery system or are UL listed, 30 kW micro turbines will not be considered further in this evaluation.
At the expected digester gas production of 35,515 ft3/day associated with the installation of a digester mixing system for the primary digester, at an assumed digester gas heat value of 600 Btu/ft3, the total heat available to fuel microturbines is calculated to be 20,709,000 Btu/day or 862,875 Btu/hr. Considering a 65 kW microturbine, the amount of fuel utilized by a single micro turbine is 11,800 Btu/kW-hr x 65 kW = 767,000 Btu/hr or 30,680 ft3/day. Therefore, based upon the expected digester gas production of 35,515 ft3/day, there is sufficient digester gas to fuel one 65 kW microturbine. The heat output associated with a 65kW microturbine is 250,000 Btu/hr, approximately 150,000 Btu/hr short of the requirement to heat primary and thickened waste activated sludge of 400,000 Btu/hr. as shown in Table 4-10. Therefore, the existing boiler would be required to supplement the heat from the 65 kW microturbine to heat the contents of the digester. At a required heat load of

Section 4 Energy Conservation and Retrofit Measures (ECRM)
A 4-47
E:\HMUA\EnergyAudit\Final Report\Section 4.doc
150,000 Btu/hr and assuming a boiler efficiency of 80 percent, the required volume of digester gas to operate the boiler is calculated to be 7,500 ft3/day, which combined with the required digester gas to operate the microturbine of 30,680 ft3/day, a total volume of digester gas is calculated to be 38,180 ft3/day which exceeds the expected digester gas production of 35,515 ft3/day.
At a future digester gas production of 57,000 ft3/day associated with digesting primary and thickened waste activated sludge with FOG, and at an assumed digester gas heat value of 600 Btu/ft3, the total heat available to fuel microturbines is calculated to be 34,200,000 Btu/day or 1,425,000 Btu/hr. Considering again a 65 kW microturbine, the amount of fuel utilized by a single micro turbine is 11,800 Btu/kW-hr x 65 kW = 767,000 Btu/hr or 30,680 ft3/day. Therefore, based upon a future digester gas production of 57,000 ft3/day, there is sufficient amount of digester gas to fuel one 65 kW microturbine. The heat output associated with a 65kW Microturbine is 250,000 Btu/hr, approximately 570,000 Btu/hr short of the requirement to heat sludge and the FOG within the grease holding tank of 820,000 Btu/hr, as shown in Table 4-10. Therefore, the existing boiler would be required to supplement the heat from the 65 kW micro turbine to heat the contents of the digester. At a required heat load of 570,000 Btu/hr and assuming a boiler efficiency of 80 percent, the required volume of digester gas to operate the boiler is calculated to be 22,800 ft3/day which combined with the required digester gas to operate the microturbine of 30,680 ft3/day, a total volume of digester gas is calculated to be 53,480 ft3/day which is approximately equivalent to the expected digester gas production of 57,000 ft3/day. The capital cost expenditure is rather significant (approximately $750,000) to install a 65 kW microturbine and gas conditioning system and making this investment based upon an expected gas production of 57,000 ft3/day is considered not to be cost effective and risky.
Therefore, based upon the above, microturbine technology will not be further evaluated.
Internal Combustion Engines Internal combustions engines are diesel engines retrofitted to operate on digester gas. Like micro turbines, the digester gas must be conditioned prior to being introduced into the engine. However, internal combustion engines are more forgiving with regards to the quality of the digester gas, and therefore, do not require the level of gas conditioning as required for micro turbines. Typically, siloxane, hydrogen sulfide and moisture are removed from the incoming digester gas but not to a low level as required by micro turbines. In addition, the gas pressure required at the engine’s fuel train is approximately 1 psig as compared to 55 to 65 psig for micro turbines thus
Section 4 Energy Conservation and Retrofit Measures (ECRM)
A 4-48
E:\HMUA\EnergyAudit\Final Report\Section 4.doc
requiring less electrical power to compress the gas. This allows a higher net electrical energy output to the plant’s grid as compared to micro turbines.
An attractive feature of internal combustion engines is that the engines can be operated at 60 percent of their full load capacity allowing operation of the internal combustion engines at varying digester gas production rates. As the internal combustion engines operate away from their full load capacity, the electrical and heat energy outputs vary linearly as a function of the operated load capacity.
Given the wide operating range for the internal combustion engines, the selection of the internal combustion engine will be made based upon the expected digester gas production of 35,515 ft3/day associated with the installation of a digester mixing system . At this gas production rate, an 115 kW internal combustion engine system rated at a maximum digester gas requirement of 43,434 ft3/day is an appropriate selection, and at an operating load reduction of 60 percent of full load operation, the required digester gas supply requirement is 28,230 ft3/day, close to the current maximum monthly average digester gas production of 25,850 ft3/day.
For the digester operating condition associated with digesting primary and thickened waste activated sludge with FOG, the anticipated digester gas production is calculated to be 57,000 ft3/day. This gas production will be sufficient to fuel a 140 kW internal combustion engine requiring 54,930 ft3/day of digester gas.
The below Table 4-12 summarizes the performance of the internal combustion engines at various digester gas production rates.

Section 4 Energy Conservation and Retrofit Measures (ECRM)
A 4-49
E:\HMUA\EnergyAudit\Final Report\Section 4.doc
Table 4-12: Internal Combustion Engine Performance Summary
Gas Production
(ft3/day)
Percent Operating
Load
Net Annual
Electrical Output
(kW-hrs)
Annual Electrical
Energy Savings at $0.1425 kW-
Hr
Heat Output (Btu/hr)
Required Heat Output
(Btu/hr)
25,850
(115 kW)
60 563,073 $80,240 370,260 400,000
35,515
(115 kW)
81 692,484 $98,680 445,940 400,000
57,000
(140 kW)
100 1,135,000 $161,740 758,130 820,000
A review of the above referenced table indicates that internal engine combustion technology is feasible at an expected digester gas production of 35,515 ft3/day associated with the installation of a digester mixing system for the primary digester as it provides sufficient heat to heat the contents of the primary digester. However, at gas production rates lower than 35,515 ft3/day, a 115 kW rated internal combustion engine may not be able to provide sufficient heat energy to heat the contents of the primary digester. At a digester gas production rate of 57,000 ft3/day associated with digesting primary and thickened waste activated sludge with FOG, the internal combustion engine does not provide for sufficient heat to heat the contents of the digester and FOG within the grease holding tank and therefore, co-generation technology associated with this operating scenario will not be further evaluated.
The Engineer’s Opinion of Probable Construction Cost based upon conceptual design for furnishing and installing a 115 kW internal combustion engine system is $1,000,000.00.
The New Jersey’s Clean Energy Customer On-Site renewable Energy “CORE” program provides for rebates associated with the installation of biogas co-generation systems which is described fully in Section 7 entitled Available Grants, Incentives and Funding Sources. The available rebate associated with the installation of a 115 kW internal combustion engine system is computed to be $232,500.

Section 4 Energy Conservation and Retrofit Measures (ECRM)
A 4-50
E:\HMUA\EnergyAudit\Final Report\Section 4.doc
Additionally, the New Jersey Clean Energy program offers to owners of eligible generating units, earning and trading Renewable Energy Credits (RECs) accounts. These accounts are managed on the Generation Attributes Tracking System (GATS) managed by PJ Environmental Information Systems (PJM-EIS) also referred to as the GATS administrator.
To establish a REC account for a generating unit, the generating unit must be registered for an electric account on the GATS Administrator’s website. Registration and account activation cannot be completed until the system has been referred to the GATS Administrator by the Marketing manager and the Marketing Manager’s referral is contingent upon verification that the system is installed and has been determined to have met all the requirements of the NJCEP, including passing all local required inspections and the program’s quality assurance/quality control requirements.
Once registered, RECs are issued by the GATS Administrator and deposited in the participant’s account as generation data is entered on a monthly basis. Account holders can list RECs and contact potential buyers on the REC program website’s electronic bulletin board or through other means.
At today’s market price, a REC is selling for approximately 0.02 cents/kW-hr. At a digester gas production of 35,515 ft3/day, the annual net electrical output is 692,484 kW-hrs. At a REC value of 0.02 cents/kW-hr, the value of the REC is calculated to be approximately $13,850.00 per year.
The cost of annual maintenance associated with the internal combustion engine system and required gas conditioning system assumes that the Authority will purchase a factory protection plan for each of these systems valued at $15,000 per year and $45,000 per year for the internal combustion engines and gas conditioning system, respectively. Therefore, the total cost for annual maintenance is $60,000.
Table 4-13: Internal Combustion Engine and Gas Conditioning System Probable Cost Summary
Engineer’s Opinion of Probable Construction Cost $1,000,000 New Jersey Clean Energy Rebate $232,500 Annual Operation and Maintenance Costs $60,000 Annual Energy Savings at 35,515 ft3/day of Digester $98,680 Annual REC Sale Value $13,850 Simple Payback 15 years
Section 4 Energy Conservation and Retrofit Measures (ECRM)
A 4-51
E:\HMUA\EnergyAudit\Final Report\Section 4.doc
The simple payback period for furnishing and installing an internal combustion engine system considering capital equipment and construction costs, energy cost savings, rebates; sale of renewable energy credit and maintenance costs is calculated to be 15 years.
Given a simple payback period of 15 years, installing an internal combustion engine system with a 115 kW generator is considered to be reasonably cost effective especially when considering that the average life span of the engine and gas conditioning system is approximately 20 years. However, before pursuing with the installation of internal combustion engine co-generation technology, confirmation of actual gas production as a result of modifying the operation of the digester system by installing a digester mixing system should be performed to ensure that actual gas production can support the operation of the internal combustion engine system. In addition, gas sampling of the digester gas must be performed to determine the baseline concentration of siloxane and hydrogen sulfide so that the gas conditioning system can be sized properly as well as determining the low and high heating value of the digester gas.
4.2.5 Ultraviolet Disinfection System The UV disinfection system consists of two (2) channels; each channel includes two (2) banks of UV lamp modules. The modules span the length of the channel. A bank of lamps consists of 9 modules, each module consisting of 8 lamps suspended from racks.
The UV disinfection system is operated year round as discussed in Section 2, and the system is flow paced. The existing system has been sized such that a flow between 0 and 3.6 MGD will result in the two lead banks being energized and a flow between 3.6 and 7.2 MGD will result in energizing the two lag banks to ensure an adequate UV dose is delivered. Energy consumption for each UV bank is 6.3 kW.
Review of the plant operating data indicates that the UV system is operated typically with 2 lead banks operating 24 hours with a third or fourth bank brought on as required to meet the UV dose. This equates to an annual energy usage of 117,275 kW-hrs/year and at $0.1425 / kW-hr an annual operating cost of $16,710. This does not account for maintenance time required for cleaning of the lamp modules and / or replacement of lamps or ballasts. The current cleaning system requires removal of a UV bank from the channel, to be soaked in a chemical cleaning tank.
A potential energy savings measure that was considered is the replacement of the existing Trojan UV3000 disinfection system with a new Trojan UV3000Plus system. The UV3000Plus not only utilizes less low pressure, high output lamps, but also has
Section 4 Energy Conservation and Retrofit Measures (ECRM)
A 4-52
E:\HMUA\EnergyAudit\Final Report\Section 4.doc
the ability to ramp power up and down to each bank (between 60 and 100 percent power). The existing system does not have this ramping ability, when banks are brought on-line they are at 100 percent power. In addition, the UV3000Plus system monitors the UV transmittance of the water and utilizes that signal in the control algorithm to determine the number of banks of lamps to be energized and at what percent power are required to meet the UV dose.
For Hackettstown, Trojan has proposed a two bank system (utilizing one channel). Each bank would consist of 6 modules, 8 lamps per module, for a total of 96 UV lamps. The proposed low-pressure, high output UV disinfection system inactivates pathogens through the use of solid (amalgam) mercury based UV lamps which are housed in a quartz sleeve. The low pressure, high output systems are quickly becoming the most common type of UV lamp as they are more efficient than the older medium pressure lamps. These lamps have many advantages over other UV lamp systems, including: lower quantity of lamps needed, lower operating temperature, and variable intensity output. Each of these advantages makes the lamp last longer, with maintenance requirements reduced, and the overall system footprint is reduced. Variable output of lamps allows for tighter control of disinfection and reduced power consumption at lower flows, since the system must be designed for high flows that do not occur often.
In addition, the UV3000Plus system is equipped with an automatic chemical / mechanical cleaning system. The ActiCleanTM Cleaning System consists of hydraulically actuated wipers that also include a chemical injection point for a food grade phosphoric acid used in cleaning the quartz sleeves. The chemical / mechanical wiping can be based on a timer or on the UV intensity measured in the wastewater. The cleaning system maintains a sleeve transmittance of at least 95%, while online, eliminating the need to remove modules from the channel. The UV intensity sensor sleeve is simultaneously cleaned.
The one channel, two bank configuration proposed results in only one bank of lamps to treat flows between 0 and 3.6 MGD, with the lag bank being brought online for flows in excess of 3.6 MGD. The average power draw of this system is 14.4 kW, which relates to an annual power use of 126,144 kW-hrs.
This proposed power demand is actually slightly higher then the existing operation of the UV disinfection system, of 117,000 kW-hrs. Consequently, although the UV3000Plus is more efficient in that fewer lamps are required, the lamps are variable output and there is an automatic cleaning system the replacement of the existing UV disinfection equipment is not recommended as no energy savings will be realized.

Section 4 Energy Conservation and Retrofit Measures (ECRM)
A 4-53
E:\HMUA\EnergyAudit\Final Report\Section 4.doc
Therefore, in order to operate the existing UV disinfection system as efficient as possible, it is recommended that the flow meter be calibrated on a set schedule to ensure that the required UV banks are energized as a function of effluent flow. In addition, frequency of sleeve and sensor cleaning should be evaluated, as the delivered UV dose is dependent on the UV intensity measured and the detention time of the water through the channel.
4.2.6 Non-Potable Water System The current non-potable water system consists of two (2) 100 gpm, 7.5 hp pumps, located in the basement of the Administration Building. The non-potable water pumps convey plant effluent to be utilized as seal water for pumps in the Administration Building and in the Advanced Treatment Building, to be utilized for a spray water system for the belt presses and the nitrification tanks and to be utilized as dilution water for the alum feed system. The non-potable water pumps also supply water to hydrants adjacent to all facilities for plant maintenance purposes.
One of these pumps operates 24 hours a day, which relates to 134 kW-hrs / day and an annual operating cost of $6,975.
A potential energy savings measure is the installation of a hydro pneumatic tank, or pressure vessel. A hydro pneumatic tank will make it possible to deliver water within the necessary pressure range, of up to 70 psig, without the necessity of operating the non-potable water pumps continuously or having the pump start every time there is a minor call for water in the distribution system.
Hydro pneumatic tanks can be conventional or bladder tanks. Conventional tanks allow air-water contact and compressed air must be provided to replenish the air. Bladder tanks have a membrane separating the air from the water phase, avoiding the need for compressed air. Bladder tanks are usually limited to small applications. For the purposes of this evaluation, bladder tanks are being considered as conventional tanks require air compressors and additional energy consumption.
In sizing the hydro pneumatic tank system, a system flow and pressure requirement range of 20 to 50 gpm and 50 to 70 psig, respectively, was assumed. This does not account for plant hydrant flow and pressure requirements. If a plant hydrant is utilized, the non-potable water pumps will be required to operate. At these flow and pressure requirements, (2) two 2,600 gallon hydro pneumatic tanks could provide between an hour and a half to four hours (1.5 – 4 hours) of water supply, as a function of plant water use, without activating the non-potable water pumps. Table 4-14 summarizes the potential pump cycling periods and associated energy consumption and cost.

Section 4 Energy Conservation and Retrofit Measures (ECRM)
A 4-54
E:\HMUA\EnergyAudit\Final Report\Section 4.doc
Table 4-14: Non-Potable Water Pumps Potential Operation Periods
Flow Required (gpm)
Pumps Off (hours / day)
Pumps Running
(Refill Tanks) (hours / day)
Energy Consumption (kW-H/ day)
Annual Energy Cost
($)
20 20 4 22 $1162 50 14 10 56 $2906
This energy savings measure presents the opportunity to save between $4,069 and $5,813 annually in electrical costs, depending on water system usage. It also presents the opportunity to potentially minimize maintenance and repair costs on the non-potable water pumps.
Table 4-15: Hydro Pneumatic Tank System Probable Cost Summary
Engineer’s Opinion of Probable Construction $203,000 Annual (Average) Energy Savings $4,940 Annual O&M Cost $1,000 Simple Payback Period 41 years
The simple payback period for furnishing and installing a hydro pneumatic tank system considering capital equipment and construction costs, energy cost savings, and maintenance costs is calculated to be 41 years. Based upon this payback period, installation of a hydro pneumatic system is considered not to be feasible. However, it is recommended that the pump motors be replaced with high efficiency motors, as discussed in Section 4.5.11.
However, in lieu of installing a hydro pneumatic system, the Authority may consider installing a third pump rated at 20 gallons per minute at a total discharge head of 55 psig, having an assumed pump efficiency of 80%, will yield a required motor horsepower of 1 Hp. With this third pump, the Authority will enjoy a small energy savings (approximately $6,000/year). The Authority is cautioned that a pressure relief valve should be provided to ensure that the pump does not operate against a deadhead should the solenoid valves malfunction and do not open.

Section 4 Energy Conservation and Retrofit Measures (ECRM)
A 4-55
E:\HMUA\EnergyAudit\Final Report\Section 4.doc
4.3 Building HVAC Systems 4.3.1 Jacob Garabed Administration Building The Jacob Garabed Administration Building is currently heated using two gas-fired furnaces, with two thermostatically-controlled zones. Cooling is also provided through two Lennox residential split-system air conditioning units. These units may also serve as heat pumps to supplement building heating supply during transitional seasons (marginally cool days, where ambient temperatures are above 32 degrees F). On average, the building is occupied 45-50 hours per week. Units are controlled via their respective programmable thermostats, allowing for both occupied and un-occupied operating modes.
This building has been modeled in eQuest, an ASHRAE 90.1-based energy modeling software, to predict monthly heating and cooling loads. For model outputs and other related data, refer to Appendix F.
It should be noted that annual and monthly heat loss calculations for all buildings have been predicted using the ASHRAE 8,760 hour BIN method, based on Newark, NJ climatic BIN data.
Energy model calculations yield a peak heating requirement of 80,834 Btu/hr, and a peak cooling load of 8.4 tons. Predicted yearly gas heating usage is 498.5 therms. Actual gas usage averaged 534 therms over the three year period from 2006 through 2008. Figure 4-11 below indicates the natural gas usage of the building over the last three years, compared to the predicted annual gas usage.

Section 4 Energy Conservation and Retrofit Measures (ECRM)
A 4-56
E:\HMUA\EnergyAudit\Final Report\Section 4.doc
Figure 4-11: Jacob Garabed Administration Building Gas Use
As previously stated, the Jacob Garabed Administration Building also employs air-source heat pumps to supplement the heating provided by the gas-fired furnace. As this supplemental heating is provided by the Lennox air conditioning units, it becomes an electrical load. Figure 4-12 below indicates the predicted monthly electrical energy usage devoted to building heating and cooling.

Section 4 Energy Conservation and Retrofit Measures (ECRM)
A 4-57
E:\HMUA\EnergyAudit\Final Report\Section 4.doc
Figure 4-12: Jacob Garabed Administration Building Heating & Cooling Electricity Use
Because the HVAC systems employed in the Jacob Garabed Administration Building are already relatively efficient, equpiment upgrades would probably not prove cost-effective. However, a simple recommendation that could potentially provide minor energy savings would be to insulate the basement duct work.
4.3.2 Operations Building The Operations Building consists of two garages, and a small office area. The northern garage contains two 60,000 BTU/Hr (output) gas-fired unit heaters, which are approximately 80 percent efficient. Currently, only one unit heater is operational while the other serves as stand-by. The southern garage also utilizes two 57,750 BTU/Hr (output), 77 percent efficient gas-fired unit heaters, with one operational and one stand-by. Heating in the work area is provided by a gas-fired hot-air furnace. Cooling is provided to the office area only through the use of a split system air conditioning unit. On average, this building is occupied 20 hours per week.
This building has been modeled in CHVAC to predict monthly heating and cooling loads. CHVAC predicts peak heating and cooling loads, which can then be used to

Section 4 Energy Conservation and Retrofit Measures (ECRM)
A 4-58
E:\HMUA\EnergyAudit\Final Report\Section 4.doc
calculate annual and monthly heat losses based on the ASHRAE 8,760 hour BIN method. For model outputs and other related data, refer to Appendix G.
Heating load calculations for the Operations Building yield a peak heat load of 83,784 BTU/Hr. This results in a predicted annual heating energy use of 117,897,850 BTU. Comparisons between predicted energy usages and actual energy usages from 2007-2008 are presented in the Figure 4-13 below.
Figure 4-13: Operations Building Heating
An upgrade to a more efficient unit heater could help to reduce building energy usage. However, the most efficient unit heaters available at this capacity are ~83 percent efficient, resulting in an increase of 3-6 percent in efficiency. Because of this and the intermittent use of the space, the payback period of such an upgrade would be too large to prove cost-effective.
4.3.3 Storage Building The Storage Building is heated with a 173,250 BTU/Hr (output), 77 percent efficient gas-fired unit heater. No cooling is provided in this building. The building is occupied 1-2 hours per week.
CDM employs a heat loss spreadsheet template to predict heat loads for simple, single zone buildings. The spreadsheet uses the ASHRAE CLTD method to predict peak heat losses, which can then be used to predict annual and monthly heat losses through the building envelope with the 8,760 hour BIN method. Because this building

Section 4 Energy Conservation and Retrofit Measures (ECRM)
A 4-59
E:\HMUA\EnergyAudit\Final Report\Section 4.doc
utilizes one unit heater and no cooling, heat loads for this building have been manually calculated using this template. For building spreadsheet outputs and other related data, refer to Appendix H.
Heating load calculations for the Storage Building yield a peak heat load of 111,405 BTU/Hr. This results in a predicted annual heating energy use of 136,760,248 BTU. Comparisons between predicted energy usages and actual energy usages from 2006-2008 are presented in the Figure 4-14 below.
Figure 4-14: Storage Building Heating
The energy usages represented in Figure 4-14 above represent heating energy only. It can be seen, therefore, that the predicted heating energy requirements for this building were significantly higher than the actual heating requirements. Calculations assumed the building indoor temperature to be maintained at 55 degrees F constantly. In reality, however, the interior space temperature may be significantly lower, or may only be 55 degrees F when the space is occupied. This could explain why the predicted energy use is relatively high.
As stated, the heater in the storage building is rated as 77 percent efficient. Total average energy use for the period encompassing 2006 through 2008 was 34,150,000 BTU. Assuming heating was provided at 77 percent efficiency, this indicates that the annual heating demand for the space was 26,295,500 BTU. Replacing this unit heater with a 93 percent efficiency Reznor unit heater at a cost of $2,995, would result in a total energy demand of 28,274,730 BTU per year for a similar time period. This yields an annual savings of 5,875,270 BTU. At the current rate of $1.2498/therm, this
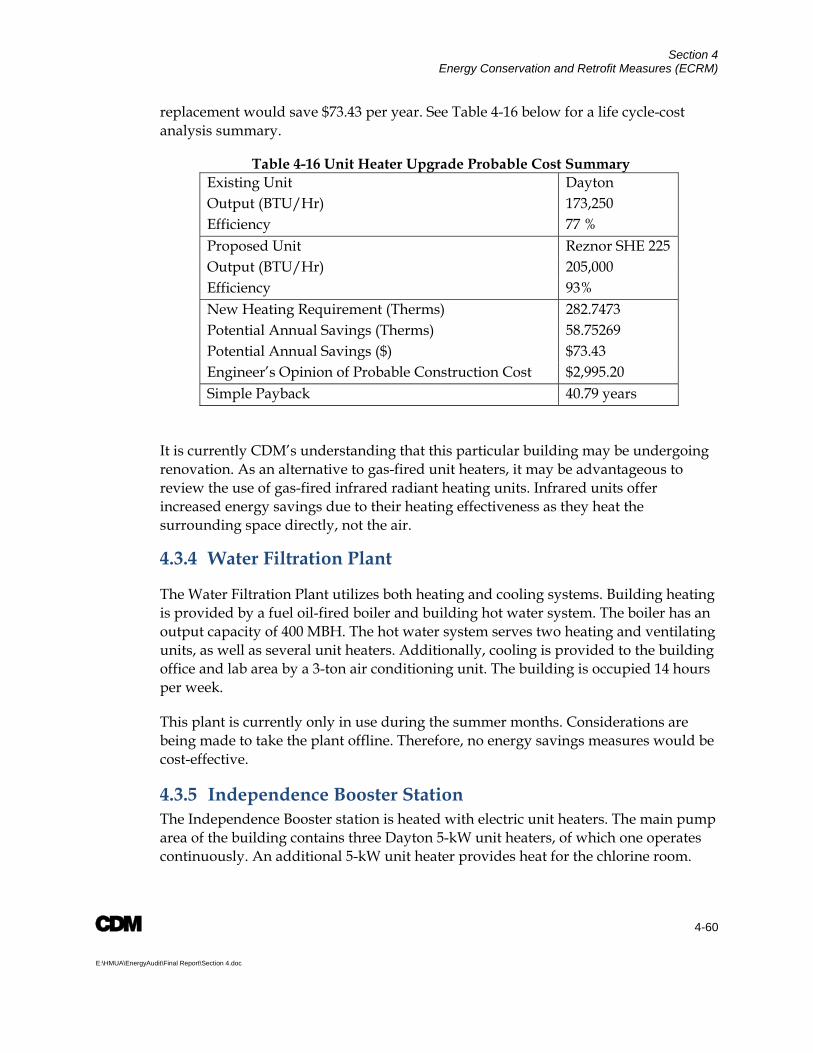
Section 4 Energy Conservation and Retrofit Measures (ECRM)
A 4-60
E:\HMUA\EnergyAudit\Final Report\Section 4.doc
replacement would save $73.43 per year. See Table 4-16 below for a life cycle-cost analysis summary.
Table 4-16 Unit Heater Upgrade Probable Cost Summary Existing Unit Dayton Output (BTU/Hr) 173,250 Efficiency 77 % Proposed Unit Reznor SHE 225 Output (BTU/Hr) 205,000 Efficiency 93% New Heating Requirement (Therms) 282.7473 Potential Annual Savings (Therms) 58.75269 Potential Annual Savings ($) $73.43 Engineer’s Opinion of Probable Construction Cost $2,995.20 Simple Payback 40.79 years
It is currently CDM’s understanding that this particular building may be undergoing renovation. As an alternative to gas-fired unit heaters, it may be advantageous to review the use of gas-fired infrared radiant heating units. Infrared units offer increased energy savings due to their heating effectiveness as they heat the surrounding space directly, not the air.
4.3.4 Water Filtration Plant
The Water Filtration Plant utilizes both heating and cooling systems. Building heating is provided by a fuel oil-fired boiler and building hot water system. The boiler has an output capacity of 400 MBH. The hot water system serves two heating and ventilating units, as well as several unit heaters. Additionally, cooling is provided to the building office and lab area by a 3-ton air conditioning unit. The building is occupied 14 hours per week.
This plant is currently only in use during the summer months. Considerations are being made to take the plant offline. Therefore, no energy savings measures would be cost-effective.
4.3.5 Independence Booster Station The Independence Booster station is heated with electric unit heaters. The main pump area of the building contains three Dayton 5-kW unit heaters, of which one operates continuously. An additional 5-kW unit heater provides heat for the chlorine room.

Section 4 Energy Conservation and Retrofit Measures (ECRM)
A 4-61
E:\HMUA\EnergyAudit\Final Report\Section 4.doc
The chlorine room is provided with an exhaust fan to be used when the room is occupied. The building is occupied 5 hours per week.
Heat loads for this building have been manually calculated using CDM’s heat loss spreadsheet template and BIN method described in Section 4.3.3. For building spreadsheet outputs and other related data, refer to Appendix H.
Heating load calculations for the Independence Booster Station yield a peak heat load of 36,048 BTU/Hr. This results in a predicted annual heating energy use of 12,966 kW-Hr. Comparisons between predicted energy usages and actual energy usages from 2006-2008 are presented in the Figure 4-15 below.
Figure 4-15: Independence Booster Station Heating
It should be noted that Predicted Use indicates all electrical loads, including heating, motor and lighting loads. Predicted heating requirement is shown to indicate the approximate portion of total building energy usage devoted to heating.
As the Independence Booster Station is heated via electric unit heaters, there are no means of increasing efficiency of the heating equipment. Therefore, no significant cost-saving or energy-reduction HVAC measures are recommended for this building.
4.3.6 Mt. Olive Booster Station The Mt. Olive Booster Station is heated with electric unit heaters. One 15-kW unit heater provides heat to the main pump area, while another 5-kW unit heater heats the

Section 4 Energy Conservation and Retrofit Measures (ECRM)
A 4-62
E:\HMUA\EnergyAudit\Final Report\Section 4.doc
chlorine room. Additionally, during the cooling season, exhaust fans are used to ensure the indoor air temperature never exceeds 10 degrees above ambient. The chlorine room is provided with an exhaust fan to be used when the room is occupied. The building is occupied 5 hours per week.
Heat loads for this building have been manually calculated using CDM’s heat loss spreadsheet template and BIN method described in Section 4.3.3. For building spreadsheet outputs and other related data, refer to Appendix H.
Heating load calculations for the Mount Olive Booster Station yield a peak heat load of 28,184 BTU/Hr. This results in a predicted annual heating energy use of 10,138 kW-Hr. Comparisons between predicted energy usages and actual energy usages from 2006-2008 are presented in the Figure 4-16 below.
Figure 4-16: Mt. Olive Booster Station Heating
Again, Predicted Use indicates all electrical loads, including heating, motor and lighting loads. Predicted heating requirement is shown to indicate the approximate portion of total building energy usage devoted to heating. Here it can be seen that the heating requirement of the building comprises only 5-10 percent of the actual building electrical usage.
As the Mount Olive Booster Station is heated via electric unit heaters, there are no means of increasing efficiency of the heating equipment. Therefore, no significant cost-saving or energy-reduction HVAC measures are recommended for this building.

Section 4 Energy Conservation and Retrofit Measures (ECRM)
A 4-63
E:\HMUA\EnergyAudit\Final Report\Section 4.doc
4.3.7 Well No. 2 Snooks Well No. 2 is heated with electric unit heaters. One 10-kW unit heater currently heats the pump room while another 5-kW unit heater is used in the chlorine room. The chlorine room is provided with an exhaust fan to be used when the room is occupied. The building is occupied 5 hours per week.
Heat loads for this building have been manually calculated using CDM’s heat loss spreadsheet template and BIN method described in Section 4.3.3. For building spreadsheet outputs and other related data, refer to Appendix I.
Heating load calculations for Well #2 yield a peak heat load of 23,911 BTU/Hr. This results in a predicted annual heating energy use of 8,600 kW-Hr. Comparisons between predicted energy usages and actual energy usages from 2006-2008 are presented in the Figure 4-17 below.
Figure 4-17: Well #2 Heating
Predicted Use indicates all electrical loads, including heating, motor and lighting loads. Predicted heating requirement is shown to indicate the approximate portion of total building energy usage devoted to heating. Here it can be seen that the heating requirement of the building comprises only 20-30 percent of the actual building electrical usage.

Section 4 Energy Conservation and Retrofit Measures (ECRM)
A 4-64
E:\HMUA\EnergyAudit\Final Report\Section 4.doc
As Well No. 2 is heated via electric unit heaters, there are no means of increasing efficiency of the heating equipment. Therefore, no significant cost-saving or energy-reduction HVAC measures are recommended for this building.
4.3.8 Well No. 4 Well No. 4 is heated with electric unit heaters. The building utilizes one 7.5-kW unit heater to heat the pump room. An exhaust fan in the pump room ensures that inside air temperature never exceeds 10 degrees above ambient during the cooling season. The chlorine room is provided with an exhaust fan to be used when the room is occupied. The building is occupied 5 hours per week.
Heat loads for this building have been manually calculated using CDM’s heat loss spreadsheet template and BIN method described in Section 4.3.3. For building spreadsheet outputs and other related data, refer to Appendix H.
Heating load calculations for Well No. 4 yield a peak heat load of 19,019 BTU/Hr. This results in a predicted annual heating energy use of 7,085 kW-Hr.
Due to the fact that Well #4 and the Water Filtration Plant are monitored by the same electrical meter, there is no exact historical usage date for just Well #4. Therefore, presented below in Figure 4-18, is the predicted total annual electrical usage compared to predicted annual heating electrical usage.
Figure 4-18: Well #4 Heating
Section 4 Energy Conservation and Retrofit Measures (ECRM)
A 4-65
E:\HMUA\EnergyAudit\Final Report\Section 4.doc
Predicted Total Energy Use indicates all electrical loads, including heating, motor and lighting loads. Predicted heating requirement is shown to indicate the approximate portion of total building energy usage devoted to heating.
As Well #4 is heated via electric unit heaters, there are no means of increasing efficiency of the heating equipment. Therefore, no significant cost-saving or energy-reduction HVAC measures are recommended for this building.
4.3.9 Well No. 6 Heath Well No. 6 is heated with electric unit heaters. The building utilizes one unit heater to heat the pump room, and another to heat the chlorine room. Unit heater capacities are unknown. An exhaust fan in the pump room ensures that inside air temperature never exceeds 10 degrees above ambient during the cooling season. The chlorine room is provided with an exhaust fan to be used when the room is occupied. The building is occupied 5 hours per week.
Heat loads for this building have been manually calculated using CDM’s heat loss spreadsheet template and BIN method described in Section 4.3.3. For building spreadsheet outputs and other related data, refer to Appendix H.
Heating load calculations for Well No. 6 yield a peak heat load of 7,154 BTU/Hr. This results in a predicted annual heating energy use of 2,573 kW-Hr. The relatively low heating requirement of this well may be attributed to the fact that the well is almost entirely below grade. This results in much less heat loss through the building walls. Comparisons between predicted energy usages and actual energy usages from 2006-2008 are presented in Figure 4-19 below.

Section 4 Energy Conservation and Retrofit Measures (ECRM)
A 4-66
E:\HMUA\EnergyAudit\Final Report\Section 4.doc
Figure 4-19: Well #6 Heating
Predicted Annual Energy Use indicates all electrical loads, including heating, motor and lighting loads. Predicted heating requirement is shown to indicate the approximate portion of total building energy usage devoted to heating. Here it can be seen that the heating requirement of the building is almost negligible when compared to the building’s total annual energy usage.
As Well #6 is heated via electric unit heaters, there are no means of increasing efficiency of the heating equipment. Therefore, no significant cost-saving or energy-reduction HVAC measures are recommended for this building.
4.3.10 Well No. 8 Claremont Well No. 8 is heated with electric unit heaters. One 5-kW unit heater provides heating for the pump room. The chlorine room is heated by another 4-kW unit heater. Additionally, an exhaust fan in the pump room ensures that inside air temperature never exceeds 10 degrees above ambient during the cooling season. The chlorine room is provided with an exhaust fan to be used when the room is occupied. The building is occupied 5 hours per week.
Heat loads for this building have been manually calculated using CDM’s heat loss spreadsheet template and BIN method described in Section 4.3.3. For building spreadsheet outputs and other related data, refer to Appendix H.

Section 4 Energy Conservation and Retrofit Measures (ECRM)
A 4-67
E:\HMUA\EnergyAudit\Final Report\Section 4.doc
Heating load calculations for Well #8 yield a peak heat load of 40,022 BTU/Hr. This results in a predicted annual heating energy use of 14,395 kW-Hr. Comparisons between predicted energy usages and actual energy usages from 2006-2008 are presented in Figure 4-20 below.
Figure 4-20: Well #8 Heating
Predicted Annual Energy Use indicates all electrical loads, including heating, motor and lighting loads. Predicted heating requirement is shown to indicate the approximate portion of total building energy usage devoted to heating. Because there are currently no pumps running in Well #8, heating constitutes the majority of the building’s annual energy use.
As Well No. 8 is heated via electric unit heaters, there are no means of increasing efficiency of the heating equipment. Therefore, no significant cost-saving or energy-reduction HVAC measures are recommended for this building.
4.3.11 Water Pollution Control Plant Administration Building The Water Pollution Control Plant (WPCP) Administration Building is heated with a fuel oil-fired boiler and hot water system. The boiler has an output capacity of 886,000 BTU/Hr. Building cooling is provided by a 10-ton rooftop air conditioning unit. The building HVAC system consists of several thermostatically-controlled zones. The building is occupied 50 hours per week.

Section 4 Energy Conservation and Retrofit Measures (ECRM)
A 4-68
E:\HMUA\EnergyAudit\Final Report\Section 4.doc
No monthly historical fuel oil usage data for this building is available, so the building heating requirement has been predicted through simulation and modeling. This building has been modeled in eQuest to predict monthly heating and cooling loads. For model outputs and other related data, refer to Appendix F.
Figure 4-21 indicates the predicted current building heating requirements. Note that the “building heating requirements” in the figure represent the building heating energy input, not the building heat loss. Therefore, the figure accounts for existing boiler efficiency.
Figure 4-21: WPCP Administration Building Predicted Heating Energy Use
The existing administration building boiler is 82 percent efficient (gross output) This is a fairly efficient rating for an oil-fired boiler. While minor energy savings may be realized by upgrading the boilers to 85% efficient models, the payback period would far exceed 20 years.
4.3.12 WPCP Intermediate Pumping Station The Intermediate Pumping Station utilizes one 7.5-kW electric unit heater. Additionally, a roof mounted exhaust fan activates if the indoor air temperature exceeds 85 degrees F. The building is occupied 2 hours per week.
Heat loads for this building have been manually calculated using CDM’s heat loss spreadsheet template and BIN method described in Section 4.3.3. For building spreadsheet outputs and other related data, refer to Appendix H.

Section 4 Energy Conservation and Retrofit Measures (ECRM)
A 4-69
E:\HMUA\EnergyAudit\Final Report\Section 4.doc
Heating load calculations for the Intermediate Pumping Station yield a peak heat load of 34,806 BTU/Hr. This results in a predicted annual heating energy use of 12,519 kW-Hr.
Due to the fact that the entire Water Pollution Control Plant is monitored with one electrical meter, there is no exact historical usage date for just the Intermediate Pumping Station.
As the Intermediate Pumping Station is heated via electric unit heaters, there are no means of increasing efficiency of the heating equipment. Therefore, no significant cost-saving or energy-reduction HVAC measures are recommended for this building.
4.3.13 WPCP Advanced Treatment Building The Advanced Treatment Building is currently heated using a combination of space heaters, convectors, and heating and ventilating units. Additionally, cooling is provided to the control room through a rooftop air conditioning system with a 1 ton capacity. All terminal unit heat is provided by a building hot water heating system, served by two boilers operating on fuel oil. The heating and ventilating units also maintain a total outside air supply of 23,105 CFM. This air flow is required to maintain NEC electrical classifications as set forth in NFPA 820, in process areas such as the gravity belt thickener and sludge pumping rooms.
This building has been modeled in eQuest to predict monthly heating and cooling loads. For model outputs and other related data, refer to Appendix F.
As the Advanced Treatment Building is heated by fuel oil, it is hard to accurately track historical energy usage. Fuel oil deliveries over time period encompassing 2006 through 2008 seem to be random (not directly related to fuel oil usage rates). Therefore, through simulation and modeling, heating energy requirements for the building have been predicted in Figure 4-22.

Section 4 Energy Conservation and Retrofit Measures (ECRM)
A 4-70
E:\HMUA\EnergyAudit\Final Report\Section 4.doc
Figure 4-22: Advanced Treatment Building Predicted Heating Energy Use
As previously stated, the gravity belt thickener area is required to maintain a ventilation rate of 6 air changes per hour. Consequently, the heating and ventilating system serving this area provides 10,520 CFM of outside air, which works out to just over 6 air changes per hour. This required ventilation rate leads to significant building heat loss.
Additionally, NFPA 820 mandates that the basement area maintain a ventilation rate of 6 air changes per hour because sludge pumps are utilized in this space. The basement is heated by a heating and ventilation system that provides 10,745 CFM of outside air. This flow rate provides 6 air changes per hour.
The addition of energy recovery ventilators to the two above-mentioned HVAC systems would greatly reduce building heating energy consumption. Energy recovery ventilators serve to recapture heat from air being exhausted from the space, and apply it to air incoming to the space. Making the rather conservative assumption that the energy recovery ventilators would be capable of recapturing 60 percent of the lost heat from ventilation, Figure 4-23 shows the potential energy savings from the addition of energy recovery ventilators.

Section 4 Energy Conservation and Retrofit Measures (ECRM)
A 4-71
E:\HMUA\EnergyAudit\Final Report\Section 4.doc
Figure 4-23: Energy Savings - Energy Recovery Ventilators
Fuel oil bills from 2008 indicate a recent rate of $1.4836 per gallon of fuel oil. Assuming a gallon of fuel oil can provide 138,700 BTU/Hr of heat, Figure 4-26 indicates potential dollar savings from the addition of energy recovery ventilators.

Section 4 Energy Conservation and Retrofit Measures (ECRM)
A 4-72
E:\HMUA\EnergyAudit\Final Report\Section 4.doc
Figure 4-24: Fiscal Savings - Energy Recovery Ventilators
These energy recovery ventilators would cost approximately $16,100 each. Based on the savings indicated in Figure 4-24, Table 4-17summarizes life-cycle cost analyses for installation of these energy recovery ventilators.
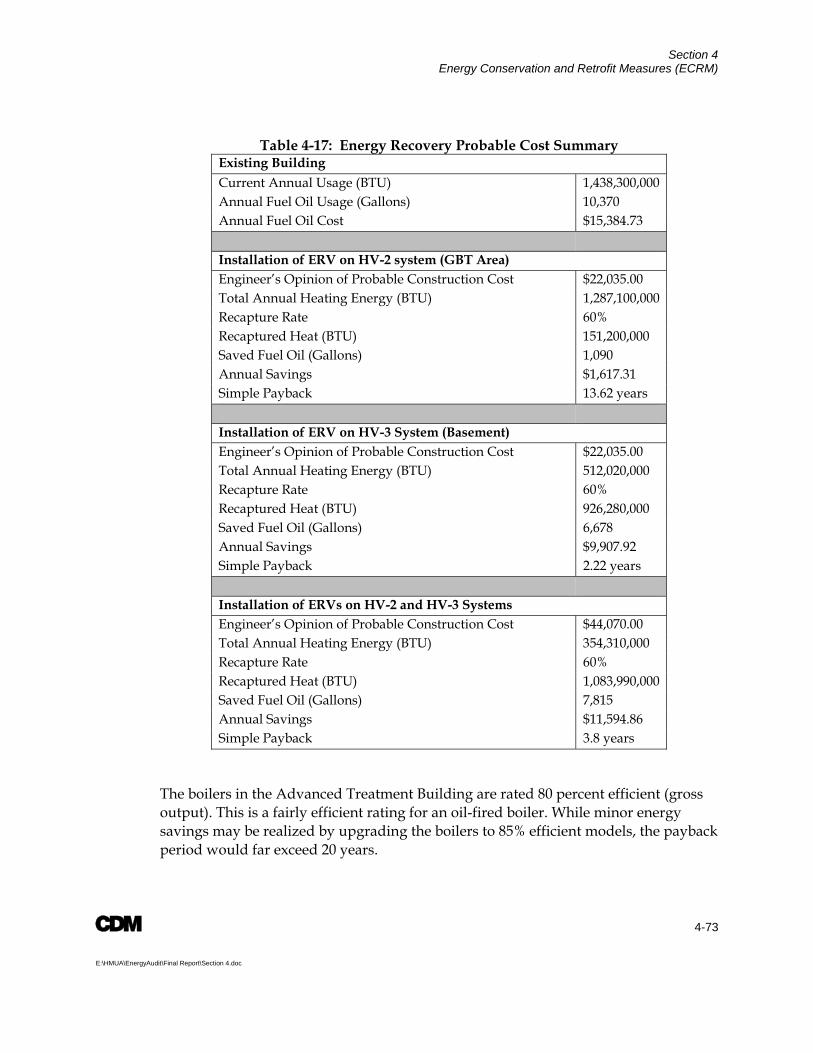
Section 4 Energy Conservation and Retrofit Measures (ECRM)
A 4-73
E:\HMUA\EnergyAudit\Final Report\Section 4.doc
Table 4-17: Energy Recovery Probable Cost Summary Existing Building Current Annual Usage (BTU) 1,438,300,000 Annual Fuel Oil Usage (Gallons) 10,370 Annual Fuel Oil Cost $15,384.73 Installation of ERV on HV-2 system (GBT Area) Engineer’s Opinion of Probable Construction Cost $22,035.00 Total Annual Heating Energy (BTU) 1,287,100,000 Recapture Rate 60% Recaptured Heat (BTU) 151,200,000 Saved Fuel Oil (Gallons) 1,090 Annual Savings $1,617.31 Simple Payback 13.62 years Installation of ERV on HV-3 System (Basement) Engineer’s Opinion of Probable Construction Cost $22,035.00 Total Annual Heating Energy (BTU) 512,020,000 Recapture Rate 60% Recaptured Heat (BTU) 926,280,000 Saved Fuel Oil (Gallons) 6,678 Annual Savings $9,907.92 Simple Payback 2.22 years Installation of ERVs on HV-2 and HV-3 Systems Engineer’s Opinion of Probable Construction Cost $44,070.00 Total Annual Heating Energy (BTU) 354,310,000 Recapture Rate 60% Recaptured Heat (BTU) 1,083,990,000 Saved Fuel Oil (Gallons) 7,815 Annual Savings $11,594.86 Simple Payback 3.8 years
The boilers in the Advanced Treatment Building are rated 80 percent efficient (gross output). This is a fairly efficient rating for an oil-fired boiler. While minor energy savings may be realized by upgrading the boilers to 85% efficient models, the payback period would far exceed 20 years.

Section 4 Energy Conservation and Retrofit Measures (ECRM)
A 4-74
E:\HMUA\EnergyAudit\Final Report\Section 4.doc
Due to the required ventilation rates in the Advanced Treatment Building, the simple payback periods for the two proposed energy recovery ventilators are relatively small. Therefore, it is CDM’s recommendation that these units be added to the two main heating and ventilating systems.
4.4 Building Lighting Systems 4.4.1 Jacob Garabed Administration Building The Jacob Garabed Administration Building is currently lighted using a combination of T12 fluorescent fixtures (throughout the building), incandescent bulbs (basement only), and incandescent floodlights (board room only). Currently, most of the fixtures in the building are on during the day, excluding the basement and the board room respectively. There are no occupancy sensors in use. This building is occupied 45-50 hours per week.
Energy model calculations yield an estimated annual lighting energy cost of $4007.02. Estimated annual energy savings of approximately $2300 can be achieved through installation of new T8 lighting ballast and T8 bulbs into existing light fixtures, compact fluorescent lights and occupancy sensors in areas that are not normally occupied during standard working hours. Engineer’s Probable Construction Cost Estimates of proposed lighting equipment needed to retrofit the existing facilities are provided in the following tables; Table 4-18, Table 4-19 and Table 4-20. These values will be used for all financial analysis related to suggested lighting upgrades.
Table 4-18: Occupancy Sensor Pricing (Infrared)
Wall Mounted Infrared $ 35.00
New Jersey Clean Energy Incentives:
$20/Fixture $(20.00)
Total Estimated Cost / Unit $ 15.00

Section 4 Energy Conservation and Retrofit Measures (ECRM)
A 4-75
E:\HMUA\EnergyAudit\Final Report\Section 4.doc
Table 4-19: Occupancy Sensor Pricing (Ultrasonic)
Ceiling / Wall Mounted Ultrasonic (small room) $ 90.00
New Jersey Clean Energy Incentives:
$20/Fixture $(20.00)
Total Estimated Cost / Unit $ 70.00
Based on the simple payback analysis illustrated in Table 4-21, the following is recommended. Replace the existing T12 fluorescent ballast and bulbs with new energy efficient T8 ballast and bulbs. Since standard T12 and T8 fixtures are dimensionally identical, the existing fixtures can be reused, the reuse of the existing fixtures greatly reduces the upfront investment and results in a significant decrease in the simplified payback modeling. This will include the following areas: Office Area, Office Kitchen Area, Admin Office, Engineer’s Office, Men’s Restroom, Women’s Restroom, Hallway, Foyer, Board Room, and Basement. It is also recommended that in areas where incandescent lights are being utilized that these bulbs upon failure be replaced with new energy efficient Compact Fluorescent Lights (CFL). It was noted that incandescent lighting is currently being used in the basement and for accent lighting in the new conference room.
Table 4-20: High Efficiency T8 Ballast Fixture Pricing
T8 48” 3 Bulbs /Fixture $ 15.00
High-Efficiency Electronic Ballast $ 35.00
New Jersey Clean Energy Incentives:
$20/Fixture $(20.00)
Total Estimated Cost / Unit $ 30.00

Section 4 Energy Conservation and Retrofit Measures (ECRM)
A 4-76
E:\HMUA\EnergyAudit\Final Report\Section 4.doc
To further reduce the energy usage used for lighting, it is also recommended that occupancy sensors be installed in rooms that are not commonly utilized during normal business hours. Typically, infrared sensors are utilized in smaller areas with few obstructions; ultrasonic sensors are used for larger open areas. Based on the technology, obstructions are less of an issue in regards to false activation of the sensor. Dual sensors are also available, based on the room configurations, these were not considered applicable. The room identified as possible candidates for occupancy sensors are as follows: Office Kitchen Area, Engineer’s Office, Men’s Restroom, Women’s Restroom, Board Room, and Basement.
Table 4-21: Jacob Garabed Admin Building Lighting Probable Cost Estimate
Annual energy savings @ $0.1742/KWH $2,322.56
# of fluorescent fixtures to be upgraded 73
# of ultrasonic occupancy sensors to be installed 2
# of infrared occupancy sensors to be installed 5
Budget Cost Estimate $12,328.68
NJ Clean Energy Rebate $1,600
Simple Payback 4.6 years
Refer to Appendix I for complete energy model calculations.
4.4.2 Operations Building The Operations Building consists of two garages, and a small office area. The garage area is lit by 25, T12 fluorescent fixtures. The office area is lit by five, T12 fluorescent recessed fixtures. There are no occupancy sensors in use. These fixtures are turned off during non-work hours. On average, this building is occupied 20 hours per week.
Energy model calculations yield an existing energy cost of $709.27 for annual lighting operation. Annual energy savings of approximately $425.01can be achieved through installation of new T8 ballast and bulbs and occupancy sensors. Simple payback period is 10.4 years, refer to Table 4-22.

Section 4 Energy Conservation and Retrofit Measures (ECRM)
A 4-77
E:\HMUA\EnergyAudit\Final Report\Section 4.doc
Table 4-22: Operations Building Lighting Probable Cost Estimate
Annual energy savings @ $0.1742/KWH $425.01
# of fluorescent fixtures to be upgraded 30
# of infrared occupancy sensors to be installed 4
Budget Cost Estimate $5,101.20
NJ Clean Energy Rebate $680
Simple Payback 10.4 years
Recommend replacing existing T12 ballast and bulbs to T8 only as a planned maintenance when the existing installed fixtures fail. Marginal savings can be realized by installing occupancy sensors in the break room and garage area.
Refer to Appendix I for complete energy model calculations.
4.4.3 Storage Building The Storage Building is currently using three incandescent bulbs and one fluorescent fixture. There are no occupancy sensors in use. These fixtures are turned off during non-work hours. The building is occupied 1-2 hours per week and is primarily used as equipment storage.
The Authority is currently in the planning stage of upgrading this building with the installation of several new overhead doors. Any lighting upgrade will be incorporated into the new design. Energy model calculations yielded existing energy cost of $68.36 for annual lighting operation. Based on the final building design and use designation, only high efficiency lighting that meets or exceeds NJ Clean Energy Standards should be used for the final design.
Therefore, based upon the above, no recommendations to improve energy reduction are being made at this time.
Refer to Appendix I for complete energy model calculations.

Section 4 Energy Conservation and Retrofit Measures (ECRM)
A 4-78
E:\HMUA\EnergyAudit\Final Report\Section 4.doc
4.4.4 Water Filtration Plant The Water Filtration Plant is currently using a combination of T12 fluorescent fixtures (throughout the building) and mercury vapor fixtures (locker rooms and work deck). There are no occupancy sensors in use. Most of the building’s fixtures are off even during work hours. The Foyer, Control Room, Lab, Ground Level Hall, and Locker Room fixtures are assumed to be the only fixtures utilized during work hours. Existing site lighting includes 7 pole mounted fixtures located along the driveway to the property. This building is occupied 14 hours per week on average
Energy model calculations are based on the assumption that only the five areas listed above are being utilized during work hours. The calculations yield an existing energy cost of $380.19 for annual lighting operation. Annual energy savings of approximately $200 can be achieved through installation of new T8 ballast, bulbs and occupancy sensors. Simple payback period is 18.6 years, refer to Table 4-23.
Table 4-23: Water Filtration Plant Lighting Probable Cost Estimate
Annual energy savings @ $0.1536/KWH $198.82
# of fluorescent fixtures to be upgraded 24
# of infrared occupancy sensors to be installed 2
Budget Cost Estimate $4,233.84
NJ Clean Energy Rebate $(520)
Simple Payback 18.7 years
Recommend replacing existing T12 ballast and bulbs to T8 only as a planned maintenance when the existing installed fixtures fail. Marginal savings can be realized by installing occupancy sensors in the break room and garage area.
Recommend against upgrading existing pole mounted streetlight fixtures from High Pressure Sodium to Metal Halide. JCP&L requires the use of High Pressure Sodium or Metal Halide fixtures as the only option. Therefore, changing fixture types would not yield energy savings.
Refer to Appendix I for complete energy model calculations.

Section 4 Energy Conservation and Retrofit Measures (ECRM)
A 4-79
E:\HMUA\EnergyAudit\Final Report\Section 4.doc
4.4.5 Independence Booster Station The Independence Booster station is currently using eight T12 fluorescent fixtures. There are no occupancy sensors in use. These fixtures are turned off during non-work hours. There is one exterior wall mounted fixture with photocell. The building is occupied 5 hours per week as part of routine maintenance activities
Energy model calculations yielded an estimated energy cost of $48.36 for annual lighting at the location. Annual energy savings of approximately $15 can be achieved through installation of new ballasts and bulbs. Simple payback period is computed to be 67.1 years. Based on the poor financial payback, the recommendation is to replace the existing T12 ballast and bulbs to T8 only as a planned maintenance when the existing installed fixtures fail.
Refer to Appendix I for complete energy model calculations.
4.4.6 Mt. Olive Booster Station The Mt. Olive Booster Station is currently using seven T12 fluorescent fixtures. There are no occupancy sensors in use. These fixtures are turned off during non-work hours. There is one exterior wall mounted fixture with photocell. The building is occupied 5 hours per week as part on routine maintenance activities.
Energy model calculations yield an existing energy cost of $56.48 for annual lighting operation. Annual energy savings of approximately $40 can be achieved through installation of new T8 ballast and bulbs. The simple payback model yielded a payback period in excess of 64 years. Based on the poor financial payback, the recommendation is to replace the existing T12 ballast and bulbs to T8 only as a planned maintenance when the existing installed fixtures fail.
Refer to Appendix I for complete energy model calculations.
4.4.7 Well No. 2 Snooks Well # 2 is currently using three T12 fluorescent fixtures. There are no occupancy sensors in use. These fixtures are turned off during non-work hours. There is an exterior pole-mounted fixture for site lighting. The building is occupied 5 hours per week as part on routine maintenance activities.
Energy model calculations yield an existing energy cost of $24.43 for annual lighting operation. Annual energy savings of approximately $6 can be achieved through installation of new fixtures and occupancy sensors. The simple payback model yielded a payback period in excess of 65 years. Based on the poor financial payback,

Section 4 Energy Conservation and Retrofit Measures (ECRM)
A 4-80
E:\HMUA\EnergyAudit\Final Report\Section 4.doc
the recommendation is to replace the existing T12 ballast and bulbs to T8 only as a planned maintenance when the existing installed fixtures fail.
Refer to Appendix I for complete energy model calculations.
4.4.8 Well No. 4 Well # 4 is currently lighted using four T12 fluorescent fixtures. There are no occupancy sensors in use. These fixtures are turned off during non-work hours. Existing site lighting for well # 4 is provided through the Water Filtration Plant site lighting. The building is occupied 5 hours per week as part of routine maintenance.
Energy model calculations yield an existing cost of $0.91 for annual lighting operation. Annual energy savings of approximately $0.50 can be achieved through installation of new T8 ballast and bulbs. The payback does not support upgrading these fixtures; the recommendation is to replace the existing T12 ballast and bulbs to T8 only as a planned maintenance when the existing installed fixtures fail.
Refer to Appendix I for complete energy model calculations.
4.4.9 Well No. 6 Heath Well #6 is currently lighted using three T12 fluorescent fixtures. There are no occupancy sensors in use. These fixtures are turned off during non-work hours. Existing site lighting includes three wall mounted incandescent fixtures on the walls of the stairwell. The building is occupied 5 hours per week as part of routine maintenance at the building.
Energy model calculations yield an existing energy cost of $15.45 for annual lighting operation. Annual energy savings of approximately $5 can be achieved through installation of new T8 ballast and bulbs. The payback does not support upgrading these fixtures; the recommendation is to replace the existing T12 ballast and bulbs to T8 only as a planned maintenance when the existing installed fixtures fail.
Refer to Appendix I for complete energy model calculations.
4.4.10 Well No. 8 Claremont Well # 8 is currently lighted using 6 T12 fluorescent fixtures. There are no occupancy sensors in use. These fixtures are turned off during non-work hours. Existing site lighting includes four wall mounted incandescent fixtures. The building is occupied 5 hours per week.

Section 4 Energy Conservation and Retrofit Measures (ECRM)
A 4-81
E:\HMUA\EnergyAudit\Final Report\Section 4.doc
Energy model calculations yield an existing energy cost of $145.74 for annual lighting operation. Annual energy savings of approximately $45.80 can be achieved through installation of new fixtures and occupancy sensors. Simple payback period is 18 years, refer to Table 4-24.
Table 4-24: Well #8 Claremont Lighting Probable Cost Estimate
Annual energy savings @ $0.9507/KWH $45.80
# of fluorescent fixtures to be upgraded 6
Budget Cost Estimate $945.36
NJ Clean Energy Rebate $(120)
Simple Payback 18 years
Based on the poor financial payback, the recommendation is to replace the existing T12 ballast and bulbs to T8 only as a planned maintenance when the existing installed fixtures fail.
Refer to Appendix I for complete energy model calculations.
4.4.11 Water Pollution Control Plant Administration Building The Water Pollution Control Plant (WPCP) Administration Building is utilizing mostly T12 fluorescent fixtures (throughout the building). There are incandescent bulbs in the bathroom and the lower level locker room. There are no occupancy sensors in use. These fixtures are turned off during non-work hours, except for night-lighting. Existing site lighting includes three exterior wall mounted incandescent fixtures. The building is occupied 50 hours per week on average.
Energy model calculations yield an existing energy cost of $3384.16 for annual building lighting. Annual energy savings of approximately $1850 can be achieved through installation of new fixtures and occupancy sensors. Simple payback period is 7 years, refer to Table 4-25.

Section 4 Energy Conservation and Retrofit Measures (ECRM)
A 4-82
E:\HMUA\EnergyAudit\Final Report\Section 4.doc
Table 4-25: WPCP Administration Building Lighting Probable Cost Estimate
Annual energy savings @ $0.1425/KWH $1,841.83
# of new fluorescent fixtures to be installed 87
# of ultrasonic occupancy sensors to be installed 2
# of infrared occupancy sensors to be installed 9
Budget Cost Estimate $14,908.92
NJ Clean Energy Rebate $(1960)
Simple Payback 7 years
Recommend replacing existing T12 fluorescent ballast and bulbs with new T8 fixtures. Replace fluorescent ballasts and bulbs in the following locations: Main Entryway, Restroom, Office Area, Kitchen, Lab, Garage, Pump Room, Workshop, MCC Room, Hallway to Garage, Locker Rooms, and Basement and Restrooms
Recommend installing occupancy sensors in the following locations: Restroom, Kitchen, Lab, Garage, Pump Room, Workshop, Locker Room, and Basement.
Refer to Appendix I for complete energy model calculations.
4.4.12 WPCP Intermediate Pumping Station The WPCP Intermediate Pumping Station is currently using nine T12 fluorescent fixtures. There is an existing skylight which provides day lighting for the area. There are no occupancy sensors in use. These fixtures are turned off during non-work hours. Existing site lighting includes one exterior incandescent fixture. The building is occupied 2 hours per week.
Energy model calculations yield an existing energy cost of $9.34 for annual lighting operation. Annual energy savings of approximately $3 can be achieved through installation of new T8 ballasts and bulbs and occupancy sensors. The simple payback calculation does not support upgrading these fixtures; the recommendation is to replace the existing T12 ballast and bulbs to T8 only as a planned maintenance when the existing installed fixtures fail.

Section 4 Energy Conservation and Retrofit Measures (ECRM)
A 4-83
E:\HMUA\EnergyAudit\Final Report\Section 4.doc
Refer to Appendix I for complete energy model calculations.
4.4.13 WPCP Advanced Treatment Building The WPCP Advanced Treatment Building is currently lighted using a combination of T12 fluorescent fixtures and High Bay High Pressure Sodium (HPS) fixtures. There are no occupancy sensors in use. These fixtures are turned off during non-work hours, except for night-lighting. Existing site lighting includes 7 exterior wall mounted fixtures with photocells.
Energy model calculations yield an existing energy cost of $5419.70 for annual lighting operation. Annual energy savings of approximately $1184.34 can be achieved through installation of new fixtures and occupancy sensors. Simple payback period is 6.1 years, refer to Table 4-26.
Table 4-26: WPCP Advanced Treatment Building Lighting Probable Cost Estimate
Annual energy savings @ $0.1425/KWH $1,184.34
# of new fluorescent fixtures to be installed 45
# of ultrasonic occupancy sensors to be installed 3
# of infrared occupancy sensors to be installed 8
Budget Cost Estimate $8,377.20
NJ Clean Energy Rebate $(1120)
Simple Payback 6.1 years
Recommend replacing existing T12 ballast and bulbs with new T8 units in the following locations: Entry/Exit Rooms, Boiler Room, Hallways, Office Area, Restroom, MCC Room, Blower Room, Loft (Above Office Rooms), and Stairwells. Leave existing High Bay High Pressure Sodium lights installed.
Recommend installing occupancy sensors in the following locations: Boiler Room, Office Area, Restroom, MCC Room, Blower Room, Loft, and Stairwells.
Refer to Appendix I for complete energy model calculations.

Section 4 Energy Conservation and Retrofit Measures (ECRM)
A 4-84
E:\HMUA\EnergyAudit\Final Report\Section 4.doc
4.4.14 WPCP Digester Building The WPCP Digester Building is currently lighted using twenty two explosion-proof mercury vapor fixtures. There are no occupancy sensors in use. These fixtures are turned off during non-work hours. Existing site lighting includes two exterior wall mounted fixtures with photocells.
Energy model calculations yield an existing energy cost of $630.89 for annual lighting operation. Based on the cost of replacing these special purpose explosion proof fixtures, the large simple payback period does not support replacement of these existing fixtures.
Refer to Appendix I for complete energy model calculations.
4.4.15 WPCP Site Lighting The WPCP compound has existing lighting including 19 Colonial Post Top mercury vapor fixtures along the driveway, 7 stanchion mounted mercury vapor fixtures for tank lighting, and three angled flood lights along the edge of WPCP Advanced Treatment Building. These lights were off during the day.
Recommend against replacing existing Colonial Post Top fixtures. JCP&L allows only certain streetlight models from specific manufacturers. Replacing existing High Pressure sodium bulbs with Metal Halide is the only option, and would not yield significant energy savings.
Recommend against replacing existing stanchion mounted fixtures. As stated above, JCP&L requires site lighting on the outdoor service line to be HPS or MH fixtures. Therefore upgrading the stanchion mounted lighting from HPS to MH would not yield significant energy savings.
Recommend against replacing existing angle flood lights with high pressure sodium. Upgrading existing flood lights from metal halide to high pressure sodium would not yield significant energy savings.
4.5 Building Pump and Motor Systems 4.5.1 Jacob Garabed Administration Building
The Jacob Garabed Admin Building currently has no pumps installed.
4.5.2 Operations Building The Operations building currently has no pumps installed.

Section 4 Energy Conservation and Retrofit Measures (ECRM)
A 4-85
E:\HMUA\EnergyAudit\Final Report\Section 4.doc
4.5.3 Storage Building The Storage Building currently has no pumps installed.
4.5.4 Water Filtration Plant The Water Filtration Plant is currently operating two High Lift Pumps. The High Lift Pump motors are 75 Horsepower (HP), 460V, 90.2% efficiency, and in 2008, ran a total of 4842 hours. The High Lift Pumps run one at a time and rotate usage as necessary. The Filter Pumps are run at the same time and ran a total of 246 hours during 2008, often being unused for months at a time.
MotorMaster energy model calculations yield $1988 in energy savings by upgrading the High Lift Pumps from the existing 90.2% efficient motor to a new 95.3% efficient motor. The simple payback period for this energy savings upgrade is 1.4 years. Refer to Appendix J for the MotorMaster detailed energy savings comparison analysis.
The Authority is in the process of evaluating the continued need for the operation of the Water Filtration Plant. The filtration process is costly and will not be needed since the existing wells supply the required capacity. If the decision is made to continue the operation of the facility then there is financial incentive to replace the two lift pump motors to higher efficiency motors.
4.5.5 Independence Booster Station The Independence Booster station is currently operating two pumps. The pump motors are Marathon Electric 60 HP, 460V, 90% efficiency. The pumps operated a total of 753 hours in 2008. Only one pump is run at a time, with the other being rotated.
MotorMaster energy model calculations yield $373.07 in energy savings by upgrading the Marathon Electric motors from the existing 90% efficiency motor to a new 95% efficiency motor. The simple payback period for this energy savings upgrade is 7.8 years. Refer to Appendix J for the MotorMaster detailed energy savings comparison analysis.
Based on the limited run time of these pumps it is recommended that these motors be replaced with new 95% efficient motors upon failure of the installed motors. If operating hours were to increase based on changes in system demand, then the replacement analysis should be reconsidered, as the increased operating hours would improve the payback period.

Section 4 Energy Conservation and Retrofit Measures (ECRM)
A 4-86
E:\HMUA\EnergyAudit\Final Report\Section 4.doc
4.5.6 Mt. Olive Booster Station The Mt. Olive Booster Station is currently operating two pumps. The first pump motor is a Baldor, 75 HP, 460V, and 93% efficiency. The second pump motor is a General Electric, 75 HP, 460V, and 95% efficiency the pumps were operated a total of 3230 hours during 2008. Only one pump is run at a time, with the other being rotated. The pumps cycle 6-7 times per day to maintain storage tank level. The pumps utilize standard across the line starter as control, since the utility is not utilizing demand metering, adding soft starts or VFDs would not affect current electric billing but may help reduce pump wear based on the number of starts per day.
MotorMaster energy model calculations yield $737.98 in energy savings by upgrading the Baldor motor from the existing 93% efficiency to a new 95.4% efficiency motor. The simple payback period for this energy savings upgrade is 4.3 years. The General Electric motor showed only marginal payback for the 0.4% increase in efficiency and as such is not a candidate for replacement at this time. Refer to Appendix J for the MotorMaster detailed energy savings comparison analysis.
Recommend replacing existing Baldor motor with new 95.4% efficient motor at this time based on the 4.3 year payback.
4.5.7 Well No. 2 Snooks Well # 2 is currently operating one Fairbanks Morse Pump. The pump has a 15 HP, 460V, the name plate did not indicate motor efficiency. This pump ran a total of 2115 hours during 2008.
MotorMaster energy model calculations yield $319 in energy savings by upgrading the Fairbanks-Morse motor from the existing assumed 85% efficiency motor to a new 92.4% efficiency motor. The simple payback period for this energy savings upgrade is 4.2 years. Refer to Appendix J for the MotorMaster detailed energy savings comparison analysis.
Based on the payback period it is recommended to replace the existing Fairbanks-Morse pump motor with a new 92.4% efficient motor at this time.
4.5.8 Well No. 4 Well # 4 is currently operating with one pump. The pump motor is a US Motor 30 HP, 460V, 90.2% efficiency. This pump utilizes a Variable Frequency Drive (VFD) and ran a total of 365 hours during 2008, a majority of the run hours occurred during October.

Section 4 Energy Conservation and Retrofit Measures (ECRM)
A 4-87
E:\HMUA\EnergyAudit\Final Report\Section 4.doc
MotorMaster energy model calculations yield $41 in energy savings by upgrading the US Motors Pump from the existing 90.2% efficiency motor to a new 93.7% efficiency motor. The simple payback period for this energy savings upgrade is 29.6 years. Refer to Appendix J for the MotorMaster detailed energy savings comparison analysis.
Based on the payback period it is recommended not to replace the existing US Motor with a new 93.7% efficient motor at this time. Advise replacing with higher efficiency motor in the case of future motor failure only.
4.5.9 Well No. 6 Heath Well #6 is currently operating one pump with a US Motors rated at 100 HP, 460V, and 95% efficiency. The pump ran a total of 6375 hours during 2008. It is normally run 24/7, but it was inactive during the months of March and April. This pump is controlled by a Soft Start motor starter.
The existing motor is already rated as a Premium Efficient motor and as such there is no need to replace.
4.5.10 Well No. 8 Claremont Well #8 is currently out of service as a new well in being installed. To be consistent with the Authorities energy initiatives only Premium Efficient motors should be utilized as part on the new installation.
4.5.11 Water Pollution Control Plant Administration Building The Water Pollution Control Plant (WPCP) Administration Building houses three Main Influent Pumps, three Trickling Recirculating Filter Pumps, two Seal Water Pumps, and two Non-Potable Water Pumps. Two of the three Main Influent Pumps are 100 HP, 460V, assumed 80% Eff, and controlled by an AutoCon Controller. The third pump motor is US Motors, 100 HP, 460V, 95% efficiency, and controlled by a Safetronics variable speed drive (VFD). The Main Influent Pumps ran a total of 8760 hours during 2008 (24/7), with one operating full-time. The other two pumps were rotated or used only when process flows were excessive.
The three Trickling Filter Recirculating Pumps are 10 HP, 460V, efficiency rating not indicated on motor name plate data, and run 24/7. Two of the Trickling Filter Pumps are run at the same time, while the third acts as a backup. The two Franklin Electric Seal Water Pumps are 2 HP, 460V, efficiency rating not indicated on motor name plate data, and one operates 24/7 while the other acts as a backup. The two Magnatek Non-Potable Water Pumps are 7.5 HP, 460V, 85.5% efficiency, and one operates 24/7 while the other acts as a backup.

Section 4 Energy Conservation and Retrofit Measures (ECRM)
A 4-88
E:\HMUA\EnergyAudit\Final Report\Section 4.doc
Motors associated with Main Influent Pumps 1 and 2 will be replaced with new Premium Efficiency motors and new VFDs. The financial justification and payback period is discussed in detail in Section 4.2.1.
MotorMaster energy model calculations yield $754 in energy savings by upgrading the Trickling Filter Recirculation Pump motor from the existing assumed 85% efficiency motor to a new 93% efficiency motor. The simple payback period for this energy savings upgrade is 1.1 years.
Based on the payback period it is recommended to replace existing Trickling Filter Recirculating Pump motors with new 93% efficient motors.
MotorMaster energy model calculations yield $40 in energy savings by upgrading the Seal Water Pump motor from the existing assumed 85% efficiency motor to a new 87% efficiency motor. The simple payback period for this energy savings upgrade is 8.4 years.
Based on the payback period it is recommended not to replace the existing Seal Water Pump motor with a new 87% efficient motor at this time. It is recommended that the existing motors be replaced with higher efficiency motor in the case of future motor failure only.
MotorMaster energy model calculations yield $433 in energy savings by upgrading the Magnatek Non-Potable Water Pump motors from the existing assumed 85% efficiency motors to new 91% efficiency motors. The simple payback period for this energy savings upgrade is 1.3 years.
Based on the payback period it is recommended to replace existing Magnatek Non-Potable water Pump motors with new 91% efficient motors.
Refer to Appendix J for the MotorMaster detailed energy savings comparison analysis.
4.5.12 WPCP Intermediate Pumping Station The WPCP Intermediate Pumping Station houses three Intermediate Pumps. There is an existing Hoffman Blower, however it is unused. The Intermediate Pumps motors are US Electric 25 HP, 460V, 82.5% efficiency, and ran a total of 8760 hours (24/7) during 2008. Only one Intermediate Pump is used at a time. Two may be operated during excessive process flow rates, but historically this is rare.
MotorMaster energy model calculations yield $2783 in energy savings by upgrading the pump motors rated at 82.5% efficiency to new 94.1% efficiency rated motor. The

Section 4 Energy Conservation and Retrofit Measures (ECRM)
A 4-89
E:\HMUA\EnergyAudit\Final Report\Section 4.doc
simple payback period for this energy savings upgrade is 0.5 years. Refer to Appendix J for the MotorMaster detailed energy savings comparison analysis.
Recommend replacing existing Intermediate Pump motors with new 94.1% efficient motor.
4.5.13 WPCP Advanced Treatment Building The WPCP Advanced Treatment Building currently houses one Water Pump, two Chemical Processing Super-E Pumps, three Return Activated Sludge (RAS) Pumps, two Thickened Sludge (TS) Pumps, two Belt Filter Press Pumps, one Boiler Pump, two Belt Filter Press Motors, and four Hoffman Blower Motors. There are three Internal Recycle Pumps and two Blowers that are currently not operating or out of service.
The Water Pump motor is an Emerson 1.5 HP, 460V, an unknown efficiency, and is operated 24/7. The two Chemical Processing Super-E Pumps are 5 HP, 460V, 89.6% efficiency, and are operated 24/7. The three RAS Pump motors are US Motors 10 HP, 460V, and 91% premium efficiency. Two of the RAS Pumps are operated at the same time for 8760 hours (24/7) during 2008, while the third pump is only operated as a backup. The RAS Pumps are operated by a VFD. The two TS Well Pumps motors are 15 HP, 460V, 92.4% premium efficiency, and operated for a total of 260 hours during 2008. Only one TS Well Pump is operated at a time, the other pump acts as a backup. The TS Well Pumps are operated by a VFD.
The two Belt Filter Press Pumps are 15 HP, 460V, 92.4% premium efficiency, and ran a total of 1040 hours during 2008. Only one Belt Filter Press Pump is operated at a time, the other acting as a backup. The Belt Filter Press Pump is operated by a VFD. The Boiler Pump is 1.5 Hp, 460V, and an unknown efficiency. The two Belt filter Press Motors are an unknown HP, 460V, an unknown efficiency, and operated for a total of 1040 hours during 2008. Only one Belt Filter Press motor is operated at a time. The four Hoffman Blowers are 125 HP, 460V, 95.4% premium efficiency, and operated for a total of 8760 hours (24/7) during 2008. Only one blower is operating at a time, the other blowers are rotated into service. The blower are controlled via Softstarts
MotorMaster energy model calculations yield no significant cost savings by replacing any motors in the WPCP Advanced Treatment Building. This was expected based on the fact that the largest motors loads associated with the process are already rated as premium efficient.
Section 4.2.3 recommends replacement of the existing blowers with smaller capacity blowers which includes new motors and controls. However, until new blowers are installed, the following action is recommended as an interim method to reduce energy

Section 4 Energy Conservation and Retrofit Measures (ECRM)
A 4-90
E:\HMUA\EnergyAudit\Final Report\Section 4.doc
consumption. The Hoffman blower motors are equipped with softstarts, these can be programmed for various motor starting profiles over an adjustable time period. They reduce the typical motor inrush starting current (5 to 6 time full load current) by slowly starting the motor over the programmed time period thereby eliminating the large inrush currents. Based on meter readings taken during our site inspection, the softstarts adjustments need to be verified, as the readings indicated unexpected inrush currents at 5 x the motors listed full load amp rating of 125 Amps.
Refer to Appendix J for the MotorMaster detailed energy savings comparison analysis.
4.5.14 WPCP Digester Building The WPCP Digester Building is currently operating one Sludge Recirculating Pump and three Plunger Sludge Pumps. The Vaughn Sludge Recirculating Pump motor is a 5 HP, 460V, 89.5% efficiency, explosion proof motor, and ran for a total of 8760 hours (24/7) during 2008. The Plunger Sludge Pump motors are Reliance Electric 3 HP, 460V, 88.5% efficiency, and are explosion proof as well. Two of the Plunger Sludge Pumps are run at the same time, total run time for 2008 was about 730 hours. The third pump is only run as an installed spare.
MotorMaster energy model calculations yield no significant cost savings by replacing any motors in the WPCP Digester Building. Refer to Appendix J for the MotorMaster detailed energy savings comparison analysis. Recommend against replacing existing Vaughn Recirculating Sludge Pump motor at this time.
Recommend against replacing existing Reliance Plunger Sludge Pump motors at this time. It is recommended that these motors be replaced with higher efficiency motors in the case of future motor failure only.
4.6 Solar Energy We have evaluated the Jacob Garabed Administration Building, Operations Building, Storage Building, Water Filtration Plant, and Wastewater Treatment Plant as potential candidates for installation of a solar energy system. A solar energy system requires that the solar panels be mounted in a southerly orientation for maximum energy production.
We have inspected both the Operation and Jacob Garabed Administration Buildings for possible installation of a roof mounted solar energy system and have noted that the roof structure for both of these buildings is oriented mostly in an east/west direction which is not favorable for a solar energy system installation and was therefore further discounted from future investigation.

Section 4 Energy Conservation and Retrofit Measures (ECRM)
A 4-91
E:\HMUA\EnergyAudit\Final Report\Section 4.doc
However, the Storage Building roof appears to have the proper orientation but visual inspection of the roof structure during our site visit has led us to suspect that the roof support system would not be adequate to support the additional weight associated with the solar panels and ancillary equipment. A detailed structural analysis is required to confirm the structural supporting capacity of the roof structure and identify the necessary structural modifications to support a solar panel system. However, assuming that the roof can support a solar panel system, we have calculated that based upon a roof area of 800 square feet, a 6.8kW DC system with an estimated annual electric production of 8044kWh can be provided. Based on the current electrical rate of $0.1144/kWh for the Storage Building, this would result in an annual electrical energy savings of $920.00. As a comparison, the average combined electrical consumption for the Jacob Garabed Administration Building and Operations Building is 2600 kWH/month or a total of 31,200 kWH/year. The current BPU upfront incentive for non residential systems less then 50kW is $1.00/watt.
The estimated installation cost and assumed structural roof modifications required to support the SEF results in a simple payback of 21 years as calculated below. Based on this, it was therefore concluded that a SEF installation for the Storage Building is not cost effective.
Installation Estimate: SEF Installation Cost: $55,000 .00 Roof Upgrade Costs: $30,000 .00 BPU Incentive : $6,800.00 Annual Electrical Energy Savings: $920.00 Annual SREC : $2800.00
Simple Payback: (($55,000 + $30,000) -$6,800)/($920.00 +$2,800) = 21 years
With respect to the Water Filtration Plant, a review of the plant’s HVAC drawings and visual inspection of the roof, it was concluded that there was just too many HVAC equipment installations to make a roof mounted solar energy system practical. During our site inspection, we attempted to locate available land to install a ground mounted solar energy system. We investigated the land adjacent to the parking lot area as a potential site for a ground mounted system but because of the density of existing trees, we were concerned that the energy from the sun would be blocked by the trees. Therefore, the Water Filtration Plant was not considered to be a viable candidate for a solar power energy system.
With respect to the Wastewater Treatment Plant, the Hackettstown Municipal Utility Authority has investigated and received two proposals , DT Solar (October 2007) and Solar Power Partners (March 2009) for the installation of a Solar Energy Facility (SEF)

Section 4 Energy Conservation and Retrofit Measures (ECRM)
A 4-92
E:\HMUA\EnergyAudit\Final Report\Section 4.doc
at the Water Pollution Control Plant located at the end of Esna Drive. Both proposals are similar in design and total system energy output, Table 4-27 summarizes the basic system parameters.
Table 4-27: Solar Energy System Parameters
DT Solar Solar Power Partners
Space Requirements 100,000 sq ft 100,500 sq ft
Nominal System Output 961.2 kW-dc 1000 kW-dc
Annual Estimated Energy Savings kWh/Yr
1,097,565 1,289,600
System dc Voltage 330-600Vdc 330-600Vdc
System Interconnect Voltage 460 /12.47 kV 460 /12.47 kV
The systems proposed will utilize approximately (5,340) 180 watt-dc (STC) photovoltaic modules oriented at a fixed angle of 25 degrees. The number of modules selected is considered to be the maximum system size as a function of available land restrictions. The DC power generated by the photovoltaic modules will be converted through DC/AC converters to 460 volt three phase power and this voltage will be stepped up to the plant’s incoming utility distribution power of 12.47 kV. The isolation/ step up transformer will also provide the required utility isolation. Based upon the peak output of the system, NET metering will be required in order to put power back onto the utility grid network.
Solar Power Purchase Agreement Option
Both DT Solar and Solar Power Partners presented a solar Power Purchase Agreement (sPPA) financing option to the Authority. This type of agreement offers the Authority the option to purchase the power produced by the SEF at a fixed annual rate with an annual escalation rate determined by the contract. The contract is typically 12 - 15 years in duration with options to renegotiate after the initial terms. Based on this option, the Authority would benefit from a fixed rate electric utility offset, based on the energy produced from the SEF, with no initial capital investment or maintenance costs. The equipment provider would bear the capital installation costs and any associated operating expenses during the contract term. In turn, the Authority as

Section 4 Energy Conservation and Retrofit Measures (ECRM)
A 4-93
E:\HMUA\EnergyAudit\Final Report\Section 4.doc
specified in the terms of the contract would carry an insurance rider to cover any unforeseen damage to the SEF. It should be noted that no actual terms and conditions of any proposed contract were available or reviewed; the analysis is based on the information that was presented in the initial proposals. A simple financial analysis is provide in Table 4-28 below.
Table 4-28: Simple Financial Analysis for Solar Energy Systems
DT Solar Solar Power Partners
Estimated Starting sPPA rate $0.11kWh $0.11kWh
Contract Term Length 15 Years 15 Years
Annual Escalator 2% 3.5%
System Size (W-dc) 961.2 kW 1000 kW
Annual Estimated Energy Production
1,097,565 kWh/yr. 1,289,600 kWh/yr.
2008 Average Utility Cost $/kWh
$0.1425 $0.1425
Annual Utility Escalation est. 3% 3%
Estimated Utility Savings for Term of Contract
$3,603,300 $3,959,263
Purchase of the SEF Option
DT Solar provided cost estimates for the Authority to purchase and operate the SEF as described in Table 4-32. This option would allow the Authority to take direct control of the Solar Renewable Energy Credits (SREC). The SREC program was created as an incentive for solar generator in excess of 50,000 watts. To establish an SREC account, the SEF must be registered and produce 1MWh of electricity, a SREC will be issued for each addition MWh of electricity produced. Refer to report Section 7 for a discussion on solar energy credits. Under a sPPA contract, the Authority will not be entitled to SREC benefits; these would be passed to the PPA. Currently, New Jersey BPU has set a cap on the Solar Alternative Compliance Payments (SACPs). This is the

Section 4 Energy Conservation and Retrofit Measures (ECRM)
A 4-94
E:\HMUA\EnergyAudit\Final Report\Section 4.doc
cost that a generator would pay to maintain compliance with New Jersey’s Renewable Portfolio Standard (RPS). Table 4-29 is the current eight year SACP maximum schedule.
Table 4-29: Eight Year SACP Maximum Schedule
Reporting Year
SACP ($/MWh)
SACP ($/kWh)
2008-2009 $711 $0.711
2009-2010 $693 $0.693
2010-2011 $675 $0.675
2011-2012 $658 $0.658
2012-2013 $641 $0.641
20-13-2014 $625 $0.625
2014-2015 $609 $0.609
20-15-2016 $594 $0.594
The plant’s current average demand is approximately 200kW to 230kW per day, this coincides when the SEF will be producing most of the solar power as well. For simplification of the financial model it is assumed 25% of the total power produced by the SEF will be consumed by the plant, this assumes that the solar system will be producing electricity at its rated designed output. This saves the plant the total cost of the power they would normally buy from the utility (the $.1425 which equals $.11/kWh cost of retail electricity, the transmission and other charges $0.0325/kWh) the remaining 75% of the power produced is sold back to the utility at just the retail electricity cost of $0.11/kWh.
Given that the project financials vary with the prevailing energy market conditions and SREC rates, the largest impact to the simple payback model is the SREC credit pricing. SREC pricing for the last half of 2008 ranged from $308/MWh to a high of $419.5/MWh. For the simple payback model a value of $360/MWh was used. The

Section 4 Energy Conservation and Retrofit Measures (ECRM)
A 4-95
E:\HMUA\EnergyAudit\Final Report\Section 4.doc
simple payback model does not take into account project finance charges, equipment depreciation or possible alternative finance methods to offset initial project costs.
Table 4-30: Simple Payback Analysis for a Solar Energy System
Parameter DT Solar
Estimated Budgetary Project Cost In 2009 Dollars (1)
$8,040,000
1st Year Production 1,097,565 kWh
1st Year Electric Savings @ $0.1425/kWh
$39,101
1st Year Net Metering Revenue @ $0.11/kWh
$90,549
1st Year SREC Revenue @ $0.36/kWh
$395,123
Project Simple Payback 14 Years
Capitalizes Equipment Life 20 Years
Total Revenue based on 20 Year Project
$3,304,565
Note 1: Construction cost estimate of $7,309,038 as provided in DT Solar’s report dated October 30, 2007 has been increased by approximately 5% per year to incorporate the effects of inflation.
Based on the simple payback modeling performed it would benefit the Authority to further investigate the solar Power Purchase Agreement option. This is primarily based on the initial upfront capital investment required for a SEF installation and the long payback period. The other factor to consider from a system ownership perspective is the ever changing technology and efficiency that may become available in the future. The sPPA option will allow the facility a chance to prove the conceptual design and establish working experience with the technology and allow the option to possibly purchase a more efficient and less costly future system after the initial contract with the sPPA provider is complete.

A 5-1
E:\HMUA\EnergyAudit\DraftRpt to TRC\Section 5.doc
Section 5 Evaluation of Energy Purchasing and Procurement Strategies
5.1 Energy Deregulation In 1999, New Jersey State Legislature passed the Electric Discount & Energy Competition Act (EDECA) to restructure the electric power industry in New Jersey. This law, the deregulation of the market, allowed all consumers to shop for their electric supplier. The intent was to create a competitive market for electrical energy supply. As a result, utilities were allowed to charge Cost of Service and customers were given the ability to choose a third party supplier. Energy deregulation in New Jersey increased the energy buyers’ options by separating the function of electricity distribution from that of electricity supply.
Jersey Central Power and Lighting (JCP&L) is currently the generator and supplier of energy for the Authority. JCP&L is one of seven subsidiaries of First Energy Corp., an energy company headquartered in Akron, Ohio. Energy deregulation creates the opportunity to choose your electric generation supplier. The benefit of this is the ability to choose a supplier based on what is important to you, for example, lowest rate or how the electric generation supply is produced.
To sell electric generation service in New Jersey, electric power suppliers must be licensed by the New Jersey Board of Public Utilities (NJ BPU). They must also be registered with the local public utility (JCP&L) to sell electric service in that utility’s service areas. The following suppliers are licensed with the NJ BPU and are registered to sell electric service in the JCP&L service territory:
Amerada Hess Corp
BOC Energy Services
Con Edison Solutions, Inc.
Constellation New Energy, Inc.
Direct Energy, LLC.
First Energy Solutions Corp.
Glacial Energy
Integrys Energy Service
Liberty Power

Section 5 Evaluation of Energy Purchasing and Procurement Practices
5-2 E:\HMUA\EnergyAudit\DraftRpt to TRC\Section 5.doc
Pepco Energy Services, Inc.
PP&L Energy Plus, LLC.
Reliant Energy Solutions East, LLC.
Sempra Energy Solutions
South Jersey Energy
Strategic Energy LLC
Suez Energy Resources NA, Inc
UGI Energy Services
5.1.1 Alternate Third Party Electrical Energy Supplier In evaluating the potential for an alternative third party supplier, CDM contacted and requested quotes for electric service from Amerada Hess Corp, Con Edison Solutions, Inc., Direct Energy, LLC and First Energy Solutions Corp. The objective of which was to get an overall idea of whether or not switching electric energy suppliers is an avenue that the Authority should pursue further to obtain electrical energy cost savings.
Although not pursued by CDM, switching service providers for natural gas to recognize cost savings is also an option for the Authority.
CDM received a proposal from First Energy Solutions Corp for four of the Authority’s 12 services. First Energy Solutions did not present a proposal for the remaining services, as the addition of their transmission charges would result in unattractive aggregate costs per kWH. In general, First Energy Solutions indicated that cost effectiveness exists on the services providing more than 150,000 kWHs per year.
The following table, Table 5-1, summarizes the four services that fall within this ‘cost effective’ range, providing more than 150,000 kWHs per year each. JCP&L imposes a different kWH charge depending on the time of year, summer (May – September) or winter (October – April) while, First Energy Solution’s proposed cost per kWH is a flat rate over a 12 month term. This will automatically allow for energy cost savings during the summer months, as First Energy Solution’s kWH rate will not increase per a summer / winter schedule. Both the proposed costs from First Energy Solutions and the retail rates from JCP&L include electric generation charges and sales and use tax. The rates used in the comparison represent the baseline generation rates from the two suppliers. These rates do not include any applicable demand charges, societal benefits charges, transmission charges, energy charges, reconciliation charges, transitional assessment charges or system control charges that were included in the aggregate rates presented in Section 3. These baseline generation rates, as presented in Table 5-1,

Section 5 Evaluation of Energy Purchasing and Procurement Practices
5-3 E:\HMUA\EnergyAudit\DraftRpt to TRC\Section 5.doc
are used for comparison purposes to identify any potential cost savings, as all other applicable charges cannot be avoided by switching suppliers.
First Energy has presented a cost that would be applicable over a 12 month, a 13 month and a 24 month period for each service; however, the 12 month term presented the most attractive rates and was consequently used in this analysis. It should be noted that these proposed costs are subject to change and are dependent on availability. In addition, this proposal expires April 10, 2009.
CDM has explored this avenue for the sole purpose of uncovering any further energy cost savings available for the Authority.
Table 5-1: First Energy Solutions Corp Proposal
Service JCP&L Summer
Retail Energy Cost ($/kWH)
JCP&L Winter Retail Energy Cost ($/kWH)
First Energy’s Proposed Cost for a 12 month period
($/kWH)
Mount Olive Booster Station $0.1337 $0.1152 $0.1186
Well #6 $0.1337 $0.1152 $0.0889
Water Filtration Plant and Well’s 5 and 7
$0.1337 $0.1152 $0.0949
WPCP $0.1337 $0.1152 $0.0816
As shown in Table 5-1, First Energy Solutions proposed costs were less than the current retail costs year round through JCP&L for Well #6, the Water Filtration Plant and the WPCP. The proposed cost for the Mount Olive Booster Station was slightly greater than the current winter retail energy cost.
The following table, Table 5-2, summarizes the cost savings available during the summer based on average summer consumption at the four services.

Section 5 Evaluation of Energy Purchasing and Procurement Practices
5-4 E:\HMUA\EnergyAudit\DraftRpt to TRC\Section 5.doc
Table 5-2: Potential Energy Cost Savings during the Summer (May – Sept) with an Alternate Third Party Supplier - First Energy Solutions Corp
Service Summer
Estimated kWH
Summer Cost with
JCP&L
Proposed Cost with First
Energy
Potential Savings
Mount Olive Booster Station 97,895 $13,088 $11,610 $1,478
Well #6 237,420 $31,743 $21,106 $10,637
Water Filtration Plant and Well’s 5 and 7
527,575 $70,536 $50,066 $20,470
WPCP 773,275 $103,386 $63,099 $40,287
Total Potential Annual Savings: $72,872
The following table, Table 5-3, summarizes the cost savings available during the winter based on average winter consumption at the four services. As shown, the proposed rates for the Mount Olive Booster Station would not be recommended, as the Authority would not gain energy cost savings from switching suppliers.
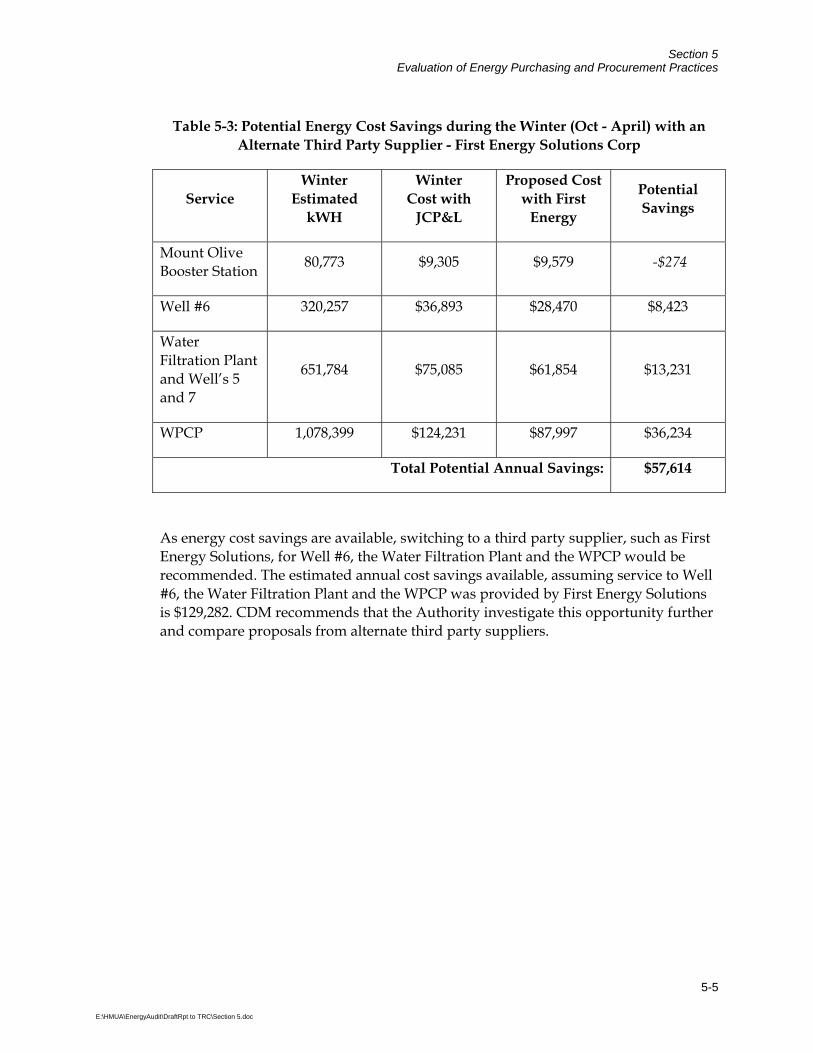
Section 5 Evaluation of Energy Purchasing and Procurement Practices
5-5 E:\HMUA\EnergyAudit\DraftRpt to TRC\Section 5.doc
Table 5-3: Potential Energy Cost Savings during the Winter (Oct - April) with an Alternate Third Party Supplier - First Energy Solutions Corp
Service Winter
Estimated kWH
Winter Cost with
JCP&L
Proposed Cost with First
Energy
Potential Savings
Mount Olive Booster Station 80,773 $9,305 $9,579 -$274
Well #6 320,257 $36,893 $28,470 $8,423
Water Filtration Plant and Well’s 5 and 7
651,784 $75,085 $61,854 $13,231
WPCP 1,078,399 $124,231 $87,997 $36,234
Total Potential Annual Savings: $57,614
As energy cost savings are available, switching to a third party supplier, such as First Energy Solutions, for Well #6, the Water Filtration Plant and the WPCP would be recommended. The estimated annual cost savings available, assuming service to Well #6, the Water Filtration Plant and the WPCP was provided by First Energy Solutions is $129,282. CDM recommends that the Authority investigate this opportunity further and compare proposals from alternate third party suppliers.


A 6-1
E:\HMUA\EnergyAudit\DraftRpt to TRC\Section 6.doc
Section 6 Ranking of Energy Conservation and Retrofit Measures (ECRM)
6.1 ECRMs The main objective of this energy audit is to identify potential Energy Conservation and Retrofit Measures and to determine whether or not the identified ECRM’s are economically feasible to warrant the cost for planning and implementation of each measure. Economic feasibility of each identified measure was evaluated through a simple payback analysis. The simple payback analysis consists of establishing the Engineer’s Opinion of Probable Construction Cost estimates, O&M estimates, projected annual energy savings estimates, and the potential value of New Jersey Clean Energy rebates, or Renewable Energy Credits, if applicable. The simple payback period is then determined as the amount of time (years) until the energy savings associated with each measure amounts to the capital investment cost.
As discussed is Section 3, aggregate unit costs for electrical energy delivery and usage, which accounts for all demand and tariff charges, at each facility was determined and utilized in the simple payback analyses.
In general, ECRMs having a payback period of 20 years or less have been recommended and only those recommended ECRMs within Section 4 of the report have been ranked for possible implementation. The most attractive rankings are those with the lowest simple payback period.
Ranking of ECRMs has been broken down into the following categories:
• Water Treatment Plant and Pump Stations;
• Water Pollution Control Plant;
• Building HVAC Components;
• Building Lighting Systems;
• Motors.
6.1.1 Water Treatment Plant and Pump Stations For the water treatment plant and pump stations, the energy audit focused on assessing the viability of off-peak pumping of production and booster pumping units in an effort to take advantage of the preferred energy rates during off-peak time periods and the viability of installing a hydro-electric system at the water treatment plant.

Section 6 Ranking of Energy Savings Measures
A 6-2
E:\HMUA\EnergyAudit\DraftRpt to TRC\Section 6.doc
With regards to the water distribution pumping systems, Section 4.1.1includes a detailed description of the analysis that was employed to determine the viability of off-peak pumping. The analysis of the water distribution system to determine if the well pumps can be operated on a Day/Night operational protocol included a two prong approach. First, we analyzed the feasibility of operating Well Number 4, 5, and 7 pumps entirely during off peak times as these well pumps are currently on a Day/Night billing structure. Secondly, we extended our evaluation to examine the feasibility of operating all well pumps during off peak operational hours. Based upon our analyses of the water distribution system, it was concluded that all 6 wells can be operated on a Day/Night billing structure with an estimated annual energy savings of $5,464.00 which equates to an annual savings in demand energy usage of 815 kW. This ECRM is highly recommended as it provides the Authority with energy savings without making a significant capital cost investment. With regards to the Mount Olive and Independence Booster Pump Stations, it was concluded that there would be no energy savings from switching these booster stations to a Day/Night billing structure. Section 4.1.2 includes a detailed description of the analysis that was employed to determine the feasibility of installing a hydro-electric system at the water filtration plant. The analysis concluded that based upon the available head and flow, approximately 7kW of electrical power can be produced. Based upon this electrical production, it was concluded that installation of a hydro-electric system at the water filtration plant was not economically feasible.
6.1.2 Water Pollution Control Plant At the WPCP, wastewater unit process such as the main sewage pumps, trickling filter recirculation pumps, aeration system, digestion system, UV disinfection system, non-potable water system and implementation of a solar energy system were evaluated as potential ECRMs. As discussed in Section 4, it has been concluded that ECRMs associated with the trickling filter recirculation pumps and non-potable water pumps are not economically feasible as the payback period associated with these ECRMs exceed 20 years. With regards to the UV disinfection system, no ECRMs have been identified for this system.

Section 6 Ranking of Energy Savings Measures
A 6-3
E:\HMUA\EnergyAudit\DraftRpt to TRC\Section 6.doc
Section 4.2.4.5 also provides for a detailed analysis of providing a combined heat and power co-generation system to be installed for beneficial use of digester gas to create electrical energy. While it was concluded that such a system is feasible, recommendation of its implementation is contingent upon installing a digester mixing system for the primary digester and verification of digester gas production rates to confirm that expected future digester gas production is sufficient to support the operation of a combined heat and power co-generation system. However, implementation of this ECRM has been included in Table 6-1 as its simple payback period has been calculated to be 15 years.
Lastly, implementation of a new solar energy system has been evaluated to determine the economic feasibility for furnishing and installing such a system for the Jacob Garabed Administration Building, Operation Building, Storage Building, Water Filtration Plant, and the Wastewater Treatment Plant. A detailed analysis is provided in Section 4.6 of the report. Based upon the analysis, it was concluded that the only feasible and cost effective location to install a new solar energy system is at the Wastewater Treatment Plant.
For the Wastewater Treatment Plant, two options were considered in the evaluation. The first option evaluated the economic feasibility of a power purchase agreement whereby the Authority contracts with a solar panel system provider who assumes the capital costs associated with the furnishing and installation of the system including annual O&M costs and the Authority in turn pays the provider a rate for electrical energy production. The second option evaluated the economic feasibility of the Authority furnishing and installing a solar energy system under a typical construction contract and to assume full responsibility of the operation of such a system.
Based on the simple payback modeling performed, it has been concluded that it would benefit the Authority to further investigate the solar Power Purchase Agreement option. This is primarily based on the initial upfront capital investment required for a solar energy system installation and the long payback period of approximately 14 years. Two major factors influencing the project financial evaluation is the variance of the prevailing energy market conditions and Solar Renewable Energy Credit (SREC) rates, with the largest impact to the simple payback model being the SREC credit pricing. SREC pricing for the last half of 2008 ranged from $308/MWh to a high of $419.5/MWh, For the simple payback model, a value of $360/MWh was used. The simple payback model did not take into account project finance charges, equipment depreciation or possible alternative finance methods to offset initial project costs.
Table 6-1, includes a ranking of the recommended ECRMs for the WPCP.

Section 6 Ranking of Energy Savings Measures
A 6-4
E:\HMUA\EnergyAudit\DraftRpt to TRC\Section 6.doc
Table 6-1: Ranking of Energy Savings Measures - WPCP
Recommendation
Engineer’s Opinion of Probable
Construction Cost
Annual Energy
Savings (kW-hrs)
Annual Energy Savings
Simple Payback (Years)
Main Sewage Pumps 1 & 2 - Motor & VFD Replacement $114,000.00 378,505 $53,937.00 2
Insulation of Primary Digester Cover $30,000.00 1,430 gallons of fuel oil $3,720.00 8
Digester Mixing System $318,000.00 65,350 $42,490.00(1) 9 Turbo Blowers $871,000.00 463,550 $66,000.00 15 Internal Combustion Engine System $1,000,000.00 692,484 $98,680.00 15
Note 1: Annual Savings of $42,490.00 comprises of an annual savings of $9,315 in electric energy, $16,300 in sludge hauling costs and $16,875 in equivalent value of fuel. Refer to table 4-11.
6.1.3 Building HVAC Components The HVAC components of all buildings have been evaluated and all evaluations are presented in Section 4.3. A number of minor improvements and alternatives for future consideration have been recommended, such as furnishing and installing insulation on the basement duct work in the Jacob Garabed Administration Building and the potential for gas-fired infrared radiant heating units in lieu of the gas-fired unit heaters currently in use in the Storage Building.
Table 6-2 includes a ranking of the recommended energy savings measures for the Advanced Treatment Building at the WPCP.
Table 6-2: Ranking of Energy Savings Measures - HVAC
Recommendation
Engineer’s Opinion of Probable
Construction Cost
Annual Fuel Oil Savings (gallons)
Annual Energy Savings
Simple Payback (Years)
WPCP Advanced Treatment Building Install energy recovery ventilator on HV-3 System (Basement Area) $22,035.00 6,678 $9,907.00 2.2
Install energy recovery ventilator on HV-2 System (GBT Area) $22,035.00 1,090 $1,617.00 13.6
6.1.4 Building Lighting Systems Table 6-3 includes rankings of all recommended ECRMs to provide energy savings for all building lighting systems which include the installation of occupancy sensors and the replacement of T12 fluorescent fixtures with T8 fluorescent fixtures and high efficiency ballasts. A detailed discussion on building lighting systems is presented in Section 4.4.

Section 6 Ranking of Energy Savings Measures
A 6-5
E:\HMUA\EnergyAudit\DraftRpt to TRC\Section 6.doc
Table 6-3: Ranking of Energy Savings Measures - Electrical Lighting
Recommendation
Engineer’s Opinion of Probable
Construction Cost
Annual Energy Savings (kW-hrs)
Annual Energy Savings
Simple Payback (Years)
Jacob Garabed Admin Building $12,330.00 13,330 $2,322.56 5 WPCP - Advanced Treatment Building $8,377.00 8,309 $1,184.34 6 WPCP - Administration Building $14,910.00 12,925 $1,841.83 7 Operations Building $5,100.00 2,440 $425.01 10
6.1.5 Motors Table 6-4, includes the ranking of ECRMs associated with Electric Motors.
Table 6-4: Ranking of Energy Savings Measures - Electrical Motors
Recommendation
Engineer’s Opinion of Probable
Construction Cost
Annual Energy Savings (kW-hrs)
Annual Energy Savings
Simple Payback (Years)
WPCP - Intermediate Pumping Station - Intermediate Pump $1,511.00 19,530 $2,783.00 0.5
WPCP Trickling Recirculating Filter Pumps $835.00 5290 $754.00 1.1 WPCP Non-Potable Water Pumps $555.00 3,040 $433.00 1.3 Water Filtration Plant - High Lift Pump(1) $2,794.00 12,942 $1,988.00 1.4 Well #2 – Snooks Pump $1,325.00 1,790 $319.00 4 Mount Olive Booster Station - Pump $3,166.00 3,910 $738.00 4
Note 1: Replacement of the High Lift Pump motors are recommended only if the Authority decides to continue to keep the Water Filtration Plant in operation.


A 7-1
E:\HMUA\EnergyAudit\DraftRpt to TRC\Section 7.doc
Section 7 Available Grants, Incentives and Funding Sources 7.1 New Jersey Environmental Infrastructure Financing Program
7.1.1 Introduction The New Jersey Environmental Infrastructure Financing Program (EIFP) is a partnership between the New Jersey Department of Environmental Protection (DEP) and the New Jersey Environmental Infrastructure Trust. The Legislature created the program to offer local governments and private water purveyors low-cost financing for construction of wastewater and drinking water infrastructure, landfill construction and closure, and stormwater and nonpoint source pollution management projects.
7.1.2 Projects Eligible for Funding Typical projects eligible for funding under the EIFP program are as follows:
Secondary and advanced wastewater treatment facilities; Infiltration and inflow correction; Interceptors, pumping stations, force mains and collection systems; Sewer system rehabilitation; Correction of combined sewer overflows; Solutions for malfunctioning septic systems; Remedial work; Stormwater and nonpoint source pollution management projects, including street
sweepers, skimmer boats, and netting on outfalls; Landfill construction and closure; Drinking water projects; Open space acquisition and conservation; Security such as fencing, lighting, motion detectors, and cameras.
7.1.3 Financing through the EIFP Borrowers receive two loans, a zero percent interest loan from DEP and a market rate loan from the sale of the trust’s AAA-rated tax-exempt bonds. Some projects will receive 75 percent of the total loan from DEP and 25 percent from the Trust, making the loans financed at only one-quarter of the market rate. Qualifying for the 75/25 financing are:
Projects serving a designated urban center or urban complex; Combined sewer overflow projects; Open space acquisition projects.

Section 7 Available Grants, Incentives and Financing Programs
7-2 E:\HMUA\EnergyAudit\DraftRpt to TRC\Section 7.doc
All other projects will receive 50 percent of the total loan from DEP and 50 percent from the Trust, making these loans financed at one-half of the market rate.
7.1.4 Advantages of Borrowing through the EIFP The advantages of borrowing through the EIFP are as follows:
Lowest Interest- Wastewater infrastructure projects are eligible for loans at one-quarter or one-half of the market rate.
Reduced Financing Costs- Borrowers benefit from reduced costs due to the economies of scale of a pooled bond issue. Bond insurance is rarely needed, interest may be capitalized and principal payments deferred during construction, and the debt service reserve fund is capitalized by the State.
Match to Other Funding Programs- The amount available to project sponsors for EIFP loans is unlimited and can be used to supplement grants and other loan programs.
7.1.5 EIFP Typical Program Schedule
Table 7-1 presents a typical program schedule.

Section 7 Available Grants, Incentives and Financing Programs
7-3 E:\HMUA\EnergyAudit\DraftRpt to TRC\Section 7.doc
Table 7-1: EIFP Typical Program Schedule
October 6 Submit commitment letter and planning document
February Attend Seminar for all borrowers to explain remaining financing schedule and requirements.
March 3 Submit design documents and loan application
March 24 Submit financial addendum form to Trust
June 1 Deadline for private water purveyors to file with BPU
Mid June Deadline for public agencies to file with State Local Finance Board
August 15 Bid blackout period begins
Late August Project certification to Trust by DEP
Mid August Escrow closing of loan begins
Mid October Bond sale takes place
1st Week in November
Loan closing takes place
November 10 Bid blackout period ends.
7.2 New Jersey Clean Energy Program 7.2.1 Introduction New Jersey's Clean Energy Program (N JCEP) promotes increased energy efficiency and the use of clean, renewable sources of energy including solar, wind, geothermal, and sustainable biomass. The results for New Jersey are a stronger economy, less pollution, lower costs, and reduced demand for electricity. NJCEP offers financial incentives, programs, and services for residential, commercial, and municipal customers.
NJCEP reduces the need to generate electricity and burn natural gas which eliminates the pollution that would have been caused by such electric generation or natural gas usage. The benefits of these programs continue for the life of the measures installed, which on average is about 15 years. Thus, the public receives substantial

Section 7 Available Grants, Incentives and Financing Programs
7-4 E:\HMUA\EnergyAudit\DraftRpt to TRC\Section 7.doc
environmental and public health benefits from programs that also lower energy bills and benefit the economy.
7.2.2 Renewable Energy Incentive Program The New Jersey Board of Public Utilities Clean Energy Program offers the new Renewable Energy Incentive Program. The program provides incentives and support services needed for participants to build onsite renewable energy projects using solar, wind and biopower technologies. The new program is part of New Jersey's efforts to reach its Energy Master Plan goals of using 30 percent renewable energy by 2020. The program includes financial incentives to owners who install qualified clean energy generation systems in New Jersey. The Renewable Energy Certificates (RECs) Program is also available to help finance projects that do not qualify for rebates. Renewable energy systems enable you or your organization to produce clean energy, help protect the environment, and reduce utility costs.
Why get involved? For a variety of reasons, such as a desire to:
reduce pollution;
stabilize electric costs;
lessen dependence on fossil fuels;
increase self-reliance;
increase local jobs & economic development;
preserve natural resources;
make a long-term commitment to the planet’s future;
strengthen energy security and long term affordability.
7.2.3 Renewable Energy Incentive Program Incentives Below are the rebate levels effective for all applications received on or after February 2, 2009 for Solar and Sustainable Biomass Systems.

Section 7 Available Grants, Incentives and Financing Programs
7-5 E:\HMUA\EnergyAudit\DraftRpt to TRC\Section 7.doc
Table 7-2: Solar Electric Systems
Capacities
Column A: Residential
Solar PV
Applications
Column B: Non-Residential
Solar PV Application
0 to 10,000 watts with an energy audit $1.75/watt does not apply
0 to 10,000 watts without an energy audit $1.55/watt does not apply
0 to 50,000 watts does not apply $1.00/watt
greater than 50,000 watts does not apply does not apply
Table 7-3: Sustainable Biomass Systems
Sustainable Biomass Systems
ITEM Incentive Level
Systems up to 10 kW $5.00/watt
Maximum incentive as percentage of eligible system costs
60%
Systems Greater than 10 kW
1 - 10,000 watts $3.00/watt
10,001 to 100,000 watts $2.00/watt

Section 7 Available Grants, Incentives and Financing Programs
7-6 E:\HMUA\EnergyAudit\DraftRpt to TRC\Section 7.doc
100,001 to 500,000 $1.50/watt
500,000 watts, up to 1,000,000 watts $0.15/watt
Maximum incentive as percentage of eligible system costs 30%
7.2.4 Participation Requirements for the Renewable Energy Incentive Program The participation process requires four steps:
1. Determining Eligibility; 2. Submittal of Initial Application; 3. Processing of Final Application, Inspection, and Up-front Incentive; 4. Earning and Trading Renewable Energy Certificates. 7.2.4.1 Determining Eligibility An applicant starts by identifying the type and size of system appropriate for their situation and submits a completed application package. An application must be submitted for all customer-sited projects, regardless of whether the project is eligible for, or is applying for, an incentive.
For solar projects, only those with a rated capacity of less than or equal to 50 kW are eligible for an up-front incentive.
Solar projects with a rated capacity of greater than 50 kW are only eligible for SRECs.
Non-solar projects are eligible for up-front incentives up to their applicable rebate limit.
Customer-Sited Renewable Energy Technology Type
Up -Front Incentives RECs
Solar-Electric Small (up to 50 kW-dc stc) X X Solar-Electric - Large (>50 kW-dc stc) X
Sustainable Biomass X X

Section 7 Available Grants, Incentives and Financing Programs
7-7 E:\HMUA\EnergyAudit\DraftRpt to TRC\Section 7.doc
All customer-sited projects must demonstrate that the estimated annual energy production does not exceed the onsite consumption, and that the system complies with all applicable program and interconnection requirements.
7.2.4.2 Initial Application
The contents of a completed initial application package generally include an application form, the appropriate technical worksheet, documentation of annual electric consumption, a signed contract for the system to be installed, and a site map. The Market Managers will not process incomplete applications for approval but instead will return incomplete applications to the applicant.
For applicants requesting up-front incentives for solar projects once the initial application package is complete and determined to comply with program requirements, and if sufficient program funds are available within the funding cycle, the participant will receive an up-front incentive approval letter. This letter represents a commitment of program up-front incentive funds to the participant, contingent upon the timely and proper completion of the project. The letter also certifies that the project, as proposed, will be eligible to generate RECs in accordance with the state’s RPS rules. If sufficient program funds are not available, the application will be returned.
For registrants that are not requesting up-front incentives, i.e., seeking to register for Solar RECs, once the initial registration package is complete and determined to comply with program requirements, the participant will receive a project acceptance letter. This letter confirms that the project, as proposed, will be eligible to earn SRECs in accordance with the State’s RPS rules.
7.2.4.3 Final Application, Inspection, and Up-front Incentive Processing Once approved, projects have 12 months for completion of the installation and to submit final project documentation.
This final documentation requirement typically includes the final up-front incentive application, evidence of Home Performance audit, and revised technical worksheet and tax certification, if applicable. After the REP inspection or quality assurance review, the installation must also pass a local code inspection. The utility interconnection application and the local code UCC must be submitted after a successful local code inspection.
Expected turnaround time after receipt of all paperwork for review, approval, and payment is 60 days for projects receiving up-front incentives; 30 days for projects that do not receive up-front incentives.

Section 7 Available Grants, Incentives and Financing Programs
7-8 E:\HMUA\EnergyAudit\DraftRpt to TRC\Section 7.doc
7.2.4.4 Earning and Trading Renewable Energy Certificates Owners of eligible generating units, installers, REC aggregators/brokers, and Load Serving Entities may establish renewable energy certificate (REC or SREC) accounts. These accounts are hosted and managed on the Generation Attributes Tracking System (GATS) managed by PJM-Environmental Information Systems (PJM-EIS), also referred to as the GATS administrator .
To establish a REC account for their generating unit, participants must register for an electronic account on the GATS Administrator’s website. Registration and account activation cannot be completed until the system has been referred to the GATS Administrator by the Market Manager, and the Market Manager’s referral is contingent upon verification that the system is installed and has been determined to have met all the requirements of the NJCEP, including passing all locally-required inspections and the program’s quality assurance/quality control requirements.
Once registered, RECs are issued by the GATS Administrator and deposited in the participant’s account as generation data is entered on a monthly basis. Account holders can list RECs for sale and contact potential buyers on the REC program website’s electronic bulletin board or through other means.
7.2.5 New Jersey Solar Renewable Energy Certificate Program SREC stands for Solar Renewable Energy Certificate and is a tradable certificate that represents all the clean energy benefits of electricity generated from a solar electric system. Each time a solar electric system generates 1000kWh (1MWh) of electricity, an SREC is issued which can then be sold or traded separately from the power. This makes it easy for individuals and businesses to finance and invest in clean, emission free solar power.
The New Jersey SREC Program provides a means for SRECs to be created and verified on the Authority’s behalf. The New Jersey Board of Public Utilities has designated an SREC Administrator* who tracks production from individual generators, issues SRECs, and records the sale (or other transfer of ownership) of SRECs from generators to other account holders. A market for SRECS is driven primarily by New Jersey's electricity suppliers who are required to purchase SRECs annually under New Jersey's Renewable Portfolio Standard (RPS). This requirement increases each year, so that SRECs from the equivalent of a total of 90MW of solar generation capacity will be required by 2009. That's enough electricity to power approximately 8,000 homes!
All solar system owners in New Jersey with grid-connected generators can participate in New Jersey's SREC Program. If the Authority plans to manage their own SREC account, you must first register for an SREC account. If you have an arrangement with someone else to manage your SREC account (for example your solar installer, or a SREC aggregator or broker) that person will establish an account for you. Once the Authority’s account is established, SRECs will be deposited into your account based

Section 7 Available Grants, Incentives and Financing Programs
7-9 E:\HMUA\EnergyAudit\DraftRpt to TRC\Section 7.doc
on estimated or actual monthly energy production, and the account holder will be able to transfer ownership of SRECs to other account holders when SRECs are sold.
7.2.6 SREC Pricing The table below contains monthly SREC pricing data based on prices reported by registered SREC account holders through the New Jersey SREC website.
Current SREC Trading Statistics Reporting Year 2009
For SRECs from electricity produced June 1, 2008 - May 31, 2009.
7.2.7 New Jersey Smart Start Program The New Jersey Smart Start Program offers rebate incentives for several qualifying equipment such as high efficient premium motors and lighting, and lighting controls.
Incentive information and incentive calculation worksheets are provided for the various new equipment installation identified in this report and are included in Appendix M.