Embed Size (px)
Citation preview
H A F N I A L I M I T E D
I N V E S TO R P R E S E N TAT I O N
Q 3 2 0 2 0
20 November 2020
IMPORTANT: YOU MUST READ THE FOLLOWING BEFORE CONTINUING. THE FOLLOWING APPLIES TO THIS DOCUMENT, THE ORAL PRESENTATION OF THE INFORMATION IN THIS DOCUMENT BY HAFNIA LIMITED (THE "COMPANY") OR ANY PERSON ON BEHALF OF THE COMPANY, AND ANY QUESTION-AND-ANSWER SESSION THAT FOLLOWS THE ORAL PRESENTATION (COLLECTIVELY, THE "INFORMATION"). IN ACCESSING THE INFORMATION, YOU AGREE TO BE BOUND BY THE FOLLOWING TERMS AND CONDITIONS.
THIS DOCUMENT HAS BEEN PRODUCED SOLELY FOR INFORMATION PURPOSES. THE INFORMATION DOES NOT CONSTITUTE OR FORM PART OF, AND SHOULD NOT BE CONSTRUED AS AN OFFER OR THE SOLICITATION OF AN OFFER TO SUBSCRIBE FOR OR PURCHASE SECURITIES OF THE COMPANY, AND NOTHING CONTAINED THEREIN SHALL FORM THE BASIS OF OR BE RELIED ON IN CONNECTION WITH ANY CONTRACT OR COMMITMENT WHATSOEVER, NOR DOES IT CONSTITUTE A RECOMMENDATION REGARDING SUCH SECURITIES. ANY SECURITIES OF THE COMPANY MAY NOT BE OFFERED OR SOLD IN THE UNITED STATES OR ANY OTHER JURISDICTION WHERE SUCH A REGISTRATION WOULD BE REQUIRED UNLESS SO REGISTERED, OR AN EXEMPTION FROM THE REGISTRATION REQUIREMENTS OF THE U.S. SECURITIES ACT OF 1933, AS AMENDED, OR OTHER APPLICABLE LAWS AND REGULATIONS IS AVAILABLE. THE INFORMATION IS NOT DIRECTED TO, OR INTENDED FOR DISTRIBUTION TO OR USE BY, ANY PERSON OR ENTITY THAT IS A CITIZEN OR RESIDENT OF, OR LOCATED IN, ANY LOCALITY, STATE, COUNTRY OR OTHER JURISDICTION WHERE SUCH DISTRIBUTION OR USE WOULD BE CONTRARY TO LAW OR REGULATION OR WHICH WOULD REQUIRE ANY REGISTRATION OR LICENSING WITHIN SUCH JURISDICTION. THE INFORMATION IS NOT FOR PUBLICATION, RELEASE OR DISTRIBUTION IN ANY JURISDICTION IN WHICH OFFERS OR SALES WOULD BE PROHIBITED BY APPLICABLE LAW.
THE INFORMATION CONTAINS FORWARD-LOOKING STATEMENTS. ALL STATEMENTS OTHER THAN STATEMENTS OF HISTORICAL FACTS INCLUDED IN THE INFORMATION ARE FORWARD-LOOKING STATEMENTS. FORWARD-LOOKING STATEMENTS GIVE THE COMPANY'S CURRENT BELIEFS, INTENTIONS, EXPECTATIONS AND PROJECTIONS RELATING TO ITS FINANCIAL CONDITION, RESULTS OF OPERATIONS, LIQUIDITY, PROSPECTS, GROWTH, PLANS AND STRATEGIES. THESE STATEMENTS MAY INCLUDE, WITHOUT LIMITATION, ANY STATEMENTS PRECEDED BY, FOLLOWED BY OR INCLUDING WORDS SUCH AS "TARGETS", "BELIEVES", "CONTINUES", "EXPECTS", "AIMS", "INTENDS", "MAY", "ANTICIPATES", "ESTIMATES", "PLANS", "PROJECTS", "WILL", "CAN HAVE", "LIKELY", "GOING FORWARD", "SHOULD", "WOULD", "COULD" AND OTHER WORDS AND TERMS OF SIMILAR MEANING OR THE NEGATIVE THEREOF. THE FORWARD-LOOKING STATEMENTS ARE BASED UPON VARIOUS ASSUMPTIONS, MANY OF WHICH ARE BASED, IN TURN, UPON FURTHER ASSUMPTIONS, INCLUDING WITHOUT LIMITATION, MANAGEMENT'S EXAMINATION OF HISTORICAL OPERATING TRENDS, DATA CONTAINED IN THE COMPANY'S RECORDS AND DATA AVAILABLE FROM THIRD PARTIES. ALTHOUGH THE COMPANY BELIEVES THAT THESE ASSUMPTIONS WERE REASONABLE WHEN MADE, THESE ASSUMPTIONS ARE INHERENTLY SUBJECT TO SIGNIFICANT KNOWN AND UNKNOWN RISKS, UNCERTAINTIES, CONTINGENCIES AND OTHER IMPORTANT FACTORS WHICH ARE DIFFICULT OR IMPOSSIBLE TO PREDICT AND ARE BEYOND ITS CONTROL AND THAT COULD CAUSE THE COMPANY'S ACTUAL FINANCIAL CONDITION, RESULTS OF OPERATIONS, LIQUIDITY, PROSPECTS, GROWTH, PLANS AND STRATEGIES TO BE MATERIALLY DIFFERENT FROM THE FINANCIAL CONDITION, RESULTS OF OPERATIONS, LIQUIDITY, PROSPECTS, GROWTH, PLANS AND STRATEGIES EXPRESSED OR IMPLIED BY SUCH FORWARD-LOOKING STATEMENTS.
NO REPRESENTATION, WARRANTY OR UNDERTAKING, EXPRESS OR IMPLIED, IS MADE AS TO, AND NO RELIANCE SHOULD BE PLACED ON, THE FAIRNESS, ACCURACY, COMPLETENESS OR CORRECTNESS OF THE INFORMATION OR THE OPINIONS CONTAINED THEREIN. NEITHER THE COMPANY NOR ANY OF ITS AFFILIATES OR REPRESENTATIVES SHALL HAVE ANY RESPONSIBILITY OR LIABILITY WHATSOEVER (FOR NEGLIGENCE OR OTHERWISE) FOR ANY LOSS WHATSOEVER AND HOWSOEVER ARISING FROM ANY USE OF THE INFORMATION. THE INFORMATION HAS NOT BEEN INDEPENDENTLY VERIFIED AND WILL NOT BE UPDATED. THE INFORMATION, INCLUDING BUT NOT LIMITED TO FORWARD-LOOKING STATEMENTS, APPLIES ONLY AS OF THE DATE OF THIS DOCUMENT AND IS NOT INTENDED TO GIVE ANY ASSURANCES AS TO FUTURE RESULTS OR ACHIEVEMENTS. THE COMPANY EXPRESSLY DISCLAIMS ANY OBLIGATION OR UNDERTAKING TO DISSEMINATE ANY UPDATES OR REVISIONS TO THE INFORMATION, INCLUDING ANY FINANCIAL DATA OR FORWARD-LOOKING STATEMENTS, AND WILL NOT PUBLICLY RELEASE ANY REVISIONS IT MAY MAKE TO THE INFORMATION THAT MAY RESULT FROM ANY CHANGE IN THE COMPANY'S EXPECTATIONS, ANY CHANGE IN EVENTS, CONDITIONS OR CIRCUMSTANCES ON WHICH THESE FORWARD-LOOKING STATEMENTS ARE BASED, OR OTHER EVENTS OR CIRCUMSTANCES ARISING AFTER THE DATE OF THIS DOCUMENT.
THE INFORMATION IS NOT TO BE CONSTRUED AS LEGAL, BUSINESS, INVESTMENT OR TAX ADVICE. EACH RECIPIENT SHOULD CONSULT ITS OWN LEGAL, BUSINESS, INVESTMENT OR TAX ADVISER AS TO LEGAL, BUSINESS, INVESTMENT OR TAX ADVICE. BY ACCESSING THE INFORMATION YOU ACKNOWLEDGE THAT YOU WILL BE SOLELY RESPONSIBLE FOR YOUR OWN ASSESSMENT OF THE MARKET AND THE MARKET POSITION OF THE COMPANY AND THAT YOU WILL CONDUCT YOUR OWN ANALYSIS AND BE SOLELY RESPONSIBLE FOR FORMING YOUR OWN VIEW ON THE POTENTIAL FUTURE PERFORMANCE OF THE COMPANY.
THIS DOCUMENT CONTAINS STATISTICS, DATA, STATEMENTS AND OTHER INFORMATION RELATING TO THE GROUP'S MARKETS AND THE INDUSTRY IN WHICH IT OPERATES. WHERE SUCH INFORMATION HAS BEEN DERIVED FROM THIRD-PARTY SOURCES, SUCH SOURCES HAVE BEEN IDENTIFIED HEREIN. IN ADDITION, THE COMPANY HAS BEEN NAMED AS A SOURCE FOR CERTAIN MARKET AND INDUSTRY STATEMENTS INCLUDED IN THIS DOCUMENT. SUCH "COMPANY INFORMATION" REFLECTS THE COMPANY'S VIEWS BASED ON ONE OR MORE SOURCES AVAILABLE TO IT (SOME OF WHICH ARE NOT PUBLICLY AVAILABLE, BUT CAN BE OBTAINED AGAINST PAYMENT), INCLUDING DATA COMPILED BY PROFESSIONAL ORGANISATIONS, CONSULTANTS AND ANALYSTS AND INFORMATION OTHERWISE OBTAINED FROM OTHER THIRD PARTY SOURCES.
DISCLAIMER – Safe Harbor Message
2
AGENDA
3
Industry Review
Q3 2020 Highlights/Overview
Governance & ESG Overview
AGENDA
4
Industry Review
Q3 2020 Highlights/Overview
Governance & ESG Overview
Q3 2020 HIGHLIGHTS - SNAPSHOT
5
Earnings
External Fees
Events
EBITDATime Charter Equivalent (TCE)
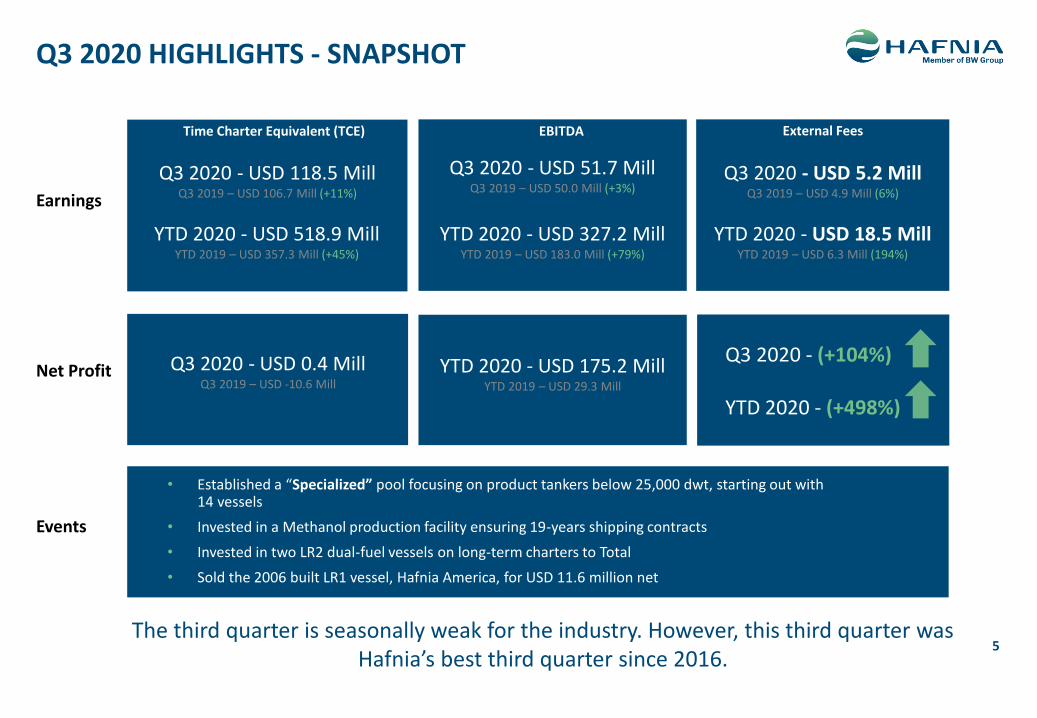
Net Profit Q3 2020 - USD 0.4 MillQ3 2019 – USD -10.6 Mill
YTD 2020 - USD 175.2 MillYTD 2019 – USD 29.3 Mill
Q3 2020 - (+104%)
YTD 2020 - (+498%)
• Established a “Specialized” pool focusing on product tankers below 25,000 dwt, starting out with 14 vessels
• Invested in a Methanol production facility ensuring 19-years shipping contracts
• Invested in two LR2 dual-fuel vessels on long-term charters to Total
• Sold the 2006 built LR1 vessel, Hafnia America, for USD 11.6 million net
Q3 2020 - USD 118.5 MillQ3 2019 – USD 106.7 Mill (+11%)
Q3 2020 - USD 51.7 MillQ3 2019 – USD 50.0 Mill (+3%)
Q3 2020 - USD 5.2 MillQ3 2019 – USD 4.9 Mill (6%)
YTD 2020 - USD 327.2 MillYTD 2019 – USD 183.0 Mill (+79%)
YTD 2020 - USD 518.9 MillYTD 2019 – USD 357.3 Mill (+45%)
YTD 2020 - USD 18.5 MillYTD 2019 – USD 6.3 Mill (194%)
The third quarter is seasonally weak for the industry. However, this third quarter was Hafnia’s best third quarter since 2016.
MARKET UPDATEQ3 2020
6
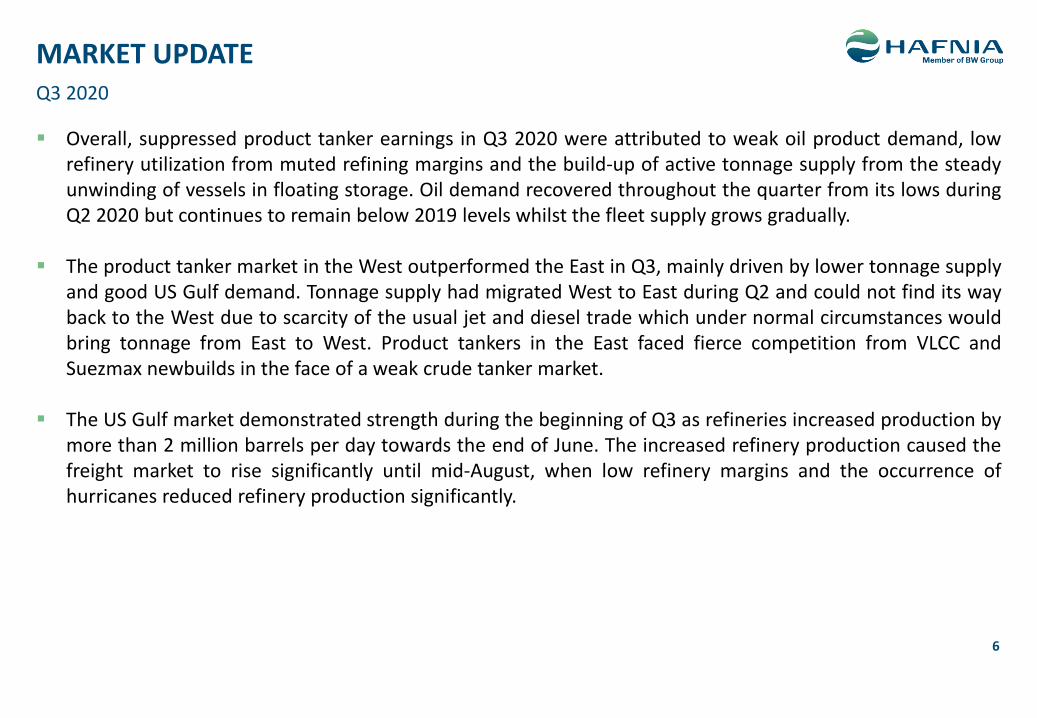
▪ Overall, suppressed product tanker earnings in Q3 2020 were attributed to weak oil product demand, lowrefinery utilization from muted refining margins and the build-up of active tonnage supply from the steadyunwinding of vessels in floating storage. Oil demand recovered throughout the quarter from its lows duringQ2 2020 but continues to remain below 2019 levels whilst the fleet supply grows gradually.
▪ The product tanker market in the West outperformed the East in Q3, mainly driven by lower tonnage supplyand good US Gulf demand. Tonnage supply had migrated West to East during Q2 and could not find its wayback to the West due to scarcity of the usual jet and diesel trade which under normal circumstances wouldbring tonnage from East to West. Product tankers in the East faced fierce competition from VLCC andSuezmax newbuilds in the face of a weak crude tanker market.
▪ The US Gulf market demonstrated strength during the beginning of Q3 as refineries increased production bymore than 2 million barrels per day towards the end of June. The increased refinery production caused thefreight market to rise significantly until mid-August, when low refinery margins and the occurrence ofhurricanes reduced refinery production significantly.
Bunker
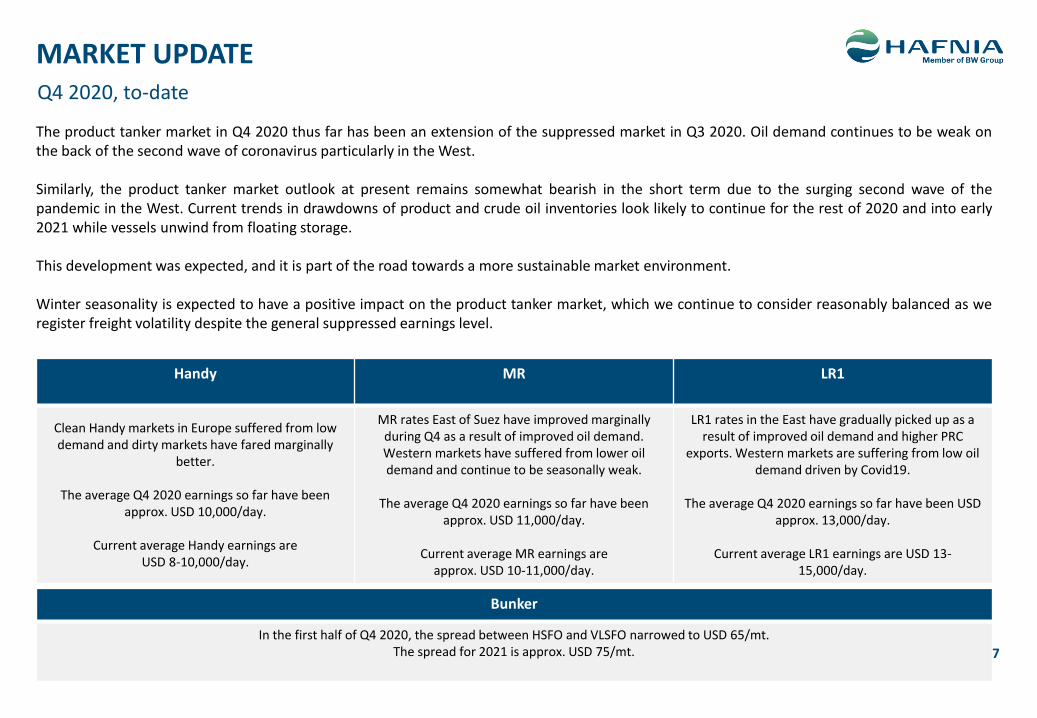
In the first half of Q4 2020, the spread between HSFO and VLSFO narrowed to USD 65/mt. The spread for 2021 is approx. USD 75/mt.
Handy MR LR1
Clean Handy markets in Europe suffered from low demand and dirty markets have fared marginally
better.
The average Q4 2020 earnings so far have been approx. USD 10,000/day.
Current average Handy earnings are USD 8-10,000/day.
MR rates East of Suez have improved marginally during Q4 as a result of improved oil demand. Western markets have suffered from lower oil demand and continue to be seasonally weak.
The average Q4 2020 earnings so far have been approx. USD 11,000/day.
Current average MR earnings are approx. USD 10-11,000/day.
LR1 rates in the East have gradually picked up as a result of improved oil demand and higher PRC
exports. Western markets are suffering from low oil demand driven by Covid19.
The average Q4 2020 earnings so far have been USD approx. 13,000/day.
Current average LR1 earnings are USD 13-15,000/day.
7
Q4 2020, to-date
MARKET UPDATE
The product tanker market in Q4 2020 thus far has been an extension of the suppressed market in Q3 2020. Oil demand continues to be weak onthe back of the second wave of coronavirus particularly in the West.
Similarly, the product tanker market outlook at present remains somewhat bearish in the short term due to the surging second wave of thepandemic in the West. Current trends in drawdowns of product and crude oil inventories look likely to continue for the rest of 2020 and into early2021 while vessels unwind from floating storage.
This development was expected, and it is part of the road towards a more sustainable market environment.
Winter seasonality is expected to have a positive impact on the product tanker market, which we continue to consider reasonably balanced as weregister freight volatility despite the general suppressed earnings level.
FINANCIAL SUMMARY
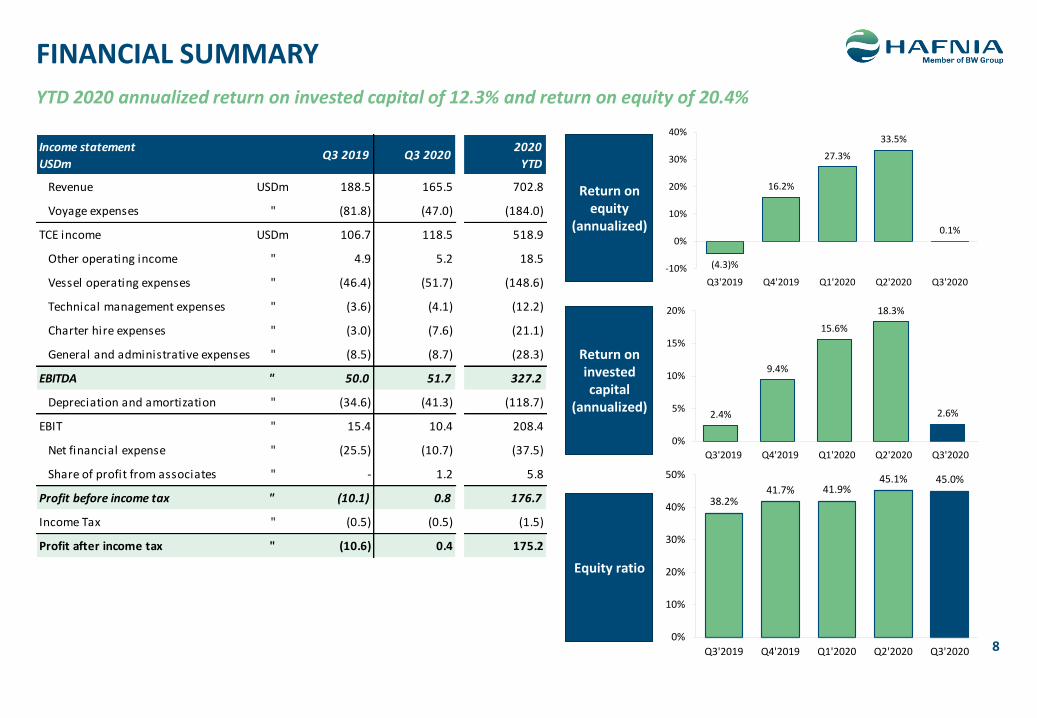
YTD 2020 annualized return on invested capital of 12.3% and return on equity of 20.4%
8
Return on equity
(annualized)
Return on invested capital
(annualized)
Equity ratio
Income statement
USDmQ3 2019 Q3 2020
2020
YTD
Revenue USDm 188.5 165.5 702.8
Voyage expenses " (81.8) (47.0) (184.0)
TCE income USDm 106.7 118.5 518.9
Other operating income " 4.9 5.2 18.5
Vessel operating expenses " (46.4) (51.7) (148.6)
Technical management expenses " (3.6) (4.1) (12.2)
Charter hire expenses " (3.0) (7.6) (21.1)
General and administrative expenses " (8.5) (8.7) (28.3)
EBITDA " 50.0 51.7 327.2
Depreciation and amortization " (34.6) (41.3) (118.7)
EBIT " 15.4 10.4 208.4
Net financial expense " (25.5) (10.7) (37.5)
Share of profit from associates " - 1.2 5.8
Profit before income tax " (10.1) 0.8 176.7
Income Tax " (0.5) (0.5) (1.5)
Profit after income tax " (10.6) 0.4 175.2
(4.3)%
16.2%
27.3%
33.5%
0.1%
-10%
0%
10%
20%
30%
40%
Q3'2019 Q4'2019 Q1'2020 Q2'2020 Q3'2020
2.4%
9.4%
15.6%
18.3%
2.6%
0%
5%
10%
15%
20%
Q3'2019 Q4'2019 Q1'2020 Q2'2020 Q3'2020
38.2%41.7% 41.9%
45.1% 45.0%
0%
10%
20%
30%
40%
50%
Q3'2019 Q4'2019 Q1'2020 Q2'2020 Q3'2020
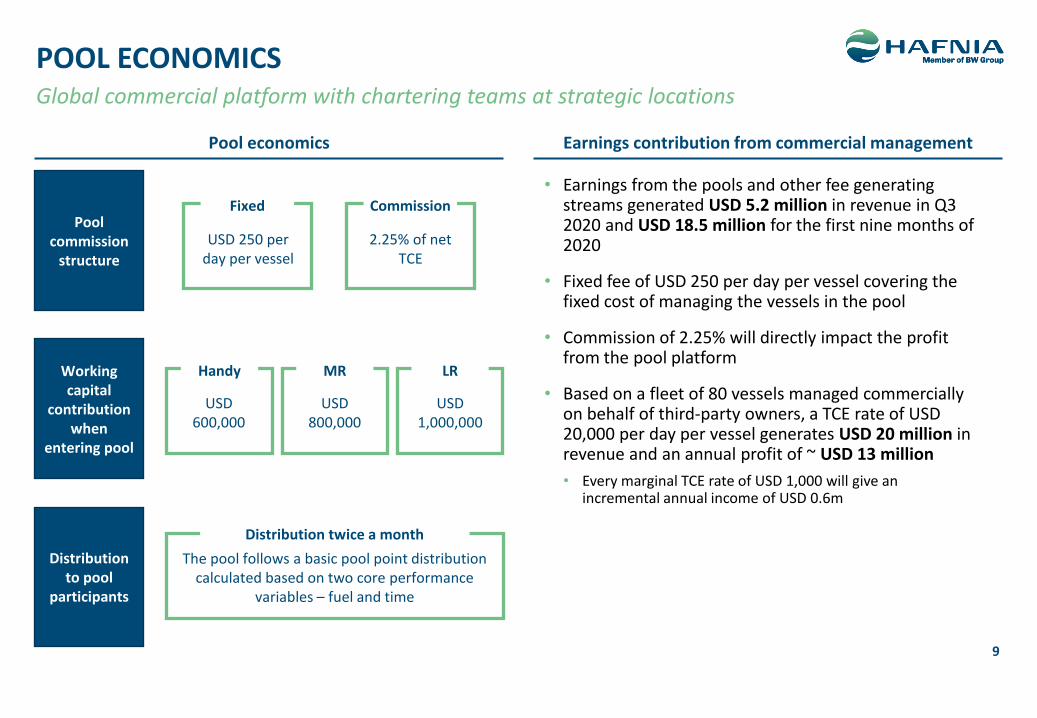
POOL ECONOMICS
• Earnings from the pools and other fee generating streams generated USD 5.2 million in revenue in Q3 2020 and USD 18.5 million for the first nine months of 2020
• Fixed fee of USD 250 per day per vessel covering the fixed cost of managing the vessels in the pool
• Commission of 2.25% will directly impact the profit from the pool platform
• Based on a fleet of 80 vessels managed commercially on behalf of third-party owners, a TCE rate of USD 20,000 per day per vessel generates USD 20 million in revenue and an annual profit of ~ USD 13 million
• Every marginal TCE rate of USD 1,000 will give an incremental annual income of USD 0.6m
Global commercial platform with chartering teams at strategic locations
Earnings contribution from commercial managementPool economics
Pool commission
structure
Workingcapital
contributionwhen
entering pool
Distribution to pool
participants
Fixed Commission
USD 250 per day per vessel
2.25% of net TCE
Handy MR LR
USD 600,000
USD 800,000
USD 1,000,000
The pool follows a basic pool point distribution calculated based on two core performance
variables – fuel and time
Distribution twice a month
9
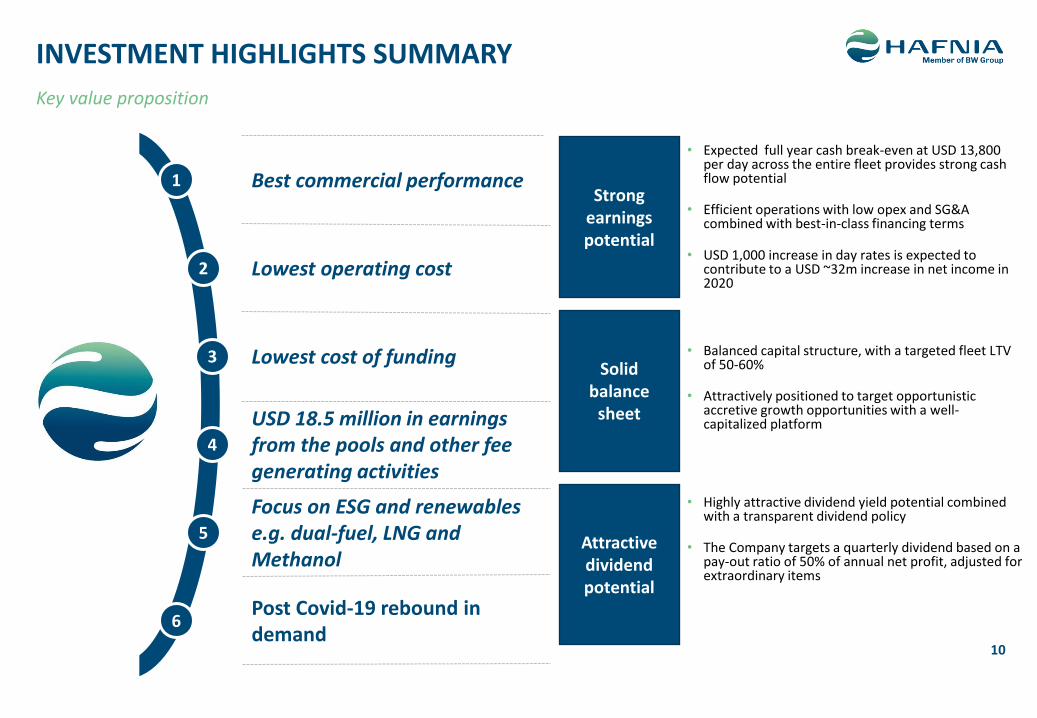
1 Best commercial performance
Lowest operating cost
Lowest cost of funding
USD 18.5 million in earnings from the pools and other fee generating activities
Focus on ESG and renewables e.g. dual-fuel, LNG and Methanol
2
Post Covid-19 rebound in demand
3
5
6
4
10
Strong earnings potential
Solid balance
sheet
Attractive dividend potential
• Expected full year cash break-even at USD 13,800 per day across the entire fleet provides strong cash flow potential
• Efficient operations with low opex and SG&A combined with best-in-class financing terms
• USD 1,000 increase in day rates is expected to contribute to a USD ~32m increase in net income in 2020
• Balanced capital structure, with a targeted fleet LTV of 50-60%
• Attractively positioned to target opportunistic accretive growth opportunities with a well-capitalized platform
• Highly attractive dividend yield potential combined with a transparent dividend policy
• The Company targets a quarterly dividend based on a pay-out ratio of 50% of annual net profit, adjusted for extraordinary items
Key value proposition
INVESTMENT HIGHLIGHTS SUMMARY
AGENDA
11
Industry Review & Outlook
Q3 2020 Highlights/Overview
Governance & ESG Overview
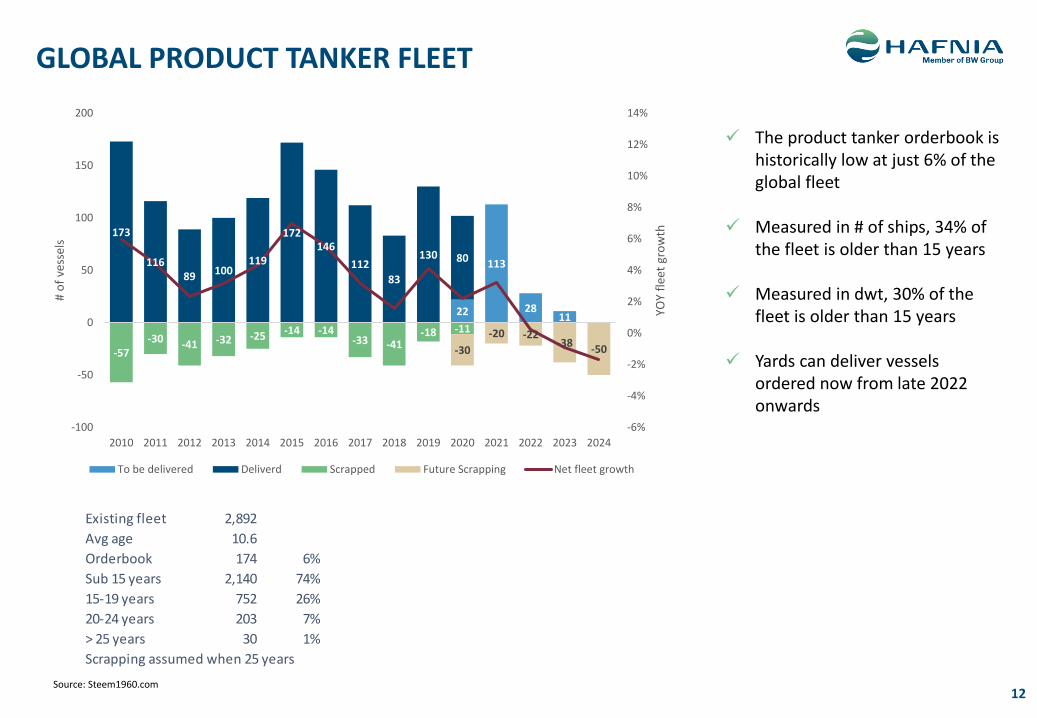
GLOBAL PRODUCT TANKER FLEET
✓ The product tanker orderbook is historically low at just 6% of the global fleet
✓ Measured in # of ships, 34% of the fleet is older than 15 years
✓ Measured in dwt, 30% of the fleet is older than 15 years
✓ Yards can deliver vessels ordered now from late 2022 onwards
Existing fleet 2,892
Avg age 10.6
Orderbook 174 6%
Sub 15 years 2,140 74%
15-19 years 752 26%
20-24 years 203 7%
> 25 years 30 1%
Scrapping assumed when 25 years
Source: Steem1960.com12
22
113
2811
173
11689 100
119
172146
112
83
130 80
-57-30 -41 -32 -25 -14 -14
-33 -41-18 -11
-30
-20 -22-38
-50
-6%
-4%
-2%
0%
2%
4%
6%
8%
10%
12%
14%
-100
-50
0
50
100
150
200
2010 2011 2012 2013 2014 2015 2016 2017 2018 2019 2020 2021 2022 2023 2024
YOY
flee
t gr
ow
th
# o
f ve
ssel
s
To be delivered Deliverd Scrapped Future Scrapping Net fleet growth
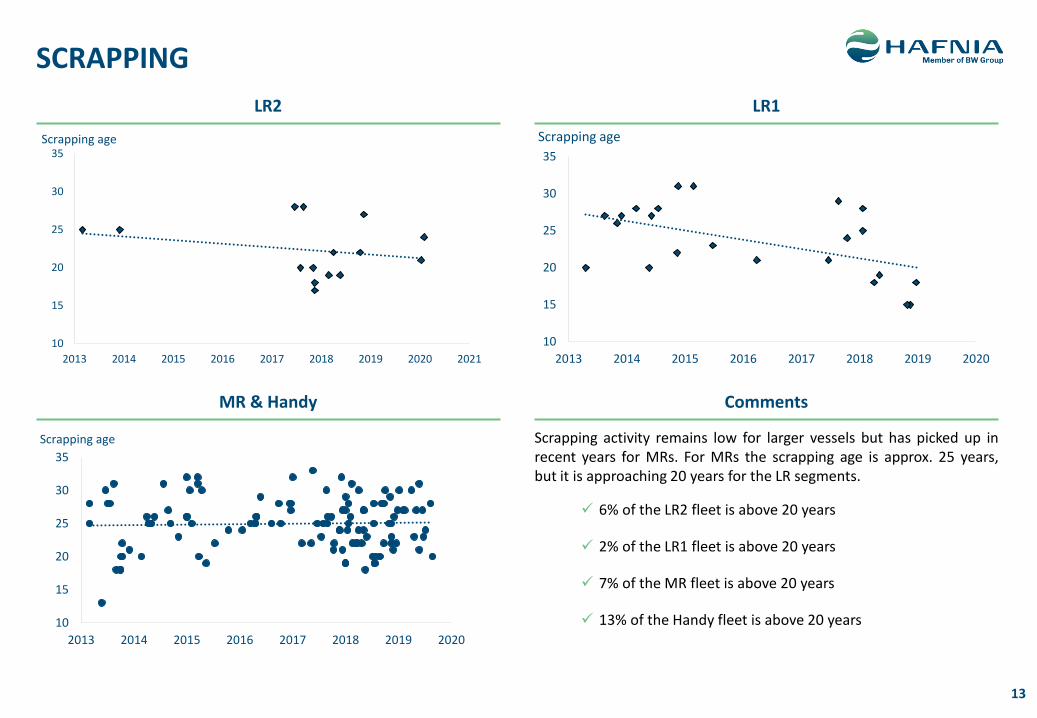
SCRAPPING
Scrapping activity remains low for larger vessels but has picked up inrecent years for MRs. For MRs the scrapping age is approx. 25 years,but it is approaching 20 years for the LR segments.
✓ 6% of the LR2 fleet is above 20 years
✓ 2% of the LR1 fleet is above 20 years
✓ 7% of the MR fleet is above 20 years
✓ 13% of the Handy fleet is above 20 years
13
LR2 LR1
MR & Handy Comments
10
15
20
25
30
35
2013 2014 2015 2016 2017 2018 2019 2020 2021
Scrapping age
10
15
20
25
30
35
2013 2014 2015 2016 2017 2018 2019 2020
Scrapping age
10
15
20
25
30
35
2013 2014 2015 2016 2017 2018 2019 2020
Scrapping age
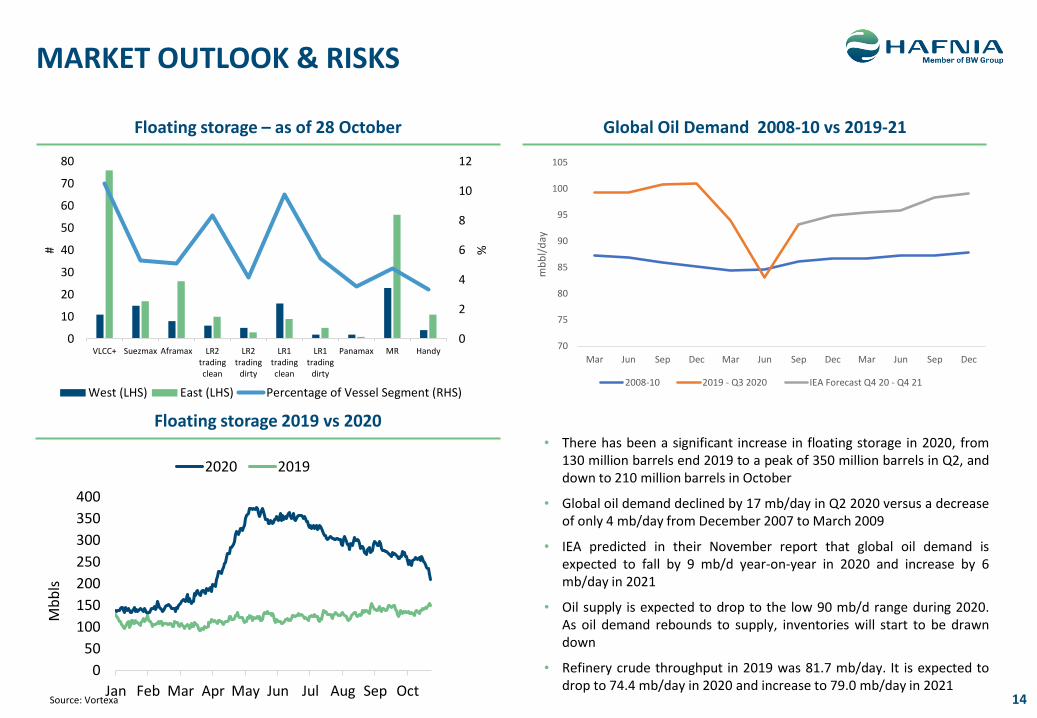
MARKET OUTLOOK & RISKS
14
Floating storage – as of 28 October
Source: Vortexa
Global Oil Demand 2008-10 vs 2019-21
Source: IEA
• There has been a significant increase in floating storage in 2020, from130 million barrels end 2019 to a peak of 350 million barrels in Q2, anddown to 210 million barrels in October
• Global oil demand declined by 17 mb/day in Q2 2020 versus a decreaseof only 4 mb/day from December 2007 to March 2009
• IEA predicted in their November report that global oil demand isexpected to fall by 9 mb/d year-on-year in 2020 and increase by 6mb/day in 2021
• Oil supply is expected to drop to the low 90 mb/d range during 2020.As oil demand rebounds to supply, inventories will start to be drawndown
• Refinery crude throughput in 2019 was 81.7 mb/day. It is expected todrop to 74.4 mb/day in 2020 and increase to 79.0 mb/day in 2021
Floating storage 2019 vs 2020
70
75
80
85
90
95
100
105
Mar Jun Sep Dec Mar Jun Sep Dec Mar Jun Sep Dec
mb
bl/
day
2008-10 2019 - Q3 2020 IEA Forecast Q4 20 - Q4 21
0
50
100
150
200
250
300
350
400
Jan Feb Mar Apr May Jun Jul Aug Sep Oct
Mb
bls
2020 2019
0
2
4
6
8
10
12
0
10
20
30
40
50
60
70
80
VLCC+ Suezmax Aframax LR2tradingclean
LR2trading
dirty
LR1tradingclean
LR1trading
dirty
Panamax MR Handy
%#
West (LHS) East (LHS) Percentage of Vessel Segment (RHS)
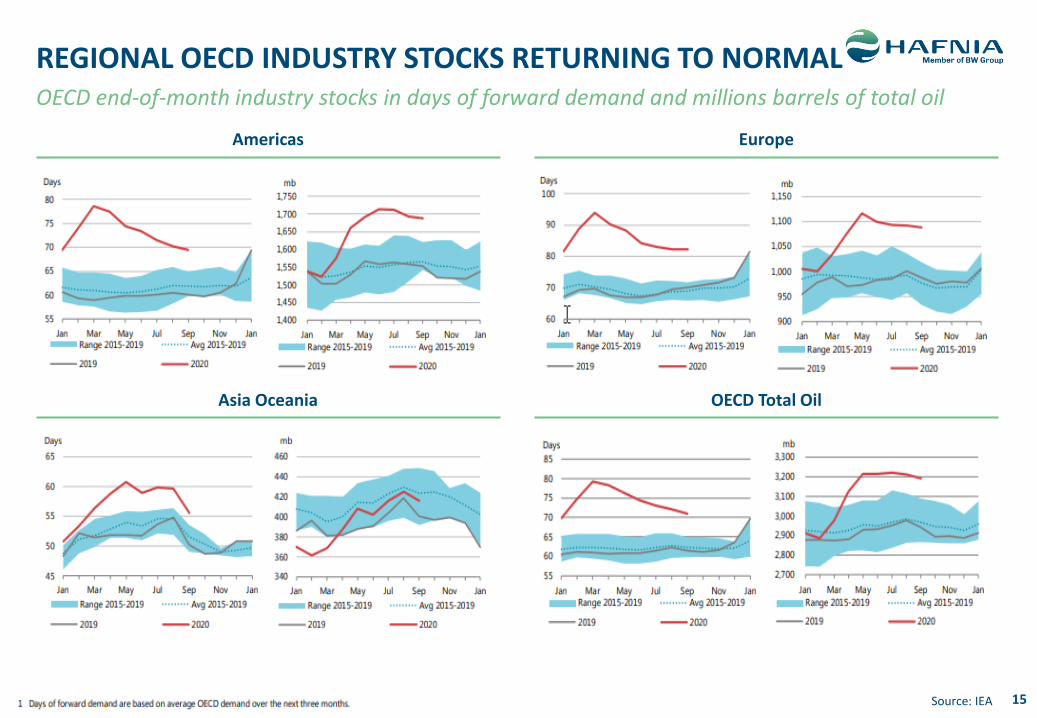
REGIONAL OECD INDUSTRY STOCKS RETURNING TO NORMAL
15Source: IEA
Americas Europe
Asia Oceania OECD Total Oil
OECD end-of-month industry stocks in days of forward demand and millions barrels of total oil
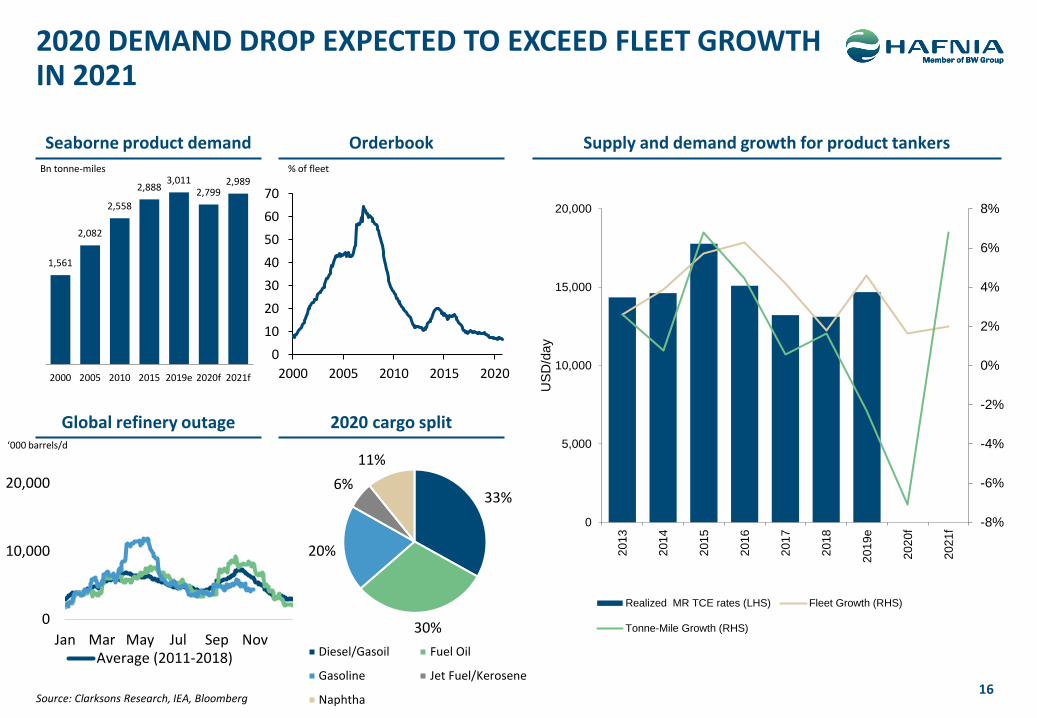
2020 DEMAND DROP EXPECTED TO EXCEED FLEET GROWTH IN 2021
Source: Clarksons Research, IEA, Bloomberg
Seaborne product demand Supply and demand growth for product tankersOrderbook
Global refinery outage 2020 cargo split
Bn tonne-miles
‘000 barrels/d
% of fleet
16
-8%
-6%
-4%
-2%
0%
2%
4%
6%
8%
0
5,000
10,000
15,000
20,000
201
3
201
4
201
5
201
6
201
7
201
8
201
9e
202
0f
202
1f
US
D/d
ay
Realized MR TCE rates (LHS) Fleet Growth (RHS)
Tonne-Mile Growth (RHS)
1,561
2,082
2,558
2,8883,011
2,7992,989
2000 2005 2010 2015 2019e 2020f 2021f
33%
30%
20%
6%
11%
Diesel/Gasoil Fuel Oil
Gasoline Jet Fuel/Kerosene
Naphtha
0
10,000
20,000
Jan Mar May Jul Sep NovAverage (2011-2018)
0
10
20
30
40
50
60
70
2000 2005 2010 2015 2020
AGENDA
17
Industry Review
Q3 2020 Highlights/Overview
Governance & ESG Overview
18
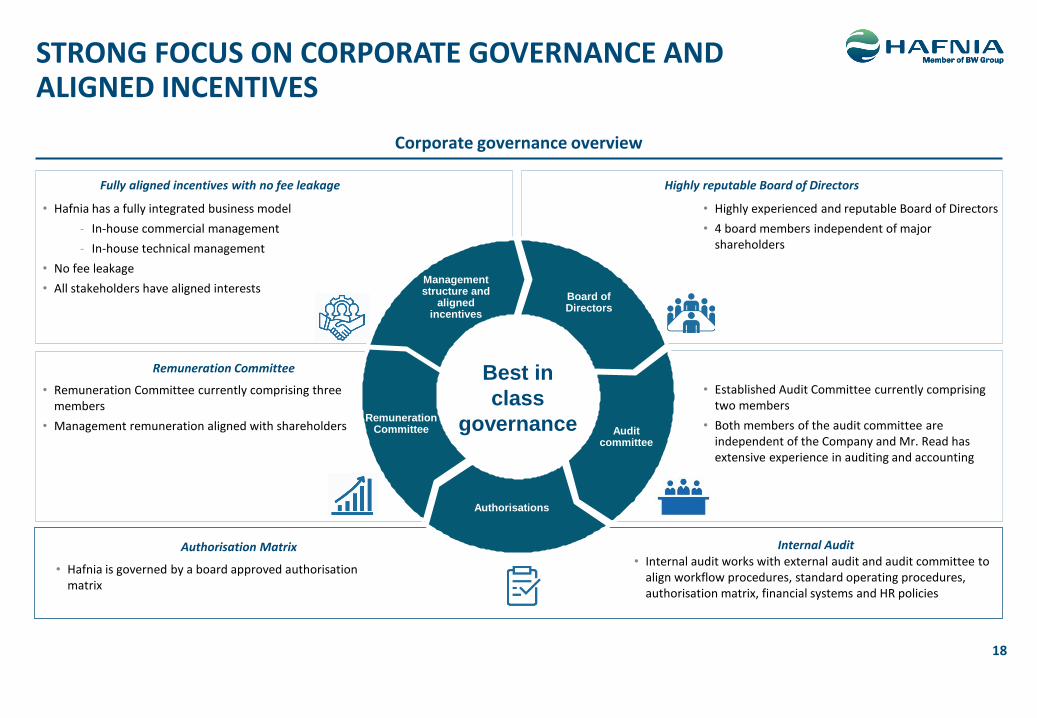
• Hafnia is governed by a board approved authorisation matrix
• Hafnia has a fully integrated business model
- In-house commercial management
- In-house technical management
• No fee leakage
• All stakeholders have aligned interests
• Remuneration Committee currently comprising three members
• Management remuneration aligned with shareholders
• Established Audit Committee currently comprising two members
• Both members of the audit committee are independent of the Company and Mr. Read has extensive experience in auditing and accounting
• Highly experienced and reputable Board of Directors
• 4 board members independent of major shareholders
Corporate governance overview
Best in
class
governance
Board of Directors
Management structure and
aligned incentives
Remuneration Committee Audit
committee
Authorisations
Fully aligned incentives with no fee leakage Highly reputable Board of Directors
Remuneration Committee
Authorisation Matrix
STRONG FOCUS ON CORPORATE GOVERNANCE AND ALIGNED INCENTIVES
Internal Audit• Internal audit works with external audit and audit committee to
align workflow procedures, standard operating procedures, authorisation matrix, financial systems and HR policies
19
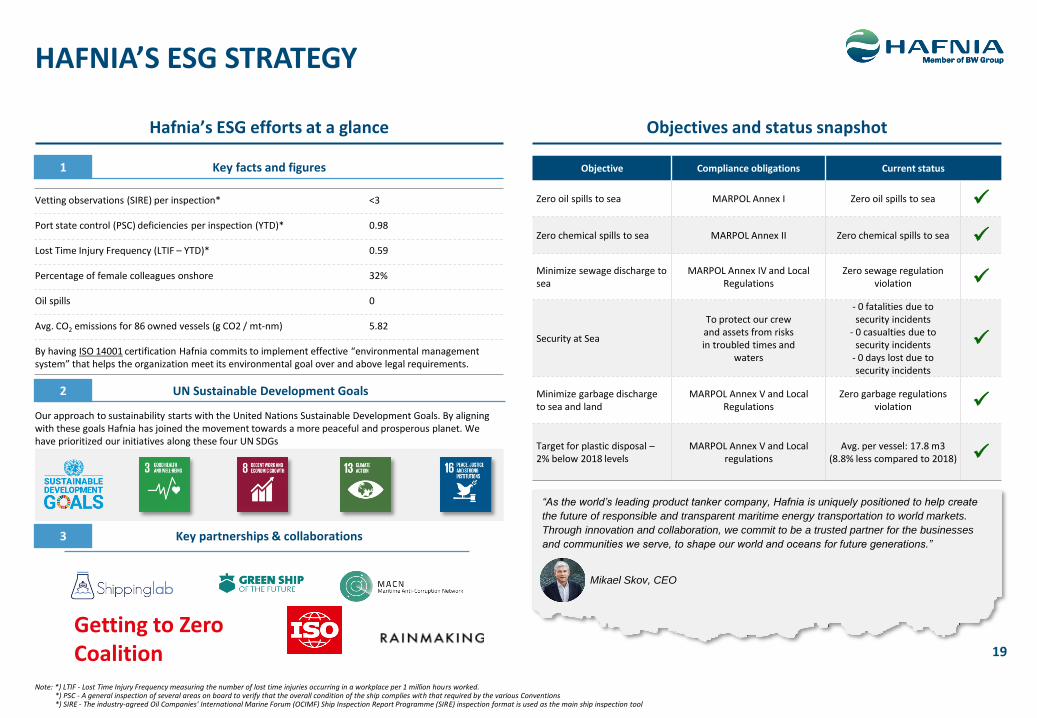
HAFNIA’S ESG STRATEGY
Hafnia’s ESG efforts at a glance
Vetting observations (SIRE) per inspection* <3
Port state control (PSC) deficiencies per inspection (YTD)* 0.98
Lost Time Injury Frequency (LTIF – YTD)* 0.59
Percentage of female colleagues onshore 32%
Oil spills 0
Avg. CO2 emissions for 86 owned vessels (g CO2 / mt-nm) 5.82
By having ISO 14001 certification Hafnia commits to implement effective “environmental management system” that helps the organization meet its environmental goal over and above legal requirements.
Our approach to sustainability starts with the United Nations Sustainable Development Goals. By aligning with these goals Hafnia has joined the movement towards a more peaceful and prosperous planet. We have prioritized our initiatives along these four UN SDGs
Objectives and status snapshot
Objective Compliance obligations Current status
Zero oil spills to sea MARPOL Annex I Zero oil spills to sea ✓
Zero chemical spills to sea MARPOL Annex II Zero chemical spills to sea ✓
Minimize sewage discharge to sea
MARPOL Annex IV and Local Regulations
Zero sewage regulation violation ✓
Security at Sea
To protect our crewand assets from risksin troubled times and
waters
- 0 fatalities due tosecurity incidents
- 0 casualties due tosecurity incidents
- 0 days lost due tosecurity incidents
✓
Minimize garbage discharge to sea and land
MARPOL Annex V and Local Regulations
Zero garbage regulations violation ✓
Target for plastic disposal –2% below 2018 levels
MARPOL Annex V and Local regulations
Avg. per vessel: 17.8 m3 (8.8% less compared to 2018) ✓
“As the world’s leading product tanker company, Hafnia is uniquely positioned to help create
the future of responsible and transparent maritime energy transportation to world markets.
Through innovation and collaboration, we commit to be a trusted partner for the businesses
and communities we serve, to shape our world and oceans for future generations.”
Mikael Skov, CEO
Key facts and figures1
UN Sustainable Development Goals2
Key partnerships & collaborations3
Note: *) LTIF - Lost Time Injury Frequency measuring the number of lost time injuries occurring in a workplace per 1 million hours worked. *) PSC - A general inspection of several areas on board to verify that the overall condition of the ship complies with that required by the various Conventions*) SIRE - The industry-agreed Oil Companies' International Marine Forum (OCIMF) Ship Inspection Report Programme (SIRE) inspection format is used as the main ship inspection tool
Getting to Zero Coalition

EVP, IR, Research and Performance Management
Email: [email protected]
CONTACTS
THOMAS ANDERSEN
CFO
Email: [email protected]
PERRY VAN ECHTELT
CEO
Email: [email protected]
MIKAEL SKOV
20
EVPCommercial
Email: [email protected]
JENS CHRISTOPHERSEN
THANK YOUwww.hafniabw.com