Embed Size (px)
Citation preview
TECHNICAL REPORT
Haiti Prospective Food Security Assessment
Laura M. GlaeserPeter HorjusShannon Strother
November 2011
FANTA 2 F O O D A N D N U T R I T I O N T E C H N I C A L A S S I S TA N C E
FANTA-2 BridgeFHI 360 1825 Connecticut Ave., NW Washington, DC 20009-5721Tel: 202-884-8000 Fax: 202-884-8432 Email: [email protected] Website: www.fantaproject.org
Haiti Prospective Food Security Assessment Laura M. Glaeser Peter Horjus Shannon Strother November 2011
FANTA-2 Bridge FHI 360 1825 Connecticut Avenue, NW Washington, DC 20009-5721 Tel: 202-884-8000 Fax: 202-884-8432 Email: [email protected] Website: www.fantaproject.org
This technical report is made possible by the generous support of the American people through the support of USAID/Haiti and the Office of Health, Infectious Diseases, and Nutrition, Bureau for Global Health, United States Agency for International Development (USAID), under terms of Cooperative Agreement No. AID-OAA-A-11-00014, through the FANTA-2 Bridge, managed by FHI 360. The contents are the responsibility of FHI 360 and do not necessarily reflect the views of USAID or the United States Government. Published November 2011
Recommended Citation: Glaeser, Laura M; Horjus, Peter; Strother, Shannon. 2011. Haiti Prospective Food Security Assessment. Washington, DC: FANTA-2 Bridge/ FHI 360. Contact information: FANTA-2 Bridge FHI 360 1825 Connecticut Avenue, NW Washington, D.C. 20009-5721 Tel: 202-884-8000 Fax: 202-884-8432 Email: [email protected] Website: www.fantaproject.org
Haiti Prospective Food Security Assessment
Contents Acronyms and Abbreviations ..................................................................................................................... i Executive Summary .................................................................................................................................... 1 1. Introduction ........................................................................................................................................... 3
1.1. Assessment Purpose and Objectives .............................................................................................. 3 1.2. Assessment Methodology, Constraints, Assumptions, and Report Structure Methodology ........... 3
Constraints and Assumptions .......................................................................................................... 3 Report Structure ............................................................................................................................... 4
2. Overview of the Country Context in Haiti .......................................................................................... 5
2.1. Overview of Medium-Term Trends in Key Economic and Social Indicators in Haiti ........................ 6 Life Expectancy, Mortality, and Nutrition in Haiti ............................................................................. 7 Education in Haiti ............................................................................................................................. 8 Economy, Growth, and Poverty in Haiti ........................................................................................... 8
2.2. Overview of Food Security Conditions in Haiti ............................................................................... 10 Food Availability in Haiti ................................................................................................................. 10 Food Access in Haiti ...................................................................................................................... 12 Food Utilization/Consumption in Haiti ............................................................................................ 18
2.3. Events Shaping Current and Forecast Food Security Conditions in Haiti ..................................... 23 Recent Shocks Affecting Food Security in Haiti ............................................................................ 24
2.4. Determining Haiti’s Most Food Insecure Areas ............................................................................. 30 3. Key Strategies, Policies, and Programs for Reducing Food Insecurity ....................................... 41
3.1. Government of Haiti Food Security-Related Strategies, Plans, and Programs ............................. 41 3.2. United States Government Food Security-Related Strategies, Plans, and Programs in Haiti ...... 48 3.3. Other Key Stakeholders’ Food Security-Related Strategies, Plans, and Programs in Haiti .......... 52
4. Conclusion .......................................................................................................................................... 56 References ................................................................................................................................................. 57 Annex 1. UNICEF and MSPP Standardized Monitoring and Assessment of Relief and Transitions Survey
Results in Haiti, April–June 2010 ................................................................................................ 63 Annex 2. Major Shocks in Haiti, 2000–2010 .............................................................................................. 65 Annex 3. Food Insecurity Severity Mapping in Haiti, 2007–Present .......................................................... 67 Annex 4. The Government of Haiti’s National Agricultural Investment Plan (2010) Priority Intervention
Areas ........................................................................................................................................... 70
Haiti Prospective Food Security Assessment
List of Boxes Box 1. Definitions of Key Terms Used in this Report .................................................................................... 4 Box 2. Characteristics of Households More and Less at Risk of Food Insecurity in Haiti .......................... 13 Box 3. Nutritional Status of Children 6–59 Months of Age and Associated Factors in Haiti ....................... 21 List of Figures Figure 1. Administrative Map of Haiti ............................................................................................................ 5 Figure 2. Percent Change in Haiti’s GDP, with Constant Prices, 1990–2010 .............................................. 9 Figure 3. Trends in Remittances to Haiti, 2003–2010 ................................................................................ 10 Figure 4. Average Monthly Price Trends for Imported Rice in Port-au-Prince, Haiti .................................. 14 Figure 5. Monthly Imported Rice Price Trends, Croix des Bossales Market, Port-au-Prince, Haiti ............ 14 Figure 6. Trends in International Cereal (Rice, Wheat, and Maize) Prices, 2007–2011 ............................ 15 Figure 7. National Consumer Price Indices in Haiti, 2010–2011 ................................................................ 15 Figure 8. Haitian Purchasing Power Based on the Official Minimum Wage, 2007–2011 ........................... 16 Figure 9. Trends in Stunting, Underweight, and Wasting by Age in Haiti ................................................... 19 Figure 10. Crop Loss in Hectares in Communes Most Affected by Hurricane Tomas in Haiti, 2010 ......... 27 Figure 11. Relative Political Instability as a Result of Regime Changes in Latin America, 1997–2003 ..... 29 Figure 12. Seasonal Calendar and Critical Events Timeline for Haiti ......................................................... 29 Figure 13. Forecast Food Security Conditions in Haiti, October–December 2011 ..................................... 30 Figure 14. Distribution of Levels of Food Security in Haiti as of August 2011 ............................................ 33 Figure 15. Prevalence of Food Insecurity in Haiti as of August 2011 ......................................................... 33 Figure 16. Food Security Trend Analysis from FEWS NET Food Security Outlooks for 2008/2009,
including Tropical Storm and Hurricane Frequency and Communes Directly Affected by the 2010 Earthquake in Haiti ............................................................................................................ 34
Figure 17. Proportion of the Haitian Population Living on Less Than US$2 per Day ................................. 35 Figure 18. Proportion of the Haitian Population Living Below the National Poverty Line, 2011 ................. 36 Figure 19. Prevalence and Numbers of Chronically Malnourished Children 6–59 Months of Age
by Department in Haiti, 2009 ...................................................................................................... 37 Figure 20. Prevalence and Numbers of Acutely Malnourished Children 6–59 Months of Age by
Department in Haiti, 2009 ........................................................................................................... 37 Figure 21. Prevalence and Numbers of Children 6–59 Months of Age with SAM by Department
in Haiti, 2009 ............................................................................................................................... 38 Figure 22. Multi-Hazard Risk, Major Disasters, and Their Severity in Haiti, 1998–2010 ............................ 39 Figure 23. Flood-Prone Areas of Haiti ........................................................................................................ 39 Figure 24. Hurricane Trajectories across Haiti ............................................................................................ 40 List of Tables Table 1. Overview of Key National Indicators for Food Security in Haiti ...................................................... 7 Table 2. Prevalence of Acute Malnutrition and Under-5 Mortality by Department in Haiti ......................... 20 Table 3. Government of Haiti Food Security-Related Strategies, Plans, and Programs (Illustrative) ........ 42 Table 4. Land Holdings and Means of Access by Sex of Head of Household in Haiti ............................... 47 Table 5. United States Government Food Security-Related Strategies, Plans, and Programs in Haiti
(Illustrative) ................................................................................................................................... 49 Table 6. Other Key Stakeholders’ Food Security-Related Strategies, Plans, and Programs in Haiti
(Illustrative) ................................................................................................................................... 53
Haiti Prospective Food Security Assessment
i
Acronyms and Abbreviations AARR average annual reduction rate ACF Action Against Hunger (Action contre la Faim) CDC Centers for Disease Control and Prevention CFSAM Crop and Food Security Assessment Mission CFSVA Comprehensive Food Security and Vulnerability Assessment CI confidence interval CIA United States Central Intelligence Agency CNSA National Food Security Coordination Office CPI consumer price index CRS Catholic Relief Services DCHA/FFP USAID Bureau for Democracy, Conflict, and Humanitarian Assistance Office of Food
for Peace DHS Demographic and Health Survey EAP economically active population ECVH Enquête sur les Conditions de Vie en Haïti EFSA I Emergency Food Security Assessment I (February 2010) EFSA II Emergency Food Security Assessment II (June 2010) EM-DAT International Disaster Database EU European Union FAO Food and Agricultural Organization of the United Nations FEWS NET Famine Early Warning Systems Network FFPr Food for Progress FY fiscal year g gram(s) GAM global acute malnutrition GDP gross domestic product GOH Government of Haiti ha hectare(s) HAZ height-for-age z-score HDA Household Development Agent HDI Human Development Index HIV human immunodeficiency virus HTG Haitian gourde(s) IDB Inter-American Development Bank IFI international financial institution IHRC Interim Haiti Recovery Commission IHSI Haitian Institute for Statistics and Information IMF International Monetary Fund IPC Integrated Food Security Phase Classification ISF Integrated Strategic Framework IYCF infant and young child feeding kcal kilocalorie(s) km kilometer(s) L liter(s) MAM moderate acute malnutrition MARNDR Ministry of Agriculture, Natural Resources, and Rural Development MEF Ministry of Economy and Finance MDG Millennium Development Goal mm millimeter(s) MPCE Ministry of Planning and External Cooperation MSPP Ministry of Public Health and Population MT metric ton(s) MUAC mid-upper arm circumference

Haiti Prospective Food Security Assessment
ii
n.d. no date NFSS National Food Security Survey NGO nongovernmental organization NCHS National Center for Health Statistics OCHA United Nations Office for the Coordination of Humanitarian Affairs PAP Port-au-Prince PDNA Post-Disaster Needs Assessment PPP purchasing power parity PRSP Poverty Reduction Strategy Paper SAM severe acute malnutrition SMART Standardized Monitoring and Assessment of Relief and Transitions U.N. United Nations U.S. United States UNDP United Nations Development Programme US$ United States dollar(s) USAID United States Agency for International Development USDA United States Department of Agriculture USG United States Government WAZ weight-for-age z-score WFP World Food Programme WHO World Health Organization WHZ weight-for-height z-score
Haiti Prospective Food Security Assessment
1
Executive Summary Haiti, the poorest country in the Western Hemisphere, ranked 145 out of 169 countries on the United Nations (U.N.) 2010 Human Development Index (HDI). Haiti has seen little change in this ranking over the past several years, including over the reference period for this prospective food security assessment (2005–2011), particularly when compared to surrounding countries in the Latin America and Caribbean region. The country’s relative developmental stagnation is due in part to a lack of improvement in many HDI components, including prevalence of undernourishment, underweight, and stunting among children; size of gross domestic product (GDP); and the overall poverty rate. The high incidence of climatic shocks and other hazards and the population’s limited capacity to mitigate the negative impacts of these shocks further impedes the country’s ability to gain meaningful development ground. As of 2008, 56 percent of the Haitian population was extremely poor (living on less than United States dollar [US$]1 per person per day), and 76 percent was poor (living on less than US$2 per person per day). In 2009, the HDI estimated GDP per capita at US$1,045, leaving the country ranked 158 out of 187 for economic growth. Per capita GDP estimates decreased again in the first half of 2010, though this was due in large part to the negative economic impacts of the 2010 earthquake—a shock that fundamentally changed the programming context and response landscape of the country—it illustrates how high levels of poverty hamper the country’s ability to withstand and recover from the shocks to which it is prone. As of 2010, Haiti had the lowest life expectancy in the Latin America and Caribbean region, about 40 percent of the population lacked access to basic health services, more than half of the country’s children remained unvaccinated, less than 53 percent of the adult population was literate, and about half of school-age children did not attend school. High poverty levels also hinder Haitians’ ability to access basic services and grow or otherwise acquire and adequately utilize the food needed for a productive and healthy life. For example, while domestic agricultural production accounts for about half of the total food available in the country, the other half is imported. This makes purchases (which require cash) a significant means by which households source food, even in rural agricultural areas. In addition to the high prevalence of poverty in the country, prices for imported foods increased significantly over the reference period for this assessment. Moreover, domestic agricultural production faces the perennial threat of damage from climatic shocks, including droughts, floods, and hurricanes (the hurricane season spans half of each calendar year). This combination of exogenous factors, in addition to the country’s lack of resilience and preparedness, puts much of the Haitian population at risk of food insecurity. The country’s infant mortality rate is estimated at between 54.0 and 62.4 infants per 1,000 live births, and the under-5 mortality rate, while having improved from 152 children per 1,000 live births in 1990 to between 72 and 87 children per 1,000 live births in 2009, remains the highest in the Latin America and Caribbean region. UNICEF estimates the underweight prevalence among children 6–59 months of age to be 18 percent. The prevalence of wasting among children in this same age group is estimated at 10 percent and the prevalence of stunting at 29 percent. According to the 2006 Demographic and Health Survey (DHS),1 only 40 percent of children under 6 months of age were exclusively breastfed in Haiti, and only 32 percent of children 6–23 months of age received appropriate complementary feeding with respect to the minimum standards for dietary diversity, meal frequency, and breast milk consumption. These low levels of appropriate infant and young child care and feeding practices increase Haitian children’s vulnerability to poor nutrition outcomes and, in the worst cases, death. Existing data further indicate concerning levels of micronutrient deficiencies in the Haitian population. For example, approximately 60 percent of children 6–59 months of age and 46 percent of women of reproductive age (15–49 years) were reported to be anemic in the 2006 DHS. Among children suffering from anemia, 72 percent were under 24 months of age. The World Health Organization (WHO) reports that as of 2004/5, 58.9 percent of the population had insufficient iodine intake, with 29,000 children born mentally impaired due to iodine deficiency each year. Moreover, only 3 percent of households were found
1 The 2006 Haiti DHS is titled “Enquête Mortalité, Morbidité et Utilisation des Services.”
Haiti Prospective Food Security Assessment
2
to consume iodized salt in 2009. WHO also found that 32 percent of pre-school age children suffered from vitamin A deficiency in 2004/5, a prevalence that qualifies as a severe public health problem. The prevalence of vitamin A deficiency among pregnant women is estimated at 5 percent, a level that also qualifies as a public health problem. Finally, as noted above, Haiti’s geography makes it particularly vulnerable to a number of different natural disasters, the negative impacts of which are often compounded by a lack of sustainable environmental management practices, poor infrastructure, and a lack of population- and household-level resilience (i.e., risk reduction and response capacity). In the past 12 years alone, Haiti experienced 34 major shocks. Floods, storms, and droughts strike with particular frequency, while earthquakes and disease epidemics deal acute, debilitating blows to the country’s economy and the lives and livelihoods of its people. Localized droughts, floods, landslides, and other smaller-scale climatic events, as well as man-made shocks, also regularly tax the resilience of Haiti’s households. This combination of factors (i.e., poverty, malnutrition, and disaster vulnerability) has led to particularly negative food security impacts in Haiti’s Nord-Ouest and Artibonite departments, the two departments this assessment’s first-level analysis indicates are the most food insecure in the country. High levels of food insecurity are also evident based on composite and factor-specific indicators, in particular, poverty and disaster vulnerability, in the Sud-Est department. Factor-specific food insecurity is also high in the following departments: Grand’Anse (poverty, malnutrition and disaster vulnerability indicators), Centre (poverty and malnutrition indicators) and Sud (poverty and disaster vulnerability indicators). While the presented data paint a stark picture of food security conditions in Haiti, concerted programming efforts are under way in the country, and there are opportunities for additional, complementary interventions, including those of future Title II development food aid programs, to meaningfully address proximate and underlying causes of food insecurity in Haiti and to improve the lives and livelihoods of food insecure Haitians, as well as those most at risk of food insecurity. The authors of this prospective assessment hope that the data and information in this report provide the United States Agency for International Development (USAID) and its potential future Title II Awardees with a firm foundation on which to base future Title II development food aid programs that optimally meet the needs of food insecure populations and those vulnerable to food insecurity in Haiti.

Haiti Prospective Food Security Assessment
3
1. Introduction 1.1. Assessment Purpose and Objectives The purpose of this prospective food security assessment for Haiti is to describe and analyze current and anticipated near-term food security trends in the country and the events, policies, and strategies shaping them to inform the United States Agency for International Development’s (USAID) planning and guidance development for FY 2012 Title II development food aid programs.2 The data and information in this report, including areas particularly vulnerable to food insecurity, are also meant to assist potential future Title II Awardees in designing the next round of development food aid program proposals in the country. As such, the primary audience for this assessment is USAID staff in Haiti and Washington, DC, and current and potential Title II Awardees. International and nongovernmental organizations, donors, and Government of Haiti (GOH) colleagues working on food security in Haiti may also find this report useful. 1.2. Assessment Methodology, Constraints, Assumptions, and Report Structure
Methodology The reference period for this prospective assessment is 2005–2011. However, given the degree to which the 2010 earthquake shifted Haiti’s food security context and programming landscape (in terms of the level of damages incurred, the response resources made available, and the number of actors intervening in the country), the majority of research efforts for this assessment and the resultant data and information included focus on the period following the 2010 earthquake. That said, this report incorporates a retrospective description and analysis of key historic food security trends, issues, and efforts across the reference period to assist potential future Title II Awardees to design programs that are grounded in an understanding of recent events and their causes and effects and that are strategically implemented to meet Title II objectives while leveraging other resources (e.g., from the GOH, the United States Government [USG], and other donors) to effectively reduce food insecurity among Haiti’s vulnerable populations. Information included in this assessment was collected through an extensive desk review of available published and gray literature and data, as well as a comprehensive series of consultations carried out in Haiti in June and July 2011. Given the limited time available to conduct this assessment, no primary data were collected. Constraints and Assumptions One significant methodological constraint that affected this assessment was the diverse and sometimes divergent nature of food security information and analysis available for Haiti, due in part to the varying time frames and methodologies for collecting and analyzing available data and information, as well as the varying levels of the overall quality of the data and information collected. In an effort to mitigate the effects of such divergences on this assessment, this report cites all data sources. Where there is diversity and divergence in the data and information available, the assessment takes as balanced as possible an approach in presenting varying data sources and carefully applying each in the construction of a solid evidence base for understanding food security conditions and trends in Haiti and their implications for future food security programming, and in particular future Title II development food aid programming, in the country. The information in this assessment does not represent an exhaustive consolidation of the multitude of food security analyses available for Haiti. Rather, it aims to concisely present what the authors feel are the most relevant food security data, information, and analyses necessary to understand Haiti’s current food security context. Significant additional micro- and macro-level data, information, and analysis are widely available, however, and a sampling of these additional sources is cited, where possible. It is recommended that potential Title II Awardees draw on this additional information as appropriate to determine specifically where and what types of food security programming they will propose for which populations in Haiti.
2 Title II activities fall under Public Law 480, the Agricultural Trade, Development and Assistance Act of 1954, which was renamed the Food for Peace Act in 2008.
Haiti Prospective Food Security Assessment
4
Report Structure The structure of this prospective assessment is as follows. Section 2 begins with an overview of the country context in Haiti, including an examination of trends among key food security indicators and an analysis of available current and recent historical data related to each food security pillar: availability, access, and utilization/consumption. This section considers the country’s food security vulnerability context, exploring several significant food security shocks across the reference period, their chronology, the broad trends they represent, and their impact on the country’s current food security status and near-term forecasts. This section also presents a concise synthesis of current food security conditions in and near-term forecasts for Haiti. The section concludes with a presentation of available data and information on key factors influencing food security in Haiti and a first-order identification of the most food insecure areas of the country based on an analysis of these factors. Section 3 provides a synopsis of key stakeholders’ current food security-related plans, policies, and intervention strategies in Haiti. These stakeholders include the GOH, the USG, and several other donor and implementing organizations, including the United Nations (U.N.) and key international financial institutions (IFIs). Box 1. Definitions of Key Terms Used in this Report3
Food security occurs when all people at all times have both physical and economic access to sufficient food to meet their dietary needs for a productive and healthy life.4 Using this definition, food security has three main components, each of which is necessary to attain food secure status: food availability, food access, and food utilization/consumption. Food availability occurs when sufficient quantities of food from household production, other domestic output, commercial imports, and/or food assistance are consistently available within reasonable proximity to a given population.5 Food access occurs when adequate resources are available to obtain appropriate foods for a nutritious diet. This depends on the total income available to a household, the distribution of income within a household, and the price of the foods.6 Food utilization/consumption occurs when food is, biologically, properly used. This requires a diet that provides sufficient energy and essential nutrients; an environment that includes potable water and adequate sanitation; and a knowledge base within the household of food storage and processing techniques, basic nutrition, and proper childcare and illness management.7 Global acute malnutrition (GAM) includes all cases of moderate and severe acute malnutrition. Moderate acute malnutrition (MAM) is indicated by a weight-for-height z-score (WHZ) < −2 and ≥ −3 OR mid-upper arm circumference (MUAC) < 125 mm and ≥ 115 mm. Severe acute malnutrition (SAM) is indicated by a WHZ < −3 OR MUAC < 115 mm OR by the presence of bilateral pitting edema. Risk is a function of the hazards/shocks members of a population experience and their vulnerability to them, considering their ability to cope. Expressed otherwise:
Risk = ƒ (hazard, vulnerability/coping)8 where ƒ = function
3 The definitions used in this report are based largely on those USAID employs. GOH definitions for many of these terms can be found at the National Food Security Coordination Office (CNSA) website: http://www.cnsahaiti.org/home/ (accessed on October 28, 20110). 4 USAID. 1992. “Policy Determination 19.” Accessed on September 7, 2011. http://www.usaid.gov/policy/ads/200/ pd19.pdf. 5 While this is the definition of food availability posited in USAID’s Policy Determination 19, other definitions of the concept exclude food assistance in the overall calculation. Technically, if the objective is to determine the amount of food available in a given country, food assistance should be included. However, if the objective is to better understand a country’s relative level of food insecurity, it may be better to exclude food assistance from the overall calculation.
Haiti Prospective Food Security Assessment
5
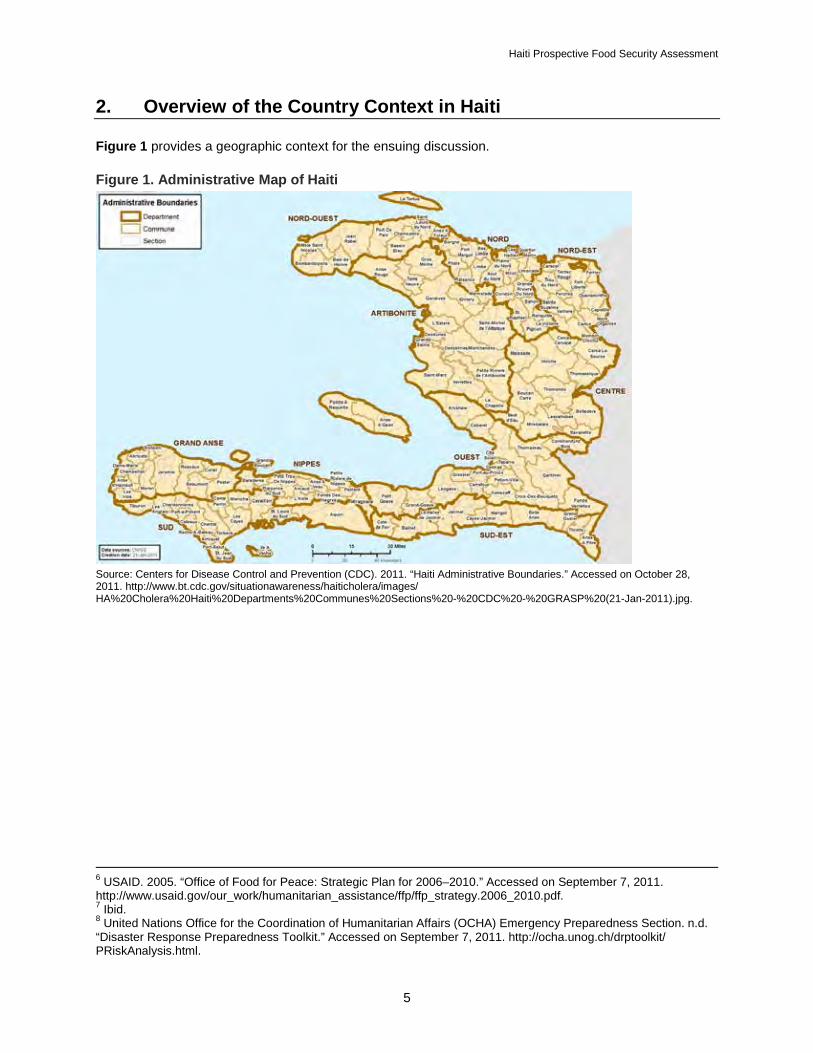
2. Overview of the Country Context in Haiti Figure 1 provides a geographic context for the ensuing discussion. Figure 1. Administrative Map of Haiti
Source: Centers for Disease Control and Prevention (CDC). 2011. “Haiti Administrative Boundaries.” Accessed on October 28, 2011. http://www.bt.cdc.gov/situationawareness/haiticholera/images/ HA%20Cholera%20Haiti%20Departments%20Communes%20Sections%20-%20CDC%20-%20GRASP%20(21-Jan-2011).jpg.
6 USAID. 2005. “Office of Food for Peace: Strategic Plan for 2006–2010.” Accessed on September 7, 2011. http://www.usaid.gov/our_work/humanitarian_assistance/ffp/ffp_strategy.2006_2010.pdf. 7 Ibid. 8 United Nations Office for the Coordination of Humanitarian Affairs (OCHA) Emergency Preparedness Section. n.d. “Disaster Response Preparedness Toolkit.” Accessed on September 7, 2011. http://ocha.unog.ch/drptoolkit/ PRiskAnalysis.html.

Haiti Prospective Food Security Assessment
6
“Limited national food production capacity, dependency on food imports, the lack of basic social services, vulnerability to natural disasters, socio-political instability, violence and insecurity in poor
urban areas and widespread poverty contribute to food insecurity [in Haiti] by restricting the availability of food and hampering households’ access to [it].”9
2.1. Overview of Medium-Term Trends in Key Economic and Social Indicators in Haiti Haiti, the poorest country in the Western Hemisphere, ranked 145 out of 169 countries on the U.N. 2010 Human Development Index (HDI). Haiti has seen little change in this ranking over the past several years, including over the reference period for this prospective assessment (2005–2011), particularly when compared to surrounding countries in the Latin America and Caribbean region. This relative developmental stagnation is due in part to a lack of improvement in many HDI components, including prevalence of undernourishment, underweight, and stunting among children; size of gross domestic product (GDP); and the overall poverty rate.10 Other commonly measured indicators, such as poverty rates and levels of food insecurity, are also largely stagnant. Moreover, many of these indicators do not yet entirely account for the negative impacts of recent shocks, such as the 2010 earthquake, the subsequent cholera epidemic, and hurricanes, and the effects of these shocks on the country’s health, education, economy, and overall food security. Table 1 provides an overview of these indicators, which will be discussed in more depth later in this section.
9 World Food Programme (WFP). 2008. “Comprehensive Food Security and Vulnerability Analysis 2007/2008 Executive Brief: Haiti. Accessed on September 7, 2011. http://reliefweb.int/sites/reliefweb.int/files/resources/ 0B44C445F6F4D73C85257560007AC6F4-Full_Report.pdf. 10 United Nations Development Programme (UNDP). 2011a. “Human Development Reports: Human Development Index.” Accessed on September 7, 2011. http://hdr.undp.org/en/statistics/hdi.

Haiti Prospective Food Security Assessment
7
Table 1. Overview of Key National Indicators for Food Security in Haiti Indicator Value Life expectancy at birth 61.7 years11 (United Nations Development
Programme [UNDP], 2009) HDI ranking 145 of 169 (UNDP, 2010) Prevalence of undernourishment12 57% (Food and Agriculture Organization of the
United Nations [FAO], 2007) Prevalence of underweight13 children 6–59 months of age
18% (Demographic and Health Survey [DHS],14 2006)
Prevalence of wasted children 6–59 months of age 10% (DHS, 2006) Prevalence of stunted children 6–59 months of age 29% (DHS, 2006) Net primary school attendance15 50%16 (UNICEF, 2006) Net secondary school attendance 19.6%17 (UNICEF, 2006) Adult literacy rate 49%18 (UNDP, 2006) GDP per capita/rank United States dollars (US$)1,04519/158 of 187
(UNDP, 2009) GDP growth rate/rank −5.1%/213 of 216 (UNDP, 2010) Average caloric availability per person per day 1,870 kcal (FAO, 2007) Percentage of population living on less than US$1 per day/US$2 per day
56%/76% (Poverty Reduction Strategy Paper [PRSP], 2008)
Number of major shocks in the last 12 years20 34 (International Disaster Database [EM-DAT], 2011)
Life Expectancy, Mortality, and Nutrition in Haiti Life expectancy at birth in Haiti is 61.7 years. Though the country saw increases in its life expectancy from 1980 (50.6 years) to 2000 (59.1 years), such improvements have since largely leveled off. The country’s infant mortality rate is estimated at between 54.0 (2008 estimate)21 and 62.4 (2005–2010 estimate)22 infants per 1,000 live births. The under-5 mortality rate is estimated at between 72 (2008
11 UNDP. 2011c. “International Human Development Indicators: Life expectancy at birth (years).” Accessed on September 13, 2011. http://hdrstats.undp.org/en/indicators/69206.html. 12 Undernourishment is calculated using a statistical model that estimates food availability from food balance sheets and distributes consumption across the population. 13 Underweight is defined as a weight-for-age z-score (WAZ) < −2. 14 The 2006 Haiti DHS is titled “Enquête Mortalité, Morbidité et Utilisation des Services.” 15 Net attendance is defined as the share of children of primary school age who attend primary school (i.e., the number of children of primary school age in primary school divided by the total number of children of primary school age). 16 UNICEF. 2011a. “Statistics by Area: Primary School Participation.” Accessed on September 13, 2011. http://www.childinfo.org/education_primary.php. The data estimate is from 2005–2009. 17 UNICEF. 2011b. “Statistics by Area: Secondary School Participation.” Accessed on November 11, 2011. http://www.childinfo.org/education_secondary.php. 18 World Bank. 2006. “Data by Country: Haiti.” Accessed on November 29, 2011. http://data.worldbank.org/indicator/ SE.ADT.LITR.ZS. 19 The most recent GDP estimates, from 2010 (US$670 per capita), and related rankings are anomalously low due to the negative economic impacts of the 2010 earthquake and, as such, were not included in this table. 20 In this tabulation, the authors defined “major shocks” as those affecting more than 1,000 people. 21 UNICEF. 2010b. “Maternal, Newborn and Child Survival Country Profiles: Haiti.” Accessed on November 11, 2011. http://www.childinfo.org/files/maternal/DI%20Profile%20-%20Haiti.pdf. 22 UNDATA. 2011. “Haiti.” Accessed on September 7, 2011. http://data.un.org/CountryProfile.aspx?crName=Haiti.
Haiti Prospective Food Security Assessment
8
estimate)23 and 87 (2009 estimate)24 children per 1,000 live births. While Haiti’s current under-5 mortality rate has dropped from 222 per 1,000 live births in 1970 to 113 in 2000 to the present rate, it remains the highest in the Latin America and Caribbean region.25 The overall prevalence of undernourishment in Haiti has improved only slightly in the past 20 years, according to the Food and Agriculture Organization of the United Nations (FAO).26 In the early 1990s, 63 percent of the total population was estimated to be undernourished. This dropped to 53 percent in the early 2000s, but increased to an estimated 57 percent between 2006 and 2008, due at least in part to the general lack of economic growth during these years and the onset of the 2008 global food price crisis. In terms of child nutrition indicators, UNICEF estimates the prevalence of underweight (weight-for-age z-score [WAZ] < −2) among children 6–59 months of age, based on the World Health Organization (WHO) 2006 Child Growth Standards,27 to be 18 percent,28 with little difference between males (18 percent prevalence) and females (17 percent prevalence). UNICEF also estimates the prevalence of wasting (weight-for-height z-score [WHZ] < −2 OR mid-upper arm circumference [MUAC] < 125 mm) to be 10 percent and the prevalence of stunting (height-for-age z-score [HAZ] < −2) to be 29 percent (31 percent among males, 26 percent among females) for the same age group, based on analysis of the country’s 2006 Demographic and Health Survey (DHS) data.29 Progress toward the Millennium Development Goal (MDG) of reducing the underweight prevalence among children under 5 years of age30 lags in Haiti, with an average annual reduction rate (AARR) of only 1.9 percent, compared to an overall AARR in the Latin America and Caribbean region of 3.3 percent.31 Education in Haiti The mean number of years of schooling for adults, defined as persons 25 years of age and older, in Haiti is currently 4.9.32 Only slow improvements in education have been observed among adults in the past 30 years, with the mean number of years of schooling increasing from 1.4 years in 1980 to 3.9 years in 2000.33 Net primary school attendance for the second half of the past decade was estimated at 50 percent, with only small differences between sexes (48 percent for females, 52 percent for males), according to data from the 2006 DHS.34 Net secondary school attendance for the same timeframe was 19.6 percent (18 percent for females, 21 percent for males), according to data from the 2006 DHS.35 This figure contrasts starkly with the Latin America and Caribbean region’s secondary school net attendance of 68 percent for males and 74 percent for females. Economy, Growth, and Poverty in Haiti In 2009, GDP per capita (purchasing power parity [PPP], in constant 2005 international dollars) in United States dollars [US$]) for Haiti was estimated at US$1,045 (compared to US$1,137 in 2000, US$1,016 in 2005, and US$1,032 in 2008), leading the country to a ranking of 158 out of 227 countries in estimated
23 UNICEF. 2010b. 24 UNICEF. 2010a. “At a glance: Haiti: Statistics.” Accessed on November 11, 2011. http://www.unicef.org/ infobycountry/haiti_statistics.html. 25 UNICEF. 2011c. “Statistics by Area: Trends in under-five mortality rates (1960–2010).” Accessed on September 7, 2011a. http://www.childinfo.org/mortality_ufmrcountrydata.php. 26 FAO. 2011d. “Hunger statistics: Haiti.” Time periods referenced include: 1990–1992, 1995–1997, 2000–2002, and 2006–2008. Accessed on September 9, 2011. http://www.fao.org/hunger/en/. 27 WHO. 2011. “Child Growth Standards.” Accessed on September 9, 2011. http://www.who.int/childgrowth/en/. 28 UNICEF. 2011c. 29 Ibid. 30 Prevalence of underweight is affiliated with the MDG 1 target of halving the proportion of people who suffer from hunger. 31 UNICEF. 2011c. 32 UNDP. 2011d. “International Human Development Indicators. Mean years of schooling (of adults) (years). Haiti.” Accessed on November 11, 2011. http://hdrstats.undp.org/en/countries/profiles/HTI.html. 33 Ibid. 34 UNICEF. 2011a. 35 UNICEF. 2011b.

Haiti Prospective Food Security Assessment
9
GDP per capita as of 2009.36 Moreover, the GDP growth rate (measured in constant prices) in 2010 was estimated at −5.1 percent, putting Haiti near the bottom of the global GDP ranking, at 212 out of 215 countries.37 In the past 20 years, Haiti’s GDP has fluctuated without a clear growth trend (Figure 2). Chronic poverty, an unstable government, poor infrastructure, and a lack of resources all contribute to this poor economic performance. Figure 2. Percent Change in Haiti’s GDP, with Constant Prices, 1990–201038
-15.00
-10.00
-5.00
0.00
5.00
10.00
15.00
1990 1992 1994 1996 1998 2000 2002 2004 2006 2008 2010
Pcer
cent
chan
ge
Year
Source: International Monetary Fund (IMF). 2011. “Report for Selected Countries and Subjects.” Accessed on November 11, 2011. http://www.imf.org/external/pubs/ft/weo/2011/01/weodata/ weorept.aspx?sy=1990&ey=2010&scsm=1&ssd=1&sort=country&ds=.&br=1&c=263&s=NGDP_RPCH&grp=0&a=&pr1.x=48&pr1. y=8. Haiti’s main exports, valued at an estimated US$530 million in 2010, include apparel, manufactured goods, oils, cocoa, mangoes, and coffee.39 Exports are mainly directed to the United States, as well as to the Dominican Republic and Canada. The country’s main imports, valued at US$2.7 billion in 2010, include food, manufactured goods, machinery, fuel, and raw materials.40 Haiti’s main import partner is the United States, followed by the Dominican Republic. Haiti’s 2008 Poverty Reduction Strategy Paper (PRSP) reports that 56 percent of the population is extremely poor (living on less than US$1 per person per day) and 76 percent are poor (living on less than US$2 per person per day).41 According to the GOH and the International Monetary Fund (IMF), for every
36 UNDP. 2011b. “International Human Development Indicators: GDP per capita in PPP terms (constant 2005 international $).” Accessed on November 22, 2011. http://hdrstats.undp.org/en/indicators/20206.html. 37 United States (U.S.) Central Intelligence Agency (CIA). 2011. “The World Factbook: Haiti.” Accessed on September 9, 2011. https://www.cia.gov/library/publications/the-world-factbook/rankorder/2003rank.html?countryName=Haiti&countryCode=ha®ionCode=cam&rank=212#ha. Some of this precipitous decrease in GDP growth is attributable to the negative economic impacts of the 2010 earthquake, which struck just outside of Port-au-Prince, the country’s economic hub. 38 The large drop in GDP per capita in 1994 illustrated in the graph was due in part to the U.N. embargo on Haiti. 39 CIA. 2011. 40 Ibid. 41 Haitian Institute for Statistics and Information (IHSI). 2003. “Enquête sur les Conditions de Vie en Haïti (ECVH).” Accessed on September 9, 2011. http://www.ihsi.ht/pdf/ecvh/ecvh_volume_I_(juillet2003).pdf. Title translates as “Survey on Living Conditions in Haiti.”
Haiti Prospective Food Security Assessment
10
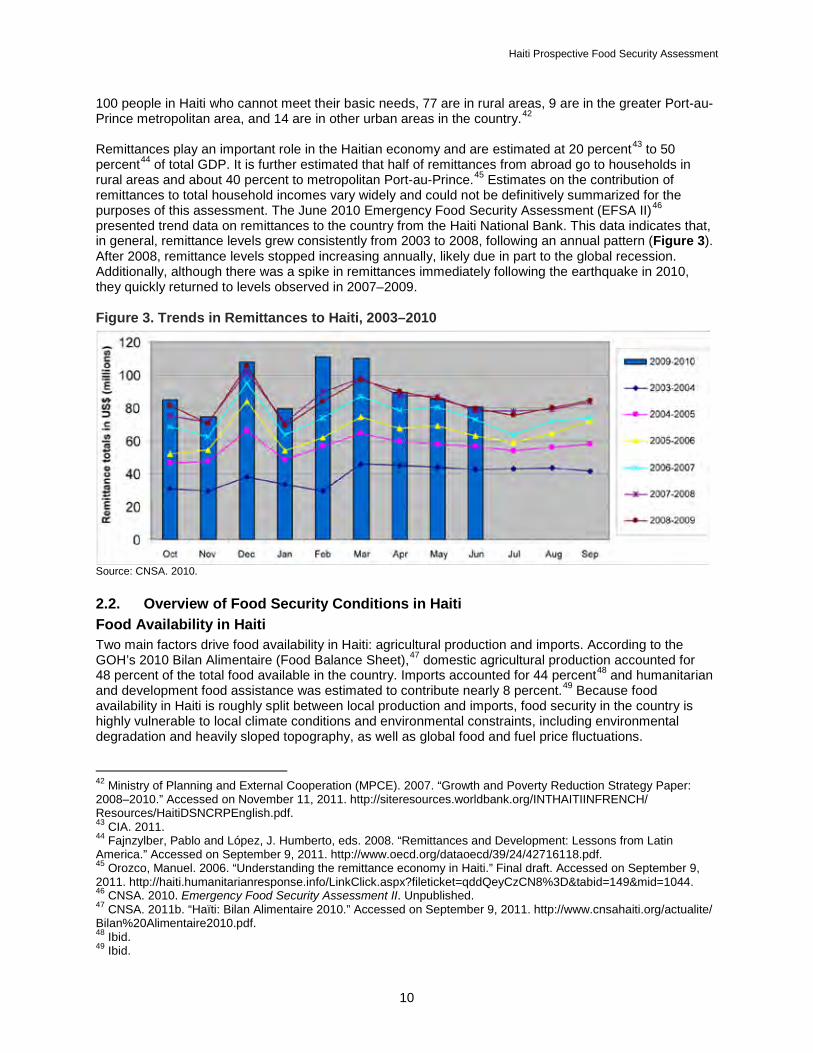
100 people in Haiti who cannot meet their basic needs, 77 are in rural areas, 9 are in the greater Port-au-Prince metropolitan area, and 14 are in other urban areas in the country.42 Remittances play an important role in the Haitian economy and are estimated at 20 percent43 to 50 percent44 of total GDP. It is further estimated that half of remittances from abroad go to households in rural areas and about 40 percent to metropolitan Port-au-Prince.45 Estimates on the contribution of remittances to total household incomes vary widely and could not be definitively summarized for the purposes of this assessment. The June 2010 Emergency Food Security Assessment (EFSA II)46 presented trend data on remittances to the country from the Haiti National Bank. This data indicates that, in general, remittance levels grew consistently from 2003 to 2008, following an annual pattern (Figure 3). After 2008, remittance levels stopped increasing annually, likely due in part to the global recession. Additionally, although there was a spike in remittances immediately following the earthquake in 2010, they quickly returned to levels observed in 2007–2009. Figure 3. Trends in Remittances to Haiti, 2003–2010
Source: CNSA. 2010. 2.2. Overview of Food Security Conditions in Haiti Food Availability in Haiti Two main factors drive food availability in Haiti: agricultural production and imports. According to the GOH’s 2010 Bilan Alimentaire (Food Balance Sheet),47 domestic agricultural production accounted for 48 percent of the total food available in the country. Imports accounted for 44 percent48 and humanitarian and development food assistance was estimated to contribute nearly 8 percent.49 Because food availability in Haiti is roughly split between local production and imports, food security in the country is highly vulnerable to local climate conditions and environmental constraints, including environmental degradation and heavily sloped topography, as well as global food and fuel price fluctuations. 42 Ministry of Planning and External Cooperation (MPCE). 2007. “Growth and Poverty Reduction Strategy Paper: 2008–2010.” Accessed on November 11, 2011. http://siteresources.worldbank.org/INTHAITIINFRENCH/ Resources/HaitiDSNCRPEnglish.pdf. 43 CIA. 2011. 44 Fajnzylber, Pablo and López, J. Humberto, eds. 2008. “Remittances and Development: Lessons from Latin America.” Accessed on September 9, 2011. http://www.oecd.org/dataoecd/39/24/42716118.pdf. 45 Orozco, Manuel. 2006. “Understanding the remittance economy in Haiti.” Final draft. Accessed on September 9, 2011. http://haiti.humanitarianresponse.info/LinkClick.aspx?fileticket=qddQeyCzCN8%3D&tabid=149&mid=1044. 46 CNSA. 2010. Emergency Food Security Assessment II. Unpublished. 47 CNSA. 2011b. “Haïti: Bilan Alimentaire 2010.” Accessed on September 9, 2011. http://www.cnsahaiti.org/actualite/ Bilan%20Alimentaire2010.pdf. 48 Ibid. 49 Ibid.
Haiti Prospective Food Security Assessment
11
The typical Haitian food basket consists primarily of rice, beans, oil, fruits, and vegetables. Haitians consume a variety of starch staples, rice being primary among them, followed by cassava, wheat, unripened bananas, maize, yams, sweet potato, and plantains.50 Haitians also consume other staples, such as sorghum, other roots and tubers, and breadfruit, albeit in smaller quantities. Consumption levels for most starchy staples have remained relatively unchanged over the past 20 years, with the exception of rice, the consumption of which nearly doubled from an average of 65 g per person per day in the early 1990s to 115 g per person per day in 2003–2005 (the most recent available data).51 This increase in rice consumption is somewhat attributable to the trade liberalization that began in the country in the mid-1980s, which took off with the advent of the IMF- and World Bank-recommended structural adjustments that the country instituted in the mid-1990s. These measures resulted in low tariffs (3 percent) on imported rice, which tends to make it less expensive than locally produced rice and other local staples.52 While rice consumption in Haiti has increased in recent decades, domestic rice production has more or less plateaued. This plateau was due in part to reduced access to fertilizers and other inputs during the Haitian trade embargo of the early 1990s; it has persisted and been exacerbated by continued environmental and physical infrastructure degradation and limited access to capital.53 These structural realities have made it impossible for local rice production to keep pace with rising demand or to compete with cheaper rice imports, despite the fact that Haitians prefer to consume locally produced rice varieties.54 FAO estimated national rice production levels at about 87,000 metric tons (MT) in 2007, covering an estimated 10–15 percent of the country’s total consumption requirements.55 The 2010 Food Balance Sheet indicated rice production levels of 141,075 MT, with 98,753 MT available after post-harvest losses. Even with agricultural production and imports, the overall food balance for 2007 (the most recent available data for this calculation) indicated an average food availability of 1,870 kcal per person per day, about 11 percent less than the 2,100 kcal daily dietary energy intake recommended for a healthy life.56 According to the 2010 FAO and World Food Programme (WFP) Crop and Food Security Assessment Mission (CFSAM) report,57 national production of key staples in Haiti for the period July 2010 to June 2011 was forecast as:
· 503,600 MT of cereals · 148,000 MT of beans/pulses · 1,232,900 MT of roots/tubers · 313,200 MT of plantains
These production estimates are lower than 2009 levels, with cereal production having decreased by 9 percent, beans/pulses by 20 percent, roots/tubers by 12 percent, and plantains by 14 percent.58 These reduced production levels were due, in part, to the negative effects of the 2010 earthquake on agricultural production (e.g., households and communities hosting populations displaced by the earthquake did not have sufficient resources to meet expanded household needs and purchase the requisite inputs for agricultural production); a decrease in total land cultivated (e.g., from broad rural-to-urban migration in search of more secure/better paying jobs); soil loss/degradation from erosion; and insufficient investments in irrigation, storage, and transport infrastructure.
50 FAO. 2011b. “Food security data and definitions.” Accessed on September 9, 2011. http://www.fao.org/economic/ ess/ess-fs/fs-data/ess-fadata/en/. (See Food consumption: Quantities: food groups.) 51 Ibid. 52 United States Agency for International Development (USAID). 2010. “Haiti Market Analysis.” Accessed on November 22, 2010. http://www.usaid.gov/our_work/humanitarian_assistance/ffp/besthaitireport.pdf. 53 Ibid. 54 Ibid. 55 FAO. 2011a. “FAOSTAT: Food Balance Sheets.” Accessed on November 11, 2011. http://faostat.fao.org/site/368/ DesktopDefault.aspx?PageID=368#ancor. (Search criteria included Country: Haiti and Year: 2007.) 56 Ibid. 57 FAO and WFP. 2010. “Rapport Spécial: Mission FAO/PAM d’Évaluation de la Récolte et de la Sécurité Alimentaire en Haïti.” Accessed on September 9, 2011. http://documents.wfp.org/stellent/groups/public/documents/ena/ wfp226104.pdf. 58 Ibid.
Haiti Prospective Food Security Assessment
12
The 2010 Food Balance Sheet, which covers a slightly different time period than the CFSAM report (January to December 2010),59 estimated national food production (post-loss) as:
· 561,814 MT of cereals · 61,895 MT of beans/pulses (pre-loss estimate of 129,831 MT) · 1,550,298 MT of roots/tubers · 400,950 MT of plantains
Food Access in Haiti The National Food Security Coordination Office (CNSA), defines food access as a household’s capacity to garner “a sufficient quantity of food, be it by production, purchase, transfers, [and/]or gifts” through negotiation of the factors that influence this capacity. Influencing factors include physical access (which depends on transport infrastructure and physical location, both of which can facilitate or worsen local market supplies), sociopolitical access (which depends on the norms that regulate social groups’ access to resources), and economic access (which depends on household purchasing power, derived from income and retail food prices).60 While a small country in terms of area, Haiti’s mountainous terrain and limited physical infrastructure present significant physical access (i.e., transport, storage) challenges. That said, household food access issues across the country tend to be more closely linked to sociopolitical and economic factors—specifically income poverty—than to physical location, though the latter does directly affect the former. When information on households’ reliance on food purchases (both imported and local foods) to meet their food needs is coupled with the 2008 PRSP figures on poverty prevalence (i.e., 56 percent of the population living on less than US$1 per person per day, 76 percent living on less than US$2 per person per day),61 the high level of vulnerability to food insecurity Haitians face as a result of income poverty becomes evident. Reliance on purchases as a significant means of sourcing food is apparent even in rural agricultural areas. For example, the WFP, CNSA and other food security partners’ 2007 Comprehensive Food Security and Vulnerability Assessment (CFSVA) found that rural households sourced about 68 percent of their food through purchases, these purchases accounting for 59 percent of their total expenditures.62 In urban areas, households sourced nearly 100 percent of food through purchase, with these purchases comprising about 33 percent of overall household expenditures in the Port-au-Prince metropolitan area and approximately 41 percent in other urban areas.63 Box 2 presents characteristics of households more and less at risk of food insecurity in Haiti beyond those of income poverty and physical location.
59 The 2010 Food Balance Sheet notes a surplus of about 311,000 MT (total food needs, in cereal equivalents: 2,269,173 MT; total food availability: 2,579,937 MT), whereas the 2010 CFSAM notes a deficit of 186,000 MT. While the reason for the discrepancies between these production estimates is unclear, poverty levels and the means by which Haitian households source their food indicate that even if the country is able to produce and import sufficient food, portions of the population are likely to continue to experience difficulties accessing it in adequate amounts. 60 CNSA. 2011a. “Coin Lexique.” Accessed on November 11, 2011. http://www.cnsahaiti.org/home/cnsa/coin-lexique.html. Information was translated by the authors of this review. 61 IHSI. 2003. 62 WFP. 2007. “Analyse Compréhensive de la Sécurité Alimentaire et de la Vulnérabilité (CFSVA) en Milieu Rural Haïtien.” Accessed on November 11, 2011. http://reliefweb.int/sites/reliefweb.int/files/resources/ 62E9C9D95143D1164925765100114702-Rapport_complet.pdf. 63 Ibid.
Haiti Prospective Food Security Assessment
13
Box 2. Characteristics of Households More and Less at Risk of Food Insecurity in Haiti Characteristics of households more at risk of food insecurity in Haiti include those that:
· Are reliant on agriculture, fishing, and other manual labor activities; day labor; charcoal sales; or transfers/social assistance as a main income source64,65
· Have more than eight members66 or have members who are chronically ill, elderly, or disabled67,68,69 · Are in the poorest wealth group,70,71 particularly those in rural areas72,73 · Were displaced by the 2010 earthquake, particularly those now living in displacement camps74 · Have members with low education levels, particularly mothers75,76 · Have pregnant and lactating women77
In contrast, households in Haiti less at risk of food insecurity include those that:
· Combine agriculture activities and other income sources, including trade of nonagricultural and/or pastoral goods78,79
· Receive remittances80
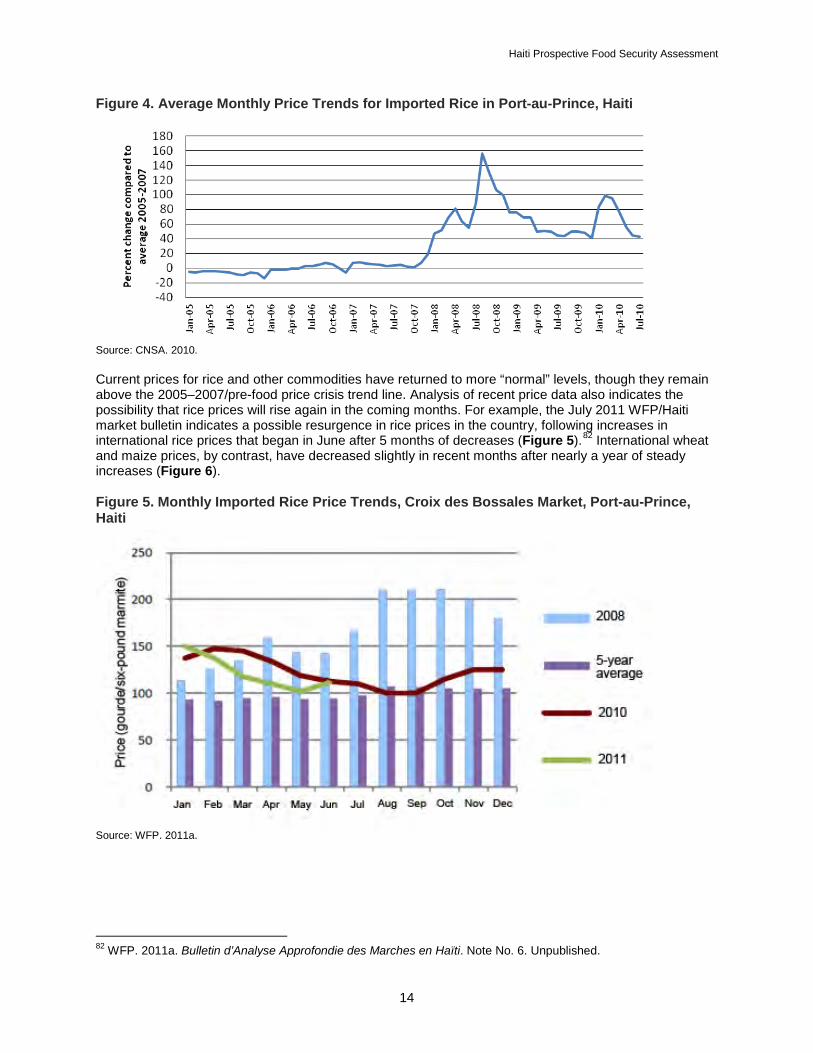
Considering Haitians’ heavy reliance on purchases to source food throughout the country, food price fluctuations are an important indicator of potential stress on household food access. Figure 4 shows the evolution of prices for imported rice, a key staple in Haiti, from January 2005 to July 2010.81 While prices from 2005 through 2007 were relatively stable, the precipitous price increase for this staple and its peak in 2008 had a significant negative impact on households’ capacity to purchase sufficient food. And, though these prices stabilized in early 2009, they remain above pre-spike levels. Figure 4 also illustrates the price spike following the January 2010 earthquake, though this spike did not reach 2008 levels before moving back toward pre-earthquake prices.
64 Ibid. 65 CNSA. 2011d. Preliminary Results of the National Food Security Study in Haiti: Conclusions and Recommendations. Unpublished. 66 Ibid. 67 CNSA. 2010. 68 MPCE. 2007. 69 Cayemittes, Michel et al. 2007. “Enquête Mortalité, Morbidité et Utilisation des Services IV Haïti 2005–2006.” Accessed on September 9, 2011. http://webapps01.un.org/vawdatabase/uploads/Haiti%20-%20mortalite%20morbidite%20et%20utilisation%20de%20services%20EMMUS%20IV.pdf. 70 CNSA. 2010. 71 CNSA. 2011d. 72 MPCE. 2007. 73 CNSA. 2011d. 74 CNSA. 2010. 75 Ibid. 76 Cayemittes et al. 2007. 77 CNSA. 2010. 78 WFP. 2007. 79 CNSA. 2011c. 80 WFP. 2007. 81 CNSA. 2010.
Haiti Prospective Food Security Assessment
14
Figure 4. Average Monthly Price Trends for Imported Rice in Port-au-Prince, Haiti
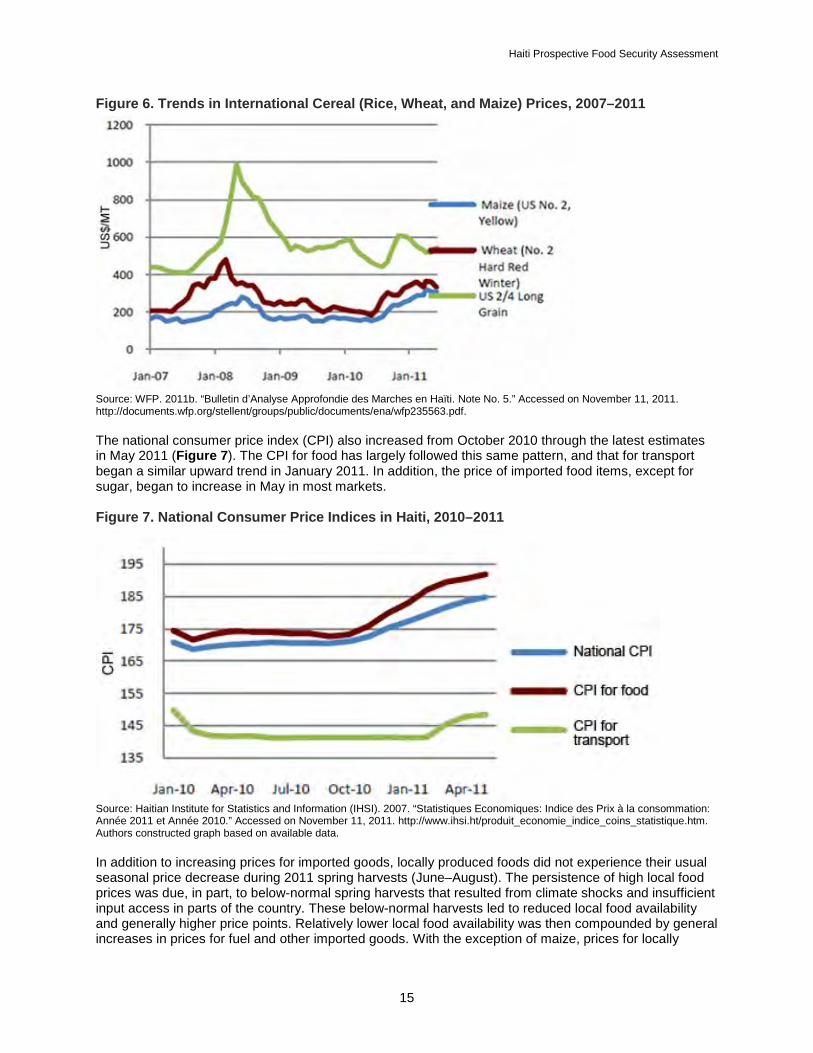
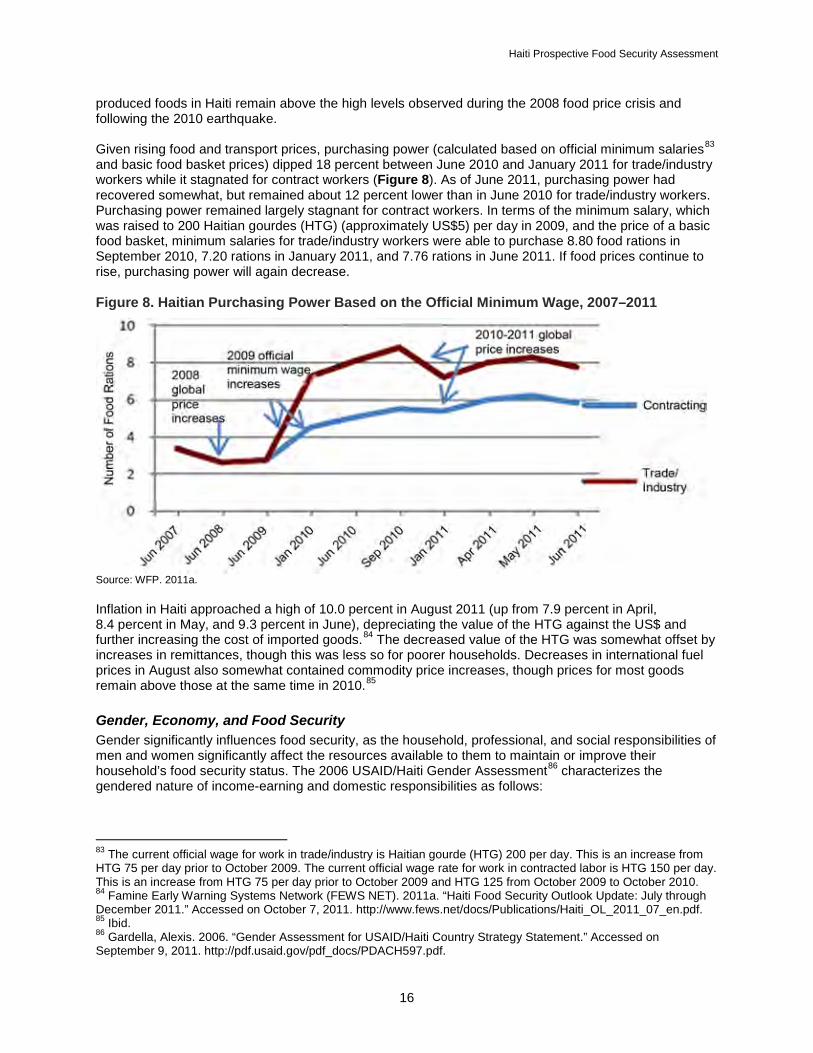
Source: CNSA. 2010. Current prices for rice and other commodities have returned to more “normal” levels, though they remain above the 2005–2007/pre-food price crisis trend line. Analysis of recent price data also indicates the possibility that rice prices will rise again in the coming months. For example, the July 2011 WFP/Haiti market bulletin indicates a possible resurgence in rice prices in the country, following increases in international rice prices that began in June after 5 months of decreases (Figure 5).82 International wheat and maize prices, by contrast, have decreased slightly in recent months after nearly a year of steady increases (Figure 6). Figure 5. Monthly Imported Rice Price Trends, Croix des Bossales Market, Port-au-Prince, Haiti
Source: WFP. 2011a.
82 WFP. 2011a. Bulletin d’Analyse Approfondie des Marches en Haïti. Note No. 6. Unpublished.
Haiti Prospective Food Security Assessment
15
Figure 6. Trends in International Cereal (Rice, Wheat, and Maize) Prices, 2007–2011
Source: WFP. 2011b. “Bulletin d’Analyse Approfondie des Marches en Haïti. Note No. 5.” Accessed on November 11, 2011. http://documents.wfp.org/stellent/groups/public/documents/ena/wfp235563.pdf. The national consumer price index (CPI) also increased from October 2010 through the latest estimates in May 2011 (Figure 7). The CPI for food has largely followed this same pattern, and that for transport began a similar upward trend in January 2011. In addition, the price of imported food items, except for sugar, began to increase in May in most markets. Figure 7. National Consumer Price Indices in Haiti, 2010–2011
Source: Haitian Institute for Statistics and Information (IHSI). 2007. “Statistiques Economiques: Indice des Prix à la consommation: Année 2011 et Année 2010.” Accessed on November 11, 2011. http://www.ihsi.ht/produit_economie_indice_coins_statistique.htm. Authors constructed graph based on available data. In addition to increasing prices for imported goods, locally produced foods did not experience their usual seasonal price decrease during 2011 spring harvests (June–August). The persistence of high local food prices was due, in part, to below-normal spring harvests that resulted from climate shocks and insufficient input access in parts of the country. These below-normal harvests led to reduced local food availability and generally higher price points. Relatively lower local food availability was then compounded by general increases in prices for fuel and other imported goods. With the exception of maize, prices for locally
Haiti Prospective Food Security Assessment
16
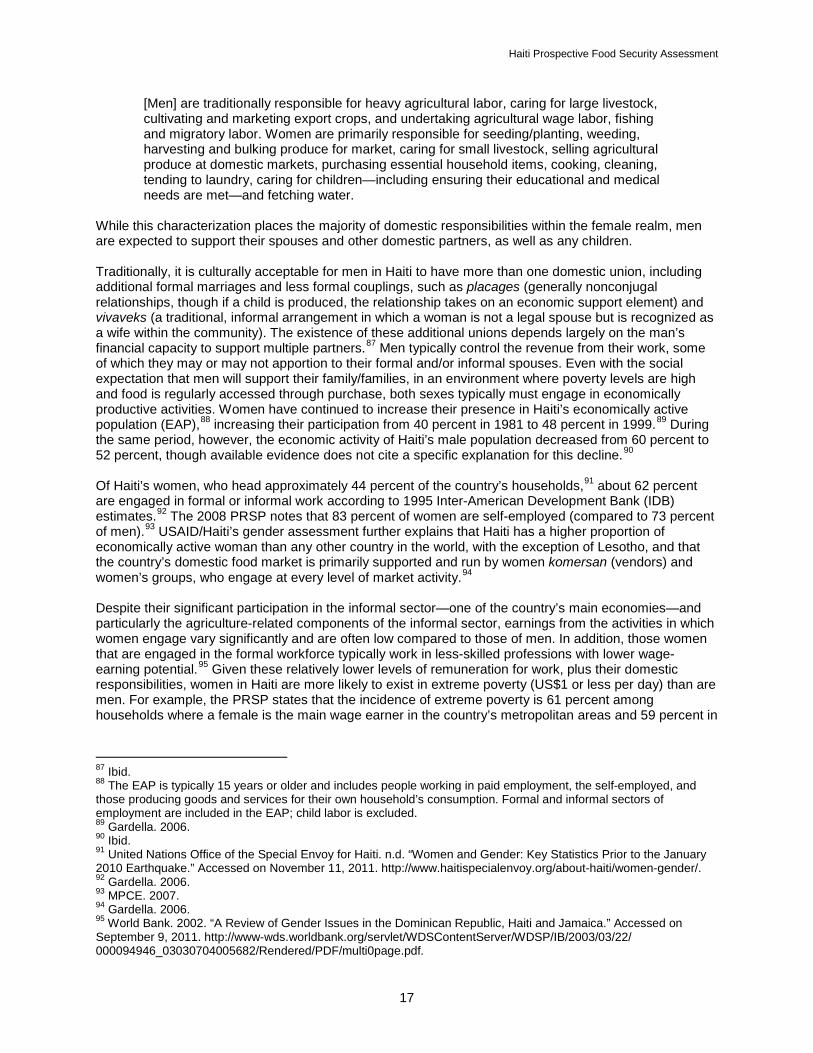
produced foods in Haiti remain above the high levels observed during the 2008 food price crisis and following the 2010 earthquake. Given rising food and transport prices, purchasing power (calculated based on official minimum salaries83 and basic food basket prices) dipped 18 percent between June 2010 and January 2011 for trade/industry workers while it stagnated for contract workers (Figure 8). As of June 2011, purchasing power had recovered somewhat, but remained about 12 percent lower than in June 2010 for trade/industry workers. Purchasing power remained largely stagnant for contract workers. In terms of the minimum salary, which was raised to 200 Haitian gourdes (HTG) (approximately US$5) per day in 2009, and the price of a basic food basket, minimum salaries for trade/industry workers were able to purchase 8.80 food rations in September 2010, 7.20 rations in January 2011, and 7.76 rations in June 2011. If food prices continue to rise, purchasing power will again decrease. Figure 8. Haitian Purchasing Power Based on the Official Minimum Wage, 2007–2011
Source: WFP. 2011a. Inflation in Haiti approached a high of 10.0 percent in August 2011 (up from 7.9 percent in April, 8.4 percent in May, and 9.3 percent in June), depreciating the value of the HTG against the US$ and further increasing the cost of imported goods.84 The decreased value of the HTG was somewhat offset by increases in remittances, though this was less so for poorer households. Decreases in international fuel prices in August also somewhat contained commodity price increases, though prices for most goods remain above those at the same time in 2010.85 Gender, Economy, and Food Security Gender significantly influences food security, as the household, professional, and social responsibilities of men and women significantly affect the resources available to them to maintain or improve their household’s food security status. The 2006 USAID/Haiti Gender Assessment86 characterizes the gendered nature of income-earning and domestic responsibilities as follows:
83 The current official wage for work in trade/industry is Haitian gourde (HTG) 200 per day. This is an increase from HTG 75 per day prior to October 2009. The current official wage rate for work in contracted labor is HTG 150 per day. This is an increase from HTG 75 per day prior to October 2009 and HTG 125 from October 2009 to October 2010. 84 Famine Early Warning Systems Network (FEWS NET). 2011a. “Haiti Food Security Outlook Update: July through December 2011.” Accessed on October 7, 2011. http://www.fews.net/docs/Publications/Haiti_OL_2011_07_en.pdf. 85 Ibid. 86 Gardella, Alexis. 2006. “Gender Assessment for USAID/Haiti Country Strategy Statement.” Accessed on September 9, 2011. http://pdf.usaid.gov/pdf_docs/PDACH597.pdf.
Haiti Prospective Food Security Assessment
17
[Men] are traditionally responsible for heavy agricultural labor, caring for large livestock, cultivating and marketing export crops, and undertaking agricultural wage labor, fishing and migratory labor. Women are primarily responsible for seeding/planting, weeding, harvesting and bulking produce for market, caring for small livestock, selling agricultural produce at domestic markets, purchasing essential household items, cooking, cleaning, tending to laundry, caring for children—including ensuring their educational and medical needs are met—and fetching water.
While this characterization places the majority of domestic responsibilities within the female realm, men are expected to support their spouses and other domestic partners, as well as any children. Traditionally, it is culturally acceptable for men in Haiti to have more than one domestic union, including additional formal marriages and less formal couplings, such as placages (generally nonconjugal relationships, though if a child is produced, the relationship takes on an economic support element) and vivaveks (a traditional, informal arrangement in which a woman is not a legal spouse but is recognized as a wife within the community). The existence of these additional unions depends largely on the man’s financial capacity to support multiple partners.87 Men typically control the revenue from their work, some of which they may or may not apportion to their formal and/or informal spouses. Even with the social expectation that men will support their family/families, in an environment where poverty levels are high and food is regularly accessed through purchase, both sexes typically must engage in economically productive activities. Women have continued to increase their presence in Haiti’s economically active population (EAP),88 increasing their participation from 40 percent in 1981 to 48 percent in 1999.89 During the same period, however, the economic activity of Haiti’s male population decreased from 60 percent to 52 percent, though available evidence does not cite a specific explanation for this decline.90 Of Haiti’s women, who head approximately 44 percent of the country’s households,91 about 62 percent are engaged in formal or informal work according to 1995 Inter-American Development Bank (IDB) estimates.92 The 2008 PRSP notes that 83 percent of women are self-employed (compared to 73 percent of men).93 USAID/Haiti’s gender assessment further explains that Haiti has a higher proportion of economically active woman than any other country in the world, with the exception of Lesotho, and that the country’s domestic food market is primarily supported and run by women komersan (vendors) and women’s groups, who engage at every level of market activity.94 Despite their significant participation in the informal sector—one of the country’s main economies—and particularly the agriculture-related components of the informal sector, earnings from the activities in which women engage vary significantly and are often low compared to those of men. In addition, those women that are engaged in the formal workforce typically work in less-skilled professions with lower wage-earning potential.95 Given these relatively lower levels of remuneration for work, plus their domestic responsibilities, women in Haiti are more likely to exist in extreme poverty (US$1 or less per day) than are men. For example, the PRSP states that the incidence of extreme poverty is 61 percent among households where a female is the main wage earner in the country’s metropolitan areas and 59 percent in
87 Ibid. 88 The EAP is typically 15 years or older and includes people working in paid employment, the self-employed, and those producing goods and services for their own household’s consumption. Formal and informal sectors of employment are included in the EAP; child labor is excluded. 89 Gardella. 2006. 90 Ibid. 91 United Nations Office of the Special Envoy for Haiti. n.d. “Women and Gender: Key Statistics Prior to the January 2010 Earthquake.” Accessed on November 11, 2011. http://www.haitispecialenvoy.org/about-haiti/women-gender/. 92 Gardella. 2006. 93 MPCE. 2007. 94 Gardella. 2006. 95 World Bank. 2002. “A Review of Gender Issues in the Dominican Republic, Haiti and Jamaica.” Accessed on September 9, 2011. http://www-wds.worldbank.org/servlet/WDSContentServer/WDSP/IB/2003/03/22/ 000094946_03030704005682/Rendered/PDF/multi0page.pdf.
Haiti Prospective Food Security Assessment
18
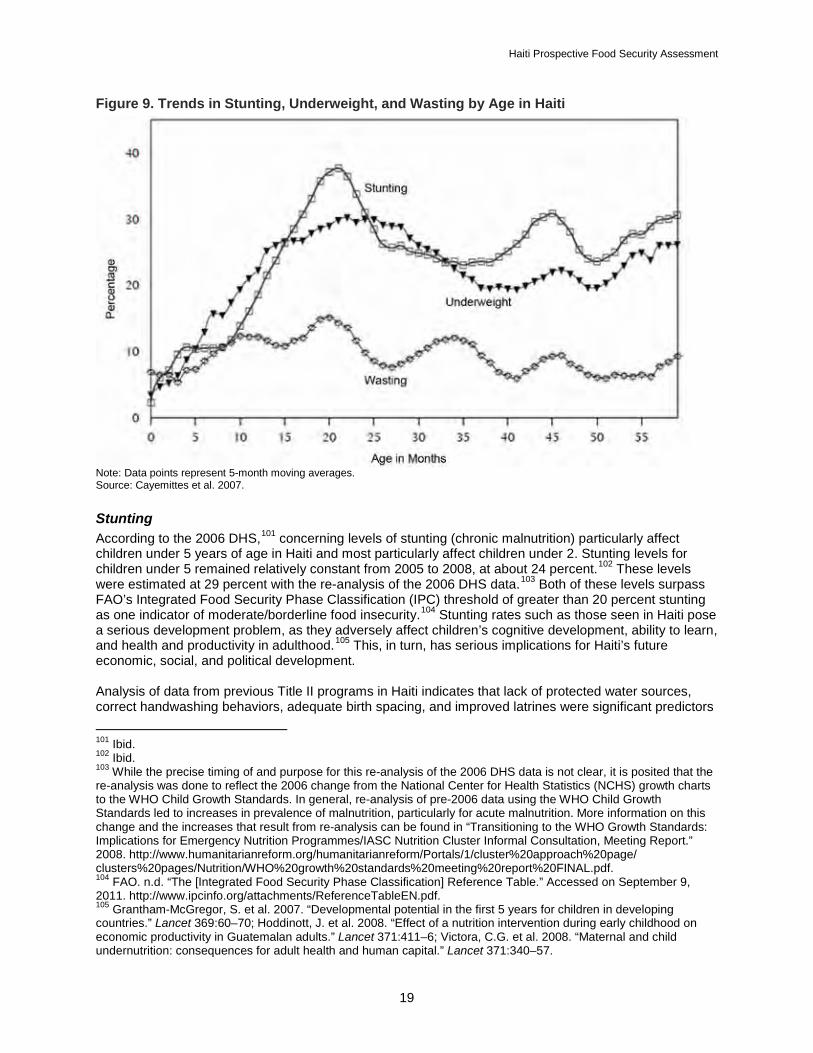
provincial cities.96 While incidence of extreme poverty appear higher in households where females are the main wage earner, the 2001 national census for Haiti indicated that male-headed households actually reported relatively higher levels of extreme food insecurity, with male-headed households reporting extreme food insecurity four times more often than women-headed households.97 One proposed explanation for the higher levels of food insecurity among male-headed households, despite the fact that female-headed households reported higher levels of extreme poverty, is that women focus on providing basic food and other needs for their families before engaging in additional wage-earning activities. That is, there is a belief that women apply the limited resources they have to meeting basic needs (e.g., food) first, whereas men may choose to invest in resources outside of basic needs. It is important to keep in mind, however, that, overall, poverty rates vary more between geographic areas in Haiti than between sexes.98 Food Utilization/Consumption in Haiti Factors affecting household capacity to effectively utilize/consume food in Haiti are multifaceted and include poor dietary intake, poor health and nutritional status, poor water and sanitation practices, poor quality of care (e.g., maternal care practices, availability of/access to basic medical services), and widespread poverty. The high burden of micronutrient malnutrition is also of concern, with a broad base of underlying contributors that includes diet, hygiene, health status, and health care access. Nutrition and Mortality Haiti’s 57 percent prevalence of undernourishment is among the highest for all developing countries.99 The country’s prevalence of underweight, reported at 22.2 percent among children under 5 years of age (21.9 percent for girls, 22.4 percent for boys) is also high, though lower than that of many other countries in the Latin America and Caribbean region.100 The most recent large-scale national health and nutrition survey for Haiti is the 2006 DHS, though efforts are under way to conduct a new DHS in 2011/2012. Broadly speaking, malnutrition trends in Haiti indicate that all forms of malnutrition begin to increase during the first few months of life and intensify through the first 2 years. By 2 years of age, the prevalence of stunting peaks at upwards of 35 percent, underweight at about 30 percent, and wasting at about 15 percent (Figure 9). This trend is of particular concern because the fetal stage though 2 years represents the period of the most rapid growth in children, making it a critical time in child development. During this period, children are most vulnerable to growth faltering, which is often caused by illness, infection, and suboptimal feeding practices that, when persistent, can lead to stunting. Stunting, in turn, is largely irreversible after 2 years of age, when the pace of growth slows.
96 MPCE. 2007. 97 IHSI. 2003. 98 MPCE. 2007. 99 FAO. 2011c. “Haiti.” Accessed on September 9, 2011. http://www.fao.org/countries/55528/fr/hti/. 100 Cayemittes et al. 2007.
Haiti Prospective Food Security Assessment
19
Figure 9. Trends in Stunting, Underweight, and Wasting by Age in Haiti
Note: Data points represent 5-month moving averages. Source: Cayemittes et al. 2007. Stunting According to the 2006 DHS,101 concerning levels of stunting (chronic malnutrition) particularly affect children under 5 years of age in Haiti and most particularly affect children under 2. Stunting levels for children under 5 remained relatively constant from 2005 to 2008, at about 24 percent.102 These levels were estimated at 29 percent with the re-analysis of the 2006 DHS data.103 Both of these levels surpass FAO’s Integrated Food Security Phase Classification (IPC) threshold of greater than 20 percent stunting as one indicator of moderate/borderline food insecurity.104 Stunting rates such as those seen in Haiti pose a serious development problem, as they adversely affect children’s cognitive development, ability to learn, and health and productivity in adulthood.105 This, in turn, has serious implications for Haiti’s future economic, social, and political development. Analysis of data from previous Title II programs in Haiti indicates that lack of protected water sources, correct handwashing behaviors, adequate birth spacing, and improved latrines were significant predictors 101 Ibid. 102 Ibid. 103 While the precise timing of and purpose for this re-analysis of the 2006 DHS data is not clear, it is posited that the re-analysis was done to reflect the 2006 change from the National Center for Health Statistics (NCHS) growth charts to the WHO Child Growth Standards. In general, re-analysis of pre-2006 data using the WHO Child Growth Standards led to increases in prevalence of malnutrition, particularly for acute malnutrition. More information on this change and the increases that result from re-analysis can be found in “Transitioning to the WHO Growth Standards: Implications for Emergency Nutrition Programmes/IASC Nutrition Cluster Informal Consultation, Meeting Report.” 2008. http://www.humanitarianreform.org/humanitarianreform/Portals/1/cluster%20approach%20page/ clusters%20pages/Nutrition/WHO%20growth%20standards%20meeting%20report%20FINAL.pdf. 104 FAO. n.d. “The [Integrated Food Security Phase Classification] Reference Table.” Accessed on September 9, 2011. http://www.ipcinfo.org/attachments/ReferenceTableEN.pdf. 105 Grantham-McGregor, S. et al. 2007. “Developmental potential in the first 5 years for children in developing countries.” Lancet 369:60–70; Hoddinott, J. et al. 2008. “Effect of a nutrition intervention during early childhood on economic productivity in Guatemalan adults.” Lancet 371:411–6; Victora, C.G. et al. 2008. “Maternal and child undernutrition: consequences for adult health and human capital.” Lancet 371:340–57.
Haiti Prospective Food Security Assessment
20
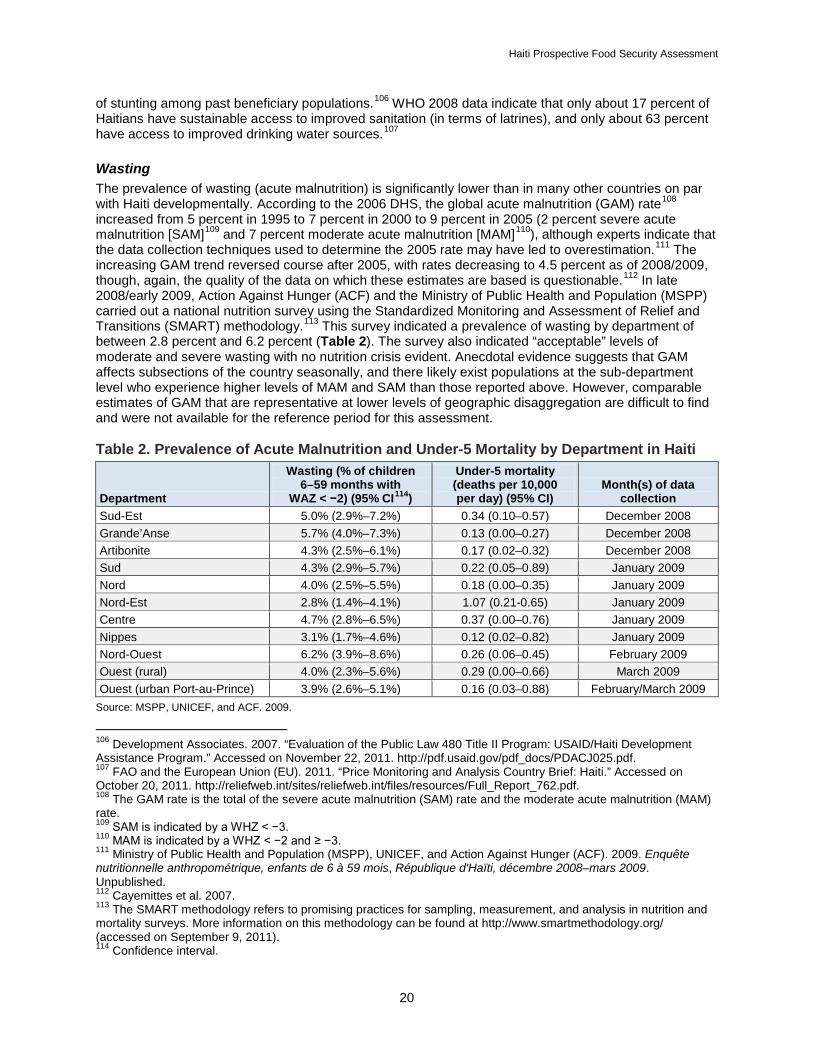
of stunting among past beneficiary populations.106 WHO 2008 data indicate that only about 17 percent of Haitians have sustainable access to improved sanitation (in terms of latrines), and only about 63 percent have access to improved drinking water sources.107 Wasting The prevalence of wasting (acute malnutrition) is significantly lower than in many other countries on par with Haiti developmentally. According to the 2006 DHS, the global acute malnutrition (GAM) rate108 increased from 5 percent in 1995 to 7 percent in 2000 to 9 percent in 2005 (2 percent severe acute malnutrition [SAM]109 and 7 percent moderate acute malnutrition [MAM]110), although experts indicate that the data collection techniques used to determine the 2005 rate may have led to overestimation.111 The increasing GAM trend reversed course after 2005, with rates decreasing to 4.5 percent as of 2008/2009, though, again, the quality of the data on which these estimates are based is questionable.112 In late 2008/early 2009, Action Against Hunger (ACF) and the Ministry of Public Health and Population (MSPP) carried out a national nutrition survey using the Standardized Monitoring and Assessment of Relief and Transitions (SMART) methodology.113 This survey indicated a prevalence of wasting by department of between 2.8 percent and 6.2 percent (Table 2). The survey also indicated “acceptable” levels of moderate and severe wasting with no nutrition crisis evident. Anecdotal evidence suggests that GAM affects subsections of the country seasonally, and there likely exist populations at the sub-department level who experience higher levels of MAM and SAM than those reported above. However, comparable estimates of GAM that are representative at lower levels of geographic disaggregation are difficult to find and were not available for the reference period for this assessment. Table 2. Prevalence of Acute Malnutrition and Under-5 Mortality by Department in Haiti
Department
Wasting (% of children 6–59 months with
WAZ < −2) (95% CI114)
Under-5 mortality (deaths per 10,000 per day) (95% CI)
Month(s) of data collection
Sud-Est 5.0% (2.9%–7.2%) 0.34 (0.10–0.57) December 2008 Grande’Anse 5.7% (4.0%–7.3%) 0.13 (0.00–0.27) December 2008 Artibonite 4.3% (2.5%–6.1%) 0.17 (0.02–0.32) December 2008 Sud 4.3% (2.9%–5.7%) 0.22 (0.05–0.89) January 2009 Nord 4.0% (2.5%–5.5%) 0.18 (0.00–0.35) January 2009 Nord-Est 2.8% (1.4%–4.1%) 1.07 (0.21-0.65) January 2009 Centre 4.7% (2.8%–6.5%) 0.37 (0.00–0.76) January 2009 Nippes 3.1% (1.7%–4.6%) 0.12 (0.02–0.82) January 2009 Nord-Ouest 6.2% (3.9%–8.6%) 0.26 (0.06–0.45) February 2009 Ouest (rural) 4.0% (2.3%–5.6%) 0.29 (0.00–0.66) March 2009 Ouest (urban Port-au-Prince) 3.9% (2.6%–5.1%) 0.16 (0.03–0.88) February/March 2009
Source: MSPP, UNICEF, and ACF. 2009.
106 Development Associates. 2007. “Evaluation of the Public Law 480 Title II Program: USAID/Haiti Development Assistance Program.” Accessed on November 22, 2011. http://pdf.usaid.gov/pdf_docs/PDACJ025.pdf. 107 FAO and the European Union (EU). 2011. “Price Monitoring and Analysis Country Brief: Haiti.” Accessed on October 20, 2011. http://reliefweb.int/sites/reliefweb.int/files/resources/Full_Report_762.pdf. 108 The GAM rate is the total of the severe acute malnutrition (SAM) rate and the moderate acute malnutrition (MAM) rate. 109 SAM is indicated by a WHZ < −3. 110 MAM is indicated by a WHZ < −2 and ≥ −3. 111 Ministry of Public Health and Population (MSPP), UNICEF, and Action Against Hunger (ACF). 2009. Enquête nutritionnelle anthropométrique, enfants de 6 à 59 mois, République d'Haïti, décembre 2008–mars 2009. Unpublished. 112 Cayemittes et al. 2007. 113 The SMART methodology refers to promising practices for sampling, measurement, and analysis in nutrition and mortality surveys. More information on this methodology can be found at http://www.smartmethodology.org/ (accessed on September 9, 2011). 114 Confidence interval.
Haiti Prospective Food Security Assessment
21
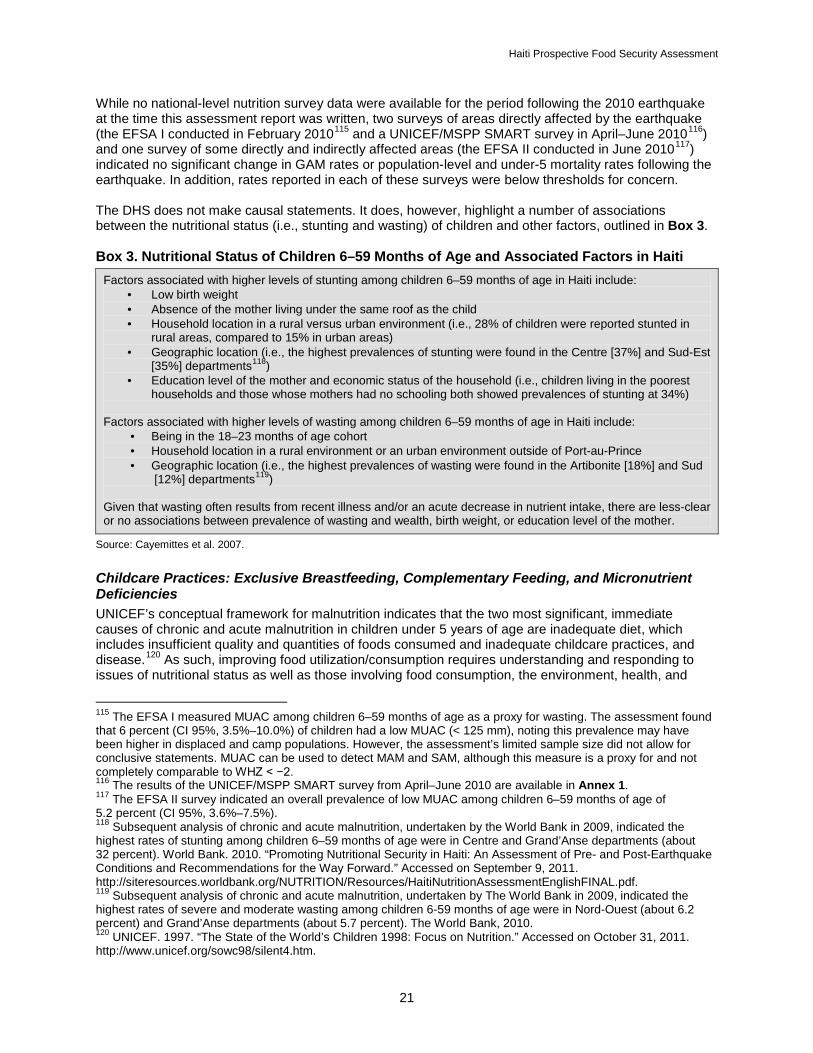
While no national-level nutrition survey data were available for the period following the 2010 earthquake at the time this assessment report was written, two surveys of areas directly affected by the earthquake (the EFSA I conducted in February 2010115 and a UNICEF/MSPP SMART survey in April–June 2010116) and one survey of some directly and indirectly affected areas (the EFSA II conducted in June 2010117) indicated no significant change in GAM rates or population-level and under-5 mortality rates following the earthquake. In addition, rates reported in each of these surveys were below thresholds for concern. The DHS does not make causal statements. It does, however, highlight a number of associations between the nutritional status (i.e., stunting and wasting) of children and other factors, outlined in Box 3. Box 3. Nutritional Status of Children 6–59 Months of Age and Associated Factors in Haiti
Factors associated with higher levels of stunting among children 6–59 months of age in Haiti include: · Low birth weight · Absence of the mother living under the same roof as the child · Household location in a rural versus urban environment (i.e., 28% of children were reported stunted in
rural areas, compared to 15% in urban areas) · Geographic location (i.e., the highest prevalences of stunting were found in the Centre [37%] and Sud-Est
[35%] departments118) · Education level of the mother and economic status of the household (i.e., children living in the poorest
households and those whose mothers had no schooling both showed prevalences of stunting at 34%) Factors associated with higher levels of wasting among children 6–59 months of age in Haiti include:
· Being in the 18–23 months of age cohort · Household location in a rural environment or an urban environment outside of Port-au-Prince · Geographic location (i.e., the highest prevalences of wasting were found in the Artibonite [18%] and Sud
[12%] departments119) Given that wasting often results from recent illness and/or an acute decrease in nutrient intake, there are less-clear or no associations between prevalence of wasting and wealth, birth weight, or education level of the mother.
Source: Cayemittes et al. 2007. Childcare Practices: Exclusive Breastfeeding, Complementary Feeding, and Micronutrient Deficiencies UNICEF’s conceptual framework for malnutrition indicates that the two most significant, immediate causes of chronic and acute malnutrition in children under 5 years of age are inadequate diet, which includes insufficient quality and quantities of foods consumed and inadequate childcare practices, and disease.120 As such, improving food utilization/consumption requires understanding and responding to issues of nutritional status as well as those involving food consumption, the environment, health, and
115 The EFSA I measured MUAC among children 6–59 months of age as a proxy for wasting. The assessment found that 6 percent (CI 95%, 3.5%–10.0%) of children had a low MUAC (< 125 mm), noting this prevalence may have been higher in displaced and camp populations. However, the assessment’s limited sample size did not allow for conclusive statements. MUAC can be used to detect MAM and SAM, although this measure is a proxy for and not completely comparable to WHZ < −2. 116 The results of the UNICEF/MSPP SMART survey from April–June 2010 are available in Annex 1. 117 The EFSA II survey indicated an overall prevalence of low MUAC among children 6–59 months of age of 5.2 percent (CI 95%, 3.6%–7.5%). 118 Subsequent analysis of chronic and acute malnutrition, undertaken by the World Bank in 2009, indicated the highest rates of stunting among children 6–59 months of age were in Centre and Grand’Anse departments (about 32 percent). World Bank. 2010. “Promoting Nutritional Security in Haiti: An Assessment of Pre- and Post-Earthquake Conditions and Recommendations for the Way Forward.” Accessed on September 9, 2011. http://siteresources.worldbank.org/NUTRITION/Resources/HaitiNutritionAssessmentEnglishFINAL.pdf. 119 Subsequent analysis of chronic and acute malnutrition, undertaken by The World Bank in 2009, indicated the highest rates of severe and moderate wasting among children 6-59 months of age were in Nord-Ouest (about 6.2 percent) and Grand’Anse departments (about 5.7 percent). The World Bank, 2010. 120 UNICEF. 1997. “The State of the World’s Children 1998: Focus on Nutrition.” Accessed on October 31, 2011. http://www.unicef.org/sowc98/silent4.htm.
Haiti Prospective Food Security Assessment
22
childcare practices. As previously noted, understanding and responding to this breadth of issues is particularly important during the first 1,000 days of life (from conception to 2 years of age), when child growth and development are most rapid. Poor care practices during this window can be devastating to the physical well-being of a child, as well as to his or her ability to physically and intellectually contribute to the development of the country as adults. For example, the World Bank indicates that Haiti loses more than US$56 million in GDP each year as a result of physical and intellectual impairments related to micronutrient deficiencies.121 According to the 2006 DHS Addendum on infant and young child feeding (IYCF) practices, only 40 percent of children under 6 months of age were exclusively breastfed in Haiti and only 32 percent of children 6–23 months of age received appropriate complementary feeding (based on the WHO-developed minimum standards for dietary diversity, meal frequency, and breast milk consumption).122 Data on the causes of low levels of exclusive breastfeeding indicate a lack of knowledge of proper infant feeding practices and women’s need to work away from the home to earn income. Statistics on micronutrient malnutrition in Haiti are scarce, although existing data indicate concerning levels of deficiencies, which can lead to a range of cognitive and physical development problems. For example, approximately 60 percent of children 6–59 months of age and 46 percent of women of reproductive age (15–49 years) were reported to be anemic in the 2006 DHS.123 Among children suffering from anemia, 72 percent were under 24 months of age.124 Despite the country’s proximity to the sea, which is often associated with lower iodine deficiency levels, considerable iodine deficiency remains in Haiti. WHO reports that as of 2004/2005, 58.9 percent of the population had insufficient iodine intake, with 29,000 children born mentally impaired due to iodine deficiency each year.125 With only 3 percent of households consuming iodized salt in 2009,126 no notable progress has been made in this area. In fact, according to the Micronutrient Initiative, the availability of iodized salt at the household level decreased between 2000 (11 percent of households) and 2005 (2 percent of households).127 Inconsistency in iodization efforts among local producers is one likely cause of this decrease, as salt comes from a variety of small, local producers who process the commodity with little oversight. According to WHO, 32 percent of preschool-age children suffer from vitamin A deficiency (Serum Retinol < 0.70 µmol/L), which qualifies as a severe public health problem.128 Among pregnant women, WHO estimates the prevalence of vitamin A deficiency at 5 percent, a level that also qualifies as a public health problem.129 The 2006 DHS indicated vitamin A coverage was below the population-level target of 80 percent.130 In fact, the highest prevalence of children under 5 years of age having received vitamin A capsules in the previous 6 months was 46.1 percent in the department of Artibonite,131 well below the DHS 80 percent population target.
121 World Bank. 2010. 122 Measure DHS. 2007. “Addendum to the 2005–2006 Haiti Demographic and Health Survey.” Accessed on September 9, 2011. http://www.measuredhs.com/pubs/pdf/FR192/HAITI-Addendum.SHM.pdf. 123 Cayemittes et al. 2007. 124 Ibid. 125 WHO. n.d. “Table 1. Country data on median urinary iodine concentrations and urinary iodine concentrations in school age children.” Accessed on September 9, 2011. http://www.who.int/vmnis/iodine/status/summary/ IDD_estimates_table_2007.pdf. 126 UNICEF. 2010a. 127 Micronutrient Initiative. n.d. “Haiti: Haiti Country Profile.” Accessed on September 9, 2011. http://www.micronutrient.org/english/view.asp?x=600. 128 World Bank. 2010. 129 WHO. 2009. “Global prevalence of vitamin A deficiency in populations at risk 1995–2005: WHO Global Database on Vitamin A Deficiency.” Accessed on November 11, 2011. http://whqlibdoc.who.int/publications/2009/ 9789241598019_eng.pdf. 130 Cayemittes et al. 2007. 131 Ibid.
Haiti Prospective Food Security Assessment
23
Many of these micronutrient deficiencies are due, in part, to inadequate complementary feeding practices. For example, the World Bank’s 2010 Nutrition Survey in Haiti indicates that less than 20 percent of breastfed children 6–9 months of age and less than 50 percent of all children 12–36 months of age consume animal-sourced food (which provides protein and many bioavailable forms of iron and vitamin A) each day.132 Evidence from this survey further indicates that only 25 percent of children 6–9 months and less than 50 percent of children under 36 months consume vitamin A-rich foods on a daily basis.133 HIV Prevalence The 2006 DHS is the only known survey to have collected nationally representative data on HIV prevalence in Haiti. According to this survey, HIV prevalence among adults (people older than 15 years of age) was 2.2 percent.134 HIV prevalence among young women (females 15–24 years of age) was measured at 1.4 percent, and among young men (males 15–24 years of age) at 0.6 percent.135 The 2007 CFSVA136 presented additional analysis, indicating HIV prevalence is higher in urban areas outside Port-au-Prince, and the highest overall prevalences being observed in Grand’Anse, Nippes, Nord, and Nord-Est departments. Among men, there existed a correlation between the prevalence of HIV and education level, those with no education being twice as likely to be HIV-positive than those with a secondary education or higher. No clear correlation was evident between education levels and HIV prevalence among women. Wealth, in terms of asset ownership, did not appear to be an important determinant of HIV prevalence, as, according to the DHS, the second poorest wealth quintile in Haiti had the lowest HIV prevalence among both men and women, while the second richest wealth quintile had the highest prevalence.137 2.3. Events Shaping Current and Forecast Food Security Conditions in Haiti Haiti’s Geophysical and Sociopolitical Vulnerability to Shocks Haiti is geographically vulnerable to a number of different shocks, with this vulnerability exacerbated by general poverty, environmental degradation, poor infrastructure, and lack of risk reduction and response capacity. An examination of recent natural and man-made shocks shows a clear pattern of frequent storms and flooding, with other events interspersed. Of the 34 major shocks in Haiti recorded in the past 12 years, 17 were flood events, 14 were storm events (13 of which were tropical storms or hurricanes), 1 was an earthquake, 1 was an infectious disease outbreak, and 1 was a drought.138 Additional information on each of these shocks is available in Annex 2. In addition to these larger-scale events, localized droughts, floods, landslides, and other smaller shocks also regularly tax community and household resilience in Haiti. The January 12, 2010, earthquake was by far the largest shock in Haiti’s recent history in terms of scale, death toll, and economic damages. However, other shocks over the assessment’s reference period also affected large numbers of people, including:
· The 2008 storms (tropical storms/hurricanes Faye, Gustav, Hannah, and Ike) and ensuing flooding and landslides in/around Gonaives that killed nearly 700 people and affected an estimated 250,000 more
· The 2010/2011 cholera epidemic, which has killed more than 5,600 people to date139 Expanding the time frame for analysis to include the past 100 years, the prevalence of flood- and storm-related events persists.
132 World Bank. 2010. 133 Ibid. 134 Cayemittes et al. 2007. 135 UNICEF. 2010b. 136 WFP. 2008. 137 Cayemittes et al. 2007. 138 Centre for Research on the Epidemiology of Disasters. 2009a. “Country Profile: Haiti.” Accessed on September 9, 2011. http://www.emdat.be/country-profile. 139 Ibid.
Haiti Prospective Food Security Assessment
24
· Six of the 10 shocks that killed the most people were storm events and 2 were flood events. The 2010 earthquake and cholera epidemic ranked as the top two shocks in terms of death toll.
· Five of the 10 shocks affecting the most people were storm events and 3 were drought events. The remaining 2 were the 2010 cholera epidemic and earthquake.
· Eight of the 10 shocks causing the most economic damage were storm events and 2 were seismic events (in 1952 and 2010).
Man-made (e.g., economic, political) shocks also regularly threaten Haiti. For example, the 2008 global food price crisis had a particularly strong negative impact on the country, due largely to its reliance on food imports and purchases. The low purchasing power of the country’s poor, who comprise more than three-quarters of the total population, makes this group particularly vulnerable to spikes in market prices for food and other essentials. The volatile political and civil security environments also negatively affect food security for the country’s population. For example, in the current political environment in which the newly elected government is only now beginning to fully form, international donors and IFIs have been hesitant to fully commit funds for reconstruction and development activities, and private sector investments appear, in some cases, to be on hold. A chronological examination of some of the key natural and man-made shocks affecting food security in Haiti over the reference period for this assessment report follows. Recent Shocks Affecting Food Security in Haiti The reference period for this assessment proved a particularly active time for shocks in Haiti, all of which had a negative impact on overall food security in the country. These shocks included the 2008 food price crisis, several tropical storms and hurricanes (four in 2008 and one in 2010), and the 2010 earthquake and cholera epidemic. The current, volatile political environment; the potential for another spike in food prices, and poor harvests in localized areas of the country continue to threaten food security. The adverse food security impacts of these events are discussed in more detail below. The 2008 Food Price Crisis As discussed in Section 2.2, Haiti imports about half of its food needs. Because households depend heavily on market purchases to source their food, even in rural areas, the country is particularly vulnerable to international market price fluctuations. In 2008, global food and fuel prices reached record levels, causing significant increases in food prices (especially for imported foods) on the Haitian market. For imported rice alone, prices increased more than 150 percent above average prices for 2005–2007 (Figure 4). These increases led to violent demonstrations against rising costs and the perceived lack of GOH engagement to manage and ultimately quell the precipitously rising cost of living. This particular shock coincided with and was compounded by a series of hurricanes, which struck the country during the 2008 hurricane season, negatively affecting local agricultural production levels and increasing prices for locally produced foods as well. (For more information, see the next subsection, The 2008 Tropical Storms and Hurricanes). While prices peaked in July–September 2008 and began to drop in October, stabilizing by early 2009, they remained about 40 percent higher than the 2005–2007 average. Current prices still remain higher than these average levels. As such, households not only had to deal with the price spike, but had to adapt to new, more costly “normal” prices after the crisis had ended. CNSA and WFP evaluated the impact of spiking food prices on food security in the poor, densely populated areas of Port-au-Prince and its environs in November 2008140 and concluded the following.
· High food prices caused a decrease in household food consumption and dietary diversity across livelihoods, with certain livelihoods feeling these negative impacts more acutely (e.g., small retailers saw a loss of income from decreased demand for commodities).
· Households attempted to offset price increases by consuming less expensive cereals (e.g., breadfruit instead of rice) and reducing consumption of meat and beans.
140 CNSA. 2008. “Haïti: Impact de la crise alimentaire sur les populations urbaines de Port-Au-Prince.” Accessed on September 9, 2011. http://cnsahaiti.org/Enquete/Haiti_HighFoodPrices_FR%20%282%29.pdf.
Haiti Prospective Food Security Assessment
25
· The poorest households reported pulling children out of school to focus expenditures on food and other basic needs.
The 2008 Tropical Storms and Hurricanes Haiti experienced an especially active hurricane season in 2008, with a combination of four tropical storms and hurricanes affecting the country in less than 1 month: Fay (August 16), Gustav (August 26), Hanna (September 2–3), and Ike (September 8). The Post-Disaster Needs Assessment (PDNA) following these storms estimated that they directly affected approximately 800,000 people, including a combined total of 793 deaths, 548 injuries, and 310 disappearances.141 The PDNA further estimated total damages and losses from the storms at approximately US$900 million, roughly 14.6 percent of Haiti’s GDP. The storms’ strong winds, heavy rains, and subsequent flooding and landslides damaged or destroyed infrastructure (e.g., roads, bridges, power lines, and residential and public buildings) and food crops that were approaching harvest across the country. Indeed, USAID estimated that these storms damaged or destroyed more than 65 percent of the country’s arable land and nearly the entirety of that season’s crop harvests.142 Crop damages were particularly acute in the Artibonite Valley, the country’s principal rice-growing region. Given the impacts of the storms, combined with peaking food and fuel prices attributable to the 2008 food price crisis and the ensuing political turmoil, Haiti’s economy slowed in 2008, and many households’ livelihoods were negatively affected. In particular, Haiti’s agriculture sector, which accounts for about 25 percent of the country’s GDP, experienced a negative growth rate of 7.4 percent.143 In addition to reduced availability of and access to food, peripheral food security impacts from the 2008 tropical storms and hurricanes included decreased school attendance (due to damage/destruction of infrastructure and household economic constraints); deteriorated hygiene conditions (due to damaged/destroyed infrastructure and contaminated water sources); declines in nutritional status among children (due to increased levels of food insecurity, poor water and sanitation conditions, and decreased access to health facilities resulting from damaged/destroyed infrastructure and household economic constraints); and increased displacement of populations who lost their homes to winds, flooding, and landslides. The concurrent food price crisis, which had already begun to erode available household resources prior to these storms, exacerbated their negative impacts, as continued high food prices following the succession of tropical storms and hurricanes impeded household recovery capacity. The 2010 Earthquake On the afternoon of January 12, 2010, an earthquake of magnitude 7.3 on the Richter scale–—the most powerful earthquake to hit Haiti in 200 years—shook the country for 35 seconds. The hypocenter was close to the surface, and its epicenter was near to the town of Léogâne, about 17 km southwest of Port-au-Prince. Eighty percent of Léogâne was destroyed in the event and its aftershocks, and the Port-au-Prince metropolitan area suffered severe damage.144 The total assessed damages/losses from the earthquake were estimated at US$7.8 billion, slightly more than Haiti’s GDP in 2009. Current food security conditions in the country are closely linked to the impacts of this event, not only in the directly affected areas, but also in the rest of the country, which suffered the indirect economic effects of the shock (e.g., disrupted market flows, dramatically weakened central government function, the out-migration of large numbers of people from directly affected areas). These indirect effects strained the resources of households and communities hosting populations displaced by
141 These numbers, as well as much of the information in this section, were taken from MPCE (2008). “Rapport d’évaluation des besoins après désastre: Cyclones Fay, Gustav, Hanna, et Ike.” Accessed on September 9, 2011. http://gfdrr.org/docs/Haiti_PDNA_2008.pdf. 142 USAID. 2010. 143 Ibid. 144 GOH. 2010b. “Haiti Earthquake PDNA: Assessment of damage, losses, general and sectoral needs: Annex to the Action Plan for National Recovery and Development of Haiti.” Accessed on September 9, 2011. http://www.refondation.ht/resources/PDNA_Working_Document.pdf.
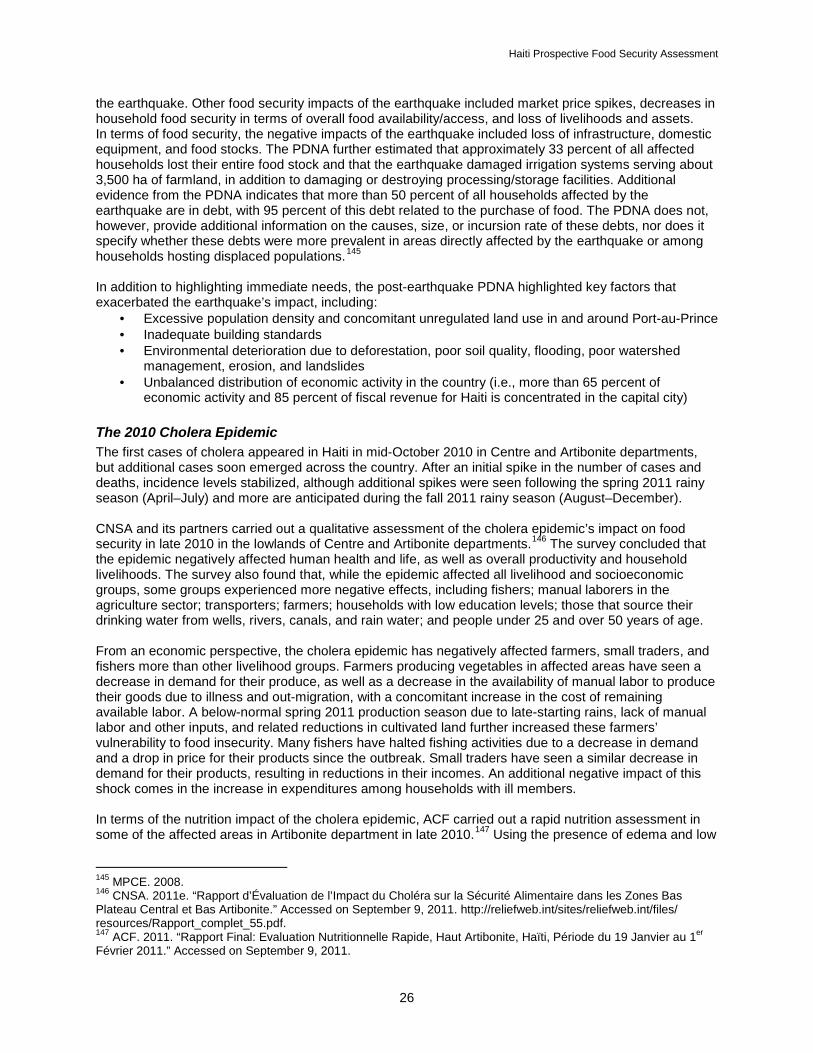
Haiti Prospective Food Security Assessment
26
the earthquake. Other food security impacts of the earthquake included market price spikes, decreases in household food security in terms of overall food availability/access, and loss of livelihoods and assets. In terms of food security, the negative impacts of the earthquake included loss of infrastructure, domestic equipment, and food stocks. The PDNA further estimated that approximately 33 percent of all affected households lost their entire food stock and that the earthquake damaged irrigation systems serving about 3,500 ha of farmland, in addition to damaging or destroying processing/storage facilities. Additional evidence from the PDNA indicates that more than 50 percent of all households affected by the earthquake are in debt, with 95 percent of this debt related to the purchase of food. The PDNA does not, however, provide additional information on the causes, size, or incursion rate of these debts, nor does it specify whether these debts were more prevalent in areas directly affected by the earthquake or among households hosting displaced populations.145 In addition to highlighting immediate needs, the post-earthquake PDNA highlighted key factors that exacerbated the earthquake’s impact, including:
· Excessive population density and concomitant unregulated land use in and around Port-au-Prince · Inadequate building standards · Environmental deterioration due to deforestation, poor soil quality, flooding, poor watershed
management, erosion, and landslides · Unbalanced distribution of economic activity in the country (i.e., more than 65 percent of
economic activity and 85 percent of fiscal revenue for Haiti is concentrated in the capital city) The 2010 Cholera Epidemic The first cases of cholera appeared in Haiti in mid-October 2010 in Centre and Artibonite departments, but additional cases soon emerged across the country. After an initial spike in the number of cases and deaths, incidence levels stabilized, although additional spikes were seen following the spring 2011 rainy season (April–July) and more are anticipated during the fall 2011 rainy season (August–December). CNSA and its partners carried out a qualitative assessment of the cholera epidemic’s impact on food security in late 2010 in the lowlands of Centre and Artibonite departments.146 The survey concluded that the epidemic negatively affected human health and life, as well as overall productivity and household livelihoods. The survey also found that, while the epidemic affected all livelihood and socioeconomic groups, some groups experienced more negative effects, including fishers; manual laborers in the agriculture sector; transporters; farmers; households with low education levels; those that source their drinking water from wells, rivers, canals, and rain water; and people under 25 and over 50 years of age. From an economic perspective, the cholera epidemic has negatively affected farmers, small traders, and fishers more than other livelihood groups. Farmers producing vegetables in affected areas have seen a decrease in demand for their produce, as well as a decrease in the availability of manual labor to produce their goods due to illness and out-migration, with a concomitant increase in the cost of remaining available labor. A below-normal spring 2011 production season due to late-starting rains, lack of manual labor and other inputs, and related reductions in cultivated land further increased these farmers’ vulnerability to food insecurity. Many fishers have halted fishing activities due to a decrease in demand and a drop in price for their products since the outbreak. Small traders have seen a similar decrease in demand for their products, resulting in reductions in their incomes. An additional negative impact of this shock comes in the increase in expenditures among households with ill members. In terms of the nutrition impact of the cholera epidemic, ACF carried out a rapid nutrition assessment in some of the affected areas in Artibonite department in late 2010.147 Using the presence of edema and low
145 MPCE. 2008. 146 CNSA. 2011e. “Rapport d’Évaluation de l’Impact du Choléra sur la Sécurité Alimentaire dans les Zones Bas Plateau Central et Bas Artibonite.” Accessed on September 9, 2011. http://reliefweb.int/sites/reliefweb.int/files/ resources/Rapport_complet_55.pdf. 147 ACF. 2011. “Rapport Final: Evaluation Nutritionnelle Rapide, Haut Artibonite, Haïti, Période du 19 Janvier au 1er Février 2011.” Accessed on September 9, 2011.
Haiti Prospective Food Security Assessment
27
MUAC (< 125 mm), the assessment found a prevalence of GAM among children 6–59 months of age of 3.0 percent, with an additional 10.5 percent of children in this age group at risk of acute malnutrition (MUAC 125–135 mm).148 These data indicate that the cholera epidemic did not lead to further declines in the overall nutritional status of children in the assessed area compared to the surveyed malnutrition prevalence in May 2010, prior to the cholera outbreak. The 2010 Hurricane Hurricane Tomas struck Haiti in November 2010. While the CNSA’s and its partners’ post-hurricane assessments indicated the overall food security impacts of this hurricane on the fishing and agriculture sectors and loss of life from the storm were less than in other tropical storm events over this assessment’s reference period, loss of agricultural production (Figure 10) and fishing outputs was significant in localized areas. The negative impacts of Hurricane Tomas had important consequences for the livelihoods and overall food security of locally affected populations.149 For example, livestock losses from Tomas were evident, primarily in the departments of Sud, Grand’Anse, Nord-Ouest, and Artibonite, with additional smaller but meaningful losses in the departments of Sud-Est and Ouest. Many areas of the country also lost soil along riverbanks due to flooding from the storm, which negatively affected soil fertility, led to loss of farmland, and further destabilized the country’s physical environment. Figure 10. Crop Loss in Hectares in Communes Most Affected by Hurricane Tomas in Haiti, 2010
Source: Ministry of Agriculture, Natural Resources, and Rural Development (MARNDR) and CNSA. 2010a.
http://haiti.humanitarianresponse.info/LinkClick.aspx?link=Nutrition+Cluster%2fRF+d%27%C3%A9valuation+ nutritionnelle+Haut+Artibonite_Janv+2011_ACF_RF.pdf&tabid=80&mid=1249. 148 Mother and Child Health and Education Trust. 2011. “Early Detection and Referral of Children with Malnutrition.” Accessed on November 9, 2011. http://motherchildnutrition.org/early-malnutrition-detection/detection-referral-children-with-acute-malnutrition/interpretation-of-muac-indicators.html. 149 Ministry of Agriculture, Natural Resources, and Rural Development (MARNDR) and CNSA. 2010a. “Rapport d’Évaluation des Dégâts de l’Ouragan Tomas dans le Secteur Agricole et de Pêche.” Accessed on September 9, 2011. http://cnsahaiti.org/Enquete/EvaluationFinale_Thomas.pdf.
Haiti Prospective Food Security Assessment
28
The 2010–11 Presidential and Legislative Elections and Subsequent Impasse The Haitian general election, to select the president, 10 senators, and all 99 deputies, was originally scheduled for February 2010, but was postponed to November 2010 due to the January earthquake. This election was the third democratic election in Haitian history. Following initial voting and the announcement of a runoff between Jude Célestin and Mirlande Manigat for president, allegations of electoral fraud and corruption led to civil unrest that disrupted markets and ongoing earthquake recovery efforts. With pressure from internal and external entities, Jude Célestin dropped out of the race, leaving a runoff between Michel Martelly and Mirlande Manigat, which Martelly won. Martelly was sworn in as president in May 2011 and has since faced significant challenges in establishing a unified government, with his Prime Minister and Cabinet having been sworn in only in October 2011. This lag in establishment of the country’s new government has limited the overall effectiveness of the GOH and slowed investments in large-scale recovery efforts in the country. For example, the slow formation and installation of the new government following Martelly’s inauguration reduced and in some cases halted important government programs, such as educational and agricultural subsidies. The slow installation of a unified government has also stalled long-term job creation efforts (the unemployment rate for the active labor force is estimated at 60 percent) and led to perceptions of instability in the country’s economy and politics, which are unfavorable for international investment.150 The Martelly administration’s slow transition also led to a slowing in donor commitments, which finance as much as 60 percent of the national budget.151 Protests related to the government transition, especially those in metropolitan areas such as Port-au-Prince, often disrupted the work day, causing loss of labor and decreases in revenue, particularly for poor households. GOH line ministries and the Interim Haiti Recovery Commission (IHRC), through partnerships with bi- and multilateral organizations, the U.N., nongovernmental organizations (NGOs), and the private sector, have, however, continued to develop integrated recovery and reconstruction strategies and plans during this transition period. While lack of economic growth and political stability in Haiti are often assumed, they continue to stall the country’s food security and broader development efforts. For example, a 2007 IMF working paper comparing economic growth in the Dominican Republic and Haiti152 posits that politics and policy decisions have played a key role in the (tripled) growth (i.e., per capita real GDP) of the Dominican Republic between 1960 and 2005 and the (halved) growth (i.e., per capita real GDP) of Haiti during the same period. The paper states that Haiti has faced much more political instability than has the rest of Latin America (Figure 11), with rapid successions of democratically elected regimes and/or increased authoritarianism among elected leaders over time. Between 1986 and 1990 alone, Haiti saw six different heads of state, with another nine across the 1990s. With this lack of stability in political leadership comes frequent changes in policy priorities and a general lack of trust that Haiti can offer a relatively stable investment climate.
150 FEWS NET. 2011a. 151 Ibid. 152 Jaramillo, Laura and Sancak, Cemile. 2007. “Growth in the Dominican Republic and Haiti: Why has the Grass Been Greener on One Side of Hispaniola.” Accessed on October 19, 2011. http://www.imf.org/external/pubs/ft/wp/ 2007/wp0763.pdf.

Haiti Prospective Food Security Assessment
29
Figure 11. Relative Political Instability as a Result of Regime Changes in Latin America, 1997–2003
Note: In this figure, higher numbers indicate more political instability. Source: Jaramillo and Sancak. 2007. Current Agroclimatology After a period of increased food insecurity due to prolonged dryness (as much as 2 months in some locations) at the start of the spring 2011 agricultural season (normally April–June) in much of Haiti’s north and part of the south and excessive rainfall in other areas of the south, food security conditions had somewhat improved across the country at the time of publication of this assessment report with the arrival of harvests of late-planted spring crops. Barring unforeseen shocks (e.g., hurricanes, significant flooding, or higher-than-anticipated levels of cholera), these somewhat improved food security conditions are likely to persist through at least the end of 2011 (Figure 12).153 Figure 12. Seasonal Calendar and Critical Events Timeline for Haiti
Source: Famine Early Warning Systems Network (FEWS NET). 2011a. Though initial spring crop production estimates anticipated a 60 percent production shortfall, favorable production conditions for late-planted spring crops and promising prospects for the fall 2011 production season led the CNSA in September to estimate a total annual production shortfall (inclusive of spring and anticipated fall crop harvests) of less than 10 percent of 2010 production levels. Spring crops typically contribute about 60 percent of total annual production in Haiti. It is worth noting, however, that 2010 production levels were also below normal due to the residual negative impacts (e.g., increased prices for food and non-food items, reduced labor availability, shift in expenditures from productive inputs/activities to primary needs such as food and medicine) of the January 2010 earthquake, the passage of Hurricane Tomas, and the cholera outbreak.
153 FEWS NET. 2011a.

Haiti Prospective Food Security Assessment
30
Figure 13. Forecast Food Security Conditions in Haiti, October–December 2011
Source: FEWS NET. 2011a. Despite this overall forecast improvement, lower production levels and resultant lower levels of local food availability are evident in the Sud-Est, Nord-Ouest, Nord, and Nord-Est departments.154 As harvests from late-planted crops continue through the fall and fall harvests begin (December–March), locally produced commodities are available in most markets and have eased purchasing power stresses on poorer households. 2.4. Determining Haiti’s Most Food Insecure Areas
“[There is an] inherent difficulty in using department-level data in Haiti to inform geographic targeting. Depending on which proxy for availability, access, and utilization is used, one could reasonably
conclude that any of the following face high levels of food insecurity: [Nord, Nord-Ouest, Nord-Est, Sud, Centre, Sud-Est, Grand’Anse, and Nippes]. Such department-level indicators do not capture pockets of food insecurity within each department, and therefore can act as general guidance only. It is imperative that […] implementing partners conduct their own independent needs assessments, market analysis,
and formative research–all at a highly localized level–to fully understand local conditions and the range of appropriate responses.”155
While Haiti’s short-term food security forecast shows relative stability or improvement in conditions in much of the country through at least the end of 2011, the country’s substantial and pervasive physical, economic, and political vulnerabilities regularly jeopardize these stable periods, particularly in the areas of the country at highest risk of food insecurity. While the precise underlying and proximate causes of food insecurity in Haiti vary according to geographic location, livelihood, relative wealth, and other factors, an understanding of the broad trends in and causes and effects of food insecurity in the country can assist in developing a first-order identification of the most food insecure areas. That is, by identifying the areas of the country where the broad factors that underpin food insecurity (i.e., high levels of poverty that limit 154 Ibid. 155 USAID. 2010.
Haiti Prospective Food Security Assessment
31
populations’ capacities to produce their own food or access food produced by others; elevated levels of malnutrition and micronutrient deficiencies, the effects of which compound existing availability and access issues over the short and longer term; high risk of disasters) are most prominent, it is possible to create a first-order identification of the most food insecure areas and those most at risk of food insecurity. Such an approach parallels, albeit at a higher level, one method used to target Title II development program beneficiaries, namely, gathering community-level (or as close a proxy as possible) data and information on income, nutrition, and disaster vulnerability. It is the authors’ intent, however, that the macro-level identification of Haiti’s most food insecure geographic areas presented here serves as the starting point from which potential future Title II Awardees conduct the in-depth area- and population-specific food insecurity analyses necessary to inform effective program design. It will be imperative that future potential Title II development program partners complement this first-level analysis with appropriate formative research and other studies to ultimately understand which populations within these broad geographic areas are the most food insecure and which types of programming can most effectively respond to their food security needs. The recently completed CNSA-led National Food Security Survey (NFSS) provides a useful composite starting point for understanding where in Haiti food insecurity is most prevalent. Preliminary results from the NFSS, carried out in May and June 2011 in 3,557 households across the country,156 indicate overall levels of food insecurity in Haiti have not changed significantly since 2010.157 Specifically, the NFSS found that, according to the scale developed for the survey, about 2.1 percent of the Haitian population is chronically highly food insecure, 6.1 percent is acutely highly food insecure, 37.0 percent is moderately food insecure, 33.7 percent is moderately food secure, and 21.1 percent is highly food secure.158 The NFSS further estimated that populations in rural areas and displaced populations in urban and peri-urban areas experience relatively higher levels of food insecurity. Using a composite of indicators to measure food insecurity,159 the NFSS found the Artibonite and Nord-Ouest departments had the highest overall prevalence of food insecurity, with more than half of the households in these locales experiencing at least moderate food insecurity (Figure 14). The Centre, Sud, and Sud-Est departments fell into the second-highest tier of food insecurity prevalence, with about 40–51 percent of households in these areas facing at least moderate food insecurity (Figure 15).160 The survey further specified that poorer households face relatively higher levels of food insecurity, with
156 CNSA. 2011c. 157 CNSA. 2011d. 158 Ibid. The NFSS’s preliminary results document defines households in each of these levels of food (in)security as:
Chronically highly food insecure households: Households that, for structural reasons (e.g., loss of active household members, chronic illness) possess little or no economic capacity or resilience to meet their food security needs; these households depend largely on external assistance, particularly for their food needs. Acutely highly food insecure households: Households that possess some economic capacity and the possibility of meeting their food security needs, but that do not have a high enough resilience, for nonstructural reasons, to effectively cope with the shocks and fluctuations common to the country (e.g., hurricanes, earthquakes, food price fluctuations); the appearance of these shocks often lead to high levels of food insecurity among these households. Moderately food insecure households: Households with insufficient (i.e., lacking in quantity, diversity, or frequency) levels of food consumption due to a lack of resources (e.g., physical resources, market resources, requisite technical skills, access to credit). Moderately food secure households: Households with sufficient levels of food consumption, but with unstable levels of resilience to ensure an ability to productively cope with the shocks and fluctuations common to the country. Highly food secure households: Households with high levels of physical and economic resilience that are able to productively cope with the shocks and fluctuations common to the country.
159 CNSA. 2011c. The NFSS used three indicators to estimate levels of food (in)security in Haiti: a food consumption score (7-day recall); a dietary diversity score (24-hour recall); and hunger levels determined by the frequency with which households/key informants reported being without food, going to bed hungry, or passing an entire day without eating. 160 CNSA. 2011d.

Haiti Prospective Food Security Assessment
32
47.6 percent of very poor households ranked as moderately food insecure and 17.6 percent of very poor households ranked highly food insecure.161
161 Ibid.
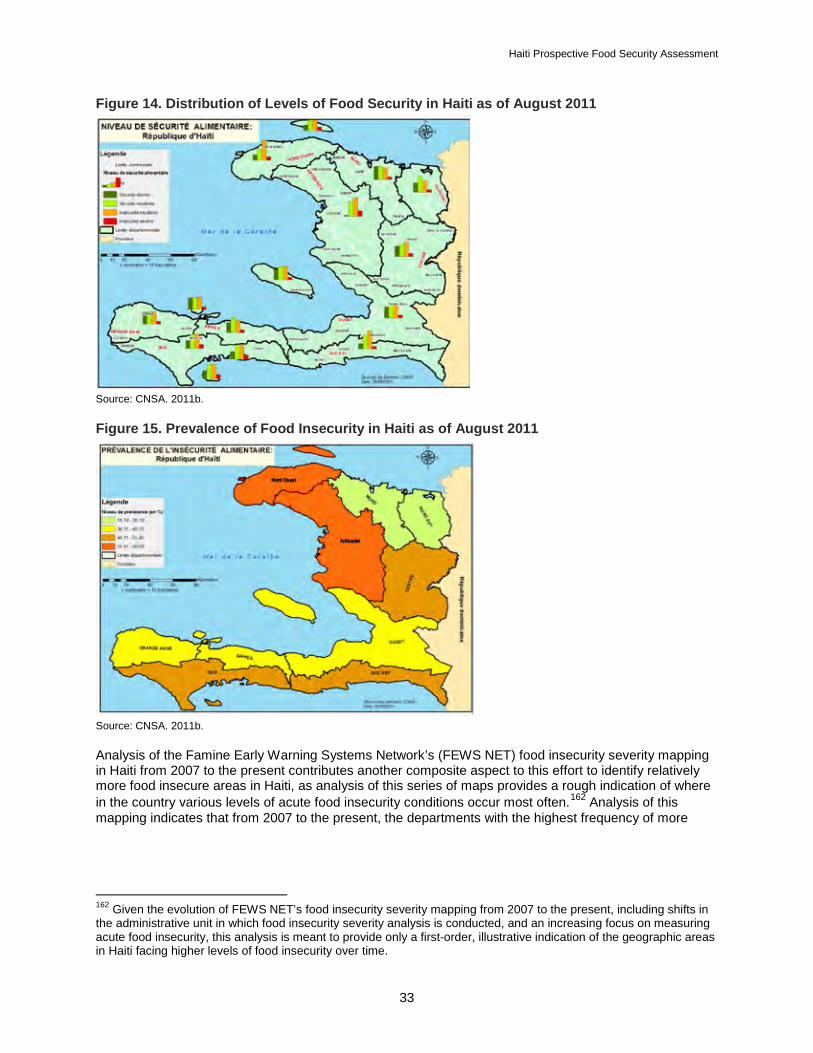
Haiti Prospective Food Security Assessment
33
Figure 14. Distribution of Levels of Food Security in Haiti as of August 2011
Source: CNSA. 2011b. Figure 15. Prevalence of Food Insecurity in Haiti as of August 2011
Source: CNSA. 2011b. Analysis of the Famine Early Warning Systems Network’s (FEWS NET) food insecurity severity mapping in Haiti from 2007 to the present contributes another composite aspect to this effort to identify relatively more food insecure areas in Haiti, as analysis of this series of maps provides a rough indication of where in the country various levels of acute food insecurity conditions occur most often.162 Analysis of this mapping indicates that from 2007 to the present, the departments with the highest frequency of more
162 Given the evolution of FEWS NET’s food insecurity severity mapping from 2007 to the present, including shifts in the administrative unit in which food insecurity severity analysis is conducted, and an increasing focus on measuring acute food insecurity, this analysis is meant to provide only a first-order, illustrative indication of the geographic areas in Haiti facing higher levels of food insecurity over time.
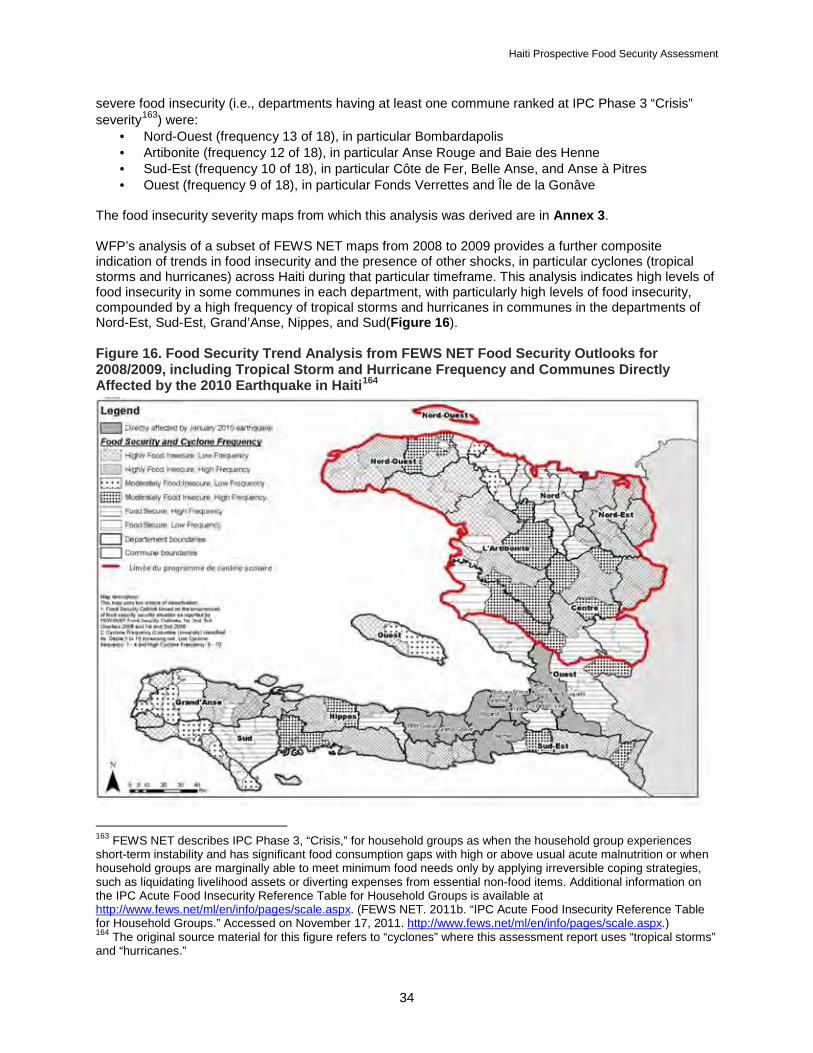
Haiti Prospective Food Security Assessment
34
severe food insecurity (i.e., departments having at least one commune ranked at IPC Phase 3 “Crisis” severity163) were:
· Nord-Ouest (frequency 13 of 18), in particular Bombardapolis · Artibonite (frequency 12 of 18), in particular Anse Rouge and Baie des Henne · Sud-Est (frequency 10 of 18), in particular Côte de Fer, Belle Anse, and Anse à Pitres · Ouest (frequency 9 of 18), in particular Fonds Verrettes and Île de la Gonâve
The food insecurity severity maps from which this analysis was derived are in Annex 3. WFP’s analysis of a subset of FEWS NET maps from 2008 to 2009 provides a further composite indication of trends in food insecurity and the presence of other shocks, in particular cyclones (tropical storms and hurricanes) across Haiti during that particular timeframe. This analysis indicates high levels of food insecurity in some communes in each department, with particularly high levels of food insecurity, compounded by a high frequency of tropical storms and hurricanes in communes in the departments of Nord-Est, Sud-Est, Grand’Anse, Nippes, and Sud(Figure 16). Figure 16. Food Security Trend Analysis from FEWS NET Food Security Outlooks for 2008/2009, including Tropical Storm and Hurricane Frequency and Communes Directly Affected by the 2010 Earthquake in Haiti164
163 FEWS NET describes IPC Phase 3, “Crisis,” for household groups as when the household group experiences short-term instability and has significant food consumption gaps with high or above usual acute malnutrition or when household groups are marginally able to meet minimum food needs only by applying irreversible coping strategies, such as liquidating livelihood assets or diverting expenses from essential non-food items. Additional information on the IPC Acute Food Insecurity Reference Table for Household Groups is available at http://www.fews.net/ml/en/info/pages/scale.aspx. (FEWS NET. 2011b. “IPC Acute Food Insecurity Reference Table for Household Groups.” Accessed on November 17, 2011. http://www.fews.net/ml/en/info/pages/scale.aspx.) 164 The original source material for this figure refers to “cyclones” where this assessment report uses “tropical storms” and “hurricanes.”
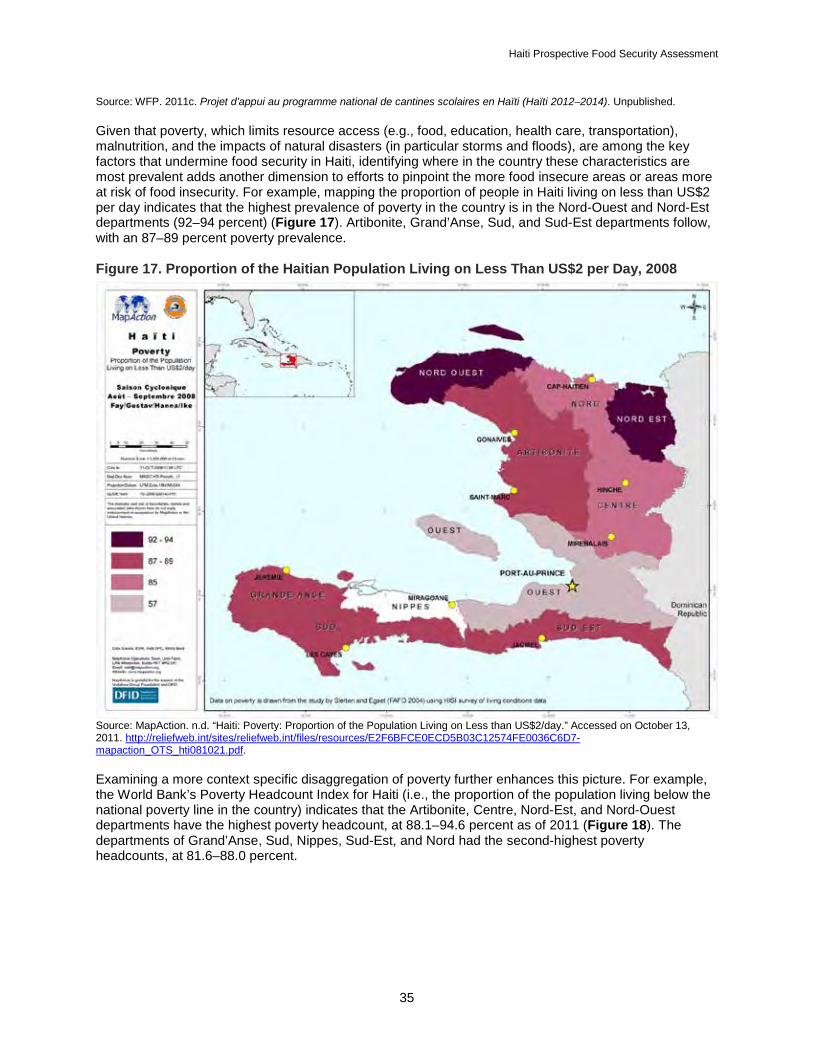
Haiti Prospective Food Security Assessment
35
Source: WFP. 2011c. Projet d’appui au programme national de cantines scolaires en Haïti (Haïti 2012–2014). Unpublished. Given that poverty, which limits resource access (e.g., food, education, health care, transportation), malnutrition, and the impacts of natural disasters (in particular storms and floods), are among the key factors that undermine food security in Haiti, identifying where in the country these characteristics are most prevalent adds another dimension to efforts to pinpoint the more food insecure areas or areas more at risk of food insecurity. For example, mapping the proportion of people in Haiti living on less than US$2 per day indicates that the highest prevalence of poverty in the country is in the Nord-Ouest and Nord-Est departments (92–94 percent) (Figure 17). Artibonite, Grand’Anse, Sud, and Sud-Est departments follow, with an 87–89 percent poverty prevalence. Figure 17. Proportion of the Haitian Population Living on Less Than US$2 per Day, 2008
Source: MapAction. n.d. “Haiti: Poverty: Proportion of the Population Living on Less than US$2/day.” Accessed on October 13, 2011. http://reliefweb.int/sites/reliefweb.int/files/resources/E2F6BFCE0ECD5B03C12574FE0036C6D7-mapaction_OTS_hti081021.pdf. Examining a more context specific disaggregation of poverty further enhances this picture. For example, the World Bank’s Poverty Headcount Index for Haiti (i.e., the proportion of the population living below the national poverty line in the country) indicates that the Artibonite, Centre, Nord-Est, and Nord-Ouest departments have the highest poverty headcount, at 88.1–94.6 percent as of 2011 (Figure 18). The departments of Grand’Anse, Sud, Nippes, Sud-Est, and Nord had the second-highest poverty headcounts, at 81.6–88.0 percent.
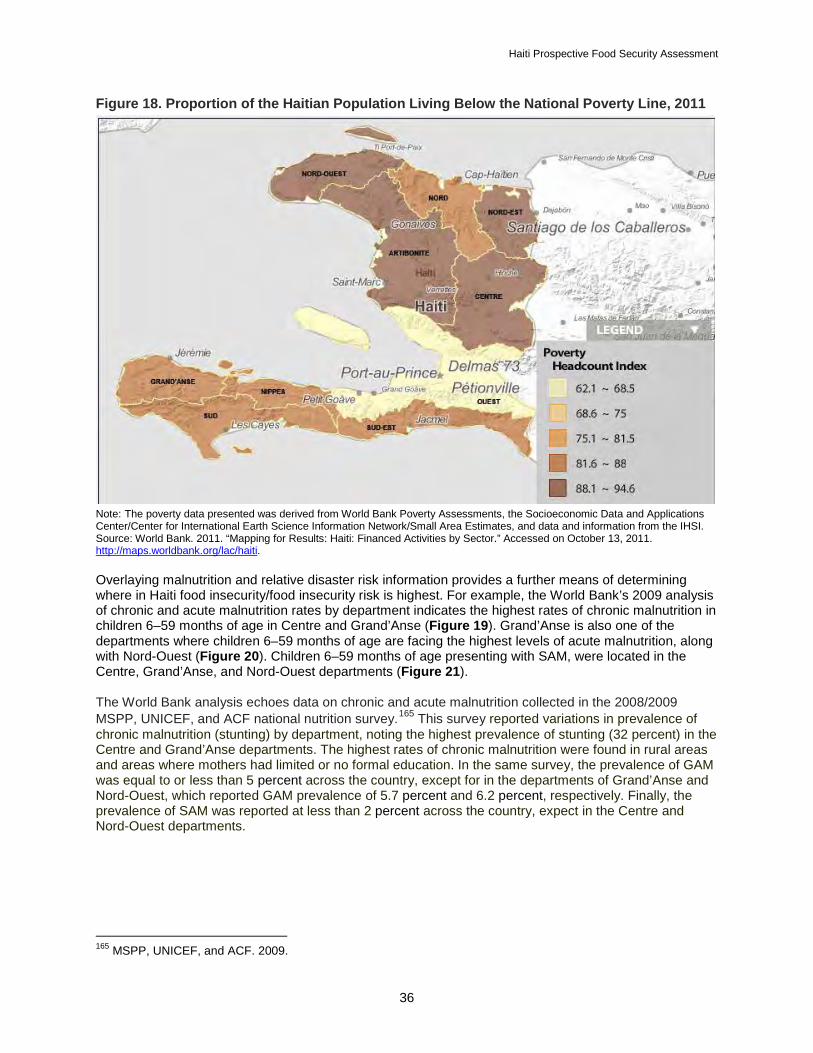
Haiti Prospective Food Security Assessment
36
Figure 18. Proportion of the Haitian Population Living Below the National Poverty Line, 2011
Note: The poverty data presented was derived from World Bank Poverty Assessments, the Socioeconomic Data and Applications Center/Center for International Earth Science Information Network/Small Area Estimates, and data and information from the IHSI. Source: World Bank. 2011. “Mapping for Results: Haiti: Financed Activities by Sector.” Accessed on October 13, 2011. http://maps.worldbank.org/lac/haiti. Overlaying malnutrition and relative disaster risk information provides a further means of determining where in Haiti food insecurity/food insecurity risk is highest. For example, the World Bank’s 2009 analysis of chronic and acute malnutrition rates by department indicates the highest rates of chronic malnutrition in children 6–59 months of age in Centre and Grand’Anse (Figure 19). Grand’Anse is also one of the departments where children 6–59 months of age are facing the highest levels of acute malnutrition, along with Nord-Ouest (Figure 20). Children 6–59 months of age presenting with SAM, were located in the Centre, Grand’Anse, and Nord-Ouest departments (Figure 21). The World Bank analysis echoes data on chronic and acute malnutrition collected in the 2008/2009 MSPP, UNICEF, and ACF national nutrition survey.165 This survey reported variations in prevalence of chronic malnutrition (stunting) by department, noting the highest prevalence of stunting (32 percent) in the Centre and Grand’Anse departments. The highest rates of chronic malnutrition were found in rural areas and areas where mothers had limited or no formal education. In the same survey, the prevalence of GAM was equal to or less than 5 percent across the country, except for in the departments of Grand’Anse and Nord-Ouest, which reported GAM prevalence of 5.7 percent and 6.2 percent, respectively. Finally, the prevalence of SAM was reported at less than 2 percent across the country, expect in the Centre and Nord-Ouest departments.
165 MSPP, UNICEF, and ACF. 2009.
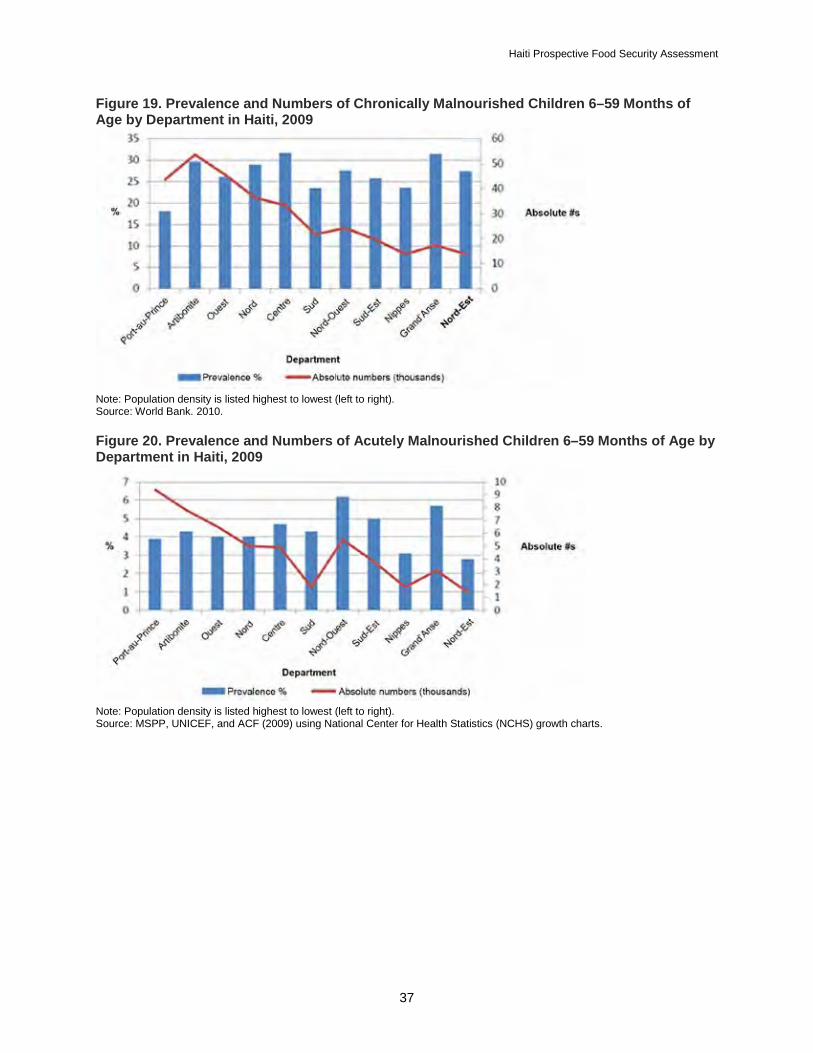
Haiti Prospective Food Security Assessment
37
Figure 19. Prevalence and Numbers of Chronically Malnourished Children 6–59 Months of Age by Department in Haiti, 2009
Note: Population density is listed highest to lowest (left to right). Source: World Bank. 2010. Figure 20. Prevalence and Numbers of Acutely Malnourished Children 6–59 Months of Age by Department in Haiti, 2009
Note: Population density is listed highest to lowest (left to right). Source: MSPP, UNICEF, and ACF (2009) using National Center for Health Statistics (NCHS) growth charts.
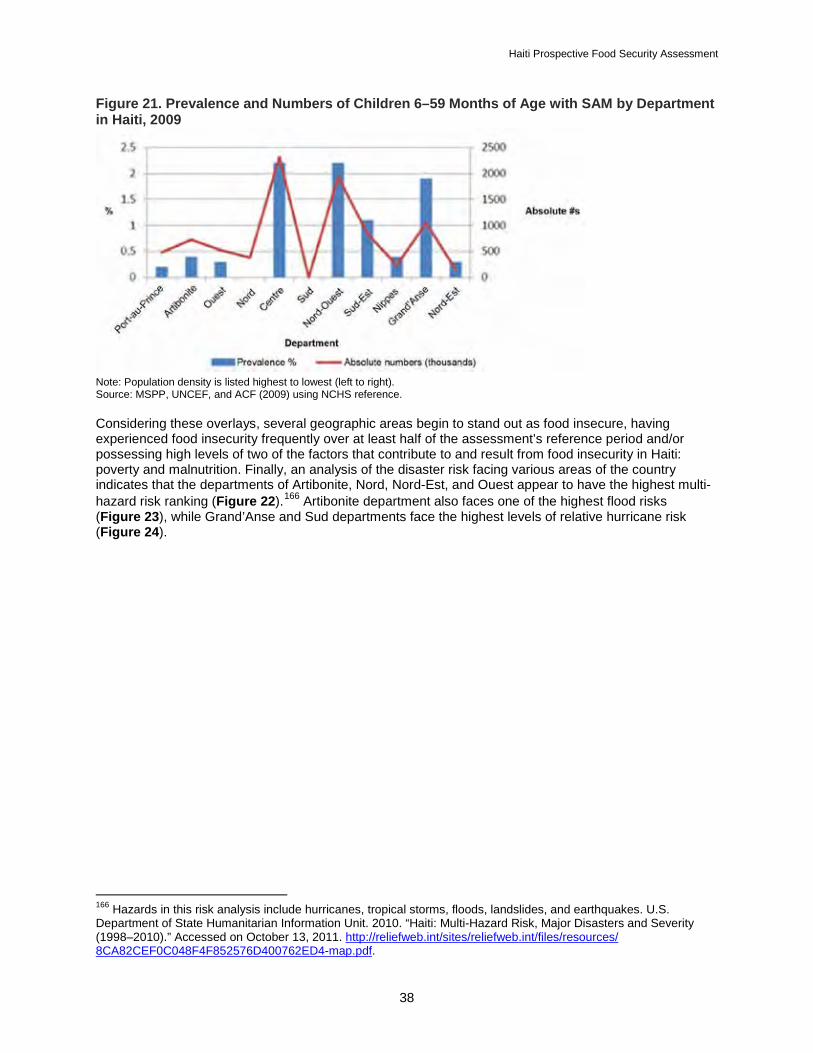
Haiti Prospective Food Security Assessment
38
Figure 21. Prevalence and Numbers of Children 6–59 Months of Age with SAM by Department in Haiti, 2009
Note: Population density is listed highest to lowest (left to right). Source: MSPP, UNCEF, and ACF (2009) using NCHS reference. Considering these overlays, several geographic areas begin to stand out as food insecure, having experienced food insecurity frequently over at least half of the assessment’s reference period and/or possessing high levels of two of the factors that contribute to and result from food insecurity in Haiti: poverty and malnutrition. Finally, an analysis of the disaster risk facing various areas of the country indicates that the departments of Artibonite, Nord, Nord-Est, and Ouest appear to have the highest multi-hazard risk ranking (Figure 22).166 Artibonite department also faces one of the highest flood risks (Figure 23), while Grand’Anse and Sud departments face the highest levels of relative hurricane risk (Figure 24).
166 Hazards in this risk analysis include hurricanes, tropical storms, floods, landslides, and earthquakes. U.S. Department of State Humanitarian Information Unit. 2010. “Haiti: Multi-Hazard Risk, Major Disasters and Severity (1998–2010).” Accessed on October 13, 2011. http://reliefweb.int/sites/reliefweb.int/files/resources/ 8CA82CEF0C048F4F852576D400762ED4-map.pdf.
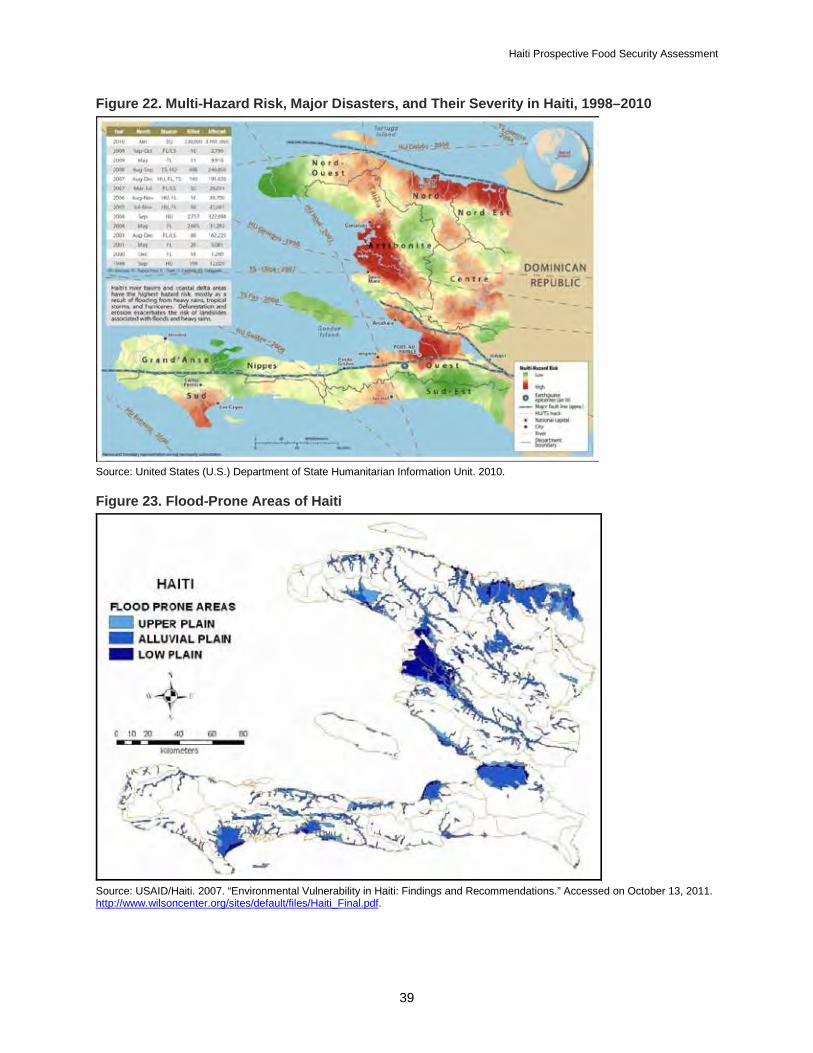
Haiti Prospective Food Security Assessment
39
Figure 22. Multi-Hazard Risk, Major Disasters, and Their Severity in Haiti, 1998–2010
Source: United States (U.S.) Department of State Humanitarian Information Unit. 2010. Figure 23. Flood-Prone Areas of Haiti
Source: USAID/Haiti. 2007. “Environmental Vulnerability in Haiti: Findings and Recommendations.” Accessed on October 13, 2011. http://www.wilsoncenter.org/sites/default/files/Haiti_Final.pdf.

Haiti Prospective Food Security Assessment
40
Figure 24. Hurricane Trajectories across Haiti
Source: USAID/Haiti. 2007. This analysis of composite and factor-specific food security indicators shows that levels of food insecurit
y in Haiti appear to be highest overall in the Nord-Ouest and Artibonite departments. High levels of food insecurity are also evident based on composite and factor-specific indicators, in particular, poverty and disaster vulnerability, in the Sud-Est department. Factor-specific food insecurity is also high in the following departments: Grand’Anse (poverty, malnutrition and disaster vulnerability indicators), Centre (poverty and malnutrition indicators) and Sud (poverty and disaster vulnerability indicators).
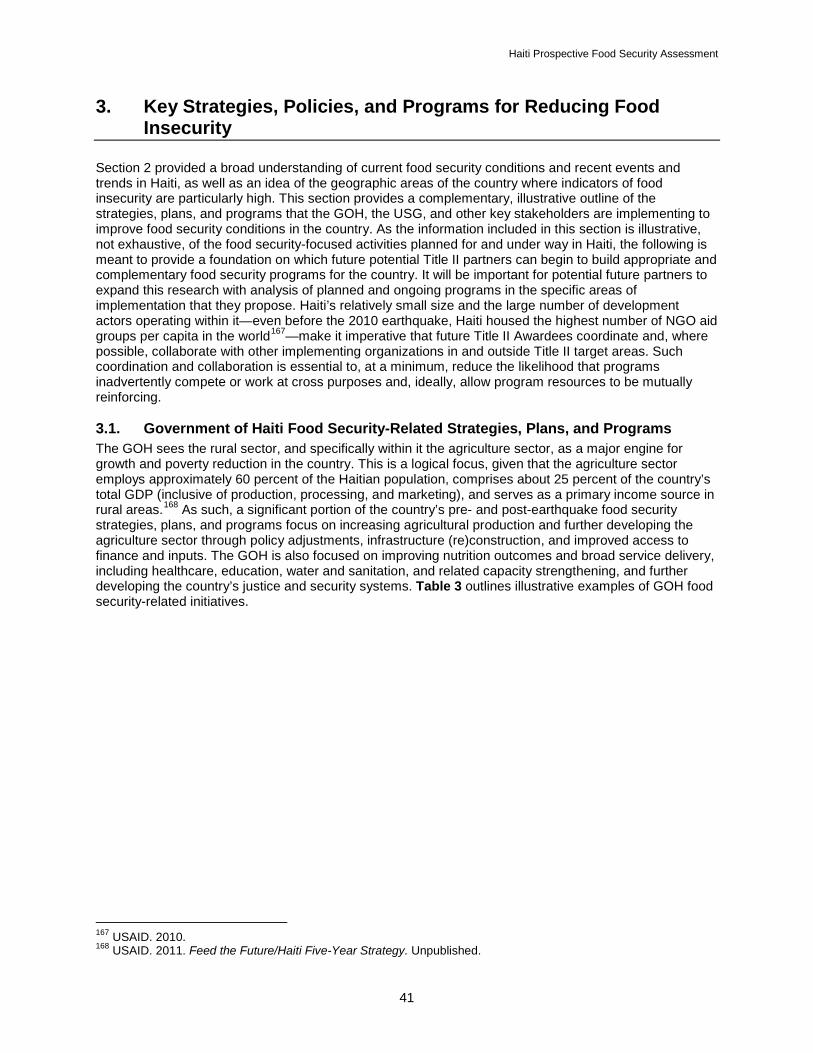
Haiti Prospective Food Security Assessment
41
3. Key Strategies, Policies, and Programs for Reducing Food Insecurity
Section 2 provided a broad understanding of current food security conditions and recent events and trends in Haiti, as well as an idea of the geographic areas of the country where indicators of food insecurity are particularly high. This section provides a complementary, illustrative outline of the strategies, plans, and programs that the GOH, the USG, and other key stakeholders are implementing to improve food security conditions in the country. As the information included in this section is illustrative, not exhaustive, of the food security-focused activities planned for and under way in Haiti, the following is meant to provide a foundation on which future potential Title II partners can begin to build appropriate and complementary food security programs for the country. It will be important for potential future partners to expand this research with analysis of planned and ongoing programs in the specific areas of implementation that they propose. Haiti’s relatively small size and the large number of development actors operating within it—even before the 2010 earthquake, Haiti housed the highest number of NGO aid groups per capita in the world167—make it imperative that future Title II Awardees coordinate and, where possible, collaborate with other implementing organizations in and outside Title II target areas. Such coordination and collaboration is essential to, at a minimum, reduce the likelihood that programs inadvertently compete or work at cross purposes and, ideally, allow program resources to be mutually reinforcing. 3.1. Government of Haiti Food Security-Related Strategies, Plans, and Programs The GOH sees the rural sector, and specifically within it the agriculture sector, as a major engine for growth and poverty reduction in the country. This is a logical focus, given that the agriculture sector employs approximately 60 percent of the Haitian population, comprises about 25 percent of the country’s total GDP (inclusive of production, processing, and marketing), and serves as a primary income source in rural areas.168 As such, a significant portion of the country’s pre- and post-earthquake food security strategies, plans, and programs focus on increasing agricultural production and further developing the agriculture sector through policy adjustments, infrastructure (re)construction, and improved access to finance and inputs. The GOH is also focused on improving nutrition outcomes and broad service delivery, including healthcare, education, water and sanitation, and related capacity strengthening, and further developing the country’s justice and security systems. Table 3 outlines illustrative examples of GOH food security-related initiatives.
167 USAID. 2010. 168 USAID. 2011. Feed the Future/Haiti Five-Year Strategy. Unpublished.
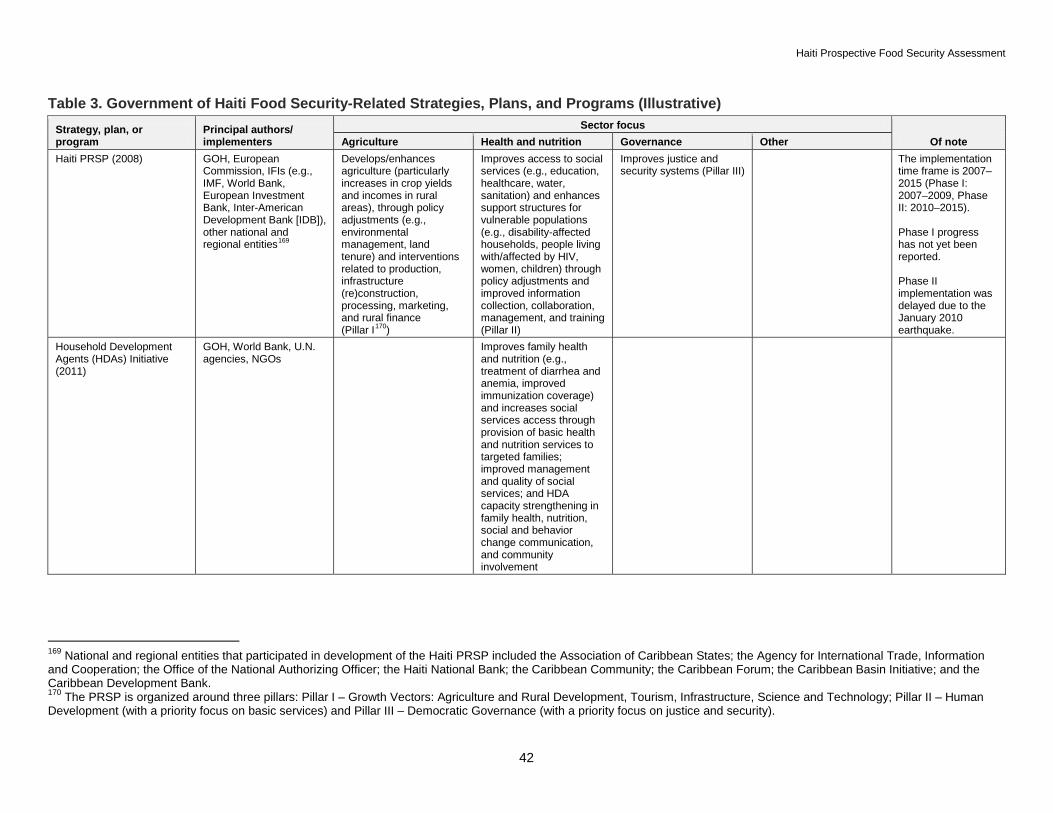
Haiti Prospective Food Security Assessment
42
Table 3. Government of Haiti Food Security-Related Strategies, Plans, and Programs (Illustrative) Strategy, plan, or program
Principal authors/ implementers
Sector focus Of note Agriculture Health and nutrition Governance Other
Haiti PRSP (2008) GOH, European Commission, IFIs (e.g., IMF, World Bank, European Investment Bank, Inter-American Development Bank [IDB]), other national and regional entities169
Develops/enhances agriculture (particularly increases in crop yields and incomes in rural areas), through policy adjustments (e.g., environmental management, land tenure) and interventions related to production, infrastructure (re)construction, processing, marketing, and rural finance (Pillar I170)
Improves access to social services (e.g., education, healthcare, water, sanitation) and enhances support structures for vulnerable populations (e.g., disability-affected households, people living with/affected by HIV, women, children) through policy adjustments and improved information collection, collaboration, management, and training (Pillar II)
Improves justice and security systems (Pillar III)
The implementation time frame is 2007–2015 (Phase I: 2007–2009, Phase II: 2010–2015). Phase I progress has not yet been reported. Phase II implementation was delayed due to the January 2010 earthquake.
Household Development Agents (HDAs) Initiative (2011)
GOH, World Bank, U.N. agencies, NGOs
Improves family health and nutrition (e.g., treatment of diarrhea and anemia, improved immunization coverage) and increases social services access through provision of basic health and nutrition services to targeted families; improved management and quality of social services; and HDA capacity strengthening in family health, nutrition, social and behavior change communication, and community involvement
169 National and regional entities that participated in development of the Haiti PRSP included the Association of Caribbean States; the Agency for International Trade, Information and Cooperation; the Office of the National Authorizing Officer; the Haiti National Bank; the Caribbean Community; the Caribbean Forum; the Caribbean Basin Initiative; and the Caribbean Development Bank. 170 The PRSP is organized around three pillars: Pillar I – Growth Vectors: Agriculture and Rural Development, Tourism, Infrastructure, Science and Technology; Pillar II – Human Development (with a priority focus on basic services) and Pillar III – Democratic Governance (with a priority focus on justice and security).
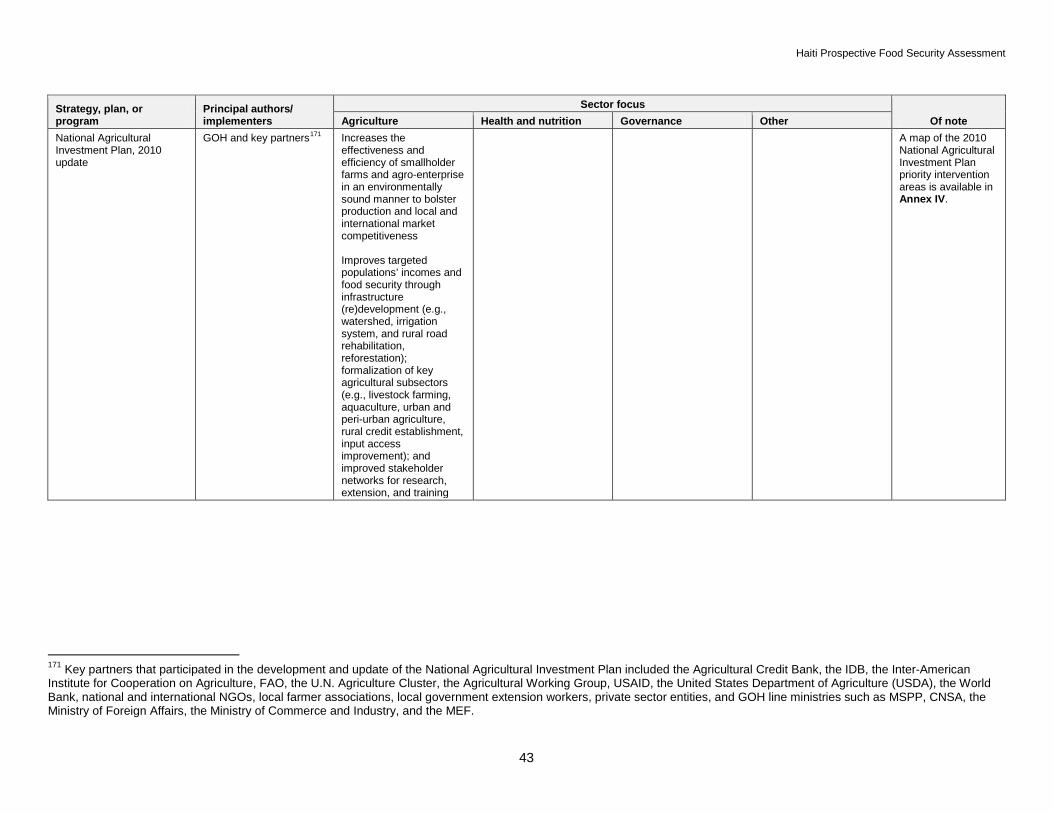
Haiti Prospective Food Security Assessment
43
Strategy, plan, or program
Principal authors/ implementers
Sector focus Of note Agriculture Health and nutrition Governance Other
National Agricultural Investment Plan, 2010 update
GOH and key partners171 Increases the effectiveness and efficiency of smallholder farms and agro-enterprise in an environmentally sound manner to bolster production and local and international market competitiveness Improves targeted populations’ incomes and food security through infrastructure (re)development (e.g., watershed, irrigation system, and rural road rehabilitation, reforestation); formalization of key agricultural subsectors (e.g., livestock farming, aquaculture, urban and peri-urban agriculture, rural credit establishment, input access improvement); and improved stakeholder networks for research, extension, and training
A map of the 2010 National Agricultural Investment Plan priority intervention areas is available in Annex IV.
171 Key partners that participated in the development and update of the National Agricultural Investment Plan included the Agricultural Credit Bank, the IDB, the Inter-American Institute for Cooperation on Agriculture, FAO, the U.N. Agriculture Cluster, the Agricultural Working Group, USAID, the United States Department of Agriculture (USDA), the World Bank, national and international NGOs, local farmer associations, local government extension workers, private sector entities, and GOH line ministries such as MSPP, CNSA, the Ministry of Foreign Affairs, the Ministry of Commerce and Industry, and the MEF.

Haiti Prospective Food Security Assessment
44
Strategy, plan, or program
Principal authors/ implementers
Sector focus Of note Agriculture Health and nutrition Governance Other
National Nutrition Plan (2010)
GOH and key partners172 Improves growth, development, and nutritional status, particularly for infants and children, through prevention of chronic and acute malnutrition (e.g., promotion of adequate nutrition throughout the lifecycle, prevention of/care for micronutrient deficiencies and malnutrition, food preservation/fortification, micronutrient supplementation, complementary feeding, promotion of safe nutrition and hygiene practices), provision of nutrition support (e.g., treatment of MAM and SAM, respectively; IYCF programming; programming for HIV, tuberculosis, and other chronic diseases), provision of nutrition protection (e.g., emergency preparedness, nutrition support in emergencies), and improved stakeholder coordination
The National Nutrition Plan was formulated based on data from the 2008/2009 national nutrition survey.173
172 Key partners that participated in the development of the National Nutrition Plan included WHO; the Pan-American Health Organization; UNICEF; WFP; FAO; the U.N. Nutrition Cluster; USAID; FEWS NET; World Bank; IDB; national and international NGOs, such as ACF, World Vision, CARE, Catholic Relief Services (CRS), ACDI/VOCA, Terres des Hommes, and Oxfam Great Britain; local government entities; private sectors entities; and other GOH line ministries and departments, such as CNSA and the ministries of Social Affairs, Education, and Agriculture. 173 MSPP, UNICEF, and ACF. 2009.

Haiti Prospective Food Security Assessment
45
Strategy, plan, or program
Principal authors/ implementers
Sector focus Of note Agriculture Health and nutrition Governance Other
Recovery from the 2010 earthquake (2010–present): Action Plan for the National Recovery and Development of Haiti (Action Plan)
GOH and key partners (e.g., U.N. agencies, NGOs, bi- and multilateral donors)
Facilitates agriculture sector recovery through provision of agricultural inputs (e.g., sale at accessible prices) to increase food supplies, (re)construction of rural infrastructure (e.g., water catchments, irrigation networks, roads and job creation to increase incomes and food access), promotion of producer access to credit, and improvement of animal slaughtering and preservation techniques
Improves access to/ quality of primary health care through interventions, including financial assistance for the care of vulnerable populations174 and increased collaboration with the private sector and other stakeholders to strengthen health system infrastructure, monitoring, and reporting Prevents/effectively treats acute malnutrition (e.g., community worker training to identify, treat, and prevent malnutrition)
The post-earthquake PDNA led to creation of the Action Plan. IHRC oversees Action Plan efforts. The Action Plan is to be implemented in two phases over 11 years: Phase I (stabilization) lasting 1 year; Phase II (territorial, economic, social, and institution (re)building) lasting10 years. The Action Plan costs US$11.5 billion: 50% for food/nutrition /agriculture, 17% for infrastructure, 15% for environment, and 15% for risk/disaster management.
Recovery from the 2010 earthquake (2010–present): Interim Haiti Recovery Commission
Supports post-earthquake reconstruction and strategic planning/ coordination implementation Prepares, develops, funds, executes, and is accountable for recovery and reconstruction programs (e.g., issuance of property titles, infrastructure (re)construction)
The IHRC’s creation was proposed in the Action Plan. The IHRC mandate runs through October 2012, after which the Haiti Development Agency, which will be developed under the Action Plan, will oversee reconstruction.
174 For the purposes of this table, vulnerable populations include but are not limited to pregnant and lactating women, children under 5 years of age, the elderly, the disabled, female-headed households, orphans and other vulnerable children, and people living with HIV or other chronic diseases.

Haiti Prospective Food Security Assessment
46
Strategy, plan, or program
Principal authors/ implementers
Sector focus Of note Agriculture Health and nutrition Governance Other
School feeding (2010–present)
The GOH Programme National de Cantines Scolaires (National School Meals Program) with support from WFP and other donors (e.g., Canada, Spain, the United States, Brazil)
Increases primary school enrollment, improves educational quality, and reduces the number of over-aged students in classes175
School feeding was important in stabilizing the education sector post-earthquake. It is envisioned to play an important support role in medium-term sector recovery and is considered a crucial safety net in the Action Plan. School feeding programs target more than 1.5 million children (of an estimated 2.2 million school-aged children) in Haiti.176 School feeding efforts focus on linking with national agricultural production augmentation efforts to facilitate local purchase of commodities and transitioning to a country-owned program by 2030.
175 It is estimated that more than 500,000 primary school-age children are not in school, that only 20 percent of primary school teachers are trained, and that more than 9 percent of children are not promoted to the next grade each year. Education statistics sourced from United Nations Office of the Special Envoy for Haiti. n.d. “Education: Key Statistics (prior to the earthquake in January 2010).” Accessed on September 12, 2011. http://www.haitispecialenvoy.org/about-haiti/education/. 176 WFP. n.d. “Haiti: WFP Activities.” Accessed on September 12, 2011. http://www.wfp.org/countries/Haiti/Operations.

Haiti Prospective Food Security Assessment
47
While the GOH sees agriculture (broad agriculture sector recovery/enhancement) as one of the linchpins of the country’s overall development, implementing this work requires confronting several interrelated challenges, including gender and land tenure. The GOH’s Action Plan for the National Recovery and Development of Haiti (Action Plan)177 emphasizes that women, as the largest contributors to Haiti’s informal economy, should be targeted for and integrated into programs and job-creation activities across sectors. In particular, the Action Plan highlights a need to improve women’s access to basic services, land tenure, and property rights, and to increase their protection against gender-based violence and exploitation. However, improving women’s access to land and enhancing their property rights presents countless challenges. For example, systemic corruption and poor record-keeping practices significantly impede efforts to clearly document land rights in Haiti, irrespective of gender. Prior to the January 2010 earthquake, only about 5 percent of Haiti’s land was estimated to have a legally recognized title.178 Properties often have two or more recognized owners, and in rural communities land ownership is typically informal. The 2010 earthquake exacerbated land tenure issues. For example, at a micro level, Habitat for Humanity reported that because many deaths from the earthquake remain undocumented, heirs have been unable to claim land and rebuild their homes and livelihoods.179 At a macro level, the lack of formal land tenure frameworks for the country’s long-term reconstruction and recovery often discourages landowners from (re)investing in property development. In terms of women’s access to land, ongoing recovery efforts call for special considerations for women regarding land tenure security and, in particular, recognition and enhancement of women’s joint ownership and inheritance rights.180 Traditionally, both men and women can own land in Haiti, and available data indicate that the proportion of male- and female-headed households that gain access to land through inheritance is roughly similar. However, while most farmers have relatively small plots (1.5 ha or less), women tend to have comparatively fewer and smaller plots still, leading to less total female-cultivated land area. This is explained in part by the fact that when not inherited, women often acquire land through small parcel purchases rather than through the parcel sharecropping that most Haitian men practice (Table 4). However, given the relatively high number of female-headed households in Haiti (about 43–44 percent181), the fact that women tend to own less land and cultivate less land area is important for understanding the gendered dynamics of food availability and access in the country. There are only limited data available regarding land security for women who are not the household head; generally, for these women, property rights are closely linked with household position as wife, mother, or placage. As this status changes, these women are subject to loss of land ownership.182 Table 4. Land Holdings and Means of Access by Sex of Head of Household in Haiti Sex of head of household
Landholdings per household Means of access (%) Number of plots
Total area (ha)
Cultivated area (ha) Inherited Purchased Rented
Share-cropped Other
Male 2.16 1.62 1.33 26.30 23.40 7.40 27.70 15.20 Female 1.45 0.82 0.68 24.90 33.30 6.90 17.50 17.50 Total 1.98 1.41 1.17 26.00 25.20 7.30 25.80 15.60
Source: World Bank. 2002. The National Agriculture Investment Plan also recognizes that improving living conditions in rural communities must include gender integration and equity across projects and policies. Specifically, the
177 GOH. 2010a. “Action Plan for the National Recovery and Development of Haiti.” Accessed on September 12, 2011. http://www.haiticonference.org/Haiti_Action_Plan_ENG.pdf. 178 Institute for Justice and Democracy in Haiti. 2010. “Haiti: Land ownership questions hinder reconstruction.” Accessed on November 17, 2011. http://lo-de-alla.org/2010/07/haiti-land-ownership-questions-hinder-reconstruction/. 179 Habitat for Humanity. 2010. “Haiti Policy Report: One year later: Haiti needs a shelter strategy.” Accessed on September 13, 2011. http://www.habitat.org/disaster/pdf/Haiti_Policy_Rpt12.2010.pdf. 180 Ibid. 181 Zanelli, Maria Luisa. 2011. “Haitian Women: The backbone of society and economic life in Haiti.” Accessed on October 25, 2011. http://www.habitat.org/theforum/english/vulnerable/Haitian_Women_the_backbone.aspx. 182 Morris-Hughes, E. 1999. Findings of Exploratory Mission to Haiti. LAC Region Note.
Haiti Prospective Food Security Assessment
48
plan encourages strengthening women’s capacities to participate in agricultural policy formation and increasing their access to loans and microcredit to support agricultural activities. The plan further notes the importance of increasing women’s access to diverse economic activities, as well as preventive and educational initiatives in nutrition, vocational training, girls’ education, and family planning. 3.2. United States Government Food Security-Related Strategies, Plans, and Programs
in Haiti While the USG supports a range of development initiatives in Haiti, its food security-related work centers on increasing the country’s agricultural productivity and overall agriculture sector growth, with the anti-cipated impacts of increasing incomes and expanding households’ food availability, access, and utilization/consumption potential (Table 5). Another significant area of USG food security program focus in Haiti is improving nutrition and overall health outcomes, particularly among the country’s vulnerable populations,183 by improving the quality of the health services delivered. It is anticipated that the majority of the USG’s food security-focused work in Haiti will be carried out in three main development/growth corridors: Port-au-Prince and environs, the area between Port-au-Prince and St. Marc, and northern areas around Cap Haïtien. The USG decision to target the majority of its food security programming resources for Haiti to specific geographic corridors will likely improve the outcomes and impacts of these investments. However, the selection criteria for targeting these areas184 and the concentration on specific populations within them (e.g., 100,000 households on relatively productive plains with facilitated access to land and other inputs) excludes other cohorts of the Haitian population who face similar, and sometimes worse, food security challenges. Given the focus of Title II programs—one of the USG’s major food security programming resources—on reducing food insecurity among vulnerable populations, future Title II development food aid programs in Haiti are well placed to address the food security needs of some of these other food insecure populations. Specifically, future Title II development food aid programming in Haiti offers several layers of complementarity to the USG’s development corridor-focused food security efforts should future Title II programs operate outside of USG development corridors. These include:
· Geographic complementarity. While most of USAID’s food security programming targets assistance to USG development corridors, future Title II development food aid programs can expand the geographic reach of USAID and overall USG assistance in Haiti by implementing activities outside of USG development corridors.
· Population-based complementarity. While USAID’s programming in the USG development corridors targets assistance to populations with relatively more resource access, future Title II development food aid programs will broaden the overall reach of USG resources by assisting the country’s relatively poorer, more food insecure populations.185
· Programmatic complementarity. While USAID’s work in the USG development corridors focuses on improving incomes and food access largely through increased agricultural production and supporting nutrition and environmental management activities, future Title II development food aid programs may have additional, complementary foci that include improving health and nutrition outcomes, supporting food access, and creating risk mitigation/disaster preparedness programs.
183 For the purposes of Table 5, vulnerable populations include but are not limited to pregnant and lactating women, children under 5 years of age, the elderly, the disabled, female-headed households, orphans and other vulnerable children, and people living with HIV or other chronic diseases. 184 According to USAID’s 5-year Feed the Future Strategy for Haiti (USAID/Haiti 2011), development corridor selection criteria include the area’s agricultural potential, nearness to markets, status as a priority MARNDR invest-ment area, population (i.e., potential beneficiary level), whether USAID has previous programming experience there, and whether USAID can align Feed the Future programming with other donor investments in the area. 185 It is anticipated that future Title II development food aid programs will target resources to the poorest, most vulnerable populations outside of USAID’s development corridors. However, should these programs target some populations within the corridors, it will be imperative that future Awardees coordinate closely with counterparts in the corridors to ensure that Title II programming fills a gap and does not duplicate or compromise ongoing programming efforts.

Haiti Prospective Food Security Assessment
49
Table 5. United States Government Food Security-Related Strategies, Plans, and Programs in Haiti (Illustrative)
Strategy, plan, or program
Principal authors/ implementers
Sector focus
Of note Agriculture Health and nutrition Other Post-Earthquake USG Haiti Strategy: Toward Renewal and Economic Opportunity (2010–present) (long-term post-earthquake reconstruction)
U.S. Department of State, USAID, GOH, other donors
Increases incomes and improves household food availability and access through agricultural development, including improved access to inputs; harvesting, storage, and processing practices; and natural resource management (Pillar II186)
Improves health care through the provision of 1) immunizations, 2) programs to prevent/manage child malnutrition and communicable diseases, and 3) activities to support/improve health infrastructure (e.g., building [re]construction, equipment supply, staff training, supply chain and information management) (Pillar III) Investments include core services across the country and comprehensive services in development corridors.187
Enhances GOH capacity to provide public and private sector services, focusing on infrastructure and energy (Pillar I), food and economic security (Pillar II), health and basic services (Pillar III), and governance and rule of law (Pillar IV)
The Strategy emphasizes Haitian-led recovery, targeting three main development corridors and sections of surrounding key watersheds: Port-au-Prince and environs, the area between Port-au-Prince and St. Marc, and northern areas around Cap Haïtien.
Global Hunger and Food Security Initiative and Feed the Future (2009–present)
USAID and other USG agencies
Accelerates agriculture sector growth through increased productivity, expanded markets and trade, and improved economic resilience for about 100,000 households in vulnerable communities188 Initiative activities include increasing agricultural productivity for high-value and staple crops, stabilizing watersheds/enhancing environmental management, strengthening agricultural markets, and adding value post-production (e.g., processing, certification, packaging)
Improve nutrition (i.e., reduce prevalence of underweight children under 5 years of age) in vulnerable communities.189
Feed the Future programming in Haiti is anticipated to operate largely within the three main development corridors of the U.S. Strategy: Port-au-Prince and environs, the area between Port-au-Prince and St. Marc, and the northern areas around Cap Haïtien.
186 The Post-Earthquake USG Haiti Strategy: Toward Renewal and Economic Opportunity (2010–present) (long-term post-earthquake reconstruction) is organized around four pillars: Pillar I – Infrastructure and Energy, Pillar II – Food and Economic Security, Pillar III – Health and Other Basic Services, and Pillar IV – Governance and Rule of Law. U.S. Department of State. 2011. “Post-Earthquake USG Haiti Strategy: Toward Renewal and Economic Opportunity.” Accessed on November 21, 2011. http://www.state.gov/documents/organization/156448.pdf. 187 The specific contents of the core and comprehensive packages had not been determined at the time of this assessment. 188 U.S. Department of State Office of the Haiti Special Coordinator. 2011. “Haiti: One Year Later.” Accessed on September 12, 2011. http://www.state.gov/s/hsc/rls/154255.htm. 189 Ibid.
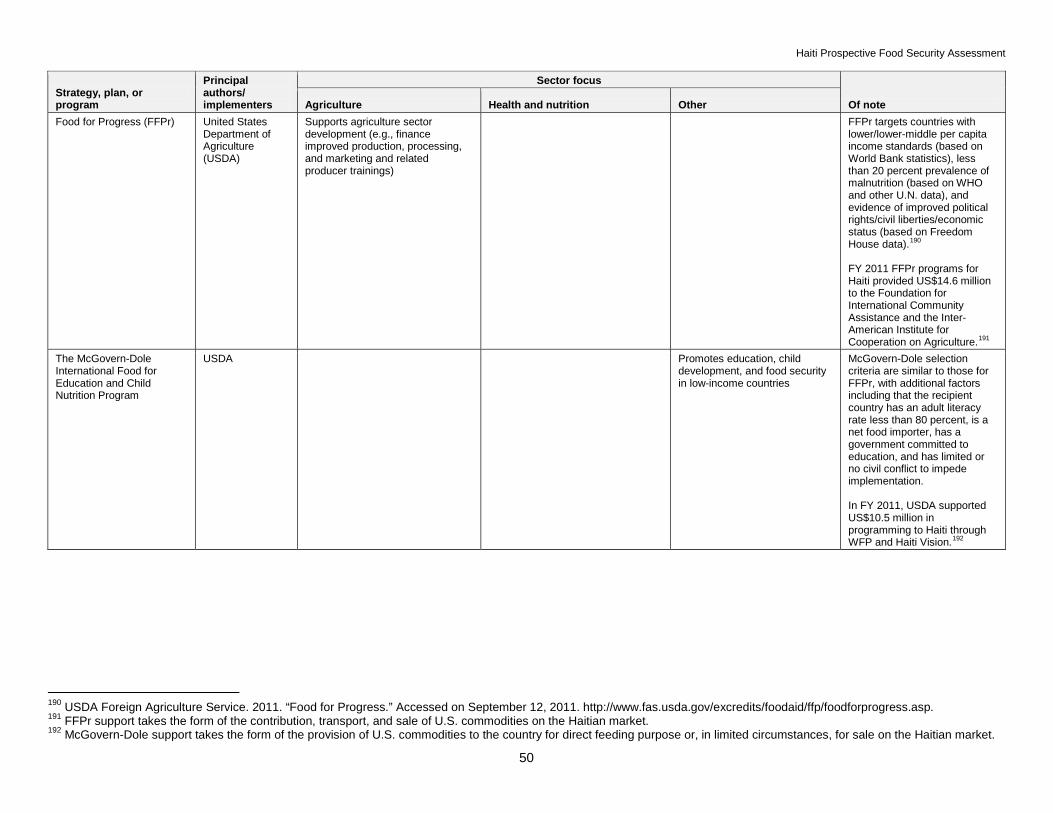
Haiti Prospective Food Security Assessment
50
Strategy, plan, or program
Principal authors/ implementers
Sector focus
Of note Agriculture Health and nutrition Other Food for Progress (FFPr) United States
Department of Agriculture (USDA)
Supports agriculture sector development (e.g., finance improved production, processing, and marketing and related producer trainings)
FFPr targets countries with lower/lower-middle per capita income standards (based on World Bank statistics), less than 20 percent prevalence of malnutrition (based on WHO and other U.N. data), and evidence of improved political rights/civil liberties/economic status (based on Freedom House data).190 FY 2011 FFPr programs for Haiti provided US$14.6 million to the Foundation for International Community Assistance and the Inter-American Institute for Cooperation on Agriculture.191
The McGovern-Dole International Food for Education and Child Nutrition Program
USDA Promotes education, child development, and food security in low-income countries
McGovern-Dole selection criteria are similar to those for FFPr, with additional factors including that the recipient country has an adult literacy rate less than 80 percent, is a net food importer, has a government committed to education, and has limited or no civil conflict to impede implementation. In FY 2011, USDA supported US$10.5 million in programming to Haiti through WFP and Haiti Vision.192
190 USDA Foreign Agriculture Service. 2011. “Food for Progress.” Accessed on September 12, 2011. http://www.fas.usda.gov/excredits/foodaid/ffp/foodforprogress.asp. 191 FFPr support takes the form of the contribution, transport, and sale of U.S. commodities on the Haitian market. 192 McGovern-Dole support takes the form of the provision of U.S. commodities to the country for direct feeding purpose or, in limited circumstances, for sale on the Haitian market.
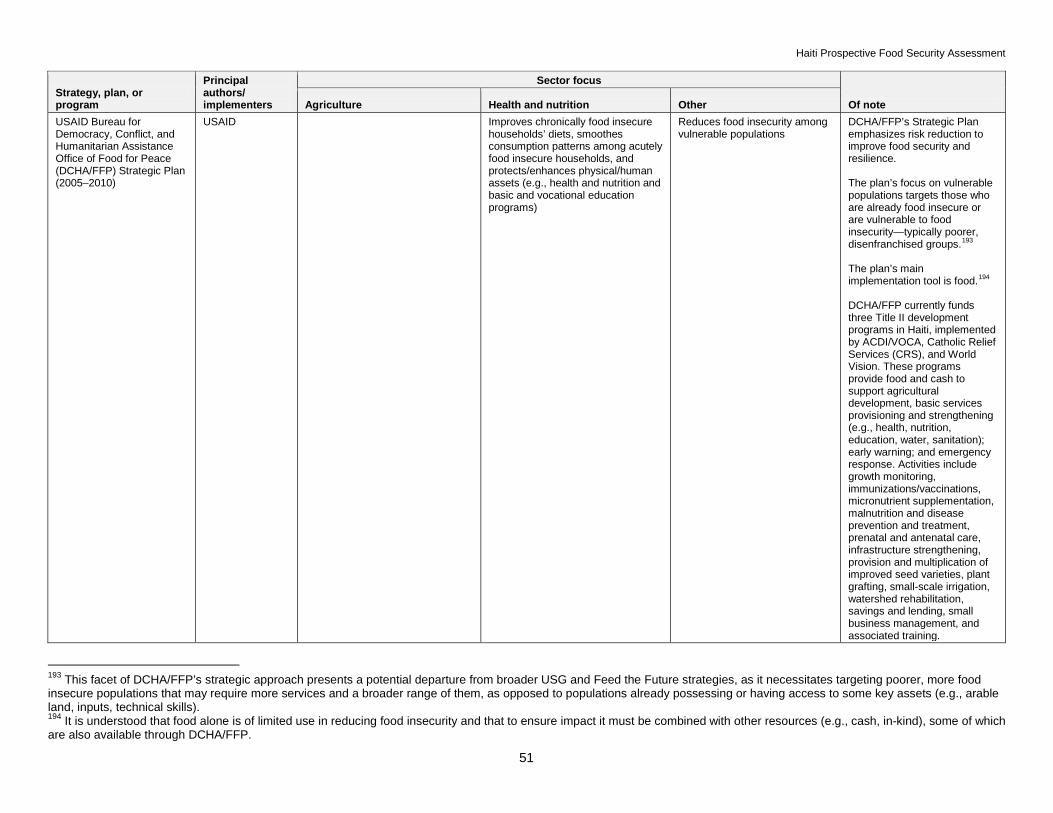
Haiti Prospective Food Security Assessment
51
Strategy, plan, or program
Principal authors/ implementers
Sector focus
Of note Agriculture Health and nutrition Other USAID Bureau for Democracy, Conflict, and Humanitarian Assistance Office of Food for Peace (DCHA/FFP) Strategic Plan (2005–2010)
USAID Improves chronically food insecure households’ diets, smoothes consumption patterns among acutely food insecure households, and protects/enhances physical/human assets (e.g., health and nutrition and basic and vocational education programs)
Reduces food insecurity among vulnerable populations
DCHA/FFP’s Strategic Plan emphasizes risk reduction to improve food security and resilience. The plan’s focus on vulnerable populations targets those who are already food insecure or are vulnerable to food insecurity—typically poorer, disenfranchised groups.193 The plan’s main implementation tool is food.194 DCHA/FFP currently funds three Title II development programs in Haiti, implemented by ACDI/VOCA, Catholic Relief Services (CRS), and World Vision. These programs provide food and cash to support agricultural development, basic services provisioning and strengthening (e.g., health, nutrition, education, water, sanitation); early warning; and emergency response. Activities include growth monitoring, immunizations/vaccinations, micronutrient supplementation, malnutrition and disease prevention and treatment, prenatal and antenatal care, infrastructure strengthening, provision and multiplication of improved seed varieties, plant grafting, small-scale irrigation, watershed rehabilitation, savings and lending, small business management, and associated training.
193 This facet of DCHA/FFP’s strategic approach presents a potential departure from broader USG and Feed the Future strategies, as it necessitates targeting poorer, more food insecure populations that may require more services and a broader range of them, as opposed to populations already possessing or having access to some key assets (e.g., arable land, inputs, technical skills). 194 It is understood that food alone is of limited use in reducing food insecurity and that to ensure impact it must be combined with other resources (e.g., cash, in-kind), some of which are also available through DCHA/FFP.
Haiti Prospective Food Security Assessment
52
3.3. Other Key Stakeholders’ Food Security-Related Strategies, Plans, and Programs in Haiti
Other key stakeholders in Haiti, including the U.N., other donor governments, and IFIs, support and/or implement a range of activities to enhance the country’s food security (Table 6). These include interventions to improve economic infrastructure (e.g., increase agricultural production, other activities that generate income and employment), activities to enhance physical well-being (e.g., improve nutritional status, manage malnutrition caseloads), programs to improve social infrastructure (e.g., direct budget support, capacity strengthening to provide equitable basic social services), and projects to (re)build the country’s physical infrastructure (e.g., earthquake debris removal, [re]construction of transport routes and irrigation systems). As stakeholder interventions vary geographically, it will be important for future Title II Awardees in Haiti to work with the GOH, USG, and other food security counterparts to determine the specific food security activities planned for or underway in the geographic areas where they propose to implement and to ensure they design food security programs that are as complementary as possible to these existing or planned interventions.

Haiti Prospective Food Security Assessment
53
Table 6. Other Key Stakeholders’ Food Security-Related Strategies, Plans, and Programs in Haiti (Illustrative)
Strategy, plan, program, or body
Principal authors/ implementers
Sector focus
Of note Agriculture Health and nutrition Other International Humanitarian Coordination (the U.N. Clusters) (2010–present)
U.N. The Agriculture Cluster: Led by FAO, with MARNDR as a counterpart Post-earthquake activities focus on maintaining food security among affected communities through the provision of agricultural supplies, livestock support, and cash-for-work activities, with a focus on (re)constructing agricultural infrastructure, income generation, and strengthening sector coordination The Cluster also supports agricultural production, employment, and other income-generating opportunities for earthquake-affected households; strengthens household capacity to prepare for and respond to shocks; and enhances national and local basic services provision and food security monitoring capacity
The Nutrition Cluster: Led by UNICEF, with MSPP as a counterpart Activities focus on nutrition assessment and prevention and treatment of malnutrition to decrease morbidity and mortality, particularly among vulnerable groups195 The Cluster also works to enhance disaster preparedness and response capacity, scale up activities to manage acute malnutrition, and decrease micronutrient deficiencies
The Food Aid Cluster: Led by WFP, with CNSA as a counterpart Post-earthquake activities focus on meeting affected populations’ immediate food needs, with a gradual transition to more strategic food interventions (e.g., nutrition, cash-for-work, school feeding) The Cluster also incorporates capacity strengthening activities related to disaster preparedness and resilience building for disaster-prone communities
Immediate responses to the 2010 earthquake focused on life-saving activities, with a gradual shift to early recovery and capacity strengthening against future disasters. U.N. Office for the Coordination of Humanitarian Affairs (OCHA) humanitarian activities for 2011 emphasize creation of durable conditions for return for displaced populations, maintenance of humanitarian assistance where needed, enhanced disaster preparedness and contingency planning, and strengthening community and government capacity.
195 For the purposes of this table, vulnerable groups include but are not limited to pregnant and lactating women, children under 5 years of age, the elderly, the disabled, female-headed households, orphans and other vulnerable children, and people living with HIV or other chronic diseases.
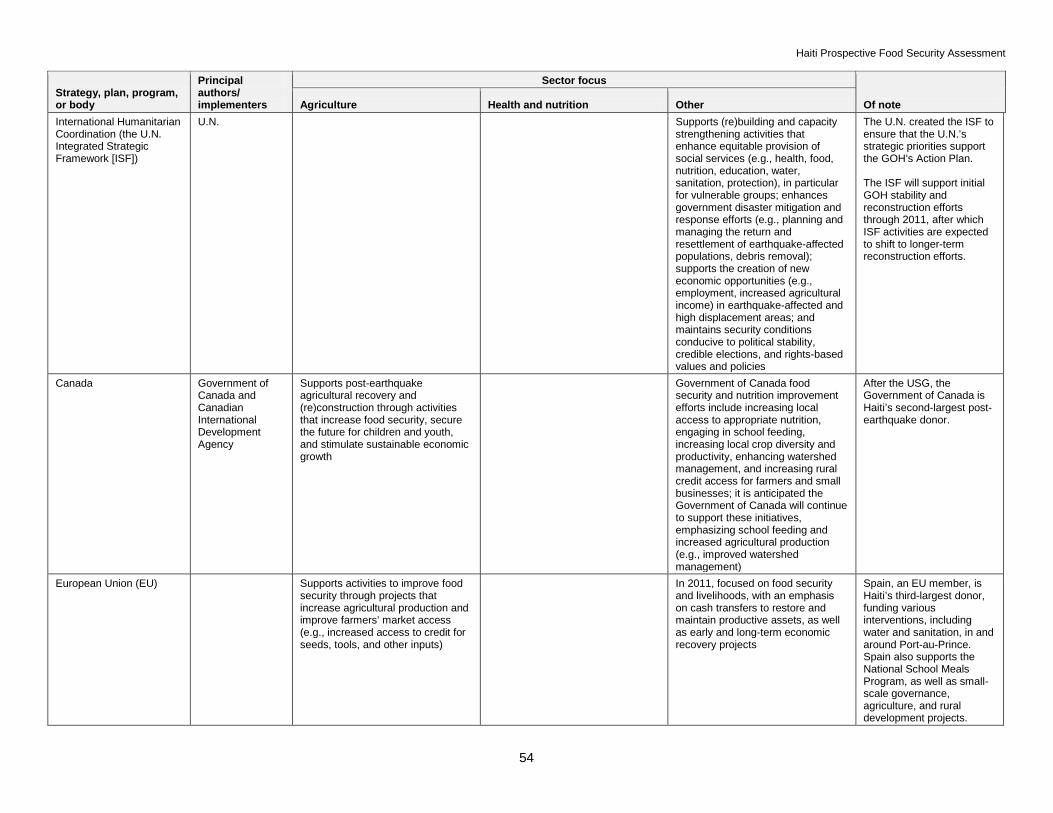
Haiti Prospective Food Security Assessment
54
Strategy, plan, program, or body
Principal authors/ implementers
Sector focus
Of note Agriculture Health and nutrition Other International Humanitarian Coordination (the U.N. Integrated Strategic Framework [ISF])
U.N. Supports (re)building and capacity strengthening activities that enhance equitable provision of social services (e.g., health, food, nutrition, education, water, sanitation, protection), in particular for vulnerable groups; enhances government disaster mitigation and response efforts (e.g., planning and managing the return and resettlement of earthquake-affected populations, debris removal); supports the creation of new economic opportunities (e.g., employment, increased agricultural income) in earthquake-affected and high displacement areas; and maintains security conditions conducive to political stability, credible elections, and rights-based values and policies
The U.N. created the ISF to ensure that the U.N.’s strategic priorities support the GOH’s Action Plan. The ISF will support initial GOH stability and reconstruction efforts through 2011, after which ISF activities are expected to shift to longer-term reconstruction efforts.
Canada Government of Canada and Canadian International Development Agency
Supports post-earthquake agricultural recovery and (re)construction through activities that increase food security, secure the future for children and youth, and stimulate sustainable economic growth
Government of Canada food security and nutrition improvement efforts include increasing local access to appropriate nutrition, engaging in school feeding, increasing local crop diversity and productivity, enhancing watershed management, and increasing rural credit access for farmers and small businesses; it is anticipated the Government of Canada will continue to support these initiatives, emphasizing school feeding and increased agricultural production (e.g., improved watershed management)
After the USG, the Government of Canada is Haiti’s second-largest post-earthquake donor.
European Union (EU) Supports activities to improve food security through projects that increase agricultural production and improve farmers’ market access (e.g., increased access to credit for seeds, tools, and other inputs)
In 2011, focused on food security and livelihoods, with an emphasis on cash transfers to restore and maintain productive assets, as well as early and long-term economic recovery projects
Spain, an EU member, is Haiti’s third-largest donor, funding various interventions, including water and sanitation, in and around Port-au-Prince. Spain also supports the National School Meals Program, as well as small-scale governance, agriculture, and rural development projects.
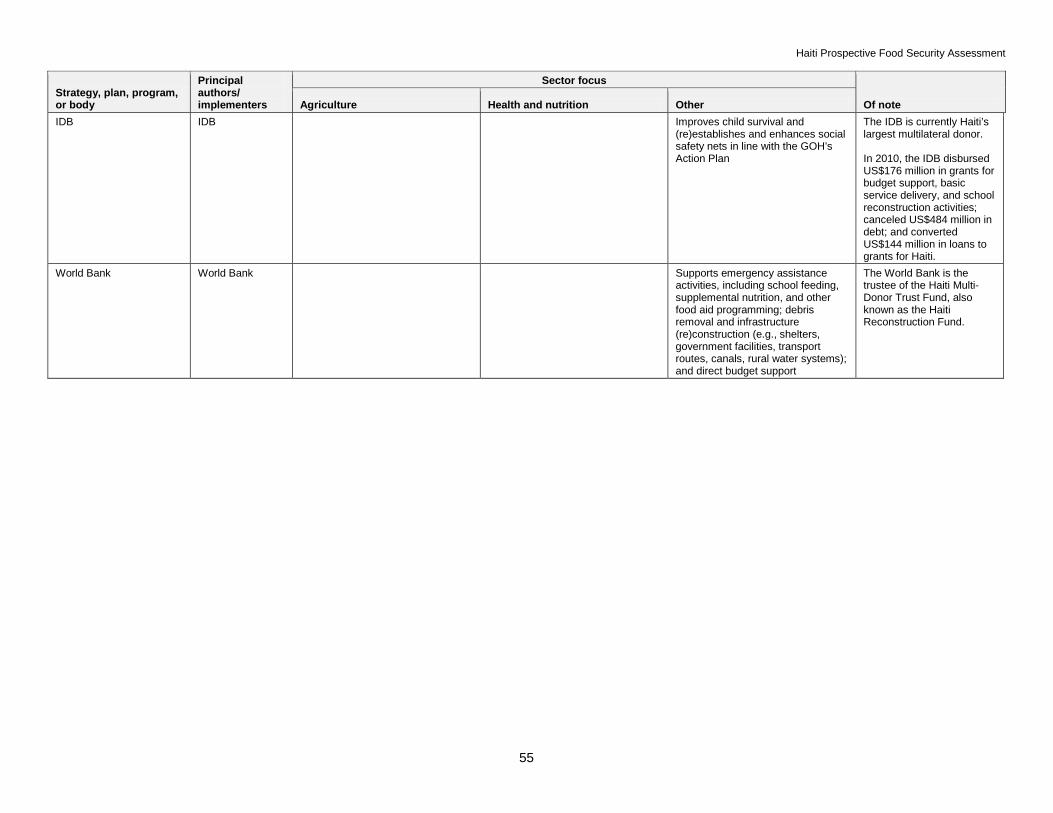
Haiti Prospective Food Security Assessment
55
Strategy, plan, program, or body
Principal authors/ implementers
Sector focus
Of note Agriculture Health and nutrition Other IDB IDB Improves child survival and
(re)establishes and enhances social safety nets in line with the GOH’s Action Plan
The IDB is currently Haiti’s largest multilateral donor. In 2010, the IDB disbursed US$176 million in grants for budget support, basic service delivery, and school reconstruction activities; canceled US$484 million in debt; and converted US$144 million in loans to grants for Haiti.
World Bank World Bank Supports emergency assistance activities, including school feeding, supplemental nutrition, and other food aid programming; debris removal and infrastructure (re)construction (e.g., shelters, government facilities, transport routes, canals, rural water systems); and direct budget support
The World Bank is the trustee of the Haiti Multi-Donor Trust Fund, also known as the Haiti Reconstruction Fund.
Haiti Prospective Food Security Assessment
56
4. Conclusion Without doubt, the answers to Haiti’s development questions, including those related to food security, are exceedingly complex, interrelated, and under a nearly omnipresent threat of disruption due to the shocks the country routinely faces. That said, while several events over the assessment’s reference period—the 2010 earthquake in particular—seriously inhibited the country’s progress toward improved economic, social, and political conditions, work in the aftermath of these events has also created opportunities for and bolstered interest in designing interventions to meet the immediate needs of the Haitian population while addressing underlying causes that increase their risk. It is hoped that this prospective food security assessment provides assistance to USAID, its future food security Awardees, and, in particular, its partners proposing future Title II development food aid programs to design relevant and complementary initiatives to effectively reduce food insecurity among Haiti’s vulnerable populations.

Haiti Prospective Food Security Assessment
57
References Action Against Hunger (ACF). 2011. “Rapport Final: Evaluation Nutritionnelle Rapide, Haut Artibonite,
Haïti, Période du 19 Janvier au 1er Février 2011.” Accessed on September 9, 2011. http://haiti.humanitarianresponse.info/LinkClick.aspx?link=Nutrition+Cluster%2fRF+d%27%C3%A9valuation+ nutritionnelle+Haut+Artibonite_Janv+2011_ACF_RF.pdf&tabid=80&mid=1249.
Cayemittes, Michel et al. 2007. “Enquête Mortalité, Morbidité et Utilisation des Services IV Haïti 2005–
2006.” Accessed on September 9, 2011. http://webapps01.un.org/vawdatabase/uploads/Haiti%20-%20mortalite%20morbidite%20et%20utilisation%20de%20services%20EMMUS%20IV.pdf.
Centers for Disease Control and Prevention (CDC). 2011. “Haiti Administrative Boundaries.” Accessed on
October 28, 2011. http://www.bt.cdc.gov/situationawareness/haiticholera/images/ HA%20Cholera%20Haiti%20Departments%20Communes%20Sections%20-%20CDC%20-%20GRASP%20(21-Jan-2011).jpg.
Centre for Research on the Epidemiology of Disasters. 2009a. “Country Profile: Haiti.” Accessed on
September 9, 2011. http://www.emdat.be/country-profile. ———. The International Disaster Database. 2009b. “Haiti: Country Profile: Natural Disasters.” Accessed
on November 17, 2011. http://www.emdat.be/result-country-profile?disgroup=natural&country=hti&period=2002$2011.
Development Associates. 2007. “Evaluation of the PL 480 Title II Program: USAID/HAITI Development
Assistance Program.” Accessed on November 22, 2011. http://pdf.usaid.gov/pdf_docs/ PDACJ025.pdf.
Fajnzylber, Pablo and López, J. Humberto, eds. 2008. “Remittances and Development: Lessons from
Latin America.” Accessed on September 9, 2011. http://www.oecd.org/dataoecd/39/24/42716118.pdf.
Food and Agricultural Organization of the United Nations (FAO). 2011a. “FAOSTAT: Food Balance
Sheets.” Accessed on November 11, 2011. http://faostat.fao.org/site/368/ DesktopDefault.aspx?PageID=368#ancor.
———. 2011b. “Food security data and definitions.” Accessed on September 9, 2011. http://www.fao.org/
economic/ess/ess-fs/fs-data/ess-fadata/en/. ———. 2011c. “Haiti.” Accessed on September 9, 2011. http://www.fao.org/countries/55528/fr/hti/. ———. 2011d. “Hunger statistics: Haiti.” Accessed on September 9, 2011. http://www.fao.org/hunger/en/. ———. n.d. “The IPC Reference Table.” Accessed on September 9, 2011. http://www.ipcinfo.org/
attachments/ReferenceTableEN.pdf. FAO and European Union (EU). 2011. “Price Monitoring and Analysis Country Brief: Haiti.” Accessed on
October 20, 2011. http://reliefweb.int/sites/reliefweb.int/files/resources/Full_Report_762.pdf. FAO and World Food Programme (WFP). 2010. “Rapport Spécial: Mission FAO/PAM d’Évaluation de la
Récolte et de la Sécurité Alimentaire en Haïti.” Accessed on September 9, 2011. http://documents.wfp.org/stellent/groups/public/documents/ena/wfp226104.pdf.
Haiti Prospective Food Security Assessment
58
Famine Early Warning Systems Network (FEWS NET). 2011a. “Haiti Food Security Outlook Update: July through December 2011.” Accessed on October 7, 2011. http://www.fews.net/docs/Publications/Haiti_OL_2011_07_en.pdf.
———. 2011b. “IPC Acute Food Insecurity Reference Table for Household Groups.” Accessed on
November 17, 2011. http://www.fews.net/ml/en/info/pages/scale.aspx. Gardella, Alexis. 2006. “Gender Assessment for USAID/Haiti Country Strategy Statement.” Accessed on
September 9, 2011. http://pdf.usaid.gov/pdf_docs/PDACH597.pdf. Government of Haiti (GOH). 2010a. “Action Plan for National Recovery and Development of Haiti.”
Accessed on September 12, 2011. http://www.haiticonference.org/Haiti_Action_Plan_ENG.pdf. ———. 2010b. “Haiti Earthquake PDNA: Assessment of damage, losses, general and sectoral needs:
Annex to the Action Plan for National Recovery and Development of Haiti.” Accessed on September 9, 2011. http://www.refondation.ht/resources/PDNA_Working_Document.pdf.
Grantham-McGregor, S. et al. 2007. “Developmental potential in the first 5 years for children in
developing countries.” Lancet 369:60–70. Habitat for Humanity. 2010. “Haiti Policy Report: One year later: Haiti needs a shelter strategy.” Accessed
on September 13, 2011. http://www.habitat.org/disaster/pdf/Haiti_Policy_Rpt12.2010.pdf. Haitian Institute for Statistics and Information (IHSI). 2007. “Statistiques Economiques: Indice des Prix à
la consommation: Année 2011 et Année 2010.” Accessed on November 11, 2011. http://www.ihsi.ht/produit_economie_indice_coins_statistique.htm.
———. 2003. “Enquête sur les Conditions de Vie en Haïti (ECVH).” Accessed on September 9, 2011.
http://www.ihsi.ht/pdf/ecvh/ecvh_volume_I_(juillet2003).pdf. Hoddinott, J. et al. 2008. “Effect of a nutrition intervention during early childhood on economic productivity
in Guatemalan adults.” Lancet 371:411–6. International Monetary Fund (IMF). 2011. “Report for Selected Countries and Subjects.” Accessed on
November 11, 2011. http://www.imf.org/external/pubs/ft/weo/2011/01/weodata/ weorept.aspx?sy=1990&ey=2010&scsm=1&ssd=1&sort=country&ds=.&br=1&c=263&s=NGDP_RPCH&grp=0&a=&pr1.x=48&pr1.y=8.
Jaramillo, Laura and Sancak, Cemile. 2007. “Growth in the Dominican Republic and Haiti: Why has the
Grass Been Greener on One Side of Hispanola.” Accessed on October 19, 2011. http://www.imf.org/external/pubs/ft/wp/2007/wp0763.pdf.
Lo-de-alla.org. 2010. “Haiti: Land ownership questions hinder reconstruction.” Accessed on
November 29, 2011. http://lo-de-alla.org/2010/07/haiti-land-ownership-questions-hinder-reconstruction/.
MapAction. n.d. “Haiti: Poverty: Proportion of the Population Living on Less than US$2/day.” Accessed on
October 13, 2011. http://reliefweb.int/sites/reliefweb.int/files/resources/ E2F6BFCE0ECD5B03C12574FE0036C6D7-mapaction_OTS_hti081021.pdf.
Measure DHS. 2007. “Addendum to the 2005–2006 Haiti Demographic and Health Survey.” Accessed on
September 9, 2011. http://www.measuredhs.com/pubs/pdf/FR192/HAITI-Addendum.SHM.pdf. Micronutrient Initiative. n.d. “Haiti: Haiti Country Profile.” Accessed on September 9, 2011.
http://www.micronutrient.org/english/view.asp?x=600.
Haiti Prospective Food Security Assessment
59
Ministry of Agriculture, Natural Resources, and Rural Development (MARNDR) and CNSA. 2010a. “Rapport d’Évaluation des Dégâts de l’Ouragan Tomas dans le Secteur Agricole et de Pêche.” Accessed on September 9, 2011. http://cnsahaiti.org/Enquete/EvaluationFinale_Thomas.pdf.
———. 2010b. “Haiti National Agricultural Investment Plan.” Accessed on November 17, 2011.
http://www.gafspfund.org/gafsp/sites/gafspfund.org/files/Documents/Haiti_NationalAgricultureInvestmentPlan.pdf.
Ministry of Planning and External Cooperation (MPCE). 2007. “Growth and Poverty Reduction Strategy
Paper (2008–2010).” Accessed on November 11, 2011. http://siteresources.worldbank.org/ INTHAITIINFRENCH/Resources/HaitiDSNCRPEnglish.pdf.
———. 2008. “Rapport d’évaluation des besoins après désastre: Cyclones Fay, Gustav, Hanna, et Ike.”
Accessed on September 9, 2011. http://gfdrr.org/docs/Haiti_PDNA_2008.pdf. Ministry of Public Health and Population (MSPP), UNICEF, and ACF. 2009. Enquête nutritionnelle
anthropométrique, enfants de 6 à 59 mois, République d'Haïti, décembre 2008–mars 2009. Unpublished.
Morris-Hughes, E. 1999. Findings of Exploratory Mission to Haiti. LAC Region Note. Mother and Child Health and Education Trust. 2011. “Early Detection and Referral of Children with
Malnutrition.” Accessed on November 9, 2011. http://motherchildnutrition.org/early-malnutrition-detection/detection-referral-children-with-acute-malnutrition/interpretation-of-muac-indicators.html.
National Food Security Coordination Office (CNSA). 2011a. “Coin Lexique.” Accessed on November 11,
2011. http://www.cnsahaiti.org/home/cnsa/coin-lexique.html. ———. 2011b. “Haïti: Bilan Alimentaire 2010.” Accessed on September 9, 2011. http://www.cnsahaiti.org/
actualite/Bilan%20Alimentaire2010.pdf. ———. 2011c. Presentation of Preliminary Results of the National Food Security Study in Haiti.
Unpublished. ———. 2011d. Preliminary Results of the National Food Security Study in Haiti: Conclusions and
Recommendations. Unpublished. ———. 2011e. “Rapport d’Évaluation de l’Impact du Choléra sur la Sécurité Alimentaire dans les Zones
Bas Plateau Central et Bas Artibonite.” Accessed on September 9, 2011. http://reliefweb.int/sites/reliefweb.int/files/resources/Rapport_complet_55.pdf.
———. 2010. Emergency Food Security Assessment II. Unpublished. ———. 2008. “Haïti: Impact de la crise alimentaire sur les populations urbaines de Port-Au-Prince.”
Accessed on September 9, 2011. http://cnsahaiti.org/Enquete/ Haiti_HighFoodPrices_FR%20%282%29.pdf.
Orozco, Manuel. 2006. “Understanding the remittance economy in Haiti.” Final draft. Accessed on
September 9, 2011. http://haiti.humanitarianresponse.info/ LinkClick.aspx?fileticket=qddQeyCzCN8%3D&tabid=149&mid=1044.
U.S. Department of State. 2011. “Post-Earthquake USG Haiti Strategy: Toward Renewal and Economic
Opportunity.” Accessed on November 20, 2011. http://www.state.gov/documents/organization/156448.pdf.
Haiti Prospective Food Security Assessment
60
U.S. Department of State Humanitarian Information Unit. 2010. “Haiti: Multi-Hazard Risk, Major Disasters and Severity (1998–2010).” Accessed on October 13, 2011. http://reliefweb.int/sites/reliefweb.int/ files/resources/8CA82CEF0C048F4F852576D400762ED4-map.pdf.
U.S. Department of State Office of the Haiti Special Coordinator. 2011. “Haiti: One Year Later.” Accessed
on September 12, 2011. http://www.state.gov/s/hsc/rls/154255.htm. UNDATA. 2011. “Haiti.” Accessed on September 7, 2011. http://data.un.org/
CountryProfile.aspx?crName=Haiti. UNICEF. 2010a. “At a glance: Haiti: Statistics.” Accessed on November 11, 2011.
http://www.unicef.org/infobycountry/haiti_statistics.html. ———. 2010b. “Maternal, Newborn and Child Survival Country Profiles: Haiti.” Accessed on November
11, 2011. http://www.childinfo.org/files/maternal/DI%20Profile%20-%20Haiti.pdf. ———. 2011a. “Statistics by Area: Primary School Participation.” Accessed on September 13, 2011.
http://www.childinfo.org/education_primary.php. ———. 2011b. “Statistics by Area: Secondary School Participation.” Accessed on November 11, 2011.
http://www.childinfo.org/education_secondary.php. ———. 2011c. “Statistics by Area: Trends in under-five mortality rates (1960–2010).” Accessed on
September 7, 2011. http://www.childinfo.org/mortality_ufmrcountrydata.php. ———. 1997. “The State of the World’s Children 1998: Focus on Nutrition.” Accessed on October 31,
2011. http://www.unicef.org/sowc98/silent4.htm. United Nations Development Programme (UNDP). 2011a. “Human Development Reports: Human
Development Index.” Accessed on September 7, 2011. http://hdr.undp.org/en/statistics/hdi. ———. 2011b. “International Human Development Indicators: GDP per capita in PPP terms (constant
2005 international $).” Accessed on November 22, 2011. http://hdrstats.undp.org/en/indicators/20206.html.
———. 2011c. “International Human Development Indicators: Life expectancy at birth (years).” Accessed
on September 13, 2011. http://hdrstats.undp.org/en/indicators/69206.html. ———. 2011d. “International Human Development Indicators. Mean years of schooling (of adults) (years).
Haiti.” Accessed on November 11, 2011. http://hdrstats.undp.org/en/countries/profiles/HTI.html. United Nations Office for the Coordination of Humanitarian Affairs (OCHA) Emergency Preparedness
Section. n.d. “Disaster Response Preparedness Toolkit.” Accessed on September 7, 2011. http://ocha.unog.ch/drptoolkit/PRiskAnalysis.html.
United Nations Office of the Special Envoy for Haiti. n.d. “Education: Key Statistics (prior to the
earthquake in January 2010).” Accessed on September 12, 2011. http://www.haitispecialenvoy.org/about-haiti/education/.
———. n.d. “Women and Gender: Key Statistics Prior to the January 2010 Earthquake.” Accessed on
November 11, 2011. http://www.haitispecialenvoy.org/about-haiti/women-gender/. United States Agency for International Development (USAID). 2011. Feed the Future/Haiti Five-Year
Strategy. Unpublished.
Haiti Prospective Food Security Assessment
61
———. 2010. “Haiti Market Analysis.” Accessed on November 22, 2011. http://www.usaid.gov/our_work/humanitarian_assistance/ffp/besthaitireport.pdf.
———. 2005. “Office of Food for Peace: Strategic Plan for 2006–2010.” Accessed on September 7, 2011.
http://www.usaid.gov/our_work/humanitarian_assistance/ffp/ffp_strategy.2006_2010.pdf. ———. 1992. “Policy Determination 19.” Accessed on September 7, 2011. http://www.usaid.gov/policy/
ads/200/pd19.pdf. United States Central Intelligence Agency (CIA). 2011. “The World Factbook: Haiti.” Accessed on
September 9, 2011. https://www.cia.gov/library/publications/the-world-factbook/rankorder/ 2003rank.html?countryName=Haiti&countryCode=ha®ionCode=cam&rank=212#ha.
United States Department of Agriculture (USDA) Foreign Agriculture Service. 2011. “Food for Progress.”
Accessed on September 12, 2011. http://www.fas.usda.gov/excredits/foodaid/ffp/ foodforprogress.asp.
USAID/Haiti. 2007. “Environmental Vulnerability in Haiti: Findings and Recommendations.” Accessed on
October 13, 2011. http://www.wilsoncenter.org/sites/default/files/Haiti_Final.pdf. Victora, C.G. et al. 2008. “Maternal and child undernutrition: consequences for adult health and human
capital.” Lancet 371:340–57. World Bank. 2011. “Mapping for Results: Haiti: Financed Activities by Sector.” Accessed on October 13,
2011. http://maps.worldbank.org/lac/haiti. ———. 2010.” Promoting Nutrition Security in Haiti: An Assessment of Pre- and Post-Earthquake
Conditions and Recommendations for the Way Forward.” Accessed on September 9, 2011. http://siteresources.worldbank.org/NUTRITION/Resources/ HaitiNutritionAssessmentEnglishFINAL.pdf.
———. 2006. “Data by Country: Haiti.” Accessed on November 29, 2011. http://data.worldbank.org/
indicator/SE.ADT.LITR.ZS. ———. 2002. “A Review of Gender Issues in the Dominican Republic, Haiti and Jamaica.” Accessed on
September 9, 2011. http://www-wds.worldbank.org/servlet/WDSContentServer/WDSP/IB/ 2003/03/22/000094946_03030704005682/Rendered/PDF/multi0page.pdf.
World Food Programme (WFP). n.d. “Haiti: WFP Activities.” Accessed on September 12, 2011.
http://www.wfp.org/countries/haiti/operations. ———. 2011a. Bulletin d’Analyse Approfondie des Marches en Haïti. Note No. 6. Unpublished. ———. 2011b. “Bulletin d’Analyse Approfondie des Marches en Haïti. Note No. 5.” Accessed on
November 11, 2011. http://documents.wfp.org/stellent/groups/public/documents/ena/ wfp235563.pdf.
———. 2011c. Projet d’appui au programme national de cantines scolaires en Haïti (Haïti 2012–2014).
Unpublished. ———. 2008. “Comprehensive Food Security and Vulnerability Analysis 2007/2008: Executive Brief:
Haiti.” Accessed on September 7, 2011. http://reliefweb.int/sites/reliefweb.int/files/resources/ 0B44C445F6F4D73C85257560007AC6F4-Full_Report.pdf.
Haiti Prospective Food Security Assessment
62
———. 2007. “Analyse Compréhensive de la Sécurité Alimentaire et de la Vulnérabilité (CFSVA) en Milieu Rural Haïtien.” Accessed on November 11, 2011. http://reliefweb.int/sites/reliefweb.int/files/ resources/62E9C9D95143D1164925765100114702-Rapport_complet.pdf.
World Health Organization (WHO). 2011. “Child Growth Standards.” Accessed on September 9, 2011.
http://www.who.int/childgrowth/en/. ———. n.d. “Table 1. Country data on median urinary iodine concentrations and urinary iodine
concentrations in school age children.” Accessed on September 9, 2011. http://www.who.int/vmnis/iodine/status/summary/IDD_estimates_table_2007.pdf.
———. 2009. “Global prevalence of vitamin A deficiency in populations at risk 1995–2005: WHO Global
Database on Vitamin A Deficiency.” Accessed on November 11, 2011. http://whqlibdoc.who.int/ publications/2009/9789241598019_eng.pdf.
Zanelli, Maria Luisa. 2011. “Haitian Women: The backbone of society and economic life in Haiti.”
Accessed on October 25, 2011. http://www.habitat.org/theforum/english/vulnerable/ Haitian_Women_the_backbone.aspx.

Haiti Prospective Food Security Assessment
63
Annex 1. UNICEF and MSPP Standardized Monitoring and Assessment of Relief and Transitions Survey Results in Haiti, April–June 2010 Prevalence of Acute Malnutrition (Wasting) of Children 6–59 Months of Age (WHO 2005 Reference Curve)196
Metropolitan
zone of PAP,197
Displaced N=540
Metropolitan zone of PAP,
Residents N=558
Léogâne, Petit Goave, Grand Goave, and
Jacmel, Displaced
N=663
Léogâne, Petit Goave, Grand Goave, and
Jacmel, Residents
N=642
Department of Artibonite
N=694
GAM (WHZ < −2 and/or edema)
5.37 (3.36–7.37)
3.05 (1.41–4.65)
2.86 (1.59–4.14)
2.49 (1.11–3.87)
5.62 (3.85–7.38)
SAM (WHZ < −3 and/or edema)
0.56 (0.00–1.18)
0.54 (0.00–1.15)
1.50 (0.54–2.50)
0.47 (0.00–1.16)
1.01 (0.29–1.72)
Edema (% of all children) 0 0 0.30 0.32 0.30
Nutritional Status of Mothers (using Mid-Upper Arm Circumference [MUAC], percentages)
Metropolitan zone of PAP,
Displaced N=429
Metropolitan zone of PAP,
Residents N=362
Léogâne, Petit Goave, Grand
Goave, and Jacmel,
Displaced N=432
Léogâne, Petit Goave, Grand Goave, and
Jacmel, Residents
N=208
Department of Artibonite
N=349 Normal (MUAC ≥ 210 mm198) 99.30 99.2 99.3 100.0 99.1
MAM (MUAC ≥ 185 mm and < 210 mm)
0.7 0.5 0.7 0.0 0.9
SAM (MUAC < 185 mm) 0.0 0.3 0.0 0.0 0.0
Percentage of Children 6–59 Months of Age Sick in the Past 2 Weeks (According to the Mother’s Recall)199
Metropolitan zone of PAP,
Displaced N=542
Metropolitan zone of PAP,
Residents N=562
Léogâne, Petit Goave, Grand
Goave, and Jacmel,
Displaced N=676
Léogâne, Petit Goave, Grand Goave, and
Jacmel, Residents
N=645
Department of Artibonite
N=698 % children with reported illness in previous 2 weeks
43.20 (35.80–50.50)
41.81 (34.30–49.33)
51.80 (45.30–58.20)
59.10 (52.90–65.20)
59.31 (53.62–65.00)
196 All results have a 95 percent confidence interval (CI). 197 Port-au-Prince. 198 The MUAC levels used in this table are not international standards for moderate or severe acute malnutrition, but rather levels selected for this particular study. 199 All results have a 95 percent CI.
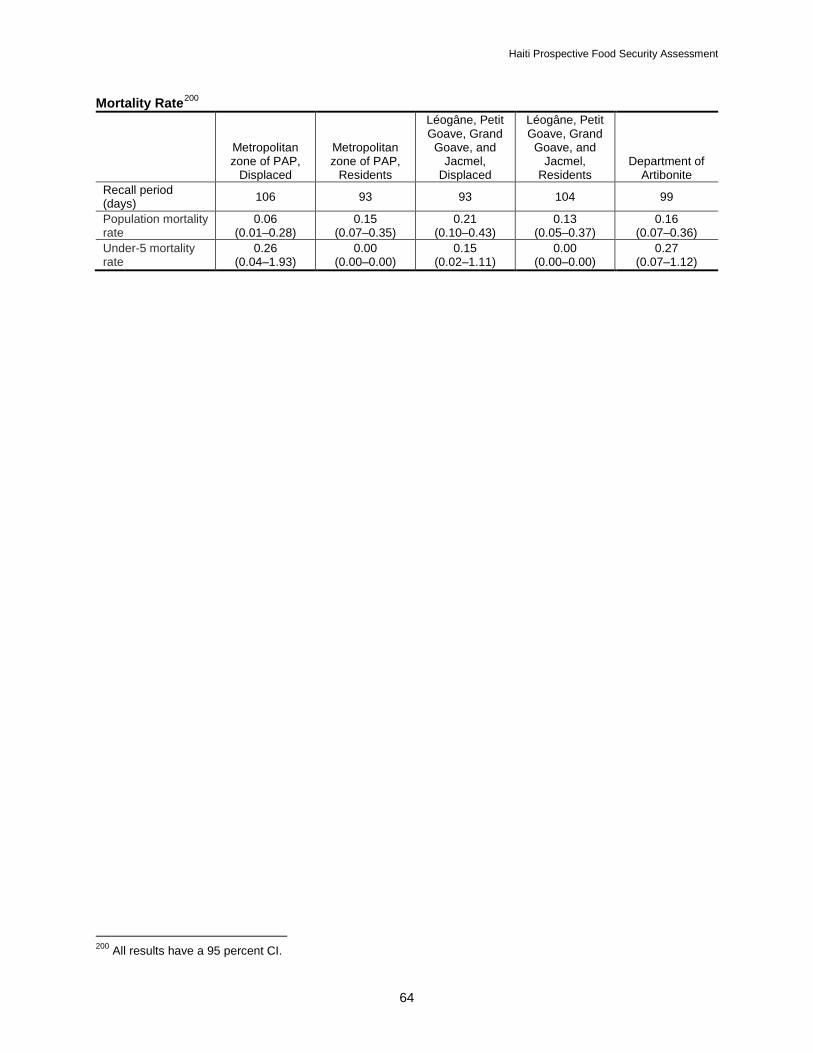
Haiti Prospective Food Security Assessment
64
Mortality Rate200
Metropolitan zone of PAP,
Displaced
Metropolitan zone of PAP,
Residents
Léogâne, Petit Goave, Grand
Goave, and Jacmel,
Displaced
Léogâne, Petit Goave, Grand
Goave, and Jacmel,
Residents Department of
Artibonite Recall period (days) 106 93 93 104 99
Population mortality rate
0.06 (0.01–0.28)
0.15 (0.07–0.35)
0.21 (0.10–0.43)
0.13 (0.05–0.37)
0.16 (0.07–0.36)
Under-5 mortality rate
0.26 (0.04–1.93)
0.00 (0.00–0.00)
0.15 (0.02–1.11)
0.00 (0.00–0.00)
0.27 (0.07–1.12)
200 All results have a 95 percent CI.

Haiti Prospective Food Security Assessment
65
Annex 2. Major Shocks in Haiti, 2000–2010
Start date Location201 Shock type Shock sub-type
Number killed
Total number affected
Est. damage
(US$ 000)
2000 January 12, 2000 Abricots region Flood 12 1,200
2001
May 16, 2001 Artibonite Flood General flood 26 5,081
2002
May 23, 2002 Azile, Grand’Anse, Les Cayes Flood Flash flood 31 38,339 1
2003
February 2003 Saint Nicolas, Bombardopolis Drought Drought 35,000
August 29, 2003 St. Marc Flood Flash flood 24 12,070
December 20, 2003 Cap-Haïtien, Port-de-Paix Flood General flood 38 150,000
2004
May 23, 2004 Fonds Verrettes Flood General flood 2,665 31,283 September 13, 2004
Cap Haïtien, Les Cayes Storm Tropical storm 3 6,500 1
September 17, 2004
Artibonite, Plateau Central Storm Tropical storm 2,754 315,594 50
2005
July 7, 2005 Sud, Ouest, Nippes Storm Tropical storm 40 15,036 50
July 14, 2005 St. Marc (North) Flood 6 2,500
October 2005 Bas-Arbonite Storm Tropical storm 1 10,000
October 2005 La Gonave Flood General flood 11 11,500
October 22, 2005 Dame Marie, Irois Storm Tropical storm 12 2,192
2006
July 30, 2006 Bas Artobonite Flood Storm surge/ coastal flood 4,690
August 15, 2006 Ouest, South Grande’Anse Storm Tropical storm 5 15,000
November 21, 2006 Jérémie, Abricots Flood Flash flood 11 20,010
201 Locations listed in this table include primarily affected areas, but are not exhaustive of all geographic locations where the noted shocks had a negative impact.
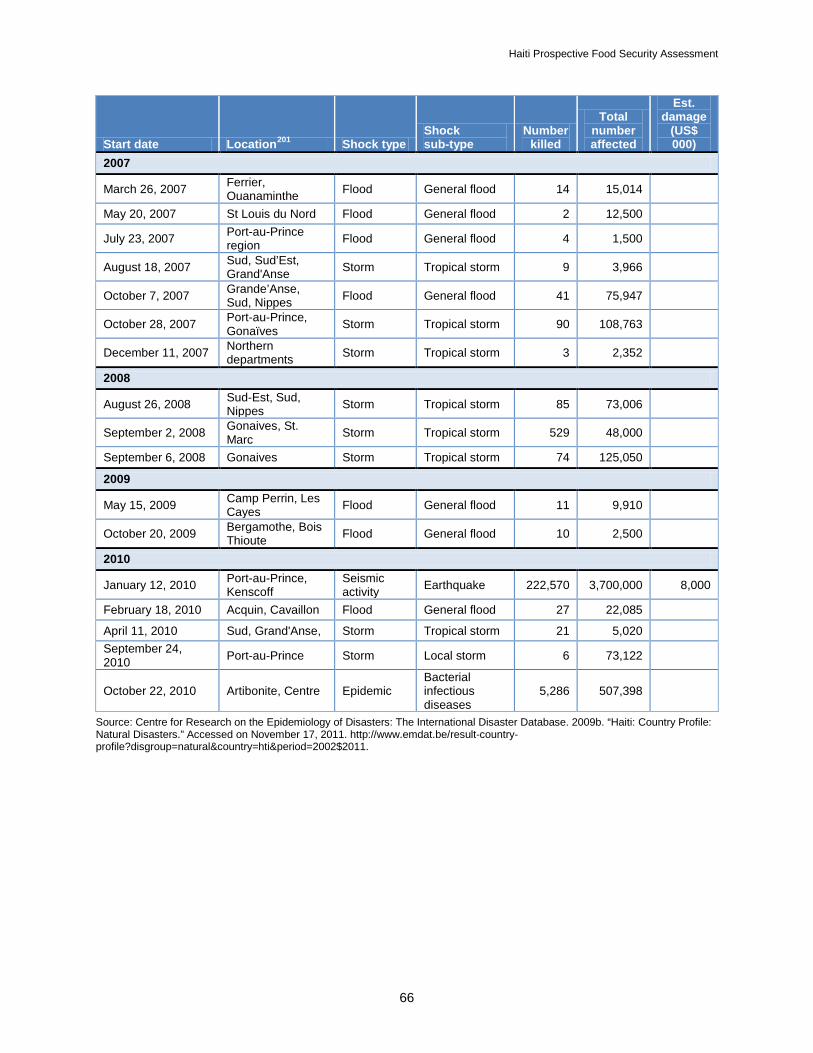
Haiti Prospective Food Security Assessment
66
Start date Location201 Shock type Shock sub-type
Number killed
Total number affected
Est. damage
(US$ 000)
2007
March 26, 2007 Ferrier, Ouanaminthe Flood General flood 14 15,014
May 20, 2007 St Louis du Nord Flood General flood 2 12,500
July 23, 2007 Port-au-Prince region Flood General flood 4 1,500
August 18, 2007 Sud, Sud’Est, Grand'Anse Storm Tropical storm 9 3,966
October 7, 2007 Grande’Anse, Sud, Nippes Flood General flood 41 75,947
October 28, 2007 Port-au-Prince, Gonaïves Storm Tropical storm 90 108,763
December 11, 2007 Northern departments Storm Tropical storm 3 2,352
2008
August 26, 2008 Sud-Est, Sud, Nippes Storm Tropical storm 85 73,006
September 2, 2008 Gonaives, St. Marc Storm Tropical storm 529 48,000
September 6, 2008 Gonaives Storm Tropical storm 74 125,050
2009
May 15, 2009 Camp Perrin, Les Cayes Flood General flood 11 9,910
October 20, 2009 Bergamothe, Bois Thioute Flood General flood 10 2,500
2010
January 12, 2010 Port-au-Prince, Kenscoff
Seismic activity Earthquake 222,570 3,700,000 8,000
February 18, 2010 Acquin, Cavaillon Flood General flood 27 22,085
April 11, 2010 Sud, Grand'Anse, Storm Tropical storm 21 5,020 September 24, 2010 Port-au-Prince Storm Local storm 6 73,122
October 22, 2010 Artibonite, Centre Epidemic Bacterial infectious diseases
5,286 507,398
Source: Centre for Research on the Epidemiology of Disasters: The International Disaster Database. 2009b. “Haiti: Country Profile: Natural Disasters.” Accessed on November 17, 2011. http://www.emdat.be/result-country-profile?disgroup=natural&country=hti&period=2002$2011.

Haiti Prospective Food Security Assessment
67
Annex 3. Food Insecurity Severity Mapping in Haiti, 2007–Present The following maps, which are arranged in chronological order starting with the most current, have been taken from FEWS NET’s monthly Food Security Updates and quarterly Food Security Outlooks for Haiti. They reflect the food security conditions anticipated in each geographic area during the timeframe noted. October–December 2011 (September 2011 Food Security Update)
July–September 2011 (July 2011 Food Security Outlook)
April–June 2011 (most likely scenario, January 2011 Food Security Outlook)
January–March 2011 (most likely scenario, January 2011 Food Security Outlook)
October–December 2010 (most likely scenario, October 2010 Food Security Outlook)
July–September 2010 (most likely scenario, May 2010 Food Security Outlook)

Haiti Prospective Food Security Assessment
68
May–June 2010 (most likely scenario, May 2010 Food Security Outlook)
January–March 2010 (most likely scenario, October 2009 Food Security Outlook)
October–December 2009 (most likely scenario, October 2009 Food Security Outlook)
July–September 2009 (most likely scenario, July 2009 Food Security Outlook)
April–June 2009 (most likely scenario, April 2009 Food Security Outlook)
January–March 2009 (most likely scenario, January 2009 Food Security Outlook)
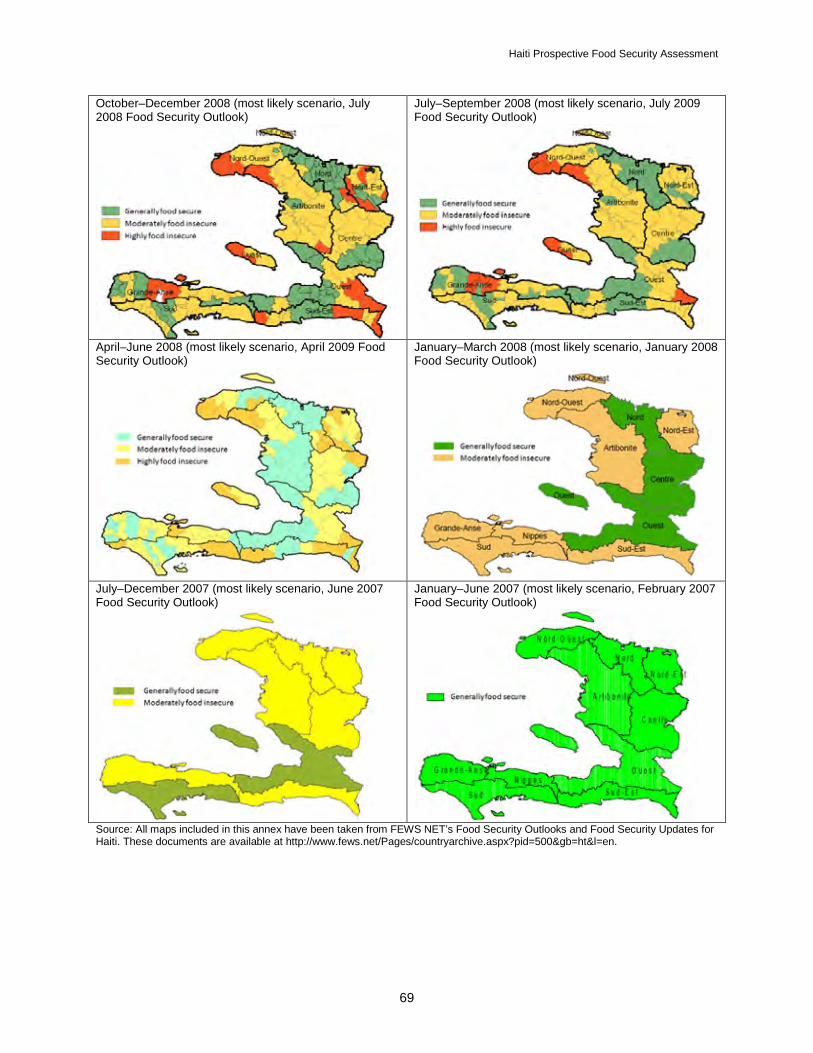
Haiti Prospective Food Security Assessment
69
October–December 2008 (most likely scenario, July 2008 Food Security Outlook)
July–September 2008 (most likely scenario, July 2009 Food Security Outlook)
April–June 2008 (most likely scenario, April 2009 Food Security Outlook)
January–March 2008 (most likely scenario, January 2008 Food Security Outlook)
July–December 2007 (most likely scenario, June 2007 Food Security Outlook)
January–June 2007 (most likely scenario, February 2007 Food Security Outlook)
Source: All maps included in this annex have been taken from FEWS NET’s Food Security Outlooks and Food Security Updates for Haiti. These documents are available at http://www.fews.net/Pages/countryarchive.aspx?pid=500&gb=ht&l=en.

Haiti Prospective Food Security Assessment
70
Annex 4. The Government of Haiti’s National Agricultural Investment Plan (2010) Priority Intervention Areas
Source: MARNDR. 2010. “Haiti National Agricultural Investment Plan.” Accessed on November 17, 2011. http://www.gafspfund.org/gafsp/sites/gafspfund.org/files/Documents/Haiti_NationalAgricultureInvestmentPlan.pdf.