Embed Size (px)
Citation preview


1. 1st Half Financial Year Summary – 3rd Quarter Update
2. COVID19 Risk Management Response
3. COVID19 Impacts on Coal Markets
4. Coal Prices
5. NAC03 Update
6. Outlook
– Near term
– Medium term
2
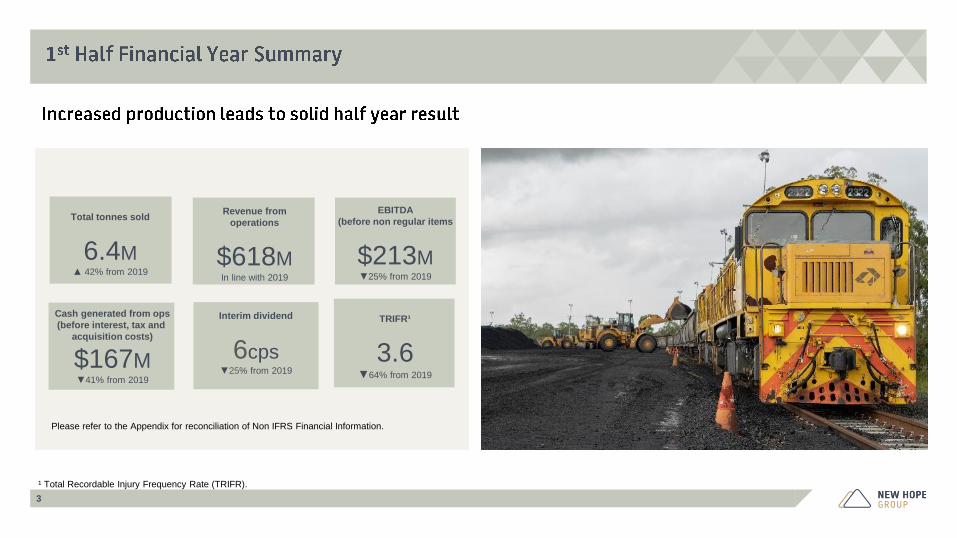
Cash generated from ops
(before interest, tax and
acquisition costs)
$167M▼41% from 2019
TRIFR¹
3.6▼64% from 2019
Total tonnes sold
6.4M▲ 42% from 2019
Please refer to the Appendix for reconciliation of Non IFRS Financial Information.
3
Revenue from
operations
$618MIn line with 2019
EBITDA
(before non regular items
$213M▼25% from 2019
Interim dividend
6cps▼25% from 2019
¹ Total Recordable Injury Frequency Rate (TRIFR).
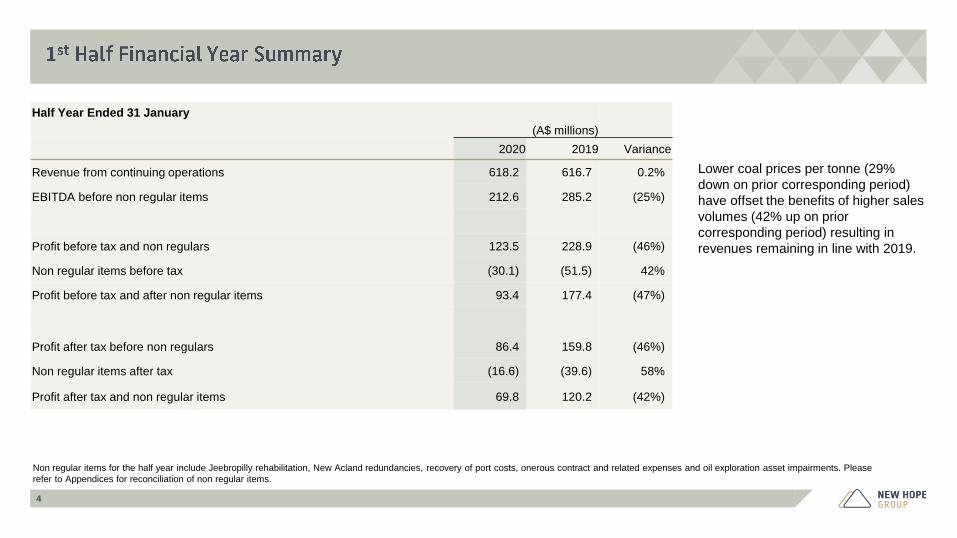
Half Year Ended 31 January
(A$ millions)
2020 2019 Variance
Revenue from continuing operations 618.2 616.7 0.2%
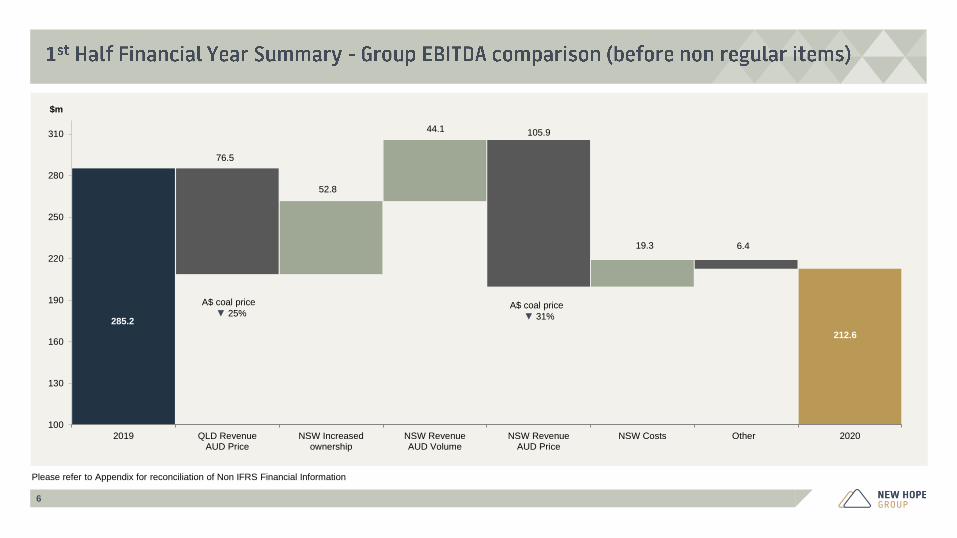
EBITDA before non regular items 212.6 285.2 (25%)
Profit before tax and non regulars 123.5 228.9 (46%)
Non regular items before tax (30.1) (51.5) 42%
Profit before tax and after non regular items 93.4 177.4 (47%)
Profit after tax before non regulars 86.4 159.8 (46%)
Non regular items after tax (16.6) (39.6) 58%
Profit after tax and non regular items 69.8 120.2 (42%)
4
Lower coal prices per tonne (29%
down on prior corresponding period)
have offset the benefits of higher sales
volumes (42% up on prior
corresponding period) resulting in
revenues remaining in line with 2019.
Non regular items for the half year include Jeebropilly rehabilitation, New Acland redundancies, recovery of port costs, onerous contract and related expenses and oil exploration asset impairments. Please
refer to Appendices for reconciliation of non regular items.
Please refer to the Appendix for reconciliation of Non IFRS Financial Information
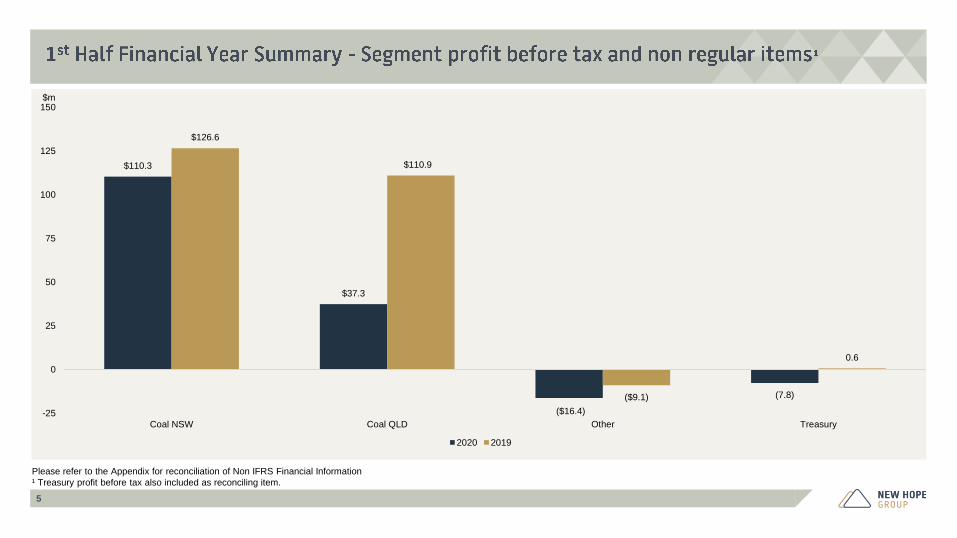
¹ Treasury profit before tax also included as reconciling item.
5
$110.3
$37.3
($16.4)
(7.8)
$126.6
$110.9
($9.1)
0.6
-25
0
25
50
75
100
125
150
Coal NSW Coal QLD Other Treasury
$m
2020 2019
Please refer to Appendix for reconciliation of Non IFRS Financial Information
6
285.2
76.5
52.8
44.1 105.9
19.3 6.4
212.6
100
130
160
190
220
250
280
310
2019 QLD RevenueAUD Price
NSW Increasedownership
NSW RevenueAUD Volume
NSW RevenueAUD Price
NSW Costs Other 2020
$m
A$ coal price
▼ 31%
A$ coal price
▼ 25%
Quarter Ended Nine Months Ended
Apr-20
(‘000t)
Apr-19
(‘000t)
Change
(%)
Apr-20
(‘000t)
Apr-19
(‘000t)
Change
(%)
Saleable Coal Production
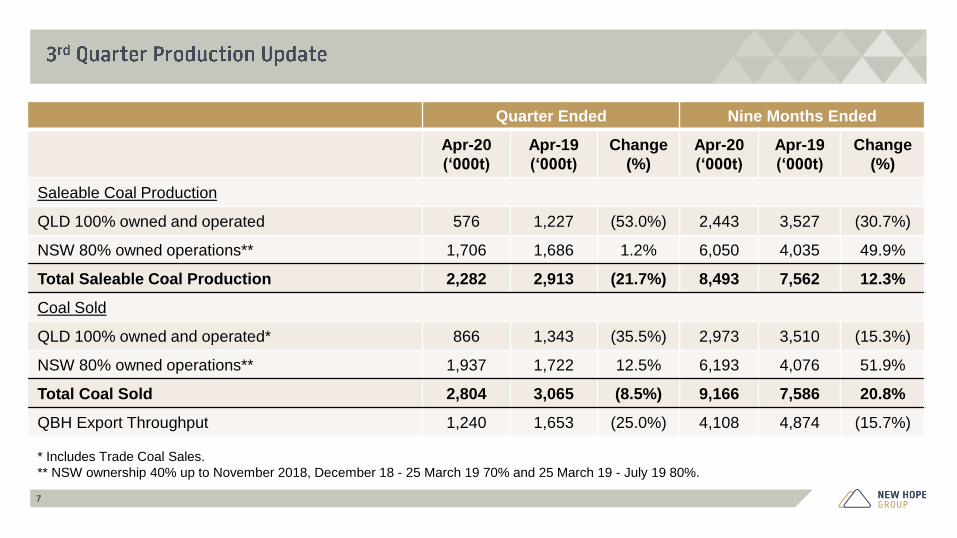
QLD 100% owned and operated 576 1,227 (53.0%) 2,443 3,527 (30.7%)
NSW 80% owned operations** 1,706 1,686 1.2% 6,050 4,035 49.9%
Total Saleable Coal Production 2,282 2,913 (21.7%) 8,493 7,562 12.3%
Coal Sold
QLD 100% owned and operated* 866 1,343 (35.5%) 2,973 3,510 (15.3%)
NSW 80% owned operations** 1,937 1,722 12.5% 6,193 4,076 51.9%
Total Coal Sold 2,804 3,065 (8.5%) 9,166 7,586 20.8%
QBH Export Throughput 1,240 1,653 (25.0%) 4,108 4,874 (15.7%)
7
* Includes Trade Coal Sales.
** NSW ownership 40% up to November 2018, December 18 - 25 March 19 70% and 25 March 19 - July 19 80%.
8
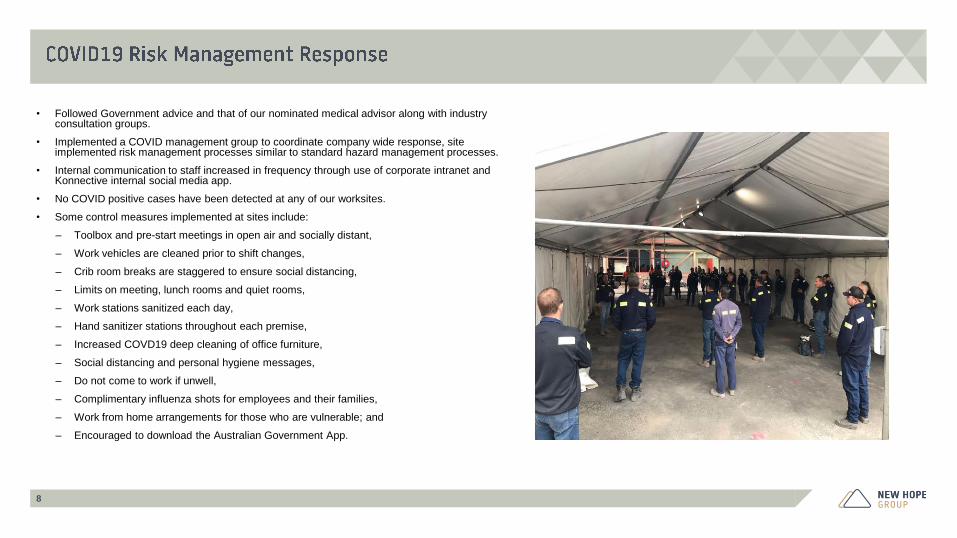
• Followed Government advice and that of our nominated medical advisor along with industry consultation groups.
• Implemented a COVID management group to coordinate company wide response, site implemented risk management processes similar to standard hazard management processes.
• Internal communication to staff increased in frequency through use of corporate intranet and Konnective internal social media app.
• No COVID positive cases have been detected at any of our worksites.
• Some control measures implemented at sites include:
– Toolbox and pre-start meetings in open air and socially distant,
– Work vehicles are cleaned prior to shift changes,
– Crib room breaks are staggered to ensure social distancing,
– Limits on meeting, lunch rooms and quiet rooms,
– Work stations sanitized each day,
– Hand sanitizer stations throughout each premise,
– Increased COVD19 deep cleaning of office furniture,
– Social distancing and personal hygiene messages,
– Do not come to work if unwell,
– Complimentary influenza shots for employees and their families,
– Work from home arrangements for those who are vulnerable; and
– Encouraged to download the Australian Government App.
9
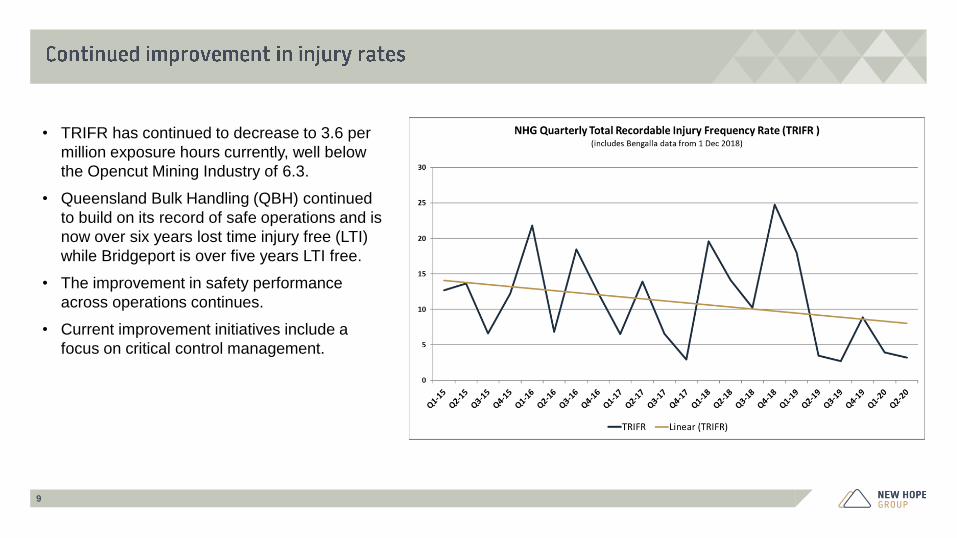
• TRIFR has continued to decrease to 3.6 per
million exposure hours currently, well below
the Opencut Mining Industry of 6.3.
• Queensland Bulk Handling (QBH) continued
to build on its record of safe operations and is
now over six years lost time injury free (LTI)
while Bridgeport is over five years LTI free.
• The improvement in safety performance
across operations continues.
• Current improvement initiatives include a
focus on critical control management.
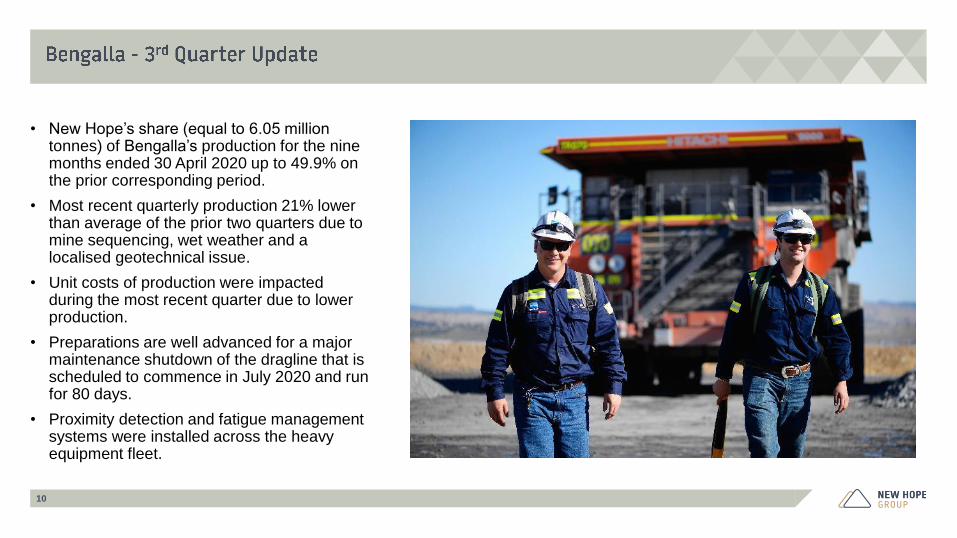
• New Hope’s share (equal to 6.05 million tonnes) of Bengalla’s production for the nine months ended 30 April 2020 up to 49.9% on the prior corresponding period.
• Most recent quarterly production 21% lower than average of the prior two quarters due to mine sequencing, wet weather and a localised geotechnical issue.
• Unit costs of production were impacted during the most recent quarter due to lower production.
• Preparations are well advanced for a major maintenance shutdown of the dragline that is scheduled to commence in July 2020 and run for 80 days.
• Proximity detection and fatigue management systems were installed across the heavy equipment fleet.
10
11
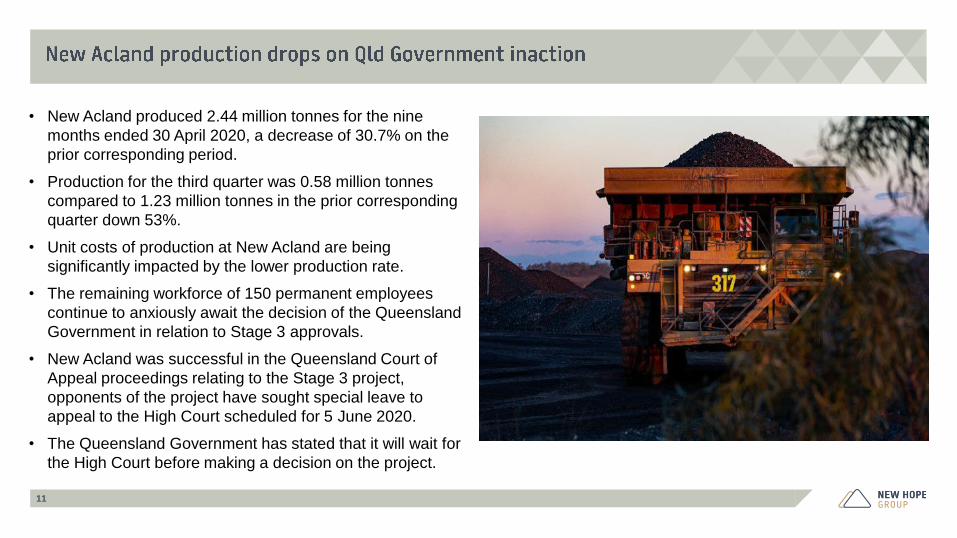
• New Acland produced 2.44 million tonnes for the nine
months ended 30 April 2020, a decrease of 30.7% on the
prior corresponding period.
• Production for the third quarter was 0.58 million tonnes
compared to 1.23 million tonnes in the prior corresponding
quarter down 53%.
• Unit costs of production at New Acland are being
significantly impacted by the lower production rate.
• The remaining workforce of 150 permanent employees
continue to anxiously await the decision of the Queensland
Government in relation to Stage 3 approvals.
• New Acland was successful in the Queensland Court of
Appeal proceedings relating to the Stage 3 project,
opponents of the project have sought special leave to
appeal to the High Court scheduled for 5 June 2020.
• The Queensland Government has stated that it will wait for
the High Court before making a decision on the project.
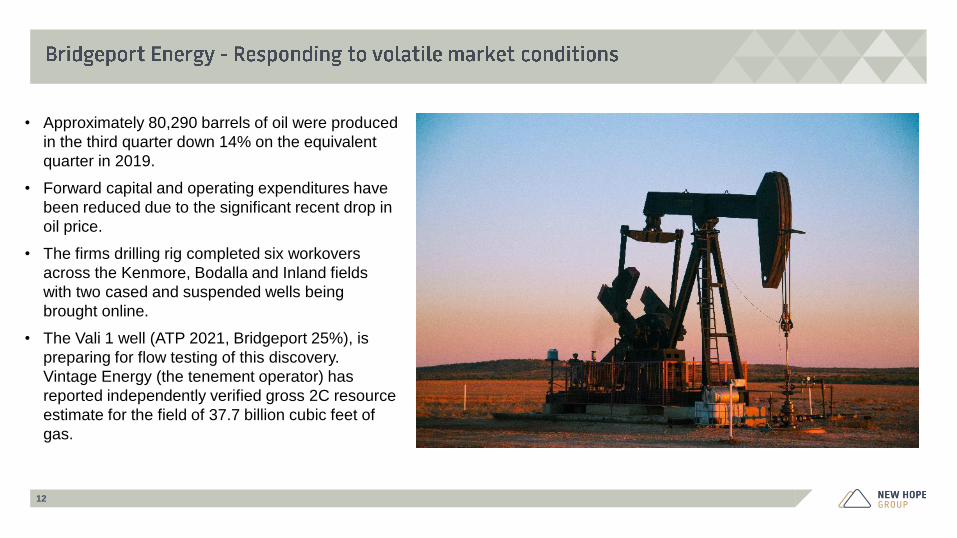
• Approximately 80,290 barrels of oil were produced
in the third quarter down 14% on the equivalent
quarter in 2019.
• Forward capital and operating expenditures have
been reduced due to the significant recent drop in
oil price.
• The firms drilling rig completed six workovers
across the Kenmore, Bodalla and Inland fields
with two cased and suspended wells being
brought online.
• The Vali 1 well (ATP 2021, Bridgeport 25%), is
preparing for flow testing of this discovery.
Vintage Energy (the tenement operator) has
reported independently verified gross 2C resource
estimate for the field of 37.7 billion cubic feet of
gas.
12
13
$0
$20
$40
$60
$80
$100
$120
$140
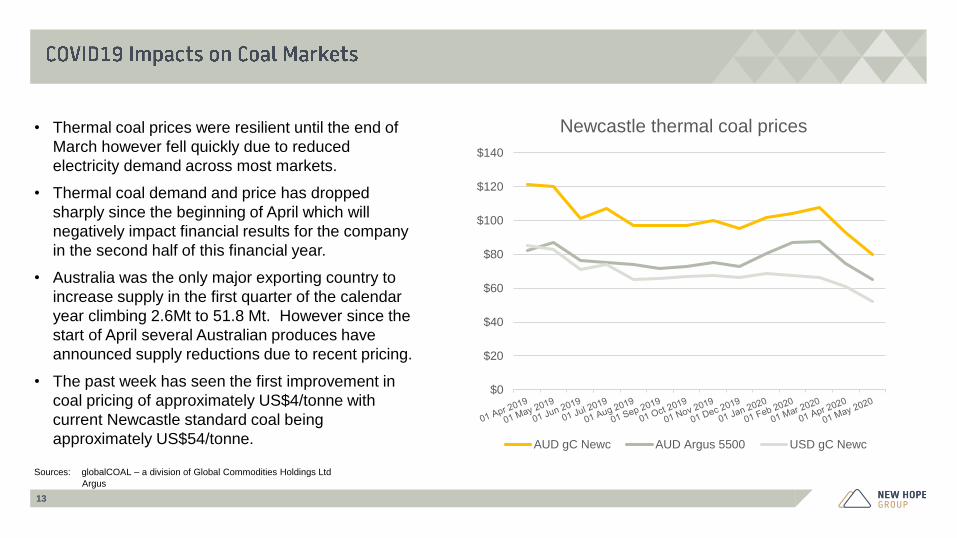
Newcastle thermal coal prices
AUD gC Newc AUD Argus 5500 USD gC Newc
• Thermal coal prices were resilient until the end of
March however fell quickly due to reduced
electricity demand across most markets.
• Thermal coal demand and price has dropped
sharply since the beginning of April which will
negatively impact financial results for the company
in the second half of this financial year.
• Australia was the only major exporting country to
increase supply in the first quarter of the calendar
year climbing 2.6Mt to 51.8 Mt. However since the
start of April several Australian produces have
announced supply reductions due to recent pricing.
• The past week has seen the first improvement in
coal pricing of approximately US$4/tonne with
current Newcastle standard coal being
approximately US$54/tonne.
Sources: globalCOAL – a division of Global Commodities Holdings Ltd
Argus
14
-14.7%
-11.1%-10.1%
-8.5%-8.0%
-6.0%-5.4%
-3.0%
-16.0%
-14.0%
-12.0%
-10.0%
-8.0%
-6.0%
-4.0%
-2.0%
0.0%
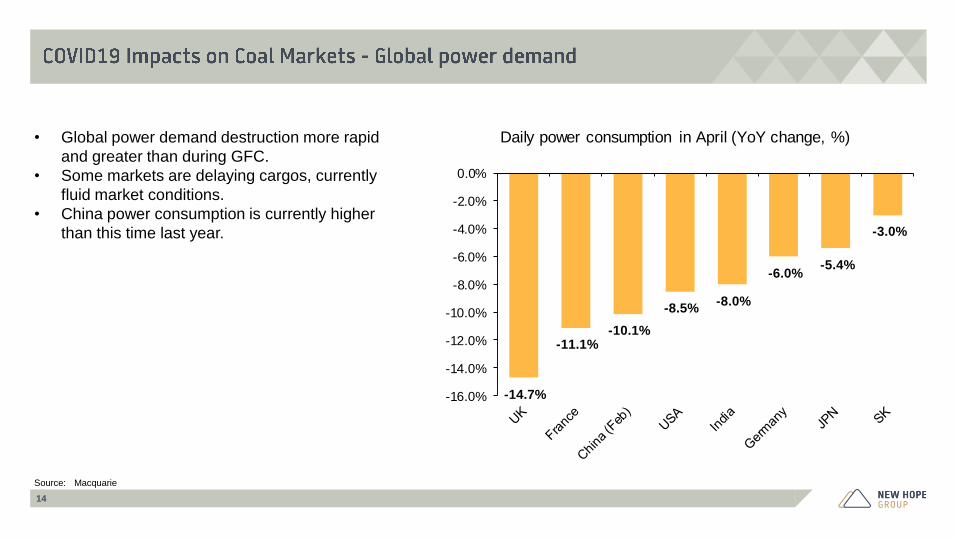
Daily power consumption in April (YoY change, %)• Global power demand destruction more rapid
and greater than during GFC.
• Some markets are delaying cargos, currently
fluid market conditions.
• China power consumption is currently higher
than this time last year.
Source: Macquarie
15
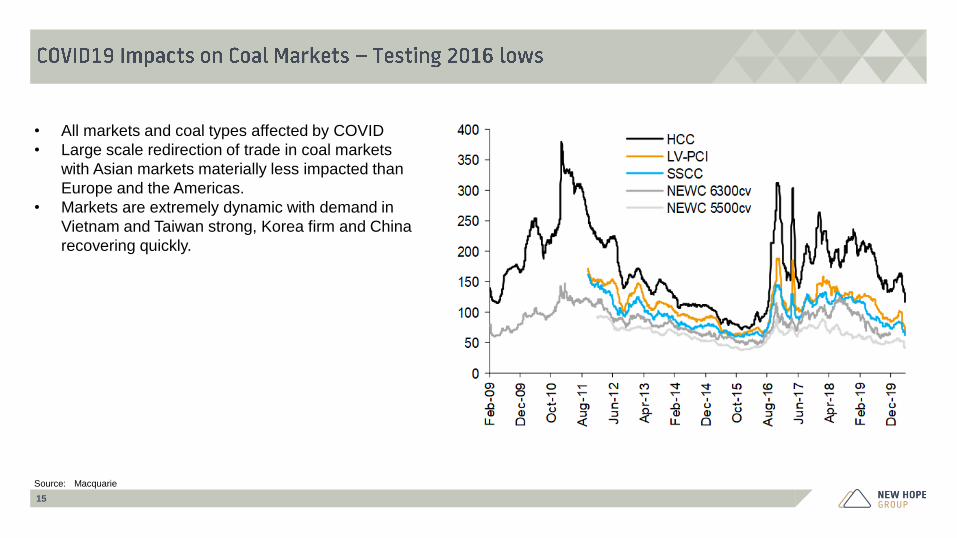
• All markets and coal types affected by COVID
• Large scale redirection of trade in coal markets
with Asian markets materially less impacted than
Europe and the Americas.
• Markets are extremely dynamic with demand in
Vietnam and Taiwan strong, Korea firm and China
recovering quickly.
Source: Macquarie
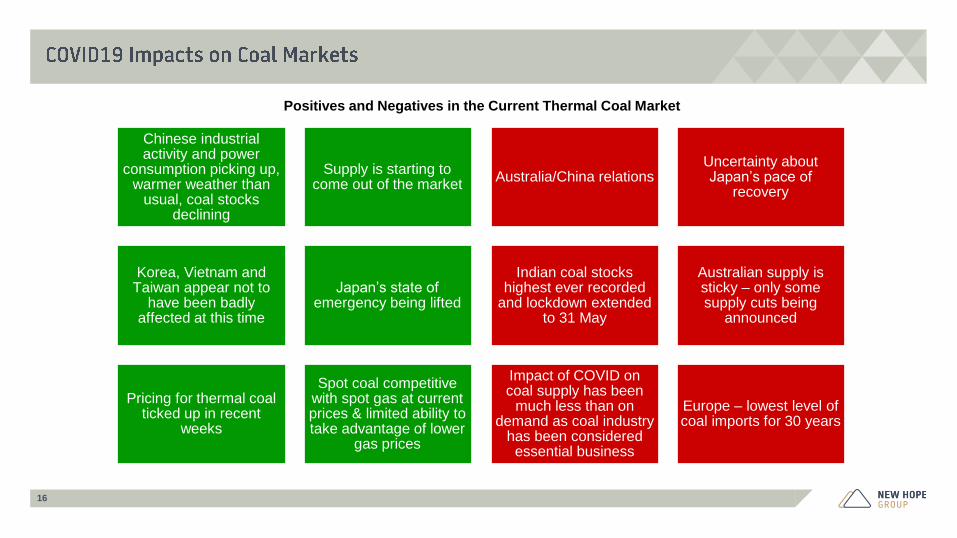
Positives and Negatives in the Current Thermal Coal Market
Chinese industrial activity and power
consumption picking up, warmer weather than
usual, coal stocks declining
Supply is starting to come out of the market
Korea, Vietnam and Taiwan appear not to
have been badly affected at this time
Japan’s state of emergency being lifted
Pricing for thermal coal ticked up in recent
weeks
Spot coal competitive with spot gas at current prices & limited ability to take advantage of lower
gas prices
Australia/China relationsUncertainty about Japan’s pace of
recovery
Indian coal stocks highest ever recorded
and lockdown extended to 31 May
Australian supply is sticky – only some supply cuts being
announced
Impact of COVID on coal supply has been
much less than on demand as coal industry
has been considered essential business
Europe – lowest level of coal imports for 30 years
16
17
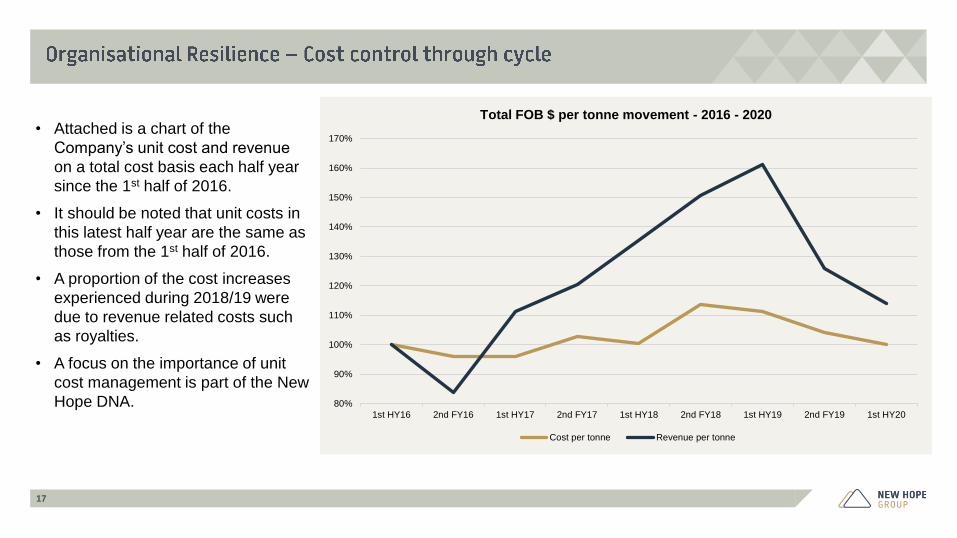
• Attached is a chart of the
Company’s unit cost and revenue
on a total cost basis each half year
since the 1st half of 2016.
• It should be noted that unit costs in
this latest half year are the same as
those from the 1st half of 2016.
• A proportion of the cost increases
experienced during 2018/19 were
due to revenue related costs such
as royalties.
• A focus on the importance of unit
cost management is part of the New
Hope DNA. 80%
90%
100%
110%
120%
130%
140%
150%
160%
170%
1st HY16 2nd FY16 1st HY17 2nd FY17 1st HY18 2nd FY18 1st HY19 2nd FY19 1st HY20
Total FOB $ per tonne movement - 2016 - 2020
Cost per tonne Revenue per tonne
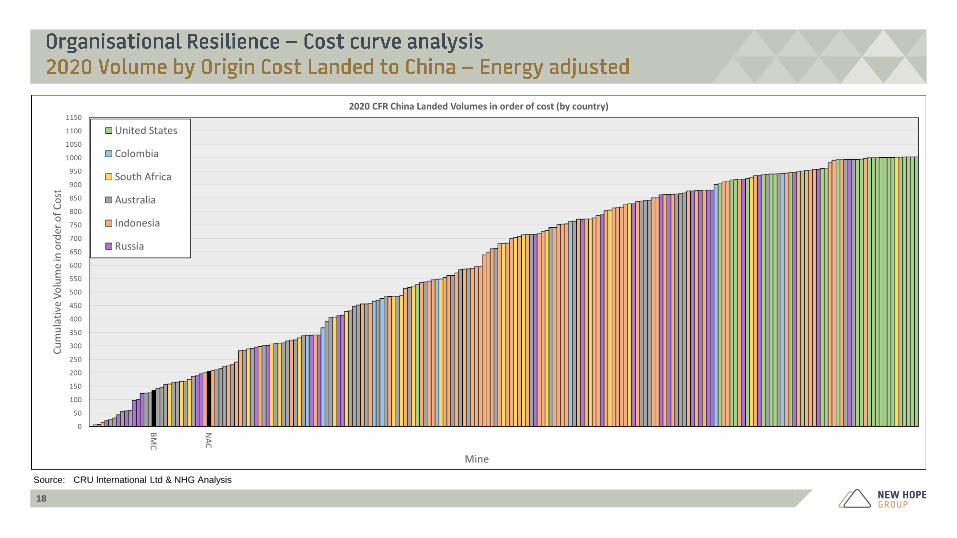
18
Source: CRU International Ltd & NHG Analysis
19
20
• The resources sector has been a standout success story during the COVID19 lockdown managing to safely maintain
sizeable workforces.
• The resources sector is poised to create 12,000 jobs and pump more than $24billion in to the Queensland economy as we
come out of lockdown.
• Projects are waiting for Government approval including 6 major coal projects.
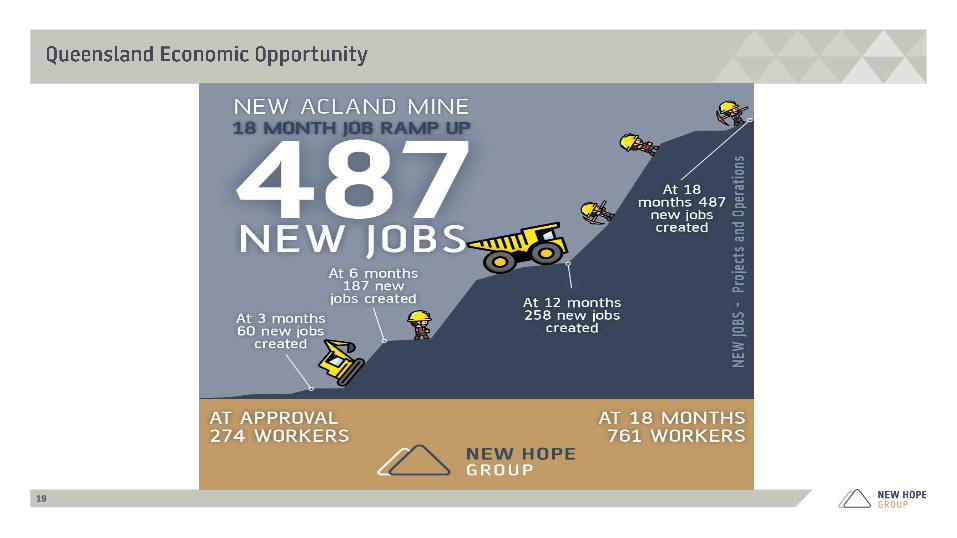
• New Acland Stage 3 Project (NAC03) sits at the top of wish list of resource projects.
• When approved NAC03 will secure 150+ existing jobs, create 487 new full time jobs and over 230 construction jobs over the
life of the project.
• It will also provide energy security for our domestic customers who employ over 14000 Queenslanders.
Source: QRC Media Release 26 May 2020
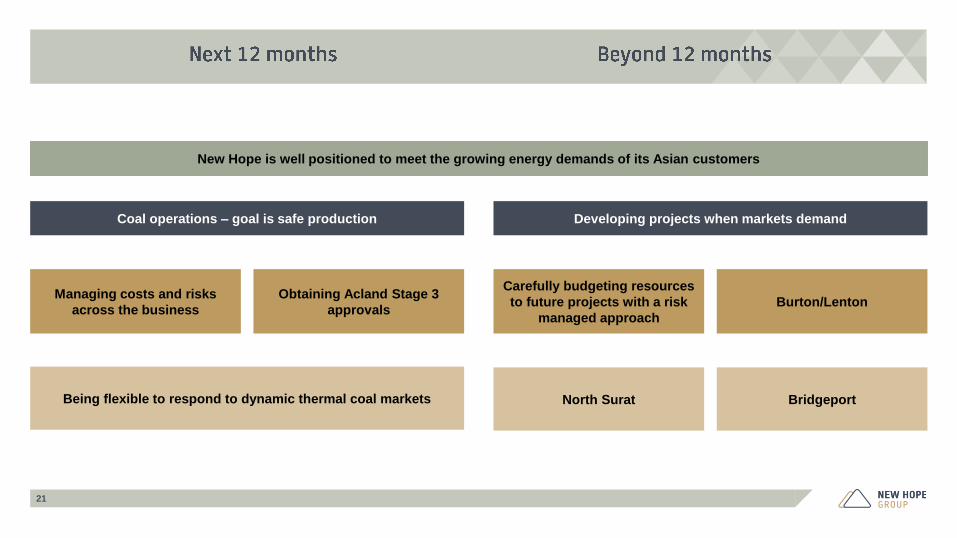
Managing costs and risks
across the business
Obtaining Acland Stage 3
approvals
Coal operations – goal is safe production
Being flexible to respond to dynamic thermal coal markets
Carefully budgeting resources
to future projects with a risk
managed approach
Burton/Lenton
Developing projects when markets demand
North Surat Bridgeport
New Hope is well positioned to meet the growing energy demands of its Asian customers
21

IMPORTANT: The information in this document has been provided to you for information only by New Hope Corporation Limited (“NHC”) and is subject to change without notice. Nothing contained in this document constitutes investment, legal, tax or other advice. Theinformation in this document does not take into account your investment objectives, financial situation or particular needs. Before making an investment decision, you should consider, with or without the assistance of professional securities adviser, whether an investmentin NHC is appropriate in the light of your particular investment needs, objectives and financial circumstances.
Nothing in this document should be considered a solicitation, offer or invitation to buy, subscribe for or sell any security in the United Sates of America (“US”) or in any place in which, or to any person to whom, it would be unlawful to make such an offer or invitation. Thedistribution of this document outside Australia may be restricted by law. Persons who come into possession of this document who are not in Australia should seek advice on and observe any such restrictions. Any failure to comply with such restrictions may constitute aviolation of applicable securities laws.
Neither this document nor any copy hereof may be transmitted in the US or distributed, directly or indirectly, in the US or to any US person including (1) any US resident, (2) any partnership or corporation or other entity organised or incorporated under the laws of the USor any state thereof, (3) any trust of which any trustee is a US person, or (4) and agency or branch of a foreign entity located in the US.
By accepting this document you agree to be bound by these limitations. NHC has prepared this document based on information available to it. Although reasonable care has been taken to ensure that the facts stated and opinions given in this document are fair andaccurate, the information provided in this document has not been independently verified. Accordingly, no representation or warranty, express or implied is made as to the fairness, accuracy, completeness or correctness of the information and opinions contained in thisdocument. To the fullest extent permitted by law, none of NHC, its directors, employees or agents or any other persons accepts any liability for any loss whatsoever arising from any use of this document or its contents, or otherwise arising in connection therewith.
Disclaimer

24
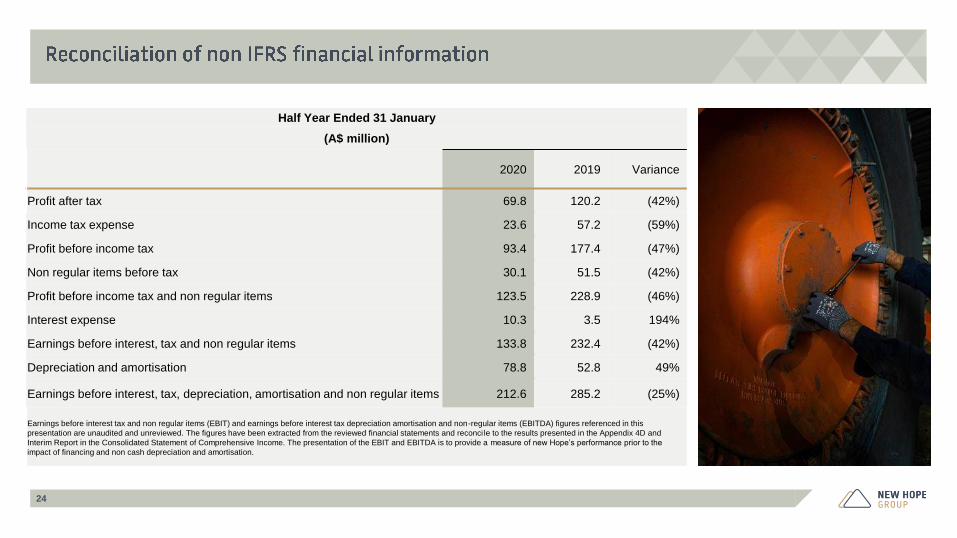
Half Year Ended 31 January
(A$ million)
2020 2019 Variance
Profit after tax 69.8 120.2 (42%)
Income tax expense 23.6 57.2 (59%)
Profit before income tax 93.4 177.4 (47%)
Non regular items before tax 30.1 51.5 (42%)
Profit before income tax and non regular items 123.5 228.9 (46%)
Interest expense 10.3 3.5 194%
Earnings before interest, tax and non regular items 133.8 232.4 (42%)
Depreciation and amortisation 78.8 52.8 49%
Earnings before interest, tax, depreciation, amortisation and non regular items 212.6 285.2 (25%)
Earnings before interest tax and non regular items (EBIT) and earnings before interest tax depreciation amortisation and non-regular items (EBITDA) figures referenced in this
presentation are unaudited and unreviewed. The figures have been extracted from the reviewed financial statements and reconci le to the results presented in the Appendix 4D and
Interim Report in the Consolidated Statement of Comprehensive Income. The presentation of the EBIT and EBITDA is to provide a measure of new Hope’s performance prior to the
impact of financing and non cash depreciation and amortisation.
25
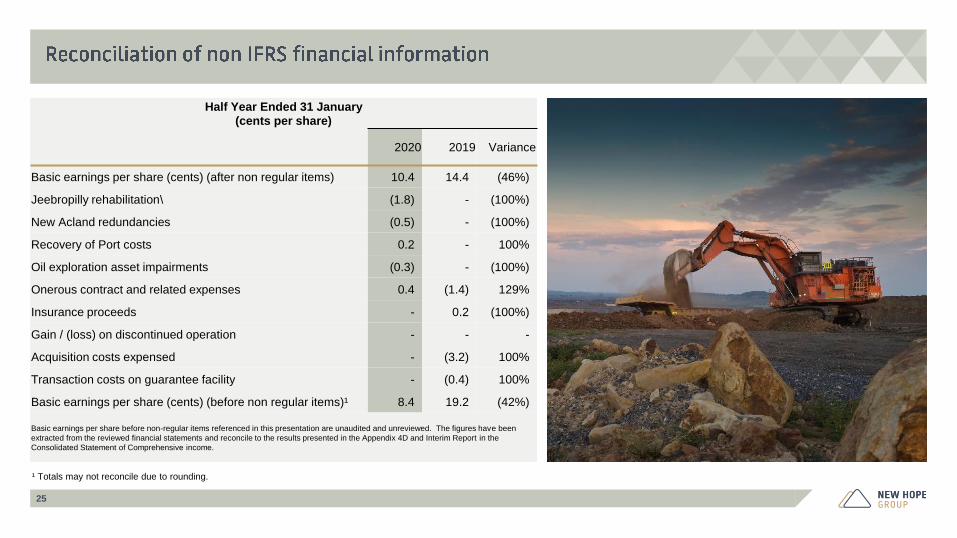
Half Year Ended 31 January
(cents per share)
2020 2019 Variance
Basic earnings per share (cents) (after non regular items) 10.4 14.4 (46%)
Jeebropilly rehabilitation\ (1.8) - (100%)
New Acland redundancies (0.5) - (100%)
Recovery of Port costs 0.2 - 100%
Oil exploration asset impairments (0.3) - (100%)
Onerous contract and related expenses 0.4 (1.4) 129%
Insurance proceeds - 0.2 (100%)
Gain / (loss) on discontinued operation - - -
Acquisition costs expensed - (3.2) 100%
Transaction costs on guarantee facility - (0.4) 100%
Basic earnings per share (cents) (before non regular items)¹ 8.4 19.2 (42%)
Basic earnings per share before non-regular items referenced in this presentation are unaudited and unreviewed. The figures have been
extracted from the reviewed financial statements and reconcile to the results presented in the Appendix 4D and Interim Report in the
Consolidated Statement of Comprehensive income.
¹ Totals may not reconcile due to rounding.
26
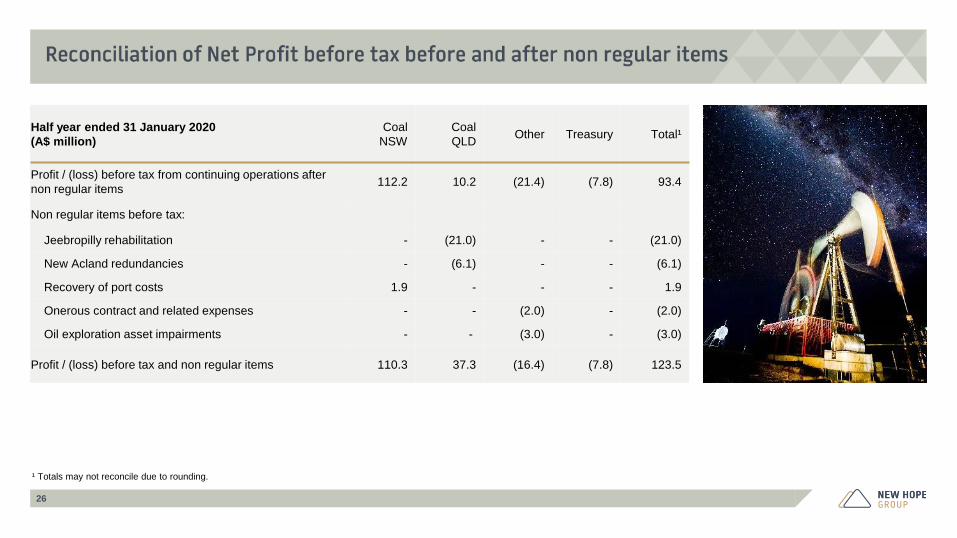
Half year ended 31 January 2020
(A$ million)
Coal
NSW
Coal
QLDOther Treasury Total¹
Profit / (loss) before tax from continuing operations after
non regular items112.2 10.2 (21.4) (7.8) 93.4
Non regular items before tax:
Jeebropilly rehabilitation - (21.0) - - (21.0)
New Acland redundancies - (6.1) - - (6.1)
Recovery of port costs 1.9 - - - 1.9
Onerous contract and related expenses - - (2.0) - (2.0)
Oil exploration asset impairments - - (3.0) - (3.0)
Profit / (loss) before tax and non regular items 110.3 37.3 (16.4) (7.8) 123.5
¹ Totals may not reconcile due to rounding.
27
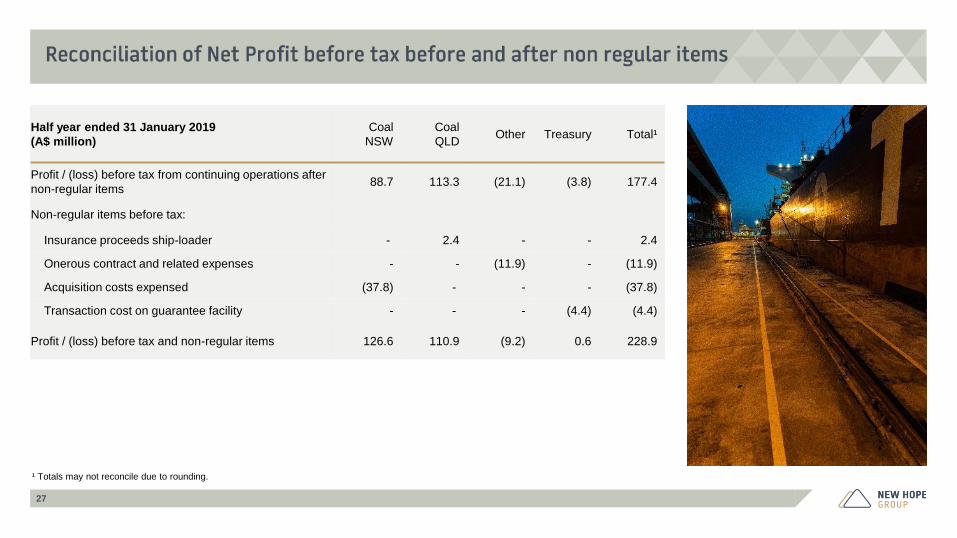
Half year ended 31 January 2019
(A$ million)
Coal
NSW
Coal
QLDOther Treasury Total¹
Profit / (loss) before tax from continuing operations after
non-regular items88.7 113.3 (21.1) (3.8) 177.4
Non-regular items before tax:
Insurance proceeds ship-loader - 2.4 - - 2.4
Onerous contract and related expenses - - (11.9) - (11.9)
Acquisition costs expensed (37.8) - - - (37.8)
Transaction cost on guarantee facility - - - (4.4) (4.4)
Profit / (loss) before tax and non-regular items 126.6 110.9 (9.2) 0.6 228.9
¹ Totals may not reconcile due to rounding.


![Exp Draft 1. - Financial Reporting Council · [DRAFT] STATEMENT ‘HALF-YEARLY FINANCIAL REPORTS’ 1-55 SUMMARY OBJECTIVE 1 SCOPE 2 HALF-YEARLY FINANCIAL REPORTS Role of the Half-Yearly](https://img.pdfslide.net/doc/110x75/5f9ba261de1189223d44f14d/exp-draft-1-financial-reporting-council-draft-statement-ahalf-yearly-financial.jpg)