Embed Size (px)
Citation preview

Half-Year Financial Report 2021

Nordea Half-Year Financial Report 2021
1
Q2
Half-year results 2021
Summary of the quarter:
• Strong result, with high income growth. Operating profit increased to EUR 1,338m from EUR 306m in the same period last year, driven by a significant increase in total operating income, strong cost control and low loan losses. Net interest income grew by 13% and net fee and commission income increased by 30%. Net fair value result was solid and at a more normalised level than in the first quarter.
• Continued strong growth in customer business volumes across Nordics. Nordea drove high levels of business activity and gained market shares across the Nordics. Mortgage volumes continued to grow significantly, increasing by 6%, year on year, and SME lending increased by 8%. Assets under management increased by 24% to an all-time high of EUR 387bn, driven by strong performance and continued solid net inflows, especially into retail funds and Private Banking.
• Underlying costs unchanged – outlook updated due to significantly higher business activity. Total costs excluding resolution fees increased by 9% due to the inclusion of Nordea Finance Equipment, higher variable pay linked to strong performance and exchange rate effects. Adjusted for these items, costs were unchanged. Given this, costs for 2021 are now expected to be around EUR 4.6bn (previously below EUR 4.6bn).
• Strong credit quality with net loan loss reversals. Net loan losses and similar net result amounted to net reversals of EUR 51m or 6bp in the quarter, compared with a 85bp charge in the same quarter last year.
Realised net loan losses remained at low levels. Net loan losses in 2021 are expected to be significantly below the 2020 level.
• Cost-to-income ratio and profitability improving. Nordea's cost-to-income ratio improved to 49% from 52% a year ago, supported by strong income growth and improved cost efficiency. Return on equity increased to 11.4%, despite the very high equity base arising from undistributed dividends and excess capital. Earnings per share increased to EUR 0.25 from EUR 0.06.
• Strong capital generation – capital position among best in Europe. Nordea’s CET1 ratio increased to 18.0% from 15.8% a year ago, even after the deduction of the unpaid dividends for 2019-20 and the accrued 2021 dividend. As previously disclosed, Nordea is ready to distribute the unpaid 2019-20 dividends (totalling EUR 0.72 per share) in October, after the current restrictions are repealed. Nordea also plans to start share buy-backs and has commenced the application process.
• On track to meet 2022 financial targets. Nordea continues to focus on its three key priorities: to create great customer experiences, drive income growth initiatives and optimise operational efficiency. Nordea is progressing well towards consistent delivery of its financial targets: a cost-to-income ratio of 50% and a return on equity above 10%.
(For further viewpoints, see the CEO comment on page 2. For definitions,
see page 54).
Group quarterly results and key ratios Q2 2021
Q2 2021 Q2 2020 Chg % Q1 2021 Chg %
Jan-Jun 2021
Jan-Jun 2020 Chg %
EURm
Net interest income 1,232 1,091 13 1,212 2 2,444 2,200 11
Net fee and commission income 878 673 30 827 6 1,705 1,438 19
Net fair value result 278 316 -12 370 -25 648 426 52
Other income 30 10 200 11 173 41 28 46
Total operating income 2,418 2,090 16 2,420 0 4,838 4,092 18
Total operating expenses excluding resolution fees -1,131 -1,039 9 -1,095 3 -2,226 -2,134 4 Total operating expenses -1,131 -1,088 4 -1,319 -14 -2,450 -2,336 5
Profit before loan losses 1,287 1,002 28 1,101 17 2,388 1,756 36
Net loan losses and similar net result 51 -696 -52 -1 -851
Operating profit 1,338 306 337 1,049 28 2,387 905 164
Cost-to-income ratio with amortised resolution fees, % 49 52 48 48 55
Return on equity with amortised resolution fees, % 11.4 3.0 11.0 11.2 5.0
Diluted earnings per share, EUR 0.25 0.06 0.19 0.44 0.17
For further information:
Frank Vang-Jensen, President and Group CEO, +358 503 821 391 Ian Smith, Group CFO, +45 5547 8372
Matti Ahokas, Head of Investor Relations, +358 405 759 178 Ulrika Romantschuk, Head of Brand, Communication and Marketing, +358 10 416 8023
Nordea is a leading Nordic universal bank. We are helping our customers realise their dreams and aspirations – and we have done that for 200 years. We want
to make a real difference for our customers and the communities where we operate – by being a strong and personal financial partner. The Nordea share is
listed on the Nasdaq Helsinki, Nasdaq Copenhagen and Nasdaq Stockholm exchanges. Read more about us on nordea.com
Nordea Half-Year Financial Report 2021
2
Q2
CEO comment
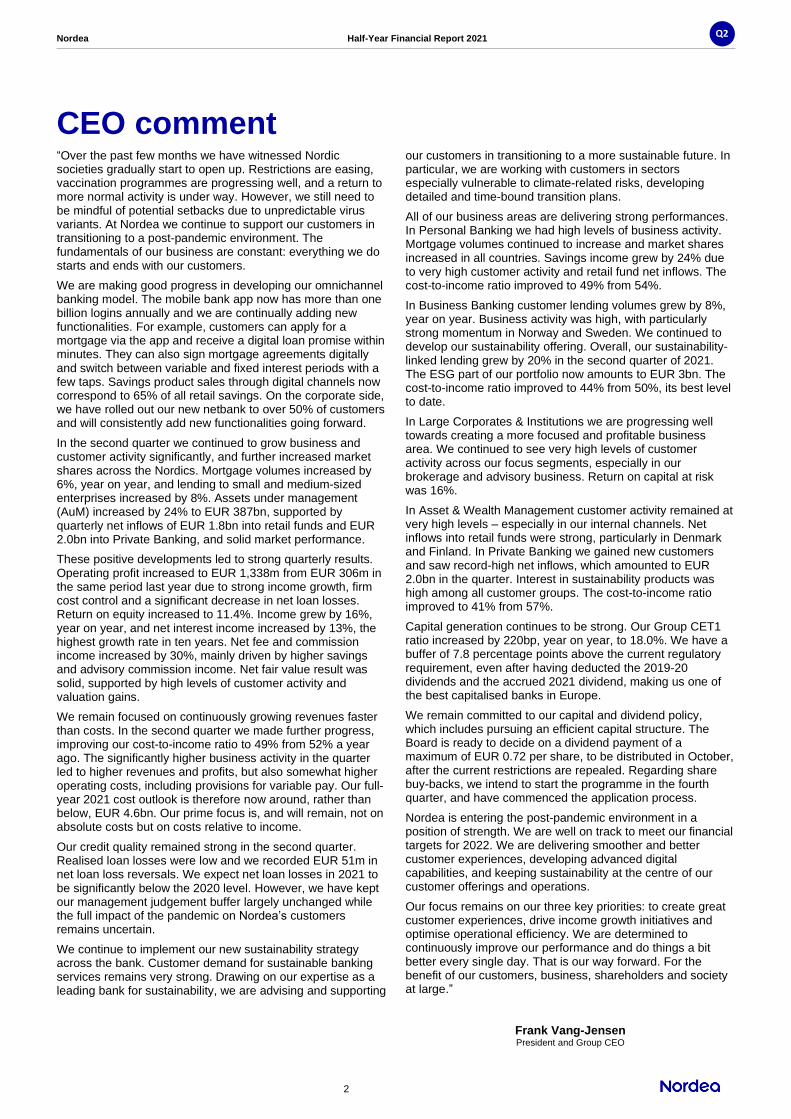
“Over the past few months we have witnessed Nordic societies gradually start to open up. Restrictions are easing, vaccination programmes are progressing well, and a return to more normal activity is under way. However, we still need to be mindful of potential setbacks due to unpredictable virus variants. At Nordea we continue to support our customers in transitioning to a post-pandemic environment. The fundamentals of our business are constant: everything we do starts and ends with our customers.
We are making good progress in developing our omnichannel banking model. The mobile bank app now has more than one billion logins annually and we are continually adding new functionalities. For example, customers can apply for a mortgage via the app and receive a digital loan promise within minutes. They can also sign mortgage agreements digitally and switch between variable and fixed interest periods with a few taps. Savings product sales through digital channels now correspond to 65% of all retail savings. On the corporate side, we have rolled out our new netbank to over 50% of customers and will consistently add new functionalities going forward.
In the second quarter we continued to grow business and customer activity significantly, and further increased market shares across the Nordics. Mortgage volumes increased by 6%, year on year, and lending to small and medium-sized enterprises increased by 8%. Assets under management (AuM) increased by 24% to EUR 387bn, supported by quarterly net inflows of EUR 1.8bn into retail funds and EUR 2.0bn into Private Banking, and solid market performance.
These positive developments led to strong quarterly results. Operating profit increased to EUR 1,338m from EUR 306m in the same period last year due to strong income growth, firm cost control and a significant decrease in net loan losses. Return on equity increased to 11.4%. Income grew by 16%, year on year, and net interest income increased by 13%, the highest growth rate in ten years. Net fee and commission income increased by 30%, mainly driven by higher savings and advisory commission income. Net fair value result was solid, supported by high levels of customer activity and valuation gains.
We remain focused on continuously growing revenues faster than costs. In the second quarter we made further progress, improving our cost-to-income ratio to 49% from 52% a year ago. The significantly higher business activity in the quarter led to higher revenues and profits, but also somewhat higher operating costs, including provisions for variable pay. Our full-year 2021 cost outlook is therefore now around, rather than below, EUR 4.6bn. Our prime focus is, and will remain, not on absolute costs but on costs relative to income.
Our credit quality remained strong in the second quarter. Realised loan losses were low and we recorded EUR 51m in net loan loss reversals. We expect net loan losses in 2021 to be significantly below the 2020 level. However, we have kept our management judgement buffer largely unchanged while the full impact of the pandemic on Nordea’s customers remains uncertain.
We continue to implement our new sustainability strategy across the bank. Customer demand for sustainable banking services remains very strong. Drawing on our expertise as a leading bank for sustainability, we are advising and supporting
our customers in transitioning to a more sustainable future. In particular, we are working with customers in sectors especially vulnerable to climate-related risks, developing detailed and time-bound transition plans.
All of our business areas are delivering strong performances. In Personal Banking we had high levels of business activity. Mortgage volumes continued to increase and market shares increased in all countries. Savings income grew by 24% due to very high customer activity and retail fund net inflows. The cost-to-income ratio improved to 49% from 54%.
In Business Banking customer lending volumes grew by 8%, year on year. Business activity was high, with particularly strong momentum in Norway and Sweden. We continued to develop our sustainability offering. Overall, our sustainability-linked lending grew by 20% in the second quarter of 2021. The ESG part of our portfolio now amounts to EUR 3bn. The cost-to-income ratio improved to 44% from 50%, its best level to date.
In Large Corporates & Institutions we are progressing well towards creating a more focused and profitable business area. We continued to see very high levels of customer activity across our focus segments, especially in our brokerage and advisory business. Return on capital at risk was 16%.
In Asset & Wealth Management customer activity remained at very high levels – especially in our internal channels. Net inflows into retail funds were strong, particularly in Denmark and Finland. In Private Banking we gained new customers and saw record-high net inflows, which amounted to EUR 2.0bn in the quarter. Interest in sustainability products was high among all customer groups. The cost-to-income ratio improved to 41% from 57%.
Capital generation continues to be strong. Our Group CET1 ratio increased by 220bp, year on year, to 18.0%. We have a buffer of 7.8 percentage points above the current regulatory requirement, even after having deducted the 2019-20 dividends and the accrued 2021 dividend, making us one of the best capitalised banks in Europe.
We remain committed to our capital and dividend policy, which includes pursuing an efficient capital structure. The Board is ready to decide on a dividend payment of a maximum of EUR 0.72 per share, to be distributed in October, after the current restrictions are repealed. Regarding share buy-backs, we intend to start the programme in the fourth quarter, and have commenced the application process.
Nordea is entering the post-pandemic environment in a position of strength. We are well on track to meet our financial targets for 2022. We are delivering smoother and better customer experiences, developing advanced digital capabilities, and keeping sustainability at the centre of our customer offerings and operations.
Our focus remains on our three key priorities: to create great customer experiences, drive income growth initiatives and optimise operational efficiency. We are determined to continuously improve our performance and do things a bit better every single day. That is our way forward. For the benefit of our customers, business, shareholders and society at large.”
Frank Vang-Jensen President and Group CEO
Nordea Half-Year Financial Report 2021
3
Q2
Outlook
Key priorities to meet 2022 financial targets
Nordea’s business plan focuses on three key priorities to meet its 2022 financial targets: 1) to optimise operational efficiency, 2) to drive income growth initiatives, and 3) to create great customer experiences.
Financial targets for 2022
Nordea’s financial targets for 2022 are:
• a return on equity above 10%
• a cost-to-income ratio of 50%
Costs (operating expenses)
New: Total costs for 2021 are expected to be around EUR 4.6bn.
Previous: Total costs for 2021 are expected to be below EUR 4.6bn.
Capital policy
A management buffer of 150-200bp above the regulatory CET1 requirement, from 1 January 2021.
Dividend policy
Nordea’s dividend policy stipulates a dividend payout ratio of 60-70%, applicable to profit generated from 1 January 2021. Nordea will continuously assess the opportunity to use share buy-backs as a tool to distribute excess capital.
Credit quality
New: Net loan losses in 2021 are expected to be significantly below the 2020 level. Previous: N/A
Nordea Half-Year Financial Report 2021
4
Q2
Table of contents
Income statement ............................................................................................................................ 5 Macroeconomy and financial markets .......................................................................................... 6 Group results and performance
Second quarter 2021 ......................................................................................................................................... 7 Net interest income ........................................................................................................................ 7
Net fee and commission income ................................................................................................... 8
Net result from items at fair value ................................................................................................. 9
Total operating income .................................................................................................................. 9
Total expenses ............................................................................................................................. 10
Net loan losses and similar net result ........................................................................................ 11
Credit portfolio ............................................................................................................................. 11
Profit ............................................................................................................................................. 12
Capital position and risk exposure amount ................................................................................ 13
Regulatory developments ............................................................................................................ 13
Balance sheet ............................................................................................................................... 15
Funding and liquidity operations ................................................................................................ 15
Market risk .................................................................................................................................... 15
Other information............................................................................................................................................ 16
Quarterly development, Group ...................................................................................................... 17
Business areas
Financial overview by business area............................................................................................................. 18 Personal Banking............................................................................................................................................ 19 Business Banking ........................................................................................................................................... 22 Large Corporates & Institutions..................................................................................................................... 25
Asset & Wealth Management ......................................................................................................................... 27
Group Functions ............................................................................................................................................. 31
Financial statements
Nordea Group .................................................................................................................................................. 32
Notes to the financial statements .................................................................................................................. 36
Nordea Bank Abp ............................................................................................................................................ 55

Nordea Half-Year Financial Report 2021
5
Q2
Income statement
Q2 2021
Q2 2020 Chg %
Local curr. %
Q1 2021 Chg %
Local curr. %
Jan-Jun 2021
Jan-Jun 2020 Chg %
Local curr. %
EURm
Net interest income 1,232 1,091 13 7 1,212 2 1 2,444 2,200 11 7
Net fee and commission income 878 673 30 27 827 6 6 1,705 1,438 19 16
Net result from items at fair value 278 316 -12 -9 370 -25 -25 648 426 52 59
Profit from associated undertakings and joint
ventures accounted for under the equity method 3 -10 -130 -130 -14 -121 -123 -11 -12 -8 -17
Other operating income 27 20 35 35 25 8 13 52 40 30 28
Total operating income 2,418 2,090 16 12 2,420 0 0 4,838 4,092 18 16
Staff costs -705 -645 9 7 -682 3 3 -1,387 -1,344 3 1
Other expenses -262 -303 -14 -17 -486 -46 -47 -748 -722 4 1
Depreciation, amortisation and impairment
charges of tangible and intangible assets -164 -140 17 15 -151 9 9 -315 -270 17 14
Total operating expenses -1,131 -1,088 4 1 -1,319 -14 -14 -2,450 -2,336 5 3
Profit before loan losses 1,287 1,002 28 24 1,101 17 17 2,388 1,756 36 33
Net loan losses and similar net result 51 -696 -107 -107 -52 -198 -200 -1 -851 -100 -100
Operating profit 1,338 306 337 316 1,049 28 27 2,387 905 164 157
Income tax expense -313 -63 397 368 -261 20 19 -574 -202 184 177
Net profit for the period 1,025 243 322 303 788 30 30 1,813 703 158 151
Business volumes, key items1
30 Jun
2021 30 Jun
2020 Chg % Local
curr. % 31 Mar
2021 Chg % Local
curr. %
EURbn
Loans to the public 338.4 328.0 3 1 333.6 1 1 Loans to the public, excl. repos/securities borrowing 317.2 299.0 6 3 314.5 1 1 Deposits and borrowings from the public 204.6 188.5 9 6 198.2 3 3 Deposits from the public, excl. repos/securities lending 196.2 179.6 9 7 191.5 2 2 Total assets 586.8 587.3 0 591.1 -1 Assets under management 387.4 311.4 24 371.7 4 Equity 35.5 31.8 12 34.5 3
Ratios and key figures2
Q2
2021 Q2
2020 Chg % Q1
2021 Chg % Jan-Jun
2021 Jan-Jun
2020 Chg %
Diluted earnings per share (DEPS), EUR 0.25 0.06 317 0.19 32 0.44 0.17 159 EPS, rolling 12 months up to period end, EUR 0.83 0.27 207 0.64 30 0.83 0.27 207 Share price1, EUR 9.40 6.15 53 8.41 12 9.40 6.15 53 Equity per share1, EUR 8.79 7.86 12 8.53 3 8.79 7.86 12 Potential shares outstanding1, million 4,050 4,050 0 4,050 0 4,050 4,050 0 Weighted average number of diluted shares, million 4,041 4,039 0 4,040 0 4,040 4,038 0 Return on equity, % 11.9 3.1 284 9.4 27 10.7 4.5 138 Return on tangible equity, % 13.4 3.5 10.6 12.0 5.1 Return on risk exposure amount, % 2.7 0.6 2.0 2.4 0.9 Return on equity with amortised resolution fees, % 11.4 3.0 11.0 11.2 5.0 Cost-to-income ratio, % 47 52 -10 55 -14 51 57 -11 Cost-to-income ratio with amortised resolution fees, % 49 52 48 48 55 Net loan loss ratio, incl. loans held at fair value, bp -6 85 6 0 52 Common Equity Tier 1 capital ratio1,3, % 18.0 15.8 14 17.5 3 18.0 15.8 14 Tier 1 capital ratio1,3, % 19.5 17.6 11 19.2 1 19.5 17.6 11 Total capital ratio1,3, % 21.3 20.1 6 20.9 2 21.3 20.1 6 Tier 1 capital1,3, EURbn 29.6 27.2 9 29.6 0 29.6 27.2 9 Risk exposure amount1, EURbn 152.2 154.6 -2 154.0 -1 152.2 154.6 -2 Return on capital at risk, % 17.7 3.8 13.6 15.7 5.5 Return on capital at risk with amortised resolution fees, % 17.0 3.8 15.8 16.4 6.1 Number of employees (FTEs)1 27,510 27,954 -2 27,800 -1 27,510 27,954 -2 Economic capital1, EURbn 23.2 24.2 -4 23.4 -1 23.2 24.2 -4 1 End of period.
2 For more detailed information regarding ratios and key figures defined as alternative performance measures,
see https://www.nordea.com/en/investor-relations/reports-and-presentations/group-interim-reports. 3 Including the result for the period.
Nordea Half-Year Financial Report 2021
6
Q2
Macroeconomy and financial markets1
Economic outlook Prospects for the global economy are improving, with vaccine roll-outs gaining speed and societies gradually reopening. After a mixed first quarter, which saw new containment measures introduced in many countries, data indicates a strong recovery in the second quarter of 2021, particularly in the advanced economies. Fiscal and monetary policy continue to support the recovery, and global growth is expected to be close to 6% in 2021 as a whole. Suppliers’ delivery times in the manufacturing sector increased during the second quarter due to bottlenecks in various parts of the global value chain. At the same time, surging commodity prices and transportation costs led to sharp increases in producer and consumer prices. Ten-year government bond yields declined in the US and increased only slightly in the euro area amid dovish central bank rhetoric. Equity markets continued to perform strongly. The Nordic countries have been among the best performing economies globally during the pandemic. While the four countries developed somewhat differently in the first quarter of 2021, data points to a strong recovery in all of them in the second quarter.
Denmark Danish GDP fell by 1.0%, quarter on quarter, in the first quarter of 2021. Household consumption contracted by 4.4% due to the harsh lockdown of society at the beginning of the year. On the other hand, exports increased by 3.9%, with particularly strong growth in goods exports. A gradual reopening of the Danish economy began on 1 March. This caused a sharp drop in the unemployment rate, which stood at 4.0% in May. House and apartment prices have increased markedly over the past 12 months and were 14.9% and 17.3% higher, respectively, in June 2021 than in the same month last year. Consumer price inflation (year on year) stood at 1.7% in June 2021, the highest level since 2012. The Danish krone has appreciated against the euro since the independent interest rate hike in March 2020. Consequently, Danmarks Nationalbank has been intervening in the foreign exchange market since February.
Finland Finnish GDP was broadly unchanged, down 0.1%, quarter on quarter, in the first quarter of 2021. Private consumption declined by 0.7% and the household savings rate jumped to 7% of disposable income due to a deterioration in the COVID-19 situation. However, investments in both construction and machinery grew for the first time in a year, reflecting an improved outlook for the industry sector and housing market. Unemployment is declining steadily. The rate stood at 7.6% in May, and job vacancies are already back at pre-pandemic levels. Apartment prices increased by 3.9%, year on year, in May. Consumer price inflation (year on year) stood at 2.0% in June. The surge in inflation has mainly been driven by higher energy prices.
Norway Norwegian mainland GDP fell by 1.0%, quarter on quarter, in the first quarter of 2021. However, mainland economic activity increased markedly during the second quarter, in tandem with the reopening of society. The normalisation of economic conditions is clearly visible in unemployment figures, which fell to 3.0% in June. House and apartment price growth has moderated lately. Prices were 10.1% higher in June 2021 than in the same month last year. Consumer price inflation (year on year) stood at 2.9% in June, driven higher by increased energy prices. Going forward, we expect inflation to moderate. Norges Bank has stated that the first rate hike will be in September. According to the central bank’s latest rate path, the key interest rate will rise from 0.0% to 1.0% by next summer. We expect the Norwegian krone to strengthen moderately against the euro, supported by the rate hikes.
Sweden Swedish GDP grew by 0.8%, quarter on quarter, in the first quarter of 2021. Exports continued to perform well and domestic demand improved. Growth indicators for the coming quarters are upbeat. The situation in the labour market continued to improve, with the unemployment rate falling to 7.9% in June. House and apartment prices increased markedly and were 21.4% and 12.1% higher, respectively, in May 2021 than in the same month last year. Consumer price inflation (year on year) peaked in April at 2.2% before declining to 1.3% in June. Modest wage increases and a stronger krona are balancing rising commodity prices and higher transport costs globally. Sveriges Riksbank kept its repo rate unchanged at 0.0% and signalled that it would remain unchanged for the coming three years. The quantitative easing programme was maintained and will cover the remainder of 2021. The trade-weighted Swedish krona strengthened by 1% in the course of the second quarter.
1Source: Nordea Economic Research
Nordea Half-Year Financial Report 2021
7
Q2
Group results and performanceSecond quarter 2021
Net interest income
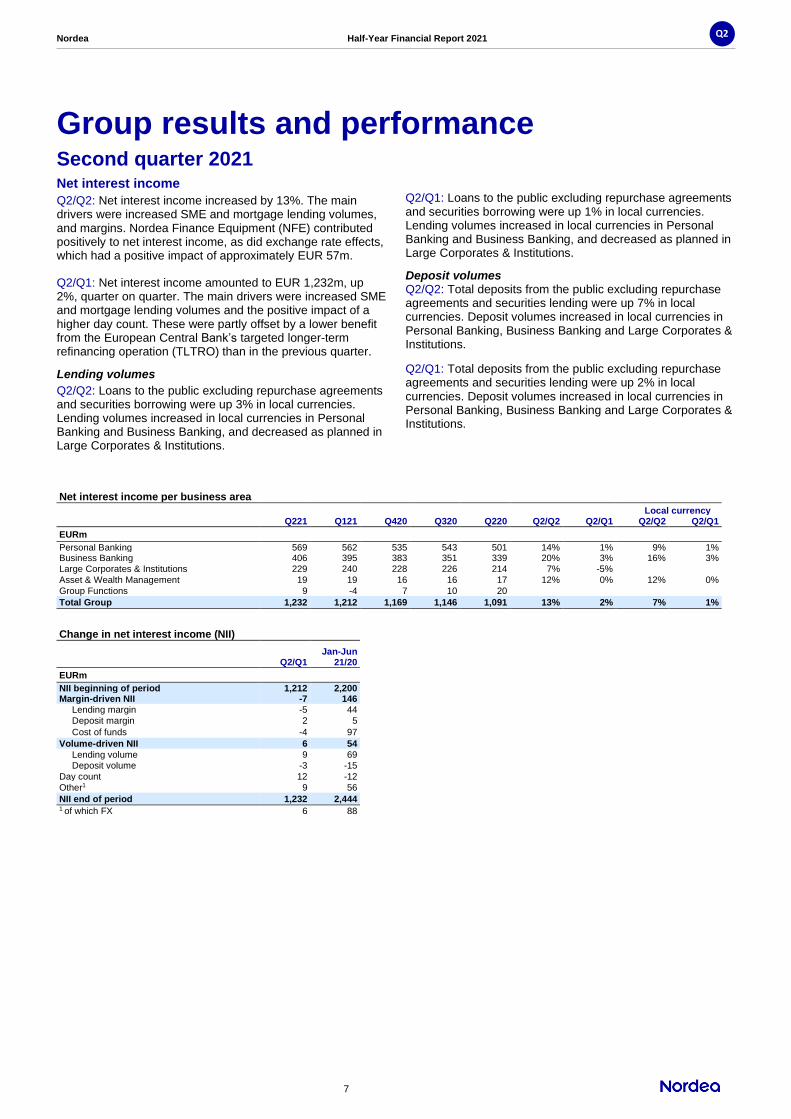
Q2/Q2: Net interest income increased by 13%. The main drivers were increased SME and mortgage lending volumes, and margins. Nordea Finance Equipment (NFE) contributed positively to net interest income, as did exchange rate effects, which had a positive impact of approximately EUR 57m.
Q2/Q1: Net interest income amounted to EUR 1,232m, up 2%, quarter on quarter. The main drivers were increased SME and mortgage lending volumes and the positive impact of a higher day count. These were partly offset by a lower benefit from the European Central Bank’s targeted longer-term refinancing operation (TLTRO) than in the previous quarter.
Lending volumes
Q2/Q2: Loans to the public excluding repurchase agreements and securities borrowing were up 3% in local currencies. Lending volumes increased in local currencies in Personal Banking and Business Banking, and decreased as planned in Large Corporates & Institutions.
Q2/Q1: Loans to the public excluding repurchase agreements and securities borrowing were up 1% in local currencies. Lending volumes increased in local currencies in Personal Banking and Business Banking, and decreased as planned in Large Corporates & Institutions.
Deposit volumes Q2/Q2: Total deposits from the public excluding repurchase agreements and securities lending were up 7% in local currencies. Deposit volumes increased in local currencies in Personal Banking, Business Banking and Large Corporates & Institutions. Q2/Q1: Total deposits from the public excluding repurchase agreements and securities lending were up 2% in local currencies. Deposit volumes increased in local currencies in Personal Banking, Business Banking and Large Corporates & Institutions.
Net interest income per business area
Local currency
Q221 Q121 Q420 Q320 Q220 Q2/Q2 Q2/Q1 Q2/Q2 Q2/Q1
EURm
Personal Banking 569 562 535 543 501 14% 1% 9% 1% Business Banking 406 395 383 351 339 20% 3% 16% 3% Large Corporates & Institutions 229 240 228 226 214 7% -5%
Asset & Wealth Management 19 19 16 16 17 12% 0% 12% 0%
Group Functions 9 -4 7 10 20
Total Group 1,232 1,212 1,169 1,146 1,091 13% 2% 7% 1%
Change in net interest income (NII)
Q2/Q1 Jan-Jun
21/20
EURm NII beginning of period 1,212 2,200 Margin-driven NII -7 146 Lending margin -5 44 Deposit margin 2 5 Cost of funds -4 97 Volume-driven NII 6 54 Lending volume 9 69 Deposit volume -3 -15 Day count 12 -12 Other1 9 56 NII end of period 1,232 2,444 1 of which FX 6 88

Nordea Half-Year Financial Report 2021
8
Q2
Net fee and commission income Q2/Q2: Net fee and commission income increased by 30%. The main drivers were growth in net income from savings and investments and an increase in lending-related net fee and commission income. Payment and card fee income also contributed positively, having increased from the subdued levels seen in the second quarter of 2020.
Q2/Q1: Net fee and commission income increased by 6% to EUR 878m. The main driver was growth in savings and investment commission income.
Savings and investment commissions
Q2/Q2: Net fee and commission income from savings and
investments increased by 37%, mainly driven by growth in assets under management (AuM) and higher levels of customer activity in the brokerage and advisory business.
Q2/Q1: Net fee and commission income from savings and investments increased by 10% to EUR 617m, mainly driven by growth in AuM and higher levels of customer activity in the brokerage and advisory business. End-of-period AuM increased by 4%, or EUR 16bn, to EUR 387bn, with a net inflow of EUR 2.6bn during the quarter.
Payments and cards and lending-related commissions
Q2/Q2: Net fee and commission income from payments and
cards increased by 10%, up from the subdued levels seen in the second quarter of 2020, which were driven by COVID-19. Lending-related net fee and commission income increased by 20%, mainly due to higher levels of customer activity.
Q2/Q1: Net fee and commission income from payments and
cards was unchanged at EUR 115m. Lending-related net fee and commission income decreased by 1% to EUR 144m.
Net fee and commission income per business area
Local currency
Q221 Q121 Q420 Q320 Q220 Q2/Q2 Q2/Q1 Q2/Q2 Q2/Q1
EURm
Personal Banking 317 296 290 279 267 19% 7% 17% 7%
Business Banking 159 166 159 135 125 27% -4% 22% -4%
Large Corporates & Institutions 163 137 116 118 101 61% 19%
Asset & Wealth Management 244 235 228 204 186 31% 4% 30% 3%
Group Functions -5 -7 -1 -7 -6
Total Group 878 827 792 729 673 30% 6% 27% 6%
Net fee and commission income per category Local currency
Q221 Q121 Q420 Q320 Q220 Q2/Q2 Q2/Q1 Q2/Q2 Q2/Q1
EURm
Savings and investments, net 617 563 552 493 450 37% 10% 35% 10%
Payments and cards, net 115 115 110 110 105 10% 0% 7% 0%
Lending-related, net 144 146 140 127 120 20% -1% 17% -1%
Other commissions, net 2 3 -10 -1 -2
Total Group 878 827 792 729 673 30% 6% 27% 6%
Assets under management (AuM), volumes and net flow
Net flow
Q221 Q121 Q420 Q320 Q220 Q221
EURbn
Nordic Retail funds 83.8 78.5 73.9 66.6 63.2 1.8
Private Banking 114.2 107.2 100.8 92.7 87.8 2.0
Institutional sales 124.6 124.5 121.4 112.7 108.5 -2.2
Life & Pension 64.8 61.6 57.6 54.2 51.9 1.0
Total 387.4 371.7 353.8 326.2 311.4 2.6
Nordea Half-Year Financial Report 2021
9
Q2
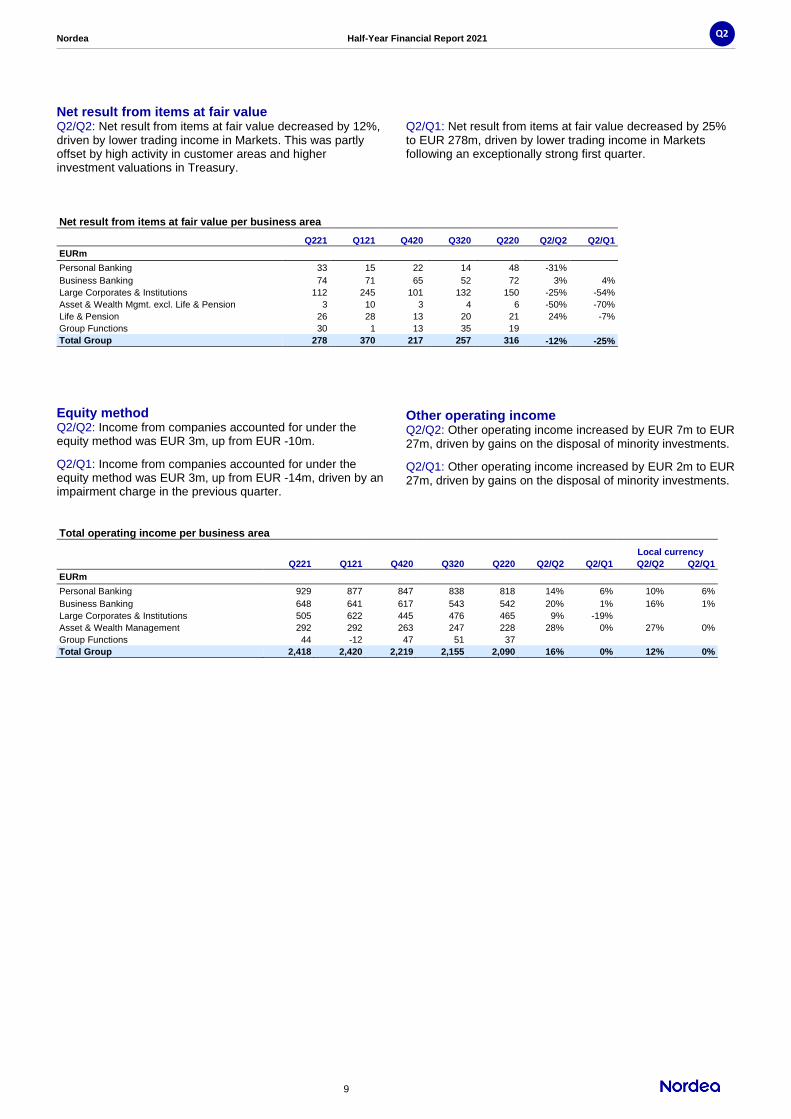
Net result from items at fair value Q2/Q2: Net result from items at fair value decreased by 12%, driven by lower trading income in Markets. This was partly offset by high activity in customer areas and higher investment valuations in Treasury.
Q2/Q1: Net result from items at fair value decreased by 25% to EUR 278m, driven by lower trading income in Markets following an exceptionally strong first quarter.
Net result from items at fair value per business area Q221 Q121 Q420 Q320 Q220 Q2/Q2 Q2/Q1
EURm
Personal Banking 33 15 22 14 48 -31%
Business Banking 74 71 65 52 72 3% 4%
Large Corporates & Institutions 112 245 101 132 150 -25% -54%
Asset & Wealth Mgmt. excl. Life & Pension 3 10 3 4 6 -50% -70%
Life & Pension 26 28 13 20 21 24% -7%
Group Functions 30 1 13 35 19
Total Group 278 370 217 257 316 -12% -25%
Equity method Q2/Q2: Income from companies accounted for under the equity method was EUR 3m, up from EUR -10m.
Q2/Q1: Income from companies accounted for under the equity method was EUR 3m, up from EUR -14m, driven by an impairment charge in the previous quarter.
Other operating income Q2/Q2: Other operating income increased by EUR 7m to EUR 27m, driven by gains on the disposal of minority investments.
Q2/Q1: Other operating income increased by EUR 2m to EUR 27m, driven by gains on the disposal of minority investments.
Total operating income per business area
Local currency
Q221 Q121 Q420 Q320 Q220 Q2/Q2 Q2/Q1 Q2/Q2 Q2/Q1
EURm
Personal Banking 929 877 847 838 818 14% 6% 10% 6%
Business Banking 648 641 617 543 542 20% 1% 16% 1%
Large Corporates & Institutions 505 622 445 476 465 9% -19%
Asset & Wealth Management 292 292 263 247 228 28% 0% 27% 0%
Group Functions 44 -12 47 51 37
Total Group 2,418 2,420 2,219 2,155 2,090 16% 0% 12% 0%
Nordea Half-Year Financial Report 2021
10
Q2
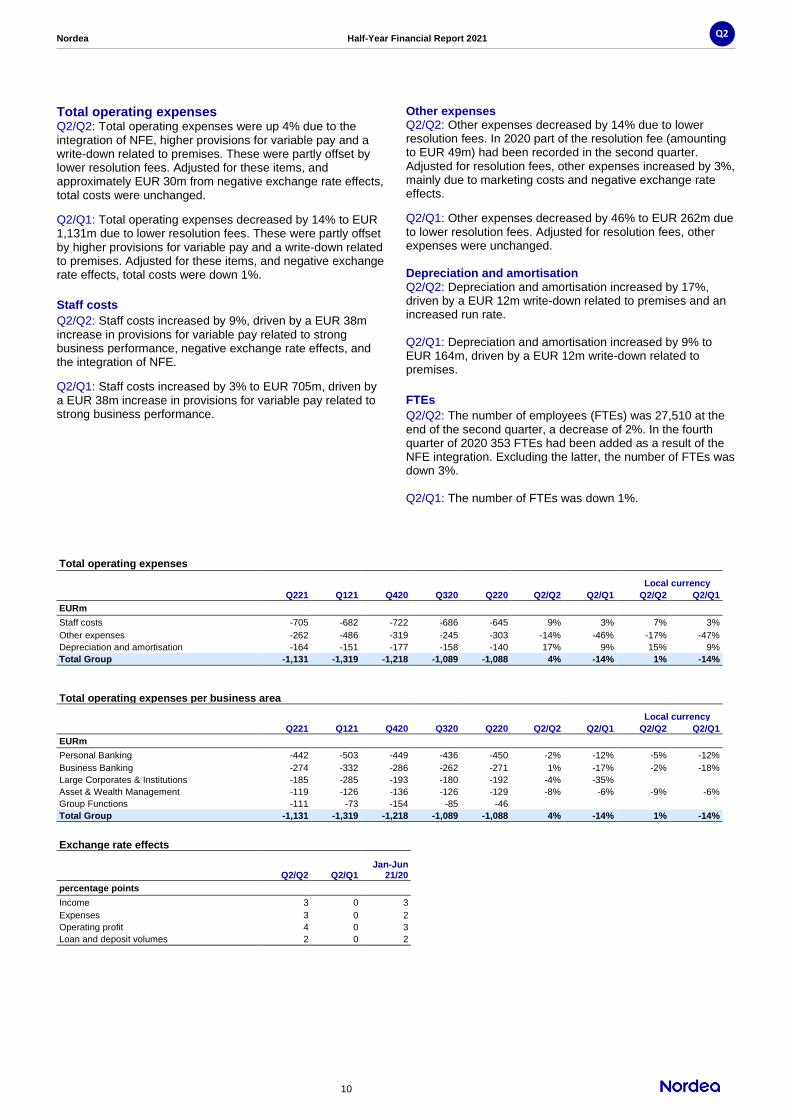
Total operating expenses Q2/Q2: Total operating expenses were up 4% due to the integration of NFE, higher provisions for variable pay and a write-down related to premises. These were partly offset by lower resolution fees. Adjusted for these items, and approximately EUR 30m from negative exchange rate effects, total costs were unchanged.
Q2/Q1: Total operating expenses decreased by 14% to EUR 1,131m due to lower resolution fees. These were partly offset by higher provisions for variable pay and a write-down related to premises. Adjusted for these items, and negative exchange rate effects, total costs were down 1%.
Staff costs
Q2/Q2: Staff costs increased by 9%, driven by a EUR 38m increase in provisions for variable pay related to strong business performance, negative exchange rate effects, and the integration of NFE.
Q2/Q1: Staff costs increased by 3% to EUR 705m, driven by a EUR 38m increase in provisions for variable pay related to strong business performance.
Other expenses Q2/Q2: Other expenses decreased by 14% due to lower resolution fees. In 2020 part of the resolution fee (amounting to EUR 49m) had been recorded in the second quarter. Adjusted for resolution fees, other expenses increased by 3%, mainly due to marketing costs and negative exchange rate effects.
Q2/Q1: Other expenses decreased by 46% to EUR 262m due to lower resolution fees. Adjusted for resolution fees, other expenses were unchanged. Depreciation and amortisation Q2/Q2: Depreciation and amortisation increased by 17%, driven by a EUR 12m write-down related to premises and an increased run rate. Q2/Q1: Depreciation and amortisation increased by 9% to EUR 164m, driven by a EUR 12m write-down related to premises.
FTEs
Q2/Q2: The number of employees (FTEs) was 27,510 at the end of the second quarter, a decrease of 2%. In the fourth quarter of 2020 353 FTEs had been added as a result of the NFE integration. Excluding the latter, the number of FTEs was down 3%. Q2/Q1: The number of FTEs was down 1%.
Total operating expenses
Local currency
Q221 Q121 Q420 Q320 Q220 Q2/Q2 Q2/Q1 Q2/Q2 Q2/Q1
EURm
Staff costs -705 -682 -722 -686 -645 9% 3% 7% 3%
Other expenses -262 -486 -319 -245 -303 -14% -46% -17% -47%
Depreciation and amortisation -164 -151 -177 -158 -140 17% 9% 15% 9%
Total Group -1,131 -1,319 -1,218 -1,089 -1,088 4% -14% 1% -14%
Total operating expenses per business area
Local currency
Q221 Q121 Q420 Q320 Q220 Q2/Q2 Q2/Q1 Q2/Q2 Q2/Q1
EURm
Personal Banking -442 -503 -449 -436 -450 -2% -12% -5% -12%
Business Banking -274 -332 -286 -262 -271 1% -17% -2% -18%
Large Corporates & Institutions -185 -285 -193 -180 -192 -4% -35%
Asset & Wealth Management -119 -126 -136 -126 -129 -8% -6% -9% -6%
Group Functions -111 -73 -154 -85 -46
Total Group -1,131 -1,319 -1,218 -1,089 -1,088 4% -14% 1% -14%
Exchange rate effects
Q2/Q2 Q2/Q1 Jan-Jun
21/20
percentage points
Income 3 0 3
Expenses 3 0 2
Operating profit 4 0 3
Loan and deposit volumes 2 0 2

Nordea Half-Year Financial Report 2021
11
Q2
Net loan losses and similar net result The Nordea Group’s net loan losses and similar net result for the second quarter amounted to net reversals of EUR 51m (6bp).
The performance of our credit portfolio remained strong in the quarter, despite the ongoing pandemic. We kept our total management judgement allowance largely unchanged at EUR 610m, thereby ensuring an adequate reserve to cover potential credit losses related to COVID-19.
Main drivers of loan losses and similar net result Net loan losses on individual exposures (stage 3) amounted to EUR 50m. Individual provisions and write-offs were very low, apart from some additional individual provisions on the Shipping, oil and offshore portfolio. Collective provisions (stages 1, 2 and 3) were reduced by EUR 80m. Of this, EUR 50m was released to reflect more favourable macroeconomic scenarios and credit portfolio development and EUR 30m related to IFRS 9 model updates based on enhanced data and model methodology.
A revaluation gain of EUR 21m was recognised in relation to Nordea Kredit’s mortgage portfolio, largely driven by increases in house prices. A gain of EUR 11m had been recognised in the first quarter of 2021.
Net loan losses and similar net result therefore amounted to net reversals in all business areas: EUR 2m in Personal Banking, EUR 30m in Business Banking, EUR 13m in Large Corporates & Institutions, EUR 3m in Asset & Wealth Management, and EUR 3m in Group Functions.
COVID-19 impacts Portfolio credit quality was stable and strong throughout the quarter, with slightly positive net rating migration and a continued reduction in new defaults. It can still be expected that some customers will suffer from pandemic-related restrictions, especially where government support measures are no longer available to counter their impact. We continue to closely monitor the evolution of credit risk in the sectors affected by COVID-19 and maintain a close dialogue with the affected customers.
Nordea provided COVID-19-related instalment-free periods for more than 100,000 customers, mainly in 2020, equivalent to a total loan amount of EUR 19bn. More than half of these periods have now expired. Those remaining equate to a total loan amount of EUR 8.0bn, corresponding to 2% of Nordea’s lending portfolio. Of this, EUR 7.7bn relates to mortgage loans in Sweden.
Less than 5% of the customers who were granted instalment-free periods due to the pandemic have been classified as forborne (or in default) following the expiry of their instalment-free period, according to our standard credit risk assessment criteria.
Management judgement allowance The total cyclical management judgement allowance of EUR 455m remained unchanged.
The structural management judgement allowance was reduced by EUR 40m to EUR 155m. The release was used as planned to offset corresponding increases in provisions resulting from updates to the IFRS 9 model, particularly regarding the impact of time in default, in line with the European Central Bank’s provisioning recommendations for non-performing loans.
Accordingly, the total management judgement allowance now stands at EUR 610m.
See Note 8 for further details.
Credit portfolio
Total lending to the public excluding reverse repurchase agreements and securities borrowing increased to EUR 317bn from EUR 315bn in the first quarter of 2021, corresponding to an increase of 1% in local currencies.
Loans to the public measured at fair value excluding reverse repurchase agreements decreased to EUR 62bn from EUR 63bn in the first quarter of 2021. At the end of the second quarter of 2021 the fair value portfolio mainly comprised Danish mortgage lending, which amounted to EUR 57bn, unchanged from the first quarter.
Lending to the public measured at amortised cost before allowances increased to EUR 263bn from EUR 260bn in the first quarter of 2021. Of this, 94% was classified as stage 1, 5% was stage 2 and 1% was stage 3. Compared with the distribution in the previous quarter, stage 1 increased slightly and stages 2 and 3 decreased slightly. The decrease in lending classified as stage 2 mainly related to enhanced data and model methodology, while the decrease in stage 3 mainly related to active credit risk management decisions. Stage 3 loans at amortised cost decreased by 15%, year on year, to EUR 3.7bn (1.4% of lending measured at amortised cost), and decreased by 7%, quarter on quarter. Stage 2 loans amounted to EUR 12.8bn (4.9% of lending measured at amortised cost), down 11%, quarter on quarter.
The coverage ratio was 3.4% for stage 2 (unchanged from the previous quarter) and 44% for stage 3 (up from 42% in the previous quarter). The gross impairment rate (stage 3) decreased to 1.41% for loans at amortised cost from 1.53% in the first quarter of 2021. The fair value impairment rate decreased to 1.09% from 1.31%. Net loan loss ratios
Q221 Q121 Q420 Q320 Q220
Basis points of loans, amortised cost1
Net loan loss ratios,
annualised, Group -5 10 9 0 115
of which stages 1 and 2 -21 -2 1 -10 66
of which stage 3 16 12 8 10 49
Basis points of loans, total1,2
Net loan loss ratio, including loans held at
fair value, annualised, Group -6 6 3 -2 85
Personal Banking total 0 2 3 -1 58
PeB Denmark -30 -12 -11 -3 50
PeB Finland 22 16 15 5 107
PeB Norway 0 2 9 -11 63
PeB Sweden 6 6 2 3 26
Business Banking total -13 7 11 -4 110
BB Denmark -38 -2 -2 -3 55
BB Finland 14 22 16 8 175
BB Norway -21 0 23 -16 155
BB Sweden -1 11 8 -3 93
Large Corporates & Institutions total -8 17 -1 -6 117
LC&I Denmark -16 -59 -10 -23 135
LC&I Finland 10 0 -5 -22 109
LC&I Norway -7 108 3 109 318
LC&I Sweden -19 5 22 -113 183 1 Negative amounts are net reversals. 2 Net loan losses and net result on loans in hold portfolios mandatorily
held at fair value divided by total lending at amortised cost and
at fair value, basis points.
Nordea Half-Year Financial Report 2021
12
Q2
Profit
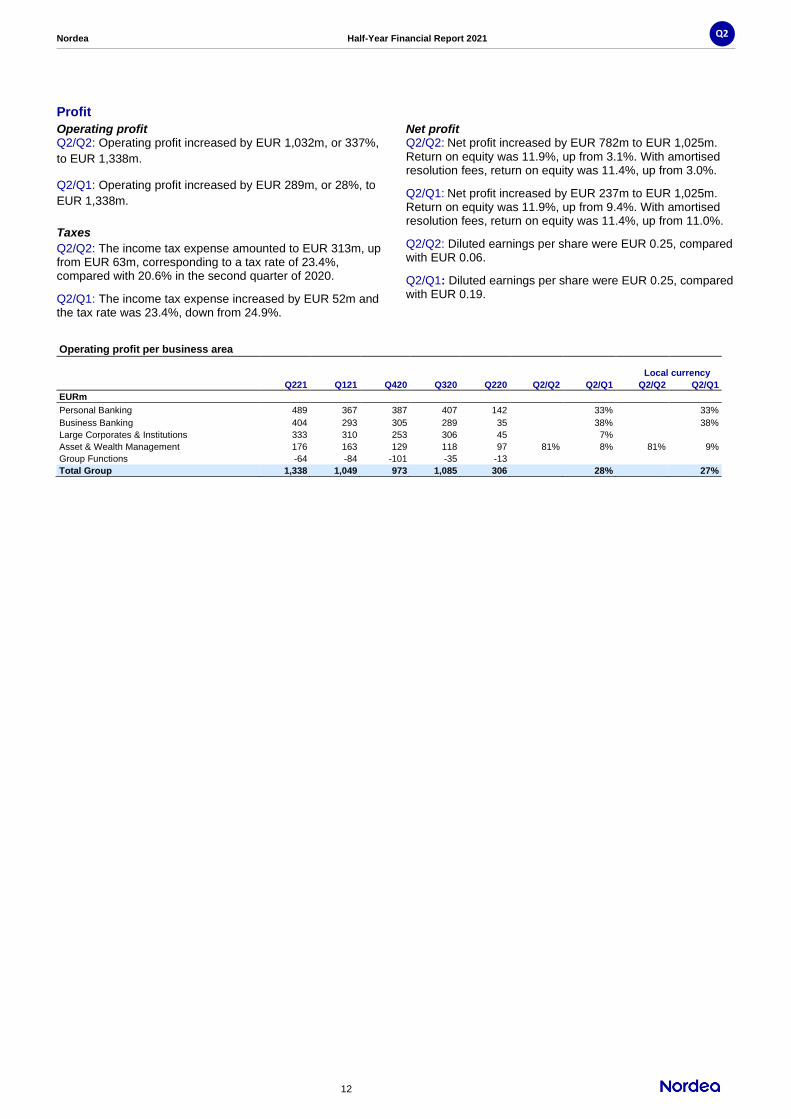
Operating profit Q2/Q2: Operating profit increased by EUR 1,032m, or 337%,
to EUR 1,338m.
Q2/Q1: Operating profit increased by EUR 289m, or 28%, to
EUR 1,338m.
Taxes
Q2/Q2: The income tax expense amounted to EUR 313m, up from EUR 63m, corresponding to a tax rate of 23.4%, compared with 20.6% in the second quarter of 2020.
Q2/Q1: The income tax expense increased by EUR 52m and the tax rate was 23.4%, down from 24.9%.
Net profit Q2/Q2: Net profit increased by EUR 782m to EUR 1,025m. Return on equity was 11.9%, up from 3.1%. With amortised resolution fees, return on equity was 11.4%, up from 3.0%.
Q2/Q1: Net profit increased by EUR 237m to EUR 1,025m. Return on equity was 11.9%, up from 9.4%. With amortised resolution fees, return on equity was 11.4%, up from 11.0%.
Q2/Q2: Diluted earnings per share were EUR 0.25, compared with EUR 0.06.
Q2/Q1: Diluted earnings per share were EUR 0.25, compared with EUR 0.19.
Operating profit per business area
Local currency
Q221 Q121 Q420 Q320 Q220 Q2/Q2 Q2/Q1 Q2/Q2 Q2/Q1
EURm
Personal Banking 489 367 387 407 142 33% 33%
Business Banking 404 293 305 289 35 38% 38%
Large Corporates & Institutions 333 310 253 306 45 7%
Asset & Wealth Management 176 163 129 118 97 81% 8% 81% 9%
Group Functions -64 -84 -101 -35 -13
Total Group 1,338 1,049 973 1,085 306 28% 27%

Nordea Half-Year Financial Report 2021
13
Q2
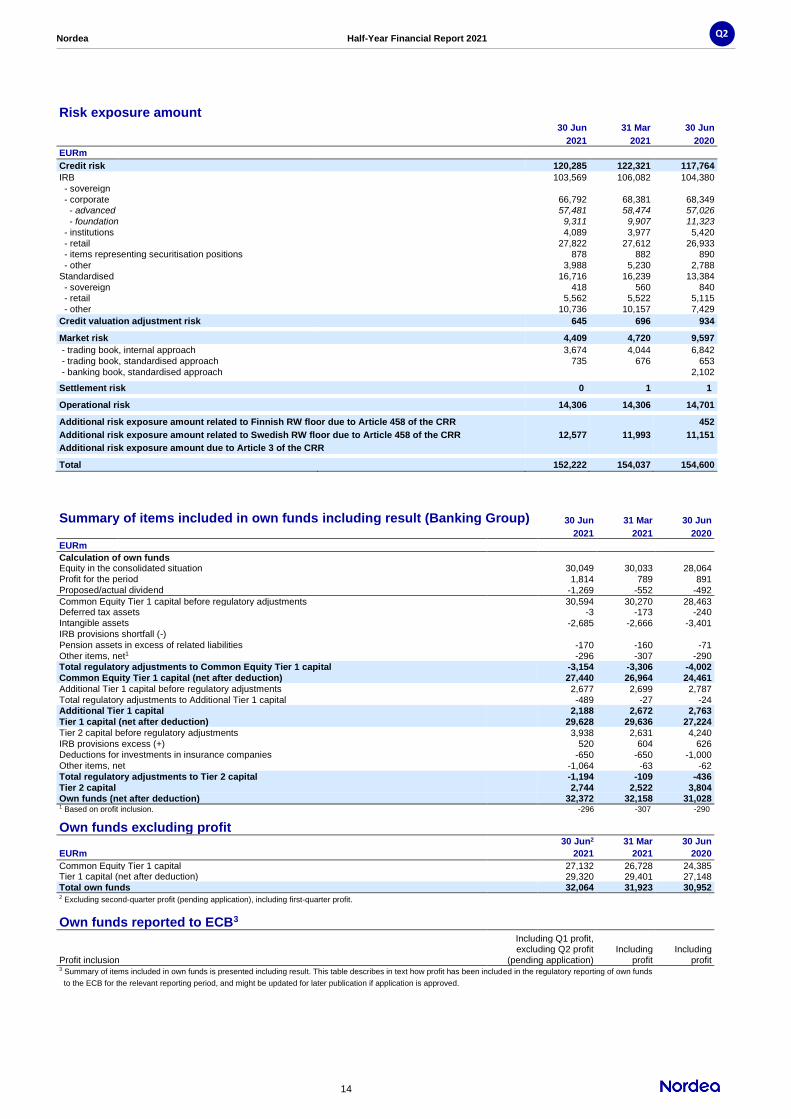
Capital position and risk exposure amount The Nordea Group’s Common Equity Tier 1 (CET1) capital ratio increased to 18.0% at the end of the second quarter from 17.5% in the first quarter of 2021. CET1 capital increased by EUR 0.5bn, mainly due to higher profit accumulation net of dividend accrual.
The risk exposure amount (REA) decreased by EUR 1.8bn, primarily due to favourable credit quality developments in the corporate and retail portfolios. Continued growth in retail mortgage lending and the final implementation of the Capital Requirements Regulation (CRR) II partly offset the REA decrease.
The Group’s Tier 1 capital ratio increased to 19.5% at the end of the quarter from 19.2% in the first quarter. The total capital ratio increased to 21.3% from 20.9%.
At the end of the second quarter CET1 capital amounted to EUR 27.4bn, Tier 1 capital amounted to EUR 29.6bn and own funds amounted to EUR 32.4bn.
The leverage ratio decreased to 5.3% in the second quarter from 5.6% in the first quarter of 2021. The reduction was mainly driven by the reinclusion of central bank exposures in the leverage ratio calculation after the final implementation of the CRR II. This was partly offset by a decrease in cash balances with central banks. Tier 1 capital remained stable during the period.
The Group’s economic capital amounted to EUR 23.2bn at the end of the second quarter, a decrease of EUR 0.2bn compared with the first quarter of 2021. The decrease was driven by a reduction in credit risk, which was mainly due to favourable credit quality effects.
Capital ratios Q221 Q121 Q420 Q320 Q220
%
CRR/CRD IV
CET1 capital ratio 18.0 17.5 17.1 16.4 15.8
Tier 1 capital ratio 19.5 19.2 18.7 18.2 17.6
Total capital ratio 21.3 20.9 20.5 19.9 20.1
Risk exposure amount, EURbn, quarterly
Common Equity Tier 1 capital ratio, changes in the quarter
Capital and dividend policy Nordea strives to maintain a strong capital position in line with its capital policy. Nordea’s policy is to hold a CET1 capital management buffer of 150-200bp above the CET1 capital ratio requirement (restriction level for maximum distributable amount, MDA). Nordea’s ambition is to distribute 60-70% of the net profit for the year to shareholders. Excess capital in relation to capital targets will be used for organic growth and strategic business acquisitions, as well as being subject to buy-back considerations. Regulatory developments In June both Denmark and Norway decided to increase their respective countercyclical capital buffer rates. In Denmark, the buffer rate will be set at 1.0% from the third quarter of 2022, and in Norway, the rate will be increased to 1.5% from the second quarter of 2022. In Finland and Sweden, the buffer rates were left unchanged, i.e. at 0%.
On 11 June the European Systemic Risk Board’s recommendation on the reciprocation of macroprudential measures in Norway was published in the EU Official Journal. The measures set the systemic risk buffer at 4.5% for Norwegian exposures and introduce risk weight floors of 20% for residential real estate and 35% for commercial real estate. Local supervisory authorities will decide how to respond to the recommendation. If they decide to reciprocate the measures, the risk weight floors should be implemented within three months and the systemic risk buffer within 18 months. The recommendation on the systemic risk buffer recognises the regulatory differences between Norway and the European Union and states that local supervisory authorities should ensure there are no overlaps in the different requirements when reciprocating. If the Finnish Financial Supervisory Authority (FSA) decides to reciprocate the measures, they would then also apply to the Nordea Group, leading to an estimated increase in the Group’s CET1 capital ratio requirement of up to 95bp.
On 18 June the European Central Bank announced that banks could continue to exclude certain central bank exposures from the leverage ratio, given the continued exceptional macroeconomic circumstances due to COVID-19. The exemption is valid until March 2022. Nordea has decided not to take advantage of this extension.
On 28 June the Finnish FSA decided to maintain the other systemically important institutions (O-SII) capital buffer for Finnish banks identified as systemically important. For Nordea, this means that the current O-SII buffer of 2% will be maintained.
During the quarter Nordea received the Single Resolution Board’s decision on the Nordea Group’s minimum requirements for own funds and eligible liabilities (MRELs). According to the decision, Nordea’s MREL requirements are 22.71% of the risk exposure amount (REA) and 5.98% of the leverage ratio exposure (LRE). Nordea’s MREL subordination requirements are 16.06% of the REA and 5.98% of the LRE. The own funds used by Nordea to comply with its combined buffer requirement (CBR) are not eligible to meet the MREL and MREL subordination requirements expressed as a percentage of the REA. As a result, the MREL and MREL subordination requirements including the second-quarter CBR of 4.73% of the REA are 27.44% and 20.79% of the REA, respectively. Both the MREL and MREL subordination requirements will be binding from 1 January 2022, with no transitional period. These requirements will be assessed and updated annually by the Single Resolution Board.
123 121
156163 160
156150 152 155
151155 154 152
Q218Q318Q418Q119Q219Q319Q419Q120Q220Q320Q420Q121Q221
Nordea Half-Year Financial Report 2021
14
Q2
Risk exposure amount 30 Jun 31 Mar 30 Jun 2021 2021 2020
EURm
Credit risk 120,285 122,321 117,764
IRB 103,569 106,082 104,380
- sovereign
- corporate 66,792 68,381 68,349 - advanced 57,481 58,474 57,026
- foundation 9,311 9,907 11,323
- institutions 4,089 3,977 5,420
- retail 27,822 27,612 26,933 - items representing securitisation positions 878 882 890
- other 3,988 5,230 2,788
Standardised 16,716 16,239 13,384
- sovereign 418 560 840 - retail 5,562 5,522 5,115
- other 10,736 10,157 7,429
Credit valuation adjustment risk 645 696 934
Market risk 4,409 4,720 9,597
- trading book, internal approach 3,674 4,044 6,842
- trading book, standardised approach 735 676 653
- banking book, standardised approach 2,102 Settlement risk 0 1 1
Operational risk 14,306 14,306 14,701
Additional risk exposure amount related to Finnish RW floor due to Article 458 of the CRR 452
Additional risk exposure amount related to Swedish RW floor due to Article 458 of the CRR 12,577 11,993 11,151
Additional risk exposure amount due to Article 3 of the CRR
Total 152,222 154,037 154,600
Summary of items included in own funds including result (Banking Group) 30 Jun 31 Mar 30 Jun 2021 2021 2020
EURm
Calculation of own funds Equity in the consolidated situation 30,049 30,033 28,064 Profit for the period 1,814 789 891 Proposed/actual dividend -1,269 -552 -492
Common Equity Tier 1 capital before regulatory adjustments 30,594 30,270 28,463 Deferred tax assets -3 -173 -240 Intangible assets -2,685 -2,666 -3,401 IRB provisions shortfall (-) Pension assets in excess of related liabilities -170 -160 -71 Other items, net1 -296 -307 -290 Total regulatory adjustments to Common Equity Tier 1 capital -3,154 -3,306 -4,002
Common Equity Tier 1 capital (net after deduction) 27,440 26,964 24,461
Additional Tier 1 capital before regulatory adjustments 2,677 2,699 2,787 Total regulatory adjustments to Additional Tier 1 capital -489 -27 -24 Additional Tier 1 capital 2,188 2,672 2,763
Tier 1 capital (net after deduction) 29,628 29,636 27,224
Tier 2 capital before regulatory adjustments 3,938 2,631 4,240 IRB provisions excess (+) 520 604 626 Deductions for investments in insurance companies -650 -650 -1,000 Other items, net -1,064 -63 -62 Total regulatory adjustments to Tier 2 capital -1,194 -109 -436
Tier 2 capital 2,744 2,522 3,804 Own funds (net after deduction) 32,372 32,158 31,028 1 Based on profit inclusion. -296 -307 -290
Own funds excluding profit
30 Jun2 31 Mar 30 Jun
EURm 2021 2021 2020
Common Equity Tier 1 capital 27,132 26,728 24,385 Tier 1 capital (net after deduction) 29,320 29,401 27,148 Total own funds 32,064 31,923 30,952 2 Excluding second-quarter profit (pending application), including first-quarter profit.
Own funds reported to ECB3
Profit inclusion
Including Q1 profit, excluding Q2 profit
(pending application) Including
profit Including
profit 3 Summary of items included in own funds is presented including result. This table describes in text how profit has been included in the regulatory reporting of own funds
to the ECB for the relevant reporting period, and might be updated for later publication if application is approved.
Nordea Half-Year Financial Report 2021
15
Q2
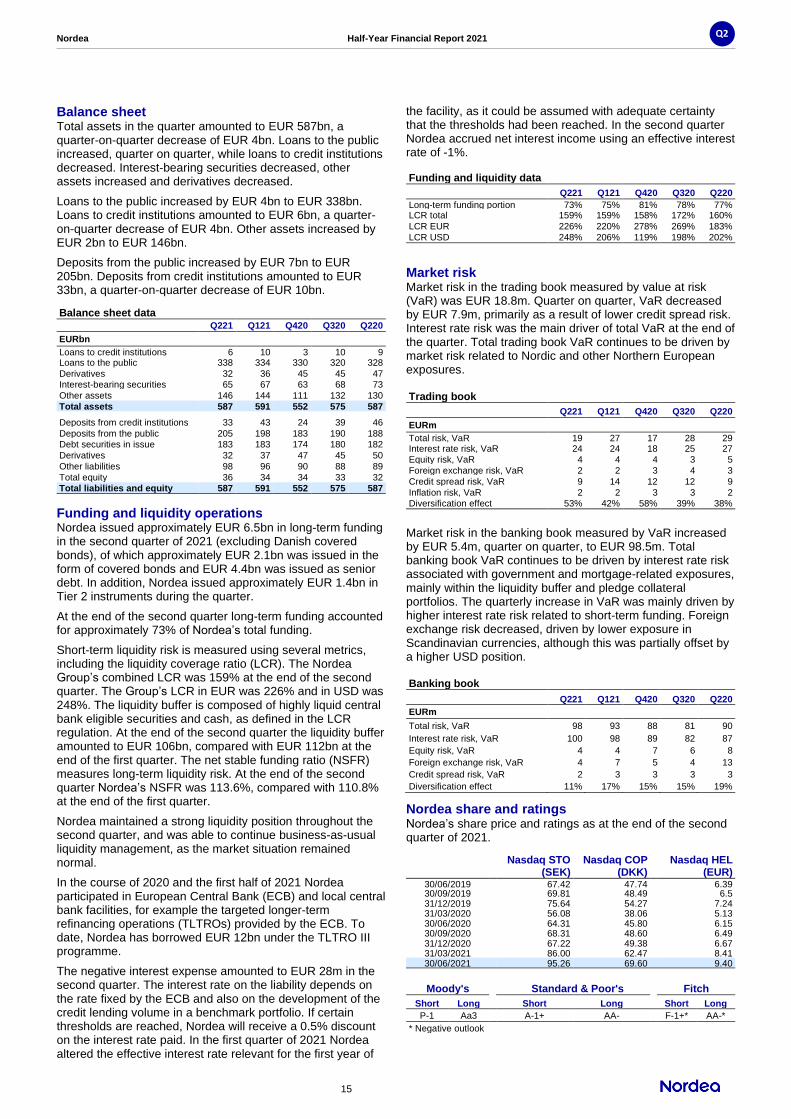
Balance sheet Total assets in the quarter amounted to EUR 587bn, a quarter-on-quarter decrease of EUR 4bn. Loans to the public increased, quarter on quarter, while loans to credit institutions decreased. Interest-bearing securities decreased, other assets increased and derivatives decreased.
Loans to the public increased by EUR 4bn to EUR 338bn. Loans to credit institutions amounted to EUR 6bn, a quarter-on-quarter decrease of EUR 4bn. Other assets increased by EUR 2bn to EUR 146bn.
Deposits from the public increased by EUR 7bn to EUR 205bn. Deposits from credit institutions amounted to EUR 33bn, a quarter-on-quarter decrease of EUR 10bn.
Balance sheet data Q221 Q121 Q420 Q320 Q220
EURbn
Loans to credit institutions 6 10 3 10 9 Loans to the public 338 334 330 320 328
Derivatives 32 36 45 45 47 Interest-bearing securities 65 67 63 68 73
Other assets 146 144 111 132 130
Total assets 587 591 552 575 587 Deposits from credit institutions 33 43 24 39 46
Deposits from the public 205 198 183 190 188 Debt securities in issue 183 183 174 180 182
Derivatives 32 37 47 45 50
Other liabilities 98 96 90 88 89
Total equity 36 34 34 33 32 Total liabilities and equity 587 591 552 575 587
Funding and liquidity operations Nordea issued approximately EUR 6.5bn in long-term funding in the second quarter of 2021 (excluding Danish covered bonds), of which approximately EUR 2.1bn was issued in the form of covered bonds and EUR 4.4bn was issued as senior debt. In addition, Nordea issued approximately EUR 1.4bn in Tier 2 instruments during the quarter.
At the end of the second quarter long-term funding accounted for approximately 73% of Nordea’s total funding.
Short-term liquidity risk is measured using several metrics, including the liquidity coverage ratio (LCR). The Nordea Group’s combined LCR was 159% at the end of the second quarter. The Group’s LCR in EUR was 226% and in USD was 248%. The liquidity buffer is composed of highly liquid central bank eligible securities and cash, as defined in the LCR regulation. At the end of the second quarter the liquidity buffer amounted to EUR 106bn, compared with EUR 112bn at the end of the first quarter. The net stable funding ratio (NSFR) measures long-term liquidity risk. At the end of the second quarter Nordea’s NSFR was 113.6%, compared with 110.8% at the end of the first quarter.
Nordea maintained a strong liquidity position throughout the second quarter, and was able to continue business-as-usual liquidity management, as the market situation remained normal.
In the course of 2020 and the first half of 2021 Nordea participated in European Central Bank (ECB) and local central bank facilities, for example the targeted longer-term refinancing operations (TLTROs) provided by the ECB. To date, Nordea has borrowed EUR 12bn under the TLTRO III programme.
The negative interest expense amounted to EUR 28m in the second quarter. The interest rate on the liability depends on the rate fixed by the ECB and also on the development of the credit lending volume in a benchmark portfolio. If certain thresholds are reached, Nordea will receive a 0.5% discount on the interest rate paid. In the first quarter of 2021 Nordea altered the effective interest rate relevant for the first year of
the facility, as it could be assumed with adequate certainty that the thresholds had been reached. In the second quarter Nordea accrued net interest income using an effective interest rate of -1%.
Funding and liquidity data Q221 Q121 Q420 Q320 Q220
Long-term funding portion 73% 75% 81% 78% 77% LCR total 159% 159% 158% 172% 160%
LCR EUR 226% 220% 278% 269% 183%
LCR USD 248% 206% 119% 198% 202%
Market risk
Market risk in the trading book measured by value at risk (VaR) was EUR 18.8m. Quarter on quarter, VaR decreased by EUR 7.9m, primarily as a result of lower credit spread risk. Interest rate risk was the main driver of total VaR at the end of the quarter. Total trading book VaR continues to be driven by market risk related to Nordic and other Northern European exposures.
Trading book
Q221 Q121 Q420 Q320 Q220
EURm
Total risk, VaR 19 27 17 28 29 Interest rate risk, VaR 24 24 18 25 27 Equity risk, VaR 4 4 4 3 5
Foreign exchange risk, VaR 2 2 3 4 3
Credit spread risk, VaR 9 14 12 12 9
Inflation risk, VaR 2 2 3 3 2 Diversification effect 53% 42% 58% 39% 38%
Market risk in the banking book measured by VaR increased by EUR 5.4m, quarter on quarter, to EUR 98.5m. Total banking book VaR continues to be driven by interest rate risk associated with government and mortgage-related exposures, mainly within the liquidity buffer and pledge collateral portfolios. The quarterly increase in VaR was mainly driven by higher interest rate risk related to short-term funding. Foreign exchange risk decreased, driven by lower exposure in Scandinavian currencies, although this was partially offset by a higher USD position.
Banking book
Q221 Q121 Q420 Q320 Q220
EURm
Total risk, VaR 98 93 88 81 90
Interest rate risk, VaR 100 98 89 82 87
Equity risk, VaR 4 4 7 6 8
Foreign exchange risk, VaR 4 7 5 4 13
Credit spread risk, VaR 2 3 3 3 3
Diversification effect 11% 17% 15% 15% 19%
Nordea share and ratings Nordea’s share price and ratings as at the end of the second quarter of 2021.
Nasdaq STO
(SEK) Nasdaq COP
(DKK) Nasdaq HEL
(EUR) 30/06/2019 67.42 47.74 6.39 30/09/2019 69.81 48.49 6.5 31/12/2019 75.64 54.27 7.24 31/03/2020 56.08 38.06 5.13 30/06/2020 64.31 45.80 6.15 30/09/2020 68.31 48.60 6.49 31/12/2020 67.22 49.38 6.67 31/03/2021 86.00 62.47 8.41 30/06/2021 95.26 69.60 9.40
Moody's Standard & Poor's Fitch
Short Long Short Long Short Long
P-1 Aa3 A-1+ AA- F-1+* AA-*
* Negative outlook
Nordea Half-Year Financial Report 2021
16
Q2
Other information
Closure of Nordea’s branch in Singapore Nordea’s Singapore branch was closed before the end of June 2021, according to plan.
Nordea Direct merger process ongoing The merger between Nordea Direct Bank ASA (formerly Gjensidige Bank ASA) and Nordea Bank Abp is ongoing, with the target completion date to be determined. The completion is subject to regulatory approval.
Update on the decision to close down Nordea’s operations in Russia In accordance with its strategy, Nordea is focusing on its business in the Nordic region. Consequently, the Group has decided to wind down its operations in Russia. On 24 March 2021 the Extraordinary General Meeting of JSC Nordea Bank decided to initiate the voluntary liquidation process, which was approved by the Central Bank of Russia on 16 April 2021.
Referral agreement with Citi for sub-custody services On 24 February 2021 Nordea announced that it would be exiting its Nordic sub-custody business and had entered into a strategic client referral agreement with Citi. Nordea recommends that its sub-custody clients appoint Citi as their new provider. Nordea is committed to ensuring that clients who do not migrate to Citi will be supported via an orderly transition to a service provider of their choice.
COVID-19 pandemic – governance, operational risk measures and further disclosures COVID-19 infection rates continued to fluctuate in the first half of 2021. Nordea’s Global Crisis Management team monitored the situation in each of the Nordic countries throughout this period.
Information on the financial and operational impacts of the COVID-19 pandemic on Nordea, as well as the measures taken to address these impacts, has been provided in this report. See “CEO comment”, “Outlook”, “Net loan losses and similar net result”, “Funding and liquidity operations”, “Other information”, “Business areas”, Note 1, “Accounting policies”, Note 7, “Net loan losses” and Note 8, “Loans and impairment”. Nordea has also identified risks caused by the COVID-19 pandemic given the uncertainty of the economic impact on the markets in which the Group operates. See Note 12, “Risks and uncertainties”.
Transfer of own shares pursuant to variable remuneration programmes Nordea transferred 1,063,981 and 10,593 own shares in April and May, respectively, without consideration, to participants in its variable remuneration programmes to settle its commitments. The transfers were based on the resolution of the Board of Directors announced on 24 March 2021. Following the transfer of own shares, Nordea holds 7,112,244 treasury shares for remuneration purposes.
Nordea Half-Year Financial Report 2021
17
Q2
Quarterly development, Group
Q2 Q1 Q4 Q3 Q2 Jan-Jun Jan-Jun
2021 2021 2020 2020 2020 2021 2020
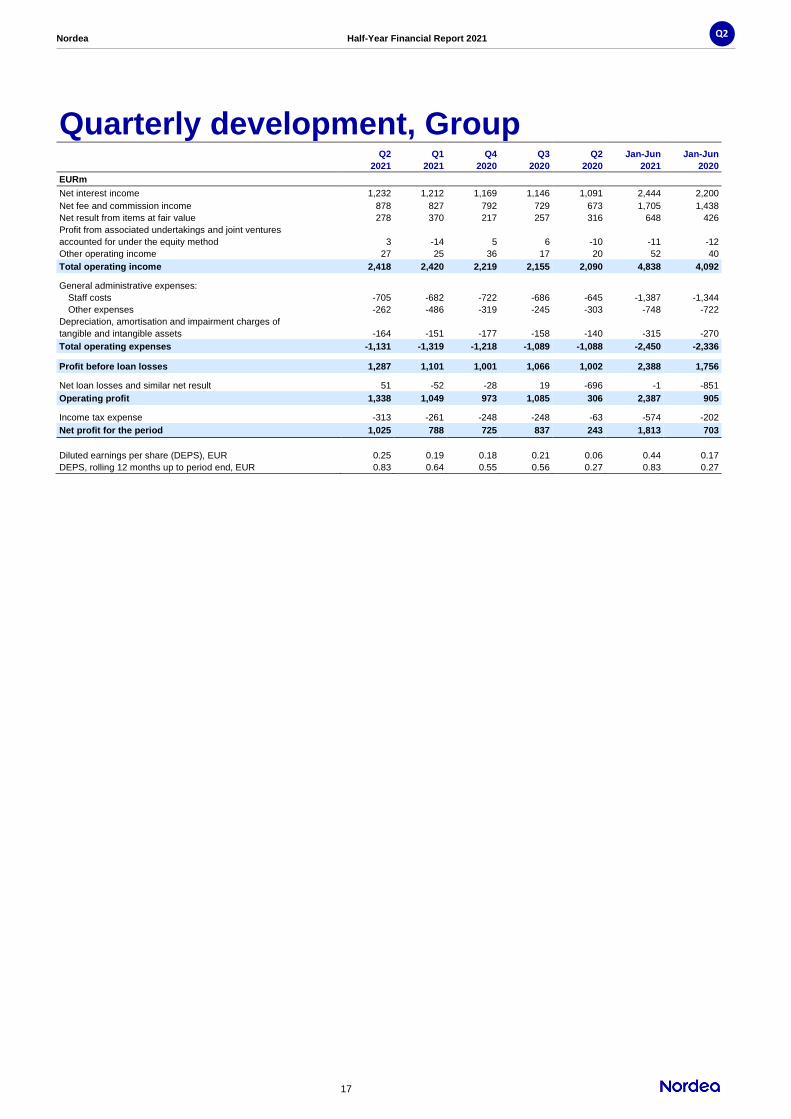
EURm Net interest income 1,232 1,212 1,169 1,146 1,091 2,444 2,200
Net fee and commission income 878 827 792 729 673 1,705 1,438
Net result from items at fair value 278 370 217 257 316 648 426
Profit from associated undertakings and joint ventures
accounted for under the equity method 3 -14 5 6 -10 -11 -12
Other operating income 27 25 36 17 20 52 40
Total operating income 2,418 2,420 2,219 2,155 2,090 4,838 4,092
General administrative expenses:
Staff costs -705 -682 -722 -686 -645 -1,387 -1,344
Other expenses -262 -486 -319 -245 -303 -748 -722
Depreciation, amortisation and impairment charges of
tangible and intangible assets -164 -151 -177 -158 -140 -315 -270
Total operating expenses -1,131 -1,319 -1,218 -1,089 -1,088 -2,450 -2,336
Profit before loan losses 1,287 1,101 1,001 1,066 1,002 2,388 1,756
Net loan losses and similar net result 51 -52 -28 19 -696 -1 -851
Operating profit 1,338 1,049 973 1,085 306 2,387 905
Income tax expense -313 -261 -248 -248 -63 -574 -202
Net profit for the period 1,025 788 725 837 243 1,813 703
Diluted earnings per share (DEPS), EUR 0.25 0.19 0.18 0.21 0.06 0.44 0.17
DEPS, rolling 12 months up to period end, EUR 0.83 0.64 0.55 0.56 0.27 0.83 0.27

Nordea Half-Year Financial Report 2021
18
Q2
Business areas
Personal Banking
Business Banking
Large Corporates & Institutions
Asset & Wealth Management
Group Functions Nordea Group
Q2 Q1 Q2 Q1 Q2 Q1 Q2 Q1 Q2 Q1 Q2 Q1
2021 2021 2021 2021 2021 2021 2021 2021 2021 2021 2021 2021 Chg
EURm
Net interest income 569 562 406 395 229 240 19 19 9 -4 1,232 1,212 2%
Net fee and commission income 317 296 159 166 163 137 244 235 -5 -7 878 827 6%
Net result from items at fair value 33 15 74 71 112 245 29 38 30 1 278 370 -25%
Equity method & other income 10 4 9 9 1 0 0 0 10 -2 30 11
Total operating income 929 877 648 641 505 622 292 292 44 -12 2,418 2,420 0%
Total operating expenses -442 -503 -274 -332 -185 -285 -119 -126 -111 -73 -1,131 -1,319 -14%
Net loan losses and similar net result 2 -7 30 -16 13 -27 3 -3 3 1 51 -52
Operating profit 489 367 404 293 333 310 176 163 -64 -84 1,338 1,049 28%
Cost-to-income ratio1, % 49 52 44 45 41 34 41 42 49 48
Return on capital at risk1, % 19 17 18 15 16 19 31 33 17 16
Economic capital (EC) 7,759 7,603 6,734 6,740 5,802 6,102 1,731 1,639 1,141 1,289 23,167 23,373 -1%
Risk exposure amount (REA) 47,008 46,464 44,014 43,698 40,518 42,095 8,552 8,294 12,130 13,486 152,222 154,037 -1%
Number of employees (FTEs) 7,017 6,976 4,446 4,572 1,330 1,398 2,744 2,718 11,973 12,136 27,510 27,800 -1%
Volumes, EURbn2:
Total lending 167.3 164.6 95.2 94.0 43.5 45.0 10.6 10.1 0.6 0.8 317.2 314.5 1%
Total deposits 85.8 83.5 52.8 50.6 48.4 43.4 11.0 10.5 -1.8 3.5 196.2 191.5 2%
1 With amortised resolution fees.
2 Excluding repurchase agreements and security lending/borrowing agreements.
Personal Banking
Business Banking
Large Corporates & Institutions
Asset & Wealth Management
Group Functions Nordea Group
Jan-Jun Jan-Jun Jan-Jun Jan-Jun Jan-Jun Jan-Jun
2021 2020 2021 2020 2021 2020 2021 2020 2021 2020 2021 2020 Chg
EURm
Net interest income 1,131 1,016 801 686 469 435 38 35 5 28 2,444 2,200 11%
Net fee and commission income 613 562 325 275 300 225 479 386 -12 -10 1,705 1,438 19%
Net result from items at fair value 48 64 145 144 357 212 67 62 31 -56 648 426 52%
Equity method & other income 14 4 18 11 1 0 0 4 8 9 41 28 46%
Total operating income 1,806 1,646 1,289 1,116 1,127 872 584 487 32 -29 4,838 4,092 18%
Total operating expenses -945 -918 -606 -579 -470 -459 -245 -259 -184 -121 -2,450 -2,336 5%
Net loan losses and similar net result -5 -265 14 -298 -14 -280 0 -2 4 -6 -1 -851
Operating profit 856 463 697 239 643 133 339 226 -148 -156 2,387 905
Cost-to-income ratio1, % 51 54 45 50 37 47 42 53 48 55
Return on capital at risk1, % 18 9 17 6 18 4 32 26 16 6
Economic capital (EC) 7,759 7,700 6,734 6,525 5,802 7,020 1,731 1,249 1,141 1,711 23,167 24,205 -4%
Risk exposure amount (REA) 47,008 45,695 44,014 41,375 40,518 47,863 8,552 5,587 12,130 14,080 152,222 154,600 -2%
Number of employees (FTEs) 7,017 7,282 4,446 4,269 1,330 1,649 2,744 2,735 11,973 12,019 27,510 27,954 -2%
Volumes, EURbn2:
Total lending 167.3 154.8 95.2 85.8 43.5 48.9 10.6 8.8 0.6 0.7 317.2 299.0 6%
Total deposits 85.8 80.5 52.8 47.0 48.4 42.3 11.0 11.1 -1.8 -1.3 196.2 179.6 9%
1 With amortised resolution fees.
2 Excluding repurchase agreements and security lending/borrowing agreements.

Nordea Half-Year Financial Report 2021
19
Q2
Personal Banking
Introduction In Personal Banking we strive to deliver great customer experiences to household customers. We offer a full range of financial services and products through a combination of physical and digital channels. We are a trusted and personal financial partner to our household customers and provide them with easy and convenient ways to fulfil their everyday banking needs, as well as sound advice to support them in the context of key life events.
Business development In the second quarter we saw lending volumes increase by 5% in local currencies, year on year, driven by strong mortgage activity: mortgage volumes were up 6%. We continued to grow our mortgage market shares across the Nordics, focusing on customer service, speed, availability and disciplined pricing. Other lending volumes, including consumer loans, increased by 1%, year on year, supported by a slight pickup during the quarter. Deposit volumes increased by 4%. We continue to strengthen our omnichannel banking model to deliver better customer experiences. We started the migration to the new netbank platform in Denmark and Norway and saw the first features go live for customers during the second quarter. The new platform provides customers with easier and more convenient access to our services and support. We also extended our account aggregation service to customers in Finland, enabling them to get an overview of all their accounts, including those outside Nordea. Our mobile bank app now has more than one billion logins annually and we are continually adding new functionalities. During the quarter we made it easier for customers to manage their mortgages through digital channels. For example, around 44% of all online loan promise applications submitted by customers in Sweden are now approved within minutes. New features in the mobile bank also enable Swedish customers to adjust their loan repayments through the app. In Denmark, we began transitioning to a seamless loan promise application process across multiple channels, where advisers can start, take over and approve customer applications quickly and efficiently. This has reduced the loan handling time from days to minutes. The strong savings and investments momentum continued in the second quarter, with further increases in monthly savings (up 25%, year on year). Customer advisory sessions with our robot adviser, Nora, increased by 77%, year on year, and monthly inflows were up 59%. After a very positive result in the first quarter, customer satisfaction decreased somewhat in the second quarter. Customer satisfaction in Sweden remained stable, but decreased in the other countries. The drivers in each market are well understood. For example, in Denmark, the decrease was expected following changes to the threshold for negative interest rates on deposits. Improving customer satisfaction in each of the Nordic countries remains a key focus area for Personal Banking.
Financial outcome
Total income increased by 14%, year on year, driven by continued strong mortgage lending growth and increased savings income. Net interest income increased by 14%, year on year, driven by strong mortgage volume growth across all countries, higher deposit margins in Denmark and Norway, and higher lending margins in Sweden. Quarter on quarter, net interest income increased by 1% due to mortgage volume growth and higher lending margins in Norway. These developments were partly offset by lower lending margins in Sweden. Net fee and commission income increased by 19%, year on year, due to higher savings and investment income. Net result from items at fair value decreased by 31%, year on year, due to changes to income recognition principles for collar loans which took effect in the third quarter of 2020. Total expenses decreased by 2%, year on year. In 2020 part of the resolution fee had been booked in the second quarter. Adjusted for resolution fees, total expenses were unchanged, as lower staff costs were offset by higher depreciation and amortisation. This resulted in an improved cost-to-income ratio of 49%, down from 54% in the second quarter of 2020. Total net loan losses and similar net result amounted to net reversals of EUR 2m (0bp), compared with net losses of EUR 226m in the same quarter last year. The lower level was mainly due to the 2020 management judgement allowances made in anticipation of both potential COVID-19-related losses and the impact of the IFRS 9 model implementation. The strong business momentum and lower net loan losses contributed to a significant year-on-year increase in operating profit, which amounted to EUR 489m. Return on capital at risk was 19%, compared with 6% in the same quarter last year.
Personal Banking Denmark Net interest income increased by 5% in local currency, year on year, driven by mortgage volume growth and higher deposit margins. Lending volumes increased by 6% in local currency, year on year, driven by a 6% increase in mortgage lending. Deposit volumes were unchanged. Net fee and commission income increased by 24% in local currency, year on year, mainly due to higher savings and investment income and higher lending fee income. Net loan losses and similar net result amounted to net reversals of EUR 33m (30bp), driven by IFRS 9 model updates and the positive revaluation of Nordea Kredit’s mortgage portfolio. Individual loan losses remained at low levels. Year on year, net loan losses and similar net result improved significantly, as management judgement allowances had been booked in the second quarter of 2020.

Nordea Half-Year Financial Report 2021
20
Q2
Personal Banking Finland
Net interest income increased by 11%, year on year, driven by mortgage volume growth and improved mortgage margins. Lending volumes increased by 5%, year on year, driven by a 6% increase in mortgage volumes. Deposit volumes increased by 8%. Net fee and commission income increased by 8%, year on year, mainly due to higher savings and investment income. This was partly offset by lower payment fee income. Net loan losses and similar net result amounted to EUR 20m (22bp), mainly driven by IFRS 9 model updates. Individual loan losses remained at the same level as the previous year. Year on year, net loan losses and similar net result improved significantly, as management judgement allowances had been booked in the second quarter of 2020.
Personal Banking Norway
Net interest income increased by 13% in local currency, year on year, due to higher deposit margins and mortgage volume growth. Quarter on quarter, net interest income increased by 9%, mainly due to improved lending margins. Lending volumes increased by 4% in local currency, year on year, driven by a 5% increase in mortgage volumes. Deposit volumes increased by 3%. Net fee and commission income increased by 17%, year on year, mainly due to higher savings and investment income.
Net loan losses and similar net result amounted to EUR 0m. Year on year, net loan losses and similar net result improved significantly, as management judgement allowances had been booked in the second quarter of 2020.
Personal Banking Sweden Net interest income increased by 10% in local currency, year on year, due to mortgage volume growth and increased lending margins. Lending volumes increased by 6% in local currency, year on year, driven by a 6% increase in mortgage volumes. Deposit volumes increased by 6%. Net fee and commission income increased by 17%, year on year, mainly due to higher savings and investment income. Net loan losses and similar net result amounted to EUR 8m (6bp), driven by the implementation of updated write-off guidelines for consumer lending. Year on year, net loan losses and similar net result improved significantly, as management judgement allowances had been booked in the second quarter of 2020.
Personal Banking total
Local curr. Jan-
Jun 21 Jan-
Jun 20
Jan-Jun 21/20
Q221 Q121 Q420 Q320 Q220 Q2/Q2 Q2/Q1 Q2/Q2 Q2/Q1 EUR Local
EURm
Net interest income 569 562 535 543 501 14% 1% 9% 1% 1,131 1,016 11% 8%
Net fee and commission income 317 296 290 279 267 19% 7% 17% 7% 613 562 9% 7%
Net result from items at fair value 33 15 22 14 48 -31% -31% 48 64 -25% -28%
Equity method & other income 10 4 0 2 2 14 4
Total income incl. allocations 929 877 847 838 818 14% 6% 10% 6% 1,806 1,646 10% 7%
Total expenses incl. allocations -442 -503 -449 -436 -450 -2% -12% -5% -12% -945 -918 3% 0%
Profit before loan losses 487 374 398 402 368 32% 30% 29% 30% 861 728 18% 15%
Net loan losses and similar net result 2 -7 -11 5 -226 -5 -265
Operating profit 489 367 387 407 142 33% 33% 856 463 85% 79%
Cost-to-income ratio1, % 49 52 55 54 54 51 54
Return on capital at risk1, % 19 17 14 15 6 18 9
Economic capital (EC) 7,759 7,603 7,652 7,739 7,700 1% 2% 7,759 7,700 1%
Risk exposure amount (REA) 47,008 46,464 47,200 46,062 45,695 3% 1% 47,008 45,695 3%
Number of employees (FTEs) 7,017 6,976 7,070 7,100 7,282 -4% 1% 7,017 7,282 -4%
Volumes, EURbn:
Mortgage lending 146.1 143.5 141.4 135.5 134.1 9% 2% 6% 2% 146.1 134.1 9% 6%
Other lending 21.2 21.1 21.1 20.8 20.7 2% 0% 1% 1% 21.2 20.7 2% 1%
Total lending 167.3 164.6 162.5 156.3 154.8 8% 2% 5% 2% 167.3 154.8 8% 5%
Total deposits 85.8 83.5 82.9 80.8 80.5 7% 3% 4% 3% 85.8 80.5 7% 4% 1 With amortised resolution fees.

Nordea Half-Year Financial Report 2021
21
Q2
Personal Banking
Local curr. Jan-Jun 21
Jan-Jun 20
Jan-Jun 21/20 Q221 Q121 Q420 Q320 Q220 Q2/Q2 Q2/Q1 Q2/Q2 Q2/Q1 EUR Local
Net interest income, EURm
PeB Denmark 145 145 139 141 138 5% 0% 5% 0% 290 278 4% 4%
PeB Finland 98 99 87 88 88 11% -1% 10% -2% 197 180 9% 9%
PeB Norway 130 119 115 120 106 23% 9% 13% 9% 249 216 15% 9%
PeB Sweden 199 201 201 192 171 16% -1% 10% -2% 400 345 16% 10%
Other -3 -2 -7 2 -2 -5 -3
Net fee and commission income, EURm
PeB Denmark 83 74 83 69 67 24% 12% 24% 12% 157 143 10% 9%
PeB Finland 94 92 89 91 87 8% 2% 9% 3% 186 181 3% 3%
PeB Norway 29 26 25 26 24 21% 12% 17% 8% 55 51 8% 6%
PeB Sweden 111 104 100 96 89 25% 7% 17% 8% 215 188 14% 8%
Other 0 0 -7 -3 0 0 -1
Net loan losses and similar net result, EURm
PeB Denmark 33 13 12 3 -51 46 -64
PeB Finland -20 -14 -13 -4 -91 -34 -99
PeB Norway 0 -2 -8 9 -53 -2 -56
PeB Sweden -8 -7 -3 -3 -30 -15 -46
Other -3 3 1 0 -1 0 0
Volumes, EURbn
Personal Banking Denmark
Mortgage lending 34.5 33.9 33.4 32.9 32.3 7% 2% 6% 2% 34.5 32.3 7% 6%
Other lending 8.8 8.8 8.7 8.6 8.5 4% 0% 4% 0% 8.8 8.5 4% 4%
Total lending 43.3 42.7 42.1 41.5 40.8 6% 1% 6% 1% 43.3 40.8 6% 6%
Total deposits 21.9 22.1 21.9 22.0 22.0 0% -1% 0% -1% 21.9 22.0 0% 0%
Personal Banking Finland
Mortgage lending 29.6 29.2 28.7 28.2 27.8 6% 1% 6% 1% 29.6 27.8 6% 6%
Other lending 6.3 6.3 6.3 6.3 6.3 0% 0% 0% 0% 6.3 6.3 0% 0%
Total lending 35.9 35.5 35.0 34.5 34.1 5% 1% 5% 1% 35.9 34.1 5% 5%
Total deposits 25.7 25.0 24.6 24.4 23.8 8% 3% 8% 3% 25.7 23.8 8% 8%
Personal Banking Norway
Mortgage lending 34.5 34.5 32.8 30.8 30.8 12% 0% 5% 2% 34.5 30.8 12% 5%
Other lending 2.6 2.6 2.7 2.6 2.6 0% 0% -4% 0% 2.6 2.6 0% -4%
Total lending 37.1 37.1 35.5 33.4 33.4 11% 0% 4% 2% 37.1 33.4 11% 4%
Total deposits 10.9 10.4 9.9 9.5 9.9 10% 5% 3% 6% 10.9 9.9 10% 3%
Personal Banking Sweden
Mortgage lending 47.4 46.0 46.4 43.6 43.3 9% 3% 6% 2% 47.4 43.3 9% 6%
Other lending 3.6 3.4 3.5 3.3 3.3 9% 6% 3% 3% 3.6 3.3 9% 3%
Total lending 51.0 49.4 49.9 46.9 46.6 9% 3% 6% 2% 51.0 46.6 9% 6%
Total deposits 27.3 26.0 26.4 24.8 24.9 10% 5% 6% 4% 27.3 24.9 10% 6%

Nordea Half-Year Financial Report 2021
22
Q2
Business Banking
Introduction In Business Banking we provide small and medium-sized corporate customers with banking and advisory products and services, both online and in person.
Business Banking also includes Transaction Banking and Nordea Finance. Transaction Banking provides payment and transaction services to customers across the Nordea Group, while Nordea Finance provides asset-based lending, sales finance and receivables finance to both corporate and private customers.
We are a trusted financial partner, maintaining and developing our customer relationships by providing competent advice and developing digital solutions for easy banking.
Business development In the second quarter we continued to see high lending and deposit volumes, which were up 8% and 10%, respectively, in local currencies, year on year. Momentum in Norway and Sweden remained strong, driven by higher engagement with new and existing customers. The increase in volumes was also supported by the acquisition of Nordea Finance Equipment (NFE). Besides good growth in the lending space, we continued to see high equity and debt capital market activity, especially in Sweden.
More than 275,000 customers in Denmark, Finland and Sweden are now able to use Nordea Business, the new netbank for small and medium-sized businesses, which we also plan to expand to Norway. In May the mobile netbank app received its highest score since it was launched. The app is currently available to all customers in Denmark and Finland and the majority of customers in Sweden.
During the quarter we further improved our digital offering to help customers fulfil their daily banking needs quickly and conveniently. For example, customers can now sign agreements on more than 80% of our loan products using digital signatures. We continued to provide customers with advice and support via remote meetings, which accounted for three out of four meetings in the quarter.
We also launched a new mobile logon solution for Corporate Netbank, the netbank for our larger corporate customers. A fully digital authentication process now enables customers to log on anywhere, any time and with the same level of security as before, but without the inconvenience of expiring key cards. The new solution has already attracted 25,000 users.
To create better customer experiences, we started migrating Nordea-issued cards to a new IT platform. The move will result in customers being able to access enhanced digitalised services and self-service functionalities. We have already completed the process for Norwegian debit cards.
We continued to develop our sustainability offering. Overall, our sustainability-linked lending grew by 20% in the second quarter, with the strongest growth in Norway and Sweden. The environmental, social and governance (ESG) part of our portfolio now amounts to EUR 3bn.
After consecutive quarters with improving or stable customer satisfaction, we experienced a dip in the previous quarter. We will continue to focus on improving customer satisfaction in all countries by providing personal and proactive customer service and further developing our digital solutions.
Financial outcome Total income increased by 20%, year on year. Excluding the impact of NFE, which was consolidated in the results from the fourth quarter of 2020, total income increased by 13%. Net interest income increased by 20%, year on year, driven by higher volumes and the benefit of funding received from the European Central Bank (ECB) under the third targeted longer-term refinancing operations programme (TLTRO III). Net fee and commission income increased by 27%, year on year, primarily driven by high equity and debt capital market activity. Savings and investment income and payment and card fee income also contributed positively, having increased from the subdued levels seen in the second quarter of 2020. Net result from items at fair value increased by 3%, year on year, driven by higher income from foreign exchange products. The increase was partly offset by lower income from interest rate products. Total expenses increased by 1%, year on year, reflecting the consolidation of NFE and higher restructuring costs. Adjusted for resolution fees, restructuring costs and the impact of the NFE integration, total expenses decreased by 2%. The cost-to-income ratio in the second quarter was 44%, the best level to date and an improvement of 6 percentage points on the same quarter last year. Net loan losses and similar net result amounted to net reversals of EUR 30m (13bp) due to low new provisions, reversals reflecting an improvement in portfolio quality, and a gain from the revaluation of Nordea Kredit’s mortgage portfolio. Operating profit increased by EUR 369m, year on year, to EUR 404m. Return on capital at risk was 18%, compared with 1% in the same quarter last year.
Business Banking Denmark Net interest income remained stable in local currency, year on year, as the impact of lower lending margins was offset by volume growth and higher deposit margins. The lower lending margins were mainly attributable to the de-risking of the Agriculture portfolio. Lending volumes increased by 3% in local currency, year on year. Excluding the impact of the NFE integration, the volumes were unchanged. Deposit volumes remained unchanged. Net fee and commission income increased by 4% in local currency, year on year, driven by higher savings and investment income. Net loan losses and similar net result amounted to net reversals of EUR 25m (38bp), up from a net loss of EUR 35m in the same quarter last year. This was due to net loan loss reversals and positive valuation adjustments in the mortgage portfolio during the quarter.
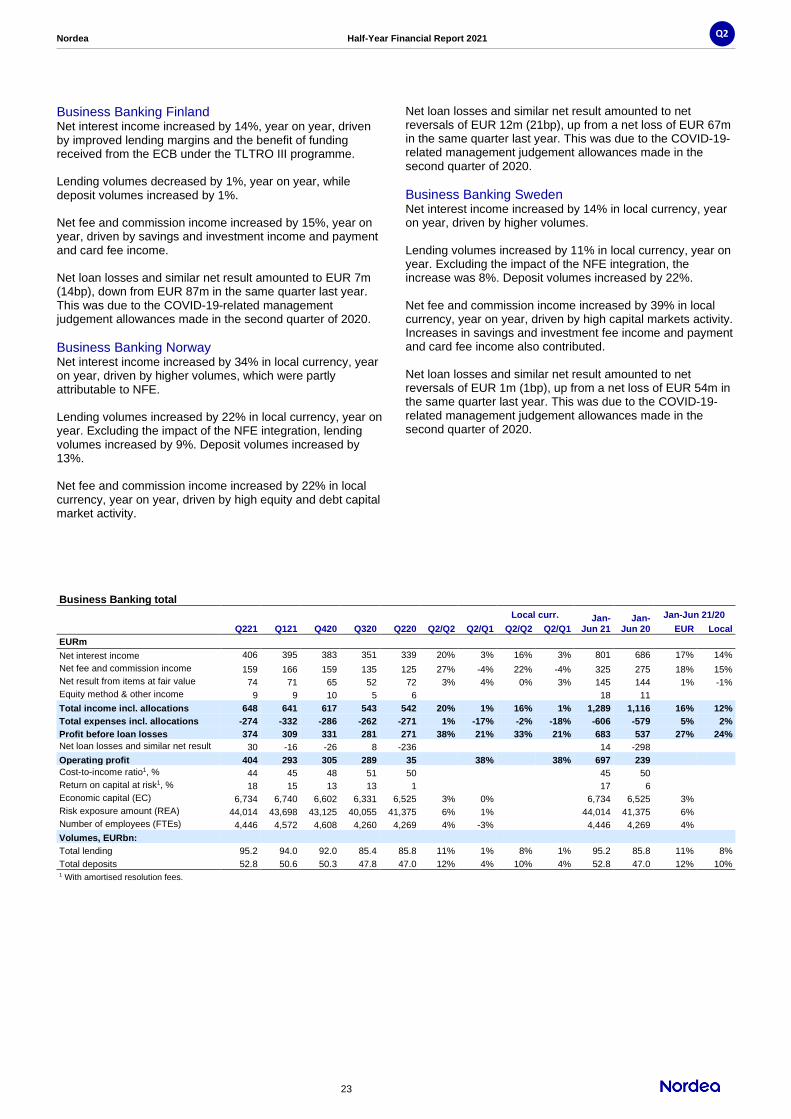
Nordea Half-Year Financial Report 2021
23
Q2
Business Banking Finland Net interest income increased by 14%, year on year, driven by improved lending margins and the benefit of funding received from the ECB under the TLTRO III programme. Lending volumes decreased by 1%, year on year, while deposit volumes increased by 1%. Net fee and commission income increased by 15%, year on year, driven by savings and investment income and payment and card fee income. Net loan losses and similar net result amounted to EUR 7m (14bp), down from EUR 87m in the same quarter last year. This was due to the COVID-19-related management judgement allowances made in the second quarter of 2020.
Business Banking Norway Net interest income increased by 34% in local currency, year on year, driven by higher volumes, which were partly attributable to NFE. Lending volumes increased by 22% in local currency, year on year. Excluding the impact of the NFE integration, lending volumes increased by 9%. Deposit volumes increased by 13%. Net fee and commission income increased by 22% in local currency, year on year, driven by high equity and debt capital market activity.
Net loan losses and similar net result amounted to net reversals of EUR 12m (21bp), up from a net loss of EUR 67m in the same quarter last year. This was due to the COVID-19-related management judgement allowances made in the second quarter of 2020.
Business Banking Sweden Net interest income increased by 14% in local currency, year on year, driven by higher volumes. Lending volumes increased by 11% in local currency, year on year. Excluding the impact of the NFE integration, the increase was 8%. Deposit volumes increased by 22%. Net fee and commission income increased by 39% in local currency, year on year, driven by high capital markets activity. Increases in savings and investment fee income and payment and card fee income also contributed. Net loan losses and similar net result amounted to net reversals of EUR 1m (1bp), up from a net loss of EUR 54m in the same quarter last year. This was due to the COVID-19-related management judgement allowances made in the second quarter of 2020.
Business Banking total
Local curr. Jan-Jun 21
Jan-Jun 20
Jan-Jun 21/20
Q221 Q121 Q420 Q320 Q220 Q2/Q2 Q2/Q1 Q2/Q2 Q2/Q1 EUR Local
EURm
Net interest income 406 395 383 351 339 20% 3% 16% 3% 801 686 17% 14%
Net fee and commission income 159 166 159 135 125 27% -4% 22% -4% 325 275 18% 15%
Net result from items at fair value 74 71 65 52 72 3% 4% 0% 3% 145 144 1% -1%
Equity method & other income 9 9 10 5 6 18 11
Total income incl. allocations 648 641 617 543 542 20% 1% 16% 1% 1,289 1,116 16% 12%
Total expenses incl. allocations -274 -332 -286 -262 -271 1% -17% -2% -18% -606 -579 5% 2%
Profit before loan losses 374 309 331 281 271 38% 21% 33% 21% 683 537 27% 24%
Net loan losses and similar net result 30 -16 -26 8 -236 14 -298
Operating profit 404 293 305 289 35 38% 38% 697 239
Cost-to-income ratio1, % 44 45 48 51 50 45 50
Return on capital at risk1, % 18 15 13 13 1 17 6
Economic capital (EC) 6,734 6,740 6,602 6,331 6,525 3% 0% 6,734 6,525 3%
Risk exposure amount (REA) 44,014 43,698 43,125 40,055 41,375 6% 1% 44,014 41,375 6%
Number of employees (FTEs) 4,446 4,572 4,608 4,260 4,269 4% -3% 4,446 4,269 4%
Volumes, EURbn:
Total lending 95.2 94.0 92.0 85.4 85.8 11% 1% 8% 1% 95.2 85.8 11% 8%
Total deposits 52.8 50.6 50.3 47.8 47.0 12% 4% 10% 4% 52.8 47.0 12% 10% 1 With amortised resolution fees.

Nordea Half-Year Financial Report 2021
24
Q2
Business Banking
Local curr. Jan-Jun 21
Jan-Jun 20
Jan-Jun 21/20 Q221 Q121 Q420 Q320 Q220 Q2/Q2 Q2/Q1 Q2/Q2 Q2/Q1 EUR Local
Net interest income, EURm
Business Banking Denmark 85 85 88 84 85 0% 0% 0% 0% 170 174 -2% -2%
Business Banking Finland 105 108 93 91 92 14% -3% 14% -3% 213 183 16% 16%
Business Banking Norway 108 102 95 77 73 48% 6% 34% 4% 210 153 37% 29%
Business Banking Sweden 101 99 99 92 84 20% 2% 14% 3% 200 170 18% 11%
Other 7 1 8 7 5 8 6
Net fee and commission income, EURm
Business Banking Denmark 27 32 30 24 26 4% -16% 4% -16% 59 57 4% 4%
Business Banking Finland 54 53 52 49 47 15% 2% 15% 2% 107 99 8% 8%
Business Banking Norway 29 31 27 23 22 32% -6% 22% -7% 60 47 28% 21%
Business Banking Sweden 62 61 63 49 42 48% 2% 39% 2% 123 93 32% 25%
Other -13 -11 -13 -10 -12 -24 -21
Net loan losses and similar net result, EURm
Business Banking Denmark 25 1 1 2 -35 26 -31
Business Banking Finland -7 -11 -8 -4 -87 -18 -132
Business Banking Norway 12 0 -12 7 -67 12 -78
Business Banking Sweden 1 -7 -5 2 -54 -6 -65
Other -1 1 -2 1 7 0 8
Lending, EURbn
Business Banking Denmark 26.1 26.5 26.0 25.0 25.3 3% -2% 3% -1% 26.1 25.3 3% 3%
Business Banking Finland 19.8 19.7 19.6 19.8 19.9 -1% 1% -1% 1% 19.8 19.9 -1% -1%
Business Banking Norway 22.6 22.5 20.9 17.3 17.3 31% 0% 22% 2% 22.6 17.3 31% 22%
Business Banking Sweden 26.7 25.3 25.4 23.3 23.3 15% 6% 11% 4% 26.7 23.3 15% 11%
Other 0 0 0.1 0 0 0 0
Deposits, EURbn
Business Banking Denmark 9.5 9.1 9.5 9.6 9.4 1% 4% 0% 4% 9.5 9.4 1% 0%
Business Banking Finland 14.7 14.4 14.5 14.6 14.6 1% 2% 1% 2% 14.7 14.6 1% 1%
Business Banking Norway 9.9 9.7 8.9 8.1 8.2 21% 2% 13% 3% 9.9 8.2 21% 13%
Business Banking Sweden 18.7 17.4 17.4 15.4 14.8 26% 7% 22% 6% 18.7 14.8 26% 22%
Other 0 0 0 0.1 0 0 0

Nordea Half-Year Financial Report 2021
25
Q2
Large Corporates & Institutions
Introduction In Large Corporates & Institutions (LC&I) we provide financial solutions to large Nordic corporate and institutional customers. We also provide services to customers across the Nordea Group through our Markets, Investment Banking & Equities and International units. We are a leading player within sustainable finance and a leading bank for large corporate and institutional customers in the Nordics. We offer a focused and dedicated range of products and services covering financing, cash management and payments, as well as investment banking and capital markets solutions.
Business development In the second quarter we took further steps towards creating a more customer-centric, focused and profitable business area. This was reflected in improved returns, higher net fee and commission income, and reductions in costs and economic capital. We actively supported our customers through the ongoing pandemic and drove services earning capital-light revenues. Bond volumes for Nordic corporate issuers increased by 64%, year on year, while lending volumes decreased by 11% and lending margins increased, in line with our strategy. During the quarter we saw very high levels of customer activity across all segments, especially within Investment Banking & Equities. In Debt Capital Markets this was particularly reflected in event-related transactions. We retained our position as the largest arranger of capital markets funding for Nordic issuers. For equity capital markets and mergers and acquisitions, we continue to hold leading market positions across the Nordic region and have a strong mandated project pipeline. Significant transactions with our involvement included Corem’s public offer for Klövern, the initial public offerings of Hemnet and Oatly, and EQT’s acquisition of Chr. Hansen’s Natural Colors Division, among many others. We further increased our focus on ESG products and continue to be a leading platform for ESG advisory services. By the end of the second quarter we ranked number one for Nordic sustainable bonds overall and for Nordic corporate sustainable bonds, where we held 15% and 21% market shares, respectively. During the quarter we launched an extensive training programme to further strengthen our staff’s sustainability competencies. We also continued to support large corporate customers in designing low-carbon transition plans. We are committed to meeting our 2030 target to reduce carbon emissions from our lending and investment portfolios by 40-50% relative to 2019 levels. Markets followed up the very strong start to the year with a solid risk management performance in the second quarter, and customer activity levels increased. We actively supported
our customers while maintaining our focus on economic capital efficiency. Markets’ results in the second quarter reflected a normalisation of risk management revenues following the exceptionally high levels seen earlier in the pandemic. At the same time, our digitalisation efforts further progressed. Corporate use of AutoFX, our tool for managing foreign currency flows, more than doubled, year on year, to approximately 10%. The increase in use follows enhancements to the tool’s functionality, for example within hedging and liquidity management.
Financial outcome Total income was up 9%, year on year, driven by the highest net fee and commission income in 14 quarters. Return on capital at risk (ROCAR) was 16%. The average ROCAR for the past four quarters stands at 15%, demonstrating our sustained repositioning of the business. Net interest income increased by 7%, year on year, driven by higher lending margins and higher yield fee income. Lending volumes decreased by 11%, year on year, due to a reduction in COVID-19-related facilities, active repositioning and high investor demand for corporate bonds. Net fee and commission income increased by 61%, year on year, primarily driven by very high customer activity in the capital markets areas, which resulted in elevated income from bond issuance, and solid corporate finance income. Net result from items at fair value decreased by 25% due to a lower result from risk management following the particularly strong quarter last year. Total expenses were down 4%, year on year, driven by lower resolution fees and continued strict cost management. In 2020 part of the resolution fee had been booked in the second quarter. These factors were partly offset by higher provisions for variable pay. Adjusted for resolution fees, total expenses were stable. Net loan losses and similar net result amounted to net reversals of EUR 13m (8bp) due to low new provisions and reversals reflecting an improvement in portfolio quality. The underlying credit quality of the loan book is strong. The total provisioning level now stands at approximately EUR 780m or 1.77% of LC&I lending. Operating profit increased significantly, year on year, to EUR 333m. Economic capital continued to decrease, standing at EUR 5,802m, a year-on-year reduction of 17%, driven by strong capital discipline, a focus on more capital-light business and lower market risk capital.

Nordea Half-Year Financial Report 2021
26
Q2
Large Corporates & Institutions total
Jan-Jun 21 Jan-Jun 20 Jan-Jun
21/20 Q221 Q121 Q420 Q320 Q220 Q2/Q2 Q2/Q1
EURm
Net interest income 229 240 228 226 214 7% -5% 469 435 8%
Net fee and commission income 163 137 116 118 101 61% 19% 300 225 33%
Net result from items at fair value 112 245 101 132 150 -25% -54% 357 212 68%
Equity method & other income 1 0 0 0 0 1 0
Total income incl. allocations 505 622 445 476 465 9% -19% 1,127 872 29%
Total expenses incl. allocations -185 -285 -193 -180 -192 -4% -35% -470 -459 2%
Profit before loan losses 320 337 252 296 273 17% -5% 657 413 59%
Net loan losses and similar net result 13 -27 1 10 -228 -14 -280
Operating profit 333 310 253 306 45 7% 643 133
Cost-to-income ratio1, % 41 34 48 42 44 37 47
Return on capital at risk1, % 16 19 11 13 1 18 4
Economic capital (EC) 5,802 6,102 6,093 6,619 7,020 -17% -5% 5,802 7,020 -17%
Risk exposure amount (REA) 40,518 42,095 42,280 45,027 47,863 -15% -4% 40,518 47,863 -15%
Number of employees (FTEs) 1,330 1,398 1,467 1,624 1,649 -19% -5% 1,330 1,649 -19%
Volumes, EURbn2:
Total lending 43.5 45.0 46.1 46.9 48.9 -11% -3% 43.5 48.9 -11%
Total deposits 48.4 43.4 39.9 43.7 42.3 14% 12% 48.4 42.3 14%
1 With amortised resolution fees. 2 Excluding repurchase agreements and security lending/borrowing agreements.
Large Corporates & Institutions
Jan-Jun 21 Jan-Jun 20 Jan-Jun
21/20 Q221 Q121 Q420 Q320 Q220 Q2/Q2 Q2/Q1
Net interest income, EURm
Denmark 35 36 38 37 38 -8% -3% 71 74 -4%
Finland 41 50 39 40 35 17% -18% 91 68 34%
Norway 72 73 74 73 73 -1% -1% 145 151 -4%
Sweden 74 71 69 64 55 35% 4% 145 113 28%
Other 7 10 8 12 13 17 29
Net fee and commission income, EURm
Denmark 51 35 31 30 25 86 55
Finland 43 33 27 34 22 76 55
Norway 31 35 27 29 25 66 55
Sweden 48 40 47 37 31 88 79
Other -10 -6 -16 -12 -2 -16 -19
Net loan losses and similar net result, EURm
Denmark 3 11 2 5 -30 14 -26
Finland -2 0 1 5 -26 -2 -30
Norway 2 -35 -1 -35 -108 -33 -166
Sweden 7 -2 -8 38 -65 5 -63
Other 3 -1 7 -3 1 2 5
Lending, EURbn1
Denmark 7.4 7.5 8.3 8.7 8.9 -17% -1% 7.4 8.9 -17%
Finland 7.8 8.4 8.7 9.3 9.5 -18% -7% 7.8 9.5 -18%
Norway 12.1 13.0 12.8 12.9 13.6 -11% -7% 12.1 13.6 -11%
Sweden 14.7 14.7 14.3 13.5 14.2 4% 0% 14.7 14.2 4%
Other 1.5 1.4 2.0 2.5 2.7 1.5 2.7
Deposits, EURbn1
Denmark 9.4 7.1 7.2 10.0 10.1 -7% 32% 9.4 10.1 -7%
Finland 13.4 12.5 12.3 11.9 11.6 16% 7% 13.4 11.6 16%
Norway 10.2 8.7 8.1 8.4 8.0 28% 17% 10.2 8.0 28%
Sweden 15.3 14.8 12.3 13.3 12.0 28% 3% 15.3 12.0 28%
Other 0.1 0.3 0 0.1 0.6 0.1 0.6 1 Excluding repurchase agreements and security lending/borrowing agreements.

Nordea Half-Year Financial Report 2021
27
Q2
Asset & Wealth Management
Introduction In Asset & Wealth Management we offer an extensive range of award-winning savings products through internal and partners’ distribution channels, and provide financial advice to high net worth individuals and corporate and institutional investors. Our aim is to be acknowledged as the leading wealth manager in each Nordic market and a leading European asset manager, with global reach and capabilities. We are also working towards becoming a leading and transparent ESG provider, with a comprehensive range of sustainability-enhanced investment products.
Business development In the second quarter assets under management (AuM) increased by EUR 15.7bn to a record high of EUR 387.4bn. Investment return increased AuM by EUR 13.1bn and net flows in the quarter were solid, totalling EUR 2.6bn. Investment performance in Asset Management remained strong, with 89% of composites providing excess return on a three-year basis. In Asset Management we attracted a total of EUR 0.9bn in net flows in the second quarter. Of these, EUR 3.0bn were delivered through our internal channels, where the strong momentum seen in previous quarters continued. Net outflows from institutional and third-party fund distribution channels amounted to EUR 2.2bn, impacted by an outflow of EUR 3.7bn from mandates related to the divestment of Nordea Life & Pensions Denmark in 2018. We continued to digitalise our trading processes in order to manage increased business volumes without increased cost. We currently expect to implement the first fully automated processes for executing interest rate, credit and listed derivative products by the end of 2021. Investor interest in our sustainability product offerings remained strong within all sales channels. Sustainability products continue to be the primary driver of our growth, generating net flows of EUR 2.4bn or over 90% of the net flows in the quarter. In institutional distribution net flows mainly stemmed from customers in Germany, Southern Europe and the United Kingdom. We also won several large new business mandates outside Europe. Our ESG engagement, competencies and strategies are widely recognised. We were ranked fourth for sustainability by fund selectors in the Fund Brand 50 annual survey of European third-party asset managers. Moreover, our Emerging Stars Bond Fund was named ESG fixed income fund of the year by Environmental Finance in their Sustainable Investment Awards 2021. In Wealth Management we continued to generate record-high net flows (EUR 2.0bn in the quarter) and all countries delivered positive net flows. Inflows were driven by continued customer acquisition and focus on proactive customer
engagement across all markets. Private Banking customer satisfaction, already high, increased further in the quarter. We saw a strong increase in Private Banking customers’ use of our digital services, with 20% more logins into the mobile bank app than a year ago. Furthermore, digital fund purchases increased by 19%, year on year. In the second quarter 20% of all fund purchases were made digitally. Although this trend was accelerated by COVID-19, we expect it to continue after the pandemic. As in previous quarters, we saw strong inflows into retail funds. Finland and Norway remained in the lead with annualised flow rates above 20%. In Denmark, we are now the biggest retail fund provider. In Life & Pension we attracted EUR 1.0bn in net flows in the second quarter, EUR 0.5bn more than in the same period last year. We continue to grow our occupational pension business in Norway and Sweden, focusing on relationship management, pipeline management and sales. ESG remains a priority area for Life & Pension, a co-founder of the UN’s Net-Zero Asset Owner Alliance. In May the Alliance announced interim climate targets for 2025 requiring asset managers to set net-zero carbon emission targets by 2024 at the latest. With our improved digital distribution capabilities, we are progressing towards becoming the leading bancassurer in the Nordics. We are focusing in particular on digitalising sales within Life & Pension.
Financial outcome Total income in the second quarter was EUR 292m, up 28%, year on year. This was mainly driven by higher income due to a 26% increase in average AuM. Net interest income was EUR 19m, up 12%, year on year, driven by increased lending volumes. Net fee and commission income amounted to EUR 244m, a year-on-year increase of 31%, reflecting the positive AuM development. Net result from items at fair value was EUR 29m, up 7%, year on year, mainly due to a higher risk result in Nordea Life & Pension. Total expenses decreased by 8%, year on year, driven by a decrease in staff expenses and lower business support costs. Net loan losses and similar net result amounted to net reversals of EUR 3m, compared with a loss of EUR 2m in the same quarter last year. Operating profit in the second quarter was EUR 176m, a year-on-year increase of 81%. The cost-to-income ratio was 41%, an improvement of 16 percentage points on the same quarter last year.

Nordea Half-Year Financial Report 2021
28
Q2
Asset & Wealth Management total
Local curr. Jan-Jun 21
Jan-Jun 20
Jan-Jun 21/20 Q221 Q121 Q420 Q320 Q220 Q2/Q2 Q2/Q1 Q2/Q2 Q2/Q1 EUR Local
EURm
Net interest income 19 19 16 16 17 12% 0% 12% 0% 38 35 9% 9%
Net fee and commission income 244 235 228 204 186 31% 4% 30% 3% 479 386 24% 23%
Net result from items at fair value 29 38 16 24 27 7% -24% 4% -22% 67 62 8% 5%
Equity method & other income 0 0 3 3 -2 0 4
Total income incl. allocations 292 292 263 247 228 28% 0% 27% 0% 584 487 20% 19%
Total expenses incl. allocations -119 -126 -136 -126 -129 -8% -6% -9% -6% -245 -259 -5% -7%
Profit before loan losses 173 166 127 121 99 75% 4% 75% 5% 339 228 49% 48%
Net loan losses and similar net result 3 -3 2 -3 -2 0 -2
Operating profit 176 163 129 118 97 81% 8% 81% 9% 339 226 50% 50%
Cost-to-income ratio1, % 41 42 52 51 57 42 53
Return on capital at risk1, % 31 33 29 27 24 32 26
Economic capital (EC) 1,731 1,639 1,445 1,301 1,249 39% 6% 1,731 1,249 39%
Risk exposure amount (REA) 8,552 8,294 7,401 5,625 5,587 53% 3% 8,552 5,587 53%
Number of employees (FTEs) 2,744 2,718 2,741 2,737 2,735 0% 1% 2,744 2,735 0%
Volumes, EURbn:
AuM 387.4 371.7 353.8 326.2 311.4 24% 4% 387.4 311.4 24%
Total lending 10.6 10.1 9.6 9.0 8.8 20% 5% 18% 5% 10.6 8.8 20% 18%
Total deposits 11.0 10.5 10.7 10.9 11.1 -1% 5% -3% 5% 11.0 11.1 -1% -3% 1 With amortised resolution fees.
Assets under Management (AuM), volumes and net flow
Net flow
Q221 Q121 Q420 Q320 Q220 Q221
EURbn
Nordic Retail funds 83.8 78.5 73.9 66.6 63.2 1.8 Private Banking 114.2 107.2 100.8 92.7 87.8 2.0 Institutional sales 124.6 124.5 121.4 112.7 108.5 -2.2 Life & Pension 64.8 61.6 57.6 54.2 51.9 1.0 Total 387.4 371.7 353.8 326.2 311.4 2.6
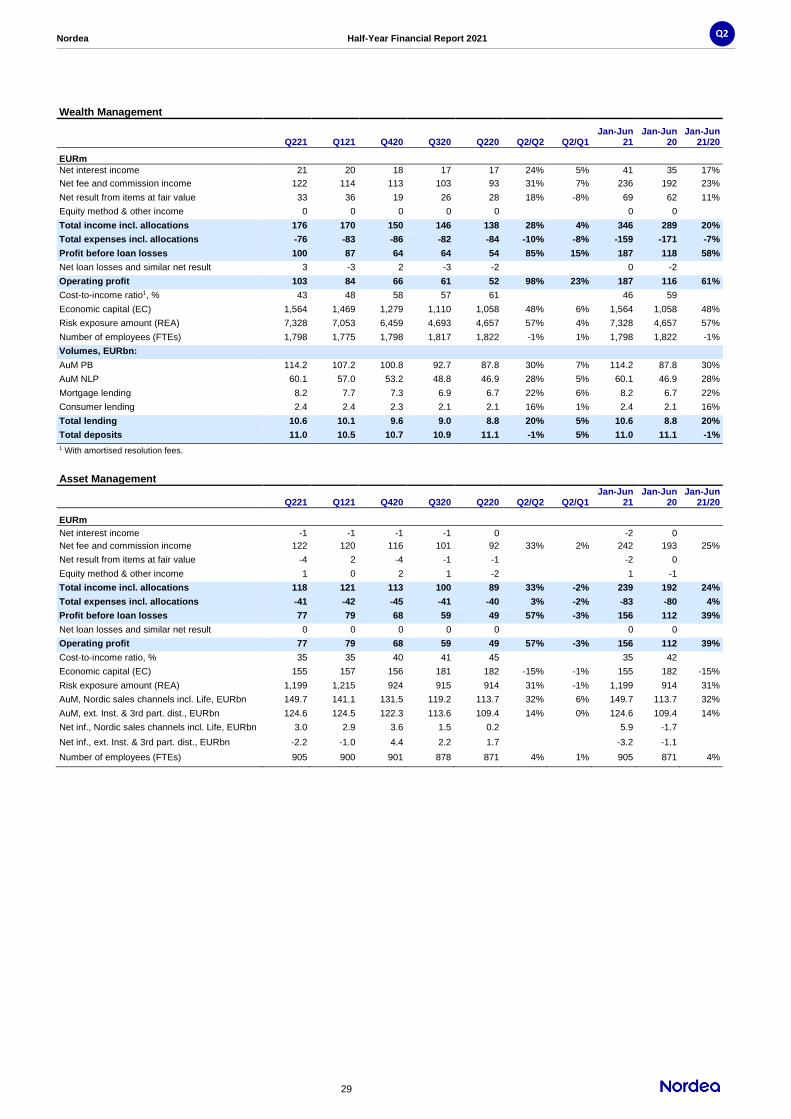
Nordea Half-Year Financial Report 2021
29
Q2
Wealth Management
Q221 Q121 Q420 Q320 Q220 Q2/Q2 Q2/Q1 Jan-Jun
21 Jan-Jun
20 Jan-Jun
21/20
EURm
Net interest income 21 20 18 17 17 24% 5% 41 35 17%
Net fee and commission income 122 114 113 103 93 31% 7% 236 192 23%
Net result from items at fair value 33 36 19 26 28 18% -8% 69 62 11%
Equity method & other income 0 0 0 0 0 0 0
Total income incl. allocations 176 170 150 146 138 28% 4% 346 289 20%
Total expenses incl. allocations -76 -83 -86 -82 -84 -10% -8% -159 -171 -7%
Profit before loan losses 100 87 64 64 54 85% 15% 187 118 58%
Net loan losses and similar net result 3 -3 2 -3 -2 0 -2
Operating profit 103 84 66 61 52 98% 23% 187 116 61%
Cost-to-income ratio1, % 43 48 58 57 61 46 59
Economic capital (EC) 1,564 1,469 1,279 1,110 1,058 48% 6% 1,564 1,058 48%
Risk exposure amount (REA) 7,328 7,053 6,459 4,693 4,657 57% 4% 7,328 4,657 57%
Number of employees (FTEs) 1,798 1,775 1,798 1,817 1,822 -1% 1% 1,798 1,822 -1%
Volumes, EURbn:
AuM PB 114.2 107.2 100.8 92.7 87.8 30% 7% 114.2 87.8 30%
AuM NLP 60.1 57.0 53.2 48.8 46.9 28% 5% 60.1 46.9 28%
Mortgage lending 8.2 7.7 7.3 6.9 6.7 22% 6% 8.2 6.7 22%
Consumer lending 2.4 2.4 2.3 2.1 2.1 16% 1% 2.4 2.1 16%
Total lending 10.6 10.1 9.6 9.0 8.8 20% 5% 10.6 8.8 20%
Total deposits 11.0 10.5 10.7 10.9 11.1 -1% 5% 11.0 11.1 -1%
1 With amortised resolution fees. 1 1 1
Asset Management
Q221 Q121 Q420 Q320 Q220 Q2/Q2 Q2/Q1 Jan-Jun
21 Jan-Jun
20 Jan-Jun
21/20
EURm
Net interest income -1 -1 -1 -1 0 -2 0
Net fee and commission income 122 120 116 101 92 33% 2% 242 193 25%
Net result from items at fair value -4 2 -4 -1 -1 -2 0
Equity method & other income 1 0 2 1 -2 1 -1
Total income incl. allocations 118 121 113 100 89 33% -2% 239 192 24%
Total expenses incl. allocations -41 -42 -45 -41 -40 3% -2% -83 -80 4%
Profit before loan losses 77 79 68 59 49 57% -3% 156 112 39%
Net loan losses and similar net result 0 0 0 0 0 0% 0% 0 0
Operating profit 77 79 68 59 49 57% -3% 156 112 39%
Cost-to-income ratio, % 35 35 40 41 45 35 42
Economic capital (EC) 155 157 156 181 182 -15% -1% 155 182 -15%
Risk exposure amount (REA) 1,199 1,215 924 915 914 31% -1% 1,199 914 31%
AuM, Nordic sales channels incl. Life, EURbn 149.7 141.1 131.5 119.2 113.7 32% 6% 149.7 113.7 32%
AuM, ext. Inst. & 3rd part. dist., EURbn 124.6 124.5 122.3 113.6 109.4 14% 0% 124.6 109.4 14%
Net inf., Nordic sales channels incl. Life, EURbn 3.0 2.9 3.6 1.5 0.2 0% 0% 5.9 -1.7
Net inf., ext. Inst. & 3rd part. dist., EURbn -2.2 -1.0 4.4 2.2 1.7 0% 0% -3.2 -1.1
Number of employees (FTEs) 905 900 901 878 871 4% 1% 905 871 4%

Nordea Half-Year Financial Report 2021
30
Q2
Private Banking
Jan-Jun
21 Jan-Jun
20
Jan-Jun Q221 Q121 Q420 Q320 Q220 Q2/Q2 Q2/Q1 21/20
Net fee and commission income, EURm
PB Denmark 52 48 50 40 43 20% 8% 100 86 17%
PB Finland 46 44 42 40 35 32% 6% 90 74 22%
PB Norway 9 10 9 8 5 74% -8% 19 13 47%
PB Sweden 26 24 22 20 18 41% 7% 50 39 29%
Private Banking 133 126 122 108 104 28% 6% 260 214 21%
AuM, EURbn
PB Denmark 34.0 32.4 30.8 28.9 27.9 22% 5% 34.0 27.9 22%
PB Finland 38.4 36.0 34.2 31.8 29.8 29% 7% 38.4 29.8 29%
PB Norway 9.8 9.3 8.3 7.2 7.0 39% 5% 9.8 7.0 39%
PB Sweden 32.1 29.5 27.5 24.7 23.1 39% 9% 32.1 23.1 39%
Private Banking 114.2 107.2 100.8 92.7 87.8 30% 7% 114.2 87.8 30%
Lending, EURbn
PB Denmark 3.8 3.8 3.7 3.6 3.5 10% 1% 3.8 3.5 10%
PB Finland 2.5 2.3 2.3 2.2 2.1 14% 5% 2.5 2.1 14%
PB Norway 1.7 1.5 1.4 1.3 1.2 38% 7% 1.7 1.2 38%
PB Sweden 2.6 2.4 2.3 2.0 2.0 31% 9% 2.6 2.0 31%
Private Banking 10.6 10.1 9.6 9.0 8.8 19% 5% 10.6 8.8 19%
Life & Pension
Q221 Q121 Q420 Q320 Q220 Q2/Q2 Q2/Q1 Jan-Jun
21 Jan-Jun
20 Jan-Jun
21/20
EURm
AuM, EURbn 60.1 57.0 53.2 48.8 46.9 28% 5% 60.1 46.9 28%
Premiums 2,081 1,919 1,852 1,098 1,102 89% 8% 4,001 2,746 46%
Profit drivers
Profit traditional products 6 7 11 8 5 35% -10% 13 9 48%
Profit market return products 66 63 54 53 51 28% 5% 129 107 20%
Profit risk products 22 21 15 20 17 33% 6% 43 35 22%
Total product result 94 91 81 81 73 30% 4% 185 151 22%

Nordea Half-Year Financial Report 2021
31
Q2
Group Functions Introduction In Group Functions we provide the four business areas with the services, subject matter expertise, data and technology infrastructure needed for Nordea to be a strong and personal financial partner. Group Functions consists of Group Business Support; Chief of Staff Office; Group Brand, Communication and Marketing; Group Risk and Compliance; Group People; Group Legal; Group Finance; and Group Internal Audit. Together with the results of the business areas, the results of Group Functions add up to the reported result for the Group. The income primarily originates from Group Treasury. The majority of both costs and income are distributed to the business areas.
Business development In the second quarter we continued with initiatives to further consolidate Operations-related processes across the Group. This will enable more nearshoring and outsourcing, further increase operational efficiency and strengthen our focus on automation.
Financial outcome Total operating income amounted to EUR 44m, up from EUR 37m in the same quarter last year. Net interest income decreased by EUR 11m, year on year, driven by tighter interbank and overnight spreads. Net result from items at fair value increased by EUR 11m, year on year, driven by higher investment valuations in Treasury. Total operating expenses amounted to EUR 111m, a year-on-year increase of EUR 65m, driven by higher provisions for variable pay and a write-down related to premises.
Group Functions
Q221 Q121 Q420 Q320 Q220 Q2/Q2 Q2/Q1 Jan-Jun 21 Jan-Jun 20
EURm
Net interest income 9 -4 7 10 20 5 28
Net fee and commission income -5 -7 -1 -7 -6 -12 -10
Net result from items at fair value 30 1 13 35 19 31 -56
Equity method & other income 10 -2 28 13 4 8 9
Total operating income 44 -12 47 51 37 32 -29
Total operating expenses -111 -73 -154 -85 -46 -184 -121
Profit before loan losses -67 -85 -107 -34 -9 -152 -150
Net loan losses and similar net result 3 1 6 -1 -4 4 -6
Operating profit -64 -84 -101 -35 -13 -148 -156
Economic capital (EC) 1,141 1,289 1,710 1,686 1,711 1,141 1,711
Risk exposure amount (REA) 12,130 13,486 15,434 13,790 14,080 12,130 14,080
Number of employees (FTEs) 11,973 12,136 12,165 12,159 12,019 0% -1% 11,973 12,019

Nordea Half-Year Financial Report 2021
32
Q2
Income statement Q2 Q2 Jan-Jun Jan-Jun Full year
Note 2021 2020 2021 2020 2020
EURm
Operating income
Interest income calculated using the effective interest rate method 1,227 1,359 2,536 2,916 5,536
Other interest income 256 282 508 585 1,071
Negative yield on financial assets -4 -63 -86 -125 -280
Interest expense -330 -549 -717 -1,288 -2,013
Negative yield on financial liabilities 83 62 203 112 201
Net interest income 1,232 1,091 2,444 2,200 4,515
Fee and commission income 1,130 892 2,188 1,878 3,856
Fee and commission expense -252 -219 -483 -440 -897
Net fee and commission income 3 878 673 1,705 1,438 2,959
Net result from items at fair value 4 278 316 648 426 900
Profit from associated undertakings and joint ventures accounted for under the equity method 3 -10 -11 -12 -1
Other operating income 27 20 52 40 93
Total operating income 2,418 2,090 4,838 4,092 8,466
Operating expenses
General administrative expenses:
Staff costs -705 -645 -1,387 -1,344 -2,752
Other expenses 5 -262 -303 -748 -722 -1,286
Depreciation, amortisation and impairment charges of tangible and intangible assets 6 -164 -140 -315 -270 -605
Total operating expenses -1,131 -1,088 -2,450 -2,336 -4,643
Profit before loan losses 1,287 1,002 2,388 1,756 3,823
Net result on loans in hold portfolios mandatorily held at fair value 21 2 32 1 48
Net loan losses 7 30 -698 -33 -852 -908
Operating profit 1,338 306 2,387 905 2,963
Income tax expense -313 -63 -574 -202 -698
Net profit for the period 1,025 243 1,813 703 2,265
Attributable to:
Shareholders of Nordea Bank Abp 1,025 243 1,787 676 2,238
Additional Tier 1 capital holders 0 0 26 27 27
Total 1,025 243 1,813 703 2,265
Basic earnings per share, EUR 0.25 0.06 0.44 0.17 0.55
Diluted earnings per share, EUR 0.25 0.06 0.44 0.17 0.55
Statement of comprehensive income Q2 Q2 Jan-Jun Jan-Jun Full year
2021 2020 2021 2020 2020
EURm Net profit for the period 1,025 243 1,813 703 2,265
Items that may be reclassified subsequently to the income statement
Currency translation differences -38 448 112 -548 -196
Hedging of net investments in foreign operations:
Valuation gains/losses 16 -302 17 321 117
Fair value through other comprehensive income:1 Valuation gains/losses, net of recycling 13 69 -12 -44 55
Tax on valuation gains/losses -3 -15 2 11 -9
Cash flow hedges:
Valuation gains/losses, net of recycling -10 -16 -51 26 21
Tax on valuation gains/losses 3 3 11 -6 -5
Items that may not be reclassified subsequently to the income statement
Changes in own credit risk related to liabilities classified as fair value option: Valuation gains/losses -2 -40 -3 -3 -9
Tax on valuation gains/losses 0 9 0 2 3
Defined benefit plans:
Remeasurement of defined benefit plans 47 -126 245 -231 22
Tax on remeasurement of defined benefit plans -10 20 -48 46 -4
Other comprehensive income from companies accounted for under the equity method 0 8 0 8 -1
Tax on other comprehensive income from companies accounted for under the equity method 0 -2 0 -2 0
Other comprehensive income, net of tax 16 56 273 -420 -6
Total comprehensive income 1,041 299 2,086 283 2,259
Attributable to:
Shareholders of Nordea Bank Abp 1,041 299 2,060 256 2,232
Additional Tier 1 capital holders 0 0 26 27 27
Total 1,041 299 2,086 283 2,259
1 Valuation gains/losses related to hedged risks under fair value hedge accounting are accounted for directly in the income statement.

Nordea Half-Year Financial Report 2021
33
Q2
Balance sheet
30 Jun 31 Dec 30 Jun
Note 2021 2020 2020
EURm Assets 9
Cash and balances with central banks 51,769 32,955 48,642
Loans to central banks 8 1,501 3,123 5,661
Loans to credit institutions 8 6,181 3,123 8,649
Loans to the public 8 338,410 329,765 328,023
Interest-bearing securities 65,424 62,509 72,520
Financial instruments pledged as collateral 1,792 3,795 6,448
Shares 23,720 12,649 13,368
Assets in pooled schemes and unit-linked investment contracts 42,795 36,484 29,854
Derivatives 32,365 44,770 47,039
Fair value changes of the hedged items in portfolio hedge of interest rate risk 179 359 356
Investments in associated undertakings and joint ventures 547 555 553
Intangible assets 3,807 3,771 3,661
Properties and equipment 1,809 1,931 1,945
Investment properties 1,638 1,535 1,575
Deferred tax assets 87 406 500
Current tax assets 397 300 392
Retirement benefit assets 337 144 91
Other assets 13,270 13,349 17,282
Prepaid expenses and accrued income 784 637 728
Total assets 586,812 552,160 587,287
Liabilities 9
Deposits by credit institutions 32,983 23,939 46,223
Deposits and borrowings from the public 204,627 183,431 188,451
Deposits in pooled schemes and unit-linked investment contracts 43,482 37,534 31,126
Liabilities to policyholders 19,101 18,178 17,888
Debt securities in issue 182,670 174,309 182,069
Derivatives 32,470 47,033 49,749
Fair value changes of the hedged items in portfolio hedge of interest rate risk 1,659 2,608 3,081
Current tax liabilities 110 305 146
Other liabilities 25,048 21,341 25,359
Accrued expenses and prepaid income 1,250 1,404 1,337
Deferred tax liabilities 473 436 464
Provisions 520 596 622
Retirement benefit obligations 290 365 561
Subordinated liabilities 6,601 6,941 8,452
Total liabilities 551,284 518,420 555,528
Equity
Additional Tier 1 capital holders 749 748 750
Non-controlling interests 9 9 22
Share capital 4,050 4,050 4,050
Invested unrestricted equity 1,066 1,063 1,072
Other reserves -1,794 -2,067 -2,488
Retained earnings 31,448 29,937 28,353
Total equity 35,528 33,740 31,759
Total liabilities and equity 586,812 552,160 587,287
Off-balance sheet commitments
Assets pledged as security for own liabilities 175,906 176,364 182,839
Other assets pledged1 266 267 240
Contingent liabilities 20,810 19,347 18,564
Credit commitments2 90,713 88,791 85,443
Other commitments 1,502 1,769 1,703 1 Includes interest-bearing securities pledged as security for payment settlements with central banks and clearing institutions. From the third quarter of 2020
only securities pledged for overnight liquidity have been disclosed (securities pledged for intraday liquidity have been excluded). Comparative figures
have been restated. 2 Including unutilised portion of approved overdraft facilities of EUR 32,788m (31 December 2020: EUR 32,859m; 30 June 2020: EUR 32,720m).
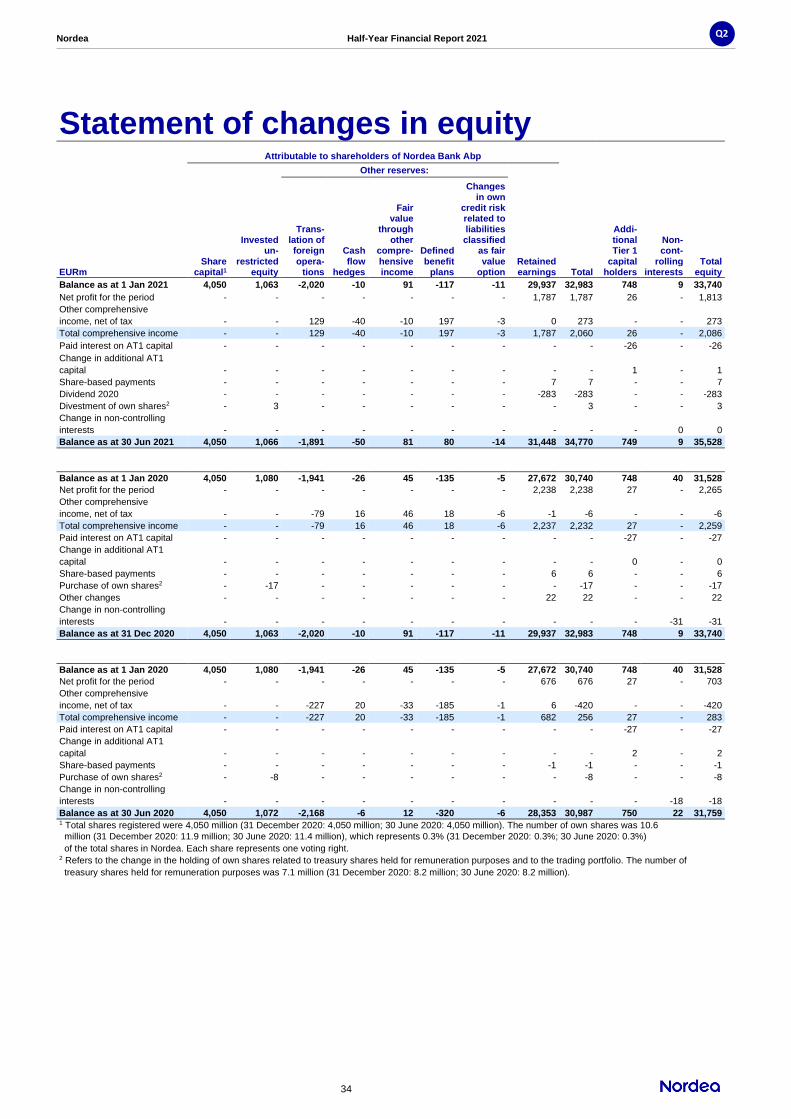
Nordea Half-Year Financial Report 2021
34
Q2
Statement of changes in equity Attributable to shareholders of Nordea Bank Abp Other reserves:
EURm Share
capital1
Invested un-
restricted equity
Trans-lation of foreign opera-
tions
Cash flow
hedges
Fair value
through other
compre-hensive income
Defined benefit
plans
Changes in own
credit risk related to liabilities classified
as fair value
option Retained earnings Total
Addi-tional Tier 1
capital holders
Non-cont-
rolling interests
Total equity
Balance as at 1 Jan 2021 4,050 1,063 -2,020 -10 91 -117 -11 29,937 32,983 748 9 33,740
Net profit for the period - - - - - - - 1,787 1,787 26 - 1,813
Other comprehensive
income, net of tax - - 129 -40 -10 197 -3 0 273 - - 273
Total comprehensive income - - 129 -40 -10 197 -3 1,787 2,060 26 - 2,086
Paid interest on AT1 capital - - - - - - - - - -26 - -26
Change in additional AT1
capital - - - - - - - - - 1 - 1
Share-based payments - - - - - - - 7 7 - - 7
Dividend 2020 - - - - - - - -283 -283 - - -283
Divestment of own shares2 - 3 - - - - - - 3 - - 3
Change in non-controlling
interests - - - - - - - - - - 0 0
Balance as at 30 Jun 2021 4,050 1,066 -1,891 -50 81 80 -14 31,448 34,770 749 9 35,528
Balance as at 1 Jan 2020 4,050 1,080 -1,941 -26 45 -135 -5 27,672 30,740 748 40 31,528
Net profit for the period - - - - - - - 2,238 2,238 27 - 2,265
Other comprehensive
income, net of tax - - -79 16 46 18 -6 -1 -6 - - -6
Total comprehensive income - - -79 16 46 18 -6 2,237 2,232 27 - 2,259
Paid interest on AT1 capital - - - - - - - - - -27 - -27
Change in additional AT1
capital - - - - - - - - - 0 - 0
Share-based payments - - - - - - - 6 6 - - 6
Purchase of own shares2 - -17 - - - - - - -17 - - -17
Other changes - - - - - - - 22 22 - - 22
Change in non-controlling
interests - - - - - - - - - - -31 -31
Balance as at 31 Dec 2020 4,050 1,063 -2,020 -10 91 -117 -11 29,937 32,983 748 9 33,740
Balance as at 1 Jan 2020 4,050 1,080 -1,941 -26 45 -135 -5 27,672 30,740 748 40 31,528
Net profit for the period - - - - - - - 676 676 27 - 703
Other comprehensive
income, net of tax - - -227 20 -33 -185 -1 6 -420 - - -420
Total comprehensive income - - -227 20 -33 -185 -1 682 256 27 - 283
Paid interest on AT1 capital - - - - - - - - - -27 - -27
Change in additional AT1
capital - - - - - - - - - 2 - 2
Share-based payments - - - - - - - -1 -1 - - -1
Purchase of own shares2 - -8 - - - - - - -8 - - -8
Change in non-controlling
interests - - - - - - - - - - -18 -18
Balance as at 30 Jun 2020 4,050 1,072 -2,168 -6 12 -320 -6 28,353 30,987 750 22 31,759 1 Total shares registered were 4,050 million (31 December 2020: 4,050 million; 30 June 2020: 4,050 million). The number of own shares was 10.6
million (31 December 2020: 11.9 million; 30 June 2020: 11.4 million), which represents 0.3% (31 December 2020: 0.3%; 30 June 2020: 0.3%)
of the total shares in Nordea. Each share represents one voting right. 2 Refers to the change in the holding of own shares related to treasury shares held for remuneration purposes and to the trading portfolio. The number of
treasury shares held for remuneration purposes was 7.1 million (31 December 2020: 8.2 million; 30 June 2020: 8.2 million).

Nordea Half-Year Financial Report 2021
35
Q2
Cash flow statement, condensed
Jan-Jun Jan-Jun Full year
2021 2020 2020
EURm Operating activities
Operating profit 2,387 905 2,963
Adjustments for items not included in cash flow 536 1,543 2,074
Income taxes paid -544 -785 -987
Cash flow from operating activities before changes in operating assets and liabilities 2,379 1,663 4,050
Changes in operating assets and liabilities 15,946 11,883 -5,393
Cash flow from operating activities 18,325 13,546 -1,343
Investing activities
Acquisition/sale of business operations 7 - -552
Acquisition/sale of associated undertakings and joint ventures - - 10
Acquisition/sale of properties and equipment -4 -33 -50
Acquisition/sale of intangible assets -185 -214 -418
Cash flow from investing activities -182 -247 -1,010
Financing activities
Issued/amortised subordinated liabilities -392 -1,330 -2,459
Divestment/repurchase of own shares, including change in trading portfolio 3 -8 -17
Dividend paid -283 - -
Paid interest on Additional Tier 1 capital -26 -27 -27
Amortisation of the principal part of lease liabilities -71 -72 -143
Cash flow from financing activities -769 -1,437 -2,646
Cash flow for the period 17,374 11,862 -4,999
Cash and cash equivalents 30 Jun 30 Jun 31 Dec
2021 2020 2020
EURm Cash and cash equivalents at beginning of the period 36,203 41,164 41,164
Translation difference 173 -94 38
Cash and cash equivalents at end of the period 53,750 52,932 36,203
Change 17,374 11,862 -4,999
The following items are included in cash and cash equivalents:
Cash and balances with central banks 51,769 48,642 32,955
Loans to central banks 5 2,947 2,426
Loans to credit institutions 1,976 1,343 822
Total cash and cash equivalents 53,750 52,932 36,203
Cash comprises legal tender and bank notes in foreign currencies. Balances with central banks consist of deposits in accounts with central banks and postal
giro systems under government authority where the following conditions are fulfilled:
- the central bank or postal giro system is domiciled in the country where the institution is established;
- the balance on the account is readily available at any time.
Loans to credit institutions payable on demand include liquid assets not represented by bonds or other interest-bearing securities.

Nordea Half-Year Financial Report 2021
36
Q2
Notes to the financial statements
Note 1 Accounting policies
The consolidated interim financial statements are prepared in accordance with International Accounting Standard (IAS) 34, “Interim Financial Reporting”, as endorsed by the European Union (EU).
The report includes a condensed set of financial statements and is to be read in conjunction with the audited consolidated financial statements for the year ended 31 December 2020. The accounting policies and methods of computation are unchanged from Note G1 in the Annual Report 2020, except for those relating to the items presented in the section “Changed accounting policies and presentation” below. For more information, see Note G1 in the Annual Report 2020.
Changed accounting policies and presentation The following changes in accounting policies and presentation were implemented by Nordea on 1 January 2021.
Interest Rate Benchmark Reform – Phase 2 In 2020 the International Accounting Standards Board (IASB) published amendments to International Financial Reporting Standard (IFRS) 9, IAS 39, IFRS 7, IFRS 4 and IFRS 16 in “Interest Rate Benchmark Reform – Phase 2”. Phase 2 of the interbank offered rate (IBOR) reform includes three major areas: hedge accounting, modifications and disclosures. The amendments were implemented by Nordea on 1 January 2021. Hedge relationships in Nordea have been able to continue as before and no material modification gains or losses have been recognised.
The amendments clarify that hedge accounting does not have to be discontinued in the event that hedged items and hedging instruments are modified due to the IBOR reform. Hedging relationships (and related documentation) must be amended to reflect modifications to the hedged item, hedging instrument and hedged risk. Any valuation adjustments resulting from the amendments are recognised as part of hedge ineffectiveness.
Modifications required as a direct consequence of the IBOR reform and made on an economically equivalent basis are not accounted for as modifications to instruments measured at amortised cost. For such modifications, the effective interest rate is amended in line with the modified cash flows.
Other amendments The following amended standard issued by the IASB was implemented by Nordea on 1 January 2021, but has not had any significant impact on Nordea’s financial statements.
• Amendments to IFRS 4, “Insurance Contracts” – deferral
of IFRS 9
Changes in IFRS not yet applied IFRS 17, “Insurance contracts” The new standard IFRS 17, “Insurance contracts”, will change the accounting requirements for the recognition, measurement, presentation and disclosure of insurance contracts.
The measurement principles will change from a non-uniform accounting policy based on the local accounting policies in the life insurance subsidiaries to a uniform accounting policy based on three measurement models: the Building Block Approach (BBA), the Variable Fee Approach (VFA) and the Premium Allocation Approach (PAA). The model application depends on the terms of the contracts (long term, long term with a variable fee or short term). The three measurement models include consistent definitions of contractual cash flows, the risk adjustment margin and discounting. These definitions are based on principles similar to those for calculating technical provisions in the Solvency II capital requirements directive. Unearned future premiums will be recognised as a provision on the balance sheet and released to revenue when the insurance service is provided. Any unprofitable contracts will be recognised in the income statement at the time the contract is signed and approved.
IFRS 17 is effective for annual reporting periods beginning on or after 1 January 2023, with earlier application permitted. The standard is not yet endorsed by the EU. Nordea does not currently intend to adopt the standard early. It is not yet possible to conclude on the impact of the new standard on Nordea’s financial statements or capital adequacy in the period of initial application.
Amendments to IAS 12, “Income Taxes”: “Deferred Tax related to Assets and Liabilities arising from a Single Transaction” In 2021 the IASB published amendments to IAS 12, “Income Taxes”, in “Deferred Tax related to Assets and Liabilities arising from Single Transaction”.
The amendments require companies to recognise deferred tax on particular transactions that, on initial recognition, give rise to taxable and deductible temporary differences of equal amounts. Such a requirement may apply on the initial recognition of a lease liability and the corresponding right-of-use asset at the commencement of a lease. The requirement also applies in the context of decommissioning, restoration and similar liabilities where the corresponding amounts are recognised as part of the cost of the related asset.
The amendments are effective for annual reporting periods beginning on or after 1 January 2023, with earlier application permitted. The standard is not yet endorsed by the EU and Nordea does not currently intend to adopt it early. The gross deferred tax assets and liabilities will be disclosed, but will be set off on the balance sheet if such requirements are met. Nordea’s current assessment is that the new standard will not have any significant impact on its capital adequacy in the period of initial application.

Nordea Half-Year Financial Report 2021
37
Q2
Other amendments to IFRS Other amendments to IFRS are not assessed to have any significant impact on Nordea’s financial statements or capital adequacy in the period of their initial application.
Critical judgements and estimation uncertainty Nordea applied significant critical judgements in the preparation of this interim report due to significant uncertainty concerning the potential long-term impact of COVID-19 on its financial statements (see “Critical judgements emphasised by COVID 19” in section 4 of Note G1, “Accounting policies”, in the Annual Report 2020). More information on where critical judgements are generally applied and where estimation uncertainty exists can be found in section 4 of Note G1, “Accounting policies”, in the Annual Report 2020.
No impairment of goodwill was identified during the second quarter, but significant estimation uncertainty exists in relation to the long-term impact on Nordea’s financial statements and the impairment need will be continuously reassessed. Both an increase in the discount rate of 1 percentage point and a reduction in the future growth rate of 1 percentage point are considered to be reasonably possible changes in key assumptions. Such changes would not result in any impairment.
Exchange rates Jan-Jun Jan-Dec Jan-Jun
2021 2020 2020
EUR 1 = SEK
Income statement (average) 10.1303 10.4889 10.6616 Balance sheet (at end of period) 10.1118 10.0220 10.4763
EUR 1 = DKK
Income statement (average) 7.4368 7.4543 7.4648 Balance sheet (at end of period) 7.4361 7.4405 7.4527
EUR 1 = NOK
Income statement (average) 10.1761 10.7291 10.7413 Balance sheet (at end of period) 10.1813 10.4703 10.8805
EUR 1 = RUB
Income statement (average) 89.5212 82.6596 76.6952 Balance sheet (at end of period) 86.5411 90.8041 79.7526

Nordea Half-Year Financial Report 2021
38
Q2
Note 2 Segment reporting
Jan-Jun 2021 Personal Banking
Business Banking
Large Corporates &
Institutions
Asset & Wealth
Management
Other operating segments
Total operating segments
Recon-ciliation
Total Group
Total operating income, EURm 1,785 1,272 1,114 581 103 4,855 -17 4,838
- of which internal transactions1 -111 -26 -67 -15 219 0 - -
Operating profit, EURm 846 688 637 338 87 2,596 -209 2,387
Loans to the public2, EURbn 164 93 43 10 0 310 28 338
Deposits and borrowings from the public, EURbn 84 53 46 11 0 194 11 205
Jan-Jun 2020
Total operating income, EURm 1,672 1,130 878 489 -23 4,146 -54 4,092
- of which internal transactions1 -262 -120 -183 -9 574 0 - -
Operating profit, EURm 473 242 136 227 -23 1,055 -150 905
Loans to the public2, EURbn 156 86 50 9 0 301 27 328
Deposits and borrowings from the public, EURbn 80 48 41 11 0 180 8 188 1 IFRS 8 requires information on revenues from transactions between operating segments. Nordea has defined intersegment revenues as internal interest
related to the funding of the reportable operating segments by the internal bank in Group Finance, included in "Other operating segments". 2 The volumes are only disclosed separately for operating segments if separately reported to the Chief Operating Decision-Maker.
Reconciliation between total operating segments and financial statements
Operating profit,
EURm Loans to the public,
EURbn
Deposits and borrowings
from the public, EURbn
Jan-Jun 30 Jun 30 Jun
2021 2020 2021 2020 2021 2020
Total operating segments 2,596 1,055 310 301 194 180
Group Functions1 -10 -112 - - - -
Unallocated items -228 -24 23 31 9 10
Differences in accounting policies2 29 -14 5 -4 2 -2
Total 2,387 905 338 328 205 188 1 Consists of Group Business Support, Group Internal Audit, Chief of Staff Office, Group People, Group Legal and Group Risk & Compliance.
2 Impact from plan exchange rates used in the segment reporting.
Measurement of operating segments' performance
The measurement principles and allocation between operating segments follow the information reported to the Chief Operating Decision-Maker (CODM), as required by IFRS 8. In Nordea the CODM has been defined as the Chief Executive Officer, who is supported by the other members of the Group Leadership Team. The main difference compared with the section "Business areas" in this report is that the information in Note 2 is prepared using plan exchange rates, as this is the basis used in the reporting to the CODM.
Financial results are presented for the main business areas Personal Banking, Business Banking, Large Corporates & Institutions and Asset & Wealth Management. These are identified as reportable operating segments and are reported separately, as they are above the quantitative thresholds in IFRS 8. Other operating segments below the thresholds are included in Other operating segments. Group Functions (and eliminations), as well as the result that is not fully allocated to any of the operating segments, are shown separately as reconciling items.
There have been no changes in the basis of segmentation during the year.

Nordea Half-Year Financial Report 2021
39
Q2
Note 3 Net fee and commission income
Q2 Q1 Q2 Jan-Jun Jan-Jun Full year
2021 2021 2020 2021 2020 2020
EURm
Asset management commissions 441 416 340 857 699 1,469
Life and pension commissions 68 64 61 132 129 263
Deposit products 6 6 6 12 13 27
Brokerage, securities issues and corporate finance
88 77 34 165 98 204
Custody and issuer services
15 0 10 15 15 34
Payments 73 80 69 153 146 280
Cards 42 35 36 77 83 168
Lending products 121 121 98 242 203 424
Guarantees 23 25 21 48 43 89
Other 1 3 -2 4 9 1
Total 878 827 673 1,705 1,438 2,959 Breakdown
Other and elimination
Nordea Group
Jan-Jun 2021
Personal Banking
Business Banking
Large Corporates &
Institutions
Asset & Wealth
Manage-ment
Other operating segments
EURm
Asset management commissions 316 52 2 487 0 0 857
Life and pension commissions 109 42 2 -21 0 0 132
Deposit products 3 9 0 0 0 0 12
Brokerage, securities issues and corporate finance
10 27 118 19 0 -9 165
Custody and issuer services
1 2 10 2 -3 3 15
Payments 35 82 37 1 0 -2 153
Cards 65 9 3 0 0 0 77
Lending products 63 82 93 3 1 0 242
Guarantees 4 13 30 0 1 0 48
Other 7 7 5 -12 -3 0 4
Total 613 325 300 479 -4 -8 1,705
Breakdown
Other and elimination
Nordea Group
Jan-Jun 2020
Personal Banking
Business Banking
Large Corporates &
Institutions
Asset & Wealth
Manage-ment
Other operating segments
EURm
Asset management commissions 273 46 3 377 0 0 699
Life and pension commissions 93 34 2 0 0 0 129
Deposit products 3 10 0 0 0 0 13
Brokerage, securities issues and corporate finance
10 15 63 18 0 -8 98
Custody and issuer services
2 2 11 2 -2 0 15
Payments 34 79 33 0 0 0 146
Cards 71 9 3 0 0 0 83
Lending products 60 63 76 1 3 0 203
Guarantees 4 12 27 0 0 0 43
Other 12 5 7 -12 -3 0 9
Total 562 275 225 386 -2 -8 1,438
Note 4 Net result from items at fair value
Q2 Q1 Q2 Jan-Jun Jan-Jun Full year
2021 2021 2020 2021 2020 2020
EURm Equity-related instruments 183 189 150 372 75 177
Interest-related instruments and foreign exchange gains/losses 80 102 157 182 638 667
Other financial instruments (including credit and commodities) -11 52 -12 41 -334 -24
Life & Pension1 26 27 21 53 47 80
Total 278 370 316 648 426 900
1 Internal transactions not eliminated against other lines in the Note. The line Life & Pension consequently provides the true impact from the life insurance
operations. Breakdown of Life & Pension Q2 Q1 Q2 Jan-Jun Jan-Jun Full year
2021 2021 2020 2021 2020 2020
EURm Equity-related instruments 448 544 735 992 -491 397
Interest-related instruments and foreign exchange gains/losses 38 -34 147 4 56 271
Investment properties 47 66 18 113 29 94
Change in technical provisions1 -319 -180 -704 -499 -20 -792
Change in collective bonus potential -202 -381 -189 -583 448 60
Insurance risk income 19 17 16 36 32 64
Insurance risk expense -5 -5 -2 -10 -7 -14
Total 26 27 21 53 47 80 1 Premium income amounts to EUR 70m for the second quarter of 2021 and EUR 165m for January-June 2021 (Second quarter of 2020: EUR 29m;
January-June 2020: EUR 100m).

Nordea Half-Year Financial Report 2021
40
Q2
Note 5 Other expenses
Q2 Q1 Q2 Jan-Jun Jan-Jun Full year
2021 2021 2020 2021 2020 2020
EURm Information technology -122 -124 -122 -246 -242 -490
Marketing and representation -12 -7 -8 -19 -17 -46
Postage, transportation, telephone and office expenses -13 -14 -13 -27 -28 -57
Rents, premises and real estate -27 -26 -34 -53 -61 -128
Resolution fee - -224 -49 -224 -202 -202
Other -88 -91 -77 -179 -172 -363
Total -262 -486 -303 -748 -722 -1,286
Note 6 Depreciation, amortisation and impairment charges of tangible and intangible assets
Q2 Q1 Q2 Jan-Jun Jan-Jun Full year
2021 2021 2020 2021 2020 2020
EURm Depreciation/amortisation
Properties and equipment -62 -63 -64 -125 -131 -255
Intangible assets -89 -86 -76 -175 -134 -298
Total -151 -149 -140 -300 -265 -553
Impairment charges Properties and equipment -13 -2 0 -15 0 -7
Intangible assets 0 0 0 0 -5 -45
Total -13 -2 0 -15 -5 -52
Total -164 -151 -140 -315 -270 -605
Note 7 Net loan losses
Q2 Q1 Q2 Jan-Jun Jan-Jun Full year
2021 2021 2020 2021 2020 2020
EURm Net loan losses, stage 1 91 -6 -200 85 -223 -155
Net loan losses, stage 2 44 16 -201 60 -188 -200
Net loan losses, non-credit-impaired assets 135 10 -401 145 -411 -355
Stage 3, credit-impaired assets
Net loan losses, individually assessed, collectively calculated -58 10 -80 -48 -167 -127
Realised loan losses -145 -102 -125 -247 -194 -573
Decrease in provisions to cover realised loan losses 73 64 90 137 128 377
Recoveries on previous realised loan losses 17 7 6 24 37 50
Reimbursement right 3 0 0 3 -1 0
New/increase in provisions -89 -211 -253 -300 -420 -601
Reversals of provisions 94 159 65 253 176 321
Net loan losses, credit-impaired assets -105 -73 -297 -178 -441 -553
Net loan losses 30 -63 -698 -33 -852 -908
Key ratios
Q2 Q1 Q2 Jan-Jun Jan-Jun Full year
2021 2021 2020 2021 2020 2020
Net loan loss ratio, amortised cost, bp -5 10 115 3 70 35
- of which stage 1 -14 1 33 -7 18 6
- of which stage 2 -7 -3 33 -5 15 8
- of which stage 3 16 12 49 15 37 21
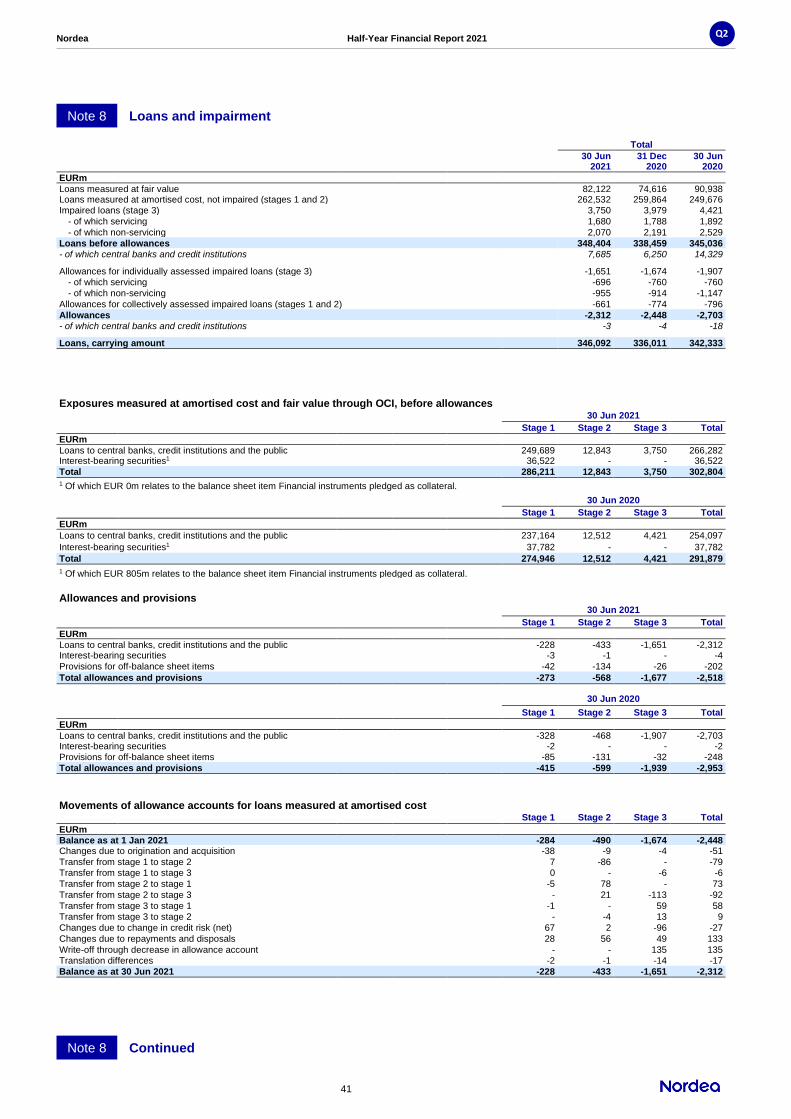
Nordea Half-Year Financial Report 2021
41
Q2
Note 8 Loans and impairment
Total
30 Jun 31 Dec 30 Jun 2021 2020 2020
EURm Loans measured at fair value 82,122 74,616 90,938 Loans measured at amortised cost, not impaired (stages 1 and 2) 262,532 259,864 249,676 Impaired loans (stage 3) 3,750 3,979 4,421
- of which servicing 1,680 1,788 1,892
- of which non-servicing 2,070 2,191 2,529
Loans before allowances 348,404 338,459 345,036 - of which central banks and credit institutions 7,685 6,250 14,329
Allowances for individually assessed impaired loans (stage 3) -1,651 -1,674 -1,907
- of which servicing -696 -760 -760
- of which non-servicing -955 -914 -1,147
Allowances for collectively assessed impaired loans (stages 1 and 2) -661 -774 -796
Allowances -2,312 -2,448 -2,703 - of which central banks and credit institutions -3 -4 -18
Loans, carrying amount 346,092 336,011 342,333
Exposures measured at amortised cost and fair value through OCI, before allowances 30 Jun 2021
Stage 1 Stage 2 Stage 3 Total
EURm Loans to central banks, credit institutions and the public 249,689 12,843 3,750 266,282 Interest-bearing securities1 36,522 - - 36,522
Total 286,211 12,843 3,750 302,804 1 Of which EUR 0m relates to the balance sheet item Financial instruments pledged as collateral.
30 Jun 2020
Stage 1 Stage 2 Stage 3 Total
EURm Loans to central banks, credit institutions and the public 237,164 12,512 4,421 254,097
Interest-bearing securities1 37,782 - - 37,782
Total 274,946 12,512 4,421 291,879
1 Of which EUR 805m relates to the balance sheet item Financial instruments pledged as collateral.
Allowances and provisions 30 Jun 2021
Stage 1 Stage 2 Stage 3 Total
EURm Loans to central banks, credit institutions and the public -228 -433 -1,651 -2,312 Interest-bearing securities -3 -1 - -4
Provisions for off-balance sheet items -42 -134 -26 -202
Total allowances and provisions -273 -568 -1,677 -2,518
30 Jun 2020
Stage 1 Stage 2 Stage 3 Total
EURm Loans to central banks, credit institutions and the public -328 -468 -1,907 -2,703 Interest-bearing securities -2 - - -2 Provisions for off-balance sheet items -85 -131 -32 -248
Total allowances and provisions -415 -599 -1,939 -2,953
Movements of allowance accounts for loans measured at amortised cost Stage 1 Stage 2 Stage 3 Total
EURm Balance as at 1 Jan 2021 -284 -490 -1,674 -2,448 Changes due to origination and acquisition -38 -9 -4 -51
Transfer from stage 1 to stage 2 7 -86 - -79 Transfer from stage 1 to stage 3 0 - -6 -6
Transfer from stage 2 to stage 1 -5 78 - 73
Transfer from stage 2 to stage 3 - 21 -113 -92
Transfer from stage 3 to stage 1 -1 - 59 58 Transfer from stage 3 to stage 2 - -4 13 9
Changes due to change in credit risk (net) 67 2 -96 -27
Changes due to repayments and disposals 28 56 49 133
Write-off through decrease in allowance account - - 135 135 Translation differences -2 -1 -14 -17
Balance as at 30 Jun 2021 -228 -433 -1,651 -2,312
Note 8 Continued
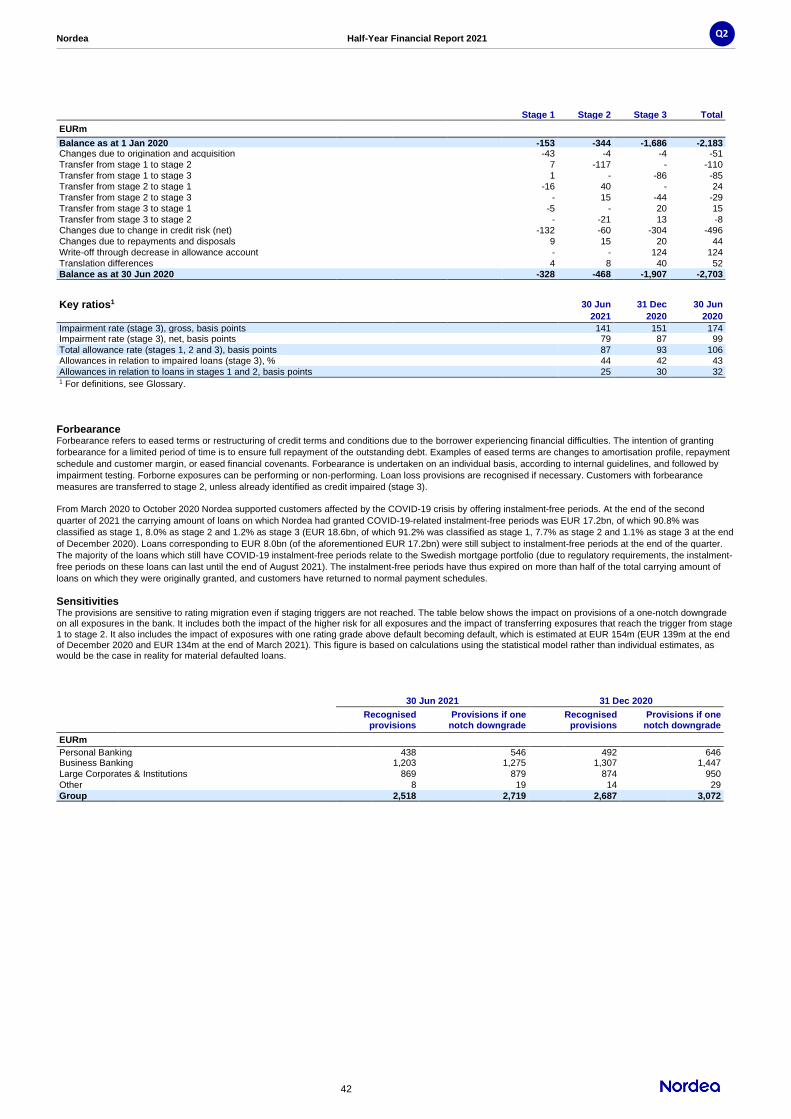
Nordea Half-Year Financial Report 2021
42
Q2
Stage 1 Stage 2 Stage 3 Total
EURm Balance as at 1 Jan 2020 -153 -344 -1,686 -2,183 Changes due to origination and acquisition -43 -4 -4 -51
Transfer from stage 1 to stage 2 7 -117 - -110
Transfer from stage 1 to stage 3 1 - -86 -85 Transfer from stage 2 to stage 1 -16 40 - 24
Transfer from stage 2 to stage 3 - 15 -44 -29
Transfer from stage 3 to stage 1 -5 - 20 15
Transfer from stage 3 to stage 2 - -21 13 -8 Changes due to change in credit risk (net) -132 -60 -304 -496
Changes due to repayments and disposals 9 15 20 44
Write-off through decrease in allowance account - - 124 124
Translation differences 4 8 40 52 Balance as at 30 Jun 2020 -328 -468 -1,907 -2,703
Key ratios1 30 Jun 31 Dec 30 Jun
2021 2020 2020
Impairment rate (stage 3), gross, basis points 141 151 174 Impairment rate (stage 3), net, basis points 79 87 99
Total allowance rate (stages 1, 2 and 3), basis points 87 93 106
Allowances in relation to impaired loans (stage 3), % 44 42 43
Allowances in relation to loans in stages 1 and 2, basis points 25 30 32 1 For definitions, see Glossary.
Forbearance Forbearance refers to eased terms or restructuring of credit terms and conditions due to the borrower experiencing financial difficulties. The intention of granting
forbearance for a limited period of time is to ensure full repayment of the outstanding debt. Examples of eased terms are changes to amortisation profile, repayment
schedule and customer margin, or eased financial covenants. Forbearance is undertaken on an individual basis, according to internal guidelines, and followed by
impairment testing. Forborne exposures can be performing or non-performing. Loan loss provisions are recognised if necessary. Customers with forbearance
measures are transferred to stage 2, unless already identified as credit impaired (stage 3).
From March 2020 to October 2020 Nordea supported customers affected by the COVID-19 crisis by offering instalment-free periods. At the end of the second
quarter of 2021 the carrying amount of loans on which Nordea had granted COVID-19-related instalment-free periods was EUR 17.2bn, of which 90.8% was
classified as stage 1, 8.0% as stage 2 and 1.2% as stage 3 (EUR 18.6bn, of which 91.2% was classified as stage 1, 7.7% as stage 2 and 1.1% as stage 3 at the end
of December 2020). Loans corresponding to EUR 8.0bn (of the aforementioned EUR 17.2bn) were still subject to instalment-free periods at the end of the quarter.
The majority of the loans which still have COVID-19 instalment-free periods relate to the Swedish mortgage portfolio (due to regulatory requirements, the instalment-
free periods on these loans can last until the end of August 2021). The instalment-free periods have thus expired on more than half of the total carrying amount of
loans on which they were originally granted, and customers have returned to normal payment schedules.
Sensitivities The provisions are sensitive to rating migration even if staging triggers are not reached. The table below shows the impact on provisions of a one-notch downgrade on all exposures in the bank. It includes both the impact of the higher risk for all exposures and the impact of transferring exposures that reach the trigger from stage 1 to stage 2. It also includes the impact of exposures with one rating grade above default becoming default, which is estimated at EUR 154m (EUR 139m at the end of December 2020 and EUR 134m at the end of March 2021). This figure is based on calculations using the statistical model rather than individual estimates, as would be the case in reality for material defaulted loans.
30 Jun 2021 31 Dec 2020
Recognised
provisions Provisions if one
notch downgrade Recognised
provisions Provisions if one
notch downgrade
EURm Personal Banking 438 546 492 646 Business Banking 1,203 1,275 1,307 1,447
Large Corporates & Institutions 869 879 874 950
Other 8 19 14 29
Group 2,518 2,719 2,687 3,072

Nordea Half-Year Financial Report 2021
43
Q2
Note 8 Continued
Forward-looking information Forward-looking information is used both for assessing significant increases in credit risk and calculating expected credit losses. Nordea uses three macroeconomic scenarios: a baseline scenario, a favourable scenario and an adverse scenario. For the second quarter of 2021, the scenarios were weighted into the final expected credit losses (ECL) as follows: baseline 60%, adverse 20% and favourable 20% (baseline 50%, adverse 45% and favourable 5% at the end of both December 2020 and March 2021). The change in weighting reflects reduced uncertainty regarding the impact of the pandemic, reduced downside risks following progress in COVID-19 vaccination programmes, and the ongoing easing of restrictions in society and the economy. The macroeconomic scenarios are provided by Group Risk and Compliance in Nordea, based on the Oxford Economics Model. The forecast is a combination of modelling and expert judgement, subject to thorough checks and quality control processes. The model has been built to give a good description of the historical relationships between economic variables and to capture the key linkages between those variables. The forecast period in the model is ten years. For periods beyond, a long-term average is used in the ECL calculations. The macroeconomic scenarios reflect Nordea’s view of how the COVID-19 virus and lockdowns will potentially impact the economic outlook. The scenarios also reflect the macroeconomic effects of government and central bank support measures. When developing the scenarios, Nordea took into account projections made by Nordic governments and central banks, Nordea Research and the European Central Bank’s macroeconomic forecasts for the euro area. Economic projections from the Nordic central banks and the European Central Bank are used as a basis for the baseline scenario. Activity in the Nordic economies picked up strongly after the sharp fall in the spring of 2020, but higher COVID-19 infection rates and stricter containment measures held back the recovery at the beginning of 2021. In recent months infection rates have declined, the pace of vaccination has accelerated and society has begun to reopen. As a result, economic activity has picked up again, although some service industries remain under pressure. There is still substantial uncertainty surrounding the recovery ahead, but expansionary fiscal and monetary policy, high household savings and pent-up demand provide a sound basis for a sharp further increase in activity when the economies are less constrained by restrictions. Activity is expected to have recovered towards the end of 2021. Following strong housing market activity over the past year, the development of house prices is expected to become more subdued in the future. At the end of the second quarter of 2021 adjustments to model-based allowances/provisions amounted to EUR 605m, including management judgements. The management judgements cover expected credit losses not yet covered by the IFRS 9 model. The cyclical reserve amounted to EUR 455m at the end of the second quarter of 2021 (EUR 455m at the end of the first quarter of 2021) and the reserve covering issues identified in the IFRS 9 model to be later covered in model updates (structural reserve) amounted to EUR 155m (EUR 195m at the end of the first quarter of 2021). The cyclical reserve was supported by additional portfolio modelling and was triggered by the substantial uncertainty in the macroeconomic development, as well as the need to account for future rating downgrades potentially underestimated by the IFRS 9 model through the updated macroeconomic scenarios. The estimation was supported by the use of the internal stress testing model, adjusted for the impact of government support schemes. For the retail portfolio, the most important public sector actions have been the various forms of labour market support schemes, which have significantly decreased expected defaults and losses among households. Due to the wide scope of these schemes, Nordea decreased the modelled development of new defaults originally predicted by the internal stress testing models, leading to lower predicted loan losses. These models are based on historical observations and correlations. Thus, they do not replicate the impact of the current government support schemes. With regard to the expected rating migration in the corporate portfolio, Nordea took into consideration the positive impact of the various government guarantee and support schemes, primarily addressing the liquidity shock caused by the lockdowns and quarantines. At the same time, additional negative rating migration was assumed for industries affected by COVID-19. This was based on an updated view of particularly sensitive industries (e.g. Retail trade, Accommodation and leisure, and Air transportation), and incorporated the main findings into the scenario projections. The stress test model-based scenario simulations support the loan loss forecasts made by the business areas, and help Nordea ensure that its loan loss projections are appropriate.

Nordea Half-Year Financial Report 2021
44
Q2
Note 8 Continued
Scenarios and allowances/provisions
Adjustments to
30 Jun 2021 Model-based model-based Individual Total
Unweighted allowances/ allowances/ allowances/ allowances/
ECL Probability provisions provisions provisions provisions
Denmark 2021 2022 2023 EURm weight EURm EURm EURm EURm
Favourable scenario GDP growth, % 3.3 5.8 1.9 206 20%
Unemployment, % 4.0 3.1 3.1
Change in household consumption, % 2.6 8.9 2.8
Change in house prices, % 11.4 5.2 2.7
Baseline scenario GDP growth, % 1.4 4.5 2.2 207 60% 208 195 323 726
Unemployment, % 4.4 4.3 4.1
Change in household consumption, % 1.3 7.7 2.5
Change in house prices, % 9.7 3.0 2.3
Adverse scenario GDP growth, % -0.4 3.5 2.2 213 20%
Unemployment, % 6.3 6.2 6.0
Change in household consumption, % 0 7.6 2.5
Change in house prices, % 4.2 -6.3 -0.9
Finland
Favourable scenario GDP growth, % 3.5 3.4 1.7 266 20%
Unemployment, % 8.1 7.4 7.0
Change in household consumption, % 4.1 4.4 2.6
Change in house prices, % 4.1 3.7 2.0
Baseline scenario GDP growth, % 2.6 2.7 1.2 271 60% 275 137 195 607
Unemployment, % 8.3 7.7 7.4
Change in household consumption, % 3.6 4.0 1.8
Change in house prices, % 1.5 1.3 1.4
Adverse scenario GDP growth, % -0.1 1.1 2.2 297 20%
Unemployment, % 10.0 9.2 8.5
Change in household consumption, % 1.0 2.8 2.3
Change in house prices, % 0 -4.8 -1.1
Norway
Favourable scenario GDP growth, % 4.6 4.1 2.0 93 20%
Unemployment, % 4.1 2.8 2.6
Change in household consumption, % 4.8 9.5 4.3
Change in house prices, % 11.8 7.4 2.3
Baseline scenario GDP growth, % 3.8 3.4 1.2 94 60% 95 175 422 692
Unemployment, % 4.2 3.2 3.2
Change in household consumption, % 4.1 9.0 3.2
Change in house prices, % 10.1 3.0 1.2
Adverse scenario GDP growth, % 0.9 2.4 2.2 100 20%
Unemployment, % 5.4 4.8 4.6
Change in household consumption, % 1.1 8.7 4.1
Change in house prices, % 3.0 -6.3 -0.9
Sweden
Favourable scenario GDP growth, % 4.4 4.8 2.1 85 20%
Unemployment, % 8.1 7.2 7.0
Change in household consumption, % 5.2 5.6 2.7
Change in house prices, % 10.9 4.1 2.0
Baseline scenario GDP growth, % 3.6 3.7 2.3 87 60% 89 92 93 274
Unemployment, % 8.6 7.7 7.4
Change in household consumption, % 4.7 4.7 2.5
Change in house prices, % 9.0 1.5 1.7
Adverse scenario GDP growth, % 0 2.8 3.0 98 20%
Unemployment, % 10.7 10.7 10.3
Change in household consumption, % 0.8 3.9 2.3
Change in house prices, % 3.9 -10.1 -3.4
Non-Nordic 2 6 211 219
Total 669 605 1,244 2,518

Nordea Half-Year Financial Report 2021
45
Q2
Note 8 Continued
Scenarios and allowances/provisions
Adjustments to
31 Dec 2020 Model-based model-based Individual Total
Unweighted allowances/ allowances/ allowances/ allowances/
ECL Probability provisions provisions provisions provisions
Denmark 2021 2022 2023 EURm weight EURm EURm EURm EURm
Favourable scenario GDP growth, % 4.7 2.4 1.9 244 5%
Unemployment, % 4.3 3.9 3.5
Change in household consumption, % 6.3 2.5 2.0
Change in house prices, % -0.6 0.3 2.4
Baseline scenario GDP growth, % 3.0 2.5 2.5 251 50% 262 195 395 852
Unemployment, % 5.6 4.8 4.2
Change in household consumption, % 5.0 1.7 1.8
Change in house prices, % -2.6 0.6 2.7
Adverse scenario GDP growth, % -0.5 3.6 4.0 277 45%
Unemployment, % 7.5 6.8 6.0
Change in household consumption, % 3.1 2.0 3.0
Change in house prices, % -5.6 -4.6 2.6
Finland
Favourable scenario GDP growth, % 3.5 2.4 1.8 191 5%
Unemployment, % 7.2 6.7 6.3
Change in household consumption, % 4.3 2.8 2.7
Change in house prices, % -0.9 1.3 2.3
Baseline scenario GDP growth, % 2.5 2.0 2.2 201 50% 217 159 262 638
Unemployment, % 8.0 7.7 7.2
Change in household consumption, % 3.8 1.9 2.5
Change in house prices, % -2.5 1.4 2.5
Adverse scenario GDP growth, % -2.3 3.4 3.3 237 45%
Unemployment, % 10.0 9.2 8.5
Change in household consumption, % -0.2 3.1 2.8
Change in house prices, % -5.2 -5.5 2.5
Norway
Favourable scenario GDP growth, % 2.9 3.2 2.8 65 5%
Unemployment, % 5.1 4.2 3.9
Change in household consumption, % 4.3 2.6 2.8
Change in house prices, % -1.0 -0.3 2.5
Baseline scenario GDP growth, % 1.9 3.3 2.9 67 50% 72 213 347 632
Unemployment, % 6.1 5.1 4.3
Change in household consumption, % 3.6 2.5 2.3
Change in house prices, % -3.2 0 3.0
Adverse scenario GDP growth, % -0.7 3.1 3.7 78 45%
Unemployment, % 7.1 6.7 5.8
Change in household consumption, % 2.2 2.4 2.8
Change in house prices, % -10.5 -9.3 3.2
Sweden
Favourable scenario GDP growth, % 4.1 2.1 2.3 100 5%
Unemployment, % 8.3 7.7 6.8
Change in household consumption, % 2.4 2.2 2.3
Change in house prices, % -2.8 -0.3 2.7
Baseline scenario GDP growth, % 1.8 5.0 3.0 109 50% 114 129 71 314
Unemployment, % 10.0 8.1 7.3
Change in household consumption, % 0.1 5.2 2.7
Change in house prices, % -3.5 -0.1 1.6
Adverse scenario GDP growth, % -2.3 3.8 3.7 121 45%
Unemployment, % 11.5 11.1 10.2
Change in household consumption, % -3.2 2.9 2.3
Change in house prices, % -13.5 -11.1 3.8
Non-Nordic 9 1 241 251
Total 674 697 1,316 2,687
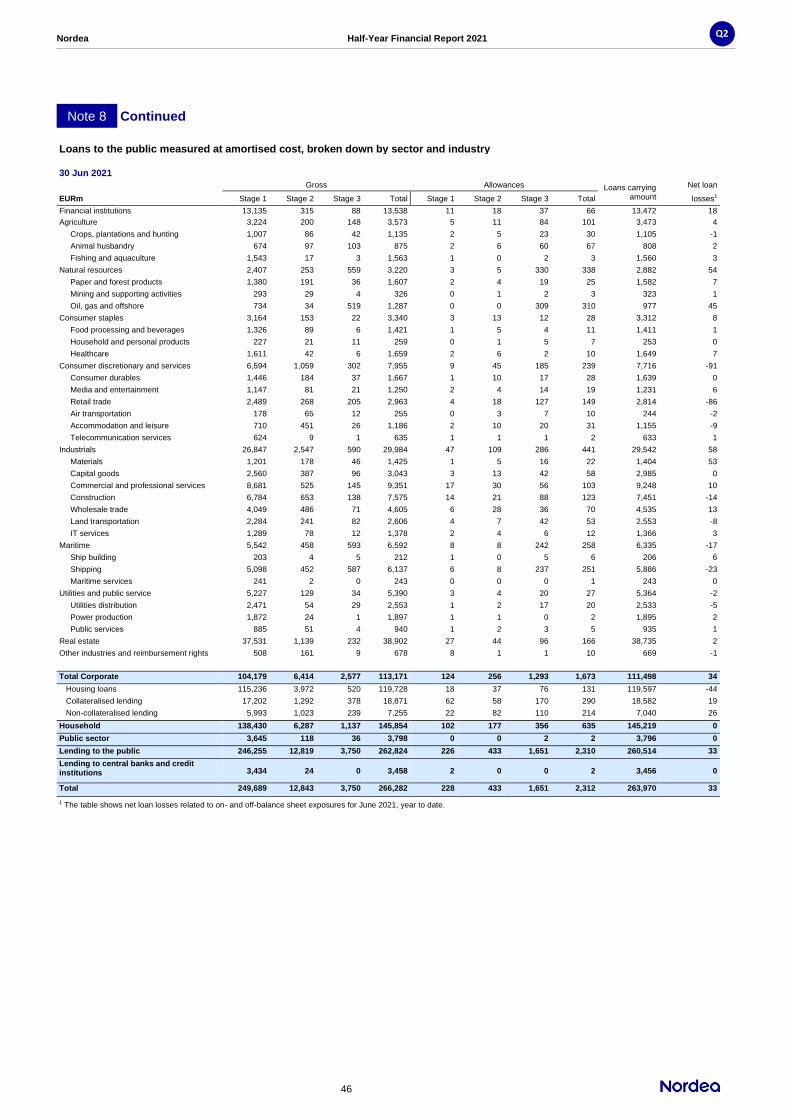
Nordea Half-Year Financial Report 2021
46
Q2
Note 8 Continued
Loans to the public measured at amortised cost, broken down by sector and industry
30 Jun 2021
Gross Allowances Loans carrying amount
Net loan
EURm Stage 1 Stage 2 Stage 3 Total Stage 1 Stage 2 Stage 3 Total losses1
Financial institutions 13,135 315 88 13,538 11 18 37 66 13,472 18 Agriculture 3,224 200 148 3,573 5 11 84 101 3,473 4 Crops, plantations and hunting 1,007 86 42 1,135 2 5 23 30 1,105 -1 Animal husbandry 674 97 103 875 2 6 60 67 808 2 Fishing and aquaculture 1,543 17 3 1,563 1 0 2 3 1,560 3 Natural resources 2,407 253 559 3,220 3 5 330 338 2,882 54 Paper and forest products 1,380 191 36 1,607 2 4 19 25 1,582 7 Mining and supporting activities 293 29 4 326 0 1 2 3 323 1 Oil, gas and offshore 734 34 519 1,287 0 0 309 310 977 45 Consumer staples 3,164 153 22 3,340 3 13 12 28 3,312 8 Food processing and beverages 1,326 89 6 1,421 1 5 4 11 1,411 1 Household and personal products 227 21 11 259 0 1 5 7 253 0 Healthcare 1,611 42 6 1,659 2 6 2 10 1,649 7 Consumer discretionary and services 6,594 1,059 302 7,955 9 45 185 239 7,716 -91 Consumer durables 1,446 184 37 1,667 1 10 17 28 1,639 0 Media and entertainment 1,147 81 21 1,250 2 4 14 19 1,231 6 Retail trade 2,489 268 205 2,963 4 18 127 149 2,814 -86 Air transportation 178 65 12 255 0 3 7 10 244 -2 Accommodation and leisure 710 451 26 1,186 2 10 20 31 1,155 -9 Telecommunication services 624 9 1 635 1 1 1 2 633 1 Industrials 26,847 2,547 590 29,984 47 109 286 441 29,542 58 Materials 1,201 178 46 1,425 1 5 16 22 1,404 53 Capital goods 2,560 387 96 3,043 3 13 42 58 2,985 0 Commercial and professional services 8,681 525 145 9,351 17 30 56 103 9,248 10 Construction 6,784 653 138 7,575 14 21 88 123 7,451 -14 Wholesale trade 4,049 486 71 4,605 6 28 36 70 4,535 13 Land transportation 2,284 241 82 2,606 4 7 42 53 2,553 -8 IT services 1,289 78 12 1,378 2 4 6 12 1,366 3 Maritime 5,542 458 593 6,592 8 8 242 258 6,335 -17 Ship building 203 4 5 212 1 0 5 6 206 6 Shipping 5,098 452 587 6,137 6 8 237 251 5,886 -23 Maritime services 241 2 0 243 0 0 0 1 243 0 Utilities and public service 5,227 129 34 5,390 3 4 20 27 5,364 -2 Utilities distribution 2,471 54 29 2,553 1 2 17 20 2,533 -5 Power production 1,872 24 1 1,897 1 1 0 2 1,895 2 Public services 885 51 4 940 1 2 3 5 935 1 Real estate 37,531 1,139 232 38,902 27 44 96 166 38,735 2 Other industries and reimbursement rights 508 161 9 678 8 1 1 10 669 -1
Total Corporate 104,179 6,414 2,577 113,171 124 256 1,293 1,673 111,498 34 Housing loans 115,236 3,972 520 119,728 18 37 76 131 119,597 -44 Collateralised lending 17,202 1,292 378 18,871 62 58 170 290 18,582 19 Non-collateralised lending 5,993 1,023 239 7,255 22 82 110 214 7,040 26 Household 138,430 6,287 1,137 145,854 102 177 356 635 145,219 0 Public sector 3,645 118 36 3,798 0 0 2 2 3,796 0 Lending to the public 246,255 12,819 3,750 262,824 226 433 1,651 2,310 260,514 33 Lending to central banks and credit institutions 3,434 24 0 3,458 2 0 0 2 3,456 0
Total 249,689 12,843 3,750 266,282 228 433 1,651 2,312 263,970 33
1 The table shows net loan losses related to on- and off-balance sheet exposures for June 2021, year to date.

Nordea Half-Year Financial Report 2021
47
Q2
Note 8 Continued
Loans to the public measured at amortised cost, broken down by sector and industry
31 Dec 2020
Gross Allowances Loans carrying amount
Net loan
EURm Stage 1 Stage 2 Stage 3 Total Stage 1 Stage 2 Stage 3 Total losses1
Financial institutions 12,622 509 158 13,289 18 16 150 185 13,105 -25 Agriculture 3,054 265 185 3,504 11 17 95 122 3,381 -13 Crops, plantations and hunting 1,027 112 49 1,188 4 7 23 34 1,154 -3 Animal husbandry 631 123 131 885 3 9 70 82 803 -4 Fishing and aquaculture 1,396 30 5 1,431 4 0 2 7 1,424 -5 Natural resources 2,673 188 564 3,425 5 4 282 291 3,134 -126 Paper and forest products 1,612 132 36 1,780 3 4 21 28 1,752 -15 Mining and supporting activities 330 22 4 356 0 0 2 3 353 -1 Oil, gas and offshore 730 34 524 1,288 1 0 258 260 1,028 -111 Consumer staples 2,821 219 27 3,067 5 20 15 40 3,027 -25 Food processing and beverages 1,083 85 7 1,175 2 5 4 11 1,164 -5 Household and personal products 165 59 11 235 1 2 5 8 227 -5 Healthcare 1,572 75 10 1,657 2 13 5 21 1,636 -15 Consumer discretionary and services 6,336 902 236 7,474 15 42 144 201 7,273 -77 Consumer durables 973 197 61 1,231 1 9 41 51 1,180 -26 Media and entertainment 1,409 79 34 1,522 2 4 25 31 1,492 -13 Retail trade 2,386 367 93 2,846 5 23 46 75 2,771 -21 Air transportation 167 33 14 214 0 1 9 10 204 -2 Accommodation and leisure 751 216 32 998 2 5 22 29 969 -20 Telecommunication services 651 9 1 662 4 0 0 5 657 6 Industrials 27,619 3,020 666 31,304 65 127 254 446 30,858 -160 Materials 1,190 384 63 1,637 3 7 29 38 1,599 9 Capital goods 2,795 403 97 3,295 5 13 51 69 3,226 -17 Commercial and professional services 10,031 605 189 10,825 26 30 0 56 10,768 -28 Construction 6,138 628 139 6,905 16 26 92 133 6,772 -56 Wholesale trade 4,234 556 85 4,874 9 35 43 86 4,788 -41 Land transportation 2,125 338 81 2,544 4 11 31 46 2,498 -19 IT services 1,106 106 12 1,224 3 6 9 18 1,207 -7 Maritime 5,620 362 555 6,537 16 9 226 251 6,286 -87 Ship building 129 4 7 140 0 0 7 7 133 2 Shipping 5,254 357 546 6,157 15 9 218 242 5,915 -88 Maritime services 237 1 1 239 0 0 1 1 238 0 Utilities and public service 5,444 127 32 5,603 4 6 16 26 5,577 -9 Utilities distribution 2,833 60 28 2,921 2 1 13 15 2,906 -2 Power production 1,833 33 1 1,866 1 3 0 4 1,863 -3 Public services 778 34 3 815 1 2 3 7 808 -4 Real estate 36,515 1,570 253 38,338 32 33 111 177 38,161 -81 Other industries and reimbursement rights 549 90 7 646 10 1 1 12 634 55
Total Corporate 103,253 7,249 2,684 113,186 181 274 1,295 1,750 111,436 -547 Housing loans 111,086 3,927 561 115,574 16 24 57 97 115,477 -77 Collateralised lending 16,425 1,401 396 18,222 55 70 192 317 17,905 -107 Non-collateralised lending 5,545 1,077 301 6,923 30 120 128 278 6,645 -178 Household 133,056 6,404 1,258 140,719 101 214 377 692 140,027 -362 Public sector 5,363 129 37 5,529 0 0 2 2 5,526 0 Lending to the public 241,672 13,782 3,979 259,433 282 489 1,674 2,444 256,989 -908 Lending to central banks and credit institutions 4,352 58 0 4,409 3 1 0 4 4,405 0
Total 246,023 13,840 3,979 263,843 285 490 1,674 2,448 261,394 -908
1 The table shows net loan losses related to on- and off-balance sheet exposures for the full year 2020.
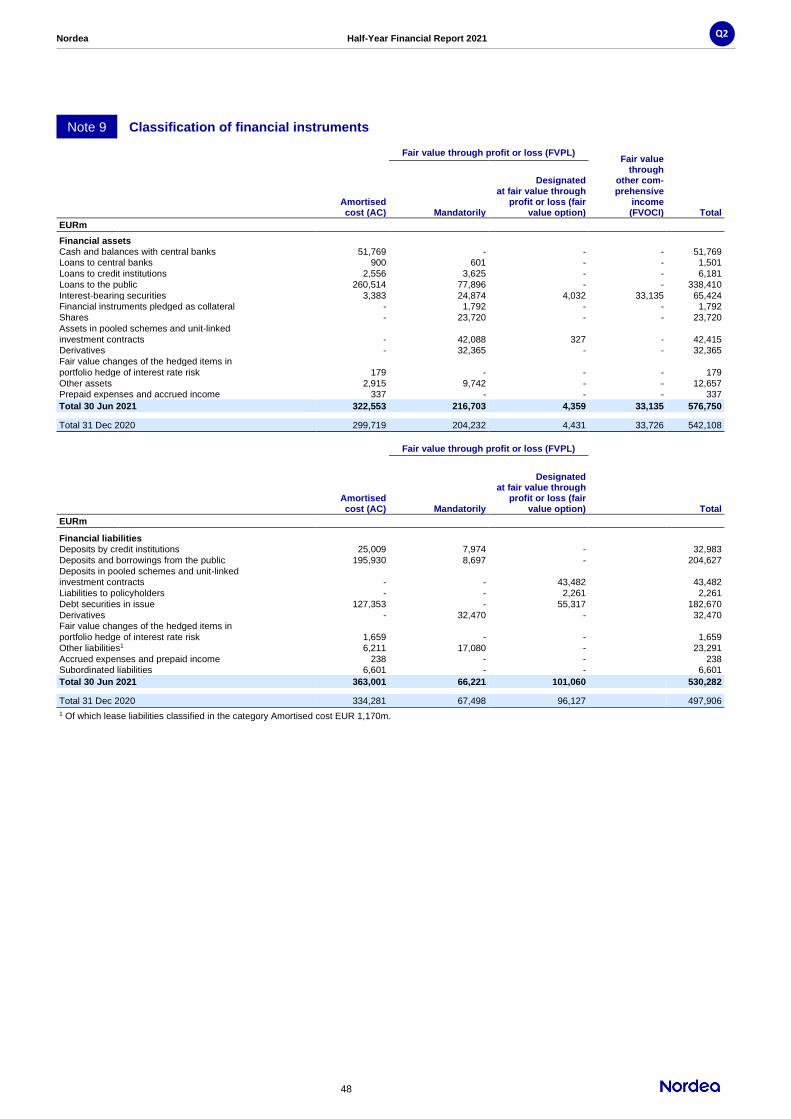
Nordea Half-Year Financial Report 2021
48
Q2
Note 9 Classification of financial instruments
Fair value through profit or loss (FVPL) Fair value
through other com-prehensive
income (FVOCI)
Amortised cost (AC) Mandatorily
Designated at fair value through
profit or loss (fair value option) Total
EURm
Financial assets
Cash and balances with central banks 51,769 - - - 51,769 Loans to central banks 900 601 - - 1,501
Loans to credit institutions 2,556 3,625 - - 6,181
Loans to the public 260,514 77,896 - - 338,410
Interest-bearing securities 3,383 24,874 4,032 33,135 65,424 Financial instruments pledged as collateral - 1,792 - - 1,792
Shares - 23,720 - - 23,720
Assets in pooled schemes and unit-linked
investment contracts - 42,088 327 - 42,415 Derivatives - 32,365 - - 32,365
Fair value changes of the hedged items in
portfolio hedge of interest rate risk 179 - - - 179
Other assets 2,915 9,742 - - 12,657 Prepaid expenses and accrued income 337 - - - 337
Total 30 Jun 2021 322,553 216,703 4,359 33,135 576,750
Total 31 Dec 2020 299,719 204,232 4,431 33,726 542,108
Fair value through profit or loss (FVPL)
Amortised cost (AC) Mandatorily
Designated at fair value through
profit or loss (fair value option) Total
EURm
Financial liabilities
Deposits by credit institutions 25,009 7,974 - 32,983
Deposits and borrowings from the public 195,930 8,697 - 204,627
Deposits in pooled schemes and unit-linked investment contracts - - 43,482 43,482
Liabilities to policyholders - - 2,261 2,261
Debt securities in issue 127,353 - 55,317 182,670
Derivatives - 32,470 - 32,470 Fair value changes of the hedged items in portfolio hedge of interest rate risk 1,659 - - 1,659
Other liabilities1 6,211 17,080 - 23,291
Accrued expenses and prepaid income 238 - - 238 Subordinated liabilities 6,601 - - 6,601
Total 30 Jun 2021 363,001 66,221 101,060 530,282
Total 31 Dec 2020 334,281 67,498 96,127 497,906
1 Of which lease liabilities classified in the category Amortised cost EUR 1,170m.
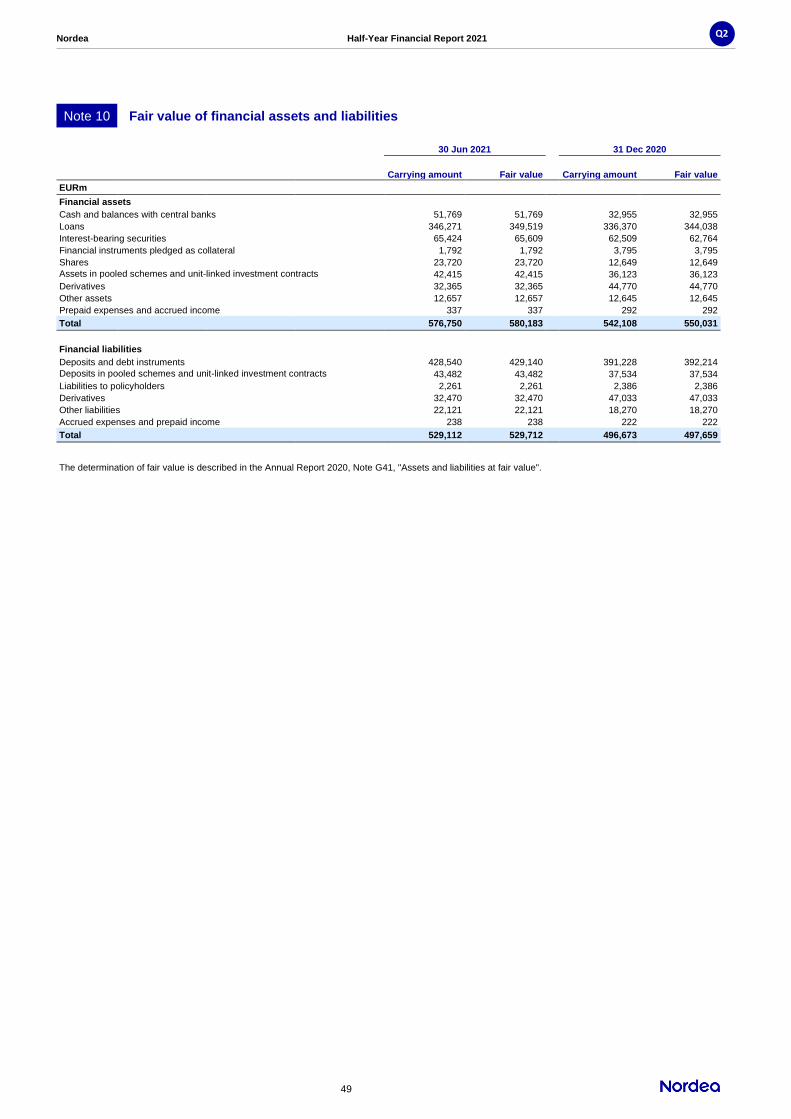
Nordea Half-Year Financial Report 2021
49
Q2
Note 10 Fair value of financial assets and liabilities
30 Jun 2021 31 Dec 2020
Carrying amount Fair value Carrying amount Fair value
EURm
Financial assets
Cash and balances with central banks 51,769 51,769 32,955 32,955
Loans 346,271 349,519 336,370 344,038
Interest-bearing securities 65,424 65,609 62,509 62,764
Financial instruments pledged as collateral 1,792 1,792 3,795 3,795
Shares 23,720 23,720 12,649 12,649
Assets in pooled schemes and unit-linked investment contracts
42,415 42,415 36,123 36,123
Derivatives 32,365 32,365 44,770 44,770
Other assets 12,657 12,657 12,645 12,645
Prepaid expenses and accrued income 337 337 292 292
Total 576,750 580,183 542,108 550,031
Financial liabilities
Deposits and debt instruments 428,540 429,140 391,228 392,214
Deposits in pooled schemes and unit-linked investment contracts
43,482 43,482 37,534 37,534
Liabilities to policyholders 2,261 2,261 2,386 2,386
Derivatives 32,470 32,470 47,033 47,033
Other liabilities 22,121 22,121 18,270 18,270
Accrued expenses and prepaid income 238 238 222 222
Total 529,112 529,712 496,673 497,659
The determination of fair value is described in the Annual Report 2020, Note G41, "Assets and liabilities at fair value".

Nordea Half-Year Financial Report 2021
50
Q2
Note 11 Financial assets and liabilities held at fair value on the balance sheet
Categorisation in the fair value hierarchy
Quoted prices in
active markets for
the same instruments
(Level 1)
Of which Life &
Pension
Valuation technique
using observable
data (Level 2)
Of which Life &
Pension
Valuation technique
using non-observable
data (Level 3)
Of which Life &
Pension Total
EURm
Assets at fair value on the balance sheet1
Loans to central banks - - 601 - - - 601
Loans to credit institutions - - 3,625 - - - 3,625
Loans to the public - - 77,896 - - - 77,896
Interest-bearing securities2 25,363 1,162 37,872 2,847 598 63 63,833
Shares 21,058 10,373 452 208 2,210 970 23,720
Assets in pooled schemes and unit-linked investment contracts
41,819 37,465 467 467 129 129 42,415
Derivatives 78 - 30,936 1 1,351 - 32,365
Other assets - - 9,711 - 31 30 9,742
Total 30 Jun 2021 88,318 49,000 161,560 3,523 4,319 1,192 254,197
Total 31 Dec 2020 74,689 42,072 162,906 3,733 4,794 1,024 242,389
Liabilities at fair value on the balance sheet1
Deposits by credit institutions - - 7,974 - - - 7,974
Deposits and borrowings from the public - - 8,697 - - - 8,697
Deposits in pooled schemes and unit-linked investment contracts
- - 43,482 39,137 - - 43,482
Liabilities to policyholders - - 2,261 2,261 - - 2,261
Debt securities in issue 41,290 - 12,479 - 1,548 - 55,317
Derivatives 102 - 31,207 42 1,161 - 32,470
Other liabilities 6,663 - 10,396 - 21 - 17,080
Total 30 Jun 2021 48,055 - 116,496 41,440 2,730 - 167,281
Total 31 Dec 2020 50,870 - 109,333 35,501 3,422 - 163,625 1 All items are measured at fair value on a recurring basis at the end of each reporting period. 2 Of which EUR 1,792m relates to the balance sheet item Financial instruments pledged as collateral.
Transfers between Levels 1 and 2 During the period Nordea transferred "Interest-bearing securities" (including such financial instruments pledged as collateral) of EUR 1,926m from Level 1 to Level 2 and of EUR 919m from Level 2 to Level 1 in the fair value hierarchy. Furthermore, Nordea transferred "Debt securities in issue" of EUR 7,369m from Level 1 to Level 2 and of EUR 3,797m from Level 2 to Level 1. Nordea also transferred "Other liabilities" of EUR 242m from Level 1 to Level 2 and of EUR 141m from Level 2 to Level 1. The transfers from Level 1 to Level 2 were due to the instruments ceasing to be actively traded during the period, which meant that fair values were obtained using valuation techniques with observable market inputs. The transfers from Level 2 to Level 1 were due to the instruments again being actively traded during the period, which meant that reliable quoted prices were obtained in the market. Transfers between levels are considered to have occurred at the end of the reporting period.
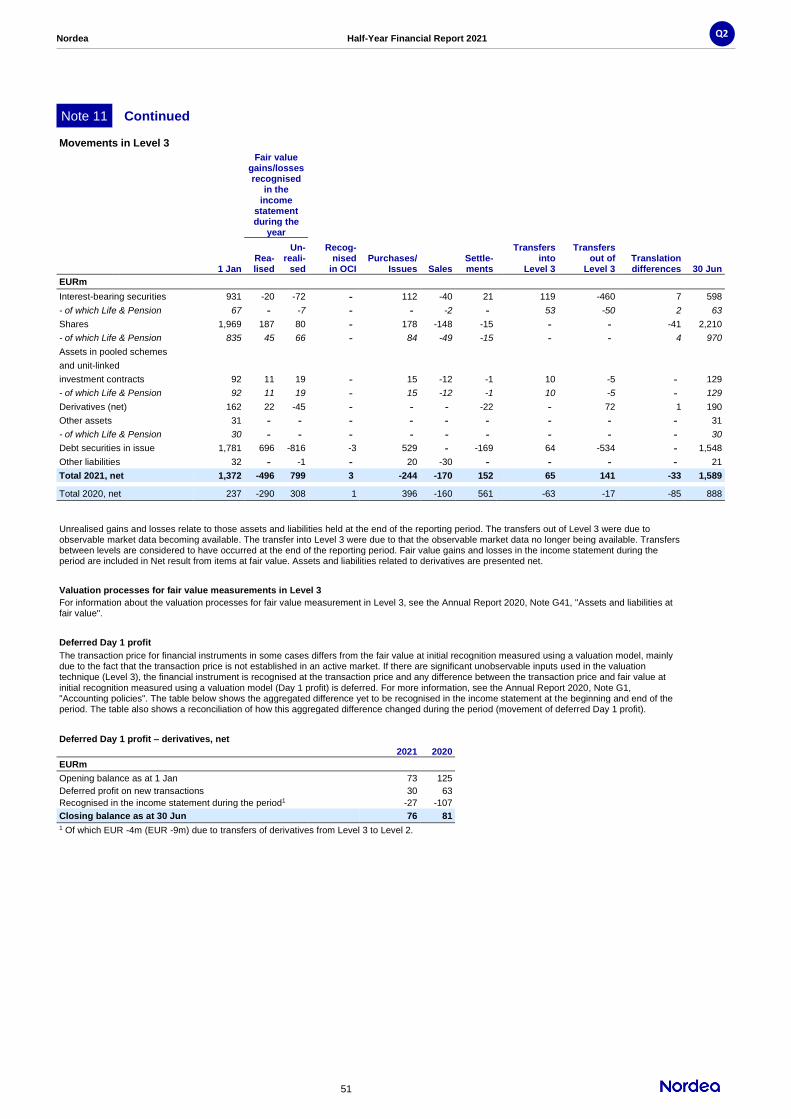
Nordea Half-Year Financial Report 2021
51
Q2
Note 11 Continued
Movements in Level 3
Fair value gains/losses recognised
in the income
statement during the
year
1 Jan Rea-lised
Un-reali-
sed
Recog-nised
in OCI Purchases/
Issues Sales Settle-ments
Transfers into
Level 3
Transfers out of
Level 3 Translation differences 30 Jun
EURm
Interest-bearing securities 931 -20 -72 - 112 -40 21 119 -460 7 598
- of which Life & Pension 67 - -7 - - -2 - 53 -50 2 63
Shares 1,969 187 80 - 178 -148 -15 - - -41 2,210
- of which Life & Pension 835 45 66 - 84 -49 -15 - - 4 970
Assets in pooled schemes
and unit-linked
investment contracts 92 11 19 - 15 -12 -1 10 -5 - 129
- of which Life & Pension 92 11 19 - 15 -12 -1 10 -5 - 129
Derivatives (net) 162 22 -45 - - - -22 - 72 1 190
Other assets 31 - - - - - - - - - 31
- of which Life & Pension 30 - - - - - - - - - 30
Debt securities in issue 1,781 696 -816 -3 529 - -169 64 -534 - 1,548
Other liabilities 32 - -1 - 20 -30 - - - - 21
Total 2021, net 1,372 -496 799 3 -244 -170 152 65 141 -33 1,589
Total 2020, net 237 -290 308 1 396 -160 561 -63 -17 -85 888
Unrealised gains and losses relate to those assets and liabilities held at the end of the reporting period. The transfers out of Level 3 were due to observable market data becoming available. The transfer into Level 3 were due to that the observable market data no longer being available. Transfers between levels are considered to have occurred at the end of the reporting period. Fair value gains and losses in the income statement during the period are included in Net result from items at fair value. Assets and liabilities related to derivatives are presented net.
Valuation processes for fair value measurements in Level 3 For information about the valuation processes for fair value measurement in Level 3, see the Annual Report 2020, Note G41, "Assets and liabilities at fair value".
Deferred Day 1 profit The transaction price for financial instruments in some cases differs from the fair value at initial recognition measured using a valuation model, mainly due to the fact that the transaction price is not established in an active market. If there are significant unobservable inputs used in the valuation technique (Level 3), the financial instrument is recognised at the transaction price and any difference between the transaction price and fair value at initial recognition measured using a valuation model (Day 1 profit) is deferred. For more information, see the Annual Report 2020, Note G1, "Accounting policies". The table below shows the aggregated difference yet to be recognised in the income statement at the beginning and end of the period. The table also shows a reconciliation of how this aggregated difference changed during the period (movement of deferred Day 1 profit).
Deferred Day 1 profit – derivatives, net
2021 2020 EURm Opening balance as at 1 Jan 73 125 Deferred profit on new transactions 30 63 Recognised in the income statement during the period1 -27 -107 Closing balance as at 30 Jun 76 81 1 Of which EUR -4m (EUR -9m) due to transfers of derivatives from Level 3 to Level 2.

Nordea Half-Year Financial Report 2021
52
Q2
Note 11 Continued
Valuation techniques and inputs used in the fair value measurements in Level 3
Fair value
Of which Life &
Pension1 Valuation techniques Unobservable input Range of fair
value4
EURm
Interest-bearing securities
Public bodies 41 - Discounted cash flows Credit spread -4/4
Mortgage and other credit institutions 380 58 Discounted cash flows Credit spread -33/33
Corporates2 177 5 Discounted cash flows Credit spread -17/17
Total 30 Jun 2021 598 63 -54/54
Total 31 Dec 2020 931 67 -88/88
Shares
Private equity funds 1,093 562 Net asset value3 -121/121
Hedge funds 75 74 Net asset value3 -7/7
Credit funds 511 168 Net asset value/market consensus3 -44/44
Other funds 242 165 Net asset value/Fund prices3 -20/20
Other5 418 130 - -43/43
Total 30 Jun 2021 2,339 1,099 -235/235
Total 31 Dec 2020 2,061 927 -199/199
Derivatives, net
Interest rate derivatives 253 - Option model Correlations -9/9
Volatilities
Equity derivatives -76 - Option model Correlations -10/5
Volatilities
Dividends
Foreign exchange derivatives 22 - Option model Correlations
0/0
Volatilities
Credit derivatives -11 - Credit derivative model Correlations
-23/22
Volatilities
Recovery rates
Other 2 - Option model Correlations
-0/0
Volatilities
Total 30 Jun 2021 190 - -42/36
Total 31 Dec 2020 162 - -52/55
Debt securities in issue Issued structured bonds 1,548 - Credit derivative model Correlations -7/7
Recovery rates
Volatilities
Total 30 Jun 2021 1,548 - -7/7
Total 31 Dec 2020 1,781 - -7/7
Other, net
Other assets and other liabilities, net 10 30 - - -2/2
Total 30 Jun 2021 10 30 -2/2
Total 31 Dec 2020 -1 30 -1/1
1 Investments in financial instruments are a major part of the life insurance business, acquired to fulfill the obligations behind the insurance and investments
contracts. The gains or losses on these instruments are almost exclusively allocated to policyholders and consequently do not affect Nordea's equity. 2 Of which EUR 155m is priced at a credit spread (the difference between the discount rate and the LIBOR) of 1.45%. A reasonable change in this credit
spread would not affect the fair value due to callability features. 3 The fair values are based on prices and net asset values provided by external suppliers/custodians. The prices are fixed by the suppliers/custodians on
the basis of the development in the assets behind the investments. For private equity funds, the dominant measurement methodology used by the suppliers/
custodians is consistent with the International Private Equity and Venture Capital Valuation (IPEV) guidelines issued by Invest Europe (formerly
EVCA). Approximately 50% of the private equity fund investments are internally adjusted/valued based on the IPEV guidelines. These carrying amounts are
in a range of 3% to 100% compared with the values received from suppliers/custodians. 4 The column "Range of fair value" shows the sensitivity of Level 3 financial instruments to changes in key assumptions. For more information, see the Annual
Report 2020, Note G41, "Assets and liabilities at fair value". 5 Of which EUR 129m related to assets in pooled schemes and unit-linked investment contracts.

Nordea Half-Year Financial Report 2021
53
Q2
Note 12 Risks and uncertainties
Nordea is subject to various legal regimes and requirements, including but not limited to those of the Nordic countries, the European Union and the United States. The supervisory and governmental authorities administering and enforcing these regimes make regular enquiries and conduct investigations with regard to Nordea’s compliance. Areas subject to investigation include investment advice, anti-money laundering (AML), trade regulation and sanctions adherence, external tax rules, competition law, and governance and control. The outcome and timing of these enquiries and investigations are unclear and pending. Accordingly, it cannot be ruled out that these enquiries and investigations could lead to criticism against the bank, reputation loss, fines, sanctions, disputes and/or litigation. In June 2015 the Danish Financial Supervisory Authority investigated how Nordea Bank Danmark A/S had followed the regulations regarding AML. The outcome resulted in criticism and, in accordance with Danish administrative practice, the matter was handed over to the police for further handling and possible sanctions. As previously stated, Nordea expects to be fined in Denmark for weak AML processes and procedures in the past and has made a provision for ongoing AML-related matters. There is a risk that, in the event the authorities issue fines, these could be higher (or potentially lower) than the current provision, and that this could also impact Nordea’s financial performance. In addition, some of these proceedings could lead to litigation. Given this uncertainty, Nordea will maintain the level of provision for ongoing AML-related matters while continuing the dialogue with the Danish Authorities regarding their allegations concerning historical AML weaknesses.
Nordea has made significant investments to address the deficiencies highlighted by the investigations. Among other actions, Nordea established in 2015 the Financial Crime Change Programme, and has strengthened its organisation significantly to enhance its AML and sanction management risk frameworks. Nordea also established the Sustainability and Ethics Committee and a culture transformation programme to embed stronger ethical standards into its corporate culture. The Group is also investing in enhanced compliance standards, processes and resources in both the first and second lines of defence. Within the framework of normal business operations, Nordea faces a number of claims related to the provision of banking and investment services and other areas in which it operates. Some of these claims have led or could lead to disputes and/or litigation. Currently, such claims are mainly related to lending and insolvency situations, various investment services, and sub-custody and withholding taxation matters. At present, none of the current claims are considered likely to have any significant adverse effect on Nordea or its financial position. There are significant risks caused by the COVID-19 pandemic given the uncertainty of the economic impact on the markets in which Nordea operates. Depending on future developments, potential adverse impacts on income could arise due to lower net interest income, market volatility and reduced business activity impacting transaction volumes and customer activity. Potential future credit risks are addressed in Note 8 and the section “Net loan losses and similar net result”. Depending on the duration and magnitude of the situation, there is a possibility that Nordea will not be able to meet its financial targets in very adverse scenarios.

Nordea Half-Year Financial Report 2021
54
Q2
Glossary Allowances in relation to credit-impaired loans (stage 3) Allowances for impaired loans (stage 3) divided by impaired loans measured at amortised cost (stage 3) before allowances.
Allowances in relation to loans in stages 1 and 2 Allowances for non-impaired loans (stages 1 and 2) divided by non-impaired loans measured at amortised cost (stages 1 and 2) before allowances.
Economic capital Economic capital is Nordea’s internal estimate of required capital. It measures the capital required to cover unexpected losses in the course of Nordea’s business with a certain probability. Economic capital uses advanced internal models to provide a consistent measurement for credit risk, market risk, operational risk, business risk and life insurance risk arising from activities in Nordea’s various business areas. The aggregation of risks across the Group gives rise to diversification effects resulting from the differences in risk drivers and the improbability that unexpected losses occur simultaneously.
Impairment rate (stage 3), gross Impaired loans (stage 3) before allowances divided by total loans measured at amortised cost before allowances.
Impairment rate (stage 3), net Impaired loans (stage 3) after allowances divided by total loans measured at amortised cost before allowances.
Net loan loss ratio, amortised cost Net loan losses (annualised) divided by the quarterly closing balance of the carrying amount of loans to the public (lending) measured at amortised cost.
Return on capital at risk
Return on capital at risk (ROCAR) is defined as net profit excluding items affecting comparability as a percentage of economic capital. For the business areas it is defined as operating profit after standard tax as a percentage of economic capital.
Return on capital at risk with amortised resolution fees
ROCAR with amortised resolution fees is defined as net profit adjusted for the effect of resolution fees on an amortised basis after tax and excluding items affecting comparability as a percentage of economic capital. For the business areas it is defined as operating profit adjusted for the effect of resolution fees on an amortised basis after standard tax as a percentage of economic capital.
Return on equity Net profit for the period as a percentage of average equity for the period. Additional Tier 1 capital, accounted for in equity, is classified as a financial liability in the calculation. Net profit for the period excludes non-controlling interests and interest expense on Additional Tier 1 capital (discretionary interest accrued). Average equity includes net profit for the period and dividend until paid, and excludes non-controlling interests and Additional Tier 1 capital.
Return on equity with amortised resolution fees Net profit for the period as a percentage of average equity for the period. Additional Tier 1 capital, accounted for in equity, is classified as a financial liability in the calculation. Net profit for the period excludes non-controlling interests and interest expense on Additional Tier 1 capital (discretionary interest accrued), and is adjusted for the effect of resolution fees on an amortised basis after tax. Average equity includes net profit for the period and dividend until paid, and excludes non-controlling interests and Additional Tier 1 capital.
Return on risk exposure amount Net profit for the period as a percentage of average risk exposure amount for the period. Net profit for the period excludes non-controlling interests and interest expense on Additional Tier 1 capital (discretionary interest accrued).
Return on tangible equity Net profit for the period as a percentage of average equity for the period. Additional Tier 1 capital, accounted for in equity, is classified as a financial liability in the calculation. Net profit for the period excludes non-controlling interests and interest expense on Additional Tier 1 capital (discretionary interest accrued). Average equity includes net profit for the period and dividend until paid, excludes non-controlling interests and Additional Tier 1 capital, and is reduced with intangible assets.
Tier 1 capital The Tier 1 capital of an institution consists of the sum of its Common Equity Tier 1 capital and Additional Tier 1 capital. Common Equity Tier 1 capital includes consolidated shareholders’ equity excluding investments in insurance companies, proposed dividend, deferred tax assets, intangible assets in the banking operations, the full expected shortfall deduction (the negative difference between expected losses and provisions) and other deductions, such as cash flow hedges.
Tier 1 capital ratio Tier 1 capital as a percentage of the risk exposure amount. The Common Equity Tier 1 capital ratio is defined as Common Equity Tier 1 capital as a percentage of the risk exposure amount.
Total allowance rate (stages 1, 2 and 3) Total allowances divided by total loans measured at amortised cost before allowances.
For a list of further alternative performance measures and business definitions, please see https://www.nordea.com/en/investor-relations/reports-and-presentations/group-interim-reports/ and the Annual Report 2020.

Nordea Half-Year Financial Report 2021
55
Q2
Nordea Bank Abp
Income statement
Q2 Q2 Jan-Jun Jan-Jun Jan-Dec
2021 2020 2021 2020 2020
EURm Note
Operating income
Interest income 820 993 1,750 2,168 3,906
Interest expense -152 -353 -425 -892 -1,390
Net interest income 668 640 1,325 1,276 2,516
Fee and commission income 635 509 1,232 1,095 2,223
Fee and commission expense -131 -132 -257 -268 -525
Net fee and commission income 504 377 975 827 1,698
Net result from securities trading and foreign exchange dealing 287 271 663 348 785 Net result from securities at fair value through fair value reserve -29 -3 -20 9 13
Net result from hedge accounting -3 -1 1 6 -8
Net result from investment properties 0 0 0 0 0
Income from equity investments 5 353 467 706 1,681
Other operating income1 370 115 481 220 483
Total operating income 1,802 1,752 3,892 3,392 7,168
Operating expenses
Staff costs -585 -542 -1,147 -1,125 -2,285
Other administrative expenses -196 -191 -392 -394 -799
Other operating expenses -106 -128 -392 -375 -593
Depreciation, amortisation and impairment charges of tangible and intangible assets -113 -92 -212 -180 -417
Total operating expenses -1,000 -953 -2,143 -2,074 -4,094
Profit before loan losses 802 799 1,749 1,318 3,074
Net loan losses 88 -542 49 -696 -678
Impairment on other financial assets 0 0 -1 0 -107
Operating profit 890 257 1,797 622 2,289
Income tax expense -220 29 -351 13 -325
Net profit for period 670 286 1,446 635 1,964
1 From 1 January 2021 the transfer pricing method applied to internal sales and distribution services provided by Nordea Bank Abp to the mortgage companies of the Group has been updated to be in line with the development of OECD guidelines on transfer pricing and local tax practice. The
updated methodology has entailed pricing adjustments to sales and distribution fees. Accrued income for 2021 is reflected in Q2, increasing Other
operating income by EUR 261 million.

Nordea Half-Year Financial Report 2021
56
Q2
Nordea Bank Abp
Balance sheet
30 Jun 31 Dec 30 Jun
2021 2020 2020
EURm
Assets
Cash and balances with central banks 51,092 32,380 48,038
Debt securities eligible for refinancing with central banks 58,963 67,748 77,389
Loans to credit institutions 79,625 64,364 69,115
Loans to the public 139,459 135,873 147,075
Interest-bearing securities 15,466 9,085 8,898
Shares and participations 15,152 4,864 5,299
Investments in associated undertakings and joint ventures 90 90 92
Investments in group undertakings 15,010 14,686 13,942
Derivatives 32,701 45,155 47,413
Fair value changes of the hedged items in portfolio hedge of interest rate risk 62 85 98
Intangible assets 1,785 1,785 1,779
Tangible assets
Properties and equipment 259 289 286
Investment properties 1 1 0
Deferred tax assets 81 398 462
Current tax assets 259 193 316
Retirement benefit assets 335 142 94
Other assets 12,890 14,048 16,984
Prepaid expenses and accrued income 1,265 1,012 1,093
Total assets 424,495 392,198 438,373
Liabilities
Deposits by credit institutions and central banks 40,985 32,278 55,494
Deposits and borrowings from the public 211,212 190,649 195,241
Debt securities in issue 75,433 60,745 71,893
Derivatives 33,433 48,552 51,360
Fair value changes of the hedged items in portfolio hedge of interest rate risk 833 1,408 1,744
Current tax liabilities 2 181 16
Other liabilities 22,927 19,537 23,580
Accrued expenses and prepaid income 960 1,048 1,006
Deferred tax liabilities 22 0 0
Provisions 561 638 711
Retirement benefit obligations 242 296 482
Subordinated liabilities 6,591 6,888 8,434
Total liabilities 393,201 362,220 409,961
Equity
Share capital 4,050 4,050 4,050
Additional Tier 1 capital holders 749 748 750
Invested unrestricted equity 1,066 1,063 1,072
Other reserves -68 -258 -468
Retained earnings 24,051 22,411 22,373
Profit or loss for the period 1,446 1,964 635
Total equity 31,294 29,978 28,412
Total liabilities and equity 424,495 392,198 438,373
Off-balance sheet commitments
Commitments given to a third party on behalf of customers
Guarantees and pledges 48,136 48,007 45,892
Other 936 1,024 1,127
Irrevocable commitments in favour of customers
Securities repurchase commitments - - -
Other 93,136 90,398 86,050

Nordea Half-Year Financial Report 2021
57
Q2
Nordea Bank Abp
Note 1 Accounting policies
The financial statements for the parent company, Nordea Bank Abp, are prepared in accordance with the Finnish Accounting Act, the Finnish Act on Credit Institutions, the Decree of the Ministry of Finance on the financial statements and consolidated financial statements of credit institutions and investment firms, and the regulations of the Finnish Financial Supervisory Authority. International Financial Reporting Standards (IFRS) as endorsed by the European Commission have been applied to the extent possible within the framework of Finnish accounting legislation and considering the close tie between financial reporting and taxation. The accounting policies and methods of computation are unchanged in comparison with Note P1 in the Annual Report 2020, except for those relating to the items presented in the section “Changed accounting policies and presentation” below. For more information, see Note P1 in the Annual Report 2020.
Changed accounting policies and presentation The following changes in accounting policies and presentation were implemented by Nordea Bank Abp on 1 January 2021.
Interest Rate Benchmark Reform – Phase 2 In 2020 the International Accounting Standards Board (IASB)
published amendments to IFRS 9, IAS 39, IFRS 7, IFRS 4 and IFRS 16 in “Interest Rate Benchmark Reform – Phase 2”. Phase 2 of the interbank offered rate (IBOR) reform includes three major areas: hedge accounting, modifications and disclosures. The amendments were implemented by Nordea Bank Abp on 1 January 2021. Hedge relationships in Nordea Bank Abp have been able to continue as before and no material modification gains or losses have been recognised. The amendments clarify that hedge accounting does not have to be discontinued in the event that hedged items and hedging instruments are modified due to the IBOR reform. Hedging relationships (and related documentation) must be amended to reflect modifications to the hedged item, hedging instrument and hedged risk. Any valuation adjustments resulting from the amendments are recognised as part of hedge ineffectiveness. Modifications required as a direct consequence of the IBOR reform and made on an economically equivalent basis are not accounted for as modifications to instruments measured at amortised cost. For such modifications, the effective interest rate is amended in line with the modified cash flows.
Nordea Half-Year Financial Report 2021
58
Q2
For further information • A webcast for media, investors and equity analysts will
be held on 21 July at 10.30 EET (09.30 CET), during which Frank Vang-Jensen, President and Group CEO, will present the results.
• To participate in the webcast, please use the webcast link or dial one of the following numbers: +44 333 300 0804, +46 8 566 426 51, +358 9 8171 03 10, +45 35 44 55 77, confirmation code 63886311#, no later than 10.20 EET (09.20 CET).
• The webcast will be directly followed by a Q&A audio session for investors and analysts with Frank Vang-Jensen, Ian Smith, Group CFO, and Matti Ahokas, Head of Investor Relations.
• The event will be webcast live and the presentation slides will be posted on www.nordea.com/ir.
• The Q2 2021 report, investor presentations and fact book are available at www.nordea.com.
Contacts
Frank Vang-Jensen President and Group CEO +358 503 821 391 Ian Smith Group CFO +45 5547 8372 Matti Ahokas Head of Investor Relations +358 405 759 178 Ulrika Romantschuk Head of Brand, Communication and Marketing +358 10 416 8023
Financial calendar
21 October 2021 – Third-quarter report 2021 (silent period starts on 7 October 2021)
Helsinki 20 July 2021 Nordea Bank Abp Board of Directors

Nordea Half-Year Financial Report 2021
59
Q2
Nordea Bank Abp • Satamaradankatu 5 • 00020 Helsinki • www.nordea.com/ir • Tel. +358 200 70000 • Business ID 2858394-9
This report contains forward-looking statements that reflect management’s current views with respect to certain future events and potential financial performance. Although Nordea believes that the expectations reflected in such forward-looking statements are reasonable, no assurance can be given that such expectations will prove to have been correct. Accordingly, results could differ materially from those set out in the forward-looking statements as a result of various factors. Important factors that may cause such a difference for Nordea include, but are not limited to: (i) the macroeconomic development, (ii) change in the competitive climate, (iii) change in the regulatory environment and other government actions and (iv) change in interest rate and foreign exchange rate levels. This report does not imply that Nordea has undertaken to revise these forward-looking statements, beyond what is required by applicable law or applicable stock exchange regulations if and when circumstances arise that will lead to changes compared to the date when these statements were provided.

Nordea Half-Year Financial Report 2021
60
Q2
Report on review of interim financial information of Nordea Bank Abp for the six months period ended 30 June 2021 To the Board of Directors of Nordea Bank Abp
Introduction We have reviewed the condensed interim financial information of Nordea Bank Abp, which comprise the balance sheet as at 30 June 2021, income statement, statement of comprehensive income, statement of changes in equity and cash flow statement for the six-month-period then ended and notes, all consolidated, and parent company’s balance sheet as at 30 June 2021 and income statement for the six-month-period then ended. The Board of Directors and the Managing Director are responsible for the preparation of the condensed interim financial information in accordance with International Accounting Standard (IAS) 34, “Interim Financial Reporting”, as adopted by the European Union and with regulations governing the preparation of interim financial information in Finland. We will express a conclusion on this condensed interim financial information based on our review. Scope of Review We conducted our review in accordance with International Standard on Review Engagements (ISRE) 2410, “Review of Interim Financial Information Performed by the Independent Auditor of the Entity”. A review of interim financial information consists of making inquiries, primarily of persons responsible for financial and accounting matters, and applying analytical and other review procedures. A review is substantially less in scope, than an audit conducted in accordance with International Standards on Auditing and consequently does not enable us to obtain assurance that we would become aware of all significant matters that might be identified in an audit. Accordingly, we do not express an audit opinion. Conclusion Based on our review, nothing has come to our attention that causes us to believe that the condensed interim financial information of Nordea Bank Abp for the six months period ended on 30 June 2021 is not prepared, in all material respects, as regards the Group financial information, in accordance with International Accounting Standard (IAS) 34, “Interim Financial Reporting”, as adopted by the European Union and other regulation governing the presentation of interim financial information in Finland, and as regards the parent company financial information, in accordance with regulations governing the preparation of interim financial information in Finland. Helsinki 20 July 2021 PricewaterhouseCoopers Oy Authorised Public Accountants Jukka Paunonen Authorised Public Accountant (KHT)