Embed Size (px)
Citation preview

Rovio Entertainment Corporation
Half Year Financial Report
August 17, 2018
HALF YEAR FINANCIAL REPORT - JANUARY-JUNE 2018

1
STRONG GROWTH IN ANGRY BIRDS 2 CONTINUES, RECORD INVESTMENTS IN USER ACQUISITION
April-June 2018 highlights • Rovio’s revenue was EUR 71.8 million (86.2). Year-on-year comparability was impacted by large revenue
peak of the Angry Birds Movie in Q2/2017. Depreciation of the US dollar decreased revenue by approximately EUR 9 million compared to last year
• Games segment revenue grew year-on-year 6.4% to 65.3 million euros (61.3); Growth in comparable currencies was approximately 12%
• Rovio’s biggest game, Angry Birds 2 gross bookings grew 44% year-on-year to reach a record number EUR 29.7 (20.6) million; Growth in comparable currencies was approximately 50%
• Brand Licensing revenue declined as expected year-on-year to 6.5 million euros (24.9) due to the large revenue peak of the Angry Birds Movie in Q2/2017
• Group adjusted operating profit was EUR 6.0 million (16.1) and adjusted operating profit margin 8.4% (18.6 %)
• User acquisition investments increased to EUR 22.9 million (15.1), or 35.1% of the Games segment’s revenue (24.6%)
• Games daily active users (DAU) increased to 8.8 million from previous quarter’s 8.7 million
• Games monthly unique payers (MUP) increased 14.6% to 581 thousand from previous quarter’s 507 thousand
• Net cash flows from operating activities was EUR 1.8 million (30.6)
• Earnings per share was EUR 0.07 (0.13)
January-June 2018 highlights • Rovio’s revenue was EUR 137.5 million (152.6). Year-on-year comparability was impacted by large revenue
peak of Angry Birds movie in H1/2017. Depreciation of the US dollar decreased revenue by approximately EUR 17 million compared to last year
• Games revenue grew 3.5% to EUR 122.1 million (117.9). In comparable currencies, the year-on-year revenue of Games segment grew approximately by 12%
• Brand Licensing revenue declined as expected year-on-year to EUR 15.4 million (34.6) due to the large revenue peak of the Angry Birds Movie in Q2/2017
• Group adjusted operating profit was EUR 15.6 million (21.3) and adjusted operating profit margin 11.3% (14.0%)
• User acquisition investments increased to EUR 37.5 million (31.5) or 30.7% of revenues (26.7%)
• Net cash flows from operating activities was EUR 12.3 million (35.7)
• Earnings per share was EUR 0.16 (0.18)

2
Key figures 4–6/ 4–6/ Change, 1–6/ 1–6/ Change, 1–12/ EUR million 2018 2017 (%) 2018 2017 (%) 2017
Revenue 71.8 86.2 -16.8% 137.5 152.6 -9.9% 297.2
EBITDA 9.3 29.7 -68.7% 23.6 39.9 -40.9% 60.0
EBITDA margin 12.9% 34.4% - 17.1% 26.1% - 20.2%
Adjusted EBITDA 9.3 31.6 -70.7% 23.9 41.8 -42.9% 64.5
Adjusted EBITDA margin, % 12.9% 36.7% - 17.4% 27.4% - 21.7%
Operating profit 6.0 14.1 -57.5% 15.2 19.4 -21.4% 31.4
Operating profit margin, % 8.4% 16.3% - 11.1% 12.7% - 10.6%
Adjusted operating profit 6.0 16.1 -62.7% 15.6 21.3 -27.0% 35.9
Adjusted operating profit margin, % 8.4% 18.6% - 11.3% 14.0% - 12.1%
Profit before tax 6.8 12.5 -45.2% 15.8 17.2 -8.3% 26.6
Capital expenditure 0.0 2.1 -99.0% 0.3 5.8 -94.1% 8.5
User acquisition cost 22.9 15.1 52.0% 37.5 31.5 19.2% 69.6
Return on equity (ROE), % 20.6% 30.8% - 20.6% 30.8% - 23.4%
Net gearing ratio, % -63.9% -35.4% - -63.9% -35.4% - -62.9%
Equity ratio, % 83.4% 71.6% - 83.4% 71.6% - 77.9%
Earnings per share, EUR 0.07 0.13 -47.9% 0.16 0.18 -10.9% 0.27
Earnings per share, diluted EUR 0.07 0.13 -47.6% 0.15 0.18 -10.6% 0.27
Net cash flows from operating activities 1.8 30.6 -94.0% 12.3 35.7 -65.6% 59.6
Employees (average for the period) 379 411 -7.8% 382 434 -12.0% 416 Unless otherwise stated, the comparison figures in brackets refer to the corresponding period in the
previous year. Calculations and definitions are presented in the Performance Measures section. The changes in comparable currencies have been calculated by translating the reporting period figures
with the average USD/EUR exchange rates of the comparison period for the US dollar dominated in-app-purchases in United States and global ad network sales.
Kati Levoranta, CEO: Rovio continued its successful Games as a Service (“GaaS”) strategy in the second quarter of 2018.
Rovio’s innovative updates in Angry Birds 2 and increased user acquisition investments propelled Rovio’s second quarter Games revenues to EUR 65.3 million which is close to the record-breaking Q4/2017 showing 6.4% improvement year-on-year. Weak dollar continued to affect the growth in Euro terms and in comparable currencies the growth was 12 %.
Angry Birds 2 made again a new record quarter of EUR 29.7 million in gross bookings which is 38% better than the previous record quarter earlier this year. The gross bookings of Angry Birds Friends grew by 11% compared to the previous quarter. Angry Birds Match also grew from the previous quarter, however, for the other new games, we did not see the growth we wanted.
The total Games revenue in the first half of 2018 was EUR 122.1 million (117.9 million). Growth was thus 3.5% year-on-year. In comparable currencies Rovio’s Games business grew 12% in the first half of 2018.
The amount of daily and monthly active users also improved from previous quarter and so did the average revenue per daily active users. The number of monthly unique payers reached an all-time high of 581 thousand.
The revenue of Rovio’s Brand Licensing Unit was, as expected, lower year-on-year mainly due to fact that a large chunk of The Angry Birds Movie income was recognized in the second quarter last year. This quarter, the Brand Licensing Unit launched the licensing program for The Angry Birds Movie 2 in Las Vegas and has signed licensing contracts with many top consumer brands such as Chupa Chups, Crocs,

3
and Pez. Mainly due to smaller movie income, Rovio group revenue was 9.9% smaller in the first half of 2018
that in the corresponding period of 2017 and was EUR 137.5 million (152.6). Growing user acquisition investments and smaller movie revenue resulted in a smaller but still healthy operating profit of EUR 6.0 million (14.1) or 8.4% of revenues in 2Q18. Rovio is keeping its guidance for revenue and profitability unchanged.
In July, Hatch Entertainment took home an European award for Hottest Media/Entertainment Startup. The development of Hatch’s game streaming service continues actively, and the beta version is available on Android in 18 European countries.
Outlook for 2018 (unchanged) Rovio maintains its full year outlook as reported in the 1-12/2017 financial statement bulletin. Rovio
Group revenue is expected to be EUR 260–300 million in 2018 (EUR 297 million in 2017). Rovio’s profitability as measured by earnings before interest and tax excluding items affecting comparability is expected to be 9 to 11 percent (12.1 percent in 2017).
Basis for outlook In 2018, Rovio Games business will focus on continuing development of its live game portfolio
according to the Games as a Service strategy, profitable user acquisition and development of new games. The user acquisition investments are expected to be around 30 percent of Games revenues for the full year, however, the amount may vary depending on development of the games’ monetization and the level of competition in the market. The cost per acquired user has risen significantly in the market.
Brand Licensing segment revenues are expected to decline by 40% in 2018. The decline is due to the declining profile of the Angry Birds Movie. The consumer products revenues are expected to be at similar level as in 2017. The focus of Brand Licensing in 2018 is on preparing the licensing portfolio for 2019 and The Angry Birds Movie sequel.
During 2018, Rovio estimates to invest 10–15 million euros in its subsidiary Hatch Entertainment Ltd. that develops a cloud-based game streaming service (5 million euros in 2017). Approximately half of the investment will impact Group profit, i.e. an impact of 2–3 %-points to the expected EBIT margin, and half will be capitalized development costs and advance payments. Hatch represents one possible way to play mobile games in the future. By investing in the development of Hatch’s streaming service Rovio diversifies its portfolio, aims to utilize the possibilities that new technologies offer for games business, and implements company’s strategy to explore the future of gaming alongside the continuous free-to-play games development.
Briefing and webcast: Rovio will host an English language webcast on the half year 2018 financial results for investors, media
and institutional investors at 14:00-15:00 EET on 17.8.2018. The webcast can be viewed live at: http://www.rovio.com/investors-investor-calendar, and later on the same day as a recording.
More information: Kati Levoranta, CEO, tel. +358 207 888 300 René Lindell, CFO, tel. +358 207 888 300 Mikko Setälä EVP, Investor Relations, tel. +358 400 607 437 Distribution: Nasdaq Helsinki, principal media, www.rovio.com

4
Rovio in brief Rovio Entertainment Corporation is a global entertainment company that creates, develops and
publishes mobile games, which have been downloaded over 4 billion times. The Company is best known for the global Angry Birds brand, which started as a popular mobile game in 2009, and has since evolved from games to various entertainment and consumer products in brand licensing. Today, the Company offers multiple mobile games, animations and has produced The Angry Birds Movie, which opened number one in theatres in 50 countries and the sequel which is in production. Rovio is headquartered in Finland and the company’s shares are listed on the main list of NASDAQ Helsinki stock exchange with the trading code ROVIO.

5
Rovio Entertainment Corporation Half Year Financial Report 1–6/2018
A description of the accounting standards applied in the preparation of this interim report is provided in the notes to this interim report, in Note 1 Accounting principles.
Market review The mobile gaming market is expected to continue its strong growth in 2018. According to market
intelligence provider Newzoo’s global games market report published in June 2018, the global mobile gaming market size in end-user generated revenue is expected to be USD 70 billion in 2018 which represents 25% year-on-year growth. The market is expected to continue its strong growth of 17% CAGR from 2017 until 2021. The market is estimated to grow double digit in all major regions except in Western Europe where the CAGR estimate is 8%. Not only China (19%) and APAC (18%) are driving the growth since also North America is growing strongly at 15% CAGR. Newzoo estimates that in 2018 there will be over 2.2 billion gamers worldwide, and in 2021 more than 2.6 billion.
Revenue and result
April-June 2018 In the second quarter, Rovio group revenue increased by 9.2% from the first quarter this year but
decreased by 16.8% compared to the corresponding period of the previous year and amounted to EUR 71.8 million (86.2). The decrease in revenue compared to the same period in 2017 was due to the large revenue peak from the Angry Birds Movie in the second quarter of 2017. Depreciation of the US dollar decreased revenue by approximately EUR 9 million compared to last year.
The Games segment revenue grew 6.4% to EUR 65.3 million (61.3). In comparable currencies, the year-on-year revenue of Games segment grew by 12%. Angry Birds 2 and the new game launches in 2017 were the main drivers for year-on-year growth in comparable currencies while the older game portfolio continued declining as expected.
The revenue of the Brand Licensing segment was EUR 6.5 million (24.9). The revenue consisted of EUR 4.0 million (22.4) from Content Licensing, the majority of which was income from the Angry Birds Movie, and EUR 2.4 million (2.5) from Consumer Products. The year-on-year comparability of Content Licensing is impacted by the revenue peak from the Angry Birds Movie in the second quarter of 2017.
The Group’s adjusted EBITDA was EUR 9.3 million (31.6), or 12.9% (36.7%) of revenues. The larger EBITDA of last year was due to the peak in movie revenues.
The Group’s adjusted operating profit was EUR 6.0 million (16.1) and adjusted operating profit margin 8.4% (18.6 %). Excluding Hatch Entertainment operating expenses, the Group’s adjusted profit was 7.5 million (16.9) and operating profit margin 10.4% (19.6%). There were no adjustments in the second quarter of 2018. Adjustments in the second quarter of 2017 amounted to EUR 2.0 million and were related to the reorganization of the Brand Licensing unit.
The Games segment’s adjusted EBITDA was EUR 9.2 million (13.5). Games profitability was lower due to the increase in user acquisition investments to EUR 22.9 million (15.1) or 35.1% of revenues (24.6%) compared to last year.
The Brand Licensing segment’s adjusted EBITDA was EUR 3.6 million (20.7). Brand Licensing segment’s EBITDA decreased year-on-year due to the revenue peak of the Angry Birds Movie in the second quarter of 2017.
The Group’s profit before taxes was EUR 6.8 million (12.5) and earnings per share EUR 0.07 (0.13).

6
January-June 2018 In the first half of 2018, Rovio group revenue amounted to EUR 137.5 million (152.6). The -9.9%
decrease in revenue compared to the same period in 2017 was due to the large revenue peak from the Angry Birds Movie in first half of 2017. Depreciation of the US dollar decreased revenue by approximately EUR 17 million compared to last year.
The Games segment revenue grew 3.5% to EUR 122.1 million (117.9). In comparable currencies, the year-on-year revenue of Games segment grew by 12%.
The revenue of the Brand Licensing segment was EUR 15.4 million (34.6). The revenue consisted of EUR 11.2 million (29.4) from Content Licensing, the majority of which was income from the Angry Birds Movie, and EUR 4.2 million (5.3) from Consumer Products. The year-on-year comparability of Content Licensing is impacted by the revenue peak from the Angry Birds Movie in second quarter of 2017.
The Group’s adjusted EBITDA was EUR 23.9 million (41.8), or 17.4% (27.4%) of revenues. The larger EBITDA of last year was due to the peak in movie revenues.
The Group’s adjusted operating profit was EUR 15.6 million (21.3) and adjusted operating profit margin 11.3% (14.0). Adjustments in first half of 2018 amounted to EUR 0.3 million and were related to the closure Rovio’s game studio in London. Adjustments in the first half of 2017 amounted to EUR 2.0 million and were related to the reorganization of the Brand Licensing unit.
The Games segment’s adjusted EBITDA was EUR 19.8 million (22.5) or 16.3% of revenues (19.1%). Games segment’s profitability was lower due to the increase in user acquisition investments to EUR 37.5 million (31.5) or 30.7% of revenues (26.7%) compared to last year.
The Brand Licensing segment’s adjusted EBITDA was EUR 10.2 million (24.3). Brand licensing segment’s EBITDA decreased year-on-year due to the revenue peak of the Angry Birds Movie in the second quarter of 2017.
The Group’s profit before taxes was EUR 15.8 million (17.2) and earnings per share EUR 0.16 (0.18).
Financing and investments Rovio’s capital expenditure was EUR 0.0 million (2.1) in the second quarter of 2018. Rovio refers to the
user acquisition costs of the Games segment as investments, but pursuant to accounting regulations, they are recognized as expenses rather than investments due to their average payback period being less than one year.
The Games segment’s capital expenditure was EUR 0.0 million (1.1) in the second quarter. The decrease was mainly due to a decrease in the amount of external development projects. The Brand Licensing segment’s investments were EUR 0.0 million (0.8) in the second quarter. The Brand Licensing segment’s strategy is to license content production and distribution to 3rd parties and thus Rovio’s Brand Licensing segment’s direct investments have declined year-on-year to negligible.
Cash flow from financing in the second quarter of 2018 amounted to EUR -7.2 million (-12.8) and consisted mainly of dividends paid.
At the end of the second quarter, Rovio’s total interest-bearing loans amounted to EUR 2.5 million, consisting of a product development loan from Tekes (the Finnish Funding Agency for Innovation). Rovio’s cash and cash equivalents at the end of the interim period amounted to EUR 97.0 million. In addition, during the second quarter the company entered into a revolving credit facility with an undrawn balance of EUR 20.0 million.

7
Development per business segment
Games
April-June 2018 The Games segment’s revenue in the reporting period amounted to EUR 65.3 million (61.3), or 6.4%
year-on-year growth. The depreciation of the US dollar against the euro continued to impact negatively on revenues, and the year-on-year growth in comparable currencies was approximately 12%. The revenue growth of Angry Birds 2 continued very strong, with a year-on-year gross bookings growth of 44% or approximately 50% growth in comparable currencies. Rovio’s top-five games in the reporting period were Angry Birds 2, Angry Birds Friends, Angry Birds Match, Angry Birds Blast, and Angry Birds Evolution.
The Games segment’s EBITDA decreased to EUR 9.2 million (13.5) which is a decline of 31.6% year-on-year. The decrease is mainly due to increased user acquisition investments as expected. The depreciation of the US dollar against the euro reduced the Games segment’s EBITDA by approximately 11%.
The Games segment’s user acquisition investments increased to EUR 22.9 million (15.1), or 35.1% (24.6 %) of the Games segment’s revenue in the reporting period. Year-on-year, user acquisition investments increased by 52% (approximately 62% in comparable currencies). The increase is due to extension of Rovio’s user acquisition payback time range from 8-10 months to 8-12 months in the beginning of the quarter and due to improved monetization of Rovio’s top-five games, mainly Angry Birds 2, enabling higher investments, and the successful optimization of user acquisition. It is uncertain if the current level of user acquisition investments can be maintained in the third and fourth quarter of 2018 as the cost per install typically rises towards the end of the year.
The Games segment did not have any capital expenditures in the reporting period (EUR 1.1 million in Q2 / 2017).
January-June 2018 The Games segment’s revenue in the January-June 2018 period amounted to EUR 122.1 million (117.9),
or 3.5% year-on-year growth. The depreciation of the US dollar against the euro impacted negatively on revenues, and the year-on-year growth in comparable currencies was approximately 12%.
The Games segment’s adjusted EBITDA decreased to EUR 19.8 million (22.5) which is a decline of 11.8% year-on-year. The decrease is mainly due to increased user acquisition investments as expected in the previous quarter.
The Games segment’s user acquisition investments increased to EUR 37.5 million (31.5), or 30.7% (26.7) of the Games segment’s revenue in the reporting period. EUR million
4–6/ 2018
4–6/ 2017
Change, %
1–6/ 2018
1–6/ 2017
Change, %
1–12/ 2017
Revenue 65.3 61.3 6.4% 122.1 117.9 3.5% 248.0
Adjusted EBITDA 9.2 13.5 -31.9% 19.8 22.5 -11.8% 43.2
Adjusted EBITDA margin, % 14.1% 22.0% - 16.3% 19.1% - 17.4%
EBITDA 9.2 13.4 -31.6% 19.5 22.4 -12.9% 43.2
EBITDA margin, % 14.1% 21.9% - 16.0% 19.0% - 17.4%
User acquisition cost 22.9 15.1 52.0% 37.5 31.5 19.1% 69.6 User acquisition share of revenue, % 35.1% 24.6% - 30.7% 26.7% - 28.1% Capital expenditure 0.0 1.1 -100.0% 0.3 2.4 -89.0% 4.1

8
Key performance indicators of the Games segment The key performance indicators of the Games segment shown below use gross bookings in place of
gross revenue. The reconciliation of gross bookings to gross revenue is provided in the notes to the financial statements. Gross bookings represent in-app purchases and in-app advertising sales in the given calendar month, reported based on the date of purchase/sale. Gross bookings do not include revenue from custom contracts, revenue deferrals or accounting adjustments due to, for example, foreign exchange rate differences between revenue accruals and actual payments, and thus differ from the actual reported revenue. Gross bookings are used as the base for calculating certain key operational metrics (ARPDAU and MARPPU), as it gives a more accurate view of Rovio’s operating performance than revenue at a specific point in time.
In the second quarter of 2018, the Games segment continued to execute its Games as a Service strategy by introducing game updates and events aimed at improving monetization and player retention. This strategy in conjunction with the extended user acquisition payback time enabled the Games segment to grow the top-five games’ and full portfolio daily and monthly active users (DAU and MAU) from the previous quarter. Quarter-on-quarter DAU growth for the top 5 games was 10.5%, and for the whole game portfolio 0.7%.
The higher active user base and improved player to payer conversion increased the monthly unique payers (MUP) that grew quarter-on-quarter by 22.2% for top 5 games and by 14.6% for the whole portfolio. As a result, average revenue per daily active user (ARPDAU) increased by 5.5% for top-five games to EUR 15 cents from the previous quarter. The top-five games’ monthly average revenue per paying user (MARPPU) on the other hand declined by 5.4% to EUR 33.5 from previous quarter as the initial purchases made by new paying users are often smaller than those made by retained older users.
EUR million 4-6/2018 1–3/2018 10–12/2017 7–9/2017 4–6/2017 1–3/2017
Gross bookings top 5 54.8 46.5 51.8 50.6 50.6 47.9
Gross bookings total 64.8 58.6 66.1 64.3 61.9 56.3 EUR million 4-6/2018 1–3/2018 10–12/2017 7–9/2017 4–6/2017 1–3/2017
DAU top 5 4.0 3.6 4.0 4.6 4.9 5.0
DAU all 8.8 8.7 9.2 10.7 10.6 11.2
MAU top 5 22.2 18.1 20.3 24.0 25.6 25.4 MAU all 64.2 61.7 64.8 79.5 79.7 83.1
EUR thousand 4-6/2018 1–3/2018 10–12/2017 7–9/2017 4–6/2017 1–3/2017
MUP top 5 497 407 447 469 479 495
MUP all 581 507 555 571 563 550
EUR 4-6/2018 1–3/2018 10–12/2017 7–9/2017 4–6/2017 1–3/2017
ARPDAU top 5 0.15 0.14 0.14 0.12 0.11 0.11
ARPDAU all 0.08 0.08 0.08 0.07 0.06 0.06
MARPPU top 5 33.5 35.6 35.6 33.7 32.6 29.8
MARPPU all 33.0 35.0 35.2 34.1 32.4 30.0
Game-specific performance in the Games segment Games segment’s gross bookings amounted to EUR 64.8 million (61.9) in the second quarter of 2018,
which is a growth of 4.5% year-on-year and 10.6% quarter-on-quarter. The whole game portfolio was negatively impacted from the depreciation of US dollar against the euro.
Angry Birds 2, released in July 2015, was Rovio’s largest and fastest growing game also in the second quarter of 2018, achieving 44% gross bookings growth year-on-year and 38% quarter-on-quarter. The gross bookings of Angry Birds 2 were EUR 29.7 million (20.6), its highest ever, thanks to successful game updates and user acquisition.
9
Rovio’s second and third biggest games in the reporting period, Angry Birds Friends released already in 2012 and Angry Birds Match released in August 2017, grew quarter-on-quarter by 11% and 10%, respectively. The gross bookings of Angry Birds Friends and Angry Birds Match were EUR 8.0 million (8.6) and EUR 6.8 million (-).
Angry Birds Blast, Angry Birds Evolution and Battle Bay reached gross bookings of EUR 6.0 million (11.3), EUR 4.2 million (2.7), and EUR 2.3 million (4.3), respectively. The decline of Angry Birds Evolution and Battle Bay from the Q1/2018 was due to refocusing of user acquisition investments on games with the highest returns. As the competition in free-to-play mobile gaming is very tough, games need to be updated constantly to retain and grow their audiences. Rovio continues to focus on developing its key games and aims to grow them into multi-year services.
Other games, which include the less actively maintained titles of Rovio’s game portfolio, generated combined gross bookings of EUR 4.0 million (8.6), which was a decrease of 13% quarter-on-quarter decrease of 53% year-on-year.
Gross bookings, EUR million 4-6/2018 1–3/2018 10–12/2017 7–9/2017 4–6/2017 1–3/2017
AB 2 29.7 21.6 19.9 18.3 20.6 19.9
AB Friends 8.0 7.2 7.9 7.9 8.6 8.3
AB Match 6.8 6.2 7.4 2.7 - -
AB Blast 6.0 6.0 7.9 9.3 11.3 11.0 AB Evolution 4.2 5.5 8.7 10.1 2.7 -
AB Pop 3.8 4.1 4.5 5.0 5.9 6.9
Battle Bay 2.3 3.5 3.8 4.6 4.3 -
Other 4.0 4.5 6.0 6.4 8.6 10.0 Total 64.8 58.6 66.1 64.3 61.9 56.3
Brand Licensing
April-June 2018 The revenue of the Brand Licensing segment in the reporting period was according to expectations:
EUR 6.5 million (24.9) which was 73.9% lower than for the same period in 2017. The revenue consisted of EUR 4.0 million (22.4) from Content Licensing, the majority of which was income from the Angry Birds Movie, and EUR 2.4 million (2.5) from Consumer Products. The year-on-year comparability is impacted by the revenue peak of the Angry Birds Movie in the second quarter of 2017.
The Brand Licensing segment’s adjusted EBITDA was 3.6 million (20.7). EBITDA margin decreased to 56.1% of revenues (83.1) due to lower movie revenues compared to the period last year. Adjustments in the second quarter of 2017 amounted to EUR 1.9 million and were related to the reorganization of the Brand Licensing unit.
There were no significant capital expenses for the segment in the reporting period due to the strategy of licensing rights for content production and distribution of the Angry Birds Movie sequel as well as other potential content.
During the reporting period, the Brand Licensing Unit had a successful official launch of the Angry Birds Movie 2 licensing program for partners in Las Vegas Licensing Expo and has signed licensing contracts with top consumer brands such as Chupa Chups, Crocs and Pez.
In May, the indoor section of the world’s largest Angry Birds themed park opened in Doha, Qatar. The park is 17,000 square meters in size and includes a vast array of rides, entertainment experiences where fans can immerse themselves in Angry Birds lore and experiences. In June, Rovio launched a new animation mini-series in Youtube with our partner Everton Football Club.
10
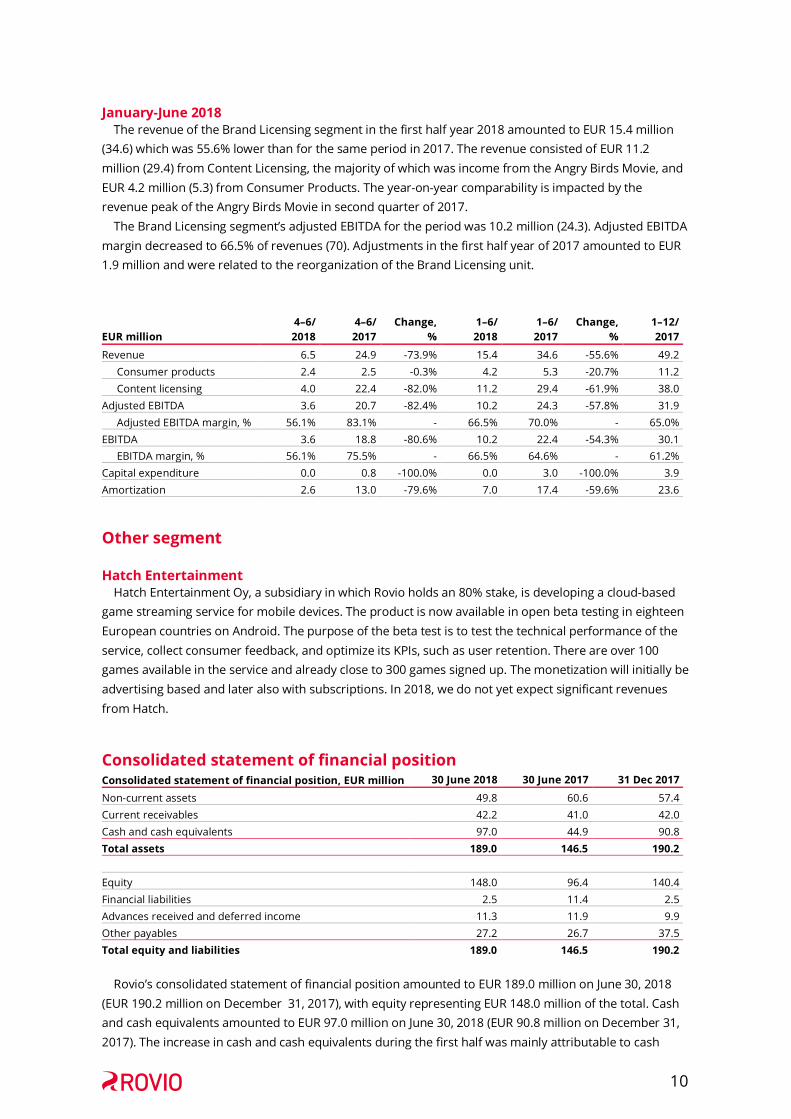
January-June 2018 The revenue of the Brand Licensing segment in the first half year 2018 amounted to EUR 15.4 million
(34.6) which was 55.6% lower than for the same period in 2017. The revenue consisted of EUR 11.2 million (29.4) from Content Licensing, the majority of which was income from the Angry Birds Movie, and EUR 4.2 million (5.3) from Consumer Products. The year-on-year comparability is impacted by the revenue peak of the Angry Birds Movie in second quarter of 2017.
The Brand Licensing segment’s adjusted EBITDA for the period was 10.2 million (24.3). Adjusted EBITDA margin decreased to 66.5% of revenues (70). Adjustments in the first half year of 2017 amounted to EUR 1.9 million and were related to the reorganization of the Brand Licensing unit.
EUR million 4–6/ 2018
4–6/ 2017
Change, %
1–6/ 2018
1–6/ 2017
Change, %
1–12/ 2017
Revenue 6.5 24.9 -73.9% 15.4 34.6 -55.6% 49.2 Consumer products 2.4 2.5 -0.3% 4.2 5.3 -20.7% 11.2 Content licensing 4.0 22.4 -82.0% 11.2 29.4 -61.9% 38.0
Adjusted EBITDA 3.6 20.7 -82.4% 10.2 24.3 -57.8% 31.9 Adjusted EBITDA margin, % 56.1% 83.1% - 66.5% 70.0% - 65.0%
EBITDA 3.6 18.8 -80.6% 10.2 22.4 -54.3% 30.1 EBITDA margin, % 56.1% 75.5% - 66.5% 64.6% - 61.2%
Capital expenditure 0.0 0.8 -100.0% 0.0 3.0 -100.0% 3.9 Amortization 2.6 13.0 -79.6% 7.0 17.4 -59.6% 23.6
Other segment
Hatch Entertainment Hatch Entertainment Oy, a subsidiary in which Rovio holds an 80% stake, is developing a cloud-based
game streaming service for mobile devices. The product is now available in open beta testing in eighteen European countries on Android. The purpose of the beta test is to test the technical performance of the service, collect consumer feedback, and optimize its KPIs, such as user retention. There are over 100 games available in the service and already close to 300 games signed up. The monetization will initially be advertising based and later also with subscriptions. In 2018, we do not yet expect significant revenues from Hatch.
Consolidated statement of financial position Consolidated statement of financial position, EUR million 30 June 2018 30 June 2017 31 Dec 2017
Non-current assets 49.8 60.6 57.4 Current receivables 42.2 41.0 42.0 Cash and cash equivalents 97.0 44.9 90.8 Total assets 189.0 146.5 190.2 Equity 148.0 96.4 140.4 Financial liabilities 2.5 11.4 2.5 Advances received and deferred income 11.3 11.9 9.9 Other payables 27.2 26.7 37.5 Total equity and liabilities 189.0 146.5 190.2
Rovio’s consolidated statement of financial position amounted to EUR 189.0 million on June 30, 2018
(EUR 190.2 million on December 31, 2017), with equity representing EUR 148.0 million of the total. Cash and cash equivalents amounted to EUR 97.0 million on June 30, 2018 (EUR 90.8 million on December 31, 2017). The increase in cash and cash equivalents during the first half was mainly attributable to cash
11
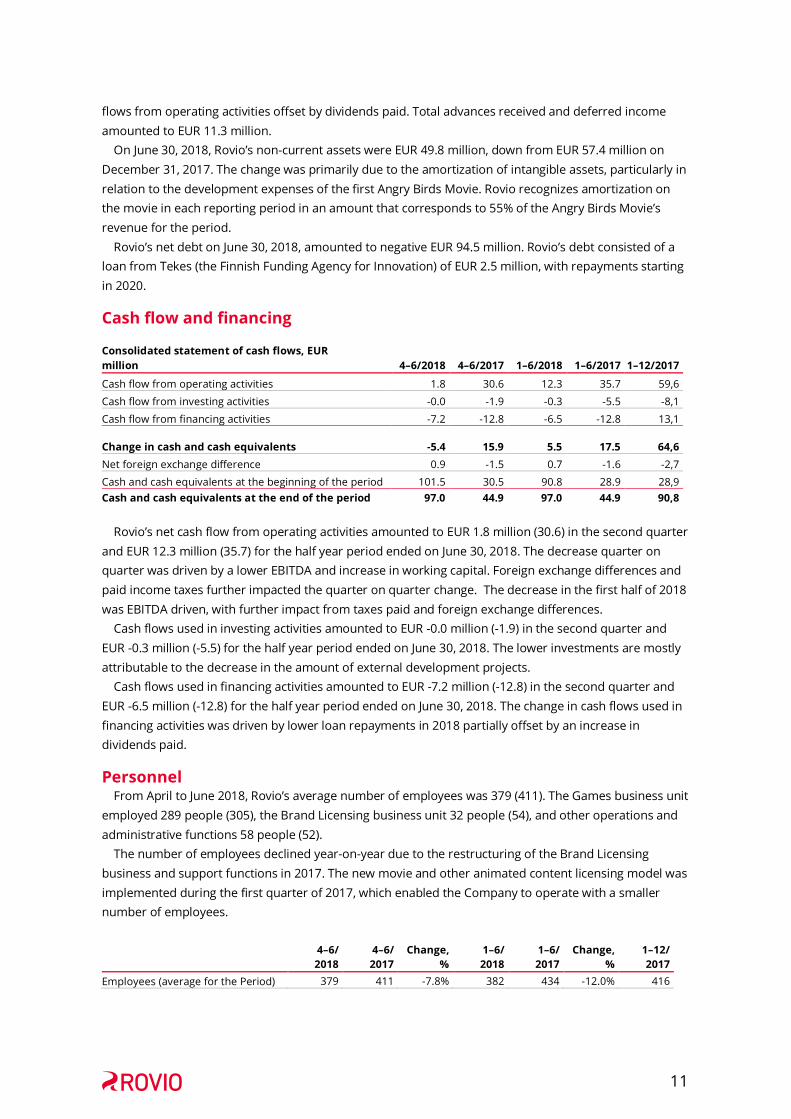
flows from operating activities offset by dividends paid. Total advances received and deferred income amounted to EUR 11.3 million.
On June 30, 2018, Rovio’s non-current assets were EUR 49.8 million, down from EUR 57.4 million on December 31, 2017. The change was primarily due to the amortization of intangible assets, particularly in relation to the development expenses of the first Angry Birds Movie. Rovio recognizes amortization on the movie in each reporting period in an amount that corresponds to 55% of the Angry Birds Movie’s revenue for the period.
Rovio’s net debt on June 30, 2018, amounted to negative EUR 94.5 million. Rovio’s debt consisted of a loan from Tekes (the Finnish Funding Agency for Innovation) of EUR 2.5 million, with repayments starting in 2020.
Cash flow and financing Consolidated statement of cash flows, EUR million
4–6/2018
4–6/2017 1–6/2018 1–6/2017
1–12/2017
Cash flow from operating activities 1.8 30.6 12.3 35.7 59,6
Cash flow from investing activities -0.0 -1.9 -0.3 -5.5 -8,1
Cash flow from financing activities -7.2 -12.8 -6.5 -12.8 13,1
Change in cash and cash equivalents -5.4 15.9 5.5 17.5 64,6
Net foreign exchange difference 0.9 -1.5 0.7 -1.6 -2,7
Cash and cash equivalents at the beginning of the period 101.5 30.5 90.8 28.9 28,9 Cash and cash equivalents at the end of the period 97.0 44.9 97.0 44.9 90,8
Rovio’s net cash flow from operating activities amounted to EUR 1.8 million (30.6) in the second quarter
and EUR 12.3 million (35.7) for the half year period ended on June 30, 2018. The decrease quarter on quarter was driven by a lower EBITDA and increase in working capital. Foreign exchange differences and paid income taxes further impacted the quarter on quarter change. The decrease in the first half of 2018 was EBITDA driven, with further impact from taxes paid and foreign exchange differences.
Cash flows used in investing activities amounted to EUR -0.0 million (-1.9) in the second quarter and EUR -0.3 million (-5.5) for the half year period ended on June 30, 2018. The lower investments are mostly attributable to the decrease in the amount of external development projects.
Cash flows used in financing activities amounted to EUR -7.2 million (-12.8) in the second quarter and EUR -6.5 million (-12.8) for the half year period ended on June 30, 2018. The change in cash flows used in financing activities was driven by lower loan repayments in 2018 partially offset by an increase in dividends paid.
Personnel From April to June 2018, Rovio’s average number of employees was 379 (411). The Games business unit
employed 289 people (305), the Brand Licensing business unit 32 people (54), and other operations and administrative functions 58 people (52).
The number of employees declined year-on-year due to the restructuring of the Brand Licensing business and support functions in 2017. The new movie and other animated content licensing model was implemented during the first quarter of 2017, which enabled the Company to operate with a smaller number of employees.
4–6/
2018 4–6/ 2017
Change, %
1–6/ 2018
1–6/ 2017
Change, %
1–12/ 2017
Employees (average for the Period) 379 411 -7.8% 382 434 -12.0% 416

12
Flagging notices Rovio received the following flagging notices during the second quarter. On April 11, 2018 Rovio received a notification from Massachusetts Mutual Life Insurance
Company. According to the notification the holding of Massachusetts Mutual Life Insurance Company and its subsidiaries MassMutual Holdings LLC and MM Asset Management LLC in the Company's shares and votes has risen above 5 per cent. These companies hold a total of 4,000,000 shares (5.04%). In addition, according to the notification OppenheimerFunds,Inc., an investment manager that independently exercises their respective voting power on behalf of the clients and investment funds whose assets they are managing, exercises the voting power attached to these shares.
On April 19, 2018 Rovio received a notification from Swedbank Robur Fonder AB. According to the notification, the holding of Swedbank Robur Ny Teknik, Swedbank Robur Småbolagsfond Norden and Swedbank Robur Nordenfond ("Robur Funds") in the Company's shares and votes has risen combined to above 10 per cent. These companies hold a total of 8,000,000 shares (10.08%).
On April 26, 2018 Rovio received a notification from Massachusetts Mutual Life Insurance Company. According to the notification, Oppenheimer Global Opportunities Fund was added to the full chain of controlled undertakings.
Shares and shareholders The total number of shares increased during the review period by a total of 15,500 as Rovio
Entertainment Corporation’s new shares were subscribed for with stock options. The entire subscription price of EUR 45,300 was recorded into the invested unrestricted equity reserve. As a result of the share subscriptions, the number of Rovio Entertainment Corporation’s shares increased to 79,401,042 shares. The shares subscribed for under the stock options were registered in the Trade Register on 28 May 2018, as of which date the new shares established shareholder rights.
On June 30, 2018, Rovio’s share capital amounted to EUR 0.7 million and the number of shares was 79,401,042. According to information provided by Euroclear, the Company’s five largest shareholders were Trema International Holdings B.V. with 40.68%, Ilmarinen Mutual Pension Insurance Company with 2.60%, Niklas Hed with 2.51%, Peter Vesterbacka with 1.83% and Elo Pension Company with 1.51%. The five largest shareholders held 49.14% of the Company’s shares. The shareholdings of the 10 largest shareholders are presented in the table below (nominee-registered holdings excluded).
Shareholder
Number of Shares
Percentage of shares and votes
Trema International Holdings B.V 32,297,528 40.68%
Ilmarinen Mutual Pension Insurance Company 2,067,500 2.60%
Hed Niklas Peter 1,996,746 2.51%
Vesterbacka Jan-Peter Edvin 1,456,229 1.83%
Elo Pension Company 1,200,000 1.51%
The State Pension Fund 1,000,000 1.26%
Sijoitusrahasto Aktia Capital 875,074 1.10%
Nordea Pro Finland Fund 804,556 1.01%
Varma Mutual Pension Insurance Company 677,471 0.85% Danske Invest Finnish Institutional Equity Fund 580,000 0.73%
Ten largest, total 42,955,104 54.10%
Other shareholders 36,445,938 45.90% Total 79,401,042 100.00%
A monthly updated table of Rovio’s shareholders is available online at
http://www.rovio.com/investors/shareholders.

13
Share-based incentive program Rovio has a long-term incentive program that consists of an option plan for all employees, including
the CEO and Rovio’s management, and a restricted share plan for selected key employees. The Board has in May resolved to update the schedule for the stock options 2018 and 2019 while
keeping the maximum total number of stock options 2017-2019 unchanged, as well as to add more gross shares to the restricted share unit plan.
The option plan provides for the issuance of up to 5,000,000 options. Each option entitles its holder to subscribe for one share. The option plan includes three lots of options that can be allocated to 2017, 2018, and 2019. Options have a vesting period of two years. The subscription price for the 2017 options is the share price in Rovio’s Initial Public Offering. The subscription price for the 2018 options is the trading volume-weighted average quotation of the shares on Nasdaq Helsinki during 2 -31. May 2018, and, for the 2019 options, the trading volume-weighted average quotation of the shares on Nasdaq Helsinki during 2 -31. May 2019. A total of 1,110,150 options were allocated under the 2017 option program as of June 30, 2018 and a total of 1,207,500 options were allocated under the 2018 option program as of June 30, 2018.
The option plan participants can execute their reward during a one-year subscription period following each vesting period through either subscribing for shares or selling options. The option plan participants generally lose the right to their reward if their employment terminates during the vesting period.
The restricted share plan is constructed as a restricted share pool from which a predetermined number of Rovio shares can be allocated to a limited number of selected key employees. The Company’s Board of Directors decides for each participant separately the length of the restricted period (1–3 years) relating to the shares allocated to the employee under the restricted share plan. The restricted share plan participants must be working at Rovio when the shares are transferred. The initial maximum number of shares that can be distributed through the restricted share plan is 1,300,000. The maximum number of shares before the board resolution was 500,000. Once the maximum number of shares has been allocated, the Board of Directors can decide on a new maximum number. A total of 559,790 rights entitling to shares had been allocated under the restricted share plan as of June 30, 2018.
Changes in Management The following changes were announced and are effective as of April 11, 2018. Ville Heijari, who has acted as Chief Marketing Officer, Games, since 2016, has been appointed Chief
Marketing Officer of Rovio Entertainment Corporation. Heijari joins the company's Leadership Team and will be responsible for marketing, communications and brand. In his new role, Heijari will report to the company's CEO Kati Levoranta. Rauno Heinonen, SVP, Communications and Investor Relations, left the company.
Mikko Setälä, who has been a member of the company's Leadership Team since 2011 and Chief Corporate Development Officer since 2015, will be responsible for investor relations. In his role, Setälä will report to CFO René Lindell.
Risks The Company’s liquidity and cash flow is strong, and the profitability outlook remains positive, which
enables the Company to continue to execute its business in accordance with its strategy. Based on the Company’s assessment, there were no material changes in the risks and uncertainties
during the review period. The most significant risks are related to the financial performance of Rovio’s top games in the market,
the continuous development of these games, and keeping up player activity. Risks in user acquisition relate to the accuracy of the profit models and the impact on the Group’s net profit. New games introduced by competitors and changes in the competitive landscape may also impact the success of

14
Rovio’s games, revenues, size of user acquisition investments, and the Group’s profit. Other significant risks relate to the demand for Angry Birds branded consumer products and other
content that may impact the revenues of the Brand Licensing business unit. The Company engages in business in several currencies, with the euro and U.S. dollar being the most
significant. Fluctuations in exchange rates, particularly between the euro and the U.S. dollar could have a material impact on the Company’s result.
More details on the risks, uncertainties, and Rovio’s risk management can be found online at Rovio.com and in the most recent published financial statements.
Outlook for 2018 (unchanged) Rovio maintains its full year outlook as reported in the 1-12/2017 financial statement bulletin. Rovio
Group revenue is expected to be EUR 260–300 million in 2018 (EUR 297 million in 2017). Rovio’s profitability as measured by earnings before interest and tax excluding items affecting comparability is expected to be 9 to 11 percent (12.1 percent in 2017).
Decisions of the Annual General Meeting and the organizing meeting of the Board of Directors
The Annual General Meeting of Rovio was held on April 16, 2018. The Annual General Meeting approved the financial statements for the financial year 2017 and discharged the members of the Board of Directors and the CEO from liability for the 2017 financial year. The Annual General Meeting decided, in accordance with the proposal of the Board of Directors, to distribute a dividend of EUR 0.09 per share. The record date of the dividend distribution was April 18, 2018 and the dividend was paid on April 25, 2018.
The Annual General Meeting decided that the Board of Directors shall comprise six (6) members. Mr. Kaj Hed, Ms. Camilla Hed-Wilson, Mr. Kim Ignatius, Mr. Mika Ihamuotila, Ms. Jenny Wolfram and Mr. Niklas Zennström were re-elected members of the Board of Directors for a term of office expiring at the end of the Annual General Meeting in 2019. Mr. Mika Ihamuotila was elected as the Chairman and Mr. Kaj Hed was elected as the Vice Chairman of the Board of Directors. The Annual General Meeting decided that the members of the Board of Directors will be paid monthly remuneration as follows: Chairman EUR 9,500; Vice Chairman EUR 7,500; other members EUR 5,000 each and EUR 2,500 as additional monthly compensation to the chairman of the Audit Committee. If the chairman of the Audit Committee is the Chairman or Vice Chairman of the Board of Directors, no additional compensation will be paid. Reasonable travel expenses of the Board members and committee members arising from Board or committee work will be compensated. Ernst & Young Oy, authorized public accountants, was re-elected as the auditor of the company.
The Annual General Meeting authorized the Board of Directors to decide on the repurchase and/or on the acceptance as pledge of the company's own shares up to a maximum of 7,938,554 shares (approximately 10 % of all the current shares in the company).
The Annual General Meeting authorized the Board of Directors to decide on the issuance of shares and the issuance of special rights entitling to shares up to a maximum of 15,877,108 shares (approximately 20 percent of all the current shares of the company).
Both authorizations will be in force until the closing of the next Annual General Meeting, however no longer than until June 30, 2019.
In the organizing meeting of the Board of Directors held after the Annual General Meeting, the Board of Directors elected from amongst its members Mr. Kim Ignatius (Chair), Mr. Mika Ihamuotila and Ms. Jenny Wolfram as members of the Audit Committee, and Mr. Kim Ignatius (Chair), Mr. Mika Ihamuotila and Ms. Jenny Wolfram as members of the Remuneration Committee.

15
Dividend distribution The Annual General Meeting decided, in accordance with the proposal of the Board of Directors, to
distribute a dividend of EUR 0.09 per share, EUR 7,144,698.78 in total. The record date of the dividend distribution was April 18, 2018 and the dividend was paid on April 25, 2018.
Events after the review period After the review period a total of 46,500 Rovio Entertainment Corporation's new shares were
subscribed for with stock options. The entire subscription price of EUR 132,525.00 was recorded into the invested unrestricted equity reserve.
As a result of the share subscriptions, the number of Rovio Entertainment Corporation's shares increased to 79,447,542 shares. The shares subscribed for under the stock options were registered in the Trade Register on 15 August 2018, as of which date the new shares established shareholder rights.
ROVIO ENTERTAINMENT CORPORATION Board of Directors
16
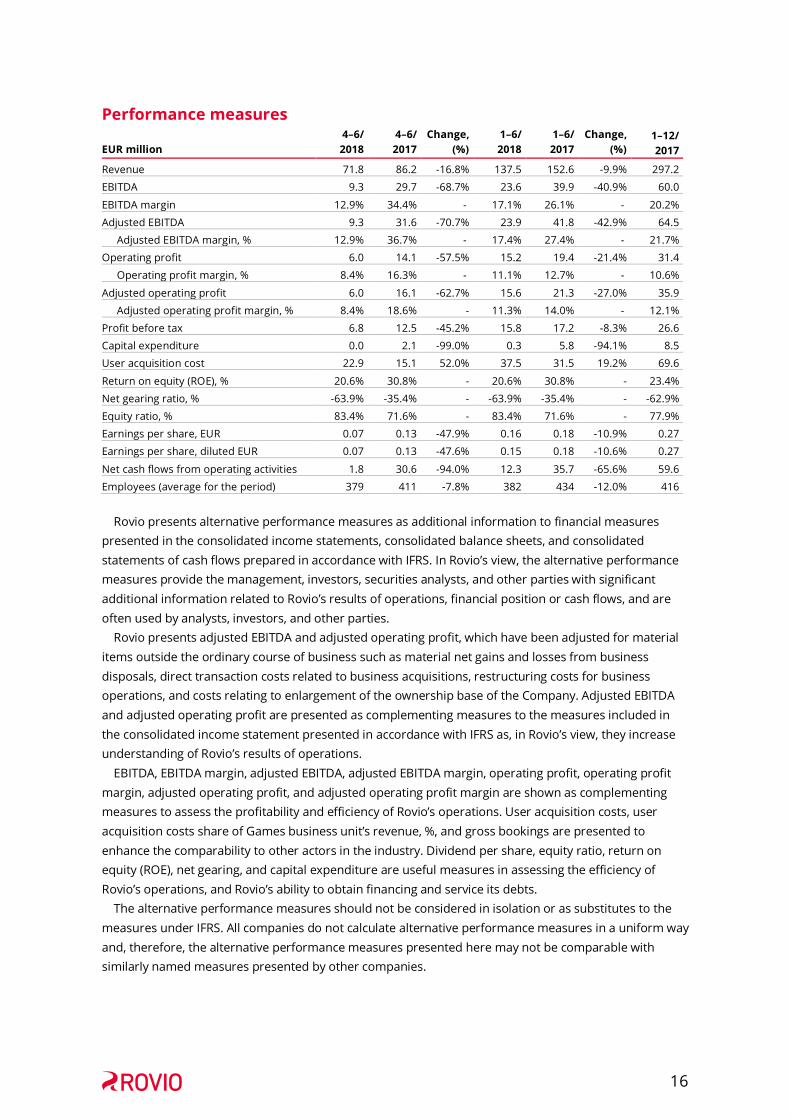
Performance measures 4–6/ 4–6/ Change, 1–6/ 1–6/ Change, 1–12/ EUR million 2018 2017 (%) 2018 2017 (%) 2017
Revenue 71.8 86.2 -16.8% 137.5 152.6 -9.9% 297.2
EBITDA 9.3 29.7 -68.7% 23.6 39.9 -40.9% 60.0
EBITDA margin 12.9% 34.4% - 17.1% 26.1% - 20.2%
Adjusted EBITDA 9.3 31.6 -70.7% 23.9 41.8 -42.9% 64.5
Adjusted EBITDA margin, % 12.9% 36.7% - 17.4% 27.4% - 21.7%
Operating profit 6.0 14.1 -57.5% 15.2 19.4 -21.4% 31.4
Operating profit margin, % 8.4% 16.3% - 11.1% 12.7% - 10.6%
Adjusted operating profit 6.0 16.1 -62.7% 15.6 21.3 -27.0% 35.9
Adjusted operating profit margin, % 8.4% 18.6% - 11.3% 14.0% - 12.1%
Profit before tax 6.8 12.5 -45.2% 15.8 17.2 -8.3% 26.6
Capital expenditure 0.0 2.1 -99.0% 0.3 5.8 -94.1% 8.5
User acquisition cost 22.9 15.1 52.0% 37.5 31.5 19.2% 69.6
Return on equity (ROE), % 20.6% 30.8% - 20.6% 30.8% - 23.4%
Net gearing ratio, % -63.9% -35.4% - -63.9% -35.4% - -62.9%
Equity ratio, % 83.4% 71.6% - 83.4% 71.6% - 77.9%
Earnings per share, EUR 0.07 0.13 -47.9% 0.16 0.18 -10.9% 0.27
Earnings per share, diluted EUR 0.07 0.13 -47.6% 0.15 0.18 -10.6% 0.27
Net cash flows from operating activities 1.8 30.6 -94.0% 12.3 35.7 -65.6% 59.6
Employees (average for the period) 379 411 -7.8% 382 434 -12.0% 416 Rovio presents alternative performance measures as additional information to financial measures
presented in the consolidated income statements, consolidated balance sheets, and consolidated statements of cash flows prepared in accordance with IFRS. In Rovio’s view, the alternative performance measures provide the management, investors, securities analysts, and other parties with significant additional information related to Rovio’s results of operations, financial position or cash flows, and are often used by analysts, investors, and other parties.
Rovio presents adjusted EBITDA and adjusted operating profit, which have been adjusted for material items outside the ordinary course of business such as material net gains and losses from business disposals, direct transaction costs related to business acquisitions, restructuring costs for business operations, and costs relating to enlargement of the ownership base of the Company. Adjusted EBITDA and adjusted operating profit are presented as complementing measures to the measures included in the consolidated income statement presented in accordance with IFRS as, in Rovio’s view, they increase understanding of Rovio’s results of operations.
EBITDA, EBITDA margin, adjusted EBITDA, adjusted EBITDA margin, operating profit, operating profit margin, adjusted operating profit, and adjusted operating profit margin are shown as complementing measures to assess the profitability and efficiency of Rovio’s operations. User acquisition costs, user acquisition costs share of Games business unit’s revenue, %, and gross bookings are presented to enhance the comparability to other actors in the industry. Dividend per share, equity ratio, return on equity (ROE), net gearing, and capital expenditure are useful measures in assessing the efficiency of Rovio’s operations, and Rovio’s ability to obtain financing and service its debts.
The alternative performance measures should not be considered in isolation or as substitutes to the measures under IFRS. All companies do not calculate alternative performance measures in a uniform way and, therefore, the alternative performance measures presented here may not be comparable with similarly named measures presented by other companies.
17
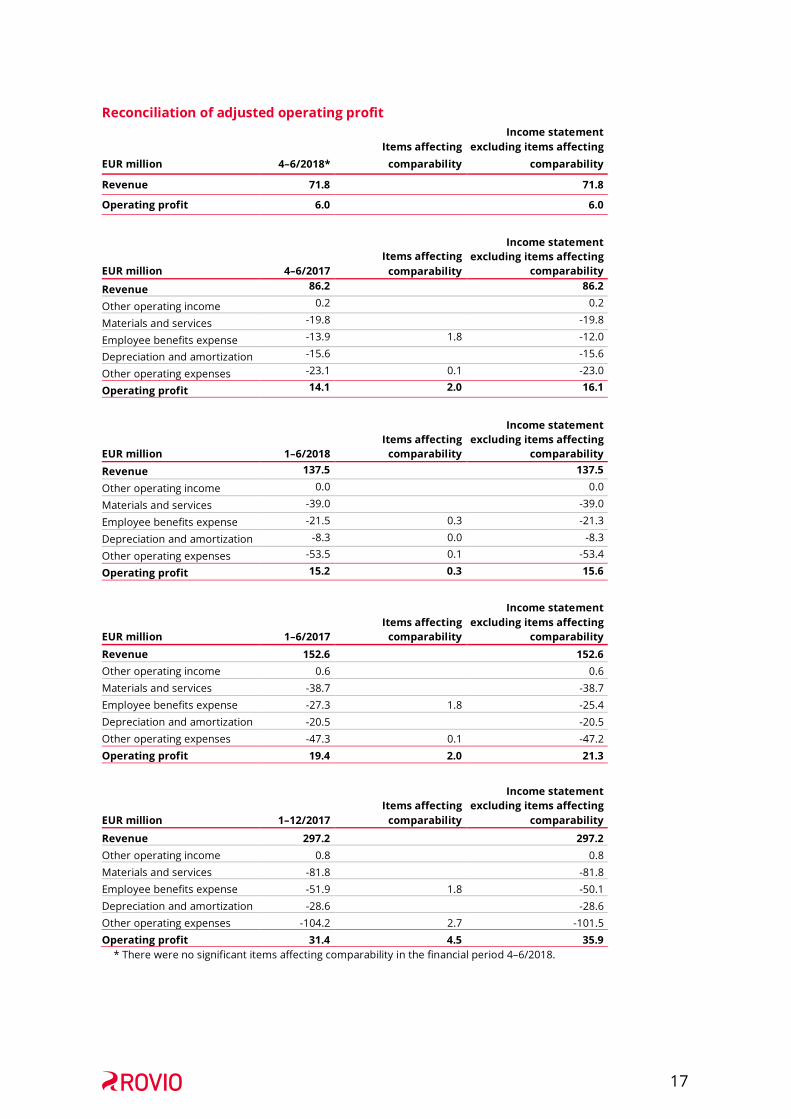
Reconciliation of adjusted operating profit
EUR million 4–6/2018*
Items affecting
comparability
Income statement excluding items affecting
comparability
Revenue 71.8 71.8 Operating profit 6.0 6.0
EUR million 4–6/2017
Items affecting comparability
Income statement excluding items affecting
comparability
Revenue 86.2 86.2
Other operating income 0.2 0.2
Materials and services -19.8 -19.8
Employee benefits expense -13.9 1.8 -12.0
Depreciation and amortization -15.6 -15.6
Other operating expenses -23.1 0.1 -23.0
Operating profit 14.1 2.0 16.1
EUR million 1–6/2018
Items affecting
comparability
Income statement excluding items affecting
comparability
Revenue 137.5 137.5
Other operating income 0.0 0.0
Materials and services -39.0 -39.0
Employee benefits expense -21.5 0.3 -21.3
Depreciation and amortization -8.3 0.0 -8.3
Other operating expenses -53.5 0.1 -53.4
Operating profit 15.2 0.3 15.6
EUR million 1–6/2017
Items affecting
comparability
Income statement excluding items affecting
comparability
Revenue 152.6 152.6 Other operating income 0.6 0.6 Materials and services -38.7 -38.7 Employee benefits expense -27.3 1.8 -25.4 Depreciation and amortization -20.5 -20.5 Other operating expenses -47.3 0.1 -47.2 Operating profit 19.4 2.0 21.3
EUR million 1–12/2017
Items affecting
comparability
Income statement excluding items affecting
comparability
Revenue 297.2 297.2 Other operating income 0.8 0.8 Materials and services -81.8 -81.8 Employee benefits expense -51.9 1.8 -50.1 Depreciation and amortization -28.6 -28.6 Other operating expenses -104.2 2.7 -101.5 Operating profit 31.4 4.5 35.9
* There were no significant items affecting comparability in the financial period 4–6/2018.

18
Reconciliation of adjusted operating profit EUR million 4–6/2018* 4–6/2017 1–6/2018 1–6/2017 1–12/2017 Operating profit 6.0 14.1 15.2 19.4 31.4
Restructuring costs arising from employee benefits expenses 1.8 0.3 1.8
1.8
Restructuring costs in Other operating expenses 0.1 0.1 0.1
0.1
Restructuring costs in Depreciation and amortization 0.0 Listing-related expenses 2.5 Adjusted operating profit 6.0 16.1 15.6 21.3 35.9
* There were no significant items affecting comparability in the financial period 4–6/2018.
Reconciliation of EBITDA and Adjusted EBITDA EUR million 4–6/2018* 4–6/2017 1–6/2018 1–6/2017 1–12/2017 Operating profit 6.0 14.1 15.2 19.4 31.4 Depreciation and amortization 3.3 15.6 8.3 20.5 28.6
EBITDA 9.3 29.7 23.6 39.9 60.0
Restructuring costs arising from employee benefits expenses 1.8 0.3 1.8
1.8
Restructuring costs in Other operating expenses 0.1 0.1 0.1
0.1
Restructuring costs in Depreciation and amortization 0.0 Listing-related expenses 2.5 Adjusted EBITDA 9.3 31.6 23.9 41.8 64.5
* There were no significant items affecting comparability in the financial period 4–6/2018
Reconciliation of equity ratio, %, return on equity, %, net gearing ratio, %, and net debt EUR million 4–6/2018 4–6/2017 1–6/2018 1–6/2017 1–12/2017
Equity ratio, % 83.4% 71.6% 83.4% 71.6% 77.9% Equity 148.0 96.4 148.0 96.4 140.4
Advances received 7.5 9.8 7.5 9.8 8.3 Deferred revenue 3.9 2.1 3.9 2.1 1.6
Total assets 189.0 146.5 189.0 146.5 190.2
Return on equity, % 20.6% 30.8% 20.6% 30.8% 23.4% Profit/loss before tax 25.2 27.0 25.2 27.0 26.6 Shareholder's equity beginning of period 96.4 78.6 96.4 78.6 86.8 Shareholder's equity end of period 148.0 96.4 148.0 96.4 140.4
Net gearing ratio, % -63.9% -35.4% -63.9% -35.4% -62.9% Total interest bearing debt 2.5 10.8 2.5 10.8 2.5
Cash and short-term deposits 97.0 44.9 97.0 44.9 90.8
Equity 148.0 96.4 148.0 96.4 140.4 Non-current interest-bearing loans and borrowings 2.5 2.5 2.5 2.5
2.5
Current interest-bearing loans and borrowings 0.0 8.3 0.0 8.3
0.0
Cash and short-term deposits 97.0 44.9 97.0 44.9 90.8 Net debt -94.5 -34.1 -94.5 -34.1 -88.3

19
Gross bookings The following table sets out reconciliation of gross bookings used in key operational metrics and
reported revenue:
Reconciliation of gross bookings to revenue EUR million 4–6/2018 4–6/2017 1–6/2018 1–6/2017 1–12/2017
Gross bookings 64.8 61.9 123.4 118.2 248.7 Change in deferred revenue -0.4 -0.3 -2.1 0.7 1.0
Custom contracts 0.4 0.6 0.8 0.6 1.4
Other adjustments 0.5 -0.8 0.1 -1.5 -3.1 Revenue 65.3 61.3 122.1 117.9 248.0
Custom contracts are distribution contracts that are signed with partners who pre-download Rovio’s
games onto their own devices or distribute Rovio’s games through their proprietary distribution platforms. Custom contracts usually contain a minimum guarantee and revenue share to Rovio. Rovio recognizes corresponding minimum guarantee revenue over the contract period. Custom contracts do not include the application stores operated by Apple and Google.
Calculation principles of alternative performance measures EBITDA (Earnings before interest, taxes, depreciation and amortization), which is operating profit
before depreciations and amortizations. EBITDA margin, %, which is defined as EBITDA as a percentage of revenue. Items affecting comparability, which are defined as material items outside the ordinary course of
business such as material net gains and losses from business disposals, direct transaction costs related to business acquisitions, restructuring costs for business operations, and costs relating to enlargement of the ownership base of the company.
Adjusted EBITDA, which is defined as EBITDA excluding items affecting comparability. Adjusted EBITDA margin, %, which is defined as comparable EBITDA as a percentage of revenue. Operating profit margin, %, which is operating profit as a percentage of revenue. Adjusted operating profit, which is defined as operating profit excluding items affecting
comparability. Adjusted operating profit margin, %, which is defined as adjusted operating profit as a percentage of
revenue. User acquisition costs, which relate to acquisition of new players in the Company’s games through
performance marketing campaigns. User acquisition costs share of Games revenue, %, which is user acquisition costs as a percentage of
Games revenue. Dividend per share, which is total dividend divided by number of shares, adjusted for share issues, at
the end of the financial period less own shares. Earnings per share, which is the net result for the review period divided by the average number of
shares in the review period, less treasury shares. Equity ratio, %, which is calculated by dividing (i) Total equity by (ii) Total equity and liabilities less
advances received and deferred revenue. Return on equity (ROE), which is calculated by dividing profit before tax, quarterly reports adjusted to
correspond with 12 months, by the average of total equity in the opening and closing balance sheet. Capital expenditure, which is cash flow of purchase of tangible and intangible assets. Net debt, which is calculated by subtracting cash and short-term deposits from current and non-
current interest-bearing loans and borrowings. Net gearing %, which is calculated by dividing net debt by the total equity.

20
Gross bookings represent in-app purchases and in-app advertising sales in the given calendar month, reported on the basis of the date of purchase/sale. Gross bookings do not include revenue from custom contracts, revenue deferrals or accounting adjustments due to e.g., foreign exchange rate differences between revenue accruals and actual payments, and thus differ from the actual reported revenue. The reconciliation of gross bookings to revenue is presented under “Reconciliation of Certain Alternative Performance Measures”. Gross bookings are used as the base for calculating certain key operational metrics (ARPDAU and MARPPU) as it gives a more accurate view of Rovio’s operating performance than revenue at a specific point in time.
DAU (Daily Active Users), which is defined as the number of devices that played one of our games during a particular day. Under this metric, a device that plays two different games on the same day is counted as two DAUs. We primarily use information provided by Rovio’s own technology but we also use third-party tracking solutions for historical data and in cases when a game does not contain Rovio’s tracking tools. Average DAUs for a particular period is the average of the DAUs for each day during that period.
MAU (Monthly Active Users), which is defined as the number of devices that played one of our games in the during a particular calendar month. Under this metric, a device that plays two different games in the same month is counted as two MAUs. We primarily use information provided by Rovio’s own technology but we also use third party tracking solutions for historical data and in cases when a game does not contain Rovio’s tracking tools.
MUP (Monthly Unique Payers), which is defined as the number of devices that made a payment at least once during the calendar month through a payment method for which we can quantify the number of individuals, including payers from our mobile games. MUPs does not include individuals who use certain payment methods for which we cannot quantify the number of unique payers. We only use information provided by Rovio’s own payment verification technology. Due to this history data is only available from September 2014 onward.
ARPDAU (Average Revenue Per Daily Active User), which is defined as Sum of quarterly Gross Bookings divided by number of days in the quarter divided by average DAU for the quarter.
MARPPU (Monthly Average Revenue Per Paying User), which is defined as Monthly Gross IAP Bookings divided by MUP from verified purchases. MARPPU does not include revenue from custom contracts, revenue deferrals or accounting adjustments such as foreign exchange rate differences between revenue accruals and actual payments.

21
Interim report January 1–June 30, 2018 – Tables
The figures in the interim report are unaudited
Statement of consolidated profit or loss and other comprehensive income
EUR million
4–6/ 2018
4–6/ 2017
1–6/ 2018
1–6/ 2017
1–12/ 2017
Revenue 71.8 86.2 137.5 152.6 297.2 Other operating income 0.0 0.2 0.0 0.6 0.8 Materials and services 20.5 19.8 39.0 38.7 81.8 Employee benefits expense 10.4 13.9 21.5 27.3 51.9 Depreciation and amortization 3.3 15.6 8.3 20.5 28.6 Other operating expenses 31.6 23.1 53.5 47.3 104.2
Operating profit 6.0 14.1 15.2 19.4 31.4 Finance income and expenses 0.8 -1.6 0.6 -2.1 -4.7 Share of profit of associates 0.0 0.0 0.0 0.0 -0.1 Profit (loss) before tax 6.8 12.5 15.8 17.2 26.6
Income tax expense 1.6 2.8 3.4 3.9 6.0 Profit for the period 5.2 9.7 12.4 13.3 20.6
Attributable to: Non-controlling interests 0.0 0.0 0.0 0.0 0.0 Equity holders of the parent company 5.2 9.7 12.4 13.3 20.6 Other comprehensive income/expense
Other comprehensive income to be reclassified to profit or loss in subsequent periods (net of tax):
Translation differences 0.1 -0.1 -0.0 -0.2 -0.4 Total comprehensive income for the period, net of tax 5.3 9.6 12.4 13.1 20.2
Attributable to: Non-controlling interests 0.0 0.0 0.0 0.0 0.0 Equity holders of the parent company 5.3 9.6 12.4 13.1 20.2
Earnings per share for net result attributable to owners of the parent:
Earnings per share, EUR 0.07 0.13 0.16 0.18 0.27 Earnings per share, diluted EUR 0.07 0.13 0.15 0.18 0.27

22
Consolidated statement of financial position EUR million 30 June 2018 30 June 2017 31 Dec 2017 ASSETS
Non-current assets 49.8 60.6 57.4 Property, plant and equipment 0.5 0.5 0.5 Intangible assets 45.2 58.9 53.1 Investment in associates and joint ventures 0.0 0.1 0.0 Non-current receivables 0.8 0.8 0.8 Deferred tax assets 3.3 0.3 3.0 Current assets 139.1 85.9 132.8 Trade receivables 30.7 30.5 29.1 Prepayments and accrued income 9.9 9.6 10.6 Other current financial assets 1.5 0.9 2.3 Cash and short-term deposits 97.0 44.9 90.8
Total assets 189.0 146.5 190.2
EQUITY AND LIABILITIES Equity
Issued capital 0.7 0.7 0.7 Reserves 36.6 0.8 35.8 Translation differences -0.6 -0.3 -0.5 Retained earnings 98.9 81.9 83.7 Profit for the period 12.4 13.3 20.6
Equity holders of the parent company 148.0 96.4 140.4 Non-controlling interests 0.0 0.0 0.0
Total equity 148.0 96.4 140.4
Liabilities
Non-current liabilities 2.7 2.8 2.7 Interest-bearing loans and borrowings 2.5 2.5 2.5 Other non-current financial liabilities 0.1 0.2 0.1 Deferred tax liabilities 0.1 0.1 0.1 Current liabilities 38.2 47.3 47.1 Trade and other payables 11.0 9.3 8.9 Interest-bearing loans and borrowings 0.0 8.3 0.0 Other current financial liabilities 0.1 0.5 1.9 Advances received 7.5 9.8 8.3 Deferred revenue 3.9 2.1 1.6 Income tax payable 0.1 1.2 4.4 Provisions 0.5 0.7 0.8 Accrued liabilities 15.1 15.5 21.2 Total liabilities 40.9 50.0 49.8 Total equity and liabilities 189.0 146.5 190.2

23
Consolidated statement of changes in equity
Attributable to the equity holders of the parent on June 30, 2017
EUR million
Issued capital
Unrestricted
equity reserve
Retained earnings
Foreign currency
translation reserve
Total
Non-
controlling interests
Total
equity
January 1, 2017 0.7 0.8 85.5 -0.1 86.9 0.0 86.8 Profit for the period 13.3 13.3 13.4 Issue of share capital 0.0 0.0 0.0 Other comprehensive income -0.2 -0.2 -0.2 Share-based payments 1.2 1.2 1.2 Cash dividends -4.5 -4.5 -4.5 Foreign currency translations -0.3 -0.3 -0.3 June 30, 2017 0.7 0.8 95.3 -0.3 96.4 0.0 96.4
Attributable to the equity holders of the parent on June 30, 2018
EUR million
Issued capital
Unrestricted
equity reserve
Retained earnings
Foreign currency
translation reserve
Total
Non-
controlling interests
Total
equity
December 31, 2017 0.7 35.8 104.3 -0.5 140.4 0.0 140.4 Adjustments to opening balance
IFRS 2 amendment 0.2 0.2 0.2
Balance at Jan 1, 2018
0.7 35.8 104.6 -0.5 140.5 0.0 140.6
Profit for the period 12.4 12.4 12.4 Option subscriptions 0.7 0.7 0.7 Other comprehensive income -0.0 -0.0 -0.0
Share-based payments 1.5 1.5 1.5 Cash dividends -7.1 -7.1 -7.1 June 30, 2018 0.7 36.6 111.3 -0.6 148.0 0.0 148.0

24
Consolidated statement of cash flows
EUR million 4–6/ 2018
4–6/ 2017
1–6/ 2018
1–6/ 2017
1–12/ 2017
Operating activities
Profit (loss) before tax 6.8 12.5 15.8 17.2 26.6 Adjustments:
Depreciation and amortization on tangible and intangible assets 3.3 15.6 8.3 20.5
28.6 Net foreign exchange differences -0.9 1.2 -0.8 1.3 2.7 Gain on disposal of property, plant and equipment -0.0 -0.2 -0.0 -0.3 -0.3 Finance costs 0.1 0.6 0.2 1.1 2.0 Share of profit of an associate and a joint venture 0.0 0.0 0.0 0.0 0.1 Other non-cash items 0.8 0.6 1.5 1.0 3.0 Change in working capital:
Change in trade and other receivables and prepayments -2.2 3.3 0.8 2.7 0.3 Change in trade and other payables -4.7 -2.4 -4.5 -6.9 -1.1 Interest received 0.1 0.0 0.2 0.0 0.0 Interest paid -0.2 -0.3 -0.4 -0.7 -1.3 Income tax paid (received) -1.3 -0.1 -8.8 -0.1 -1.0
Net cash flows from operating activities 1.8 30.6 12.3 35.7 59.6
Investing activities Purchase of tangible and intangible assets* -0.0 -2.1 -0.3 -5.8 -8.5 Proceeds from sales of tangible and intangible assets 0.0 0.2 0.0 0.3 0.3
Net cash flows used in investing activities -0.0 -1.9 -0.3 -5.5 -8.1
Financing activities Acquisition of non-controlling interests 0.0 0.0 0.0 0.0 0.0 Finance lease repayments -0.1 0.0 -0.1 0.0 -0.1 Proceeds from and repayments of borrowings 0.0 -8.3 0.0 -8.3 -16.7 Share subscriptions based on option rights 0.0 0.0 0.7 0.0 5.7 Proceeds of share issue 0.0 0.0 0.0 0.0 30.0 Share issue transaction costs 0.0 0.0 0.0 0.0 -1.3 Dividends paid to equity holders of the parent -7.1 -4.4 -7.1 -4.4 -4.5 Net cash flows from/(used in) financing activities -7.2 -12.8 -6.5 -12.8 13.1
Change in cash and cash equivalents -5.4 15.9 5.5 17.5 64.6 Net foreign exchange difference 0.9 -1.5 0.7 -1.6 -2.7 Cash and cash equivalents at beginning of period 101.5 30.5 90.8 28.9 28.9 Cash and cash equivalents at the end of the period 97.0 44.9 97.0 44.9 90.8

25
Notes
1. Key accounting principles Rovio’s consolidated financial statements are prepared in accordance with the International Financial
Reporting Standards (IFRS) adopted by the EU. The Half Year Financial Report has been prepared in accordance with IAS 34, Interim Financial Reporting. The accounting principles and methods used are essentially the same as those applied in the consolidated financial statements for the year 2017.
The company has adopted the IFRS 2 – Classification and Measurement of Share-based Payment Transactions – Amendments to IFRS 2 during the first quarter of 2018. As a result of the amendment, the share-based payments that are settled net in shares after withholding taxes are accounted for in full as equity-settled arrangements despite the fact that Rovio pays in cash the taxes related to the rewards on behalf of the participants. Amendments to IFRS 2 regarding the classification and measurement of share-based payment transactions were adopted prospectively and resulted in an increase of EUR 0.2 million in Rovio’s equity in the opening balance of 2018.
The figures in the consolidated interim financial statements have been rounded and consequently the sum of individual figures may deviate from the sum presented. Key figures have been calculated using exact figures.
This interim report does not include all the information or disclosures as presented in the consolidated financial statements of December 31, 2017.
The figures in this report are unaudited.
2. Notes to the statement of profit or loss 2.1 Segment disclosures
Rovio adopted IFRS 8 in 2017 and defined its operating segments as Games, Brand Licensing (BLU) and Other. Rovio’s business was previously divided into three business lines: Games, Licensing, and Merchandise and Media.
Rovio defines the Group’s Board of Directors as its chief operating decision maker (CODM). The CODM follows Rovio’s performance on the segment level, which is presented in section 2.2 Segment operating performance. EBITDA is the primary performance measure that CODM follows. There are no revenues between the operating segments of Rovio Group.
The segment assets and liabilities except for non-current assets are not reported and reviewed by the chief operating decision maker and have not been included in the table below.
Rovio did not during the interim period have customers that would require disclosure (i.e. 10% or more of revenues from transactions with a single customer).
2.2 Segment operating performance
The allocations between segments consist of shared functions employee benefits expense as well as general and administrative expenses that are recognized centrally and allocated to the reportable segments as a separate line item in management reporting.

26
Segment profit and loss 4–6/2018
EUR million
Games
Brand Licensing
Other
Allocation
Total IFRS segments
Revenue 65.3 6.5 0.0 71.8 Other operating income 0.0 0.0 0.0 0.0 Materials and services 19.9 0.6 0.0 20.5 Employee benefits expense 7.2 0.9 1.6 0.7 10.4 User acquisition 22.9 0.0 0.0 22.9 Other operating expenses 4.8 1.0 1.4 1.5 8.6 Allocations 1.3 0.3 0.6 -2.2 0.0 EBITDA 9.2 3.6 -3.6 0.0 9.3 Depreciation and amortization 0.5 2.6 0.1 3.3 Operating profit 8.7 1.0 -3.7 6.0
EBITDA 9.2 3.6 -3.6 9.3 Adjustments 0.0 0.0 0.0 0.0 Adjusted EBITDA 9.2 3.6 -3.6 9.3
Operating profit 8.7 1.0 -3.7 6.0 Adjustments 0.0 0.0 0.0 0.0 Adjusted operating profit 8.7 1.0 -3.7 6.0
Segment Capital expenditure 4–6/2018
EUR million
Games
Brand Licensing
Other
Total IFRS segments
Capital expenditure 0.0 0.0 0.0 0.0
Segment assets June 30, 2018
EUR million
Games
Brand Licensing
Other
Total IFRS segments
Non-current assets 8.0 36.2 5.6 49.8

27
Segment profit and loss 4–6/2017
EUR million
Games
Brand Licensing
Other
Allocation
Total IFRS segments
Revenue 61.3 24.9 0.0 86.2 Other operating income 0.0 0.2 0.0 0.2 Materials and services 18.7 1.2 0.0 19.8 Employee benefits expense 9.0 2.8 1.3 0.8 13.9 User acquisition 15.1 0.0 0.0 15.1 Other operating expenses 3.9 1.8 1.0 1.4 8.0 Allocations 1.3 0.6 0.3 -2.2 0.0 EBITDA 13.4 18.8 -2.6 0.0 29.7 Depreciation and amortization 2.5 13.0 0.0 15.6 Operating profit 10.9 5.8 -2.6 14.1
EBITDA 13.4 18.8 -2.6 29.7 Adjustments 0.1 1.9 0.0 2.0 Adjusted EBITDA 13.5 20.7 -2.6 31.6
Operating profit 10.9 5.8 -2.6 14.1 Adjustments 0.1 1.9 0.0 2.0 Adjusted operating profit 11.0 7.7 -2.6 16.1
Segment Capital expenditure 4–6/2017
EUR million
Games
Brand Licensing
Other
Total IFRS segments
Capital expenditure 1.1 0.8 0.1 2.1
Segment assets June 30, 2017
EUR million
Games
Brand Licensing
Other
Total IFRS segments
Non-current assets 8.6 49.3 2.7 60.6

28
Segment profit and loss 1–6/2018
EUR million
Games
Brand Licensing
Other
Allocation
Total IFRS segments
Revenue 122.1 15.4 0.0 137.5 Other operating income 0.0 0.0 0.0 0.0 Materials and services 38.0 1.0 0.0 39.0 Employee benefits expense 15.3 1.9 3.0 1.4 21.5 User acquisition 37.5 0.0 0.0 37.5 Other operating expenses 9.2 1.6 2.3 2.8 15.9 Allocations 2.6 0.6 1.0 -4.2 0.0 EBITDA 19.5 10.2 -6.2 0.0 23.6 Depreciation and amortization 1.1 7.0 0.2 8.3 Operating profit 18.4 3.2 -6.4 15.2
EBITDA 19.5 10.2 -6.2 23.6 Adjustments 0.3 0.0 0.0 0.3 Adjusted EBITDA 19.8 10.2 -6.2 23.9
Operating profit 18.4 3.2 -6.4 15.2 Adjustments 0.3 0.0 0.0 0.3 Adjusted operating profit 18.8 3.2 -6.4 15.6
Segment Capital expenditure 1–6/2018
EUR million
Games
Brand Licensing
Other
Total IFRS segments
Capital expenditure 0.3 0.0 0.1 0.3
Segment assets June 30, 2018
EUR million
Games
Brand Licensing
Other
Total IFRS segments
Non-current assets 8.0 36.2 5.6 49.8

29
Segment profit and loss 1–6/2017
EUR million
Games
Brand Licensing
Other
Allocation
Total IFRS segments
Revenue 117.9 34.6 0.0 152.6 Other operating income 0.0 0.3 0.3 0.6 Materials and services 36.6 2.0 0.0 38.7 Employee benefits expense 17.2 5.9 2.7 1.5 27.3 User acquisition 31.5 0.0 0.0 31.5 Other operating expenses 7.6 3.5 1.9 2.8 15.8 Allocations 2.6 1.2 0.6 -4.3 0.0 EBITDA 22.4 22.4 -4.9 0.0 39.9 Depreciation and amortization 3.0 17.4 0.1 20.5 Operating profit 19.5 4.9 -5.0 19.4
EBITDA 22.4 22.4 -4.9 39.9 Adjustments 0.1 1.9 0.0 2.0 Adjusted EBITDA 22.5 24.3 -4.9 41.8
Operating profit 19.5 4.9 -5.0 19.4 Adjustments 0.1 1.9 0.0 2.0 Adjusted operating profit 19.5 6.8 -5.0 21.3
Segment Capital expenditure 1–6/2017
EUR million
Games
Brand Licensing
Other
Total IFRS segments
Capital expenditure 2.4 3.0 0.4 5.8
Segment assets June 30, 2017
EUR million
Games
Brand Licensing
Other
Total IFRS segments
Non-current assets 8.6 49.3 2.7 60.6

30
Segment profit and loss 1–12/2017
EUR million
Games
Brand Licensing
Other
Allocation
Total IFRS segments
Revenue 248.0 49.2 0.0 297.2 Other operating income 0.1 0.3 0.3 0.8
Materials and services 78.4 3.4 0.0 81.8 Employee benefits expense 34.9 8.3 5.8 3.0 51.9
User acquisition 69.6 0.0 0.0 69.6
Other operating expenses 16.9 5.8 6.5 5.5 34.6
Allocations 5.2 2.0 1.3 -8.4 0.0
EBITDA 43.2 30.1 -13.2 0.0 60.0 Depreciation and amortization 4.7 23.6 0.3 28.6
Operating profit 38.4 6.4 -13.5
31.4
EBITDA 43.2 30.1 -13.2 60.0 Adjustments 0.1 1.9 2.6 4.5
Adjusted EBITDA 43.2 31.9 -10.7
64.5
Operating profit 38.4 6.4 -13.5 31.4 Adjustments 0.1 1.9 2.6 4.5
Adjusted operating profit 38.5 8.3 -11.0
35.9
Segment Capital expenditure 1–12/2017
EUR million
Games
Brand Licensing
Other
Total IFRS segments
Capital expenditure 4.1 3.9 0.4 8.5
Segment assets Dec 31, 2017
EUR million
Games
Brand Licensing
Other
Total IFRS segments
Non-current assets 8.7 43.3 5.4 57.4
2.3 Geographical distribution of revenue
The Group’s business is very international. North America, and the United States in particular, is Rovio’s largest market. The geographical distribution of revenue per segment is presented below.
For in-app purchases and advertising revenue, the Games segment’s revenue has been allocated to the geographical markets based on gross bookings, which can be monitored on a country-specific basis. Revenue from custom contracts is presented based on the customer’s home country. Revenue deferrals and other adjustment items have been allocated to the geographical markets in proportion to gross bookings, as they are estimated to largely follow the same structure.
The licensing revenue of the Brand Licensing segment has been allocated to the geographical markets based on reported royalties and, for terminating contracts, according to the partner’s home country. Revenue from content sales (movie, short form animations) has been allocated to the geographical markets based on the home country of the distribution partner or contractual partner. The advertising revenue allocated to the Brand Licensing segment has been allocated to the geographical markets according to the same principle as in the Games segment.

31
EUR Million
Games
4–6/2018
Brand Licensing
Total
Games
4–6/2017
Brand Licensing
Total NAM 39.9 3.9 43.7 39.5 22.2 61.6 LATAM 0.9 0.4 1.4 0.8 0.3 1.1 EMEA 16.6 1.2 17.8 15.0 1.5 16.5 APAC 7.9 1.1 8.9 6.1 0.9 6.9 Total 65.3 6.5 71.8 61.3 24.9 86.2
EUR Million
Games
1–6/2018
Brand Licensing
Total
Games
1–6/2017
Brand Licensing
Total NAM 75.6 10.8 86.4 78.1 29.1 107.2 LATAM 1.8 0.6 2.4 1.5 0.7 2.2 EMEA 31.9 2.3 34.1 28.0 3.1 31.1 APAC 12.9 1.6 14.5 10.2 1.8 12.0 Total 122.1 15.4 137.5 117.9 34.6 152.6
EUR Million
Games
1–12/2017
Brand Licensing Total
NAM 158.0 38.2 196.2 LATAM 3.7 2.1 5.8 EMEA 64.0 5.9 69.9 APAC 22.3 2.9 25.2 Total 248.0 49.2 297.2
2.4 Disaggregation of revenue from contracts with Customers according to IFRS15 EUR million
Segment and revenue stream Timing of revenue recognition
4–6/ 2018
4–6/ 2017
1–6/ 2018
1–6/ 2017
1–12/ 2017
Games In-application purchases
At a point in time and over time 57.4 53.8 108.5 103.5 219.7
Subscription payments Over time 0.0 0.0 0.0 0.0 0.0 Custom contracts Over time 0.4 0.6 0.8 0.6 1.4 Advertising At a point in time 7.5 6.9 12.9 13.8 27.0 Games total revenue 65.3 61.3 122.1 117.9 248.0 Brand Licensing IP Licensing and tangible sales
At a point in time and over time 2.4 2.5 4.2 5.3 11.2
Animation broadcasting and distribution
At a point in time 4.0 22.4 11.1 28.8 37.3
Advertising At a point in time 0.1 0.1 0.1 0.5 0.7 Brand Licensing total revenue 6.5 24.9 15.4 34.6 49.2 Group revenue 71.8 86.2 137.5 152.6 297.2

32
3. Notes to the statement of financial position 3.1 Non-Current Assets – Intangible Assets
Reconciliation of beginning and ending balances by classes of assets: EUR million
Development costs - Games
Trademarks
Development costs - Movie
Development costs - Other
Total
Cost At January 1, 2017 31.1 2.5 63.7 15.2 112.4 Additions 2.4 0.0 1.8 1.2 5.5 At June 30, 2017 33.5 2.5 65.5 16.3 117.9 At January 1, 2018 35.2 1.5 63.0 20.2 119.8 Additions 0.3 0.0 0.0 0.0 0.3 Disposals 0.0 0.0 0.0 0.0 0.0 At June 30, 2018 35.5 1.5 63.0 20.2 120.1
Amortization and impairment
At January 1, 2017 22.2 1.4 5.1 10.0 38.7 Amortization 0.8 0.1 15.4 2.1 18.4
Impairment 2.0 0.0 0.0 0.0 2.0 At June 30, 2017 24.9 1.4 20.5 12.0 59.0 At January 1, 2018 26.5 0.6 23.8 15.8 66.8 Amortization 1.0 0.1 5.7 1.4 8.2 Impairment 0.0 0.0 0.0 0.0 0.0 Reclassification 0.0 0.0 0.0 0.0 0.0
At June 30, 2018 27.5 0.7 29.5 17.2 74.9
Carrying amount
At June 30, 2017 8.6 1.0 45.0 4.3 58.9
At June 30, 2018 8.0 0.8 33.4 3.0 45.2 At December 31, 2017 8.7 0.9 39.2 4.3 53.1
3.2 Non-Current Assets – Tangible Assets
There were no material changes in tangible assets during the first half of 2018.
EUR million Machinery and
equipment Cost At January 1, 2017 5.1
Additions 0.4
Disposals -0.5 Translation differences -0.1
At June 30, 2017 4.9
At January 1, 2018 5.0
Additions 0.2
Disposals 0.0 Translation differences 0.0
At June 30, 2018 Depreciation and amortization
5.3
At January 1, 2017 -4.4 Depreciation charge for the period -0.2
Disposals 0.1 Translation differences 0.1
At June 30, 2017 -4.4

33
At January 1, 2018 -4.6 Depreciation charge for the period -0.2 Disposals -0.0
Translation differences -0.0
At June 30, 2018 Carrying amount
-4.9
At June 30, 2017 0.5
At June 30, 2018 0.5
At December 31, 2017 0.5
4. Changes in contingent liabilities or contingent assets Future minimum rentals payable under non-cancelable operating leases as follows:
EUR million At June 30, 2018 At June 30,
2017 At December 31,
2017 Equipment lease commitments
Due within one year 0.2 0.1 0.1 Due in subsequent years 0.1 0.1 0.1
Total
Office rental commitments
0.3 0.2 0.3
Due within one year 2.1 2.5 2.5 Due in subsequent years 2.5 4.5 3.7
Total
Other commitments
4.6 7.0 6.1
Enterprise mortgages 30.0 30.0 30.0 Total 30.0 30.0 30.0
5. Related party transactions Rovio’s related parties include its subsidiaries, associates, key persons belonging to the management
and their close family members and entities controlled by them, and entities with significant influence on Rovio.
Trema is an entity with significant influence over the Rovio Group. Trema’s previous control over the Rovio Group ended following the sales of shares carried out in conjunction with the Initial Public Offering.
In April, 2018, EUR 2.9 million was paid out as dividend between the Rovio Group and Trema.
6. Mergers, acquisitions and divestments In the first quarter 2018 Rovio divested its 34,74 % ownership of Sunwoo Entertainment Co., Ltd, that
was an associate company to the Rovio Group. Rovio sold its share of the company to the majority owner for an amount of EUR 37 thousand. The book value of the shares was zero.

34
7. Calculation of earnings per share 4–6/
2018
4–6/
2017 1–6/ 2018
1–6/ 2017
1–12/ 2017
Earnings per share, EUR 0.07 0.13 0.16 0.18 0.27 Earnings per share, diluted, EUR 0.07 0.13 0.15 0.18 0.27 Shares outstanding at the end of the period (thousands) 79,401 74,948 79,401 74,948 79,171 Weighted average adjusted number of shares during the financial period, basic (thousands) 79,391 74,948 79,327 74,946 75,795 Weighted average adjusted number of shares during the financial period, diluted (thousands) 80,214 76,177 80,281 76,084 77,370